Embed Size (px)
Citation preview
THESIS FOR THE DEGREE OF DOCTOR OF PHILOSOPHY
ENERGY EFFICIENCY IN SHOPPING MALLS Some Aspects Based on a Case Study
SOFIA STENSSON
Building Services Engineering Department of Energy and Environment
CHALMERS UNIVERSITY OF TECHNOLOGY Göteborg, Sweden 2014
ENERGY EFFICIENCY IN SHOPPING MALLS Some Aspects Based on a Case Study SOFIA STENSSON ISBN 978-91-7597-081-3 © SOFIA STENSSON, 2014 Doktorsavhandlingar vid Chalmers tekniska högskola Ny serie nr 3762 ISSN 0346-718X Technical report D2014:02 Building Services Engineering Department of Energy and Environment Chalmers University of Technology SE-412 96 GÖTEBORG Sweden Telephone +46 (0)31 772 1000 Printed by Chalmers Reproservice Göteborg, Sweden 2014
ii
ENERGY EFFICIENCY IN SHOPPING MALLS Some Aspects Based on a Case Study SOFIA STENSSON Building Services Engineering Chalmers University of Technology
ABSTRACT The building sector accounts for approximately 40 percent of our energy use. To reach existing environmental targets energy use will have to be reduced in all building types. At the European level, the main legislative instrument for improving the energy efficiency of the building stock is the Energy Performance of Buildings Directive (EPBD). The EPBD requires all member states to implement the directive in the building code and it also requires energy declarations to be performed at the building level.
The first objective of this thesis is to describe energy use in shopping malls in Sweden and to suggest how this energy use can be reduced. The second objective is to determine whether current regulatory requirements are effective in promoting energy efficiency measures in Swedish shopping malls. Only limited background information was found from national energy statistics and scientific papers that deal specifically with energy use in shopping malls. The data available are difficult to analyse and compare due to inconsistencies in terminology regarding nomenclature and system boundaries. An improved terminology is presented in the thesis, with a distinction between organisationally and functionally divided energy, to facilitate future studies. Furthermore, when it comes to designing shopping malls and evaluating their energy use, correct input data are required. For calculations and simulations of energy demand in buildings, internal and external load patterns are important input data. The thesis provides occupancy, lighting and infiltration load data for shopping malls.
Energy use in one shopping mall was investigated in detail and resulted in a validated calculation model for the prediction of energy use. To develop the calculation model an iterative empirical-theoretical methodology was used. It involved cross-checking measured data, assumptions related to operational and technical data, and model calculation results. The calculation model was then used for a more general analysis of energy efficiency measures and an evaluation of regulatory requirements. The thesis illustrates how the current building code and energy declarations are implemented in shopping malls today together with associated strengths and weaknesses.
Keywords: Shopping mall, energy use, energy efficiency, HVAC system, load patterns, case study, regulatory requirements, building code, and energy declarations.
iii

The work described in this doctoral thesis was carried out at SP Technical Research Institute of Sweden in cooperation with Chalmers University of Technology. The author wishes to acknowledge the financial support for this research project received from The Swedish Energy Agency and the project working group, consisting of the following companies: Bengt Dahlgren AB, CebyC AS, Energikonsulterna i Sverige AB, Evotek, Frico AB, Geoborr Geoenergi AB, Geotec, Kabona AB, Kungsfors Köpcentrum AB, LAROF Energientreprenader, Refcon AB, Steen&Ström Sverige AB, White Arkitekter AB, Wikströms VVS-kontroll and ÅF Infrastruktur.
iv

FOREWORD Writing this thesis was for me an interesting, challenging and fun process in many ways. I have learned a lot about my research subject and adjacent research areas, but also about myself. Having to commit to such a narrowly defined subject over such a long period of time and to keep working (at times continuously alone) toward a (sometimes) blurred goal has at times been very tiresome. At other times, it has been one of the most interesting and creative processes I have done workwise. The most stimulating and fruitful results are most often a product from discussions and reviews from my supervisors, colleagues and other researchers that I have meet at conferences and courses. There are a great number of people who I really would like to give my gratitude.
I would like to thank my supervisors Professor Jan-Olof Dalenbäck, Professor Per Fahlén and Dr Monica Axell. A special thank goes to Jan-Olof who supervised me with great commitment and enthusiasm during the second half of my thesis work. To Per, thanks for your input, especially to the discussion regarding nomenclature and system boundaries. To Monica, thank you for your encouragement and for never doubting in my capabilities.
No research project can commence without funding. The work described in this thesis was performed within the research project “Energy efficiency in shopping malls with an improved indoor climate”. The project was financed by the Swedish Energy Agency through the programmes Effsys2 and Effsys+. I am grateful to the Swedish Energy Agency for their financial support of the project.
In parallel to the research activities, there has also been a project working group involved in the process, consisting of the following companies; Bengt Dahlgren AB, CebyC AS, Energikonsulterna i Sverige AB, Evotek, Frico AB, Geoborr Geoenergi AB, Geotec, Kabona AB, Kungsfors Köpcentrum AB, LAROF Energientreprenader, Refcon AB, Steen&Ström Sverige AB, White Arkitekter AB, Wikströms VVS-kontroll and ÅF Infrastruktur. On average, the project working group has met four times a year to learn about the research progress and to provide the opportunity to give comments and feedback on the work and results. This has provided valuable input and increased the relevance of the work, as well as being a quality check of the results. Apart from these meetings, other work meetings have taken place when applicable to give support, input data and analysis of the results. The project working group has contributed with invaluable information and insights to the project. I am grateful to the participating companies and persons, for their support, and for their participation in the project.
I would like to thank all my colleagues at SP who have made everyday life at work enjoyable. It is a privilege to have such a pleasant workplace. To all of you, thanks for listening and supporting me in everything from research problems to everyday matters. There are numerous persons that I am especially thankful to, and to mention a few I would like to thank Jessica Benson, Kristina Fyhr, Carolina Hiller, Frida Jones, Caroline Markusson, Ola Gustafsson, Magnus Viktorsson, Kajsa Andersson, Lennart Rolfsman, Caroline Haglund Stignor, Roger Nordman, Thomas Ljung, Lisa Ossman, Marcus Olsson, Svein Ruud, Martin Borgqvist, Pia Tiljander and Markus Alsbjer.
v

To all friends in the rock climbing society, thanks for having contributed to an encouraging and friendly environment outside of work. I believe that the adventures and meditation that I have experienced with you have given me great confidence and inspiration.
To the world’s most wonderful person, Stefan Bergquist, you have been amazing throughout the thesis writing process. As stressful as it may have been for both of us, you have kept on supporting me inexhaustibly. Thank you for not giving up on me and for your endless patience.
Finally, I would like to thank my family and friends.
Göteborg June 2014
Sofia Stensson
vi
CONTENTS Page
ABSTRACT ............................................................................................................................ III
FOREWORD ........................................................................................................................... V
SYMBOLS, ABBREVIATIONS AND DEFINITIONS ......................................................................... IX
1 INTRODUCTION ............................................................................................................. 1
1.1 BACKGROUND ...................................................................................................... 1 1.2 OBJECTIVES ......................................................................................................... 3 1.3 DISPOSITION ........................................................................................................ 3 1.4 LIMITATIONS ......................................................................................................... 5
2 ENERGY REGULATIONS AND TERMINOLOGY ................................................................... 7
2.1 ENERGY PERFORMANCE OF BUILDING DIRECTIVE (EPBD) ..................................... 7 2.2 EPBD IN SWEDEN ................................................................................................ 8 2.3 EPBD IN OTHER NORDIC COUNTRIES ................................................................. 11 2.4 THESIS TERMINOLOGY ........................................................................................ 13 2.5 FUNCTIONAL AND ORGANISATIONAL DIVISION ...................................................... 15
3 LITERATURE REVIEW .................................................................................................. 17
3.1 ENERGY STATISTICS .......................................................................................... 19 3.2 SCIENTIFIC PAPERS............................................................................................ 27 3.3 DISCUSSION AND SUMMARY ................................................................................ 32
4 DATABASE ON ENERGY DECLARATIONS ...................................................................... 33
4.1 SELECTION OF ENERGY DECLARATIONS .............................................................. 33 4.2 RESULTS AND ANALYSIS ..................................................................................... 36 4.3 DISCUSSION AND SUMMARY ................................................................................ 44
5 INTERNAL AND EXTERNAL LOAD PATTERNS ................................................................. 45
5.1 OCCUPANCY ...................................................................................................... 45 5.2 LIGHTING ........................................................................................................... 56 5.3 INFILTRATION ..................................................................................................... 60 5.4 DISCUSSION AND SUMMARY ................................................................................ 68
6 MEASURED ENERGY USE ............................................................................................ 71
6.1 CASE STUDY METHODOLOGY ............................................................................. 71 6.2 DESCRIPTION OF THE CASE STUDY ..................................................................... 72 6.3 HVAC SYSTEM .................................................................................................. 73 6.4 MEASUREMENT RESULTS ................................................................................... 77 6.5 DISCUSSION AND SUMMARY ................................................................................ 82
7 ESTIMATED ENERGY USE ............................................................................................ 85
7.1 LANDLORD ELECTRICITY ..................................................................................... 85 7.2 TENANT ELECTRICITY ......................................................................................... 88 7.3 ELECTRICITY FOR VENTILATION ........................................................................... 90 7.4 HEATING AFTER ENERGY RE-ALLOCATION .......................................................... 93 7.5 COOLING AFTER ENERGY RE-ALLOCATION .......................................................... 94 7.6 DISCUSSION AND SUMMARY ................................................................................ 95
8 CALCULATED ENERGY USE ......................................................................................... 99
8.1 CALCULATION SOFTWARE PROGRAM ................................................................ 100 8.2 CALCULATION METHOD .................................................................................... 100 8.3 CALCULATED ENERGY ...................................................................................... 106 8.4 SENSITIVITY ANALYSIS...................................................................................... 108 8.5 DISCUSSION AND SUMMARY .............................................................................. 116
vii
9 IMPROVED ENERGY EFFICIENCY ................................................................................ 119
9.1 ENERGY EFFICIENCY ........................................................................................ 120 9.2 ENERGY RETROFIT MEASURES ......................................................................... 120 9.3 DESIGNING A NEW BUILDING ............................................................................. 123 9.4 DISCUSSION AND SUMMARY .............................................................................. 126
10 ANALYSIS OF REGULATORY REQUIREMENTS .............................................................. 127
10.1 BUILDING CODE (BBR) ..................................................................................... 127 10.2 ENERGY DECLARATIONS ................................................................................... 134 10.3 DISCUSSION AND SUMMARY .............................................................................. 136
11 DISCUSSION ............................................................................................................. 139
11.1 DESCRIPTION OF ENERGY USE ......................................................................... 140 11.2 REDUCTION OF ENERGY USE ............................................................................ 141 11.3 ENHANCING ENERGY EFFICIENCY MEASURES .................................................... 141
12 CONCLUSIONS .......................................................................................................... 145
REFERENCES .................................................................................................................... 147
APPENDIX A. ORIENTATION OF WINDOW FACADE ............................................................... 155
APPENDIX B. SENSITIVITY ANALYSIS .................................................................................. 157
APPENDIX C. ENERGY DECLARATION FOR CASE STUDY ..................................................... 163
viii
SYMBOLS, ABBREVIATIONS AND DEFINITIONS
Symbols
𝐴 Area [m2] Aenv Envelope surface area [m2]
pc Specific heat capacity [J/(kg*K)] 𝑓p Arriving frequency of people [persons/hour] 𝑓p,A Area specific people frequency [persons/hour/m2] 𝑁�p Average daily number of people [persons] 𝑁�p,A Area specific average daily number of people [persons/m2] 𝑁𝑚𝑖𝑛 Measured number of people walking into the building during hour
m where 1 ≤ m ≤ 24 [persons] 𝑁𝑚𝑜𝑢𝑡 Measured number of people walking out of the building during
hour m where 1 ≤ m ≤ 24 [persons] 𝑁𝑚𝑖𝑛
∗ Estimated number of people walking into the building during hour m where 1 ≤ m ≤ 24 [persons]
𝑁𝑚𝑜𝑢𝑡∗ Estimated number of people walking out of the building during
hour m where 1 ≤ m ≤ 24 [persons] 𝑁day Number of people visiting the building during one day
[persons/day] 𝑁p,occm
Number of people occupying the building during hour m where 1 ≤ m ≤ 24 [persons]
��p Estimated sensible heat emitted from one person [W] ��p,A Area specific sensible heat emitted per person during open hours
[W/m2] ��p,A,m Heat from people profile during hour m where 1 ≤ m ≤ 24 [W/m2] Qsol heat supplied because of solar irradiation Qint heat supplied because of internal heat loads Qtrans transmissions through the building envelope Qinf infiltrations Qvent heating and cooling through the ventilation Qheat/cool the amount of heat that need to be removed or supplied to the
building in order to achieve a constant indoor temperature qΔp air flow through the building envelope at Δp divided by the
envelope area [l/s/m2], [m3/h/m2] SFP Specific fan power [kW/m3/s] 𝜏open Operation time open hours [hours] 𝜏light Operation time lighting [hours] 𝜏occ,e Estimated occupancy time [hours] 𝜏calc Calculated average time spent in the building [hours] V ventilated volume [m3] ⋅
V volume flow rate [m3/s] VΔp leakage air flow at pressure difference Δp [l/s], [m3/h] V1 supply air flow rate [m3/h] V2 exhaust air flow rate [m3/h]
ix
⋅
W power (mechanical or electric) [W] wΔp Air flow through the building envelope at Δp divided by floor area nΔp Air flow through the building envelope at Δp divided by the
building volume ninf infiltration rate [h-1] n50 air change rate resulting from pressure difference of 50 Pa between
inside and outside [h-1] nx infiltration rate according to EN ISO 13789, when ventilation is on
and accounting for wind effects [h-1] e, f shielding coefficients Δp pressure difference across the building envelope [Pa] β flow exponent characterising the flow regime [-] C flow coefficient [kg/s/Pan] ρ density [kg/m3] t celsius temperature [°C]
Subscripts
A area a annual calc calculated cool cooling env envelope heat heating inf infiltration int internal heat loads light lighting occ occupancy open open hours p person sol solar irradiation trans transmission vent ventilation
Abbreviations
AHU: Air handling unit ASHRAE: American Society for Heating, Refrigerating and Air Conditioning
Engineers BBR Swedish building code (in Swedish: Boverkets byggregler) CAV: Constant air volume COP: Coefficient of performance DCV: Demand controlled ventilation EPBD: Energy of performance of buildings directive EPC: Energy performance certificate FCU: Fan coil unit FTX Exhaust and supply system with heat exchanger (in Swedish från-
och tilluftssystem med värmeväxlare) HVAC: Heating, ventilation and air-conditioning
x
IEA International Energy Agency LPG: Liquid petroleum gas OVK: Mandatory ventilation inspection (in Swedish: obligatorisk
ventilationskontroll) SFP: Specific fan power [kW/(m3/s)] SPF: Seasonal performance factor VAV: Variable air volume
Definitions
Building energy Building energy is all energy supplied to a building, and consists of building services energy and business energy. The building services energy consists of HVAC energy and service energy. The HVAC energy is for installed technical systems, usually permanent, for maintaining the required indoor climate. Service energy is for other building services, such as installations for sanitation, transport and security etc. Building energy = building services energy + business energy. Building services energy = HVAC energy + service energy.
Building services The building services can be divided into HVAC systems and service systems.
Building services electricity Building services electricity is the electricity used for operation of the central systems. It is needed for the building to be used for its intended purpose. Examples are electricity use for fans, pumps, elevators, permanently installed lighting, and suchlike.
Business The business refers to the energy used for the business activities in the building and includes, for example, energy for specific business-purpose lighting and equipment. Lighting, occupants and other equipment are heat sources that affect the indoor climate in the room.
Energy supply Energy supply refers to the energy that is supplied at the system boundary.
Energy use Energy use is the amount of energy used inside the system boundary.
Free energy Free energy is a somewhat vague notation. It can be used in different situations with different meanings. Using certain technologies it is possible to utilize “free” heat sinks for cooling and “free” heat sources for heating. An example would be the utilization of ambient energy (ground, water or air). In this context as being used in this thesis, free energy refers to energy supplied to the building and which is not paid for. However, it should not be forgotten that in order to utilise the free energy, an initial investment is almost always needed, which will cause a certain capital cost per kWha. Another thing to remember is that free energy usually requires some other energy to be utilized: for instance, often it requires energy for pumps and/or fans for distribution to the area with the energy demand.
xi
HVAC systems The HVAC systems comprise the technical systems that compensate for heat deficit, remove of surplus heat and removal of air pollutants. The task of the HVAC systems is to compensate in situations where the interaction between the outdoor climate, business and the building does not give the required indoor climate. This part of the building services is affected by the outdoor climate.
Indoor climate The indoor climate (temperature and air quality) of a room is a result of the interaction between the outdoor climate, the thermal properties of the building, the business activities and the HVAC systems. The underlying reason for designing and constructing a building is that it is needed for a specific purpose. The building should have such functional performance that the planned activity can be carried out as intended. From an energy point of view, it is important to understand how the indoor climate requirements influence the energy needed.
Landlord energy Landlord energy is paid for by the landlord. This is usually energy to permanently installed building services systems for heating, cooling, ventilation, lighting, information, lifts, common laundry equipment, etc. indoors, as well as lighting outdoors.
Outdoor energy Outdoor energy is supplied to equipment located outdoors. Outdoor electrical energy may, for instance, be electricity used for outdoor lighting, vehicle heaters, ground heaters, community antenna installations, etc. An example of outdoor thermal energy could be snow melting on parking lots. Any HVAC equipment placed outside is excluded, since it will be included in the HVAC energy instead.
Purchased energy Purchased energy is the energy which is paid for by the property-owner or tenant. Alternatively the term delivered energy could be used in accordance with EN 15603, delivered energy is “energy, expressed per energy carrier, supplied to the technical building system through the system boundary, to satisfy the uses taken into account (heating, cooling, ventilation, domestic hot water, lighting, appliances etc.) or to produce electricity”.
Room The room comprises the room surfaces and room air.
Service systems The service systems comprise the part of the building services not affected by the outdoor climate. This includes water, sewage system, electricity for general lighting, data communication, supervision, escalators, lifts, etc.
Shopping mall A shopping mall, as defined in this study, is a large shopping centre entirely beneath a roofed structure, usually with a limited number of entrances. Stores and other services are normally accessible only via interior corridors or open spaces.
xii

System boundary According to EN 15603 system boundary has the following definition “boundary that includes within is all areas associated with the building (both inside and outside the building) where energy is consumed or produced”.
Tenant electricity Tenant electricity is the electricity used for the activities in buildings. Examples are lighting, computers, copier, TV, dishwashers, washing machines and other household machines and suchlike.
xiii

1 INTRODUCTION This chapter provides background, purpose of the thesis, thesis structure, research questions and limitations.
1.1 Background There is in general considerable interest in energy efficiency measures to reduce our use of energy resources, to reduce energy imports (dependency, security), and last but not least, to reduce climate change. Our present (fossil) energy resources are still abundant in the short term, energy is comparatively cheap and the population is increasing.
Concern over energy security, the social and economic impacts of energy prices, and growing awareness of climate change have led many countries to put greater emphasis on developing policies and measures that promote energy efficiency [46]. Governments offer different incentives to manage energy use in all sectors. Our energy use is divided approximately equally between three main sectors: industry, transport and “others”. The sector “others” covers residential, commercial and public services, i.e. basically all types of buildings.[45] Buildings account for approximately 40 % of all energy use. The International Energy Agency (IEA) has identified the building sector as one of the most cost-effective sectors for reducing energy use[44]. The Swedish energy target regarding residential and non-residential buildings is that energy use per heated area shall be 20 percent lower in year 2020, compared to the energy use in year 1995.[72] This thesis deals with energy use in buildings with a specific focus on shopping malls that have been identified as having high energy use and being less explored than other building types[86].
Energy efficiency in shopping malls is a research area in its early stage of development. Public documentation on energy use specific to shopping malls is still very limited. There are a few scientific papers, that have been published, which have documented energy use in shopping malls, see Chapter 3. However, none of these studies makes a complete analysis of both the electrical energy use and the thermal energy use. The focus is always on the energy supplied to the building rather than an analysis of the functions for which the energy is used. However, the need for comprehensive studies is becoming increasingly important, if the actual heating and cooling demands of buildings are to be understood and thereby reduced.
1
1.1.1 Shopping mall characteristics The number of shopping malls is increasing in the world. According to a market report from 2014 by Cushman and Wakefield, covering 51 markets, more than 1 650 new shopping centres were added to these markets during a two year period, in 2012 and 2013.[69] These new shopping centres represent 7.0 % of the existing inventory.[69] The USA dominates the shopping mall business, but also developing countries such as Brazil, Russia, India and China have seen a significant increase in shopping centres over the past decade.[69] According to a market forecast by Cushman and Wakefield, an increase of more than 1 800 new shopping centres within the next three years is expected. This adds approximately 80 million square metres of retail area.[69] According to Centrumutveckling, Sweden has also seen an increase during the last decade and today there are approximately 350 shopping centres with a total rentable area of approximately 6.2 million m2 in Sweden.[15] Currently, these shopping centres account for one third of all retail trade, and their sales figures are increasing more rapidly than those of retail trade in general.[15]
The national energy statistics in Sweden do not treat shopping malls separately. However, shopping malls constitute a building sector which is considered to have high energy use and as in the commercial building sector in general, energy use in shopping malls can, with high probability, be significantly reduced. Furthermore, energy use in shopping malls appears to be dominated by tenant electricity (related mainly to lighting), and space cooling (related mainly to heat loads from lighting and the large number of occupants). Clothing shops, which are common in shopping malls, are at the high end of electricity use for lighting. Tenant electricity constitutes 40-75 % of the total energy supplied to shopping malls.[86]
In commercial buildings in general, the heating demand is a minor problem today. The need for air treatment, space cooling and the operation of fans and pumps is dominant instead. Therefore, considerable energy use is due to removal of surplus heat and removal of airborne pollutants. Electricity for lighting and equipment is another major energy user. Electricity for lighting and equipment is usually classified as tenant energy use. This is important to note, since tenant energy use is not included in building regulation requirements or energy declarations.
1.1.2 Requirements on energy use There are both mandatory energy policies and voluntary benchmarking tools that may stimulate energy efficiency at the building level. Important European energy policies are, Energy Performance of Buildings Directive (EPBD), Ecodesign of Energy Using Products Directive, The Energy Labelling Directive, Energy Efficiency Directive, and Promotion of Renewable energy Sources. Important benchmarking tools are, Building Research Establishment Environmental Assessment Method (BREEAM) and Leadership in Energy and Environmental Design (LEED). BREEAM is developed in Europe whereas LEED originates from the US. The focus in this thesis is on the Swedish implementation of the EPBD. EPBD is the main legislative instrument for improving the energy performance of the building stock at a European level. EPBD was introduced in 2002 to be implemented in national legislation and building codes by January 2006. There was a revision in 2010 with an implementation period 2015 to 2020.
2
According to EPBD, buildings occupied by public authorities and buildings frequently visited by the public should set an example by showing that environmental and energy considerations are being taken into account. The directive points out shopping centres specifically. The following sentence is found in the directive “The dissemination to the public of information on energy performance should be enhanced by clearly displaying these energy performance certificates, in particular in buildings of a certain size which are occupied by public authorities or which are frequently visited by the public, such as shops and shopping centres, supermarkets, restaurants, theatres, banks and hotels.”
In Sweden, the Swedish National Board of Housing, Building and Planning, Building and Planning [Boverket] has overall responsibility for the implementation of the EPBD. It issues the Swedish building regulations, namely Boverkets Byggregler (BBR), and has designed, developed and currently supports the Energy Performance Certification (EPC) system is Sweden.
A new upcoming concept is “net zero energy buildings”. When it comes to defining future net zero energy buildings, well-defined system definitions and system boundaries become more important, and difficult to achieve. Some work was done in relation to the EPBD revision in 2010. For instance, the REHVA article by Kurnitski et al.[51] proposes a technical definition for nearly net zero energy buildings. Such uniform definitions and energy boundaries, across countries, are aimed at helping experts to exchange information on the most energy-efficient technical solutions for buildings.
1.2 Objectives The first objective of this thesis is to describe energy use in shopping malls in Sweden and to suggest how this energy use can be reduced. The second objective is to determine whether current regulatory requirements are effective in promoting energy efficiency measures.
1.3 Disposition This section describes the thesis outline. A brief description of the methods used in each chapter is given. The first part of the thesis, Chapters 2-5, gives a thorough introduction to energy use in shopping malls. These chapters introduces the subject, including an analysis of relevant terminology, a literature review, investigation of internal and external load patterns, and an analysis of energy declarations. In the second part of the thesis, Chapters 6-10, a case study of an existing shopping mall is presented. Energy use, energy efficiency measures and regulatory requirements are analysed as they pertain to an existing shopping mall. The last part, Chapters 11-12, includes discussions and conclusions in relation to the objectives.
As mentioned, the first part of the thesis gives an introduction to energy use in shopping malls. Chapter 2 describes the terminology used for characterising and analysing energy demands and energy use in shopping malls. This chapter is relevant to any energy efficiency projects or research in shopping malls, and applies equally to other non-residential buildings. Chapter 3 presents a literature review that focuses on issues related to energy statistics, energy auditing, and
3
scientific investigations of shopping malls. In Chapter 4, energy declarations in Swedish shopping malls are analysed. Chapter 5 deals with the internal and external load patterns, which are important input data for the calculation and simulation of energy demand. Data on the internal load patterns from occupants and users, lighting and equipment are related to information provided by companies participating in the research project. Special focus is given to the characteristics of these internal load patterns since they are specific for shopping malls and also have a large impact on the energy use in this type of buildings.
As mentioned, the second part of the thesis includes a case study of an existing shopping mall. This is the main method used for evaluation of energy use and energy efficiency measures. The case study is an existing shopping mall situated in Sweden. Using this case study, the thesis suggests a methodology for describing and analysing energy demand and energy use. Energy demand was determined by calculations and software modelling of the building and energy use was determined by energy auditing and measurements. Based on a better understanding of energy demand and energy use, alternative HVAC systems could be more accurately evaluated.
Chapters 6-9 present the case study and the results from the energy auditing campaign. The case study methodology and a description of the shopping mall are found in Chapter 6. They also present available measurements on energy use in the case study building. In order to utilize the measured data for this study, some of the measured energy had to be re-allocated. An explanation for why this re-allocation is needed is that existing measurements are partially planned based on organisational system boundaries, whereas functional system boundaries are needed for this study. Exactly how these re-allocations were performed is discussed in Chapter 7. Chapter 8 presents the calculation model and the resulting theoretical energy demands including a sensitivity analysis. In Chapter 9, the calculation model is used to evaluate alternative HVAC systems for both retrofits of the existing building and for design of a new building. In Chapter 10, the case study building is used to exemplify the implications of current regulatory requirements. Based on the case study, different system solutions and energy efficiency measures were calculated and total energy use was derived. The way in which different system solutions and energy efficiency measures are evaluated and managed according to current regulatory requirements is also discussed in this chapter.
Below is a summary of the main research questions that each chapter of the thesis answers to:
Chapter 4: Based on the energy declarations, what conclusions can be made concerning the energy performance of shopping malls in Sweden?
Chapter 5: What are the characteristics of the internal and external load patterns in shopping malls?
Chapter 6: How much energy is used in the case study shopping mall, according to available measurements?
Chapter 7: How is the measured energy allocated between different functions in the building?
Chapter 8: Which parameters determine the energy use?
4
Chapter 9: How can energy efficiency be improved by using an alternative building envelope, lighting and equipment, HVAC system or supply systems?
Chapter 10: Are current regulatory requirements effective in promoting energy efficiency measures in shopping malls?
1.4 Limitations The research topic covered in this thesis involves a large number of multifaceted issues. It is therefore necessary to consider boundaries and limitations for the work.
• There are many different types of shopping centres. This study focuses on the type of shopping centre which is known as a shopping mall. A shopping mall, as defined in this study, is a large shopping centre entirely beneath a roofed structure, usually with a limited number of entrances. Stores and other services are normally accessible only via interior corridors or open spaces.
• The shopping malls that are considered in this study are situated in Sweden. The conclusions drawn in the study are therefore applicable to a Swedish outdoor climate and for Swedish regulations.
• The thesis does not include an environmental impact assessment of different primary energy sources. However, it does report the amount of energy used from different energy sources for each HVAC system, which will allow others to do the environmental impact assessment. The reason for this limitation is that environmental impact assessment is in itself a large research field, and could easily have become a doctoral thesis on its own. There has been a debate on-going in Sweden on how electricity shall be addressed from an environmental and climate perspective in different situations. For example average electricity and marginal electricity are discussed. In a paper by Dotzauer[21], five assessment principles which have advocates in practice are critically evaluated. Dotzauer concludes that the debate will probably remain until academia or any other independent player with reliability become more involved in the process and give recommendations on how stakeholders shall act.
• For the calculations presented in the thesis on alternative HVAC system and building design only the technical and not the economic potential have been considered, therefore only technical and not economic constraints are considered. However, suggested systems and solutions are those already available on the market today, and are therefore to some degree proven to be cost effective enough to be manufactured and sold. Nevertheless, a total economic analysis is needed if cost optimal solutions are to be found.
• There are ongoing activities in Europe to define zero energy buildings, also known as net zero energy buildings (nZEB). However, this concept is only briefly discussed in the thesis. nZEB is a political definition where energy use can be reduced by onsite and/or nearby energy generation. However subtracting onsite and nearby energy generation does not change the fact that a building is using energy. In this thesis the focus is on reducing the energy use that is needed for the activities in the building and to maintain a comfortable indoor climate.
5

2 ENERGY REGULATIONS AND TERMINOLOGY Current Swedish requirements on energy use in buildings are strongly affected by EU directives. In 2007 the EU Member States committed themselves to achieve the following targets by the year 2020:
• 20 % reduction of greenhouse gas emissions compared with 1990 levels; • 20 % share of renewables in EU energy use; and • 20 % reduction in energy use by improving energy efficiency.
The general EU 2020 policy objectives have been translated into national targets. Several key pieces of legislation have been introduced by the EU to help achieve the 20 % energy efficiency target, including the revision of the Energy Performance Directive (EPBD), the recent Energy Efficiency Directive (EED) and the Renewable Energy Directive (RED). These three directives seek to focus resources on sustainable energy in buildings and to mobilise investments. The focus in this thesis is on the implementation of EPBD.
Along with the current standardisation stipulated by the EPBD, this thesis aims to clarify and extend the framework and nomenclature concerning energy statistics in non-residential buildings. When discussing systems, of any kind, it is necessary to define the system, its functions and the system boundaries. If the definitions are unclear, it will be difficult to have a meaningful discussion and to perform a realistic analysis. For the purpose, methodology and research questions in this thesis, an understanding of a number of terms are needed and are therefore discussed in this chapter. Two issues are especially highlighted;
1) A more consistent use and better understanding of energy supply, energy use and energy demand are required. To develop and present relevant and valid energy statistics it is important to have a sufficient understanding and a clear definition of these energy flows.
2) When building energy is reported in energy statistics there is a common confusion between functional divisions and organisational divisions. The functional requirements and systems must be understood in order to evaluate the energy use of a building.
2.1 Energy Performance of Building Directive (EPBD) The EPBD requires member states to set minimum energy performance requirements for new buildings and buildings undergoing renovation in order to achieve cost-effective levels. This directive required all member countries to implement the directive in the national building code. The objective of EPBD is to
7
promote improvements in the energy use of buildings within the community, taking into account outdoor climatic and local conditions, indoor climate requirements and cost effectiveness. The directive refers to energy use and does not take into account the life cycle energy demands (which would include energy used to produce and dispose of the materials used in the building).
It was the EPBD that introduced the energy performance certificate (EPC) as an energy policy tool. EPBD sets the guidelines for the EPC which member nations are obliged to follow. The aim of EPC is to inform building owners about the energy performance and energy costs of buildings by requiring an energy declaration. EPC is a specific energy policy tool that is used to direct the building sector and the retail market towards higher energy efficiency in buildings. For new and existing buildings it requires a calculation of the energy performance of the building, including its heating, ventilation, cooling and lighting systems, based on energy use, primary energy or CO2 emissions.
In Sweden the EPCs are called energy declarations. When it comes to the Swedish energy declarations, Sweden has decided to use an energy performance measure for non-residential buildings that includes building services energy but excludes tenant electricity. Even though tenant electricity is not considered in the energy declaration, it still substantially affects the total energy use and the energy balance of the building. In Sweden the energy performance is not only calculated, but also measured. No other European country has made energy measurements compulsory for EPCs.
Energy performance can be a somewhat confusing term. The energy performance is measured in the unit kWh/m2. The lower the “energy performance” is the better. Normally when using the term performance, “high” performance is the goal, but for the energy declarations “low” energy performance is the goal, as it is supposed to identify a building with low energy use.
2.2 EPBD in Sweden Swedish regulations covering energy management in new and renovated buildings have existed at the national level since 1948.[19] In October 2006, as a consequence of EPBD, a new law (law 2006:985) was introduced in Sweden to require energy declarations for all buildings. According to the law, all buildings in Sweden should have declared their use of energy by the 31st of December 2008. However, it took longer before all buildings were provided with a declaration. Very few buildings are excluded from the law. The energy declaration must be performed by an accredited company, with at least one certified energy expert in a management position. The purpose of the energy declaration is to make an energy audit of the building and to examine how its use of energy can be reduced. It also clarifies to what extent the building owners have commissioned mandatory ventilation inspection (OVK) [obligatorisk ventilationskontroll] and radon measurements. The energy declaration should include energy efficiency measures when there are cost effective measures that could be taken. The energy declaration is valid for ten years. All energy declarations are stored in a central database at the Swedish National Board of Housing, Building and Planning [Boverket], in accordance with law 2012:397.
8
The following information in this section refers to the latest version of BBR available when the thesis was written, version BFS 2013:14 [7]. Section 2.2.1 and section 2.2.2 give a description of the BBR definitions and the BBR requirements that are of importance, in order to understand the analysis of the BBR requirements in the thesis, especially the results presented in Chapters 4 and 10. Note that the information below is a summary of the key issues that are important for the thesis. For other purposes the latest version of the building code itself should be consulted.
Some key points and intentions of BBR:
• BBR is intended, as far as possible, to be technology neutral. • The BBR energy use is determined from the purchased (end-use) energy
for heating, domestic hot water, cooling and auxiliary energy. The user related energy (i.e. for lighting and plug loads) is not included in the requirements.
• Primary energy is not limited and no national primary energy conversion factor has been stipulated. However, the building code has much stricter requirements for buildings that are electrically heated than for buildings with other heating systems.
• Regarding measurement systems, the energy use of the building shall be monitored continuously by a measurement system. Based on readings of the measurement system, it must be possible to calculate the energy use of the building for a required time period.
• When the building has another heating system than electric heating the electricity used by chillers for comfort cooling shall be multiplied by a factor 3 when determining the BBR energy use.
2.2.1 BBR definitions The following definitions are used in BBR:
Atemp Floor area in temperature-controlled spaces intended to be heated to more than 10 °C, enclosed by inside of the building envelope (m2). Definition according to BBR.
BBR average year correction Correction of the metered energy use of the building based on the difference between the on-site climates conditions in an average year and the actual climate in the period for which the energy use of the building is being verified.
BBR climate zone I Northern part of Sweden (counties of Norrbotten, Västerbotten and Jämtland).
BBR climate zone II Middle part of Sweden (counties of Västernorrland, Gävleborg, Dalarna and Värmland).
9
BBR climate zone III South part of Sweden (counties of Västra Götaland, Jönköping, Kronoberg, Kalmar, Östergötland, Södermanland, Örebro, Västermanland, Stockholm, Uppsala, Skåne, Halland, Blekinge and Gotland).
BBR electric heating Heating with electricity, where the installed power rating for heating is greater than 10 W/m2 (Atemp). Examples are ground, sea or air heat pumps, direct electric heating, hydronic electric heating, air-based electric heating, electric underfloor heating, electric water heaters and the like. Electrical power in solid fuel installations that is installed to provide temporary backup is not included if the solid fuel installation is designed for continuous operation.
BBR energy use: The energy which, in normal use during a reference year, needs to be supplied to a building (often referred to as “purchased energy”) for heating, comfort cooling, domestic hot water and the building’s “property energy use”. It is usually divided by 𝐴temp and expressed as kWha/m2/year. This is also the energy use that is reported in the energy declarations. In the energy declarations however it is referred to as energy performance. Therefore BBR energy use and energy performance are used synonymously in the thesis, with the only difference that energy performance is used when referring to the energy declarations.
BBR operational energy use: Electricity or other forms of energy used for the activities taking place in the premises. Examples of this include process energy, lighting, computers, copiers, TVs, showcase refrigerators/freezers, machinery and other appliances, including stoves, refrigerators, freezers, dishwashers, washing machines, dryers, other household appliances.
BBR property energy use: The part of the electrical energy used for building services necessary for the use of the building, where the electrical devices are in, under, or affixed to the exterior of the building. This includes the permanently installed lighting of common spaces and utility rooms. It also includes energy used in heating cables, pumps, motors, control and monitoring equipment and the like. External but locally placed devices that supply the building, such as pumps and fans for free cooling, are also included.
2.2.2 BBR requirements The BBR contains mandatory requirements that the energy use of the building should be calculated during the design phase and also verified on the basis of measurements that are made during operation. The developer or owner is responsible for ensuring that the building meets the requirements. BBR has different requirements for residential and non-residential buildings. Furthermore, BBR distinguishes between buildings that have electric heating and buildings that have other heating systems, see Table 2.1 and Table 2.2 respectively for these requirements.
10
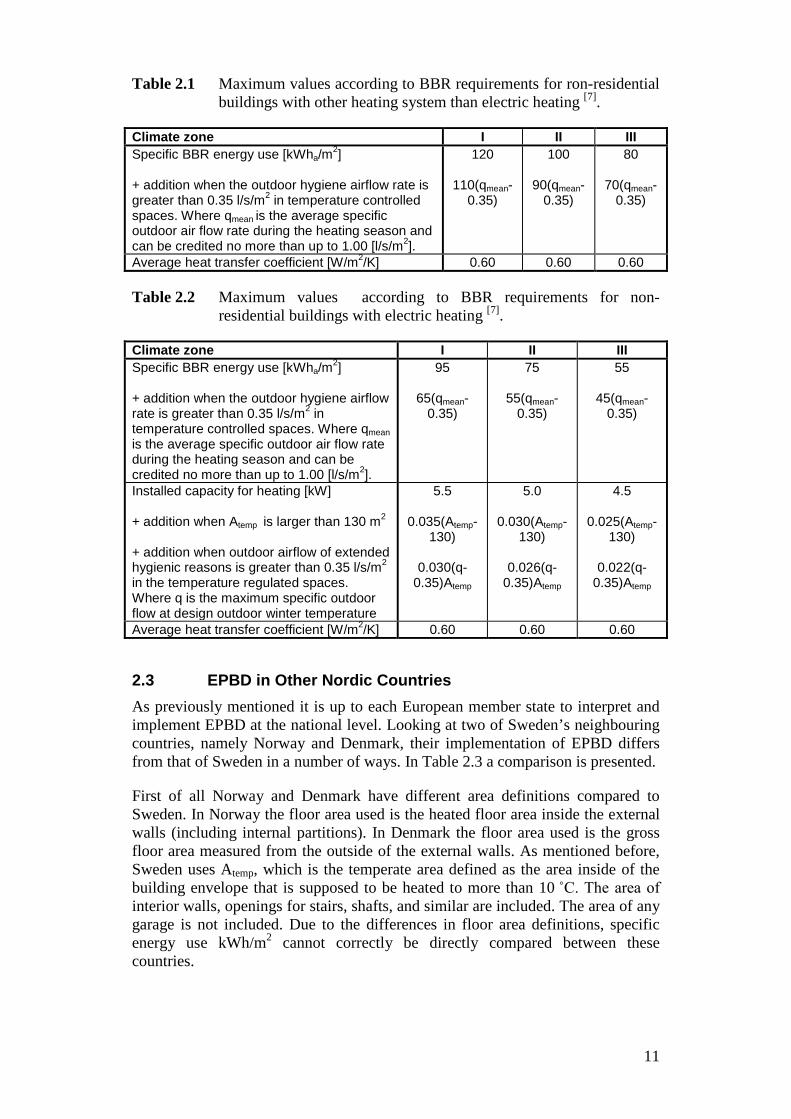
Table 2.1 Maximum values according to BBR requirements for ron-residential buildings with other heating system than electric heating [7].
Climate zone I II III Specific BBR energy use [kWha/m2] + addition when the outdoor hygiene airflow rate is greater than 0.35 l/s/m2 in temperature controlled spaces. Where qmean is the average specific outdoor air flow rate during the heating season and can be credited no more than up to 1.00 [l/s/m2].
120
110(qmean-0.35)
100
90(qmean-0.35)
80
70(qmean-0.35)
Average heat transfer coefficient [W/m2/K] 0.60 0.60 0.60
Table 2.2 Maximum values according to BBR requirements for non-residential buildings with electric heating [7].
Climate zone I II III Specific BBR energy use [kWha/m2] + addition when the outdoor hygiene airflow rate is greater than 0.35 l/s/m2 in temperature controlled spaces. Where qmean is the average specific outdoor air flow rate during the heating season and can be credited no more than up to 1.00 [l/s/m2].
95
65(qmean-0.35)
75
55(qmean-0.35)
55
45(qmean-0.35)
Installed capacity for heating [kW] + addition when Atemp is larger than 130 m2
+ addition when outdoor airflow of extended hygienic reasons is greater than 0.35 l/s/m2 in the temperature regulated spaces. Where q is the maximum specific outdoor flow at design outdoor winter temperature
5.5
0.035(Atemp-130)
0.030(q-
0.35)Atemp
5.0
0.030(Atemp-130)
0.026(q-
0.35)Atemp
4.5
0.025(Atemp-130)
0.022(q-
0.35)Atemp
Average heat transfer coefficient [W/m2/K] 0.60 0.60 0.60
2.3 EPBD in Other Nordic Countries As previously mentioned it is up to each European member state to interpret and implement EPBD at the national level. Looking at two of Sweden’s neighbouring countries, namely Norway and Denmark, their implementation of EPBD differs from that of Sweden in a number of ways. In Table 2.3 a comparison is presented.
First of all Norway and Denmark have different area definitions compared to Sweden. In Norway the floor area used is the heated floor area inside the external walls (including internal partitions). In Denmark the floor area used is the gross floor area measured from the outside of the external walls. As mentioned before, Sweden uses Atemp, which is the temperate area defined as the area inside of the building envelope that is supposed to be heated to more than 10 ˚C. The area of interior walls, openings for stairs, shafts, and similar are included. The area of any garage is not included. Due to the differences in floor area definitions, specific energy use kWh/m2 cannot correctly be directly compared between these countries.
11
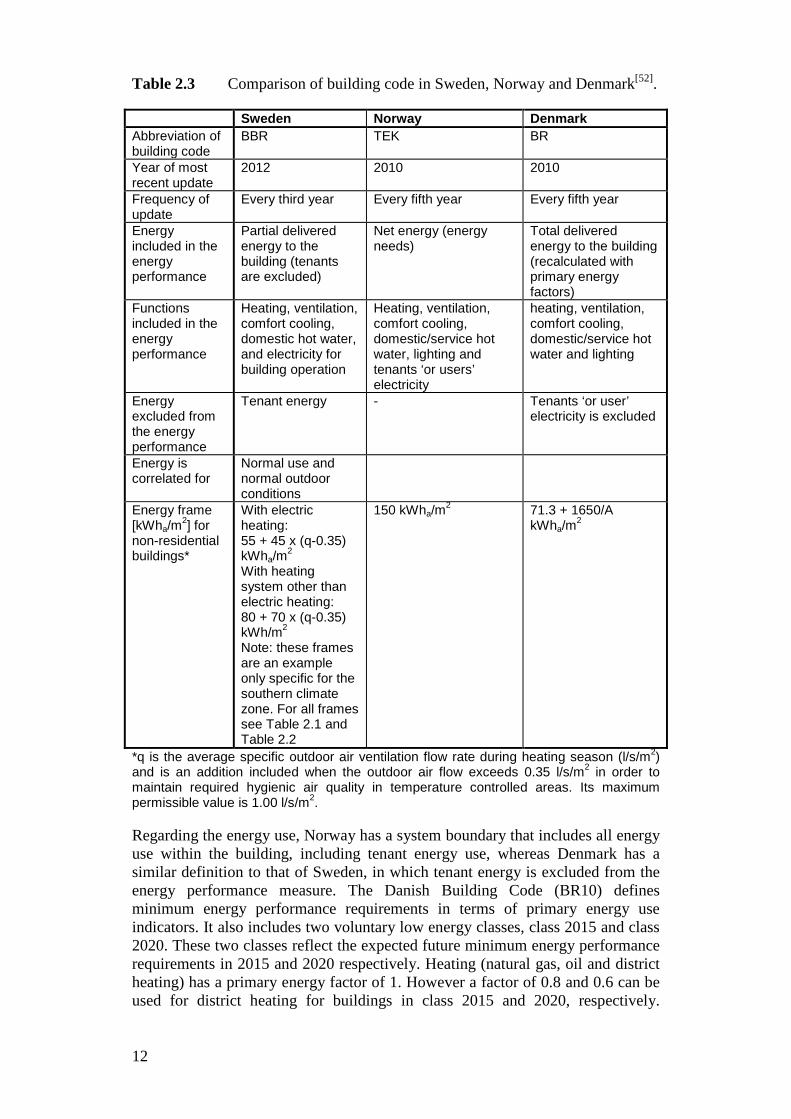
Table 2.3 Comparison of building code in Sweden, Norway and Denmark[52].
Sweden Norway Denmark Abbreviation of building code
BBR TEK BR
Year of most recent update
2012 2010 2010
Frequency of update
Every third year Every fifth year Every fifth year
Energy included in the energy performance
Partial delivered energy to the building (tenants are excluded)
Net energy (energy needs)
Total delivered energy to the building (recalculated with primary energy factors)
Functions included in the energy performance
Heating, ventilation, comfort cooling, domestic hot water, and electricity for building operation
Heating, ventilation, comfort cooling, domestic/service hot water, lighting and tenants ‘or users’ electricity
heating, ventilation, comfort cooling, domestic/service hot water and lighting
Energy excluded from the energy performance
Tenant energy - Tenants ‘or user’ electricity is excluded
Energy is correlated for
Normal use and normal outdoor conditions
Energy frame [kWha/m2] for non-residential buildings*
With electric heating: 55 + 45 x (q-0.35) kWha/m2 With heating system other than electric heating: 80 + 70 x (q-0.35) kWh/m2 Note: these frames are an example only specific for the southern climate zone. For all frames see Table 2.1 and Table 2.2
150 kWha/m2 71.3 + 1650/A kWha/m2
*q is the average specific outdoor air ventilation flow rate during heating season (l/s/m2) and is an addition included when the outdoor air flow exceeds 0.35 l/s/m2 in order to maintain required hygienic air quality in temperature controlled areas. Its maximum permissible value is 1.00 l/s/m2.
Regarding the energy use, Norway has a system boundary that includes all energy use within the building, including tenant energy use, whereas Denmark has a similar definition to that of Sweden, in which tenant energy is excluded from the energy performance measure. The Danish Building Code (BR10) defines minimum energy performance requirements in terms of primary energy use indicators. It also includes two voluntary low energy classes, class 2015 and class 2020. These two classes reflect the expected future minimum energy performance requirements in 2015 and 2020 respectively. Heating (natural gas, oil and district heating) has a primary energy factor of 1. However a factor of 0.8 and 0.6 can be used for district heating for buildings in class 2015 and 2020, respectively.
12
Electricity has a primary factor of 2.5, but for buildings fulfilling class 2020 a factor of 1.8 can be used.
In Sweden, the energy performance of new buildings must be verified by measurements made within 24 months of the completion of the building. Sweden is the only member state that requires measurements for their EPCs.
In Denmark, on-site renewable energy production inside the system boundary is subtracted from energy use when calculating the delivered energy. It is subtracted both if it is used in the building directly or is exported to the grid.
In a survey study by the Concerted Action EPBD[19] some conclusions were made concerning energy experts. According to the study, the training of energy experts must be considerably improved. Their knowledge, skills and ability to communicate with owners must also be improved. In most European member states, the client selects an energy expert based mainly on the cost of the Energy Performance Certificate and the reputation of the issuing energy expert. This has negatively affected the image of the whole EPC system.[19]
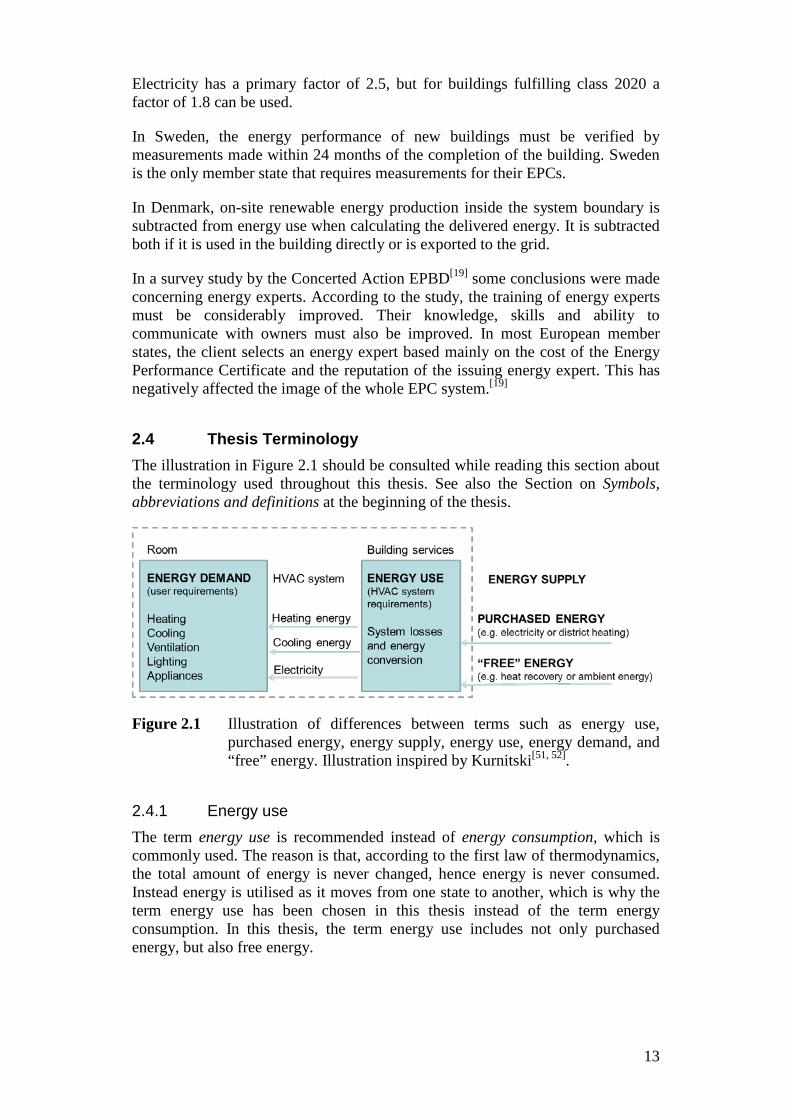
2.4 Thesis Terminology The illustration in Figure 2.1 should be consulted while reading this section about the terminology used throughout this thesis. See also the Section on Symbols, abbreviations and definitions at the beginning of the thesis.
Figure 2.1 Illustration of differences between terms such as energy use, purchased energy, energy supply, energy use, energy demand, and “free” energy. Illustration inspired by Kurnitski[51, 52].
2.4.1 Energy use The term energy use is recommended instead of energy consumption, which is commonly used. The reason is that, according to the first law of thermodynamics, the total amount of energy is never changed, hence energy is never consumed. Instead energy is utilised as it moves from one state to another, which is why the term energy use has been chosen in this thesis instead of the term energy consumption. In this thesis, the term energy use includes not only purchased energy, but also free energy.
13
2.4.2 Purchased energy Purchased energy is the energy which is paid for by the property-owners or tenants. An important issue is that building statistics typically include only purchased energy and therefore are somewhat misleading concerning actual energy supply (and energy use). Generally, purchased energy includes losses within the building, but excludes external conversion and transformation losses. In order to compare different buildings and technical systems both the purchased energy and the free energy supplied to the building must be taken into account. If only the purchased energy is evaluated, the result might be that buildings, on paper, have better energy performance but in fact use more energy (except that the energy is supplied in such a way that it is considered to be “free”). Therefore, in accordance with this framework, the term “purchased energy” should be used, which incorrectly but commonly is referred to as “energy use” or “energy consumption” in the official statistics. Another common term for purchased energy is delivered energy, used for example in EN 15603.
2.4.3 “Free” energy Free energy is a somewhat vague term. It can be used in different situations with different meanings. Using certain technologies it is possible to utilize “free” heat sinks for cooling and “free” heat sources for heating. An example would be the utilization of ground source energy. In the context of this thesis, free energy refers to energy supplied to the building that is not paid for. However, it should not be forgotten that in order to utilise the free energy, an initial investment is almost always needed, which incurs a certain capital cost per kWh. It is also worth remembering that free energy usually requires some other energy to be utilized: for instance, it often requires energy for pumps and/or fans for distribution to the space with the energy requirement.
2.4.4 Energy demand Sometimes energy use and energy demand are confused, and too often they are ‘falsely’ assumed to be the same thing. In this thesis, energy demand is the theoretical minimum energy use that is required to achieve the purposes of the building and to provide the required indoor climate. Note that energy use will always be greater than energy demand, because there will be not only unintended losses but also unnecessary use, due for example to non-optimum operation. Energy demand may be tuned by reducing externally or internally generated heat loads or by changing the indoor environmental specifications (e.g. less rigid minimum and maximum temperatures). Furthermore, losses can be decreased by modifications of the building envelope or the technical systems. Another common term for energy demand is energy need, used for example in EN 15603.
2.4.5 Unnecessary energy use The energy use of a building is never totally optimised; there are losses and not requested energy use for several reasons. The unnecessary energy use is energy used when there is no energy demand; an example would be when a light is turned on in an unoccupied room. Unnecessary energy use can be reduced by increasing
14
the awareness of occupants and maintenance staff or by improved control strategies.
2.5 Functional and Organisational Division Building energy can be subdivided in two different ways, either functionally or organisationally. In the functional division, energy is divided between the functions for which it is used. The organisational division relates to who pays for the energy. A problem today is that the Swedish National Board of Housing, Building and Planning [Boverket] and the Swedish Energy Agency [Energimyndigheten], use a mixture of functional division and organisational division. The consequence is unclear and inconsistent definitions. It is easy to understand how this mixture originated. On the one hand, an organisational division of purchased energy use is almost always readily available, based on who is paying for the energy, e.g. tenant or building owner. On the other hand, in the evaluation of energy efficiency, a functional division of the energy use is required.
Organisationally divided energy can most often not be correctly translated directly to a functional division, although in practice this is often assumed to be possible.
Here follows one example of how this confusion can occur in practice. The following definitions are used by the Swedish National Board of Housing, Building and Planning [Boverket]:
- Building services electricity is the electricity used for operation of the central systems. It is required if the building is to be used for its intended purpose. Examples are electricity use for fans, pumps, elevators, permanently installed lighting, etc.
- Tenant electricity is the electricity used for the activities taking place in buildings. Examples are lighting, computers, copiers, TV, dishwashers, washing machines and other household machines.
When building services electricity is reported, it is commonly equated to landlord electricity, although it might not be exactly the same thing. The division between landlord electricity and tenant electricity depends on the tenant agreements and the billing of energy, and not on the actual function. For example, if a landlord pays for the building service electricity, except for the energy to the exhaust and supply system with heat exchanger (FTX) [från- och tilluftssystem med värmeväxlare] which is paid by the tenants, than the energy to the fans in the FTX will be missing in the building service electricity statistics.
How these confusions become a complicating factor is also illustrated in the thesis case study, presented in Chapter 6-9. Chapter 6 presents energy data that were measured on a mainly organisational basis. In Chapter 7, the energy data is re-allocated, based on estimates, to the different functions in the building. In order to do this an iterative process with cross comparisons to the calculation model, presented in Chapter 8, was needed. This is a rather time consuming process that would not have been necessary if the measurements had been based on a functional division in the first place.
15

3 LITERATURE REVIEW The literature review focuses on issues related to energy statistics and scientific investigations related to shopping malls. There are a number of scientific papers that deal with energy efficiency in shopping malls in one way or another [14, 27, 31,
32, 36, 42, 54-56, 67, 70, 94, 98-100]. These papers are focusing on a varity of issues, such as
• HVAC systems, operation and control[11, 14, 27, 31, 32, 36, 42, 55, 67, 70, 94, 98], • measurements and evaluation of thermal comfort[36, 54, 99], and • construction and architectural design[56, 100].
For this thesis, the papers that focused on HVAC systems, operation and control[11, 14, 27, 31, 32, 42, 55, 67, 70, 94, 98] are more relevant than the ones in the other categories. A number of these papers included case studies in their methodology[11, 14, 32, 55, 56, 67, 94]. Some of the studies involved modelling and simulations of subsystems in shopping malls[27, 31, 32, 67, 94]. However, no study has been found that presents a whole building calculation model for a shopping mall as was done in this thesis.
In the early study by Haberl and Komor from 1989 a case study of a New Jersey shopping mall was used for investigating an analytical framework for improved commercial energy audits. They pointed out that a traditional energy audit of a commercial building is a complex task requiring the services of building professionals from several fields, including architects, mechanical engineers, electrical engineers, lighting engineers, plumbing engineers, electronic specialists, and others. Haberl and Komor showed that combined indices (e.g., kW, kWh, size of conditioned space, and occupancy) can provide useful insight and can be used to determine whether certain equipment is over-sized or left on during unoccupied periods and, whether economizers are functioning properly. An electricity energy saving range of 5 to 15 % and electrical power demand reduction during cooling-season of 8 % is suggested.
In the paper by March[56] a case study was conducted via structured observation, interview and questionnaire survey in Bahrain in 2007. Three buildings were included of which one was a 140 000 m2 shopping mall with over 300 stores. The purpose of the study was to understand the perception of intelligent buildings in Bahrain. What the study means with ‘intelligent building’ is however poorly defined. The study concluded that the pace of construction in Bahrain and the Middle East is such that there is great scope for intelligent buildings to develop further, both from perspective of the number of intelligent buildings being built and also the sophistication of their specifications. This study included no measurement or calculations.
17
The paper by Petkajee[67] tried to develop economic and environmental optimum operation of a combined heat and power system for application to building energy management system for a large shopping mall in Thailand. In the study electrical load profiles for a case study shopping mall were used for the analysis of total operating cost, total CO2 emissions and payback time for an investment of a combined heat and power system.
In the multi-year research study presented by Wang[94] the objective was to determine the magnitude of energy savings achievable by retrofitting existing packaged rooftop units with advanced control strategies. A total of 66 rooftop units on 8 different buildings were retrofitted with commercially available advanced controllers for improving rooftop unit operational efficiency. The eight buildings covered four building types, including mercantile (both retail and shopping malls), office, food sales, and healthcare. These buildings were located in four different climate zones in the U.S. All rooftop units were monitored for at least 1 year with alternative operation (standard vs. advanced). Field measurements included the unit’s total electric power, the return-air CO2 concentration, and temperatures for the outdoor air, the return air, the mixed air, and the supply air. At the national level in the U.S., packaged rooftop units are used in 46 % of all commercial buildings, serving over 60 % of the commercial building floor space in the U.S. The site cooling energy consumption associated with rooftop units is about 47 billion kWha (160 trillion Btus) annually. Package heat pumps account for an additonal 21 billion kWha (70 trillion Btus) annually. The source energy use of these units is over 293 billion kWh (1000 trillion Btus) annually. Therefore, even a small improvement in part-load operation of these units can lead to a significant reduction of energy use and carbon emissions.
The paper by Fitzgerald and Woods[32] dealt with application of laboratory analogue modelling of air flow in a naturally ventilated shopping mall. The laboratory modelling approach was supposed to provide a complement to CFD studies, for large building projects.
The paper by Fahkroo[27] analysed the operation of a typical shopping mall in Qatar, with the aim of optimising cooling energy. A comparison of the energy use of two cooling system operations strategies, i.e., scheduled and unscheduled district cooling, for the shopping mall was conducted. The method used was by simulation. The result showed that scheduling district cooling can result in a 13 % total annual energy saving.
In the paper by Fasiuddin[31] energy savings and comfort enhancement are identified with new HVAC operation strategies for a shopping mall in the hot-humid climate of Saudi Arabia. The energy simulation program VisualDOE 4.0 was used to perform the HVAC and control simulations. Various zero-investment strategies such as thermostat control, night setback control, time-scheduled operation, etc. were investigated. The simulation model was first calibrated with actual energy use values to ensure an accurate and realistic retrofit simulation. The study indicated that it is possible to achieve substantial energy savings while maintaining thermal comfort with the implementation of new HVAC operation strategies.
18
Three of the case studies (Lam and Li[55], Busch[11] and Canbay[14]) which were more directed towards whole building analysis rather than the analysis of subsystems, are summarised in Section 3.2.
There are other relevant studies, not focusing on shopping malls specifically but other types of commercial buildings, that deals with methodologies for whole building energy evaluations of complex buildings [5, 6, 14, 16, 47, 62, 68, 71, 87]. The selected methodology used in this thesis is most similar to the work done by Aste and Del Pero[5], see Section 6.1 for more information. Their presented methodology was used in a case study where an existing office building was retrofitted.
Part of the methodology used in this thesis concerns handling of model input data that are uncertain and difficult to predict. Another study that covers similar model development and calibration problems for an office building was reported by Pappas and Reilly[62]. They described a methodology where the model input data was separated into three categories: known values, roughly known values, and unknown values. They started the model development by incorporating all of the known and roughly known values, and inputting mid-range values for the unknowns. They also performed a rough sensitivity analysis to evaluate the impact of error in any of their key assumptions on the results.
Two input data that were identified in this thesis as unknown and difficult to predict for shopping malls are people occupancy and infiltration. These have therefore been studied in more detail and related literature reviews and investigations are found in Sections 5.1 and 5.3. A separate literature review regarding lighting was also performed, since it has been identified as one of the major energy users in shopping malls[86, 89], and it also has a major potential to be reduced[89]. The literature review on lighting is found in Section 5.2.
Another important part of this thesis is regulatory requirements. References to relevant literature regarding this issue are found in Chapter 3 and 10. In Chapter 3 a database on energy declarations for shopping malls is analysed while, in Chapter 10, regulatory requirements are analysed from the perspective of implementation and implications for shopping malls.
3.1 Energy Statistics The purpose of the following sections is to give an overview of three reports covering energy statistics in shopping malls and/or retail trade, for year 2009. An attempt is made to analyse the reports from the basis of the framework and nomenclature presented in Chapter 2. The reports are:
1. Energy use in retail trade – Improved energy statistics for premises, STIL2[89] – Referred to as Stil2 2009 [Stil2-09]
2. Energy statistics for non-residential premises in 2009[90] – Referred to as Swedish Energy Statistics 2009 [SweES-09]
3. Building Network's energy statistics [25] – Referred to as Norwegian Energy Statistics 2009 [NorES-09]
19
3.1.1 Analysis of energy statistics To make possible a comparison of the three reports on energy statistics in shopping malls and other retail trade, Stil2-09[89], SweES-09[90] and NorES-09[25], an analysis and interpretation of the notations used in the reports was carried out. The nomenclature and system boundaries were according to the framework that was presented in Chapter 2.
The Stil2-09[89] was a study whose goal was to provide more detailed results then the ordinary national energy statistics and it was performed with data from 2009. This is the reason why year 2009 was chosen for this comparison of energy statistic data from different sources. See Table 3.1 for an overview of the reports.
Stil2 2009 [Stil2-09]
Stil2-09[89] was run by the Swedish Energy Agency. The purpose of the project was to improve energy statistics in buildings. Within the overall Stil2-project, there were several reports concerning energy use in different types of buildings, such as, retail trade[89], offices[81], schools[82], hospitals[83] and sport facilities[84]. This literature review analyses only the report concerning energy use in retail trade, “Energy use in retail trade – Improved energy statistics for premises, STIL2”[89]. This study was performed with data from year 2009. In the report, retail trade was divided into three categories; shopping malls, supermarkets and other retail trade. Stil2-09[89] included detailed energy audits for 94 randomly selected buildings of which 19 buildings were shopping malls. It constitutes the most comprehensive report so far concerning energy use in Swedish shopping malls.
Swedish Energy Statistics 2009 [SweES-09]
Yearly energy statistics for Swedish buildings have been published since 1977. The authority responsible for the Swedish Energy Statistics is the Swedish Energy Agency. The report, SweES-09[90], analysed here is limited to non-residential buildings and excludes industry and agriculture.
Energy use in ‘supermarkets’ and ‘other retail’ are reported on a yearly basis in the SweES-09[90]. Shopping malls are included in the category ‘other retail’, i.e. not reported as a separate category. The survey was based on a random stratified sample from the Register of Real Estate. From year 2007, the definition of population was changed in the survey. From having previously asked for information at the property level, data from 2007 and forward was at the building level. This change was made in order to report according to the same unit as in the Building Energy Declarations which are mandatory according to the European Energy Performance of Building Directive (EPBD). The survey on Swedish Energy Statistics in 2009 for non-residential premises, SweES-09[90], was carried out as a mail and web survey. It was based on a sample of 10 313 buildings, and the response rate was 64 percent. At a national level, the estimated number of non-residential building was 62 490 ± 1 509.
Norwegian Energy Statistics 2009 [NorES-09]
Enova published a report on energy statistics in buildings in Norway. It is included in the analysis since Norway has a comparable outdoor climate to Sweden and since it covers energy use in shopping malls. The report is based on
20
data submitted to Enova’s internet based reporting tool Byggnet. It should be noted that the figures in the NorES-09[25] are not representative for the buildings in Norway as a whole. Unlike the SweES-09[90], the NorES-09[25] is not based on a random selection. Therefore, one cannot extrapolate the energy use for the buildings included in the report to all buildings in Norway. Enova reports supermarkets and other retail together in the same category. The report includes data from 2 493 buildings in which 147 buildings are shopping malls.
3.1.2 Area definitions To compare buildings of different size, the notation specific energy use is commonly used. This is defined as energy use divided by the floor area of the building. When the energy use includes only purchased energy, the more correct notation specific purchased energy is suggested. When specific energy use or specific purchased energy, kWh/m2, is compared it is important that the same areas are compared.
Just to illustrate the different area definitions that are used, the most common Swedish definitions are as follows:
• Atemp: Floor area in temperature-controlled spaces intended to be heated to more than 10 °C, enclosed by inside of the building envelope. This definition is defined by the Swedish National Board of Housing, Building and Planning [Boverket].[7] 1
• LOA [lokalarea]. LOA is the rentable area in non-residential buildings. Staircases and corridors are not included in LOA, which means that the heated area is larger in reality than in the statistics. See SS 21054:2009 for a complete definition.[91]
• BTA[Bruttoarea]: The gross floor area where measured from the outside walls. See SS 21054:2009 for a complete definition.[91]
• BRA [Bruksarea]: The sum of all areas of all floors measured from the inside of the building envelope. See SS 21054:2009 for a complete definition.[91]
The floor areas were measured differently in the energy statistics in the Stil2-09[89], the SweES-09[90] and the NorES-09[25]. Stil2-09[89] uses Atemp, SweES-09[90] uses LOA and NorES-09[25] uses a Norwegian version of BTA[25], which does not have the exact same definition as the Swedish BRA. Atemp is the area definition also used for energy declarations in Sweden and by the Swedish building regulations. Atemp and LOA is measured from the inside walls whereas BTA is measured from the outside of the walls. Consequently, since Atemp and LOA excludes areas included in BTA, the Stil2-09[89] and SweES-09[90] gives a slightly higher specific purchased energy compared to NorES-09[25]. How Atemp and LOA relate to each other may differ between different buildings, but generally Atemp would be larger since it includes staircases and corridors which are excluded from LOA. For more information on area definitions see standard SS 021054:2009[91]
1 If there is a garage heated above 10 °C than the energy for heating is included in the BBR energy but not the area.
21
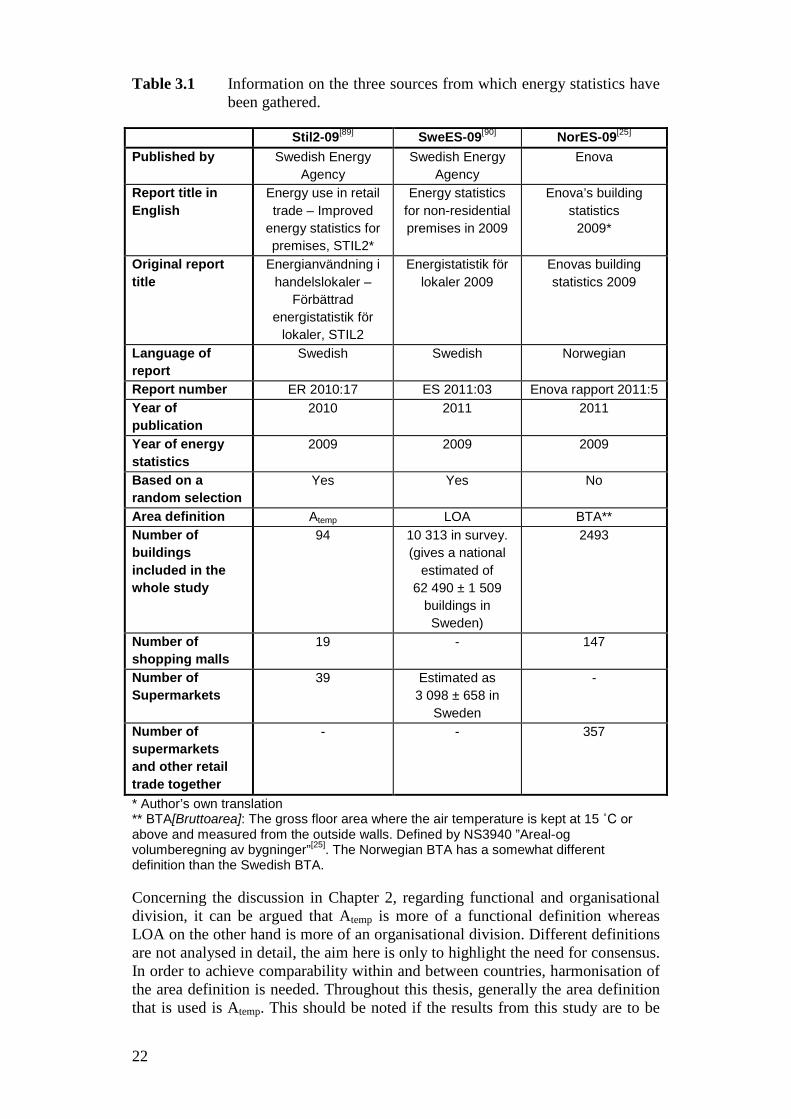
Table 3.1 Information on the three sources from which energy statistics have been gathered.
Stil2-09[89] SweES-09[90] NorES-09[25] Published by Swedish Energy
Agency Swedish Energy
Agency Enova
Report title in English
Energy use in retail trade – Improved
energy statistics for premises, STIL2*
Energy statistics for non-residential premises in 2009
Enova’s building statistics
2009*
Original report title
Energianvändning i handelslokaler –
Förbättrad energistatistik för
lokaler, STIL2
Energistatistik för lokaler 2009
Enovas building statistics 2009
Language of report
Swedish Swedish Norwegian
Report number ER 2010:17 ES 2011:03 Enova rapport 2011:5 Year of publication
2010 2011 2011
Year of energy statistics
2009 2009 2009
Based on a random selection
Yes Yes No
Area definition Atemp LOA BTA** Number of buildings included in the whole study
94 10 313 in survey. (gives a national
estimated of 62 490 ± 1 509
buildings in Sweden)
2493
Number of shopping malls
19 - 147
Number of Supermarkets
39 Estimated as 3 098 ± 658 in
Sweden
-
Number of supermarkets and other retail trade together
- - 357
* Author’s own translation ** BTA[Bruttoarea]: The gross floor area where the air temperature is kept at 15 ˚C or above and measured from the outside walls. Defined by NS3940 ”Areal-og volumberegning av bygninger”[25]. The Norwegian BTA has a somewhat different definition than the Swedish BTA.
Concerning the discussion in Chapter 2, regarding functional and organisational division, it can be argued that Atemp is more of a functional definition whereas LOA on the other hand is more of an organisational division. Different definitions are not analysed in detail, the aim here is only to highlight the need for consensus. In order to achieve comparability within and between countries, harmonisation of the area definition is needed. Throughout this thesis, generally the area definition that is used is Atemp. This should be noted if the results from this study are to be
22
analysed with specific energy use of other buildings. On the occasions when other area definitions appear in the thesis it is intended to be clearly stated.
3.1.3 Reported numerical data See Table 3.2 and Table 3.3 when following the discussion in this section. Note that Table 3.2 summarises all electric energy and Table 3.3 summaries all thermal energy from the three references Stil2-09[89], SweES-09[90] and NorES-09[25]. The statistics are commented on and organised on the basis of the different measurements.
Total energy use
The total electricity use is found in the last row in Table 3.2 and it is called building electricity. The building electricity combined with the sum of the thermal energies presented in Table 3.3 gives the resulting total energy use.
According to Stil2-09[89], the total average energy use (including building electricity and thermal energy) in shopping malls is 262 kWha/m2 in Sweden. The total energy use in other retail trade is considerably lower, with 182.9 kWha/m2. It can be questioned what reasons there are for this large difference. The national Swedish Energy Statistics in SweES-09[90] does not have information on total energy use, since the tenant energy use is excluded in this study.
Comparing Norway (NorES-09[25]) and Sweden (Stil2-09[89]) the total energy use is lower in Norway. In Norway the total energy use for shopping malls is 248 kWha/m2 compared to the stated 262 kWha/m2 in Sweden. These values include both building electricity and thermal energy.
Building electricity
According to Stil2-09[89], shopping malls use considerably more building electricity than other retail trade in Sweden. In general, it can again be questioned why a shopping mall, which would generally have similar activities to other retail trade, would need more building electricity.
Comparing building electricity between Sweden and Norway is not straightforward. Building electricity is much higher for the NorES-09[25] then for Stil2-09[89], but this is because the NorES-09[25] probably also includes all or parts of business electricity, HVAC electricity and service electricity while Stil2-09[89] reports these measures separately.
A comparison between NorES-09[25] and the corresponding study for Norwegian energy statistics in year 2006, NorES-06[24], revels large differences between years 2006 and 2009. The building electricity in year 2006 was 373 kWha/m2 in shopping malls and 492 kWha/m2 in supermarkets and other retail trade. In 2009 the same measures was 239 kWha/m2 and 478 kWha/m2 respectively.[24, 25] However, it is not known if this is an actual decrease or if it is related to the difference in selections of buildings between the years. The buildings in the Norwegian energy statistics are not selected randomly and therefore they are less reliable for statistical analysis. Furthermore, it is unknown to what degree the 2006 and 2009 years data include the same buildings or not.
23
Refrigeration
Stil2-09[89] is the only report that includes data on refrigeration, which is less common in shopping malls then in other retail trade.
Lighting
According to Stil2-09[89], lighting is by far the largest part of the business electricity in shopping malls and other retail trade. Furthermore, energy use for lighting is considerably higher in shopping malls than in other retail trade.
Electric heating including heat pumps
Electric heating including heat pumps is higher in other retail trade than in shopping malls in Sweden. Stil2-09[89] is the only report on energy statistics that includes data on electric heating including heat pumps. However, in the energy declarations it is mandatory to report electric heating.
Comfort cooling
The HVAC electricity used for comfort cooling is higher in shopping malls than in other retail trade. The lighting and comfort cooling interact since lighting affects the internal heat load and surplus heat that must be removed from the building.
Pumps and fans
Energy use for pumps and fans is rarely measured and reported in energy statistics for buildings. However it is included in Stil2-09[89] and the result shows that pumps and fans account for approximately 20 % of the building electricity, hence their energy use is not negligible.
District heating and cooling
According to Stil2-09[89], shopping malls use both more district heating and more district cooling than other retail trade. District heating is much larger in retail trade premises in Sweden than in Norway. At the same time building electricity is much lower in Stil2-09[89] than in the NorES-09[25]. In Sweden district heating is the most common source of energy used for heating. It is strange, however, that in the SweES-09[90] for other retail trade, district heating is reported to be nearly twice as high, 115 kWha/m2, as the figure for retail trade in Stil2-09[89], 66.5 kWha/m2.
24
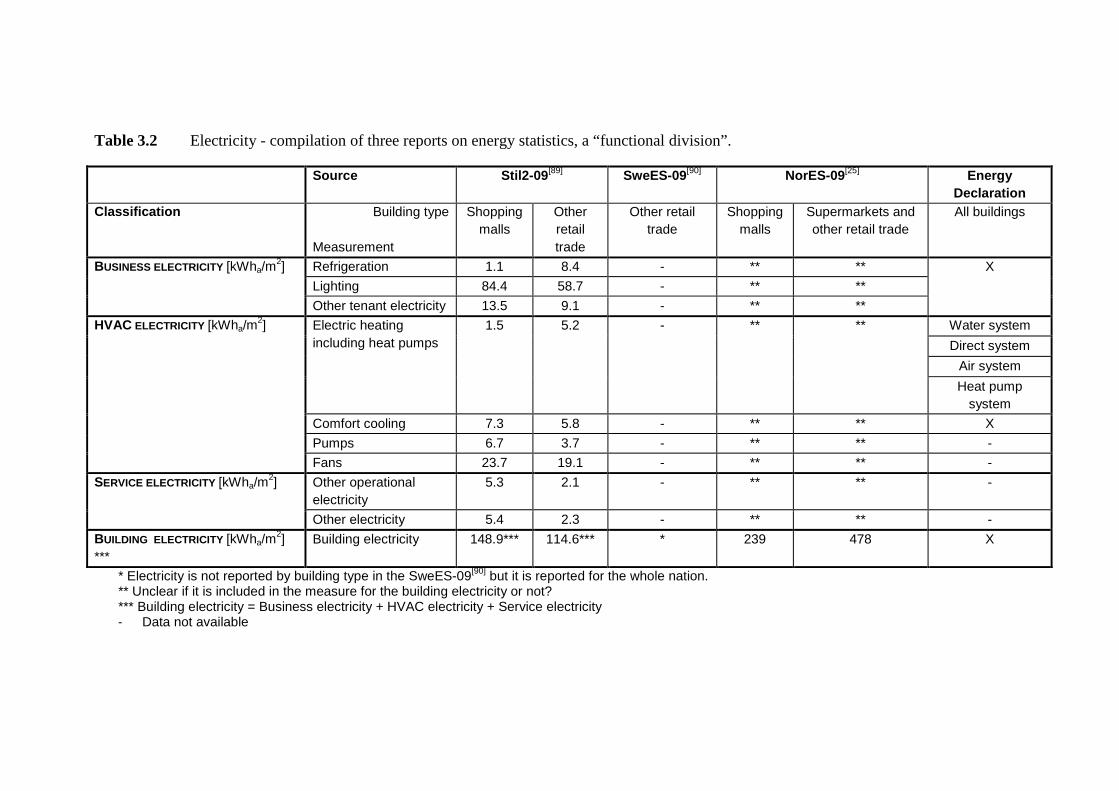
Table 3.2 Electricity - compilation of three reports on energy statistics, a “functional division”.
Source Stil2-09[89] SweES-09[90] NorES-09[25] Energy Declaration
Classification Building type
Measurement
Shopping malls
Other retail trade
Other retail trade
Shopping malls
Supermarkets and other retail trade
All buildings
BUSINESS ELECTRICITY [kWha/m2] Refrigeration 1.1 8.4 - ** ** X Lighting 84.4 58.7 - ** ** Other tenant electricity 13.5 9.1 - ** **
HVAC ELECTRICITY [kWha/m2] Electric heating including heat pumps
1.5 5.2 - ** ** Water system Direct system
Air system Heat pump
system Comfort cooling 7.3 5.8 - ** ** X Pumps 6.7 3.7 - ** ** - Fans 23.7 19.1 - ** ** -
SERVICE ELECTRICITY [kWha/m2] Other operational electricity
5.3 2.1 - ** ** -
Other electricity 5.4 2.3 - ** ** - BUILDING ELECTRICITY [kWha/m2] ***
Building electricity 148.9*** 114.6*** * 239 478 X
* Electricity is not reported by building type in the SweES-09[90] but it is reported for the whole nation. ** Unclear if it is included in the measure for the building electricity or not? *** Building electricity = Business electricity + HVAC electricity + Service electricity - Data not available
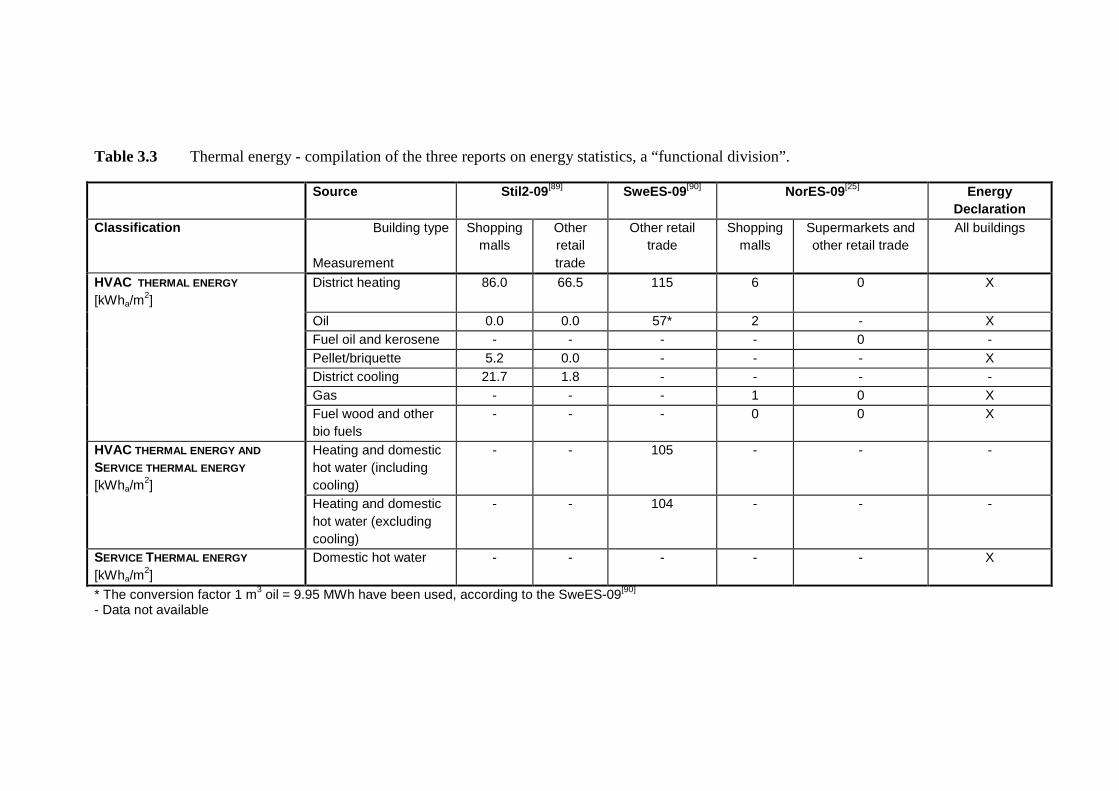
Table 3.3 Thermal energy - compilation of the three reports on energy statistics, a “functional division”.
Source Stil2-09[89] SweES-09[90] NorES-09[25] Energy Declaration
Classification Building type
Measurement
Shopping malls
Other retail trade
Other retail trade
Shopping malls
Supermarkets and other retail trade
All buildings
HVAC THERMAL ENERGY [kWha/m2]
District heating 86.0 66.5 115 6 0 X
Oil 0.0 0.0 57* 2 - X Fuel oil and kerosene - - - - 0 - Pellet/briquette 5.2 0.0 - - - X District cooling 21.7 1.8 - - - - Gas - - - 1 0 X Fuel wood and other bio fuels
- - - 0 0 X
HVAC THERMAL ENERGY AND SERVICE THERMAL ENERGY [kWha/m2]
Heating and domestic hot water (including cooling)
- - 105 - - -
Heating and domestic hot water (excluding cooling)
- - 104 - - -
SERVICE THERMAL ENERGY [kWha/m2]
Domestic hot water - - - - - X
* The conversion factor 1 m3 oil = 9.95 MWh have been used, according to the SweES-09[90] - Data not available
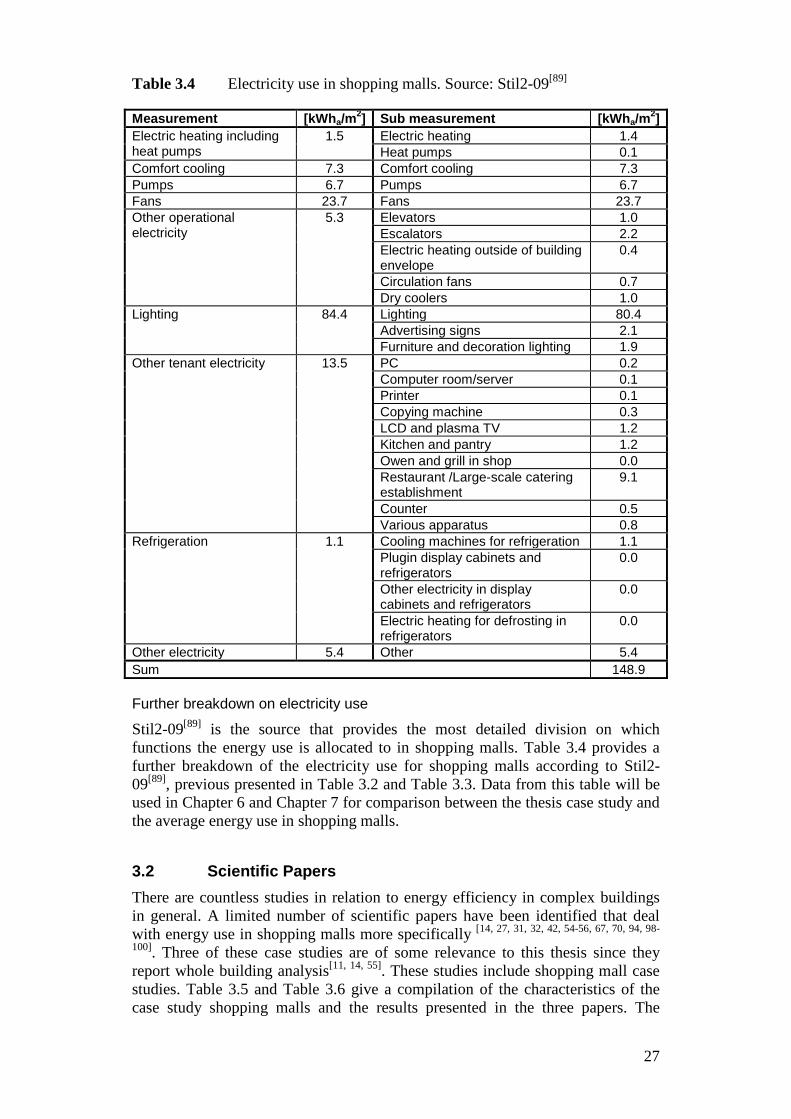
Table 3.4 Electricity use in shopping malls. Source: Stil2-09[89]
Measurement [kWha/m2] Sub measurement [kWha/m2] Electric heating including heat pumps
1.5 Electric heating 1.4 Heat pumps 0.1
Comfort cooling 7.3 Comfort cooling 7.3 Pumps 6.7 Pumps 6.7 Fans 23.7 Fans 23.7 Other operational electricity
5.3 Elevators 1.0 Escalators 2.2 Electric heating outside of building envelope
0.4
Circulation fans 0.7 Dry coolers 1.0
Lighting 84.4 Lighting 80.4 Advertising signs 2.1 Furniture and decoration lighting 1.9
Other tenant electricity 13.5 PC 0.2 Computer room/server 0.1 Printer 0.1 Copying machine 0.3 LCD and plasma TV 1.2 Kitchen and pantry 1.2 Owen and grill in shop 0.0 Restaurant /Large-scale catering establishment
9.1
Counter 0.5 Various apparatus 0.8
Refrigeration 1.1 Cooling machines for refrigeration 1.1 Plugin display cabinets and refrigerators
0.0
Other electricity in display cabinets and refrigerators
0.0
Electric heating for defrosting in refrigerators
0.0
Other electricity 5.4 Other 5.4 Sum 148.9
Further breakdown on electricity use
Stil2-09[89] is the source that provides the most detailed division on which functions the energy use is allocated to in shopping malls. Table 3.4 provides a further breakdown of the electricity use for shopping malls according to Stil2-09[89], previous presented in Table 3.2 and Table 3.3. Data from this table will be used in Chapter 6 and Chapter 7 for comparison between the thesis case study and the average energy use in shopping malls.
3.2 Scientific Papers There are countless studies in relation to energy efficiency in complex buildings in general. A limited number of scientific papers have been identified that deal with energy use in shopping malls more specifically [14, 27, 31, 32, 42, 54-56, 67, 70, 94, 98-
100]. Three of these case studies are of some relevance to this thesis since they report whole building analysis[11, 14, 55]. These studies include shopping mall case studies. Table 3.5 and Table 3.6 give a compilation of the characteristics of the case study shopping malls and the results presented in the three papers. The
27
following three section provides short summaries of the studies described in each paper.
3.2.1 Four case study shopping malls in Hong Kong The study reported by Lam and Li[55] investigated the electricity use characteristics of four fully air conditioned shopping malls, built during the 1990s, in subtropical Hong Kong. These are all modern shopping malls from that era, with centralised HVAC plants. The HVAC systems consisted of central air handling units and local fan coil units. Chilled water was provided by air cooled hermetic centrifugal or reciprocating machines with a rated cooling coefficient of performance (COPcool) ranging from 2.65 to 2.88.
The average electric lighting load densities for the landlord and tenant areas were 15 W/m2 and 55 W/m2, respectively. The annual total electricity use per total floor area ranged from 391 to 454 kWha/m2
TotalFloorArea, with a mean of 430 kWha/m2
TotalFloorArea. The landlord’s electricity use ranged from 485 to 795 kWha/m2
LandlordArea and the tenants’ electricity use ranged from 294 to 327 kWha/m2
TenantArea. Note that landlord electricity use and tenant electricity use were based on landlord area and tenant area, respectively. This is why landlord electricity use has a larger value than the total electricity use, since the total electricity use is based on the total floor area.
Lam and Li[55] also report insufficient sub-metering. Sufficient sub-metering is needed to achieve accurate monitoring of the electricity use by different building services installations and equipment. Furthermore, the results showed that air conditioning and electric lighting were major end users of electricity. Lam and Li also refer to a study on air conditioned buildings reported by Lam and Chan[53], where it was concluded that air conditioning accounted for 40–60 % and lighting accounted for 20–30 % of the total electricity use in commercial buildings. Electricity use per unit gross floor area ranged from 391 to 454 kWha/m2, with an average of 430 kWha/m2.
Electricity use showed a strong correlation with the mean monthly outdoor temperature. Air conditioning and lighting is of special importance for shopping malls in terms of energy efficient design and energy management. This is because shopping malls tend to have a much larger lighting load, higher occupant density and, hence, a larger demand for air conditioning than buildings in general.
3.2.2 One case study shopping mall in Bangkok The study reported by Busch[11] explored the opportunities to save electricity required for lighting in prototype Thai offices, hotels and shopping malls. Prototype building descriptions were based on existing buildings in Bangkok. The climate in Bangkok is hot and humid, which causes high cooling demands. The savings from lighting conservation measures were calculated as direct savings and indirect savings. Direct savings came from reduced lighting use. Indirect savings came from reduced cooling loads due to the reduction in waste heat generated by the lighting system.
28
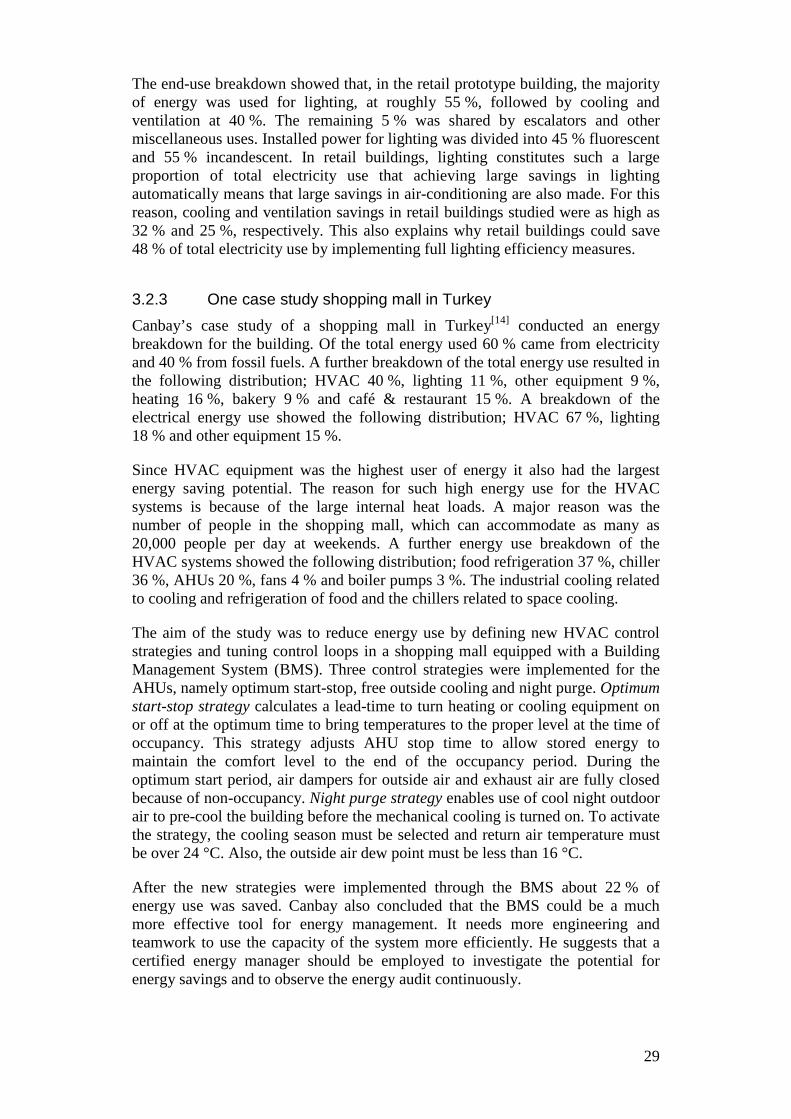
The end-use breakdown showed that, in the retail prototype building, the majority of energy was used for lighting, at roughly 55 %, followed by cooling and ventilation at 40 %. The remaining 5 % was shared by escalators and other miscellaneous uses. Installed power for lighting was divided into 45 % fluorescent and 55 % incandescent. In retail buildings, lighting constitutes such a large proportion of total electricity use that achieving large savings in lighting automatically means that large savings in air-conditioning are also made. For this reason, cooling and ventilation savings in retail buildings studied were as high as 32 % and 25 %, respectively. This also explains why retail buildings could save 48 % of total electricity use by implementing full lighting efficiency measures.
3.2.3 One case study shopping mall in Turkey Canbay’s case study of a shopping mall in Turkey[14] conducted an energy breakdown for the building. Of the total energy used 60 % came from electricity and 40 % from fossil fuels. A further breakdown of the total energy use resulted in the following distribution; HVAC 40 %, lighting 11 %, other equipment 9 %, heating 16 %, bakery 9 % and café & restaurant 15 %. A breakdown of the electrical energy use showed the following distribution; HVAC 67 %, lighting 18 % and other equipment 15 %.
Since HVAC equipment was the highest user of energy it also had the largest energy saving potential. The reason for such high energy use for the HVAC systems is because of the large internal heat loads. A major reason was the number of people in the shopping mall, which can accommodate as many as 20,000 people per day at weekends. A further energy use breakdown of the HVAC systems showed the following distribution; food refrigeration 37 %, chiller 36 %, AHUs 20 %, fans 4 % and boiler pumps 3 %. The industrial cooling related to cooling and refrigeration of food and the chillers related to space cooling.
The aim of the study was to reduce energy use by defining new HVAC control strategies and tuning control loops in a shopping mall equipped with a Building Management System (BMS). Three control strategies were implemented for the AHUs, namely optimum start-stop, free outside cooling and night purge. Optimum start-stop strategy calculates a lead-time to turn heating or cooling equipment on or off at the optimum time to bring temperatures to the proper level at the time of occupancy. This strategy adjusts AHU stop time to allow stored energy to maintain the comfort level to the end of the occupancy period. During the optimum start period, air dampers for outside air and exhaust air are fully closed because of non-occupancy. Night purge strategy enables use of cool night outdoor air to pre-cool the building before the mechanical cooling is turned on. To activate the strategy, the cooling season must be selected and return air temperature must be over 24 °C. Also, the outside air dew point must be less than 16 °C.
After the new strategies were implemented through the BMS about 22 % of energy use was saved. Canbay also concluded that the BMS could be a much more effective tool for energy management. It needs more engineering and teamwork to use the capacity of the system more efficiently. He suggests that a certified energy manager should be employed to investigate the potential for energy savings and to observe the energy audit continuously.
29
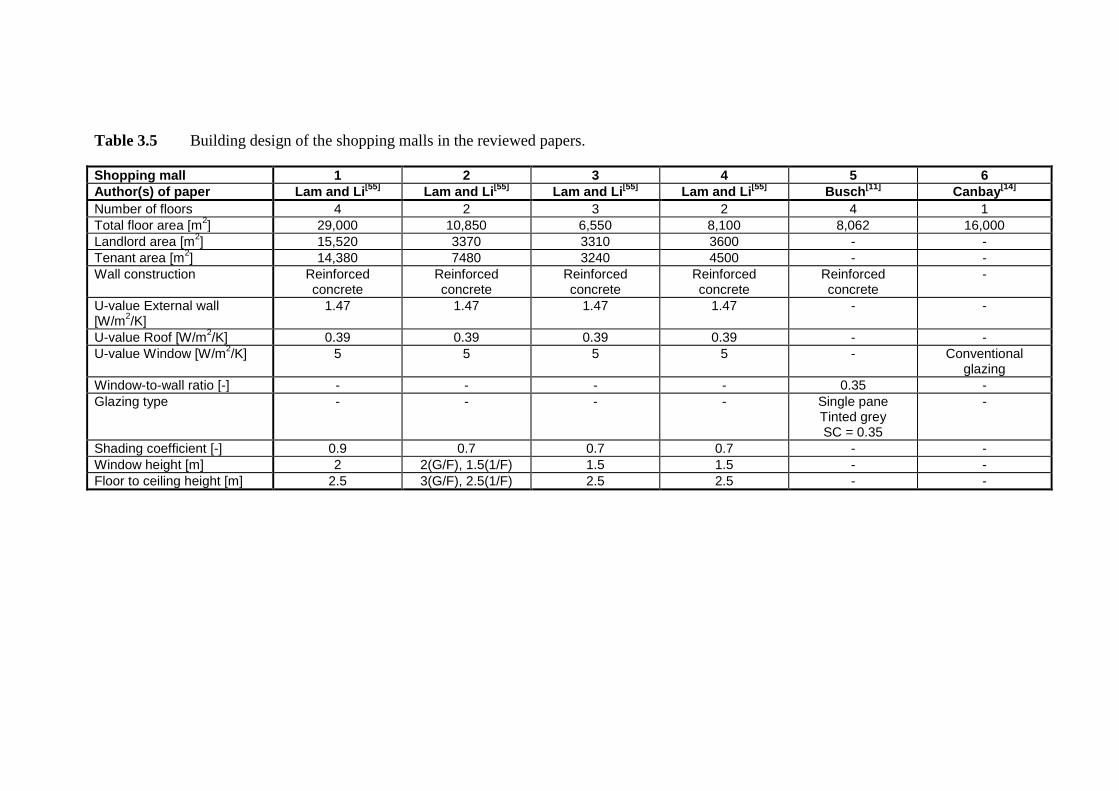
Table 3.5 Building design of the shopping malls in the reviewed papers.
Shopping mall 1 2 3 4 5 6 Author(s) of paper Lam and Li[55] Lam and Li[55] Lam and Li[55] Lam and Li[55] Busch[11] Canbay[14] Number of floors 4 2 3 2 4 1 Total floor area [m2] 29,000 10,850 6,550 8,100 8,062 16,000 Landlord area [m2] 15,520 3370 3310 3600 - - Tenant area [m2] 14,380 7480 3240 4500 - - Wall construction Reinforced
concrete Reinforced concrete
Reinforced concrete
Reinforced concrete
Reinforced concrete
-
U-value External wall [W/m2/K]
1.47 1.47 1.47 1.47 - -
U-value Roof [W/m2/K] 0.39 0.39 0.39 0.39 - - U-value Window [W/m2/K] 5 5 5 5 - Conventional
glazing Window-to-wall ratio [-] - - - - 0.35 - Glazing type - - - - Single pane
Tinted grey SC = 0.35
-
Shading coefficient [-] 0.9 0.7 0.7 0.7 - - Window height [m] 2 2(G/F), 1.5(1/F) 1.5 1.5 - - Floor to ceiling height [m] 2.5 3(G/F), 2.5(1/F) 2.5 2.5 - -
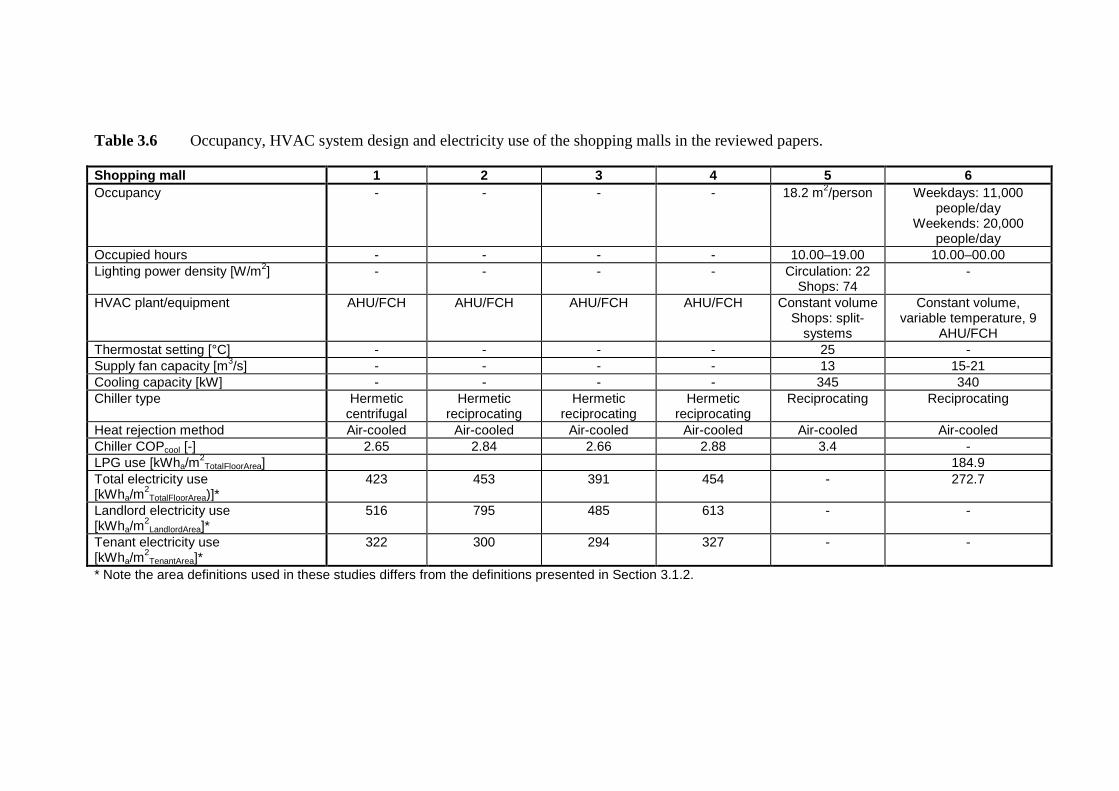
Table 3.6 Occupancy, HVAC system design and electricity use of the shopping malls in the reviewed papers.
Shopping mall 1 2 3 4 5 6 Occupancy - - - - 18.2 m2/person Weekdays: 11,000
people/day Weekends: 20,000
people/day Occupied hours - - - - 10.00–19.00 10.00–00.00 Lighting power density [W/m2] - - - - Circulation: 22
Shops: 74 -
HVAC plant/equipment AHU/FCH AHU/FCH AHU/FCH AHU/FCH Constant volume Shops: split-
systems
Constant volume, variable temperature, 9
AHU/FCH Thermostat setting [°C] - - - - 25 - Supply fan capacity [m3/s] - - - - 13 15-21 Cooling capacity [kW] - - - - 345 340 Chiller type Hermetic
centrifugal Hermetic
reciprocating Hermetic
reciprocating Hermetic
reciprocating Reciprocating Reciprocating
Heat rejection method Air-cooled Air-cooled Air-cooled Air-cooled Air-cooled Air-cooled Chiller COPcool [-] 2.65 2.84 2.66 2.88 3.4 - LPG use [kWha/m2
TotalFloorArea] 184.9 Total electricity use [kWha/m2
TotalFloorArea)]* 423 453 391 454 - 272.7
Landlord electricity use [kWha/m2
LandlordArea]* 516 795 485 613 - -
Tenant electricity use [kWha/m2
TenantArea]* 322 300 294 327 - -
* Note the area definitions used in these studies differs from the definitions presented in Section 3.1.2.
3.3 Discussion and Summary The national energy statistics in Sweden include retail trade and supermarkets but does not handle shopping malls separately. In 2009 there was however a separate study that included 94 randomly selected buildings from the three building categories shopping malls, supermarkets and (other) retail trade. Of these buildings 19 were shopping malls. According to Stil2-09[89], the average total energy use in shopping malls in Sweden is 262.0 kWha/m2. The energy supply is divided between 149 kWha/m2 electricity, 86.0 kWha/m2 district heating, 5.2 kWha/m2 pellet/briquette, and 21.7 kWha/m2 district cooling, according to Stil2-09[89]. Of the energy supplied to the building approximately 35 % is used for heating (includes energy form heat pumps, district heating and pellet/briquette), 11 % for cooling (includes comfort cooling/chiller and district cooling), 32 % is used for lighting, 9 % for fans, and 3 % for pumps, according to the data presented in Table 3.2 and Table 3.3.
The scientific case studies described in Section 3.2 were conducted in Bangkok, Hong Kong and Turkey. Those case study shopping malls were therefore exposed to different climates than the Swedish case study shopping mall that is investigated in this thesis, see Chapter 6-9. There were several other differences: for example, the reinforced concrete material used for the walls is not very common in Scandinavia, where shopping malls usually have a much lighter construction. Despite these differences these case studies are relevant since they are the only studies identified that conducted whole building analysis on existing case study shopping malls. There are also similarities to the results from the energy statistics in Sweden. Take lighting for example, Stil2-09[89] reports lighting as a major energy user, as do Lam and Chan[53] who point out that lighting accounts for 20–30 % of the total electricity use in commercial buildings.
There is a need to improve how energy statistics in buildings are reported. In the national energy statistics in Sweden a mixture of functionally and organisationally divided energy is being used. This makes it difficult, and sometimes impossible, to use the data for a correct analysis of the energy flows.
32
4 DATABASE ON ENERGY DECLARATIONS Based on the energy declarations, what conclusions can be made concerning the energy performance of shopping malls in Sweden? Chapter 2 gave an introduction to the Swedish building code, BBR, and the energy declarations. In this chapter a database on energy declarations is analysed. The energy declarations are completed by certified energy experts. The energy declaration system has a central registry and database to which the energy experts report the declarations. A selection of energy declarations from this central database was received from the Swedish National Board of Housing, Building and Planning [Boverket].
The database includes buildings declared before the date 2012-09-07 and where all or parts of the building was categorised as shopping mall. The database included 319 building declarations. However, 50 of these declarations where selected for a more thorough analysis. The reason for this was to select the buildings that were comparable to the thesis case study in terms of size and function. The first section of this chapter describes the method used to select the 50 declarations that are subject for the results and analyses presented in Section 4.2.
4.1 Selection of Energy Declarations In this thesis, shopping malls refers to larger buildings, usually with multiple functions and where shops are entered via interior corridors. If looking at the area of the shopping malls included in this database, then the floor areas are distributed according to Figure 4.1. Note that the presented area intervals on the x-axis are larger when the floor area is larger than 20 000 m2.
Many of the smaller declared buildings can be categorised as shops rather than shopping malls, as defined in the thesis. In the end of this section only the buildings in the area interval between 10 000-30 000 m2, from Figure 4.1, is selected for further analysis, as they are of similar size as the case study building. Until then, however, all 319 buildings is included in the discussions made in this section.
33
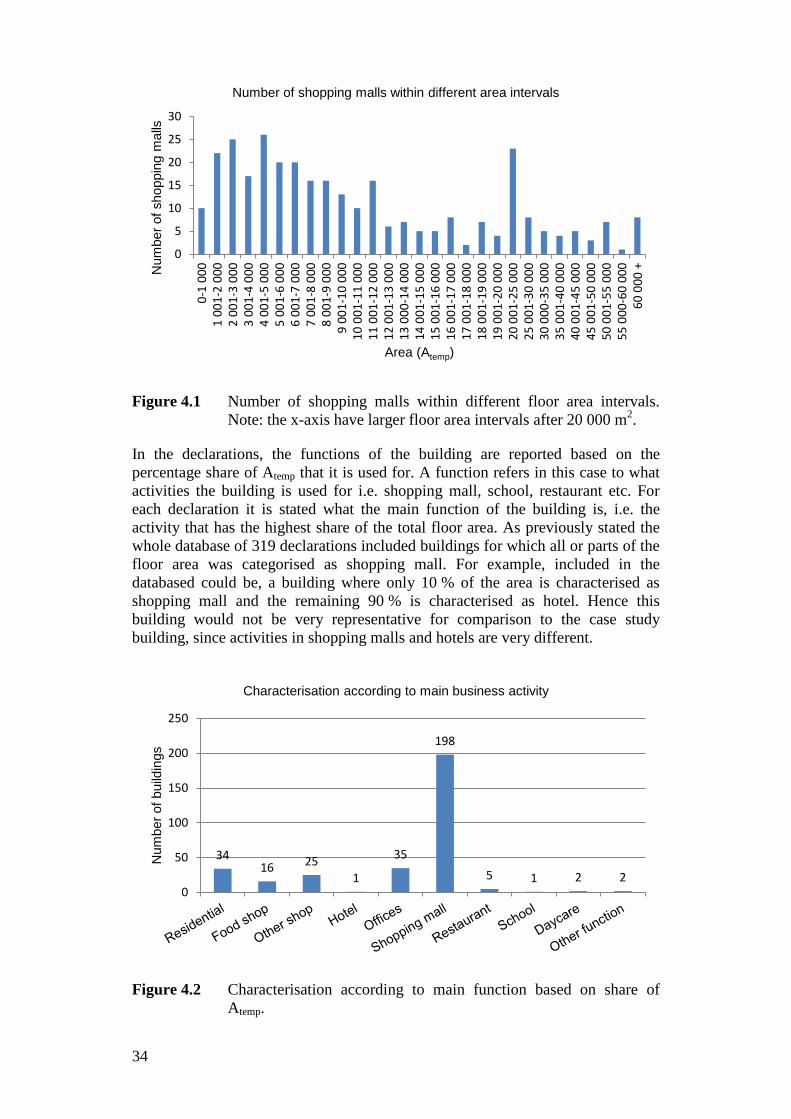
Figure 4.1 Number of shopping malls within different floor area intervals. Note: the x-axis have larger floor area intervals after 20 000 m2.
In the declarations, the functions of the building are reported based on the percentage share of Atemp that it is used for. A function refers in this case to what activities the building is used for i.e. shopping mall, school, restaurant etc. For each declaration it is stated what the main function of the building is, i.e. the activity that has the highest share of the total floor area. As previously stated the whole database of 319 declarations included buildings for which all or parts of the floor area was categorised as shopping mall. For example, included in the databased could be, a building where only 10 % of the area is characterised as shopping mall and the remaining 90 % is characterised as hotel. Hence this building would not be very representative for comparison to the case study building, since activities in shopping malls and hotels are very different.
Figure 4.2 Characterisation according to main function based on share of Atemp.
0
5
10
15
20
25
30
0-1
000
1 00
1-2
000
2 00
1-3
000
3 00
1-4
000
4 00
1-5
000
5 00
1-6
000
6 00
1-7
000
7 00
1-8
000
8 00
1-9
000
9 00
1-10
000
10 0
01-1
1 00
011
001
-12
000
12 0
01-1
3 00
013
000
-14
000
14 0
01-1
5 00
015
001
-16
000
16 0
01-1
7 00
017
001
-18
000
18 0
01-1
9 00
019
001
-20
000
20 0
01-2
5 00
025
001
-30
000
30 0
00-3
5 00
035
001
-40
000
40 0
01-4
5 00
045
001
-50
000
50 0
01-5
5 00
055
000
-60
000
60 0
00 +Num
ber o
f sho
ppin
g m
alls
Area (Atemp)
Number of shopping malls within different area intervals
34 16 25
1
35
198
5 1 2 2 0
50
100
150
200
250
Num
ber o
f bui
ldin
gs
Characterisation according to main business activity
34
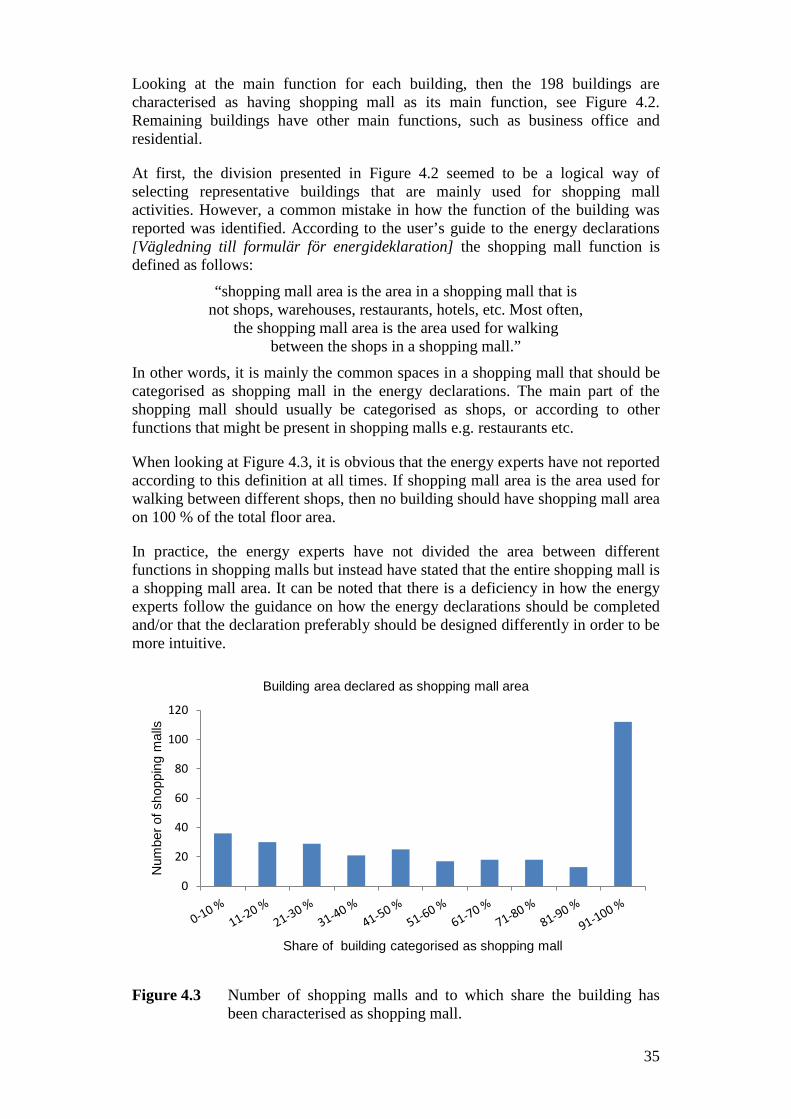
Looking at the main function for each building, then the 198 buildings are characterised as having shopping mall as its main function, see Figure 4.2. Remaining buildings have other main functions, such as business office and residential.
At first, the division presented in Figure 4.2 seemed to be a logical way of selecting representative buildings that are mainly used for shopping mall activities. However, a common mistake in how the function of the building was reported was identified. According to the user’s guide to the energy declarations [Vägledning till formulär för energideklaration] the shopping mall function is defined as follows:
“shopping mall area is the area in a shopping mall that is not shops, warehouses, restaurants, hotels, etc. Most often,
the shopping mall area is the area used for walking between the shops in a shopping mall.”
In other words, it is mainly the common spaces in a shopping mall that should be categorised as shopping mall in the energy declarations. The main part of the shopping mall should usually be categorised as shops, or according to other functions that might be present in shopping malls e.g. restaurants etc.
When looking at Figure 4.3, it is obvious that the energy experts have not reported according to this definition at all times. If shopping mall area is the area used for walking between different shops, then no building should have shopping mall area on 100 % of the total floor area.
In practice, the energy experts have not divided the area between different functions in shopping malls but instead have stated that the entire shopping mall is a shopping mall area. It can be noted that there is a deficiency in how the energy experts follow the guidance on how the energy declarations should be completed and/or that the declaration preferably should be designed differently in order to be more intuitive.
Figure 4.3 Number of shopping malls and to which share the building has been characterised as shopping mall.
0
20
40
60
80
100
120
Num
ber o
f sho
ppin
g m
alls
Share of building categorised as shopping mall
Building area declared as shopping mall area
35
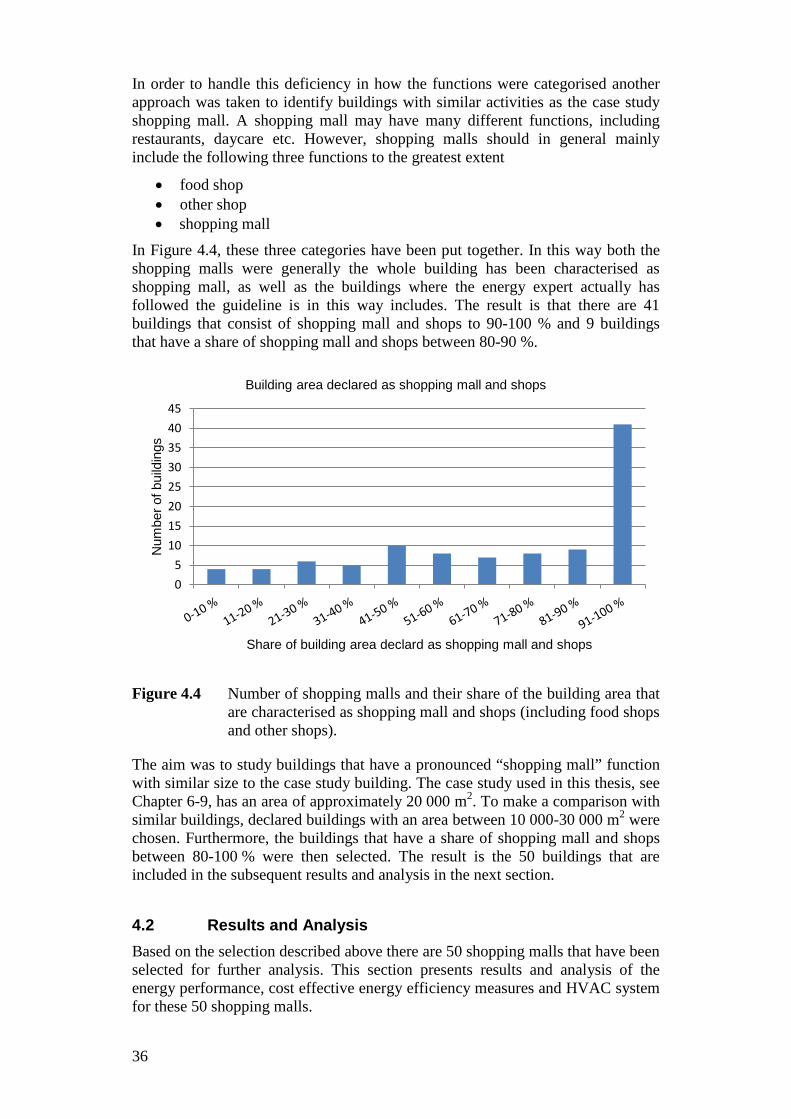
In order to handle this deficiency in how the functions were categorised another approach was taken to identify buildings with similar activities as the case study shopping mall. A shopping mall may have many different functions, including restaurants, daycare etc. However, shopping malls should in general mainly include the following three functions to the greatest extent
• food shop • other shop • shopping mall
In Figure 4.4, these three categories have been put together. In this way both the shopping malls were generally the whole building has been characterised as shopping mall, as well as the buildings where the energy expert actually has followed the guideline is in this way includes. The result is that there are 41 buildings that consist of shopping mall and shops to 90-100 % and 9 buildings that have a share of shopping mall and shops between 80-90 %.
Figure 4.4 Number of shopping malls and their share of the building area that are characterised as shopping mall and shops (including food shops and other shops).
The aim was to study buildings that have a pronounced “shopping mall” function with similar size to the case study building. The case study used in this thesis, see Chapter 6-9, has an area of approximately 20 000 m2. To make a comparison with similar buildings, declared buildings with an area between 10 000-30 000 m2 were chosen. Furthermore, the buildings that have a share of shopping mall and shops between 80-100 % were then selected. The result is the 50 buildings that are included in the subsequent results and analysis in the next section.
4.2 Results and Analysis Based on the selection described above there are 50 shopping malls that have been selected for further analysis. This section presents results and analysis of the energy performance, cost effective energy efficiency measures and HVAC system for these 50 shopping malls.
05
1015202530354045
Num
ber o
f bui
ldin
gs
Share of building area declard as shopping mall and shops
Building area declared as shopping mall and shops
36
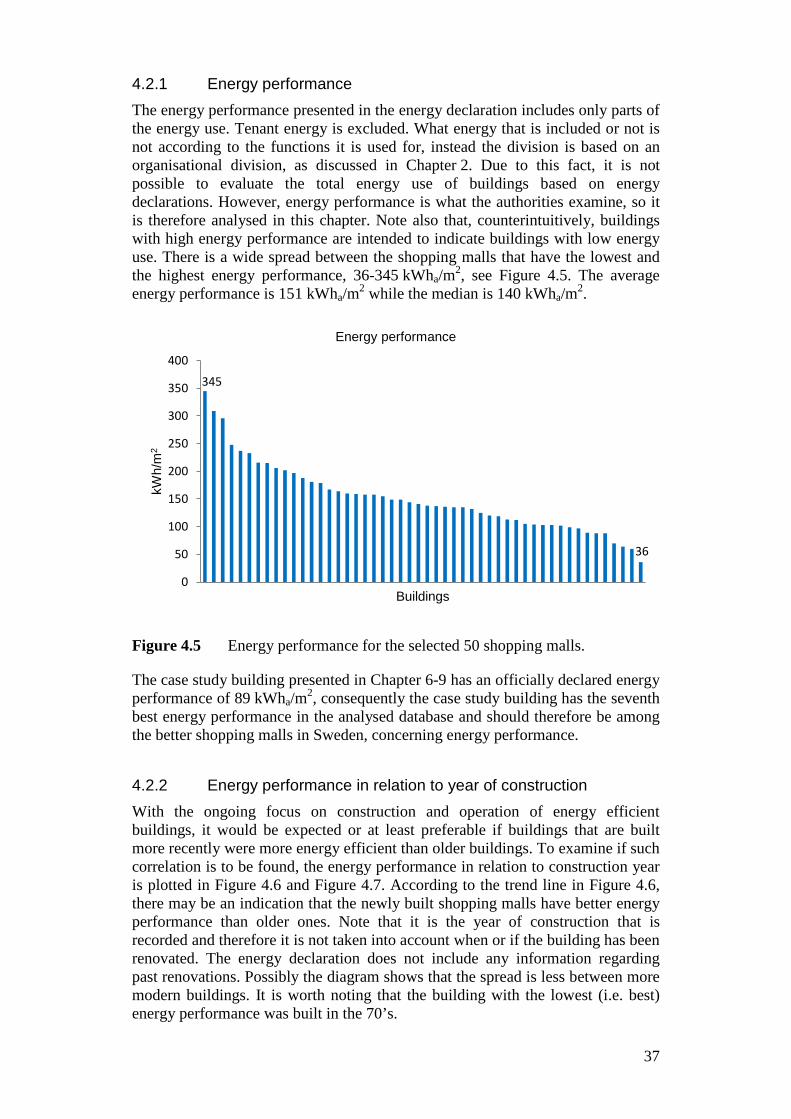
4.2.1 Energy performance The energy performance presented in the energy declaration includes only parts of the energy use. Tenant energy is excluded. What energy that is included or not is not according to the functions it is used for, instead the division is based on an organisational division, as discussed in Chapter 2. Due to this fact, it is not possible to evaluate the total energy use of buildings based on energy declarations. However, energy performance is what the authorities examine, so it is therefore analysed in this chapter. Note also that, counterintuitively, buildings with high energy performance are intended to indicate buildings with low energy use. There is a wide spread between the shopping malls that have the lowest and the highest energy performance, 36-345 kWha/m2, see Figure 4.5. The average energy performance is 151 kWha/m2 while the median is 140 kWha/m2.
Figure 4.5 Energy performance for the selected 50 shopping malls.
The case study building presented in Chapter 6-9 has an officially declared energy performance of 89 kWha/m2, consequently the case study building has the seventh best energy performance in the analysed database and should therefore be among the better shopping malls in Sweden, concerning energy performance.
4.2.2 Energy performance in relation to year of construction With the ongoing focus on construction and operation of energy efficient buildings, it would be expected or at least preferable if buildings that are built more recently were more energy efficient than older buildings. To examine if such correlation is to be found, the energy performance in relation to construction year is plotted in Figure 4.6 and Figure 4.7. According to the trend line in Figure 4.6, there may be an indication that the newly built shopping malls have better energy performance than older ones. Note that it is the year of construction that is recorded and therefore it is not taken into account when or if the building has been renovated. The energy declaration does not include any information regarding past renovations. Possibly the diagram shows that the spread is less between more modern buildings. It is worth noting that the building with the lowest (i.e. best) energy performance was built in the 70’s.
345
36
0
50
100
150
200
250
300
350
400
kWh/
m2
Buildings
Energy performance
37
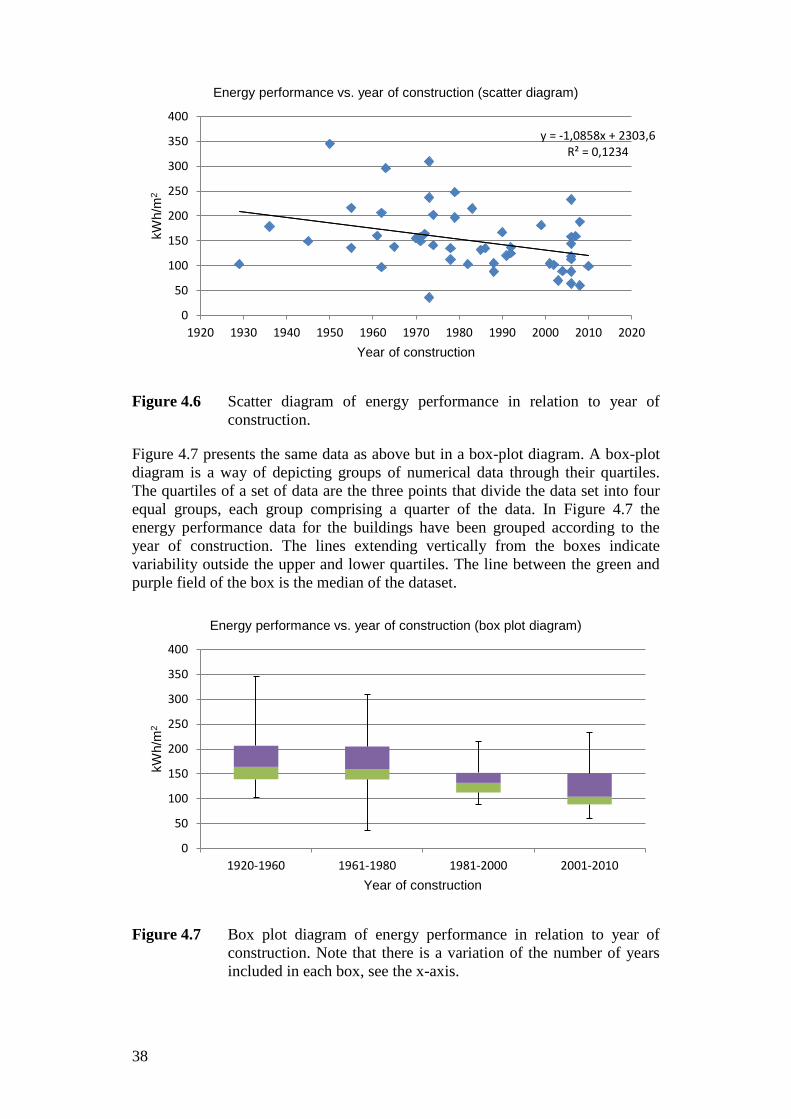
Figure 4.6 Scatter diagram of energy performance in relation to year of construction.
Figure 4.7 presents the same data as above but in a box-plot diagram. A box-plot diagram is a way of depicting groups of numerical data through their quartiles. The quartiles of a set of data are the three points that divide the data set into four equal groups, each group comprising a quarter of the data. In Figure 4.7 the energy performance data for the buildings have been grouped according to the year of construction. The lines extending vertically from the boxes indicate variability outside the upper and lower quartiles. The line between the green and purple field of the box is the median of the dataset.
Figure 4.7 Box plot diagram of energy performance in relation to year of construction. Note that there is a variation of the number of years included in each box, see the x-axis.
y = -1,0858x + 2303,6 R² = 0,1234
0
50
100
150
200
250
300
350
400
1920 1930 1940 1950 1960 1970 1980 1990 2000 2010 2020
kWh/
m2
Year of construction
Energy performance vs. year of construction (scatter diagram)
0
50
100
150
200
250
300
350
400
1920-1960 1961-1980 1981-2000 2001-2010
kWh/
m2
Year of construction
Energy performance vs. year of construction (box plot diagram)
38
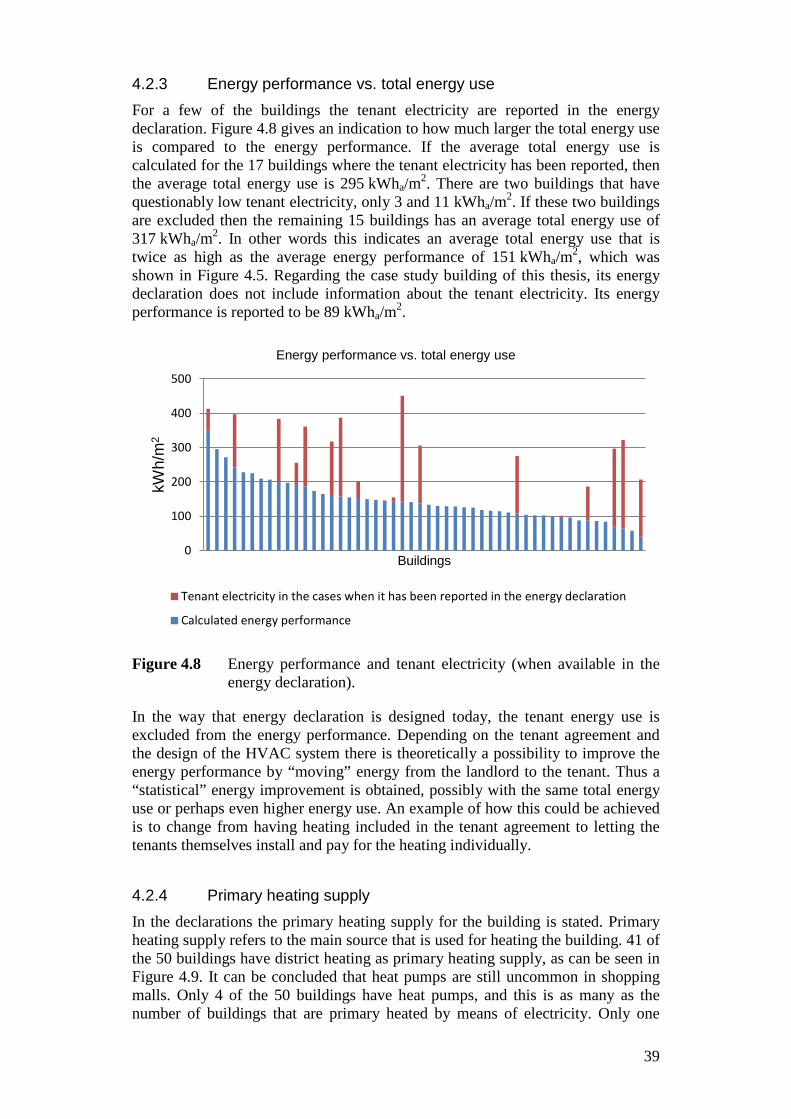
4.2.3 Energy performance vs. total energy use For a few of the buildings the tenant electricity are reported in the energy declaration. Figure 4.8 gives an indication to how much larger the total energy use is compared to the energy performance. If the average total energy use is calculated for the 17 buildings where the tenant electricity has been reported, then the average total energy use is 295 kWha/m2. There are two buildings that have questionably low tenant electricity, only 3 and 11 kWha/m2. If these two buildings are excluded then the remaining 15 buildings has an average total energy use of 317 kWha/m2. In other words this indicates an average total energy use that is twice as high as the average energy performance of 151 kWha/m2, which was shown in Figure 4.5. Regarding the case study building of this thesis, its energy declaration does not include information about the tenant electricity. Its energy performance is reported to be 89 kWha/m2.
Figure 4.8 Energy performance and tenant electricity (when available in the energy declaration).
In the way that energy declaration is designed today, the tenant energy use is excluded from the energy performance. Depending on the tenant agreement and the design of the HVAC system there is theoretically a possibility to improve the energy performance by “moving” energy from the landlord to the tenant. Thus a “statistical” energy improvement is obtained, possibly with the same total energy use or perhaps even higher energy use. An example of how this could be achieved is to change from having heating included in the tenant agreement to letting the tenants themselves install and pay for the heating individually.
4.2.4 Primary heating supply In the declarations the primary heating supply for the building is stated. Primary heating supply refers to the main source that is used for heating the building. 41 of the 50 buildings have district heating as primary heating supply, as can be seen in Figure 4.9. It can be concluded that heat pumps are still uncommon in shopping malls. Only 4 of the 50 buildings have heat pumps, and this is as many as the number of buildings that are primary heated by means of electricity. Only one
0
100
200
300
400
500
kWh/
m2
Buildings
Energy performance vs. total energy use
Tenant electricity in the cases when it has been reported in the energy declaration
Calculated energy performance
39
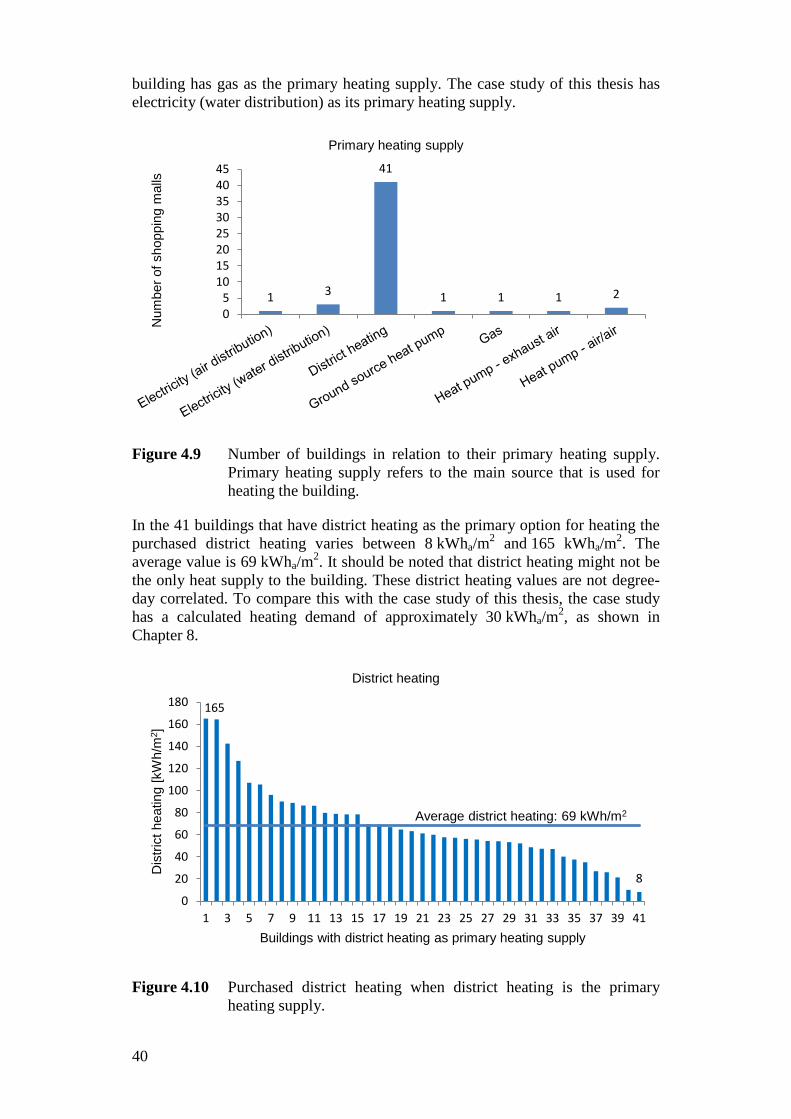
building has gas as the primary heating supply. The case study of this thesis has electricity (water distribution) as its primary heating supply.
Figure 4.9 Number of buildings in relation to their primary heating supply. Primary heating supply refers to the main source that is used for heating the building.
In the 41 buildings that have district heating as the primary option for heating the purchased district heating varies between 8 kWha/m2 and 165 kWha/m2. The average value is 69 kWha/m2. It should be noted that district heating might not be the only heat supply to the building. These district heating values are not degree-day correlated. To compare this with the case study of this thesis, the case study has a calculated heating demand of approximately 30 kWha/m2, as shown in Chapter 8.
Figure 4.10 Purchased district heating when district heating is the primary heating supply.
1 3
41
1 1 1 2 05
1015202530354045
Num
ber o
f sho
ppin
g m
alls
Primary heating supply
165
8
0
20
40
60
80
100
120
140
160
180
1 3 5 7 9 11 13 15 17 19 21 23 25 27 29 31 33 35 37 39 41
Dis
trict
hea
ting
[kW
h/m
2 ]
Buildings with district heating as primary heating supply
District heating
Average district heating: 69 kWh/m2
40
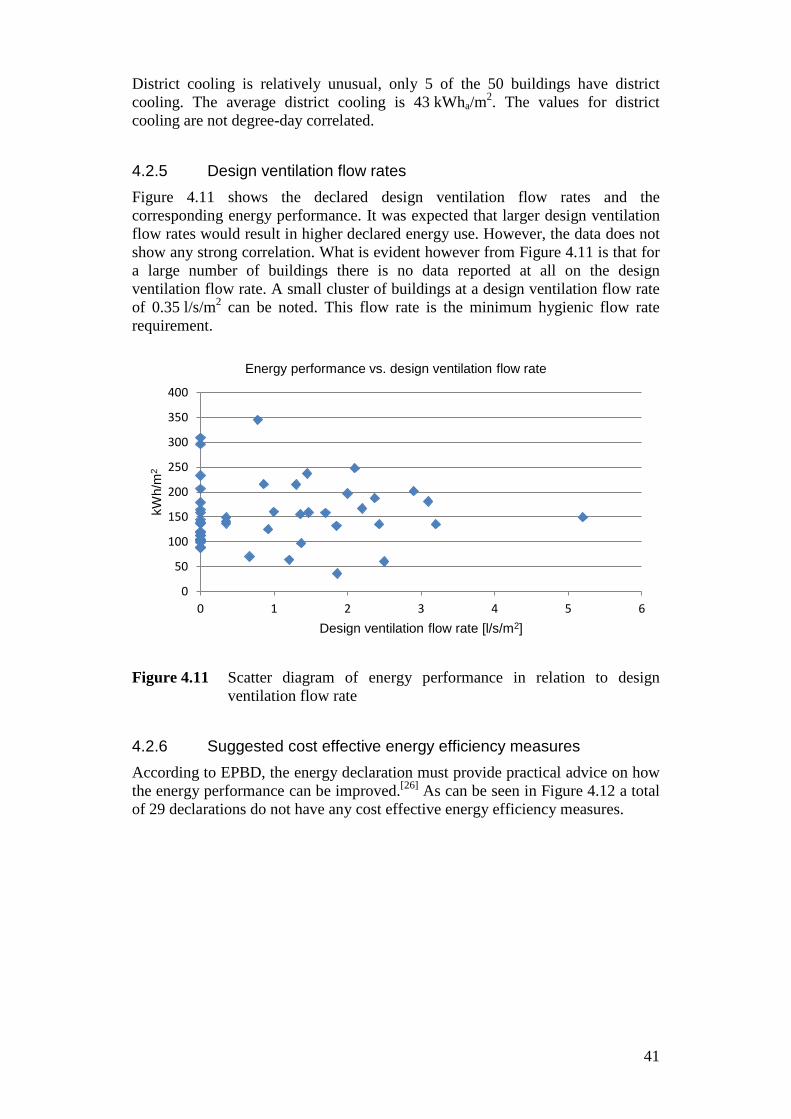
District cooling is relatively unusual, only 5 of the 50 buildings have district cooling. The average district cooling is 43 kWha/m2. The values for district cooling are not degree-day correlated.
4.2.5 Design ventilation flow rates Figure 4.11 shows the declared design ventilation flow rates and the corresponding energy performance. It was expected that larger design ventilation flow rates would result in higher declared energy use. However, the data does not show any strong correlation. What is evident however from Figure 4.11 is that for a large number of buildings there is no data reported at all on the design ventilation flow rate. A small cluster of buildings at a design ventilation flow rate of 0.35 l/s/m2 can be noted. This flow rate is the minimum hygienic flow rate requirement.
Figure 4.11 Scatter diagram of energy performance in relation to design ventilation flow rate
4.2.6 Suggested cost effective energy efficiency measures According to EPBD, the energy declaration must provide practical advice on how the energy performance can be improved.[26] As can be seen in Figure 4.12 a total of 29 declarations do not have any cost effective energy efficiency measures.
0
50
100
150
200
250
300
350
400
0 1 2 3 4 5 6
kWh/
m2
Design ventilation flow rate [l/s/m2]
Energy performance vs. design ventilation flow rate
41
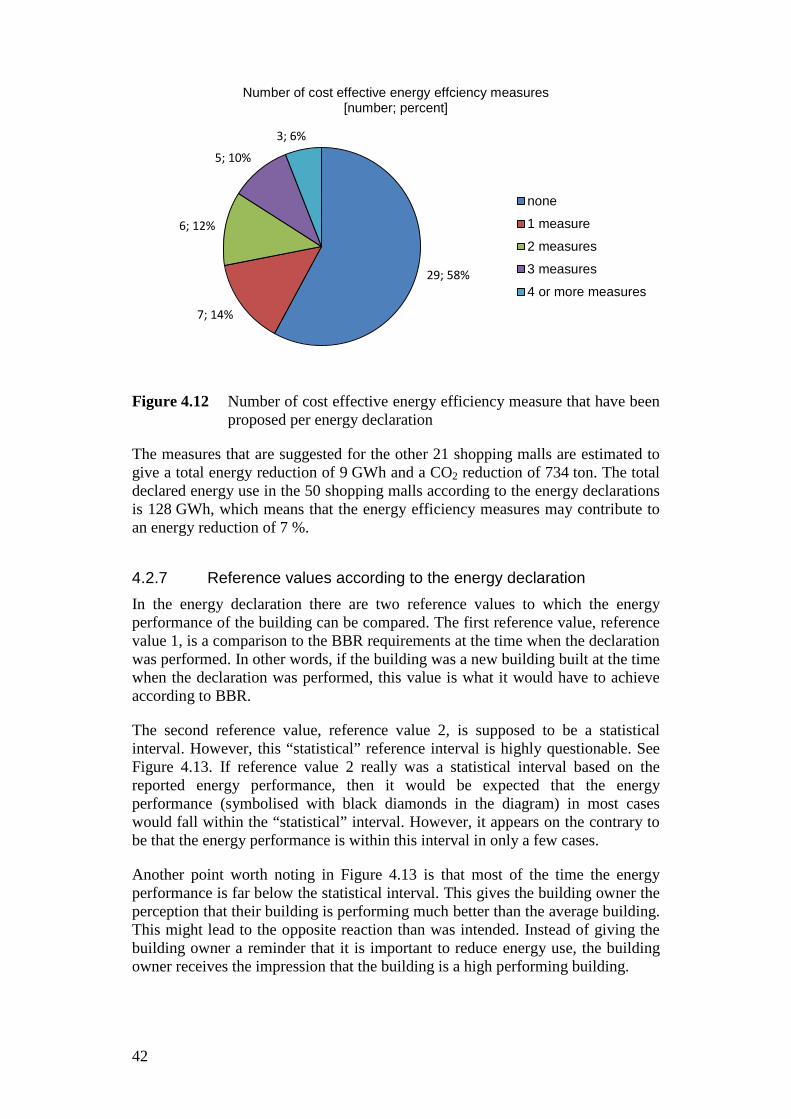
Figure 4.12 Number of cost effective energy efficiency measure that have been proposed per energy declaration
The measures that are suggested for the other 21 shopping malls are estimated to give a total energy reduction of 9 GWh and a CO2 reduction of 734 ton. The total declared energy use in the 50 shopping malls according to the energy declarations is 128 GWh, which means that the energy efficiency measures may contribute to an energy reduction of 7 %.
4.2.7 Reference values according to the energy declaration In the energy declaration there are two reference values to which the energy performance of the building can be compared. The first reference value, reference value 1, is a comparison to the BBR requirements at the time when the declaration was performed. In other words, if the building was a new building built at the time when the declaration was performed, this value is what it would have to achieve according to BBR.
The second reference value, reference value 2, is supposed to be a statistical interval. However, this “statistical” reference interval is highly questionable. See Figure 4.13. If reference value 2 really was a statistical interval based on the reported energy performance, then it would be expected that the energy performance (symbolised with black diamonds in the diagram) in most cases would fall within the “statistical” interval. However, it appears on the contrary to be that the energy performance is within this interval in only a few cases.
Another point worth noting in Figure 4.13 is that most of the time the energy performance is far below the statistical interval. This gives the building owner the perception that their building is performing much better than the average building. This might lead to the opposite reaction than was intended. Instead of giving the building owner a reminder that it is important to reduce energy use, the building owner receives the impression that the building is a high performing building.
29; 58%
7; 14%
6; 12%
5; 10%
3; 6%
Number of cost effective energy effciency measures [number; percent]
none
1 measure
2 measures
3 measures
4 or more measures
42
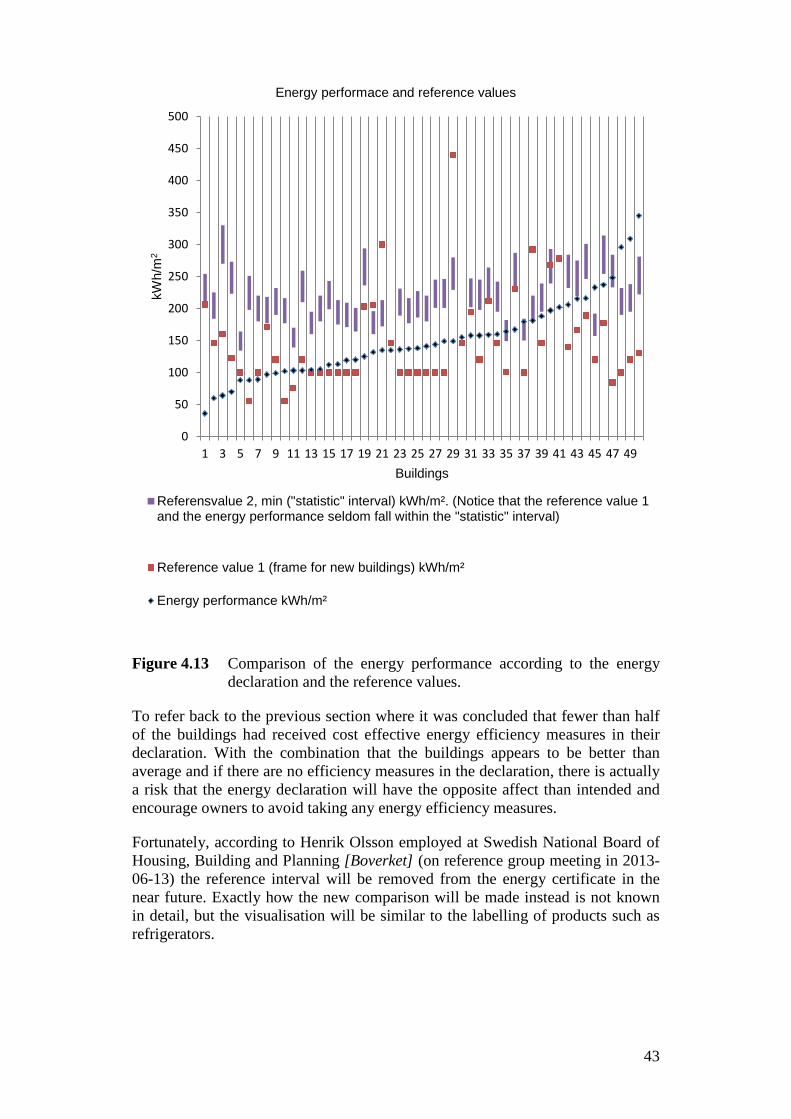
Figure 4.13 Comparison of the energy performance according to the energy declaration and the reference values.
To refer back to the previous section where it was concluded that fewer than half of the buildings had received cost effective energy efficiency measures in their declaration. With the combination that the buildings appears to be better than average and if there are no efficiency measures in the declaration, there is actually a risk that the energy declaration will have the opposite affect than intended and encourage owners to avoid taking any energy efficiency measures.
Fortunately, according to Henrik Olsson employed at Swedish National Board of Housing, Building and Planning [Boverket] (on reference group meeting in 2013-06-13) the reference interval will be removed from the energy certificate in the near future. Exactly how the new comparison will be made instead is not known in detail, but the visualisation will be similar to the labelling of products such as refrigerators.
0
50
100
150
200
250
300
350
400
450
500
1 3 5 7 9 11 13 15 17 19 21 23 25 27 29 31 33 35 37 39 41 43 45 47 49
kWh/
m2
Buildings
Energy performace and reference values
Referensvalue 2, min ("statistic" interval) kWh/m². (Notice that the reference value 1and the energy performance seldom fall within the "statistic" interval)
Reference value 1 (frame for new buildings) kWh/m²
Energy performance kWh/m²
43
4.3 Discussion and Summary The national database on energy declarations, from the Swedish National Board of Housing, Building and Planning [Boverket], included 319 shopping malls when this study was performed. Out of these, 50 declarations that were of similar size as the case study building in this thesis and were used mainly for shopping mall activities (i.e. buildings with for example a large proportion of office space were excluded) were selected for a more thorough analysis in this chapter.
Energy declarations report the energy performance of the building. The energy performance of the building is not the same thing as the total energy use since the tenant energy is excluded. It should therefore be noted that it is only a part of the total energy use that is analysed in this chapter.
Based on the 50 analysed energy declarations, the deviation in energy performance in shopping malls is between 36-345 kWha/m2 The average energy performance is 151 kWha/m2 while the median is 140 kWha/m2. The average total energy use in shopping malls is, according to Stil2-09[89], 262 kWha/m2. The case study in this thesis is among the buildings with the best energy performance.
One of the main purposes of the energy declarations is that they are supposed to give valuable suggestions regarding energy efficiency measures in existing buildings, however more than half of the energy declarations lack such suggestions. Although it is likely that there in reality is cost effective energy efficiency measures available to be done.
With increased focus on constructing energy efficient buildings, it would be expected that more recent buildings should have a better performance than older ones. From the data presented however there is only a small indication, but it is not significant, that newly built shopping malls have lower declared energy use than older ones.
Previously, the energy declarations have included a statistical interval. This statistical interval was supposed to be a reference that could be used for comparison of the energy performance of the declared building. It was stated that the background information of the statistical interval was based on data from representative buildings. However, looking at the energy declarations analysed in this thesis it is evident that the statistical interval could not have been derived from the same buildings as the buildings that were included in the database for the energy declarations. The statistical interval was highly misleading and, in most cases it appeared as if the building that was the subject of the energy declaration was performing much better than other similar buildings, although this need not have been true. This statistical interval has recently been removed from the energy declaration.
It is required by EPBD that all buildings must have energy declarations. However, the accuracy of these energy declarations is seldom evaluated, except on rare occasions, for example in this PhD thesis. On the other hand, another thing to point out is that in Sweden energy performance is validated by measurements. It can be expected that this in the long run should lead to better measurements and knowledge of energy use in buildings.
44
5 INTERNAL AND EXTERNAL LOAD PATTERNS What are the characteristics of the internal and external load patterns in shopping malls? Internal and external load patterns are important input data for calculations and simulations of energy demand. Therefore, this chapter investigates the specific characteristics of the internal and external load patterns in shopping malls. The internal load patterns from people, lighting and equipment are developed based on information gathered from the shopping mall sector, measurements and a literature review. Internal load patterns caused by the heat emitted from people in shopping malls have not been studied or published before, although can reasonably be assumed to have a large impact on the operation and energy demand of the building. The external load patterns from infiltration were obtained from a literature review. Load and demand are closely connected. A heat load will result in a corresponding cooling demand and vice versa. Studies show that rising internal heat loads and improved building envelopes have resulted in major cooling demands even in a Nordic climate[28], which is a reason why knowledge on internal load patterns are becoming increasingly important. Heating and cooling demands for a case study building are considered in Chapter 8, where the results from this chapter are an important input to the calculations for the case study.
5.1 Occupancy People influence the internal heat loads by emitting both sensible and latent heat. Metabolic activities of the body result almost completely in heat that must be continuously dissipated and regulated to maintain normal body temperature. A unit used to express the metabolic rate is met, defined as the metabolic rate of a sedentary person (seated relaxed). One met is equivalent to 58 W/m2, where the area m2 refers to the surface of a human body.[3, 35] For the heat generated by a person a human surface area of 1.77 m2 has been estimated for the average Scandinavian person.[35]
5.1.1 Heat emitted from people In order to calculate the internal heat load pattern from people, heat emitted from customers and employees in shopping malls based on their activity level and metabolic rate need to be estimated. Table 5.1 shows metabolic rates and heat generated by a person at different activity levels. The heat generation in the table includes both sensible and latent heat. According to the table, people emit 164-205 W while doing ordinary standing work in a shop. Furthermore, people walking slowly emit 205 W. It is assumed that people in shopping malls have an
45
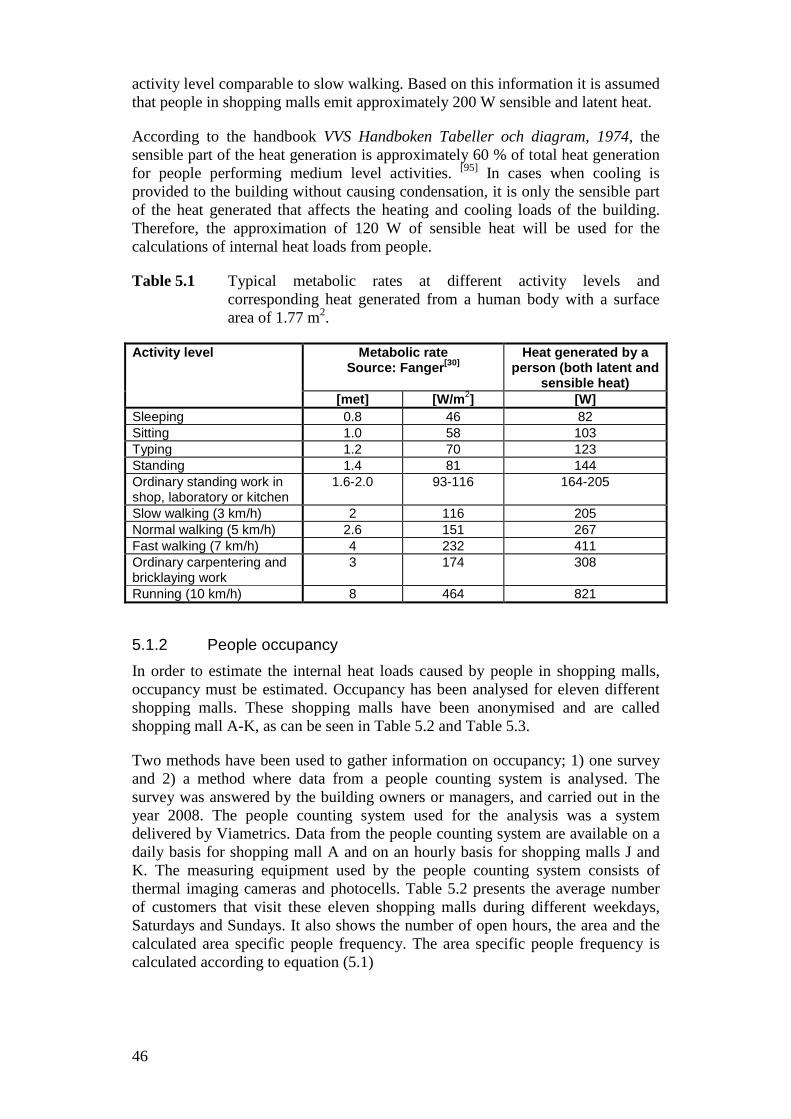
activity level comparable to slow walking. Based on this information it is assumed that people in shopping malls emit approximately 200 W sensible and latent heat.
According to the handbook VVS Handboken Tabeller och diagram, 1974, the sensible part of the heat generation is approximately 60 % of total heat generation for people performing medium level activities. [95] In cases when cooling is provided to the building without causing condensation, it is only the sensible part of the heat generated that affects the heating and cooling loads of the building. Therefore, the approximation of 120 W of sensible heat will be used for the calculations of internal heat loads from people.
Table 5.1 Typical metabolic rates at different activity levels and corresponding heat generated from a human body with a surface area of 1.77 m2.
Activity level Metabolic rate Source: Fanger[30]
Heat generated by a person (both latent and
sensible heat) [met] [W/m2] [W]
Sleeping 0.8 46 82 Sitting 1.0 58 103 Typing 1.2 70 123 Standing 1.4 81 144 Ordinary standing work in shop, laboratory or kitchen
1.6-2.0 93-116 164-205
Slow walking (3 km/h) 2 116 205 Normal walking (5 km/h) 2.6 151 267 Fast walking (7 km/h) 4 232 411 Ordinary carpentering and bricklaying work
3 174 308
Running (10 km/h) 8 464 821
5.1.2 People occupancy In order to estimate the internal heat loads caused by people in shopping malls, occupancy must be estimated. Occupancy has been analysed for eleven different shopping malls. These shopping malls have been anonymised and are called shopping mall A-K, as can be seen in Table 5.2 and Table 5.3.
Two methods have been used to gather information on occupancy; 1) one survey and 2) a method where data from a people counting system is analysed. The survey was answered by the building owners or managers, and carried out in the year 2008. The people counting system used for the analysis was a system delivered by Viametrics. Data from the people counting system are available on a daily basis for shopping mall A and on an hourly basis for shopping malls J and K. The measuring equipment used by the people counting system consists of thermal imaging cameras and photocells. Table 5.2 presents the average number of customers that visit these eleven shopping malls during different weekdays, Saturdays and Sundays. It also shows the number of open hours, the area and the calculated area specific people frequency. The area specific people frequency is calculated according to equation (5.1)
46
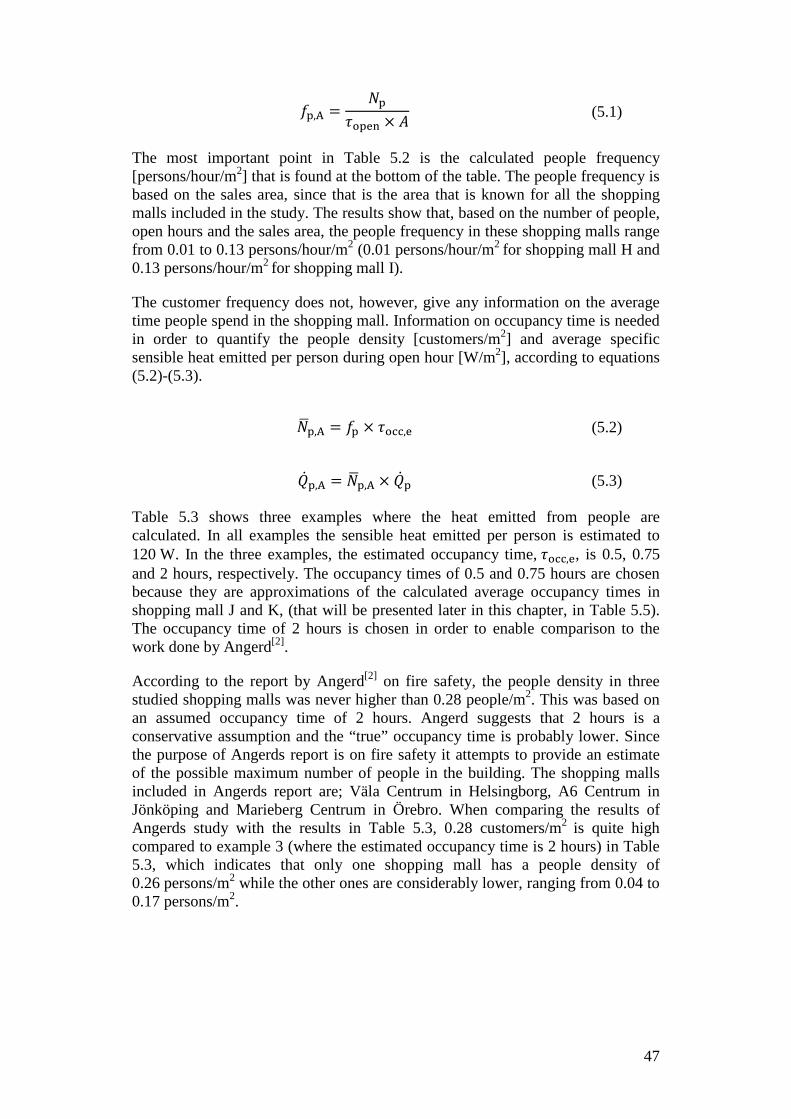
𝑓p,A =𝑁p
𝜏open × 𝐴 (5.1)
The most important point in Table 5.2 is the calculated people frequency [persons/hour/m2] that is found at the bottom of the table. The people frequency is based on the sales area, since that is the area that is known for all the shopping malls included in the study. The results show that, based on the number of people, open hours and the sales area, the people frequency in these shopping malls range from 0.01 to 0.13 persons/hour/m2 (0.01 persons/hour/m2 for shopping mall H and 0.13 persons/hour/m2 for shopping mall I).
The customer frequency does not, however, give any information on the average time people spend in the shopping mall. Information on occupancy time is needed in order to quantify the people density [customers/m2] and average specific sensible heat emitted per person during open hour [W/m2], according to equations (5.2)-(5.3).
𝑁�p,A = 𝑓p × 𝜏occ,e (5.2)
��p,A = 𝑁�p,A × ��p (5.3)
Table 5.3 shows three examples where the heat emitted from people are calculated. In all examples the sensible heat emitted per person is estimated to 120 W. In the three examples, the estimated occupancy time, 𝜏occ,e, is 0.5, 0.75 and 2 hours, respectively. The occupancy times of 0.5 and 0.75 hours are chosen because they are approximations of the calculated average occupancy times in shopping mall J and K, (that will be presented later in this chapter, in Table 5.5). The occupancy time of 2 hours is chosen in order to enable comparison to the work done by Angerd[2].
According to the report by Angerd[2] on fire safety, the people density in three studied shopping malls was never higher than 0.28 people/m2. This was based on an assumed occupancy time of 2 hours. Angerd suggests that 2 hours is a conservative assumption and the “true” occupancy time is probably lower. Since the purpose of Angerds report is on fire safety it attempts to provide an estimate of the possible maximum number of people in the building. The shopping malls included in Angerds report are; Väla Centrum in Helsingborg, A6 Centrum in Jönköping and Marieberg Centrum in Örebro. When comparing the results of Angerds study with the results in Table 5.3, 0.28 customers/m2 is quite high compared to example 3 (where the estimated occupancy time is 2 hours) in Table 5.3, which indicates that only one shopping mall has a people density of 0.26 persons/m2 while the other ones are considerably lower, ranging from 0.04 to 0.17 persons/m2.
47
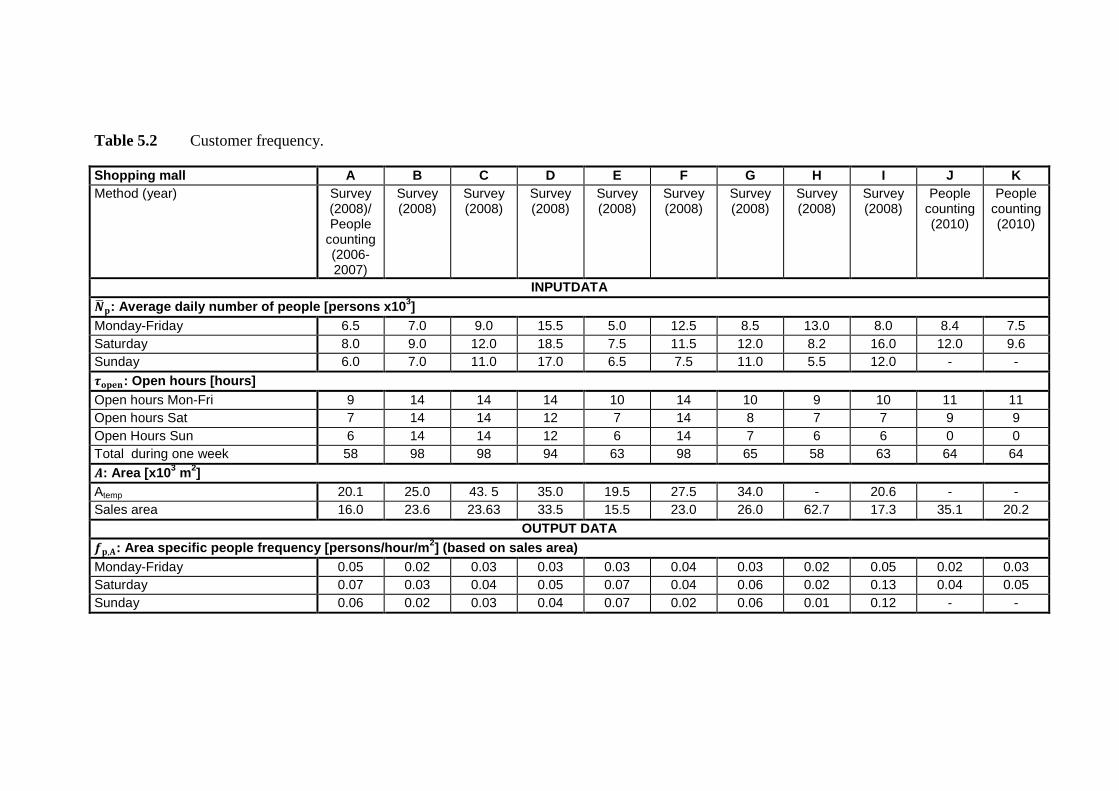
Table 5.2 Customer frequency.
Shopping mall A B C D E F G H I J K Method (year) Survey
(2008)/ People
counting (2006-2007)
Survey (2008)
Survey (2008)
Survey (2008)
Survey (2008)
Survey (2008)
Survey (2008)
Survey (2008)
Survey (2008)
People counting (2010)
People counting (2010)
INPUTDATA 𝑵�𝐩: Average daily number of people [persons x103] Monday-Friday 6.5 7.0 9.0 15.5 5.0 12.5 8.5 13.0 8.0 8.4 7.5 Saturday 8.0 9.0 12.0 18.5 7.5 11.5 12.0 8.2 16.0 12.0 9.6 Sunday 6.0 7.0 11.0 17.0 6.5 7.5 11.0 5.5 12.0 - - 𝝉𝐨𝐩𝐞𝐧: Open hours [hours] Open hours Mon-Fri 9 14 14 14 10 14 10 9 10 11 11 Open hours Sat 7 14 14 12 7 14 8 7 7 9 9 Open Hours Sun 6 14 14 12 6 14 7 6 6 0 0 Total during one week 58 98 98 94 63 98 65 58 63 64 64 𝑨: Area [x103 m2] Atemp 20.1 25.0 43. 5 35.0 19.5 27.5 34.0 - 20.6 - - Sales area 16.0 23.6 23.63 33.5 15.5 23.0 26.0 62.7 17.3 35.1 20.2
OUTPUT DATA 𝒇𝐩,𝐀: Area specific people frequency [persons/hour/m2] (based on sales area) Monday-Friday 0.05 0.02 0.03 0.03 0.03 0.04 0.03 0.02 0.05 0.02 0.03 Saturday 0.07 0.03 0.04 0.05 0.07 0.04 0.06 0.02 0.13 0.04 0.05 Sunday 0.06 0.02 0.03 0.04 0.07 0.02 0.06 0.01 0.12 - -
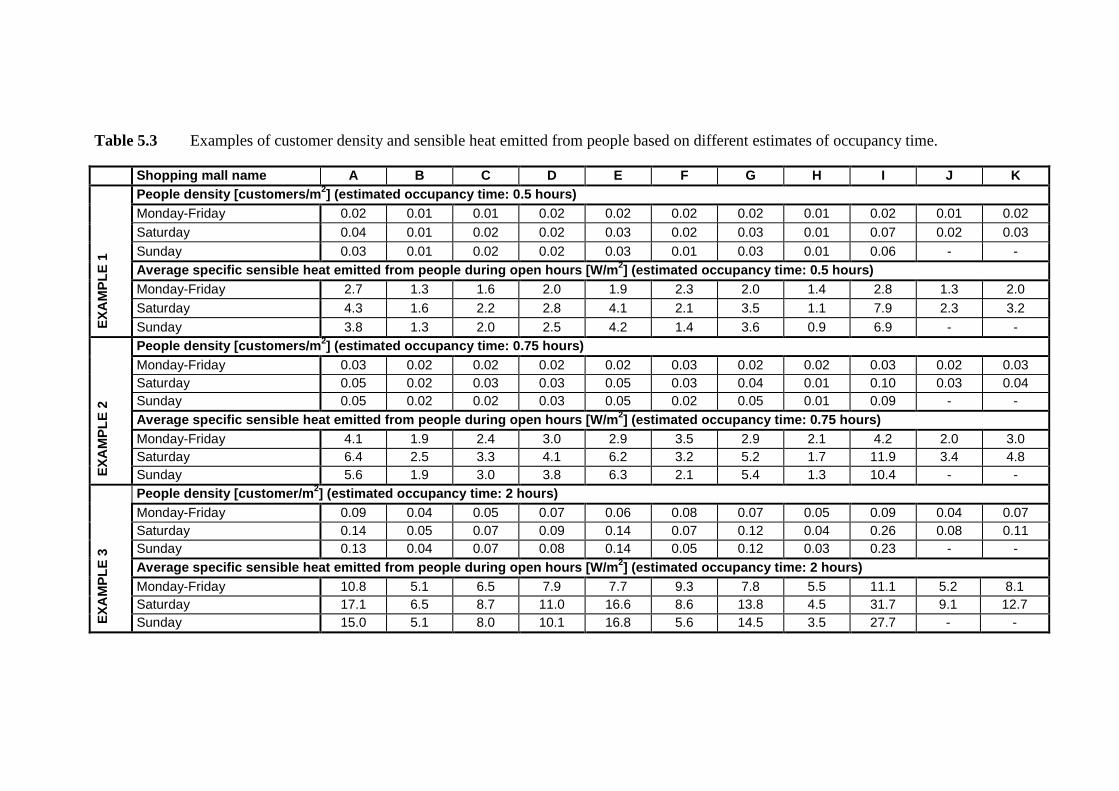
Table 5.3 Examples of customer density and sensible heat emitted from people based on different estimates of occupancy time.
Shopping mall name A B C D E F G H I J K
EXA
MPL
E 1
People density [customers/m2] (estimated occupancy time: 0.5 hours) Monday-Friday 0.02 0.01 0.01 0.02 0.02 0.02 0.02 0.01 0.02 0.01 0.02 Saturday 0.04 0.01 0.02 0.02 0.03 0.02 0.03 0.01 0.07 0.02 0.03 Sunday 0.03 0.01 0.02 0.02 0.03 0.01 0.03 0.01 0.06 - - Average specific sensible heat emitted from people during open hours [W/m2] (estimated occupancy time: 0.5 hours) Monday-Friday 2.7 1.3 1.6 2.0 1.9 2.3 2.0 1.4 2.8 1.3 2.0 Saturday 4.3 1.6 2.2 2.8 4.1 2.1 3.5 1.1 7.9 2.3 3.2 Sunday 3.8 1.3 2.0 2.5 4.2 1.4 3.6 0.9 6.9 - -
EXA
MPL
E 2
People density [customers/m2] (estimated occupancy time: 0.75 hours) Monday-Friday 0.03 0.02 0.02 0.02 0.02 0.03 0.02 0.02 0.03 0.02 0.03 Saturday 0.05 0.02 0.03 0.03 0.05 0.03 0.04 0.01 0.10 0.03 0.04 Sunday 0.05 0.02 0.02 0.03 0.05 0.02 0.05 0.01 0.09 - - Average specific sensible heat emitted from people during open hours [W/m2] (estimated occupancy time: 0.75 hours) Monday-Friday 4.1 1.9 2.4 3.0 2.9 3.5 2.9 2.1 4.2 2.0 3.0 Saturday 6.4 2.5 3.3 4.1 6.2 3.2 5.2 1.7 11.9 3.4 4.8 Sunday 5.6 1.9 3.0 3.8 6.3 2.1 5.4 1.3 10.4 - -
EXA
MPL
E 3
People density [customer/m2] (estimated occupancy time: 2 hours) Monday-Friday 0.09 0.04 0.05 0.07 0.06 0.08 0.07 0.05 0.09 0.04 0.07 Saturday 0.14 0.05 0.07 0.09 0.14 0.07 0.12 0.04 0.26 0.08 0.11 Sunday 0.13 0.04 0.07 0.08 0.14 0.05 0.12 0.03 0.23 - - Average specific sensible heat emitted from people during open hours [W/m2] (estimated occupancy time: 2 hours) Monday-Friday 10.8 5.1 6.5 7.9 7.7 9.3 7.8 5.5 11.1 5.2 8.1 Saturday 17.1 6.5 8.7 11.0 16.6 8.6 13.8 4.5 31.7 9.1 12.7 Sunday 15.0 5.1 8.0 10.1 16.8 5.6 14.5 3.5 27.7 - -
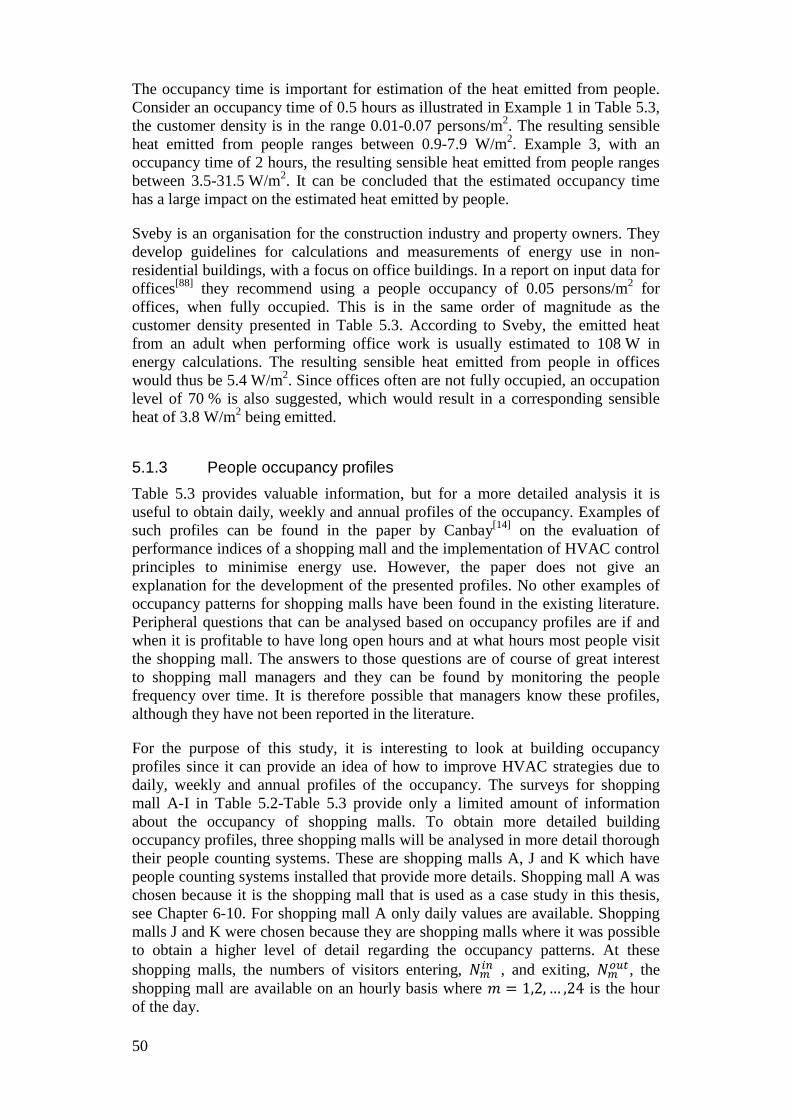
The occupancy time is important for estimation of the heat emitted from people. Consider an occupancy time of 0.5 hours as illustrated in Example 1 in Table 5.3, the customer density is in the range 0.01-0.07 persons/m2. The resulting sensible heat emitted from people ranges between 0.9-7.9 W/m2. Example 3, with an occupancy time of 2 hours, the resulting sensible heat emitted from people ranges between 3.5-31.5 W/m2. It can be concluded that the estimated occupancy time has a large impact on the estimated heat emitted by people.
Sveby is an organisation for the construction industry and property owners. They develop guidelines for calculations and measurements of energy use in non-residential buildings, with a focus on office buildings. In a report on input data for offices[88] they recommend using a people occupancy of 0.05 persons/m2 for offices, when fully occupied. This is in the same order of magnitude as the customer density presented in Table 5.3. According to Sveby, the emitted heat from an adult when performing office work is usually estimated to 108 W in energy calculations. The resulting sensible heat emitted from people in offices would thus be 5.4 W/m2. Since offices often are not fully occupied, an occupation level of 70 % is also suggested, which would result in a corresponding sensible heat of 3.8 W/m2 being emitted.
5.1.3 People occupancy profiles Table 5.3 provides valuable information, but for a more detailed analysis it is useful to obtain daily, weekly and annual profiles of the occupancy. Examples of such profiles can be found in the paper by Canbay[14] on the evaluation of performance indices of a shopping mall and the implementation of HVAC control principles to minimise energy use. However, the paper does not give an explanation for the development of the presented profiles. No other examples of occupancy patterns for shopping malls have been found in the existing literature. Peripheral questions that can be analysed based on occupancy profiles are if and when it is profitable to have long open hours and at what hours most people visit the shopping mall. The answers to those questions are of course of great interest to shopping mall managers and they can be found by monitoring the people frequency over time. It is therefore possible that managers know these profiles, although they have not been reported in the literature.
For the purpose of this study, it is interesting to look at building occupancy profiles since it can provide an idea of how to improve HVAC strategies due to daily, weekly and annual profiles of the occupancy. The surveys for shopping mall A-I in Table 5.2-Table 5.3 provide only a limited amount of information about the occupancy of shopping malls. To obtain more detailed building occupancy profiles, three shopping malls will be analysed in more detail thorough their people counting systems. These are shopping malls A, J and K which have people counting systems installed that provide more details. Shopping mall A was chosen because it is the shopping mall that is used as a case study in this thesis, see Chapter 6-10. For shopping mall A only daily values are available. Shopping malls J and K were chosen because they are shopping malls where it was possible to obtain a higher level of detail regarding the occupancy patterns. At these shopping malls, the numbers of visitors entering, 𝑁𝑚𝑖𝑛 , and exiting, 𝑁𝑚𝑜𝑢𝑡, the shopping mall are available on an hourly basis where 𝑚 = 1,2, … ,24 is the hour of the day.
50
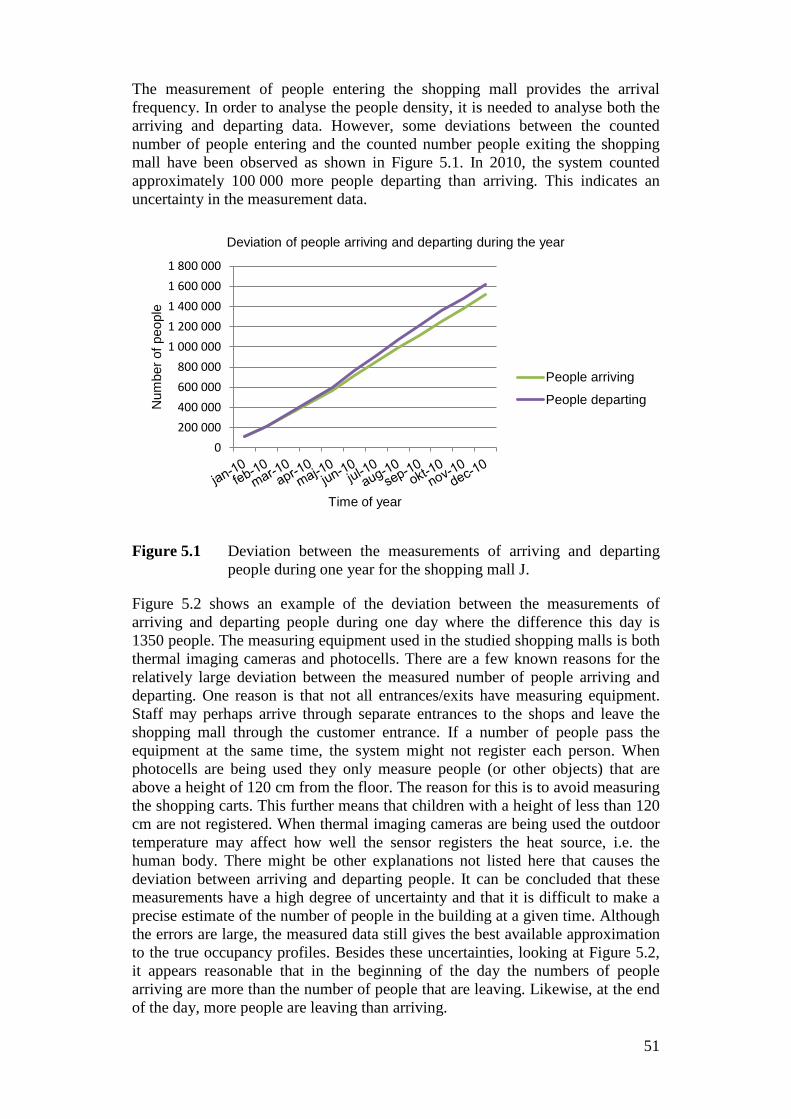
The measurement of people entering the shopping mall provides the arrival frequency. In order to analyse the people density, it is needed to analyse both the arriving and departing data. However, some deviations between the counted number of people entering and the counted number people exiting the shopping mall have been observed as shown in Figure 5.1. In 2010, the system counted approximately 100 000 more people departing than arriving. This indicates an uncertainty in the measurement data.
Figure 5.1 Deviation between the measurements of arriving and departing people during one year for the shopping mall J.
Figure 5.2 shows an example of the deviation between the measurements of arriving and departing people during one day where the difference this day is 1350 people. The measuring equipment used in the studied shopping malls is both thermal imaging cameras and photocells. There are a few known reasons for the relatively large deviation between the measured number of people arriving and departing. One reason is that not all entrances/exits have measuring equipment. Staff may perhaps arrive through separate entrances to the shops and leave the shopping mall through the customer entrance. If a number of people pass the equipment at the same time, the system might not register each person. When photocells are being used they only measure people (or other objects) that are above a height of 120 cm from the floor. The reason for this is to avoid measuring the shopping carts. This further means that children with a height of less than 120 cm are not registered. When thermal imaging cameras are being used the outdoor temperature may affect how well the sensor registers the heat source, i.e. the human body. There might be other explanations not listed here that causes the deviation between arriving and departing people. It can be concluded that these measurements have a high degree of uncertainty and that it is difficult to make a precise estimate of the number of people in the building at a given time. Although the errors are large, the measured data still gives the best available approximation to the true occupancy profiles. Besides these uncertainties, looking at Figure 5.2, it appears reasonable that in the beginning of the day the numbers of people arriving are more than the number of people that are leaving. Likewise, at the end of the day, more people are leaving than arriving.
0200 000400 000600 000800 000
1 000 0001 200 0001 400 0001 600 0001 800 000
Num
ber o
f peo
ple
Time of year
Deviation of people arriving and departing during the year
People arriving
People departing
51
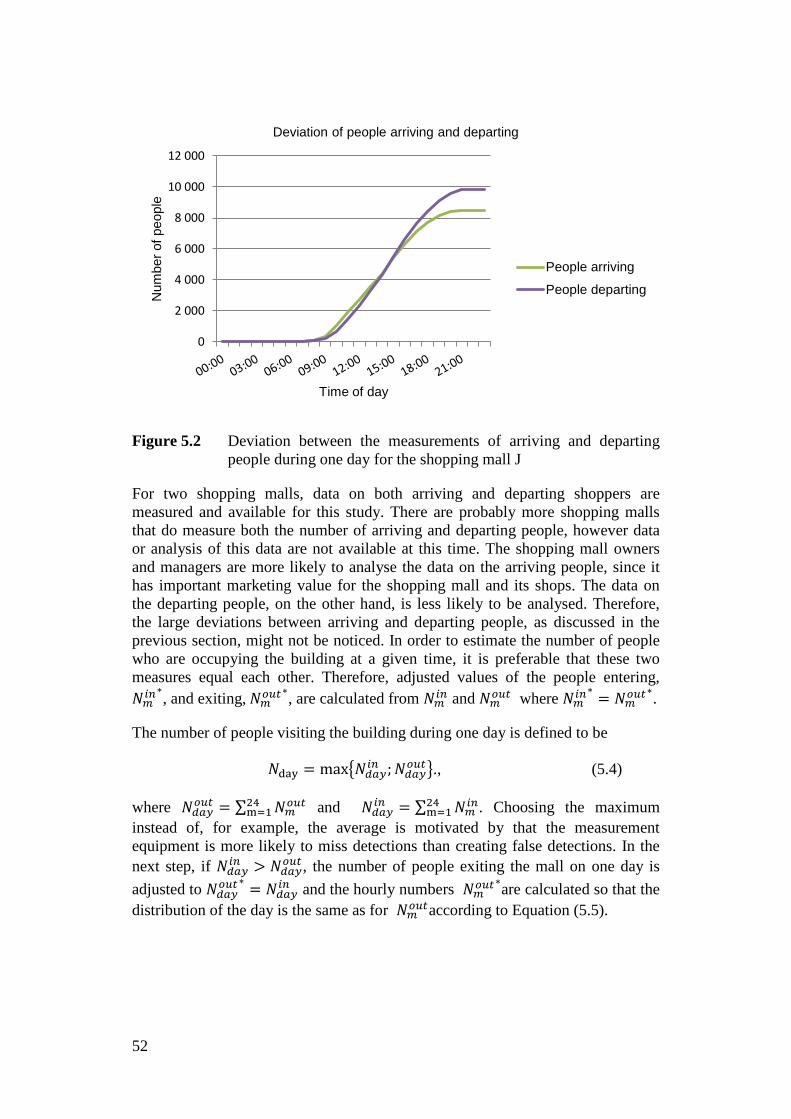
Figure 5.2 Deviation between the measurements of arriving and departing people during one day for the shopping mall J
For two shopping malls, data on both arriving and departing shoppers are measured and available for this study. There are probably more shopping malls that do measure both the number of arriving and departing people, however data or analysis of this data are not available at this time. The shopping mall owners and managers are more likely to analyse the data on the arriving people, since it has important marketing value for the shopping mall and its shops. The data on the departing people, on the other hand, is less likely to be analysed. Therefore, the large deviations between arriving and departing people, as discussed in the previous section, might not be noticed. In order to estimate the number of people who are occupying the building at a given time, it is preferable that these two measures equal each other. Therefore, adjusted values of the people entering, 𝑁𝑚𝑖𝑛
∗, and exiting, 𝑁𝑚𝑜𝑢𝑡∗, are calculated from 𝑁𝑚𝑖𝑛 and 𝑁𝑚𝑜𝑢𝑡 where 𝑁𝑚𝑖𝑛
∗ = 𝑁𝑚𝑜𝑢𝑡∗.
The number of people visiting the building during one day is defined to be
𝑁day = max�𝑁𝑑𝑎𝑦𝑖𝑛 ;𝑁𝑑𝑎𝑦𝑜𝑢𝑡�., (5.4)
where 𝑁𝑑𝑎𝑦𝑜𝑢𝑡 = ∑ 𝑁𝑚𝑜𝑢𝑡24m=1 and 𝑁𝑑𝑎𝑦𝑖𝑛 = ∑ 𝑁𝑚𝑖𝑛24
m=1 . Choosing the maximum instead of, for example, the average is motivated by that the measurement equipment is more likely to miss detections than creating false detections. In the next step, if 𝑁𝑑𝑎𝑦𝑖𝑛 > 𝑁𝑑𝑎𝑦𝑜𝑢𝑡 , the number of people exiting the mall on one day is adjusted to 𝑁𝑑𝑎𝑦𝑜𝑢𝑡∗ = 𝑁𝑑𝑎𝑦𝑖𝑛 and the hourly numbers 𝑁𝑚𝑜𝑢𝑡
∗are calculated so that the distribution of the day is the same as for 𝑁𝑚𝑜𝑢𝑡according to Equation (5.5).
0
2 000
4 000
6 000
8 000
10 000
12 000N
umbe
r of p
eopl
e
Time of day
Deviation of people arriving and departing
People arriving
People departing
52
�𝑁𝑚𝑖𝑛
∗ = 𝑁𝑚𝑖𝑛
𝑁𝑚𝑜𝑢𝑡∗ =
𝑁𝑚𝑜𝑢𝑡
𝑁𝑑𝑎𝑦𝑜𝑢𝑡 𝑁𝑑𝑎𝑦𝑖𝑛
(5.5)
In the case of 𝑁𝑑𝑎𝑦𝑖𝑛 < 𝑁𝑑𝑎𝑦𝑜𝑢𝑡 , the calculation are made according to Equation (5.6).
�𝑁𝑚𝑖𝑛
∗ =𝑁𝑚𝑖𝑛
𝑁𝑑𝑎𝑦𝑖𝑛 𝑁𝑑𝑎𝑦𝑖𝑛
𝑁𝑚𝑜𝑢𝑡∗ = 𝑁𝑚𝑜𝑢𝑡
(5.6)
Thus, after the manipulation the following equation is true
𝑁day = 𝑁𝑑𝑎𝑦𝑖𝑛 ∗= 𝑁𝑑𝑎𝑦𝑜𝑢𝑡∗. (5.7)
The adjusted data are then used to calculate the occupancy, 𝑁occm. These calculations were performed using Equation(5.8),
𝑁p,occm= ∑ 𝑁p,in
∗m
mm=1 − ∑ 𝑁p,out
∗m
mm=1 , (5.8)
The resulting sensible heat load profile from people was calculated according to Equation (5.9)
��p,Am=
𝑁p,occm×Qp𝐴
. (5.9)
Figure 5.3 shows the heat emitted by the occupants of shopping mall J during Weekdays and Saturdays. It also shows the day during the year when the shopping mall had the largest number of visitors, ”day with most people”. This occurred on 2010-05-14 for shopping mall J. It was somewhat surprising that the day with the most people did not occur around Christmas, which was expected to be the busiest time for the shopping mall.
53
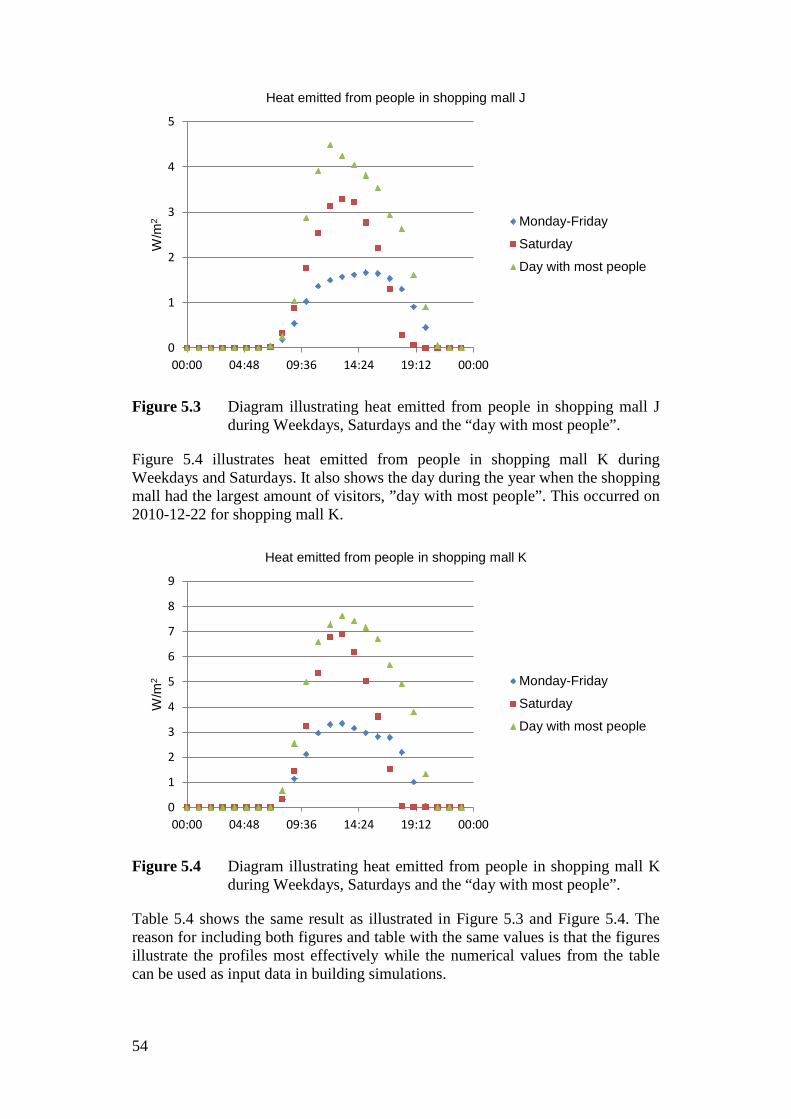
Figure 5.3 Diagram illustrating heat emitted from people in shopping mall J during Weekdays, Saturdays and the “day with most people”.
Figure 5.4 illustrates heat emitted from people in shopping mall K during Weekdays and Saturdays. It also shows the day during the year when the shopping mall had the largest amount of visitors, ”day with most people”. This occurred on 2010-12-22 for shopping mall K.
Figure 5.4 Diagram illustrating heat emitted from people in shopping mall K during Weekdays, Saturdays and the “day with most people”.
Table 5.4 shows the same result as illustrated in Figure 5.3 and Figure 5.4. The reason for including both figures and table with the same values is that the figures illustrate the profiles most effectively while the numerical values from the table can be used as input data in building simulations.
0
1
2
3
4
5
00:00 04:48 09:36 14:24 19:12 00:00
W/m
2
Heat emitted from people in shopping mall J
Monday-Friday
Saturday
Day with most people
0
1
2
3
4
5
6
7
8
9
00:00 04:48 09:36 14:24 19:12 00:00
W/m
2
Heat emitted from people in shopping mall K
Monday-Friday
Saturday
Day with most people
54
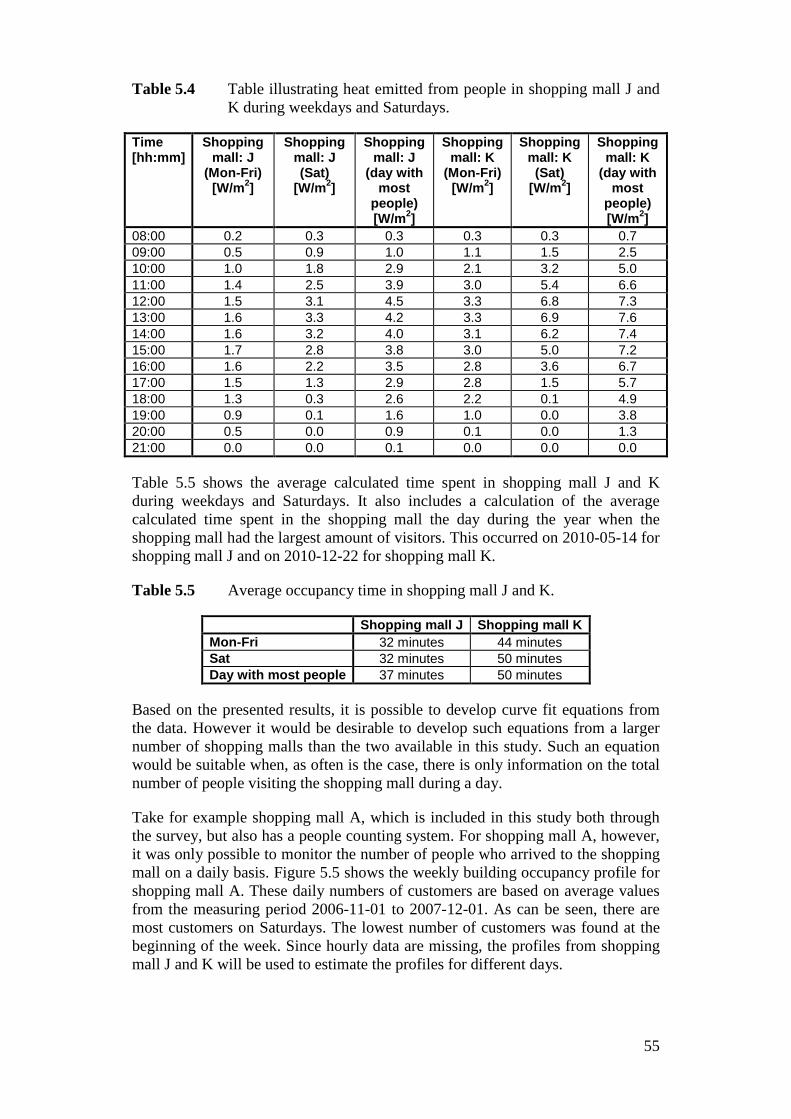
Table 5.4 Table illustrating heat emitted from people in shopping mall J and K during weekdays and Saturdays.
Time [hh:mm]
Shopping mall: J
(Mon-Fri) [W/m2]
Shopping mall: J (Sat)
[W/m2]
Shopping mall: J
(day with most
people) [W/m2]
Shopping mall: K
(Mon-Fri) [W/m2]
Shopping mall: K (Sat)
[W/m2]
Shopping mall: K
(day with most
people) [W/m2]
08:00 0.2 0.3 0.3 0.3 0.3 0.7 09:00 0.5 0.9 1.0 1.1 1.5 2.5 10:00 1.0 1.8 2.9 2.1 3.2 5.0 11:00 1.4 2.5 3.9 3.0 5.4 6.6 12:00 1.5 3.1 4.5 3.3 6.8 7.3 13:00 1.6 3.3 4.2 3.3 6.9 7.6 14:00 1.6 3.2 4.0 3.1 6.2 7.4 15:00 1.7 2.8 3.8 3.0 5.0 7.2 16:00 1.6 2.2 3.5 2.8 3.6 6.7 17:00 1.5 1.3 2.9 2.8 1.5 5.7 18:00 1.3 0.3 2.6 2.2 0.1 4.9 19:00 0.9 0.1 1.6 1.0 0.0 3.8 20:00 0.5 0.0 0.9 0.1 0.0 1.3 21:00 0.0 0.0 0.1 0.0 0.0 0.0
Table 5.5 shows the average calculated time spent in shopping mall J and K during weekdays and Saturdays. It also includes a calculation of the average calculated time spent in the shopping mall the day during the year when the shopping mall had the largest amount of visitors. This occurred on 2010-05-14 for shopping mall J and on 2010-12-22 for shopping mall K.
Table 5.5 Average occupancy time in shopping mall J and K.
Shopping mall J Shopping mall K Mon-Fri 32 minutes 44 minutes Sat 32 minutes 50 minutes Day with most people 37 minutes 50 minutes
Based on the presented results, it is possible to develop curve fit equations from the data. However it would be desirable to develop such equations from a larger number of shopping malls than the two available in this study. Such an equation would be suitable when, as often is the case, there is only information on the total number of people visiting the shopping mall during a day.
Take for example shopping mall A, which is included in this study both through the survey, but also has a people counting system. For shopping mall A, however, it was only possible to monitor the number of people who arrived to the shopping mall on a daily basis. Figure 5.5 shows the weekly building occupancy profile for shopping mall A. These daily numbers of customers are based on average values from the measuring period 2006-11-01 to 2007-12-01. As can be seen, there are most customers on Saturdays. The lowest number of customers was found at the beginning of the week. Since hourly data are missing, the profiles from shopping mall J and K will be used to estimate the profiles for different days.
55
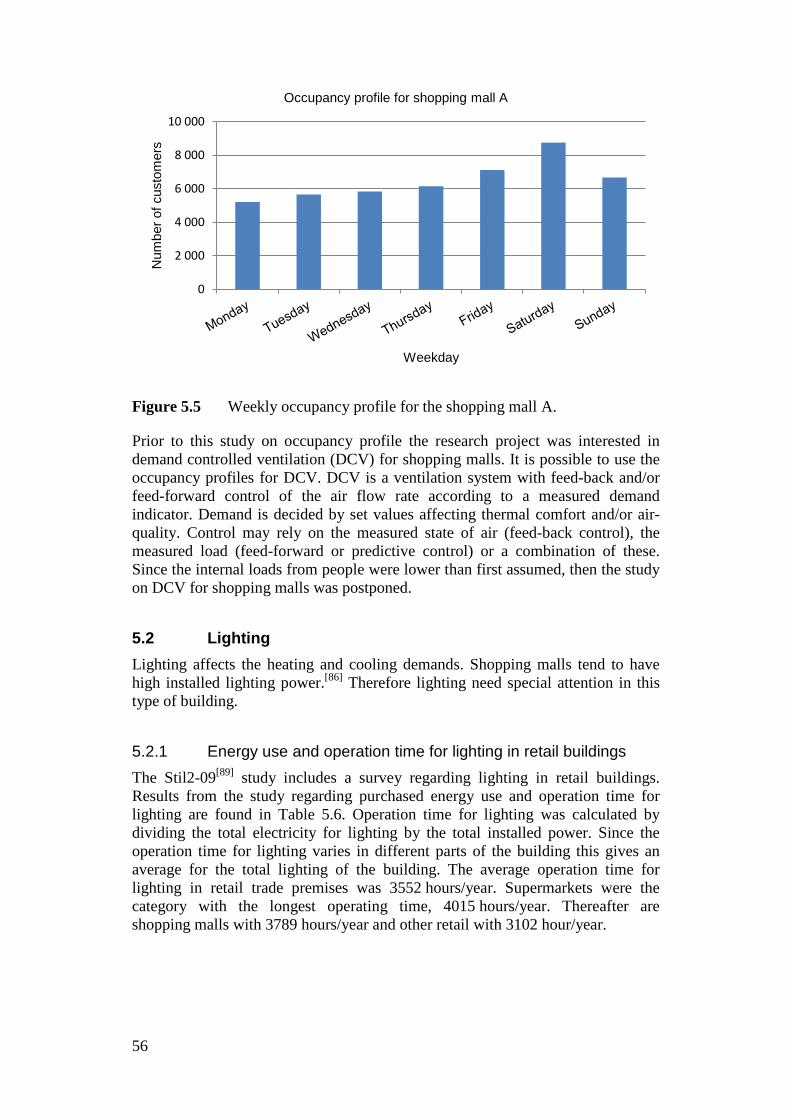
Figure 5.5 Weekly occupancy profile for the shopping mall A.
Prior to this study on occupancy profile the research project was interested in demand controlled ventilation (DCV) for shopping malls. It is possible to use the occupancy profiles for DCV. DCV is a ventilation system with feed-back and/or feed-forward control of the air flow rate according to a measured demand indicator. Demand is decided by set values affecting thermal comfort and/or air-quality. Control may rely on the measured state of air (feed-back control), the measured load (feed-forward or predictive control) or a combination of these. Since the internal loads from people were lower than first assumed, then the study on DCV for shopping malls was postponed.
5.2 Lighting Lighting affects the heating and cooling demands. Shopping malls tend to have high installed lighting power.[86] Therefore lighting need special attention in this type of building.
5.2.1 Energy use and operation time for lighting in retail buildings The Stil2-09[89] study includes a survey regarding lighting in retail buildings. Results from the study regarding purchased energy use and operation time for lighting are found in Table 5.6. Operation time for lighting was calculated by dividing the total electricity for lighting by the total installed power. Since the operation time for lighting varies in different parts of the building this gives an average for the total lighting of the building. The average operation time for lighting in retail trade premises was 3552 hours/year. Supermarkets were the category with the longest operating time, 4015 hours/year. Thereafter are shopping malls with 3789 hours/year and other retail with 3102 hour/year.
0
2 000
4 000
6 000
8 000
10 000
Num
ber o
f cus
tom
ers
Weekday
Occupancy profile for shopping mall A
56
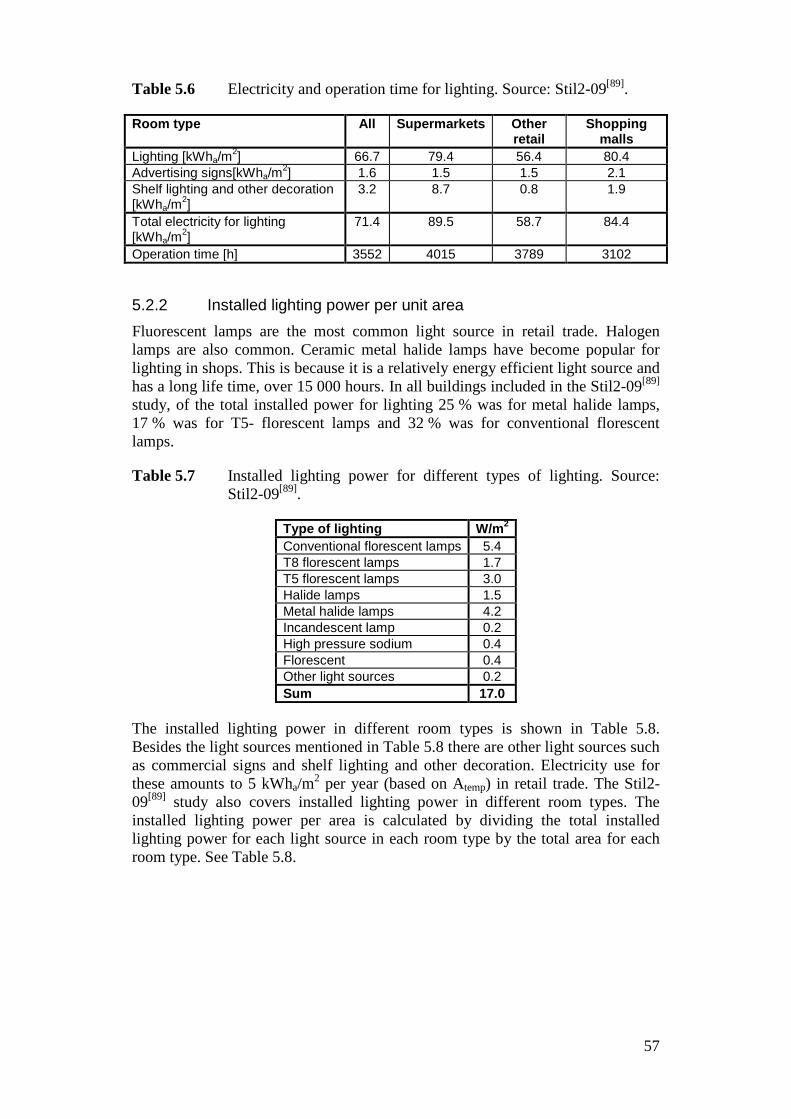
Table 5.6 Electricity and operation time for lighting. Source: Stil2-09[89].
Room type All Supermarkets Other retail
Shopping malls
Lighting [kWha/m2] 66.7 79.4 56.4 80.4 Advertising signs[kWha/m2] 1.6 1.5 1.5 2.1 Shelf lighting and other decoration [kWha/m2]
3.2 8.7 0.8 1.9
Total electricity for lighting [kWha/m2]
71.4 89.5 58.7 84.4
Operation time [h] 3552 4015 3789 3102
5.2.2 Installed lighting power per unit area Fluorescent lamps are the most common light source in retail trade. Halogen lamps are also common. Ceramic metal halide lamps have become popular for lighting in shops. This is because it is a relatively energy efficient light source and has a long life time, over 15 000 hours. In all buildings included in the Stil2-09[89] study, of the total installed power for lighting 25 % was for metal halide lamps, 17 % was for T5- florescent lamps and 32 % was for conventional florescent lamps.
Table 5.7 Installed lighting power for different types of lighting. Source: Stil2-09[89].
Type of lighting W/m2
Conventional florescent lamps 5.4 T8 florescent lamps 1.7 T5 florescent lamps 3.0 Halide lamps 1.5 Metal halide lamps 4.2 Incandescent lamp 0.2 High pressure sodium 0.4 Florescent 0.4 Other light sources 0.2 Sum 17.0
The installed lighting power in different room types is shown in Table 5.8. Besides the light sources mentioned in Table 5.8 there are other light sources such as commercial signs and shelf lighting and other decoration. Electricity use for these amounts to 5 kWha/m2 per year (based on Atemp) in retail trade. The Stil2-09[89] study also covers installed lighting power in different room types. The installed lighting power per area is calculated by dividing the total installed lighting power for each light source in each room type by the total area for each room type. See Table 5.8.
57
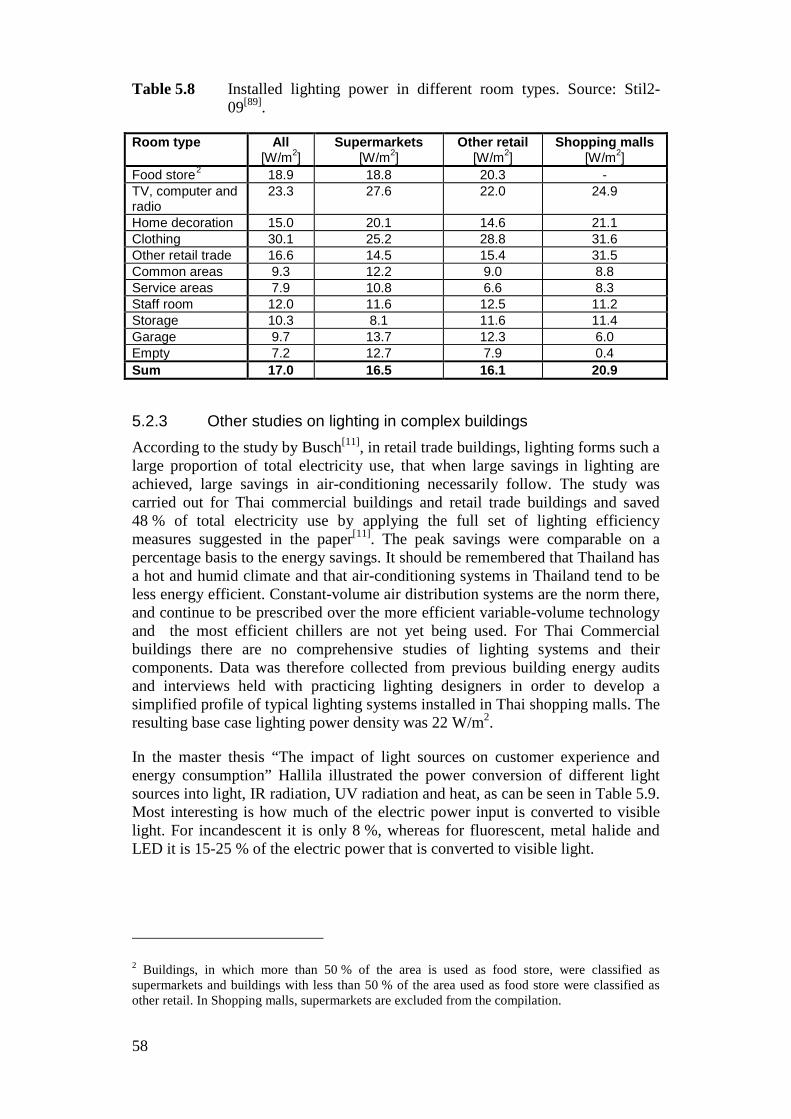
Table 5.8 Installed lighting power in different room types. Source: Stil2-09[89].
Room type All [W/m2]
Supermarkets [W/m2]
Other retail [W/m2]
Shopping malls [W/m2]
Food store2 18.9 18.8 20.3 - TV, computer and radio
23.3 27.6 22.0 24.9
Home decoration 15.0 20.1 14.6 21.1 Clothing 30.1 25.2 28.8 31.6 Other retail trade 16.6 14.5 15.4 31.5 Common areas 9.3 12.2 9.0 8.8 Service areas 7.9 10.8 6.6 8.3 Staff room 12.0 11.6 12.5 11.2 Storage 10.3 8.1 11.6 11.4 Garage 9.7 13.7 12.3 6.0 Empty 7.2 12.7 7.9 0.4 Sum 17.0 16.5 16.1 20.9
5.2.3 Other studies on lighting in complex buildings According to the study by Busch[11], in retail trade buildings, lighting forms such a large proportion of total electricity use, that when large savings in lighting are achieved, large savings in air-conditioning necessarily follow. The study was carried out for Thai commercial buildings and retail trade buildings and saved 48 % of total electricity use by applying the full set of lighting efficiency measures suggested in the paper[11]. The peak savings were comparable on a percentage basis to the energy savings. It should be remembered that Thailand has a hot and humid climate and that air-conditioning systems in Thailand tend to be less energy efficient. Constant-volume air distribution systems are the norm there, and continue to be prescribed over the more efficient variable-volume technology and the most efficient chillers are not yet being used. For Thai Commercial buildings there are no comprehensive studies of lighting systems and their components. Data was therefore collected from previous building energy audits and interviews held with practicing lighting designers in order to develop a simplified profile of typical lighting systems installed in Thai shopping malls. The resulting base case lighting power density was 22 W/m2.
In the master thesis “The impact of light sources on customer experience and energy consumption” Hallila illustrated the power conversion of different light sources into light, IR radiation, UV radiation and heat, as can be seen in Table 5.9. Most interesting is how much of the electric power input is converted to visible light. For incandescent it is only 8 %, whereas for fluorescent, metal halide and LED it is 15-25 % of the electric power that is converted to visible light.
2 Buildings, in which more than 50 % of the area is used as food store, were classified as supermarkets and buildings with less than 50 % of the area used as food store were classified as other retail. In Shopping malls, supermarkets are excluded from the compilation.
58
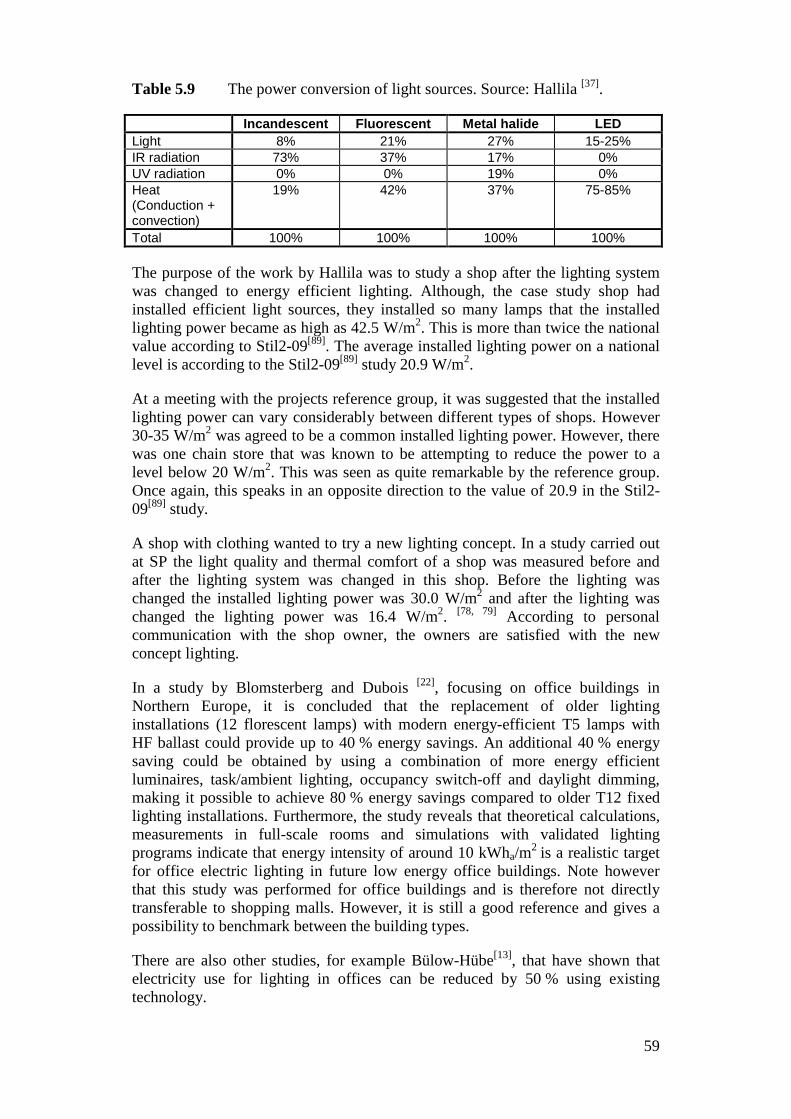
Table 5.9 The power conversion of light sources. Source: Hallila [37].
Incandescent Fluorescent Metal halide LED Light 8% 21% 27% 15-25% IR radiation 73% 37% 17% 0% UV radiation 0% 0% 19% 0% Heat (Conduction + convection)
19% 42% 37% 75-85%
Total 100% 100% 100% 100%
The purpose of the work by Hallila was to study a shop after the lighting system was changed to energy efficient lighting. Although, the case study shop had installed efficient light sources, they installed so many lamps that the installed lighting power became as high as 42.5 W/m2. This is more than twice the national value according to Stil2-09[89]. The average installed lighting power on a national level is according to the Stil2-09[89] study 20.9 W/m2.
At a meeting with the projects reference group, it was suggested that the installed lighting power can vary considerably between different types of shops. However 30-35 W/m2 was agreed to be a common installed lighting power. However, there was one chain store that was known to be attempting to reduce the power to a level below 20 W/m2. This was seen as quite remarkable by the reference group. Once again, this speaks in an opposite direction to the value of 20.9 in the Stil2-09[89] study.
A shop with clothing wanted to try a new lighting concept. In a study carried out at SP the light quality and thermal comfort of a shop was measured before and after the lighting system was changed in this shop. Before the lighting was changed the installed lighting power was 30.0 W/m2 and after the lighting was changed the lighting power was 16.4 W/m2. [78, 79] According to personal communication with the shop owner, the owners are satisfied with the new concept lighting.
In a study by Blomsterberg and Dubois [22], focusing on office buildings in Northern Europe, it is concluded that the replacement of older lighting installations (12 florescent lamps) with modern energy-efficient T5 lamps with HF ballast could provide up to 40 % energy savings. An additional 40 % energy saving could be obtained by using a combination of more energy efficient luminaires, task/ambient lighting, occupancy switch-off and daylight dimming, making it possible to achieve 80 % energy savings compared to older T12 fixed lighting installations. Furthermore, the study reveals that theoretical calculations, measurements in full-scale rooms and simulations with validated lighting programs indicate that energy intensity of around 10 kWha/m2 is a realistic target for office electric lighting in future low energy office buildings. Note however that this study was performed for office buildings and is therefore not directly transferable to shopping malls. However, it is still a good reference and gives a possibility to benchmark between the building types.
There are also other studies, for example Bülow-Hübe[13], that have shown that electricity use for lighting in offices can be reduced by 50 % using existing technology.
59
5.3 Infiltration This section is based on a literature review. The purpose is to give an introduction to air leakage and infiltration in buildings, investigate current knowledge on the subject, and provide input to the calculation model and sensitivity analysis presented in Chapter 8. For the energy calculations in this thesis, it is the infiltration rate that is needed. Infiltration rate can have a large impact on the energy calculation, but it can be difficult to quantify. This section attempts to investigate if it is possible, based on available literature to estimate a typical range for the infiltration rates in Swedish commercial buildings.
5.3.1 What is infiltration and why is it important? Infiltration is the unintentional and uncontrolled flow of outdoor air into a building through leaks in the building envelope. Exfiltration is the opposite, i.e. uncontrolled air flow out of the building. Exfiltration through leaks in the building envelope should generally be avoided since it can lead to moisture damage when warm moist air from the inside cools down and condenses within the building envelope.
In mechanically ventilated buildings, it is desirable to have a tight envelope, as air leakage has several potentially negative consequences, including uncontrolled and unconditioned outdoor air intake, thermal comfort problems, and moisture problems. Infiltration can also have a significant impact on the energy use for heating. Energy losses occur when cold air leaks in through the building envelope and must be heated or when warm air leaves the building and must be replaced. Another reason for increased energy use due to air leakage is that leaks cause draught which result in larger and cooler air flows. Alternatively, air leakage can also create cold surfaces. Drafts and cold surfaces usually lead to reduced thermal comfort. To compensate for this, occupants may try to raise the room temperature, which in turn increases the energy use. As HVAC equipment efficiencies improve, the HVAC system losses will decrease. This means that, with better HVAC systems a greater portion of total energy loss will occur through building envelope leakage.
The air leakage is driven by the pressure difference between inside and outside of the building envelope. The pressure difference is due to three factors; stack effect, wind effect and ventilation. The stack effect is due to the thermal driving force e.g. temperature differences in the air that create density differences. Hot air, which is lighter than cold air, rises up and is replaced by colder outdoor air. This force is greatest during the heating season when the outdoor air is much colder than the indoor air. The wind effect depends on how exposed the building is to the wind velocity and on the wind direction. In addition, the pressure difference depends on the type of ventilation system (e.g. natural or mechanical ventilation) and its operation (e.g. on/off and flow rates).
In energy calculations, such as the calculation presented in Chapter 8, the infiltration rate of the building must be estimated. The only reliable way to determine the air exchange rate of an existing building is to measure it.[4] The air exchange rate, including both ventilation and infiltration, can be measured by tracer gas measurements. The air tightness of the building envelope, which
60
indirectly can be used to quantify the infiltration rate, can be determined by pressurisation measurements.
For a building such as the case study building presented in Chapter 6-9 it is a rather complicated and time consuming project to measure the air tightness. Such measurements are seldom performed in large commercial buildings, although it would provide valuable input for building simulations and possible reduction of energy use if the air tightness of the building were to be improved.
5.3.2 Air exchange rate by tracer gas measurements By releasing tracer gas in a controlled manner into the building, the concentration of the tracer can be monitored and related to the air exchange rate.[4] Tracer gas measurements can be divided in three categories; dilution, constant injection, and constant concentration.[4, 38, 49] Measurements with tracer gas are usually complicated, time consuming and expensive. This can explain why only a few studies of individual tracer gas measurements in commercial buildings were found in this literature review. One example is the study by Persily[64] which describes air change effectiveness in two office buildings, it does not however analyse the infiltration. Consequently, no studies using tracer gas measurements that would allow general conclusions about the infiltration rates in commercial buildings were found.
5.3.3 Air tightness by pressurisation measurements There are currently a number of pressurisations methods, e.g. using a blower door or the ventilation system. The methods consist of pressurising (and/or de-pressurising) the building using fans and determining the necessary airflow to achieve a set pressure. The airflow rate is generally measured at a series of pressure differences ranging from about 10 Pa to 75 Pa.[4] There are few studies and databases which includes analysis of infiltration rate for several commercial buildings using pressurisation measurements. These references are presented and analysed in Section 5.3.6. The result of the analysis is used as input to the calculations in Chapter 8 and the sensitivity analysis in Section 8.4.
An airtightness measurement gives a leakage flow rate at a certain pressure.
VΔp leakage air flow at pressure difference Δp [l/s], [m3/h]
In other words, VΔp is the air flow rate that is needed to maintain the pressure difference Δp. It is common to express the airtightness of a building at the pressure difference of 50 Pa (although also 75 Pa is frequently used, especially in the USA).
Airtightness measurements make it possible to compare different buildings. However, in order to compare different buildings VΔp must be normalised. The normalisation usually accounts for building size by adjusting for factors such as envelope area, building volume or floor area. Table 5.10 gives an overview of the three ways in which air tightness is commonly quantified.
61
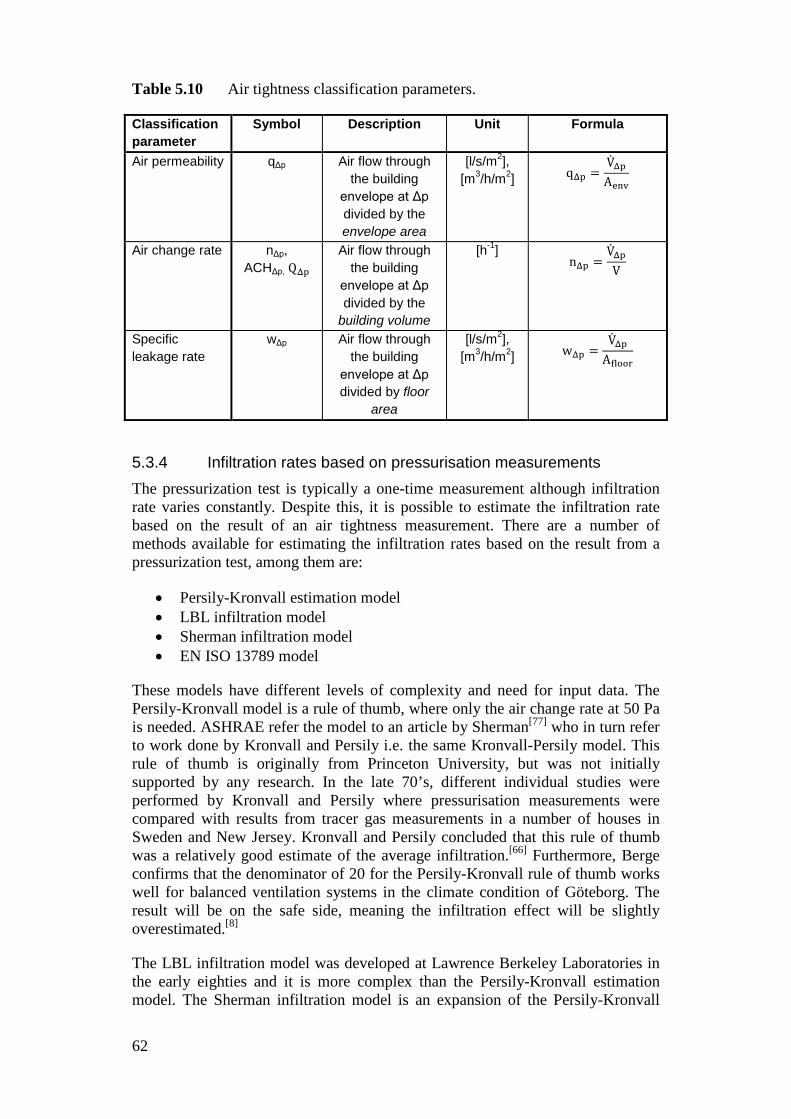
Table 5.10 Air tightness classification parameters.
Classification parameter
Symbol Description Unit Formula
Air permeability qΔp Air flow through the building
envelope at Δp
divided by the envelope area
[l/s/m2], [m3/h/m2] qΔp =
VΔpAenv
Air change rate nΔp, ACHΔp, QΔp
Air flow through the building
envelope at Δp divided by the
building volume
[h-1] nΔp =
VΔpV
Specific leakage rate
wΔp Air flow through the building
envelope at Δp divided by floor
area
[l/s/m2], [m3/h/m2] wΔp =
VΔpAfloor
5.3.4 Infiltration rates based on pressurisation measurements The pressurization test is typically a one-time measurement although infiltration rate varies constantly. Despite this, it is possible to estimate the infiltration rate based on the result of an air tightness measurement. There are a number of methods available for estimating the infiltration rates based on the result from a pressurization test, among them are:
• Persily-Kronvall estimation model • LBL infiltration model • Sherman infiltration model • EN ISO 13789 model
These models have different levels of complexity and need for input data. The Persily-Kronvall model is a rule of thumb, where only the air change rate at 50 Pa is needed. ASHRAE refer the model to an article by Sherman[77] who in turn refer to work done by Kronvall and Persily i.e. the same Kronvall-Persily model. This rule of thumb is originally from Princeton University, but was not initially supported by any research. In the late 70’s, different individual studies were performed by Kronvall and Persily where pressurisation measurements were compared with results from tracer gas measurements in a number of houses in Sweden and New Jersey. Kronvall and Persily concluded that this rule of thumb was a relatively good estimate of the average infiltration.[66] Furthermore, Berge confirms that the denominator of 20 for the Persily-Kronvall rule of thumb works well for balanced ventilation systems in the climate condition of Göteborg. The result will be on the safe side, meaning the infiltration effect will be slightly overestimated.[8]
The LBL infiltration model was developed at Lawrence Berkeley Laboratories in the early eighties and it is more complex than the Persily-Kronvall estimation model. The Sherman infiltration model is an expansion of the Persily-Kronvall
62
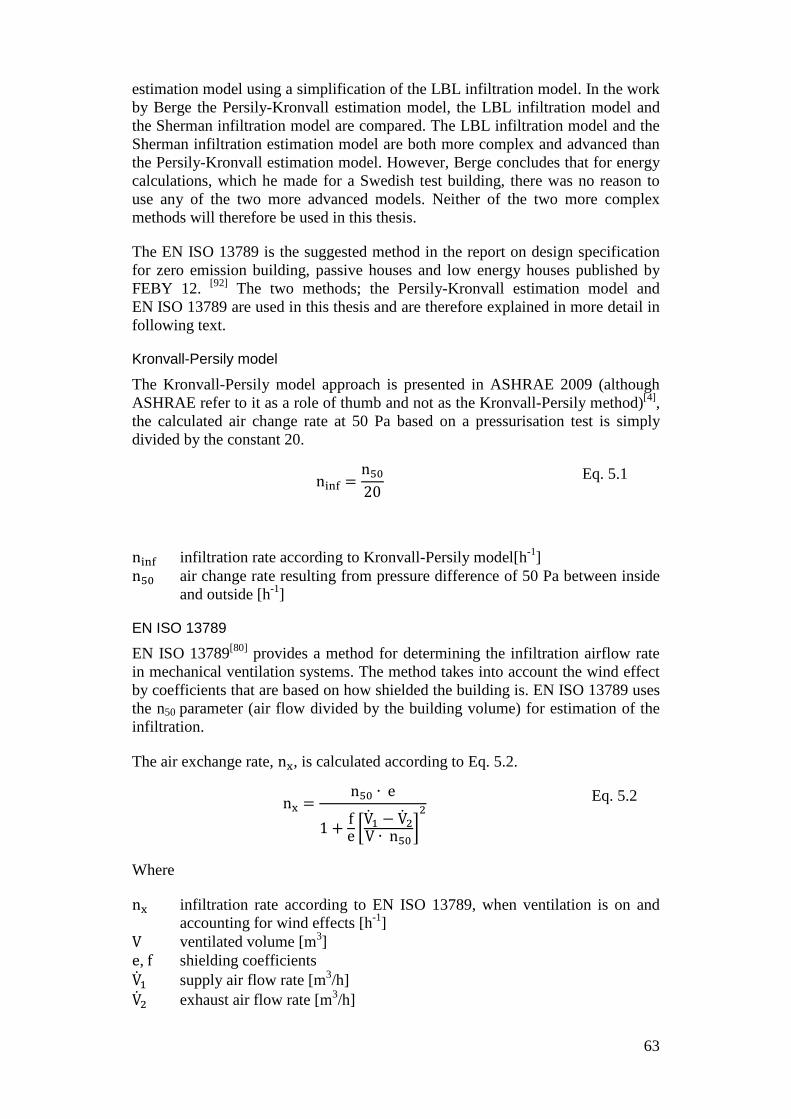
estimation model using a simplification of the LBL infiltration model. In the work by Berge the Persily-Kronvall estimation model, the LBL infiltration model and the Sherman infiltration model are compared. The LBL infiltration model and the Sherman infiltration estimation model are both more complex and advanced than the Persily-Kronvall estimation model. However, Berge concludes that for energy calculations, which he made for a Swedish test building, there was no reason to use any of the two more advanced models. Neither of the two more complex methods will therefore be used in this thesis.
The EN ISO 13789 is the suggested method in the report on design specification for zero emission building, passive houses and low energy houses published by FEBY 12. [92] The two methods; the Persily-Kronvall estimation model and EN ISO 13789 are used in this thesis and are therefore explained in more detail in following text.
Kronvall-Persily model
The Kronvall-Persily model approach is presented in ASHRAE 2009 (although ASHRAE refer to it as a role of thumb and not as the Kronvall-Persily method)[4], the calculated air change rate at 50 Pa based on a pressurisation test is simply divided by the constant 20.
ninf =n5020
Eq. 5.1
ninf infiltration rate according to Kronvall-Persily model[h-1] n50 air change rate resulting from pressure difference of 50 Pa between inside
and outside [h-1]
EN ISO 13789
EN ISO 13789[80] provides a method for determining the infiltration airflow rate in mechanical ventilation systems. The method takes into account the wind effect by coefficients that are based on how shielded the building is. EN ISO 13789 uses the n50 parameter (air flow divided by the building volume) for estimation of the infiltration.
The air exchange rate, nx, is calculated according to Eq. 5.2.
nx =n50 ∙ e
1 + fe �
V1 − V2V ∙ n50
�2 Eq. 5.2
Where
nx infiltration rate according to EN ISO 13789, when ventilation is on and accounting for wind effects [h-1]
V ventilated volume [m3] e, f shielding coefficients V1 supply air flow rate [m3/h] V2 exhaust air flow rate [m3/h]
63
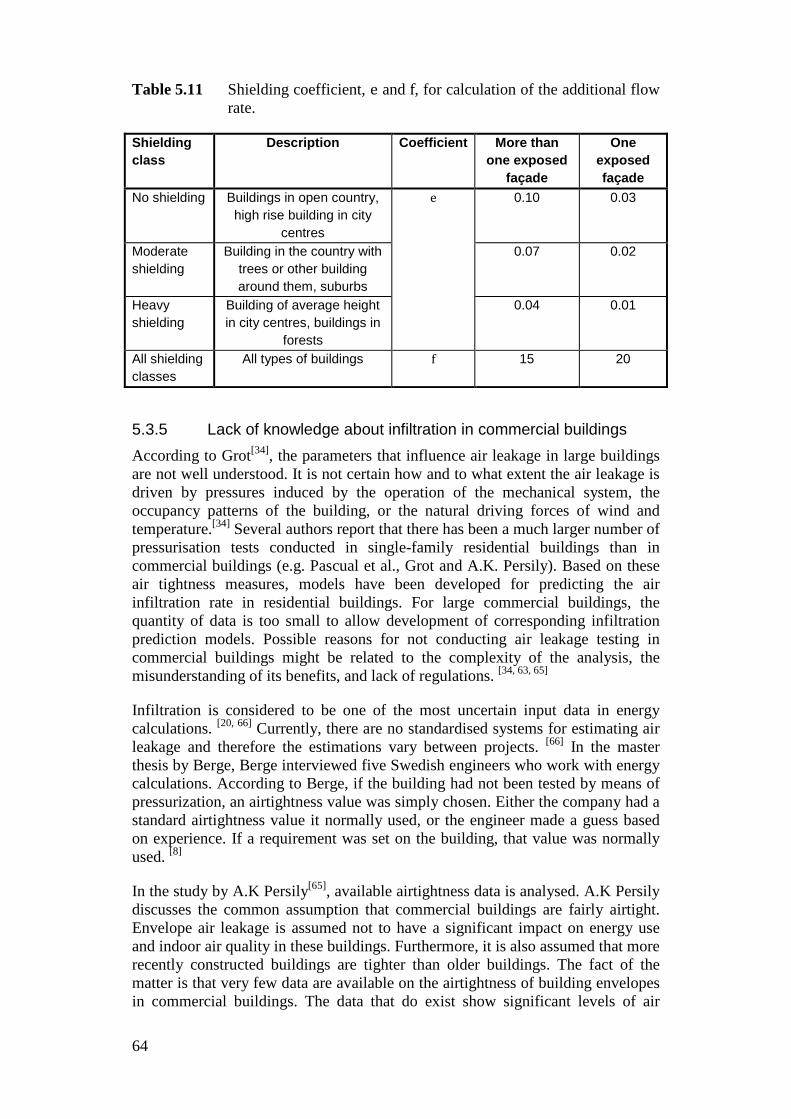
Table 5.11 Shielding coefficient, e and f, for calculation of the additional flow rate.
Shielding class
Description Coefficient More than one exposed
façade
One exposed façade
No shielding Buildings in open country, high rise building in city
centres
e 0.10 0.03
Moderate shielding
Building in the country with trees or other building around them, suburbs
0.07 0.02
Heavy shielding
Building of average height in city centres, buildings in
forests
0.04 0.01
All shielding classes
All types of buildings f 15 20
5.3.5 Lack of knowledge about infiltration in commercial buildings According to Grot[34], the parameters that influence air leakage in large buildings are not well understood. It is not certain how and to what extent the air leakage is driven by pressures induced by the operation of the mechanical system, the occupancy patterns of the building, or the natural driving forces of wind and temperature.[34] Several authors report that there has been a much larger number of pressurisation tests conducted in single-family residential buildings than in commercial buildings (e.g. Pascual et al., Grot and A.K. Persily). Based on these air tightness measures, models have been developed for predicting the air infiltration rate in residential buildings. For large commercial buildings, the quantity of data is too small to allow development of corresponding infiltration prediction models. Possible reasons for not conducting air leakage testing in commercial buildings might be related to the complexity of the analysis, the misunderstanding of its benefits, and lack of regulations. [34, 63, 65]
Infiltration is considered to be one of the most uncertain input data in energy calculations. [20, 66] Currently, there are no standardised systems for estimating air leakage and therefore the estimations vary between projects. [66] In the master thesis by Berge, Berge interviewed five Swedish engineers who work with energy calculations. According to Berge, if the building had not been tested by means of pressurization, an airtightness value was simply chosen. Either the company had a standard airtightness value it normally used, or the engineer made a guess based on experience. If a requirement was set on the building, that value was normally used. [8]
In the study by A.K Persily[65], available airtightness data is analysed. A.K Persily discusses the common assumption that commercial buildings are fairly airtight. Envelope air leakage is assumed not to have a significant impact on energy use and indoor air quality in these buildings. Furthermore, it is also assumed that more recently constructed buildings are tighter than older buildings. The fact of the matter is that very few data are available on the airtightness of building envelopes in commercial buildings. The data that do exist show significant levels of air
64
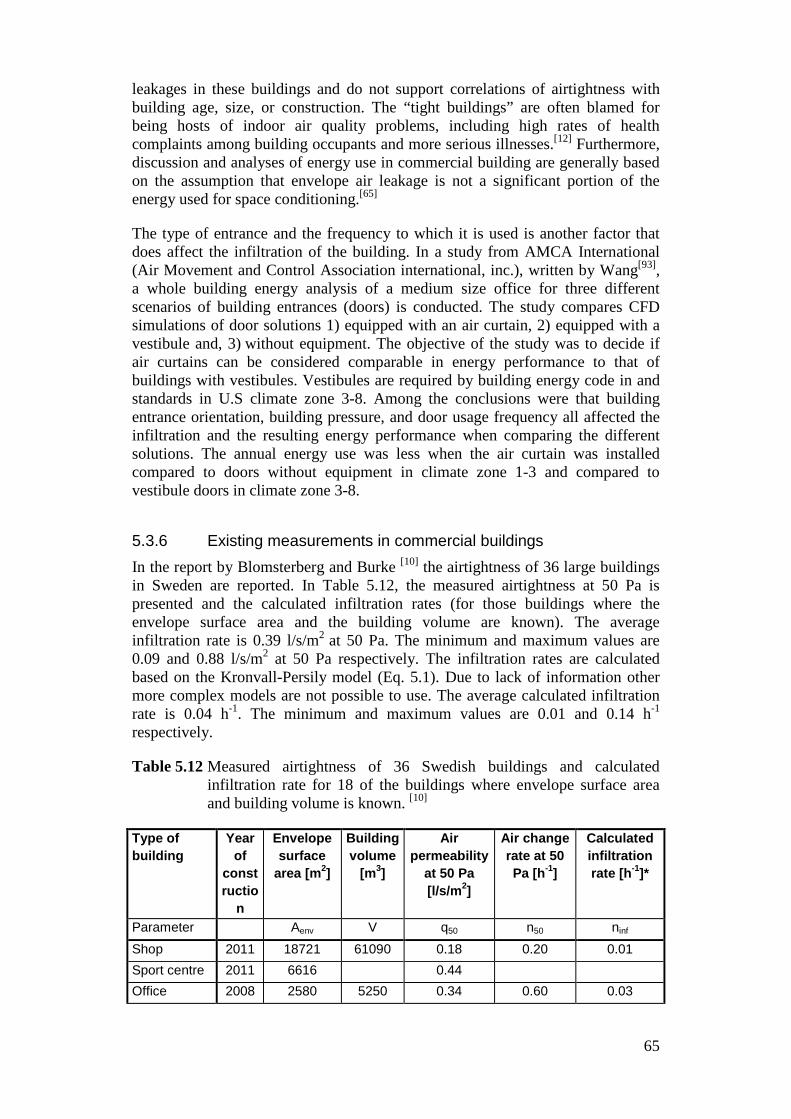
leakages in these buildings and do not support correlations of airtightness with building age, size, or construction. The “tight buildings” are often blamed for being hosts of indoor air quality problems, including high rates of health complaints among building occupants and more serious illnesses.[12] Furthermore, discussion and analyses of energy use in commercial building are generally based on the assumption that envelope air leakage is not a significant portion of the energy used for space conditioning.[65]
The type of entrance and the frequency to which it is used is another factor that does affect the infiltration of the building. In a study from AMCA International (Air Movement and Control Association international, inc.), written by Wang[93], a whole building energy analysis of a medium size office for three different scenarios of building entrances (doors) is conducted. The study compares CFD simulations of door solutions 1) equipped with an air curtain, 2) equipped with a vestibule and, 3) without equipment. The objective of the study was to decide if air curtains can be considered comparable in energy performance to that of buildings with vestibules. Vestibules are required by building energy code in and standards in U.S climate zone 3-8. Among the conclusions were that building entrance orientation, building pressure, and door usage frequency all affected the infiltration and the resulting energy performance when comparing the different solutions. The annual energy use was less when the air curtain was installed compared to doors without equipment in climate zone 1-3 and compared to vestibule doors in climate zone 3-8.
5.3.6 Existing measurements in commercial buildings In the report by Blomsterberg and Burke [10] the airtightness of 36 large buildings in Sweden are reported. In Table 5.12, the measured airtightness at 50 Pa is presented and the calculated infiltration rates (for those buildings where the envelope surface area and the building volume are known). The average infiltration rate is 0.39 l/s/m2 at 50 Pa. The minimum and maximum values are 0.09 and 0.88 l/s/m2 at 50 Pa respectively. The infiltration rates are calculated based on the Kronvall-Persily model (Eq. 5.1). Due to lack of information other more complex models are not possible to use. The average calculated infiltration rate is 0.04 h-1. The minimum and maximum values are 0.01 and 0.14 h-1 respectively.
Table 5.12 Measured airtightness of 36 Swedish buildings and calculated infiltration rate for 18 of the buildings where envelope surface area and building volume is known. [10]
Type of building
Year of
constructio
n
Envelope surface
area [m2]
Building volume
[m3]
Air permeability
at 50 Pa [l/s/m2]
Air change rate at 50 Pa [h-1]
Calculated infiltration rate [h-1]*
Parameter Aenv V q50 n50 ninf
Shop 2011 18721 61090 0.18 0.20 0.01 Sport centre 2011 6616 0.44 Office 2008 2580 5250 0.34 0.60 0.03
65
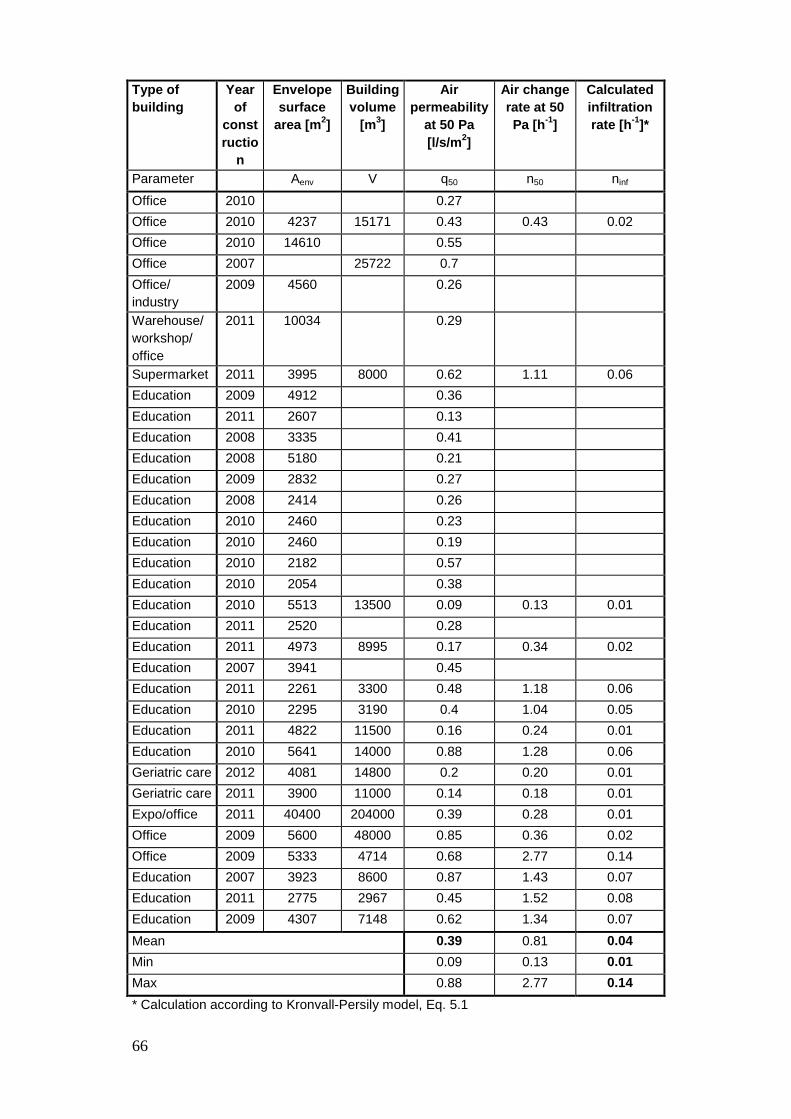
Type of building
Year of
constructio
n
Envelope surface
area [m2]
Building volume
[m3]
Air permeability
at 50 Pa [l/s/m2]
Air change rate at 50 Pa [h-1]
Calculated infiltration rate [h-1]*
Parameter Aenv V q50 n50 ninf
Office 2010 0.27 Office 2010 4237 15171 0.43 0.43 0.02 Office 2010 14610 0.55 Office 2007 25722 0.7 Office/ industry
2009 4560 0.26
Warehouse/workshop/ office
2011 10034 0.29
Supermarket 2011 3995 8000 0.62 1.11 0.06 Education 2009 4912 0.36 Education 2011 2607 0.13 Education 2008 3335 0.41 Education 2008 5180 0.21 Education 2009 2832 0.27 Education 2008 2414 0.26 Education 2010 2460 0.23 Education 2010 2460 0.19 Education 2010 2182 0.57 Education 2010 2054 0.38 Education 2010 5513 13500 0.09 0.13 0.01 Education 2011 2520 0.28 Education 2011 4973 8995 0.17 0.34 0.02 Education 2007 3941 0.45 Education 2011 2261 3300 0.48 1.18 0.06 Education 2010 2295 3190 0.4 1.04 0.05 Education 2011 4822 11500 0.16 0.24 0.01 Education 2010 5641 14000 0.88 1.28 0.06 Geriatric care 2012 4081 14800 0.2 0.20 0.01 Geriatric care 2011 3900 11000 0.14 0.18 0.01 Expo/office 2011 40400 204000 0.39 0.28 0.01 Office 2009 5600 48000 0.85 0.36 0.02 Office 2009 5333 4714 0.68 2.77 0.14 Education 2007 3923 8600 0.87 1.43 0.07 Education 2011 2775 2967 0.45 1.52 0.08 Education 2009 4307 7148 0.62 1.34 0.07 Mean 0.39 0.81 0.04 Min 0.09 0.13 0.01 Max 0.88 2.77 0.14 * Calculation according to Kronvall-Persily model, Eq. 5.1
66
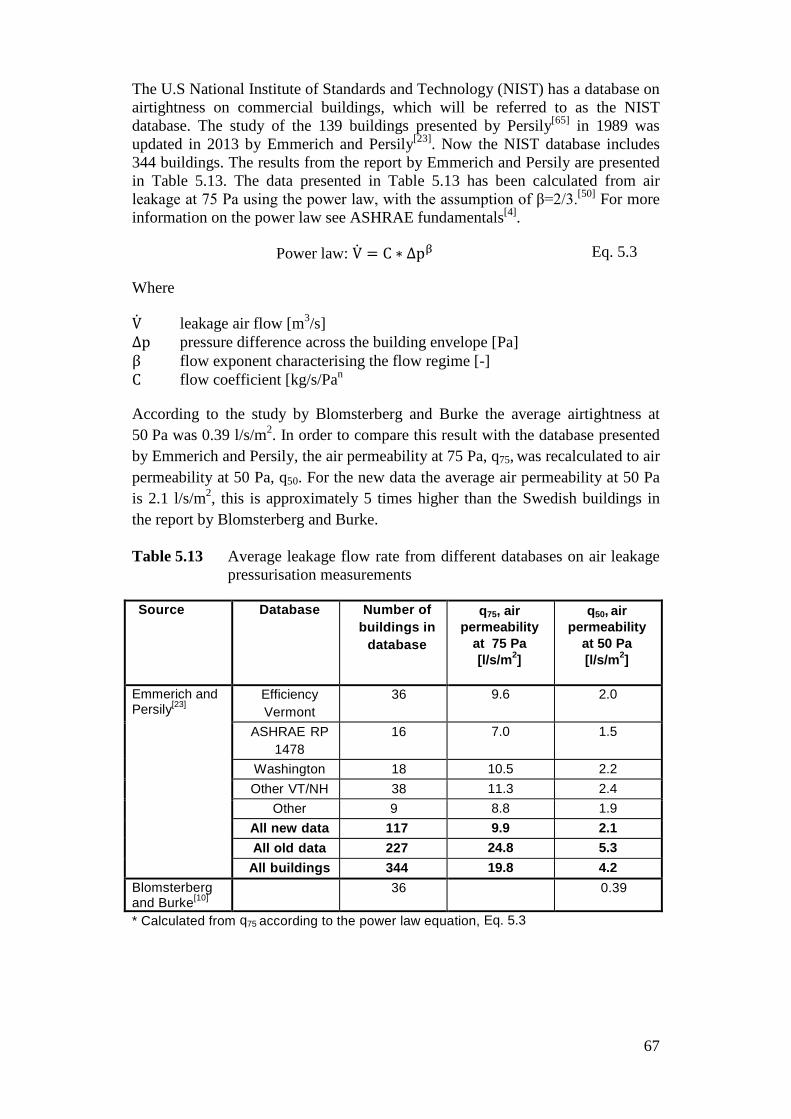
The U.S National Institute of Standards and Technology (NIST) has a database on airtightness on commercial buildings, which will be referred to as the NIST database. The study of the 139 buildings presented by Persily[65] in 1989 was updated in 2013 by Emmerich and Persily[23]. Now the NIST database includes 344 buildings. The results from the report by Emmerich and Persily are presented in Table 5.13. The data presented in Table 5.13 has been calculated from air leakage at 75 Pa using the power law, with the assumption of β=2/3.[50] For more information on the power law see ASHRAE fundamentals[4].
Power law: V = C ∗ Δpβ Eq. 5.3
Where
V leakage air flow [m3/s] Δp pressure difference across the building envelope [Pa] β flow exponent characterising the flow regime [-] C flow coefficient [kg/s/Pan
According to the study by Blomsterberg and Burke the average airtightness at 50 Pa was 0.39 l/s/m2. In order to compare this result with the database presented by Emmerich and Persily, the air permeability at 75 Pa, q75, was recalculated to air permeability at 50 Pa, q50. For the new data the average air permeability at 50 Pa is 2.1 l/s/m2, this is approximately 5 times higher than the Swedish buildings in the report by Blomsterberg and Burke.
Table 5.13 Average leakage flow rate from different databases on air leakage pressurisation measurements
Source Database Number of buildings in
database
q75, air permeability
at 75 Pa [l/s/m2]
q50, air permeability
at 50 Pa [l/s/m2]
Emmerich and Persily[23]
Efficiency Vermont
36 9.6 2.0
ASHRAE RP 1478
16 7.0
1.5
Washington 18 10.5 2.2 Other VT/NH 38 11.3 2.4
Other 9 8.8 1.9 All new data 117 9.9 2.1 All old data 227 24.8 5.3
All buildings 344 19.8 4.2 Blomsterberg and Burke[10]
36 0.39
* Calculated from q75 according to the power law equation, Eq. 5.3
67
5.4 Discussion and Summary Based on the information presented in this chapter it can be concluded that there is a large deviation in the number of customers between different days and throughout one day in a shopping mall. Consequently there will be a deviation between the heat loads from customers at different times as well. It would be possible to develop more sophisticated models of the customer occupancy profile than available today. This chapter has shown that it is possible to define a function that predicts the customer occupancy in shopping malls relatively well. However the need for it when calculating heat loads is limited as long as other loads, such as lighting, are considerably larger. Today the internal heat load from people is still small compared to lighting, but this will most likely change considering the large development of energy efficient lighting technology.
There is limited data available on how much the occupancy in non-residential buildings actually affects the energy use. Some data is available from Sveby[97]. According to their guideline, sensible heat emitted from people is 3.8 W/m2 and 5.4 W/m2 at occupancy level of 70 % and 100 %, respectively. This is in the same order of magnitude as the estimation for heat emitted from people in shopping malls, as presented in this chapter.
In Chapter 8, an estimation of the heat load from people was needed in the energy calculation for the case study building. Based on the discussion in this chapter a value of 4.1 W/m2 was chosen for the calculations. This corresponds to an average occupancy time of 0.75 hours and the measured occupancy during Monday-Friday, as was presented in Table 5.3. In the case study only an average value was needed since the internal heat from people did not have a large impact on the energy demand. However, in other energy calculations, when the internal heat loads from people are more dominant, the load patterns from this chapter can be used. The analysis in this chapter was also important since it gave realistic references to the average occupancy time in shopping malls. This value was needed for the case study calculations since the occupancy in the case study shopping malls was not available, only the frequency of people entering the shopping mall was measured.
The lighting energy can be significantly reduced. A reduction of 50 % will probably be possible in many cases. According to a study performed at SP Technical Research Institute a shop changed their lighting and the resulting installed lighting power was as low as 16.4 W/m2 (compared to initial 30.0 W/m2), with satisfactory results. [78, 79] This is approximately half the installed power compared to current practise, according to the reference group of this thesis project. There are furthermore other studies showing a potential energy saving between 40-50 % when the light sources are changed in commercial buildings. [13, 22] The potential increases to up to 80 % if the change of light sources is combined with improved operation e.g. occupancy switch-off and daylight dimming.[22]
There is limited information available concerning infiltration in commercial buildings. The infiltration in a building can be estimated based on simulations and/or measurements. It is more common to conduct pressurisation measurements on residential buildings then in commercial buildings. Only two references have been found that report on air tightness measurements in numerous buildings. A
68
study by Blomsterberg and Burke reports air permeability at 50 Pa in 36 large buildings. Emmerich and Persily report air permeability at 75 Pa in 344 buildings. To enable comparison of these results the air permeability at 75 Pa is recalculated to air permeability at 50 Pa using the power law equation.
Of the buildings in the Emmerich and Persily report, 117 building are categorised as “new data”. The “old data” is considered less relevant to this study, since construction technology has evolved over the years. However, the new data in the Emmerich and Persily report still shows air permeability 5 times larger than the 36 Swedish buildings. One explanation for this large deviation is that the USA has had less focus on air tightness than Sweden. Another point worth mentioning is that the buildings in the USA data base represent a wide range of different climate conditions, whereas the Blomsterberg and Burke report represent Swedish climate conditions only.
Because of the large differences in construction traditions and the geographical location, the Swedish study is considered most relevant as the reference for the case study in this thesis. To answer the question stated in the introduction to this section, the infiltration rates in Swedish commercial buildings can be assumed to range between 0.04-0.14 h-1. However, this assumption is only based on one study of 36 buildings. It should also be noted that these buildings were not randomly selected, so the results cannot be assumed to be representative for the population as a whole. A better assumption can be made when more data is available.
69

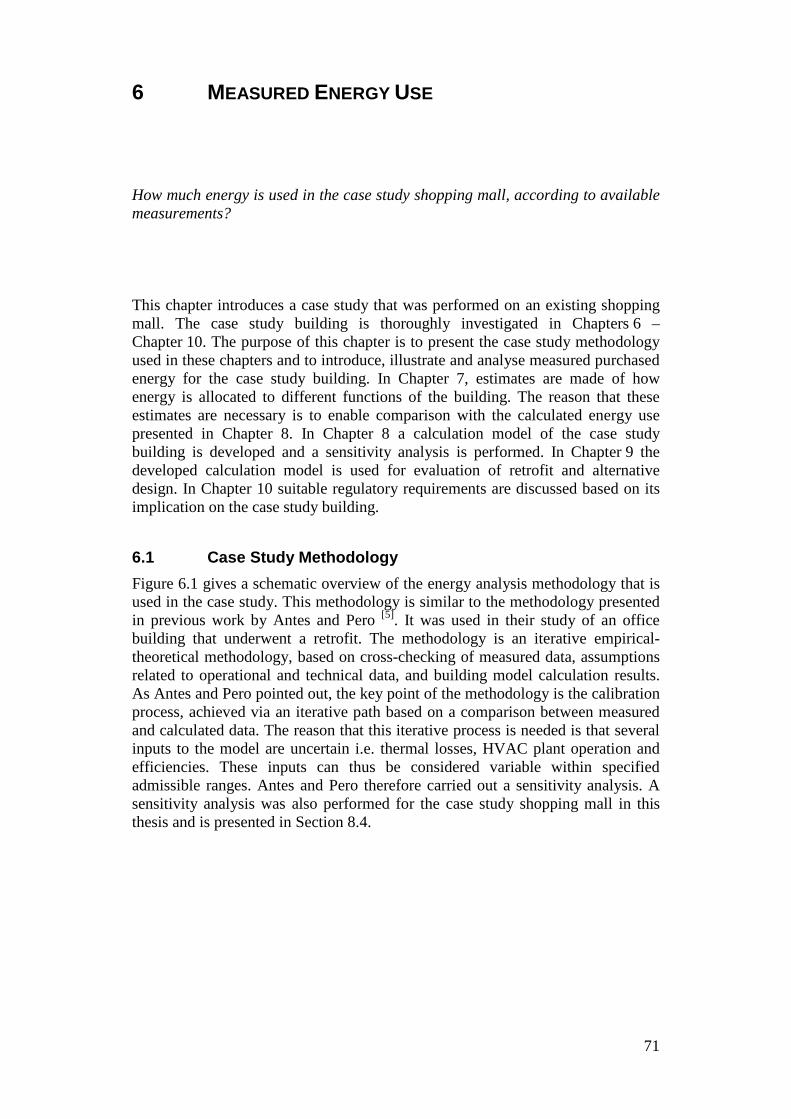
6 MEASURED ENERGY USE How much energy is used in the case study shopping mall, according to available measurements? This chapter introduces a case study that was performed on an existing shopping mall. The case study building is thoroughly investigated in Chapters 6 – Chapter 10. The purpose of this chapter is to present the case study methodology used in these chapters and to introduce, illustrate and analyse measured purchased energy for the case study building. In Chapter 7, estimates are made of how energy is allocated to different functions of the building. The reason that these estimates are necessary is to enable comparison with the calculated energy use presented in Chapter 8. In Chapter 8 a calculation model of the case study building is developed and a sensitivity analysis is performed. In Chapter 9 the developed calculation model is used for evaluation of retrofit and alternative design. In Chapter 10 suitable regulatory requirements are discussed based on its implication on the case study building.
6.1 Case Study Methodology Figure 6.1 gives a schematic overview of the energy analysis methodology that is used in the case study. This methodology is similar to the methodology presented in previous work by Antes and Pero [5]. It was used in their study of an office building that underwent a retrofit. The methodology is an iterative empirical-theoretical methodology, based on cross-checking of measured data, assumptions related to operational and technical data, and building model calculation results. As Antes and Pero pointed out, the key point of the methodology is the calibration process, achieved via an iterative path based on a comparison between measured and calculated data. The reason that this iterative process is needed is that several inputs to the model are uncertain i.e. thermal losses, HVAC plant operation and efficiencies. These inputs can thus be considered variable within specified admissible ranges. Antes and Pero therefore carried out a sensitivity analysis. A sensitivity analysis was also performed for the case study shopping mall in this thesis and is presented in Section 8.4.
71
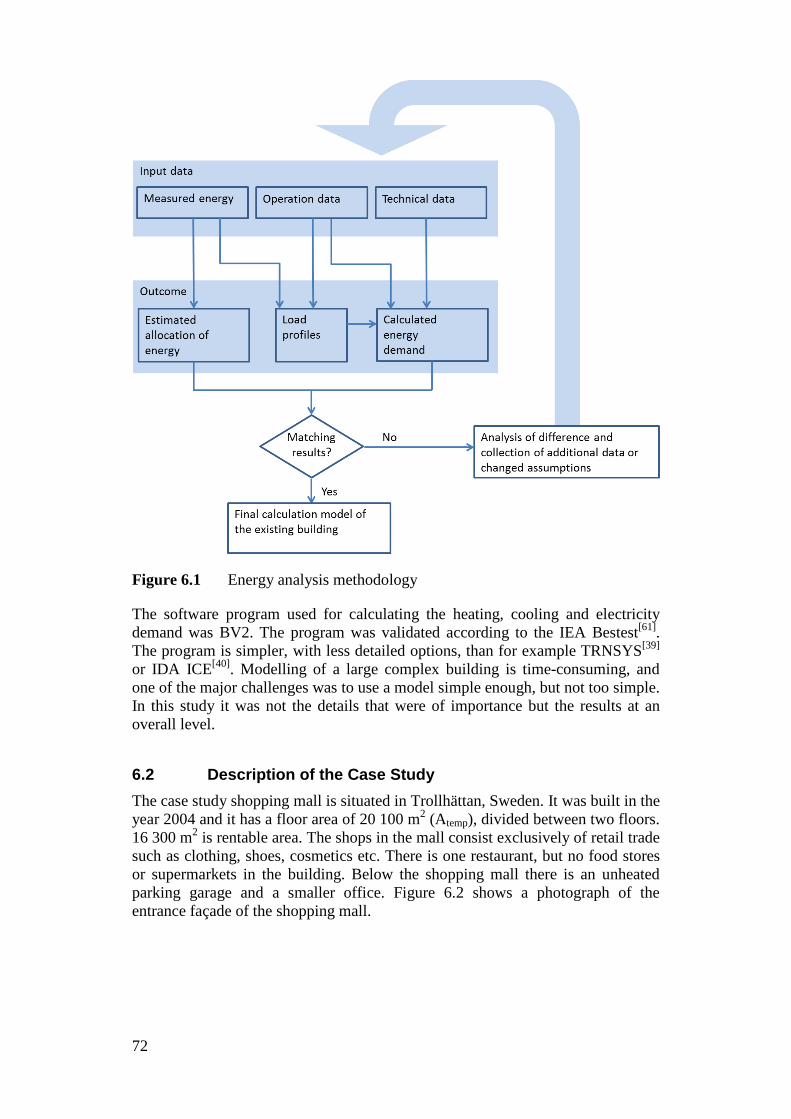
Figure 6.1 Energy analysis methodology
The software program used for calculating the heating, cooling and electricity demand was BV2. The program was validated according to the IEA Bestest[61]. The program is simpler, with less detailed options, than for example TRNSYS[39] or IDA ICE[40]. Modelling of a large complex building is time-consuming, and one of the major challenges was to use a model simple enough, but not too simple. In this study it was not the details that were of importance but the results at an overall level.
6.2 Description of the Case Study The case study shopping mall is situated in Trollhättan, Sweden. It was built in the year 2004 and it has a floor area of 20 100 m2 (Atemp), divided between two floors. 16 300 m2 is rentable area. The shops in the mall consist exclusively of retail trade such as clothing, shoes, cosmetics etc. There is one restaurant, but no food stores or supermarkets in the building. Below the shopping mall there is an unheated parking garage and a smaller office. Figure 6.2 shows a photograph of the entrance façade of the shopping mall.
72
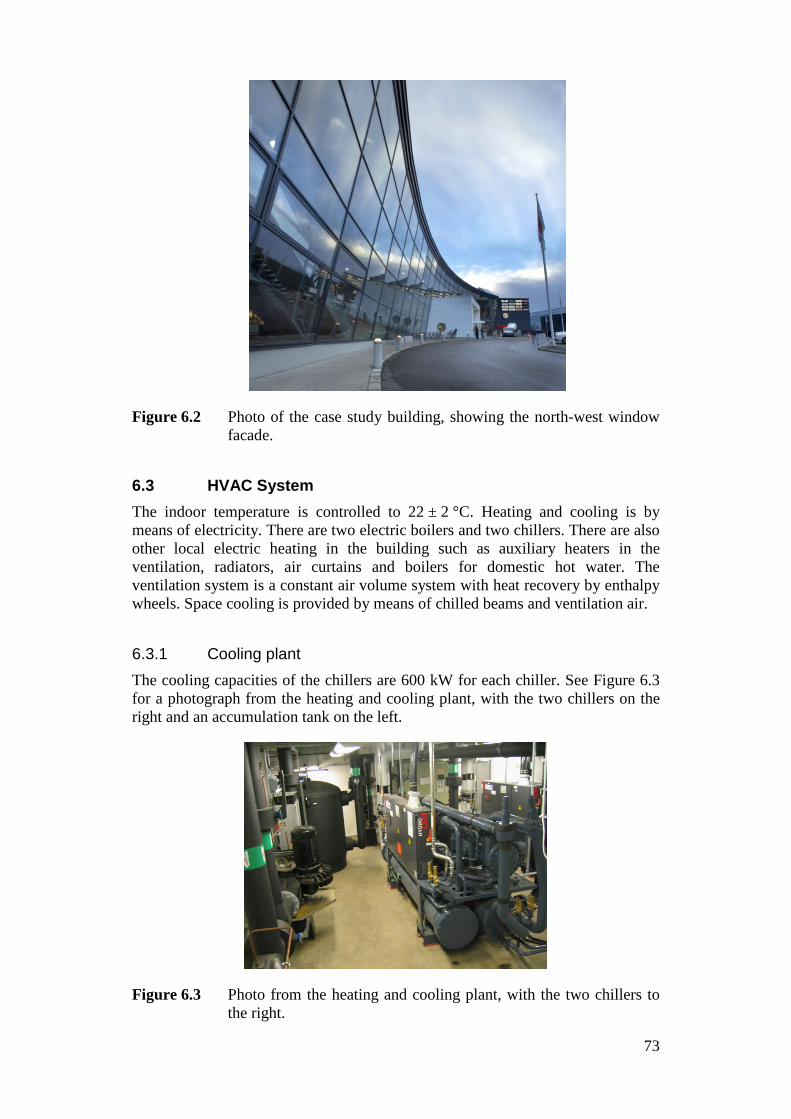
Figure 6.2 Photo of the case study building, showing the north-west window facade.
6.3 HVAC System The indoor temperature is controlled to 22 ± 2 °C. Heating and cooling is by means of electricity. There are two electric boilers and two chillers. There are also other local electric heating in the building such as auxiliary heaters in the ventilation, radiators, air curtains and boilers for domestic hot water. The ventilation system is a constant air volume system with heat recovery by enthalpy wheels. Space cooling is provided by means of chilled beams and ventilation air.
6.3.1 Cooling plant The cooling capacities of the chillers are 600 kW for each chiller. See Figure 6.3 for a photograph from the heating and cooling plant, with the two chillers on the right and an accumulation tank on the left.
Figure 6.3 Photo from the heating and cooling plant, with the two chillers to the right.
73
The chillers are of the brand Hydrociat 2500 Z série LW. Each chiller has two screw compressors and the refrigerant used is R407C. Each chiller has a cooling capacity of 600 kW, and the power input during design conditions is 200 kW. The cooling coefficient of performance (COPcool) is 3 at design condition. The compressors are capacity controlled (25-100%). At design operation, the supply temperature is 7 °C and the return temperature is 12 °C, on the evaporation side of the chiller. Further design data are presented in Table 6.1.
Table 6.1 Design data for the chillers.
Cooling evaporator Heating condensor Capacity 600 kW 800 kW Fluid Water MEG 30 % Inlet temperature 12.0 ºC 35.0 ºC Outlet temperature 7.0 ºC 41 ºC Flow 103.4 m3/h 120.3 m3/h Pressure drop 4.25 mWG 3.6 mWG Connection diameter PN 16 DN 150 PN 16 DN 150
The excess heat from the condenser side of the chiller is dissipated from two identical dry coolers situated on the roof of the shopping mall. No condenser heat is recovered in any way. Table 6.2 present the data for the dry coolers.
Table 6.2 Data for the dry coolers.
Rated power input 19.8 kW Number of fans per dry cooler 12 Thermal capacity 798 kW Air temperature in /out 28.0 / 38.6 °C Fluid Ethylene glycol 30 % Fluid temperature in / out 41.0 / 34.5 °C Number of fans 12
Figure 6.4 gives a schematic layout of the cooling plant. The cooling plant works in two different operation modes; 1) chiller operation and 2) free cooling operation. During chiller operation the two chillers, VKA1 and VKA2, provide chilled water to the air handling units (AHUs) and the chilled beams. The condensers are cooled by the two dry coolers, KMK1 and KMK2. During free cooling operation, cooling is provided via the dry coolers instead of via the chillers. Free cooling may take place when the outdoor temperature falls below +12 °C for more than two hours and when the return temperature from the dry coolers at KM1-GT22 and KM1-GT23 is lower than the return brine temperature at KB1-GT21. During free cooling valve KB1-SV11 is closed. The temperature at KB1-GT12 is kept constant at 14 °C by first opening valve KM1-SV12 into the heat exchanger VVX and then starting fans in the dry coolers, KMK1 and KMK2. The temperature at KM1-GT22 and KM1-GT23 is limited to +8 °C by switching off the fans in the dry coolers. Free cooling is disconnected when the return temperature from the dry coolers at KM1-GT22 and KM1-GT23 exceeds the return brine temperature at KB1-GT21 or when the outdoor temperature exceeds +13 °C.
74
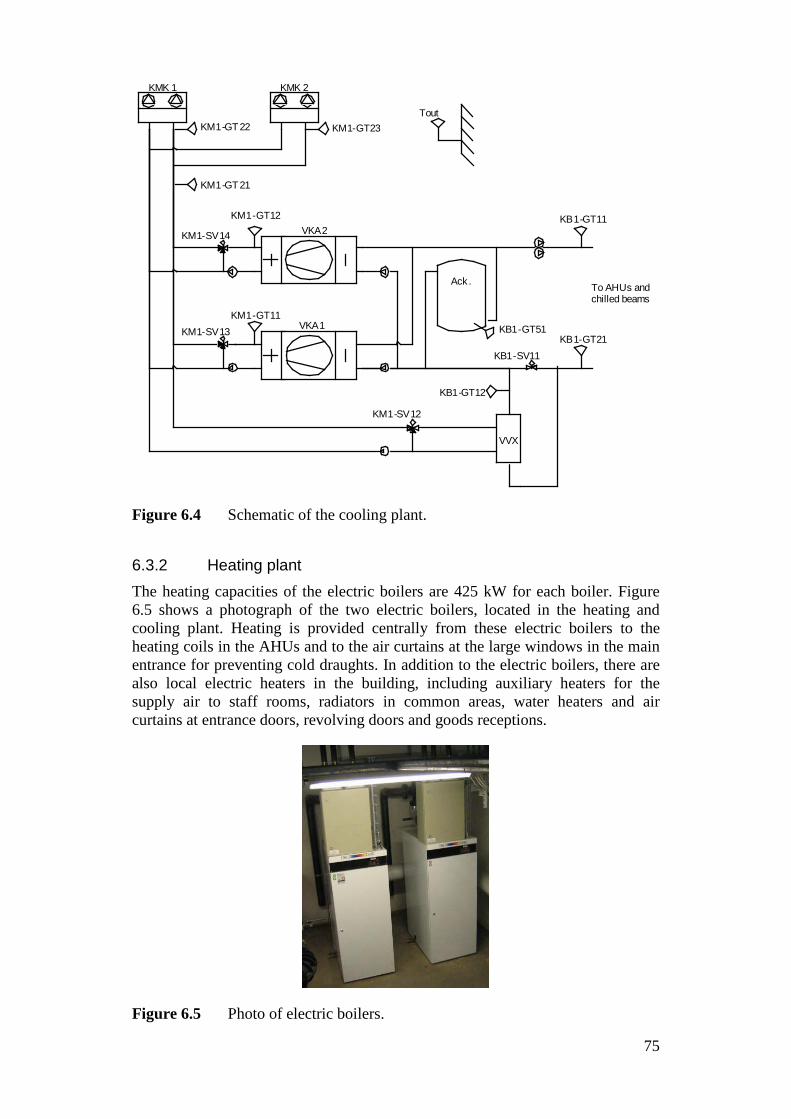
Figure 6.4 Schematic of the cooling plant.
6.3.2 Heating plant The heating capacities of the electric boilers are 425 kW for each boiler. Figure 6.5 shows a photograph of the two electric boilers, located in the heating and cooling plant. Heating is provided centrally from these electric boilers to the heating coils in the AHUs and to the air curtains at the large windows in the main entrance for preventing cold draughts. In addition to the electric boilers, there are also local electric heaters in the building, including auxiliary heaters for the supply air to staff rooms, radiators in common areas, water heaters and air curtains at entrance doors, revolving doors and goods receptions.
Figure 6.5 Photo of electric boilers.
Ack .
VVX
KM1-SV12
KM1-SV13
KM1-SV14
KM1-GT 21
KM1-GT 22 KM1-GT23
KB1-GT11
KB1-SV11
KB1-GT51KB1-GT21
KB1-GT12
Tout
To AHUs and chilled beams
VKA1
VKA2
KMK 1 KMK 2
KM1-GT11
KM1-GT12
75
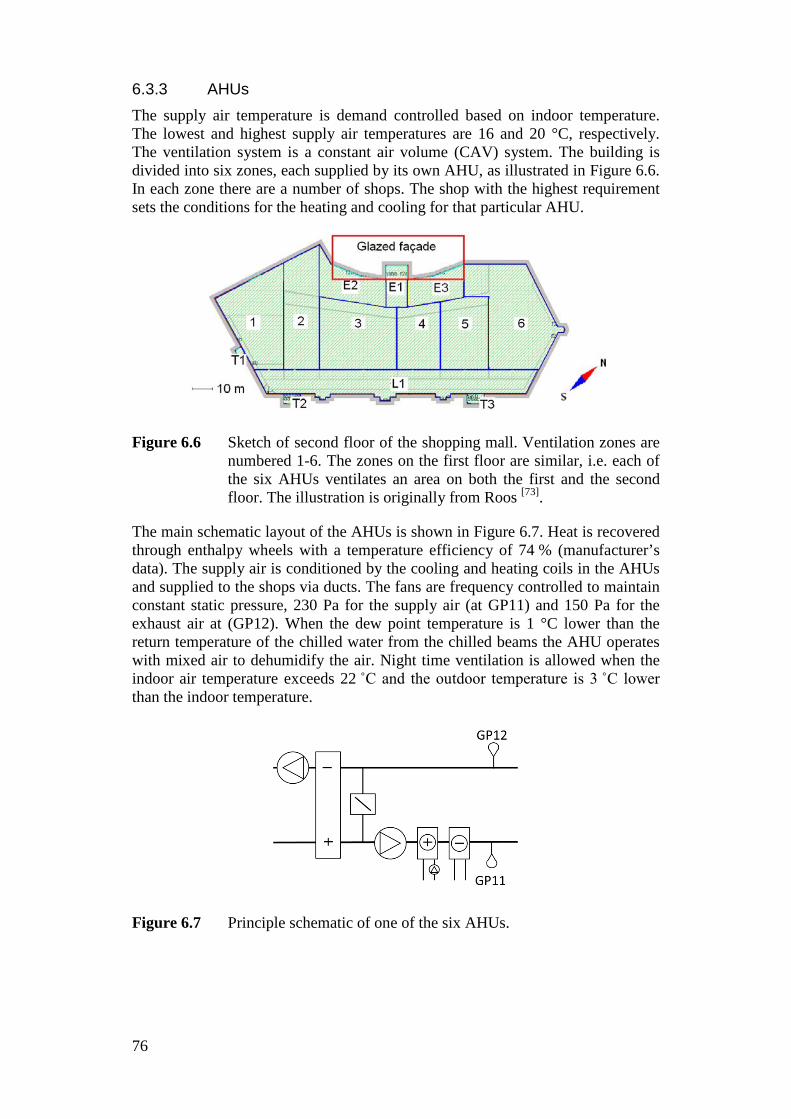
6.3.3 AHUs The supply air temperature is demand controlled based on indoor temperature. The lowest and highest supply air temperatures are 16 and 20 °C, respectively. The ventilation system is a constant air volume (CAV) system. The building is divided into six zones, each supplied by its own AHU, as illustrated in Figure 6.6. In each zone there are a number of shops. The shop with the highest requirement sets the conditions for the heating and cooling for that particular AHU.
Figure 6.6 Sketch of second floor of the shopping mall. Ventilation zones are numbered 1-6. The zones on the first floor are similar, i.e. each of the six AHUs ventilates an area on both the first and the second floor. The illustration is originally from Roos [73].
The main schematic layout of the AHUs is shown in Figure 6.7. Heat is recovered through enthalpy wheels with a temperature efficiency of 74 % (manufacturer’s data). The supply air is conditioned by the cooling and heating coils in the AHUs and supplied to the shops via ducts. The fans are frequency controlled to maintain constant static pressure, 230 Pa for the supply air (at GP11) and 150 Pa for the exhaust air at (GP12). When the dew point temperature is 1 °C lower than the return temperature of the chilled water from the chilled beams the AHU operates with mixed air to dehumidify the air. Night time ventilation is allowed when the indoor air temperature exceeds 22 ˚C and the outdoor temperature is 3 ˚C lower than the indoor temperature.
Figure 6.7 Principle schematic of one of the six AHUs.
76
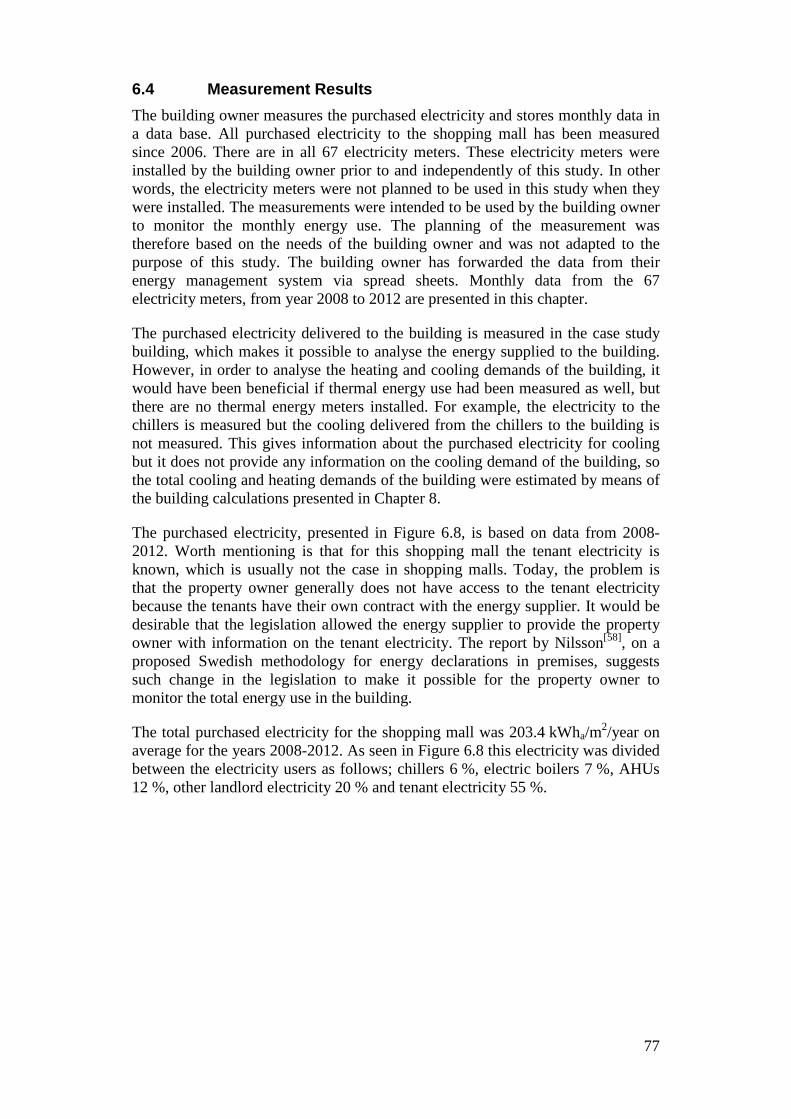
6.4 Measurement Results The building owner measures the purchased electricity and stores monthly data in a data base. All purchased electricity to the shopping mall has been measured since 2006. There are in all 67 electricity meters. These electricity meters were installed by the building owner prior to and independently of this study. In other words, the electricity meters were not planned to be used in this study when they were installed. The measurements were intended to be used by the building owner to monitor the monthly energy use. The planning of the measurement was therefore based on the needs of the building owner and was not adapted to the purpose of this study. The building owner has forwarded the data from their energy management system via spread sheets. Monthly data from the 67 electricity meters, from year 2008 to 2012 are presented in this chapter.
The purchased electricity delivered to the building is measured in the case study building, which makes it possible to analyse the energy supplied to the building. However, in order to analyse the heating and cooling demands of the building, it would have been beneficial if thermal energy use had been measured as well, but there are no thermal energy meters installed. For example, the electricity to the chillers is measured but the cooling delivered from the chillers to the building is not measured. This gives information about the purchased electricity for cooling but it does not provide any information on the cooling demand of the building, so the total cooling and heating demands of the building were estimated by means of the building calculations presented in Chapter 8.
The purchased electricity, presented in Figure 6.8, is based on data from 2008-2012. Worth mentioning is that for this shopping mall the tenant electricity is known, which is usually not the case in shopping malls. Today, the problem is that the property owner generally does not have access to the tenant electricity because the tenants have their own contract with the energy supplier. It would be desirable that the legislation allowed the energy supplier to provide the property owner with information on the tenant electricity. The report by Nilsson[58], on a proposed Swedish methodology for energy declarations in premises, suggests such change in the legislation to make it possible for the property owner to monitor the total energy use in the building.
The total purchased electricity for the shopping mall was 203.4 kWha/m2/year on average for the years 2008-2012. As seen in Figure 6.8 this electricity was divided between the electricity users as follows; chillers 6 %, electric boilers 7 %, AHUs 12 %, other landlord electricity 20 % and tenant electricity 55 %.
77
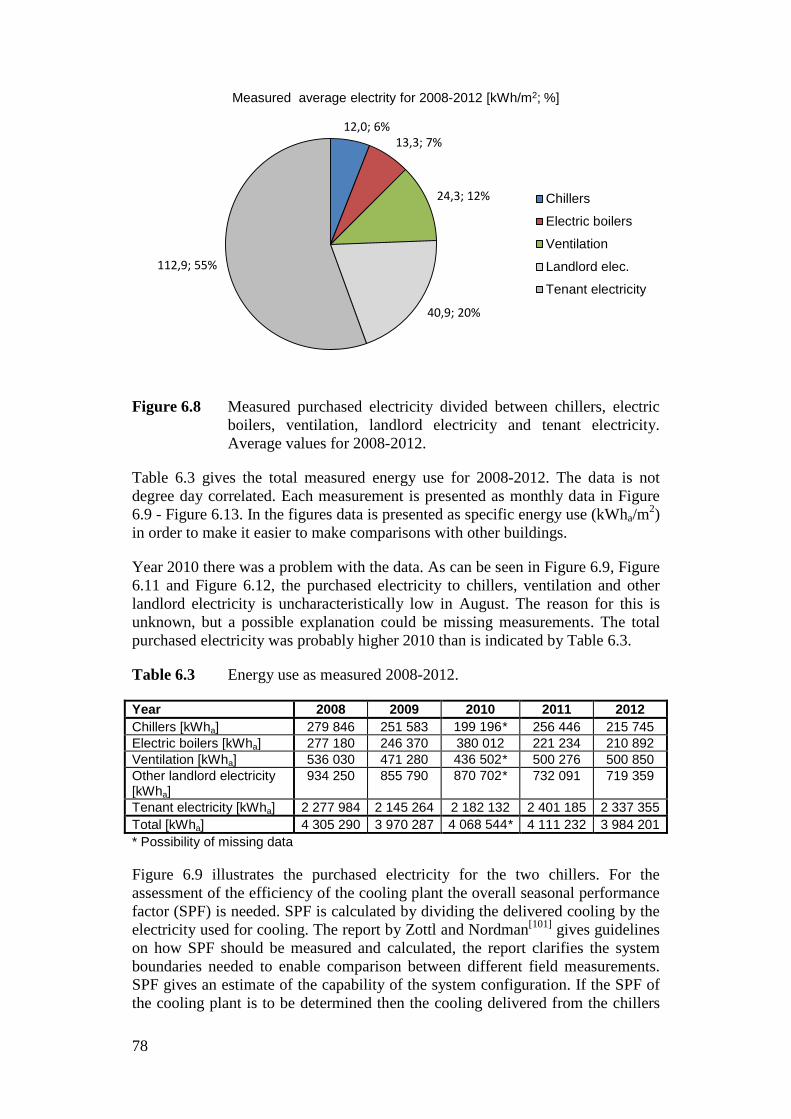
Figure 6.8 Measured purchased electricity divided between chillers, electric boilers, ventilation, landlord electricity and tenant electricity. Average values for 2008-2012.
Table 6.3 gives the total measured energy use for 2008-2012. The data is not degree day correlated. Each measurement is presented as monthly data in Figure 6.9 - Figure 6.13. In the figures data is presented as specific energy use (kWha/m2) in order to make it easier to make comparisons with other buildings.
Year 2010 there was a problem with the data. As can be seen in Figure 6.9, Figure 6.11 and Figure 6.12, the purchased electricity to chillers, ventilation and other landlord electricity is uncharacteristically low in August. The reason for this is unknown, but a possible explanation could be missing measurements. The total purchased electricity was probably higher 2010 than is indicated by Table 6.3.
Table 6.3 Energy use as measured 2008-2012.
Year 2008 2009 2010 2011 2012 Chillers [kWha] 279 846 251 583 199 196* 256 446 215 745 Electric boilers [kWha] 277 180 246 370 380 012 221 234 210 892 Ventilation [kWha] 536 030 471 280 436 502* 500 276 500 850 Other landlord electricity [kWha]
934 250 855 790 870 702* 732 091 719 359
Tenant electricity [kWha] 2 277 984 2 145 264 2 182 132 2 401 185 2 337 355 Total [kWha] 4 305 290 3 970 287 4 068 544* 4 111 232 3 984 201 * Possibility of missing data
Figure 6.9 illustrates the purchased electricity for the two chillers. For the assessment of the efficiency of the cooling plant the overall seasonal performance factor (SPF) is needed. SPF is calculated by dividing the delivered cooling by the electricity used for cooling. The report by Zottl and Nordman[101] gives guidelines on how SPF should be measured and calculated, the report clarifies the system boundaries needed to enable comparison between different field measurements. SPF gives an estimate of the capability of the system configuration. If the SPF of the cooling plant is to be determined then the cooling delivered from the chillers
12,0; 6% 13,3; 7%
24,3; 12%
40,9; 20%
112,9; 55%
Measured average electrity for 2008-2012 [kWh/m2; %]
Chillers
Electric boilers
Ventilation
Landlord elec.
Tenant electricity
78
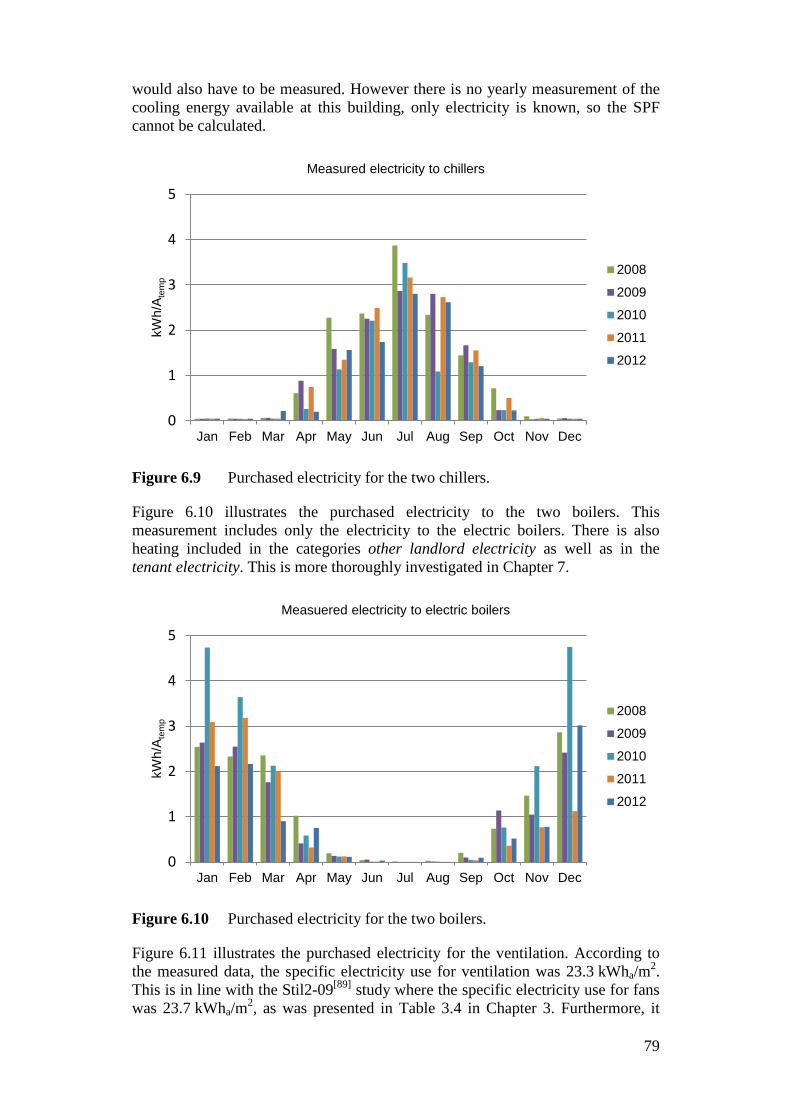
would also have to be measured. However there is no yearly measurement of the cooling energy available at this building, only electricity is known, so the SPF cannot be calculated.
Figure 6.9 Purchased electricity for the two chillers.
Figure 6.10 illustrates the purchased electricity to the two boilers. This measurement includes only the electricity to the electric boilers. There is also heating included in the categories other landlord electricity as well as in the tenant electricity. This is more thoroughly investigated in Chapter 7.
Figure 6.10 Purchased electricity for the two boilers.
Figure 6.11 illustrates the purchased electricity for the ventilation. According to the measured data, the specific electricity use for ventilation was 23.3 kWha/m2. This is in line with the Stil2-09[89] study where the specific electricity use for fans was 23.7 kWha/m2, as was presented in Table 3.4 in Chapter 3. Furthermore, it
0
1
2
3
4
5
Jan Feb Mar Apr May Jun Jul Aug Sep Oct Nov Dec
kWh/
A tem
p Measured electricity to chillers
2008
2009
2010
2011
2012
0
1
2
3
4
5
Jan Feb Mar Apr May Jun Jul Aug Sep Oct Nov Dec
kWh/
A tem
p
Measuered electricity to electric boilers
2008
2009
2010
2011
2012
79
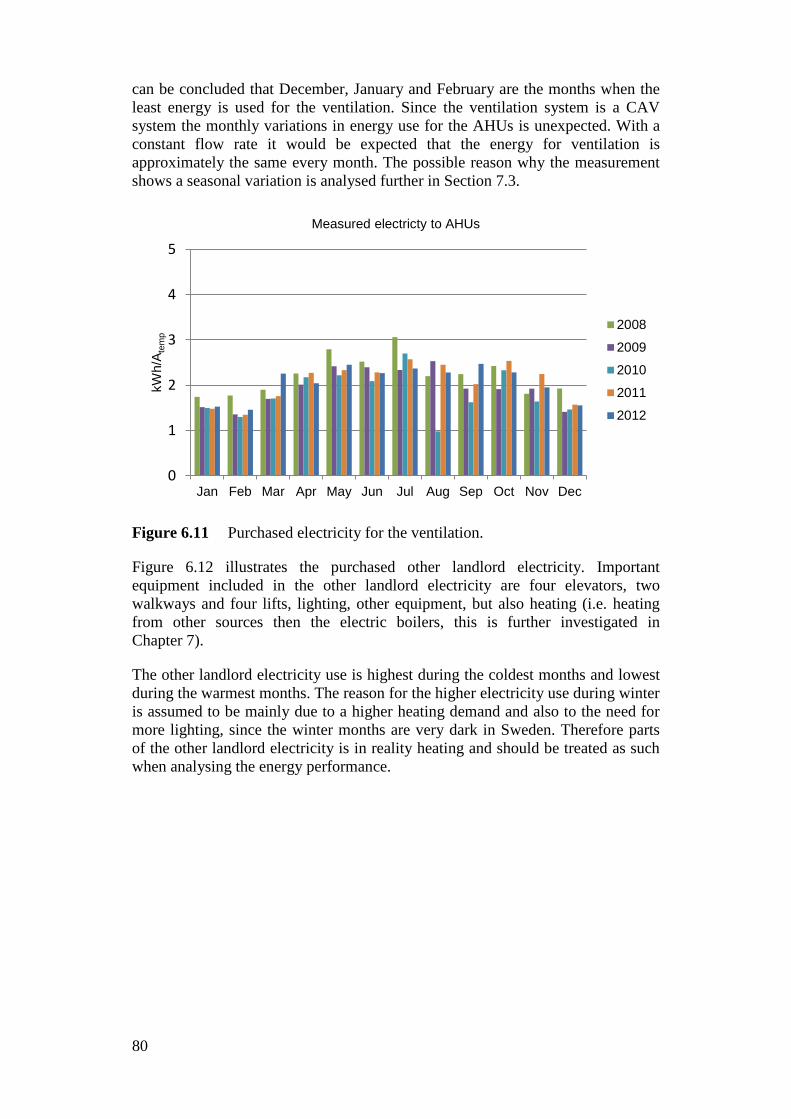
can be concluded that December, January and February are the months when the least energy is used for the ventilation. Since the ventilation system is a CAV system the monthly variations in energy use for the AHUs is unexpected. With a constant flow rate it would be expected that the energy for ventilation is approximately the same every month. The possible reason why the measurement shows a seasonal variation is analysed further in Section 7.3.
Figure 6.11 Purchased electricity for the ventilation.
Figure 6.12 illustrates the purchased other landlord electricity. Important equipment included in the other landlord electricity are four elevators, two walkways and four lifts, lighting, other equipment, but also heating (i.e. heating from other sources then the electric boilers, this is further investigated in Chapter 7).
The other landlord electricity use is highest during the coldest months and lowest during the warmest months. The reason for the higher electricity use during winter is assumed to be mainly due to a higher heating demand and also to the need for more lighting, since the winter months are very dark in Sweden. Therefore parts of the other landlord electricity is in reality heating and should be treated as such when analysing the energy performance.
0
1
2
3
4
5
Jan Feb Mar Apr May Jun Jul Aug Sep Oct Nov Dec
kWh/
A tem
p
Measured electricty to AHUs
2008
2009
2010
2011
2012
80
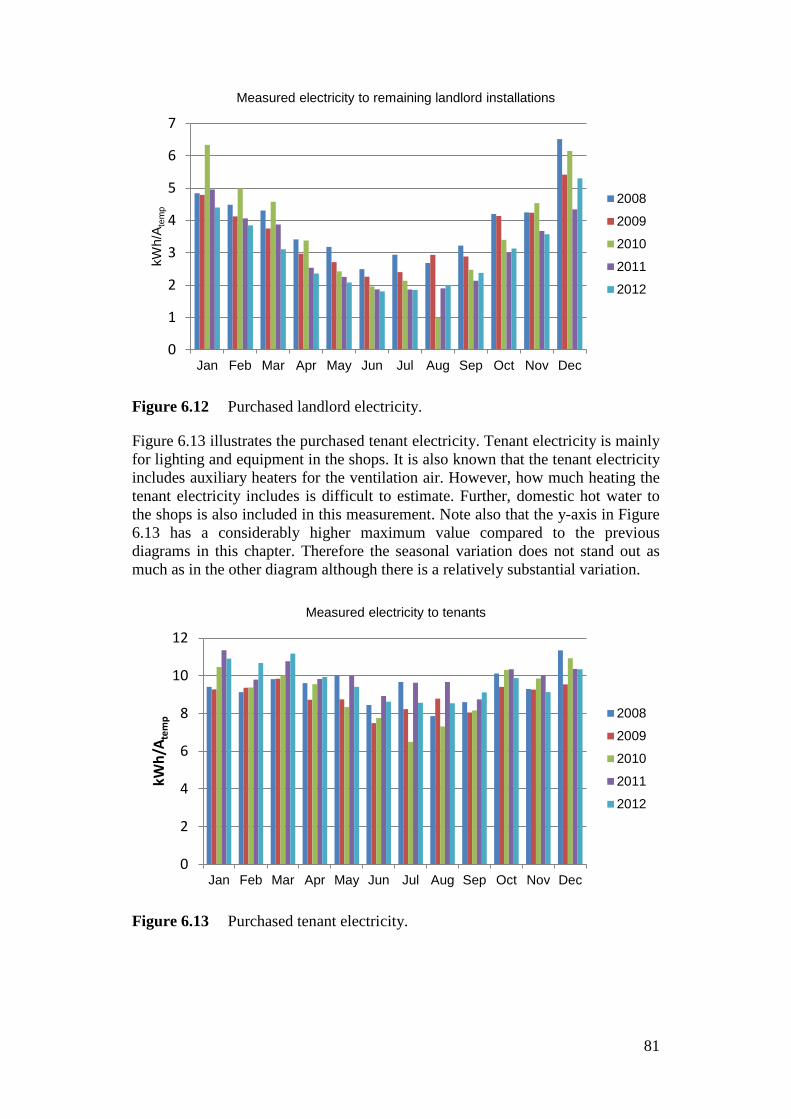
Figure 6.12 Purchased landlord electricity.
Figure 6.13 illustrates the purchased tenant electricity. Tenant electricity is mainly for lighting and equipment in the shops. It is also known that the tenant electricity includes auxiliary heaters for the ventilation air. However, how much heating the tenant electricity includes is difficult to estimate. Further, domestic hot water to the shops is also included in this measurement. Note also that the y-axis in Figure 6.13 has a considerably higher maximum value compared to the previous diagrams in this chapter. Therefore the seasonal variation does not stand out as much as in the other diagram although there is a relatively substantial variation.
Figure 6.13 Purchased tenant electricity.
0
1
2
3
4
5
6
7
Jan Feb Mar Apr May Jun Jul Aug Sep Oct Nov Dec
kWh/
A tem
p
Measured electricity to remaining landlord installations
2008
2009
2010
2011
2012
0
2
4
6
8
10
12
Jan Feb Mar Apr May Jun Jul Aug Sep Oct Nov Dec
kWh/
A tem
p
Measured electricity to tenants
2008
2009
2010
2011
2012
81
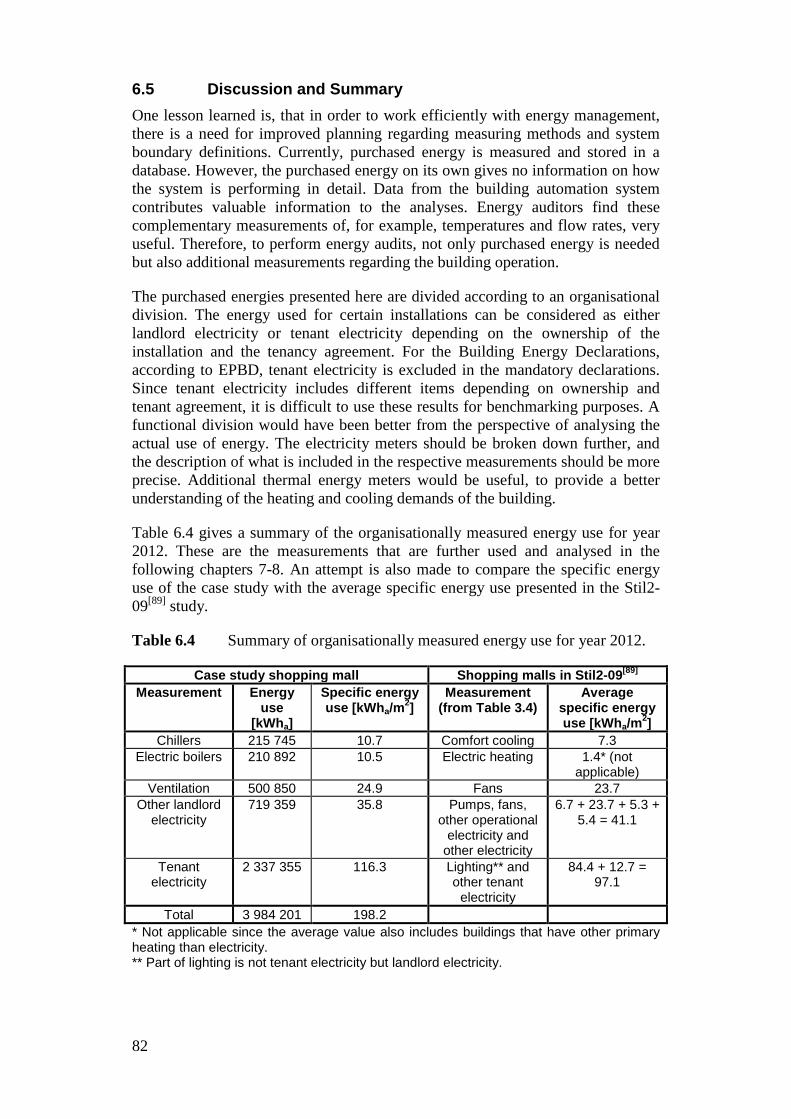
6.5 Discussion and Summary One lesson learned is, that in order to work efficiently with energy management, there is a need for improved planning regarding measuring methods and system boundary definitions. Currently, purchased energy is measured and stored in a database. However, the purchased energy on its own gives no information on how the system is performing in detail. Data from the building automation system contributes valuable information to the analyses. Energy auditors find these complementary measurements of, for example, temperatures and flow rates, very useful. Therefore, to perform energy audits, not only purchased energy is needed but also additional measurements regarding the building operation.
The purchased energies presented here are divided according to an organisational division. The energy used for certain installations can be considered as either landlord electricity or tenant electricity depending on the ownership of the installation and the tenancy agreement. For the Building Energy Declarations, according to EPBD, tenant electricity is excluded in the mandatory declarations. Since tenant electricity includes different items depending on ownership and tenant agreement, it is difficult to use these results for benchmarking purposes. A functional division would have been better from the perspective of analysing the actual use of energy. The electricity meters should be broken down further, and the description of what is included in the respective measurements should be more precise. Additional thermal energy meters would be useful, to provide a better understanding of the heating and cooling demands of the building.
Table 6.4 gives a summary of the organisationally measured energy use for year 2012. These are the measurements that are further used and analysed in the following chapters 7-8. An attempt is also made to compare the specific energy use of the case study with the average specific energy use presented in the Stil2-09[89] study.
Table 6.4 Summary of organisationally measured energy use for year 2012.
Case study shopping mall Shopping malls in Stil2-09[89] Measurement Energy
use [kWha]
Specific energy use [kWha/m2]
Measurement (from Table 3.4)
Average specific energy use [kWha/m2]
Chillers 215 745 10.7 Comfort cooling 7.3 Electric boilers 210 892 10.5 Electric heating 1.4* (not
applicable) Ventilation 500 850 24.9 Fans 23.7
Other landlord electricity
719 359 35.8 Pumps, fans, other operational
electricity and other electricity
6.7 + 23.7 + 5.3 + 5.4 = 41.1
Tenant electricity
2 337 355 116.3 Lighting** and other tenant
electricity
84.4 + 12.7 = 97.1
Total 3 984 201 198.2 * Not applicable since the average value also includes buildings that have other primary heating than electricity. ** Part of lighting is not tenant electricity but landlord electricity.
82
If the energy use for chillers in the case study is compared with the average energy use for comfort cooling then it appears that the case study building is using more energy for cooling than the average shopping mall.
The comparison between electric boilers and the average electric heating is not really representative since district heating is a common source for heating in shopping malls. An average value for shopping malls that are solely heated by electricity is not available in the Stil2-09[89] study.
Comparison between the energy for ventilation and the average energy use for fans shows a very similar result, 24.9 kWha/m2 and 23.7 kWha/m2, respectively.
It is not immediately obvious how other landlord electricity should be compared with Stil2-09[89]. The other landlord electricity in the case study building was 35.8 kWha/m2. This is lower than the average energy used for pumps, fans, other operational electricity and other electricity, which has an average specific energy use of 41.1 kWha/m2.
The tenant electricity, of 116 kWha/m2, in the case study shopping mall appears to be higher than average. The average energy use for lighting and other tenant electricity was 97.1 kWha/m2. It should be noted that part of the lighting was provided by the landlord, so the tenant electricity should in reality be compared to a value lower than 97.1 kWha/m2.
The data in Table 6.4 is further broken down into which function it is used for in the following chapter, Chapter 7. The results here can be compared with the more detailed results presented in Table 7.11.
83

7 ESTIMATED ENERGY USE How is the measured energy allocated between different functions in the building? The measured data presented in the previous chapter is not detailed enough for the purpose of this study. The measured data have therefore been further analysed in order to estimate how the energy is allocated between different functions in the building. This allocation is needed to enable a comparison between the measured data and the calculation results presented in Chapter 8. The allocation method is thoroughly discussed in this chapter. The discussions also include and handle shortcomings concerning equipment documentation and system boundaries. The building owner and the operating staff were closely involved in estimating the energy allocation, both giving input and taking part in discussions and verifying the plausibility of the results. The final result presented in this chapter is the result of an iterative process of estimating the allocation of different energy use and then comparing the estimation with calculated results. The methodology is visualised in Figure 6.1 in Chapter 6.
It is the 2012 data from previous chapter that has been used throughout this whole chapter. When analysing the measured data it appeared that there was actually more heating and cooling supplied to the building than the measurements first indicated. It was realised that the measured other landlord electricity and the tenant electricity also included “hidden” energy for heating. Furthermore, the measured electricity for ventilation also included “hidden” energy for cooling. This chapter is therefore structured in the following way. It starts with the analysis of the other landlord electricity, tenant electricity and ventilation, to identify the “hidden” heating and cooling energy within these measurements. Thereafter, it continues by analysing the total heating and cooling of the building. It concludes with a summary and discussion of the measured and estimated energy.
7.1 Landlord Electricity This section shows how the measured other landlord electricity is divided between the functions: heating, lighting (outdoors, indoors and garage), neon signs, as well as escalators, walkways, elevators and rotating doors. Other landlord electricity refers in this case to the landlord electricity not used for heating, cooling or ventilation. The measured other landlord electricity in year 2012 was approximately 720 000 kWha, and Figure 7.1 shows the monthly distribution. As seen in Figure 7.1 more energy was used during the winter months than during the summer months, in other words there were seasonal variations. This is partly explained by higher use of lighting during the darker months and partly because there is more use of heating. The heating in the other landlord electricity includes radiators and air curtains.
85
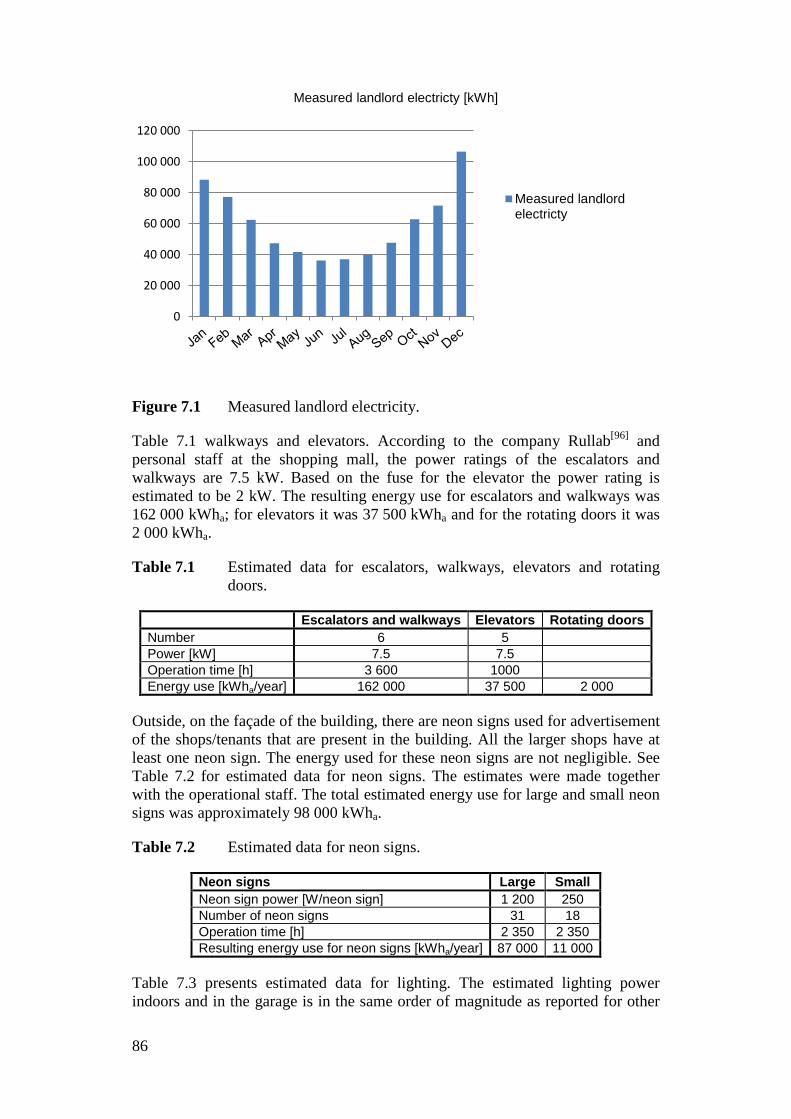
Figure 7.1 Measured landlord electricity.
Table 7.1 walkways and elevators. According to the company Rullab[96] and personal staff at the shopping mall, the power ratings of the escalators and walkways are 7.5 kW. Based on the fuse for the elevator the power rating is estimated to be 2 kW. The resulting energy use for escalators and walkways was 162 000 kWha; for elevators it was 37 500 kWha and for the rotating doors it was 2 000 kWha.
Table 7.1 Estimated data for escalators, walkways, elevators and rotating doors.
Escalators and walkways Elevators Rotating doors Number 6 5 Power [kW] 7.5 7.5 Operation time [h] 3 600 1000 Energy use [kWha/year] 162 000 37 500 2 000
Outside, on the façade of the building, there are neon signs used for advertisement of the shops/tenants that are present in the building. All the larger shops have at least one neon sign. The energy used for these neon signs are not negligible. See Table 7.2 for estimated data for neon signs. The estimates were made together with the operational staff. The total estimated energy use for large and small neon signs was approximately 98 000 kWha.
Table 7.2 Estimated data for neon signs.
Neon signs Large Small Neon sign power [W/neon sign] 1 200 250 Number of neon signs 31 18 Operation time [h] 2 350 2 350 Resulting energy use for neon signs [kWha/year] 87 000 11 000
Table 7.3 presents estimated data for lighting. The estimated lighting power indoors and in the garage is in the same order of magnitude as reported for other
0
20 000
40 000
60 000
80 000
100 000
120 000
Measured landlord electricty [kWh]
Measured landlordelectricty
86
shopping malls according to the Stil2-09[89] study. The resulting energy use for lighting indoors was 160 000 kWha and for the garage it was 45 000 kWha. Outdoor lighting was known from a separate measurement to have used 25 000 kWha.
Table 7.3 Estimated data for the lighting from the other landlord electricity.
Lighting Indoor Garage Outdoor Average lighting power [W/m2] 10 5 Operation time [h] 4 000 3 000 Area [m2] 4 000 3 000 Resulting energy use for lighting [kWha] 160 000 45 000 25 000
The remaining part of the other landlord electricity which has not been allocated to a certain function is assumed to be heating. The estimated heating from other landlord electricity is therefore 190 000 kWha. Based on the discussion above the resulting allocation of the other landlord electricity would be as presented in Table 7.4.
Table 7.4 Resulting allocation of the other landlord electricity based on estimations.
Energy [kWha] Heating 190 000 Lighting outdoors 25 000 Lighting indoors 160 000 Lighting in garage 45 000 Neon signs 98 000 Escalators, walkways, elevators and rotating doors 202 000 Total 719 000
Figure 7.2 illustrates the estimated allocation of the other landlord electricity. As can be seen in the figure the energy for escalators, walkways, elevators and rotating doors is assumed to be equal throughout the whole year. Further it is estimated that there is no need for heating during the hottest summer month. Of the energy that is due to seasonal variations approximately 2/3 is due to “hidden” heating and 1/3 to lighting during the colder and darker part of the year. “Hidden” heating is heating included in the landlord electricity measure. It is estimated based on the yearly profile of energy use illustrated in Figure 7.2.
87
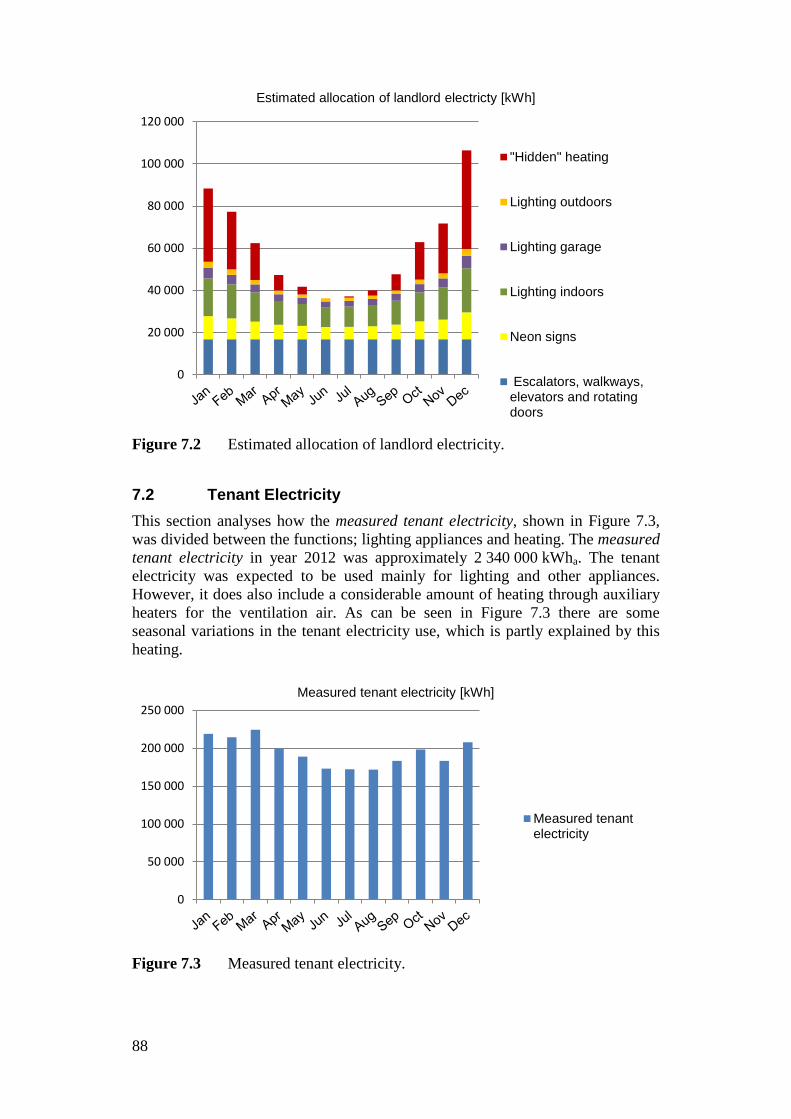
Figure 7.2 Estimated allocation of landlord electricity.
7.2 Tenant Electricity This section analyses how the measured tenant electricity, shown in Figure 7.3, was divided between the functions; lighting appliances and heating. The measured tenant electricity in year 2012 was approximately 2 340 000 kWha. The tenant electricity was expected to be used mainly for lighting and other appliances. However, it does also include a considerable amount of heating through auxiliary heaters for the ventilation air. As can be seen in Figure 7.3 there are some seasonal variations in the tenant electricity use, which is partly explained by this heating.
Figure 7.3 Measured tenant electricity.
0
20 000
40 000
60 000
80 000
100 000
120 000
Estimated allocation of landlord electricty [kWh]
"Hidden" heating
Lighting outdoors
Lighting garage
Lighting indoors
Neon signs
Escalators, walkways,elevators and rotatingdoors
0
50 000
100 000
150 000
200 000
250 000Measured tenant electricity [kWh]
Measured tenantelectricity
88
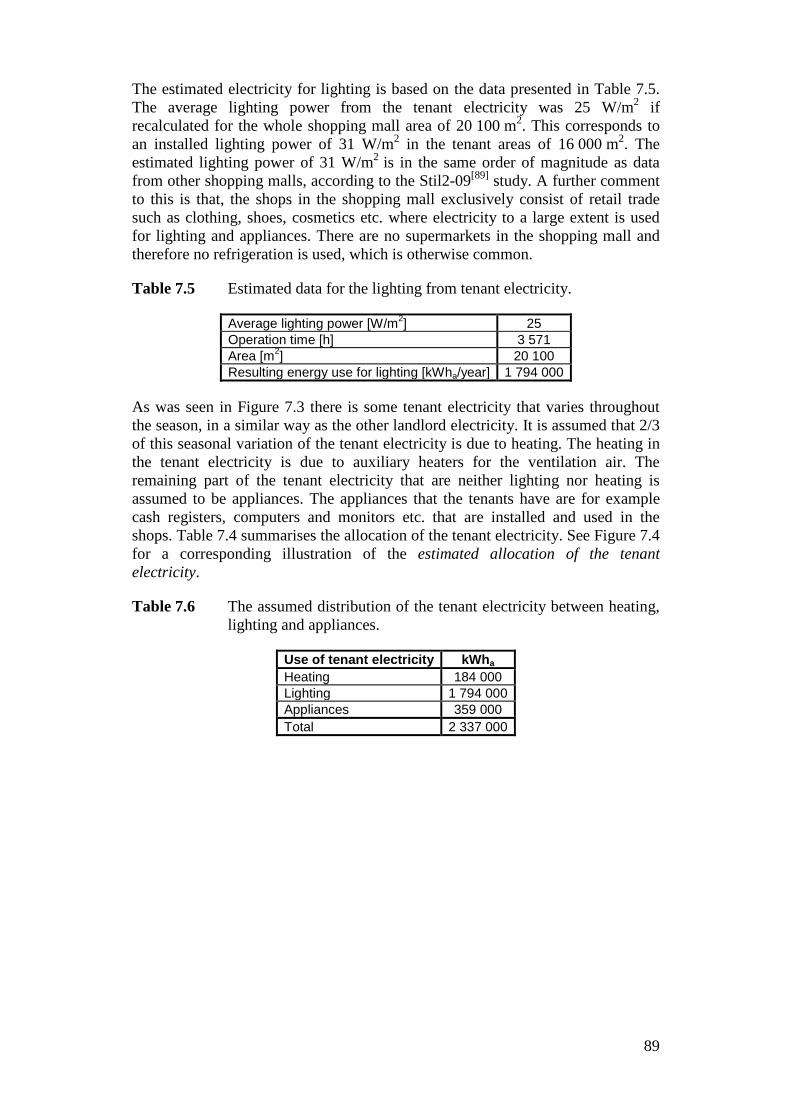
The estimated electricity for lighting is based on the data presented in Table 7.5. The average lighting power from the tenant electricity was 25 W/m2 if recalculated for the whole shopping mall area of 20 100 m2. This corresponds to an installed lighting power of 31 W/m2 in the tenant areas of 16 000 m2. The estimated lighting power of 31 W/m2 is in the same order of magnitude as data from other shopping malls, according to the Stil2-09[89] study. A further comment to this is that, the shops in the shopping mall exclusively consist of retail trade such as clothing, shoes, cosmetics etc. where electricity to a large extent is used for lighting and appliances. There are no supermarkets in the shopping mall and therefore no refrigeration is used, which is otherwise common.
Table 7.5 Estimated data for the lighting from tenant electricity.
Average lighting power [W/m2] 25 Operation time [h] 3 571 Area [m2] 20 100 Resulting energy use for lighting [kWha/year] 1 794 000
As was seen in Figure 7.3 there is some tenant electricity that varies throughout the season, in a similar way as the other landlord electricity. It is assumed that 2/3 of this seasonal variation of the tenant electricity is due to heating. The heating in the tenant electricity is due to auxiliary heaters for the ventilation air. The remaining part of the tenant electricity that are neither lighting nor heating is assumed to be appliances. The appliances that the tenants have are for example cash registers, computers and monitors etc. that are installed and used in the shops. Table 7.4 summarises the allocation of the tenant electricity. See Figure 7.4 for a corresponding illustration of the estimated allocation of the tenant electricity.
Table 7.6 The assumed distribution of the tenant electricity between heating, lighting and appliances.
Use of tenant electricity kWha Heating 184 000 Lighting 1 794 000 Appliances 359 000 Total 2 337 000
89
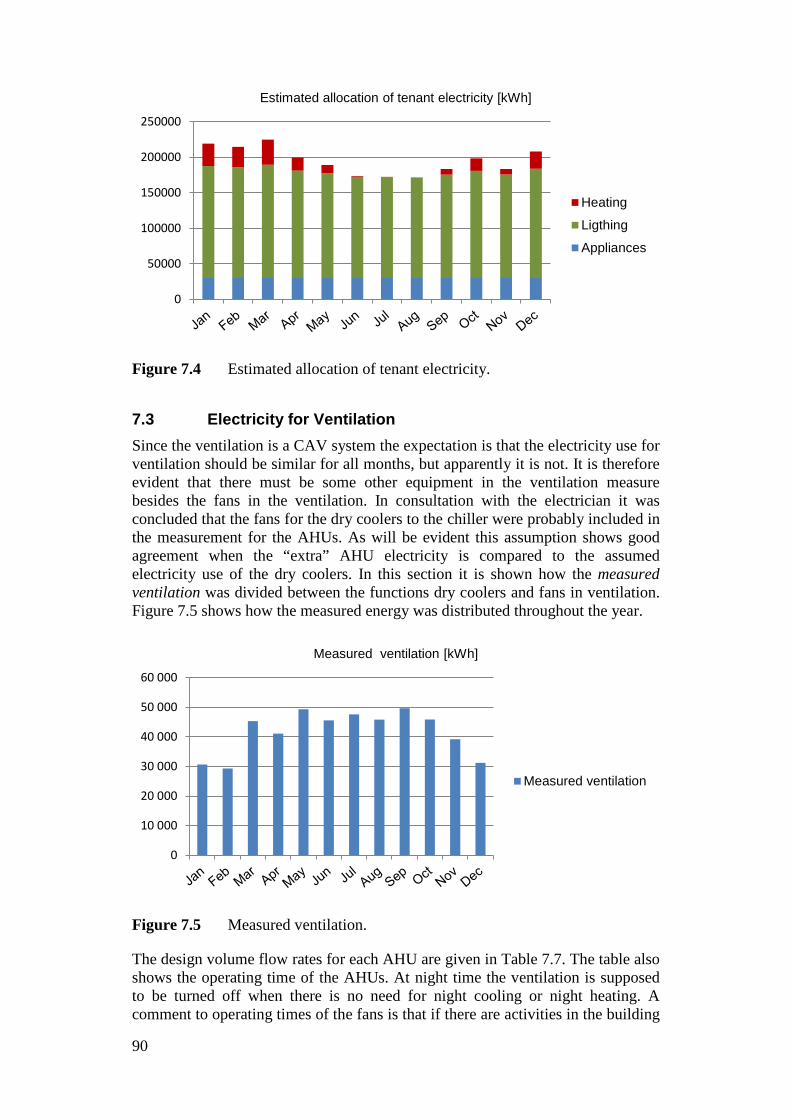
Figure 7.4 Estimated allocation of tenant electricity.
7.3 Electricity for Ventilation Since the ventilation is a CAV system the expectation is that the electricity use for ventilation should be similar for all months, but apparently it is not. It is therefore evident that there must be some other equipment in the ventilation measure besides the fans in the ventilation. In consultation with the electrician it was concluded that the fans for the dry coolers to the chiller were probably included in the measurement for the AHUs. As will be evident this assumption shows good agreement when the “extra” AHU electricity is compared to the assumed electricity use of the dry coolers. In this section it is shown how the measured ventilation was divided between the functions dry coolers and fans in ventilation. Figure 7.5 shows how the measured energy was distributed throughout the year.
Figure 7.5 Measured ventilation.
The design volume flow rates for each AHU are given in Table 7.7. The table also shows the operating time of the AHUs. At night time the ventilation is supposed to be turned off when there is no need for night cooling or night heating. A comment to operating times of the fans is that if there are activities in the building
0
50000
100000
150000
200000
250000
Estimated allocation of tenant electricity [kWh]
Heating
Ligthing
Appliances
0
10 000
20 000
30 000
40 000
50 000
60 000
Measured ventilation [kWh]
Measured ventilation
90
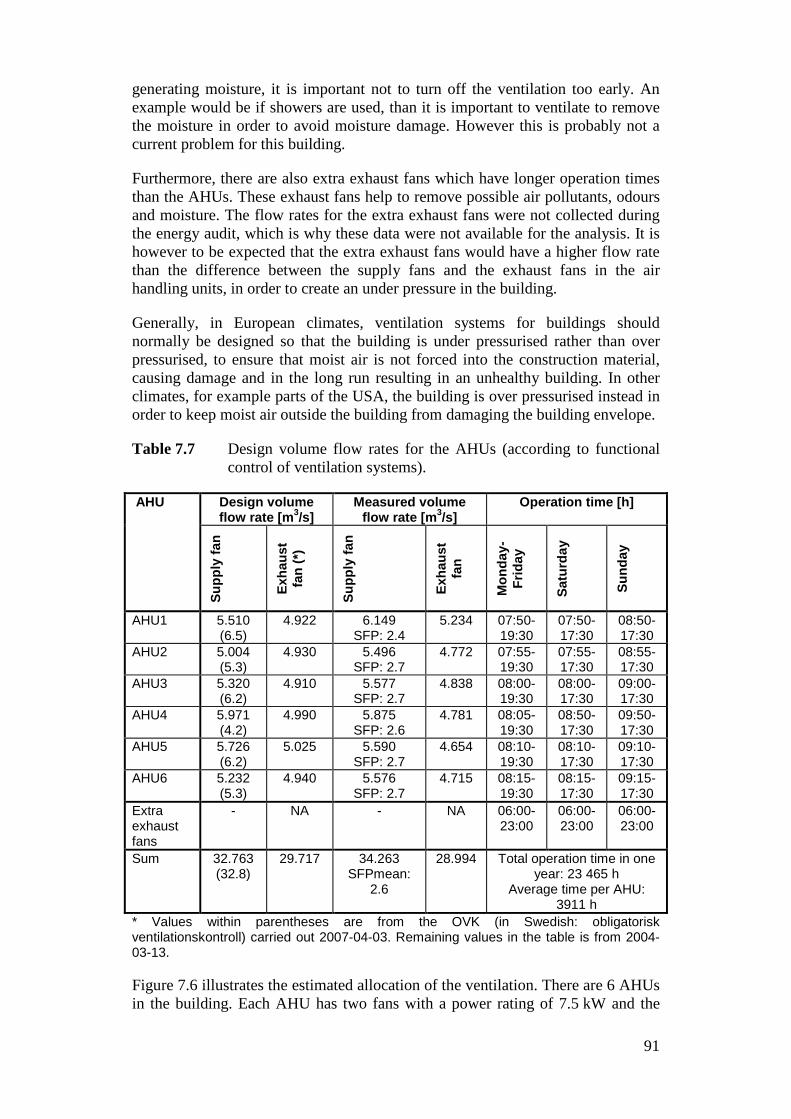
generating moisture, it is important not to turn off the ventilation too early. An example would be if showers are used, than it is important to ventilate to remove the moisture in order to avoid moisture damage. However this is probably not a current problem for this building.
Furthermore, there are also extra exhaust fans which have longer operation times than the AHUs. These exhaust fans help to remove possible air pollutants, odours and moisture. The flow rates for the extra exhaust fans were not collected during the energy audit, which is why these data were not available for the analysis. It is however to be expected that the extra exhaust fans would have a higher flow rate than the difference between the supply fans and the exhaust fans in the air handling units, in order to create an under pressure in the building.
Generally, in European climates, ventilation systems for buildings should normally be designed so that the building is under pressurised rather than over pressurised, to ensure that moist air is not forced into the construction material, causing damage and in the long run resulting in an unhealthy building. In other climates, for example parts of the USA, the building is over pressurised instead in order to keep moist air outside the building from damaging the building envelope.
Table 7.7 Design volume flow rates for the AHUs (according to functional control of ventilation systems).
AHU Design volume flow rate [m3/s]
Measured volume flow rate [m3/s]
Operation time [h]
Supp
ly fa
n
Exha
ust
fan
(*)
Supp
ly fa
n
Exha
ust
fan
Mon
day-
Frid
ay
Satu
rday
Sund
ay
AHU1 5.510 (6.5)
4.922
6.149 SFP: 2.4
5.234 07:50-19:30
07:50-17:30
08:50-17:30
AHU2 5.004 (5.3)
4.930
5.496 SFP: 2.7
4.772 07:55-19:30
07:55-17:30
08:55-17:30
AHU3 5.320 (6.2)
4.910
5.577 SFP: 2.7
4.838 08:00-19:30
08:00-17:30
09:00-17:30
AHU4 5.971 (4.2)
4.990
5.875 SFP: 2.6
4.781 08:05-19:30
08:50-17:30
09:50-17:30
AHU5 5.726 (6.2)
5.025
5.590 SFP: 2.7
4.654 08:10-19:30
08:10-17:30
09:10-17:30
AHU6 5.232 (5.3)
4.940
5.576 SFP: 2.7
4.715 08:15-19:30
08:15-17:30
09:15-17:30
Extra exhaust fans
- NA - NA 06:00-23:00
06:00-23:00
06:00-23:00
Sum 32.763 (32.8)
29.717 34.263 SFPmean:
2.6
28.994 Total operation time in one year: 23 465 h
Average time per AHU: 3911 h
* Values within parentheses are from the OVK (in Swedish: obligatorisk ventilationskontroll) carried out 2007-04-03. Remaining values in the table is from 2004-03-13.
Figure 7.6 illustrates the estimated allocation of the ventilation. There are 6 AHUs in the building. Each AHU has two fans with a power rating of 7.5 kW and the
91
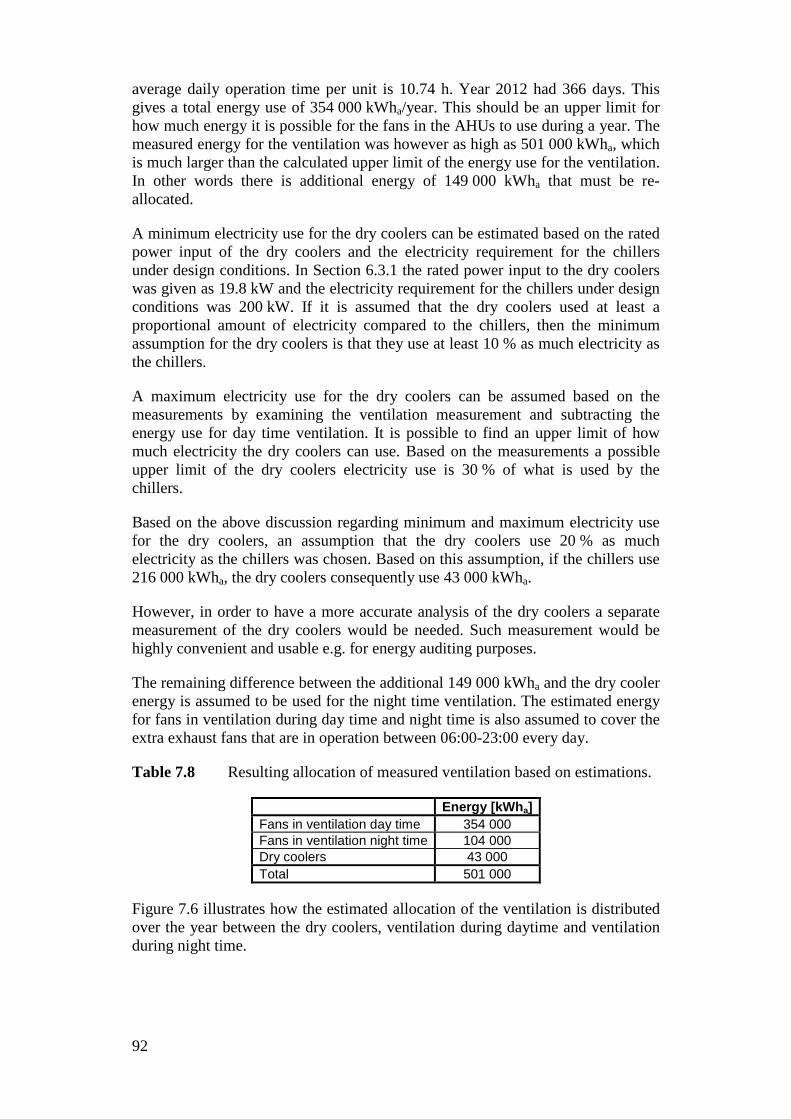
average daily operation time per unit is 10.74 h. Year 2012 had 366 days. This gives a total energy use of 354 000 kWha/year. This should be an upper limit for how much energy it is possible for the fans in the AHUs to use during a year. The measured energy for the ventilation was however as high as 501 000 kWha, which is much larger than the calculated upper limit of the energy use for the ventilation. In other words there is additional energy of 149 000 kWha that must be re-allocated.
A minimum electricity use for the dry coolers can be estimated based on the rated power input of the dry coolers and the electricity requirement for the chillers under design conditions. In Section 6.3.1 the rated power input to the dry coolers was given as 19.8 kW and the electricity requirement for the chillers under design conditions was 200 kW. If it is assumed that the dry coolers used at least a proportional amount of electricity compared to the chillers, then the minimum assumption for the dry coolers is that they use at least 10 % as much electricity as the chillers.
A maximum electricity use for the dry coolers can be assumed based on the measurements by examining the ventilation measurement and subtracting the energy use for day time ventilation. It is possible to find an upper limit of how much electricity the dry coolers can use. Based on the measurements a possible upper limit of the dry coolers electricity use is 30 % of what is used by the chillers.
Based on the above discussion regarding minimum and maximum electricity use for the dry coolers, an assumption that the dry coolers use 20 % as much electricity as the chillers was chosen. Based on this assumption, if the chillers use 216 000 kWha, the dry coolers consequently use 43 000 kWha.
However, in order to have a more accurate analysis of the dry coolers a separate measurement of the dry coolers would be needed. Such measurement would be highly convenient and usable e.g. for energy auditing purposes.
The remaining difference between the additional 149 000 kWha and the dry cooler energy is assumed to be used for the night time ventilation. The estimated energy for fans in ventilation during day time and night time is also assumed to cover the extra exhaust fans that are in operation between 06:00-23:00 every day.
Table 7.8 Resulting allocation of measured ventilation based on estimations.
Energy [kWha] Fans in ventilation day time 354 000 Fans in ventilation night time 104 000 Dry coolers 43 000 Total 501 000
Figure 7.6 illustrates how the estimated allocation of the ventilation is distributed over the year between the dry coolers, ventilation during daytime and ventilation during night time.
92
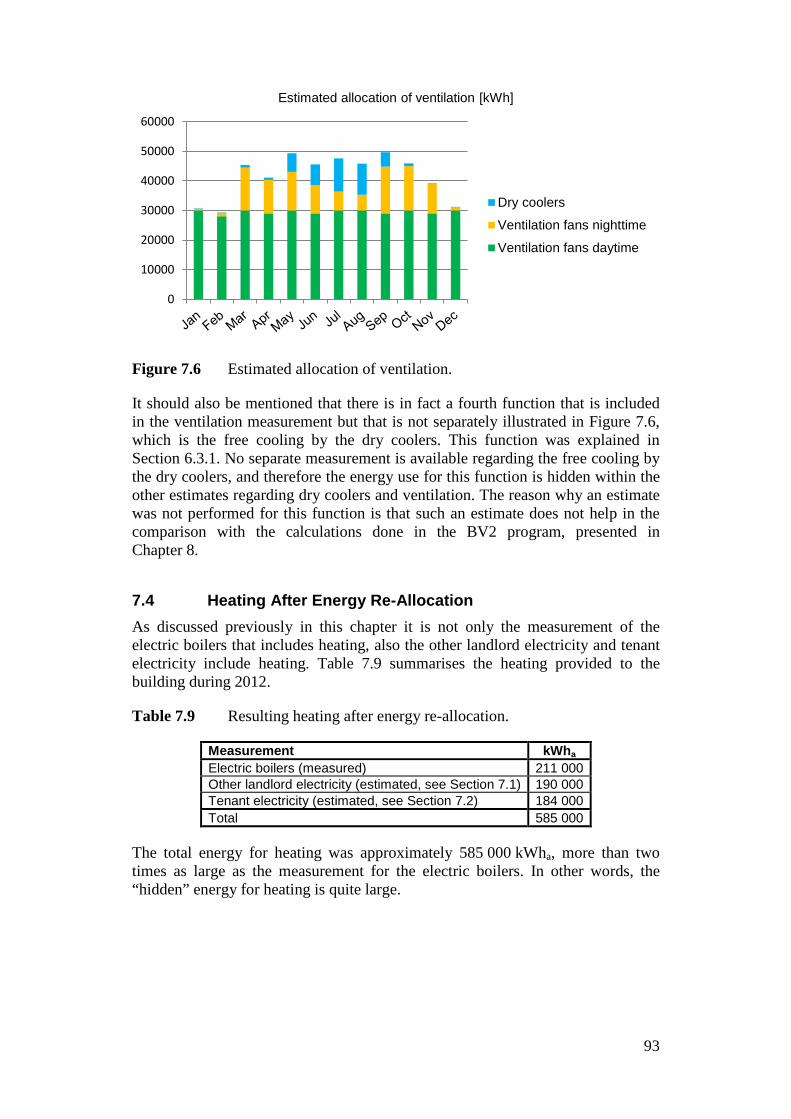
Figure 7.6 Estimated allocation of ventilation.
It should also be mentioned that there is in fact a fourth function that is included in the ventilation measurement but that is not separately illustrated in Figure 7.6, which is the free cooling by the dry coolers. This function was explained in Section 6.3.1. No separate measurement is available regarding the free cooling by the dry coolers, and therefore the energy use for this function is hidden within the other estimates regarding dry coolers and ventilation. The reason why an estimate was not performed for this function is that such an estimate does not help in the comparison with the calculations done in the BV2 program, presented in Chapter 8.
7.4 Heating After Energy Re-Allocation As discussed previously in this chapter it is not only the measurement of the electric boilers that includes heating, also the other landlord electricity and tenant electricity include heating. Table 7.9 summarises the heating provided to the building during 2012.
Table 7.9 Resulting heating after energy re-allocation.
Measurement kWha Electric boilers (measured) 211 000 Other landlord electricity (estimated, see Section 7.1) 190 000 Tenant electricity (estimated, see Section 7.2) 184 000 Total 585 000
The total energy for heating was approximately 585 000 kWha, more than two times as large as the measurement for the electric boilers. In other words, the “hidden” energy for heating is quite large.
0
10000
20000
30000
40000
50000
60000
Estimated allocation of ventilation [kWh]
Dry coolers
Ventilation fans nighttime
Ventilation fans daytime
93
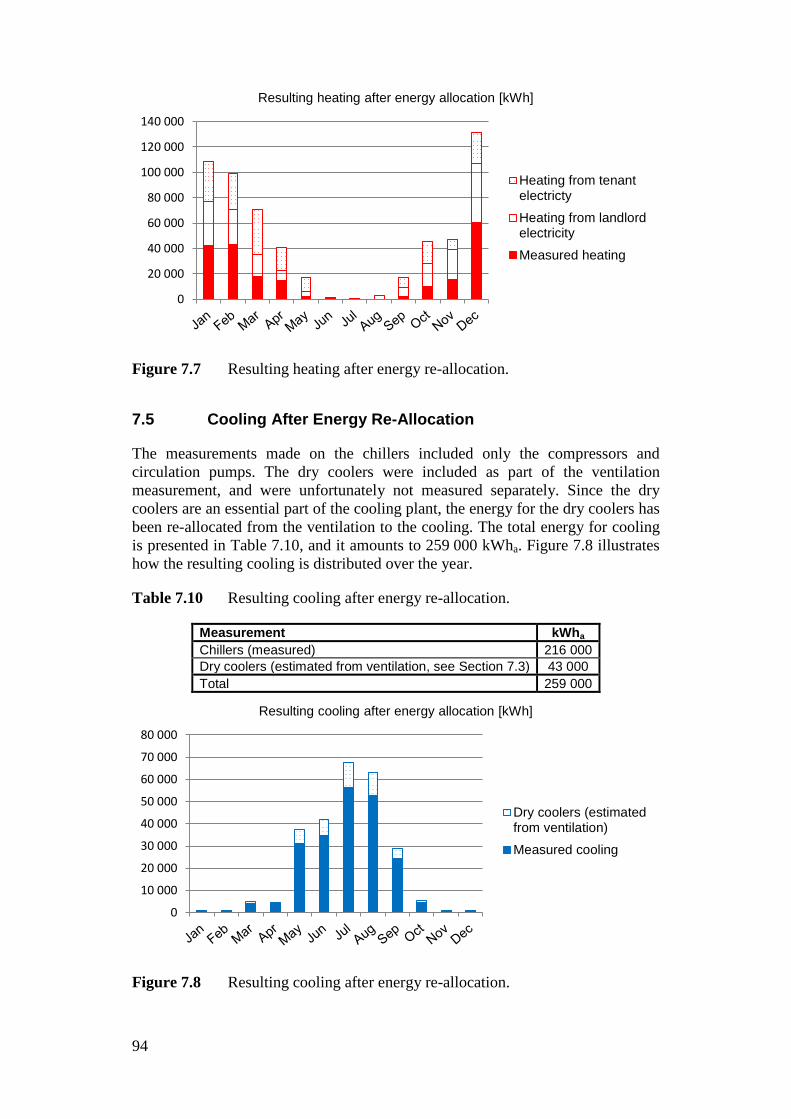
Figure 7.7 Resulting heating after energy re-allocation.
7.5 Cooling After Energy Re-Allocation
The measurements made on the chillers included only the compressors and circulation pumps. The dry coolers were included as part of the ventilation measurement, and were unfortunately not measured separately. Since the dry coolers are an essential part of the cooling plant, the energy for the dry coolers has been re-allocated from the ventilation to the cooling. The total energy for cooling is presented in Table 7.10, and it amounts to 259 000 kWha. Figure 7.8 illustrates how the resulting cooling is distributed over the year.
Table 7.10 Resulting cooling after energy re-allocation.
Measurement kWha Chillers (measured) 216 000 Dry coolers (estimated from ventilation, see Section 7.3) 43 000 Total 259 000
Figure 7.8 Resulting cooling after energy re-allocation.
0
20 000
40 000
60 000
80 000
100 000
120 000
140 000
Resulting heating after energy allocation [kWh]
Heating from tenantelectricty
Heating from landlordelectricity
Measured heating
0
10 000
20 000
30 000
40 000
50 000
60 000
70 000
80 000
Resulting cooling after energy allocation [kWh]
Dry coolers (estimatedfrom ventilation)
Measured cooling
94
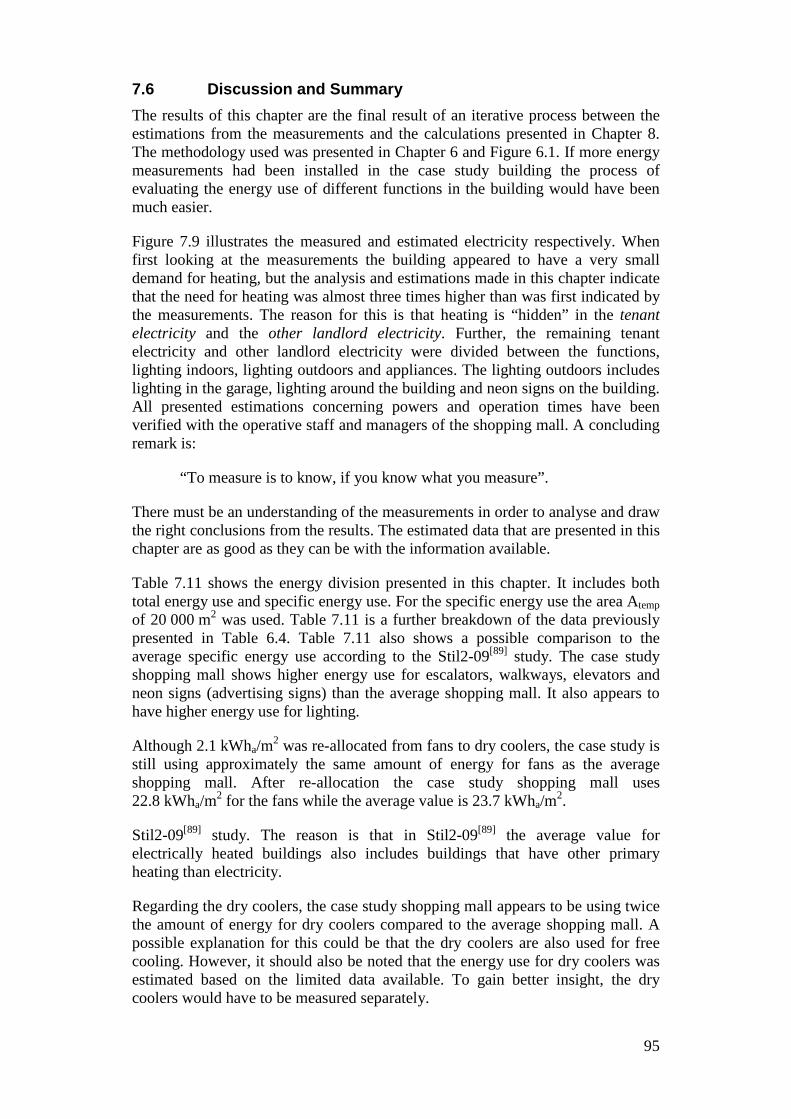
7.6 Discussion and Summary The results of this chapter are the final result of an iterative process between the estimations from the measurements and the calculations presented in Chapter 8. The methodology used was presented in Chapter 6 and Figure 6.1. If more energy measurements had been installed in the case study building the process of evaluating the energy use of different functions in the building would have been much easier.
Figure 7.9 illustrates the measured and estimated electricity respectively. When first looking at the measurements the building appeared to have a very small demand for heating, but the analysis and estimations made in this chapter indicate that the need for heating was almost three times higher than was first indicated by the measurements. The reason for this is that heating is “hidden” in the tenant electricity and the other landlord electricity. Further, the remaining tenant electricity and other landlord electricity were divided between the functions, lighting indoors, lighting outdoors and appliances. The lighting outdoors includes lighting in the garage, lighting around the building and neon signs on the building. All presented estimations concerning powers and operation times have been verified with the operative staff and managers of the shopping mall. A concluding remark is:
“To measure is to know, if you know what you measure”.
There must be an understanding of the measurements in order to analyse and draw the right conclusions from the results. The estimated data that are presented in this chapter are as good as they can be with the information available.
Table 7.11 shows the energy division presented in this chapter. It includes both total energy use and specific energy use. For the specific energy use the area Atemp of 20 000 m2 was used. Table 7.11 is a further breakdown of the data previously presented in Table 6.4. Table 7.11 also shows a possible comparison to the average specific energy use according to the Stil2-09[89] study. The case study shopping mall shows higher energy use for escalators, walkways, elevators and neon signs (advertising signs) than the average shopping mall. It also appears to have higher energy use for lighting.
Although 2.1 kWha/m2 was re-allocated from fans to dry coolers, the case study is still using approximately the same amount of energy for fans as the average shopping mall. After re-allocation the case study shopping mall uses 22.8 kWha/m2 for the fans while the average value is 23.7 kWha/m2.
Stil2-09[89] study. The reason is that in Stil2-09[89] the average value for electrically heated buildings also includes buildings that have other primary heating than electricity.
Regarding the dry coolers, the case study shopping mall appears to be using twice the amount of energy for dry coolers compared to the average shopping mall. A possible explanation for this could be that the dry coolers are also used for free cooling. However, it should also be noted that the energy use for dry coolers was estimated based on the limited data available. To gain better insight, the dry coolers would have to be measured separately.
95
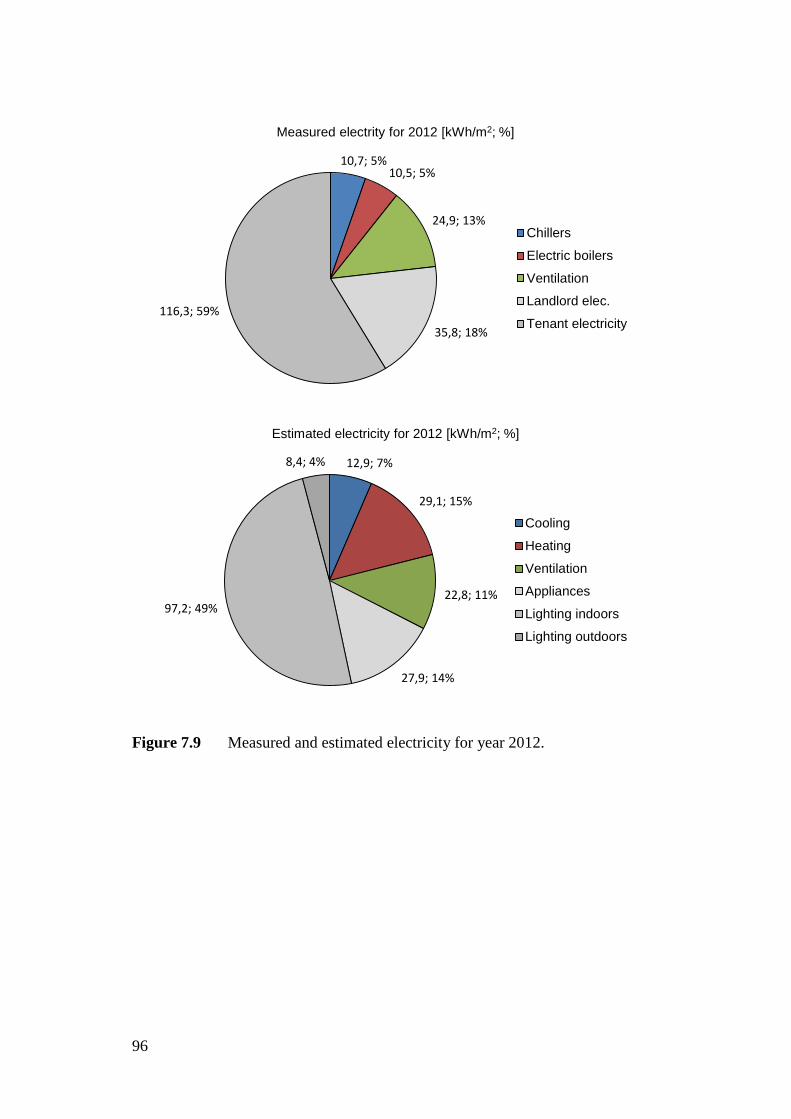
Figure 7.9 Measured and estimated electricity for year 2012.
10,7; 5% 10,5; 5%
24,9; 13%
35,8; 18%
116,3; 59%
Measured electrity for 2012 [kWh/m2; %]
Chillers
Electric boilers
Ventilation
Landlord elec.
Tenant electricity
12,9; 7%
29,1; 15%
22,8; 11%
27,9; 14%
97,2; 49%
8,4; 4%
Estimated electricity for 2012 [kWh/m2; %]
Cooling
Heating
Ventilation
Appliances
Lighting indoors
Lighting outdoors
96
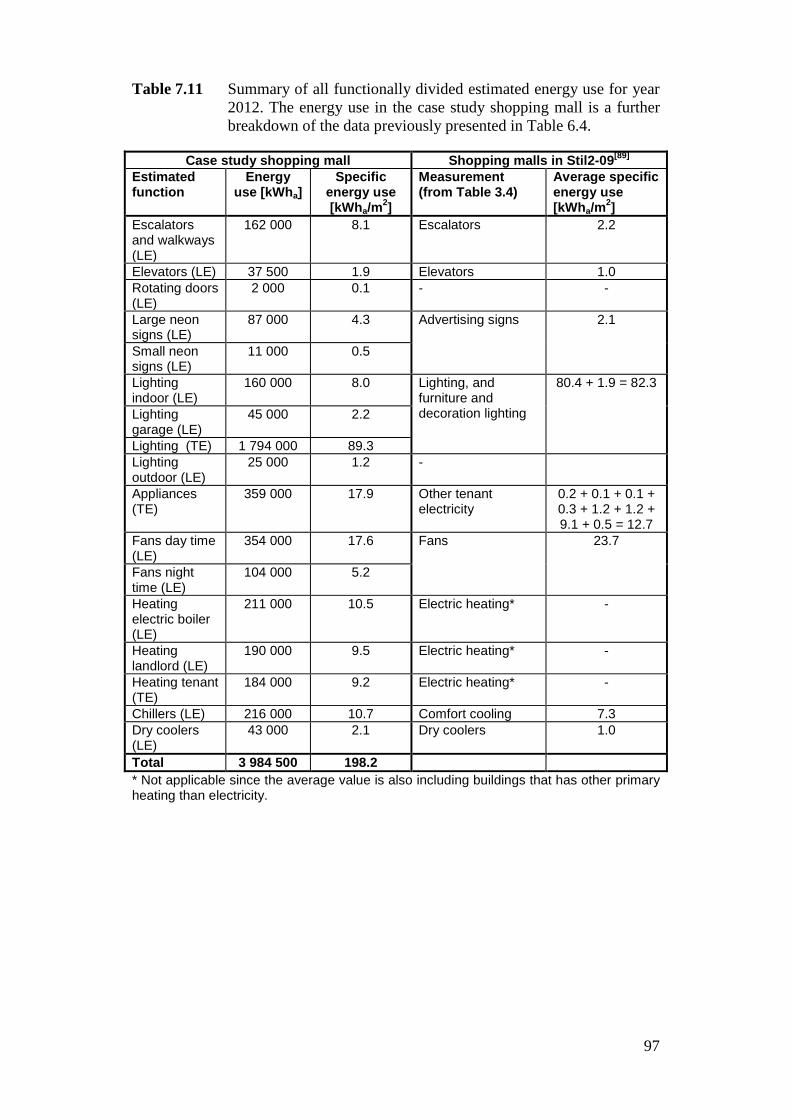
Table 7.11 Summary of all functionally divided estimated energy use for year 2012. The energy use in the case study shopping mall is a further breakdown of the data previously presented in Table 6.4.
Case study shopping mall Shopping malls in Stil2-09[89] Estimated function
Energy use [kWha]
Specific energy use [kWha/m2]
Measurement (from Table 3.4)
Average specific energy use [kWha/m2]
Escalators and walkways (LE)
162 000 8.1 Escalators 2.2
Elevators (LE) 37 500 1.9 Elevators 1.0 Rotating doors (LE)
2 000 0.1 - -
Large neon signs (LE)
87 000 4.3 Advertising signs 2.1
Small neon signs (LE)
11 000 0.5
Lighting indoor (LE)
160 000 8.0 Lighting, and furniture and decoration lighting
80.4 + 1.9 = 82.3
Lighting garage (LE)
45 000 2.2
Lighting (TE) 1 794 000 89.3 Lighting outdoor (LE)
25 000 1.2 -
Appliances (TE)
359 000 17.9 Other tenant electricity
0.2 + 0.1 + 0.1 + 0.3 + 1.2 + 1.2 + 9.1 + 0.5 = 12.7
Fans day time (LE)
354 000 17.6 Fans 23.7
Fans night time (LE)
104 000 5.2
Heating electric boiler (LE)
211 000 10.5 Electric heating* -
Heating landlord (LE)
190 000 9.5 Electric heating* -
Heating tenant (TE)
184 000 9.2 Electric heating* -
Chillers (LE) 216 000 10.7 Comfort cooling 7.3 Dry coolers (LE)
43 000 2.1 Dry coolers 1.0
Total 3 984 500 198.2 * Not applicable since the average value is also including buildings that has other primary heating than electricity.
97

8 CALCULATED ENERGY USE Which parameters determine the energy use? The previous two chapters dealt with energy supplied to the building. Chapter 6 presented the measured purchased energy and Chapter 7 analysed for which functions the purchased energy was used. However, the heating and cooling demands of the building are still not quantified. For revision of the terms, energy supply, purchased energy, and heating and cooling demand, see Chapter 2.
The purpose of this chapter is to develop a calculation model that illustrates the heating and cooling demands of the existing shopping mall. The calculation result gives the theoretical energy demand of the building. The calculation model will also be used in Chapter 9 to evaluate alternative HVAC systems. As for the results presented in Chapter 7 the calculation results presented in this chapter are a result of an iterative process, as explained in Chapter 6 (visualised in Figure 6.1).
Due to the complex interplay between the building envelope, the activities inside the building, the outdoor climate and the requirements for the indoor environment, any analysis of the effect of energy efficiency measures must be based on the total energy balance of the building. The heat balance of a building depends on: internal and external load patterns, transmission, uncontrolled infiltration, controlled ventilation, heat stored in the building, and the amount of heating supplied and extracted in order to maintain the required room temperature. Energy is needed both for maintaining the required room temperature and for the activities in the building. When the temperature inside the building remains constant the heat balance can be expressed as follows:
Qsol + Qint − Qtrans − Qinf − Qvent ± Qheat/cool = 0
Qsol heat supplied because of solar irradiation Qint heat supplied because of internal heat loads Qtrans transmissions through the building envelope Qinf infiltrations Qvent heating and cooling through the ventilation Qheat/cool the amount of heat that need to be removed or supplied to the
building in order to achieve a constant indoor temperature When Qheat/cool = 0, the building is in thermal balance with its surroundings.
99
8.1 Calculation Software Program The heat balance and the characteristics of the heating and cooling demands of the building are determined by means of calculations in BV2. BV2 is a software program developed to be practically suitable for planning commercial buildings, which is the reason the tool was chosen for this study. The theoretical framework for the BV2 model was originally developed and presented in a doctoral thesis by Nilsson[57], and the BV2 model was validated by simulations in the software DOE-2. The BV2 version 2010 has also been validated according to IEA Bestest[61]. The name BV2 comes from the Swedish abbreviation of “Byggnadens Värmebalans i Varaktighetsdiagram”, or directly translated to English “the building heat balance in duration diagrams”. For more information about the BV2 software program the manual may be consulted[17].
BV2 is a single zone model. A weakness with a single zone model is that it cannot deal with heating and cooling demands simultaneously. In shopping malls, which are large buildings with diverse activities there might be a need for heating in one zone of the building while there is a need for cooling in another zone. When these simultaneous needs occur it is not possible to correctly reproduce the heating and cooling demands of the building in BV2. For system dimensioning and detailed analyses a multi zone model would have been required. This thesis however focuses on the system as a whole and therefore the use of a single zone model was considered sufficient.
8.2 Calculation Method In order to develop the shopping mall model in BV2, an extensive foundation of input data was gathered through an energy audit. This section explains the compilation of input data used in the model, as well as assumptions made during calculations. Input data was gathered from the following sources of information:
• Building and HVAC system plans • Interviews with management and operative personnel • Documentation of control strategies • Mandatory ventilation inspection protocols (in Swedish “OVK-protokoll”) • Building management system • People counting system • Measured purchased electricity
The input data concerning internal heat generation, construction and HVAC system are presented in Table 8.1 to Table 8.9. All input data that are of importance for the results and analysis of this thesis are analysed in more depth in this chapter. This chapter enables reproduction of the shopping mall model, for any future studies.
100
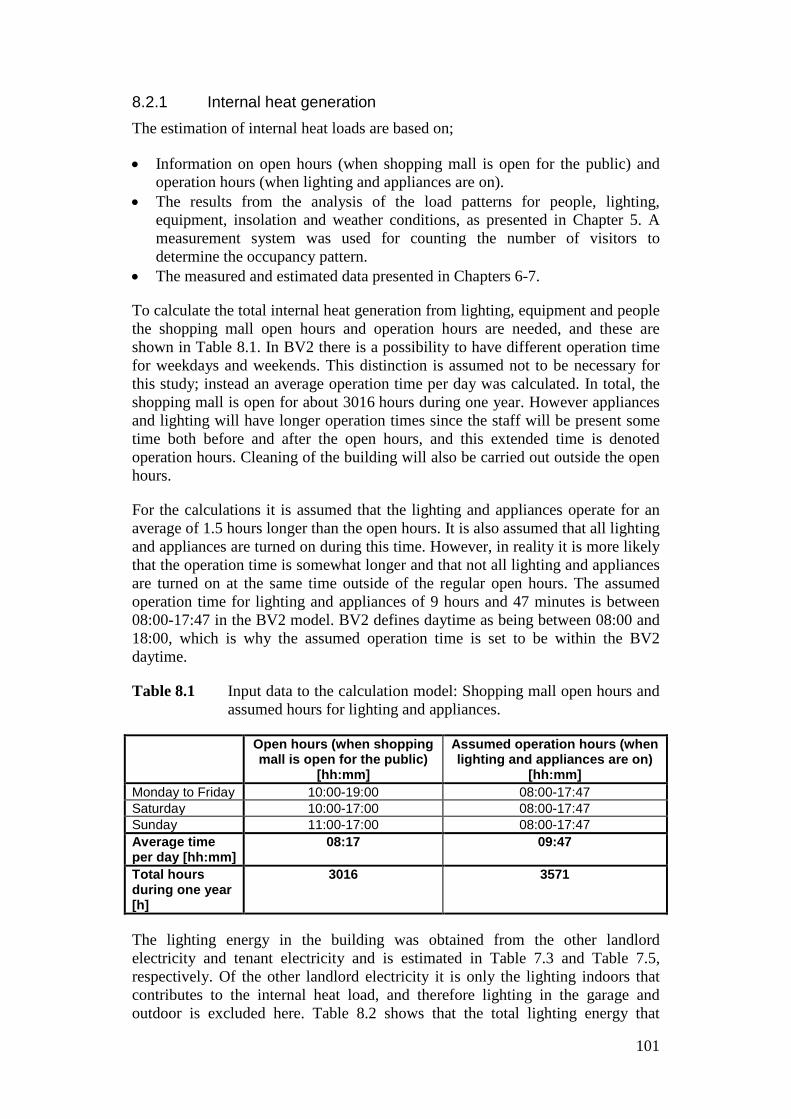
8.2.1 Internal heat generation The estimation of internal heat loads are based on;
• Information on open hours (when shopping mall is open for the public) and operation hours (when lighting and appliances are on).
• The results from the analysis of the load patterns for people, lighting, equipment, insolation and weather conditions, as presented in Chapter 5. A measurement system was used for counting the number of visitors to determine the occupancy pattern.
• The measured and estimated data presented in Chapters 6-7.
To calculate the total internal heat generation from lighting, equipment and people the shopping mall open hours and operation hours are needed, and these are shown in Table 8.1. In BV2 there is a possibility to have different operation time for weekdays and weekends. This distinction is assumed not to be necessary for this study; instead an average operation time per day was calculated. In total, the shopping mall is open for about 3016 hours during one year. However appliances and lighting will have longer operation times since the staff will be present some time both before and after the open hours, and this extended time is denoted operation hours. Cleaning of the building will also be carried out outside the open hours.
For the calculations it is assumed that the lighting and appliances operate for an average of 1.5 hours longer than the open hours. It is also assumed that all lighting and appliances are turned on during this time. However, in reality it is more likely that the operation time is somewhat longer and that not all lighting and appliances are turned on at the same time outside of the regular open hours. The assumed operation time for lighting and appliances of 9 hours and 47 minutes is between 08:00-17:47 in the BV2 model. BV2 defines daytime as being between 08:00 and 18:00, which is why the assumed operation time is set to be within the BV2 daytime.
Table 8.1 Input data to the calculation model: Shopping mall open hours and assumed hours for lighting and appliances.
Open hours (when shopping mall is open for the public)
[hh:mm]
Assumed operation hours (when lighting and appliances are on)
[hh:mm] Monday to Friday 10:00-19:00 08:00-17:47 Saturday 10:00-17:00 08:00-17:47 Sunday 11:00-17:00 08:00-17:47 Average time per day [hh:mm]
08:17 09:47
Total hours during one year [h]
3016 3571
The lighting energy in the building was obtained from the other landlord electricity and tenant electricity and is estimated in Table 7.3 and Table 7.5, respectively. Of the other landlord electricity it is only the lighting indoors that contributes to the internal heat load, and therefore lighting in the garage and outdoor is excluded here. Table 8.2 shows that the total lighting energy that
101
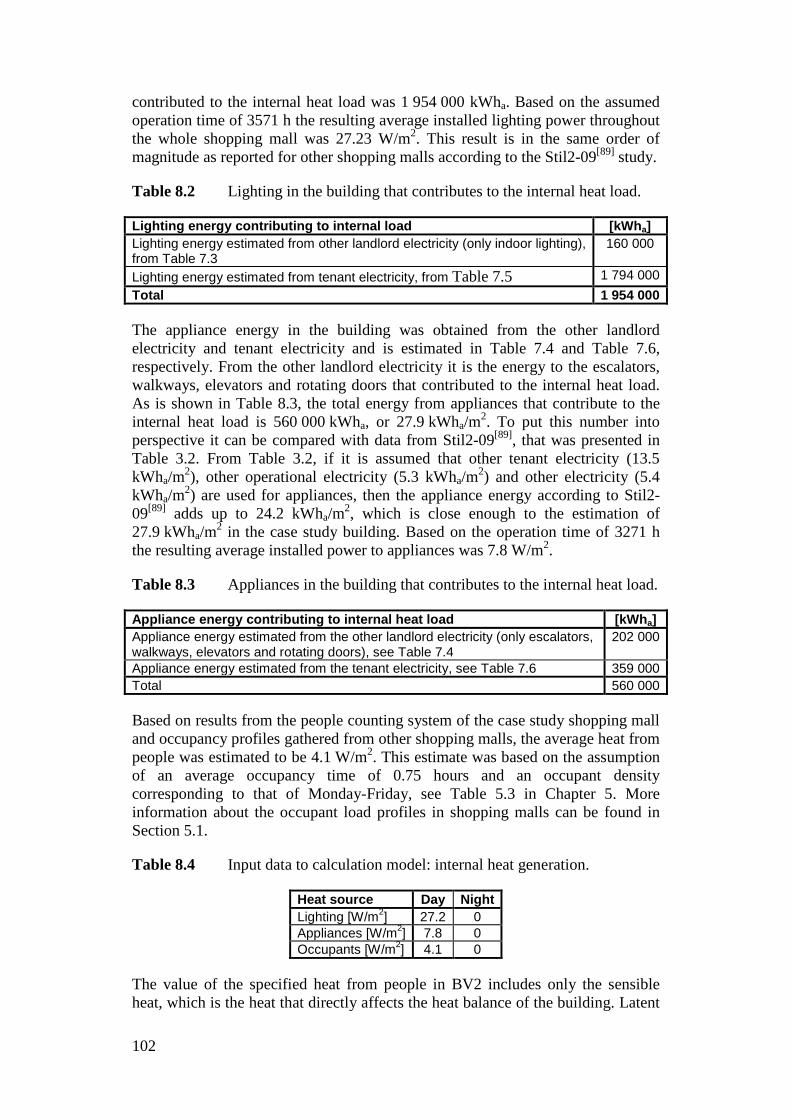
contributed to the internal heat load was 1 954 000 kWha. Based on the assumed operation time of 3571 h the resulting average installed lighting power throughout the whole shopping mall was 27.23 W/m2. This result is in the same order of magnitude as reported for other shopping malls according to the Stil2-09[89] study.
Table 8.2 Lighting in the building that contributes to the internal heat load.
Lighting energy contributing to internal load [kWha] Lighting energy estimated from other landlord electricity (only indoor lighting), from Table 7.3
160 000
Lighting energy estimated from tenant electricity, from Table 7.5 1 794 000 Total 1 954 000
The appliance energy in the building was obtained from the other landlord electricity and tenant electricity and is estimated in Table 7.4 and Table 7.6, respectively. From the other landlord electricity it is the energy to the escalators, walkways, elevators and rotating doors that contributed to the internal heat load. As is shown in Table 8.3, the total energy from appliances that contribute to the internal heat load is 560 000 kWha, or 27.9 kWha/m2. To put this number into perspective it can be compared with data from Stil2-09[89], that was presented in Table 3.2. From Table 3.2, if it is assumed that other tenant electricity (13.5 kWha/m2), other operational electricity (5.3 kWha/m2) and other electricity (5.4 kWha/m2) are used for appliances, then the appliance energy according to Stil2-09[89] adds up to 24.2 kWha/m2, which is close enough to the estimation of 27.9 kWha/m2 in the case study building. Based on the operation time of 3271 h the resulting average installed power to appliances was 7.8 W/m2.
Table 8.3 Appliances in the building that contributes to the internal heat load.
Appliance energy contributing to internal heat load [kWha] Appliance energy estimated from the other landlord electricity (only escalators, walkways, elevators and rotating doors), see Table 7.4
202 000
Appliance energy estimated from the tenant electricity, see Table 7.6 359 000 Total 560 000
Based on results from the people counting system of the case study shopping mall and occupancy profiles gathered from other shopping malls, the average heat from people was estimated to be 4.1 W/m2. This estimate was based on the assumption of an average occupancy time of 0.75 hours and an occupant density corresponding to that of Monday-Friday, see Table 5.3 in Chapter 5. More information about the occupant load profiles in shopping malls can be found in Section 5.1.
Table 8.4 Input data to calculation model: internal heat generation.
Heat source Day Night Lighting [W/m2] 27.2 0 Appliances [W/m2] 7.8 0 Occupants [W/m2] 4.1 0
The value of the specified heat from people in BV2 includes only the sensible heat, which is the heat that directly affects the heat balance of the building. Latent
102
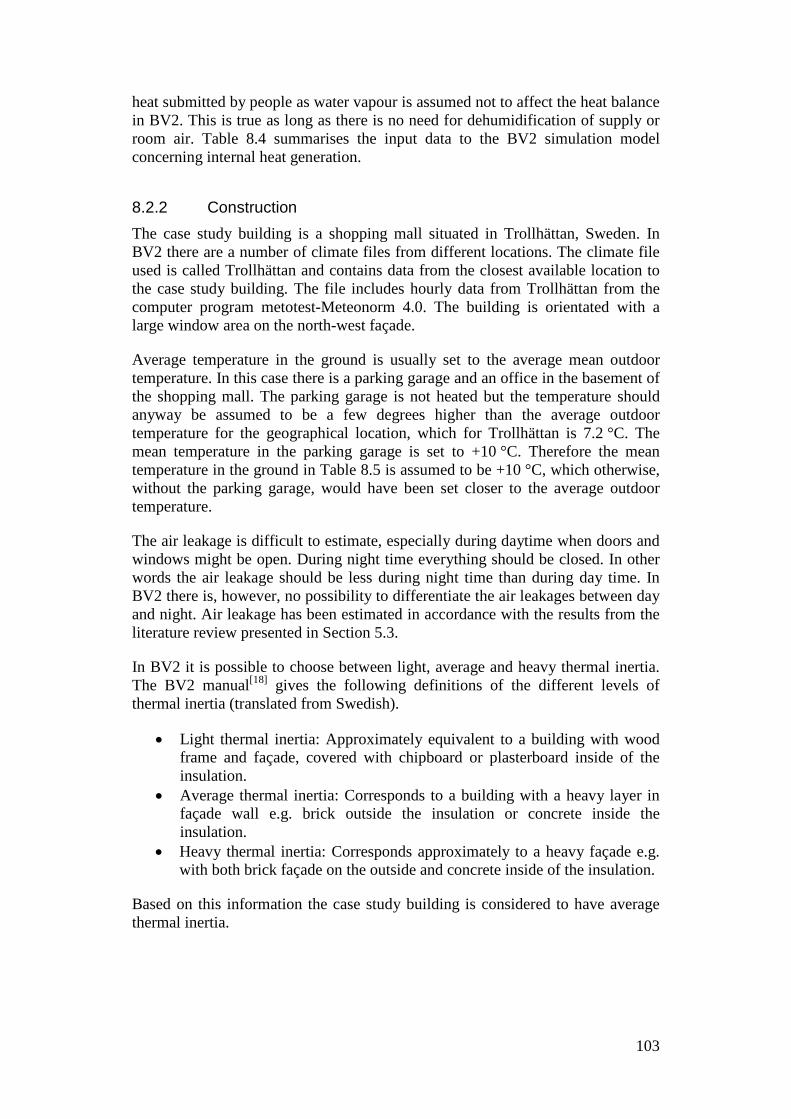
heat submitted by people as water vapour is assumed not to affect the heat balance in BV2. This is true as long as there is no need for dehumidification of supply or room air. Table 8.4 summarises the input data to the BV2 simulation model concerning internal heat generation.
8.2.2 Construction The case study building is a shopping mall situated in Trollhättan, Sweden. In BV2 there are a number of climate files from different locations. The climate file used is called Trollhättan and contains data from the closest available location to the case study building. The file includes hourly data from Trollhättan from the computer program metotest-Meteonorm 4.0. The building is orientated with a large window area on the north-west façade.
Average temperature in the ground is usually set to the average mean outdoor temperature. In this case there is a parking garage and an office in the basement of the shopping mall. The parking garage is not heated but the temperature should anyway be assumed to be a few degrees higher than the average outdoor temperature for the geographical location, which for Trollhättan is 7.2 °C. The mean temperature in the parking garage is set to +10 °C. Therefore the mean temperature in the ground in Table 8.5 is assumed to be +10 °C, which otherwise, without the parking garage, would have been set closer to the average outdoor temperature.
The air leakage is difficult to estimate, especially during daytime when doors and windows might be open. During night time everything should be closed. In other words the air leakage should be less during night time than during day time. In BV2 there is, however, no possibility to differentiate the air leakages between day and night. Air leakage has been estimated in accordance with the results from the literature review presented in Section 5.3.
In BV2 it is possible to choose between light, average and heavy thermal inertia. The BV2 manual[18] gives the following definitions of the different levels of thermal inertia (translated from Swedish).
• Light thermal inertia: Approximately equivalent to a building with wood frame and façade, covered with chipboard or plasterboard inside of the insulation.
• Average thermal inertia: Corresponds to a building with a heavy layer in façade wall e.g. brick outside the insulation or concrete inside the insulation.
• Heavy thermal inertia: Corresponds approximately to a heavy façade e.g. with both brick façade on the outside and concrete inside of the insulation.
Based on this information the case study building is considered to have average thermal inertia.
103
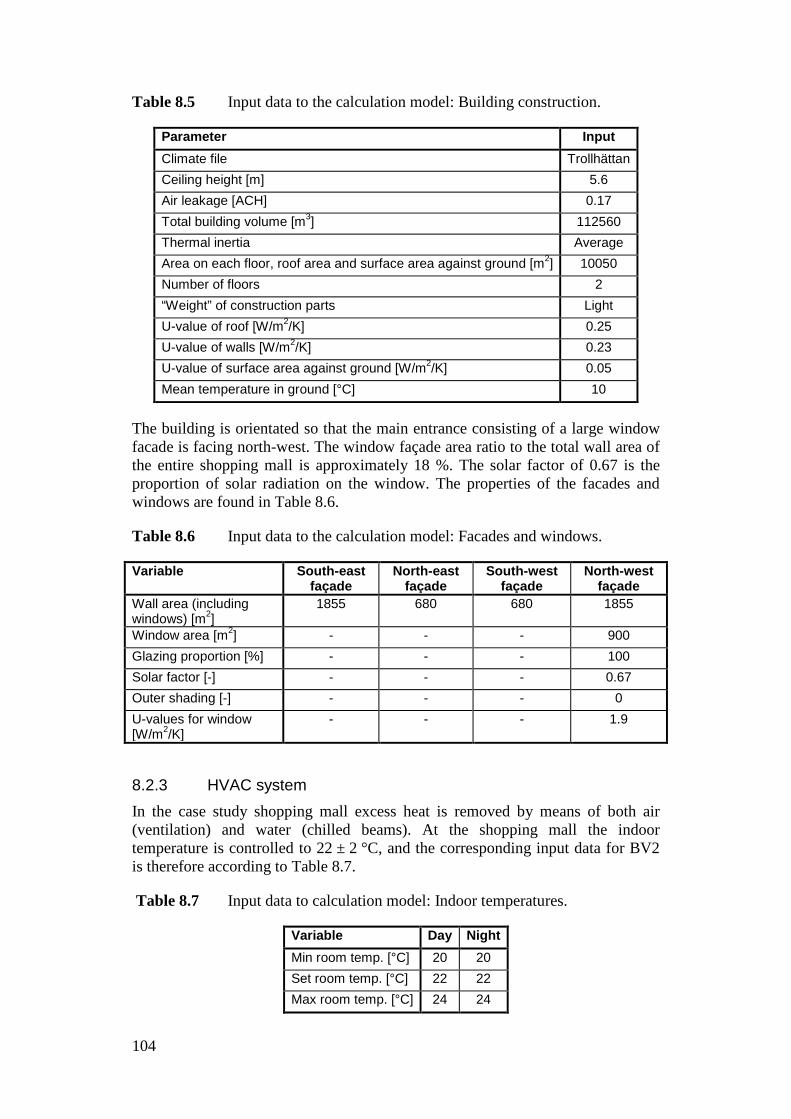
Table 8.5 Input data to the calculation model: Building construction.
Parameter Input Climate file Trollhättan Ceiling height [m] 5.6 Air leakage [ACH] 0.17 Total building volume [m3] 112560 Thermal inertia Average Area on each floor, roof area and surface area against ground [m2] 10050 Number of floors 2 “Weight” of construction parts Light U-value of roof [W/m2/K] 0.25 U-value of walls [W/m2/K] 0.23 U-value of surface area against ground [W/m2/K] 0.05 Mean temperature in ground [°C] 10
The building is orientated so that the main entrance consisting of a large window facade is facing north-west. The window façade area ratio to the total wall area of the entire shopping mall is approximately 18 %. The solar factor of 0.67 is the proportion of solar radiation on the window. The properties of the facades and windows are found in Table 8.6.
Table 8.6 Input data to the calculation model: Facades and windows.
Variable South-east façade
North-east façade
South-west façade
North-west façade
Wall area (including windows) [m2]
1855 680 680 1855
Window area [m2] - - - 900 Glazing proportion [%] - - - 100 Solar factor [-] - - - 0.67 Outer shading [-] - - - 0 U-values for window [W/m2/K]
- - - 1.9
8.2.3 HVAC system In the case study shopping mall excess heat is removed by means of both air (ventilation) and water (chilled beams). At the shopping mall the indoor temperature is controlled to 22 ± 2 °C, and the corresponding input data for BV2 is therefore according to Table 8.7.
Table 8.7 Input data to calculation model: Indoor temperatures.
Variable Day Night Min room temp. [°C] 20 20 Set room temp. [°C] 22 22 Max room temp. [°C] 24 24
104
AHU operation
The ventilation system is a constant air volume system with heat recovery by enthalpy wheels. The total aggregated design air flow rate according to OVK-protocols for the six air handling units is 32.8 m3/s, which correspond to 1.6 l/s/m2. This ventilation flow rate is designed so that the chilled beams and ventilation air together meet the cooling demand under design conditions. To put the ventilation flow rate of 1.6 l/s/m2 into some perspective it is possible to relate it to the number of people in the building. The number of customers that visit the shopping mall during one day is approximately 6500. This implies that the person-specific flow rate would be approximately 5 l/s/person if all these people were in the building at the same time. However, each customer will only be in the shopping mall for a short period of time and therefore the true volume flow rate per person is much larger.
Based on the estimations presented in Chapter 7, night time ventilation uses approximately 25 % of the energy used in the day time ventilation. In reality the night time ventilation is only on during specific conditions when there is a cooling or heating demand. This operation was however not possible to achieve in the calculation, due to constraints in the BV2 program. Therefore, in the calculation, the flow rate during night time was assumed to be the same all year around. The flow rate during night time of 0.4 l/s/m2 was determined based on the estimated data presented in Chapter 7. The flow rate was set in a way that the total energy use for ventilation should correspond to the total estimated energy for ventilation.
The supply air temperature is demand controlled based on indoor temperature, however the lowest and highest supply air temperatures are 16 and 20 °C, respectively.
To calculate the specific fan power (SFP), the design volume flow rate (V) and power use for the fans (W) are required[7], see Eq. 8.1. The highest value of the supply and exhaust flow rate was used in the calculation. For the case study building it is the supply flow rate that is the highest, as can be seen in Table 7.7 in Chapter 7.
SFP =WV
Eq. 8.1
Where
SFP Specific fan power [kW/m3/s] W Fan power [W], [J/s] V Volume flow rate [m3/s]
In the previous chapter it was shown that the ventilation is operated on its maximum power the whole time, see the analysis in Section 7.3. Therefore rated output of the fans is used to calculate SFP. The rated output of all the fans is 90 kW and the measured volume flow rate was 32.8 m3/s. This yields an SFP of 2.7 kW/m3/s (90/32.8=2.7). Commercial buildings today have AHUs with SFPs within the range of 2-3 kW/m2/s. Based on this, a SFP of 2.7 was assumed and used in the BV2 model.
105
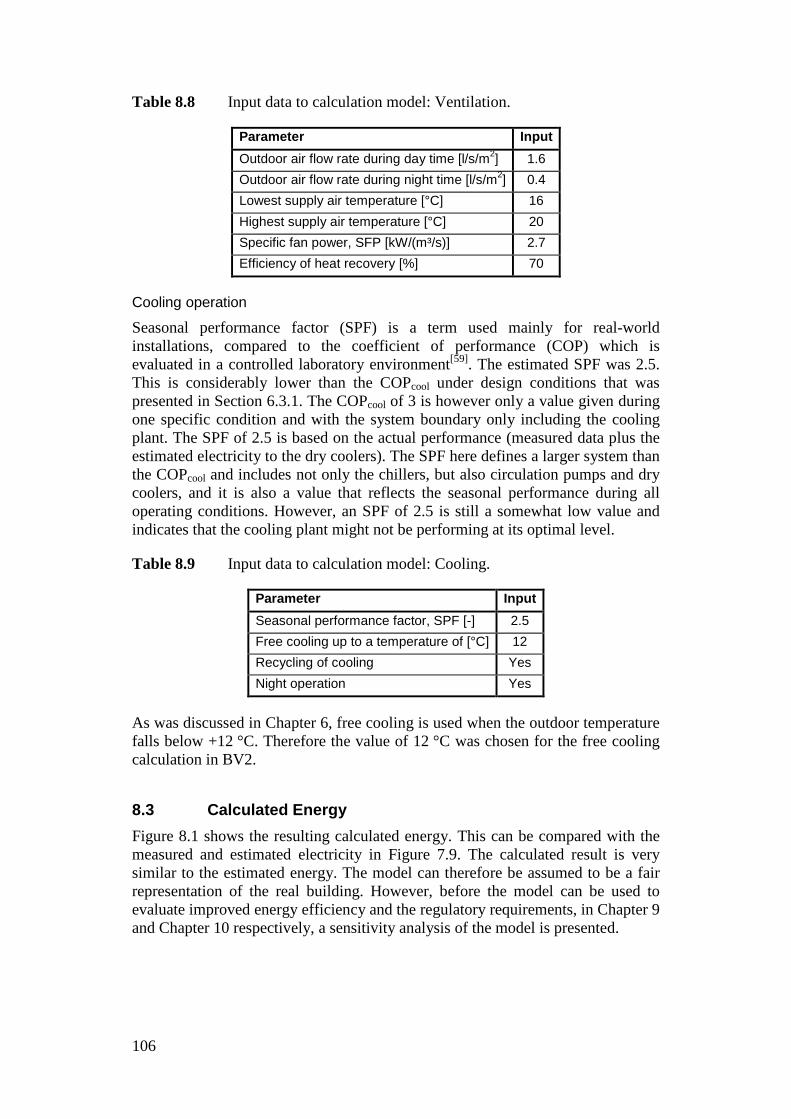
Table 8.8 Input data to calculation model: Ventilation.
Parameter Input Outdoor air flow rate during day time [l/s/m2] 1.6 Outdoor air flow rate during night time [l/s/m2] 0.4 Lowest supply air temperature [°C] 16 Highest supply air temperature [°C] 20 Specific fan power, SFP [kW/(m³/s)] 2.7 Efficiency of heat recovery [%] 70
Cooling operation
Seasonal performance factor (SPF) is a term used mainly for real-world installations, compared to the coefficient of performance (COP) which is evaluated in a controlled laboratory environment[59]. The estimated SPF was 2.5. This is considerably lower than the COPcool under design conditions that was presented in Section 6.3.1. The COPcool of 3 is however only a value given during one specific condition and with the system boundary only including the cooling plant. The SPF of 2.5 is based on the actual performance (measured data plus the estimated electricity to the dry coolers). The SPF here defines a larger system than the COPcool and includes not only the chillers, but also circulation pumps and dry coolers, and it is also a value that reflects the seasonal performance during all operating conditions. However, an SPF of 2.5 is still a somewhat low value and indicates that the cooling plant might not be performing at its optimal level.
Table 8.9 Input data to calculation model: Cooling.
Parameter Input Seasonal performance factor, SPF [-] 2.5 Free cooling up to a temperature of [°C] 12 Recycling of cooling Yes Night operation Yes
As was discussed in Chapter 6, free cooling is used when the outdoor temperature falls below +12 °C. Therefore the value of 12 °C was chosen for the free cooling calculation in BV2.
8.3 Calculated Energy Figure 8.1 shows the resulting calculated energy. This can be compared with the measured and estimated electricity in Figure 7.9. The calculated result is very similar to the estimated energy. The model can therefore be assumed to be a fair representation of the real building. However, before the model can be used to evaluate improved energy efficiency and the regulatory requirements, in Chapter 9 and Chapter 10 respectively, a sensitivity analysis of the model is presented.
106
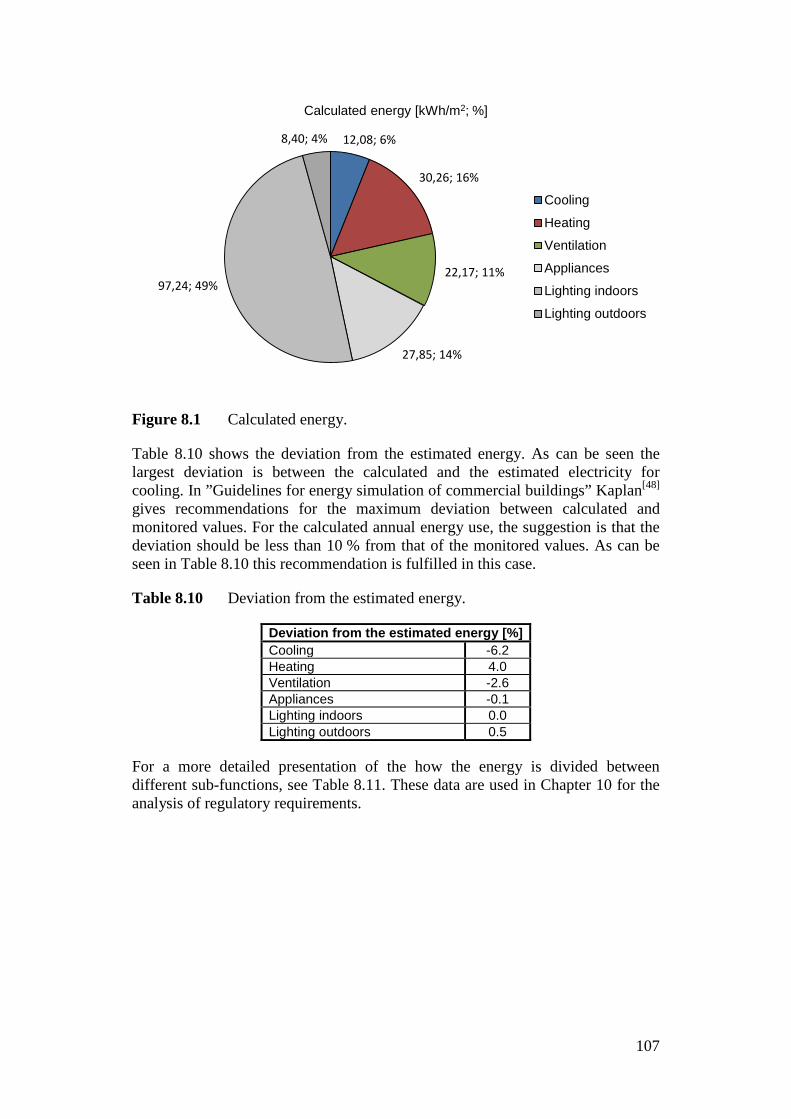
Figure 8.1 Calculated energy.
Table 8.10 shows the deviation from the estimated energy. As can be seen the largest deviation is between the calculated and the estimated electricity for cooling. In ”Guidelines for energy simulation of commercial buildings” Kaplan[48] gives recommendations for the maximum deviation between calculated and monitored values. For the calculated annual energy use, the suggestion is that the deviation should be less than 10 % from that of the monitored values. As can be seen in Table 8.10 this recommendation is fulfilled in this case.
Table 8.10 Deviation from the estimated energy.
Deviation from the estimated energy [%] Cooling -6.2 Heating 4.0 Ventilation -2.6 Appliances -0.1 Lighting indoors 0.0 Lighting outdoors 0.5
For a more detailed presentation of the how the energy is divided between different sub-functions, see Table 8.11. These data are used in Chapter 10 for the analysis of regulatory requirements.
12,08; 6%
30,26; 16%
22,17; 11%
27,85; 14%
97,24; 49%
8,40; 4%
Calculated energy [kWh/m2; %]
Cooling
Heating
Ventilation
Appliances
Lighting indoors
Lighting outdoors
107
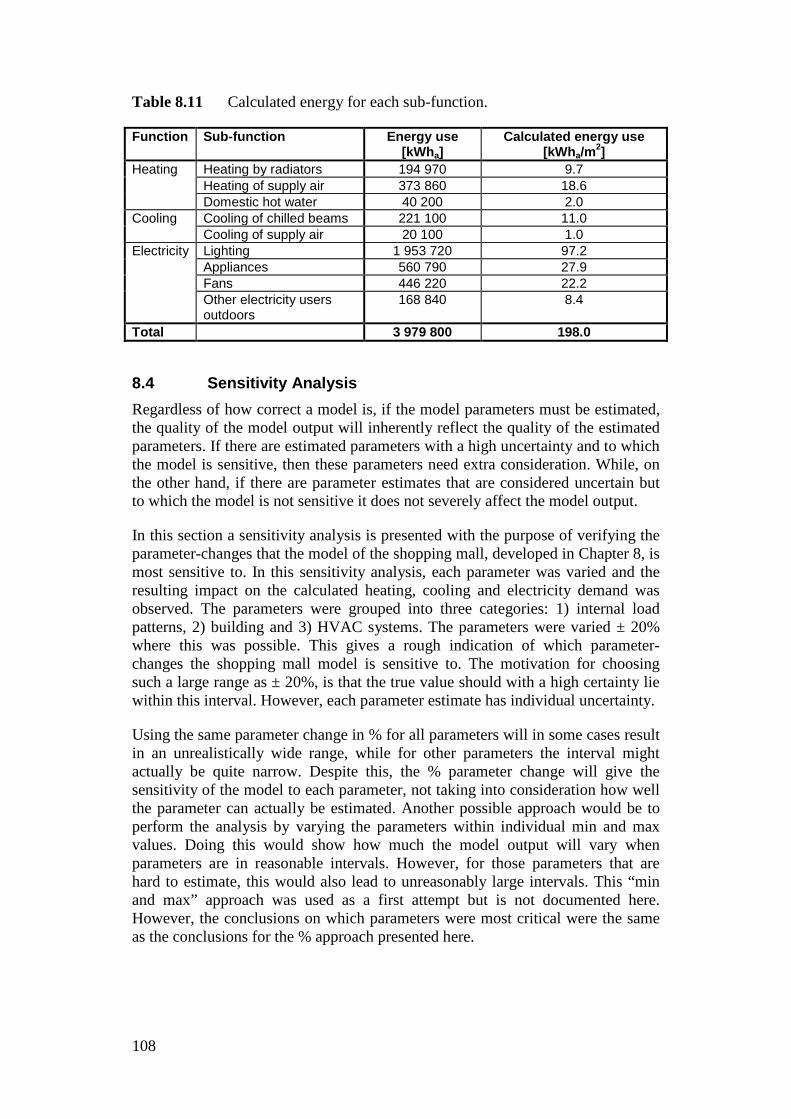
Table 8.11 Calculated energy for each sub-function.
Function Sub-function Energy use [kWha]
Calculated energy use [kWha/m2]
Heating Heating by radiators 194 970 9.7 Heating of supply air 373 860 18.6 Domestic hot water 40 200 2.0
Cooling Cooling of chilled beams 221 100 11.0 Cooling of supply air 20 100 1.0
Electricity Lighting 1 953 720 97.2 Appliances 560 790 27.9 Fans 446 220 22.2 Other electricity users outdoors
168 840 8.4
Total 3 979 800 198.0
8.4 Sensitivity Analysis Regardless of how correct a model is, if the model parameters must be estimated, the quality of the model output will inherently reflect the quality of the estimated parameters. If there are estimated parameters with a high uncertainty and to which the model is sensitive, then these parameters need extra consideration. While, on the other hand, if there are parameter estimates that are considered uncertain but to which the model is not sensitive it does not severely affect the model output.
In this section a sensitivity analysis is presented with the purpose of verifying the parameter-changes that the model of the shopping mall, developed in Chapter 8, is most sensitive to. In this sensitivity analysis, each parameter was varied and the resulting impact on the calculated heating, cooling and electricity demand was observed. The parameters were grouped into three categories: 1) internal load patterns, 2) building and 3) HVAC systems. The parameters were varied ± 20% where this was possible. This gives a rough indication of which parameter-changes the shopping mall model is sensitive to. The motivation for choosing such a large range as ± 20%, is that the true value should with a high certainty lie within this interval. However, each parameter estimate has individual uncertainty.
Using the same parameter change in % for all parameters will in some cases result in an unrealistically wide range, while for other parameters the interval might actually be quite narrow. Despite this, the % parameter change will give the sensitivity of the model to each parameter, not taking into consideration how well the parameter can actually be estimated. Another possible approach would be to perform the analysis by varying the parameters within individual min and max values. Doing this would show how much the model output will vary when parameters are in reasonable intervals. However, for those parameters that are hard to estimate, this would also lead to unreasonably large intervals. This “min and max” approach was used as a first attempt but is not documented here. However, the conclusions on which parameters were most critical were the same as the conclusions for the % approach presented here.
108
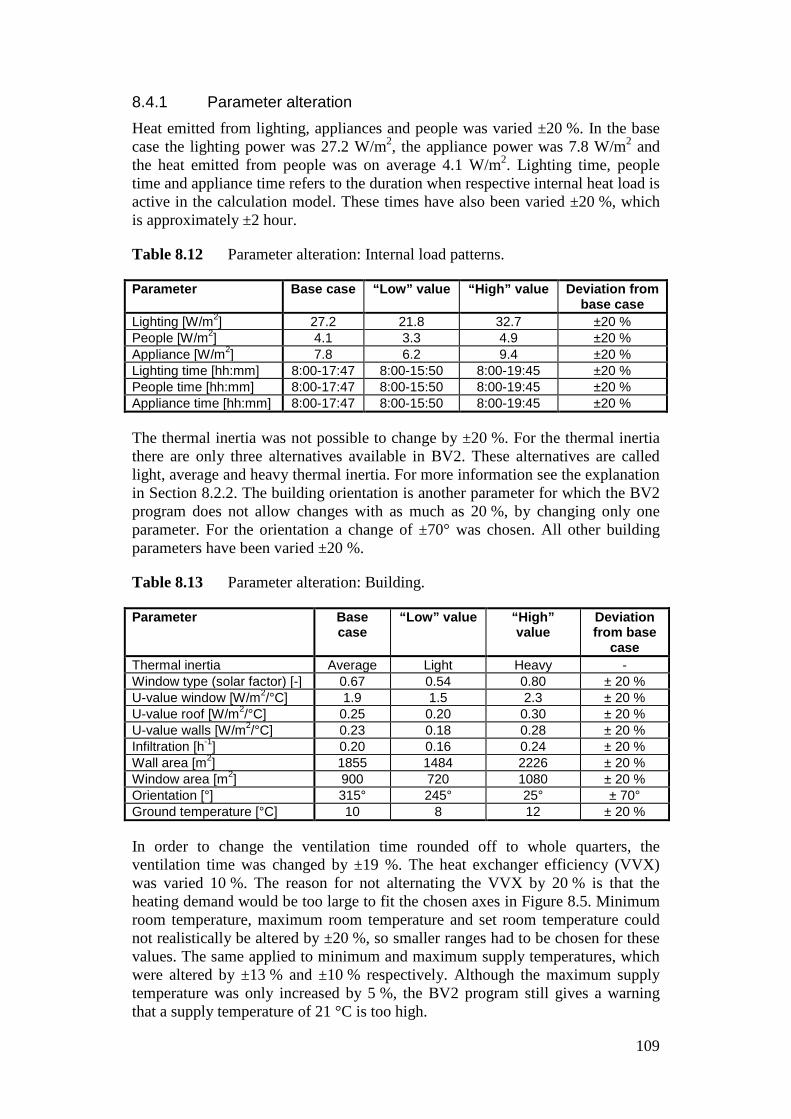
8.4.1 Parameter alteration Heat emitted from lighting, appliances and people was varied ±20 %. In the base case the lighting power was 27.2 W/m2, the appliance power was 7.8 W/m2 and the heat emitted from people was on average 4.1 W/m2. Lighting time, people time and appliance time refers to the duration when respective internal heat load is active in the calculation model. These times have also been varied ±20 %, which is approximately ±2 hour.
Table 8.12 Parameter alteration: Internal load patterns.
Parameter Base case “Low” value “High” value Deviation from base case
Lighting [W/m2] 27.2 21.8 32.7 ±20 % People [W/m2] 4.1 3.3 4.9 ±20 % Appliance [W/m2] 7.8 6.2 9.4 ±20 % Lighting time [hh:mm] 8:00-17:47 8:00-15:50 8:00-19:45 ±20 % People time [hh:mm] 8:00-17:47 8:00-15:50 8:00-19:45 ±20 % Appliance time [hh:mm] 8:00-17:47 8:00-15:50 8:00-19:45 ±20 %
The thermal inertia was not possible to change by ±20 %. For the thermal inertia there are only three alternatives available in BV2. These alternatives are called light, average and heavy thermal inertia. For more information see the explanation in Section 8.2.2. The building orientation is another parameter for which the BV2 program does not allow changes with as much as 20 %, by changing only one parameter. For the orientation a change of ±70° was chosen. All other building parameters have been varied ±20 %.
Table 8.13 Parameter alteration: Building.
Parameter Base case
“Low” value “High” value
Deviation from base
case Thermal inertia Average Light Heavy - Window type (solar factor) [-] 0.67 0.54 0.80 ± 20 % U-value window [W/m2/°C] 1.9 1.5 2.3 ± 20 % U-value roof [W/m2/°C] 0.25 0.20 0.30 ± 20 % U-value walls [W/m2/°C] 0.23 0.18 0.28 ± 20 % Infiltration [h-1] 0.20 0.16 0.24 ± 20 % Wall area [m2] 1855 1484 2226 ± 20 % Window area [m2] 900 720 1080 ± 20 % Orientation [°] 315° 245° 25° ± 70° Ground temperature [°C] 10 8 12 ± 20 %
In order to change the ventilation time rounded off to whole quarters, the ventilation time was changed by ±19 %. The heat exchanger efficiency (VVX) was varied 10 %. The reason for not alternating the VVX by 20 % is that the heating demand would be too large to fit the chosen axes in Figure 8.5. Minimum room temperature, maximum room temperature and set room temperature could not realistically be altered by ±20 %, so smaller ranges had to be chosen for these values. The same applied to minimum and maximum supply temperatures, which were altered by ±13 % and ±10 % respectively. Although the maximum supply temperature was only increased by 5 %, the BV2 program still gives a warning that a supply temperature of 21 °C is too high.
109
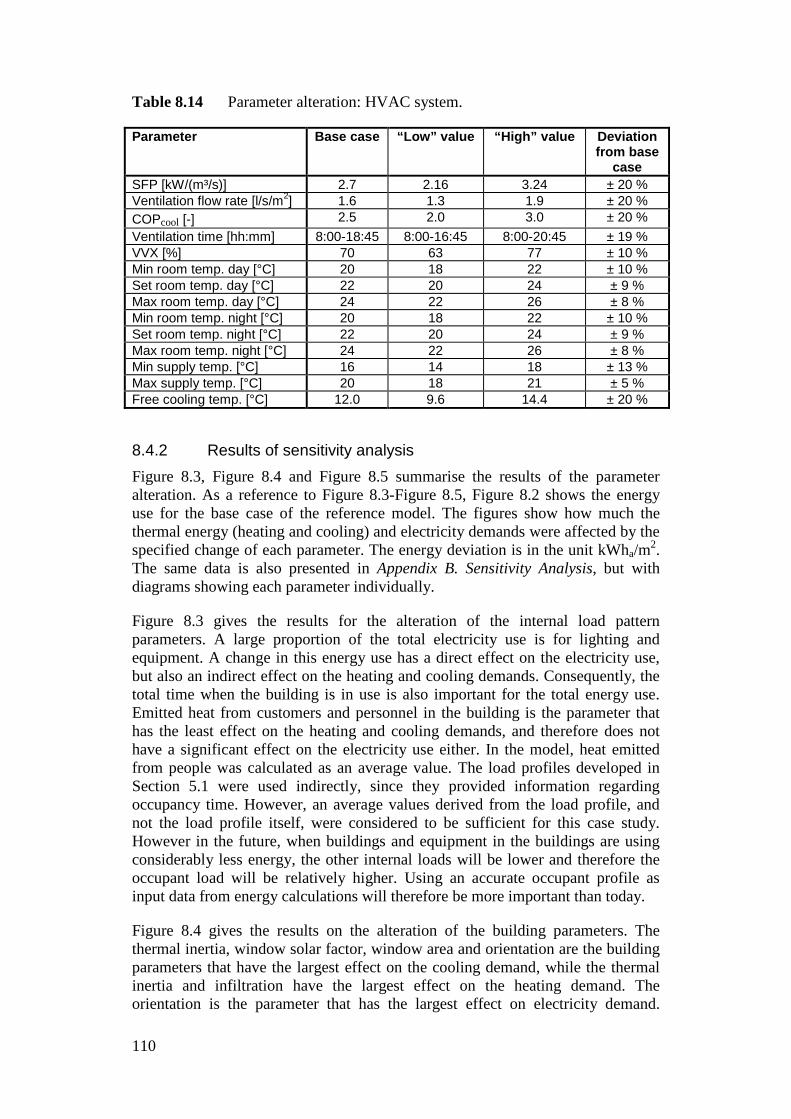
Table 8.14 Parameter alteration: HVAC system.
Parameter Base case “Low” value “High” value Deviation from base
case SFP [kW/(m³/s)] 2.7 2.16 3.24 ± 20 % Ventilation flow rate [l/s/m2] 1.6 1.3 1.9 ± 20 % COPcool [-] 2.5 2.0 3.0 ± 20 % Ventilation time [hh:mm] 8:00-18:45 8:00-16:45 8:00-20:45 ± 19 % VVX [%] 70 63 77 ± 10 % Min room temp. day [°C] 20 18 22 ± 10 % Set room temp. day [°C] 22 20 24 ± 9 % Max room temp. day [°C] 24 22 26 ± 8 % Min room temp. night [°C] 20 18 22 ± 10 % Set room temp. night [°C] 22 20 24 ± 9 % Max room temp. night [°C] 24 22 26 ± 8 % Min supply temp. [°C] 16 14 18 ± 13 % Max supply temp. [°C] 20 18 21 ± 5 % Free cooling temp. [°C] 12.0 9.6 14.4 ± 20 %
8.4.2 Results of sensitivity analysis Figure 8.3, Figure 8.4 and Figure 8.5 summarise the results of the parameter alteration. As a reference to Figure 8.3-Figure 8.5, Figure 8.2 shows the energy use for the base case of the reference model. The figures show how much the thermal energy (heating and cooling) and electricity demands were affected by the specified change of each parameter. The energy deviation is in the unit kWha/m2. The same data is also presented in Appendix B. Sensitivity Analysis, but with diagrams showing each parameter individually.
Figure 8.3 gives the results for the alteration of the internal load pattern parameters. A large proportion of the total electricity use is for lighting and equipment. A change in this energy use has a direct effect on the electricity use, but also an indirect effect on the heating and cooling demands. Consequently, the total time when the building is in use is also important for the total energy use. Emitted heat from customers and personnel in the building is the parameter that has the least effect on the heating and cooling demands, and therefore does not have a significant effect on the electricity use either. In the model, heat emitted from people was calculated as an average value. The load profiles developed in Section 5.1 were used indirectly, since they provided information regarding occupancy time. However, an average values derived from the load profile, and not the load profile itself, were considered to be sufficient for this case study. However in the future, when buildings and equipment in the buildings are using considerably less energy, the other internal loads will be lower and therefore the occupant load will be relatively higher. Using an accurate occupant profile as input data from energy calculations will therefore be more important than today.
Figure 8.4 gives the results on the alteration of the building parameters. The thermal inertia, window solar factor, window area and orientation are the building parameters that have the largest effect on the cooling demand, while the thermal inertia and infiltration have the largest effect on the heating demand. The orientation is the parameter that has the largest effect on electricity demand.
110
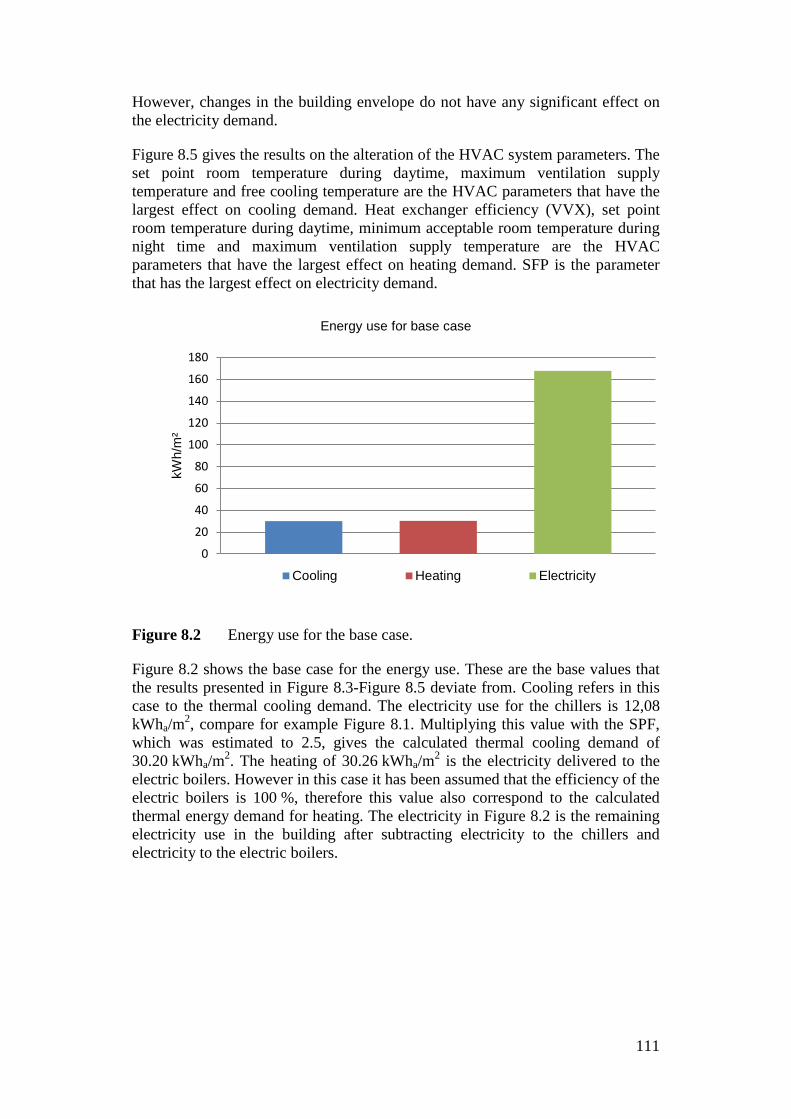
However, changes in the building envelope do not have any significant effect on the electricity demand.
Figure 8.5 gives the results on the alteration of the HVAC system parameters. The set point room temperature during daytime, maximum ventilation supply temperature and free cooling temperature are the HVAC parameters that have the largest effect on cooling demand. Heat exchanger efficiency (VVX), set point room temperature during daytime, minimum acceptable room temperature during night time and maximum ventilation supply temperature are the HVAC parameters that have the largest effect on heating demand. SFP is the parameter that has the largest effect on electricity demand.
Figure 8.2 Energy use for the base case.
Figure 8.2 shows the base case for the energy use. These are the base values that the results presented in Figure 8.3-Figure 8.5 deviate from. Cooling refers in this case to the thermal cooling demand. The electricity use for the chillers is 12,08 kWha/m2, compare for example Figure 8.1. Multiplying this value with the SPF, which was estimated to 2.5, gives the calculated thermal cooling demand of 30.20 kWha/m2. The heating of 30.26 kWha/m2 is the electricity delivered to the electric boilers. However in this case it has been assumed that the efficiency of the electric boilers is 100 %, therefore this value also correspond to the calculated thermal energy demand for heating. The electricity in Figure 8.2 is the remaining electricity use in the building after subtracting electricity to the chillers and electricity to the electric boilers.
0
20
40
60
80
100
120
140
160
180
kWh/
m²
Energy use for base case
Cooling Heating Electricity
111
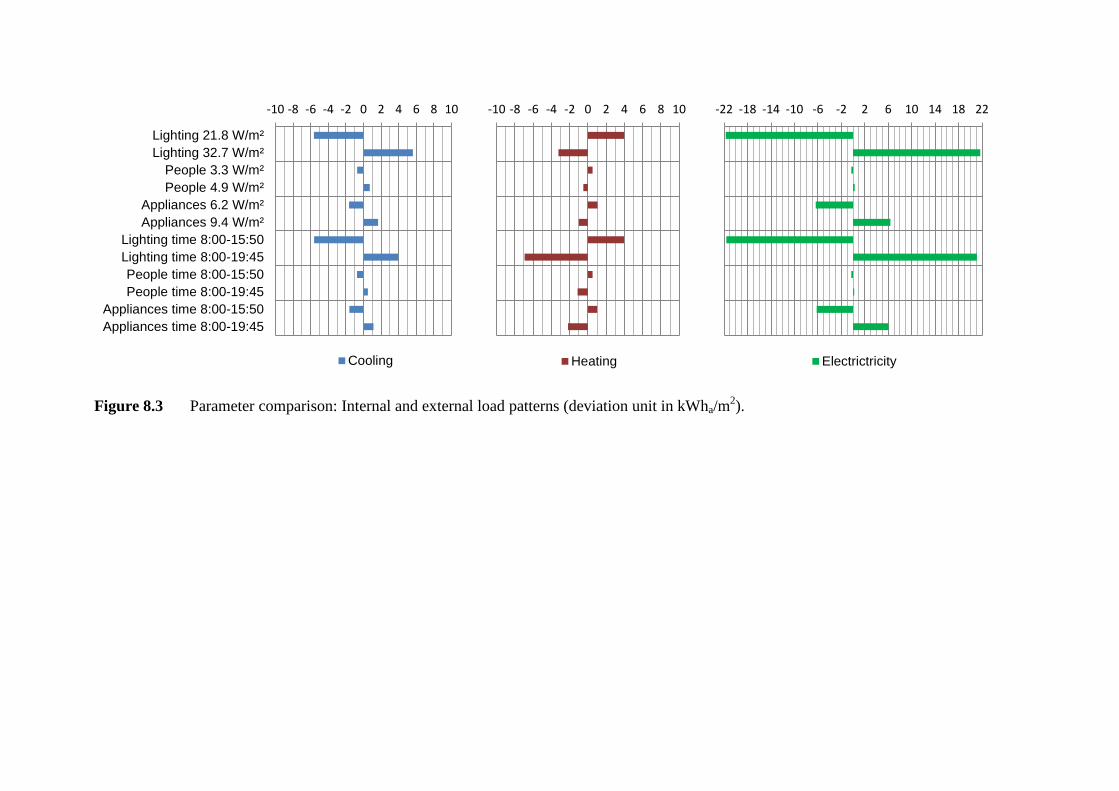
Figure 8.3 Parameter comparison: Internal and external load patterns (deviation unit in kWha/m2).
-10 -8 -6 -4 -2 0 2 4 6 8 10
Lighting 21.8 W/m²Lighting 32.7 W/m²
People 3.3 W/m²People 4.9 W/m²
Appliances 6.2 W/m²Appliances 9.4 W/m²
Lighting time 8:00-15:50Lighting time 8:00-19:45People time 8:00-15:50People time 8:00-19:45
Appliances time 8:00-15:50Appliances time 8:00-19:45
Cooling
-10 -8 -6 -4 -2 0 2 4 6 8 10
Heating
-22 -18 -14 -10 -6 -2 2 6 10 14 18 22
Electrictricity
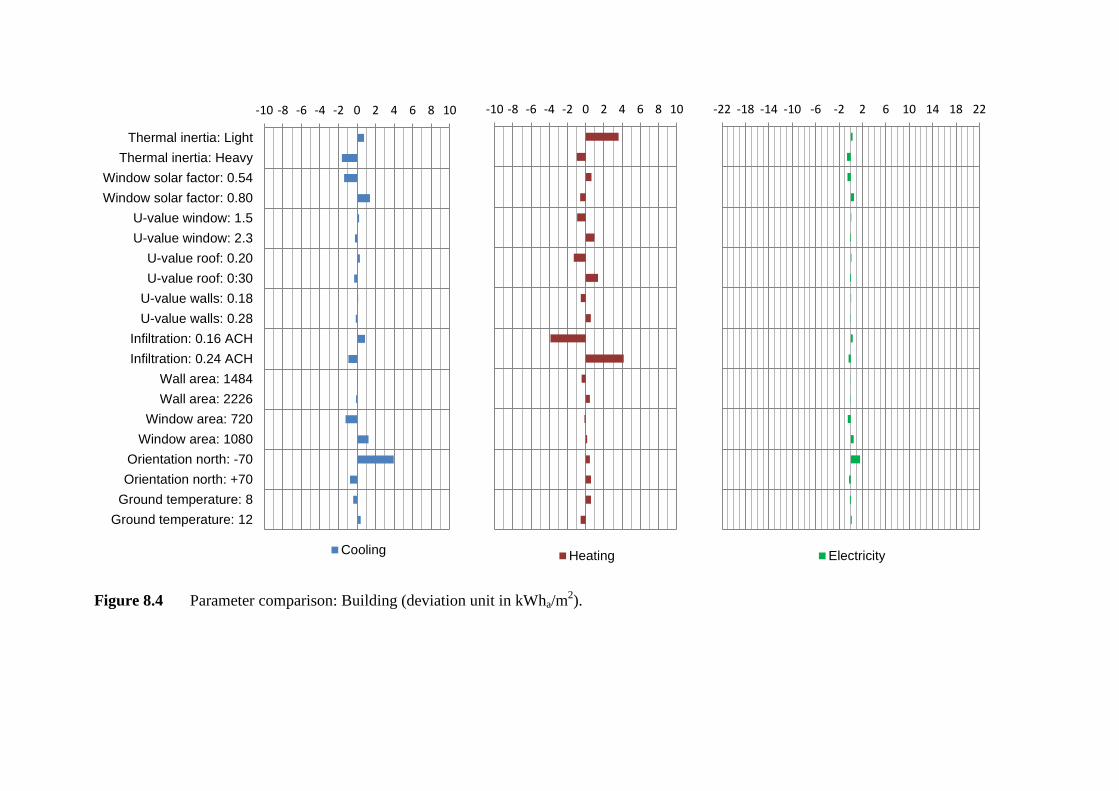
Figure 8.4 Parameter comparison: Building (deviation unit in kWha/m2).
-10 -8 -6 -4 -2 0 2 4 6 8 10
Thermal inertia: LightThermal inertia: Heavy
Window solar factor: 0.54Window solar factor: 0.80
U-value window: 1.5U-value window: 2.3
U-value roof: 0.20U-value roof: 0:30
U-value walls: 0.18U-value walls: 0.28
Infiltration: 0.16 ACHInfiltration: 0.24 ACH
Wall area: 1484Wall area: 2226
Window area: 720Window area: 1080
Orientation north: -70Orientation north: +70
Ground temperature: 8Ground temperature: 12
Cooling
-10 -8 -6 -4 -2 0 2 4 6 8 10
Heating
-22 -18 -14 -10 -6 -2 2 6 10 14 18 22
Electricity
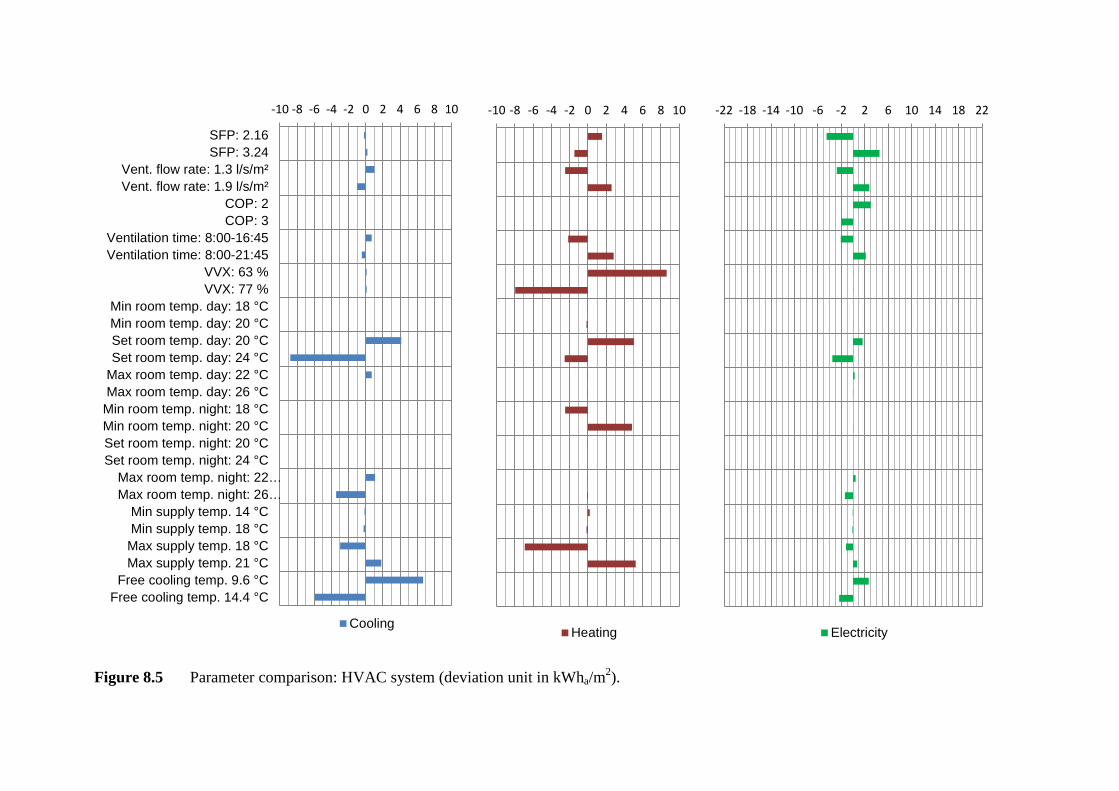
Figure 8.5 Parameter comparison: HVAC system (deviation unit in kWha/m2).
-10 -8 -6 -4 -2 0 2 4 6 8 10
SFP: 2.16SFP: 3.24
Vent. flow rate: 1.3 l/s/m²Vent. flow rate: 1.9 l/s/m²
COP: 2COP: 3
Ventilation time: 8:00-16:45Ventilation time: 8:00-21:45
VVX: 63 %VVX: 77 %
Min room temp. day: 18 °CMin room temp. day: 20 °CSet room temp. day: 20 °CSet room temp. day: 24 °C
Max room temp. day: 22 °CMax room temp. day: 26 °C
Min room temp. night: 18 °CMin room temp. night: 20 °CSet room temp. night: 20 °CSet room temp. night: 24 °C
Max room temp. night: 22…Max room temp. night: 26…
Min supply temp. 14 °CMin supply temp. 18 °C
Max supply temp. 18 °CMax supply temp. 21 °C
Free cooling temp. 9.6 °CFree cooling temp. 14.4 °C
Cooling
-10 -8 -6 -4 -2 0 2 4 6 8 10
Heating
-22 -18 -14 -10 -6 -2 2 6 10 14 18 22
Electricity
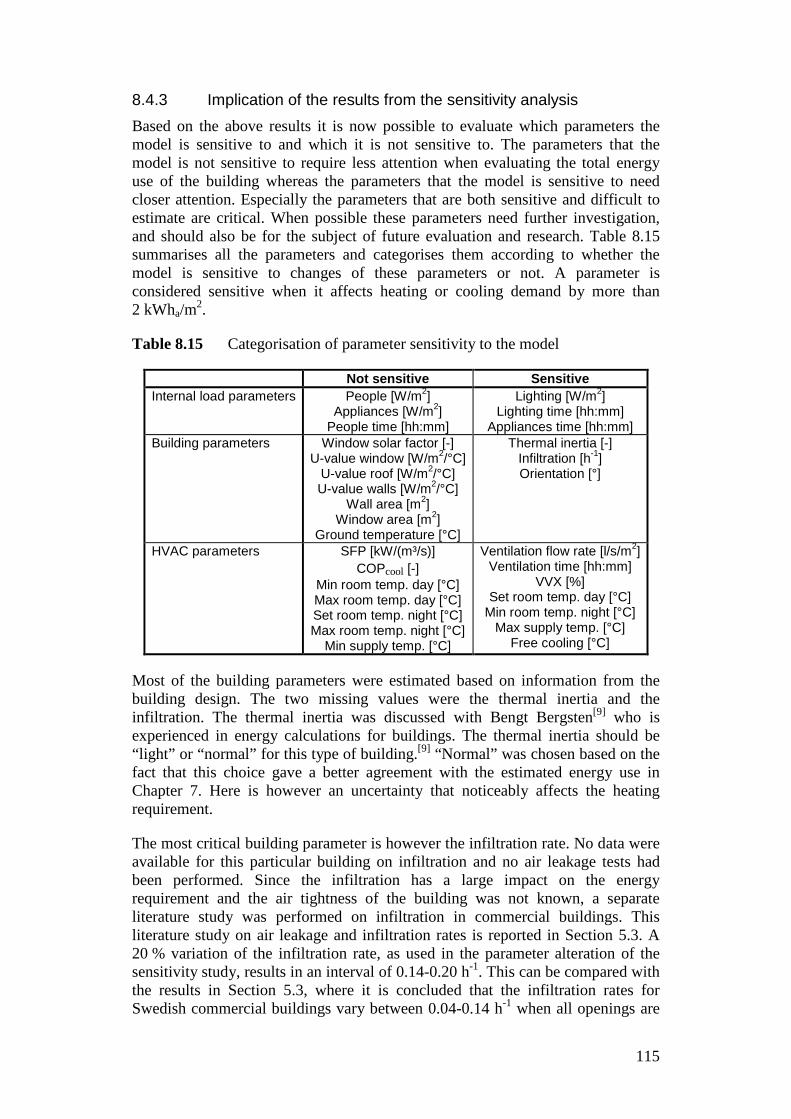
8.4.3 Implication of the results from the sensitivity analysis Based on the above results it is now possible to evaluate which parameters the model is sensitive to and which it is not sensitive to. The parameters that the model is not sensitive to require less attention when evaluating the total energy use of the building whereas the parameters that the model is sensitive to need closer attention. Especially the parameters that are both sensitive and difficult to estimate are critical. When possible these parameters need further investigation, and should also be for the subject of future evaluation and research. Table 8.15 summarises all the parameters and categorises them according to whether the model is sensitive to changes of these parameters or not. A parameter is considered sensitive when it affects heating or cooling demand by more than 2 kWha/m2.
Table 8.15 Categorisation of parameter sensitivity to the model
Not sensitive Sensitive Internal load parameters
People [W/m2] Appliances [W/m2]
People time [hh:mm]
Lighting [W/m2] Lighting time [hh:mm]
Appliances time [hh:mm] Building parameters Window solar factor [-]
U-value window [W/m2/°C] U-value roof [W/m2/°C] U-value walls [W/m2/°C]
Wall area [m2] Window area [m2]
Ground temperature [°C]
Thermal inertia [-] Infiltration [h-1] Orientation [°]
HVAC parameters SFP [kW/(m³/s)] COPcool [-]
Min room temp. day [°C] Max room temp. day [°C] Set room temp. night [°C] Max room temp. night [°C]
Min supply temp. [°C]
Ventilation flow rate [l/s/m2] Ventilation time [hh:mm]
VVX [%] Set room temp. day [°C]
Min room temp. night [°C] Max supply temp. [°C]
Free cooling [°C]
Most of the building parameters were estimated based on information from the building design. The two missing values were the thermal inertia and the infiltration. The thermal inertia was discussed with Bengt Bergsten[9] who is experienced in energy calculations for buildings. The thermal inertia should be “light” or “normal” for this type of building.[9] “Normal” was chosen based on the fact that this choice gave a better agreement with the estimated energy use in Chapter 7. Here is however an uncertainty that noticeably affects the heating requirement.
The most critical building parameter is however the infiltration rate. No data were available for this particular building on infiltration and no air leakage tests had been performed. Since the infiltration has a large impact on the energy requirement and the air tightness of the building was not known, a separate literature study was performed on infiltration in commercial buildings. This literature study on air leakage and infiltration rates is reported in Section 5.3. A 20 % variation of the infiltration rate, as used in the parameter alteration of the sensitivity study, results in an interval of 0.14-0.20 h-1. This can be compared with the results in Section 5.3, where it is concluded that the infiltration rates for Swedish commercial buildings vary between 0.04-0.14 h-1 when all openings are
115
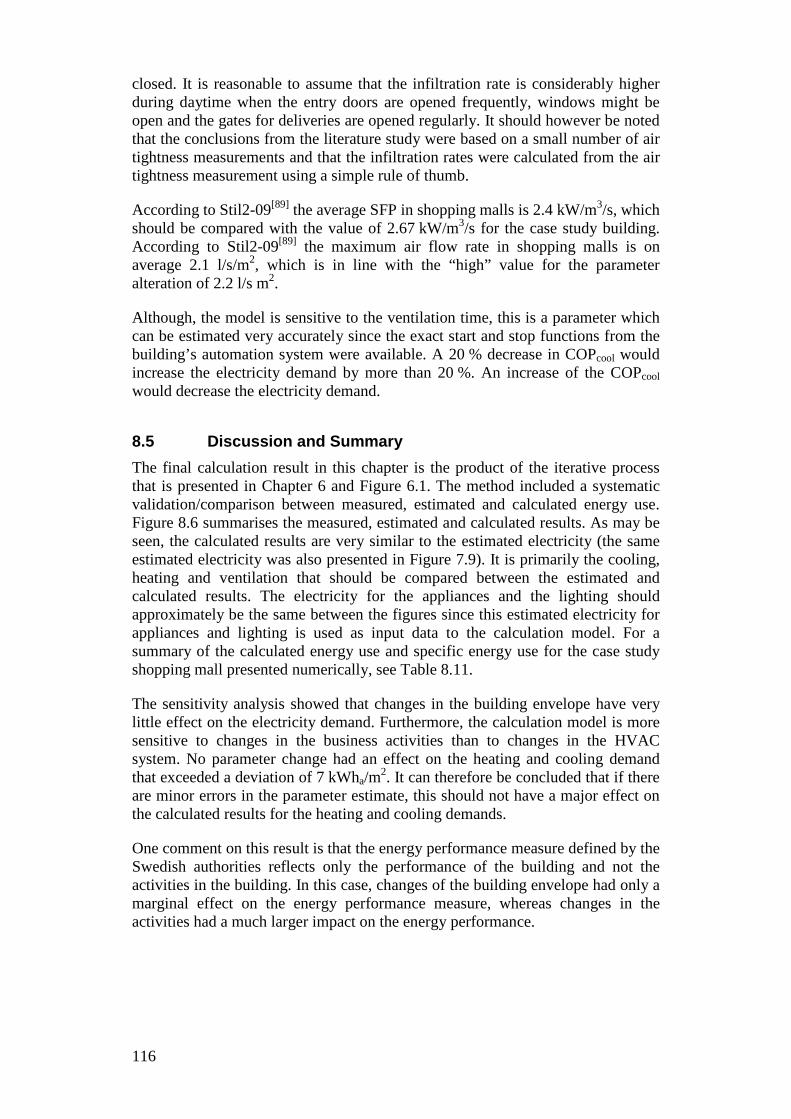
closed. It is reasonable to assume that the infiltration rate is considerably higher during daytime when the entry doors are opened frequently, windows might be open and the gates for deliveries are opened regularly. It should however be noted that the conclusions from the literature study were based on a small number of air tightness measurements and that the infiltration rates were calculated from the air tightness measurement using a simple rule of thumb.
According to Stil2-09[89] the average SFP in shopping malls is 2.4 kW/m3/s, which should be compared with the value of 2.67 kW/m3/s for the case study building. According to Stil2-09[89] the maximum air flow rate in shopping malls is on average 2.1 l/s/m2, which is in line with the “high” value for the parameter alteration of 2.2 l/s m2.
Although, the model is sensitive to the ventilation time, this is a parameter which can be estimated very accurately since the exact start and stop functions from the building’s automation system were available. A 20 % decrease in COPcool would increase the electricity demand by more than 20 %. An increase of the COPcool would decrease the electricity demand.
8.5 Discussion and Summary The final calculation result in this chapter is the product of the iterative process that is presented in Chapter 6 and Figure 6.1. The method included a systematic validation/comparison between measured, estimated and calculated energy use. Figure 8.6 summarises the measured, estimated and calculated results. As may be seen, the calculated results are very similar to the estimated electricity (the same estimated electricity was also presented in Figure 7.9). It is primarily the cooling, heating and ventilation that should be compared between the estimated and calculated results. The electricity for the appliances and the lighting should approximately be the same between the figures since this estimated electricity for appliances and lighting is used as input data to the calculation model. For a summary of the calculated energy use and specific energy use for the case study shopping mall presented numerically, see Table 8.11.
The sensitivity analysis showed that changes in the building envelope have very little effect on the electricity demand. Furthermore, the calculation model is more sensitive to changes in the business activities than to changes in the HVAC system. No parameter change had an effect on the heating and cooling demand that exceeded a deviation of 7 kWha/m2. It can therefore be concluded that if there are minor errors in the parameter estimate, this should not have a major effect on the calculated results for the heating and cooling demands.
One comment on this result is that the energy performance measure defined by the Swedish authorities reflects only the performance of the building and not the activities in the building. In this case, changes of the building envelope had only a marginal effect on the energy performance measure, whereas changes in the activities had a much larger impact on the energy performance.
116
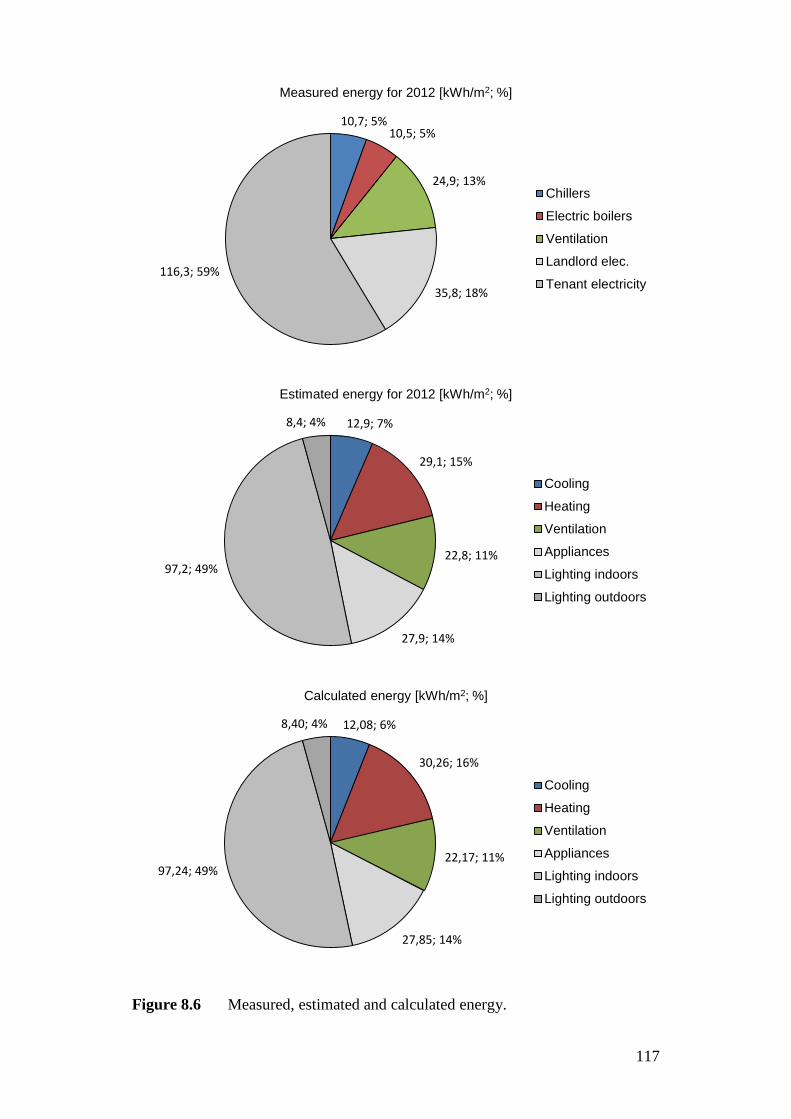
Figure 8.6 Measured, estimated and calculated energy.
10,7; 5% 10,5; 5%
24,9; 13%
35,8; 18%
116,3; 59%
Measured energy for 2012 [kWh/m2; %]
Chillers
Electric boilers
Ventilation
Landlord elec.
Tenant electricity
12,9; 7%
29,1; 15%
22,8; 11%
27,9; 14%
97,2; 49%
8,4; 4%
Estimated energy for 2012 [kWh/m2; %]
Cooling
Heating
Ventilation
Appliances
Lighting indoors
Lighting outdoors
12,08; 6%
30,26; 16%
22,17; 11%
27,85; 14%
97,24; 49%
8,40; 4%
Calculated energy [kWh/m2; %]
Cooling
Heating
Ventilation
Appliances
Lighting indoors
Lighting outdoors
117

9 IMPROVED ENERGY EFFICIENCY How can energy efficiency be improved by using an alternative building envelope, lighting and equipment, HVAC system or supply systems? In previous chapters a model of the case study building (an existing shopping mall) was developed, calibrated and analysed. In this chapter the model is used for calculating how the energy use can be reduced. In the second section of this chapter, Section 9.2, improvements that realistically could be made in the existing shopping mall by renovation are analysed. In the next section, Section 9.3 Designing a New Building, alternative designs for a new building are analysed.
The analysis of different retrofits and designs was performed by testing different parameter values in the calculation model, in a way that represents different system solutions. To optimise one parameter at a time is simple, but to optimise the system as a whole implies that all parameters must be optimised simultaneously. Therefore, a method of careful selection of parameter values based on the sensitivity analysis (in section 8.4) and information from the literature review (in Chapter 3) was chosen. Despite this, there might be combinations of parameter values that have better energy efficiency than the solutions examined in this chapter. However, by this method, realistic examples of how energy can be reduced in the case study building (and similar buildings) are presented.
The results presented in this chapter are for an academic purpose. Prior to an actual retrofit of an existing building or when a new building is constructed, more detailed and precise calculations are needed for the specific circumstances. The focus here is on the methodology and to give a good indication of the energy saving potential. In other words, the aim and focus of this chapter is to create a feeling for the order of magnitude that different energy efficiency measure might achieve.
Another limitation of the results presented here is that no economic evaluation was performed. In the analysis of different retrofits and designs solutions, only the technical potential was directly considered and addressed. A cost analysis was not performed for the selected solutions. However, in the analysis selected parameter values were chosen so that they reflect technical solutions that are available on the market today. The aim is that the calculation results should represent simple and well-known building technologies and configurations. More advanced and innovative solutions could have larger energy efficiency potential than the results presented in this chapter.
Another point to bear in mind is that the case study building on which the calculation model is based is a building that is considered to have low energy use compared to other similar buildings. This was shown in Chapter 4. The base case
119
energy use was therefore lower than for the majority of existing shopping malls. It is therefore to be expected that many other shopping malls, with a larger energy use than the case study building, would have a larger potential for energy efficiency improvements than is shown in this chapter.
9.1 Energy efficiency Energy efficiency is usually connected to less use of energy. EPBD use expressions like buildings with high or improved energy performance, which is commonly understood as buildings using less energy. However, energy efficiency is increased when something delivers more services with the same energy input, or the same services with less energy input.[43] This is how energy efficiency, with few exceptions, should be understood in this thesis. For example, when a compact florescent light bulb uses less energy than an incandescent bulb to give the same amount of light, the compact florescent light bulb is considered to be more energy efficient. Related to the case study, all proposed energy efficiency measures should result in at least the same indoor climate.
Since a building is a system of interacting parts and components it is important to take all energy flows into account. When developing and implementing new energy efficient technologies for buildings, the effect on the total energy use for the building need to be analysed. For instance, focusing on thermal energy only in a low-energy building study, without taking the electrical energy into consideration is a questionable approach. Without sufficient information about the influence on both thermal energy use and electrical energy use, there is an obvious risk of erroneous conclusions.[1]
Different energy forms use more or less primary energy, where so called primary energy factors are used to balance between different forms of energy. Energy efficiency can with that aspect taken into account be defined as something that delivers more services with the same primary energy input, or the same services with less primary energy input. However, in this thesis the focus is more on efficient use of energy (energy need) within the building and less focus is given to the (primary) energy supplied to the building. The suggested approach is that, firstly the energy need in the building should be reduced. When the building use as little energy as possible for meeting the requirements of the activities in the building and the required indoor climate, then secondly the most appropriate supply system to meet the remaining needs should be selected. Commonly, large focus is on energy supply and energy (end) use does not always gain equal attention.
Taking it one step further, in reality, also economics has to be considered. In such case only cost-effective energy efficiency measures, given a certain requirement on the cost-effectiveness, should be considered.
9.2 Energy Retrofit Measures The case study shopping mall was built in the year 2004, so it can be expected that the building is too new for major renovations of the building envelop to be considered. Furthermore, the sensitivity analysis indicates that minor changes to the building envelope have only a small impact on the total electricity use, see
120
Figure 8.4 and Table 8.13 in Section 8.4. Only one building parameter change affects the electricity use by more than 1 kWha/m2. This is the orientation parameter and this is not a parameter that is realistically possible to change for the existing building through a retrofit. With this information at hand the parametric study of possible retrofits will focus on the HVAC system and not include any improvement of the building envelope.
9.2.1 Improved HVAC system Table 9.1 presents the parameter values that were used to simulate an improved HVAC system for the case study building. Regarding the heat exchangers’ effectiveness, 85 % represents the best available rotating heat exchanger on the market.[33] Although, manufacturers claim this efficiency in their product data information, there are no field measurements that prove that this efficiency really can be achieved in a real installation.[74] In order not to overestimate the potential for heat exchange from the exhaust air a value of 80 % for the heat exchanger efficiency was chosen.
Regarding the SFP, a future value to aim for is close to 1 kW/m³/s.[29] In order not to overestimate, a value of 1.5 kW/m3/s was chosen for this energy retrofit analysis. This is the same value that was used in a similar study of offices by Flodberg[33].
Regarding the COPcool for the chillers, used for comfort cooling, the value 3 was chosen. This value was chosen because it is a common value for chillers used for comfort cooling.[75]
Regarding the ventilation flow rate, a value of 1.3 l/s/m2 was chosen. As was discussed in Section 8.2.3, regarding the AHUs operation, the ventilation flow rate of 1.6 l/s/m2 is more than enough to achieve the required hygienic flow. The design factor is not the hygienic flow rate but the cooling demand under design conditions. It is important not to choose a flow rate that will cause unacceptable indoor temperatures on hot summer days. The chosen flow rate of 1.3 l/s/m2 is a 20 % reduction from the base case, and with this flow rate it has been ascertained that the indoor temperature would not exceed 25 °C at any time.
Table 9.1 Chosen parameter values for the improved HVAC system
Base case Improved SFP [kW/(m³/s)] 2.7 1.5 Vent flow rate [l/s/m2] 1.6 1.3 COPcool [-] 2.5 3 Set. room temp. day [°C] 22 23 Free cooling [°C] 12 13 VVX [%] 70 80 Min room temp. night [°C] 20 19 Max room temp. night [°C] 24 25 Max supply temp. [°C] 20 19
121
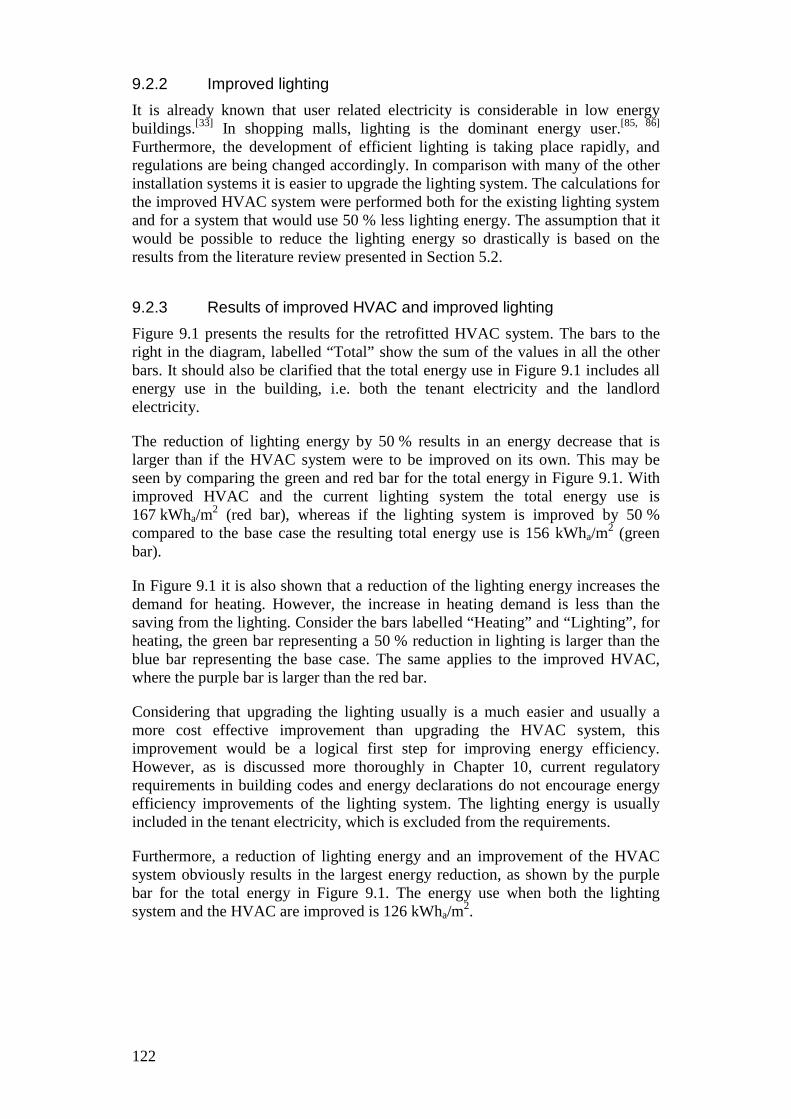
9.2.2 Improved lighting It is already known that user related electricity is considerable in low energy buildings.[33] In shopping malls, lighting is the dominant energy user.[85, 86] Furthermore, the development of efficient lighting is taking place rapidly, and regulations are being changed accordingly. In comparison with many of the other installation systems it is easier to upgrade the lighting system. The calculations for the improved HVAC system were performed both for the existing lighting system and for a system that would use 50 % less lighting energy. The assumption that it would be possible to reduce the lighting energy so drastically is based on the results from the literature review presented in Section 5.2.
9.2.3 Results of improved HVAC and improved lighting Figure 9.1 presents the results for the retrofitted HVAC system. The bars to the right in the diagram, labelled “Total” show the sum of the values in all the other bars. It should also be clarified that the total energy use in Figure 9.1 includes all energy use in the building, i.e. both the tenant electricity and the landlord electricity.
The reduction of lighting energy by 50 % results in an energy decrease that is larger than if the HVAC system were to be improved on its own. This may be seen by comparing the green and red bar for the total energy in Figure 9.1. With improved HVAC and the current lighting system the total energy use is 167 kWha/m2 (red bar), whereas if the lighting system is improved by 50 % compared to the base case the resulting total energy use is 156 kWha/m2 (green bar).
In Figure 9.1 it is also shown that a reduction of the lighting energy increases the demand for heating. However, the increase in heating demand is less than the saving from the lighting. Consider the bars labelled “Heating” and “Lighting”, for heating, the green bar representing a 50 % reduction in lighting is larger than the blue bar representing the base case. The same applies to the improved HVAC, where the purple bar is larger than the red bar.
Considering that upgrading the lighting usually is a much easier and usually a more cost effective improvement than upgrading the HVAC system, this improvement would be a logical first step for improving energy efficiency. However, as is discussed more thoroughly in Chapter 10, current regulatory requirements in building codes and energy declarations do not encourage energy efficiency improvements of the lighting system. The lighting energy is usually included in the tenant electricity, which is excluded from the requirements.
Furthermore, a reduction of lighting energy and an improvement of the HVAC system obviously results in the largest energy reduction, as shown by the purple bar for the total energy in Figure 9.1. The energy use when both the lighting system and the HVAC are improved is 126 kWha/m2.
122
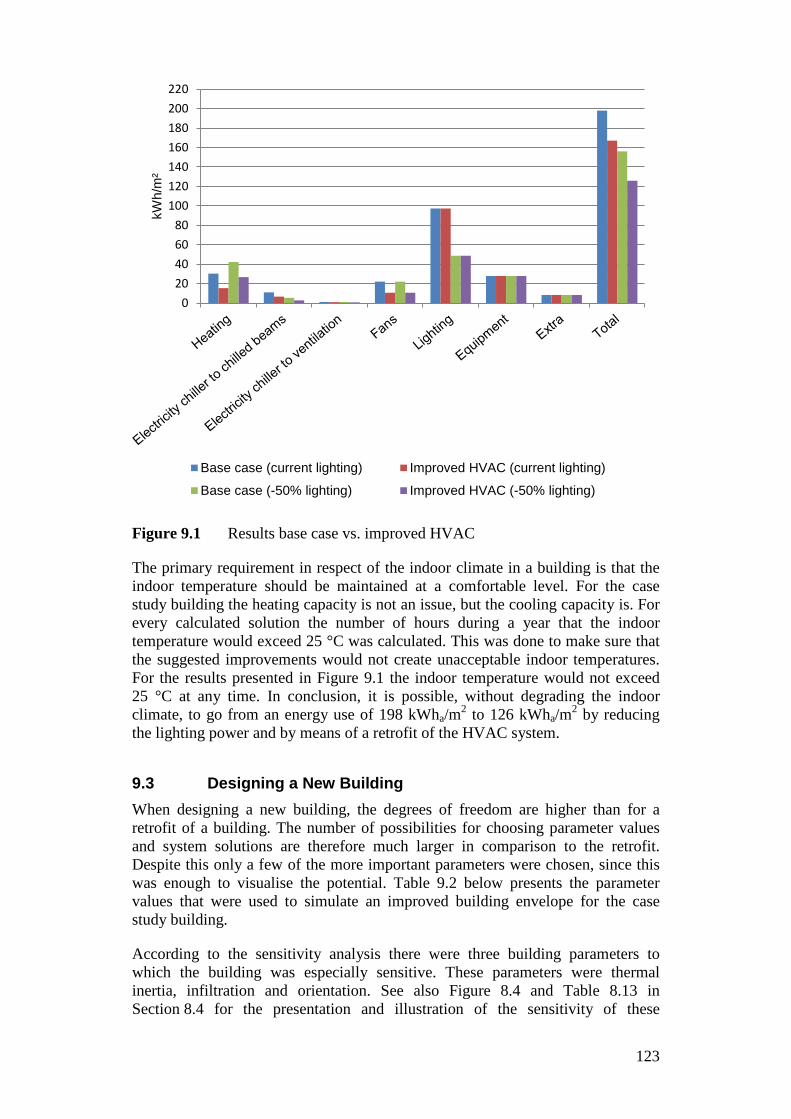
Figure 9.1 Results base case vs. improved HVAC
The primary requirement in respect of the indoor climate in a building is that the indoor temperature should be maintained at a comfortable level. For the case study building the heating capacity is not an issue, but the cooling capacity is. For every calculated solution the number of hours during a year that the indoor temperature would exceed 25 °C was calculated. This was done to make sure that the suggested improvements would not create unacceptable indoor temperatures. For the results presented in Figure 9.1 the indoor temperature would not exceed 25 °C at any time. In conclusion, it is possible, without degrading the indoor climate, to go from an energy use of 198 kWha/m2 to 126 kWha/m2 by reducing the lighting power and by means of a retrofit of the HVAC system.
9.3 Designing a New Building When designing a new building, the degrees of freedom are higher than for a retrofit of a building. The number of possibilities for choosing parameter values and system solutions are therefore much larger in comparison to the retrofit. Despite this only a few of the more important parameters were chosen, since this was enough to visualise the potential. Table 9.2 below presents the parameter values that were used to simulate an improved building envelope for the case study building.
According to the sensitivity analysis there were three building parameters to which the building was especially sensitive. These parameters were thermal inertia, infiltration and orientation. See also Figure 8.4 and Table 8.13 in Section 8.4 for the presentation and illustration of the sensitivity of these
020406080
100120140160180200220
kWh/
m²
Base case (current lighting) Improved HVAC (current lighting)
Base case (-50% lighting) Improved HVAC (-50% lighting)
123
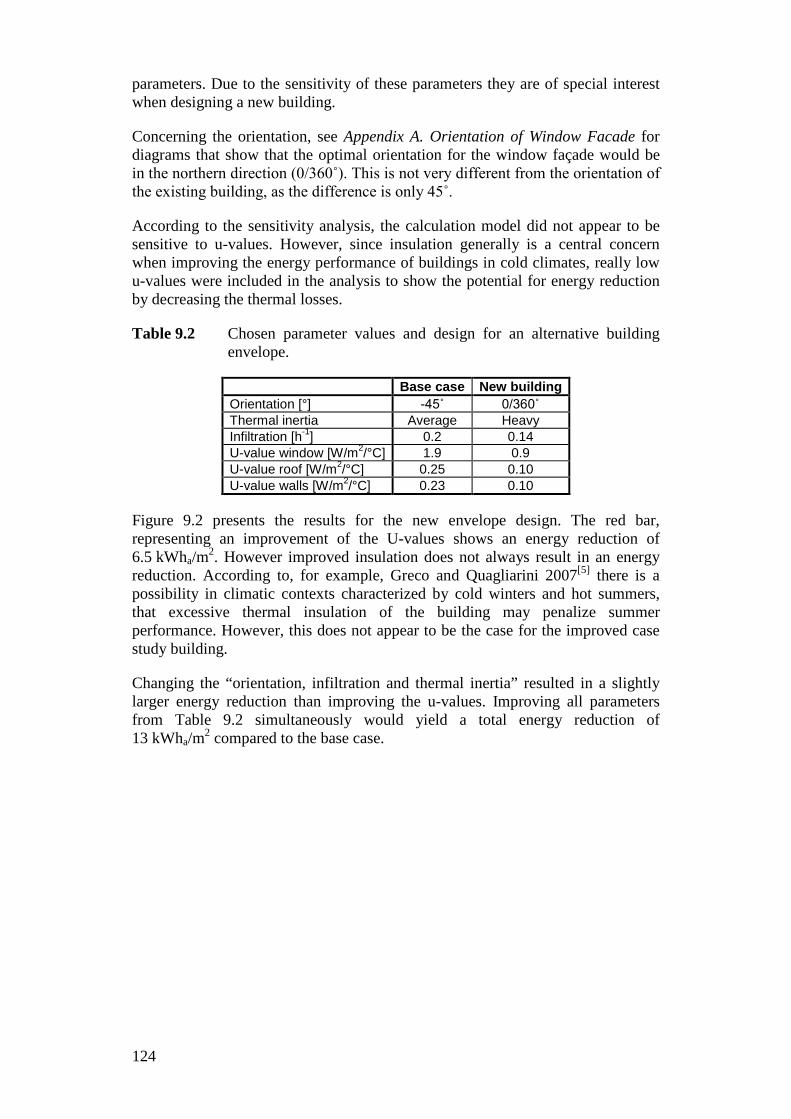
parameters. Due to the sensitivity of these parameters they are of special interest when designing a new building.
Concerning the orientation, see Appendix A. Orientation of Window Facade for diagrams that show that the optimal orientation for the window façade would be in the northern direction (0/360˚). This is not very different from the orientation of the existing building, as the difference is only 45˚.
According to the sensitivity analysis, the calculation model did not appear to be sensitive to u-values. However, since insulation generally is a central concern when improving the energy performance of buildings in cold climates, really low u-values were included in the analysis to show the potential for energy reduction by decreasing the thermal losses.
Table 9.2 Chosen parameter values and design for an alternative building envelope.
Base case New building Orientation [°] -45˚ 0/360˚ Thermal inertia Average Heavy Infiltration [h-1] 0.2 0.14 U-value window [W/m2/°C] 1.9 0.9 U-value roof [W/m2/°C] 0.25 0.10 U-value walls [W/m2/°C] 0.23 0.10
Figure 9.2 presents the results for the new envelope design. The red bar, representing an improvement of the U-values shows an energy reduction of 6.5 kWha/m2. However improved insulation does not always result in an energy reduction. According to, for example, Greco and Quagliarini 2007[5] there is a possibility in climatic contexts characterized by cold winters and hot summers, that excessive thermal insulation of the building may penalize summer performance. However, this does not appear to be the case for the improved case study building.
Changing the “orientation, infiltration and thermal inertia” resulted in a slightly larger energy reduction than improving the u-values. Improving all parameters from Table 9.2 simultaneously would yield a total energy reduction of 13 kWha/m2 compared to the base case.
124
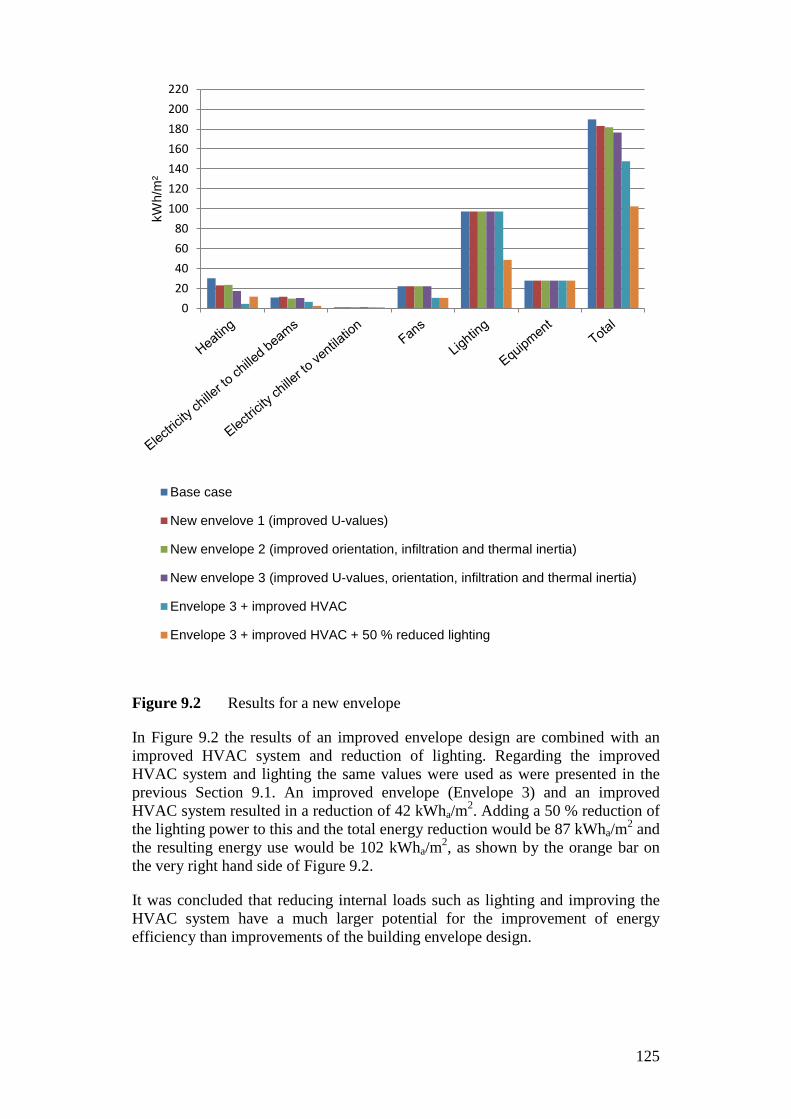
Figure 9.2 Results for a new envelope
In Figure 9.2 the results of an improved envelope design are combined with an improved HVAC system and reduction of lighting. Regarding the improved HVAC system and lighting the same values were used as were presented in the previous Section 9.1. An improved envelope (Envelope 3) and an improved HVAC system resulted in a reduction of 42 kWha/m2. Adding a 50 % reduction of the lighting power to this and the total energy reduction would be 87 kWha/m2 and the resulting energy use would be 102 kWha/m2, as shown by the orange bar on the very right hand side of Figure 9.2.
It was concluded that reducing internal loads such as lighting and improving the HVAC system have a much larger potential for the improvement of energy efficiency than improvements of the building envelope design.
020406080
100120140160180200220
kWh/
m²
Base case
New envelove 1 (improved U-values)
New envelope 2 (improved orientation, infiltration and thermal inertia)
New envelope 3 (improved U-values, orientation, infiltration and thermal inertia)
Envelope 3 + improved HVAC
Envelope 3 + improved HVAC + 50 % reduced lighting
125
9.4 Discussion and Summary A number of possible energy retrofits and alternative design solutions for the case study building are presented in this chapter. Only a selection of possible solutions have been tested and a further study might look into other solutions including for example recovery of heat from water-cooled condensors, solar photovoltaic panels, heat pumps and other control strategies.
However, even with the limited number of solutions tested in this chapter, a great potential for energy reduction was found. Based on the calculations for the case study building it can be concluded that by means of a retrofit the energy use can be reduced by 36 % from 198 kWha/m2, down to 126 kWha/m2. When designing a new building the energy can be reduced by 46 %, down to 102 kWha/m2. These two results are based on the assumption that energy for lighting can be reduced by 50 %.
It should be emphasised that this potential was found for a building that is already among the buildings that has the best energy performance, according to results presented in Chapter 4. Also the case study building has considerably lower total energy use than the average total energy use reported by the Stil2-09 study. The case study building uses approximately 200 kWha/m2, whereas the national average is approximately 260 kWha/m2.This indicates that there is a still larger potential for the shopping mall sector as a whole.
126
10 ANALYSIS OF REGULATORY REQUIREMENTS Are current regulatory requirements effective in promoting energy efficiency measures in shopping malls? Shopping malls are complex buildings in terms of the evaluation of their energy efficiency, as has been evident in previous chapters. For an accurate analysis, correct measurements are needed and even when the measurements are correct there are several input data to a whole building energy analysis that are uncertain and difficult to estimate. The Swedish authorities and government has their own definition of energy use, which is referred to as BBR energy use in this text. The purpose of this chapter is to evaluate whether or not current requirements on energy use in buildings are suitable for shopping malls. When possible, suggestions are given on how the requirements can be developed to increase the incentives for energy efficiency measures.
According to Schade et al. Sweden had strict and detailed regulations in the building code in the late 1970s and 1980s. Strict in the sense of the limits that were provided for the energy related requirements and detailed regarding how these requirements were expressed as technical specifications rather than functional requirements.[76] According to Nässen et al. the recent shift away from the strict and detailed regulation has hindered the improvement of energy efficiency in new buildings.[60] Furthermore, from the survey study by Schade, it was concluded that building standards and regulations regarding energy performance affect how professionals are educated and the way energy requirements and demands are managed throughout the building process. Another conclusion from the work by Nässen et al. [60] is that improvement in energy efficiency is strongly price driven.
10.1 Building Code (BBR) In this section the BBR requirements are analysed from the perspective of their applicability to shopping malls. The existing shopping mall that has been analysed in previous chapters is used here to illustrate the implications of the BBR regulations in a real case scenario. As a reminder and also for those who are less familiar with the BBR, see Chapter 2.
First, the energy performance (according to BBR) is analysed in a comparison between measured energy use (organisational division) and calculated energy use (functional division). Second, the energy performance is analysed for different energy supply systems. Third, the influence of changed lighting energy on the energy performance is analysed.
127
10.1.1 Case study building The measured energy includes the landlord and tenant energy, based on an organisational division. In this case, this means that the energy that is paid for by the landlord will be included in the energy declaration. Whereas the energy paid for by the tenants will not be included, not even if it is used for functions in the building which are normally regulated by the BBR. To illustrate this, a comparison will be made between measured energy use (organisational division) and calculated energy use (functional division), see Table 10.1.
The first two columns in Table 10.1 presents the BBR energy as it would be if it was based on the results from the measurements, as they were presented in Chapter 6. This is the method that would be used most often when energy declarations are performed. Based on the results from the measurements the BBR energy would be 81.9 kWha/m2.
However, when the measured data was analysed in more detail in Chapter 8 it was discovered that the interpretation of the data became different. One major point was that both landlord and tenant energy included heating. For the landlord energy this only means that energy is moved from one post to another in the energy declaration and that more of the energy for heating (30.3 instead of 10.5 kWha/m2) has to be degree day corrected (to correspond to the value it would be expected to have in a year with “average” weather). For the tenant energy on the other hand this means that there is energy that was excluded from the energy declaration that should have been included (since heating must be reported in the declaration). To clarify this in the table, the tenant energy columns have different headings (with and without heating). For the calculated energy a more functional division is used where the tenant electricity is divided between lighting and appliances, and the heating has been moved and included in the BBR energy and the value becomes 90.7 kWha/m2.
It has been shown that there is a difference of 10.7 % between the BBR energy based on an organisational division (81.9 kWha/m2) and the BBR energy based on a functional division (90.7 kWha/m2), for the case study building. The total energy use is however the same, 81.9 + 116.2 = 198.2 kWha/m2 and 90.7 + 107.3 = 198.0 kWha/m2.
The BBR energy values presented here represent a specific year (2012). If they were normalised to apply to a normal year, we would arrive at the BBR energy declared in the energy declaration. Depending on the actual conditions (mainly ambient temperature variations) and normalisation method the difference between the two resulting values may decrease or increase.
Another reason that the BBR energy can assume different values is the way lighting and appliances are divided between landlord and tenant. As seen in Table 10.1, for the calculated energy, lighting and appliances are divided between the landlord electricity and the tenant electricity. Therefore, only the part of lighting and appliance energy that is paid by the landlord is included in the BBR energy.
128
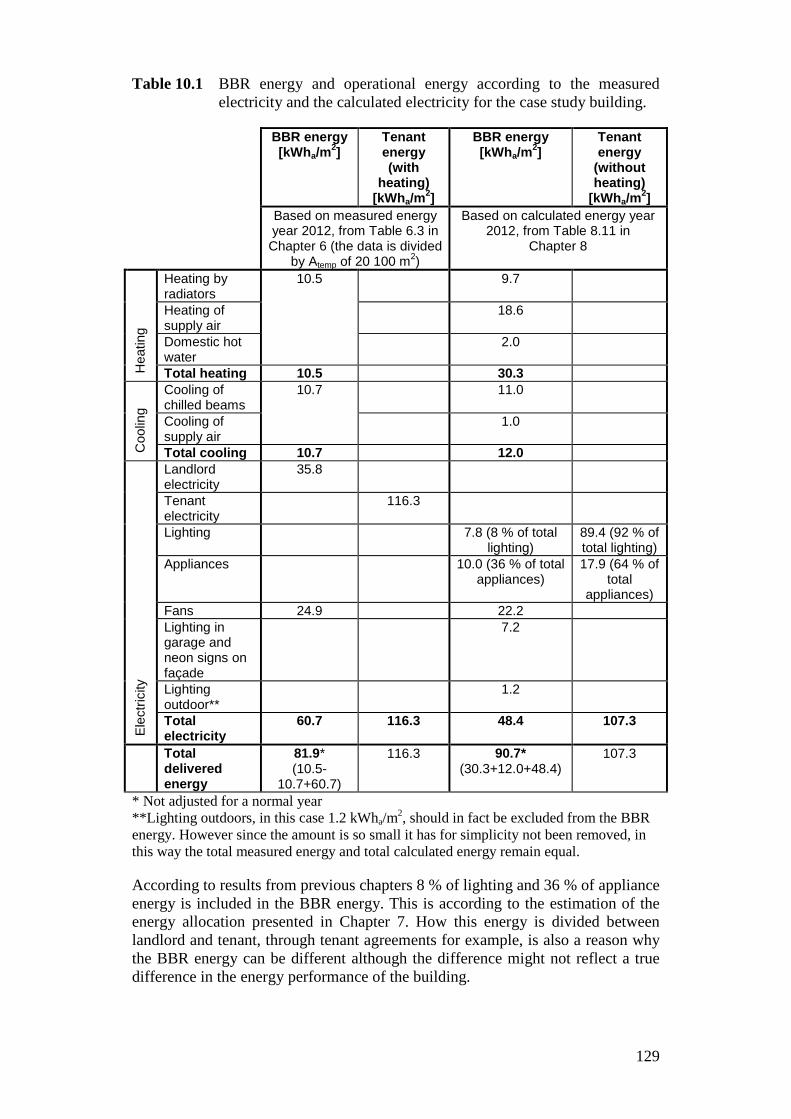
Table 10.1 BBR energy and operational energy according to the measured electricity and the calculated electricity for the case study building.
BBR energy [kWha/m2]
Tenant energy (with
heating) [kWha/m2]
BBR energy [kWha/m2]
Tenant energy
(without heating)
[kWha/m2] Based on measured energy
year 2012, from Table 6.3 in Chapter 6 (the data is divided
by Atemp of 20 100 m2)
Based on calculated energy year 2012, from Table 8.11 in
Chapter 8
Hea
ting
Heating by radiators
10.5 9.7
Heating of supply air
18.6
Domestic hot water
2.0
Total heating 10.5 30.3
Coo
ling
Cooling of chilled beams
10.7 11.0
Cooling of supply air
1.0
Total cooling 10.7 12.0
Elec
trici
ty
Landlord electricity
35.8
Tenant electricity
116.3
Lighting 7.8 (8 % of total lighting)
89.4 (92 % of total lighting)
Appliances 10.0 (36 % of total appliances)
17.9 (64 % of total
appliances) Fans 24.9 22.2 Lighting in garage and neon signs on façade
7.2
Lighting outdoor**
1.2
Total electricity
60.7 116.3 48.4 107.3
Total delivered energy
81.9* (10.5-
10.7+60.7)
116.3 90.7* (30.3+12.0+48.4)
107.3
* Not adjusted for a normal year **Lighting outdoors, in this case 1.2 kWha/m2, should in fact be excluded from the BBR energy. However since the amount is so small it has for simplicity not been removed, in this way the total measured energy and total calculated energy remain equal.
According to results from previous chapters 8 % of lighting and 36 % of appliance energy is included in the BBR energy. This is according to the estimation of the energy allocation presented in Chapter 7. How this energy is divided between landlord and tenant, through tenant agreements for example, is also a reason why the BBR energy can be different although the difference might not reflect a true difference in the energy performance of the building.
129
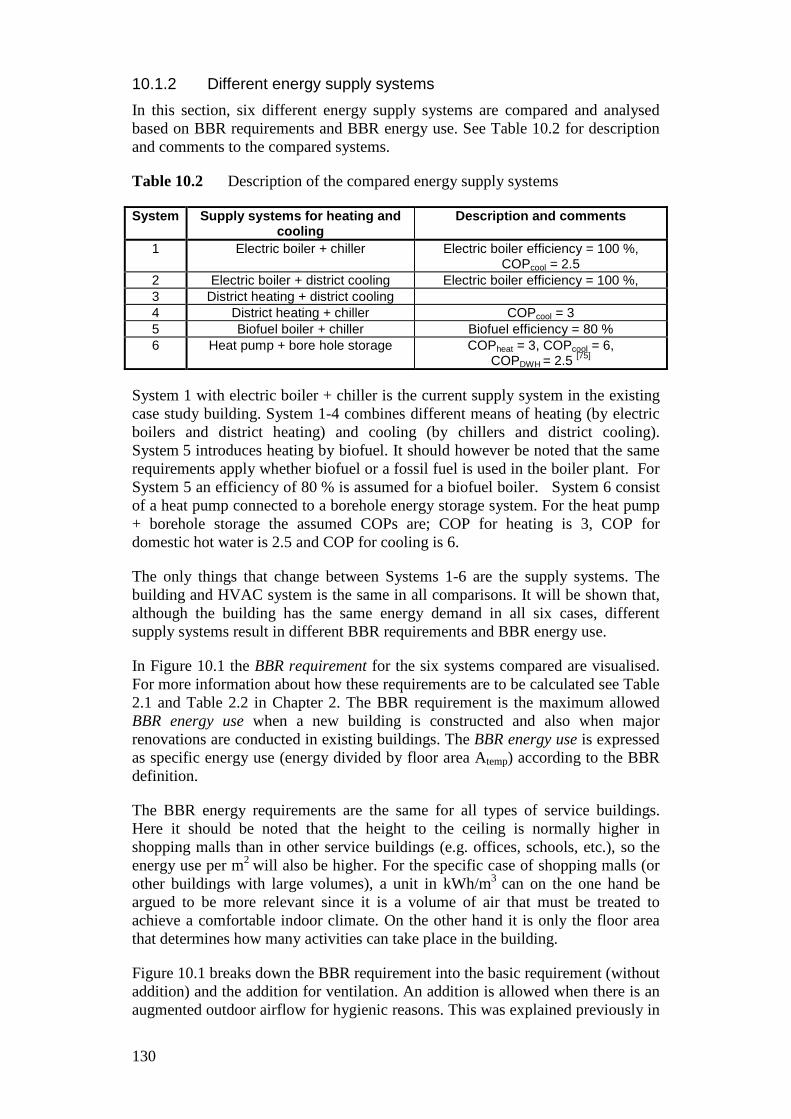
10.1.2 Different energy supply systems In this section, six different energy supply systems are compared and analysed based on BBR requirements and BBR energy use. See Table 10.2 for description and comments to the compared systems.
Table 10.2 Description of the compared energy supply systems
System Supply systems for heating and cooling
Description and comments
1 Electric boiler + chiller Electric boiler efficiency = 100 %, COPcool = 2.5
2 Electric boiler + district cooling Electric boiler efficiency = 100 %, 3 District heating + district cooling 4 District heating + chiller COPcool = 3 5 Biofuel boiler + chiller Biofuel efficiency = 80 % 6 Heat pump + bore hole storage COPheat = 3, COPcool = 6,
COPDWH = 2.5 [75]
System 1 with electric boiler + chiller is the current supply system in the existing case study building. System 1-4 combines different means of heating (by electric boilers and district heating) and cooling (by chillers and district cooling). System 5 introduces heating by biofuel. It should however be noted that the same requirements apply whether biofuel or a fossil fuel is used in the boiler plant. For System 5 an efficiency of 80 % is assumed for a biofuel boiler. System 6 consist of a heat pump connected to a borehole energy storage system. For the heat pump + borehole storage the assumed COPs are; COP for heating is 3, COP for domestic hot water is 2.5 and COP for cooling is 6.
The only things that change between Systems 1-6 are the supply systems. The building and HVAC system is the same in all comparisons. It will be shown that, although the building has the same energy demand in all six cases, different supply systems result in different BBR requirements and BBR energy use.
In Figure 10.1 the BBR requirement for the six systems compared are visualised. For more information about how these requirements are to be calculated see Table 2.1 and Table 2.2 in Chapter 2. The BBR requirement is the maximum allowed BBR energy use when a new building is constructed and also when major renovations are conducted in existing buildings. The BBR energy use is expressed as specific energy use (energy divided by floor area Atemp) according to the BBR definition.
The BBR energy requirements are the same for all types of service buildings. Here it should be noted that the height to the ceiling is normally higher in shopping malls than in other service buildings (e.g. offices, schools, etc.), so the energy use per m2 will also be higher. For the specific case of shopping malls (or other buildings with large volumes), a unit in kWh/m3 can on the one hand be argued to be more relevant since it is a volume of air that must be treated to achieve a comfortable indoor climate. On the other hand it is only the floor area that determines how many activities can take place in the building.
Figure 10.1 breaks down the BBR requirement into the basic requirement (without addition) and the addition for ventilation. An addition is allowed when there is an augmented outdoor airflow for hygienic reasons. This was explained previously in
130
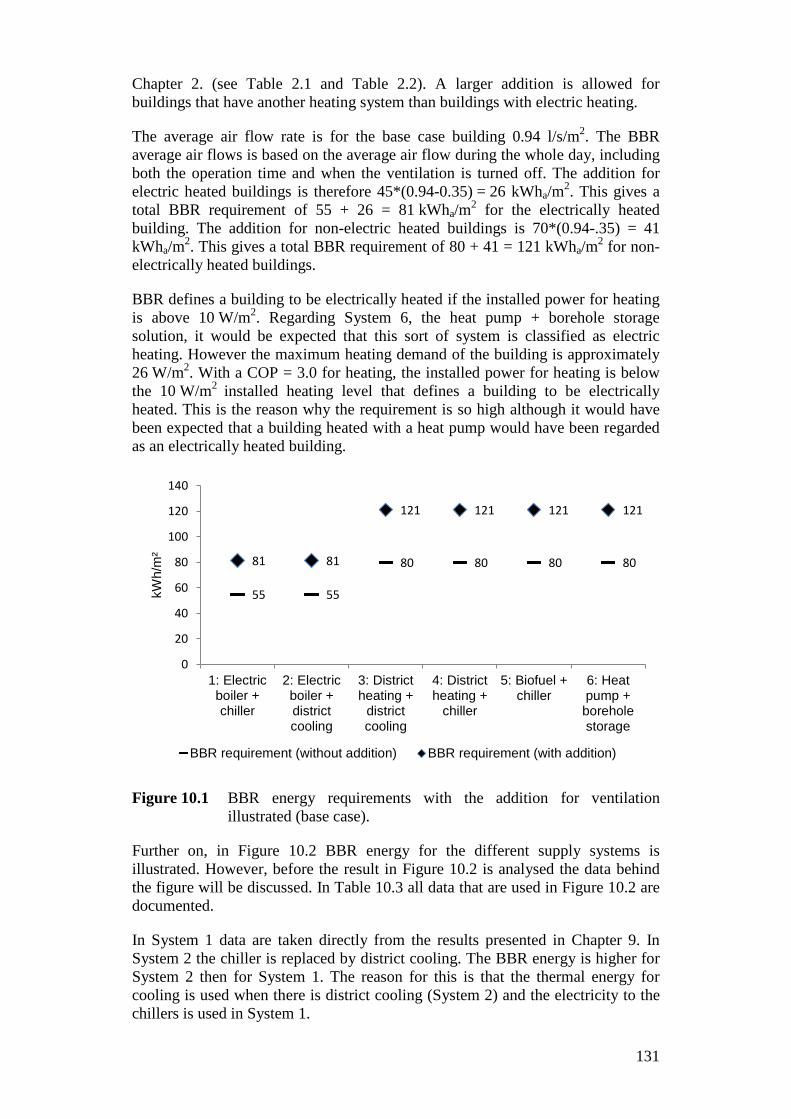
Chapter 2. (see Table 2.1 and Table 2.2). A larger addition is allowed for buildings that have another heating system than buildings with electric heating.
The average air flow rate is for the base case building 0.94 l/s/m2. The BBR average air flows is based on the average air flow during the whole day, including both the operation time and when the ventilation is turned off. The addition for electric heated buildings is therefore 45*(0.94-0.35) = 26 kWha/m2. This gives a total BBR requirement of 55 + 26 = 81 kWha/m2 for the electrically heated building. The addition for non-electric heated buildings is 70*(0.94-.35) = 41 kWha/m2. This gives a total BBR requirement of 80 + 41 = 121 kWha/m2 for non-electrically heated buildings.
BBR defines a building to be electrically heated if the installed power for heating is above 10 W/m2. Regarding System 6, the heat pump + borehole storage solution, it would be expected that this sort of system is classified as electric heating. However the maximum heating demand of the building is approximately 26 W/m2. With a COP = 3.0 for heating, the installed power for heating is below the 10 W/m2 installed heating level that defines a building to be electrically heated. This is the reason why the requirement is so high although it would have been expected that a building heated with a heat pump would have been regarded as an electrically heated building.
Figure 10.1 BBR energy requirements with the addition for ventilation illustrated (base case).
Further on, in Figure 10.2 BBR energy for the different supply systems is illustrated. However, before the result in Figure 10.2 is analysed the data behind the figure will be discussed. In Table 10.3 all data that are used in Figure 10.2 are documented.
In System 1 data are taken directly from the results presented in Chapter 9. In System 2 the chiller is replaced by district cooling. The BBR energy is higher for System 2 then for System 1. The reason for this is that the thermal energy for cooling is used when there is district cooling (System 2) and the electricity to the chillers is used in System 1.
55 55
80 80 80 80 81 81
121 121 121 121
0
20
40
60
80
100
120
140
1: Electricboiler +chiller
2: Electricboiler +districtcooling
3: Districtheating +
districtcooling
4: Districtheating +
chiller
5: Biofuel +chiller
6: Heatpump +boreholestorage
kWh/
m²
BBR requirement (without addition) BBR requirement (with addition)
131
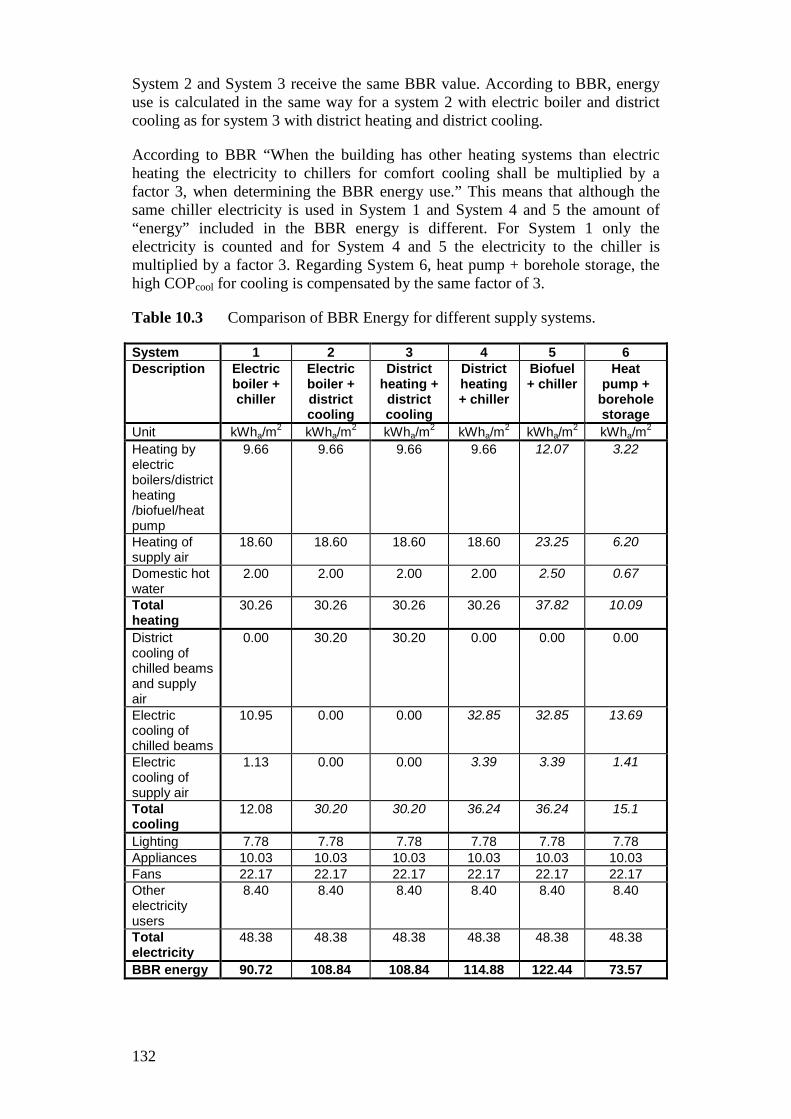
System 2 and System 3 receive the same BBR value. According to BBR, energy use is calculated in the same way for a system 2 with electric boiler and district cooling as for system 3 with district heating and district cooling.
According to BBR “When the building has other heating systems than electric heating the electricity to chillers for comfort cooling shall be multiplied by a factor 3, when determining the BBR energy use.” This means that although the same chiller electricity is used in System 1 and System 4 and 5 the amount of “energy” included in the BBR energy is different. For System 1 only the electricity is counted and for System 4 and 5 the electricity to the chiller is multiplied by a factor 3. Regarding System 6, heat pump + borehole storage, the high COPcool for cooling is compensated by the same factor of 3.
Table 10.3 Comparison of BBR Energy for different supply systems.
System 1 2 3 4 5 6 Description Electric
boiler + chiller
Electric boiler + district cooling
District heating + district cooling
District heating + chiller
Biofuel + chiller
Heat pump +
borehole storage
Unit kWha/m2 kWha/m2 kWha/m2 kWha/m2 kWha/m2 kWha/m2 Heating by electric boilers/district heating /biofuel/heat pump
9.66 9.66 9.66 9.66 12.07 3.22
Heating of supply air
18.60 18.60 18.60 18.60 23.25 6.20
Domestic hot water
2.00 2.00 2.00 2.00 2.50 0.67
Total heating
30.26 30.26 30.26 30.26 37.82 10.09
District cooling of chilled beams and supply air
0.00 30.20 30.20 0.00 0.00 0.00
Electric cooling of chilled beams
10.95 0.00 0.00 32.85 32.85 13.69
Electric cooling of supply air
1.13 0.00 0.00 3.39 3.39 1.41
Total cooling
12.08 30.20 30.20 36.24 36.24 15.1
Lighting 7.78 7.78 7.78 7.78 7.78 7.78 Appliances 10.03 10.03 10.03 10.03 10.03 10.03 Fans 22.17 22.17 22.17 22.17 22.17 22.17 Other electricity users
8.40 8.40 8.40 8.40 8.40 8.40
Total electricity
48.38
48.38
48.38
48.38
48.38
48.38
BBR energy 90.72 108.84 108.84 114.88 122.44 73.57
132
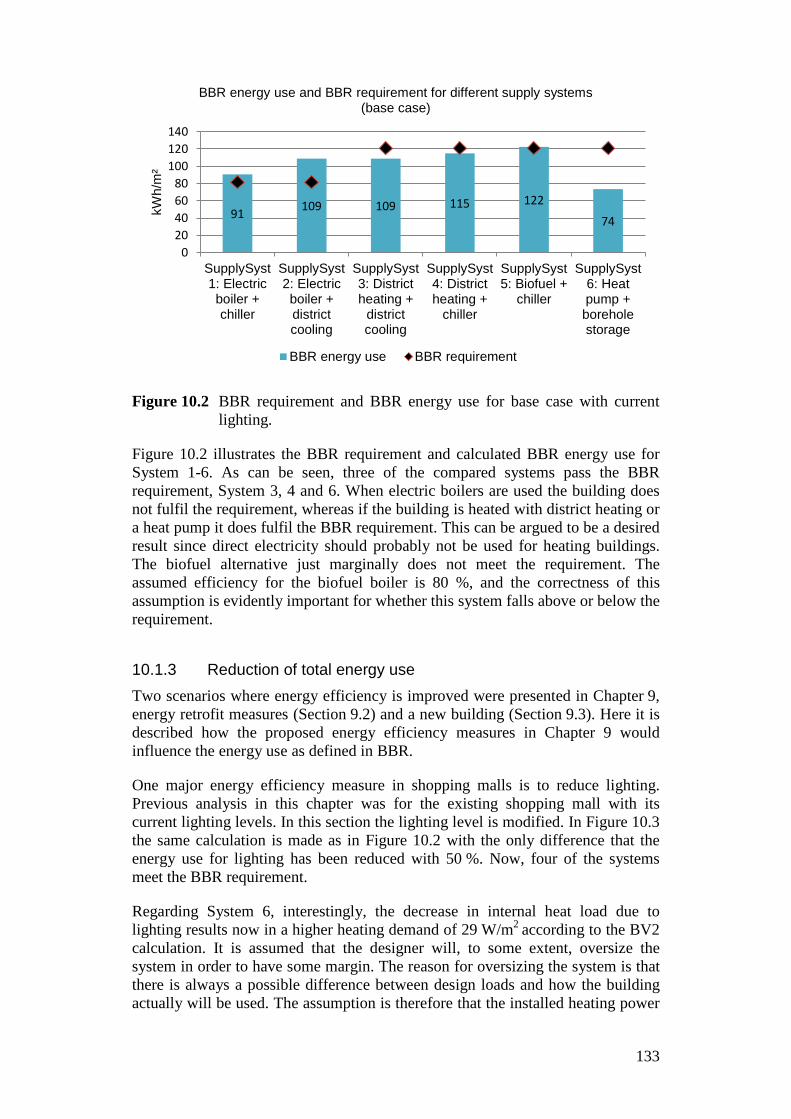
Figure 10.2 BBR requirement and BBR energy use for base case with current lighting.
Figure 10.2 illustrates the BBR requirement and calculated BBR energy use for System 1-6. As can be seen, three of the compared systems pass the BBR requirement, System 3, 4 and 6. When electric boilers are used the building does not fulfil the requirement, whereas if the building is heated with district heating or a heat pump it does fulfil the BBR requirement. This can be argued to be a desired result since direct electricity should probably not be used for heating buildings. The biofuel alternative just marginally does not meet the requirement. The assumed efficiency for the biofuel boiler is 80 %, and the correctness of this assumption is evidently important for whether this system falls above or below the requirement.
10.1.3 Reduction of total energy use Two scenarios where energy efficiency is improved were presented in Chapter 9, energy retrofit measures (Section 9.2) and a new building (Section 9.3). Here it is described how the proposed energy efficiency measures in Chapter 9 would influence the energy use as defined in BBR.
One major energy efficiency measure in shopping malls is to reduce lighting. Previous analysis in this chapter was for the existing shopping mall with its current lighting levels. In this section the lighting level is modified. In Figure 10.3 the same calculation is made as in Figure 10.2 with the only difference that the energy use for lighting has been reduced with 50 %. Now, four of the systems meet the BBR requirement.
Regarding System 6, interestingly, the decrease in internal heat load due to lighting results now in a higher heating demand of 29 W/m2 according to the BV2 calculation. It is assumed that the designer will, to some extent, oversize the system in order to have some margin. The reason for oversizing the system is that there is always a possible difference between design loads and how the building actually will be used. The assumption is therefore that the installed heating power
91 109 109 115 122
74
020406080
100120140
SupplySyst1: Electricboiler +chiller
SupplySyst2: Electricboiler +districtcooling
SupplySyst3: Districtheating +
districtcooling
SupplySyst4: Districtheating +
chiller
SupplySyst5: Biofuel +
chiller
SupplySyst6: Heatpump +boreholestorage
kWh/
m²
BBR energy use and BBR requirement for different supply systems (base case)
BBR energy use BBR requirement
133
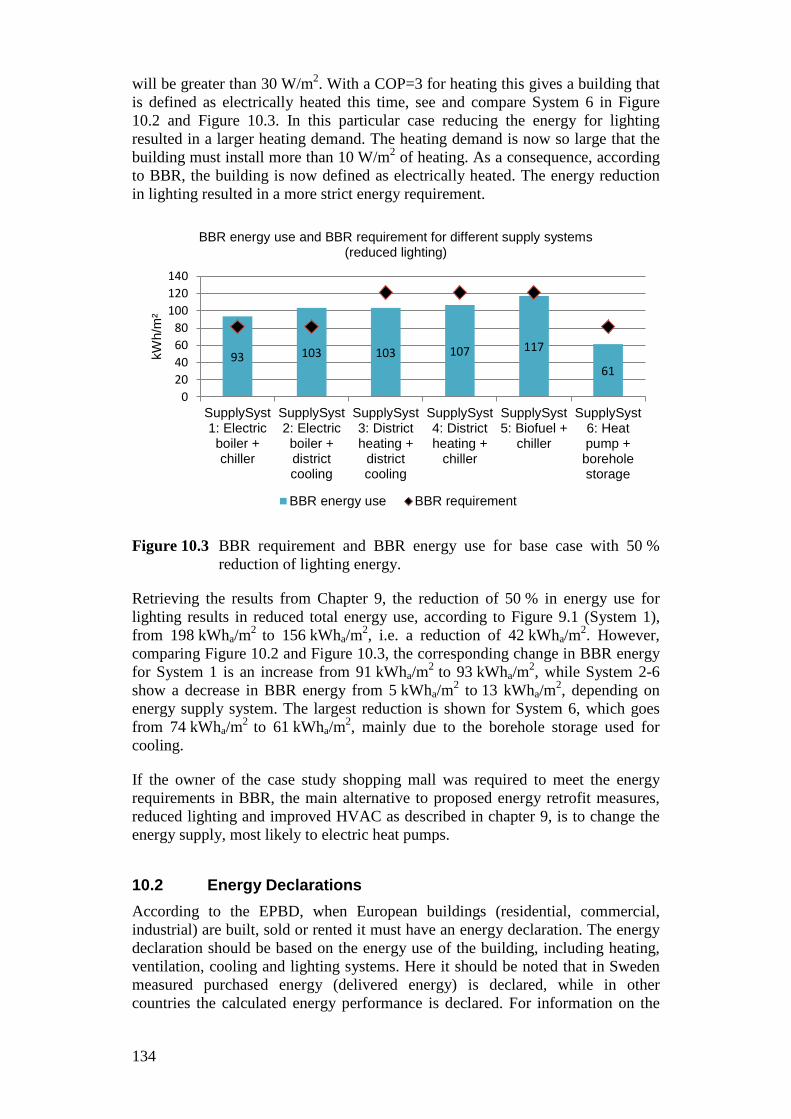
will be greater than 30 W/m2. With a COP=3 for heating this gives a building that is defined as electrically heated this time, see and compare System 6 in Figure 10.2 and Figure 10.3. In this particular case reducing the energy for lighting resulted in a larger heating demand. The heating demand is now so large that the building must install more than 10 W/m2 of heating. As a consequence, according to BBR, the building is now defined as electrically heated. The energy reduction in lighting resulted in a more strict energy requirement.
Figure 10.3 BBR requirement and BBR energy use for base case with 50 % reduction of lighting energy.
Retrieving the results from Chapter 9, the reduction of 50 % in energy use for lighting results in reduced total energy use, according to Figure 9.1 (System 1), from 198 kWha/m2 to 156 kWha/m2, i.e. a reduction of 42 kWha/m2. However, comparing Figure 10.2 and Figure 10.3, the corresponding change in BBR energy for System 1 is an increase from 91 kWha/m2 to 93 kWha/m2, while System 2-6 show a decrease in BBR energy from 5 kWha/m2 to 13 kWha/m2, depending on energy supply system. The largest reduction is shown for System 6, which goes from 74 kWha/m2 to 61 kWha/m2, mainly due to the borehole storage used for cooling.
If the owner of the case study shopping mall was required to meet the energy requirements in BBR, the main alternative to proposed energy retrofit measures, reduced lighting and improved HVAC as described in chapter 9, is to change the energy supply, most likely to electric heat pumps.
10.2 Energy Declarations According to the EPBD, when European buildings (residential, commercial, industrial) are built, sold or rented it must have an energy declaration. The energy declaration should be based on the energy use of the building, including heating, ventilation, cooling and lighting systems. Here it should be noted that in Sweden measured purchased energy (delivered energy) is declared, while in other countries the calculated energy performance is declared. For information on the
93 103 103 107 117
61
020406080
100120140
SupplySyst1: Electricboiler +chiller
SupplySyst2: Electricboiler +districtcooling
SupplySyst3: Districtheating +
districtcooling
SupplySyst4: Districtheating +
chiller
SupplySyst5: Biofuel +
chiller
SupplySyst6: Heatpump +boreholestorage
kWh/
m²
BBR energy use and BBR requirement for different supply systems (reduced lighting)
BBR energy use BBR requirement
134
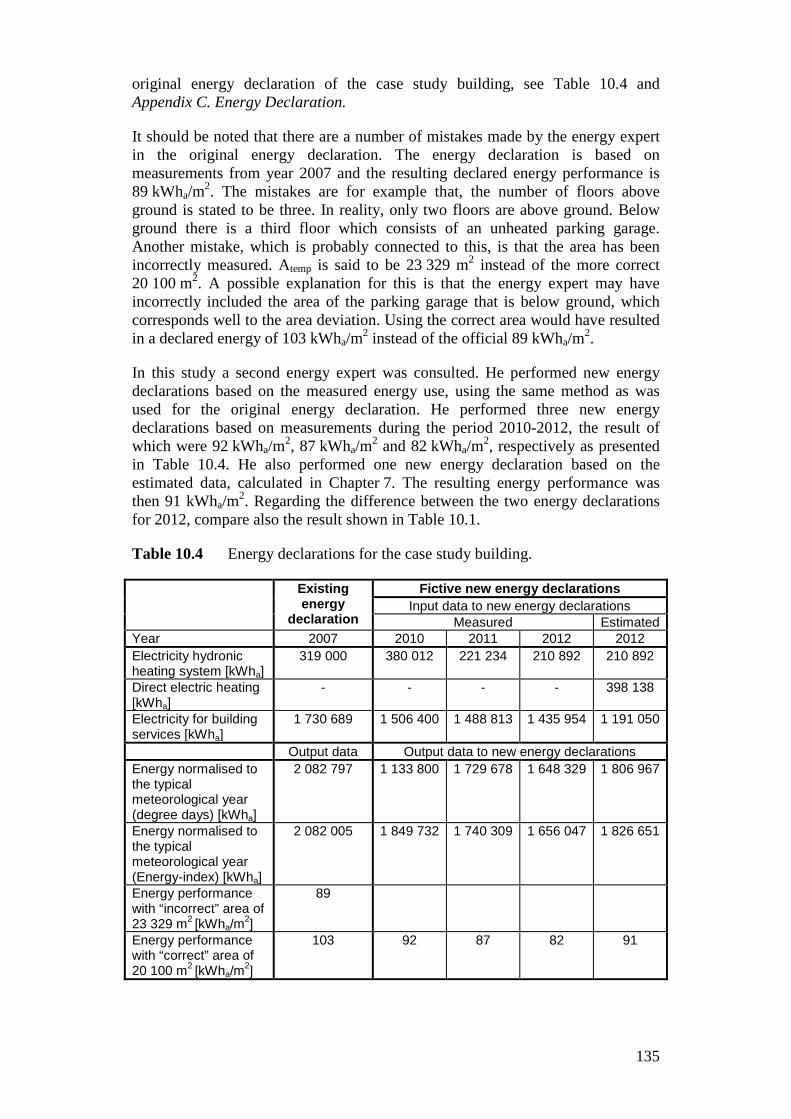
original energy declaration of the case study building, see Table 10.4 and Appendix C. Energy Declaration.
It should be noted that there are a number of mistakes made by the energy expert in the original energy declaration. The energy declaration is based on measurements from year 2007 and the resulting declared energy performance is 89 kWha/m2. The mistakes are for example that, the number of floors above ground is stated to be three. In reality, only two floors are above ground. Below ground there is a third floor which consists of an unheated parking garage. Another mistake, which is probably connected to this, is that the area has been incorrectly measured. Atemp is said to be 23 329 m2 instead of the more correct 20 100 m2. A possible explanation for this is that the energy expert may have incorrectly included the area of the parking garage that is below ground, which corresponds well to the area deviation. Using the correct area would have resulted in a declared energy of 103 kWha/m2 instead of the official 89 kWha/m2.
In this study a second energy expert was consulted. He performed new energy declarations based on the measured energy use, using the same method as was used for the original energy declaration. He performed three new energy declarations based on measurements during the period 2010-2012, the result of which were 92 kWha/m2, 87 kWha/m2 and 82 kWha/m2, respectively as presented in Table 10.4. He also performed one new energy declaration based on the estimated data, calculated in Chapter 7. The resulting energy performance was then 91 kWha/m2. Regarding the difference between the two energy declarations for 2012, compare also the result shown in Table 10.1.
Table 10.4 Energy declarations for the case study building.
Existing energy
declaration
Fictive new energy declarations Input data to new energy declarations
Measured Estimated Year 2007 2010 2011 2012 2012 Electricity hydronic heating system [kWha]
319 000 380 012 221 234 210 892 210 892
Direct electric heating [kWha]
- - - - 398 138
Electricity for building services [kWha]
1 730 689 1 506 400 1 488 813 1 435 954 1 191 050
Output data Output data to new energy declarations Energy normalised to the typical meteorological year (degree days) [kWha]
2 082 797 1 133 800 1 729 678 1 648 329 1 806 967
Energy normalised to the typical meteorological year (Energy-index) [kWha]
2 082 005 1 849 732 1 740 309 1 656 047 1 826 651
Energy performance with “incorrect” area of 23 329 m2 [kWha/m2]
89
Energy performance with “correct” area of 20 100 m2 [kWha/m2]
103 92 87 82 91
135
The energy performance, according to BBR and the energy declarations, is supposed to reflect the performance of the building and not the activities in the building. This is at least the motivation for why the tenant electricity has been excluded from the energy performance measure in the regulatory requirements. If it is the building that is evaluated then the evaluation should be the same for different years if no changes have been made to the building or its HVAC system.
In theory the energy performance should be the same independently of what year the energy declaration was made. This should theoretically be possible by normalising the data. Firstly, the data is normalised to a typical meteorological year (this is done automatically in the energy declaration). The energy index that is used for normalisation to a typical meteorological year in the energy declaration is a “site index” that is supposed to be suitable for an “average” building type and is therefore based on an older apartment building with mechanical exhaust ventilation. In other words, a building type that differs considerably from the shopping mall studied in this thesis. It can therefore be questioned how suitable this method is for this building type.
Secondly, if the building has been used in another way than “normal” the energy data used in the declaration should be corrected, according to BBR. However, for the building type shopping mall, there is limited data available on what normal use really is. When it comes to another building type, offices, there are some data available through Sveby [www.sveby.org], but this data is not really applicable to shopping malls.
10.3 Discussion and Summary Questions can be raised regarding how suitable the BBR requirements are for complex buildings such as shopping malls. The following discussion is based on a relatively detailed analysis that has been done for a case study building.
First, there may arise large differences between measured energy use (based on an organisational division) and calculated energy use (based on a functional division), as exemplified in Table 10.1 and Table 10.4. The fact is that some energy use can be regarded as either BBR energy or tenant energy. Based on the tenant agreements and the assumptions those are made, more or less of the total electricity use can be included or excluded from the energy performance (as defined in BBR).
Second, energy requirements, as well as energy performance, (as defined in BBR) are strongly influenced by the type of energy supply system, i.e. given a certain building with a certain energy demand, it would be easier to meet the energy requirements with some types of energy supply systems than with others, as exemplified in Figure 10.2 and Figure 10.3.
Third, the BBR requirements apply for normal use of the building. However, it is not clearly defined what normal use is. Especially for complex buildings such as shopping malls it will be difficult to develop figures for normal use since each and every one of these buildings are unique in terms of tenants, open hours, occupancy time, HVAC system, architecture etc. Differences between years for the case study building have been exemplified in Table 10.4.
136

Fourth, the BBR energy is measured in the unit kWh/m2. In shopping malls the height to the ceiling is normally higher than in other service buildings, therefore the energy use per m2 will be higher and the requirements will be harder to meet if they are the same as for other service buildings.
137

11 DISCUSSION The methods and results in this thesis were derived with the following purpose (previously stated in Section 1.2).
The first objective of this thesis is to describe energy use in shopping malls in Sweden and to suggest how this energy use can be reduced. The second objective is to determine whether current regulatory requirements are effective in promoting energy efficiency measures.
Shopping malls have not been treated separately in Swedish national statistics, and the motivation for this is their complexity. Previous to this thesis, a licentiate thesis was published that included an analysis of 41 shopping malls in Sweden and Norway. In parallel with this PhD thesis project, the Swedish Energy Agency performed a study, Stil2-09, where energy statistic for shopping malls in Sweden for the first time was collected. In this study, a total of 19 shopping malls were included. The present thesis analyses a database of energy declarations, received from Swedish National Board of Housing, Building and Planning [Boverket], which has not been previously analysed or presented. In the analysis of the energy use in the shopping malls included from these three sources it was evident that comparison is difficult due to inconsistencies in nomenclature and system boundaries.
There are several issues with the available energy statistics. Different definitions of energy use in buildings lead to confusion and may result in wrong or misleading conclusions. Functional division and organisational division are frequently combined arbitrarily. In the available statistics, energy use often refers only to the purchased energy and ignores other types of energy supply. It is vital to distinguish between purchased energy use and total energy use. Moreover, consistency in area definitions is important to enable comparison of specific energy use. Purchased energy is always known but there is a lack of measurements on how energy is distributed between functions in the building. Use of free cooling and heat recovery is seldom quantified.
An attempt was made in the thesis to suggest improvements on the nomenclature, and the main worthwhile improvements was to distinguish more clearly between functionally and organisationally divided energy, since there unfortunately is confusion between these divisions in current statistics and definitions. The aim in the thesis was to handle this nomenclature more clearly. This however was challenging since available data from energy statistics, energy measurements and energy declarations are based on the current practice and could not be perfectly divided in a functional division, as would have been beneficial for this study.
In order to evaluate energy efficiency the energy use must be related to some sort of useful output, such as energy per number of goods sold, energy per turnover or energy per hour of business. For example, if there are very few activities in the building then the energy use can be low, but it might not necessarily mean that the energy is being used efficiently. The most common way to express energy use is per unit of floor area. However, shopping malls usually have high ceilings which mean that the energy use will be higher due to the larger air volume. A number of factors can be suggested for normalising energy use, but there are arguments both for and against each one of them.
139
11.1 Description of Energy Use The main methods used in this thesis to describe current energy use in shopping malls have been statistics and literature reviews together with analysis of a database on energy declarations. Furthermore, a comprehensive evaluation of the energy use in a case study building was performed.
The national energy statistics in Sweden includes retail trade and supermarkets but does not handle shopping malls separately. In 2009 there was however a separate study that included 94 randomly selected buildings from the three building categories shopping malls, supermarkets and (other) retail trade. Of these buildings 19 were shopping malls. According to Stil2-09[89], the average total energy use in shopping malls in Sweden is estimated to 262 kWha/m2.
According to the analysed energy declarations there is a wide spread between the shopping malls that have the lowest and the highest energy performance (as defined in BBR), 36-345 kWha/m2. The average energy performance is 151 kWha/m2. This average declared energy performance (as defined in BBR, excluding tenant electricity) corresponds to about 57 % of the average total energy use of 262 kWha/m2 reported by the Stil2-09 study.
There have been many studies of energy use in complex buildings in general, but only a few articles have been published on energy use in shopping malls specifically. The published articles are mainly from other parts of the world, and so are not directly applicable to Swedish conditions in all their aspects. There are differences in how buildings are constructed, in building regulations and in outdoor climate, for example.
Energy use in shopping malls appears to be dominated by tenant related electricity (mainly for lighting) and cooling related energy (mainly resulting from heat loads from lighting, appliances and people). Despite the cold climate of Sweden, the interior zones of shopping malls require cooling all year around due to high internal heat loads, mainly from lighting.
With a greater focus on environmental issues and energy efficiency over the years, it would be reasonable to expect that new buildings are becoming more energy efficient. However, the results indicate that newer shopping malls do not necessarily use less energy than older ones. In the database on energy declarations there was only a small tendency indicating that newer shopping malls use less energy than older ones, but the result was not significant.
However, shopping malls have become more and more exclusive and when a new shopping mall is built the intention is usually that the shopping mall should stand out in comparison with other nearby shopping malls. Additionally, the energy declaration only includes year of construction and no information on whether, or when, the building was renovated. Furthermore the BBR energy is only a part of the total energy use. This obviously reduces the possibility of evaluating whether newer buildings (and renovated buildings) use less energy than older ones.
According to the analysis of the database on energy declarations, the ventilation flow rates have little effect on the energy performance of the 50 buildings analysed. If this results stands true for buildings in general, then the correction allowed in the BBR requirement for an addition when the outdoor hygiene airflow
140
rate is greater than 0.35 l/s/m2 can be questioned, see Section 2.2.2. However, few energy declarations included data on ventilation flow rates.
The measured total energy use in the case study building varied around 200 kWha/m2 between 2008 and 2012, with a corresponding energy performance (as defined in BBR) of around 90 kWha/m2. This is well below the average total energy use in Swedish shopping malls according to Stil2-09[89], as well below the average energy performance of shopping malls in the Swedish database for energy declarations. It should further be noted that about 50 % of the total energy use in the case study building is related to lighting.
11.2 Reduction of Energy Use In this thesis measured energy use was thoroughly investigated in relation to calculated energy demand. This was achieved by means of a detailed study of an existing building. A calculation model was calibrated for the actual building and the energy use was further analysed in a sensitivity analysis. The sensitivity analyses were based on initial more detailed studies for people and lighting loads, as well as infiltration heat losses.
In general terms, the highest potential for affecting the total energy use was by changing the load patterns (especially lighting), secondly by making changes to the HVAC system, while changes in the building envelope were found to have the least effect on energy use.
The energy performance of the case study building is among the best energy performances for the declared shopping malls, and yet it could be shown that there was a great potential for improvements. It was shown that it is possible to reduce the current total energy use from 198 kWha/m2 down to 126 kWha/m2. When designing a new building, the total energy use could be reduced by 46 %, i.e. down to a value of 102 kWha/m2. This indicates a large potential for energy reduction possibilities in a majority of the existing shopping malls, i.e. if there are the appropriate incentives.
11.3 Enhancing Energy Efficiency Measures At the European level, the main legislative instrument for improving the energy efficiency of the building stock is the Energy Performance of Buildings Directive (EPBD). The EPBD requires all member states to implement the directive in the building code (in Sweden BBR) and it also requires energy declarations to be performed at the building level.
Consequently, based on the Swedish interpretation of EPBD, there are two main regulatory ways in which energy efficiency is enhanced in Swedish building stock today. First, there are energy performance requirements in BBR on new buildings, and in cases of renovation they also apply for existing buildings. Second, there are requirements to include suggestions on cost effective energy efficiency measures in connection to the energy declarations. It is then up to the building owner if they perform suggested measures or not.
The main methods used in the thesis to analyse the effectiveness of regulatory requirements to enhance energy efficiency measures is by 1) analysis of the data
141
base of energy declarations, and 2) analysis of the regulations in relation to results from the case study of an existing shopping mall.
Building energy performance as it is defined today (in BBR) does not provide a comprehensive description of the energy use in buildings. Swedish building code (BBR) and building energy declarations include only landlord energy. Tenant energy is excluded. However, to reduce the tenant electricity used for lighting is one of the most efficient ways to reduce total use of energy, but it has a limited effect on the energy performance (as defined in BBR, see Figure 10.2 and Figure 10.3). This makes the existing energy requirements less suitable for shopping malls, or at least other incentives are needed. This will be elaborated in the end of this section.
It is important to notice that the energy declaration includes only energy performance i.e. a portion of the total energy use in the building. The energy declarations cannot therefore be used for the evaluation of total energy use in buildings. For example, the case study building used for more thorough analysis in this thesis has a lower than average energy performance. Its declared energy performance is approximately 90 kWha/m2 (note: it was shown in Chapter 10 that there were some errors in the energy declaration of the case study building and when these errors were corrected the corresponding declared energy performance became approximately 100 kWha/m2). However, the total measured purchased energy use was approximately 200 kWha/m2, as was presented in Chapter 6, and approximately half of this energy was tenant electricity.
One purpose of the declaration is to provide information to the building owner of what cost effective energy efficiency measures that are possible to conduct in the building. It is mandatory for the energy expert, who provides the energy declaration, to suggest such cost effective measures if any are available. In practice, fewer than half of the energy declarations for shopping malls included cost effective energy efficiency measures. This was an unexpected result. Unfortunately, building owner receiving no suggestions for cost effective measures has little practical use of the energy declaration.
The energy performance definition (in BBR) is said to be neutral to technology but in its current formulation it is not. First, buildings are divided between electrically heated and not electrically heated buildings, with different requirements. Second, the calculated energy performance for buildings with the same energy needs varies with the energy supply system. The requirements have furthermore been tightened in different ways on different occasions. Consequently, the competition between different energy supply systems has been different during different time periods. For the time being, there seems to be three valid versions of the requirements (BBR 19, 20 and 21).
Sweden is the only country in Europe where the interpretation of the EPBD has led to energy performance being validated by measurements. It can be expected that this in the long run should lead to better measurements of energy in buildings. However, to utilise the full potential of the energy declarations, they also have to include the tenant energy.
When it comes to shopping malls and other service buildings with a landlord and tenant, there is a major third voluntary way to improve the energy efficiency in
142

the buildings. That is via agreements (between the landlord and the tenant) specified with the aim to improve the energy efficiency of the building. These so called Green Agreements [Gröna Avtal], in Sweden pioneered by Vasakronan, have recently been developed as templates with a handbook by the Swedish Property Federation [Fastighetsägarna].[41] The agreements are partly based on the energy declarations, which emphasises the need to strive for good quality energy declarations. Here it can be concluded that the energy declaration for the case study building would not be of much help. However, the agreements also include checklists and detailed guidelines how to carry out energy audits, etc., as well as guidelines how the agreed measures can be applied.
143

12 CONCLUSIONS Shopping malls are not yet a well-defined building type, compared to for example office buildings. This means that there are almost no standardised data characterising the activities in a shopping mall and only very limited statistics is available. The Stil2-09 study is the only national source reporting total energy use in shopping malls, which is approximately 260 kWha/m2. The relatively large energy use in comparison to other building types, together with an increased numbers of shopping malls, makes it important to enhance the knowledge about energy use in shopping malls.
The BBR requirements and the energy declarations do not include the total energy use, since it excludes the tenant energy. The part of the total energy use included is called energy performance. There are about 300 buildings declared as shopping malls in the Swedish database for energy declarations, out of which about 50 have a heated floor area between 10 000 m2 and 20 000 m2. For these relatively large buildings there is a large variation in declared energy performance, from 35 kWha/m2 to 345 kWha/m2, with an average value of about 150 kWha/m2.
Available energy statistics, as well as the evaluation of an existing (relatively typical) Swedish shopping mall with about 20 000 m2 of heated floor area, indicate that the total energy use in shopping malls is dominated by the use of electricity for lighting. Thus, energy efficiency measures related to the installation of more energy efficient lighting is a major challenge in relation to energy retrofit of existing, as well as new, shopping malls. Furthermore improved HVAC systems, as well as improved knowledge about air infiltration heat losses in large buildings, are other challenges in relation to shopping malls.
The detailed evaluation of the existing shopping mall, with a total energy use of about 200 kWha/m2, indicates that the total energy use can be reduced to about 125 kWha/m2 with more or less standard energy retrofit measures (especially reduced energy for lighting) and that it could be possible to achieve a total energy use of close to 100 kWha/m2 in a new shopping mall applying standard building, HVAC system and lighting technologies.
However, present energy requirements on buildings focus on landlord energy (mainly HVAC energy) and exclude energy requirements on tenant energy, and are thus less relevant in order to reduce the total energy use in shopping malls where tenant energy dominates the total energy use.
The energy declarations are supposed to give valuable suggestions regarding energy efficiency measures in existing buildings. However, the present control and handling of the energy declarations does not enhance energy efficiency measures in shopping malls. There are further a number of difficulties related to the present way of stating the energy performance of complex buildings, as there is a lack of tools that complement the definition of energy performance. With current requirements there is even a possibility that one building using less total energy does not satisfy the building requirements while another building using more energy does do so.
145

REFERENCES 1. Abel, E., 1994. Low-energy buildings. (Energy and Buildings, vol. 21, nr.
3, pp. 169-174).
2. Angerd, M., 1999. Är utrymningsschablonerna vid brandteknisk dimensionering säkra? En osäkerhetsanalys av utrymningssäkerheten i affärer dimensionerade enligt NR 1988. nr. Report 5028.
3. ASHRAE Handbook, Fundamentals, American Society for Heating, Refrigerating and Air Conditioning Engineers. 2005.
4. ASHRAE Handbook, Fundamentals, American Society for Heating, Refrigerating and Air Conditioning Engineers. 2009.
5. Aste, N., Del Pero, C., 2013. Energy retrofit of commercial buildings: case study and applied methodology. (Energy Efficiency, vol. 6, nr. 2, pp. 407-23).
6. Athienitis, A.K., 1993. A methodology for integrated building- HVAC system thermal analysis. (Building and Environment, vol. 28, nr. 4, pp. 483-496).
7. BBR. Boverkets byggregler, BFS 2013:14.
8. Berge, A., (2011). Analysis of Methods to Calculate Air Infiltration for Use in Energy Calculations. Department of Civil and Environmental Engineering, Chalmers University of Technology, Göteborg. Retrieved from http://publications.lib.chalmers.se/records/fulltext/147421.pdf (Date accessed 2014-07-19).
9. Bergsten, B. Personal communication.
10. Blomsterberg, Å., Burke, S., (2012). Verklig lufttäthet i stora byggnader - Mätningar och beräkningar. Retrieved from www.sbuf.se (Date accessed 2013-07-16). (in Swedish).
11. Busch, J.F., du Pont, P., Chirarattananon, S., 1993. Energy-efficient lighting in Thai commercial buildings. (Energy, vol. 18, nr. 2, pp. 197-210).
12. Byggforskningsrådets BFR-skrift, 1990. House and health.
13. Bülow-Hübe, H., 2008. Daylight in glazed office buildings: a comparative study of daylight availability, luminance and illunance distribution for an office room with three different glass areas.
14. Canbay, C.S., Hepbasli, A., Gokcen, G., 2004. Evaluating performance indices of a shopping centre and implementing HVAC control principles to minimize energy usage. (Energy and Buildings, vol. 36, nr. 6, pp. 587-598).
15. Centrumutveckling, 2009. Köpcentrumkatalogen 07/08. Stockholm.
147
16. Chidiac, S.E., Catania, E.J.C., Morofsky, E., Foo, S., 2011. A screening methodology for implementing cost effective energy retrofit measures in Canadian office buildings. (Energy and Buildings, vol. 43, nr. 2-3, pp. 614-20).
17. CIT Energy Management AB, 2010. BV2 Byggnadens värmebalans i varaktighetsdiagram. Ett datorprogram för beräkning av byggnaders energibehov. Version 2010. Användarmanual. Göteborg.
18. CIT Energy Management AB, 2012. BV2 Byggnadens värmebalans i varaktighetsdiagram. Ett datorprogram för beräkning av byggnaders energibehov. Version 2012. Användarmanual. Göteborg.
19. Concerted Action Energy Performance of Buildings, Electronic version October 2013. Implementing the Energy Performance of Building Directive (EPBD). Featuring country reports 2012.
20. Corrado, V., Mechri, H.E., 2009. Uncertainty and Sensitivity Analysis for Building Energy Rating.
21. Dotzauer, E., 2010. Greenhouse gas emission from power generation and consumption in a nordic perspective. (Energy policy, vol. 38, nr. 2010, pp. 701-704).
22. Dubois, M.-C., Blomsterberg, Å., 2011. Energy saving potential and strategies for electric lighting in future North European, low energy office buildings: A literature review. (Energy and Buildings, vol. 43, nr. 10, pp. 2572-2582).
23. Emmerich, S.J., Persily, A.K., (2013). Analysis of the NIST Comercial and Institutional Building Envelope Leakage Database. Content submitted to and published by: AIVC Airtightness Workshop 3rd TightVent Workshop on Building and Ductwork Airtightness pp.84-87. Retrieved from www.nist.gov (Date accessed 2013-07-16).
24. Enova, 2007:2. Bygningsnettverkets energistatistikk 2006. Enova-rapport 2006:2, available from www.enova.no.
25. Enova, 2011. Enovas byggstatistikk 2009. Enova rapport 2011:5, available from www.enova.no.
26. European Union, 2010. Directive 2010/31/EU of the European Parliament and of the council of May 2010 on the energy performance of buildings (recast). (Official Journal of the European Union).
27. Fahkroo, M.I., Al-Awainati, N., Musharavati, F., Pokherel, S., Gabbar, H.A., 2013. Operations optimization towards high performance cooling in commercial buildings. pp. (6 pp. sidor, IEEE.) Piscataway, NJ, USA.
28. Fahlén, P., Markusson, C., Jagemar, L., 2010 Influence of ventilation-system design on the use of heating, cooling and drive energy to fans. (Clima 2010, 10th REHVA World Congress.) Antalya, Turkey.
148
29. Fahlén, P., 2011. Comfort cooling with or without heat pump (in Swedish). Kyla, no. 7, 2011-11, pp. 32-38. (Kylentreprenörernas Förening.).
30. Fanger, P.O., 1973. Assessment of man's thermal comfort in practice. (British Journal of Industrial Medicine, nr. 30, pp. 313-324).
31. Fasiuddin, M., Budaiwi, I., Abdou, A., 2010 Zero-investment HVAC system operation strategies for energy conservation and thermal comfort in commercial buildings in hot-humid climate. (Int. J. Energy Res. (UK), (John Wiley & Sons Ltd., vol. 34, pp. 1-19.) UK.
32. Fitzgerald, S.D., Woods, A.W., 2007. Energy efficiency with natural ventilation: a case study. (Institution of Civil Engineers, vol. 160, nr. 1, pp. 9-14).
33. Flodberg, K., 2012, Very Low Energy Office Buildings in Sweden. Division of Energy and Building Design. Department of of Architecture and Built Environment, Lund University.
34. Grot, R.A. The Air Infiltration and Ventilation Rates in Two Large Commercial Buildings.
35. Gunnarsen, L., 2003. Section 3.1 Thermal Climate. (pp. 91-113, book: Achieving the desired indoor climate, ed.: Nilsson, Studentlitteratur.). Lund.
36. Haberl, J.S., Komor, P.S., June 1989 (Revised December 1990). Investigating an analytival framework for improving commercial energy audits: Results from a New Jersey mall. PU/CEES Report No. 264. Center for Energy and Environment Studies. The Engineering Quadrangle. Princeton University.
37. Hallila, R., 2010, The impact of light sources on customer experience and energy consumption, Aalto University.
38. Harrje, D.T., Duil, G.S., Bohac, D.L., Gadsby, K.J., 1985 Jan 01. Documenting air movements and infiltration in multicell buildings using various tracer-gas technics.
39. http://sel.me.wisc.edu/trnsys/.
40. http://www.equa-solutions.co.uk/en/software/idaice.
41. http://www.fastighetsagarna.se, Stockholm 2012. Grönt hyresavtal. En handledning.
42. Huang, K., Ji, L.-j., Yang, Y., Wu, Z.-m., 2013. Distribution and Operating Characteristics of Public Buildings'Energy Consumption in Jiangsu Province. (Editorial Department of Journal of Building Energy Efficiency, vol. 41, nr. 2, pp. 53-6).
43. International Energy Agency.
149
44. International energy Agency, 2010. Energy Performance Certification of Buildings - A policy tool to improve energy efficiency.
45. International Energy Agency, 2013. Key World Energy Statistics.
46. International Energy Agency, 2014. Energy Efficiency Indicatiors: Essentials for Policy Making.
47. Johnsson, E., 2001, Projekteringsmetodik för minimering av miljöpåverkan (Design methodology for minimizing environmental impact). Licentiate thesis, Chalmers University of Technology, Department of Buildning Services Engineering. Göteborg.
48. Kaplan, M., 1992. Guidlines for energy simulation of commercial buildings. (Bonneville Power Administration, Portland. OR.).
49. Kronvall, J., 1979. Mätningar och mätmetoder för lufttäthet.
50. Kronvall, J., 1980, Air flows in building components. Division of building technology. Lund institute of technology. Report TVBH-1002, Lund, Sweden, 1980.
51. Kurnitski, J., Allard, F., Braham, D., Goeders, G., Heiselberg, P., Jagemar, L., Kosonen, R., Lebrun, J., Mazzarella, L., Railio, J., et al., 2011. How to define nearly net zero energy buildings nZEB - REHVA proposal for uniformed national implementation of EPBD recast. (The REHVA European HVAC Journal, vol. 48, nr. 3.
52. Kurnitski, J., 2013. REHVA nZEB technical definition and system boundaries for nearly zero energy buildings - 2013 revision for uniformed national implementation of EPBD recast prepared in cooperation with European standardization organization CEN.
53. Lam, J.C., Chan, A.L.S., 1995. Energy audits and surveys of air conditioned buildings. In: Proceeding of Australian and New Zealand Architectural Science Association Conference. University of Canberra, Australia; 1995. p. 49-54.
54. Lam, J.C., Li, D.H.W., Cheung, S.O., 2001. Preliminary measurements of thermal and visual conditions in shopping malls in Hong Kong. (Architectural Science Review, vol. 44, nr. 3, pp. 325-333).
55. Lam, J.C., Li, D.H.W., 2003. Electricity consumption characteristics in shopping malls in subtropical climates. (Energy Conversion and Management, vol. 44, nr. 9, pp. 1391-1398).
56. March, P., Yao, R.-m., Clements-Croome, D., 2009. Development of intelligent buildings in Bahrain. (Journal of Central South University of Technology, vol. 16, pp. 89-94).
57. Nilsson, P.-E., 1994, Heating and cooling requirements in commercial buildings. A duration curve model including building dynamics. Göteborg.
150
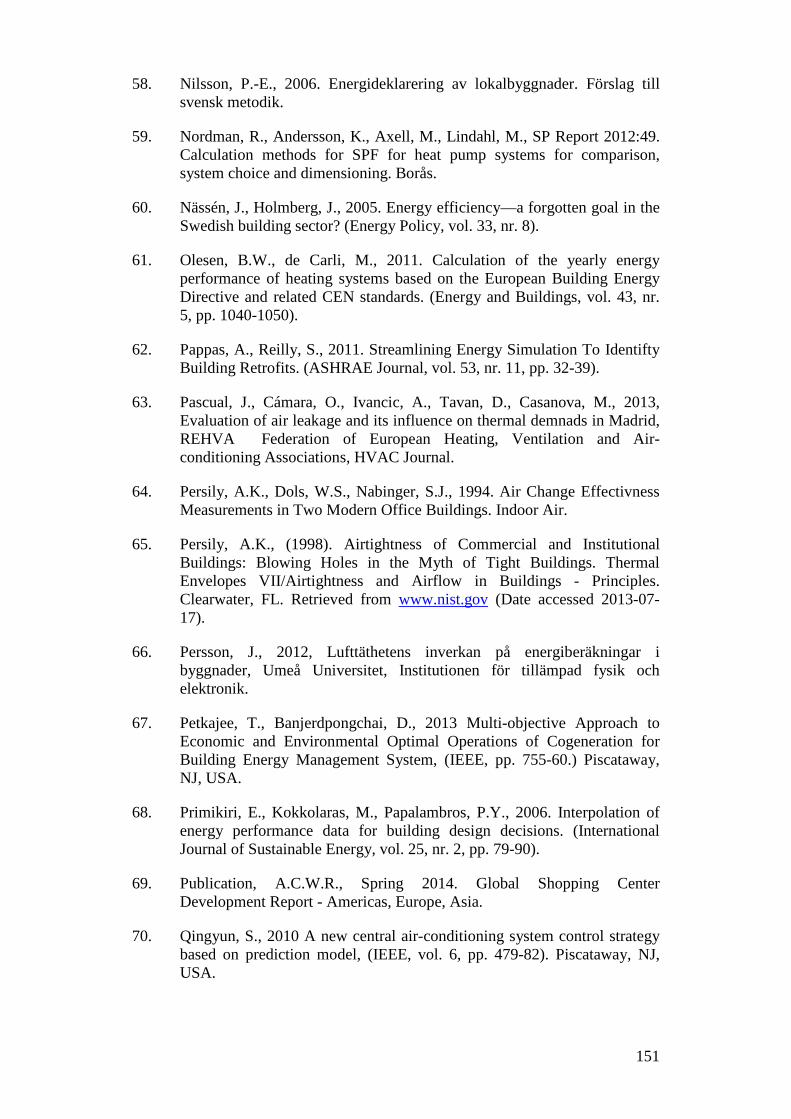
58. Nilsson, P.-E., 2006. Energideklarering av lokalbyggnader. Förslag till svensk metodik.
59. Nordman, R., Andersson, K., Axell, M., Lindahl, M., SP Report 2012:49. Calculation methods for SPF for heat pump systems for comparison, system choice and dimensioning. Borås.
60. Nässén, J., Holmberg, J., 2005. Energy efficiency—a forgotten goal in the Swedish building sector? (Energy Policy, vol. 33, nr. 8).
61. Olesen, B.W., de Carli, M., 2011. Calculation of the yearly energy performance of heating systems based on the European Building Energy Directive and related CEN standards. (Energy and Buildings, vol. 43, nr. 5, pp. 1040-1050).
62. Pappas, A., Reilly, S., 2011. Streamlining Energy Simulation To Identifty Building Retrofits. (ASHRAE Journal, vol. 53, nr. 11, pp. 32-39).
63. Pascual, J., Cámara, O., Ivancic, A., Tavan, D., Casanova, M., 2013, Evaluation of air leakage and its influence on thermal demnads in Madrid, REHVA Federation of European Heating, Ventilation and Air-conditioning Associations, HVAC Journal.
64. Persily, A.K., Dols, W.S., Nabinger, S.J., 1994. Air Change Effectivness Measurements in Two Modern Office Buildings. Indoor Air.
65. Persily, A.K., (1998). Airtightness of Commercial and Institutional Buildings: Blowing Holes in the Myth of Tight Buildings. Thermal Envelopes VII/Airtightness and Airflow in Buildings - Principles. Clearwater, FL. Retrieved from www.nist.gov (Date accessed 2013-07-17).
66. Persson, J., 2012, Lufttäthetens inverkan på energiberäkningar i byggnader, Umeå Universitet, Institutionen för tillämpad fysik och elektronik.
67. Petkajee, T., Banjerdpongchai, D., 2013 Multi-objective Approach to Economic and Environmental Optimal Operations of Cogeneration for Building Energy Management System, (IEEE, pp. 755-60.) Piscataway, NJ, USA.
68. Primikiri, E., Kokkolaras, M., Papalambros, P.Y., 2006. Interpolation of energy performance data for building design decisions. (International Journal of Sustainable Energy, vol. 25, nr. 2, pp. 79-90).
69. Publication, A.C.W.R., Spring 2014. Global Shopping Center Development Report - Americas, Europe, Asia.
70. Qingyun, S., 2010 A new central air-conditioning system control strategy based on prediction model, (IEEE, vol. 6, pp. 479-82). Piscataway, NJ, USA.
151
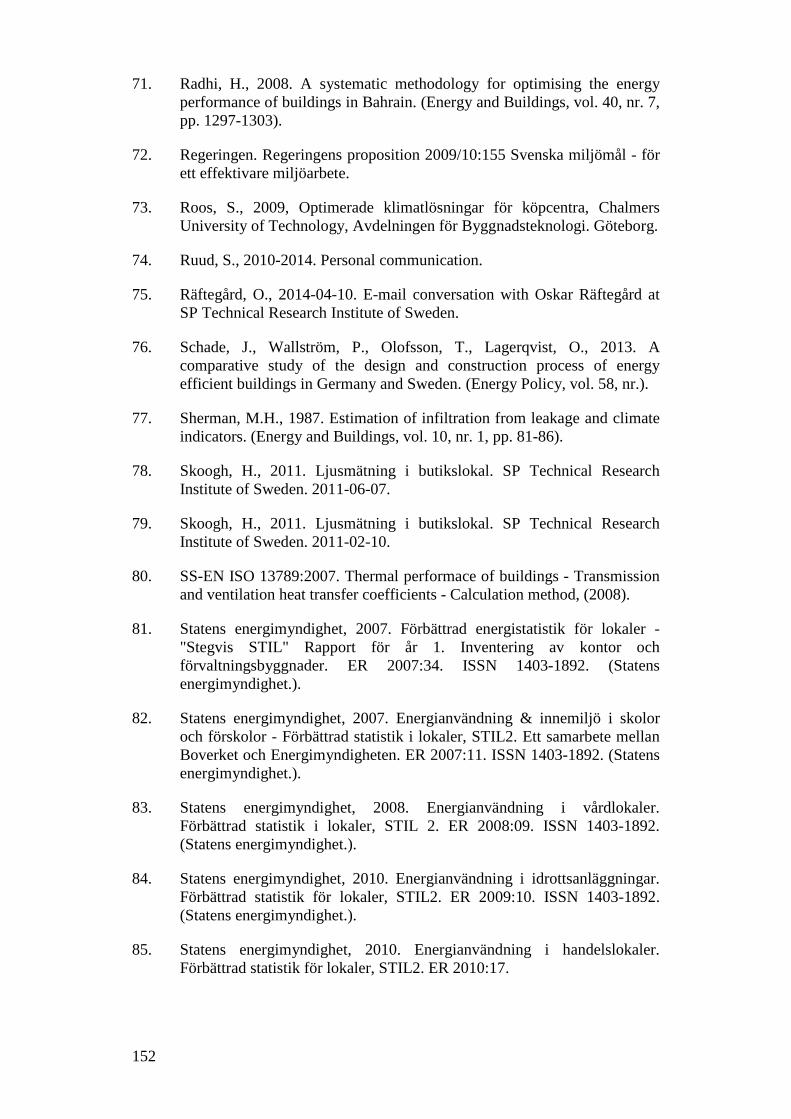
71. Radhi, H., 2008. A systematic methodology for optimising the energy performance of buildings in Bahrain. (Energy and Buildings, vol. 40, nr. 7, pp. 1297-1303).
72. Regeringen. Regeringens proposition 2009/10:155 Svenska miljömål - för ett effektivare miljöarbete.
73. Roos, S., 2009, Optimerade klimatlösningar för köpcentra, Chalmers University of Technology, Avdelningen för Byggnadsteknologi. Göteborg.
74. Ruud, S., 2010-2014. Personal communication.
75. Räftegård, O., 2014-04-10. E-mail conversation with Oskar Räftegård at SP Technical Research Institute of Sweden.
76. Schade, J., Wallström, P., Olofsson, T., Lagerqvist, O., 2013. A comparative study of the design and construction process of energy efficient buildings in Germany and Sweden. (Energy Policy, vol. 58, nr.).
77. Sherman, M.H., 1987. Estimation of infiltration from leakage and climate indicators. (Energy and Buildings, vol. 10, nr. 1, pp. 81-86).
78. Skoogh, H., 2011. Ljusmätning i butikslokal. SP Technical Research Institute of Sweden. 2011-06-07.
79. Skoogh, H., 2011. Ljusmätning i butikslokal. SP Technical Research Institute of Sweden. 2011-02-10.
80. SS-EN ISO 13789:2007. Thermal performace of buildings - Transmission and ventilation heat transfer coefficients - Calculation method, (2008).
81. Statens energimyndighet, 2007. Förbättrad energistatistik för lokaler - "Stegvis STIL" Rapport för år 1. Inventering av kontor och förvaltningsbyggnader. ER 2007:34. ISSN 1403-1892. (Statens energimyndighet.).
82. Statens energimyndighet, 2007. Energianvändning & innemiljö i skolor och förskolor - Förbättrad statistik i lokaler, STIL2. Ett samarbete mellan Boverket och Energimyndigheten. ER 2007:11. ISSN 1403-1892. (Statens energimyndighet.).
83. Statens energimyndighet, 2008. Energianvändning i vårdlokaler. Förbättrad statistik i lokaler, STIL 2. ER 2008:09. ISSN 1403-1892. (Statens energimyndighet.).
84. Statens energimyndighet, 2010. Energianvändning i idrottsanläggningar. Förbättrad statistik för lokaler, STIL2. ER 2009:10. ISSN 1403-1892. (Statens energimyndighet.).
85. Statens energimyndighet, 2010. Energianvändning i handelslokaler. Förbättrad statistik för lokaler, STIL2. ER 2010:17.
152
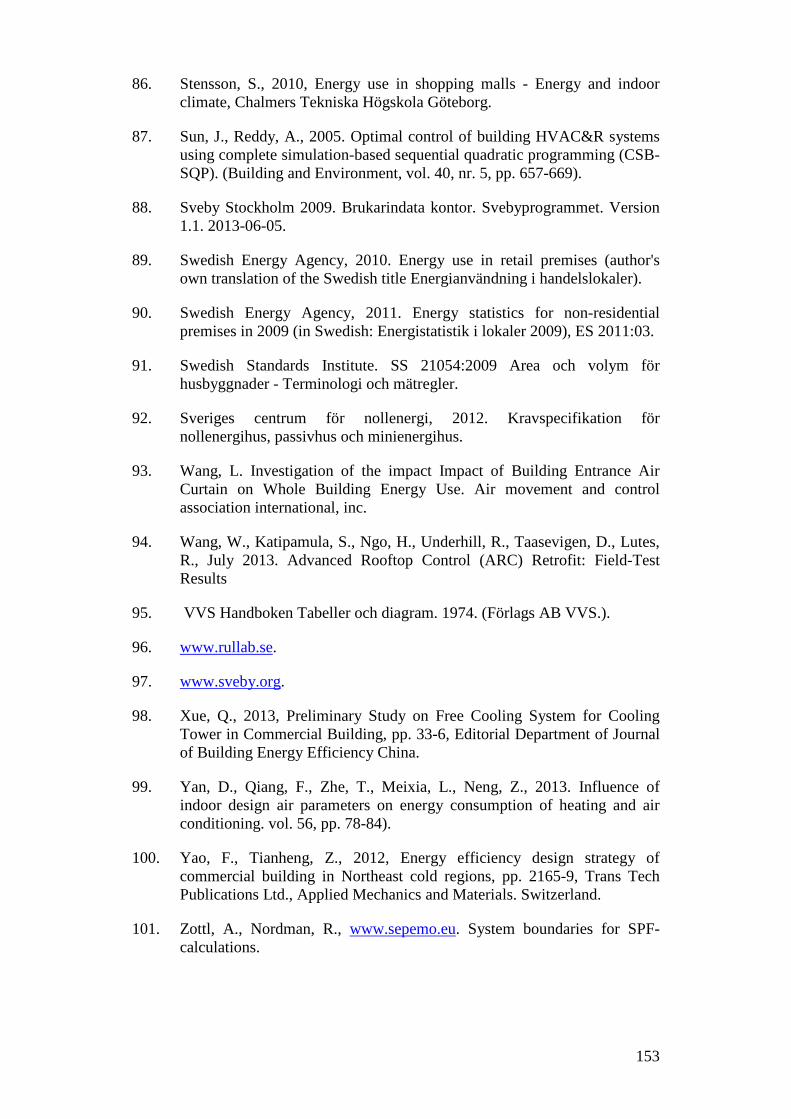
86. Stensson, S., 2010, Energy use in shopping malls - Energy and indoor climate, Chalmers Tekniska Högskola Göteborg.
87. Sun, J., Reddy, A., 2005. Optimal control of building HVAC&R systems using complete simulation-based sequential quadratic programming (CSB-SQP). (Building and Environment, vol. 40, nr. 5, pp. 657-669).
88. Sveby Stockholm 2009. Brukarindata kontor. Svebyprogrammet. Version 1.1. 2013-06-05.
89. Swedish Energy Agency, 2010. Energy use in retail premises (author's own translation of the Swedish title Energianvändning i handelslokaler).
90. Swedish Energy Agency, 2011. Energy statistics for non-residential premises in 2009 (in Swedish: Energistatistik i lokaler 2009), ES 2011:03.
91. Swedish Standards Institute. SS 21054:2009 Area och volym för husbyggnader - Terminologi och mätregler.
92. Sveriges centrum för nollenergi, 2012. Kravspecifikation för nollenergihus, passivhus och minienergihus.
93. Wang, L. Investigation of the impact Impact of Building Entrance Air Curtain on Whole Building Energy Use. Air movement and control association international, inc.
94. Wang, W., Katipamula, S., Ngo, H., Underhill, R., Taasevigen, D., Lutes, R., July 2013. Advanced Rooftop Control (ARC) Retrofit: Field-Test Results
95. VVS Handboken Tabeller och diagram. 1974. (Förlags AB VVS.).
96. www.rullab.se.
97. www.sveby.org.
98. Xue, Q., 2013, Preliminary Study on Free Cooling System for Cooling Tower in Commercial Building, pp. 33-6, Editorial Department of Journal of Building Energy Efficiency China.
99. Yan, D., Qiang, F., Zhe, T., Meixia, L., Neng, Z., 2013. Influence of indoor design air parameters on energy consumption of heating and air conditioning. vol. 56, pp. 78-84).
100. Yao, F., Tianheng, Z., 2012, Energy efficiency design strategy of commercial building in Northeast cold regions, pp. 2165-9, Trans Tech Publications Ltd., Applied Mechanics and Materials. Switzerland.
101. Zottl, A., Nordman, R., www.sepemo.eu. System boundaries for SPF-calculations.
153

APPENDIX A. ORIENTATION OF WINDOW FACADE
Figure 0.1 Electricity to chillers for cooling by chilled beams. Orientation of the window façade on x-axis and kWha/m2 on y-axis.
Figure 0.2 Electricity to chillers for cooling by ventilation air. Orientation of the window façade on x-axis and kWha/m2 on y-axis.
Figure 0.3 Electricity for heating. Orientation of the window façade on x-axis and kWha/m2 on y-axis.
10
12
14
16
270˚
28
5˚
300˚
31
5˚
330˚
34
5˚
0/36
0˚
15˚
30˚
45˚
60˚
75˚
90˚
105˚
12
0˚
135˚
15
0˚
165˚
18
0˚
195˚
21
0˚
225˚
24
0˚
255˚
kWh/
m2
Orientation
Electricity chiller to chilled beams
0
0,5
1
1,5
270˚
28
5˚
300˚
31
5˚
330˚
34
5˚
0/36
0˚
15˚
30˚
45˚
60˚
75˚
90˚
105˚
12
0˚
135˚
15
0˚
165˚
18
0˚
195˚
21
0˚
225˚
24
0˚
255˚
kWh/
m2
Orientation
Electricity chiller to ventilation
282930313233
270˚
28
5˚
300˚
31
5˚
330˚
34
5˚
0/36
0˚
15˚
30˚
45˚
60˚
75˚
90˚
105˚
12
0˚
135˚
15
0˚
165˚
18
0˚
195˚
21
0˚
225˚
24
0˚
255˚
kWh/
m2
Orientation
Heating
155
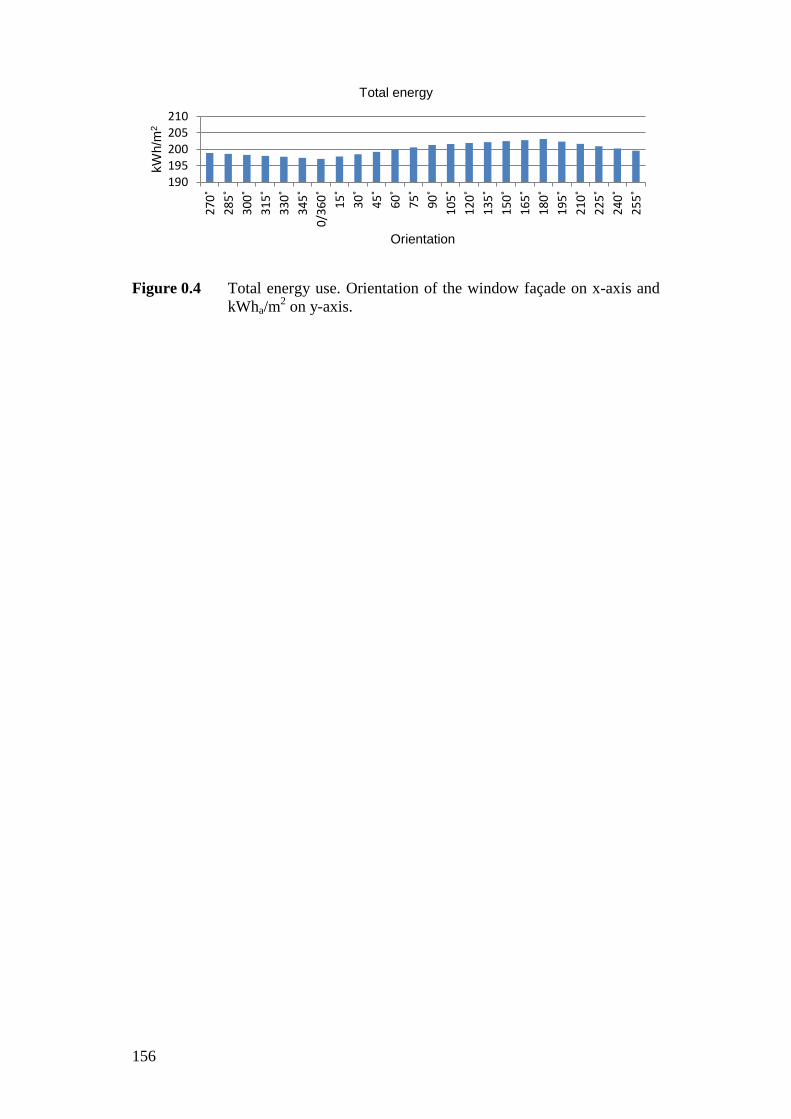
Figure 0.4 Total energy use. Orientation of the window façade on x-axis and kWha/m2 on y-axis.
190195200205210
270˚
28
5˚
300˚
31
5˚
330˚
34
5˚
0/36
0˚
15˚
30˚
45˚
60˚
75˚
90˚
105˚
12
0˚
135˚
15
0˚
165˚
18
0˚
195˚
21
0˚
225˚
24
0˚
255˚
kWh/
m2
Orientation
Total energy
156
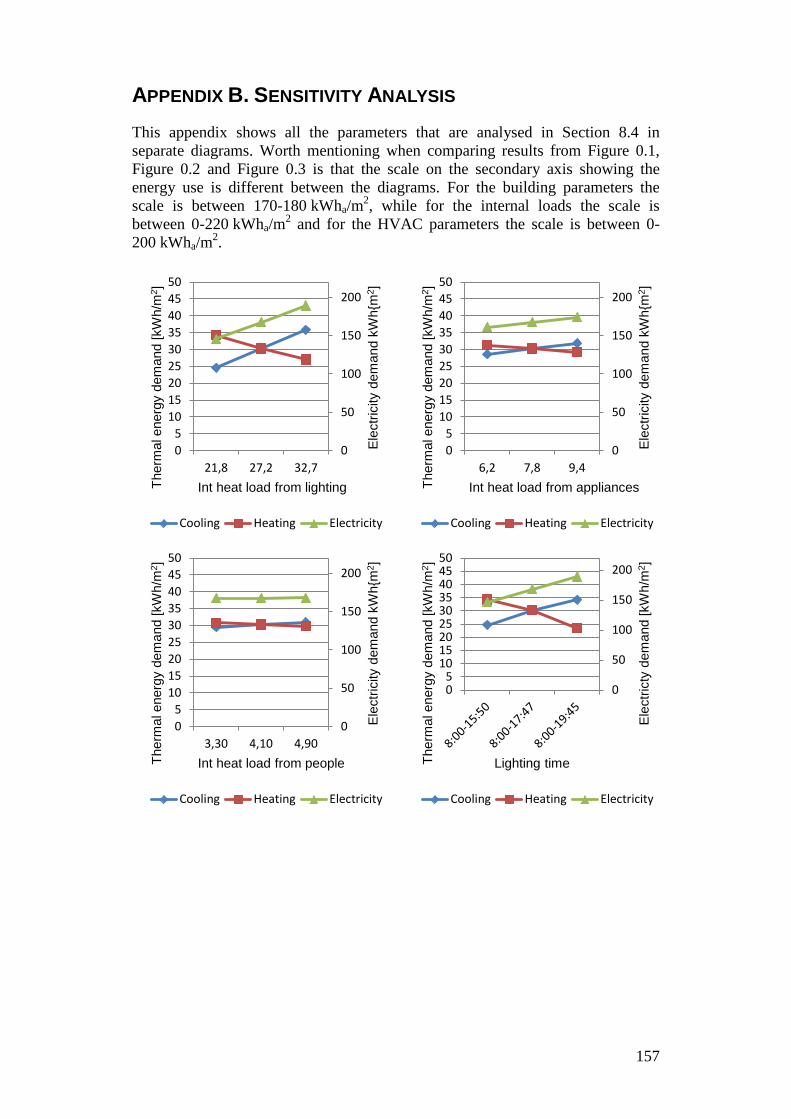
APPENDIX B. SENSITIVITY ANALYSIS This appendix shows all the parameters that are analysed in Section 8.4 in separate diagrams. Worth mentioning when comparing results from Figure 0.1, Figure 0.2 and Figure 0.3 is that the scale on the secondary axis showing the energy use is different between the diagrams. For the building parameters the scale is between 170-180 kWha/m2, while for the internal loads the scale is between 0-220 kWha/m2 and for the HVAC parameters the scale is between 0-200 kWha/m2.
0
50
100
150
200
05
101520253035404550
21,8 27,2 32,7
Elec
trici
ty d
eman
d kW
h{m
2 ]
Ther
mal
ene
rgy
dem
and
[kW
h/m
2 ]
Int heat load from lighting
Cooling Heating Electricity
0
50
100
150
200
05
101520253035404550
6,2 7,8 9,4
Elec
trici
ty d
eman
d kW
h{m
2 ]
Ther
mal
ene
rgy
dem
and
[kW
h/m
2 ]
Int heat load from appliances
Cooling Heating Electricity
0
50
100
150
200
05
101520253035404550
3,30 4,10 4,90
Elec
trici
ty d
eman
d kW
h{m
2 ]
Ther
mal
ene
rgy
dem
and
[kW
h/m
2 ]
Int heat load from people
Cooling Heating Electricity
0
50
100
150
200
05
101520253035404550
Elec
trict
y de
man
d [k
Wh/
m2 ]
Ther
mal
ene
rgy
dem
and
[kW
h/m
2 ]
Lighting time
Cooling Heating Electricity
157
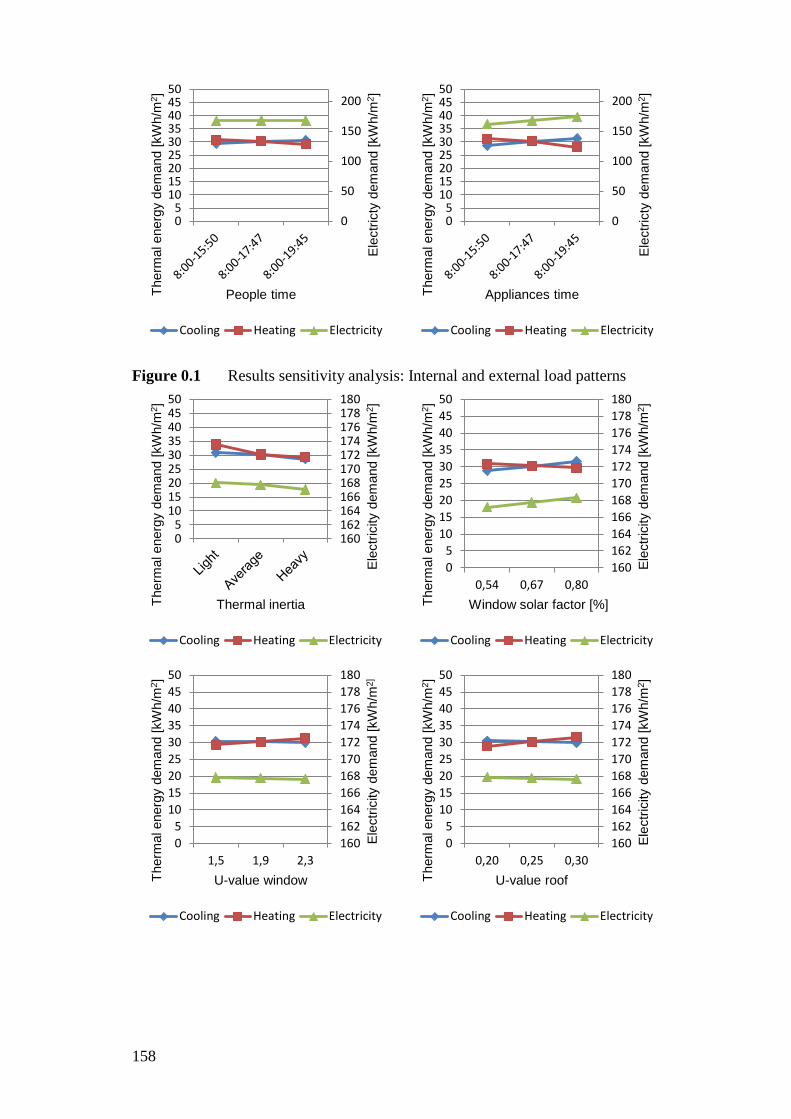
Figure 0.1 Results sensitivity analysis: Internal and external load patterns
0
50
100
150
200
05
101520253035404550
Elec
trict
y de
man
d [k
Wh/
m2 ]
Ther
mal
ene
rgy
dem
and
[kW
h/m
2 ]
People time
Cooling Heating Electricity
0
50
100
150
200
05
101520253035404550
Elec
trict
y de
man
d [k
Wh/
m2 ]
Ther
mal
ene
rgy
dem
and
[kW
h/m
2 ]
Appliances time
Cooling Heating Electricity
160162164166168170172174176178180
05
101520253035404550
Elec
trici
ty d
eman
d [k
Wh/
m2 ]
Ther
mal
ene
rgy
dem
and
[kW
h/m
2 ]
Thermal inertia
Cooling Heating Electricity
160162164166168170172174176178180
05
101520253035404550
0,54 0,67 0,80
Elec
trici
ty d
eman
d [k
Wh/
m2 ]
Ther
mal
ene
rgy
dem
and
[kW
h/m
2 ]
Window solar factor [%]
Cooling Heating Electricity
160162164166168170172174176178180
05
101520253035404550
1,5 1,9 2,3
Elec
trici
ty d
eman
d [k
Wh/
m2]
Ther
mal
ene
rgy
dem
and
[kW
h/m
2 ]
U-value window
Cooling Heating Electricity
160162164166168170172174176178180
05
101520253035404550
0,20 0,25 0,30
Elec
trici
ty d
eman
d [k
Wh/
m2 ]
Ther
mal
ene
rgy
dem
and
[kW
h/m
2 ]
U-value roof
Cooling Heating Electricity
158
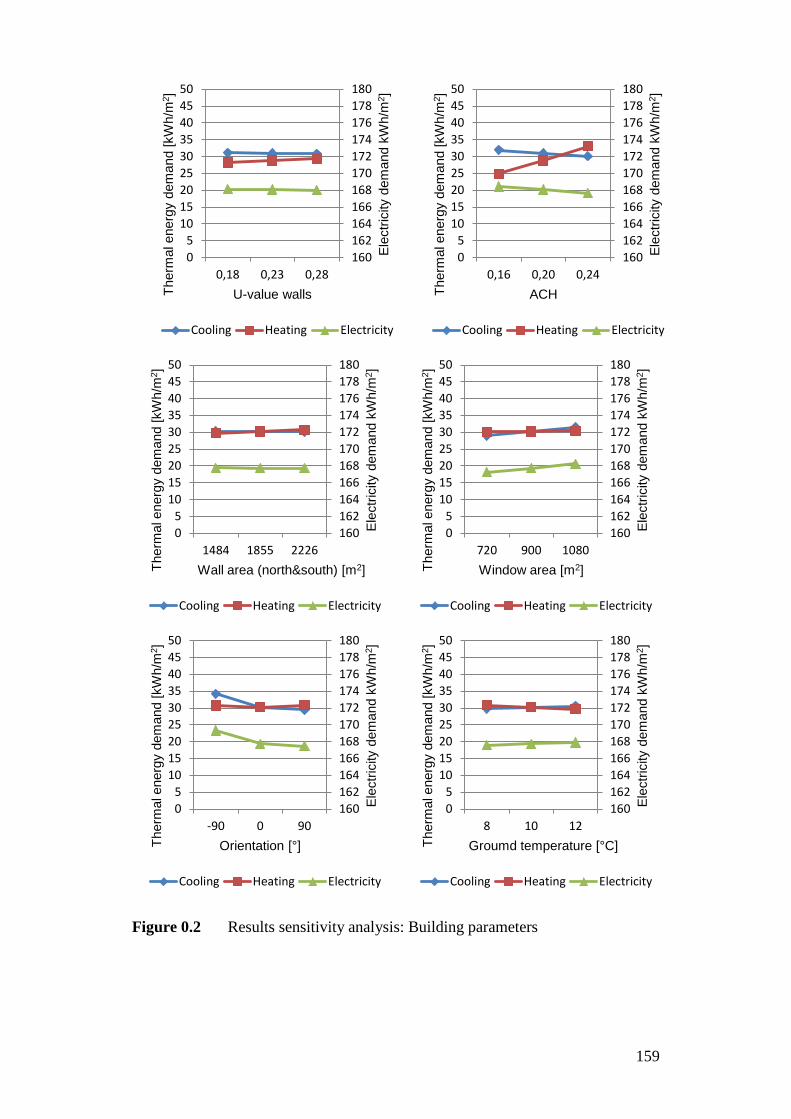
Figure 0.2 Results sensitivity analysis: Building parameters
160162164166168170172174176178180
05
101520253035404550
0,18 0,23 0,28
Elec
trici
ty d
eman
d kW
h/m
2 ]
Ther
mal
ene
rgy
dem
and
[kW
h/m
2 ]
U-value walls
Cooling Heating Electricity
160162164166168170172174176178180
05
101520253035404550
0,16 0,20 0,24
Elec
trici
ty d
eman
d kW
h/m
2 ]
Ther
mal
ene
rgy
dem
and
[kW
h/m
2 ]
ACH
Cooling Heating Electricity
160162164166168170172174176178180
05
101520253035404550
1484 1855 2226
Elec
trici
ty d
eman
d kW
h/m
2 ]
Ther
mal
ene
rgy
dem
and
[kW
h/m
2 ]
Wall area (north&south) [m2]
Cooling Heating Electricity
160162164166168170172174176178180
05
101520253035404550
720 900 1080
Elec
trici
ty d
eman
d kW
h/m
2 ]
Ther
mal
ene
rgy
dem
and
[kW
h/m
2 ]
Window area [m2]
Cooling Heating Electricity
160162164166168170172174176178180
05
101520253035404550
-90 0 90
Elec
trici
ty d
eman
d kW
h/m
2 ]
Ther
mal
ene
rgy
dem
and
[kW
h/m
2 ]
Orientation [°]
Cooling Heating Electricity
160162164166168170172174176178180
05
101520253035404550
8 10 12
Elec
trici
ty d
eman
d kW
h/m
2 ]
Ther
mal
ene
rgy
dem
and
[kW
h/m
2 ]
Groumd temperature [°C]
Cooling Heating Electricity
159
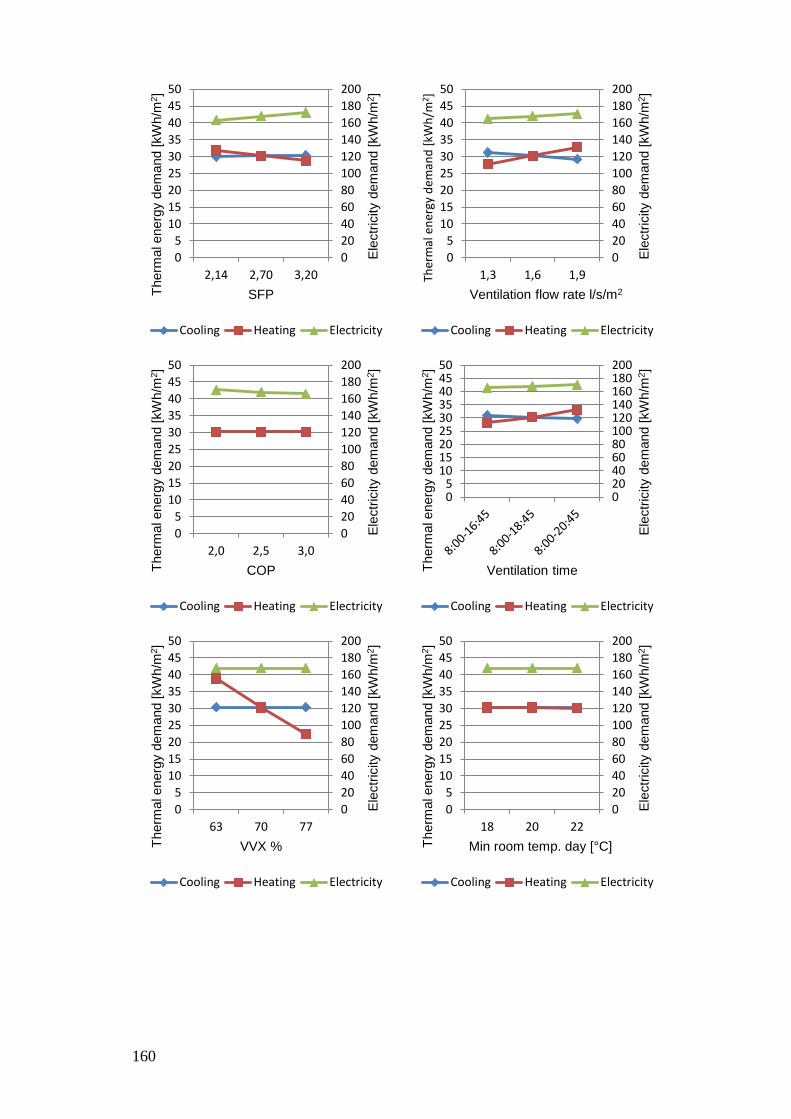
020406080100120140160180200
05
101520253035404550
2,14 2,70 3,20
Elec
trici
ty d
eman
d [k
Wh/
m2 ]
Ther
mal
ene
rgy
dem
and
[kW
h/m
2 ]
SFP
Cooling Heating Electricity
020406080100120140160180200
05
101520253035404550
1,3 1,6 1,9
Elec
trici
ty d
eman
d [k
Wh/
m2 ]
Ther
mal
ene
rgy
dem
and
[kW
h/m
2 ]
Ventilation flow rate l/s/m2
Cooling Heating Electricity
020406080100120140160180200
05
101520253035404550
2,0 2,5 3,0
Elec
trici
ty d
eman
d [k
Wh/
m2 ]
Ther
mal
ene
rgy
dem
and
[kW
h/m
2 ]
COP
Cooling Heating Electricity
020406080100120140160180200
05
101520253035404550
Elec
trici
ty d
eman
d [k
Wh/
m2 ]
Ther
mal
ene
rgy
dem
and
[kW
h/m
2 ]
Ventilation time
Cooling Heating Electricity
020406080100120140160180200
05
101520253035404550
63 70 77
Elec
trici
ty d
eman
d [k
Wh/
m2 ]
Ther
mal
ene
rgy
dem
and
[kW
h/m
2 ]
VVX %
Cooling Heating Electricity
020406080100120140160180200
05
101520253035404550
18 20 22
Elec
trici
ty d
eman
d [k
Wh/
m2 ]
Ther
mal
ene
rgy
dem
and
[kW
h/m
2 ]
Min room temp. day [°C]
Cooling Heating Electricity
160
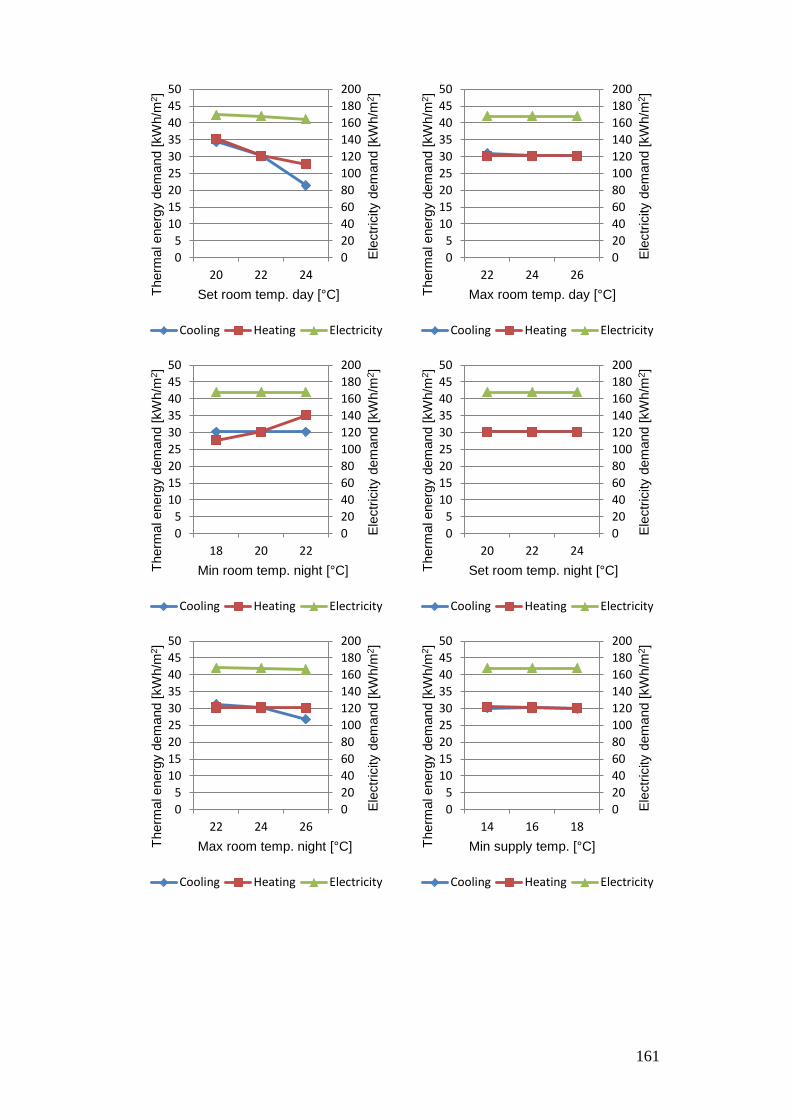
020406080100120140160180200
05
101520253035404550
20 22 24
Elec
trici
ty d
eman
d [k
Wh/
m2 ]
Ther
mal
ene
rgy
dem
and
[kW
h/m
2 ]
Set room temp. day [°C]
Cooling Heating Electricity
020406080100120140160180200
05
101520253035404550
22 24 26
Elec
trici
ty d
eman
d [k
Wh/
m2 ]
Ther
mal
ene
rgy
dem
and
[kW
h/m
2 ]
Max room temp. day [°C]
Cooling Heating Electricity
020406080100120140160180200
05
101520253035404550
18 20 22
Elec
trici
ty d
eman
d [k
Wh/
m2 ]
Ther
mal
ene
rgy
dem
and
[kW
h/m
2 ]
Min room temp. night [°C]
Cooling Heating Electricity
020406080100120140160180200
05
101520253035404550
20 22 24
Elec
trici
ty d
eman
d [k
Wh/
m2 ]
Ther
mal
ene
rgy
dem
and
[kW
h/m
2 ]
Set room temp. night [°C]
Cooling Heating Electricity
020406080100120140160180200
05
101520253035404550
22 24 26
Elec
trici
ty d
eman
d [k
Wh/
m2 ]
Ther
mal
ene
rgy
dem
and
[kW
h/m
2 ]
Max room temp. night [°C]
Cooling Heating Electricity
020406080100120140160180200
05
101520253035404550
14 16 18
Elec
trici
ty d
eman
d [k
Wh/
m2 ]
Ther
mal
ene
rgy
dem
and
[kW
h/m
2 ]
Min supply temp. [°C]
Cooling Heating Electricity
161
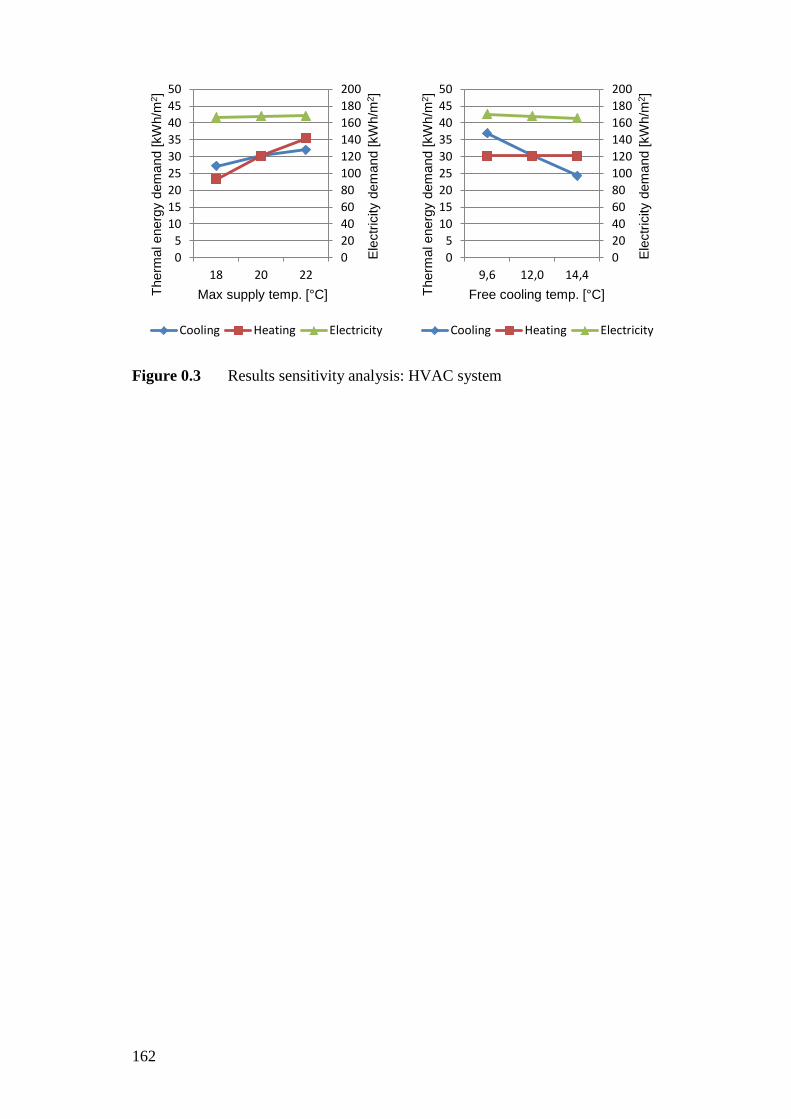
Figure 0.3 Results sensitivity analysis: HVAC system
020406080100120140160180200
05
101520253035404550
18 20 22
Elec
trici
ty d
eman
d [k
Wh/
m2 ]
Ther
mal
ene
rgy
dem
and
[kW
h/m
2 ]
Max supply temp. [°C]
Cooling Heating Electricity
020406080100120140160180200
05
101520253035404550
9,6 12,0 14,4
Elec
trici
ty d
eman
d [k
Wh/
m2 ]
Ther
mal
ene
rgy
dem
and
[kW
h/m
2 ]
Free cooling temp. [°C]
Cooling Heating Electricity
162
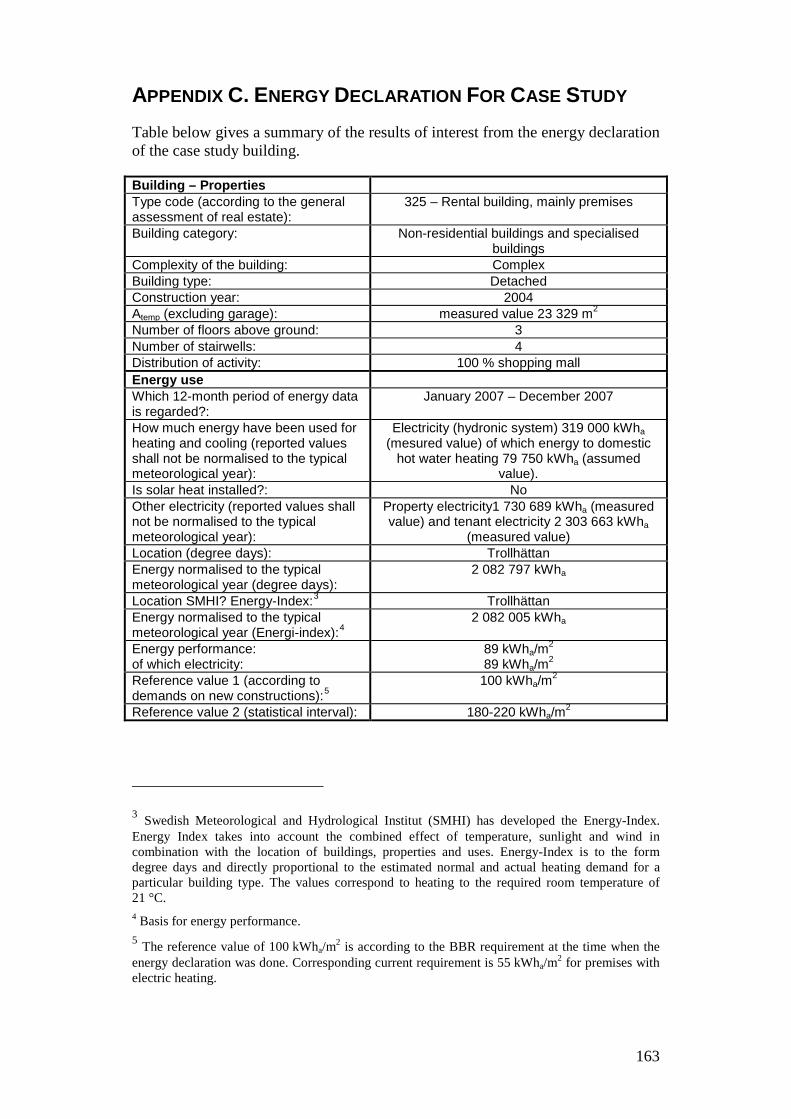
APPENDIX C. ENERGY DECLARATION FOR CASE STUDY Table below gives a summary of the results of interest from the energy declaration of the case study building.
Building – Properties Type code (according to the general assessment of real estate):
325 – Rental building, mainly premises
Building category: Non-residential buildings and specialised buildings
Complexity of the building: Complex Building type: Detached Construction year: 2004 Atemp (excluding garage): measured value 23 329 m2 Number of floors above ground: 3 Number of stairwells: 4 Distribution of activity: 100 % shopping mall Energy use Which 12-month period of energy data is regarded?:
January 2007 – December 2007
How much energy have been used for heating and cooling (reported values shall not be normalised to the typical meteorological year):
Electricity (hydronic system) 319 000 kWha (mesured value) of which energy to domestic
hot water heating 79 750 kWha (assumed value).
Is solar heat installed?: No Other electricity (reported values shall not be normalised to the typical meteorological year):
Property electricity1 730 689 kWha (measured value) and tenant electricity 2 303 663 kWha
(measured value) Location (degree days): Trollhättan Energy normalised to the typical meteorological year (degree days):
2 082 797 kWha
Location SMHI? Energy-Index:3 Trollhättan Energy normalised to the typical meteorological year (Energi-index):4
2 082 005 kWha
Energy performance: of which electricity:
89 kWha/m2 89 kWha/m2
Reference value 1 (according to demands on new constructions):5
100 kWha/m2
Reference value 2 (statistical interval): 180-220 kWha/m2
3 Swedish Meteorological and Hydrological Institut (SMHI) has developed the Energy-Index. Energy Index takes into account the combined effect of temperature, sunlight and wind in combination with the location of buildings, properties and uses. Energy-Index is to the form degree days and directly proportional to the estimated normal and actual heating demand for a particular building type. The values correspond to heating to the required room temperature of 21 °C. 4 Basis for energy performance. 5 The reference value of 100 kWha/m2 is according to the BBR requirement at the time when the energy declaration was done. Corresponding current requirement is 55 kWha/m2 for premises with electric heating.
163
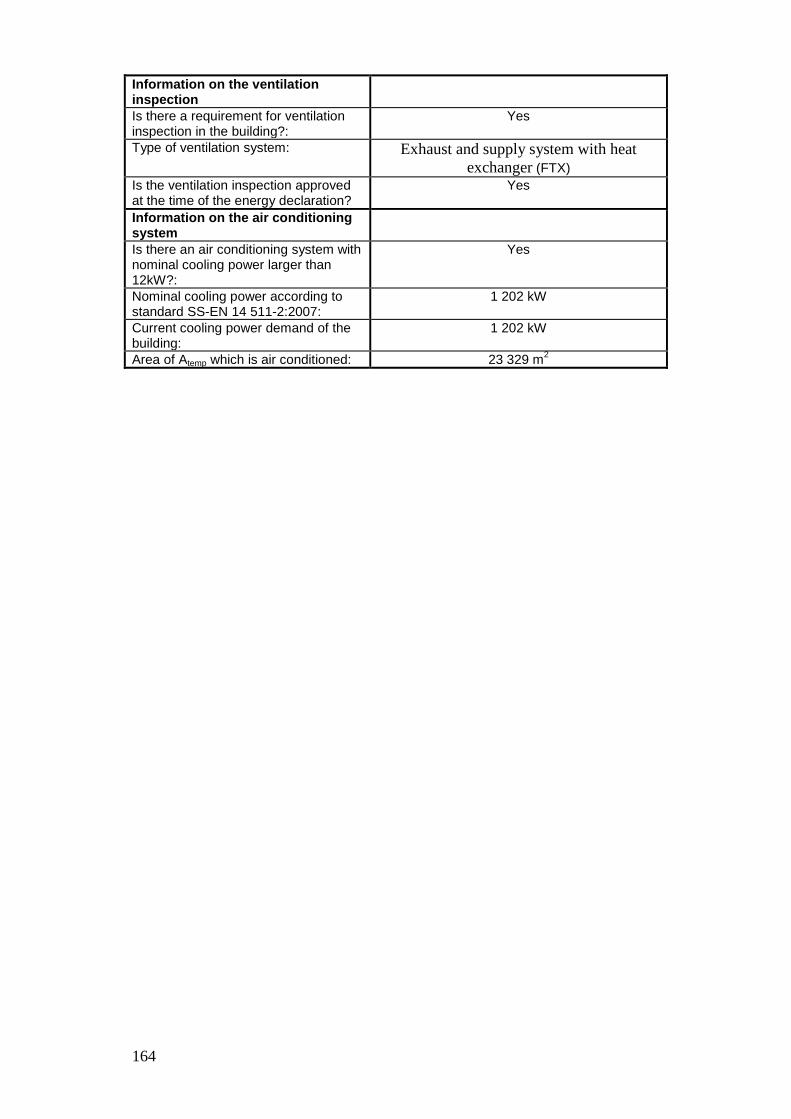
Information on the ventilation inspection
Is there a requirement for ventilation inspection in the building?:
Yes
Type of ventilation system: Exhaust and supply system with heat exchanger (FTX)
Is the ventilation inspection approved at the time of the energy declaration?
Yes
Information on the air conditioning system
Is there an air conditioning system with nominal cooling power larger than 12kW?:
Yes
Nominal cooling power according to standard SS-EN 14 511-2:2007:
1 202 kW
Current cooling power demand of the building:
1 202 kW
Area of Atemp which is air conditioned: 23 329 m2
164


![Disabled facilities in shopping malls: Malaysian perspective / Ahmad Ezanee Hashim ... [et. al]](https://img.pdfslide.net/doc/110x75/635dd005a0f1eac29f0c62c3/disabled-facilities-in-shopping-malls-malaysian-perspective-ahmad-ezanee-hashim.jpg)