Embed Size (px)
Citation preview

http://www.diva-portal.org
Preprint
This is the submitted version of a paper published in Journal of Empirical Software Engineering.
Citation for the original published paper (version of record):
Petersen, K., Gencel, C., Asghari, N., Betz, S. (2014)
An Elicitation Instrument for Operationalising GQM+Strategies (GQM+S-EI).
Journal of Empirical Software Engineering, 20(4): 968-1005
http://dx.doi.org/10.1007/s10664-014-9306-z
Access to the published version may require subscription.
N.B. When citing this work, cite the original published paper.
Permanent link to this version:http://urn.kb.se/resolve?urn=urn:nbn:se:bth-6520

Empirical Software Engineering manuscript No.(will be inserted by the editor)
An Elicitation Instrument for OperationalisingGQM+Strategies (GQM+S-EI)
Kai Petersen · Cigdem Gencel · NeginAsghari · Stefanie Betz
Received: date / Accepted: date
Abstract Context: A recent approach for measurement program planning,GQM+Strategies, provides an important extension to existing approaches link-ing measurements and improvement activities to strategic goals and ways toachieve these goals. There is a need for instruments aiding in eliciting informa-tion from stakeholders to use GQM+Strategies. The success of GQM+Strategieshighly depends on accurately identifying goals, strategies and informationneeds from stakeholders.
Objective: The research aims at providing an instrument (called GQM+S-EI), aiding practitioners to accurately elicit information needed by GQM+Strategies(capturing goals, strategies and information needs).
Method: The research included two phases. In the first phase, using actionresearch method, the GQM+S-EI was designed in three iterations in EricssonAB. Thereafter, a case study was conducted to evaluate whether the informa-tion elicited with the designed instrument following the defined process wasaccurate and complete.
Kai Petersen (corresponding author)Blekinge Institute of TechnologyKarlskrona, SwedenE-mail: [email protected]
Cigdem GencelFree University of Bolzano-Bozen,39100 Bolzano-Bozen, ItalyE-mail: [email protected]
Negin AsghariEricsson ABKista, SwedenE-mail: [email protected]
Stefanie BetzBlekinge Institute of TechnologyKarlskrona, SwedenE-mail: [email protected]

2 Kai Petersen et al.
Results: We identified that the industry requires elicitation instrumentsthat are capable to elicit information from stakeholders, not having to knowabout the concepts (e.g. goals and strategies). The case study results showedthat our proposed instrument is capable of accurately and completely captur-ing the needed information from the stakeholders.
Conclusions: We conclude that GQM+S-EI can be used for accuratelyand completely eliciting the information needed by goal driven measurementframeworks. The instrument has been successfully transferred to Ericsson ABfor measurement program planning.
Keywords Goal Driven Measurement · Goal Elicitation · Strategy Elic-itation · Information Need · GQM+Strategies · Action Research · CaseStudy
1 Introduction
In today’s competitive software development market, there is an increasingneed for having a well-structured measurement program for software orga-nizations to understand, control and improve the current status of softwareprocesses, products and resources.
A well structured measurement program gives organizations the ability tofollow up on goals at different levels of the organization by translating businessstrategies to the set of operational goals and break them down to respectivemeasurements needed to evaluate them [Basili et al., 2007,Basili et al., 2010].The key success for measurement initiatives is to provide a well-defined planfor executing measurement programs, which can be efficiently implementedafterwards [Mandic et al., 2010b]. As [Mendonça and Basili, 2000] point out,a high quality software measurement program should lead to sound, complete,lean, and consistent measurements.
A number of frameworks, models and standards (cf. [Basili et al., 2010,Tahir and Jafar, 2011]) have been developed to support software organiza-tions in planning their measurement programs. The main idea of many ap-proaches is to provide a set of metrics that might be relevant for a specificapplication domain, process area, or quality aspect. Links to goals or linksto information needs are typically only vaguely provided if at all. Mecha-nisms to creating such links are usually missing. However, there are a fewexceptions, that aim at deriving measures from measurement goals (such asGoal Question Metric [Basili and Weiss, 1984,Caldiera and Rombach, 1994])or connecting measures to organizational goals (such as Balanced Score Card[Kaplan et al., 1996]).
The empirical evidence collected in different contexts have shown that goal-driven measurement approaches are rigorous, adaptable and flexible [Boyd, 2005].Among these, some of the well-known ones are Goal Question Metric (GQM)[Basili and Weiss, 1984,Caldiera and Rombach, 1994], Balanced Score Card[Kaplan et al., 1996], Goals Questions Indicators Measures (GQ(I)M) [Boyd, 2002],Model Measure Manage Paradigm (M3P) [Offen and Jeffery, 1997], ISO/IEC

An Elicitation Instrument for Operationalising GQM+Strategies (GQM+S-EI) 3
15939 standard on software measurement process [ISO/IEC15939, 2002] andDecision Maker Model [McGarry et al., 2002].
The Goal-Question-Metric (GQM) served the industry for quite a longtime with the purpose of improving the process and quality of software prod-uct development [Ardimento et al. 2006]. GQM suggested that measurementsin software development should be driven by measurement goals in a top downfashion. GQM defines a measurement model consisting of multiple levels: goals,questions and metrics. Measurement goals represent what should be achievedwith the measurement. Questions represent the information needs of the stake-holders (i.e. answers to the questions help to achieve the measurement goal),and the metrics help in answering the questions. In this approach, each metricconnects indirectly to a goal through one or more question(s), therefore nometrics are defined which do not have any justification related to a measure-ment goal.
GQM has been extended and complemented over time. Offen and Jeffery[Offen and Jeffery, 1997] introduced the M3P which proposed a well-definedlinkage among the numerical data and related development and business con-text by coupling business, organizational and technical issues into a mea-surement program context. M3P hence incorporates business goals, and em-phasizes linking numerical results to them similar to GQ(I)M [Boyd, 2002,Park et al., 1996]. GQ(I)M is the acronym for Goal Question Indicator Mea-sure and the “I” in parenthesis emphasizes the difference between this frame-work and GQM. GQ(I)M extends GQM with different steps, for example theincorporation of business goals and actions to be taken to implement the mea-sures. Furthermore, indicators (i.e. definitions of charts and visualizations)play an important role. In comparison to GQM, GQ(I)M incorporates businessgoals in addition to project goals, hence incorporating the business perspec-tive [Boyd, 2002]. It was specifically designed for the CMM/CMMI family ofprocess improvement models [Park et al., 1996].
Recently, [Basili et al., 2007,Basili et al., 2010] introduced GQM+Strategiesto explicitly link organizational goals across multiple levels (e.g. business, soft-ware, and process). This model extends the GQM by introducing business goalsto which measurement and operational goals are linked. With this, the GQM-approach gains a long- term perspective and hence the measurement programis more likely to be sustainable. Furthermore, strategies for how to reach thegoals are incorporated to be able to follow up on whether a strategy was suc-cessful in reaching the business goals. Given the benefit of sustainability of themeasurement programs based on GQM+Strategies, we chose this approach toform the basis for this research.
On the other hand, in order to run goal-driven measurement frameworks,plenty of information has to be elicited; including goals on multiple levels,strategies, and information needs. In particular, capturing all this informationfrom the perspective of stakeholders accurately is essential, given that they willuse the information as a decision parameter for metrics selection. The amountof information to be captured also increases when the scale of the organiza-tion is large (e.g. in terms of number of systems, or the number of people or

4 Kai Petersen et al.
projects involved). The different perspectives (e.g. roles in the organization)then have to agree on the accuracy of the captured information to achieve acommon understanding, and to decide what is important (e.g. through walk-throughs or discussion). Alternatives for prioritizing the importance of goalsand strategies and how to use that for selecting software metrics is discussedin [Graham, 2009].
However, the existing goal-driven approaches neither explicitly define howto, nor provide supporting guidelines for the information elicitation process.[Kilpi, 2001] briefly mentioned the overhead costs due to time consuming goalssetting sessions and negotiations in Nokia. Boyd [Boyd, 2005], referring to Wil-son et al. [Wilson et al., 2002], claimed that it is difficult to elicit informationon business goals and strategies in an organisation as stakeholders were notalways fully aware of, or able to articulate their goals. The need to arrive at acommon understanding and agreement on what is important further adds tothat challenge.
We checked whether elicitation approaches are available and were empir-ically evaluated in order to capture information needed for goal-driven mea-surement through a pilot search. The goal was to determine whether thereexists any study where the main focus was on how to design an elicitation in-strument for goal-based measurement program planning. The terms used were“(GQM OR “goal based measurement”) AND elicitation”. The majority of thepapers (over 500) returned were related to requirements engineering, but nonewas empirically evaluating and comparing approaches to elicit informationfor a measurement program in general, and GQM+Strategies in particular.In [Park et al., 1996], some guidelines are provided for eliciting informationwhen applying goal-driven measurement process. However, no empirical evi-dence was provided, which the guidelines were built upon. Hence, we identifiedthe following research gap: For goal-based measurement program planning weknow what to collect, but have little empirical evidence for how to best collectthe required information.
With the purpose of aiding organizations in eliciting information neededfor GQM+Strategies based measurement program planning, we fulfilled thefollowing objectives:
1. Design an elicitation instrument for GQM+Strategies in close collaborationwith industry and practically apply it.
2. Empirically evaluate the approach with respect to its ability to accuratelycapture information for GQM+Strategies from practitioners.
The remainder of this paper is structured as follows: Section 2 providesbackground on GQM+Strategies and the studies conducted on the topic. There-after, Section 3 presents the related work on information elicitation approachesin general, and in the context of goal-based measurement. Section 4 providesthe research methodology used in this study. Section 5 presents the results,followed by a discussion of the results and their implications in Section 6.Section 7 concludes the paper.

An Elicitation Instrument for Operationalising GQM+Strategies (GQM+S-EI) 5
Context/Assumption
Goal
Strategy
Levels (linked)
Business levelSoftware level
Project level
influences
influences
realised by
GQM Goal
Question Question
Measure Measure
Measure
> made measurable
through
< measuresachievement
of
GQM+Strategy Elements GQM Graph
Fig. 1: GQM+Strategies Concepts based on [Basili et al., 2007]
2 Background
2.1 GQM+Strategies Structure and Concepts
GQM+Strategies [Basili et al., 2007,Basili et al., 2010] is the most recent ad-vancement in goal-driven measurement program planning. Figure 1 illustratesthe structure of GQM+Strategies. The key elements of GQM+Strategies aregoals, strategies, and assumptions.
Goals, strategies, and assumptions/contextual information is collected andlinked with each other. These are collected on multiple levels, e.g. businesslevel, software level, and project level and linked with each other across levels.
To avoid a disconnection between the business perspective and operationalmeasures the GQM+Strategies elements are linked to GQM graphs to doc-ument how they could be quantified to determine the achievement of thegoals documented in GQM+Strategies elements. For instance, one could learnwhether a new strategy used was leading an improvement with respect to thedesired business goals. For that it is important to determine an interpretationmodel, which states when a goal has been achieved.
[Münch and Heidrich, 2008] provide definitions for the concepts used inGQM+Strategies. The definitions from [Münch and Heidrich, 2008] are pro-vided in Table 1.
2.2 Studies on GQM+Strategies
Mandic et al. [Mandic et al., 2010b] evaluated the GQM+Strategies approachin a Finnish company. They used Bloom’s taxonomy to evaluate the level ofunderstanding that practitioners have in using the approach. This reaches fromlevel 1 (remember the concepts) up to level 6 (being able to create the best pos-sible GQM+Strategies grid/graph). The levels in between those are level 2 (un-derstanding GQM+Strategies), level 3 (being able to apply GQM+Strategies),

6 Kai Petersen et al.
Table 1: Action Research Interviewers
Business goal Definition ExampleBusiness goals Goals the organization wishes
to accomplishMarket shares to be achieved,revenue goals, and otherbenchmarking goals
i-th level goals Lower-level goals that are in-herited from higher-level goals(level i-1)
Lvl i (business goal) improvemarket has strategy (improvequality), leads to lvl i-1 goal(reduce customer trouble re-ports by X%) on software level
Strategy Approaches to achieve thegoals
Improve product quality, in-crease efficiency, etc.
Assumptions Estimated unknowns affectingthe interpretation of data in re-lation to linkage between ele-ments
Assumptions how differentgoals influence each other
Context factors Environmental factors repre-senting the organizational en-vironment
Experience in measurementprograms, means for auto-mated data collection
GQM+StrategiesElement
Single goal and its strategies,including context and assump-tions
Left box in Figure 1
GQM-Graph Single GQM goal and relatedquestions, metrics, and inter-pretation models
Right box in Figure 1
GQM+StrategiesGrid
Collection of GQM+Strategieselements, GQM-Graphs and alllinks
Figure 5
level 4 (being able to analyze GQM+Strategies) and level 5 (being able toevaluate GQM+Strategies). People were given training in the approach, whichshould allow them to achieve level 3. Higher levels require practical experience.In the evaluation of the approach 12 people from the company participated.Overall, the majority of the participants remembered the concepts. For higherlevels (2-4) they indicated that that they feel comfortable in reaching thosestep working together with an expert supervisor. The practitioners with theircurrent knowledge level considered level 5 and 6 as not being doable.
Mandic et al. [Mandic et al., 2010a,Mandic and Basili, 2010] extended theGQM+Strategies by introducing the value goals with the intent of analysingbusiness goals. To this end, they integrated business value analysis (BVA),which provided a coupling of cost-benefit and risk analysis (value goals) withoperationally measurable business goals. Overall, the idea is based on returnon investment, i.e. the return is the value gained, and the investment is thecost in creating the value in the organization. An illustrative example waspresented to understand the approach, but no empirical evaluation has beendone yet.
Mandic and Oivo [Mandic and Oivo, 2010] proposed a tool that allows cap-turing context information for GQM+Strategies as well as goals and strategies.The tool was built to support information elicitation for the GQM+Strategieswhen creating the tree/grid for the measurement program. However, the paper

An Elicitation Instrument for Operationalising GQM+Strategies (GQM+S-EI) 7
does not provide information of how to elicit the information from stakehold-ers in order to capture them in the tool. In a small survey with 12 participantsthe researchers found that the participants agreed on the usefulness of the toolin structuring the GQM+Strategies elicitation.
An evaluation of GQM+Strategies in the military training domain was pre-sented in [Sarcià, 2010]. In this study, the authors elaborated the extent theGQM+Strategies has to be modified in order to be applicable. GQM+Strategiesdefines multiple levels as business level, organizational level, and product level.These levels were translated into more generic ones to be applicable to otherdomains, namely strategic level, design level, and execution level. In addition,they evaluated the ease of applying this approach in terms of efficiency andeffectiveness by applying it to military training to evaluate training expenses.The study showed that the approach could be transferred to different domains,but at the same time requires excellent understanding of the concepts.
GQM+Strategies has been applied in the Japan Aerospace ExplorationAgency [Kaneko et al., 2011]. The outcome was in the main focus of the work.However, how the outcome was reached and which challenges/support theapproach supported were not elaborated. Some lessons learned have been pre-sented, namely: (1) clarify the relationship between different organizationalunits and organizational levels; (2) involve the people in the organization; and(3) when having used the approach, record components for goals and strategiesand reuse them to reduce effort in running the measurement program. Accord-ing to the authors, GQM+Strategies also needs to be extended to incorporatepriorities of goals.
The authors in [Trendowicz et al., 2011] provide a case study of applyingGQM+Strategies in the case of the Japanese Information-Technology Promo-tion Agency (IPA) with the goal of identifying the degree with which projectsare contributing to business goals, and with this information to align theprojects. The work was motivated by the observation that alignment of activi-ties with business goals is seldom accomplished. A project alignment matrix isthen used to show which strategic goals exist, and which project and its relatedgoals match those strategic goals. In the case study five projects and strategygoals have been identified. The researchers conclude that the approach helpedto achieve traceability from strategies to project goals, and hence support toupdate project goals accordingly.
[Jürgen Münch, 2013b] conducted a recent case study reflecting on theirexperiences when using GQM+Strategies. The study lasted for five monthsand was structured along several workshops. The main drivers for elicitationin this case were workshops and planning meetings held with company repre-sentatives. The study highlights several challenges: 1) Initial training is neededgiven that stakeholders do not all have prior knowledge of the GQM+Strategiesconcepts; 2) it is challenging to find a suitable entry point to start the investi-gation; and 3) understanding the organizational structure is a challenge giventhat roles are not always clearly defined. Key recommendations were givenas: having representatives from multiple levels of the organization to partic-

8 Kai Petersen et al.
ipate; using the concept of saturation to determine stability, and using goalevaluation patterns which appeared as very useful.
[Jürgen Münch, 2013a] conducted another investigation at the same com-pany as in [Jürgen Münch, 2013b] with the goal of determining goal harmo-nization and alignment. The study presents revisions of goals for revisions ofthe GQM+Strategies grid. The findings indicated that during workshops onlylittle new information was added to the grid. Hence, overall the evidence in-dicated that GQM+Strategies helps in alignment and harmonization of thegoals of an organisation. Other positive side-effects mentioned was increasedtransparency.
3 Related Work
The area with most research on elicitation in software engineering is asso-ciated with the requirements engineering activity. Two systematic reviews[Davis et al., 2006,Dieste and Juzgado, 2011] have been conducted to aggre-gate evidence to identify which elicitation approach has been most effective.
In the systematic review by Davis et al. [Davis et al., 2006], interviewshave been found to be most effective in terms of amount of information gath-ered. Based on vote counting (counting number of studies in favor or againsta specific outcome), they found that structured interviews appear to be moreeffective than unstructured interviews, and that unstructured interviews aremore effective than the think aloud technique. Another finding was that vi-sual aids do not aid discovering new information, but help in focusing thediscussion.
The review by [Dieste and Juzgado, 2011] analyzed studies on interviewtechniques which were categorized into interviewing, laddering, sorting, andprotocol review techniques. The findings of this review also support that in-terviews appear to be the most effective technique for elicitation. The leasteffective technique was protocol analysis.
Park et al. [Park et al., 1996] suggested using structured brainstorming, theNominal Group Technique [Scholtes et al., 2003] and interviews for elicitinginformation when applying goal driven measurement.
As part of the GQM approach, GQM abstraction sheets are a means toconduct interviews to elicit GQM-based information. An abstraction sheetselects a unit of study, purpose, quality focus, and context for one specificgoal. It is answered from a viewpoint. Four quadrants are to be filled in withthe interviewee, namely quality focus (measured properties), variation factors(influencing factors on measured properties in the quality focus), baseline hy-potheses (current situation with respect to measured properties), and variationhypotheses (effect variation factors will have on the properties in the qualityfocus) [Briand et al., 1996]. The approach has been successfully used in indus-try as part of the overall GQM-approach (cf. [Van Latum et al., 1998]). Theabstraction sheet is valuable in eliciting information building the GQM graph

An Elicitation Instrument for Operationalising GQM+Strategies (GQM+S-EI) 9
as part of GQM+Strategies. It has been evaluated as part of GQM, but hasnot been the main focus of an empirical study.
Contribution to related work: There are a number of publications onthe GQM+Strategies, while only few represent industrial case studies (see Sec-tion 2). The existing case studies did not provide a guide that a measurementprogram responsible could take to communicate and elicit information fromrelevant stakeholders beyond the presentation of the definition and concepts,as well as the final result (GQM+Strategies grid). The grid itself is the out-come of the elicitation (i.e. communicating with the stakeholders, studyingdocumentation, etc.).
There exist templates to fill in GQM+Strategies related information. Fur-thermore, the GQM+Strategies grid as an instrumentation instrument couldbe used for elicitation. In this study, the traditional instruments (template/GQM-grid) have been utilized first with an initial assumption that they would beeasy and intuitive to populate with information. However, it became evidentthat a new solution was needed, which does not rely on substantial experienceon measurement concepts when interviewing practitioners (see Section 5.1.1).
This research adds to the current body of knowledge on the GQM+Strategiesby iteratively designing an elicitation instrument in industry and providing re-flections for each design iteration for alternative elicitation approaches. Thedesigned instrument is then used in a case study focusing on a specific mea-surement program, making a novel contribution in empirically evaluating thequality of the elicited information with respect to accuracy and completenessin industry.
4 Research Methodology
This research is divided into two phases building upon each other: i) Phase I -Design of the Elicitation Instrument and ii) Phase II - Evaluation of the Elici-tation Instrument. Figure 2 provides an overview of the research methodologyused in this study.
In the first phase, we used action research [Brydon-Miller et al., 2003] toiteratively design the elicitation instrument for the GQM+Strategies (calledGQM+S-EI) in close collaboration with the case company (see Section 4.2 fordetails). We took the role of measurement program planners for one particularimprovement program at the company. The research question (RQ1) for thisphase of the study was:
– RQ1: How should software organizations elicit goals and strategies as inputfor GQM+Strategies?
The answer to this question aims at finding a useful and practically appli-cable way of eliciting information for GQM+Strategies from stakeholders. Theinitial design goal of GQM+S-EI was to capture the main structural elements(goals, strategies, links between them) from practitioners to make the con-struction of the GQM+Strategies grid as presented in [Basili et al., 2010]. The

10 Kai Petersen et al.
GQM+Strategies grid is the outcome of the elicitation activity, but can alsoserve as an instrument for elicitation. We used a notation-based grid structureas the starting point for elicitation, and made changes iteratively using actionresearch to improve. Each iteration provides insights of which strategies ofelicitation are applicable. Having defined a stable and well working solutionfor elicitation, we used the instrument in the second phase.
In the second phase, we conducted a case study [Runeson and Höst, 2009]on a different improvement program to empirically evaluate the GQM+S-EIin eliciting information accurately and completely from the stakeholders (seeSection 4.3 for details). The research question was as follows:
– RQ2: How accurate and complete is GQM+S-EI in capturing GQM+Strategiesrelevant information from stakeholders?
The answer to this question provides evidence for the accuracy and com-pleteness in capturing information from stakeholders, which are the main in-tention of the elicitation approach.
Another important related issue to eliciting information is to decide on theright goals and strategies for a measurement program to be successful (e.g. howto prioritize elicited goals, and how to choose metrics accordingly). However,this is another step in the overall measurement program and is not elaboratedhere. Information about this important issue can be found in, for example,[Gencel et al., 2013].
4.1 Research Context
This study was conducted as part of a research project (GQM-Lean: Estab-lishing a Lean and Sustainable Software Measurement Program funded byEricsson Software Research (ESR)). The research context is characterized bythe company and the measurement program being studied.
The industry partner for this study was Ericsson AB, which is one ofthe major telecommunication companies in the world offering telecommuni-cation services and products to telecom operators. Ericsson is certified by ISO9001:2000. It is a market-driven company and the frequently changing marketinfluences its product development approach, which is incremental with theuse of agile practices. Details on the process followed in the company can befound in [Petersen and Wohlin, 2009a,Petersen and Wohlin, 2010a]. Ericssonuses balanced scorecard as a performance tool for managing and measuringthe software process, products, and resources. Table 2 represents more detailregarding the context of the study. The same company was investigated inboth Phase I and Phase II.
Ericsson AB has been using ISO 15939 to structure their measurements,aimed at defining common base measures that will fulfil the most importantinformation needs (10 to 20). Further requirements formulated were the possi-bility to benchmark externally, strengthen organizational alignment, and sat-isfying the information needs of multiple stakeholders. Many measures were

An Elicitation Instrument for Operationalising GQM+Strategies (GQM+S-EI) 11
Ac#on Planning
Ac#on Taking Reflec#on
Phase I: Design of the Elicita#on Instrument (Ac#on Research)
Phase II: Evalua#on of the Elicita#on Instrument (Case Study)
Itera#on 1: GQM+S-‐EI v. 1.0 Itera#on 2: GQM+S-‐EI v. 2.0 Itera#on 3: GQM+S-‐EI v. 3.0 GQM+S-‐EI Release Version*
* The solu#on is stabilized and ready to be evaluated
Diagnoses
Case Study
Fig. 2: Research Methodology
collected manually and had to be aggregated from different databases. Hence,the measures identified the need to support measurement programs runningcurrently by automation to reduce the workload, increase efficiency, and tomake better analysis of the collected data. Recently, Ericsson AB built dash-boards that are connected to collected data that has been captured automat-ically (e.g. for lead-time and throughput related measures). No GQM-basedrepresentation has been used in the studied case prior to this study.

12 Kai Petersen et al.
Table 2: Context Characterization
Context Element DescriptionDomain Telecommunication, data communication, and multimedia so-
lutionMarket Highly dynamic and customized with a market share of 35 %Certification ISO 9001:2000Measurement Balanced ScorecardProcess Incremental process on the principal level, and agile practices
on development level
4.2 Phase I: Design of the Elicitation Instrument
4.2.1 Units of analysis
Improvement programs are initiatives to improve and are to be supported bymeasurement programs. In our initial meetings in Ericsson AB, we agreed todevelop GQM+ S-EI in a currently ongoing improvement program alreadyplanned, namely ‘Customer Responsiveness Program’. The Customer Respon-siveness program has been initiated in 2010 for reducing lead-time end-to-end in creating customizations requested by the customers in-between releases(cf. [Mujtaba et al., 2011]). The reason for requesting them is that customerswould not like to wait for a new release before receiving a feature they desire.Having developed a wide range of customizations, the company decides beforea release, which of the customizations developed should become part of thenext release delivered to all customers. Furthermore, we also made interviewsin two of the other ongoing improvement programs, one focusing on evaluatingthe ‘Cost of Poor Quality’ and the other on ‘R&D Performance’ evaluation.The choice of improvement programs was driven by the interest of the orga-nization, and the priority of planning and gathering information for specificprograms.
4.2.2 Overview of the method
We used action research method (action research [Brydon-Miller et al., 2003])for designing the elicitation instrument. The reason for choosing this methodwas that the company committed to provide the required resources and con-tinuously collaborate with us to iteratively design the elicitation instrumentto be later on transferred to Ercisson AB. Action research method follows thesteps of diagnosis, action planning, action taking, and reflection. The actionis an intervention introduced by the researcher to induce a positive change inthe company. Examples of action research applied in the software engineeringcontext can be found in [Baca and Petersen, 2013,Iversen et al., 2004].
Phase I in Figure 2 provides an overview of the research process usedin this phase of the research. We started with the diagnosis step in orderto understand the challenges in industry in relation to existing approachesand decide on the scope of the research. Furthermore, we investigated the

An Elicitation Instrument for Operationalising GQM+Strategies (GQM+S-EI) 13
improvement program the case company chose to work on when designing theelicitation instrument. We studied the process documentation in order to getfamiliar with the terminology used in the company. Whenever there was a need,we held informal meetings with the practitioners in the company to clarifyanswers to our questions. Having a good understanding, we continued withthe action planning and action taking steps designing and testing an initialversion of GQM+S-EI. Thereafter, we reflected on the results and identifiedimprovement points GQM+S-EI for the next iterations. The instrument wasfinalised and released after three iterations.
4.2.3 Roles and their interaction
The action research team consisted of three persons who acted as responsi-ble for measurement program planning. In this role, they elicited and aggre-gated information related to measurement program planning from stakehold-ers. Their initial tasks were defined on a high level beforehand, as is shown inTable 3.
Table 3: Action Research Interviewers
Name Role DescriptionNegin Asghari Lead inter-
viewerGuides the interview by following the guidelinesprovided by GQM+S-EI.
Cigdem Gencel Support Asks follow-up questions and follows interestinglines of questioning.
Kai Petersen Scribe Documents the information provided while usingGQM+S-EI and provides summaries in-between.
Six interviews were needed to achieve a stable and well working versionof GQM+S-EI. The practitioner profiles of the interviewees are provided inTable 4. We got the support of two managers at Ericsson in deciding on themeasurement programs and relevant stakeholders with respect to the interestof the organization. The interviewees are very experienced and know the orga-nization well, and all have been with the company for more than 10 years. Themanager then contacted the interviewees to get their consent. Thereafter, wesent an invitation email to all interviewees to inform them about the purposeof the investigation.
4.2.4 Data collection
In the action research process understanding the processes, products, prac-tices, and corporate terminology is essential to be able to act in the role ofa measurement program planner. To acquire the knowledge, archival data (inparticular process descriptions, power-point presentations, and measurementreports) have been studied. In case information was not understandable to us,our contact persons identified experts who could help in that situation. Most

14 Kai Petersen et al.
Table 4: Action Research Interviewees
Interviewee ID CurrentRole
Description
AI1 Architect This interviewee has been working in Ericsson for 19years. She has been working as a Principal Architectfor a year, and before that she was a biomedical engi-neer, building software for hemodialysis. Before that,she was a computer science tutor.
AI2 Systemmanager
This interviewee has worked over 30 years at Erics-son in different levels of the organization and in differ-ent positions. She has managed software developmentand system development and during the last 10 yearshas been involved mostly in system management. Atthe moment she is working in the management of re-search and development at the company, which followstwo targets: excel in reuse and improve the system ar-chitecture. As a system manager, she is documentingtheir blueprint architecture, which represents processsteps for facilitating reuse.
AI3 Solutionarchitect
This interviewee has been working with Ericsson for 18years in Sweden. She has worked in different positions,such as system integrator, system tester, support en-gineer, and project manager.
AI4 Requirementsengineer
This interviewee is a requirements engineer responsi-ble for requirements road-map and allocation. She hasnine years experience working in Ericsson and 20 yearsexperience in other companies like; Anoto, Telia Mo-bile, UAB, ELLEMTEL, and Logica Svenska AB. Shehas worked as a developer, tester, and product man-ager before.
AI5 Strategicmanage-ment
This interviewee is involved in strategic management,and she has been working for Ericsson for 17 years. Shehas experienced in RD organization within Ericssonwith the focus on radio networks.
AI6 R&D Man-ager
This interviewee has worked over twenty years at Er-icsson in different levels of organization and in differ-ent positions. She has managed software developmentand system development and during last 10 years shehas been involved more in system management. At themoment she is working in the RD management.
of the documents have been written abstractly and were hard to understandfor people not yet familiar with the measurement programs. Therefore, tenmeetings (online and face-to face) have been conducted in order to under-stand the content of the documents. Online meetings were necessary in caseswhere the interviewee was sitting in another branch of the organization locatedin another city.
In total, six interviews have been conducted to design three different ver-sions of GQM+S-EI (see Section 5.1). The data collection consisted of foursteps:
– Step 1. Introduction: The purpose has been introduced to the practitionerbeing interviewed. The introduction has evolved during the action research

An Elicitation Instrument for Operationalising GQM+Strategies (GQM+S-EI) 15
iterations, and can be found in Section 5.1.1, Section 5.1.2 , Section 5.1.3and Section 5.1.4 for GQM+S-EI v.1.0, v.2.0, v.3.0 and release version,respectively.
– Step 2. Application of the GQM+S-EI instrument to elicit information.The first version of the elicitation instrument is described in Section 5.1.1.The versions 2.0 and 3.0 are presented in Section 5.1.2, Table 8. The releaseversion of GQM+S-EI is shown in Tables 9 and 10 in Section 5.1.4.
– Step 3. Feedback collection: We gathered feedback from the intervieweesregarding GQM+S-EI. During Step 3, the interviewees have been askedregarding their reflection and discussion on the following aspects for allinterviews using opinion questions. They rated their level of agreementwith the statements below on a 7-point likert scale of ’Completely agree’ to’Completely disagree’. They were also asked to comment on their answers.The ratings and the comments were then used as a starting point for amore open discussion of why they gave that rating, which led to concreteactions suggested for improvements.– Understandability/usability: The interview questions to be used as part
of GQM+S-EI were easy to understand.– Completeness: Some important types of information (e.g. rationale)
have not been captured.– Correctness: We have been asked the right questions to be able to cap-
ture the intention of process related to the improvement program.– Overhead: We have been asked for irrelevant information, which brings
unnecessary overhead.– Acceptance: I would like this elicitation approach (interview guide) to
be adopted at Ericsson.– Step 4. Research team reflection: The research team (see Table 3) immedi-
ately reflected what happened during the use of GQM+S-EI, and discussedfurther improvements.
All data collection steps were recorded on tape and then transcribed. Incase we needed clarification, we contacted the interviewees. Then, we presentedthe interview results to the practitioners to evaluate their accuracy (memberchecking [Yin, 2011]).
In parallel to the interviews, steering group meetings with customer rep-resentatives (including our contact persons at the company) have been held.During the meetings the progress has been reported, and the changes to thesolution presented. This was an additional source for discussing, reflecting, andidentifying improvements to GQM+S-EI. Five steering group meetings havebeen held during the action research.
4.2.5 Data analysis
During the analysis phase, we used the transcribed text, our notes taken duringthe interview sessions and the answers to questionnaire that we used to getfeedback on each iteration (Step 3). The interviews were analyzed by noting

16 Kai Petersen et al.
down observations in our own words, where we observed challenges comingto light given that an aspect of the instrument was not working well duringinterview sessions. Furthermore, we summarized the feedback collected fromStep 3 to take into consideration which improvements the practitioners seewhen designing the new version of the interview. Much of this documentationwas also done in Step 4.
To increase the reliability of this analysis, we had multiple researcherspresent, reducing the bias in the interpretation of an individual researcher(observer triangulation [Runeson et al., 2012]). In order to structure the anal-ysis, we assigned tags to the statements (one tag indicating where things weregoing well and one where improvements are needed) and associated them totext fragments during the interview (Step 2) and during the research teamreflection (Step 3). Based on the analysis we highlighted noteworthy observa-tions as narratives and provided reflections that led changes to the instrument.[Colombo, 2003] suggested narrative analysis as a meaningful way to analyzeaction research results.
4.2.6 Threats to validity
[Petersen and Gencel, 2013] provided a reflection of validity threat categoriza-tions for software engineering and proposed to discuss four types of validitythreats: 1) descriptive validity (ability to describe what we observe objectivelyand truthfully), 2) theoretical validity (concerns controllability and whetherthe measures used capture what they intend to capture), 3) generalizabil-ity (the degree of generalizability internally (within groups, communities, ora company) and externally (across groups, communities, and companies)),and 4) interpretive validity (whether the conclusions/inferences are reason-ably drawn from the data objectively).
Descriptive validity: To avoid the risk that events during the action researchare not accurately captured, two actions have been taken. First, all interviewswere recorded and transcribed, which removes a step of interpretation if wewould have only relied on notes. Second, our summaries of what occurredduring the interviews have been verified with the interviewees through memberchecking. Hence, this threat is considered being under control.
Theoretical validity: A confounding factor between the setups is the back-ground of the interviewees, as well as in some cases we were co-located andin others not. Regarding the background, all interviewees were very experi-enced and had a good understanding of the improvement programs involved,hence being able to provide the information requested. The video-conferencesystem was advanced given that the company is using global software de-velopment; hence it allowed to see the other interviewers, and provided thefeature of screen sharing. Overall, the set-up was similar to the face-to-facesituation. Learning effect is a threat in action research, given that with everyiteration learning occurs. In each interview session, new participants who werenot exposed to the questions earlier, were involved to avoid the learning ef-fect. A potential threat could be that the interview team learns and executes
An Elicitation Instrument for Operationalising GQM+Strategies (GQM+S-EI) 17
the interviews with greater proficiency. Another threat could have been thatthe interviewees did not disclose all information as the interviews could havebeen be perceived as outsiders. At the time of the study, a collaborative re-search project has been established, with the first author being employed atthe company and not being a superior to any of the interviewees. This aidedin establishing trust. Furthermore, the authors had an office and were henceembedded in the corporate environment.
Generalizability: One risk is that the outcome depends on the context inwhich it was applied, i.e. the company and the measurement program. We ap-plied the elicitation approach to support measurement program planning fordifferent improvement programs (customer responsiveness, cost of poor qual-ity, performance measurement) and found that the approach stabilized andthe principle design was working well in the three programs. This supports in-ternal generalizability. There exists a threat to external generalizability giventhat the approach has been evaluated in a single company. We described thecontext and provided references to detailed process description to support fu-ture aggregations of evidence (e.g. cross-case comparisons) to support externalgeneralizability.
Interpretive validity: The interpretive validity concern the conclusions wedraw from the observations made in each action research iteration. As theserely on interpretation, as suggested in the context of literature reviews, mul-tiple researchers were involved in the interpretation step. The interpretationswere further cross-checked and reflected in the reference group meetings toreduce the threat of interpretive validity.
4.3 Phase II: Evaluation of the Elicitation Instrument
The purpose of this phase was to empirically evaluate whether the designedinstrument could completely and accurately capture GQM+Strategies relevantinformation from stakeholders.
4.3.1 Unit of analysis
Improvement program: During the case study, we studied another improve-ment program. This improvement program for which a measurement programwas planned is concerned with the continuous transformation of Ericsson ABto being a lean organization according to the principles of lean manufacturingand software engineering [Poppendieck, 2003]. The program includes differentbusiness units including software development as well as hardware develop-ment. The initiative is hence distributed across multiple development units.The measurement program is the basis for creating measurement dashboardsto continuously evaluate and improve with respect to being a lean softwareorganization.

18 Kai Petersen et al.
4.3.2 Overview of the method
The research method used is a single case study with one unit of analysis[Runeson and Höst, 2009]. The primary means of data collection were inter-views in combination with observation.
4.3.3 Roles and their interaction
The team for empirical evaluation of the instrument during the case studyconsisted of one researcher (Kai Petersen) and two measurement analysts atthe case company. Their experiences are shortly described in Table 5. Bothanalysts were also involved as contact persons during the action research, andas participants in the steering group meeting. They observed the use of theapproach during the action research (Phase I). Furthermore, they received apresentation of the tutorial prior to conducting the case study (see Section5.1.4). Having them being part of the interviewer team is an important partof creating a realistic situation (see e.g. [Ivarsson and Gorschek, 2011] for adiscussion about facilitating practical relevance from a subject’s perspective).
In this phase, another researcher, Stefanie Betz, was also involved afterthe interview sessions in: 1) reviewing the grid to make sure the translationof mind map to GQM+Strategies grid was correct, and 2) documenting theoutcome of the member checking (walkthrough meeting) to assure accuraterecording of requested changes by the practitioners.
Table 5: Case Study Interviewers
Name Role ExperienceMeasurementAnalyst 1
Lead Inter-viewer
The lead interviewer at the time of the interviews wasthe head of product development excellence, a unit at thecompany which is concerned with process improvement,methods, tools, and measurements. He worked with cross-organizational and global improvement programs. Beforethat, he headed product development units, was a linemanager, and a designer. He has been with Ericsson since1995.
MeasurementAnalyst 2
Support The support interviewer is a business intelligence prod-uct manager, and had repsonsibilities as a system designdriver, unit manager, quality manager, as well as designer,tester and trainer. He has been with Ericsson since 1992.
In total, eight interview sessions with the improvement program stakehold-ers were performed in order to evaluate the instrument by applying it to elicitthe required information. Two stakeholders participated in the Interview 7.The interviewees have been selected by the measurement analysts. They werefrom different development sites and business units. However, they all were in-volved in the improvement program and shared the main ideas and intentionsas described in Sections 4.3.1. Table 6 provides an overview of the interviews,their roles, and their experience. Interviewees have been chosen to capture the

An Elicitation Instrument for Operationalising GQM+Strategies (GQM+S-EI) 19
Table 6: Case Study Interviewees
IntervieweeID
Current Role Description
CI1 Portfolio manager Responsible for strategic product manage-ment. Manager since the 1990s, has been ITand unit manager, and is in the role of a port-folio manager since 2009
CI2 Driver lean and agiletransformation
Currently driver (formally responsible) for leanand agile transformation. Worked in R&D,head of technology for 2 years, head of productmanagement for six years.
CI3 Portfolio manager At Ericsson since 1997, previous roles wereunit manager, program manager, and depart-ment manager
CI4 Program and projectmanager
At Ericsson since 1991, previously in manage-ment positions in different organisations at Er-icsson
CI5 Project manager In the role of a project manager since 1999 atEricsson.
CI6 Head portfolio andtechnology mgt.
At Ericsson for over 18 years, had roles asproject manager, line manager, technologymanager.
CI7 Interviewee 1: Re-sponsible for opera-tions and innovation/Interviewee 2: Re-sponsible for integra-tion and verificationEfficiency
Interviewee 1: 3-4 years responsible for op-erations and innovation, previous backgroundin testing, test coordination, and test man-ager. Interviewee 2: Responsible for integra-tion and verification efficiency, working withoperational improvement, previous experienceas test manager and line manager, 36 years atEricsson.
CI8 Change driver for ag-ile and lean, agilecoach
At Ericsson for 15 years, headed different sys-tem management departments
operational perspective (project, e.g. CI4, CI5 in Table 6), strategic productperspective (Portfolio and program managers, e.g. CI1, CI3, CI6), and pro-cess improvement perspective (e.g. CI2, CI8). Choosing multiple perspectiveshas been important to not achieve saturation by just covering a very limitednumber of perspectives.
4.3.4 Data collection
The research team used the final release of GQM+S-EI designed in Phase1 for eliciting information from different stakeholders. During the elicitationprocess, the GQM+S-EI comprises use of mind-maps (see Section 5.1.4) andGQM+Strategies grid (see Fig 5).
The main source for determining the completeness and accuracy of theelicitation using the instrument is the GQM+Strategies grid. The outcomes ofthe elicitation session using the mind-maps are documented in the grid, whichprovided the basis to determine newly added information with each additional
20 Kai Petersen et al.
interview. Hence, the interviews using the elicitation approach form the basisof data collection for the study.
The final outcome (GQM+Strategies) was reviewed in a walkthrough meet-ing, during which member checking (accuracy) was conducted. Prior to themeeting, each member received their own mind-maps by e-mail to make even-tual corrections. The lead interviewer (see Table 5) guided the participants ofthe meeting through the GQM+Strategies grid step by step. Prior to doingthis, the first interviewer presented his slides and piloted his walkthrough withthe other members of the interview team being there to provide feedback.
During the walkthrough, the participants of the meeting could commenton the grid. The scribe took meeting minutes to document all comments andchanges requested. In total, four stakeholders not previously involved in theinterviews, but concerned with the improvement program, were present asadditional references to give further possibilities to add views to the grid.These included two program managers, the corporate responsible for improvingbusiness flow across business units, and a consultant for product development.
4.3.5 Data analysis
After completing all eight interview sessions, the scribe constructed the GQM+
Strategies grid (see Fig 5). This was done by marking goals, strategies, infor-mation needs, and metrics in different colours. From the data collected in thefirst interview session, an initial version of the grid was constructed. There-after, the elements of the second interview were added, and so forth. If anelement was already present, it was not added again. This way, it would be-come visible what was new in the GQM+Strategies grid after each additionalsession.
After having constructed the grid, the last author of this paper checkedwhether mapping of the information collected in the mind map to GQM+
Strategies grid was correct. Then, the scribe sent the grid to the interviewersand incorporated their feedback. Documenting the outcome of the memberchecking during the walkthrough meeting, the last author also checked thecorrectness and completeness of the recording of requested changes by thepractitioners.
In this study, we used two measures to evaluate the results of the casestudy, and hence the GQM+S-EI for accuracy and completeness. The firstmeasure used was saturation (quantitative) to establish completeness, whichmeans that with additional interview sessions to elicit information, less newdata is obtained [Guest et al., 2006]. Saturation is recognized as a good mea-sure for qualitative research. [Morse, 1994] stated “saturation is the key toexcellent qualitative work”. In this study, we measured the saturation by count-ing the newly identified GQM+Strategies elements with each additional inter-view session, as having been applied in software engineering research (see e.g.[Ali et al., 2012]).
The second measure used to determine the accuracy of the elicited infor-mation was done by member checking. The common approach to determine

An Elicitation Instrument for Operationalising GQM+Strategies (GQM+S-EI) 21
the accuracy of qualitative findings is to use member checking [Yin, 2011],which has been conducted through the walkthrough activity with the inter-viewees and additional stakeholders determining whether their views are alsocovered. The number of change requests in terms of, for example, reformulat-ing, adding, or deleting GQM+Strategies elements has been used as a measure.The member checking is also an additional means to check for completeness.That is, if many new GQM+Strategies elements would be suggested duringthe walkthrough, important information would have been missed.
4.3.6 Threats to validity
Descriptive validity: In this phase, we were not given consent to record the in-terviews due to confidentiality reasons. There was a risk that the GQM+Strategiesgrid is inaccurately defined by the researcher, which would lead to inaccuratereflections based on the elicited information with respect to accuracy and com-pleteness. Therefore, the first author created the grid from the interviews, andthen the lead interviewer and support interviewer from the case study, whoare also measurement analysts, reviewed the results. Furthermore, the last au-thor of this paper checked whether mapping of the information collected inthe mind map to GQM+Strategies grid as well as the recording of requestedchanges by the practitioners were correct. These reduced the risk of the datacollected in the grid being dependent on the researchers.
Theoretical validity: A lack of diversity in the background and roles of theparticipants could have led to a result where no new goals or strategies wereidentified early on. To avoid this threat, people from different business unitsand perspectives have been interviewed. Hence, this factor appeared to havea limited impact on the result. Furthermore, there was a threat having theresearchers who were the developers of the approach drove the elicitation, asthis constitutes an unrealistic situation (see [Ivarsson and Gorschek, 2011]).Hence, roles were changed from the action research to the case study, the rolesof the lead and support interviews now being taken by corporate measurementanalysts.
Generalizability: The measurement program is of large scale involving dif-ferent business units. Hence, the results with respect to distribution betweennumber of GQM+Strategies elements, and the outcome with respect to com-pleteness and accuracy might differ in other contexts (e.g. in the number ofinterview sessions needed to reach saturation), such as process improvementin smaller scales.
Interpretive validity: The interpretation was based on well-defined andwidely used measures in qualitative research and requirements engineering.Hence, using established approaches in this study (saturation as a measureof completeness, and member checking) reduced the risk in drawing non-reasonable conclusions from the data.
22 Kai Petersen et al.
5 Results
In this section, the results of Phase I and Phase II following the researchmethodology described in the previous section are presented.
5.1 Phase I: Design of the Elicitation Instrument
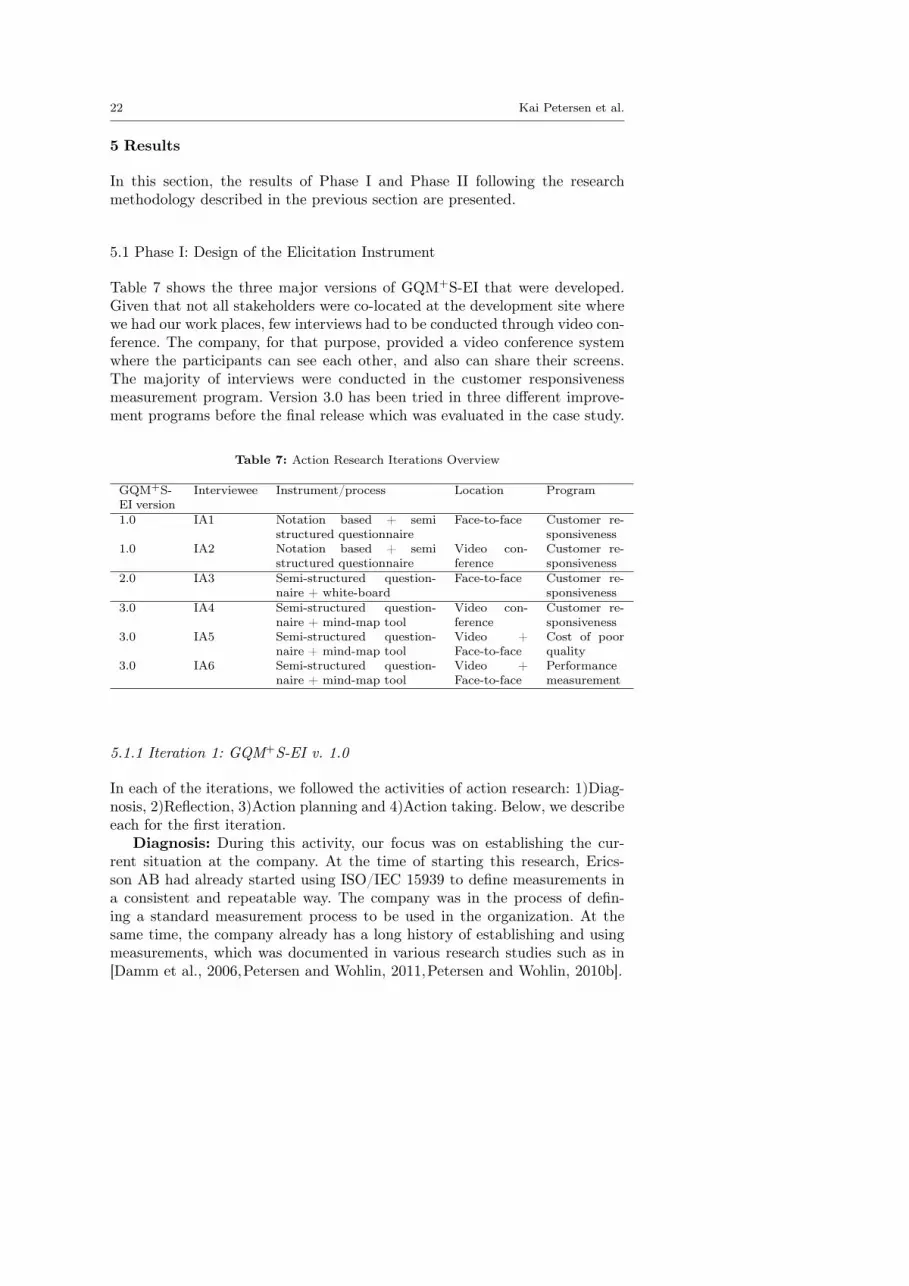
Table 7 shows the three major versions of GQM+S-EI that were developed.Given that not all stakeholders were co-located at the development site wherewe had our work places, few interviews had to be conducted through video con-ference. The company, for that purpose, provided a video conference systemwhere the participants can see each other, and also can share their screens.The majority of interviews were conducted in the customer responsivenessmeasurement program. Version 3.0 has been tried in three different improve-ment programs before the final release which was evaluated in the case study.
Table 7: Action Research Iterations Overview
GQM+S-EI version
Interviewee Instrument/process Location Program
1.0 IA1 Notation based + semistructured questionnaire
Face-to-face Customer re-sponsiveness
1.0 IA2 Notation based + semistructured questionnaire
Video con-ference
Customer re-sponsiveness
2.0 IA3 Semi-structured question-naire + white-board
Face-to-face Customer re-sponsiveness
3.0 IA4 Semi-structured question-naire + mind-map tool
Video con-ference
Customer re-sponsiveness
3.0 IA5 Semi-structured question-naire + mind-map tool
Video +Face-to-face
Cost of poorquality
3.0 IA6 Semi-structured question-naire + mind-map tool
Video +Face-to-face
Performancemeasurement
5.1.1 Iteration 1: GQM+S-EI v. 1.0
In each of the iterations, we followed the activities of action research: 1)Diag-nosis, 2)Reflection, 3)Action planning and 4)Action taking. Below, we describeeach for the first iteration.
Diagnosis: During this activity, our focus was on establishing the cur-rent situation at the company. At the time of starting this research, Erics-son AB had already started using ISO/IEC 15939 to define measurements ina consistent and repeatable way. The company was in the process of defin-ing a standard measurement process to be used in the organization. At thesame time, the company already has a long history of establishing and usingmeasurements, which was documented in various research studies such as in[Damm et al., 2006,Petersen and Wohlin, 2011,Petersen and Wohlin, 2010b].

An Elicitation Instrument for Operationalising GQM+Strategies (GQM+S-EI) 23
Reflection: In the diagnosis stage, our aim was to explore with whichelicitation approach to start with considering the current situation of the casecompany. The first idea was using existing templates (e.g. templates providedin the tutorial material [Münch and Heidrich, 2008] developed at FraunhoferIESE, and having practitioners fill them in. However, one concern was thatthey might loose sight of the big picture regarding the overall structure giventhat the information was added in a document using tables, and not visuallyconnecting the GQM+Strategies elements, such as in the GQM+Strategiesgrid. We also sent the template to one of the persons in the measurement pro-gram, which was not filled in due to the amount of information requested. Fill-ing in the template also requires excellent understanding of GQM+Strategies[Sarcià, 2010]. It was also shown that, even with training, only 3 of 6 lev-els in the Bloom’s Taxonomy tailored to GQM+Strategies could be obtained[Mandic et al., 2010b] (see also related work in Section 3). Therefore, we de-cided that the template itself would serve as an excellent checklist for com-pleteness of the elicitation outcome, but not as the elicitation instrument itself.
Our first design hence was based on a self-developed notation to representthe GQM+Strategies grid to the stakeholder during the elicitation process,which was combined with a semi-structured questionnaire as discussed furtherbelow.
Action planning: The problem of planning a measurement program issimilar to configuring a customizable system during product configuration insoftware product lines [van der Linden et al., 2007]. In software product lineengineering, alternative features can be selected for a product. In softwaremeasurement program planning alternative measures, strategies, and goals canbe selected. Furthermore, there might be dependencies between strategies andgoals, as is the case between features in product lines. Hence, we adapted anotation used in product lines [Bühne et al., 2005] that allowed us to clearlydistinguish goals and strategies from each other.
An example (cut-out), which we prepared based on the study of existingdocumentation about the Customer Responsiveness program, is shown in Fig-ure 3. Goals are represented as triangles, and strategies as boxes to clearlydistinguish the two elements. On the highest level, the strategic goal, whichcan have several associated strategies, was found (in this case strategy S1 isto run a customer responsiveness program). This strategy, on a lower level,becomes a goal, which generates further strategies, etc. Two types of linksconnect goals and strategies. Mandatory links indicate that the strategy hasto be implemented in order to achieve the goal, while optional strategies couldbe implemented, e.g. one might choose one optional strategy over another one.At the links, a rationale is written why the strategy aids in fulfilling the goal,adding rationales to make the notation easily understandable. Furthermore,links exist between strategies: <include> links indicate that in order to im-plement one strategy another has to be implemented as well; <exclude> linksindicate that when one strategy is implemented, it is in conflict with anotherstrategy. In case there is uncertainty with respect to the links (e.g. whether

24 Kai Petersen et al.
Improve Ericsson Business
S1
Run a customer responsiveness program
G1
G1,S1:<need to rapidly fulfill customer specific need>
Increase customer responsiveness
G2
S2
Release on Demand
S3
Market-‐Driven Product
S4
Implement Adaptable Product
S5
Sales Support for Proposal Handling
S1,G2:<Program only useful with actual in crease in responsiveness>
Improve product adaptability
G3
S7
Increase extensibility of the product
S8
Increase flexibility in soRware product
G2,S4:<Can respond beTer to the customer if we could adapt product to individual customer needs>
S4,G3:<In todays situaUon limitaUons in adaptability with respect to ….>
G3,S7:<way to increase adaptability.>
G3,S8:<way to increase adaptability.>
NotaUon explanaUon
Goal descripUon
ID
ID
Strategy DescripUon
OPTIONAL SELECTON (ALT)
ID
MANDATORY SELECTION
REQUIRES/EXCLUDE <requires>/<exclude>
GOAL
STRATEGY
Fig. 3: GQM+S-EI Notation
two strategies are really conflicting) they present assumptions and in the caseof certainty context elements.
We used a semi-structured questionnaire to guide the interview as previousreviews [Davis et al., 2006,Dieste and Juzgado, 2011,Park et al., 1996] foundinterviews that were structured to be most effective technique for elicitation.

An Elicitation Instrument for Operationalising GQM+Strategies (GQM+S-EI) 25
The semi-structured questionnaire used complementary to the notation wasstructured as follows:
– Introduction: We provided an initial skeleton with few goals and strategiesalready elicited from documentation (see Figure 3). We communicated thatwe would like to elicit further goals and strategies, and also that we wouldlike to collect feedback about the elicitation approach used.
– Subject information collection: The interviewees were asked for their role inthe organization, how long they have been at Ericsson, which areas (and forhow long) they have been working in before, and their practical experienceand education before joining Ericsson.
– Notation introduction: The notation (as explained above) and the purposeof GQM+Strategies are introduced.
– Application of GQM+S-EI v. 1.0: The elicitation questions asked include:1. Are the goals, strategies, the rationals and the relations between them
well defined? Please comment whether there are: (a) any extra goalsand strategies that are needed?; (b) Are there any goals/strategies thatneed to be deleted or replaced?
2. What are the magnitude and time-frame for the goals?3. Is there any information you think is important/missing for our purpose
that you would like to add?– Feedback collection: We collect feedback on the elicitation approach, as
described earlier in the previous section.
During the process, the interviewees could follow from the model all up-dates based on the responses given by them as the changes were made directlyduring the interview sessions.
Action taking: Applying the approach as described above, the interviewerteam had the roles as described in Table 4. During the first two interviewsessions, the participants were confused by the concept of strategy, especiallyas we broke the goal down to sub-goals and went further down the tree of goalsand strategies. One of the problems we faced during the first interview was thatthe interviewee confused the meaning of the goal and strategy and how strategyat each upper level becomes a goal at lower levels. The following phrase areexamples of strategy definition that the interviewee defined for himself tounderstand the situation better: “Strategy should be implemented. Strategy isa plan to achieve a goal. Strategy is a use of specific tools. For me, strategycannot have a verb, I am just thinking through.. What is different between agoal and strategy? We have to check that because they almost the same. I gotlost, it is kind of like an inception, goal and goal and goal, dream and dream anddream and then you get lost”. During one and a half hours, the intervieweewas still trying to understand the goal and strategy concepts rather thandefining them and interrelating to each other. The concept of strategy madeinterviewee stop from talking about the actual answers to the questions. Wefound that different people perceived the concept differently depending on theirown definitions they had in mind (e.g. from their organizational context). Thatis, they could not just forget those. We also observed during the interview that

26 Kai Petersen et al.
they checked the definitions several times to remind themselves the concepts.As a consequence, communication took a long time, as the use of the conceptswas not intuitive.
Reflection: The result of the first two interviews was surprising. In ourmind, goal and strategy were clearly defined concepts. Two possible reasonsthat created confusion might be: (1) given that a goal on one level becomes astrategy on the next, and so forth appears to be confusing to non-experts inGQM+Strategies. (2) Organizations have their own terminology and a meaningfor goals and strategies, which are the definitions practitioners have in theirminds. As a consequence, for our next design iteration, we aimed to designGQM+S-EI v. 2.0 eliciting for strategies and goals without using these terms.
5.1.2 Iteration 2: GQM+S-EI v. 2.0
Action planning:We formulated open questions in the interview to allow theinterviewees to explain their ideas more freely. For example, instead of asking:“What goals do you want to achieve with the improvement program?” we asked:“The improvement program is successful when: a)..., b)..., c)...; please completethe sentence”. At the same time we linked the questions to rationales to makethe purpose of the question traceable in the context of GQM+Strategies. Table8 provides an overview of the questions and rationales.
Table 8: Questions used in GQM+S-EI v. 2.0
ID Question Rationale1 What is <X> ( X is, e.g. improvement
program) about?It gets the person talking freely. It isalso a good start to understand thecontext.
2 Why was it initiated/used? It provides the rationale for the exis-tence of the program, further informa-tion about context and assumptions.
3 <X> is successful when: a)..., b)...,c)...; please complete the sentence.
This gives hints for goals, informationneeds and even measurement needed.
4 Who can influence the success of a, b,c,...
Identifies the relevant stakeholderswhen deploying and evaluating strate-gies.
5 What do you do to achieve a, b, c,...? It identifies current strategies to beevaluated by the measurements to un-derstand, control and improve.
6 In these activities that you just men-tioned, which ones are working outgood today?
Identifies strategies that work well andcould be spread in the organization
7 Which ones have the highest improve-ment potential?
Identifies strategies that need to be im-proved (e.g. by changing, removing, oradding new strategies).
8 Do you have a plan to improve them?How?
Identifies further strategies that shouldbe employed in the future, or changesto the existing strategies.

An Elicitation Instrument for Operationalising GQM+Strategies (GQM+S-EI) 27
The process was followed according to Table 4, with Negin Asghari leadingthe interview, Cigdem Gencel being responsible for listening, interrupting andasking follow-up questions, and Kai Petersen documenting the outcome of theinterview. In this iteration, the outcome was documented on a white-board,given that the interviewee was in the same room as the interviewers.
Action taking: Following the process above, the following observationshave been made. The interviewees talked freely and fluently, and also did nothave to ask for clarification of the questions, the answers indicated that thequestions were easily understandable. The content of the transcription showedthat the interviewee was much more focused on the content of the actualquestions asked. In the second approach, we used the white-board to mapthe interviewee’s thoughts on the board and illustrate what we understoodfrom his/her answers. Capturing the information on a white-board allowed usto summarize how we understood the interviewee, as (s)he would see all theinformation captured during the interviewee. This process was iterative andthe interviewee was also correcting the things we documented by pointing outmisunderstandings. We had to capture the information very fast, which ledto poor handwriting, and at the same time the information was not so wellstructured.
Reflection: We concluded that the interviewee talked more freely andanswered the questions without being constrained by the enforced conceptsand/or notation. It was beneficial to capture information on a white-boardduring the interview as it allowed the interviewee to understand how we inter-preted the information. Hence, we concluded that the interview documentationshould be visible to the interviewee during the session. This also allowed toconduct member checking at ‘real-time’, which was at the same time problem-atic to keep the pace.
5.1.3 Iteration 3: GQM+S-EI v. 3.0
Action planning: In the new version, the same questionnaire was used aswe did not identify any reason for a change. However, we decided to changethe role of the scribe when documenting the information in order to pace theinterview, stopping it and making summaries. Another change was that thesessions could also take place using video conferencing. Hence, instead of usingthe white-board that becomes difficult to manage during a long interview, amind-map tool was planned to be used on a shared screen.
Action taking: To avoid any bias and confirm the applicability of thelast version of GQM+S-EI we applied GQM+S-EI v. 3.0 to two other differentprograms: “Cost of Poor Quality” and ‘Performance Measurement’. During theinterview for ‘Cost of Poor Quality’ the interviewee was available online. Threeobservers were present during the interview to learn about how to conduct it.The observers then took the roles of the measurement analysis (see Table4) during the interview for the ‘Performance Measurement’. In particular,measurement analyst 1 in Table 5 took the role of the lead interviewee andmeasurement analyst 2 took the role of the scribe. Also, Kai Petersen had

28 Kai Petersen et al.
the role of the scribe to later compare notes. The other researchers had thesupport role and made observations.
One noteworthy observation was that during the interviews the partici-pants often referred to measures they were already using. Furthermore, duringthe interviews the practitioners elaborated on the issue that measurementsmight drive wrong behavior, and how they could be tricked. For example,when having a measure on lead-time, quality might be compromised to per-form better on the lead-time measure. This hence leads to sub-optimization.After the interviews we showed the results to the interviewees to confirm thecaptured information was correct. They confirmed the accuracy of the contentand found this approach useful and easy to use. Comparing the notes of thetwo scribes, one version was keyword based, while the other version was usingmore detailed phrases.
Reflection: In contrast to using white-boards, managing information col-lected through mind-map appeared to be much easier and convenient forboth the analysts. For example, there was no worry about losing or missinginformation. Furthermore, it was possible to navigate through the informa-tion and make it easier for the interviewee to check the collected data. Thisalso added in readability and allowed to structure and provide links betweenGQM+Strategies elements. Hence, even when conducting the interview co-located, we suggested the use of a mind-map tool. Regarding taking of notesduring the interviews, we recommended usage of phrases instead of short notes,as after a longer period of time the mind-maps could still be read and under-standable by persons not being present at the interviews. As we noticed thatpractitioners talked about the current measures collected, we introduced aquestion related to that. Furthermore, we introduced a question to the behav-ior that is driven by using the measurements, and how they could be tricked.This was motivated by the observation that the practitioners elaborated onpossibilities of driving wrong behaviors through measurements (see Table 10).These led us to the GQM+S-EI release version that has been evaluated lateron in the case study.
5.1.4 GQM+S-EI Release
For the release version, we developed a elicitation guideline to be used by themeasurement analysts in the company. Below, we provide the content of thistutorial.
Part I: Introduction: In this part, the following information is given tothe measurement analyst:1. Some general preparations and tips for making interviews with stakeholders:
Here we describe what is needed prior to the interview, and some additionalhints for preparation.– Install MindMap tool (e.g. FreeMind) to your computer(s) for capturing
what the interviewee is saying. The interviewee should be able to seethe MindMap and follow what the interviewers understand from his/hercomments.
An Elicitation Instrument for Operationalising GQM+Strategies (GQM+S-EI) 29
– It is important that the person taking the notes is given time to capturethe information, that is, he/she determines the pace of the interview.As a start, the person taking the notes has a skeleton of the mind-mapwith branches indicating the main information to be captured. Here,it is important that the person taking the notes is free to extend themind-map according to his/her interpretation.
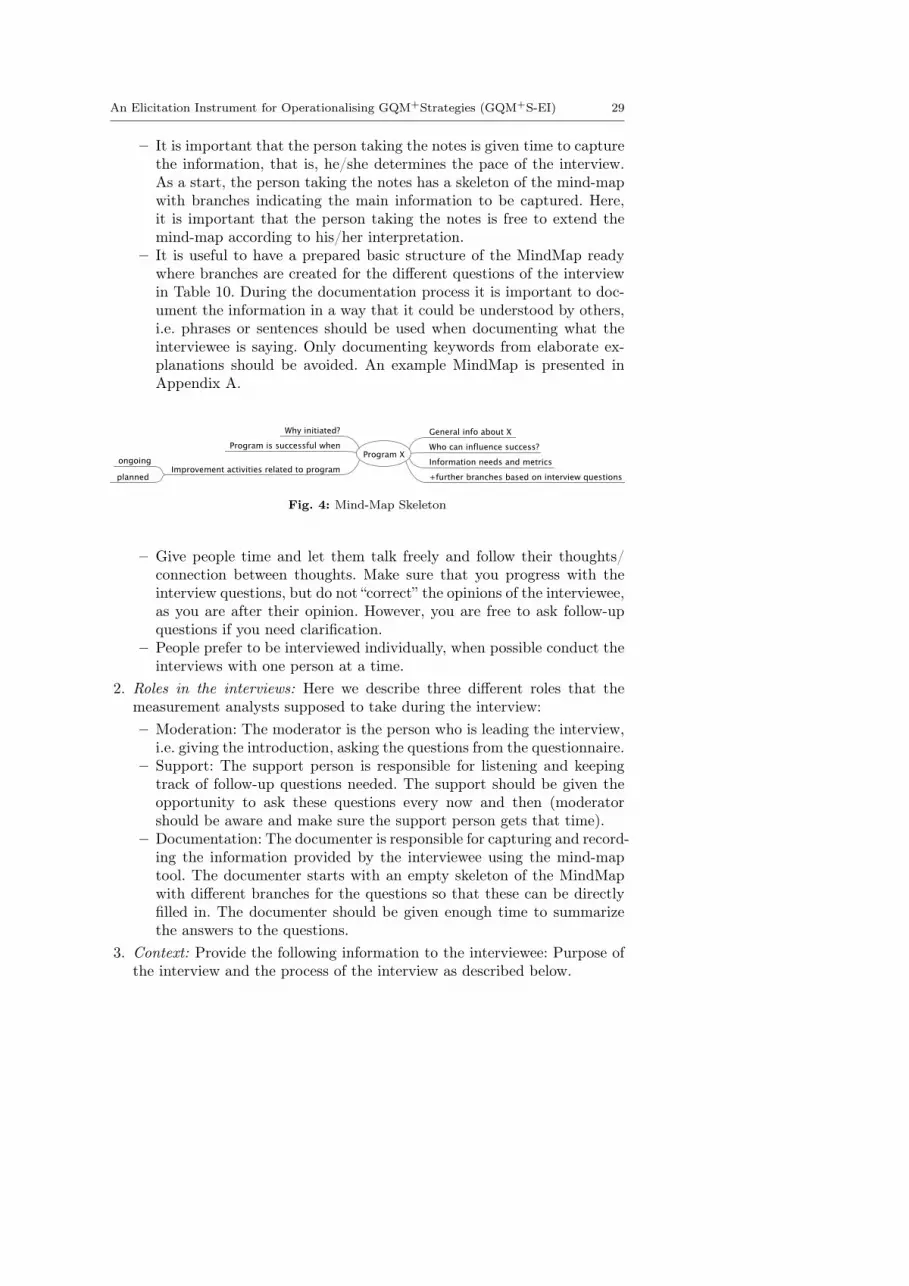
– It is useful to have a prepared basic structure of the MindMap readywhere branches are created for the different questions of the interviewin Table 10. During the documentation process it is important to doc-ument the information in a way that it could be understood by others,i.e. phrases or sentences should be used when documenting what theinterviewee is saying. Only documenting keywords from elaborate ex-planations should be avoided. An example MindMap is presented inAppendix A.
Fig. 4: Mind-Map Skeleton
– Give people time and let them talk freely and follow their thoughts/connection between thoughts. Make sure that you progress with theinterview questions, but do not “correct” the opinions of the interviewee,as you are after their opinion. However, you are free to ask follow-upquestions if you need clarification.
– People prefer to be interviewed individually, when possible conduct theinterviews with one person at a time.
2. Roles in the interviews: Here we describe three different roles that themeasurement analysts supposed to take during the interview:– Moderation: The moderator is the person who is leading the interview,
i.e. giving the introduction, asking the questions from the questionnaire.– Support: The support person is responsible for listening and keeping
track of follow-up questions needed. The support should be given theopportunity to ask these questions every now and then (moderatorshould be aware and make sure the support person gets that time).
– Documentation: The documenter is responsible for capturing and record-ing the information provided by the interviewee using the mind-maptool. The documenter starts with an empty skeleton of the MindMapwith different branches for the questions so that these can be directlyfilled in. The documenter should be given enough time to summarizethe answers to the questions.
3. Context: Provide the following information to the interviewee: Purpose ofthe interview and the process of the interview as described below.

30 Kai Petersen et al.
– Purpose of the interview: Describe the goal of the interview (e.g. toget a better understanding of perspective X), where X is, for example,Cost of poor quality’ program, Customer Responsiveness Program, orany other perspective.
– Reason for selecting the interviewee: e.g. as interviewee is working withX program he/she is considered an important measurement stakeholder.
– What will happen during the interview? Tell interviewee that you pro-vide a number of open ended questions that you will ask to be ableto cover the information needs of stakeholders in order to identify use-ful measures to aid in achieving good quality measurement program inEricsson (e.g., measuring only what is needed and nothing else, aid inmanaging projects in a better way, driving the right behavior and soforth).
– Tell interviewee that there are no right/wrong answers and that youare looking for his/her opinions, and that the interviewee is always freeto ask questions for clarification, or not to answer a specific question.
Part 2: Questionnaire: The questionnaire has 2 parts: a) Questionsrelated to Interviewee background (Table 9), and b) Questions to captureGQM+-Strategies related information (Table 10).
Table 9: Gathering Information about the Stakeholder
ID Question Rationale1 Name and contact information Allows for source traceability and collect-
ing further feedback2 How long have you been working in this
organization?Gives some hints about domain knowl-edge, process knowledge, etc.
3 What areas have you been in before andhow long have you been working in?
Gives some hints about domain knowl-edge, process knowledge, other perspec-tives, etc.
5.2 Phase II: Evaluation of the Elicitation Instrument
The individual interviews are integrated into a single grid representing thedifferent viewpoints of the interviewees. The interview structure that is rep-resented in the mind-map is structured along GQM+Strategies elements andallows to explicitly link goals and strategies. For example, when we asked“<X> is successful when: a). . . b). . . c)”, for a, b, and c, we also ask how theyare achieved (strategies).
During the actual process of elicitation the documenter creates sub-branchesrepresenting different levels of GQM+Strategies. This is done either by directlyasking for a refinement (e.g. what does this goal comprise of), or by interpre-tation. Given that the interviewees can observe the documentation processdirectly, they can correct the interpretation in case it is wrong. Having several

An Elicitation Instrument for Operationalising GQM+Strategies (GQM+S-EI) 31
Table 10: Questions to capture GQM+Strategies related information
ID Question Rationale1 What is <X> ( X is, e.g. improvement
program) about?It gets the person talking freely. It is alsoa good start to understand the context.
2 Why was it initiated/used? It provides the rationale for the exis-tence of the program, further informationabout context and assumptions.
3 <X> is successful when: a)..., b)..., c)...;please complete the sentence.
This gives hints for goals, informationneeds and even measurement needed.
4 What information is needed to evaluatesuccess?
Makes required information needs, indi-cators, and measures explicit.
5 Who can influence the success of a, b, c,... Identifies the relevant stakeholders whendeploying and evaluating strategies.
6 What do you do to achieve a, b, c,...? It identifies current strategies to be evalu-ated by the measurements to understand,control and improve.
7 In these activities that you just men-tioned, which ones are working out goodtoday?
Identifies strategies that work well andcould be spread in the organization
8 Which ones have the highest improve-ment potential?
Identifies strategies that need to be im-proved (e.g. by changing, removing, oradding new strategies).
9 Do you have a plan to improve them?How?
Identifies new strategies that should beemployed in the future, or changes to theexisting strategies.
10 What information do you need to eval-uate whether proposed improvementstrategies are successful?
Identifies additional information needsand success indicators for concrete im-provement ideas/actions)
11 What are you collecting today (measure-ments)?
Identifies current state of measurement
12 What behavior will the measurements(currently collected/planned to collect)drive?
Figures out whether the measures willreally drive the desired improvement ac-tions, or any other kind of behavior notleading to a benefit.
13 How could the measurements be tricked? Helps achieve robust and accepted mea-surements that show “reality”.
mind-maps their information has to be integrated. The first interview is usedas a starting point. From that interview the initial grid is created based on themind-map by incrementally adding the elements based on the questions in Ta-ble 10. We started with the answers to question 3. (giving the goals), followedby 6., 7., and 8. (giving the strategies). Then we added in the informationneeds of question 4., 10., and the metrics (question 11.). In the next step thesecond interview is taken and all new information is added one by one to thegrid of interviewee 1, and so forth. We color coded the new information addedfor each interview, and it is also recommended to keep traceability from eachelement to the interviewees raising it as this aids in negation.
Table 11 shows the number of GQM+Strategies elements that have beencollected during the eight interviews. The absolute number, and the % of allelements collected are also shown. In total, 98 GQM+Strategies elements havebeen identified.

32 Kai Petersen et al.
Table 11: Case Study Interviewees
Element No. identified PercentageNumber of business goals 1 1Strategies related to business goals 4 4Lower level goals 4 4Strategies related to lower level goals 18 19Measurement goals 19 20Information needs (questions) 29 29Metrics 23 23Total 98 100
5.2.1 Completeness
Figure 5 provides a structural overview of the grid derived. Due to confiden-tiality reasons of the case company, the complete list of goals and strategies arenot mentioned. Different colors indicate the additional information providedby the interviews. At the bottom right corner of the Figure the sequence ofinterviews in relation to the colors is shown (e.g. white color is the first inter-view, yellow color the second interview, etc.). Diamonds represent strategies,and boxes represent goals on different levels, as well as questions and metrics.What is immediately noticeable in the grid is that the business goal, lowerlevel goals, and strategies have been largely covered already after two inter-views. Only to derive the measurement goals, questions, and metrics furtherinterviews were required.
To make the added information for each type of GQM+Strategies moreexplicit, Figure 6 provides the cumulative number of each GQM+Strategieselement as listed in Table 11. The x-axis shows the sequence of interviews.The y-axis shows the cumulative number of GQM+Strategies elements ac-cording to type. It is visible that the saturation occurs after the Interview 6for all element types, with only very few elements being added by the last in-terviewee in relation to the overall number collected. Furthermore, the higherin the GQM+Strategies hierarchy, the earlier the saturation occurs. For busi-ness goals, strategies related to business goals, and lower level goals saturationoccurred after the second interview. Similar observations apply to strategiesrelated to lower level goals and measurement goals with only few additionsin comparison to what has been added during Interview 1 and Interview 2.Relatively many new items were added for information needs and metrics untilInterview 6.
Overall, the result indicates saturation, and hence provides a positive indi-cation that the elicitation approach is completely capturing GQM+Strategiesinformation from the stakeholders.

An Elicitation Instrument for Operationalising GQM+Strategies (GQM+S-EI) 33
BUSINESS/HIGH-LEVEL
GOLS and STRATEGIES
LOWER LEVEL GOALS and
STRATEGIES
Measurement Goals
Questions (Information Needs) Metrics
Interview 3
Interview 1Interview 2
Interview 4Interview 5Interview 6Interview 7Interview 8
Fig. 5: GQM+Strategies Grid
5.2.2 Accuracy
Overall, five changes have been requested by the practitioners. All changesrequested were renaming (one goal and four strategies were requested to berenamed). The following changes were made:
– the strategy “Improve practices and processes” was reformulated to “Con-tinuously improve processes & methods”.
– the strategy “Reduce cost” was reformulated to “Achieve cost accuracy”.– the strategy “Make realistic commitments” was reformulated to “Manage
uncertainties”.– the strategy “Deliver quality” was reformulated to “Deliver accuracy and
quality”.
The essence of the strategy has been preserved, and hence no changes inthe structure were needed for the GQM+Strategies elements. As an exam-

34 Kai Petersen et al.
0
5
10
15
20
25
30
35
1 2 3 4 5 6 7 8
Number of business goals
Strategies related to business goals
Lower level goals
Strategies related to lower level goals
Measurement goals
InformaAon needs (quesAons)
Metrics
1
1 With interview 2, saturaAon for business goals, strategies related to business goals, and lower level goals is achieved.
2
2 RelaAve to the first two interviews, fewer measurement goals and strategies related to to lower level goals were idenAfied, indicaAng a trend of saturaAon.
3
3
3 AMer interview 6 saturaAon is visible for strategies, measurement goals, informaAon needs and metrics. With interview 8 two new strategies were added, which led to the idenAficaAon of few new informaAon needs and metrics.
Fig. 6: Saturation in Interviews
ple, “make realistic commitments” means to be dealing with uncertainties andestimating them (e.g. risks) in a good way.
A noteworthy change was the reformulation of the business goal from beingrelated to being profitable to value creation, which was is in-line with the leanidea, focusing all activities on value [Poppendieck, 2003]. That is, profit is seenas a monetary value, while in lean the value terminology is wider (e.g. value forthe customer, internal value related to efficiency, and so forth). The term wasfound to subsume the GQM+Strategies below the business goal well. Similarobservations are reported in [Mandic et al., 2010a].
Possible changes are to move (restructure), add, change (e.g. reformulate),or delete elements (Move-Add-Change-Delete [Finke and Hartmann, 2011]).Only changes in the form of reformulations were requested (change). Themain change was the reformulation of the business goal. No modifications instructure, additions, or deletions of GQM+Strategies elements were requested.Overall, this supports the accuracy of the interpretations.
5.2.3 Observed side effects
These are observations that have not been incorporated in the research ques-tions earlier, but are noteworthy to mention.
Learning from each other: As pointed out by the Ericsson representativesparticipating in the review team, capturing the strategies (those that work well

An Elicitation Instrument for Operationalising GQM+Strategies (GQM+S-EI) 35
and those that do not) across business unit boundaries allowed to learn fromother units. In particular, for a strategy not working well today, another unitmight provide a strategy that could help to improve the situation. Hence, theelicitation approach facilitates knowledge transfer relevant for concrete processimprovement actions, not just for measurement program planning. This alsoleads to an aligned understanding of goals and strategies the organization isperforming, which is essential in further negotiation processes.
Reflections on cost: The Swedish funding agency KKHög 1 calculates costsfor practitioners participating in research projects with 800 SEK per hour(approx. 120 USD or 90 Euro). Eight interviews have been conducted withthree interviewers with seven interviews individually, and one interview havingtwo interviewees. Hence, the pure conduct of the interviews with the core teamcost (8* (3+7)+2) *800 SEK = 65600 SEK. In addition, the walkthroughmeeting with 13 people participating created a cost of 83200, overall creatinga cost 148800 SEK. Overall, this is a low cost seen from the improvementprogram and measurement stakeholders point of view. On the other hand,substantial effort was required by the measurement analysts. However, we didnot record the time spent working on analysis and reflection, hence we are notable to provide a number.
6 Discussion
Prior to using GQM+S-EI we investigated company documentation to gain anunderstanding of the company. This part was essential as part of the research(document analysis being an important part of triangulation), but should beconsidered as an important part of the elicitation approach itself.
During the iterative design of the elicitation instrument, different alterna-tives have been explored. The template-based approach is sequential in addingGQM+Strategies element and does not provide an overall picture connectingthe elements. The notation based approach directly focused the intervieweeson the elements (goals, strategies, etc.) and their meaning. In particular, it wasconfusing when a strategy on one level becomes a goal on the next level, etc.Hence, there was a need to elicit information to identify the elements with-out using the GQM+Strategies terminology for the identified reasons, and atthe same time provide a structural overview. For this purpose, mind-mappingserved best. During the interviews, further information was added sequen-tially. While the process was initially focused on strategies and goals, it wasexpanded to incorporate information needs, and metrics as well. Overall, thisindicates that, it is essential to allow the practitioners to talk freely in theirown terminology during elicitation, and later have the measurement analysts,who are the experts in the concepts, conduct the mapping. During the processof structuring the grid, notation based approaches appear to be most valuable.
During the case study, we found out that our elicitation instrument was ca-pable of accurately and completely eliciting goals and strategies. To determine
1 http://www.kks.se/

36 Kai Petersen et al.
the completeness and accuracy of information elicited we used saturation andmember checking as measures. We saw that, higher level goals and strategieswere elicited early on with very few interviews. More interviews were neededto reach a saturation state at the lower levels. Overall, this indicates that theelicitation instrument can quickly lead to a comprehensive picture. This re-sult has been obtained by interviewing people from different business units,and also different roles and perspectives that took part in the same improve-ment program. Thus, in a smaller scale saturation might be reached sooner.An interesting research direction for the future is to investigate how manyinterviews are needed in different contexts (scale, domain, or processes, seee.g. [Petersen and Wohlin, 2009b]) as this provides interesting insight whenestimating the effort for measurement program planning. The result of sucha study might vary also depending on the persons involved. When startingwith persons on the project level high level goals might be missing early on. Incase no high level goals are elicited, we would propose to group existing goalsand suggest high level goals (e.g. measurement experts might have experienceallowing them to do that), and negotiate them with the measurement stake-holders involved. The case study was also conducted in a situation where noGQM+Strategies grid has been available prior to the case study. For a casewith an existing grid we suggest to conduct the interviews as described andcomplement the existing grid with newly obtained information (see Section4.3.5 for a description of how to systematically add information). When look-ing at how much new information is added with new interviews it will becomevisible whether the existing grid still reflects the situation of the company.
The interview design was geared towards GQM+Strategies, containingquestions explicitly focused on strategies. However, it also subsumes infor-mation required by other measurement programs (see related work in Section3). Hence, the solution presented is not just a GQM+Strategies solution, buta solution for all goal-based measurement program planning approaches. Moreinformation was collected, but this was not considered an issue as the actualelicitation from the stakeholders appears to be cost-effective.
The cost-effectiveness is also positively influenced by the way that theinstrument is designed, i.e. only the measurement analysts need training inthe concepts of GQM+Strategies by asking for the information using moreintuitive questions allowing to talk practitioners freely (see Section 5.1.4).However, the measurement analysts need to have very good knowledge as theyhave to transfer the information from the interview into the GQM+Strategiesgrid, which requires the accurate identification of GQM+Strategies elements.
When having elicited all information there is a need to prioritize and takedecisions which metrics to collect. For that purpose, it is important to as-sure traceability back to the interviewees, which can be directly done in theGQM+Strategies grid by color coding it according to sources (see Figure 5).
We also would like to highlight that it was essential to have multiple peo-ple involved during the interviews as well as when interpreting and structuringthe GQM+Strategies grid. As recommended by [Keele, 2007] it is useful to in-volve multiple persons in tasks where interpretation is required to increase the

An Elicitation Instrument for Operationalising GQM+Strategies (GQM+S-EI) 37
quality, and hence trust in the end-result. Member checking based on a walk-through was used to check whether the instrument accurately and completelycaptured the information for the set of people interviewed. The group shouldagree on a version of the grid; hence walkthroughs could become part of theelicitation activity in practical usage also (not just for research purposes) toachieve a shared understanding. In the next step, the practitioners have toask questions such as: "Which goals are important?", "Which strategies arebest suited to achieve the goals?", and "Which metrics (based on the previoustwo answers) should be collected?". Having provided an instrument to accu-rate instrumentation we recommend that negotiation and review should be acontinuous process when adopting the instrument.
7 Conclusion
This research focused on developing an elicitation instrument to completelyand accurately identify GQM+Strategies elements from measurement stake-holders, and then from that build GQM+Strategies grid. The research wasconducted in two phases. In the first phase, the elicitation instrument wasiteratively developed using action research. In the second phase, the final ver-sion of the instrument was evaluated with respect to its ability to accuratelyand completely identify GQM+Strategies elements from stakeholders. Two re-search questions have been investigated in these two phases:
Action research question (RQ1): How should software organizations elicitgoals and strategies as input for GQM+Strategies? After having studied docu-mentation to familiarize with the improvement programs and company’s termi-nology, six interviews were needed to identify a stable and workable elicitationinstrument. Here are the main findings:
– Semi-structured interviews using mind-mapping is preferred over templatesand notations for elicitation purposes. Templates require deep knowledgeabout measurement terminology and information is added sequentially intables hindering to get an overall overview. Notations also require knowl-edge about the measurement concepts. Questions not using the terminologywhen eliciting (e.g. goals and strategies) fared better as practitioners focuson providing insights of the improvement program in their domain duringthe interviews rather than struggling with the terminology.
– Notations and templates are important from the measurement analysts’point of view when translating the mind-maps into GQM+Strategies ele-ments and grids.
– Multiple roles are required for the interviews when applying the elicitationinstrument. The interview leader moderates the interview and asks thequestions, the support interviewer interrupts and asks follow-up questions,and the scribe documents the results in the mind-map tool visible on ascreen to the interviewee. That way a “real-time” member-checking is alsoconducted.

38 Kai Petersen et al.
– While the interview initially focused on eliciting and structuring goals andstrategies, it was expanded to incorporate all elements needed to constructthe GQM+Strategies grid.
Case study research question (RQ2): How accurate and complete is GQM+S-EIin capturing GQM+Strategies relevant information from stakeholders? Satu-ration (measure of completeness) occurred after the sixth of eight interviews,while saturation occurred earlier on for the high level GQM+Strategies ele-ments. This indicates that the elicitation approach achieves good results incompleteness. With respect to accuracy (member checking was used to mea-sure) only few changes were requested, which were primarily related to refor-mulations, no structural changes or additions/deletions were needed. The mainchange was to reformulate the business goal to better reflect the value focusof lean software development (which was the focus of the measurement pro-gram). Hence, we conclude that the designed elicitation instrument accuratelyreflected the views of the stakeholders.
A number of future research studies would be of interest. First, the elici-tation instrument should be investigated in different contexts (e.g. small andmedium sized scales). This allows gaining an understanding of how much ef-fort is required for gathering the data in measurement programs in differentcontexts (e.g. with small scale saturation might occur much earlier). Anotherinteresting direction is how to structure the elicited information. For instance,for elicitation we proposed to utilize product line concepts, which was notapplicable at that stage. However, to be able to analyze a measurement pro-gram with respect to consistency, product line concepts could be useful in laterstages.
Acknowledgements This work has been conducted as part of an Ericsson Software Re-search (ESR) funded project; GQM-Lean- Establishing a Lean and Sustainable SoftwareMeasurement Program. The work also funded partially by ELLIIT, the Strategic Area forICT research, funded by the Swedish Government. We also would like to thank the mea-surement analysts who have worked with us in close collaboration, and all the intervieweesthat participated in this research.
References
[Ali et al., 2012] Ali, N. B., Petersen, K., and Mäntylä, M. (2012). Testing highly complexsystem of systems: an industrial case study. In Proceedings of the ACM-IEEE Interna-tional Symposium on Empirical Software Engineering and Measurement (ESEM 2012),pages 211–220.
[Ardimento et al. 2006] Ardimento, P., Baldassare, M. T., Cimitile, M., and Visaggio, G.(2006). Assessing multiview framework (MF) comprehensibility and efficiency: A repli-cated experiment. Information and Software Technology, 48(5):313–322.
[Baca and Petersen, 2013] Baca, D. and Petersen, K. (2013). Countermeasure graphs forsoftware security risk assessment: An action research. Journal of Systems and Software,86(9):2411–2428.
[Basili et al., 2007] Basili, V. R., Heidrich, J., Lindvall, M., Münch, J., Regardie, M., Rom-bach, H. D., Seaman, C. B., and Trendowicz, A. (2007). Bridging the gap between businessstrategy and software development. In Proceedings of the International Conference on In-formation Systems (ICIS 2007), page 25.

An Elicitation Instrument for Operationalising GQM+Strategies (GQM+S-EI) 39
[Basili et al., 2010] Basili, V. R., Lindvall, M., Regardie, M., Seaman, C. B., Heidrich, J.,Münch, J., Rombach, H. D., and Trendowicz, A. (2010). Linking software developmentand business strategy through measurement. IEEE Computer, 43(4):57–65.
[Basili and Weiss, 1984] Basili, V. R. and Weiss, D. M. (1984). A methodology for collectingvalid software engineering data. IEEE Trans. Software Eng., 10(6):728–738.
[Boyd, 2002] Boyd, A. (2002). The goals, questions, indicators, measures (gqim) approach tothe measurement of customer satisfaction with e-commerce web sites. In Aslib Proceedings,volume 54, pages 177–187. MCB UP Ltd.
[Boyd, 2005] Boyd, A. J. (2005). The evolution of goal-based information modelling: liter-ature review. In Aslib proceedings, volume 57, pages 523–538. Emerald Group PublishingLimited.
[Briand et al., 1996] Briand, L. C., Differding, C. M., and Rombach, H. D. (1996). Practicalguidelines for measurement-based process improvement. Software Process Improvementand Practice, 2(4):253–280.
[Brydon-Miller et al., 2003] Brydon-Miller, M., Greenwood, D., and Maguire, P. (2003).Why action research? Action research, 1(1):9–28.
[Bühne et al., 2005] Bühne, S., Lauenroth, K., and Pohl, K. (2005). Modelling requirementsvariability across product lines. In Proceedings of the 13th IEEE International Conferenceon Requirements Engineering (RE 2005), pages 41–52.
[Caldiera and Rombach, 1994] Caldiera, V. R. B. G. and Rombach, H. D. (1994). The goalquestion metric approach. Encyclopedia of software engineering, 2(1994):528–532.
[Colombo, 2003] Colombo, M. (2003). Reflexivity and narratives in action research: A dis-cursive approach. In Forum Qualitative Sozialforschung/Forum: Qualitative Social Re-search, volume 4.
[Damm et al., 2006] Damm, L.-O., Lundberg, L., and Wohlin, C. (2006). Faults-slip-through - a concept for measuring the efficiency of the test process. Software Process:Improvement and Practice, 11(1):47–59.
[Davis et al., 2006] Davis, A. M., Tubío, Ó. D., Hickey, A. M., Juzgado, N. J., and Moreno,A. M. (2006). Effectiveness of requirements elicitation techniques: Empirical results de-rived from a systematic review. In Proceedings of the 14th IEEE International Conferenceon Requirements Engineering (RE 2006), pages 176–185.
[Dieste and Juzgado, 2011] Dieste, O. and Juzgado, N. J. (2011). Systematic review andaggregation of empirical studies on elicitation techniques. IEEE Trans. Software Eng.,37(2):283–304.
[Finke and Hartmann, 2011] Finke, J. S. and Hartmann, D. (2011). Implementing CiscoUnified Communications Manager, Part 1 (CIPT1) Foundation Learning Guide:(CCNPVoice CIPT1 642-447). Cisco Press.
[Gencel et al., 2013] Gencel, C., Petersen, K., Mughal, A. A., and Iqbal, M. I. (2013). Adecision support framework for metrics selection in goal-based measurement programs:GQM-DSFMS. Journal of Systems and Software, in print.
[Graham, 2009] Graham, D. (2009). Foundations of software testing : ISTQB certification.Course Technology Cengage Learning, Hampshire, rev. ed. edition.
[Guest et al., 2006] Guest, G., Bunce, A., and Johnson, L. (2006). How many interviews areenough? an experiment with data saturation and variability. Field methods, 18(1):59–82.
[ISO/IEC15939, 2002] ISO/IEC15939 (2002). Iso/iec 15939 international standard 1st edi-tion 2002: Software engineering - software measurement process. reference number iso/iec15939:2002(e)(2002).
[Ivarsson and Gorschek, 2011] Ivarsson, M. and Gorschek, T. (2011). A method for evalu-ating rigor and industrial relevance of technology evaluations. Empirical Software Engi-neering, 16(3):365–395.
[Iversen et al., 2004] Iversen, J. H., Mathiassen, L., and Nielsen, P. A. (2004). Managing riskin software process improvement: an action research approach. Mis Quarterly, 28(3):395–433.
[Jürgen Münch, 2013a] Jürgen Münch, Fabian Fagerholm, P. K. M. P. J. P. (2013a). Theeffects of gqm+strategies on organizational alignment. In Proceedings of the DASMASoftware Metric Congress (MetriKon 2013), Santander, Spain.
[Jürgen Münch, 2013b] Jürgen Münch, Fabian Fagerholm, P. K. M. P. J. P. (2013b). Ex-periences and insights from applying gqm+strategies in a systems product development

40 Kai Petersen et al.
organisation. In Proceedings of the 39th EUROMICRO Conference on Software Engi-neering and Advanced Applications (SEAA 2013), Kaiserslautern, Germany.
[Kaneko et al., 2011] Kaneko, T., Katahira, M., Miyamoto, Y., and Kowalczyk, M. (2011).Application of gqm+strategies R© in the japanese space industry. In IJoint Conf of 21stInt’l Workshop on Software Measurement and the 6th Int’l Conference on Software Pro-cess and Product Measurement (IWSM/Mensura 2011), pages 221–226.
[Kaplan et al., 1996] Kaplan, R., Kaplan, R. S., and Norton, D. P. (1996). The balancedscorecard: translating strategy into action. Harvard Business Press.
[Keele, 2007] Keele, S. (2007). Guidelines for performing systematic literature reviews insoftware engineering. Technical report, EBSE Technical Report EBSE-2007-01.
[Kilpi, 2001] Kilpi, T. (2001). Implementing a software metrics program at nokia. IEEESoftware, 18(6):72–77.
[Mandic and Basili, 2010] Mandic, V. and Basili, V. (2010). An approach for evaluatingbusiness goals. Technical report, Technical Report TR TR-TOL-2010-2802, University ofOulu, Department of Information Processing Science.
[Mandic et al., 2010a] Mandic, V., Basili, V. R., Harjumaa, L., Oivo, M., and Markkula, J.(2010a). Utilizing gqm+strategies for business value analysis: an approach for evaluatingbusiness goals. In Proceedings of the International Symposium on Empirical SoftwareEngineering and Measurement (ESEM 2010).
[Mandic et al., 2010b] Mandic, V., Harjumaa, L., Markkula, J., and Oivo, M. (2010b). Earlyempirical assessment of the practical value of gqm+strategies. In Proceedings of theInternational Conference on Software Process (ICSP 2010), pages 14–25.
[Mandic and Oivo, 2010] Mandic, V. and Oivo, M. (2010). Sas: A tool for thegqm+strategies grid derivation process. In 11th International Conference on Product-Focused Software Process Improvement (PROFES 2010), pages 291–305.
[McGarry et al., 2002] McGarry, J., Card, D., Jones, C., Layman, B., Clark, E., Dean, J.,and Hall, F. (2002). Practical software measurement: objective information for decisionmakers. Addison-Wesley Boston.
[Mendonça and Basili, 2000] Mendonça, M. G. and Basili, V. R. (2000). Validation on anapproach for improving existing measurement frameworks. IEEE Trans. Software Eng.,26(6):484–499.
[Morse, 1994] Morse, J. M. (1994). Designing funded qualitative research.[Mujtaba et al., 2011] Mujtaba, S., Feldt, R., and Petersen, K. (2011). Analyzing strategyand processes for product customization in large-scale industrial settings. In Proceedings ofthe 37th EUROMICRO Conference on Software Engineering and Advanced Applications(SEAA 2011), pages 369–373.
[Münch and Heidrich, 2008] Münch, J. and Heidrich, J. (2008). Aligning business strategieswith software measurement - exercise handouts.
[Offen and Jeffery, 1997] Offen, R. J. and Jeffery, D. R. (1997). Establishing software mea-surement programs. IEEE Software, 14(2):45–53.
[Park et al., 1996] Park, R. E., Goethert, W. B., and Florac, W. A. (1996). Goal-driven soft-ware measurement?a guidebook (cmu/sei-96-hb-002, ada313946). pittsburgh, pa.: Softwareengineering institute.
[Petersen and Gencel, 2013] Petersen, K. and Gencel, C. (2013). Worldviews, researchmethods, and their relationship to validity in empirical software engineering research.In Proceedings of the Joint Conference of the 23rd International Workshop on SoftwareMeasurement and the 8th International Conference on Software Process and ProductMeasurement (IWSM-Mensura 2013).
[Petersen and Wohlin, 2009a] Petersen, K. and Wohlin, C. (2009a). A comparison of issuesand advantages in agile and incremental development between state of the art and anindustrial case. Journal of Systems and Software, 82(9):1479–1490.
[Petersen and Wohlin, 2009b] Petersen, K. and Wohlin, C. (2009b). Context in industrialsoftware engineering research. In Proceedings of the Third International Symposium onEmpirical Software Engineering and Measurement (ESEM 2009), pages 401–404.
[Petersen and Wohlin, 2010a] Petersen, K. and Wohlin, C. (2010a). The effect of movingfrom a plan-driven to an incremental software development approach with agile practices- an industrial case study. Empirical Software Engineering, 15(6):654–693.

An Elicitation Instrument for Operationalising GQM+Strategies (GQM+S-EI) 41
[Petersen and Wohlin, 2010b] Petersen, K. and Wohlin, C. (2010b). Software process im-provement through the lean measurement (spi-leam) method. Journal of Systems andSoftware, 83(7):1275–1287.
[Petersen and Wohlin, 2011] Petersen, K. and Wohlin, C. (2011). Measuring the flow inlean software development. Softw., Pract. Exper., 41(9):975–996.
[Poppendieck, 2003] Poppendieck, M. (2003). Lean software development: an agile toolkit.Addison-Wesley Professional.
[Runeson and Höst, 2009] Runeson, P. and Höst, M. (2009). Guidelines for conducting andreporting case study research in software engineering. Empirical Software Engineering,14(2):131–164.
[Runeson et al., 2012] Runeson, P., Host, M., Rainer, A., and Regnell, B. (2012). Casestudy research in software engineering: Guidelines and examples. Wiley. com.
[Sarcià, 2010] Sarcià, S. A. (2010). Is gqm+strategies really applicable as is to non-softwaredevelopment domains? In roceedings of the International Symposium on Empirical Soft-ware Engineering and Measurement (ESEM 2010).
[Scholtes et al., 2003] Scholtes, P. R., Joiner, B. L., and Streibel, B. J. (2003). The teamhandbook. Oriel Incorporated.
[Tahir and Jafar, 2011] Tahir, T. and Jafar, A. (2011). A systematic review on softwaremeasurement programs. In Proceedings of Frontiers of Information Technology (FIT2011), pages 39–44. IEEE.
[Trendowicz et al., 2011] Trendowicz, A., Heidrich, J., and Shintani, K. (2011). Aligningsoftware projects with business objectives. In Joint Conf of 21st Int’l Workshop onSoftware Measurement and the 6th Int’l Conference on Software Process and ProductMeasurement (IWSM/Mensura 2011), pages 142–150.
[van der Linden et al., 2007] van der Linden, F. J., Schmid, K., and Rommes, E. (2007).Software product lines in action. Springer.
[Van Latum et al., 1998] Van Latum, F., Van Solingen, R., Oivo, M., Hoisl, B., Rombach,D., and Ruhe, G. (1998). Adopting gqm based measurement in an industrial environment.Software, IEEE, 15(1):78–86.
[Wilson et al., 2002] Wilson, H., Daniel, E., and McDonald, M. (2002). Factors for successin customer relationship management (crm) systems. Journal of marketing management,18(1-2):193–219.
[Yin, 2011] Yin, R. K. (2011). Applications of case study research. Sage.

42 Kai Petersen et al.
A Mind-Map Example
Program M
gt.
R&D PM
close to development team
SLA teams (US, Italy)
22 teams, 5 PM
seach team
has Scrum m
aster (who has 3-4 team
s)
activities to get on-track (e.g put in extra team, put tasks on another team
)
Input to OLT report
on PMR level
reports to program if w
e are on/off track
Activities today
highest improvem
ent potential
technical debt in node <X>
would like to quantify the debt
need to plan for it
Code standardsneed for alignm
ent as well
When is the code clean enough?
narror sector in LSV NFN
T -> do not know
who is approving test
getting the complete SAT team
how they estim
ate
working good
same view
/message as program
/scrum m
aster/feature lead -> requires com
munication
help from Scrum
Masters spending tim
e in the teams (success factor)
reporting to the portfolio (R&D project and portfolio program
works good in collaboration)
close follow-up in the developm
ent teams
Boards are there, but do not look very goodreview
boards -> ask once a w
eek regarding target
feature lead interact more on a daily base (not in the sam
e meetings as Program
Mgt.)
Who can influence
Line Mgt. (put together com
petences in the teams) ->
given; need competence profiles as team
s are very different
Developm
ent teams
User story level
R&D project m
anager (interface to the teams)
User story level
SCRUM m
aster
Feature lead part of SAT team
Measures today
TRs MH
Web
Trick measurem
ent/information
LSV report (quality report)autom
ation?
reporting takes time (hard to get)
not easy to trick
Status of a PMR
Point for velocity not used (could not)
Technical hours
Perspectives on Decisions
Business perspective important
Portfolio puts up the priority
SPM input lim
ited
Architecture prespective important
Success
Financehard to plan for finance/m
eet the goal
Cost
Offering levels (planning)
Before: cost center level (e.g. promised 12 team
s got 10)
on feature level (cost per feature) hard to follow up ->
will be m
apped to time reporting; starting
January 1st
provide causes why there is a differences
Fault slip through -> planned cost vs. actual cost
Quality
Progress report/status report of the node on each drop-level
connected parts (dependencies) are done together/coordinated well
business and architecuture alignment
know the architecture of the scope
good estimation
POT product ow
ner -> user story break dow
n; are part of the feature
putting targets = com
mitm
entRepresentative from
the nodes
wait w
ith comm
itment till quick studies is there
potential hinder: reduces agility (know too m
uch), balance agility and estimation accuracy
good planning depends on good estimation
No alerts
Activities to achieve Success
Align views in softw
are architecture teams (how
much clean-up do w
e have to do)
Team up in a new
way/area focused, finding w
ho needs to interact
early feedback loop on estimations
Hinders: Technicians do not w
ant to do estimations
About decisions/program
Role/Perspective
Fig. 7: Mind-Map Example

An Elicitation Instrument for Operationalising GQM+Strategies (GQM+S-EI) 43
Kai Petersen is a senior researcher at Blekinge Institute of Technology (BTH), Sweden.He received his PhD from BTH in 2010. His research focuses on software processes, softwaremetrics, lean and agile software development, quality assurance, and software security inclose collaboration with industry partners. Kai has authored over 30 articles in internationaljournals and conferences, and has been the industry chair of REFSQ 2013.
Cigdem Gencel is a senior researcher at the Faculty of Computer Science of the FreeUniversity of Bolzano, Italy. She received her PhD from the Middle East Technical Universityin Turkey in 2005. Her research focus is providing novel solutions to real industrial chal-lenges, particularly in the areas of software size and effort estimating, software measurement,software project management, requirements elicitation methods and process improvement.She is a member of the International Advisory Council of COSMIC and a member of theCOSMIC Measurement Practices Committee.
Negin Asghari is a Software Developer at Ericsson - primarily at the Call Session Con-trol Function, which is one of the IP Multimedia System-nodes. Before that she was workingas a researcher in the same company, being passionate about software process improvementand lean software development, she spent most of her time on a project for Improving Cus-tomer Responsiveness. She has got a Bachelor in Computer Engineering from the Universityof Mashad, Iran and a Master of Science in Software Engineering from Blekinge Institute ofTechnology (Sweden). She is also a certified Microsoft System Administrator with two yearsworking experience.
Stefanie Betz received her Diploma in Information Engineering and Management andher PhD from the Karlsruhe University, Germany. She is currently a research fellow in theSoftware Engineering Lab at Blekinge Institute of Technology, Sweden. Before, she wasa research fellow at the Institute of Applied Informatics and Formal DescriptionMethods(AIFB), Faculty of Economics and Business Engineering, Karlsruhe Institute for Technology,Germany. She spent the autumn 2009 as an invited visiting researcher at the EnterpriseSimulation Laboratory SimLab, Faculty of Information and Natural Sciences, Departmentof Industrial Engineering and Management, Aalto University Finland. Her research interestsare in (global) software engineering and business process management.