Embed Size (px)
Citation preview

1
Energy policy and renewables' status in Chile
Benjamin Beaufils, Francesco Coppola and Jean Rault November 2014
5959 words

2
TABLE OF CONTENTS
1 INTRODUCTION ..................................................................................................................................... 3
2 CHILE ENERGY POLICY ........................................................................................................................ 4
3 RENEWABLES ENERGIES .................................................................................................................... 6 3.1 HYDROPOWER .............................................................................................................................................. 6 3.1.1 Potential and current status ................................................................................................................................ 6 3.1.2 Future And Challenges of HydroPower .......................................................................................................... 7
3.2 SOLAR ENERGY IN CHILE ........................................................................................................................... 8 3.2.1 Potential, advantages and current status ....................................................................................................... 8 3.2.2 Sun might provide a cleaner, reliable and competitive energy to the mining industry. ............ 9 3.2.3 What challenges are solar projects facing? ................................................................................................. 12 3.2.4 Conclusion ................................................................................................................................................................. 13
3.3 WIND ENERGY ............................................................................................................................................. 14 3.3.1 Wind Power: From availability to current developments .................................................................... 14 3.3.2 Wind Power: Future challenges ....................................................................................................................... 16
3.4 MARINE ENERGY ......................................................................................................................................... 17 3.5 GEOTHERMAL ENERGY ............................................................................................................................ 20 3.5.1 Potential, advantages and current status ..................................................................................................... 20 3.5.2 Barriers to geothermal energy development in Chile ............................................................................ 22
3.6 ENERGY FROM BIOMASS IN CHILE ....................................................................................................... 23 3.6.1 Introduction: Traditional firewood ................................................................................................................ 23 3.6.2 Power generation from biomass ...................................................................................................................... 23 3.6.3 Biogas and biofuels ................................................................................................................................................ 23
4 CONCLUSION ........................................................................................................................................ 25

3
1 INTRODUCTION Chile is one of the strongest economies in South America and the only member of the Organization
of Economic Cooperation and Development (OECD) in South America. For many years, up until
1995, the country has relied mainly on oil and biomass, for its primary energy, together with
hydropower, coal and gas for power generation. As its economy grows, so does its energy needs.
From the 1990s up to 2007, coal and gas were developed as the main sources of energy for the
power grids.
In recent years, Argentina has stopped its gas supply, which coupled with severe draughts caused
power shortages. On the other hand, Chile imports more than 90 % of its fossil fuels, oil, gas and
coal (Craze, 2014). Thus, electricity prices are now some of the highest in South America and higher
than the OECD countries’ average (MINE, 2013). Chile’s ministry of energy is therefore strongly
supporting diversification of its energy sources, like small hydro power, wind turbines, solar power
stations and potentially geothermal, as well as the development of energy efficient measures for
buildings. As Chile is very prone to earthquakes, nuclear energy cannot be developed economically
over there.
In this document, we will first describe at high level the country energy policies and goals. Then we
will describe the current status of energy use and energy sources, and then we will describe the
potential of development for renewable energies: specifically the current state of development and
the expected trends for hydropower, solar power, wind power, wave and tidal power, geothermal
power and biomass plants.

4
2 CHILE ENERGY POLICY In June 2014, Chilean President Michelle Bachelet stated that by “2025, 45% of new installed
generating capacity in Chile will come from non-conventional renewable sources” (Santiago, 2014).
Indeed it is projected that energy demand on the electricity grid will increase from approximately 60
GWh in 2014 to 120 GWh in 2025. Chile’s economy grew at an average rate of 5.4% between 1986
and 2010 (MINE, 2012), and its energy consumption had a “compound average growth rate of 4.2%
over the 1990-2009 period” (IEA, 2012). It is expected that Chile will grow at average of 4% in the
next decade.
However Chile is still highly dependent on hydrocarbons imports, especially for transport, which
represents approximately 50% of its oil demand. The industrial sector and also the power generation
sectors are large oil consumers of oil and diesel: Many of its power plants previously running on
natural gas were retrofitted to run on diesel after the 2008 gas shortage from Argentina (IEA, 2012).
Furthermore Chile imports most of the coal it consumes: In 2012, Chile imported 97% of its
consumption (US EIA, 2014). This has a major impact on the country dependency towards
hydrocarbons’ imports and on the general price of electricity. Future projects are planned to sustain
demand: The construction of a third LNG terminal is planned by Empresa Nacional del Petróleo, the
Mina Invierno coal mining project which began production in 2013 is expected to meet 30% of
Chile's coal domestic demand. (US EIA, 2014). Chile will strengthen its commercial relations with
Peru, Ecuador, and Colombia to secure gas supply from these neighbours (Zborowski, 2014).
Considering the high demand, many coal power stations will be built. The country needs
hydrocarbons to sustain its current consumption, but its also needs to diversify its energy sources
Renewable Energy is a much-needed solution to be developed in the country, to increase the
country’s energy security. In 2008, Ley Corta III, law 20.257, creates a minimum requirement for
non-conventional renewable energy sources for the production of electricity: 5 % by 2010 rising to
10 % by 2024 of electricity produced/ sold shall be from non conventional renewable sources
(Dufey, 2010), for utility companies that own at least 200 megawatts of capacity (Santiago, 2014).
However this target has been raised in September 2013, via Law 20.698: Utilities must get 20 % of
their power from non-conventional renewable energy (NCRE) sources by 2025, and 10% by 2020
(Central Energia, 2014). That will work out to 6,500 megawatts of capacity from projects including
solar farms and small hydroelectric dams, up from about 1,000 megawatts now (Nielsen, 2013).
Non-conventional renewable energy (NCRE) sources include solar plants, wind farms both onshore
and offshore, biomass plants, geothermal plants, wave and tidal power plants, and hydropower
smaller than 20MW. Hydropower plants larger than 20 MW are considered as conventional power
sources, although this limit may change in the future (Hristova, 2014).
5
One of the other main issues of the power equation in Chile is that, considering its size it has several
independent power grids:
Ø In the North of Chile, the northern grid SING supplies electricity to the copper mining
industries and the local cities, representing 20% of the total of electricity produced.
Ø In the central region, the SIC grid supplies electricity to the capital and 93% of the
population, representing 70% of the total electricity produced.
Ø In the South, Aysen and Magallanes grids supply the remote towns and industries,
representing a negligible amount of the total electricity produced.
Between the SING grid and the SIC grid lies a desert of 600 km, without connection currently built.
This has an impact, as many renewable projects may benefit from a link between the two grids.
Endesa-Chile, either directly or through its subsidiaries is the principal supplier to the SIC grid
(approximately 50% of electricity produced and sold) while the SING grid is dominated by
independent producers. All industrial projects on renewable energy must therefore have a strong
agreement with the current grid owner or majority holder, that is Endesa for the grid serving 97% of
the population. However the government has put in place regulations that simplify and incentivise
the connections to the grid of electricity produced by non-conventional renewable energy sources.
Law 19.940 created in 2008 help the development of small renewable electricity generators by
securing the right to sell power to the spot market, granting connection rights to the main distribution
networks, establishing non discriminatory terms, and exempting fully or partially transmission tolls to
non- conventional sources (CER, 2014).
Chile’s ministry of energy ascertains that the potential of NCRE sources that can be installed in the
country is over 350 GW, when today less than 24 GW are currently installed (Cruz, 2014). Therefore
there is a bright potential for the development of these energy sources.
As described earlier, Chile does not have much oil & gas fields. Currently only the Magellan fields,
very south of the country, produce oil & gas: 17000 barrel per day of oil, for a total country
consumption of 342150 barrel per day and 42.27 billion cubic feet per year of natural gas, for a total
consumption of 178.23 billion cubic feet. (US EIA, 2014) It does not cover at all the country
consumption.
Similarly for coal in 2013, 0.721 millions short tons were produced, when 10.826 millions short tons
were consumed in the country.
The total primary energy consumption monitored in the country was last year 1.322 quadrillion btu,
that is 387,44 TWh (US EIA, 2014).
For electricity generation, 16.21 GWe capacity is installed in the country, of which 14.720 GWe are
installed on the SIC (CDEC-SIC, 2014).

6
3 RENEWABLES ENERGIES
3.1 HYDROPOWER
3.1.1 Potential and current status Chile’s geography is naturally favourable to the deployment of hydroelectricity, with high mountains
and good hydrologic conditions. Before year 2000, hydroelectricity was representing up to 78% of
electricity produced in the whole of Chile. In October 2013, it was still representing 58.6% of the total
of electricity produced on the SIC grid (CDEC-SIC, 2014).
In October 2014, there were approximately 5.97 GW of installed hydropower capacity connected to
the SIC network, from approximately 90 power plants, of which circa 22 had an installed capacity
larger than 100 MW, and 40 had an installed capacity smaller than 20 MW. There is 12.4 MW of
installed hydropower capacity serving the SING electricity network in the north, from three small
hydroelectric power plants. Currently hydropower represents more than 40% of electricity supply
capacity in Chile (Nasirov and Silva, 2014).
The HidroAysen project, a large dam with a 2750 MW production capacity, led by Colburn and
Endesa, was rejected this summer, due to environmental, social and political impacts. However
small hydroelectric plants will be built to sustain electricity consumption. Actually Chile is now
promoting the development of small-scale hydropower plants (less than 20 MW), recognising them
as non-conventional renewable energy sources, while large projects are identified as conventional
energy sources.
Currently there is 444 MW of small-scale hydropower plants, while 32 MW are under construction
and 84 MW are planned, which environmental impact assessments were approved (CER, 2014).
Some analysts consider that Chile total potential for hydropower capacity could be over 9GW,
considering reservoir plants and run-of-rivers projects (Woodhouse, 2011). Specifically, the southern
regions have more potential, however they are neither populated nor industrialised. In 2013, Chile’s
Ministry of Energy believed that conventional large hydropower plants could represent more than
45% of the total country’s energy mix by 2020. As of 2014, Chile is pushing for 20% of supply from
NCRE sources, among which small hydropower plants have a high power plant.

7
Energy Mix in 2012 Energy Mix in 2020
(Reference: MAS, 2013)
3.1.2 Future And Challenges of HydroPower However climate change could impact significantly the future of hydroelectric power. Three main
factors are now identified:
Ø Lower rainfall in central Chile
Ø Reduction of snow depth in the mountains, together with an increase of glaciers melting rate
Ø Higher frequency of El Nino oceanic conditions
These, together with the planned mean temperatures growth and rainfall shortages, will reinforce the
potential for droughts, as they occurred in the past decade.
Water shortage could also impact the operations of thermal power plants, as it is required for cooling
the systems.
Small-scale systems should take into account this hydrologic risk. Currently more than 60 small
plants are under study. 850 MW of hydropower capacity could be developed on small rivers and
channels.
Hydropower is clean, but it has a lasting impact on the environment and is also seasonal: Because
of droughts in the late summer periods, the installed capacity in Chile has been partially backed up
by coal power stations and diesel fuelled thermal power generation: hydropower has its limits,
especially considering the future trends in climate change.
3Manufacturing and Services — Market Intelligence
Chile’s Renewable Energy and Energy Effi ciency Market: Opportunities for U.S. Exporters
participate in public tenders under long-term contracts (up to 15 years) to sell power to distribution companies at a fi xed price. A “spot” market also exists for power transfers not subject to existing power purchase agreements (PPAs).10
Whether through long-term PPAs or the “spot” market, most power producers sell their electricity into the wholesale electricity market the Chilean electricity wholesale market is privately operated, but is controlled by a few large companies, which operate a virtual monopoly as a result of geography and the cost of building transmission grids.11
Finally, utility companies buy power from the wholesale market and supply it to electricity customers. Chilean utilities are oft en well-known companies that have a geographic monopoly through a concession granted by the Ministry of Economy, which awards concessions for an indefi nite period of time for electricity systems greater than 1,500 KW.12
Importantly, some large energy consumers – mainly mining companies in Northern Chile – have recently built their own power systems, cutting out the remaining part of the value chain, including wholesalers and utilities. Th ese fi rms have decided to build and operate their own power stations since either connecting their operations to a far-away electricity grid or operating diesel generators has become increasingly cost prohibitive. Many of these fi rms have turned to renewable energy – either solar, small wind, or
10 Country Energy Profi le: Chile – Clean Energy Information Portal (www.reegle.info/countries/chile-energy-profi le/CL11 Ibid12 Ibid
geothermal energy – to provide their power needs, opening a new market for U.S. fi rms with expertise developing off -grid applications.
Renewable Energy
In 2012, 37% of Chile’s energy was produced from renewable energy sources – mostly large hydro projects, which accounted for 34% of Chile’s energy production.13 Non-conventional renewable energy, which is defi ned by Chilean law as renewable energy excluding hydropower projects over 40 MW, remains a small but growing part of the Chilean energy mix, contributing only 3% of Chile’s energy production.14 As of 2011, Chile had only 843 MW of non-conventional renewable energy capacity installed, much of it in the form of small hydropower projects.15
Despite little progress to date, the solar and geothermal markets appear poised for signifi cant growth as a result of both resource potential and high energy prices, which together have catalyzed investment in the sector and built a strong pipeline of planned projects. Bloomberg New Energy Finance (BNEF) estimates that $4.5 billion was invested in Chile’s clean energy industry over the last fi ve years – 5% of all renewable energy investment committed to Latin America, trailing only Brazil and Mexico.16 By 2015, ITA expects Chile to produce 264 MW of solar energy and 1,361
13 Government of Chile, “National Energy Strategy 2012-2030: Energy for the Future,” pp. 12 (February 2012)14 Ibid, 1215 Bloomberg New Energy Finance, “Climate Scope 2012: Assessing the Climate for Climate Investing in Latin America and the Caribbean,” pp. 4716 Ibid, 48
Figure 1: Current and Future Energy Mix (2012 and 2024)
Source: Chile National Energy Strategy, pp. 12-13

8
3.2 SOLAR ENERGY IN CHILE
3.2.1 Potential, advantages and current status Chile has a huge potential as it benefit from a high level of irradiance where Direct Normal
Irradiation (DNI) can reach levels higher than 3000 kWh/m2, especially in the northern region
(Atacama desert), as shown on the following map.
(from Solargis.info)
Solar energy potential is estimated to be 226 GW, as shown in the following table:
(From CIFES, 2012)
Nevertheless, for the time being, the significant solar energy potential remains under-exploited.
In 2013, only 9.8 MW of capacities were in operation generating circa 7 GWh, but already 260 GWh
in 2014 (CNE, 2013)

9
Current and forecasted capacities are as shown in the following table: (Goyeneche Rojas, 2014)
type and grid in
operation (MW)
Under construction (2014) (MW)
Environment assessment approved (2014) (MW)
Solar PV -‐SIC 8.4 634.8 0
Solar PV -‐ SING 1.4 413 7811
Solar CSP-‐SIC 0 0 0
Solar CSP-‐SING 0 110 760
Total 9.8 1157.8 8571
Several factors make Chile an exciting solar market:
Ø The country has a huge potential as it benefits from a high level of irradiance, especially in the
northern region where Direct Normal Irradiance (DNI) can reach levels of 3000 kWh/m²
Ø An increasing energy demand led by the mining industry, an energy-hungry industry. Copper
mines are mainly located in the northern regions of Chile.
Ø High electricity prices on spot market (2009 SING average market price was 155.8 US$/MWh)
(CIFES, 2012), make solar projects cost competitive and can facilitate private-sector
investment without subsidies.
Ø The national Non-Conventional Renewable Energy target (NCRE) incentivises solar
development: as already said, law 20258 was passed in 2013, requiring that 25% of energy
produced by Independent power producers (IPPs) had to come from non-conventional
renewable energy (NCRE) by 2025
Solar energy might be used to provide energy to irrigation system (vineyard) or rural electrification,
but capacities involved in those applications are not significant regarding the huge potential market
that represents the mining industry sector.
3.2.2 Sun might provide a cleaner, reliable and competitive energy to the mining industry.
The vast majority of this rising demand for solar energy will come from mining operations. The
northern region produces most of the world’s copper and iodine and it's a top producer of silver,
gold, iron, steel and coal.
Mining is essential to the health of the Chilean economy, with copper alone accounting for 3/5 of the
nation’s exports and 1/5 of its GDP (OECD, 2014).
As these mines grow and expand their operations, demand is on the rise (Smith, 2014).

10
To date, energy needed to operate those mines is mainly provided by thermal power plant through
the SING electrical network. Solar energy could help mining industry by:
Ø Increasing energy self-sufficiency and preventing shutdowns due to power blackout. On-site
solar projects ensure that the mines can continue operations without relying on the SING grid
Ø Contributing to reach NCRE targets set by law 20258, September 2013
Ø Refreshing the mining industry image and providing a better image for public and other
stakeholders, showing interests in environmental issues)
Ø Providing cost competitive energy,
As a matter of fact, all significant solar projects are located nearby mines, and are mainly based on
2 technologies: Concentrated solar power plant (CSP) and Photovoltaic power plant (PV)
Focus on Concentrated solar power (CSP) plants Only few CSP pilot installation are currently in operation, among which we can notice the 7 MWth
“Minera El Tesoro solar power plant” which provides process steam to the nearby copper mine.
Nevertheless, roughly 1GW of capacity, based on CSP technology, are planning to be erected by
2020 (cf. following maps and listing) (CSP World, 2014).

11
(CSP World, 2014)
Name Owner Status Power Technology
Purpose Cost (USD)
use
Chile CSP Plant Development 10 MWe Demonstration
Mejillones GDF Suez , Solar Power group
Planned 5 MWe Fresnel Commercial Steam generation
Minera El Tesoro Termosolar
Minera el tesoro
Operational (since 2012)
7MWth Parabolic through
Commercial $14 M process heating used to heat water for a SX-‐EW process to obtain copper.
Planta Solar Cerro Dominator
Abengoa Under construction (start date :2018)
110 MW CSP +110 MW PV
Central receiver (power tower)
Commercial $1,300 M Connection to SING
Planta termosolar Maria Elena
Ibereolica Planned 400 MW Central receiver (power tower)
Commercial $3,290 M
Planta Termosolar Pedro de Valdivia
Ibereolica Development 360 MW Parabolic through
Commercial $2,610 M
Solastor Mejillones
Safe Earth Energy, Solastor
Planned 5 MW Central receiver (power tower)
Commercial -‐
(CSP World, 2014)
On one hand, modern CSP plants have the advantage of incorporating energy storage facilities in
their very design by using molten salt. Consequently these plants are now almost able to generate
electricity on a 24 hours basis. This is a real advantage for this technology, as mining operation
requires base load 24/7.

12
The following map illustrates what CSP plants are used for: providing energy to mining industry.
(CSP World, 2014)
On the other hand, CSP plants require a massive investment and even with their massive
economies of scale, they cannot compete with PV on price alone, and development and
construction takes many years.
3.2.3 What challenges are solar projects facing? Main challenges are:
Ø Lack of technical studies (Dufey, 2010):
As we’ve seen Chile has exceptionally favourable conditions for solar resources but there has
only ever been one extremely basic series of solar radiation measurements taken, in 1987.
Consequently, in practice, each project developer must carry out their own individual studies,
which take time and money. Although the government has recently begun to generate
information of this kind, the barrier still persists and must continue to be addressed.
Ø Permitting processing time is long:
As with any country, permits relating to the environment, land and to the grid must be
obtained. In Chile a project may need as many as 60 regulatory approvals divided between
the environment and the grid. Typical approval processing periods for a new generation facility
are around 333 days, with one of the most lengthy being the permits for environmental impact
assessment which features the impact on human geography and communities as well as the
land and animal ecosystem,
Ø Financing the project is hard:
With regard to financing, banks require a signed PPA (Power purchase agreement) to even
consider funding a project. Furthermore, solar power purchase agreements are a way for
mining companies to address rising demand and avoid paying high marginal prices on the spot

13
market. But negotiating PPAs with mining companies is difficult with the highly volatile
commodity market. The fluctuations in prices for gold, silver, copper, iodine, iron, steel and coal
will all influence demand for solar power in the region. Mining companies are understandably
hesitant to sign long-term take-or-pay power purchase agreements when they may have to
suspend operations until commodity prices rise again.
Consequently, complaints abound about the absence of Feed-in Tariffs and strong demands have
been made to the government to introduce new support mechanisms for the sector.
3.2.4 Conclusion Solar energy in Chile presents mixed results:
Despite the urgency of the situation and the country’s many natural assets, especially in its northern
region where solar irradiance is one of the highest in the world, the country has not invested enough
in developing solar energy and only circa 10 MW of solar capacity was in operation at the end of
2013.
This matter could be resolved in the future since Chile’s environmental impact assessment agency
approved more than 8 571MW worth of solar project in November 2014.

14
3.3 WIND ENERGY
3.3.1 Wind Power: From availability to current developments Chile has a good potential for wind power development with its very long coastline exposed to
pacific winds. Specifically, the remote areas in Patagonia in the south of Chile have the biggest
potential. Analysts believe there is a total potential for 40 GW for wind energy onshore Chile
(Woodhouse, 2011)
Wind Speed Distribution (Woodhouse, 2011)
Wind potential and land availability are very high in the south, while the demand is in the central
region where the majority of Chile’s population lives and the North, with mining industries. According
to the Global Wind Energy Council, poor grid infrastructure is one of the main barriers to the
development of wind power. With a grid controlled mainly by Endesa, growth for wind projects
depends on the flexibility to connect to the 4 independent sub-systems across the length of Chile
(Woodhouse, 2011). However a lot of other sites are ideal to foster wind power.
The Chilean government has helped developers by giving away wind surveys in specific areas, such
as Atacama, Coquimbo and Maule. Similarly, the United Nations together with the financial support
of the Global Environmental Facility (GEF) are helping wind measurements in other areas. It has
been shown many places benefit of a combination of coastal winds and thermal winds (Los Choros -
Llano Chocolate in Atacama Region, Quebrada del Teniente in Coquimbo Region, Chanco in Maule
Region). with high winds during late afternoons and nights, where consumption peak (Watts and
Jara, 2011).

15
Some claim that wind data come moistly from meteorological studies that are not adapted to
industrial use. Therefore, in practice, projects developers need to dedicated capital and time to
specific studies to generate important information. This creates a barrier of entry, that limits potential
developments.
The NCRE laws in 2008 and 2013 also helped development of wind power by forcing central grids to
accept power from small producers.
The first three wind turbines were installed in 2001 in Alto Baguales, with a total nominal capacity of
2MW. Only in 2007 was the second wind farm installed, Coquimbo phase 1, for a total combined
production of 20MW, that was the first to be connected to the central SIC grid.
According to RNC’s statistics since 2009 15 wind projects have begun operation: (4 began operation
in 2009; 1 in 2010; 4 in 2011; 3 in 2013; and 3 in 2014) and their net capacities range from 1.5 MW
to 115 MW (Vallejo, 2014)
Proposed Wind Farms in Chile (Galetti Vernazzani and Veirs, 2012)
At the end of 2013, there were 20 running wind farms, all onshore, for a total capacity of 335 MW, as
registered (Pierrot, 2014).
In August 2014, the country’s largest windfarm was started up 400 km away from Santiago, the
capital, costing 300 millions $, consisting of 50 turbines, for a total capacity of 115 megawatts, a
third of the total wind power capacity in 2013 by comparison (Long, 2014). Most of the output is

16
already sold as “a long-term fixed-for-floating hedge” to a mining company, Minera Los Pelambres,
operating one of the largest copper mines in the world. The rest will be sold on the spot market of
the SIC grid (Pattern, 2014).
In October 2014, the total of wind power capacity in operation was 737 MW (Goyeneche Rojas,
2014).
3.3.2 Wind Power: Future challenges Onshore wind is an attractive alternative in Chile, considering the high-cost of energy in Chile,
estimated at $120/MWh. (MAS). In 2011, levelized cost of onshore wind energy was between 51
and 259 US$/MWh, with a mean cost of 100 US$/MWh, below SIC and SING grids energy prices,
and the mean levelized cost is expected to be 80 US$/ MWh by 2020, still cheaper than locally
traded energy prices (NRDC, 2012).
Many projects have been approved and are on their way: As an example, in 2013, a Scottish
company together with a private equity have secured the supply and operatorship of 450 MW
capacity wind farms in Chile, to be started up in 2016 (Gottlieb, 2013). Another 100 MW farm will be
built soon by Ecopower on Chiloe Island, despite original conflicts with indigenous communities.
In total, more than 5000 MW installed wind power capacity are planned and have received approval
of their environmental impact assessments (Goyeneche Rojas, 2014).
Considering offshore wind farms, they are more expensive and therefore less attractive at the
moment. Furthermore, it seems that along the coastline of Chile, the subsea layout would give a fair
amount of technical challenges to development prospects, because of the depth and the steep
submarine ravines (Watts and Jara, 2011). However the offshore wind power potential is under
study, notably via satellites data (Ini, 2014).
Onshore wind in Chile has a bright future and is already one of the highest growing non-
conventional renewable energy sources, although it only represents 2% of the electricity generation
capacity at the moment in the country.

17
3.4 MARINE ENERGY
“Chile is the country with the highest wave energy potential in the world” (Woodhouse, 2011)
According to a study commissioned in 2009 by the Interamerican Development Bank (IDB) the
potential of Chile in Ocean and Tidal Energy is enormous thanks to more than 4000 kilometres of
coast and to high levels of wave and tide energy values.
The Total ocean-based energy reserves produced from waves and tides was estimated to about
164,000 MW which is over 10 times the current installed capacity (Staff, 2013)
To procure tidal energy turbines need to be placed underwater in areas of fast currents. The water
moving back and forth will spin the turbine wheel which, similar to a wind turbine, will produce
electricity. Chile’s Chacao Channel has the third-strongest tidal energy current in the world with
about 2,000 megawatts (MW) of energy potential in the channel. This is the equivalent to one-
quarter of the new energy Chile might be projected to demand by 2020.

18
With regards wave energy the converter is placed on the surface of the ocean where waves,
generally caused by the wind, will operate the turbines.
Water being denser than wind more power can be generated from smaller area than other turbines
devices i.e. wind. Tidal energy presents the advantages of being sustained and constant in time
(unlikely solar or wind) although varying in density. On the other side maintenance might be more
challenging and longevity more onerous.
Wave and tidal technologies are at an early stage this is due to not very developed technology and
the elevated costs of production and assembling. At present the costs of wouldn’t be competitive
compared to actual energy prices in Chile. Tidal technology being more developed than the wave
one because it uses some of the same concepts applied to other rotary turbine flows. Consistent
progress in marine renewable technologies started about a decade ago and we are currently ending
a first phase of “testing” with associated development costs decreasing. The next generation of
marine based energy will probably bring some savings in terms of costs as well as performance
(Davies & Wills, 2014)
The potential of ocean and tidal energy is under study by the Ministry of Energy which plays the role
of promoter of Renewables Energies, as set by Law No.20,641. In 2014 about 20 millions US
Dollars resources were provided by the Chilean development organization CORFO (Corporación de
Fomento de la Producción) to establish the International R&D Centers of Excellence in Chile in the
marine energy sector.
With regards R&D Centres of Excellence DCNS and ENEL Green Power were chosen by CORFO
to set up MERIC (Marine Energy Research and Innovation Centre) (Donelly, 2014).
MERIC is an 8 years program to promote high-level knowhow in development, integration and
promotion of marine energy technologies at an international level. This is achieved by the Centre by

19
reviewing and exchanging information on marine energies with the international community.
Research, Evaluation, Development, Support and being able to make recommendations on
resources available and the technologies to use are also part of the objectives of MERIC.
The fact that marine energy is new and yet to be commercialised means Chile has an opportunity to
play the development role and potentially become one of the pioneers in playing a leading role.
With regards the geographic areas that would present potential in the production of Marine energy
Garrad Hassan identified the Chacao Channel which is located at the southern end of the SIC grid
close to Puerto Montt. Chacao Channel currently is one the most promising area of Chile for tidal
energy with its peak flows of 3.5 to 5 m/s and raw kinetic energy of 674 MW.
Magallanes the southernmost region of Chile located between the Pacific and Atlantic oceans is also
extremely interesting for maritime energy with average peak flow of 4 m/s in the Strait of Magellan
(Levy, 2012)

20
3.5 GEOTHERMAL ENERGY
3.5.1 Potential, advantages and current status Chile is one of the most volcanically active regions in the world, given its privileged position in the
so-called "Pacific Ring of Fire," the country has about 20% of the active volcanoes inland. Its
strategic location also means a high potential in Chile for geothermal power generation (CEGA,
2014)
(Google, 2014)
The geothermal potential is estimated at 16,000 MW, which could represent roughly 90% of the
current installed capacity (CIFES, 2012).
Moreover, geothermal energy is not only abundant, but also cost competitive:
A 2011 Bloomberg New Energy Finance analysis of levelized cost of energy (LCOE) in the Chilean
market finds geothermal to be one most cost competitive NCRE sources and one of the more cost
competitive resources of any type (Tringas, 2011).
Only onshore wind, biomass, biogas, and certain types of hydroelectric resources supersede
geothermal LCOE, which is roughly estimated between USD 50/MWh and 80/MWh

21
(Tringas, 2011).
Main advantages of this renewable energy are:
Ø It is an abundant, reliable, consistent and domestic energy, as such it improves energy
security,
Ø It is a versatile energy and can be used for direct uses (greenhouses, heat, etc.) as well
as electricity generation,
Ø Geothermal technology is mature and has been used all over the world for decades,
Ø It can be used by the mining industry in the north of the country because their operations
are located nearby geothermal resources.
Ø It is cost competitive.
But, to date, according to CIFES, no geothermal plant is in operation nor even under construction.

22
Nevertheless, it should be noticed that 2 first modest projects have received the approval from the
environmental agency (SEIA) but are not expected to generate energy before 2018.
Name Owner Capacity
CAPEX Year of approval
Central Geotérmica Cerro Pabellón
Geotérmica del Norte
50MW 180M USD 2012 Connected to SING
Central Geotérmica Curacautín
Mighty River Power (New Zealand)
70 MW 330 M USD 2013 Connected to SIC
120 MW 510 M USD (CNE, 2013)
So, despite the upside of geothermal energy, why has the development process for geothermal
been so slow and laborious?
3.5.2 Barriers to geothermal energy development in Chile Hereafter are the main obstacles (Reed, 2006) to the development of this renewable energy in
Chile:
Ø Despite favourable LCOE for geothermal energy, proving a resource’s viability is both
expensive and risky–especially, at this time, in Chile. Actually, exploration drilling is more
expensive than in others countries: considering Chile is not home to oil and gas resources, any
rigs would need to be imported, there is no service providers nor drilling equipment, concession
are in remote locations, etc. Few investors are willing to assume this risk. Developers require
some additional government assistance to facilitate project development such as tax credit, feed-
in tariffs scheme, tax incentives for those who buy geothermal energy.
Ø Some geothermal projects are located in remote areas, making access to the electrical
grid and exploitation costly and difficult.
Ø Exploration rights do not include lands rights and sometimes, exploration companies have
to face indigenous or environmentalist opposition, what might delay the project (Although Land
rights ownerships have been eased for NCRE developers…)
Ø Permitting process is a long way and might be long, involving negotiation with various
authorities at different level of the state administration. Development companies have to deal with
complicated local, provincial, and federal regulations. Furthermore, there is a lack of uniformity in
the environmental assessment by local authorities and studies for geothermal projects often do
not follow the same standards from region to region

23
3.6 ENERGY FROM BIOMASS IN CHILE
3.6.1 Introduction: Traditional firewood
Energy from biomass, which can be considered renewable, comes into various forms:
Ø It may be wood and biological matter used in a traditional way to provide heating and cooking
to households.
Ø It can be power plants fuelled with wood pellets or other biological matters, producing
electricity by heating a water-steam system.
Ø It can also be bio-ethanol, bio-diesel or biogas produced from crops or farm rejects. These
derivatives can then be used in cars, or for other applications.
In Chile, traditional biomass represented before 2007 up to 50% of energy use in the residential and
commercial sectors, sectors that accounted for 20% of the global country energy consumption. In
2011, the residential sector derived 58% of its energy use from firewood (Schueftan, 2013) while in
2012 only 31% of energy used was from firewood (MINE, 2013), the bulk being electricity from the
grid.
As always, figures related to traditional biomass usage shall be taken cautiously, as it is difficult to
obtain real figures. Traditional biomass usage in Chile is strongly related with deforestation rates
that have been increasing in the country and may have had an impact on prices. Consumption of
firewood is also related with an important topic in terms of energy security: energy efficiency
measures. Chile’s government is promoting regulations to improve energy efficiency in buildings.
Traditional houses in Chile are poorly insulated, but new buildings will have to be built to save
energy as much as possible.
3.6.2 Power generation from biomass Power generation from biomass (like wood pellets or waste products) only supplies the central
region network, SIC. Forestry businesses and pulp and paper factories also use their by-products to
produce some of their own consumed electricity. Currently 444 MW capacity of biomass power has
been installed (MAS, 2013), 68 MW are under construction and 283 MW of planned capacity in
January 2014 had their environmental impact assessment approved. Some analysts believe that up
to 1370 MW total capacity can be developed from current industries rejects (Woodhouse, 2011).
Compared to other renewable energy sources, it is not a high growth sector.
3.6.3 Biogas and biofuels For biogas, in 2012, 13 million cubic metre of biogas was produced and consumed, while 1232
millions cubic meter of natural gas were extracted from Chilean fields and 3917 million cubic meter
of natural gas were imported (Ramirez and Bickford, 2012). So we can say it was negligible,
compare to the overall consumption.

24
However the potential for biogas exist: there is approximately 300 landfills, with an associated
potential of 160 to 203 Millions cubic meters of biogas. There is more than 160 wastewater
treatment plants, three of them already fitted with sludge fermenters designed for producing 44.5
Millions cubic meter per year. Agricultural residues could produce 122 millions cubic meters of
biogas for crops, and 100 millions cubic meters for other discarded materials from wineries, dairy
farms, fisheries. Animal farms, through cow and pig manures could also produce up to 470 millions
cubic meter per year. In Total the potential of recovery of biomass into biogas is more than 1000
millions cubic meter per year, equivalent to the national gas fields current production (Mang, 2004)
A grant from the Global Environmental Facility (GEF) of 1,7 million US$ shall be used to finance
partially the development of some biogas production facilities (CER, 2014).
However the current price of gas does not give any incentive to develop these projects.
Production of liquid biofuels has not been developed and will not be developed in Chile, as the
available agricultural ground is limited and is required to supply the food demand. Forest Industries
have streamlined their process and are already using their wood refuse to produce their own
electricity and reduce their costs, therefore there is no potential to re-use their residues to produce
biofuels.
Producing biodiesel from algae, which Chile has lots of access to, may be promising and is under
study (Ramirez and Bickford, 2012).
25
4 CONCLUSION To date, despite the urgency of the situation and the country’s many natural assets, the country has
not invested enough in developing alternative energy sources. By October 2014, only 1803 MW of
renewable capacities were in operation which have generated circa 3200 GWh over 2014,
representing 6% of the total generation (52231 GWh) (CNE, 2014).
But renewables energies development is improving rapidly in Chile:
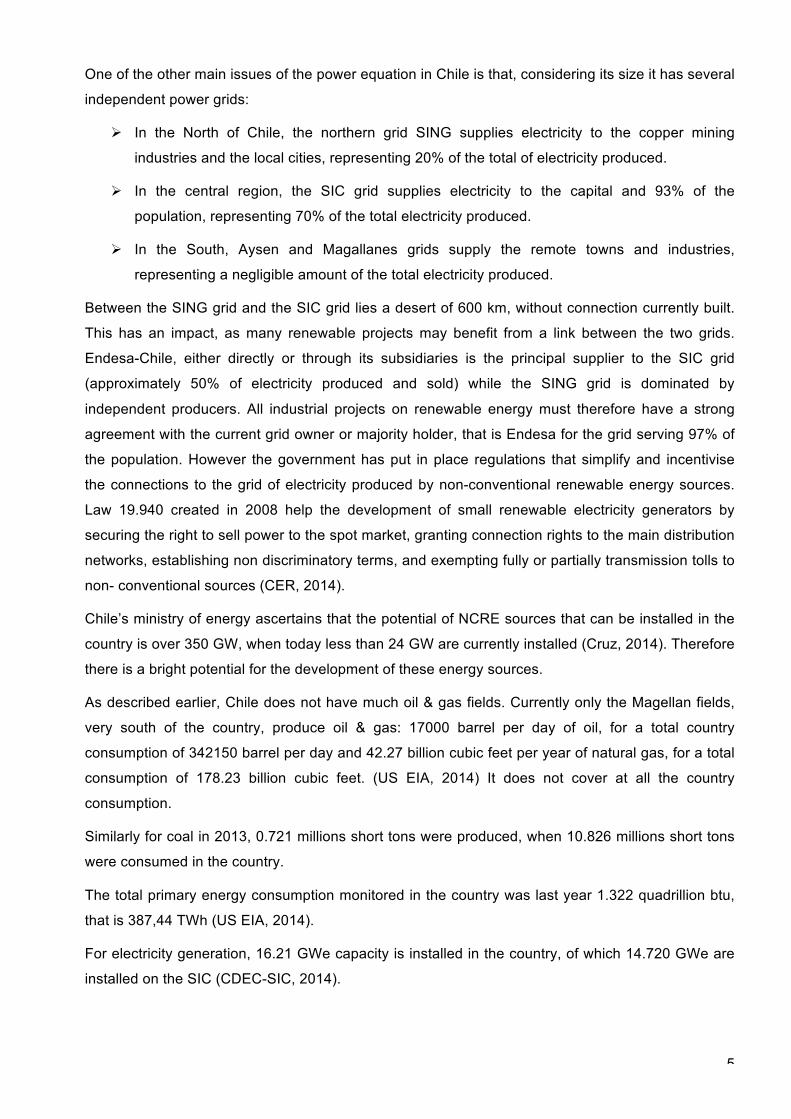
Ø In October 2014, 14280MW worth of renewable projects were approved by the Chile’s
environmental impact assessment agency.
October 2014, updated NCRE Status, Source: Goyeneche Rojas, 2014
Ø Chile has been ranked number 13 in the latest (June 2014) “Renewable Energy Country
Attractiveness Index” (“RECAI”), which ranks 40 countries based on their attractiveness for
investment in renewable energy projects and investment opportunities in the renewable
energy sector. In addition to Chile’s economic, political and legal stability, incentives and
protections to foreign investment and abundance of natural resources, the increase in NCRE
Projects in Chile is substantially due to the amendments to the General Electricity Services
Law (“Electricity Law”) enacted in 2008 and 2013 by Laws 20,257 and 20,698, respectively,
designed to foster the development of NCRE Projects.
Last but not least Chile has understood the concept that “the cheapest energy is the one you don’t
need to consume”. As a matter of fact, an aside developing renewables, Chile is trying to improve
the efficiency of its energy consumers, which is completely justified by high energy prices.
The Energy Efficiency Action Plan 2012-2020 made by the government promotes energy efficiency
measures focusing on 4 main sectors: mining and industry transport, building construction and
services.

26
BIBLIOGRAPHY Arauco (2009), ‘Energy from Forest Biomass: A Bright Spot for the Future’, Issues & Answers, Arauco business publication Ayre J. (2013), ‘Solar Now Accounts For 57% Of Chile’s Renewable Energy Pipeline’, cleantechnica.com BNEF (2012), ‘Chile’s Clean Energy Future’, Bloomberg New Energy Finance for the Natural Resources Defense Council CEGA (2014), ‘Geothermal in Chile’, Centro de exelencia en geotermia de los Andes, Website http://www.cega.ing.uchile.cl/cega/index.php/en/outreach/geothermal-‐in-‐chile Accessed 12/11/2014 Central Energía -‐ Central de información y discusión de energía en Chile, website http://www.centralenergia.cl/ Accessed 20/10/2014 CDEC-‐SIC website, http://www.cdec-‐sic.cl/ Accessed 04/11/2014 CDEC-‐SIC (2013), ‘Estadisticas de operation 2003-‐2012’, Business Publication, Centro de Despacho Económico de Carga -‐ Sistema Interconectado Central CDEC-‐SIC (2014), ‘Energía segura y eficiente para el Sistema Interconectado Central’, Business Publication, Centro de Despacho Económico de Carga -‐ Sistema Interconectado Central CDEC-‐SINC, Centro de despacho economico de carga del sistema interconectado del norte Grande de Chile, http://cdec2.cdec-‐sing.cl/ Accessed 02/11/2014 CER (2014), ‘Renewable Energy in Chile: Moving towards a clean, economical & secure energy matrix’, Centro de Energias Renovables, Ministerio de Energía de Chile CIFES (2012), Renewable Energy in Chile – Factsheet, Renewable Energy Center (CER) CNE (2013), Production real por systema, http://www.cne.cl/estdisticas/energia/electricidad, accessed 08/11/2014 CSP World (2014), http://www.csp-‐world.com/cspworldmap

27
Accessed 11/11/214 Comité Técnico de la Plataforma Escenarios Energéticos 2030 (2013), ‘Escenarios Energéticos Chile 2030’, TRANSELEC S.A. (Ed.) Craze, M. (2014), ‘Chile Top Renewables Market on Sunny Desert, Windy Shores’, Bloomberg Craze M. (2014), ‘ConocoPhillips to Study Oil, Gas Potential in Chile’, Bloomberg Cruz O. (2014), ‘Chile's Untapped Clean Energy Potential’, NACLA Report on the Americas Davies G. and Wills T. (2013), ‘Recommendations for Chile’s Marine Energy Strategy-‐ a Road Map for development’, Aquatera Consulting Report for the British Embassy in Santiago Donelly A. (2014), ‘DCNS and ENEL GREEN power to develop groundbreaking marine energy R&D facility in chile’, DCNS Company Website, http://en.dcnsgroup.com Del Sol F. and Sauma E. (2012), ‘Economic impacts of installing solar power plants in northern Chile’, Renewable and Sustainable Energy Reviews 19 Dufey, A. (2010), ‘Opportunities and Domestic Barriers to Clean Energy Investment in Chile’, International Institute for Sustainable Development Euromonitor International (2012), ‘Mercosur Diversifies into Renewable Energy’, Euromonitor International database, http://www.portal.euromonitor.com Galetti Vernazzani B. and Veirs V. (2012), ‘Wind farm projects near cetacean critical habitat in Chile: a case study’, Centro de Conservación Cetacea Gottlieb J. (2013), ‘Is Chile the Next Star in Renewable Energy?’, The energy collective website Goyeneche Rojas P. (2014), ‘Estado de proyectos ERNC Renewable Energy Center (CER), reporte CER octubre 2014, Renewable Energy Center (CER) GWEC (2014), Institutional website, Global Wind Energy Council www.gwec.com Accessed 12/11/2014 Harris M. (2014), ‘Chile rejects proposal for 2,750-‐MW HidroAysen hydroelectric project’, www.hydroworld.com

28
Hristova, D. (2014), ‘Chile may review 20-‐MW limit for mini hydro units’, http://renewables.seenews.com IEA (2012), ‘Oil and Gas Security -‐ Emergency Response of IEA countries, Chile 2012’, International Energy Agency IEA (2012), ‘Energy Balances of OECD Countries 2012’, OECD Publishing Ini L. (2014), ‘Chile evaluates offshore wind potential’, www.windpoweroffshore.com Levy A. (2012), ‘Marine Energy in Chile’, IDB Energy Innovation Center Long G. (2014), ‘Chile launches its biggest wind farm’, BBC News, La Serena, Chile Mang H. (2004), ‘Biogas Potential in Chile – Technology Transfer from Europe and China to Chile’, German Society for sustainable Biogas and Bioenergy Utilisation MAS (2013), ‘Chile’s Renewable Energy and Energy Efficiency Market: Opportunities for U.S. Exporter’, Market Intelligence Brief, International Trade Administration, Manufacturing and Services MINE (2011), ‘Renewable Energy in Chile – Factsheet’, Renewable Energy Center (CER), Ministerio de Energía de Chile MINE (2012), ‘NATIONAL ENERGY STRATEGY 2012-‐2030’, Ministerio de Energía de Chile MINE (2013),’Balance Nacional de Energía 2012’, Ministerio de Energía de Chile http://antiguo.minenergia.cl/minwww/opencms/14_portal_informacion/06_Estadisticas/Balances_Energ.html Mundaca T. L., (2013), ‘Climate change and energy policy in Chile: Up in smoke?’, Energy Policy 52, Elsevier Nasirov S. and Silva. C. (2014), ‘Diversification of Chilean Energy Matrix: Recent development and challenges’, International Association for Energy Economics Nielsen, S. (2014), ‘Chile Doubles Renewable-‐Energy Goal to 20% to Spark New Projects’, Bloomberg

29
OECD (2014), Latin American Economic Outlook 2014-‐OECD -‐ http://www.keepeek.com/Digital-‐Asset-‐Management/oecd/development/latin-‐american-‐economic-‐outlook-‐2014_leo-‐2014-‐en POCH (2011), ‘Chile: Final Report’, Observatory of Renewable Energy in Latin America and The Caribbean, the Latin American Energy Organization (OLADE) and the United Nations Industrial Development Organization (UNIDO). Ramirez N. and Bickford R. (2012), ‘Evolution of biofuels in Chile’, Global Agricultural Information Network Report, United States Department of Agriculture Palma Behnke R. et al. (2009), ‘Non-‐Conventional Renewable Energy in the Chilean Electricity Market’, Proyecto Energías Renovables No Convencionales (CNE/GTZ) Pattern (2014), ‘El Arrayán Wind’, Pattern Energy Company website http://patternenergy.com/en/operations/projects/el_arrayan/ accessed 15/11/2014 Pirazzoli A. (2014), ‘Renewable Energy: An update on the Chilean Experience’, Presentation for a Technical Expert Meeting: Renewable Energy, Ministerio de Energía de Chile Reed A. (2006), ‘Energy Under the Andes: Benefits, Barriers to Development, and Relevant Policy Alternatives for Chile’s Untapped Geothermal Resources’, University of Pittsburgh, Master Thesis Santiago L.G. (2014), ‘Energy in Chile: Keeping the lights on”, The Economist Schueftan A. and Gonzales A.D. (2013), ‘Reduction of firewood consumption by households in south-‐central Chile associated with energy efficiency programs”, Energy Policy 63 Smith A. (2014), ‘Financing Solar Projects in Chile Is a Tricky Business’ www.greentechmedia.com Smith P. (2013), ‘Ecopower plans 100MW Chile project’, www.windpowermonthly.com Staff (2013), ‘Tides are changing to expand renewable energy options in Chile’, The Santiago Times Tringas T. (2011) ‘Chile levelised cost of energy presented to NRDC’, Bloomberg New Energy Finance

30
US EIA (2014), Chile’s page, US Energy Information Administration http://www.eia.gov/countries/country-‐data.cfm?fips=ci
Accessed 09/10/2014
Vallejo C. (2014), ‘Boom of Nonconventional Renewable Energy Projects in Chile’, Cross Border Transactions, www.manatt.com Watts D. and Jara D. (2010), ‘Statistical analysis of wind energy in Chile’, Renewable Energy 36 (2011)
Woodhouse S. (2011), ‘Renewable Energy Potential of Chile’, Global Energy Network Institute, www.geni.org Zborowski M. (2014), ‘Chile looking to gas to meet energy demand, energy minister says’, Oil & Gas Journal


