Embed Size (px)
Citation preview
ARTICLE IN PRESS
Renewable and Sustainable Energy Reviews
12 (2008) 2013–2039
1364-0321/$ -
doi:10.1016/j
�CorrespoE-mail ad
www.elsevier.com/locate/rser
Energy situation and renewables in Turkey andenvironmental effects of energy use
Adem Akpınara, Murat Ihsan Komurcua,�, Murat Kankala,Ismail Hakkı Ozolc-erb, Kamil Kaygusuzc
aCivil Engineering Department, Karadeniz Technical University, 61080 Trabzon, TurkeybCivil Engineering Department, Zonguldak Karaelmas University, Zonguldak, TurkeycDepartment of Chemistry, Karadeniz Technical University, 61080 Trabzon, Turkey
Received 2 March 2007; accepted 11 April 2007
Abstract
The effects on global and environmental air quality of pollutants released into the atmosphere
from fossil fuels in power plants provide strong arguments for the development of renewable energy
resources. Clean, domestic and renewable energy is commonly accepted as the key for future life, not
only for Turkey but also for the world. In this regard, the objective of this paper is to present a review
of the energy situation, technical and economical potential and utilization of renewables, including
hydraulic energy, biomass energy, solar energy, wind energy and geothermal energy, in Turkey and
then concerned with greenhouse gas emissions status, especially in air pollution, and environmental
impacts of renewable energy sources. The renewable energy potential of the country, their present
utilization, and greenhouse gas emissions status are evaluated based on the available data. The
present paper shows that there is an important potential for renewables in Turkey and making use of
renewable energy and energy efficiency resources to provide energy services to the electricity
consumers can provide significant environmental benefits for Turkey.
r 2007 Elsevier Ltd. All rights reserved.
Keywords: Energy resources; Environment; Turkey
see front matter r 2007 Elsevier Ltd. All rights reserved.
.rser.2007.04.011
nding author. Tel.: +90462 377 2633; fax: +90462 326 6682.
dress: [email protected] (M.I. Komurcu).
ARTICLE IN PRESSA. Akpınar et al. / Renewable and Sustainable Energy Reviews 12 (2008) 2013–20392014
Contents
1. Introduction . . . . . . . . . . . . . . . . . . . . . . . . . . . . . . . . . . . . . . . . . . . . . . . . . . . . . 2014
2. Energy situation in Turkey . . . . . . . . . . . . . . . . . . . . . . . . . . . . . . . . . . . . . . . . . . . 2015
3. Renewables in Turkey . . . . . . . . . . . . . . . . . . . . . . . . . . . . . . . . . . . . . . . . . . . . . . 2017
3.1. Hydropower . . . . . . . . . . . . . . . . . . . . . . . . . . . . . . . . . . . . . . . . . . . . . . . . . 2017
3.2. Geothermal energy . . . . . . . . . . . . . . . . . . . . . . . . . . . . . . . . . . . . . . . . . . . . 2021
3.3. Biomass energy. . . . . . . . . . . . . . . . . . . . . . . . . . . . . . . . . . . . . . . . . . . . . . . 2023
3.4. Solar energy . . . . . . . . . . . . . . . . . . . . . . . . . . . . . . . . . . . . . . . . . . . . . . . . . 2026
3.5. Wind energy. . . . . . . . . . . . . . . . . . . . . . . . . . . . . . . . . . . . . . . . . . . . . . . . . 2027
4. Greenhouse gas emissions in Turkey . . . . . . . . . . . . . . . . . . . . . . . . . . . . . . . . . . . . 2029
5. Environmental effects of renewable energy sources . . . . . . . . . . . . . . . . . . . . . . . . . . 2032
5.1. Hydropower . . . . . . . . . . . . . . . . . . . . . . . . . . . . . . . . . . . . . . . . . . . . . . . . . 2032
5.2. Geothermal energy . . . . . . . . . . . . . . . . . . . . . . . . . . . . . . . . . . . . . . . . . . . . 2033
5.3. Biomass energy. . . . . . . . . . . . . . . . . . . . . . . . . . . . . . . . . . . . . . . . . . . . . . . 2034
5.4. Solar energy . . . . . . . . . . . . . . . . . . . . . . . . . . . . . . . . . . . . . . . . . . . . . . . . . 2035
5.5. Wind energy. . . . . . . . . . . . . . . . . . . . . . . . . . . . . . . . . . . . . . . . . . . . . . . . . 2036
6. Conclusions . . . . . . . . . . . . . . . . . . . . . . . . . . . . . . . . . . . . . . . . . . . . . . . . . . . . . 2037
References . . . . . . . . . . . . . . . . . . . . . . . . . . . . . . . . . . . . . . . . . . . . . . . . . . . . . . 2037
1. Introduction
A popular (and quite accurate) conception of energy is that it is a resource thatmakes life easier for us—a resource that takes us from one place to another, providesheat and light, powers our entertainment devices and labor-saving appliances, andimproves our quality of life. To understand just what energy is, it is useful to look firstat the many forms in which it comes. Primary energy resources on the earth includefossil fuels (petroleum, natural gas, and coal), nuclear energy, and renewables suchas solar, wind, hydropower, geothermal, and biomass [1]. Fossil fuels and nuclearenergy sources are fundamentally limited and exhaustible. As these sourcesbecome depleted, human beings will be forced to learn how to evaluate renewable energysources.The effects on global and environmental air quality of pollutants released into the
atmosphere from fossil fuels in power plants provide strong arguments for thedevelopment of renewable energy resources. Clean, domestic and renewable energyis commonly accepted as the key for future life, not only for Turkey but also for theworld. The consumption of conventional fossil energy sources (coal, petroleum andnatural gas) on one hand results in serious environmental pollution problems, and on theother hand faces with the danger of exhaustion. In order to have a sustainabledevelopment in Turkey, it must be enhanced the efficiency of the conventional energygeneration and increased the proportion of renewable energy sources in the total energybudget.In this paper, energy situation and major environmental impacts of energy utilization in
Turkey, especially greenhouse gas emissions, are analysed; renewable energy sourcesincluding hydropower, biomass, solar, wind and geothermal energy are examined withrespect to their potential and current use.
ARTICLE IN PRESSA. Akpınar et al. / Renewable and Sustainable Energy Reviews 12 (2008) 2013–2039 2015
2. Energy situation in Turkey
Although Turkey has almost all kinds of energy resources, it is an energy importingcountry; more than half of the energy requirement has been supplied by imports.Therefore, it seems that if the country wants to supply its demand by domestic and cleanenergy resources, the transition to renewable energy resources must be realized in areasonable time period [2]. When it is examined energy consumption data of Turkey, it isrealized that oil has the biggest share in total primary energy consumption. The high levelof dependence on imported petroleum and natural gas is the dominant factor in Turkey’spattern of energy consumption. While the share of petroleum in consumption ofcommercial primary energy increase 3.5% from 2003 to 2004, the share of natural gas inconsumption of commercial primary energy grow 5% from 2003 to 2004.
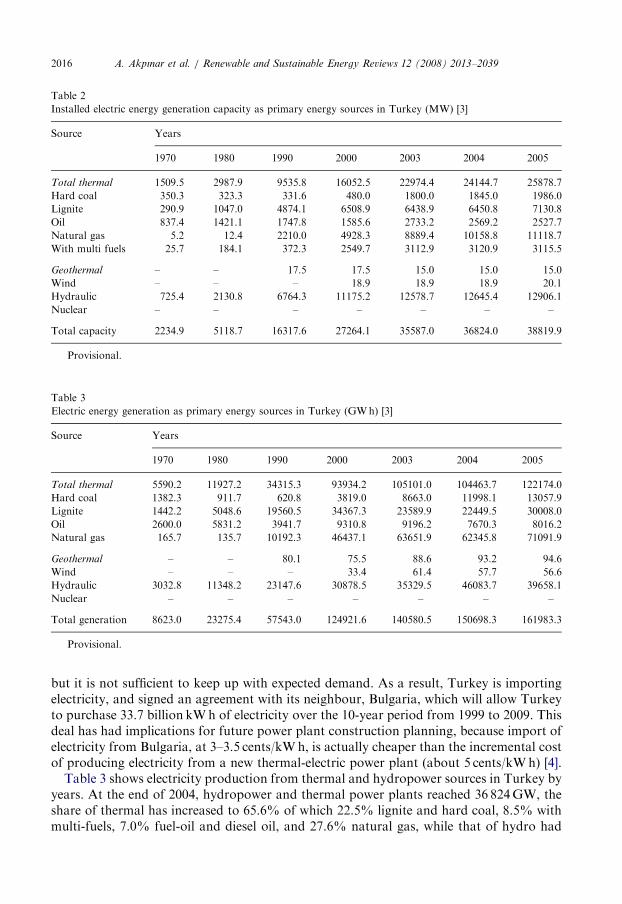
Turkey’s primary energy sources include hydropower, geothermal, lignite, hard coal, oil,natural gas, wood, animal and plant wastes, solar and wind energy. In 2004, primaryenergy production and consumption has reached 24.332 million tonnes (Mt) of oilequivalent (Mtoe) and 86.20Mtoe, respectively. Table 1 shows the Turkey’s primaryenergy consumption and production in 2003 and 2004. Fossil fuels provided about 87.5%of the total energy consumption of the year 2004, with oil (38.2%) in first place, followedby coal (25.6%) and natural gas (23.7%). Turkey has not utilized nuclear energy yet. TheTurkish coal sector, which includes hard coal as well as lignite, accounts for nearly one halfof the country’s total primary energy production, with lignite being the main domesticenergy source at 9.141Mtoe in 2004. The renewables collectively provided 12.5% of theprimary energy, mostly in the form of combustible renewables and wastes (6.4%),hydropower (about 4.6%), geothermal (1.0%), and much less by other renewable energyresources (approximately 0.5%) [3].
An historical summary of installed electricity generating capacity in Turkey is shown inTable 2. Net electricity generation in Turkey has more than doubled over the past decade,
Table 1
Turkey’s primary energy production and consumption (Mtoe) [3]
Energy source Production Consumption Increase (2003–2004) in
consumption
2003-year 2004-year 2003-year 2004-year Percentage
Fossil fuels 13.782 13.566 72.072 75.434 +4.7
Oil 2.494 2.390 31.806 32.922 +3.5
Natural gas 0.511 0.644 19.450 20.426 +5.0
Coal 10.777 10.532 20.816 22.086 +6.1
Nuclear – – – – –
Renewables 10.001 10.766 10.001 10.766 +7.7
Hydro 3.038 3.963 3.038 3.963 +30.4
Geothermal 0.860 0.891 0.860 0.891 +3.6
Solar 0.350 0.375 0.350 0.375 +7.1
Wind 0.005 0.005 0.005 0.005 0
Comb. renew. and
wastes
5.748 5.532 5.748 5.532 �3.9
Total 23.783 24.332 82.073 86.200 +5.0
ARTICLE IN PRESS
Table 3
Electric energy generation as primary energy sources in Turkey (GWh) [3]
Source Years
1970 1980 1990 2000 2003 2004 2005�
Total thermal 5590.2 11927.2 34315.3 93934.2 105101.0 104463.7 122174.0
Hard coal 1382.3 911.7 620.8 3819.0 8663.0 11998.1 13057.9
Lignite 1442.2 5048.6 19560.5 34367.3 23589.9 22449.5 30008.0
Oil 2600.0 5831.2 3941.7 9310.8 9196.2 7670.3 8016.2
Natural gas 165.7 135.7 10192.3 46437.1 63651.9 62345.8 71091.9
Geothermal – – 80.1 75.5 88.6 93.2 94.6
Wind – – – 33.4 61.4 57.7 56.6
Hydraulic 3032.8 11348.2 23147.6 30878.5 35329.5 46083.7 39658.1
Nuclear – – – – – – –
Total generation 8623.0 23275.4 57543.0 124921.6 140580.5 150698.3 161983.3
�Provisional.
Table 2
Installed electric energy generation capacity as primary energy sources in Turkey (MW) [3]
Source Years
1970 1980 1990 2000 2003 2004 2005�
Total thermal 1509.5 2987.9 9535.8 16052.5 22974.4 24144.7 25878.7
Hard coal 350.3 323.3 331.6 480.0 1800.0 1845.0 1986.0
Lignite 290.9 1047.0 4874.1 6508.9 6438.9 6450.8 7130.8
Oil 837.4 1421.1 1747.8 1585.6 2733.2 2569.2 2527.7
Natural gas 5.2 12.4 2210.0 4928.3 8889.4 10158.8 11118.7
With multi fuels 25.7 184.1 372.3 2549.7 3112.9 3120.9 3115.5
Geothermal – – 17.5 17.5 15.0 15.0 15.0
Wind – – – 18.9 18.9 18.9 20.1
Hydraulic 725.4 2130.8 6764.3 11175.2 12578.7 12645.4 12906.1
Nuclear – – – – – – –
Total capacity 2234.9 5118.7 16317.6 27264.1 35587.0 36824.0 38819.9
�Provisional.
A. Akpınar et al. / Renewable and Sustainable Energy Reviews 12 (2008) 2013–20392016
but it is not sufficient to keep up with expected demand. As a result, Turkey is importingelectricity, and signed an agreement with its neighbour, Bulgaria, which will allow Turkeyto purchase 33.7 billion kWh of electricity over the 10-year period from 1999 to 2009. Thisdeal has had implications for future power plant construction planning, because import ofelectricity from Bulgaria, at 3–3.5 cents/kWh, is actually cheaper than the incremental costof producing electricity from a new thermal-electric power plant (about 5 cents/kWh) [4].Table 3 shows electricity production from thermal and hydropower sources in Turkey by
years. At the end of 2004, hydropower and thermal power plants reached 36 824GW, theshare of thermal has increased to 65.6% of which 22.5% lignite and hard coal, 8.5% withmulti-fuels, 7.0% fuel-oil and diesel oil, and 27.6% natural gas, while that of hydro had
ARTICLE IN PRESSA. Akpınar et al. / Renewable and Sustainable Energy Reviews 12 (2008) 2013–2039 2017
fallen to 34.34%. In 2005, installed capacity rose to 38 819.9GW. Most thermal capacitywas fuel oil fired power plant until the beginning of 1980, when lignite plants took the lead.In the second half of the 1980s, natural gas fired plants were increasingly used and becamesecond only to lignite by 1990. In 2005, 161.98 TWh of electricity, the basic input for theeconomy and industry, was generated of which 75.5% from thermal and 24.5% fromhydrosources.
3. Renewables in Turkey
National and international bodies use a variety of definitions for renewable energy. Therenewable energy working party of International Energy Agency set down the followingdefinitions: ‘‘Renewable energy is energy that derived from natural processes that arereplenished constantly. In its various form the sun, or from heat generated deep withinthe Earth. Included in the definition is energy generated from solar, wind, biomass,geothermal, hydropower and ocean resources, and biofuels and hydrogen derived fromrenewable resources’’ [5].
Turkey has substantial reserves of renewable energy resources. Renewables make thesecond-largest contribution to domestic energy production after coal. In 2004, renewableenergy production represented about 10.766Mtoe (44.25% of total generation). More thanhalf of renewables used in Turkey are composed of combustible renewables and waste, therest being mainly hydro (36.8%) and geothermal (8.3%) [3]. Combustible renewables andwaste used in Turkey are almost exclusively non-commercial fuels, typically wood andanimal products, used in the residential sector for heating. The use of biomass forresidential heating, however, has declined owing to replacement of non-commercial fuelsby commercial fuels. The contribution of wind and solar is still small but is expected toincrease [6].
In 2005, the total electricity generation from renewables is 39.84 TWh and the share ofthe renewables given by 24.6%. In 1990, generation from renewables was 23.2 TWh andtheir share in power generation was higher, representing 40.4%. Hydro is the dominantsource of renewable electricity, with only 0.28 TWh derived from other sources. Hydroproduction fluctuates annually depending on the weather.
Renewable energy technologies produce marketable energy by converting naturalphenomena/resources into useful energy form. These resources represent a massive energypotential, which greatly exceeds that of fossil fuel resources. The usage of renewable energyresources is a promising prospect for the future as an alternative to conventional energy.However, except biomass energy, the proportion of other renewable energy used is stillmuch smaller than that of the conventional energy resources [7].
The following sections represent potential and utilization of various renewable energiesused in Turkey in recent years.
3.1. Hydropower
There is a general view that hydroelectricity is the renewable energy source parexcellence, non-exhaustible, non-polluting, and more economically attractive than otheroptions. And although the number of hydropower plants that can be built is finite, only athird of the sites quantified as economically feasible are tapped. Most renewable sources ofenergy hydroelectricity generation are capital intensive but have lower operational costs
ARTICLE IN PRESSA. Akpınar et al. / Renewable and Sustainable Energy Reviews 12 (2008) 2013–20392018
than thermal and nuclear options. The high initial cost is a serious barrier for its growth indeveloping countries where most of the untapped economic potential is located [8].Hydropower is obtained by allowing water to fall on a turbine to turn a shaft. Electricity
is produced from the kinetic energy of falling water. The requirement for a hydropower siteare a river with a reliable flow of water in a canyon with high walls and a narrow spot atwhich a dam can be built [9].The gross hydroelectric power potential depends on the foreseen development projects
of the region. For Turkey, it are estimated as 433–442TWh/yr [10] that is equal to 1% ofthe total hydropower potential of the world (Table 4) and 14% of European hydropowerpotential [11]. Technical hydroelectric power potential corresponds to the technicallyavailable part of the gross potential. For example a permeable geological formation willpromote a decrease in the available potential. It can slightly increase with developingtechnologic possibilities. Almost half of the gross potential is technically exploitable. Thetechnical hydroelectric potential of Turkey are estimated as 216TWh/yr. Economichydroelectric power potential corresponds to the economically advantageous part of thetechnical potential, compared with alternative energy resources [12]. Economic hydro-electric power potential of Turkey is 129.9 TWh/yr by the end of February 2006 and35.4% of this potential in operation while 8.1% and 56.5% of total potential are underconstruction and in various design level, respectively.According to findings of a study in which a new criterion is developed related to key
concept of ‘‘the economical feasibility’’, by taking into consideration some undervaluedand even ignored benefits of hydro plants and some overvalued benefits of thermal powerplants, economically feasible hydropower potential goes up 188TWh/yr, with an increaseratio of 47% compared to General Directorate of State Hydraulic Works (DSI) value[13,14]. Turkey’s hydropower potential according to DSI and the new developed criteriatogether with installed power values are given in Table 5.As of February 2006, there were 142 hydro plants in operation. These have a total
installed capacity of 12 788MW and an annual average generation capacity of45 930GWh, amounting to almost 35.4% of the total exploitable potential, which is
Table 4
Hydropotential of Turkey compared to world’s potential [10]
Region Gross theoretical
hydroelectric potential
(GWh/yr)
Technically feasible
hydroelectric potential
(GWh/yr)
Economically feasible
hydroelectric potential
(GWh/yr)
Africa 4 000 000 1 665 000 1 000 000
Asia 19 000 000 6 800 000 3 600 000
Australia/Oceania 600 000 270 000 105 000
Europe 3 150 000 1 225 000 800 000
North & Central
America
6 000 000 1 500 000 1 100 000
South America 7 400 000 2 600 000 2 300 000
World 40 150 000 14 060 000 8 905 000
Turkey 433 000 216 000 129 900
Turkey/World 1.07 1.54 1.84
ARTICLE IN PRESS
Table 5
Turkey’s annual hydropower potential according to DSI and new criteria [13,14]
Basin Average
annual
current
(Billionm3)
Gross
potential
(GWh)
Potential according
to DSI
Potential according to
new criteria
Economically
feasibility
potential
(GWh)
Installed
power
(MW)
Economically
feasibility
potential
(GWh)
Installed
power
(MW)
Fırat (Euphrates) 31.61 84 122 39 375 10 345 46 267 12 176
Dicle (Tigris) 21.33 48 706 17 375 5416 24 353 7610
Eastern Black Sea 14.90 48 478 11 474 3257 24 239 6925
Eastern Mediterranean 11.07 27 445 5216 1490 10 978 3137
Antalya 11.06 23 079 5355 1537 9232 2638
C- oruh 6.30 22 601 10 933 3361 12 431 3825
Ceyhan 7.18 22 163 4825 1515 8865 2860
Seyhan 8.01 20 875 7853 2146 9394 2609
Kızılırmak 6.48 19 552 6555 2245 7821 2697
Yes-ilırmak 5.80 18 685 5494 1350 8408 2213
Western Black Sea 9.93 17 914 2257 669 7166 2108
Western Mediterranean 8.93 13 595 2628 723 5438 1511
Aras 4.63 13 114 2372 631 5246 1418
Sakarya 6.40 11 335 2461 1175 3967 1984
Susurluk 5.43 10 573 1662 544 2643 881
Others 30 744 1788 546 1721 507
Total 186.05 432 981 127 623 36 950 188 169 55 099
A. Akpınar et al. / Renewable and Sustainable Energy Reviews 12 (2008) 2013–2039 2019
meeting about 30.6% of the electricity demand in 2004. Hydro plants with an installedcapacity of 3197 MW and an annual generation capacity of 10 518GWh, which is almost8% of the total potential, are under construction [15]. In the future, 565 more hydropowerplants will be constructed to exploit the remaining potential of 73 459GWh/yr, bringingthe total number of hydropower plants to 565 with a total installed capacity of 20 667MW.Those are being designed are divided into four sub-groups and distribution of Turkeyhydro power potential according to design level are given in Table 6. As follows this table:10 752GWh/yr (8.3%) with final design ready, 26 562GWh/yr (20.4%) with feasibilityreport ready, 17 819GWh/yr (13.7%) with master plan ready, and 18 326GWh/yr(14.1%) with preliminary report ready.
Small hydropower is in most cases ‘‘run-of-river’’; in other words any dam or hydraulicstructure is quite small, usually just a weir, and generally little or no water is stored. Thecivil works purely serve the function of regulating the level of the water at the intake to thehydropower plant. Therefore run-of-river installations do not have the same kinds ofadverse effect on the local environment as large hydro. On the other hand, hydropower hasvarious degrees of ‘‘smallness’’. To date, there is still no internationally agreed definition of‘‘small’’ hydro; the upper limit varies between 2.5 and 25MW. A maximum of 10MW isthe most widely accepted value worldwide, although the definition in China standsofficially at 25MW. In Turkey, the upper limit is accepted as 50MW [16]. While thedistribution of the hydropower plants, which are under design level, is presented in
ARTICLE IN PRESS
Table 7
Distribution of under design hydropower plants according to their hydro capacity [15]
Classification
(MW)
Number
of HEPP
Total capacity
(MW)
Total reliable
energy (GWh/yr)
Average annual
energy (GWh/yr)
Percentage of total
annual energy
o10 278 1086 1552 4940 6.72
10–50 188 4691 9038 18 847 25.66
450 99 14 890 29 415 49 672 67.62
Total 565 20 667 40 006 73 459 100.00
Table 6
Distribution of Turkey hydropower potential according to design level (February 2006) [15]
Status of hydroelectric
plants projects
Number
of project
Installed
capacity
(MW)
Total annual hydroelectric energy generation
Reliable
energy
(GWh)
Total
energy
(GWh)
Ratio
(%)
Cumulative
energy
(GWh)
Ratio
(%)
In operation 142 12 788 33 560 45 930 35.4 45 930 35.4
Under construction 40 3197 6358 10 518 8.1 56 448 43.5
Planned 565 20 667 40 006 73 459 56.5
Final design ready 14 3556 7089 10 752 8.3 67 200 51.8
Feasibility report ready 175 7306 13 305 26 562 20.4 93 762 72.2
Master plan ready 96 5120 10 582 17 819 13.7 111 581 85.9
Preliminary report ready 280 4685 9030 18 326 14.1 129 907 100.0
Total potential 747 36 652 79 924 129 907 100.0 129 907 100.0
Table 8
Distribution of existing hydro power plants according to their hydro capacity [17]
Classification
(MW)
Number
of HEPP
Total capacity
(MW)
Total reliable
energy (GWh/yr)
Average annual
energy (TWh/yr)
Percentage of total
annual energy
o10 72 172.95 277.00 675.28 1.47
10–50 32 734.86 1259.80 2758.00 6.00
450 38 11880.40 32023.00 42497.00 92.53
Total 142 12788.21 33559.80 45930.28 100.00
A. Akpınar et al. / Renewable and Sustainable Energy Reviews 12 (2008) 2013–20392020
Table 7. According to their hydro capacity, the distribution of the existing hydropowerplants is given Table 8. As can be seen these tables, there is 72 installed small hydropowerplants (SHPs), which have 172.95MW of installed capacity [17], and it is also planned toallocate 278 SHPs with 1086MW of capacity in Turkey. Thus, when this planned powerplants are in operation, the SHP will able to meet 4.7% of total annual energy (present is1.47% of the total).
ARTICLE IN PRESSA. Akpınar et al. / Renewable and Sustainable Energy Reviews 12 (2008) 2013–2039 2021
3.2. Geothermal energy
Geothermal energy is the energy contained as heat in the Earth’s interior. The origin ofthis heat is linked with the internal structure of our planet and the physical processesoccurring there. This heat is brought to the near-surface by thermal conduction and byintrusion into the Earth’s crust of molten magma originating from great depths.Groundwater is heated to form hydrothermal resources. Use of hydrothermal energy iseconomic today at a number of high-grade sites. Hydrothermal resources are tapped byexisting well-drilling and energy-conversion technologies to generate electricity or toproduce hot water for direct use (house heating, washing, etc.). For generation ofelectricity, hot water at temperatures ranging from about 150 to 370 1C is brought from theunderground reservoir to the surface through production wells and is flashed to steam inspecial vessels by release of pressure. The steam is separated from the liquid and fed to aturbine engine, which turns a generator [18].
Geothermal energy includes direct uses of heat, electricity production, and geothermalheat pump. Direct applications of geothermal energy can involve a wide variety of enduses, such as space heating and cooling, industry, greenhouses, fish farming, and healthspas. The technology, reliability, economics, and environmental acceptability of direst useof geothermal energy have been demonstrated throughout the world.
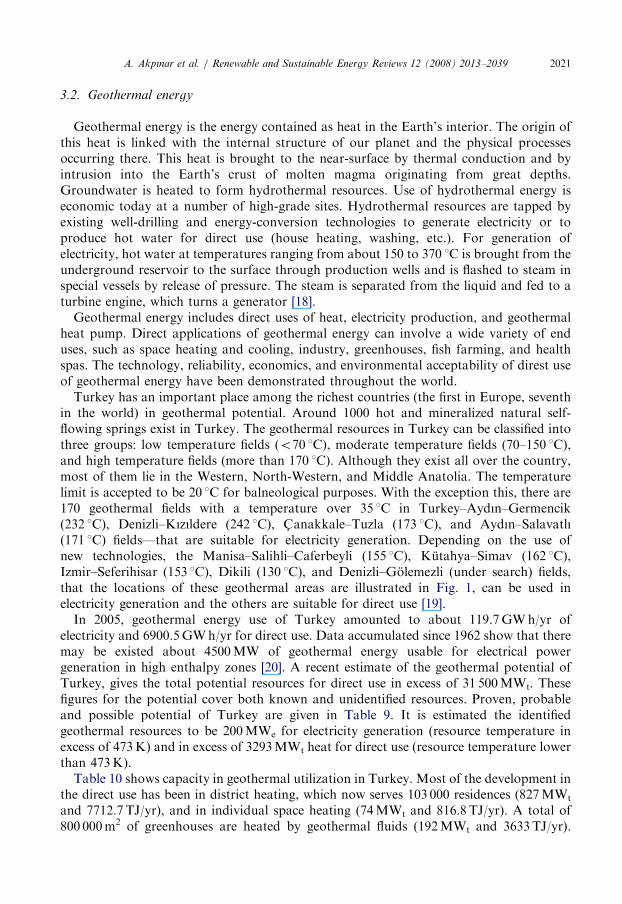
Turkey has an important place among the richest countries (the first in Europe, seventhin the world) in geothermal potential. Around 1000 hot and mineralized natural self-flowing springs exist in Turkey. The geothermal resources in Turkey can be classified intothree groups: low temperature fields (o70 1C), moderate temperature fields (70–150 1C),and high temperature fields (more than 170 1C). Although they exist all over the country,most of them lie in the Western, North-Western, and Middle Anatolia. The temperaturelimit is accepted to be 20 1C for balneological purposes. With the exception this, there are170 geothermal fields with a temperature over 35 1C in Turkey–Aydın–Germencik(232 1C), Denizli–Kızıldere (242 1C), C- anakkale–Tuzla (173 1C), and Aydın–Salavatlı(171 1C) fields—that are suitable for electricity generation. Depending on the use ofnew technologies, the Manisa–Salihli–Caferbeyli (155 1C), Kutahya–Simav (162 1C),Izmir–Seferihisar (153 1C), Dikili (130 1C), and Denizli–Golemezli (under search) fields,that the locations of these geothermal areas are illustrated in Fig. 1, can be used inelectricity generation and the others are suitable for direct use [19].
In 2005, geothermal energy use of Turkey amounted to about 119.7GWh/yr ofelectricity and 6900.5GWh/yr for direct use. Data accumulated since 1962 show that theremay be existed about 4500MW of geothermal energy usable for electrical powergeneration in high enthalpy zones [20]. A recent estimate of the geothermal potential ofTurkey, gives the total potential resources for direct use in excess of 31 500MWt. Thesefigures for the potential cover both known and unidentified resources. Proven, probableand possible potential of Turkey are given in Table 9. It is estimated the identifiedgeothermal resources to be 200MWe for electricity generation (resource temperature inexcess of 473K) and in excess of 3293MWt heat for direct use (resource temperature lowerthan 473K).
Table 10 shows capacity in geothermal utilization in Turkey. Most of the development inthe direct use has been in district heating, which now serves 103 000 residences (827MWt
and 7712.7 TJ/yr), and in individual space heating (74MWt and 816.8 TJ/yr). A total of800 000m2 of greenhouses are heated by geothermal fluids (192MWt and 3633TJ/yr).
ARTICLE IN PRESS
Table 9
Status of Turkey’s geothermal energy in 2005 [21–23]
Proven
potential
Probable and possible
potential
Heating (o473K) 3293MWt 31 500MWt
Electricity (4473K) 200MWe 4500MWe
Capacity
(MWt)
Use (TJ/yr) Use GWh/yr Capacity
factor
Direct use 1495 24 839.9 6900.5 0.53
Electricity 20.4 119.73
Table 10
Capacity in geothermal utilization in Turkey [24]
Geothermal utilization Capacity
District heating 827MWt
Balneological utilization 402MWt
Total direct use 1229MWt
Carbon dioxide production 120 000 t/yr
Power production 20MWe (Denizli–Kızıldere) (operating)
25MWe (Germencik) (under construction)
10MWe (Aydın Salavatlı) (under construction)
Fig. 1. Map indicating Turkey’s geothermal fields suitable for electricity generation.
A. Akpınar et al. / Renewable and Sustainable Energy Reviews 12 (2008) 2013–20392022
Geothermal heated pools used for bathing and swimming account for a capacity of402MWt and utilize 12 677.4 TJ/yr. About 120 000 ton of liquid carbon dioxide and dry iceare produced annually at the Kızıldere power plant. By the year 2010 Turkey aims at
ARTICLE IN PRESSA. Akpınar et al. / Renewable and Sustainable Energy Reviews 12 (2008) 2013–2039 2023
having 500MWe dedicated to electricity generation and 3500MWt for space heating. Heatpumps are not being used at present, because of the high cost of electricity [21–24].
It is clear that the present use of geothermal energy is a very small fraction of theidentified geothermal potential. Four percent of geothermal source potential of Turkey isonly evaluated up to 2005. When Turkey uses all of the total geothermal potential it canmeet 12.7% of the total energy need (heat+electricity) from geothermal energy. There iscertainly space for an accelerated use of geothermal energy both for electricity generationand direct use in the near future [25].
3.3. Biomass energy
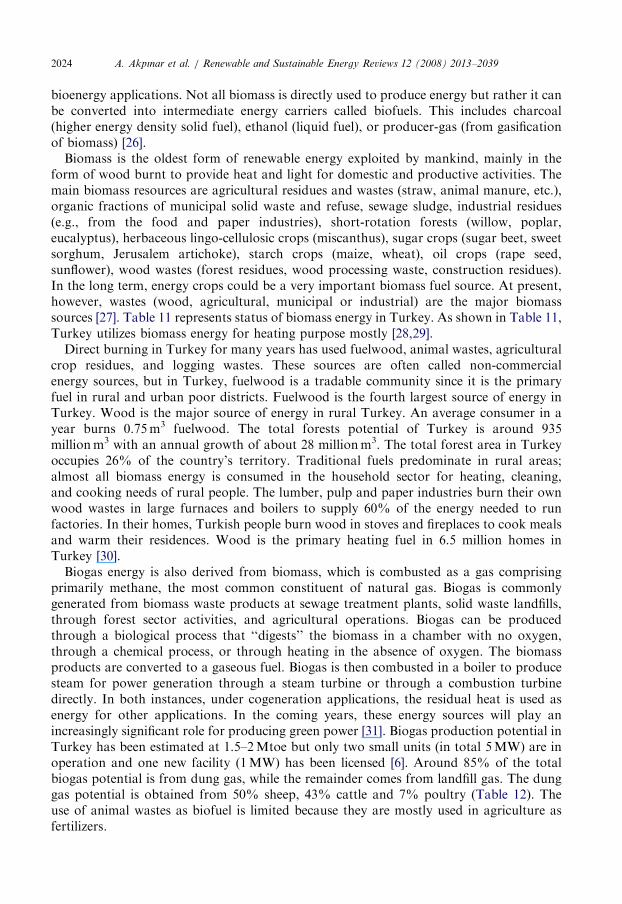
Biomass is the term used for all organic material originating from plants (includingalgae), trees and crops and is essentially the collection and storage of the sun’s energythrough photosynthesis. Biomass energy, or bioenergy, is the conversion of biomass intouseful forms of energy such as heat, electricity and liquid fuels.
Biomass for bioenergy comes either directly from the land, as dedicated energy crops, orfrom residues generated in the processing of crops for food or other products such as pulpand paper from the wood industry. Another important contribution is from post consumerresidue streams such as construction and demolition wood, pallets used in transportation,and the clean fraction of municipal solid waste (MSW). The biomass to bioenergy systemcan be considered as the management of flow of solar generated materials, food, and fiberin our society. These inter-relationships are shown in Fig. 2, which presents the variousresource types and applications, showing the flow of their harvest and residues to
Food
Biomass
Process residues, stalks
& straw, harvest
residues, forest slash,
bagasse, dung
Process
residues, black
liquor, sawdust,
bark
MSW, yard
trimmings,
construction &
demolition, wood
Forest harvest for
energy, short
rotation woody
crops, herbaceous
energy cropsBioenergy
Fiber
Crops,
Animals
Consumers
Materials
Pulp, paper,
lumber,
plywood,
cotton
Energy Services
Heat, electricity,
CHP
Biofuels
Charcoal, ethanol,
producer-gas
Fig. 2. Biomass and bioenergy flow chart [26].
ARTICLE IN PRESSA. Akpınar et al. / Renewable and Sustainable Energy Reviews 12 (2008) 2013–20392024
bioenergy applications. Not all biomass is directly used to produce energy but rather it canbe converted into intermediate energy carriers called biofuels. This includes charcoal(higher energy density solid fuel), ethanol (liquid fuel), or producer-gas (from gasificationof biomass) [26].Biomass is the oldest form of renewable energy exploited by mankind, mainly in the
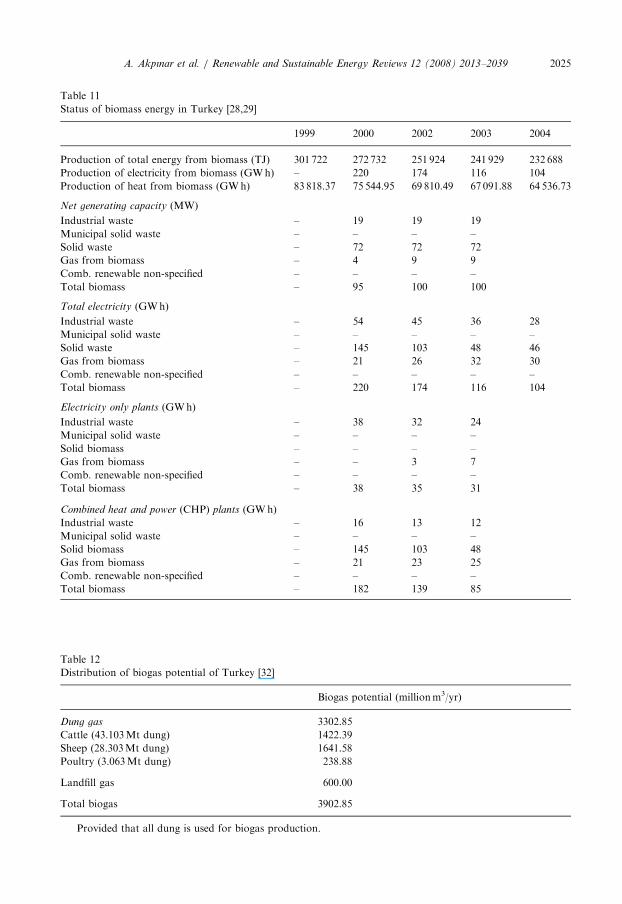
form of wood burnt to provide heat and light for domestic and productive activities. Themain biomass resources are agricultural residues and wastes (straw, animal manure, etc.),organic fractions of municipal solid waste and refuse, sewage sludge, industrial residues(e.g., from the food and paper industries), short-rotation forests (willow, poplar,eucalyptus), herbaceous lingo-cellulosic crops (miscanthus), sugar crops (sugar beet, sweetsorghum, Jerusalem artichoke), starch crops (maize, wheat), oil crops (rape seed,sunflower), wood wastes (forest residues, wood processing waste, construction residues).In the long term, energy crops could be a very important biomass fuel source. At present,however, wastes (wood, agricultural, municipal or industrial) are the major biomasssources [27]. Table 11 represents status of biomass energy in Turkey. As shown in Table 11,Turkey utilizes biomass energy for heating purpose mostly [28,29].Direct burning in Turkey for many years has used fuelwood, animal wastes, agricultural
crop residues, and logging wastes. These sources are often called non-commercialenergy sources, but in Turkey, fuelwood is a tradable community since it is the primaryfuel in rural and urban poor districts. Fuelwood is the fourth largest source of energy inTurkey. Wood is the major source of energy in rural Turkey. An average consumer in ayear burns 0.75m3 fuelwood. The total forests potential of Turkey is around 935millionm3 with an annual growth of about 28 millionm3. The total forest area in Turkeyoccupies 26% of the country’s territory. Traditional fuels predominate in rural areas;almost all biomass energy is consumed in the household sector for heating, cleaning,and cooking needs of rural people. The lumber, pulp and paper industries burn their ownwood wastes in large furnaces and boilers to supply 60% of the energy needed to runfactories. In their homes, Turkish people burn wood in stoves and fireplaces to cook mealsand warm their residences. Wood is the primary heating fuel in 6.5 million homes inTurkey [30].Biogas energy is also derived from biomass, which is combusted as a gas comprising
primarily methane, the most common constituent of natural gas. Biogas is commonlygenerated from biomass waste products at sewage treatment plants, solid waste landfills,through forest sector activities, and agricultural operations. Biogas can be producedthrough a biological process that ‘‘digests’’ the biomass in a chamber with no oxygen,through a chemical process, or through heating in the absence of oxygen. The biomassproducts are converted to a gaseous fuel. Biogas is then combusted in a boiler to producesteam for power generation through a steam turbine or through a combustion turbinedirectly. In both instances, under cogeneration applications, the residual heat is used asenergy for other applications. In the coming years, these energy sources will play anincreasingly significant role for producing green power [31]. Biogas production potential inTurkey has been estimated at 1.5–2Mtoe but only two small units (in total 5MW) are inoperation and one new facility (1MW) has been licensed [6]. Around 85% of the totalbiogas potential is from dung gas, while the remainder comes from landfill gas. The dunggas potential is obtained from 50% sheep, 43% cattle and 7% poultry (Table 12). Theuse of animal wastes as biofuel is limited because they are mostly used in agriculture asfertilizers.
ARTICLE IN PRESS
Table 12
Distribution of biogas potential of Turkey [32]
Biogas potential (millionm3/yr)
Dung gas 3302.85
Cattle (43.103Mt dung) 1422.39
Sheep (28.303Mt dung) 1641.58
Poultry (3.063Mt dung) 238.88
Landfill gas 600.00
Total biogas� 3902.85
�Provided that all dung is used for biogas production.
Table 11
Status of biomass energy in Turkey [28,29]
1999 2000 2002 2003 2004
Production of total energy from biomass (TJ) 301 722 272 732 251 924 241 929 232 688
Production of electricity from biomass (GWh) – 220 174 116 104
Production of heat from biomass (GWh) 83 818.37 75 544.95 69 810.49 67 091.88 64 536.73
Net generating capacity (MW)
Industrial waste – 19 19 19
Municipal solid waste – – – –
Solid waste – 72 72 72
Gas from biomass – 4 9 9
Comb. renewable non-specified – – – –
Total biomass – 95 100 100
Total electricity (GWh)
Industrial waste – 54 45 36 28
Municipal solid waste – – – – –
Solid waste – 145 103 48 46
Gas from biomass – 21 26 32 30
Comb. renewable non-specified – – – – –
Total biomass – 220 174 116 104
Electricity only plants (GWh)
Industrial waste – 38 32 24
Municipal solid waste – – – –
Solid biomass – – – –
Gas from biomass – – 3 7
Comb. renewable non-specified – – – –
Total biomass – 38 35 31
Combined heat and power (CHP) plants (GWh)
Industrial waste – 16 13 12
Municipal solid waste – – – –
Solid biomass – 145 103 48
Gas from biomass – 21 23 25
Comb. renewable non-specified – – – –
Total biomass – 182 139 85
A. Akpınar et al. / Renewable and Sustainable Energy Reviews 12 (2008) 2013–2039 2025
ARTICLE IN PRESSA. Akpınar et al. / Renewable and Sustainable Energy Reviews 12 (2008) 2013–20392026
3.4. Solar energy
There are two basic categories of technologies that convert sunlight into useful forms ofenergy, aside from biomass-based systems that do this in a broader sense by usingphotosynthesis from plants as an intermediate step. First, solar photovoltaic (PV)modules convert sunlight directly into electricity. Second, solar thermal power systems usefocused solar radiation to produce steam, which is then used to turn a turbine producingelectricity [26].PV solar energy conversion is the direct conversion of sunlight into electricity. This can
be done by flat plate and concentrator systems. An essential component of these systems isthe solar cell, in which the PV effect—the generation of free electrons using the energy oflight particles—takes place. These electrons are used to generate electricity.Solar radiation is available at any location on the surface of the Earth. It can produce
high-temperature heat, which can generate electricity. The most important solar thermaltechnologies to produce electricity-concentrating use direct irradiation. Low cloud areaswith little scattered radiation, such as deserts, are considered most suitable for direct-beam-only collectors. Thus the primary market for concentrating solar thermal electrictechnologies is in sunnier regions, particularly in warm temperate, sub-tropical, or desertareas.The easiest and most direct application of solar energy is the direct conversion of
sunlight into low-temperature heat-up to a temperature of 100 1C. In general, two classesof technologies can be distinguishes: passive and active solar energy conversion. Withactive conversion there is always a solar collector, and the heat is transported to theprocess by a medium. With passive conversion the conversion takes place in the process, sono active components are used. The best known active conversion application is the solardomestic hot water system. Another technology in the building sector is the solar spaceheating system. Such a system can be sized for single houses or for collective buildings anddistrict heating. Similar technologies can be applied in the industrial and agricultural sectorfor low-temperature heating and drying applications. Heating using solar energy can alsobe achieved by heat pumps [8].An important part of Turkey is suitable for utilization of solar energy. Turkey is
between the 361 and 421 north latitudes. The solar energy potential of Turkey is theequivalent of 1.3 billion tonnes of oil. The solar thermal capacity is approximately2640 h/yr and annual solar intensity is 3.6 kWh/m2 day. This is sufficient to provideadequate energy for solar thermal applications [32,33]. The solar radiation and sunshineduration vary between about 240–395 cal/cm2 day and 4.5–8.5 h/day, respectively. Solarenergy potential is given in Table 13. The average solar radiation is 309.6 cal/m2 day andthe average sunshine duration is 7.2 h/day. The south-eastern Anatolia and Mediterraneanregions are very suitable for solar energy use.There are basically three types of collectors: flat-plate, evacuated-tube, and concentrat-
ing. Flat-plate collectors are the most commonly used types. Flat-plate solar collectorsused for domestic water heating are widely used and commercially available in Turkey. In2003, the collector surface area installed in Turkey was 10 millionm2, including bothhousehold systems and large-scale use in hotels, industrial activities, etc. Using thesecollectors for heating contributed 0.35Mtoe to energy production. Annual collectormanufacturing capacity is 1 millionm2. The Electrical Power Resources Survey andDevelopment Administration (EIE) installed a computer-aided test stand in order to
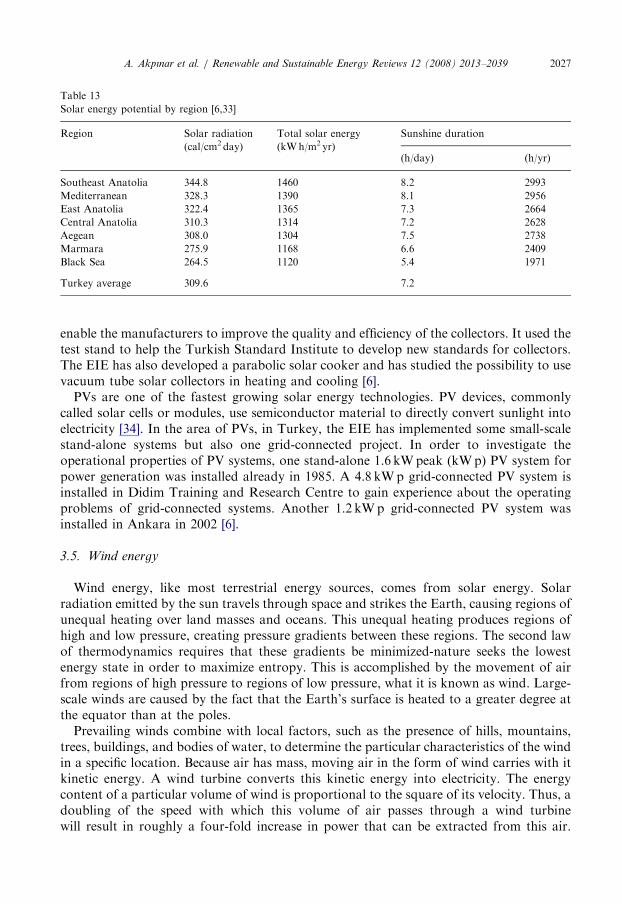
ARTICLE IN PRESS
Table 13
Solar energy potential by region [6,33]
Region Solar radiation
(cal/cm2 day)
Total solar energy
(kWh/m2 yr)
Sunshine duration
(h/day) (h/yr)
Southeast Anatolia 344.8 1460 8.2 2993
Mediterranean 328.3 1390 8.1 2956
East Anatolia 322.4 1365 7.3 2664
Central Anatolia 310.3 1314 7.2 2628
Aegean 308.0 1304 7.5 2738
Marmara 275.9 1168 6.6 2409
Black Sea 264.5 1120 5.4 1971
Turkey average 309.6 7.2
A. Akpınar et al. / Renewable and Sustainable Energy Reviews 12 (2008) 2013–2039 2027
enable the manufacturers to improve the quality and efficiency of the collectors. It used thetest stand to help the Turkish Standard Institute to develop new standards for collectors.The EIE has also developed a parabolic solar cooker and has studied the possibility to usevacuum tube solar collectors in heating and cooling [6].
PVs are one of the fastest growing solar energy technologies. PV devices, commonlycalled solar cells or modules, use semiconductor material to directly convert sunlight intoelectricity [34]. In the area of PVs, in Turkey, the EIE has implemented some small-scalestand-alone systems but also one grid-connected project. In order to investigate theoperational properties of PV systems, one stand-alone 1.6 kWpeak (kWp) PV system forpower generation was installed already in 1985. A 4.8 kWp grid-connected PV system isinstalled in Didim Training and Research Centre to gain experience about the operatingproblems of grid-connected systems. Another 1.2 kWp grid-connected PV system wasinstalled in Ankara in 2002 [6].
3.5. Wind energy
Wind energy, like most terrestrial energy sources, comes from solar energy. Solarradiation emitted by the sun travels through space and strikes the Earth, causing regions ofunequal heating over land masses and oceans. This unequal heating produces regions ofhigh and low pressure, creating pressure gradients between these regions. The second lawof thermodynamics requires that these gradients be minimized-nature seeks the lowestenergy state in order to maximize entropy. This is accomplished by the movement of airfrom regions of high pressure to regions of low pressure, what it is known as wind. Large-scale winds are caused by the fact that the Earth’s surface is heated to a greater degree atthe equator than at the poles.
Prevailing winds combine with local factors, such as the presence of hills, mountains,trees, buildings, and bodies of water, to determine the particular characteristics of the windin a specific location. Because air has mass, moving air in the form of wind carries with itkinetic energy. A wind turbine converts this kinetic energy into electricity. The energycontent of a particular volume of wind is proportional to the square of its velocity. Thus, adoubling of the speed with which this volume of air passes through a wind turbinewill result in roughly a four-fold increase in power that can be extracted from this air.
ARTICLE IN PRESSA. Akpınar et al. / Renewable and Sustainable Energy Reviews 12 (2008) 2013–20392028
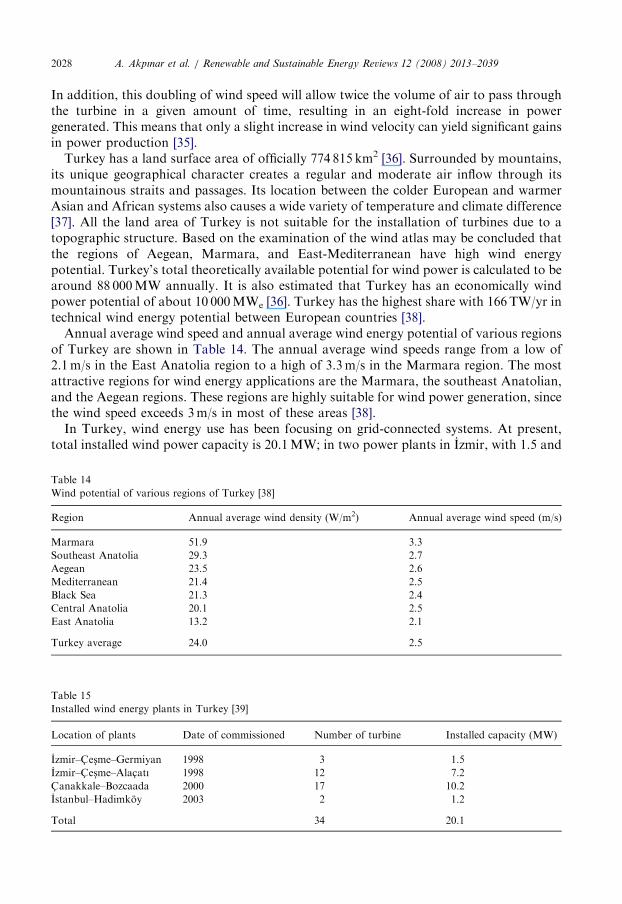
In addition, this doubling of wind speed will allow twice the volume of air to pass throughthe turbine in a given amount of time, resulting in an eight-fold increase in powergenerated. This means that only a slight increase in wind velocity can yield significant gainsin power production [35].Turkey has a land surface area of officially 774 815 km2 [36]. Surrounded by mountains,
its unique geographical character creates a regular and moderate air inflow through itsmountainous straits and passages. Its location between the colder European and warmerAsian and African systems also causes a wide variety of temperature and climate difference[37]. All the land area of Turkey is not suitable for the installation of turbines due to atopographic structure. Based on the examination of the wind atlas may be concluded thatthe regions of Aegean, Marmara, and East-Mediterranean have high wind energypotential. Turkey’s total theoretically available potential for wind power is calculated to bearound 88 000MW annually. It is also estimated that Turkey has an economically windpower potential of about 10 000MWe [36]. Turkey has the highest share with 166TW/yr intechnical wind energy potential between European countries [38].Annual average wind speed and annual average wind energy potential of various regions
of Turkey are shown in Table 14. The annual average wind speeds range from a low of2.1m/s in the East Anatolia region to a high of 3.3m/s in the Marmara region. The mostattractive regions for wind energy applications are the Marmara, the southeast Anatolian,and the Aegean regions. These regions are highly suitable for wind power generation, sincethe wind speed exceeds 3m/s in most of these areas [38].In Turkey, wind energy use has been focusing on grid-connected systems. At present,
total installed wind power capacity is 20.1MW; in two power plants in Izmir, with 1.5 and
Table 14
Wind potential of various regions of Turkey [38]
Region Annual average wind density (W/m2) Annual average wind speed (m/s)
Marmara 51.9 3.3
Southeast Anatolia 29.3 2.7
Aegean 23.5 2.6
Mediterranean 21.4 2.5
Black Sea 21.3 2.4
Central Anatolia 20.1 2.5
East Anatolia 13.2 2.1
Turkey average 24.0 2.5
Table 15
Installed wind energy plants in Turkey [39]
Location of plants Date of commissioned Number of turbine Installed capacity (MW)
Izmir–C- es-me–Germiyan 1998 3 1.5
Izmir–C- es-me–Alac-atı 1998 12 7.2
C- anakkale–Bozcaada 2000 17 10.2
Istanbul–Hadimkoy 2003 2 1.2
Total 34 20.1
ARTICLE IN PRESSA. Akpınar et al. / Renewable and Sustainable Energy Reviews 12 (2008) 2013–2039 2029
7.2MW installed capacity; one in C- anakkale, with an installed capacity of 10.2 MW; andone in Istanbul, with an installed capacity of 1.2MW (Table 15) [39].
4. Greenhouse gas emissions in Turkey
Greenhouse gases (GHGs) such as carbon dioxide (CO2), methane (CH4) and nitrousoxide (N2O) are very efficient in absorbing the infrared heat radiation emitted from Earth’swarm surface while transparent to visible light. They trap the radiation heat in theatmosphere and then reemit it back toward the Earth. The heat balance called greenhouseeffect is essential to life on Earth. Anthropogenic emissions of GHGs, however, led to aconsiderable increase in the concentrations of these gases in the atmosphere since theIndustrial Revolution. Thus, it is expected to trigger global warning, which may causeadverse environmental disasters. In 1992, the United Nations Framework Convention onClimate Change (UNFCCC) was declared in Rio De Janerio, followed by the KyotoProtocol in 1997 [40]. Subsequently, developed and developing countries around the worldhave prevailingly addressed the mitigation strategies and policies relating to the GHGs. Itis also well known that the emissions of GHGs are closely related to the use of energy [41].
Greenhouse gas emissions of Turkey have been estimated by State Institute of Statistics(DIE) and the Intergovernmental Panel on Climate Change (IPCC) guideline has beenused in calculations. IPCC Guidelines define carbon dioxide (CO2), methane (CH4) andnitrous oxide (N2O) as direct GHGs and nitrogen oxides (NOx), carbon monoxides (CO),non-methane volatile organic compound (NMVOC), hydro-fluoro carbons (HFCs), per-fluoro-carbons (PFCs), sulphur hexafluoride (SF6) and sulphur dioxide (SO2) as indirectgreenhouse gases. CO2 emissions having special situation among all greenhouse gases aregenerated from fuel consumption and industrial processes. CO2 emissions generated fromfuel consumption by sectors were studied, in 2005 43% was generated from energy andtransformation sector, 24% from industrial sector, 18% from transportation sector and15% from other sectors (residential, agriculture, commercial and forest). The estimationfor the year of 2010 shows that the ratio of energy and transformation sector will increasedto 46% and the ratio of industrial sectors will be 27%, transportation sector will be 16%and other sectors will be 11% [42].
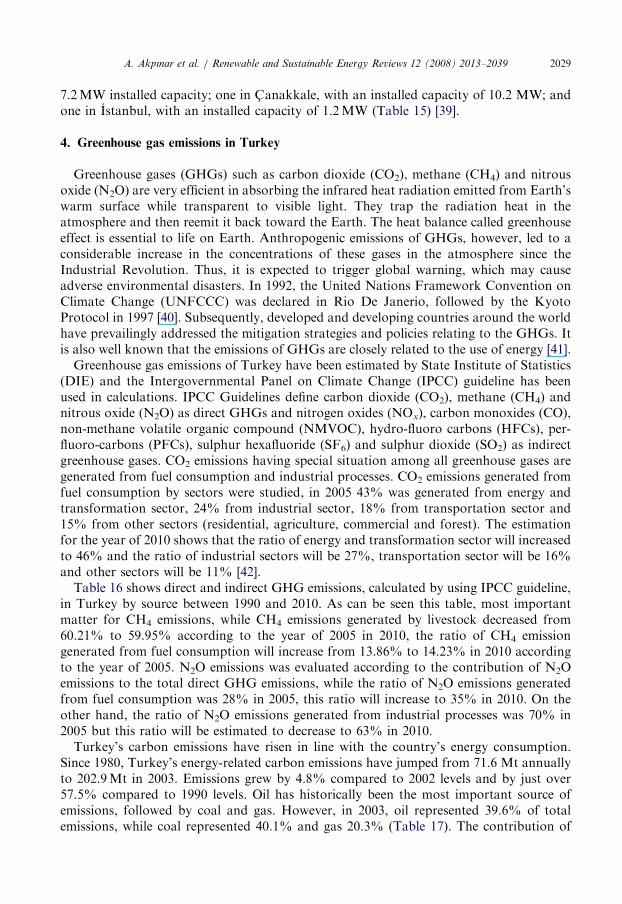
Table 16 shows direct and indirect GHG emissions, calculated by using IPCC guideline,in Turkey by source between 1990 and 2010. As can be seen this table, most importantmatter for CH4 emissions, while CH4 emissions generated by livestock decreased from60.21% to 59.95% according to the year of 2005 in 2010, the ratio of CH4 emissiongenerated from fuel consumption will increase from 13.86% to 14.23% in 2010 accordingto the year of 2005. N2O emissions was evaluated according to the contribution of N2Oemissions to the total direct GHG emissions, while the ratio of N2O emissions generatedfrom fuel consumption was 28% in 2005, this ratio will increase to 35% in 2010. On theother hand, the ratio of N2O emissions generated from industrial processes was 70% in2005 but this ratio will be estimated to decrease to 63% in 2010.
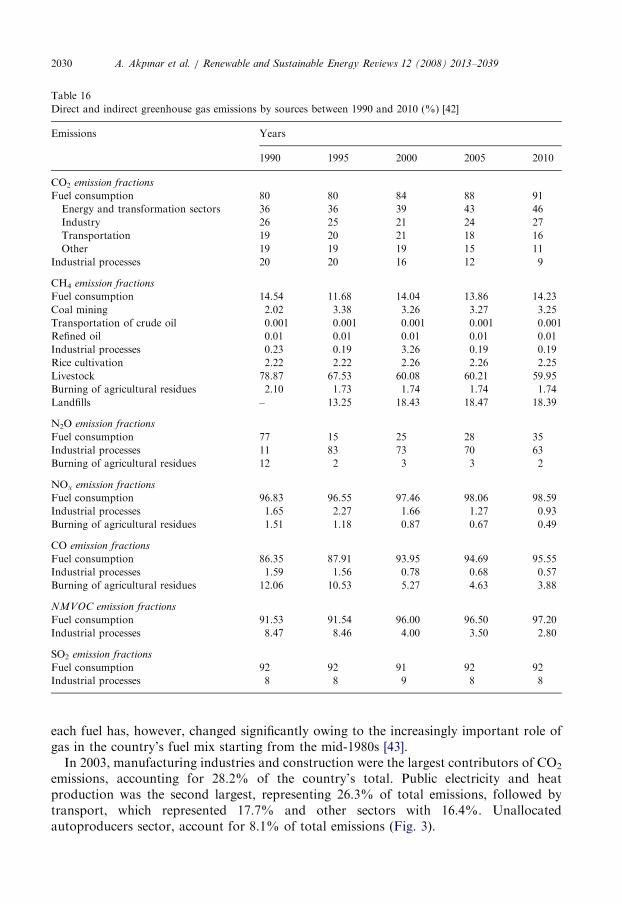
Turkey’s carbon emissions have risen in line with the country’s energy consumption.Since 1980, Turkey’s energy-related carbon emissions have jumped from 71.6 Mt annuallyto 202.9Mt in 2003. Emissions grew by 4.8% compared to 2002 levels and by just over57.5% compared to 1990 levels. Oil has historically been the most important source ofemissions, followed by coal and gas. However, in 2003, oil represented 39.6% of totalemissions, while coal represented 40.1% and gas 20.3% (Table 17). The contribution of
ARTICLE IN PRESS
Table 16
Direct and indirect greenhouse gas emissions by sources between 1990 and 2010 (%) [42]
Emissions Years
1990 1995 2000 2005 2010
CO2 emission fractions
Fuel consumption 80 80 84 88 91
Energy and transformation sectors 36 36 39 43 46
Industry 26 25 21 24 27
Transportation 19 20 21 18 16
Other 19 19 19 15 11
Industrial processes 20 20 16 12 9
CH4 emission fractions
Fuel consumption 14.54 11.68 14.04 13.86 14.23
Coal mining 2.02 3.38 3.26 3.27 3.25
Transportation of crude oil 0.001 0.001 0.001 0.001 0.001
Refined oil 0.01 0.01 0.01 0.01 0.01
Industrial processes 0.23 0.19 3.26 0.19 0.19
Rice cultivation 2.22 2.22 2.26 2.26 2.25
Livestock 78.87 67.53 60.08 60.21 59.95
Burning of agricultural residues 2.10 1.73 1.74 1.74 1.74
Landfills – 13.25 18.43 18.47 18.39
N2O emission fractions
Fuel consumption 77 15 25 28 35
Industrial processes 11 83 73 70 63
Burning of agricultural residues 12 2 3 3 2
NOx emission fractions
Fuel consumption 96.83 96.55 97.46 98.06 98.59
Industrial processes 1.65 2.27 1.66 1.27 0.93
Burning of agricultural residues 1.51 1.18 0.87 0.67 0.49
CO emission fractions
Fuel consumption 86.35 87.91 93.95 94.69 95.55
Industrial processes 1.59 1.56 0.78 0.68 0.57
Burning of agricultural residues 12.06 10.53 5.27 4.63 3.88
NMVOC emission fractions
Fuel consumption 91.53 91.54 96.00 96.50 97.20
Industrial processes 8.47 8.46 4.00 3.50 2.80
SO2 emission fractions
Fuel consumption 92 92 91 92 92
Industrial processes 8 8 9 8 8
A. Akpınar et al. / Renewable and Sustainable Energy Reviews 12 (2008) 2013–20392030
each fuel has, however, changed significantly owing to the increasingly important role ofgas in the country’s fuel mix starting from the mid-1980s [43].In 2003, manufacturing industries and construction were the largest contributors of CO2
emissions, accounting for 28.2% of the country’s total. Public electricity and heatproduction was the second largest, representing 26.3% of total emissions, followed bytransport, which represented 17.7% and other sectors with 16.4%. Unallocatedautoproducers sector, account for 8.1% of total emissions (Fig. 3).
ARTICLE IN PRESS
Fig. 3. 2003 CO2 emissions by sector in Turkey.
Table 17
CO2 emissions by fuel� (million tonnes of CO2) [43]
Years % Change
1990–2003
(%)1975 1980 1985 1990 1995 2000 2001 2002 2003
Coal 20.7 27.1 45.2 58.9 62.4 90.9 75.8 77.7 81.4 38.1
Oil 39.0 44.6 50.0 63.3 80.0 83.9 78.2 81.8 80.3 26.9
Gas – – 0.1 6.5 13.0 28.9 31.1 34.1 41.1 528.4
Total 59.6 71.6 95.3 128.8 155.4 203.7 185.2 193.6 202.9 57.5
�Estimated using the IPCC sectoral approach.
A. Akpınar et al. / Renewable and Sustainable Energy Reviews 12 (2008) 2013–2039 2031
Turkey is not yet a party to the UN Framework Convention on Climate Change or theKyoto Protocol, meaning the country has no binding requirements to cut carbon emissionsby the 2008–2012 period as most other IEA countries have. However, Turkey hasestablished a National Climate Coordination Group (NCCG) to carry out the nationalstudies in line with those conducted by all countries of the UNFCC. Armed with theresearch of the NCCG and with studies underway for a National Climate Programme,Turkey is considering accession to the Kyoto Protocol. Additional pressure to meet EUstandards make it increasingly likely that Turkey will accept some level of binding emissionreduction requirements in the foreseeable future [44].
ARTICLE IN PRESSA. Akpınar et al. / Renewable and Sustainable Energy Reviews 12 (2008) 2013–20392032
As Turkey resumes economic growth in coming years and attempts to meet EUmembership criteria, it will increasingly need to take environmental considerations intoaccount. Improved energy efficiency is a key to this strategy, with reduction of state energysubsidies allowing energy prices to more accurately reflect true costs. Overall, Turkey’senergy demand is expected to increase by 2.9% annually through 2020, while carbonemissions grow by a somewhat slower 2.2% yearly rate, as natural gas and renewables(which emit no carbon) consumption grows faster than coal usage. To the extent thatnatural gas and renewables replace more carbon-intensive fuels, the country’s increased useof natural gas will further diversify the Turkish energy supply and contribute to themitigation of urban pollution and CO2 emissions. By setting differentiated taxes topromote the use of cleaner fuels (and, in particular, to promote the use of low-sulphurheavy fuel oil), Turkey can significantly stem the rising tide of carbon emissions and otherpollutants [45].
5. Environmental effects of renewable energy sources
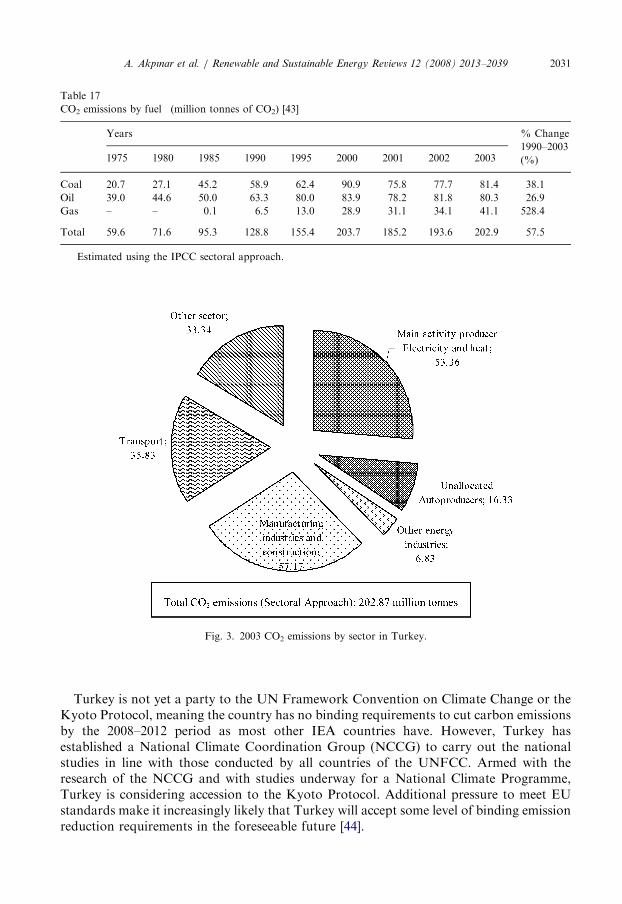
Environmental impacts that resources used in energy generation have occurred duringproduction are shown in Table 18. In table, it is used ‘‘+’’ in case of being stated impact ofsource. It is used ‘‘�’’ in the event of not being or little being stated impact of source. It isexamined whether or not there is only an impact of source. Therefore, marks in the tableare relative [46].
5.1. Hydropower
Hydropower dams can cause several environmental problems, even though they burn nofuel. Damming rivers may destroy or disrupt wildlife and natural resources. Fish, for one,may no longer be able to swim upstream. Damming a river can alter the amount andquality of water in the river downstream of the dam, as well as preventing fish frommigrating upstream to spawn. These impacts can be reduced by requiring minimum flowsdownstream of a dam, and by creating fish ladders which allow fish to move upstream pastthe dam [47]. Hydro plant operations may also affect water quality by churning updissolved metals that may have been deposited by industry long ago. Hydropoweroperations may increase silting, change water temperatures, and lower the levels of
Table 18
Environmental impacts as source type [46]
Source Contribution into
emissions, air
pollution, and
climate change
Contribution into
water pollution
and watery areas
Waste Visual
impacts
Noise Impacts
on habitat
and living
life
Fossil fuels + + + � + +
Solar � � � + � �
Wind � � � + + +
Geothermal � + � � + +
Hydrogen � + � � � �
Ocean-wave � + � + + +
Biomass + � + + � +
ARTICLE IN PRESSA. Akpınar et al. / Renewable and Sustainable Energy Reviews 12 (2008) 2013–2039 2033
dissolved oxygen. Some of these problems can be managed by constructing fish ladders,dredging the silt, and carefully regulating plant operations.
Hydropower has advantages, too. Hydropower’s fuel supply (flowing water) is clean andis renewed yearly by snow and rainfall. Furthermore, hydro plants do not emit pollutantsinto the air because they burn no fuel. With growing concern over greenhouse gasemissions and increased demand for electricity, hydropower may become more importantin the future. Hydropower facilities offer a range of additional benefits. Many dams areused to control flooding and regulate water supply, and reservoirs provide lakes forrecreational purposes, such as boating and fishing [48].
The most obvious impact of hydroelectric dams is the flooding of vast areas of land,much of it previously forested or used for agriculture. The size of reservoirs created can beextremely large. Reservoirs can be used for ensuring adequate water supplies, providingirrigation, and recreation; but in several cases they have flooded the homelands of nativepeoples, whose way of life has then been destroyed. Many rare ecosystems are alsothreatened by hydroelectric development [47].
Finally, a dam produces impacts on the river ecosystems that affect the fauna and theflora in the river region. In the dam area, the following impacts can occur: loss of habitatsand biodiversity; loss of aquatic vegetation; decrease of water quality; loss of fishcommunities; alteration of the landscape; accumulation of sediments in the reservoir andorganic material accumulation. In down- and up-river areas, the following impacts canoccur: habitat fragmentation; decrease of water quality; obstruction of the fishes migratorymovements; organic material transport; sediments transports; seasonal fluctuations of thewater column and daily fluctuations of the water column [49].
5.2. Geothermal energy
Geothermal fluids contain a variable quantity of gas—largely nitrogen and carbondioxide with some hydrogen sulphide and smaller proportions of ammonia, mercury,radon, and boron. The amounts depend on the geological conditions of different fields.Most of the chemicals are concentrated in the disposal water, routinely re-injected into drillholes, and thus not released into the environment. The concentrations of the gases areusually not harmful, and the removal of such gases as hydrogen sulphide from geothermalsteam is a routine matter in geothermal power stations where the gas content is high. Therange in carbon dioxide emissions from high-temperature geothermal fields used forelectricity production in the world is 13–380 g kWh, less than for fossil fuel power stations.Sulphur emissions are also significantly less for geothermal than fossil fuel electric powerstations.
The gas emissions from low-temperature geothermal resources are normally only afraction of the emissions from the high-temperature fields used for electricity production.The carbon dioxide content is lower than that of the cold groundwater. In sedimentarybasins, the gas content may be too high to be released. In such cases the geothermal fluid iskept at pressure within a closed circuit (the geothermal doublet) and re-injected into thereservoir without any degassing. Conventional geothermal schemes in sedimentary basinscommonly produce brines that are generally re-injected into the reservoir and thus neverreleased into the environment. The carbon dioxide emission from these is thus zero [8].In addition, geothermal power plants require relatively little land, taking up only afraction of that needed by other energy sources. Other land uses can mingle with
ARTICLE IN PRESSA. Akpınar et al. / Renewable and Sustainable Energy Reviews 12 (2008) 2013–20392034
geothermal plants with little interference or fear of accidents. Geothermal facilities haveneither huge piles of ash, nor slag, nor bags of radiation-tainted sulphur to contend with.Containment barriers associated with most fossil-fuelled power plants are non-existent incurrent designs [50].Discharge of wastewater is also a potential source of chemical pollution. Spent
geothermal fluids with high concentrations of chemicals such as boron, fluoride or arsenicshould be treated, and/or re-injected into the reservoir. However, the low-to-moderatetemperature geothermal fluids used in most direct-use applications generally contain lowlevels of chemicals and the discharge of spent geothermal fluids is seldom a major problem.Sometimes these fluids can be discharged into surface water after cooling. The water canthen be cooled in special storage ponds or tanks to avoid modifying the ecosystems ofnatural bodies of water.Geothermal plants produce noise pollution during construction, e.g. by drilling of wells
and the escape of high-pressure steam during testing. Noise is usually negligible duringoperation with direct-heat applications. However, electricity generation plants producesome noise from the cooling tower fans, the steam ejector and the turbine. Geothermalplants are often located in areas of high scenic value, where the appearance of the plant isimportant. Fortunately, geothermal power plants take up little area and, with carefuldesign they can blend well into the surrounding environment. Wet cooling towers at plantscan produce plumes of water vapour, which some people find unsightly. In such cases,air-cooled condensers can be used [27].
5.3. Biomass energy
Several environmental impacts are directly related to biomass energy production andconsumption. The first is obviously the environmental benefit of displacing fossil fuel usageand a reduction in any adverse environmental impacts that are caused by fossil fuelconsumption. In addition, the use of a fossil fuel and biomass together in certainapplications, such as electric power generation with coal and wood or coal and refuse-derived fuel in dual-fuel combustion or cocombustion plants, can result in reduction ofundesirable emissions. The substitution of fossil fuels and their derivatives by biomass andbiofuels also helps to conserve depletable fossil fuels. Another beneficial environmentalimpact results from the combined application of waste biomass disposal and energyrecovery technologies. Examples are biogas recovery from the treatment of biosolids inmunicipal wastewater treatment plants by anaerobic digestion, landfill gas recovery frommunicipal solid waste landfills etc. [51].In terms of air pollutants, biomass feedstocks can offer improvements relative to fossil
fuels. Biomass is naturally low in sulphur and therefore, when burned, generates low SO2
emissions. However, if burned in the open air, some biomass feedstocks would emitrelatively high levels of NOx (given the high nitrogen content of plant material), CO, andparticulates. Fortunately, emissions control equipment exists to reduce the amount of eachof these pollutants into the atmosphere. Therefore, the air pollution impact of biopowerplants will depend upon whether or not facilities have installed devices such as selectivecatalytic reduction equipment (for NOx), electrostatic precipitators (for particulates), andcatalytic oxidizers (for volatile organic compounds, CO, and NOx). Finally, some formsbiomass may release toxins such as dioxins and heavy metals if the feedstock iscontaminated. For instance, organic municipal solid waste could contain inorganic
ARTICLE IN PRESSA. Akpınar et al. / Renewable and Sustainable Energy Reviews 12 (2008) 2013–2039 2035
materials such as plastics. Urban waste wood may not be clean, containing wood that hasbeen treated with resins and varnishes [52].
The abundant use of fertilizers and manure in agriculture has led to considerableenvironmental problems in various regions: nitrification of groundwater, saturation ofsoils with phosphate, eutrophication, and unportable water. Phosphates have alsoincreased the heavy metal flux of the soil. But energy farming with short rotation forestryand perennial grasses requires less fertilizer than conventional agriculture. With perennials,better recycling of nutrients is obtained. The leaching of nitrogen for willow cultivation canbe a half to a tenth that for food crops, meeting stringent standards for groundwaterprotection. The use of plantation biomass will result in removal of nutrients from the soilthat have to be replenished in one way or the other [8]. The natural humus and deadorganic matter in the forest soils is a large reservoir of carbon as well. Conversion ofnatural ecosystems to managed energy plantations could result in a release of carbon fromthe soil as a result of the accelerated decay of organic matter [53]. Landscaping andmanaging biomass production systems can considerably reduce the risks of fire anddisease. Thus they deserve more attention in coming projects, policies, and research [8].
The final environmental impact associated with the use of fuel wood is that of land use.Wood energy plantations may displace natural forest ecosystems or land which could beused for food production. Single species ‘‘monocultures’’ of trees do not provide habitatfor many other species of plant and animals and are highly susceptible to damage fromdisease and insects. This may also results in increased use of pesticides in these plantations,with their environmental and health problems [53].
5.4. Solar energy
Solar energy technologies provide obvious environmental advantages in comparison tothe conventional energy sources, thus contributing to the sustainable development ofhuman activities. Not counting the depletion of the exhausted natural resources, their mainadvantage is related to the reduced CO2 emissions, and, normally, absence of any airemissions or waste products during their operation.
Concerning the environment, the use of solar energy technologies has additional positiveimplications such as: reduction of the emissions of the greenhouse gases (mainly CO2,NOx) and prevention of toxic gas emissions (SO2, particulates); reclamation of degradedland; reduction of the required transmission lines of the electricity grids; and improvementof the quality of water resources. In regard the socio-economic viewpoint the benefits ofthe exploitation of solar energy technologies comprise: increase of the regional/nationalenergy independency; provision of significant work opportunities; diversification andsecurity of energy supply; support of the deregulation of energy markets; and accelerationof the rural electrification in developing countries [54].
In environmental terms, PV, like other renewable technologies, can make an importantcontribution to governmental commitments made at the international summits on climatechange. Indeed environmental protection and ‘‘green’’ image are perhaps the main marketdrivers at the current time. PV has none of the pollutant emissions or environmental safetyconcerns associated with conventional power generation technologies. A growing numberof energy consumers are willing to pay a premium for PV based purely on itsenvironmental added values, while many national governments are increasingly offeringincentives to promote the uptake of solar electricity amongst utility customers [55].
ARTICLE IN PRESSA. Akpınar et al. / Renewable and Sustainable Energy Reviews 12 (2008) 2013–20392036
5.5. Wind energy
Although wind energy is a clean technology, it is not free of impacts on the environment.Wind energy has a number of special features, including: more than one wind turbine isneeded for large-scale production; wind turbines are mainly located in remote and ruralareas where the wind resource is present; the turbines may be visible from a great distance;the movement of the blades may draw attention.As well as these visual impacts, wind energy is associated with other environmental
issues such as noise, land use and impacts during the construction phase. Some impacts,such as those on birds and flickering can be measured quantitatively; others, such asvisual intrusion and noise require more subjective and qualitative criteria [56]. The primaryenvironmental concerns with wind power are related to potential visual, auditory,locational and wildlife impacts of windfarm installations. However, these concernscan be addressed through proper sitting, public education, and the use of improvedtechnologies.Some are concerned by the visual impact of wind farms. On land, wind turbines are
located where the wind resource is best—typically in highly visible, exposed locations.Offshore wind parks, likewise, are usually situated within sight of the shore. In bothcases, the vertical towers and the motion of the rotors cause the wind turbines to becomefocal points in the landscape for observers close to the wind towers. Fortunately, newer,larger rotors rotate more slowly than their predecessors, and thus are less eye-catching.To further mitigate the visual impact of wind turbines they can be painted tomatch their surroundings. Some of the wind energy captured by wind turbines isunavoidably transformed into sound energy. Air moving by the rotors generatessound, though improvements in rotor technology have greatly diminished the amount ofsound produced in this way. Some sound may also emanate from the gearbox andgenerator, though sound absorbing materials are used to mitigate this. The apparentnoise level of a typical wind farm at 350m distance varies between 35 and 45 dB.This is similar to the noise level in the reading room of a library. Keep in mind that awind turbine produces no sound when it is not producing electricity, that is, below the‘‘cut-in’’ speed. Above this speed, the amount of sound increases as the wind speedincreases. Thus, wind farm noise will be partly masked by ambient noise, such as that fromthe wind rustling leaves or grasses. The sound also tends to be spread out across manyfrequencies, like white noise, further contributing to its unobtrusiveness. With properconsiderations for sound propagation, wind turbines can be sited to have negligible noiseimpacts.The environmental benefits of wind power are felt locally, regionally and globally.
Wind power can displace power from fossil fuel-powered plants, and therebyhelp to improve local air quality, mitigate regional effects such as acid rain, and reducegreenhouse gas emissions. Power plants emit pollutants as a by-product of powergeneration, but also may account for further emissions in connection with plantconstruction, operation, and decommissioning. For example, the mining and transportof fuel are themselves energy-intensive activities, with associated emissions andenvironmental impacts. Wind compares favourably to traditional power generationon this metric as well: lifecycle CO2 emissions per unit of power produced by awind farm are about 1% of that for coal plants and about 2% of that for natural gasfacilities [35].
ARTICLE IN PRESSA. Akpınar et al. / Renewable and Sustainable Energy Reviews 12 (2008) 2013–2039 2037
6. Conclusions
It is well known that the consumption of conventional energy sources resulted in seriousenvironmental pollution problems. Apart from that, fossil fuels are also facing the dangerof exhaustion. Turkey should increase the proportion of renewable energy sources in thetotal energy budget because Turkey is an importing country. On the other hand, domesticfossil fuels are limited and the economical condition of the country is not good. Thepresent study shows that there is an important potential to use renewable energy forTurkey. Especially hydraulic, biomass, geothermal, solar, and wind energy seem to be themost interesting domestic and clean energy sources. Therefore, the use of renewable energyresources shows a promising prospect in Turkey in the future as an alternative to theconventional energy.
Renewable energy technologies have the proven ability to offset increasing emissions ofcarbon dioxide and other greenhouse gas emissions. For any of these technologies toachieve importance, however, there must be supportive government policy. It must beincreased and sustained funding for development of these energy sources.
References
[1] Bent R, Bacher A, Thomas I. Energy; science, policy, and the pursuit of sustainability. In: Bent R, Orr L,
Baker R, editors. Rules of the game. Covelo, CA, USA: Island Press; 2002. p. 11–36.
[2] Kaygusuz K, Sarı A. Renewable energy potential and utilization in Turkey. Energy Convers Manage
2003;44:459–78.
[3] World Energy Council-Turkish National Committee (WEC-TNC). Energy statistics of the world and Turkey.
Proceedings of tenth energy congress of Turkey, 27–30 November, Ankara, Turkey; 2006 [in Turkish].
[4] Tunc- M, C- amdali U, Liman T, Deger A. Electrical energy consumption and production of Turkey versus
world. Energy Policy 2006;34:3284–92.
[5] Hepbas-lı A, Utlu Z. Evaluating the energy utilization efficiency of Turkey’s renewable energy sources during
2001. Renew Sustain Energy Rev 2004;8:237–55.
[6] Organisation for Economic Co-operation and Development/International Energy Agency (OECD/IEA).
Energy policies of IEA countries: Turkey 2005 review, Paris, France; 2005.
[7] Chang J, Leung DYC, Wu CZ, Yuan ZH. A review on the energy production, consumption, and prospect of
renewable energy in China. Renew Sustain Energy Rev 2003;7:453–68.
[8] Turkenburg WC. Renewable energy technologies. World energy assessment: energy and the challenge of
sustainability. /http://stone.undp.org/undpweb/seed/wea/pdfs/chapter14.pdfS.
[9] Hepbaslı A, Ozdamar A, Ozalp N. Present status and potential of renewable energy sources in Turkey.
Energy Sources 2001;23:631–48.
[10] General Directorate of State Hydraulic Works (DSI). From past to present DSI 1954–2004, Ankara, Turkey;
2004 [in Turkish].
[11] Kaygusuz K. Sustainable development of hydroelectric power. Energy Sources 2002;24:803–15.
[12] Unsal I. Turkey’s hydroelectric potential and energy policies. e-journal of strategy and analysis
(stradigma.com), Issue 6, July 2003.
[13] Bakır NN. Hydroelectric potential of Turkey and electricity generation politics from European Union
perspective; 2005. Available from /http://www.ere.com.trS [in Turkish].
[14] Yuksek O, Yuksel I, Komurcu MI, Kaygusuz K. The role of hydropower in meeting Turkey’s electric energy
demand. Energy Policy 2006;34:3093–103.
[15] The Electrical Power Resources Survey and Development Administration (EIE). Hydro electric power plant
projects carried out by EIE, February 2006. Ankara, Turkey; 2006 [in Turkish].
[16] Yuksek O, Kaygusuz K. Small hydropower plants as a new and renewable energy source. Energy Sources,
Part B Econ Plann Policy 2006;1:279–90.
[17] General Directorate of State Hydraulic Works (DSI). List of hydroelectric power plants projects. Ankara,
Turkey. Available from /http://www.dsi.gov.tr/skatablo/Tablo1.htmS [in Turkish].
ARTICLE IN PRESSA. Akpınar et al. / Renewable and Sustainable Energy Reviews 12 (2008) 2013–20392038
[18] Kaygusuz K, Kaygusuz A. Energy and sustainable development in Turkey. Part I: energy utilization and
sustainability. Energy Sources 2002;24:483–98.
[19] Acar HI. A review of geothermal energy in Turkey. Energy Sources 2003;25:1083–8.
[20] Kaygusuz K, Kaygusuz A. Renew energy and sustainable development in Turkey. Renew Energy 2002;
25:431–53.
[21] Lund JW, Freeston DH, Boyd TL. Direct application of geothermal energy: 2005 worldwide review.
Geothermics 2005;34:691–727.
[22] Fridleifsson IB. Geothermal energy for the benefit of the people. Renew Sustain Energy Rev 2001;5:
299–312.
[23] Altas- M, Ozkan HF, C- elebi E. Energy statistics of the year 2002. Proceedings of ninth energy congress of
Turkey, World Energy Council-Turkish National Committee (WEC-TNC), 24–27 September, Istanbul,
Turkey; 2003 [in Turkish].
[24] Geothermal Association of Turkey (GAT). Geothermal energy in Turkey. Available from /http://www.
jeotermaldernegi.org.tr/S [in Turkish].
[25] Akpınar A, Komurcu MI, Onsoy H, Kaygusuz K. Status of geothermal energy amongst Turkey’s energy
sources. Renew Sustain Energy Rev 2007; in press, doi:10.1016/j.rser.2006.10.016.
[26] Herzog AV, Lipman TE, Kammen DM. Renewable energy sources. The encyclopedia of life support systems
(EOLSS) forerunner volume ‘‘Perspectives and overview of life support systems and sustainable
development’’ part 4C. Energy resources science and technology issues in sustainable development.
Available from /http://www.eolss.comS.
[27] Organisation for Economic Co-operation and Development/International Energy Agency (OECD/IEA).
Renewables for power generation: status and prospects, Paris, France; 2003.
[28] Organisation for Economic Co-operation and Development/International Energy Agency (OECD/IEA).
Renewables information, 2005 ed., Paris, France; 2005.
[29] Organisation for Economic Co-operation and Development/International Energy Agency (OECD/IEA).
Energy statistics of OECD countries 2003–2004, Paris, France; 2006.
[30] Demirbas- A. The importance of biomass. Energy Sources 2004;26:361–6.
[31] Islam M, Fartaj A, Ting DS-K. Current utilization and future prospects of emerging renewable energy
applications in Canada. Renew Sustain Energy Rev 2004;8:493–519.
[32] Ediger VS- , Kentel E. Renewable energy potential as an alternative to fossil fuels in Turkey. Energy Convers
Manage 1999;40:743–55.
[33] Ogulata RT, Ogulata SN. Solar energy potential in Turkey. Energy Sources 2002;24:1055–64.
[34] Hepbas-lı A, Ulgen K, Eke R. Solar energy applications in Turkey. Energy Sources 2004;26:551–61.
[35] Reeves A, Beck F. Wind energy for electric power. A renewable energy policy project issue brief,
Washington, USA; 2003.
[36] Hepbas-lı A, Ozgener O. A review on the development of wind energy in Turkey. Renew Sustain Energy Rev
2004;8:257–76.
[37] Global Wind Energy Council (GWEC). Wind force 12 report 2005 (a blueprint to achieve 12% of the world’s
electricity from wind power by 2020), Brussels, Belgium.
[38] Ogulata RT. Energy sector and wind energy potential in Turkey. Renew Sustain Energy Rev 2003;7:
469–84.
[39] Yenici E. Bozcaada wind power plant: VI. National clean energy symposium (UTES’2006), 25–27 Mayıs,
Isparta, Turkey; 2006. p. 735–44 [in Turkish].
[40] El-Fadel M, Chedid R, Zeinati M, Hmaidan W. Mitigation energy-related GHG emissions through
renewable energy. Renew Energy 2003;28:1257–76.
[41] Tsai WT, Chou YH. Overview of environmental impacts, prospects and policies for renewable energy in
Taiwan. Renew Sustain Energy Rev 2005;9:119–47.
[42] Akc-asoy K, Onder F, Guven S. Statistical evaluation of greenhouse gas emissions of Turkey between the
years 1970 and 2010. State Institute of Statistics (DIE), Ankara, Turkey; 2000.
[43] Organisation for Economic Co-operation and Development/International Energy Agency (OECD/IEA).
CO2 emissions from fuel combustion 1971–2003, Paris, France; 2005.
[44] Lynch R. An energy overview of the republic of Turkey. US Department of Energy, Washington,
USA; 2003. Available from /http://www.geni.org/globalenergy/library/national_energy_grid/turkey/
EnergyOverviewofTurkey.shtmlS.
[45] Energy Information Administration (EIA). Turkey: environmental issues, July 2002. Available from /http://
www.eia.doe.gov/emeu/cabs/turkenv.htmlS.
ARTICLE IN PRESSA. Akpınar et al. / Renewable and Sustainable Energy Reviews 12 (2008) 2013–2039 2039
[46] Varınca KB, Gonullu MT. Environmental positif impacts of utilization of renewable energy sources:
VI. National clean energy symposium (UTES’2006), 25–27 Mayıs, Isparta, Turkey; 2006. p. 297–310
[in Turkish].
[47] Baird S. Hydro-electric power. Available from /http://www.ecology.com/archived-links/hydroelectric-energy/
index.htmlS.[48] Secondary Energy Infobook (SEI). Hydropower. Available from /http://www.need.org/needpdf/infobook_
activities/SecInfo/HydroS.pdfS.
[49] Almeida AT, Moura PS, Marques AS, Almeida JL. Multi-impact evaluation of new medium and large
hydropower plants in Portugal centre region. Renew Sustain Energy Rev 2005;9:149–67.
[50] Energy Information Administration (EIA). Environmental impacts of geothermal energy. Available from
/http://www.eia.doe.gov/cneaf/solar.renewables/renewable.energy.annual/appd.htmlS.
[51] Klass DL. Biomass for renewable energy and fuels. Encyclopedia of energy, vol. 1. Amsterdam: Elsevier Inc.;
2004.
[52] World Resources Institute (WRI). Biomass. Available from /http://www.thegreenpowergroup.org/
biomass.cfm?loc=usS.
[53] Demirbas- A. Bioenergy, global warning, and environmental impacts. Energy Sources 2004;26:225–36.
[54] Tsoutsos T, Frantzeskaki N, Gekas V. Environmental impacts from the solar energy technologies. Energy
Policy 2005;33:289–96.
[55] The European Photovoltaic Industry Association (EPIA). Solar electricity in 2010. Building on a decade of
industrial and political commitment, Brussels, Belgium; 2001.
[56] The European Wind Energy Association (EWEA). Wind energy: the facts. An analysis of wind energy in
the EU-25. Volume 1. Available from /http://www.ewea.org/fileadmin/ewea_documents/documents/
publications/WETF/Facts_Volume_1.pdfS.


