Embed Size (px)
Citation preview

Protein Adsorption at the Electrified Air−Water Interface:Implications on Foam StabilityKathrin Engelhardt,† Armin Rumpel,†,‡ Johannes Walter,† Jannika Dombrowski,§ Ulrich Kulozik,§
Bjorn Braunschweig,† and Wolfgang Peukert*,†,‡
†Institute of Particle Technology (LFG), University of Erlangen-Nuremberg, Cauerstrasse 4, 91058 Erlangen, Germany‡Erlangen Graduate School in Advanced Optical Technologies (SAOT), University of Erlangen-Nuremberg, Paul-Gordan-Strasse 6,91052 Erlangen, Germany§Chair for Food Process Engineering and Dairy Technology, Research Center for Nutrition and Food Sciences (ZIEL) − DepartmentTechnology, Technische Universitat Munchen, Freising-Weihenstephan, Germany
ABSTRACT: The surface chemistry of ions, water molecules,and proteins as well as their ability to form stable networks infoams can influence and control macroscopic properties suchas taste and texture of dairy products considerably. Despite thesignificant relevance of protein adsorption at liquid interfaces,a molecular level understanding on the arrangement ofproteins at interfaces and their interactions has been elusive.Therefore, we have addressed the adsorption of the modelprotein bovine serum albumin (BSA) at the air−waterinterface with vibrational sum-frequency generation (SFG) and ellipsometry. SFG provides specific information on thecomposition and average orientation of molecules at interfaces, while complementary information on the thickness of theadsorbed layer can be obtained with ellipsometry. Adsorption of charged BSA proteins at the water surface leads to an electrifiedinterface, pH dependent charging, and electric field-induced polar ordering of interfacial H2O and BSA. Varying the bulk pH ofprotein solutions changes the intensities of the protein related vibrational bands substantially, while dramatic changes invibrational bands of interfacial H2O are simultaneously observed. These observations have allowed us to determine the isoelectricpoint of BSA directly at the electrolyte−air interface for the first time. BSA covered air−water interfaces with a pH near theisoelectric point form an amorphous network of possibly agglomerated BSA proteins. Finally, we provide a direct correlation ofthe molecular structure of BSA interfaces with foam stability and new information on the link between microscopic properties ofBSA at water surfaces and macroscopic properties such as the stability of protein foams.
■ INTRODUCTIONFoams are materials of particular importance since they areapplied in a broad range of applications such as metal foams forlightweight structures,1 polymer foams for thermal insulation orfoams in food products, just to mention a few. Although thechemical composition of these foams is largely different, theyshare common similarities for foam formation and stabilization.The latter is controlled by adsorption processes at the interfacebetween the gaseous and the surrounding solid or liquid phase.Therefore, it is of great importance to understand foamstabilization processes at interfaces in order to design advancedmaterials with tunable properties.2 Stabilization of proteinfoams is dominated by a molecular layer at the interface whichcan be controlled experimentally.3−6 For that reason, proteinfoams represent a model system for mechanistic studies offoams and investigations on the origin that causes a liquid tofoam. Hence, hierarchical studies of the relationship betweenmolecular structure and interactions, interface design andmacroscopic properties, has become an important part ofcurrent research in this field.7−9 A detailed molecular levelunderstanding of the surface chemistry of proteins at liquidinterfaces has, however, not been established.
In order to reveal the interactions of proteins at interfaces,information on the interfacial composition, for example, thearrangement of ions and water molecules in the adjacentelectrolyte subphase, possible protein unfolding processes, andthe formation of single or multilayers, is imperative.10−13 Thephysical and chemical stability of proteins is influenced bydifferent factors such as temperature, chemical composition ofthe electrolyte, and the pH of the bulk electrolyte.14 While itseems to be accepted that structural rearrangement of proteinsdue to the adsorption to the interface can occur,15−18 the extentof unfolding or surface aggregation and a possible reversibilityof this process are still a matter of considerable debate.9,19,20
The lack of molecular level information is mainly due to alack of suitable experimental techniques that can actually revealboth composition as well as conformation of protein adlayersand other interfacial molecules such as H2O. In previousstudies, it was already shown that sum-frequency generation(SFG) is a powerful optical probe for the investigation of
Received: April 3, 2012Revised: April 23, 2012Published: April 24, 2012
Article
pubs.acs.org/Langmuir
© 2012 American Chemical Society 7780 dx.doi.org/10.1021/la301368v | Langmuir 2012, 28, 7780−7787

protein interfaces.21−26 Wang et al.27 reported the pHdependent charging of bovine serum albumin (BSA) at theair−liquid interface where the influence of pH on the SFGspectra in the region of methyl and OH stretching vibrationswas attributed to a charge reversal of interfacial BSA. As thesurface charge of the proteins is affected by the electrolyte pH,it leads to a strong electric field and, consequently, to theformation of an electric double layer at the protein surface. Thelocal electric field of proteins and its effects on the surroundingelectrolyte layer is minimized at a pH where the net charge ofthe protein with bound ions is zero.28 Obviously, this point is ofgreat scientific interest as it is protein specific and is a functionof the amino acid sequence at the protein surface. Although theisoelectric point of proteins in the bulk electrolyte can bedetermined by zeta potential measurements, the conditions atelectrolyte interfaces can be dramatically different from those inthe bulk. The concentrations of proteins, ions, and watermolecules as well as their lateral interactions may be modifiedsignificantly at an interface. Consequently, it is a priori not clearif the isoelectric points of proteins at interfaces and in bulkelectrolytes are identical.In order to reveal the intriguing relationship between pH
dependent charging of a protein, protein adsorption, interfacialmolecular structure, and macroscopic properties such as foamstability, we have studied the model protein BSA at theelectrified air−water interface with broadband SFG, ellipsom-etry, and a macroscopic analysis of the foam stability. Thishierarchical approach has enabled us to determine theinterfacial isoelectric point as well as the structure of BSAlayers adsorbed to the electrolyte−air interface. Newinformation on the link between microscopic properties ofBSA at interfaces and macroscopic properties such as thestability of foams from BSA solutions is provided.
■ EXPERIMENTAL SECTIONSample Preparation. BSA (essentially acid free) was purchased
from Sigma Aldrich (A7030) and was used as-received. BSA solutions(15 μM for spectroscopic measurements, 150 μM for zeta potentialmeasurements) were prepared by dissolving the dry protein inultrapure water (18.2 MΩ cm−1; total oxidizable carbon < 10 ppb).The pH was adjusted by adding either HCl (Merck; Suprapur grade)or NaOH (99.99%; Alfa Aesar) and measured with an InLab MicroPro pH electrode (Mettler Toledo). In order to remove possiblecontaminations, the necessary glassware was soaked in a mixture ofconcentrated sulfuric acid (98%; analytical grade) and NOCHROMIXfor at least 24 h, thoroughly rinsed with ultrapure water, andsubsequently cleaned in boiling ultrapure water. All measurementswere performed at a temperature of 24 °C.Zeta Potential Measurements. Zeta potentials were measured
with a commercial Zetasizer Nano ZS instrument (Malvern Instru-ments). The pH of 150 μM BSA aqueous solutions was adjusted byadding either acid or base. The samples were filtered using 0.2 μmcellulose acetate filters (VWR 514-0060) and thoroughly cleaned glasssyringes before transferring them into the cuvette. For every datapoint, at least four measurements with four different cuvettes wereperformed. For good and reproducible zeta potential measurements, aminimum BSA concentration of approximately 150 μM is needed. Forthat reason, 10-fold higher BSA concentrations have been chosen formeasurements of the bulk zeta potential compared to ellipsometry andSFG measurements at air−water interfaces.Ellipsometry. The thickness of adsorbed protein layers was
determined with a phase modulated ellipsometer (PicometerEllipsometer; Beaglehole Instruments) that was operated with awavelength of 632.8 nm. Phase modulated ellipsometry offers thepossibility to record data near or at the Brewster angle (∼55°) of thestudied system which increases the sensitivity considerably and enables
rapid acquisitions of experimental data compared to the conventionalnulling technique.29 For each experiment, 15 μM BSA sample solutionwas poured into a Petri dish with a diameter of 10 cm and was allowedto equilibrate for about 30 min. Angle scans between 51° and 55°versus the surface normal were performed with a step width of 0.5°. Inorder to ensure reproducibility, at least six measurements wererecorded and averaged for every pH value. Angle-resolved data fromellipsometry were fitted under the assumption of a three layer modelwith refractive indices of 1.33, 1.40,12 and 1.00 for the electrolytesubphase, the protein layer, and air, respectively. In general twoparameters are unknown in this three layer system: the thickness of theadsorbed protein layer and the corresponding refractive index. Due tothe fact that these parameters cannot be determined independently,one of them, for example, the refractive index, has to be chosen as afixed input parameter for all model calculations. Since the refractiveindex of BSA at an interface is unknown, the latter assumption causes asystematic error of the layer thickness that depends on the deviation ofthe assumed refractive index from its actual value. However, since weonly compare relative changes in the layer thickness as a function ofthe electrolyte pH, interpretations in this respect are not impaired.
Vibrational Sum-Frequency Generation (SFG). SFG is asecond-order nonlinear optical technique30 where two laser beamsare overlapped temporally and spatially at the interface of interest andgenerate photons with the sum frequency of the two impinging laserbeams. One laser has a frequency ωVIS in the visible region (800 nm),and the other laser is tunable in the infrared region with frequenciesωIR. The intensity of sum-frequency output I(ω) depends on theintensities of the impinging laser beams IVIS and IIR as well as on thenonresonant χNR
(2) and resonant χk(2) parts of the second-order nonlinear
susceptibility χ(2) as follows:
∑ω χ χ χφ
ω ω∝ + =
− + ΓI I I
A ii
( ) withexp( )
kNR(2)
k(2)
2
VIS IR k(2) k k
k k
(1)
The resonant contribution χk(2) depends on the amplitude Ak =
N⟨αkμk⟩, the relative phase φk, the resonance frequency ωk, and thebandwidth Γk of the vibrational mode k. The amplitude Ak is afunction of the molecular number density N at the interface and anorientational average of the Raman polarizability αk and the dynamicdipole moment μk. The latter dependence of Ak on the orientation ofmolecules at interfaces has far reaching consequences: SFG is notallowed in materials with centrosymmetry or isotropic materialswithout long-range order, that is, liquids and gases when the positionsof molecules are averaged over time. At interfaces, the bulk symmetryis necessarily broken and nonzero components of χ(2) solely from theinterface exist and give rise to surface sensitive SFG. A perfectly polar-ordered adlayer results in the highest amplitude and SFG intensity,while a layer with identical coverage, but randomly oriented interfacialmolecules, has negligible SFG intensity. Hence, SFG combines theadvantages of optical techniques with intrinsic surface/symmetrysensitivity and is a very powerful and highly versatile spectroscopic toolfor studies of surfaces and interfaces. However, most studies ofproteins at the air−water interface were limited to the methyl andwater stretching region27,31−34 which yields information about theinterfacial water structure but not about the protein amide I bandaround 1650 cm−1. For our SFG measurements a home builtbroadband SFG setup was applied, as described elsewhere.35 The setupenables us to tune the IR frequency and record the SFG intensity forIR frequencies which are within the bandwidth of a broadband IRpulse (200 cm−1). All spectra were recorded with s-polarized sum-frequency, s-polarized visible and p-polarized IR beams (ssp). Thepresented spectra were normalized to a reference spectrum of apolycrystalline Au sample that was previously subjected to oxygenplasma. The 15 μM BSA samples were poured in a Petri dish, and SFGspectra were collected. Each spectrum was measured by scanning thebroadband IR beam with a step width of 130 cm−1 and totalacquisition times of 7 and 8 min for 2800−3800 and 1300−1800 cm−1
spectral regions, respectively.
Langmuir Article
dx.doi.org/10.1021/la301368v | Langmuir 2012, 28, 7780−77877781
Foam Preparation and Characterization. Foaming experimentswere carried out with a commercial dynamic foam analyzer DFA 100(Kruss GmbH, Germany). Foams were produced in a glass column of0.25 m length and 0.04 m thickness by a stream of air that wasintroduced into the protein dilutions through a porous glass filter(pore size: 9−16 μm) with a constant flow rate of 5 mL/s.Experiments were performed in triplicates. According to Glaser etal.,36 stability and capacity are key parameters which can be used tocharacterize macroscopic foam properties. The foam capacity can bedetermined by the volume increase due to the foaming of the initialBSA dilution with a volume Vi of 40 mL. In our experiments the foamcapacity is given by the maximum (foam) volume (Vf) that is reachedafter 10 s of gas flow through the BSA dilution. Foam capacity [%] =(Vf − Vi)/Vi × 100. Subsequent to the formation, foam degradationgiven by the Foam stability [%] = (Vt=300s/Vt=0) × 100 was monitoredfor an additional 300 s.
■ RESULTSDetermination of the Bulk Zeta Potential. The zeta
potential is often used as stability parameter in colloidalchemistry whereby a potential larger than |30 mV| leads tostable suspensions.37 In contrast to this, the zeta potential ofproteins is determined to be mostly lower than |40 mV|28,38 andis often used to determine the isoelectric point.39 Theisoelectric point is defined as the point where the zeta potentialis equal to zero. At the isoelectric point, the protein carries nonet charge, while there is an excess of positive or negativecharge for pH values higher and lower than the pH of theisoelectric point, respectively. Previous studies of the BSA’sisoelectric point have shown that its exact determination isimpaired by the applied experimental method and thebackground electrolyte. For that reason it is not surprisingthat isoelectric points between pH 4.7 and 5.6 have beenreported.28
Figure 1 shows the zeta potential of BSA in a bulk solution asa function of the electrolyte pH. From a close inspection of
Figure 1, the pH of the isoelectric point of BSA can bedetermined to 5.2 ± 0.1. Although the isoelectric point of BSAcan be established in the bulk electrolyte, it is not a prioriknown whether the isoelectric points of bulk and surfaceregions are identical. In fact, the small electric charge of BSAnear or at the isoelectric points leads to very small repulsionbetween individual proteins and therefore to the tendency ofagglomeration and possibly to precipitation of BSA. Con-sequently, it is not clear if and how stable BSA layers canactually form at the air−water interface under these conditions.To study this effect further, we will show the pH dependent
behavior of surface adsorbed BSA layers in the followingsections.
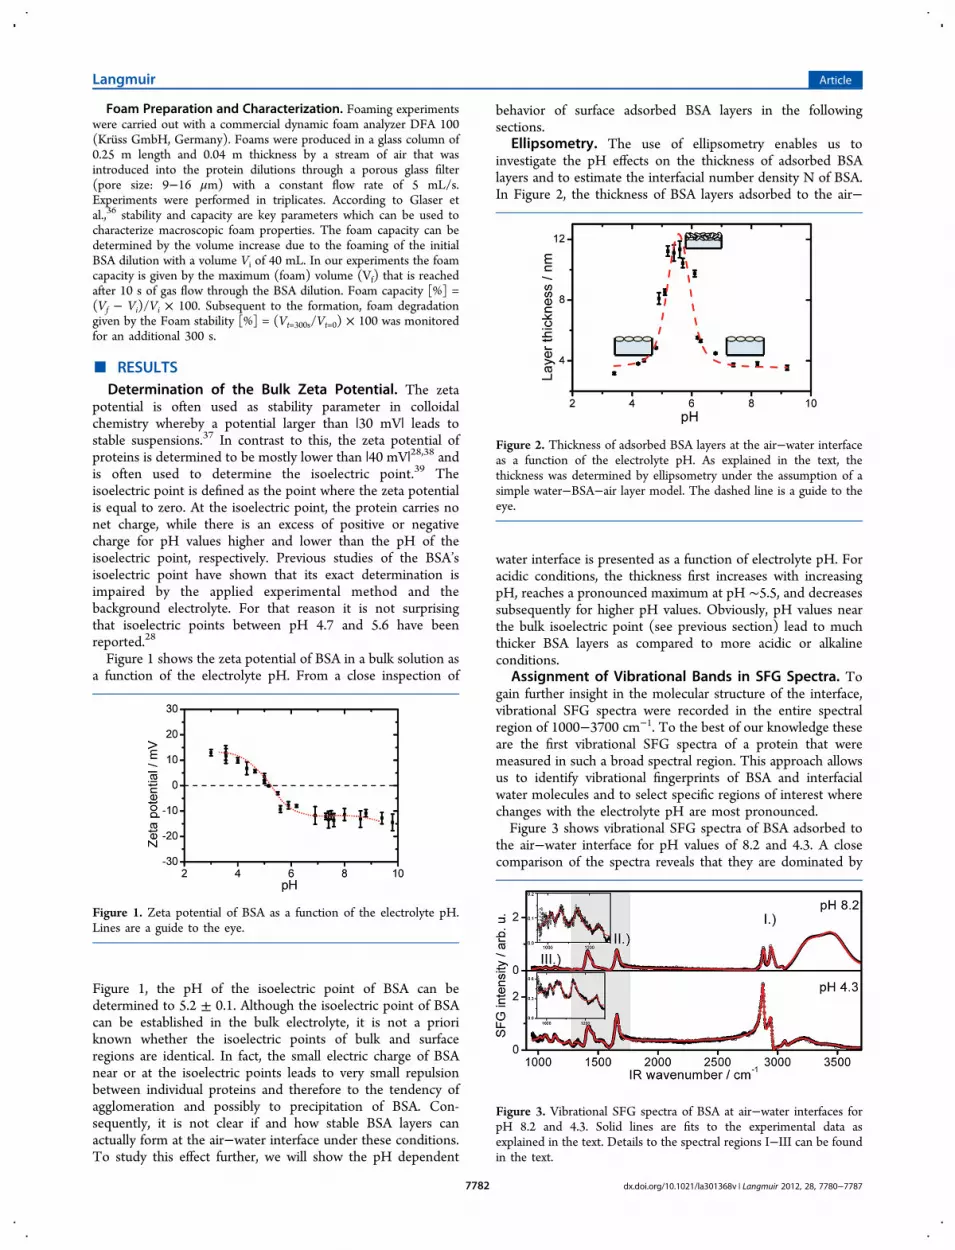
Ellipsometry. The use of ellipsometry enables us toinvestigate the pH effects on the thickness of adsorbed BSAlayers and to estimate the interfacial number density N of BSA.In Figure 2, the thickness of BSA layers adsorbed to the air−
water interface is presented as a function of electrolyte pH. Foracidic conditions, the thickness first increases with increasingpH, reaches a pronounced maximum at pH ∼5.5, and decreasessubsequently for higher pH values. Obviously, pH values nearthe bulk isoelectric point (see previous section) lead to muchthicker BSA layers as compared to more acidic or alkalineconditions.
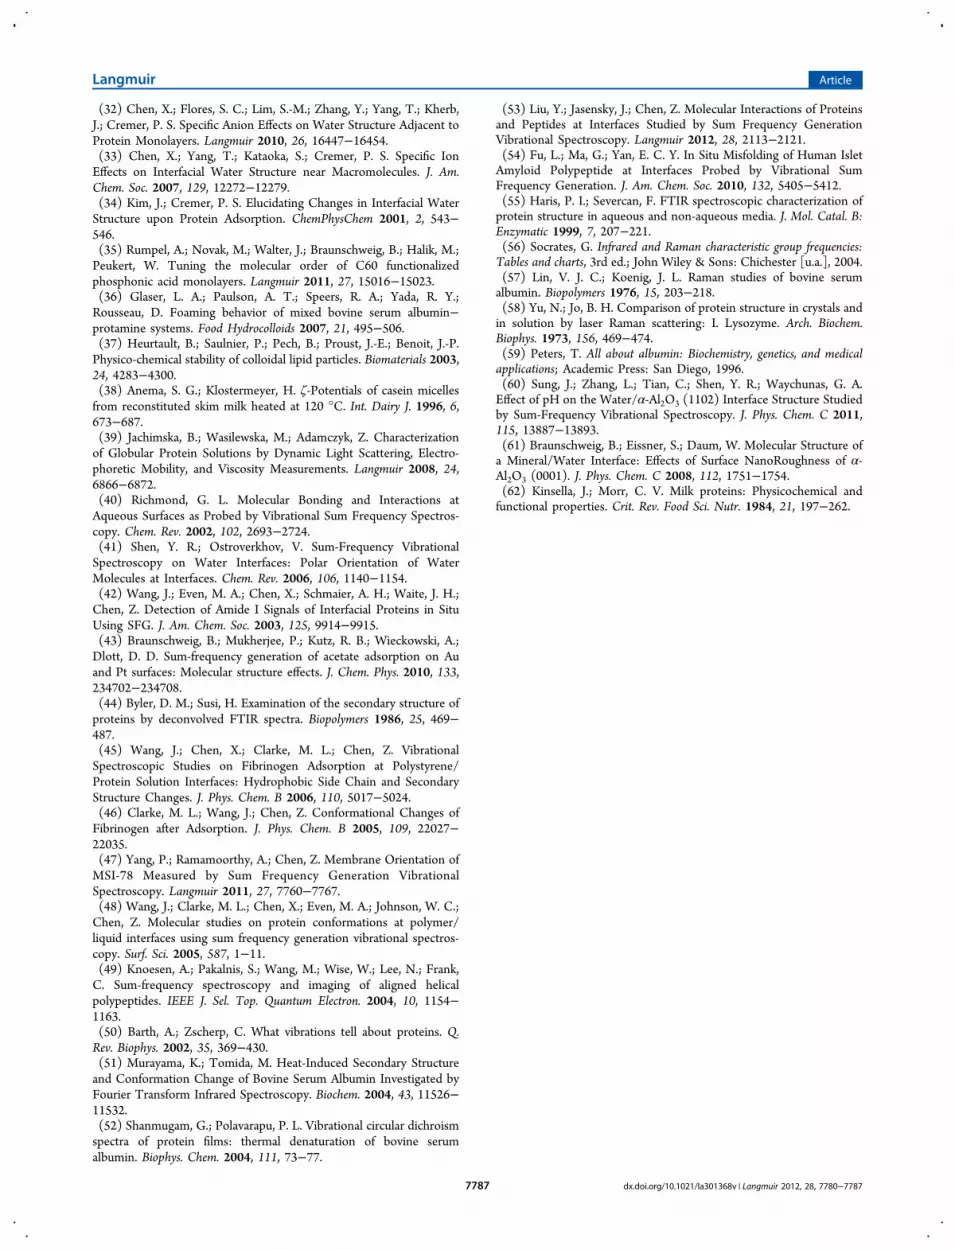
Assignment of Vibrational Bands in SFG Spectra. Togain further insight in the molecular structure of the interface,vibrational SFG spectra were recorded in the entire spectralregion of 1000−3700 cm−1. To the best of our knowledge theseare the first vibrational SFG spectra of a protein that weremeasured in such a broad spectral region. This approach allowsus to identify vibrational fingerprints of BSA and interfacialwater molecules and to select specific regions of interest wherechanges with the electrolyte pH are most pronounced.Figure 3 shows vibrational SFG spectra of BSA adsorbed to
the air−water interface for pH values of 8.2 and 4.3. A closecomparison of the spectra reveals that they are dominated by
Figure 1. Zeta potential of BSA as a function of the electrolyte pH.Lines are a guide to the eye.
Figure 2. Thickness of adsorbed BSA layers at the air−water interfaceas a function of the electrolyte pH. As explained in the text, thethickness was determined by ellipsometry under the assumption of asimple water−BSA−air layer model. The dashed line is a guide to theeye.
Figure 3. Vibrational SFG spectra of BSA at air−water interfaces forpH 8.2 and 4.3. Solid lines are fits to the experimental data asexplained in the text. Details to the spectral regions I−III can be foundin the text.
Langmuir Article
dx.doi.org/10.1021/la301368v | Langmuir 2012, 28, 7780−77877782

vibrational bands in unique spectral regions where substantialchanges as a function of the electrolyte pH can be observed:(I) Functional groups of adsorbed BSA give rise to strong
vibrational bands at ∼2875 and ∼2936 cm−1 that areattributable to CH3 symmetric stretching vibrations and tothe CH3 Fermi resonance, respectively. Furthermore, CH3asymmetric, symmetric CH2, and aromatic CH stretchingvibrations give rise to bands at 2964, 2850, and 3060 cm−1,respectively.27,31−33 Strong bands between 3100 and 3800 cm−1
originate from OH stretching vibrations of interfacial watermolecules.34,40,41
(II) In a second spectral region, additional vibrational bandsof interfacial BSA at ∼1654 and 1410 cm−1 are observed andcan be attributed to amide I and to carboxylate (R−COO−)symmetric stretching vibrations, respectively.42,43 The amide Iband originates from R−CO carbonyl vibrations ofmolecular groups in the protein backbone44−48 where theycan form hydrogen bonds to neighboring amide groups49,50
(Figure 4).
The strength of the hydrogen bonds influences the frequencyof the amide I band greatly and is, therefore, stronglydependent on the secondary structure of the protein. Inprevious IR studies, changes in the position of this band wereoften referred to denaturation, unfolding, or aggregationprocesses.51,52 Since BSA consists mainly of an α-helicalstructure, unfolding would lead to a blue shift in the amide Ifrequency. As was previously shown, the spectral frequencies ofamide I vibrations can be attributed to different secondarystructures42,53 and the kinetics of conformational changes wasalso resolved with SFG.54
At this point, it should be noted that the so-called amide IIband at ∼1550 cm−1 that can be observed with linear IRspectroscopy50,55 contributes only weakly to the SFG intensity.Prerequisite for an SFG active mode is both Raman as well asIR activity. Since the amide II mode does lead to weak Ramanresonances only,56 weak resonant SFG contributions from thisband are also likely. Furthermore, the amide II band is acombination of C−N stretch and N−H bending vibrations andhas a dynamic dipole moment that is perpendicular to thedipole moment of the amide I band (Figure 4). As a result, theintensity of this band is additionally weakened due to weakerexcitations with p polarized IR light.(III) In the spectral region below 1400 cm−1, a band
centered at ∼1250 cm−1 is observed and has been attributed toamide III vibrations.56,57 Three weak bands at ∼1140, ∼1070,and ∼1020 cm−1 are also observed in our spectra, which werelate to −C−O− stretching modes, N−H deformation, and
CH aromatic bending vibrations.58 Since substantial changes asa function of the bulk pH are observed for CH, OH, amide I,and carboxylate vibrations (Figure 3), we have focused furtherpH dependent studies to the latter vibrations. An overview ofthe SFG active BSA resonances relevant to the furtherdiscussion and their attribution to specific molecular vibrationscan be found in Table 1.
pH Dependence of the Interfacial Molecular Struc-ture. In order to reveal changes in the interfacial molecularstructure, SFG spectra of BSA adsorbed to the air−waterinterface were recorded and analyzed for pH values of 3−10.Figure 5 shows representative SFG spectra in this pH range.OH, CH, and amide I bands have strong pH dependencies. Inparticular, for the OH stretching bands of interfacial watermolecules, we observe dramatic changes in the SFG intensity(Figure 5b).At a pH of 5.5, the SFG intensity of the H2O bands is
negligible, but increases substantially for lower and higher pHvalues than 5.5. Similar but less pronounced behavior isobserved for the SFG intensity in the CH stretching region.Compared to the latter bands, BSA amide I and carboxylatemodes show much weaker changes in SFG intensity with thepH (Figure 5a). In order to analyze changes of SFG bands as afunction of pH, we have fitted our spectra with model functionsaccording to eq 1 and determined the amplitude of thevibrational bands in our SFG spectra. We have used theamplitude Ak, the resonance frequencies ωk, and the non-resonant contribution χNR
(2) as adjustable parameters in ourfitting procedures. Here, the overview spectra in Figure 3 areextremely helpful, since the nonresonant contribution and itsinfluence on the dispersion of the vibrational resonances can beeasily estimated.In Figure 6a, b, and c, the results of our fitting procedures are
presented for the amplitudes of amide I, carboxylate (R−COO−), and OH vibrations, respectively. The pH dependenceof the three amplitudes shows a local minimum around pH 5.While the amplitudes of amide I and carboxylate bands have anarrow minimum at pH 5 and are only slightly smaller for morealkaline than for acidic pH values, the amplitude of OHvibrations is also minimal at pH 5, but varies in a much broaderpH range. Nearly all carboxyl groups with a pK of 4.3 from theamino acid side chains of BSA59 are deprotonated in thestudied pH range and exist as carboxylates. This causes theamplitudes of the R−COO− vibration to stay nearly constant.However, since the density of these groups at the interface
Figure 4. Schematic representation of amide groups and their localorientation in a protein with an α-helix secondary structure.
Table 1. Assignment of Vibrational Bands in SFG Spectra ofBSA Adsorbed to the Air−Water Interfacea
band [cm−1] ref
amide III 1250 57COO− (ss) 1410 43amide II 1550 50amide I 1650 48, 53CH2 (ss) 2850 31−33CH3 (ss) 2875 31−33CH3 (F) 2936 31−33arom. CH 3060 31−33OH (ss) 3200 40, 41OH (ss) 3450 40, 41
a(F), (ss), and (as) stand for Fermi resonance, symmetric, andantisymmetric stretching vibrations, respectively.
Langmuir Article
dx.doi.org/10.1021/la301368v | Langmuir 2012, 28, 7780−77877783

increases (Figure 2), the observed change in SFG amplitude is asignature of a decrease in interfacial polar order that will bediscussed in more detail in the following section.The vibrational band of interfacial H2O shows a dramatic
decrease in amplitude for pH 3−5 with a subsequent dramaticincrease of almost 1 order of magnitude (Figure 6c). However,not only the amplitudes of the vibrational bands change, butthere is also a notable change in the polarity of the band at∼3060 cm−1 due to aromatic CH stretching vibrations. At pH <5, this band appears as a positive going feature, while for pH >5 a negative going feature is observed (Figure 5b). Thesechanges are not directly related to the ∼3060 cm−1 band but toa change in the orientation of the interfacial water molecules.The phases of the broad OH stretching bands are rotated by180°, and according to eq 1 the spectral interference of H2Oand CH bands is altered. The change in the average orientationof the interfacial water molecules points to a charge reversal ofthe interface and, consequently, to a reversal of the electric fieldthat causes the polar ordering of H2O at the interface. Thisresult confirms previous SFG studies of BSA adsorption byWang et al.27
■ DISCUSSIONWe will now compare the observed pH effects of adsorbed BSAadlayers from ellipsometry with SFG measurements and thezeta potential of BSA in the bulk electrolyte. It is obvious thatthe bulk isoelectric point of BSA at pH 5.2 with a zeta potentialequal to zero (Figure 1) clearly corresponds to a minimum inSFG amplitudes of the BSA and interfacial H2O related bands(Figure 6), but to a maximum in the thickness of adsorbed BSAadlayers (Figure 2). In fact, our ellipsometry results indicate thepresence of multilayers for pH values near the bulk isoelectricpoint and are in agreement with previous neutron reflectionstudies of BSA at air−water interfaces. In their report, Lu et al.have estimated the adsorbate thickness to approximately 7 nmand a reduced thickness of approximately 4 nm for pH valueshigher or lower than the bulk isoelectric point.11 Modeling thegeometric dimensions of BSA by a simple incompressibleellipsoid, thicknesses of ∼4 nm in Figure 2 point to amonolayer of adsorbed BSA proteins with their long axisoriented parallel to the interface.12 Threefold thicker layers at apH near 5 are also observed (Figure 2) and suggest theformation of multilayers. Although we observe a seemingly
Figure 5. Vibrational SFG spectra of BSA at air−water interfaces as afunction of the electrolyte pH: (a) Symmetric carboxylate (R-COO−)and amide I bands and (b) CH and OH stretching bands as explainedin the text (Table 1). The pH was as indicated in the figure. Solid linesare fits to the experimental data according to eq 1. The color scalerepresents schematically the interfacial charge density as a function ofthe pH.
Figure 6. pH dependence of the amide I (a) and carboxylate R−COO− (b) vibrational amplitude in arbitrary units. (c) Amplitude ofOH stretching vibrations at 3200 cm−1 (black solid square) and 3400cm−1 (red solid triangle). Dotted Lines are guide to the eye.
Langmuir Article
dx.doi.org/10.1021/la301368v | Langmuir 2012, 28, 7780−77877784

opposite behavior of SFG amplitudes and adsorbate thickness,it can be concluded that the isoelectric points of bulk andinterfacial BSA proteins are identical. pH values at theisoelectric point of the interface lead to a highly disorderedelectrolyte subphase and BSA (multi)layers with a low degreeof order:We recall that the SFG amplitude Ak is dependent on both
the number density of interfacial molecules and their molecularorder. In the present case, the contribution of the numberdensity to the SFG amplitudes is only minor otherwise theamplitude should reach a maximum at a pH where thethickness of the BSA adlayer is also maximal. Since we observethe opposite, signals in SFG spectra must be dominated by theinterfacial molecular order. At a pH near the bulk isoelectricpoint, the net charge of BSA proteins is negligible and amacroscopic electric field at the interface is absent. As the pHincreases or decreases with respect to the isoelectric point ofBSA, the charge density and, consequently, the electric field ofthe interface increase. As a result, polar ordering of interfacialwater molecules and BSA is induced by the interfacial electricfield. Further support for this hypothesis comes from SFGexperiments at electrified oxide interfaces where electric field-induced polar ordering of interfacial water molecules wasshown.40,41,60,61
Observations of field induced polar ordering in vibrationalSFG are, consequently, directly related to the strength of theinterfacial electric field and allow an estimate of the isoelectricpoint of the interface. At this point, it should be noted thatelectrokinetic zeta potential measurements and SFG spectros-copy actually probe different physical properties which,however, have their physical origin both in the chargedistribution at the surface. The zeta potential refers to theelectric potential at the hydrodynamic shear (or slipping) plane.The slipping plane separates ions (if present) and solventmolecules which travel with the migrating protein from those inthe diffuse layer that do not travel with the charged protein inan external electric field. In contrast, SFG probes the averageorientation of molecules within the interfacial electric field.Since the amide I band originates from molecular groups in theinterior of the protein (see above), pH effects on polar orderingmust be related to the net charge of the protein surface which isalso determined by the charge of possible bound counterions inthe adjacent Stern layer. The physical origins of polar orderingas seen in SFG and in the zeta potential are, thus, identical. Theremarkable resemblance of amide I, carboxylate (R−COO−),and OH amplitudes in Figure 6 also signifies a similar origin forthe latter bands.For pH values near the isoelectric point, BSA adsorption is
controlled by a gain in entropy and the formation of attractivenoncovalent interactions such as van der Waals forces andhydrogen bonds of the BSA hydration shell. The situation isdifferent for pH values of <4.6 and >6.7 where electrostaticforces dominate and lead to a polar ordered BSA monolayer. Inorder to establish multiple BSA layers at the interface, thelateral interactions between individual BSA proteins have to beattractive. In fact, the absence of a strong electric charge at theBSA surface, as it is suggested by the zeta potential of BSA inthe bulk, leads to weak repulsive electrostatic interactions andconsequently to an agglomerated BSA adlayer. At the isoelectricpoint, the orientation of adsorbed BSA is, however, notcompletely random since the nonzero SFG amplitudes of amideI and carboxylate vibrations indicate that to some extent apreferential orientation of BSA is maintained. This observation
can be rationalized in terms of hydrophilic−hydrophobicinteractions, where the hydrophobic parts of the BSA proteinstend to protrude into the gas phase. In contrast to the proteinlayer, the interfacial water molecules are highly disordered andlead to negligible SFG amplitudes (Figure 6c).Having established the interfacial molecular structure, we can
now deduce (to some extent) macroscopic properties such asfoam stability and foam capacity. Prerequisite for good foamformation is a fast diffusion of the proteins to the interface,where they can build a viscoelastic adsorbed layer around thegas bubbles and prevent destabilization of the foam lamella.62
As we have shown, at the interfacial isoelectric point of BSA, anetwork of agglomerated proteins is formed and held togetherby weak attractive forces, while at a pH more alkaline or moreacidic than the isoelectric point BSA forms monolayers withrepulsive interactions. It is therefore likely that producing BSAfoams at the isoelectric point will lead to foams with higherstability.We have tested this hypothesis with macroscopic foams from
BSA dilutions. The results for foam capacity, which describesthe ability of a protein solution to enclose air, and foam stabilitymeasurements are shown in Figure 7a and b, respectively. Both
the foam capacity and stability show a clear maximum aroundpH 5 (Figure 7). Obviously, a network of agglomerated proteinmultilayers can encapsulate the air and prevent the foam fromdrainage much more efficiently than ordered proteinmonolayers with repulsive interactions.
■ SUMMARY AND CONCLUSIONNew information on molecular processes at interfaces andmacroscopic phenomena of soft matter is provided. For thatpurpose, we have addressed the surface chemistry of the proteinbovine serum albumin (BSA) at the air−water interface and theeffect of pH. Combining ellipsometry and broadband sum-frequency generation (SFG) has allowed us to reveal themolecular composition and molecular order of BSA adlayersand the electrolyte subphase in unprecedented detail. pHdependent charging of BSA leads to the formation of electrifiedinterfaces and to polar ordering of interfacial BSA and H2O.Using the latter as a measure of the electric field at the interface,
Figure 7. Foam capacity (a) and stability (b) as a function of pH.Lines are a guide to the eye.
Langmuir Article
dx.doi.org/10.1021/la301368v | Langmuir 2012, 28, 7780−77877785

we have deduced the isoelectric point of BSA at air−waterinterfaces to pH ∼ 5, which is close to that of bulk BSA. Themolecular level information presented in this study can explainthe high foam stability around pH 5, which was determined inadditional experiments: Around pH 5, disordered multilayersare present at the interface and form an agglomerated networkof BSA proteins that can be used to form macroscopic foamswith excellent stability. Here, BSA agglomerates stabilize gasbubbles at the ubiquitous air−water interface extremelyefficiently and prevent the foam from drainage. For pH valuessmaller or larger than the isoelectric point, BSA monolayerswith repulsive interactions are formed and lead to a decreasedstability of BSA foams.
■ AUTHOR INFORMATIONCorresponding Author*E-mail: [email protected].
NotesThe authors declare no competing financial interest.
■ ACKNOWLEDGMENTSThe authors gratefully acknowledge funding of the ErlangenGraduate School in Advanced Optical Technologies (SAOT)and by the German National Science Foundation (DFG)through the Leibniz program and project PE427/21-1. B.B. isgrateful for support by the Alexander von Humboldtfoundation and a Feodor Lynen fellowship. J.D. is grateful forsupport by the German Ministry of Economics and Technology(via AiF) and the FEI (Forschungskreis der Ernahrungsindus-trie e. V., Bonn), project AiF 17124 N.
■ REFERENCES(1) Lefebvre, L.-P.; Banhart, J.; Dunand, D. C. Porous Metals andMetallic Foams: Current Status and Recent Developments. Adv. Eng.Mater. 2008, 10, 775−787.(2) Fameau, A.-L.; Saint-Jalmes, A.; Cousin, F.; Houinsou-Houssou,B.; Novales, B.; Navailles, L.; Nallet, F.; Gaillard, C.; Boue, F.; Douliez,J.-P. Smart Foams: Switching Reversibly between Ultrastable andUnstable Foams. Angew. Chem. 2011, 123, 8414−8419.(3) Mezzenga, R.; Schurtenberger, P.; Burbidge, A.; Michel, M.Understanding foods as soft materials. Nat. Mater. 2005, 4, 729−740.(4) Schramm, L. L. Emulsions, foams, and suspensions: Fundamentaland applications; Wiley-VCH Verlag GmbH & Co. KGaA: Weinheim,2005.(5) Townsend, A.-A.; Nakai, S. Relationships Between Hydro-phobicity and Foaming Characteristics of Food Proteins. J. Food Sci.1983, 48, 588−594.(6) Foegeding, E. A.; Luck, P. J.; Davis, J. P. Factors determining thephysical properties of protein foams. Food Hydrocolloids 2006, 20,284−292.(7) Tolstoguzov, V. Foods As Dispersed Systems. Thermodynamicaspects of composition-property relationships in formulated food. J.Therm. Anal. Calorim. 2000, 61, 397−409.(8) Goff, H. D., Vega, C. Structure-engineering of ice-cream andfoam-based foods. In Understanding and controlling the microstructure ofcomplex foods; McClements, D. J., Ed.; CRC Press; Woodhead Pub.:Cambridge, 2007.(9) Wierenga, P. A.; Gruppen, H. New views on foams from proteinsolutions. Curr. Opin. Colloid Interface Sci. 2010, 15, 365−373.(10) Miller, R.; Fainerman, V. B.; Wustneck, R.; Kragel, J.; Trukhin,D. V. Characterisation of the initial period of protein adsorption bydynamic surface tension measurements using different droptechniques. Colloids Surf., A 1998, 131, 225−230.(11) Lu, J. R.; Su, T. J.; Penfold, J. Adsorption of Serum Albumins atthe Air/Water Interface. Langmuir 1999, 15, 6975−6983.
(12) McClellan, S. J.; Franses, E. I. Effect of concentration anddenaturation on adsorption and surface tension of bovine serumalbumin. Colloids Surf., B 2003, 28, 63−75.(13) Stocco, A.; Drenckhan, W.; Rio, E.; Langevin, D.; Binks, B. P.Particle-stabilised foams: an interfacial study. Soft Matter 2009, 5,2215−2222.(14) Wang, W. Instability, stabilization, and formulation of liquidprotein pharmaceuticals. Int. J. Pharm. 1999, 185, 129−188.(15) Douillard, R. Kinetics of lysozyme adsorption at the air-bufferinterface. Thin Solid Films 1997, 292, 169−172.(16) Miller, R.; Fainerman, V. B.; Makievski, A. V.; Kragel, J.;Grigoriev, D. O.; Kazakov, V. N.; Sinyachenko, O. V. Dynamics ofprotein and mixed protein/surfactant adsorption layers at the water/fluid interface. Adv. Colloid Interface Sci. 2000, 86, 39−82.(17) Tripp, B. C.; Magda, J. J.; Andrade, J. D. Adsorption of GlobularProteins at the Air/Water Interface as Measured via Dynamic SurfaceTension: Concentration Dependence, Mass-Transfer Considerations,and Adsorption Kinetics. J. Colloid Interface Sci. 1995, 173, 16−27.(18) Tronin, A.; Dubrovsky, T.; Dubrovskaya, S.; Radicchi, G.;Nicolini, C. Role of Protein Unfolding in Monolayer Formation onAir-Water Interface. Langmuir 1996, 12, 3272−3275.(19) Felsovalyi, F.; Mangiagalli, P.; Bureau, C.; Kumar, S.; Banta, S.Reversibility of the Adsorption of Lysozyme on Silica. Langmuir 2011,27, 11873−11882.(20) Desfougeres, Y.; Saint-Jalmes, A.; Salonen, A.; Vies, V.; Beaufils,S.; Pezennec, S.; Desbat, B.; Lechevalier, V.; Nau, F. StrongImprovement of Interfacial Properties Can Result from SlightStructural Modifications of Proteins: The Case of Native and Dry-Heated Lysozyme. Langmuir 2011, 27, 14947−14957.(21) Kim, G.; Gurau, M.; Kim, J.; Cremer, P. S. Investigations ofLysozyme Adsorption at the Air/Water and Quartz/Water Interfacesby Vibrational Sum Frequency Spectroscopy. Langmuir 2002, 18,2807−2811.(22) Fick, J.; Wolfram, T.; Belz, F.; Roke, S. Surface-SpecificInteraction of the Extracellular Domain of Protein L1 withNitrilotriacetic Acid-Terminated Self-Assembled Monolayers. Lang-muir 2009, 26, 1051−1056.(23) Kim, J.; Somorjai, G. A. Molecular Packing of Lysozyme,Fibrinogen, and Bovine Serum Albumin on Hydrophilic andHydrophobic Surfaces Studied by Infrared−Visible Sum FrequencyGeneration and Fluorescence Microscopy. J. Am. Chem. Soc. 2003,125, 3150−3158.(24) Wang, J.; Chen, X.; Clarke, M. L.; Chen, Z. Detection of chiralsum frequency generation vibrational spectra of proteins and peptidesat interfaces in situ. Proc. Natl. Acad. Sci. U.S.A. 2005, 102, 4978−4983.(25) Thennarasu, S.; Huang, R.; Lee, D.-K.; Yang, P.; Maloy, L.;Chen, Z.; Ramamoorthy, A. Limiting an Antimicrobial Peptide to theLipid−Water Interface Enhances Its Bacterial Membrane Selectivity: ACase Study of MSI-367. Biochemistry 2010, 49, 10595−10605.(26) Nguyen, K. T.; Soong, R.; lm, S.-C.; Waskell, L.; Ramamoorthy,A.; Chen, Z. Probing the Spontaneous Membrane Insertion of a Tail-Anchored Membrane Protein by Sum Frequency Generation Spec-troscopy. J. Am. Chem. Soc. 2010, 132, 15112−15115.(27) Wang, J.; Buck, S. M.; Chen, Z. Sum frequency generationvibrational spectroscopy studies on protein adsorption. J. Phys. Chem.B 2002, 106, 11666−11672.(28) Salis, A.; Bostrom, M.; Medda, L.; Cugia, F.; Barse, B.; Parsons,D. F.; Ninham, B. W.; Monduzzi, M. Measurements and TheoreticalInterpretation of Points of Zero Charge/Potential of BSA Protein.Langmuir 2011, 27, 11597−11604.(29) Tompkins, H. G.; Irene, E. A. Handbook of ellipsometry; WilliamAndrew Pub; Springer: Norwich, NY, Heidelberg, Germany, 2005.(30) Shen, Y. R. The principles of nonlinear optics; John Wiley & Sons:New York,1984.(31) Wang, J.; Buck, S. M.; Chen, Z. The effect of surface coverageon conformation changes of bovine serum albumin molecules at theair-solution interface detected by sum frequency generation vibrationalspectroscopy. Analyst 2003, 128, 773−778.
Langmuir Article
dx.doi.org/10.1021/la301368v | Langmuir 2012, 28, 7780−77877786
(32) Chen, X.; Flores, S. C.; Lim, S.-M.; Zhang, Y.; Yang, T.; Kherb,J.; Cremer, P. S. Specific Anion Effects on Water Structure Adjacent toProtein Monolayers. Langmuir 2010, 26, 16447−16454.(33) Chen, X.; Yang, T.; Kataoka, S.; Cremer, P. S. Specific IonEffects on Interfacial Water Structure near Macromolecules. J. Am.Chem. Soc. 2007, 129, 12272−12279.(34) Kim, J.; Cremer, P. S. Elucidating Changes in Interfacial WaterStructure upon Protein Adsorption. ChemPhysChem 2001, 2, 543−546.(35) Rumpel, A.; Novak, M.; Walter, J.; Braunschweig, B.; Halik, M.;Peukert, W. Tuning the molecular order of C60 functionalizedphosphonic acid monolayers. Langmuir 2011, 27, 15016−15023.(36) Glaser, L. A.; Paulson, A. T.; Speers, R. A.; Yada, R. Y.;Rousseau, D. Foaming behavior of mixed bovine serum albumin−protamine systems. Food Hydrocolloids 2007, 21, 495−506.(37) Heurtault, B.; Saulnier, P.; Pech, B.; Proust, J.-E.; Benoit, J.-P.Physico-chemical stability of colloidal lipid particles. Biomaterials 2003,24, 4283−4300.(38) Anema, S. G.; Klostermeyer, H. ζ-Potentials of casein micellesfrom reconstituted skim milk heated at 120 °C. Int. Dairy J. 1996, 6,673−687.(39) Jachimska, B.; Wasilewska, M.; Adamczyk, Z. Characterizationof Globular Protein Solutions by Dynamic Light Scattering, Electro-phoretic Mobility, and Viscosity Measurements. Langmuir 2008, 24,6866−6872.(40) Richmond, G. L. Molecular Bonding and Interactions atAqueous Surfaces as Probed by Vibrational Sum Frequency Spectros-copy. Chem. Rev. 2002, 102, 2693−2724.(41) Shen, Y. R.; Ostroverkhov, V. Sum-Frequency VibrationalSpectroscopy on Water Interfaces: Polar Orientation of WaterMolecules at Interfaces. Chem. Rev. 2006, 106, 1140−1154.(42) Wang, J.; Even, M. A.; Chen, X.; Schmaier, A. H.; Waite, J. H.;Chen, Z. Detection of Amide I Signals of Interfacial Proteins in SituUsing SFG. J. Am. Chem. Soc. 2003, 125, 9914−9915.(43) Braunschweig, B.; Mukherjee, P.; Kutz, R. B.; Wieckowski, A.;Dlott, D. D. Sum-frequency generation of acetate adsorption on Auand Pt surfaces: Molecular structure effects. J. Chem. Phys. 2010, 133,234702−234708.(44) Byler, D. M.; Susi, H. Examination of the secondary structure ofproteins by deconvolved FTIR spectra. Biopolymers 1986, 25, 469−487.(45) Wang, J.; Chen, X.; Clarke, M. L.; Chen, Z. VibrationalSpectroscopic Studies on Fibrinogen Adsorption at Polystyrene/Protein Solution Interfaces: Hydrophobic Side Chain and SecondaryStructure Changes. J. Phys. Chem. B 2006, 110, 5017−5024.(46) Clarke, M. L.; Wang, J.; Chen, Z. Conformational Changes ofFibrinogen after Adsorption. J. Phys. Chem. B 2005, 109, 22027−22035.(47) Yang, P.; Ramamoorthy, A.; Chen, Z. Membrane Orientation ofMSI-78 Measured by Sum Frequency Generation VibrationalSpectroscopy. Langmuir 2011, 27, 7760−7767.(48) Wang, J.; Clarke, M. L.; Chen, X.; Even, M. A.; Johnson, W. C.;Chen, Z. Molecular studies on protein conformations at polymer/liquid interfaces using sum frequency generation vibrational spectros-copy. Surf. Sci. 2005, 587, 1−11.(49) Knoesen, A.; Pakalnis, S.; Wang, M.; Wise, W.; Lee, N.; Frank,C. Sum-frequency spectroscopy and imaging of aligned helicalpolypeptides. IEEE J. Sel. Top. Quantum Electron. 2004, 10, 1154−1163.(50) Barth, A.; Zscherp, C. What vibrations tell about proteins. Q.Rev. Biophys. 2002, 35, 369−430.(51) Murayama, K.; Tomida, M. Heat-Induced Secondary Structureand Conformation Change of Bovine Serum Albumin Investigated byFourier Transform Infrared Spectroscopy. Biochem. 2004, 43, 11526−11532.(52) Shanmugam, G.; Polavarapu, P. L. Vibrational circular dichroismspectra of protein films: thermal denaturation of bovine serumalbumin. Biophys. Chem. 2004, 111, 73−77.
(53) Liu, Y.; Jasensky, J.; Chen, Z. Molecular Interactions of Proteinsand Peptides at Interfaces Studied by Sum Frequency GenerationVibrational Spectroscopy. Langmuir 2012, 28, 2113−2121.(54) Fu, L.; Ma, G.; Yan, E. C. Y. In Situ Misfolding of Human IsletAmyloid Polypeptide at Interfaces Probed by Vibrational SumFrequency Generation. J. Am. Chem. Soc. 2010, 132, 5405−5412.(55) Haris, P. I.; Severcan, F. FTIR spectroscopic characterization ofprotein structure in aqueous and non-aqueous media. J. Mol. Catal. B:Enzymatic 1999, 7, 207−221.(56) Socrates, G. Infrared and Raman characteristic group frequencies:Tables and charts, 3rd ed.; John Wiley & Sons: Chichester [u.a.], 2004.(57) Lin, V. J. C.; Koenig, J. L. Raman studies of bovine serumalbumin. Biopolymers 1976, 15, 203−218.(58) Yu, N.; Jo, B. H. Comparison of protein structure in crystals andin solution by laser Raman scattering: I. Lysozyme. Arch. Biochem.Biophys. 1973, 156, 469−474.(59) Peters, T. All about albumin: Biochemistry, genetics, and medicalapplications; Academic Press: San Diego, 1996.(60) Sung, J.; Zhang, L.; Tian, C.; Shen, Y. R.; Waychunas, G. A.Effect of pH on the Water/α-Al2O3 (1102) Interface Structure Studiedby Sum-Frequency Vibrational Spectroscopy. J. Phys. Chem. C 2011,115, 13887−13893.(61) Braunschweig, B.; Eissner, S.; Daum, W. Molecular Structure ofa Mineral/Water Interface: Effects of Surface NanoRoughness of α-Al2O3 (0001). J. Phys. Chem. C 2008, 112, 1751−1754.(62) Kinsella, J.; Morr, C. V. Milk proteins: Physicochemical andfunctional properties. Crit. Rev. Food Sci. Nutr. 1984, 21, 197−262.
Langmuir Article
dx.doi.org/10.1021/la301368v | Langmuir 2012, 28, 7780−77877787


