Embed Size (px)
Citation preview
applied sciences
Article
Enhanced Phosphorus Removal from WastewaterUsing RSPRC and a Novel Reactor
Yan Liu, Limin Zhang * and Rajendra Prasad Singh
School of Civil Engineering, Southeast University, Nanjing 210000, China; [email protected] (Y.L.);[email protected] (R.P.S.)* Correspondence: [email protected]; Tel.: +86-151-9590-8761
Received: 21 April 2020; Accepted: 18 May 2020; Published: 24 May 2020�����������������
Abstract: Fly ash and steel slag both have a good adsorption performance and many researchershave mixed the two to make effective adsorbents. Based on previous knowledge, activated clay isadded in this study. In order to deep dephosphorize wastewater, two different industrial wastes (steelslag, fly ash) are blended into activated clay as adsorption substrates, supplemented with a binderand foaming agent to prepare a Residue and Soil Phosphorus Removal Composite (RSPRC). This isprepared to carry out experimental research on the decolorization effect and phosphorus removalcharacteristics of RSPRC. Meanwhile, a self-developed concentric circular diversion wall adsorptionreactor is implemented to study the effect of phosphorus removal. It is found that the addition ofactivated clay can significantly improve the phosphorus removal performance. The results suggestthat the phosphorus concentration in the effluent from the reactor can be stably reduced to below0.10 mg/L. The concentric circular diversion wall adsorption reactor and RSPRC will have broadapplication prospects in phosphorus removal.
Keywords: phosphorus; adsorption; steel slag; fly ash; activated clay; reactor
1. Introduction
Phosphorus (P) usually originates from human and animal wastes, household detergents,food-processing effluents, commercial fertilizers, and agricultural land runoffs. Phosphorus is amajor nutrient for biomass growth [1–3]. However, excessive concentrations of P in water bodiessuch as lakes, lagoons or rivers cause an abnormal growth of algae and aquatic plants resulting in thedegradation of the water quality [4,5]. The State Environmental Protection Administration of China hasrecommended that total P should not exceed 0.5 mg/L according to the class A demands of dischargestandard of pollutants for municipal wastewater treatment plants (GB18918-2002). The European Union(EU) maintains that the cut-off for total P concentration between risk and no risk of eutrophicationin lakes is <10 µg/L to >100 µg/L, and for rivers, while total P concentrations below 0.01–0.07 µg/Lare considered ideal. Therefore, the enhanced removal of phosphorus is a current trend. At present,removal methods of phosphorus from wastewater can be roughly divided into chemical precipitation [6],advanced biological treatment [7,8] and adsorption [9,10]. The biological phosphorus removal processis complicated and easily affected by the environment, which means that the effluent phosphorusconcentration stability is poor [11]. Although the chemical removal method has a good effluent effect,most phosphorus removal agents used are industrial products such as lime, aluminum salt, iron salt,ferrous salt and magnesium salt, which lead to high phosphorus removal costs and a large amountof sludge. Thus, chemical precipitation has not been widely applied in practice [12]. Comparedwith other kinds of phosphorus removal methods, adsorption has the advantages of easy operation,simple process, reliable operation, high efficiency, low consumption, etc. [13]. Therefore, it has broadapplication prospects.
Appl. Sci. 2020, 10, 3629; doi:10.3390/app10103629 www.mdpi.com/journal/applsci

Appl. Sci. 2020, 10, 3629 2 of 16
Studies over the past two decades have provided significant information on the profoundphosphorus removal performance of steel slag and fly ash. However, there is clearly a lack of researchrelated to the phosphorus removal performance of activated clay. Although extensive research hasbeen carried out on steel slag and fly ash, there has been little research on combining active clay, steelslag and fly ash to remove phosphorus. Most studies in the field of phosphorus adsorption have onlyfocused on the adsorbents. So far, very little attention has been paid to the role of reactors used foradsorption reactions. Currently, high efficiency phosphorus removal material with strong adsorptioncapacity, certain strength and chemical stability, low water flow resistance and low cost should bedeveloped urgently and applied to the phosphorus removal process of various wastewaters to ensurethe phosphorus removal effect on the wastewater and recover the phosphorus [14]. In addition,the development of a reactor that is easy to operate, has a large capacity for water treatment andcan guarantee an excellent adsorption effect for a long period of time is also one of the hot topics inrecent years.
Therefore, the prepared RSPRC was used as the adsorbent and a concentric circular diversion walladsorption reactor was developed as the adsorption device. The main objectives of the current workare as follows: (1) assess the decolorization and dephosphorization performance of activated clay atdifferent ratios to determine the optimum ratio of raw materials for preparing RSPRC. (2) Investigatethe phosphorus removal characteristics of RSPRC. (3) Investigate the effect of RSPRC dosage onthe phosphorus removal efficiency of the reactor. (4) Investigate the effect of RSPRC distributionon phosphorus removal efficiency to optimize the placement of RSPRC for adsorption reactors.Moreover, (5) investigate the effect of hydraulic retention time (HRT) in the reactor on the phosphorusremoval efficiency.
2. Materials and Methods
2.1. The Concentric Circular Diversion Wall Adsorption Reactor
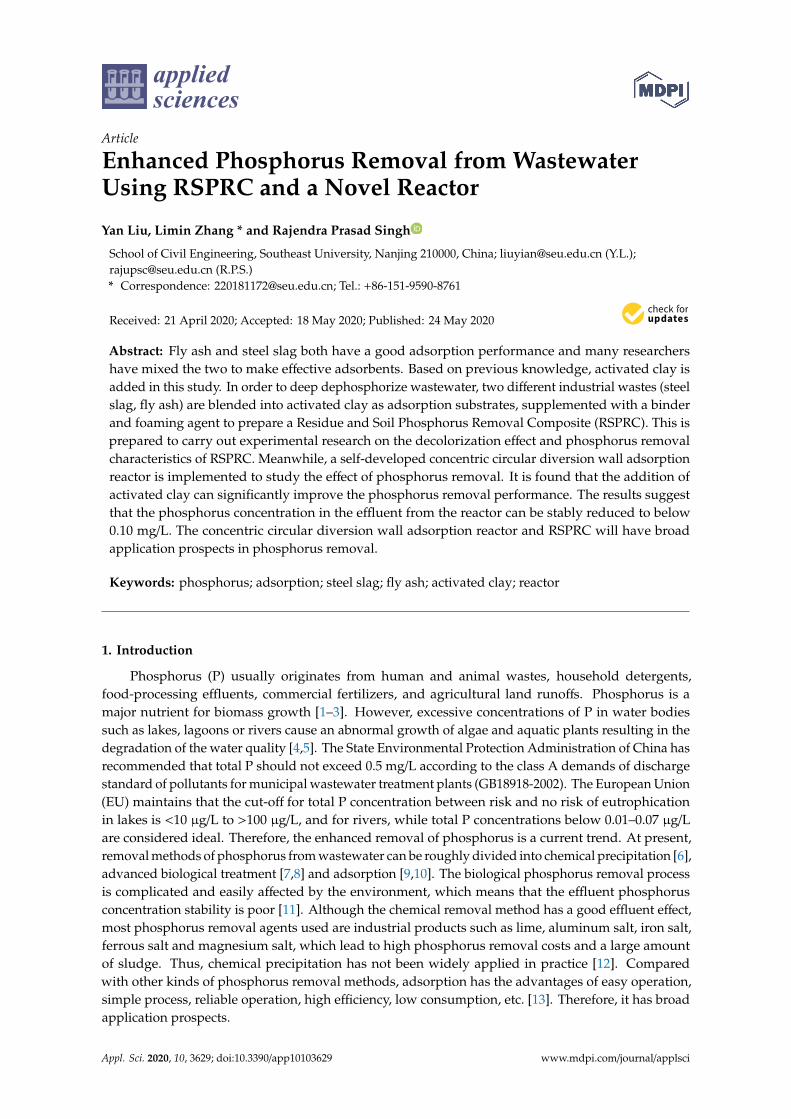
The design scheme of the concentric circular diversion wall adsorption reactor was as follows:comparing the advantages and disadvantages of the existing reactors, combined with the purposeof this research, the preliminary design scheme of the reactor type, namely the fixed bed type, wasproposed. In order to realize the functions of multi-stage series adsorption and flexible distribution ofadsorbents, taking the oxidation ditch as a reference, the reactor adopted the shape of concentric circlesand was equipped with slots and grills. Based on the preliminary design scheme, comprehensivelyconsidering the advantages and disadvantages of various types of materials, after repeated researchand discussion with the manufacturer on the details of the reactor, stainless steel was chosen as thereactor material and the necessary adjustments of the reactor structure were made. Finally, the reactordimensions were determined, such as the height-to-diameter ratio of the reactor, the size of the waterinlet and outlet, the size of the overflow port and so on.
The concentric circular diversion wall adsorption reactor was composed of an outlet pipe, an inletpipe, an overflow port, a slot, removable grilles, diversion walls, diversion tubes, a constant flowpump and ball valves (Figure 1a,b). The total height of the reactor was 80 cm, the effective height was50 cm and the support foot height was 30 cm. The diameter was 120 cm and the effective diameter was100 cm. The inflow height was 78 cm and the effluent height was 28 cm. The total volume was about400 L and the effective volume was approximately 375 L. The diameters of the diversion walls from theoutside to the inside were 50 cm, 40 cm, 30 cm, 20 cm and 10 cm, respectively. The total heights ofthe diversion walls were 50 cm and the effective height was 48 cm, 46 cm, 44 cm, 42 cm and 40 cmfrom the outside to inside. The distances from the outside to the inside of the diversion wall were2 cm, 4 cm, 6 cm, 8 cm and 10 cm. The dimensions of the removable grilles were: length × width ×thickness = 50 cm × 10 cm × 1 cm; and the measured mesh area was about 0.04 cm2. The outer andinner diameters of the diversion tube used in current work were 20 mm and 19 mm respectively.
Appl. Sci. 2020, 10, 3629 3 of 16Appl. Sci. 2020, 10, x FOR PEER REVIEW 3 of 16
(a)
(b)
Figure 1. (a) The concentric circular diversion wall adsorption reactor schematic; (b) the concentric circular diversion wall adsorption reactor.
2.2. RSPRC Preparation
The raw materials of RSPRC were divided into two types: substrate and auxiliary material. The substrate consisted of steel slag, fly ash and activated clay. The auxiliary material was cement as binder and the foaming agent to increase the specific surface area [15]. The steel slag and fly ash used in this experiment were taken from a steel plant and a power plant in Nanjing. The chemical composition of the steel slag and fly ash was analyzed by wavelength dispersive X-ray fluorescence analyzer (XRF-1800) produced by Shimadzu, Kyoto, Japan. Table 1 shows the chemical composition and content of the waste residue substrate and Table 2 presents the particle size distribution of the waste residue substrate.
Table 1. Percentage of oxides in waste residue substrate.
Oxide CaO Fe2O3 Al2O3 SiO2 MgO MnO SO3 V2O5 TiO2 Na2O ZnO CuO Composition of fly ash
(%) 1.31 4.39 45.9 44.4 0.261 0.026 0.666 0.038 1.26 0.094 0.021 0.02
Composition of steel slag (%) 55.0 21.5 1.51 13.4 3.65 1.75 0.512 0.417 0.296 0.077 - -
Table 2. Size distribution of the waste residue substrate.
Particle Size of fly ash/mesh <6 6~18 18~45 45~70 >70 proportion/% 7.45 12.76 42.93 23.55 11.87
Particle size of steel slag/mesh <12 12~80 80~320 >320 - proportion/% 2.49 7.68 32.40 57.36 -
The preparation of activated clay is divided into original soil treatment and modification treatment [16]. This experiment adopted acid modification treatment [17]. The bentonite was taken from Tangshan, Jiangning District, Nanjing, China. For the acid modification treatment, the bentonite was immersed in a 3 mol/L sulfuric acid solution, activated for 30 min, and stirred at a speed of 1000 r/min in a constant temperature environment of 100 °C. After the activation was completed, it was washed with distilled water to neutrality, dried, ground, and passed through a 100-mesh sieve to obtain experimental activated clay. Respectively, the principal oxides SiO2, Al2O3, MgO, Fe2O3, and CaO in the activated clay account for 64.23%, 16.88%, 0.76%, 2.05% and 2.45%. The preparation of the adsorbent was carried out according to the different proportion of various substrates. The specific percentages of substrate and binder are presented in Table 3.
Figure 1. (a) The concentric circular diversion wall adsorption reactor schematic; (b) the concentriccircular diversion wall adsorption reactor.
2.2. RSPRC Preparation
The raw materials of RSPRC were divided into two types: substrate and auxiliary material.The substrate consisted of steel slag, fly ash and activated clay. The auxiliary material was cementas binder and the foaming agent to increase the specific surface area [15]. The steel slag and fly ashused in this experiment were taken from a steel plant and a power plant in Nanjing. The chemicalcomposition of the steel slag and fly ash was analyzed by wavelength dispersive X-ray fluorescenceanalyzer (XRF-1800) produced by Shimadzu, Kyoto, Japan. Table 1 shows the chemical compositionand content of the waste residue substrate and Table 2 presents the particle size distribution of thewaste residue substrate.
Table 1. Percentage of oxides in waste residue substrate.
Oxide CaO Fe2O3 Al2O3 SiO2 MgO MnO SO3 V2O5 TiO2 Na2O ZnO CuO
Composition of fly ash (%) 1.31 4.39 45.9 44.4 0.261 0.026 0.666 0.038 1.26 0.094 0.021 0.02Composition of steel slag (%) 55.0 21.5 1.51 13.4 3.65 1.75 0.512 0.417 0.296 0.077 - -
Table 2. Size distribution of the waste residue substrate.
Particle Size of fly ash/mesh <6 6~18 18~45 45~70 >70proportion/% 7.45 12.76 42.93 23.55 11.87
Particle size of steel slag/mesh <12 12~80 80~320 >320 -proportion/% 2.49 7.68 32.40 57.36 -
The preparation of activated clay is divided into original soil treatment and modificationtreatment [16]. This experiment adopted acid modification treatment [17]. The bentonite wastaken from Tangshan, Jiangning District, Nanjing, China. For the acid modification treatment, thebentonite was immersed in a 3 mol/L sulfuric acid solution, activated for 30 min, and stirred at a speedof 1000 r/min in a constant temperature environment of 100 ◦C. After the activation was completed,it was washed with distilled water to neutrality, dried, ground, and passed through a 100-mesh sieveto obtain experimental activated clay. Respectively, the principal oxides SiO2, Al2O3, MgO, Fe2O3, andCaO in the activated clay account for 64.23%, 16.88%, 0.76%, 2.05% and 2.45%. The preparation of theadsorbent was carried out according to the different proportion of various substrates. The specificpercentages of substrate and binder are presented in Table 3.
Appl. Sci. 2020, 10, 3629 4 of 16
Table 3. Percentage composition of substrate and binder in Residue and Soil Phosphorus RemovalComposite (RSPRC) in four groups.
Material Fly Ash Steel Slag Activated Clay Binder
Composition of Group 1 (%) 78.25 11.25 5 5Composition of Group 2 (%) 74.38 10.63 10 5Composition of Group 3 (%) 70 10 15 5Composition of Group 4 (%) 83.13 11.88 — 5
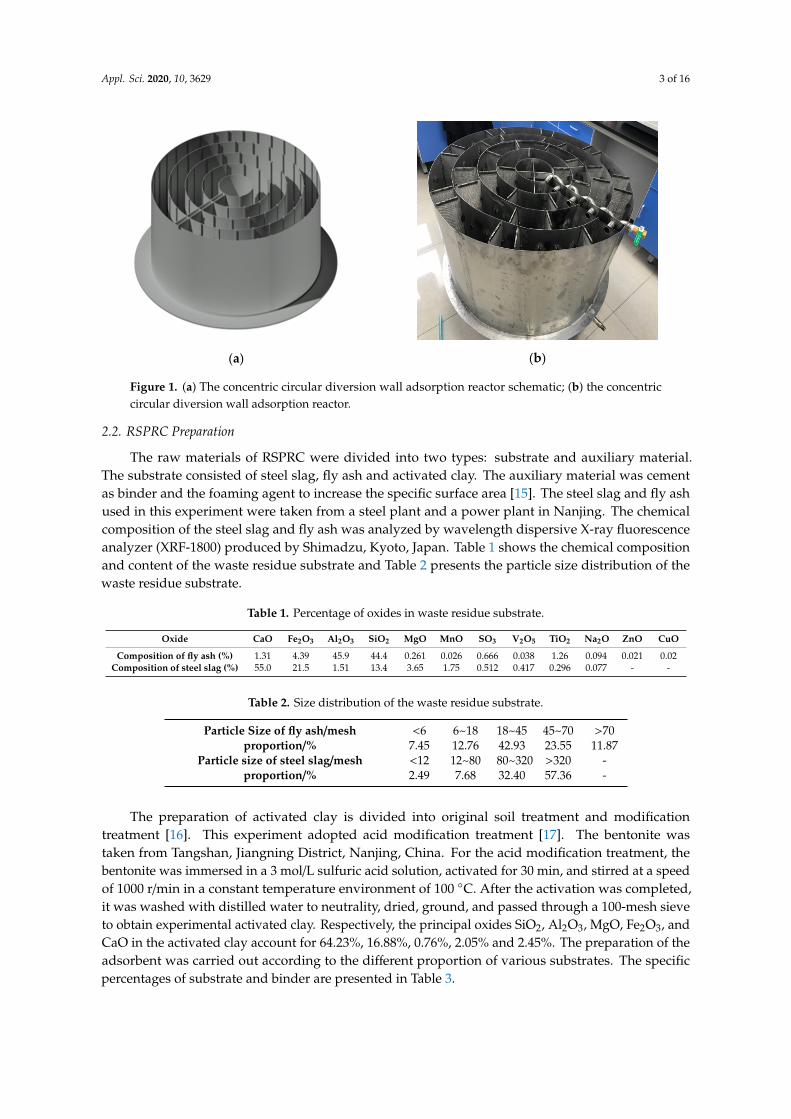
A schematic flow chart of the RSPRC preparation process is provided in Figure 2. At first,the selected substrate (fly ash and steel slag) was mechanically pulverized. After that, an appropriateamount of activated clay, binder and foaming agent were blended and thoroughly mixed. Later,an appropriate amount of tap water was added to the materials and these materials were stirred evenly.Then, all the materials were poured into the drum granulator. After the granulation was completed,the water was sprinkled after 6~8 h. Finally, RSPRC was maintained for several days under normaltemperature and pressure to keep certain humidity on the surface of the particles.
Appl. Sci. 2020, 10, x FOR PEER REVIEW 4 of 16
Table 3. Percentage composition of substrate and binder in Residue and Soil Phosphorus Removal Composite (RSPRC) in four groups.
Material Fly Ash Steel Slag Activated Clay Binder Composition of Group 1 (%) 78.25 11.25 5 5 Composition of Group 2 (%) 74.38 10.63 10 5 Composition of Group 3 (%) 70 10 15 5 Composition of Group 4 (%) 83.13 11.88 — 5
A schematic flow chart of the RSPRC preparation process is provided in Figure 2. At first, the selected substrate (fly ash and steel slag) was mechanically pulverized. After that, an appropriate amount of activated clay, binder and foaming agent were blended and thoroughly mixed. Later, an appropriate amount of tap water was added to the materials and these materials were stirred evenly. Then, all the materials were poured into the drum granulator. After the granulation was completed, the water was sprinkled after 6~8 h. Finally, RSPRC was maintained for several days under normal temperature and pressure to keep certain humidity on the surface of the particles.
Figure 2. RSPRC preparation process.
According to the experimental conclusion of Wu et al. [18], the composite adsorbent with a particle size of 5 mm had a more efficient phosphorus removal effect than that with particle sizes of 10 and 20 mm. Therefore, the particle size selected for this experiment was 5 mm. Zhou [19] pointed out in their research on Efficient Phosphorus Removal Composite (EPRC)that the use of a plant-type foaming agent in the preparation process made it more difficult to cause secondary pollution, and that the optimal dosage was 8 mL/kg. RSPRC and EPRC are basically the same in terms of material physical properties. Consequently, the preparation of the adsorbent was carried out with an 8 mL/kg foaming agent. The plant-type foaming agent was bought from Shanghai Fangbao Building Material Technology Co., Ltd., Shanghai, China. The plant-type foaming agent is prepared from rosin and sodium hydroxide through a saponification reaction and had the advantages of its low cost and large foam production.
2.3. Study on Decolorization and P Removal of RSPRC with Activated Clay
The colored wastewater used in the experiment was derived from a river in the Jiulonghu Campus of Southeast University. A total of 250 mL wastewater was taken and stored in conical flasks. As shown in Table 3, 5 g adsorbents of different groups were respectively added. The colored wastewater was slowly stirred for 20 min and stood for 2 h. After that, the wastewater was filtered and the filtrate was taken to measure absorbance. The absorbance was measured by a spectrophotometer at a wavelength of 750 nm. The decolorization rate was calculated by the following formula: Q = (A − A )A × 100% (1)
Figure 2. RSPRC preparation process.
According to the experimental conclusion of Wu et al. [18], the composite adsorbent with a particlesize of 5 mm had a more efficient phosphorus removal effect than that with particle sizes of 10 and20 mm. Therefore, the particle size selected for this experiment was 5 mm. Zhou [19] pointed outin their research on Efficient Phosphorus Removal Composite (EPRC)that the use of a plant-typefoaming agent in the preparation process made it more difficult to cause secondary pollution, andthat the optimal dosage was 8 mL/kg. RSPRC and EPRC are basically the same in terms of materialphysical properties. Consequently, the preparation of the adsorbent was carried out with an 8 mL/kgfoaming agent. The plant-type foaming agent was bought from Shanghai Fangbao Building MaterialTechnology Co., Ltd., Shanghai, China. The plant-type foaming agent is prepared from rosin andsodium hydroxide through a saponification reaction and had the advantages of its low cost and largefoam production.
2.3. Study on Decolorization and P Removal of RSPRC with Activated Clay
The colored wastewater used in the experiment was derived from a river in the Jiulonghu Campusof Southeast University. A total of 250 mL wastewater was taken and stored in conical flasks. As shownin Table 3, 5 g adsorbents of different groups were respectively added. The colored wastewater wasslowly stirred for 20 min and stood for 2 h. After that, the wastewater was filtered and the filtrate wastaken to measure absorbance. The absorbance was measured by a spectrophotometer at a wavelengthof 750 nm. The decolorization rate was calculated by the following formula:
Q =(A0 −Ae)
A0× 100% (1)
Appl. Sci. 2020, 10, 3629 5 of 16
where Q is the decolorization rate, A0 is the initial absorbance of the colored wastewater and Ae is theabsorbance of the colored wastewater after adsorption.
A total of 10 g of different groups of adsorbents were placed into 250 mL Erlenmeyer flasks. Then,the simulated solution, with a phosphorus concentration of 2 mg/L, prepared with deionized waterand KH2PO4, was separately added to the Erlenmeyer flasks up to the mark. The pH of the simulatedsolution was adjusted to 7 by adding HCL and NaOH solution. Finally, they were oscillated in aconstant temperature oscillator. When the adsorption duration was 60 min, 120 min and 180 min,the supernatant was taken, and the P concentrations were determined using the molybdenum bluespectrophotometric method stated in American Public Health Association (APHA) [20] in order toinvestigate the effect of the ratio of activated clay in the adsorbent on phosphorus removal.
The phosphorus removal effect of RSPRC in the advanced treatment of wastewater was mainlyreflected in the phosphorus removal rate and the amount of phosphorus adsorbed by RSPRC.The adsorption capacity (Qe, mg/g) or amount of phosphorus adsorbed by RSPRC and removal rate(R) of phosphorus were calculated from the following equations:
Qe =(C0 −Ce)V
m(2)
R (%) = 100×C0 −Ce
C0(3)
where Co is the initial concentration of the P (mg/L), Ce is the equilibrium or residual P concentration(mg/L), V is the volume of the solution (L) and m is the mass of adsorbent (g).
2.4. Study on P Removal Characteristics of RSPRC
At first, for the purpose of exploring the effect of dosage on the phosphorus removal of RSPRC, 2,3, 4, 5, and 6 g RSPRC samples with a particle size of 5 mm were placed in five conical flasks, whichcontained 100 mL of KH2PO4 standard solution with a P concentration of 0.5 mg/L and pH = 7. The fiveconical flasks were shaken well in a 150 r/min shaker. After 24 h, the supernatant was taken and the Pconcentration was measured. Secondly, in order to study the effect of contact time, when the staticadsorption times were 4, 8, 24, 72 and 144 h, the supernatant was taken and the P concentration wasdetermined. Thirdly, 5 g of RSPRC was separately put into 1 L of simulated wastewater with pH = 7and P concentrations of 0.3, 0.5 and 1.0 mg/L. The P concentration was detected at different times toinvestigate the effect of initial P concentration on the phosphorus removal of RSPRC.
2.5. Study on the Influence of RSPRC Distribution in the Reactor on Phosphorus Removal Effect
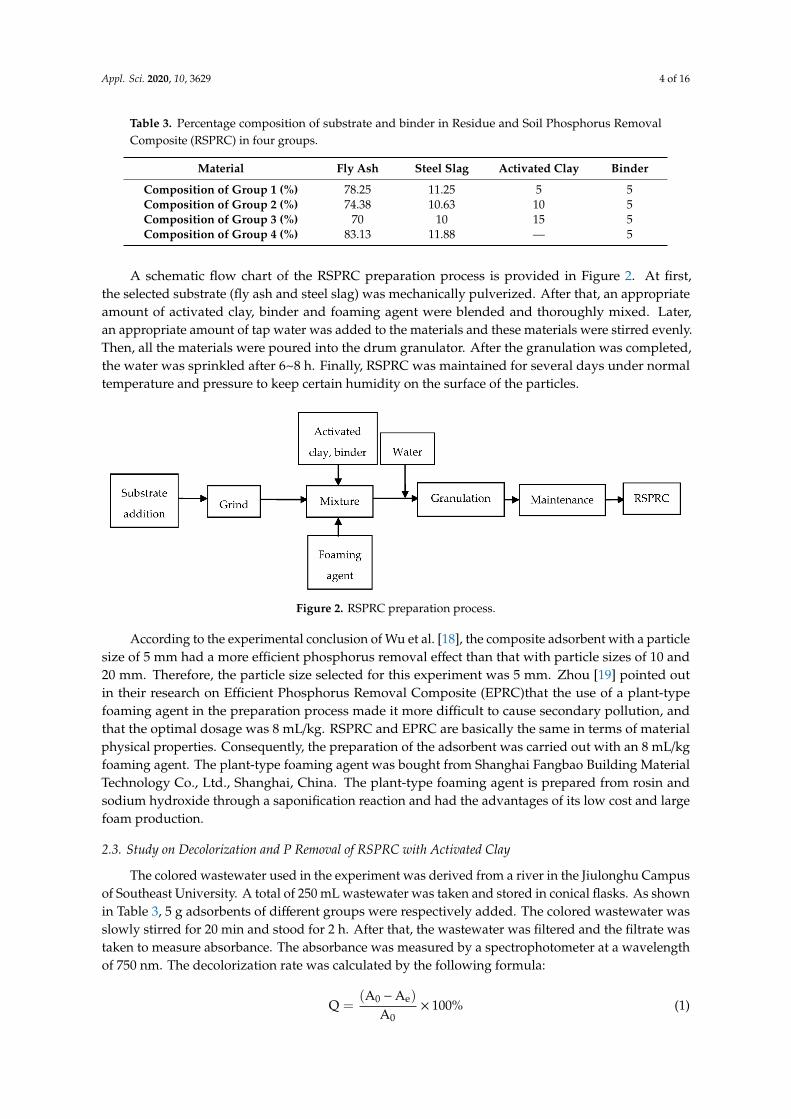
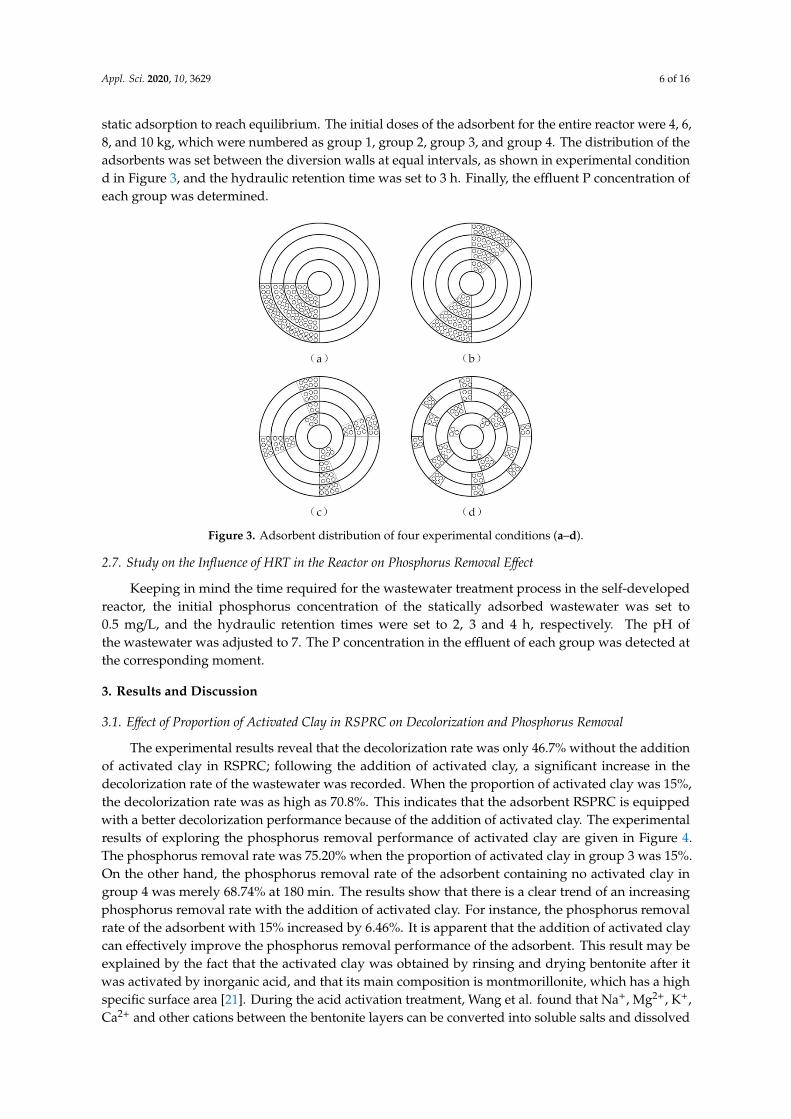
In an attempt to study the influence of different distributions of RSPRC in the reactor on thephosphorus removal effect, four different distributions were designed and a certain amount of adsorbentwas placed in the reactor in the specified way. Four distributions of RSPRC are presented in Figure 3.The initial P concentration of the experimental influent was set to 0.5 mg/L, the pH was adjusted to 7,and the total amount of adsorbent was 10 kg, so as to better observe the phosphorus removal effect ofthe reactor under different distributions. Additionally, the hydraulic retention time was 3 h and thewater flow rate was 125 L/h.
2.6. Study on the Influence of RSPRC Dosage in the Reactor on Phosphorus Removal Effect
In this experiment, the initial phosphorus concentrations of the wastewater were set to threegradients: 0.3, 0.4 and 0.5 mg/L. The pH of wastewater was adjusted to 7. At present, the reactiontime required for the wastewater advanced treatment process is 1~6 h, and hence the adsorptionreaction time set in this experiment was 2~4 h, which is far less than the previously set reactionbalance time. Therefore, for the purpose of reaching the set target effluent P concentration (<0.1 mg/L),the experiment needed to increase the dosage of the adsorbent and shorten the time required for the
Appl. Sci. 2020, 10, 3629 6 of 16
static adsorption to reach equilibrium. The initial doses of the adsorbent for the entire reactor were 4, 6,8, and 10 kg, which were numbered as group 1, group 2, group 3, and group 4. The distribution of theadsorbents was set between the diversion walls at equal intervals, as shown in experimental conditiond in Figure 3, and the hydraulic retention time was set to 3 h. Finally, the effluent P concentration ofeach group was determined.
Appl. Sci. 2020, 10, x FOR PEER REVIEW 6 of 16
were 4, 6, 8, and 10 kg, which were numbered as group 1, group 2, group 3, and group 4. The distribution of the adsorbents was set between the diversion walls at equal intervals, as shown in experimental condition d in Figure 3, and the hydraulic retention time was set to 3 h. Finally, the effluent P concentration of each group was determined.
Figure 3. Adsorbent distribution of four experimental conditions (a)–(d).
2.7. Study on the Influence of HRT in the Reactor on Phosphorus Removal Effect
Keeping in mind the time required for the wastewater treatment process in the self-developed reactor, the initial phosphorus concentration of the statically adsorbed wastewater was set to 0.5 mg/L, and the hydraulic retention times were set to 2, 3 and 4 h, respectively. The pH of the wastewater was adjusted to 7. The P concentration in the effluent of each group was detected at the corresponding moment.
3. Results and Discussion
3.1. Effect of Proportion of Activated Clay in RSPRC on Decolorization and Phosphorus Removal
The experimental results reveal that the decolorization rate was only 46.7% without the addition of activated clay in RSPRC; following the addition of activated clay, a significant increase in the decolorization rate of the wastewater was recorded. When the proportion of activated clay was 15%, the decolorization rate was as high as 70.8%. This indicates that the adsorbent RSPRC is equipped with a better decolorization performance because of the addition of activated clay. The experimental results of exploring the phosphorus removal performance of activated clay are given in Figure 4. The phosphorus removal rate was 75.20% when the proportion of activated clay in group 3 was 15%. On the other hand, the phosphorus removal rate of the adsorbent containing no activated clay in group 4 was merely 68.74% at 180 min. The results show that there is a clear trend of an increasing phosphorus removal rate with the addition of activated clay. For instance, the phosphorus removal rate of the adsorbent with 15% increased by 6.46%. It is apparent that the addition of activated clay can effectively improve the phosphorus removal performance of the adsorbent. This result may be explained by the fact that the activated clay was obtained by rinsing and drying bentonite after it was activated by inorganic acid, and that its main composition is montmorillonite, which has a high specific surface area [21]. During the acid activation treatment, Wang et al. found that Na+, Mg2+, K+, Ca2+ and other cations between the bentonite layers can be
Figure 3. Adsorbent distribution of four experimental conditions (a–d).
2.7. Study on the Influence of HRT in the Reactor on Phosphorus Removal Effect
Keeping in mind the time required for the wastewater treatment process in the self-developedreactor, the initial phosphorus concentration of the statically adsorbed wastewater was set to0.5 mg/L, and the hydraulic retention times were set to 2, 3 and 4 h, respectively. The pH ofthe wastewater was adjusted to 7. The P concentration in the effluent of each group was detected atthe corresponding moment.
3. Results and Discussion
3.1. Effect of Proportion of Activated Clay in RSPRC on Decolorization and Phosphorus Removal
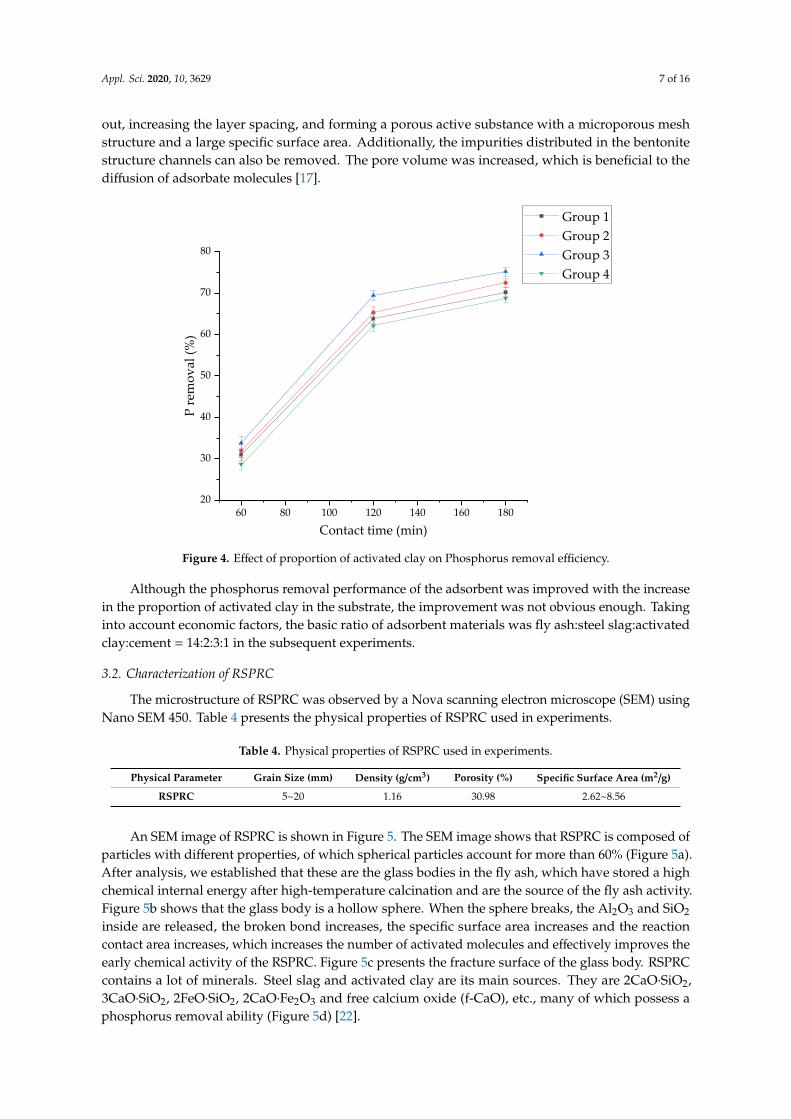
The experimental results reveal that the decolorization rate was only 46.7% without the additionof activated clay in RSPRC; following the addition of activated clay, a significant increase in thedecolorization rate of the wastewater was recorded. When the proportion of activated clay was 15%,the decolorization rate was as high as 70.8%. This indicates that the adsorbent RSPRC is equippedwith a better decolorization performance because of the addition of activated clay. The experimentalresults of exploring the phosphorus removal performance of activated clay are given in Figure 4.The phosphorus removal rate was 75.20% when the proportion of activated clay in group 3 was 15%.On the other hand, the phosphorus removal rate of the adsorbent containing no activated clay ingroup 4 was merely 68.74% at 180 min. The results show that there is a clear trend of an increasingphosphorus removal rate with the addition of activated clay. For instance, the phosphorus removalrate of the adsorbent with 15% increased by 6.46%. It is apparent that the addition of activated claycan effectively improve the phosphorus removal performance of the adsorbent. This result may beexplained by the fact that the activated clay was obtained by rinsing and drying bentonite after itwas activated by inorganic acid, and that its main composition is montmorillonite, which has a highspecific surface area [21]. During the acid activation treatment, Wang et al. found that Na+, Mg2+, K+,Ca2+ and other cations between the bentonite layers can be converted into soluble salts and dissolved
Appl. Sci. 2020, 10, 3629 7 of 16
out, increasing the layer spacing, and forming a porous active substance with a microporous meshstructure and a large specific surface area. Additionally, the impurities distributed in the bentonitestructure channels can also be removed. The pore volume was increased, which is beneficial to thediffusion of adsorbate molecules [17].
Appl. Sci. 2020, 10, x FOR PEER REVIEW 7 of 16
converted into soluble salts and dissolved out, increasing the layer spacing, and forming a porous active substance with a microporous mesh structure and a large specific surface area. Additionally, the impurities distributed in the bentonite structure channels can also be removed. The pore volume was increased, which is beneficial to the diffusion of adsorbate molecules.[17].
Figure 4. Effect of proportion of activated clay on Phosphorus removal efficiency.
Although the phosphorus removal performance of the adsorbent was improved with the increase in the proportion of activated clay in the substrate, the improvement was not obvious enough. Taking into account economic factors, the basic ratio of adsorbent materials was fly ash:steel slag:activated clay:cement = 14:2:3:1 in the subsequent experiments.
3.2. Characterization of RSPRC
The microstructure of RSPRC was observed by a Nova scanning electron microscope (SEM) using Nano SEM 450. Table 4 presents the physical properties of RSPRC used in experiments.
Table 4. Physical properties of RSPRC used in experiments.
Physical Parameter
Grain Size (mm)
Density (g/cm3)
Porosity (%)
Specific Surface Area (m2/g)
RSPRC 5~20 1.16 30.98 2.62~8.56
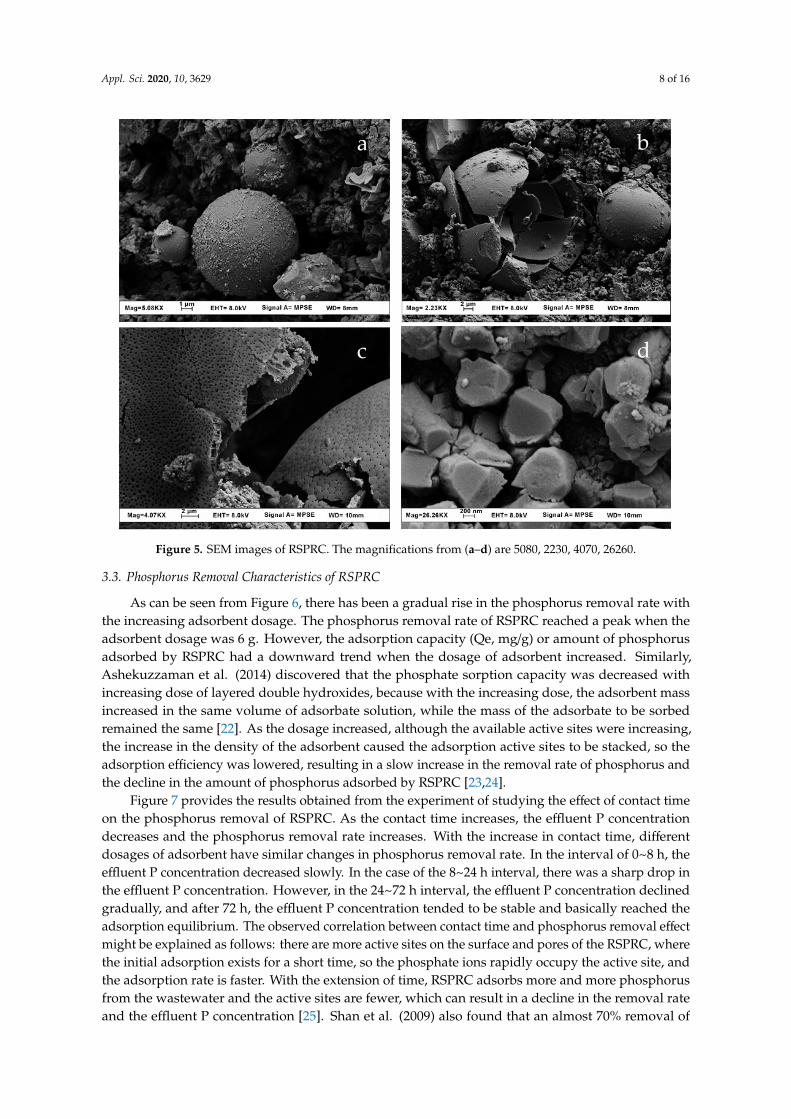
An SEM image of RSPRC is shown in Figure 5. The SEM image shows that RSPRC is composed of particles with different properties, of which spherical particles account for more than 60% (Figure 5a). After analysis, we established that these are the glass bodies in the fly ash, which have stored a high chemical internal energy after high-temperature calcination and are the source of the fly ash activity. Figure 5b shows that the glass body is a hollow sphere. When the sphere breaks, the Al2O3 and SiO2 inside are released, the broken bond increases, the specific surface area increases and the reaction contact area increases, which increases the number of activated molecules and effectively improves the early chemical activity of the RSPRC. Figure 5c presents the fracture surface of the glass body. RSPRC contains a lot of minerals. Steel slag and activated clay are its main sources. They are 2CaO·SiO2, 3CaO·SiO2, 2FeO·SiO2, 2CaO·Fe2O3 and free calcium oxide (f-CaO), etc., many of which possess a phosphorus removal ability (Figure 5d) [22].
60 80 100 120 140 160 18020
30
40
50
60
70
80
P re
mov
al (%
)
Contact time (min)
Group 1 Group 2 Group 3 Group 4
Figure 4. Effect of proportion of activated clay on Phosphorus removal efficiency.
Although the phosphorus removal performance of the adsorbent was improved with the increasein the proportion of activated clay in the substrate, the improvement was not obvious enough. Takinginto account economic factors, the basic ratio of adsorbent materials was fly ash:steel slag:activatedclay:cement = 14:2:3:1 in the subsequent experiments.
3.2. Characterization of RSPRC
The microstructure of RSPRC was observed by a Nova scanning electron microscope (SEM) usingNano SEM 450. Table 4 presents the physical properties of RSPRC used in experiments.
Table 4. Physical properties of RSPRC used in experiments.
Physical Parameter Grain Size (mm) Density (g/cm3) Porosity (%) Specific Surface Area (m2/g)
RSPRC 5~20 1.16 30.98 2.62~8.56
An SEM image of RSPRC is shown in Figure 5. The SEM image shows that RSPRC is composed ofparticles with different properties, of which spherical particles account for more than 60% (Figure 5a).After analysis, we established that these are the glass bodies in the fly ash, which have stored a highchemical internal energy after high-temperature calcination and are the source of the fly ash activity.Figure 5b shows that the glass body is a hollow sphere. When the sphere breaks, the Al2O3 and SiO2
inside are released, the broken bond increases, the specific surface area increases and the reactioncontact area increases, which increases the number of activated molecules and effectively improves theearly chemical activity of the RSPRC. Figure 5c presents the fracture surface of the glass body. RSPRCcontains a lot of minerals. Steel slag and activated clay are its main sources. They are 2CaO·SiO2,3CaO·SiO2, 2FeO·SiO2, 2CaO·Fe2O3 and free calcium oxide (f-CaO), etc., many of which possess aphosphorus removal ability (Figure 5d) [22].
Appl. Sci. 2020, 10, 3629 8 of 16
Appl. Sci. 2020, 10, x FOR PEER REVIEW 8 of 16
Figure 5. SEM images of RSPRC. The magnifications from (a) to (d) are 5080, 2230, 4070, 26260.
3.3. Phosphorus Removal Characteristics of RSPRC
As can be seen from Figure 6, there has been a gradual rise in the phosphorus removal rate with the increasing adsorbent dosage. The phosphorus removal rate of RSPRC reached a peak when the adsorbent dosage was 6 g. However, the adsorption capacity (Qe, mg/g) or amount of phosphorus adsorbed by RSPRC had a downward trend when the dosage of adsorbent increased. Similarly, Ashekuzzaman et al. (2014) discovered that the phosphate sorption capacity was decreased with increasing dose of layered double hydroxides, because with the increasing dose, the adsorbent mass increased in the same volume of adsorbate solution, while the mass of the adsorbate to be sorbed remained the same [22]. As the dosage increased, although the available active sites were increasing, the increase in the density of the adsorbent caused the adsorption active sites to be stacked, so the adsorption efficiency was lowered, resulting in a slow increase in the removal rate of phosphorus and the decline in the amount of phosphorus adsorbed by RSPRC [23,24].
Figure 7 provides the results obtained from the experiment of studying the effect of contact time on the phosphorus removal of RSPRC. As the contact time increases, the effluent P concentration decreases and the phosphorus removal rate increases. With the increase in contact time, different dosages of adsorbent have similar changes in phosphorus removal rate. In the interval of 0~8 h, the effluent P concentration decreased slowly. In the case of the 8~24 h interval, there was a sharp drop in the effluent P concentration. However, in the 24~72 h interval, the effluent P concentration declined gradually, and after 72 h, the effluent P concentration tended to be stable and basically reached the adsorption equilibrium. The observed correlation between contact time and phosphorus removal effect might be explained as follows: there are more active sites on the surface and pores of the RSPRC, where the initial adsorption exists for a short time, so the phosphate ions rapidly occupy the active site, and the adsorption rate is faster. With the extension of time, RSPRC adsorbs more and more phosphorus from the wastewater and the active sites are fewer, which can result in a decline in the removal rate and the effluent P concentration [25]. Shan et al. (2009) also found that an almost 70% removal of phosphate by fly ash was reached in a short time and progressively increased with
Figure 5. SEM images of RSPRC. The magnifications from (a–d) are 5080, 2230, 4070, 26260.
3.3. Phosphorus Removal Characteristics of RSPRC
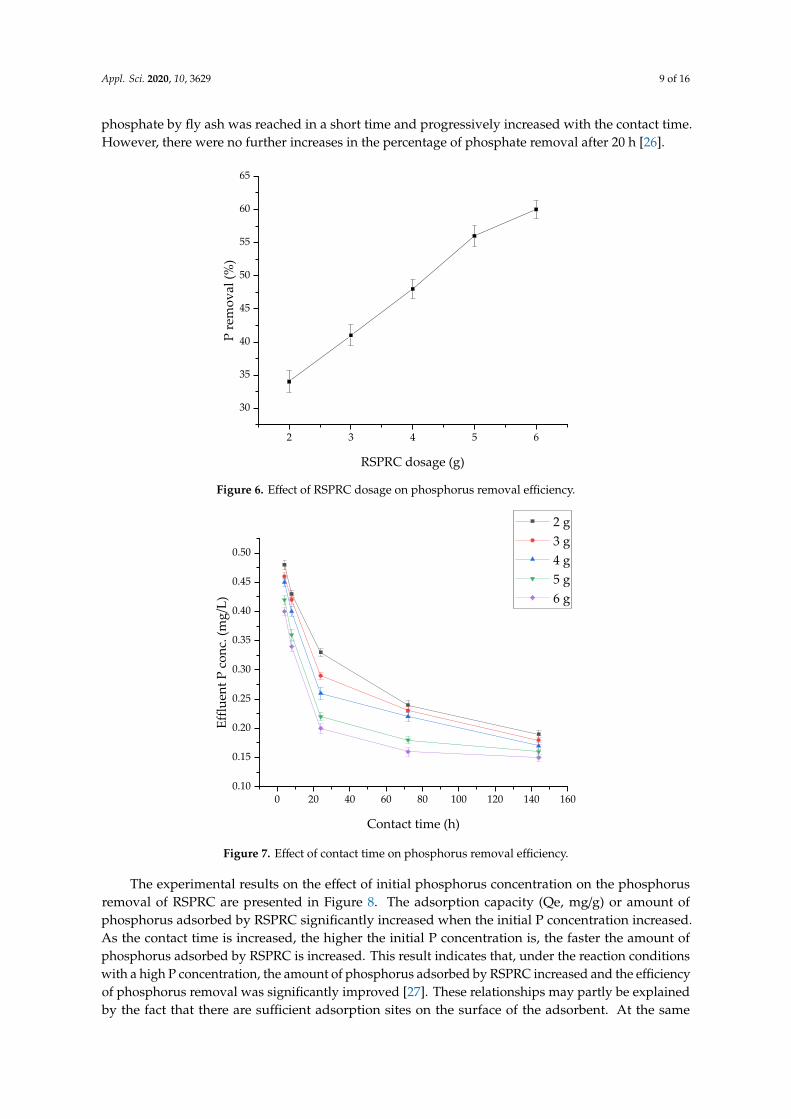
As can be seen from Figure 6, there has been a gradual rise in the phosphorus removal rate withthe increasing adsorbent dosage. The phosphorus removal rate of RSPRC reached a peak when theadsorbent dosage was 6 g. However, the adsorption capacity (Qe, mg/g) or amount of phosphorusadsorbed by RSPRC had a downward trend when the dosage of adsorbent increased. Similarly,Ashekuzzaman et al. (2014) discovered that the phosphate sorption capacity was decreased withincreasing dose of layered double hydroxides, because with the increasing dose, the adsorbent massincreased in the same volume of adsorbate solution, while the mass of the adsorbate to be sorbedremained the same [22]. As the dosage increased, although the available active sites were increasing,the increase in the density of the adsorbent caused the adsorption active sites to be stacked, so theadsorption efficiency was lowered, resulting in a slow increase in the removal rate of phosphorus andthe decline in the amount of phosphorus adsorbed by RSPRC [23,24].
Figure 7 provides the results obtained from the experiment of studying the effect of contact timeon the phosphorus removal of RSPRC. As the contact time increases, the effluent P concentrationdecreases and the phosphorus removal rate increases. With the increase in contact time, differentdosages of adsorbent have similar changes in phosphorus removal rate. In the interval of 0~8 h, theeffluent P concentration decreased slowly. In the case of the 8~24 h interval, there was a sharp drop inthe effluent P concentration. However, in the 24~72 h interval, the effluent P concentration declinedgradually, and after 72 h, the effluent P concentration tended to be stable and basically reached theadsorption equilibrium. The observed correlation between contact time and phosphorus removal effectmight be explained as follows: there are more active sites on the surface and pores of the RSPRC, wherethe initial adsorption exists for a short time, so the phosphate ions rapidly occupy the active site, andthe adsorption rate is faster. With the extension of time, RSPRC adsorbs more and more phosphorusfrom the wastewater and the active sites are fewer, which can result in a decline in the removal rateand the effluent P concentration [25]. Shan et al. (2009) also found that an almost 70% removal of
Appl. Sci. 2020, 10, 3629 9 of 16
phosphate by fly ash was reached in a short time and progressively increased with the contact time.However, there were no further increases in the percentage of phosphate removal after 20 h [26].
Appl. Sci. 2020, 10, x FOR PEER REVIEW 9 of 16
the contact time. However, there were no further increases in the percentage of phosphate removal after 20 h [26].
Figure 6. Effect of RSPRC dosage on phosphorus removal efficiency.
Figure 7. Effect of contact time on phosphorus removal efficiency.
The experimental results on the effect of initial phosphorus concentration on the phosphorus removal of RSPRC are presented in Figure 8. The adsorption capacity (Qe, mg/g) or amount of phosphorus adsorbed by RSPRC significantly increased when the initial P concentration increased. As the contact time is increased, the higher the initial P concentration is, the faster the amount of phosphorus adsorbed by RSPRC is increased. This result indicates that, under the reaction conditions with a high P concentration, the amount of phosphorus adsorbed by RSPRC increased and the efficiency of phosphorus removal was significantly improved [27]. These relationships may partly be explained by the fact that there are sufficient adsorption sites on the surface of the adsorbent. At the same time, the initial phosphate concentration in the solution is high, so a
2 3 4 5 6
30
35
40
45
50
55
60
65
P re
mov
al (%
)
RSPRC dosage (g)
0 20 40 60 80 100 120 140 1600.10
0.15
0.20
0.25
0.30
0.35
0.40
0.45
0.50
Efflu
ent P
con
c. (m
g/L)
Contact time (h)
2 g 3 g 4 g 5 g 6 g
Figure 6. Effect of RSPRC dosage on phosphorus removal efficiency.
Appl. Sci. 2020, 10, x FOR PEER REVIEW 9 of 16
the contact time. However, there were no further increases in the percentage of phosphate removal after 20 h [26].
Figure 6. Effect of RSPRC dosage on phosphorus removal efficiency.
Figure 7. Effect of contact time on phosphorus removal efficiency.
The experimental results on the effect of initial phosphorus concentration on the phosphorus removal of RSPRC are presented in Figure 8. The adsorption capacity (Qe, mg/g) or amount of phosphorus adsorbed by RSPRC significantly increased when the initial P concentration increased. As the contact time is increased, the higher the initial P concentration is, the faster the amount of phosphorus adsorbed by RSPRC is increased. This result indicates that, under the reaction conditions with a high P concentration, the amount of phosphorus adsorbed by RSPRC increased and the efficiency of phosphorus removal was significantly improved [27]. These relationships may partly be explained by the fact that there are sufficient adsorption sites on the surface of the adsorbent. At the same time, the initial phosphate concentration in the solution is high, so a
2 3 4 5 6
30
35
40
45
50
55
60
65
P re
mov
al (%
)
RSPRC dosage (g)
0 20 40 60 80 100 120 140 1600.10
0.15
0.20
0.25
0.30
0.35
0.40
0.45
0.50
Efflu
ent P
con
c. (m
g/L)
Contact time (h)
2 g 3 g 4 g 5 g 6 g
Figure 7. Effect of contact time on phosphorus removal efficiency.
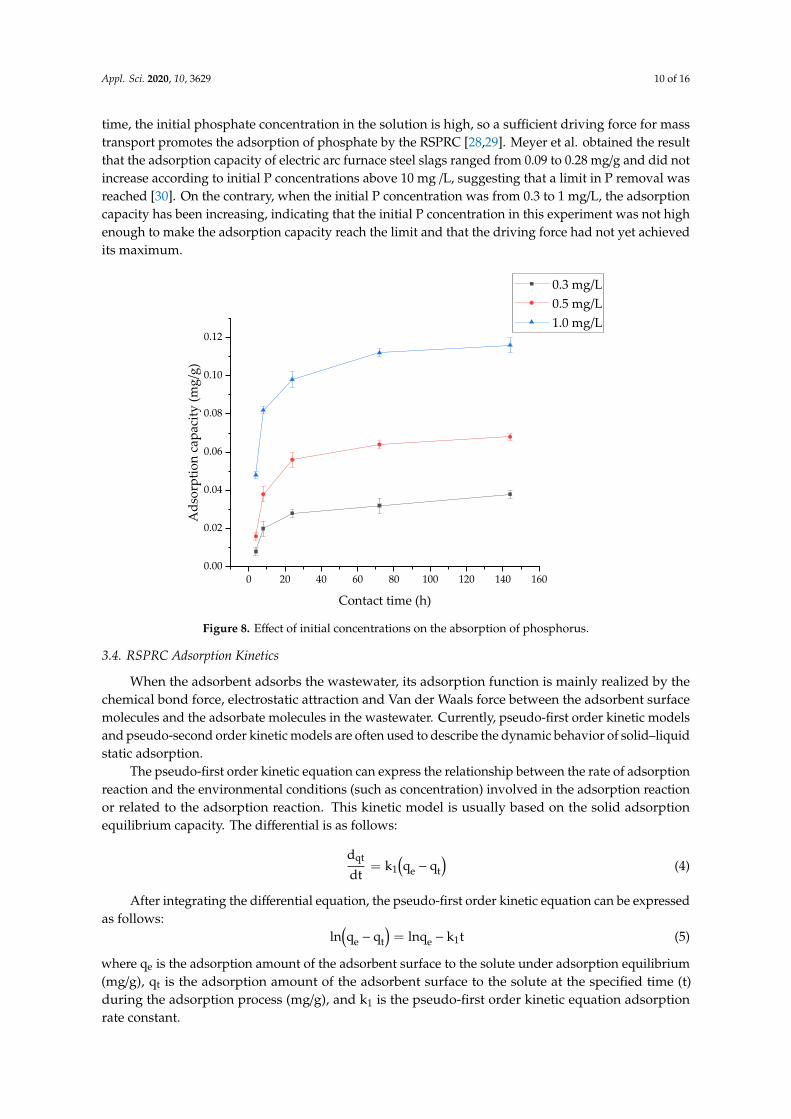
The experimental results on the effect of initial phosphorus concentration on the phosphorusremoval of RSPRC are presented in Figure 8. The adsorption capacity (Qe, mg/g) or amount ofphosphorus adsorbed by RSPRC significantly increased when the initial P concentration increased.As the contact time is increased, the higher the initial P concentration is, the faster the amount ofphosphorus adsorbed by RSPRC is increased. This result indicates that, under the reaction conditionswith a high P concentration, the amount of phosphorus adsorbed by RSPRC increased and the efficiencyof phosphorus removal was significantly improved [27]. These relationships may partly be explainedby the fact that there are sufficient adsorption sites on the surface of the adsorbent. At the same
Appl. Sci. 2020, 10, 3629 10 of 16
time, the initial phosphate concentration in the solution is high, so a sufficient driving force for masstransport promotes the adsorption of phosphate by the RSPRC [28,29]. Meyer et al. obtained the resultthat the adsorption capacity of electric arc furnace steel slags ranged from 0.09 to 0.28 mg/g and did notincrease according to initial P concentrations above 10 mg /L, suggesting that a limit in P removal wasreached [30]. On the contrary, when the initial P concentration was from 0.3 to 1 mg/L, the adsorptioncapacity has been increasing, indicating that the initial P concentration in this experiment was not highenough to make the adsorption capacity reach the limit and that the driving force had not yet achievedits maximum.
Appl. Sci. 2020, 10, x FOR PEER REVIEW 10 of 16
sufficient driving force for mass transport promotes the adsorption of phosphate by the RSPRC [28,29]. Meyer et al. obtained the result that the adsorption capacity of electric arc furnace steel slags ranged from 0.09 to 0.28 mg/g and did not increase according to initial P concentrations above 10 mg /L, suggesting that a limit in P removal was reached [30]. On the contrary, when the initial P concentration was from 0.3 to 1 mg/L, the adsorption capacity has been increasing, indicating that the initial P concentration in this experiment was not high enough to make the adsorption capacity reach the limit and that the driving force had not yet achieved its maximum.
Figure 8. Effect of initial concentrations on the absorption of phosphorus.
3.4. RSPRC Adsorption Kinetics
When the adsorbent adsorbs the wastewater, its adsorption function is mainly realized by the chemical bond force, electrostatic attraction and Van der Waals force between the adsorbent surface molecules and the adsorbate molecules in the wastewater. Currently, pseudo-first order kinetic models and pseudo-second order kinetic models are often used to describe the dynamic behavior of solid–liquid static adsorption.
The pseudo-first order kinetic equation can express the relationship between the rate of adsorption reaction and the environmental conditions (such as concentration) involved in the adsorption reaction or related to the adsorption reaction. This kinetic model is usually based on the solid adsorption equilibrium capacity. The differential is as follows: ddt = k (q − q ) (4)
After integrating the differential equation, the pseudo-first order kinetic equation can be expressed as follows: ln(q − q ) = lnq − k t (5)
where qe is the adsorption amount of the adsorbent surface to the solute under adsorption equilibrium (mg/g), qt is the adsorption amount of the adsorbent surface to the solute at the specified time (t) during the adsorption process (mg/g), and k1 is the pseudo-first order kinetic equation adsorption rate constant.
The pseudo-second order kinetic model is applicable to the solid–liquid static adsorption reaction in the presence of a saturated site, which can effectively represent the composite effect
0 20 40 60 80 100 120 140 1600.00
0.02
0.04
0.06
0.08
0.10
0.12
Ads
orpt
ion
capa
city
(mg/
g)
Contact time (h)
0.3 mg/L 0.5 mg/L 1.0 mg/L
Figure 8. Effect of initial concentrations on the absorption of phosphorus.
3.4. RSPRC Adsorption Kinetics
When the adsorbent adsorbs the wastewater, its adsorption function is mainly realized by thechemical bond force, electrostatic attraction and Van der Waals force between the adsorbent surfacemolecules and the adsorbate molecules in the wastewater. Currently, pseudo-first order kinetic modelsand pseudo-second order kinetic models are often used to describe the dynamic behavior of solid–liquidstatic adsorption.
The pseudo-first order kinetic equation can express the relationship between the rate of adsorptionreaction and the environmental conditions (such as concentration) involved in the adsorption reactionor related to the adsorption reaction. This kinetic model is usually based on the solid adsorptionequilibrium capacity. The differential is as follows:
dqt
dt= k1
(qe − qt
)(4)
After integrating the differential equation, the pseudo-first order kinetic equation can be expressedas follows:
ln(qe − qt
)= lnqe − k1t (5)
where qe is the adsorption amount of the adsorbent surface to the solute under adsorption equilibrium(mg/g), qt is the adsorption amount of the adsorbent surface to the solute at the specified time (t)during the adsorption process (mg/g), and k1 is the pseudo-first order kinetic equation adsorptionrate constant.
Appl. Sci. 2020, 10, 3629 11 of 16
The pseudo-second order kinetic model is applicable to the solid–liquid static adsorption reactionin the presence of a saturated site, which can effectively represent the composite effect under theaction of multiple adsorption mechanisms. Generally, the kinetic model is based on the adsorptionequilibrium capacity. The differential is as follows:
dqt
dt= k2
(qe − qt
)(6)
After integrating the differential equation, the pseudo-second order kinetic equation can beexpressed as follows:
tqt
=1
k2qe2 +
1qe
t (7)
where qe is the adsorption amount of the adsorbent surface to the solute under adsorption equilibrium(mg/g), qt is the adsorption amount of the adsorbent surface to the solute at the specified time (t)during the adsorption process (mg/g), and k2 is the pseudo-second order kinetic equation adsorptionrate constant.
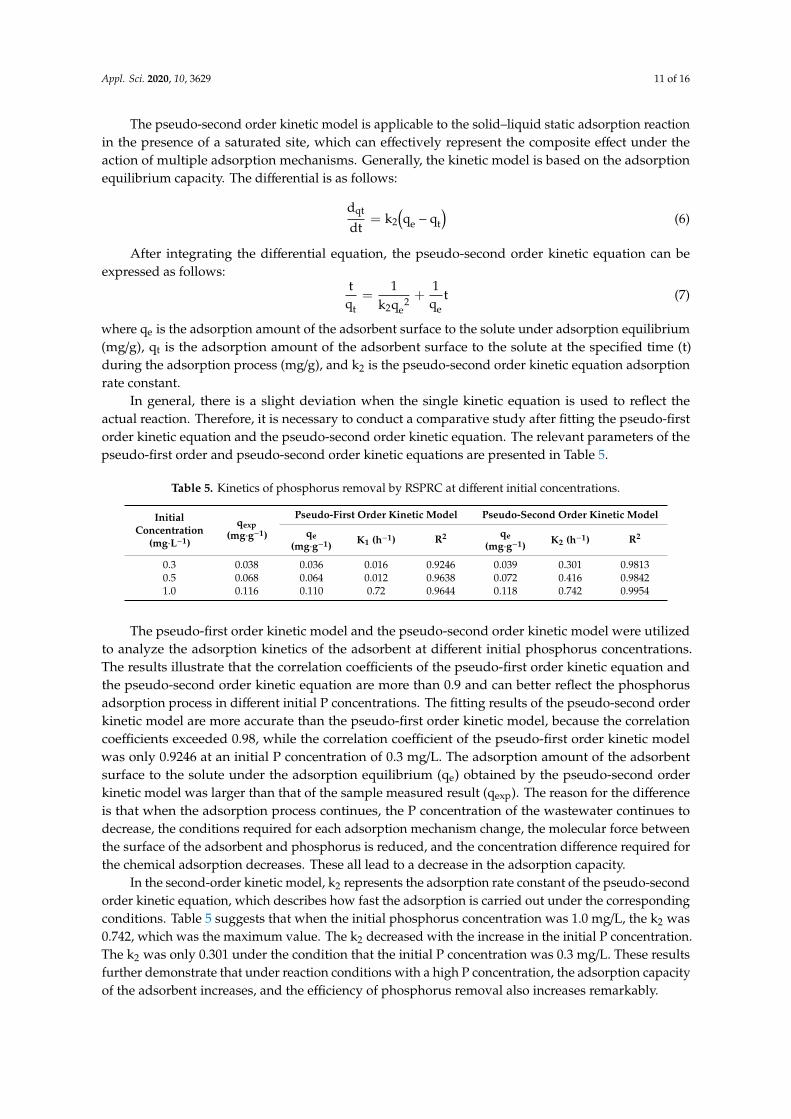
In general, there is a slight deviation when the single kinetic equation is used to reflect theactual reaction. Therefore, it is necessary to conduct a comparative study after fitting the pseudo-firstorder kinetic equation and the pseudo-second order kinetic equation. The relevant parameters of thepseudo-first order and pseudo-second order kinetic equations are presented in Table 5.
Table 5. Kinetics of phosphorus removal by RSPRC at different initial concentrations.
InitialConcentration
(mg·L−1)
qexp(mg·g−1)
Pseudo-First Order Kinetic Model Pseudo-Second Order Kinetic Model
qe(mg·g−1) K1 (h−1) R2 qe
(mg·g−1) K2 (h−1) R2
0.3 0.038 0.036 0.016 0.9246 0.039 0.301 0.98130.5 0.068 0.064 0.012 0.9638 0.072 0.416 0.98421.0 0.116 0.110 0.72 0.9644 0.118 0.742 0.9954
The pseudo-first order kinetic model and the pseudo-second order kinetic model were utilizedto analyze the adsorption kinetics of the adsorbent at different initial phosphorus concentrations.The results illustrate that the correlation coefficients of the pseudo-first order kinetic equation andthe pseudo-second order kinetic equation are more than 0.9 and can better reflect the phosphorusadsorption process in different initial P concentrations. The fitting results of the pseudo-second orderkinetic model are more accurate than the pseudo-first order kinetic model, because the correlationcoefficients exceeded 0.98, while the correlation coefficient of the pseudo-first order kinetic modelwas only 0.9246 at an initial P concentration of 0.3 mg/L. The adsorption amount of the adsorbentsurface to the solute under the adsorption equilibrium (qe) obtained by the pseudo-second orderkinetic model was larger than that of the sample measured result (qexp). The reason for the differenceis that when the adsorption process continues, the P concentration of the wastewater continues todecrease, the conditions required for each adsorption mechanism change, the molecular force betweenthe surface of the adsorbent and phosphorus is reduced, and the concentration difference required forthe chemical adsorption decreases. These all lead to a decrease in the adsorption capacity.
In the second-order kinetic model, k2 represents the adsorption rate constant of the pseudo-secondorder kinetic equation, which describes how fast the adsorption is carried out under the correspondingconditions. Table 5 suggests that when the initial phosphorus concentration was 1.0 mg/L, the k2 was0.742, which was the maximum value. The k2 decreased with the increase in the initial P concentration.The k2 was only 0.301 under the condition that the initial P concentration was 0.3 mg/L. These resultsfurther demonstrate that under reaction conditions with a high P concentration, the adsorption capacityof the adsorbent increases, and the efficiency of phosphorus removal also increases remarkably.
Appl. Sci. 2020, 10, 3629 12 of 16
3.5. Effect of RSPRC Distribution in Reactor on Phosphorus Removal
As mentioned in Table 6, phosphorus removal performance reached a low point under experimentalcondition a. The concentration of effluent P amounted to 0.34 mg/L and the phosphorus removal ratewas merely 32%. Based on further analysis, the adsorbent was concentratedly distributed betweenadjacent diversion walls. Although the adsorbent can absorb phosphorus in the nearby wastewaterwith a higher efficiency, overall, P concentration of the wastewater is lower, and the solute concentrationgradient affecting the diffusion rate is smaller. Therefore, the phosphorus in the wastewater is diffusedwith difficulty and it is unable to sufficiently contact the adsorbent. Ultimately, the adsorption capacityof RSPRC is not fully utilized [31,32]. Under the experimental condition d, the equal spacing of theadsorbent is evenly distributed between the adjacent diversion walls, which increases the contact areawith the sewage. As a result, the phosphorus adsorbate in wastewater can be efficiently absorbed [33]and the role of the adsorbent can be completely utilized to increase the unit adsorption amount of theadsorbent. The effluent P concentration in experimental condition d was the lowest at only 0.08 mg/Land the phosphorus removal rate reached up to 84%. Ragheb observed that the removal of P increasedwith the increase in rpm to some extent and attributed it to the dispersal of the adsorbent particles in theaqueous solution, which leads to a reduced boundary mass transfer [34]. The dispersive distributionof the adsorbent increases the removal rate, whose mechanism is similar to that of the increase inrpm. In an attempt to achieve the best static adsorption phosphorus removal result in the concentriccircular diversion wall adsorption reactor, the experimental condition d was selected as the adsorbentdistribution in the subsequent experiments.
Table 6. Effect of experimental condition in reactor on phosphorus removal.
Experimental Condition Initial Concentration(mg/L)
Effluent Concentration(mg/L)
Phosphorus RemovalRate (%)
a 0.50 0.34 32b 0.50 0.28 44c 0.50 0.18 64d 0.50 0.08 84
3.6. Effect of RSPRC Dosage in Reactor on Phosphorus Removal
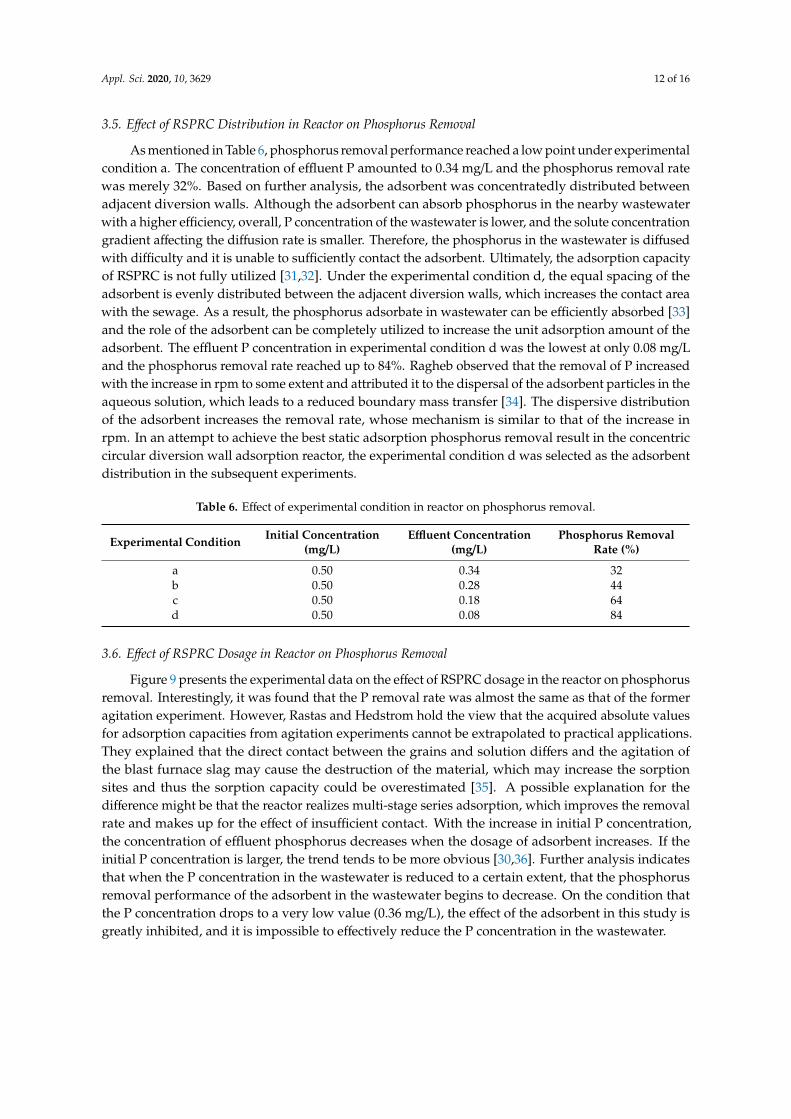
Figure 9 presents the experimental data on the effect of RSPRC dosage in the reactor on phosphorusremoval. Interestingly, it was found that the P removal rate was almost the same as that of the formeragitation experiment. However, Rastas and Hedstrom hold the view that the acquired absolute valuesfor adsorption capacities from agitation experiments cannot be extrapolated to practical applications.They explained that the direct contact between the grains and solution differs and the agitation ofthe blast furnace slag may cause the destruction of the material, which may increase the sorptionsites and thus the sorption capacity could be overestimated [35]. A possible explanation for thedifference might be that the reactor realizes multi-stage series adsorption, which improves the removalrate and makes up for the effect of insufficient contact. With the increase in initial P concentration,the concentration of effluent phosphorus decreases when the dosage of adsorbent increases. If theinitial P concentration is larger, the trend tends to be more obvious [30,36]. Further analysis indicatesthat when the P concentration in the wastewater is reduced to a certain extent, that the phosphorusremoval performance of the adsorbent in the wastewater begins to decrease. On the condition thatthe P concentration drops to a very low value (0.36 mg/L), the effect of the adsorbent in this study isgreatly inhibited, and it is impossible to effectively reduce the P concentration in the wastewater.
Appl. Sci. 2020, 10, 3629 13 of 16Appl. Sci. 2020, 10, x FOR PEER REVIEW 13 of 16
Figure 9. Effect of RSPRC dosage in the reactor on the effluent phosphorus concentration.
3.7. Effect of HRT in Reactor on Phosphorus Removal
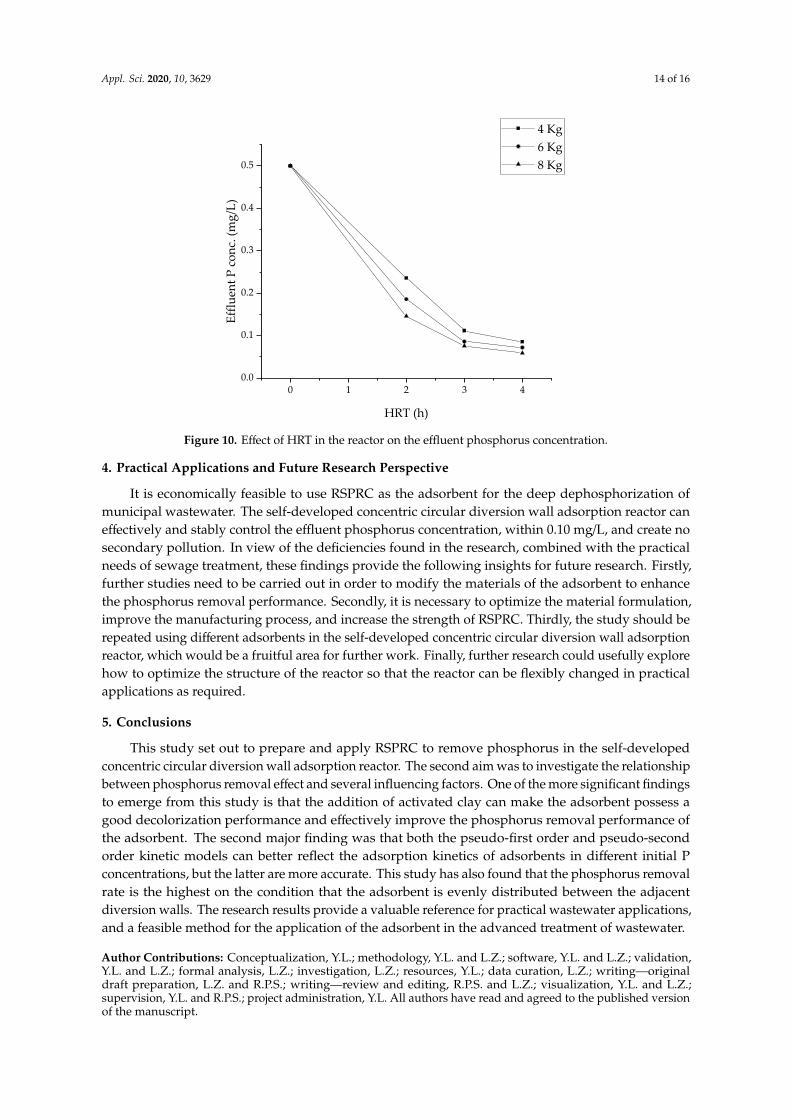
The results of the effect of hydraulic retention time in reactor on phosphorus removal are presented in Figure 10. In cases where the HRT increases, the phosphorus removal rate increases significantly at a low adsorbent dosage, but with an increasing adsorbent dosage, the increase in the phosphorus removal rate of the adsorption reactor slows down [26,37]. The trend is similar to that of agitation experiments. Lu et al. achieved the same result. They explained that the rapid initial removal was mainly attributed to the precipitation of phosphate with exchangeable and dissolved Ca2+ rather than the adsorption. The liberated Ca2+ from the exchange site or from the dissolution of CaCO3, CaO and Ca(OH)2 were preferably precipitated by phosphate, which gave a high initial rate of adsorption. The exact contribution of the adsorption and precipitation phases to the removal of phosphate remains unclear [38]. Another possible explanation might be that when the HRT is short, the dosage of the adsorbent selected in the experiment cannot balance the adsorption reaction in the wastewater. In other words, the P concentration differs greatly from the equilibrium state. Although the reaction effect of the adsorbent has declined, the removal efficiency has not been excessively inhibited. An earlier study revealed that when the HRT is long, the instantaneous P concentration of the wastewater approaches the equilibrium state of the reaction, where the function of the adsorbent is obviously suppressed [39,40]. In cases where the dosage increases, the removal rate of phosphorus in the wastewater is still extremely slow. This is reflected in the fact that the longer the hydraulic retention time is, the smaller the influence of the adsorbent dosage on the P concentration of the effluent is.
4 5 6 7 8 9 100.03
0.04
0.05
0.06
0.07
0.08
0.09
0.10
0.11
0.12
Efflu
ent P
con
c. (m
g/L)
RSPRC dosage (Kg)
0.3 mg/L 0.4 mg/L 0.5 mg/L
Figure 9. Effect of RSPRC dosage in the reactor on the effluent phosphorus concentration.
3.7. Effect of HRT in Reactor on Phosphorus Removal
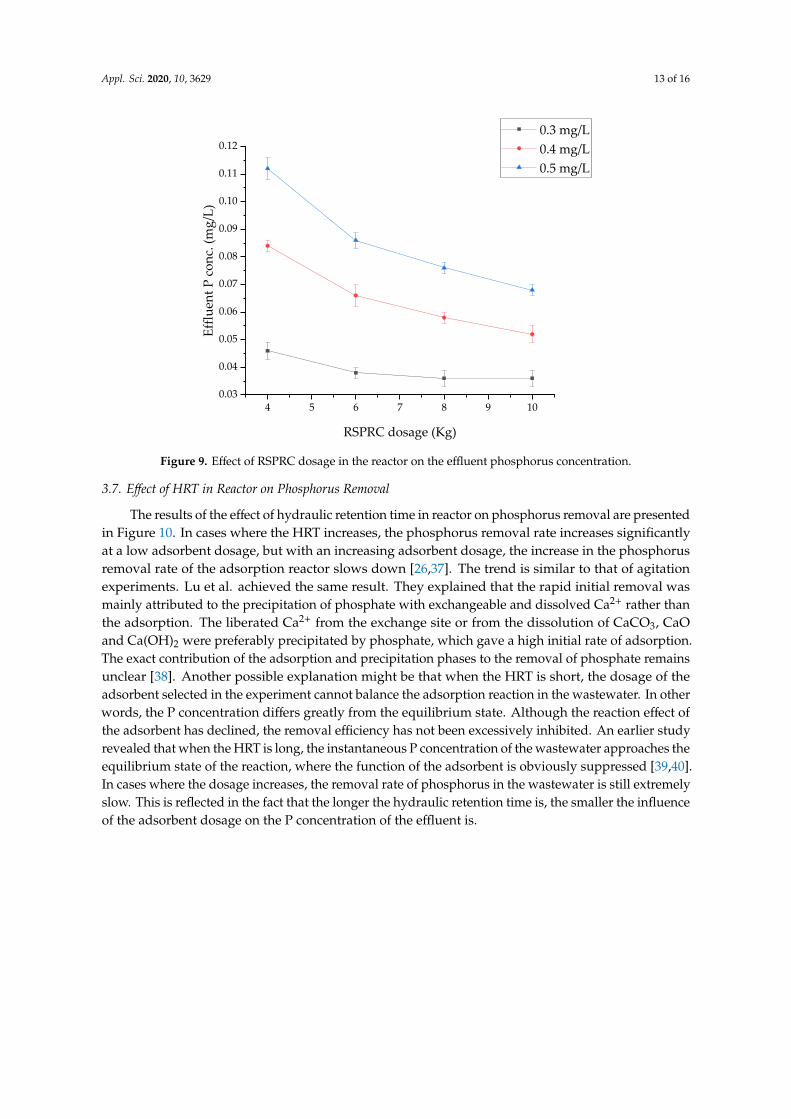
The results of the effect of hydraulic retention time in reactor on phosphorus removal are presentedin Figure 10. In cases where the HRT increases, the phosphorus removal rate increases significantlyat a low adsorbent dosage, but with an increasing adsorbent dosage, the increase in the phosphorusremoval rate of the adsorption reactor slows down [26,37]. The trend is similar to that of agitationexperiments. Lu et al. achieved the same result. They explained that the rapid initial removal wasmainly attributed to the precipitation of phosphate with exchangeable and dissolved Ca2+ rather thanthe adsorption. The liberated Ca2+ from the exchange site or from the dissolution of CaCO3, CaOand Ca(OH)2 were preferably precipitated by phosphate, which gave a high initial rate of adsorption.The exact contribution of the adsorption and precipitation phases to the removal of phosphate remainsunclear [38]. Another possible explanation might be that when the HRT is short, the dosage of theadsorbent selected in the experiment cannot balance the adsorption reaction in the wastewater. In otherwords, the P concentration differs greatly from the equilibrium state. Although the reaction effect ofthe adsorbent has declined, the removal efficiency has not been excessively inhibited. An earlier studyrevealed that when the HRT is long, the instantaneous P concentration of the wastewater approaches theequilibrium state of the reaction, where the function of the adsorbent is obviously suppressed [39,40].In cases where the dosage increases, the removal rate of phosphorus in the wastewater is still extremelyslow. This is reflected in the fact that the longer the hydraulic retention time is, the smaller the influenceof the adsorbent dosage on the P concentration of the effluent is.
Appl. Sci. 2020, 10, 3629 14 of 16Appl. Sci. 2020, 10, x FOR PEER REVIEW 14 of 16
Figure 10. Effect of HRT in the reactor on the effluent phosphorus concentration.
4. Practical Applications and Future Research Perspective
It is economically feasible to use RSPRC as the adsorbent for the deep dephosphorization of municipal wastewater. The self-developed concentric circular diversion wall adsorption reactor can effectively and stably control the effluent phosphorus concentration, within 0.10 mg/L, and create no secondary pollution. In view of the deficiencies found in the research, combined with the practical needs of sewage treatment, these findings provide the following insights for future research. Firstly, further studies need to be carried out in order to modify the materials of the adsorbent to enhance the phosphorus removal performance. Secondly, it is necessary to optimize the material formulation, improve the manufacturing process, and increase the strength of RSPRC. Thirdly, the study should be repeated using different adsorbents in the self-developed concentric circular diversion wall adsorption reactor, which would be a fruitful area for further work. Finally, further research could usefully explore how to optimize the structure of the reactor so that the reactor can be flexibly changed in practical applications as required.
5. Conclusions
This study set out to prepare and apply RSPRC to remove phosphorus in the self-developed concentric circular diversion wall adsorption reactor. The second aim was to investigate the relationship between phosphorus removal effect and several influencing factors. One of the more significant findings to emerge from this study is that the addition of activated clay can make the adsorbent possess a good decolorization performance and effectively improve the phosphorus removal performance of the adsorbent. The second major finding was that both the pseudo-first order and pseudo-second order kinetic models can better reflect the adsorption kinetics of adsorbents in different initial P concentrations, but the latter are more accurate. This study has also found that the phosphorus removal rate is the highest on the condition that the adsorbent is evenly distributed between the adjacent diversion walls. The research results provide a valuable reference for practical wastewater applications, and a feasible method for the application of the adsorbent in the advanced treatment of wastewater.
Author Contributions: Conceptualization, Y.L.; methodology, Y.L. and L.Z.; software, Y.L. and L.Z.; validation, Y.L. and L.Z.; formal analysis, L.Z.; investigation, L.Z.; resources, Y.L.; data curation, L.Z.;
0 1 2 3 40.0
0.1
0.2
0.3
0.4
0.5
Efflu
ent P
con
c. (m
g/L)
HRT (h)
4 Kg 6 Kg 8 Kg
Figure 10. Effect of HRT in the reactor on the effluent phosphorus concentration.
4. Practical Applications and Future Research Perspective
It is economically feasible to use RSPRC as the adsorbent for the deep dephosphorization ofmunicipal wastewater. The self-developed concentric circular diversion wall adsorption reactor caneffectively and stably control the effluent phosphorus concentration, within 0.10 mg/L, and create nosecondary pollution. In view of the deficiencies found in the research, combined with the practicalneeds of sewage treatment, these findings provide the following insights for future research. Firstly,further studies need to be carried out in order to modify the materials of the adsorbent to enhancethe phosphorus removal performance. Secondly, it is necessary to optimize the material formulation,improve the manufacturing process, and increase the strength of RSPRC. Thirdly, the study should berepeated using different adsorbents in the self-developed concentric circular diversion wall adsorptionreactor, which would be a fruitful area for further work. Finally, further research could usefully explorehow to optimize the structure of the reactor so that the reactor can be flexibly changed in practicalapplications as required.
5. Conclusions
This study set out to prepare and apply RSPRC to remove phosphorus in the self-developedconcentric circular diversion wall adsorption reactor. The second aim was to investigate the relationshipbetween phosphorus removal effect and several influencing factors. One of the more significant findingsto emerge from this study is that the addition of activated clay can make the adsorbent possess agood decolorization performance and effectively improve the phosphorus removal performance ofthe adsorbent. The second major finding was that both the pseudo-first order and pseudo-secondorder kinetic models can better reflect the adsorption kinetics of adsorbents in different initial Pconcentrations, but the latter are more accurate. This study has also found that the phosphorus removalrate is the highest on the condition that the adsorbent is evenly distributed between the adjacentdiversion walls. The research results provide a valuable reference for practical wastewater applications,and a feasible method for the application of the adsorbent in the advanced treatment of wastewater.
Author Contributions: Conceptualization, Y.L.; methodology, Y.L. and L.Z.; software, Y.L. and L.Z.; validation,Y.L. and L.Z.; formal analysis, L.Z.; investigation, L.Z.; resources, Y.L.; data curation, L.Z.; writing—originaldraft preparation, L.Z. and R.P.S.; writing—review and editing, R.P.S. and L.Z.; visualization, Y.L. and L.Z.;supervision, Y.L. and R.P.S.; project administration, Y.L. All authors have read and agreed to the published versionof the manuscript.
Appl. Sci. 2020, 10, 3629 15 of 16
Funding: This research received no external funding.
Acknowledgments: The authors would like to show their gratitude to all those who helped during theexperimental period and writing of this manuscript. L.Z. would like to gratefully acknowledge the help of RajendraPrasad Singh, School of Civil Engineering, Southeast University. I appreciate his patience, encouragement andprofessional instructions.
Conflicts of Interest: The authors declare no conflict of interest.
References
1. Schindler, D.W.; Carpenter, S.R.; Chapra, S.C.; Hecky, R.E.; Orihel, D.M. Reducing phosphorus to curb lakeeutrophication is a success. Environ. Sci. Technol. 2016, 50, 8923–8929. [CrossRef] [PubMed]
2. Mishra, S.; Kumar, A. Estimation of physicochemical characteristics and associated metal contamination riskin the Narmada River, India. Environ. Eng. Res. 2020, 26, 190521. [CrossRef]
3. Loganathan, P.; Vigneswaran, S.; Kandasamy, J.; Bolan, N.S. Removal and recovery of phosphate from waterusing sorption. Crit. Rev. Environ. Sci. Technol. 2014, 44, 847–907. [CrossRef]
4. Kumar, A.; Sharma, M.P.; Taxak, A.K. Analysis of water environment changing trend in Bhagirathi tributaryof Ganges in India. Desalin. Water Treat. 2017, 63, 55–62. [CrossRef]
5. Kumar, A.; Sharma, M.P.; Rai, S.P. A novel approach for river health assessment of Chambal using fuzzymodeling, India. Desalin. Water Treat. 2017, 58, 72–79. [CrossRef]
6. Li, Y.; He, X.; Hu, H. Enhanced phosphate removal from wastewater by using in situ generated fresh trivalentFe composition through the interaction of Fe(II) on CaCO3. J. Environ. Manag. 2018, 221, 38–44. [CrossRef]
7. Benammar, L.; Menasria, T.; Ayachi, A.; Benounis, M. Phosphate removal using aerobic bacterial consortiumand pure cultures isolated from activated sludge. Process Saf. Environ. 2015, 95, 237–246. [CrossRef]
8. Wang, Y.; Liu, L.; Fan, W.; Yuan, L.; Luo, D. The mechanism of biological phosphorus removal underanoxic-aerobic alternation condition with starch as sole carbon source and its biochemical pathway. Biochem.Eng. J. 2018, 132, 90–99. [CrossRef]
9. Mitrogiannis, D.; Psychoyou, M.; Baziotis, I.; Inglezakis, V.J.; Koukouzas, N.; Tsoukalas, N.; Palles, D.;Kamitsos, E.; Oikonomou, G.; Markou, G. Removal of phosphate from aqueous solutions by adsorption ontoCa(OH)(2) treated natural clinoptilolite. Chem. Eng. J. 2017, 320, 510–522. [CrossRef]
10. Kuroki, V.; Bosco, G.E.; Fadini, P.S.; Mozeto, A.A.; Cestari, A.R.; Carvalho, W.A. Use of a La(III)-modifiedbentonite for effective phosphate removal from aqueous media. J. Hazard. Mater. 2014, 274, 124–131.[CrossRef]
11. Mulkerrins, D.; Dobson, A.; Colleran, E. Parameters affecting biological phosphate removal from wastewaters.Environ. Int. 2004, 30, 249–259. [CrossRef]
12. Lei, G.; Zhang, B.H. Progress of phosphorus wastewater treatment technology. Energy Conserv. Emiss. Reduct.Pet. Petrochem. Ind. 2013, 3, 37–40. (In Chinese)
13. Bhatnagar, A.; Sillanpaa, M. A review of emerging adsorbents for nitrate removal from water. Biochem. Eng. J.2011, 168, 493–504. [CrossRef]
14. Ahmed, S.; Ashiq, M.N.; Li, D.; Tang, P.; Leroux, F.; Feng, Y. Recent progress on adsorption materials forphosphate removal. Recent Pat. Nanotechnol. 2019, 13, 3–16. [CrossRef]
15. Lakshmi, V.; Resmi, V.G.; Raju, A.; Deepa, J.P.; Rajan, T.P.D.; Pavithran, C.; Pai, B.C. Concentration dependentpore morphological tuning of kaolin clay foams using sodium dodecyl sulfate as foaming agent. Ceram. Int.2015, 41, 14263–14269. [CrossRef]
16. Zhang, W. Progress in the application of bentonite to the adsorption for inorganic pollutants in waterpollution control. Ind. Water Treat. 2018, 38, 10–16. (In Chinese)
17. Wang, T.; Liu, T.; Wu, D.; Li, M.; Chen, J.; Teng, S. Performance of phosphoric acid activated montmorilloniteas buffer materials for radioactive waste repository. J. Hazard. Mater. 2010, 173, 335–342. [CrossRef]
18. Wu, L.L.; Liu, Y.; Wang, S.H.; Zhang, H.; Huang, M. Effects of the particle size and pH value on EPRC inphosphate removal. Saf. Environ. Eng. 2008, 15, 45–48. (In Chinese)
19. Zhou, J. Study on Phosphorus Removal Characteristics of Perforated EPRC. Master’s Thesis,Southeast University, Nanjing, China, 2010. (In Chinese)
20. Standard Methods for the Examination of Water and Wastewater; APHA (American Public Health Association):Washington, DC, USA, 1989.
Appl. Sci. 2020, 10, 3629 16 of 16
21. Gamba, M.; Kovar, P.; Pospisil, M.; Torres Sanchez, R.M. Insight into thiabendazole interaction withmontmorillonite and organically modified montmorillonites. Appl. Clay Sci. 2017, 137, 59–68. [CrossRef]
22. Ashekuzzaman, S.M.; Jiang, J. Study on the sorption-desorption-regeneration performance of Ca-, Mg- andCaMg-based layered double hydroxides for removing phosphate from water. Biochem. Eng. J. 2014, 246,97–105. [CrossRef]
23. Patra, B.S.; Baliarsingh, N.; Parida, K.M.; Das, J. Adsorption of phosphate by layered double hydroxides inaqueous solutions. Appl. Clay Sci. 2006, 32, 252–260.
24. Wang, H.Z.; Song, W.D.; Xing, K.; Zhao, Z.P.; Guo, L.G. Adsorption of tripolyphosphate from aqueoussolution by Mg-Al-CO3-layered double hydroxides. Colloids Surf. A 2008, 328, 15–20.
25. Li, J.; Wu, B.; Zhou, T.; Chai, X. Preferential removal of phosphorus using modified steel slag and cementcombination for its implications in engineering applications. Environ. Technol. Innov. 2018, 10, 264–274.[CrossRef]
26. Shan, H.D.; Lu, S.G.; Bai, S.Q.; Zhu, L. Removal mechanism of phosphate from aqueous solution by fly ash.J. Hazard. Mater. 2009, 161, 95–101.
27. Agyei, N.M.; Strydom, C.A.; Potgieter, J.H. The removal of phosphate ions from aqueous solution by fly ash,slag, ordinary Portland cement and related blends. Cem. Concr. Res. 2002, 32, 1889–1897. [CrossRef]
28. Li, X.; Wang, G.; Li, W.; Wang, P.; Su, C. Adsorption of acid and basic dyes by sludge-based activated carbon:Isotherm and kinetic studies. J. Central South. Univ. 2015, 22, 103–113. [CrossRef]
29. Zhao, Y.Q.; Babatunde, A.O. Equilibrium and kinetic analysis of phosphorus adsorption from aqueoussolution using waste alum sludge. J. Hazard. Mater. 2010, 184, 746–752.
30. Meyer, D.; Andres, Y.; Chazarenc, F.; Barca, C.; Gerente, C. Phosphate removal from synthetic and realwastewater using steel slags produced in Europe. Water Res. 2012, 46, 2376–2384.
31. Liu, Y.; Li, L.; Zhang, S.J.; Wang, S.H. Kinetics and thermodynamics of efficient phosphorus removal by acomplex material. Desalin. Water Treat. 2015, 56, 1949–1954. [CrossRef]
32. Yao, X.D.; Haghseresht, F.; Wang, S.B.; Rudolph, V.; Zhu, Z.H.; Li, L.; Huang, W.W. Phosphate removal fromwastewater using red mud. J. Hazard. Mater. 2008, 158, 35–42.
33. Goscianska, J.; Ptaszkowska-Koniarz, M.; Frankowski, M.; Franus, M.; Panek, R.; Franus, W. Removal ofphosphate from water by lanthanum-modified zeolites obtained from fly ash. J. Colloid Inter. Sci. 2018, 513,72–81. [CrossRef] [PubMed]
34. Ragheb, S.M. Phosphate removal from aqueous solution using slag and fly ash. HBRC J. 2013, 9, 270–275.[CrossRef]
35. Rastas, L.; Hedstrom, A. Methodological aspects of using blast furnace slag for wastewater phosphorusremoval. J. Environ. Eng. 2006, 132, 1431–1438.
36. Molle, P.; Saenz De Miera, L.E.; Blanco, I.; Ansola, G. Basic Oxygen Furnace steel slag aggregates forphosphorus treatment. Evaluation of its potential use as a substrate in constructed wetlands. Water Res.2016, 89, 355–365.
37. Senan, P.; Anirudhan, T.S. Adsorption of phosphate ions from water using a novel cellulose-based adsorbent.Chem. Ecol. 2011, 27, 147–164.
38. Lu, S.G.; Shan, H.D.; Bai, S.Q. Mechanisms of phosphate removal from aqueous solution by blast furnaceslag and steel furnace slag. J. Zhejiang Univ. Sci. A 2008, 9, 125–132. [CrossRef]
39. Pengthamkeerati, P.; Satapanajaru, T.; Chularuengoaksorn, P. Chemical modification of coal fly ash for theremoval of phosphate from aqueous solution. Fuel 2008, 87, 2469–2476. [CrossRef]
40. Kumar, A.; Mishra, S. Environmental quantification of soil elements in the catchment of hydroelectricreservoirs in India. Hum. Ecolog. Risk Asses 2017, 23, 1202–1218. [CrossRef]
© 2020 by the authors. Licensee MDPI, Basel, Switzerland. This article is an open accessarticle distributed under the terms and conditions of the Creative Commons Attribution(CC BY) license (http://creativecommons.org/licenses/by/4.0/).


