Embed Size (px)
Citation preview

Volume 2
Environment-Friendly Construction Materials
Shaopeng Wu, Inge Hoff, Serji N. Amirkhanian and Yue Xiao
www.mdpi.com/journal/materials
Edited by
Printed Edition of the Special Issue Published in Materials

Environment-Friendly ConstructionMaterials


Environment-Friendly ConstructionMaterials
Volume 2
Special Issue Editors
Shaopeng Wu
Inge Hoff
Serji N. Amirkhanian
Yue Xiao
MDPI • Basel • Beijing • Wuhan • Barcelona • Belgrade
Special Issue Editors
Shaopeng Wu
Wuhan University of Technology
(WUT)
China
Inge Hoff
Norwegian University of Science and Technology
(NTNU)
Norway
Serji N. Amirkhanian
University of Alabama
USA
Yue Xiao
Wuhan University of Technology (WUT)
China
Editorial Office
MDPI
St. Alban-Anlage 66
4052 Basel, Switzerland
This is a reprint of articles from the Special Issue published online in the open access journal Materials
(ISSN 1996-1944) from 2018 to 2019 (available at: https://www.mdpi.com/journal/materials/
special issues/EFCM).
For citation purposes, cite each article independently as indicated on the article page online and as
indicated below:
LastName, A.A.; LastName, B.B.; LastName, C.C. Article Title. Journal Name Year, Article Number,
Page Range.
Volume 2
ISBN 978-3-03921-014-5 (Pbk)
ISBN 978-3-03921-015-2 (PDF)
Volume 1-3
ISBN 978-3-03897-418-5 (Pbk)
ISBN 978-3-03897-419-2 (PDF)
c© 2019 by the authors. Articles in this book are Open Access and distributed under the Creative
Commons Attribution (CC BY) license, which allows users to download, copy and build upon
published articles, as long as the author and publisher are properly credited, which ensures maximum
dissemination and a wider impact of our publications.
The book as a whole is distributed by MDPI under the terms and conditions of the Creative Commons
license CC BY-NC-ND.
Contents
About the Special Issue Editors . . . . . . . . . . . . . . . . . . . . . . . . . . . . . . . . . . . . . vii
Yue Xiao, Feng Wang, Peide Cui, Lei Lei, Juntao Lin and Mingwei Yi
Evaluation of Fine Aggregate Morphology by Image Method and Its Effect on Skid-Resistanceof Micro-SurfacingReprinted from: Materials 2018, 11, 920, doi:10.3390/ma11060920 . . . . . . . . . . . . . . . . . . . 1
Yongchun Cheng, Wensheng Wang, Jinglin Tao, Meng Xu, Xiaoli Xu, Guirong Ma and
Shurong Wang
Influence Analysis and Optimization for Aggregate Morphological Characteristics on High-and Low-Temperature Viscoelasticity of Asphalt MixturesReprinted from: Materials 2018, 11, 2034, doi:10.3390/ma11102034 . . . . . . . . . . . . . . . . . . 15
Wensheng Wang, Yongchun Cheng, Guojin Tan and Jinglin Tao
Analysis of Aggregate Morphological Characteristics for Viscoelastic Properties of AsphaltMixes Using Simplex Lattice DesignReprinted from: Materials 2018, 11, 1908, doi:10.3390/ma11101908 . . . . . . . . . . . . . . . . . . 41
Fanlong Tang, Guangji Xu, Tao Ma and Lingyun Kong
Study on the Effect of Demulsification Speed of Emulsified Asphalt Based on SurfaceCharacteristics of AggregatesReprinted from: Materials 2018, 11, 1488, doi:10.3390/ma11091488 . . . . . . . . . . . . . . . . . . 61
Zhuangzhuang Liu, Xiaonan Huang, Aimin Sha, Hao Wang, Jiaqi Chen and Cheng Li
Improvement of Asphalt-Aggregate Adhesion Using Plant Ash ByproductReprinted from: Materials 2019, 12, 605, doi:10.3390/ma12040605 . . . . . . . . . . . . . . . . . . . 77
Dongliang Kuang, Yuan Jiao, Zhou Ye, Zaihong Lu, Huaxin Chen, Jianying Yu and Ning Liu
Diffusibility Enhancement of Rejuvenator by Epoxidized Soybean Oil and Its Influence on thePerformance of Recycled Hot Mix Asphalt MixturesReprinted from: Materials 2018, 11, 833, doi:10.3390/ma11050833 . . . . . . . . . . . . . . . . . . . 93
Dongliang Kuang, Zhou Ye, Lifeng Yang, Ning Liu, Zaihong Lu and Huaxin Chen
Effect of Rejuvenator Containing Dodecyl Benzene Sulfonic Acid (DBSA) on PhysicalProperties, Chemical Components, Colloidal Structure and Micro-Morphology of AgedBitumenReprinted from: Materials 2018, 11, 1476, doi:10.3390/ma11081476 . . . . . . . . . . . . . . . . . . 104
Tianyuan Yang, Meizhu Chen, Xinxing Zhou and Jun Xie
Evaluation of Thermal-Mechanical Properties of Bio-Oil Regenerated Aged AsphaltReprinted from: Materials 2018, 11, 2224, doi:10.3390/ma11112224 . . . . . . . . . . . . . . . . . . 117
Pan Pan, Yi Kuang, Xiaodi Hu and Xiao Zhang
A Comprehensive Evaluation of Rejuvenator on Mechanical Properties, Durability, andDynamic Characteristics of Artificially Aged Asphalt MixtureReprinted from: Materials 2018, 11, 1554, doi:10.3390/ma11091554 . . . . . . . . . . . . . . . . . . 129
Zhelun Li, Xiong Xu, Jianying Yu and Shaopeng Wu
Assessment on Physical and Rheological Properties of Aged SBS Modified Bitumen ContainingRejuvenating Systems of Isocyanate and Epoxy SubstancesReprinted from: Materials 2019, 12, 618, doi:10.3390/ma12040618 . . . . . . . . . . . . . . . . . . . 147
v
Shi Xu, Xueyan Liu, Amir Tabakovic and Erik Schlangen
Investigation of the Potential Use of Calcium Alginate Capsules for Self-Healing in PorousAsphalt ConcreteReprinted from: Materials 2019, 12, 168, doi:10.3390/ma12010168 . . . . . . . . . . . . . . . . . . . 158
Benan Shu, Shaopeng Wu, Lijie Dong, Qing Wang and Quantao Liu
Microfluidic Synthesis of Ca-Alginate Microcapsules for Self-Healing of Bituminous BinderReprinted from: Materials 2018, 11, 630, doi:10.3390/ma11040630 . . . . . . . . . . . . . . . . . . . 171
Jiuming Wan, Yue Xiao, Wei Song, Cheng Chen, Pan Pan and Dong Zhang
Self-Healing Property of Ultra-Thin Wearing Courses by Induction HeatingReprinted from: Materials 2018, 11, 1392, doi:10.3390/ma11081392 . . . . . . . . . . . . . . . . . . 186
Changluan Pan, Ping Tang, Martin Riara, Liantong Mo, Mingliang Li and Meng Guo
Effect of Healing Agents on Crack Healing of Asphalt and Asphalt MortarReprinted from: Materials 2018, 11, 1373, doi:10.3390/ma11081373 . . . . . . . . . . . . . . . . . . 199
Quantao Liu, Cheng Chen, Bin Li, Yihan Sun and Hechuan Li
Heating Characteristics and Induced Healing Efficiencies of Asphalt Mixture via Induction andMicrowave HeatingReprinted from: Materials 2018, 11, 913, doi:10.3390/ma11060913 . . . . . . . . . . . . . . . . . . . 217
Chao Li, Shaopeng Wu, Guanyu Tao and Yue Xiao
Initial Self-Healing Temperatures of Asphalt Mastics Based on Flow Behavior IndexReprinted from: Materials 2018, 11, 917, doi:10.3390/ma11060917 . . . . . . . . . . . . . . . . . . . 230
vi
About the Special Issue Editors
Shaopeng Wu is a chief professor of materials science and engineering at Wuhan University of
Technology. Dr. Wu is a prominent researcher in the field of bituminous materials and asphalt
pavement. He has completed research projects on subjects including electrically conductive asphalt
pavement, rubberized asphalt binder, recycling asphalt materials, self-healing asphalt, and asphalt
preventive maintenance technologies. Dr. Wu is an editor of “Journal of Testing and Evaluation” and
“International Journal of Pavement Research and Technology”, and a member of the International
Society of Asphalt Pavement. He has received 14 provincial awards, including 3 first-prize Science
and Technology Progress Awards. He has already supervised more than 30 research projects and
published more than 300 SCI peer-reviewed journal papers.
Inge Hoff started his research career in the independent research organization SINTEF (Norway)
doing contracted research projects for 10 years. Most of the projects were laboratory-based projects
financed by the Norwegian Public Roads Administration or producers of different types of materials.
Dr. Hoff was appointed to professor in 2009 and has been working at NTNU since then. He was
a supervisor of nine completed Ph.D. projects and is currently supervising six Ph.D. students.
Dr. Hoff has authored more than 80 scientific and popular scientific papers and is an active reviewer
for several international scientific journals. In addition, he has authored several SINTEF reports.
Dr. Hoff is the leader of the only research laboratory for materials for transport infrastructure in
Norway. The laboratory is used for education of master’s and Ph.D. students, project-based testing
for industry, and research purposes.
Serji N. Amirkhanian was the Mays Professor of Transportation and the director of the Asphalt
Rubber Technology Services (ARTS) in the Department of Civil Engineering at Clemson University
until June of 2010, before becoming a professor of civil engineering at the University of Alabama,
Tuscaloosa, USA. He is also a professor of civil engineering at Wuhan University of Technology
(Wuhan, China), in addition to being an adjunct professor of materials at Norwegian University of
Science and Technology (NTNU), Norway.
His research has resulted in over 300 refereed journal papers, conference papers, and research
reports. He has also published several book chapters. In addition, he has given over 300 presentations,
presenting his research findings in the US and internationally. He has supported over 100 graduate
students and over 15 post-doctoral scholars, conducting research for many agencies (e.g., the Federal
Highway Administration (FHWA)). He has consulted for many companies or agencies, such as the
World Bank, United Nations (UNIDO), BMW, Owens Corning, Michelin, Honeywell International,
Ontario Ministry of Transportation, and Honduras Ministry of Transportation, among many others.
Yue Xiao has been an associate research professor at State Key Lab of Silicate Materials for
Architectures in the Wuhan University of Technology since 2014. He was named the Fok Ying Tung
Outstanding Young Teacher by the Ministry of Education of China in 2018. He received the title
of CHUTIAN Scholar in material science and engineering from the Hubei provincial department
of education in 2014. Dr. Xiao obtained his PhD degree in road and railway engineering from Delft
University of Technology, the Netherlands. Subsequently, he joined Wuhan University of Technology.
His research interests include eco-efficient pavement materials and construction material recycling.
vii

Dr. Xiao is now conducting three innovative projects founded by the National Natural Science
Foundation of China (NSFC), as well as projects supported by provincial departments. Since 2011,
Dr. Xiao has published 49 SCI peer-reviewed journal papers.
viii


materials
Article
Evaluation of Fine Aggregate Morphology by ImageMethod and Its Effect on Skid-Resistanceof Micro-Surfacing
Yue Xiao 1,† ID , Feng Wang 1, Peide Cui 1,*, Lei Lei 2,† ID , Juntao Lin 3 and Mingwei Yi 4,5
1 State Key Laboratory of Silicate Materials for Architectures, Wuhan University of Technology,Wuhan 430070, China; [email protected] (Y.X.); [email protected] (F.W.)
2 Shenzhen MacRitchie Technology Co., Ltd., Shen Zhen 518101, China; [email protected] Faculty of Engineering, China University of Geosciences (Wuhan), Wuhan 430074, China; [email protected] National Engineering Research Center of Road Maintenance Technologies, Beijing 100095, China;
[email protected] Research Institute of Highway Ministry of Transport, Beijing 100088, China* Correspondence: [email protected] (P.C.); Tel.: +86-131-2519-2356† These authors contributed equally to this work.
Received: 5 May 2018; Accepted: 29 May 2018; Published: 29 May 2018
Abstract: Micro-surfacing is a widely used pavement preventive maintenance technology used allover the world, due to its advantages of fast construction, low maintenance cost, good waterproofness,and skid-resistance performance. This study evaluated the fine aggregate morphology and surfacetexture of micro-surfacing by AIMS (aggregate image measurement system), and explored the effectof aggregate morphology on skid-resistance of single-grade micro-surfacing. Sand patch test andBritish pendulum test were also used to detect skid-resistance for comparison with the image-basedmethod. Wet abrasion test was used to measure skid-resistance durability for feasibility verificationof single-grade micro-surfacing. The results show that the effect of Form2D on the skid-resistanceof micro-surfacing is much stronger than that of angularity. Combining the feasibility analysis ofdurability and skid-resistance, 1.18–2.36 grade micro-surfacing meets the requirements of durabilityand skid-resistance at the same time. This study also determined that, compared with Britishpendulum test, the texture result obtained by sand patch test fits better with results of image method.
Keywords: aggregate morphology; aggregate image measurement system; micro-surfacing;skid-resistance; surface texture
1. Introduction
With the development of transportation industry, the construction of the world’s highwaynetworks has gradually improved. The maintenance and disease prevention of asphalt pavementshave already attracted widespread attention. Micro-surfacing is a widely used pavement preventivemaintenance technology used all over the world, due to its advantages of fast construction,low maintenance cost, good waterproofness, and skid-resistance performance [1–4]. It consistsof modified emulsified asphalt, aggregates, fillers, water, and additives. The number of trafficaccident can be reduced if there is enough friction between tire and pavement surface [5,6].Safe and comfortable conditions of micro-surfacing are directly related to abundant surface texturecharacteristics, which makes great contributes to skid-resistance [7–9].
Evaluation of asphalt pavement texture mainly includes microtexture and macrotexture.Macrotexture is closely related to the distribution and gradation of aggregates, while microtextureis dependent on aggregate morphological characteristics [10–13]. The traditional test methods
Materials 2018, 11, 920; doi:10.3390/ma11060920 www.mdpi.com/journal/materials1
Materials 2018, 11, 920
for texture property of asphalt pavements mainly include sand patch test and British pendulumtest. These traditional testing methods are not only time-consuming, but also depend largely onthe operator’s subjective judgment, making the experimental results imprecise and incomplete.Accurate quantification of texture characteristics has great significance to fully understanding theskid-resistance of pavement.
Digital image processing technology has been used for accurately quantifying the texturecharacteristics of pavement, and a variety of equipment and image testing methods based ondigital image processing technology has been rapidly developed [14–17]. AIMS (aggregate imagemeasurement system) is an objective and credible instrument for evaluating morphologicalcharacteristics of aggregates and surface texture of pavements, which allows accurate andcomprehensive analysis, and calculation of texture based on digital images collected by a highresolution digital camera and a variable magnification microscope [18–21].
Asi et al. performed a comparative study to find the British pendulum skid-resistance number fora number of mixes. It was found that the mix with 30% slag has the highest skid number, followed bySuperpave, SMA, and Marshall mixes, respectively. Also, increasing the asphalt content above theoptimal asphalt content value decreases the skid-resistance of these mixes [7]. Puzzo et al. presentedan image-based technique for the assessment of a 3D model of pavement texture to calculate the digitalmean texture depth (MTD), starting from the digital surface model (DSM) generated by the photos [22].Araujo et al. detected characterization of three hot mix asphalt (HMA) texture properties using digitalimage processing techniques, and the results indicated that the HMA particle size distribution directlyaffects its texture characteristics [15]. Chen et al. used fractal dimension of the fracture surface toevaluate impact of contact stress distribution on skid-resistance of asphalt pavements. The resultshowed that the stress distribution increased with an increase of pavement texture depth or tire load,or a decrease of the tire inflation pressure. The influence of pavement roughness and tire load was moresignificant than tire inflation pressure on the stress concentration [23]. El-Desouky used a special fluidto conduct skid-resistance tests at below freezing temperatures, and test results were used to developcorrection models for skid-resistance under temperature variations [24]. Although many studies focuson skid-resistance of asphalt pavements, no research has been done to correlate skid-resistance ofmicro-surfacing with fine aggregate morphologies.
The objective of this study is to evaluate fine aggregate morphology and surface textureof micro-surfacing by AIMS, and explore the effect of aggregate morphology on skid-resistanceof single-grade micro-surfacing. A comparison between single-grade micro-surfacing and MS-2(which will be explained in Section 2.1.3) standard micro-surfacing was conducted for exploring thefeasibility of single-grade micro-surfacing. This study also aimed to correlate conventional texturecharacteristics with texture results detected by image method.
2. Materials and Research Methodologies
The specific contents of this paper are as follows:
1. Three types of fine aggregate are chosen which are steel slag, basalt, and limestone. Three grades0.6–1.18, 1.18–2.36, and 2.36–4.75 are selected for each type of aggregate.
2. AIMS was used to evaluate morphological characteristics of nine (3 × 3) kinds of fine aggregates.3. Modified emulsified asphalt used in micro-surfacing was prepared.4. Nine kinds of micro-surfacing slurry mixture with single-grade aggregate was prepared,
corresponding to nine kinds of aggregate. Another normal-grade micro-surfacing mixture wasalso prepared for comparison with single-grade micro-surfacing. There are, in total, 10 kinds ofmicro-surfacing in this study.
5. Sand patch test, British pendulum test, and image method were used to evaluate theskid-resistance of micro-surfacing. Wet abrasion test was used to test durability for verifyingfeasibility of single-grade micro-surfacing.
2
Materials 2018, 11, 920
2.1. Materials
2.1.1. Aggregates
Basalt, limestone, and steel slag were selected as fine aggregates of micro-surfacing. Basalt isa basic volcanic rock, with a large compressive strength, low water absorption, and good wearresistance. Limestone has satisfactory physical properties, such as good workability, excellentsturdiness, and good cementation. However, it is generally not used on the surface of asphalt pavement,due to its lower strength than volcanic rocks, such as basalt [25,26]. Steel slag, as an industrial waste,has been more and more widely used in road engineering in recent years [27]. The fine aggregatesused in this study were nine types in total: 0.6–1.18, 1.18–2.36, and 2.36–4.75; three grades for eachtype of aggregate. The basic performance indicators of fine aggregates are shown in Table 1.
Table 1. Fine aggregate basic characteristics.
Properties Unit Technical RequirementsTested Value
Specification UsedBasalt Limestone Steel Slag
Sand equivalent % ≥60 68 71 75 ASTM D 2419 [28]Soundness % ≥12 15.7 15.1 13.6 ASTM C 88 [29]
Apparent relative density — ≥2.5 2.978 2.708 2.872 ASTM C 128 [30]Angularity s ≥30 42 45 43 ASTM C 1252 [31]
2.1.2. Modified Emulsified Asphalt
Modified emulsified asphalt uses asphalt as base material, macromolecule polymer as modifier,and emulsifier added to make asphalt droplets, dissolved in water. It is the binding materialof micro-surfacing, and its quality has direct impact on the micro-surfacing’s performance.In order to meet the requirements of rapid open traffic, the emulsifier used in the micro-surfacemust be slow-breaking and quick-curing cationic emulsifier. The commonly used modifiers arestyrene–butadiene–styrene (SBS), styrene–butadiene rubber (SBR), and chloroprene rubber (CR) [32].
The asphalt used in this study was AH-70, where AH stands for heavy traffic paving asphalt,and 70 (unit is 0.1 mm) stands for its penetration. This kind of asphalt has moderate viscoelasticproperties and good adhesion properties with aggregates. The modifier was styrene–butadienerubber (SBR), and the emulsifier is the type of quick-set cationic emulsifier produced by ZhengtongTechnology Company. Calcium chloride and polyvinyl alcohol (PVA) are chosen as additives toimprove the stability of modified emulsified asphalt, preventing it from quick demulsification duringmixing with aggregate.
Colloid mill was used to produce modified emulsified asphalt in this study. The basic principleof colloid mill is that the raw materials, such as asphalt, emulsifier, and water, pass through the gapbetween the fixed gear and the moving gear, which proceeds at high-speed relative motion, so that thematerial is subjected to powerful shearing force, friction force, and high-frequency vibration, making iteffectively crushed, emulsified, and mixed.
The production process is that stabilizer, emulsifier, and SBR were sequentially added to thewater, and mixed uniformly at 65 ◦C. After adjusting the pH to 2.5, it is put into colloid mill togetherwith hot asphalt to make a modified emulsified asphalt. The proportion of raw materials and basiccharacteristics of modified emulsified asphalt are shown in Tables 2 and 3.
Table 2. Composition of modified emulsified asphalt.
Materials Modified Emulsified Asphalt Asphalt Water SBR Emulsifier Calcium Chloride PVA
Weight (g) 500 300 177 12 10 0.5 0.5Ratio (%) 100 60 35.4 2.4 2 0.1 0.1
3
Materials 2018, 11, 920
Table 3. Basic characteristics of modified emulsified asphalt.
Properties Unit Technical Requirements Tested Value Specification Used
Sieve residue (1.18) % ≤0.1 0.04 ASTM D 244 [33]Charge — + + ASTM D 244 [33]
Rotary viscosity Pa · s — 98 ASTM D 4402 [34]Evaporated residue content % ≥60 62.5 ASTM D 244 [33]
Evaporatedresidue properties
Penetration 0.1 mm 40–100 57.3 ASTM D 5 [35]Softening point ◦C ≥53 54.8 ASTM D 36 [36]
Ductility cm ≥20 56 ASTM D 113 [37]Solubility % ≥97.5 99.3 ASTM D 2042 [38]
Storage stability 1 day % ≤1 0.1ASTM D 244 [33]5 day % ≤5 1.2
2.1.3. Micro-Surfacing Mixture
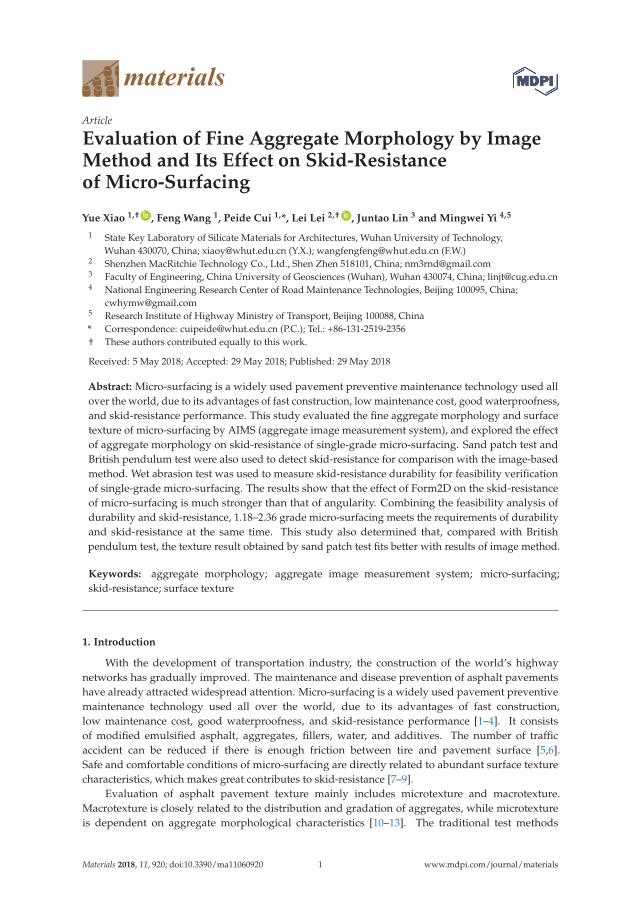
In order to obtain larger texture depth and skid-resistance than ordinary micro-surfacing, thisstudy attempts to prepare single-grade micro-surfacing, which means aggregates in the micro-surfacingmixture have only one size. Corresponding to nine kinds of fine aggregate, nine kinds of single-grademicro-surfacing mixture were prepared. At the same time, in order to verify the feasibility of single-grademicro-surfacing, standard MS-2 micro-surfacing made with basalt was also designed for performancecomparison with single-grade micro-surfacing. The grading curve of MS-2 mixture is shown in Figure 1.The proportion of materials in the 10 types of micro-surfacing mix are shown in Table 4. The percentageof cement and water in the table is with regard to the mass of aggregates as denominator.
Figure 1. Gradation curves of MS-2 used in this work.
Table 4. Composition of 10 types of micro-surfacing.
Mixture TypesLimestone Basalt Steel Slag
MS-20.6–1.18 1.18–2.36 2.36–4.75 0.6–1.18 1.18–2.36 2.36–4.75 0.6–1.18 1.18–2.36 2.36–4.75
Thickness (mm) 6 6 6 6 6 6 6 6 6 6Cement (%) 1 1 1 1 1 1 1 1 1 1Water (%) 9.5 8.5 7.5 9.5 8.5 7.5 9.5 8.5 7.5 10
Asphalt-aggregateratio (%) 7.5 7 6.5 7.5 7 6.5 7.5 7 6.5 10
4
Materials 2018, 11, 920
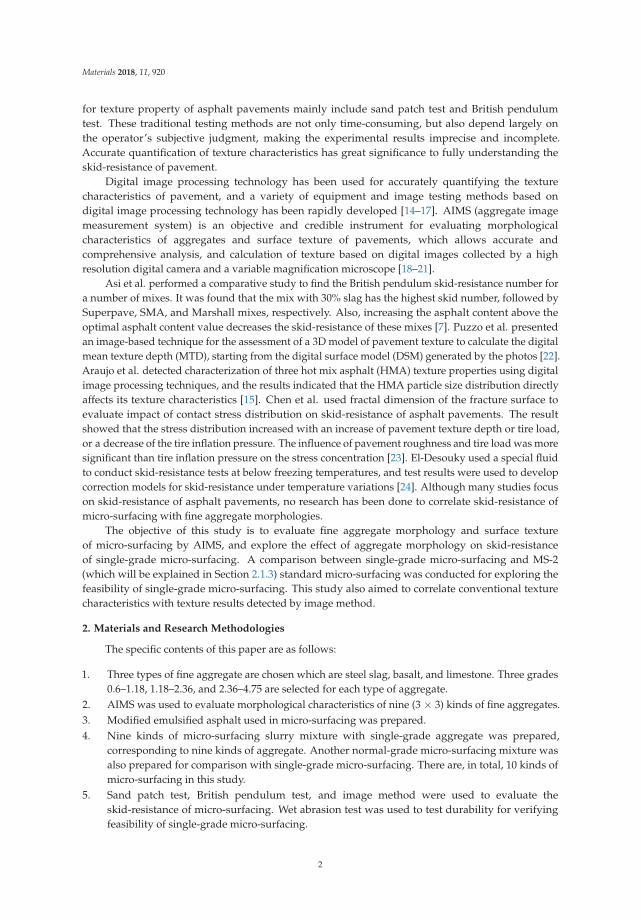
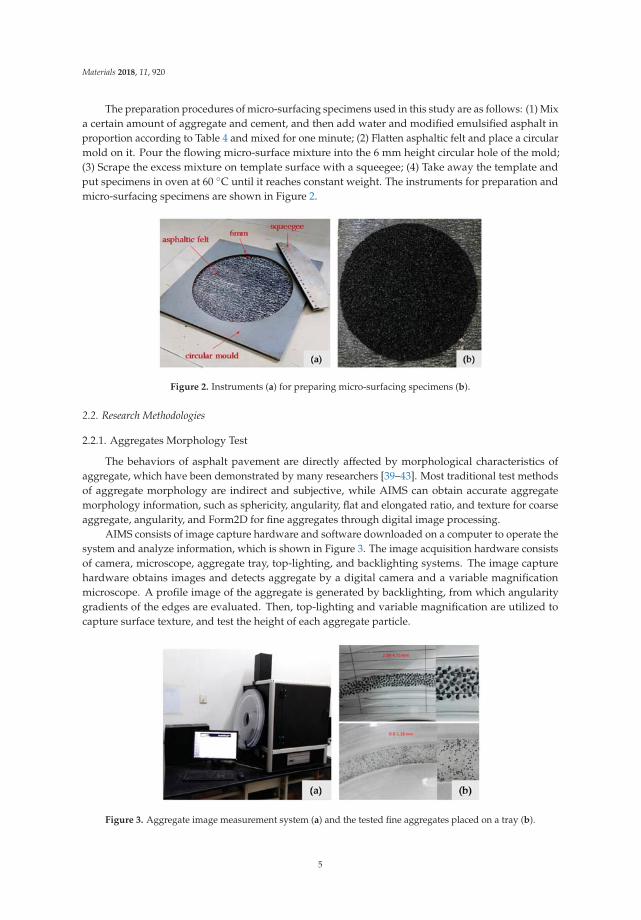
The preparation procedures of micro-surfacing specimens used in this study are as follows: (1) Mixa certain amount of aggregate and cement, and then add water and modified emulsified asphalt inproportion according to Table 4 and mixed for one minute; (2) Flatten asphaltic felt and place a circularmold on it. Pour the flowing micro-surface mixture into the 6 mm height circular hole of the mold;(3) Scrape the excess mixture on template surface with a squeegee; (4) Take away the template andput specimens in oven at 60 ◦C until it reaches constant weight. The instruments for preparation andmicro-surfacing specimens are shown in Figure 2.
Figure 2. Instruments (a) for preparing micro-surfacing specimens (b).
2.2. Research Methodologies
2.2.1. Aggregates Morphology Test
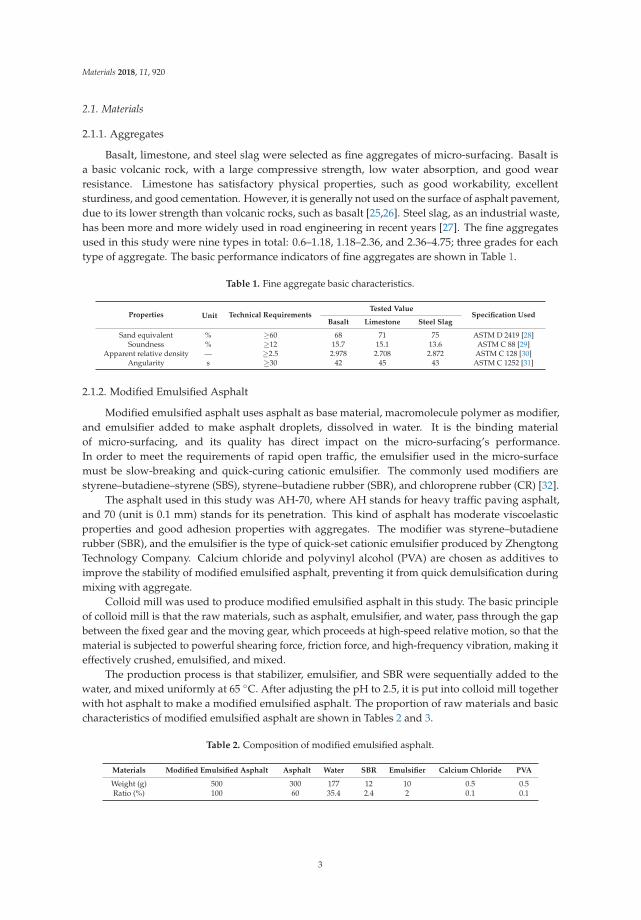
The behaviors of asphalt pavement are directly affected by morphological characteristics ofaggregate, which have been demonstrated by many researchers [39–43]. Most traditional test methodsof aggregate morphology are indirect and subjective, while AIMS can obtain accurate aggregatemorphology information, such as sphericity, angularity, flat and elongated ratio, and texture for coarseaggregate, angularity, and Form2D for fine aggregates through digital image processing.
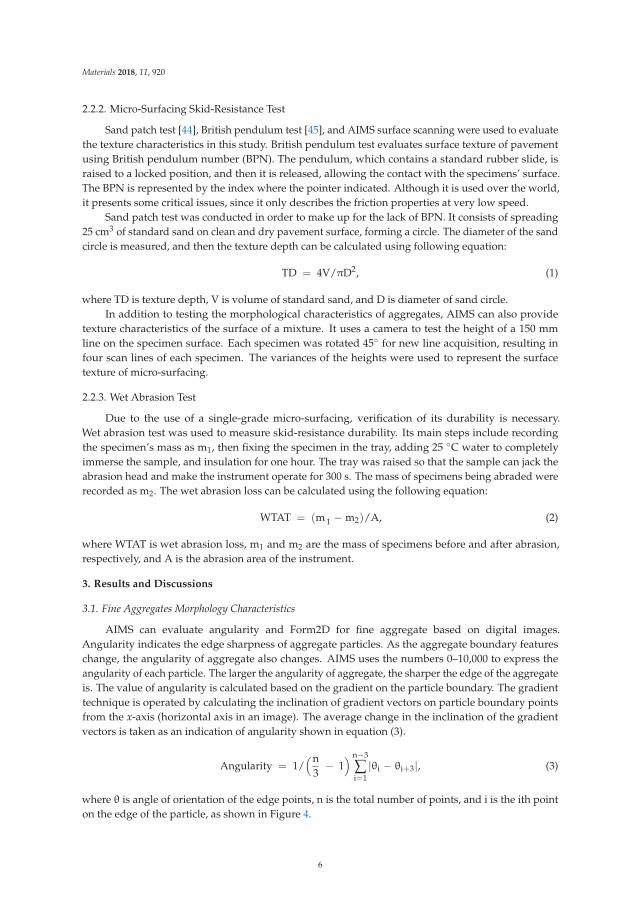
AIMS consists of image capture hardware and software downloaded on a computer to operate thesystem and analyze information, which is shown in Figure 3. The image acquisition hardware consistsof camera, microscope, aggregate tray, top-lighting, and backlighting systems. The image capturehardware obtains images and detects aggregate by a digital camera and a variable magnificationmicroscope. A profile image of the aggregate is generated by backlighting, from which angularitygradients of the edges are evaluated. Then, top-lighting and variable magnification are utilized tocapture surface texture, and test the height of each aggregate particle.
Figure 3. Aggregate image measurement system (a) and the tested fine aggregates placed on a tray (b).
5
Materials 2018, 11, 920
2.2.2. Micro-Surfacing Skid-Resistance Test
Sand patch test [44], British pendulum test [45], and AIMS surface scanning were used to evaluatethe texture characteristics in this study. British pendulum test evaluates surface texture of pavementusing British pendulum number (BPN). The pendulum, which contains a standard rubber slide, israised to a locked position, and then it is released, allowing the contact with the specimens’ surface.The BPN is represented by the index where the pointer indicated. Although it is used over the world,it presents some critical issues, since it only describes the friction properties at very low speed.
Sand patch test was conducted in order to make up for the lack of BPN. It consists of spreading25 cm3 of standard sand on clean and dry pavement surface, forming a circle. The diameter of the sandcircle is measured, and then the texture depth can be calculated using following equation:
TD = 4V/πD2, (1)
where TD is texture depth, V is volume of standard sand, and D is diameter of sand circle.In addition to testing the morphological characteristics of aggregates, AIMS can also provide
texture characteristics of the surface of a mixture. It uses a camera to test the height of a 150 mmline on the specimen surface. Each specimen was rotated 45◦ for new line acquisition, resulting infour scan lines of each specimen. The variances of the heights were used to represent the surfacetexture of micro-surfacing.
2.2.3. Wet Abrasion Test
Due to the use of a single-grade micro-surfacing, verification of its durability is necessary.Wet abrasion test was used to measure skid-resistance durability. Its main steps include recordingthe specimen’s mass as m1, then fixing the specimen in the tray, adding 25 ◦C water to completelyimmerse the sample, and insulation for one hour. The tray was raised so that the sample can jack theabrasion head and make the instrument operate for 300 s. The mass of specimens being abraded wererecorded as m2. The wet abrasion loss can be calculated using the following equation:
WTAT = (m 1 − m2)/A, (2)
where WTAT is wet abrasion loss, m1 and m2 are the mass of specimens before and after abrasion,respectively, and A is the abrasion area of the instrument.
3. Results and Discussions
3.1. Fine Aggregates Morphology Characteristics
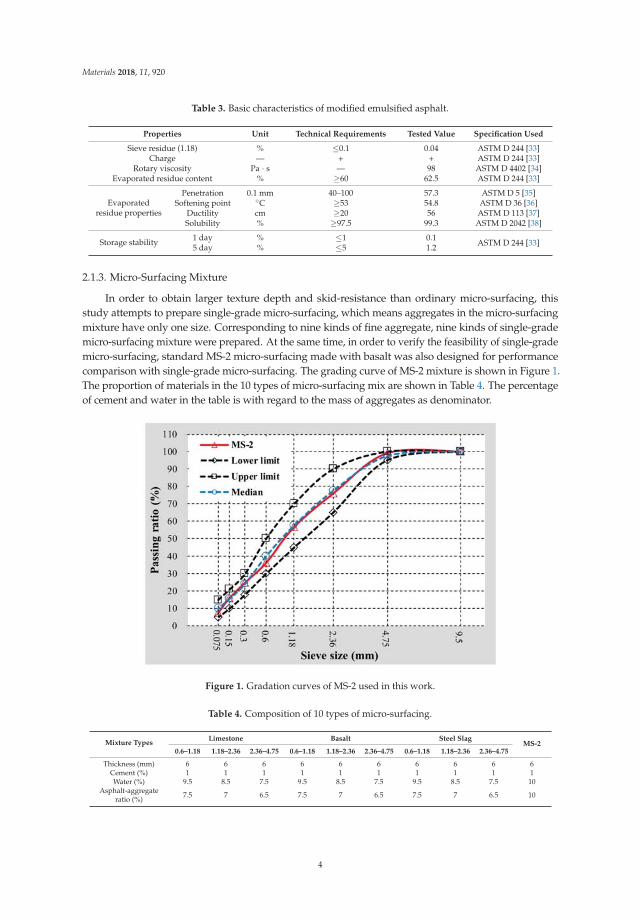
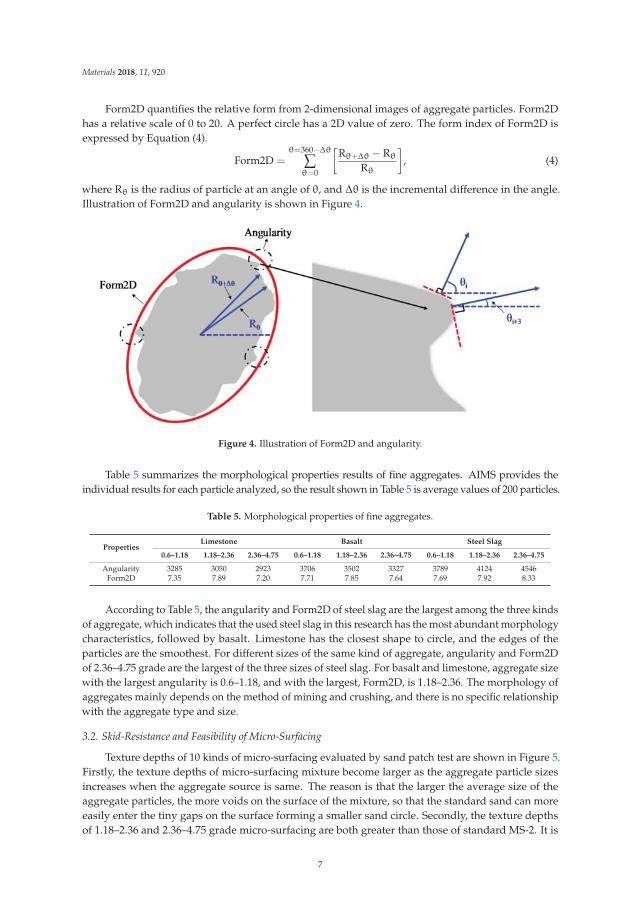
AIMS can evaluate angularity and Form2D for fine aggregate based on digital images.Angularity indicates the edge sharpness of aggregate particles. As the aggregate boundary featureschange, the angularity of aggregate also changes. AIMS uses the numbers 0–10,000 to express theangularity of each particle. The larger the angularity of aggregate, the sharper the edge of the aggregateis. The value of angularity is calculated based on the gradient on the particle boundary. The gradienttechnique is operated by calculating the inclination of gradient vectors on particle boundary pointsfrom the x-axis (horizontal axis in an image). The average change in the inclination of the gradientvectors is taken as an indication of angularity shown in equation (3).
Angularity = 1/(n
3− 1
) n−3
∑i=1
|θi − θi+3|, (3)
where θ is angle of orientation of the edge points, n is the total number of points, and i is the ith pointon the edge of the particle, as shown in Figure 4.
6
Materials 2018, 11, 920
Form2D quantifies the relative form from 2-dimensional images of aggregate particles. Form2Dhas a relative scale of 0 to 20. A perfect circle has a 2D value of zero. The form index of Form2D isexpressed by Equation (4).
Form2D =θ=360−Δθ
∑θ=0
[Rθ+Δθ − Rθ
Rθ
], (4)
where Rθ is the radius of particle at an angle of θ, and Δθ is the incremental difference in the angle.Illustration of Form2D and angularity is shown in Figure 4.
Figure 4. Illustration of Form2D and angularity.
Table 5 summarizes the morphological properties results of fine aggregates. AIMS provides theindividual results for each particle analyzed, so the result shown in Table 5 is average values of 200 particles.
Table 5. Morphological properties of fine aggregates.
PropertiesLimestone Basalt Steel Slag
0.6–1.18 1.18–2.36 2.36–4.75 0.6–1.18 1.18–2.36 2.36–4.75 0.6–1.18 1.18–2.36 2.36–4.75
Angularity 3285 3050 2923 3706 3502 3327 3789 4124 4546Form2D 7.35 7.89 7.20 7.71 7.85 7.64 7.69 7.92 8.33
According to Table 5, the angularity and Form2D of steel slag are the largest among the three kindsof aggregate, which indicates that the used steel slag in this research has the most abundant morphologycharacteristics, followed by basalt. Limestone has the closest shape to circle, and the edges of theparticles are the smoothest. For different sizes of the same kind of aggregate, angularity and Form2Dof 2.36–4.75 grade are the largest of the three sizes of steel slag. For basalt and limestone, aggregate sizewith the largest angularity is 0.6–1.18, and with the largest, Form2D, is 1.18–2.36. The morphology ofaggregates mainly depends on the method of mining and crushing, and there is no specific relationshipwith the aggregate type and size.
3.2. Skid-Resistance and Feasibility of Micro-Surfacing
Texture depths of 10 kinds of micro-surfacing evaluated by sand patch test are shown in Figure 5.Firstly, the texture depths of micro-surfacing mixture become larger as the aggregate particle sizesincreases when the aggregate source is same. The reason is that the larger the average size of theaggregate particles, the more voids on the surface of the mixture, so that the standard sand can moreeasily enter the tiny gaps on the surface forming a smaller sand circle. Secondly, the texture depthsof 1.18–2.36 and 2.36–4.75 grade micro-surfacing are both greater than those of standard MS-2. It is
7
Materials 2018, 11, 920
demonstrated that single-grade micro-surfacing can indeed increase the surface texture characteristic,consequently increasing the skid-resistance.
Figure 5. Texture depths of micro-surfacing.
BPN of 10 kinds of micro-surfacing evaluated by British pendulum test are shown in Figure 6.Firstly, the BPN of micro-surfacing mixture become larger as the aggregate particle sizes increases whenthe aggregate source is the same, except 0.6–1.18 of steel slag. Secondly, the BPN of micro-surfacingare all larger than those of standard MS-2 except 0.6–1.18 of limestone and basalt. The results alsoindicated that single-grade micro-surfacing can enlarge the skid-resistance of micro-surfacing.
Figure 6. BPN of micro-surfacing.
The variances of heights detected by AIMS were also used to represent the surface texture ofmicro-surfacing, as shown in Figure 7. Same as the results obtained by the two previous conventionalmethods, only the 0.6–1.18 of steel slag and basalt micro-surfacing are smoother than standard MS-2.From the results of three kinds of surface texture tests, it can be seen that the surface textures of1.18–2.36 and 2.36–4.75 single-grade micro-surfacing are larger than MS-2, regardless of the aggregate
8
Materials 2018, 11, 920
sources. Therefore, from the perspective of skid-resistance performance, it is feasible to use the1.18–2.36 and 2.36–4.75 grade aggregates to prepare single-grade micro-surfacing.
Since there is only one size of aggregate in single-grade micro-surfacing, it will lead to the lossof skeleton-embedded structure in mixture, which will then have a certain impact on the strength ofmicro-surfacing. Therefore, the verification of single-grade micro-surfacing’s durability is necessary.The WTAT of micro-surfacing are shown in Figure 8. The requirement of WTAT is less than 540 inspecification. It can be seen that the 0.6–1.18 and 1.18–2.36 grade micro-surfacing meet the requirements.Therefore, 0.6–1.18 and 1.18–2.36 grade micro-surfacing is feasible from the perspective of durability.Combining the feasibility analysis of durability and skid-resistance, it can be seen that the 1.18–2.36 typemicro-surfacing meets the requirements of durability and skid-resistance at the same time.
Figure 7. Height’s variance of micro-surfacing.
Figure 8. WTAT of micro-surfacing.
3.3. Correlation between Aggregate Morphology and Skid-Resistance
From the contents of previous chapter, it can be seen that 1.18–2.36 type micro-surfacing meets thefeasibility requirements. Therefore, in this section, the influence of the fine aggregates’ morphological
9
Materials 2018, 11, 920
characteristics on the surface texture of 1.18–2.36 micro-surfacing was discussed. The effect of aggregatemorphology on texture depth, BPN and variance of height are shown in Figures 9–11, respectively.
Figure 9. Correlation between aggregate morphology and texture depth.
Figure 10. Correlation between aggregate morphology and British pendulum number (BPN).
Figure 11. Correlation between aggregate morphology and variances of heights.
10
Materials 2018, 11, 920
It can be seen from Figures 9–11 that the R2 values of the relationship between Form2D andskid-resistance are all larger than those of angularity. This shows that the effect of angularity on theskid-resistance of micro-surfacing is weaker than that of Form2D. The reason might be that the angularityindicates the edge sharpness of aggregate, and the edge sharpness of fine aggregates is too small comparedto the surface texture of micro-surfacing, so that there is no obvious relationship between them.
Compared to the BPN, Form2D correlated better with height of variance and texture depth,and the R2 values reached 0.9154 and 0.9229, respectively. The reason might be that pendulum head’ssliding length of the instrument is difficult to control precisely, resulting in a different friction distancebetween each specimen, thereby affecting the BPN results. So accurate quantification of texturecharacteristics should be considered for inclusion in the specification for fully understanding theskid-resistance of pavement.
3.4. Correlation between Traditional Test and Digital Image Method
Correlations between the traditional test and digital image method for skid resistance wereanalyzed, as shown in Figure 12. It can be seen that the texture results obtained by sand patch test fitbetter with the results of image method, compared with British pendulum test. However, the results ofR2 are only 0.6224 and 0.3945 for sand patch test and British pendulum test, respectively, indicating thatthe proposed quadratic functions between traditional skid-resistance results and image method resultsare not strong. More data is therefore needed to finalize a more accuracy correlation between traditionaltest and digital image method, regarding characterization of the texture depth of micro-surfacing.
Figure 12. Correlation between traditional test and digital image method for skid-resistance.
4. Conclusions
The main objective of this study is to explore the effect of aggregate morphology on skid-resistanceof single-grade micro-surfacing made with basalt, limestone, and steel slag. A comparison betweensingle-grade micro-surfacing made with three kinds of aggregate and MS-2 standard micro-surfacingconsists of basalt was firstly conducted for exploring the feasibility of single-grade micro-surfacing.Then, the correlation between conventional texture characteristics and texture results detected byimage method was also discussed. Based on the above results, the following conclusions can be drawn:
1. Single-grade micro-surfacing can indeed increase the surface texture characteristics comparedwith standard micro-surfacing, thus increasing the skid-resistance.
11
Materials 2018, 11, 920
2. Combining the feasibility analysis of durability and skid-resistance, it can be summarized thatthe 1.18–2.36 type micro-surfacing meets the requirements of durability and skid-resistance at thesame time.
3. Form2D and angularity were characterized as morphologic indices of fine aggregates.Research results indicated that the effect of Form2D on skid-resistance of micro-surfacing ismuch stronger than that of angularity. Compared with BPN results, height of variance andtexture depth correlated better with Form2D.
4. The texture result obtained by sand patch test fits better with results of image method comparedwith British pendulum test. However, both of them are not strong.
Author Contributions: F.W., Y.X., L.L. and P.C. conceived and designed the experiments; P.C. and F.W. performedthe experiments; Y.X., L.L. and P.C. analyzed the data; J.L. and M.Y. contributed reagents/materials/analysis tools;Y.X., L.L. and F.W. wrote the paper.
Acknowledgments: This work is supported by the Natural Science Foundation of China (No. U1733121) and theFundamental Research Funds for the Central Universities, China University of Geosciences (Wuhan) (CUG170621).The authors gratefully acknowledge their financial supports.
Conflicts of Interest: The authors declare no conflict of interest.
References
1. Wang, Z.J.; Gao, J.; Ai, T.; Zhao, P. Laboratory investigation on microwave deicing function of micro surfacingasphalt mixtures reinforced by carbon fiber. J. Test. Eval. 2014, 42, 498–507. [CrossRef]
2. Yu, J.M.; Zhang, X.N.; Xiong, C.L. A methodology for evaluating micro-surfacing treatment on asphaltpavement based on grey system models and grey rational degree theory. Constr. Build. Mater. 2017, 150,214–226. [CrossRef]
3. Xiu, S.C.; Liu, M.H.; Chao, C.X.; Li, S.J. Study on micro-surface texture and tribology characters of groundsurface in point grinding process. Int. J. Surf. Sci. Eng. 2014, 8, 225–238.
4. Kamaraj, C.; Lakshmi, S.; Rose, C.; Mani, U.; Paul, E.; Mandal, A.B.; Gangopadhyay, S. Experimental studyon micro surfacing using chrome shaving impregnated with modified bitumen emulsion. J. Sci. Ind. Res.2016, 75, 378–382.
5. Huang, C.Y.; Huang, X. Effects of pavement texture on pavement friction: A review. Int. J. Veh. Des. 2014, 65,256–269. [CrossRef]
6. Xiao, Y.; Wang, Y.; Wu, S.; Yi, M. Assessment of bonding behaviours between ultrathin surface layer andasphalt mixture layer using modified pull test. J. Adhes. Sci. Technol. 2015, 29, 1508–1521. [CrossRef]
7. Asi, I.M. Evaluating skid resistance of different asphalt concrete mixes. Build. Environ. 2007, 42, 325–329.[CrossRef]
8. Kogbara, R.B.; Masad, E.A.; Kassem, E.; Scarpas, A.; Anupam, K. A state-of-the-art review of parametersinfluencing measurement and modeling of skid resistance of asphalt pavements. Constr. Build. Mater. 2016,114, 602–617. [CrossRef]
9. Fwa, T.F. Skid resistance determination for pavement management and wet-weather road safety.Int. J. Transp. Sci. Technol. 2017, 6, 217–227. [CrossRef]
10. Kanafi, M.M.; Kuosmanen, A.; Pellinen, T.K.; Tuononen, A.J. Macro- and micro-texture evolution of roadpavements and correlation with friction. Int. J. Pavement Eng. 2015, 16, 168–179. [CrossRef]
11. Pratico, F.G.; Astolfi, A. A new and simplified approach to assess the pavement surface micro-andmacrotexture. Constr. Build. Mater. 2017, 148, 476–483. [CrossRef]
12. Kong, D.; Xiao, Y.; Wu, S.; Tang, N.; Ling, J.; Wang, F. Comparative evaluation of designing asphalt treatedbase mixture with composite aggregate types. Constr. Build. Mater. 2017, 156, 819–827. [CrossRef]
13. Cui, P.; Wu, S.; Xiao, Y.; Wan, M.; Cui, P. Inhibiting effect of layered double hydroxides on the emissions ofvolatile organic compounds from bituminous materials. J. Clean. Prod. 2015, 108, 987–991. [CrossRef]
14. Amarasiri, S.; Gunaratne, M.; Sarkar, S. Use of digital image modeling for evaluation of concrete pavementmacrotexture and wear. J. Transp. Eng. 2012, 138, 589–602. [CrossRef]
15. Araujo, V.M.C.; Bessa, I.S.; Castelo Branco, V.T.F. Measuring skid resistance of hot mix asphalt using theaggregate image measurement system (aims). Constr. Build. Mater. 2015, 98, 476–481. [CrossRef]
12
Materials 2018, 11, 920
16. Loprencipe, G.; Cantisani, G. Unified analysis of road pavement profiles for evaluation of surfacecharacteristics. Mod. Appl. Sci. 2013, 7, 1–14. [CrossRef]
17. Chen, J.; Wang, H.; Li, L. Virtual testing of asphalt mixture with two-dimensional and three-dimensionalrandom aggregate structures. Int. J. Pavement Eng. 2015, 18, 824–836. [CrossRef]
18. Mahmoud, E.; Gates, L.; Masad, E.; Erdogan, S.; Garboczi, E. Comprehensive evaluation of aims texture,angularity, and dimension measurements. J. Mater. Civ. Eng. 2010, 22, 369–379. [CrossRef]
19. Wang, L.B.; Sun, W.J.; Tutumluer, E.; Druta, C. Evaluation of aggregate imaging techniques for quantificationof morphological characteristics. Transp. Res. Rec. 2013, 2335, 39–49. [CrossRef]
20. Bessa, I.S.; Franco Castelo Branco, V.T.; Soares, J.B. Evaluation of polishing and degradation resistance ofnatural aggregates and steel slag using the aggregate image measurement system. Road Mater. Pavement Des.2014, 15, 385–405. [CrossRef]
21. Ding, X.; Ma, T.; Gao, W. Morphological characterization and mechanical analysis for coarse aggregateskeleton of asphalt mixture based on discrete-element modeling. Constr. Build. Mater. 2017, 154, 1048–1061.[CrossRef]
22. Puzzo, L.; Loprencipe, G.; Tozzo, C.; D’Andrea, A. Three-dimensional survey method of pavement textureusing photographic equipment. Measurement 2017, 111, 146–157. [CrossRef]
23. Chen, B.; Zhang, X.; Yu, J.; Wang, Y. Impact of contact stress distribution on skid resistance of asphaltpavements. Constr. Build. Mater. 2017, 133, 330–339. [CrossRef]
24. El-Desouky, A. Investigating the effect of temperature variations on the measured airfield pavement skidresistance. Constr. Build. Mater. 2018, 161, 649–653. [CrossRef]
25. Wang, D.; Leng, Z.; Yu, H.; Hueben, M.; Kollmann, J.; Oeser, M. Durability of epoxy-bonded tio2-modifiedaggregate as a photocatalytic coating layer for asphalt pavement under vehicle tire polishing. Wear 2017,382, 1–7. [CrossRef]
26. Xiao, F.; Punith, V.S.; Amirkhanian, S.N.; Thodesen, C. Improved resistance of long-term aged warm-mixasphalt to moisture damage containing moist aggregates. J. Mater. Civ. Eng. 2013, 25, 913–922. [CrossRef]
27. Chen, Z.; Wu, S.; Xiao, Y.; Zeng, W.; Yi, M.; Wan, J. Effect of hydration and silicone resin on basic oxygenfurnace slag and its asphalt mixture. J. Clean. Prod. 2016, 112, 392–400. [CrossRef]
28. ASTM. Test Method for Sand Equivalent Value of Soils and Fine Aggregate; D2419-02; ASTM: West Conshohocken,PA, USA, 2005.
29. ASTM. Test Method for Soundness of Aggregates by Use of Sodium Sulfate or Magnesium Sulfate; C0088-99A;ASTM: West Conshohocken, PA, USA, 2013.
30. ASTM. Test Method for Density, Relative Density (Specific Gravity), and Absorption of Fine Aggregate; C0128-04A;ASTM: West Conshohocken, PA, USA, 2015.
31. ASTM. Test Methods for Uncompacted Void Content of Fine Aggregate (as Influenced by Particle Shape, SurfaceTexture, and Grading); C1252-03; ASTM: West Conshohocken, PA, USA, 2017.
32. Guo, Y.; Ma, B.; Zhi, Z.; Tan, H.; Liu, M.; Jian, S.; Guo, Y. Effect of polyacrylic acid emulsion on fluidity ofcement paste. Coll. Surf. A Physicochem. Eng. Asp. 2017, 535, 139–148. [CrossRef]
33. ASTM. Test Methods and Practices for Emulsified Asphalts; D0244-04; ASTM: West Conshohocken, PA, USA,2015.
34. ASTM. Test Method for Viscosity Determination of Asphalt at Elevated Temperatures Using a Rotational Viscometer;D4402-02; ASTM: West Conshohocken, PA, USA, 2015.
35. ASTM. Test Method for Penetration of Bituminous Materials; D0005-05; ASTM: West Conshohocken, PA, USA, 2013.36. ASTM. Test Method for Softening Point of Bitumen (Ring-and-Ball Apparatus); D0036-95R00E01; ASTM:
West Conshohocken, PA, USA, 2005.37. ASTM. Test Method for Ductility of Bituminous Materials; D0113-99; ASTM: West Conshohocken, PA, USA, 2005.38. ASTM. Test Method for Solubility of Asphalt Materials in Trichloroethylene; D2042-01; ASTM: West Conshohocken,
PA, USA, 2015.39. Chen, J.S.; Hsieh, W.; Liao, M.C. Effect of coarse aggregate shape on engineering properties of stone mastic
asphalt applied to airport pavements. Int. J. Pavement Res. Technol. 2013, 6, 595–601.40. Fletcher, T.; Chandan, C.; Masad, E.; Sivakumar, K. Measurement of aggregate texture and its influence on
hot mix asphalt (hma) permanent deformation. J. Test. Eval. 2002, 30, 524–531.
13
Materials 2018, 11, 920
41. Souza, L.T.; Kim, Y.R.; Souza, F.V.; Castro, L.S. Experimental testing and finite-element modeling to evaluatethe effects of aggregate angularity on bituminous mixture performance. J. Mater. Civ. Eng. 2012, 24, 249–258.[CrossRef]
42. Maerz, N.H. Technical and computational aspects of the measurement of aggregate shape by digital imageanalysis. J. Comput. Civ. Eng. 2004, 18, 10–18. [CrossRef]
43. Bessa, I.S.; Castelo Branco, V.T.F.; Soares, J.B.; Nogueira Neto, J.A. Aggregate shape properties and theirinfluence on the behavior of hot-mix asphalt. J. Mater. Civ. Eng. 2015, 27, 04014212. [CrossRef]
44. ASTM. Standard Test Method for Measuring Pavement Macrotexture Depth Using a Volumetric Technique; E965–96;ASTM: West Conshohocken, PA, USA, 2015.
45. ASTM. Standard Test Method for Measuring Surface Frictional Proprieties Using the British Pendulum Tester;E303–93; ASTM: West Conshohocken, PA, USA, 2005.
© 2018 by the authors. Licensee MDPI, Basel, Switzerland. This article is an open accessarticle distributed under the terms and conditions of the Creative Commons Attribution(CC BY) license (http://creativecommons.org/licenses/by/4.0/).
14
materials
Article
Influence Analysis and Optimization for AggregateMorphological Characteristics on High- andLow-Temperature Viscoelasticity of Asphalt Mixtures
Yongchun Cheng 1, Wensheng Wang 1,* , Jinglin Tao 2,*, Meng Xu 3, Xiaoli Xu 3, Guirong Ma 1
and Shurong Wang 1
1 College of Transportation, Jilin University, Changchun 130025, China; [email protected] (Y.C.);[email protected] (G.M.); [email protected] (S.W.)
2 Jiangxi Transportation Institute, Nanchang 330200, China3 Jilin Zhongteng Road & Bridge Construction Co., Ltd., Changchun 130022, China;
[email protected] (M.X.); [email protected] (X.X.)* Correspondence: [email protected] (W.W.); [email protected] (J.T.); Tel.: +86-8509-5446 (W.W.)
Received: 27 September 2018; Accepted: 16 October 2018; Published: 19 October 2018
Abstract: Aggregate is an indispensable raw material for asphalt pavement construction. This studyevaluates the influences of aggregate morphological characteristics on the high- and low-temperatureviscoelasticity of asphalt mixtures. Based on simplex lattice mixture design (SLD), asphalt mixsamples were designed and prepared with the same gradation but three different types of aggregates.Subsequently, three morphological characteristics of aggregate (roundness, perimeter index, anderosion-dilation area ratio) are presented to characterize fine and coarse aggregates. Then basedon Burgers viscoelastic model, uniaxial compression static creep test was carried out to analyze thehigh-temperature viscoelastic properties for asphalt mortar and mixture. Meanwhile fitting Pronyseries models have been utilized to represent relaxation modulus conversed from creep complianceand the low-temperature relaxation characteristics can be also discussed. The experimental resultsindicated that morphological characteristics of aggregate, especially fine aggregates, are stronglycorrelated with the viscoelastic parameters of asphalt mixtures. However, the complex morphologicalcharacteristics of aggregates have opposite influences on the high- and low-temperature viscoelasticparameters. Therefore, when considering both high- and low-temperature viscoelastic properties,the aggregate proportion was optimized for the appropriate morphological characteristics, whichwill provide a reference for asphalt mixture design.
Keywords: asphalt mixture; viscoelastic properties; creep; relaxation; aggregates; morphology
1. Introduction
Aggregate is an important raw material and it directly affects the performances of asphaltpavement engineering, which is highly related to the efficiency of asphalt pavement maintenance [1].Aggregate in asphalt mixtures generally accounts for approximately over 90% by weight, which playsa major role for its stability, durability, and mechanical properties.
Researchers have constantly developed research methods to study the aggregates morphologicalcharacteristics. Wilson and Klotz [2] presented a method of measuring angularity using Houghtransform for quantitative analysis of aggregate angularity. Kuo et al. [3] used a digital image-analysismethod to investigate the coarse aggregates morphologies and quantified the morphologicalcharacteristics in an effective way. Masad and Button [4] investigated the angularity and textureof fine aggregates by using erosion-dilation method and form factor, in which angularity is analyzedby high-resolution images and texture is described by low-resolution images. Kuo and Freeman [5]
Materials 2018, 11, 2034; doi:10.3390/ma11102034 www.mdpi.com/journal/materials15
Materials 2018, 11, 2034
defined three image indices called aspect ratio, angularity, and roughness to characterize overall shape,roundness of corners and particle surface texture of fine aggregates. Wang et al. [6] developed a unifiedFourier morphological analysis method for quantifying the aggregate morphological characteristics,including shape, angularity, and surface texture. Hu et al. [7] studied the effects of aggregateparticles on internal structure in asphalt concrete and results showed that high-temperature damageis mainly caused by coarse aggregate particles. Xie et al. [8] found that digital image processingtechnique is useful for evaluating morphological characteristics of fine aggregate among three methods.Xiao et al. [9] studied the fine aggregate morphology through using aggregate image measurementsystem. Ding et al. [10] proposed a modeling algorithm to capture the realistic shape of aggregatesand characterize the granular aggregates mechanical properties accurately. Wang et al. [11] proposedan algorithm for modeling two-dimensional virtual aggregates that is based on the Aggregate ImagingMeasurement System and the Particle Flow Code in Two Dimensions.
According to existing research on aggregates morphology evaluation, lots of researchers studiedthe influences of aggregate morphological characteristics on the performances of asphalt mixtures.Chen et al. [12] demonstrated the effects of morphological characteristics of coarse aggregates onthe engineering properties of hot-mix asphalt (HMA) mixtures. Masad et al. [13] addressed therelationship between morphological characteristics of fine aggregate and performances of asphaltmixtures and they found that aggregate texture characteristic had the strongest correlation with ruttingresistance of asphalt mixtures. Arasan et al. [14] showed that there is a good correlation betweensome shape indices of aggregate and volumetric performances of asphalt mixtures. Singh et al. [15]utilized aggregate shape parameters to estimate dynamic modulus of asphalt mixes by establishinga model. Pan et al. [16] investigated the effects of coarse aggregate morphology on the permanentdeformation of asphalt mixtures. The permanent deformation showed a best correlation with thesurface texture and the angularity and surface texture have significant influences on the permanentdeformation. Valdes-Vidal et al. [17] investigated the influence of aggregate physical properties onthe mechanical properties of asphalt concretes and the results demonstrated that the morphologicalcharacteristics of coarse and fine aggregates have influences on strength and anti-cracking of asphaltconcretes. Aragao et al. [18] evaluated the influence of morphological properties of aggregates on themechanical behavior of bituminous mixtures. Thus, the aggregate morphological characteristics havesignificantly direct influences on the performances of asphalt mixture.
In addition, asphalt mixture is a typical viscoelastic material with the characteristics of bothHookean elasticity and Newtonian viscosity. Its viscoelastic characteristics are the basis forinvestigation on pavement cracking and permanent deformation of asphalt mixture [19,20]. Ingeneral, the physical quantities, such as creep compliance, relaxation modulus, and so on, are usedrepresent the basic viscoelastic characteristics of asphalt mixtures [21]. Despite extensive researcheshave been conducted to investigate the influence of aggregate morphological characteristics onperformances of asphalt mixture, no much study has been conducted for the viscoelastic characteristicsof asphalt mixture.
The objective of this study is to relate the aggregate morphological characteristics to the high-and low-temperature viscoelastic properties of asphalt mixture. For that, an experimental proportiondesign was designed for asphalt mortars and mixtures were prepared with the same gradation butthree different types of aggregates based on simplex lattice design (SLD) method. Three aggregatemorphological characteristics (roundness, perimeter index and erosion-dilation area ratio) are chosento characterize fine and coarse aggregates. Then based on Burgers viscoelastic model, uniaxialcompression static creep test was carried out to analyze the high-temperature viscoelastic propertiesfor asphalt mix. Meanwhile, by fitting Prony series models, relaxation modulus can be conversed fromcreep compliance and the low-temperature relaxation characteristics can be also discussed.
16
Materials 2018, 11, 2034
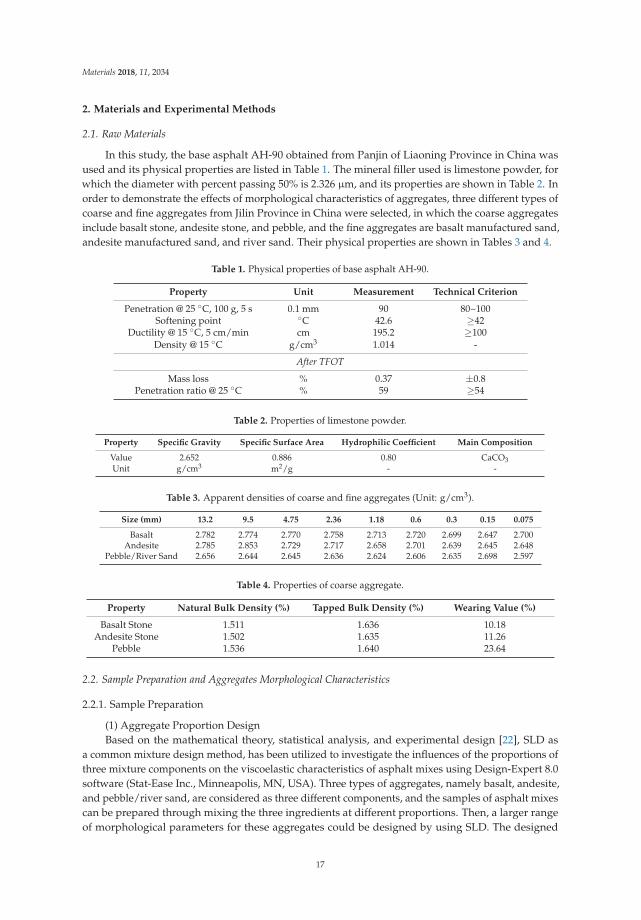
2. Materials and Experimental Methods
2.1. Raw Materials
In this study, the base asphalt AH-90 obtained from Panjin of Liaoning Province in China wasused and its physical properties are listed in Table 1. The mineral filler used is limestone powder, forwhich the diameter with percent passing 50% is 2.326 μm, and its properties are shown in Table 2. Inorder to demonstrate the effects of morphological characteristics of aggregates, three different types ofcoarse and fine aggregates from Jilin Province in China were selected, in which the coarse aggregatesinclude basalt stone, andesite stone, and pebble, and the fine aggregates are basalt manufactured sand,andesite manufactured sand, and river sand. Their physical properties are shown in Tables 3 and 4.
Table 1. Physical properties of base asphalt AH-90.
Property Unit Measurement Technical Criterion
Penetration @ 25 ◦C, 100 g, 5 s 0.1 mm 90 80~100Softening point ◦C 42.6 ≥42
Ductility @ 15 ◦C, 5 cm/min cm 195.2 ≥100Density @ 15 ◦C g/cm3 1.014 -
After TFOT
Mass loss % 0.37 ±0.8Penetration ratio @ 25 ◦C % 59 ≥54
Table 2. Properties of limestone powder.
Property Specific Gravity Specific Surface Area Hydrophilic Coefficient Main Composition
Value 2.652 0.886 0.80 CaCO3Unit g/cm3 m2/g - -
Table 3. Apparent densities of coarse and fine aggregates (Unit: g/cm3).
Size (mm) 13.2 9.5 4.75 2.36 1.18 0.6 0.3 0.15 0.075
Basalt 2.782 2.774 2.770 2.758 2.713 2.720 2.699 2.647 2.700Andesite 2.785 2.853 2.729 2.717 2.658 2.701 2.639 2.645 2.648
Pebble/River Sand 2.656 2.644 2.645 2.636 2.624 2.606 2.635 2.698 2.597
Table 4. Properties of coarse aggregate.
Property Natural Bulk Density (%) Tapped Bulk Density (%) Wearing Value (%)
Basalt Stone 1.511 1.636 10.18Andesite Stone 1.502 1.635 11.26
Pebble 1.536 1.640 23.64
2.2. Sample Preparation and Aggregates Morphological Characteristics
2.2.1. Sample Preparation
(1) Aggregate Proportion DesignBased on the mathematical theory, statistical analysis, and experimental design [22], SLD as
a common mixture design method, has been utilized to investigate the influences of the proportions ofthree mixture components on the viscoelastic characteristics of asphalt mixes using Design-Expert 8.0software (Stat-Ease Inc., Minneapolis, MN, USA). Three types of aggregates, namely basalt, andesite,and pebble/river sand, are considered as three different components, and the samples of asphalt mixescan be prepared through mixing the three ingredients at different proportions. Then, a larger rangeof morphological parameters for these aggregates could be designed by using SLD. The designed
17
Materials 2018, 11, 2034
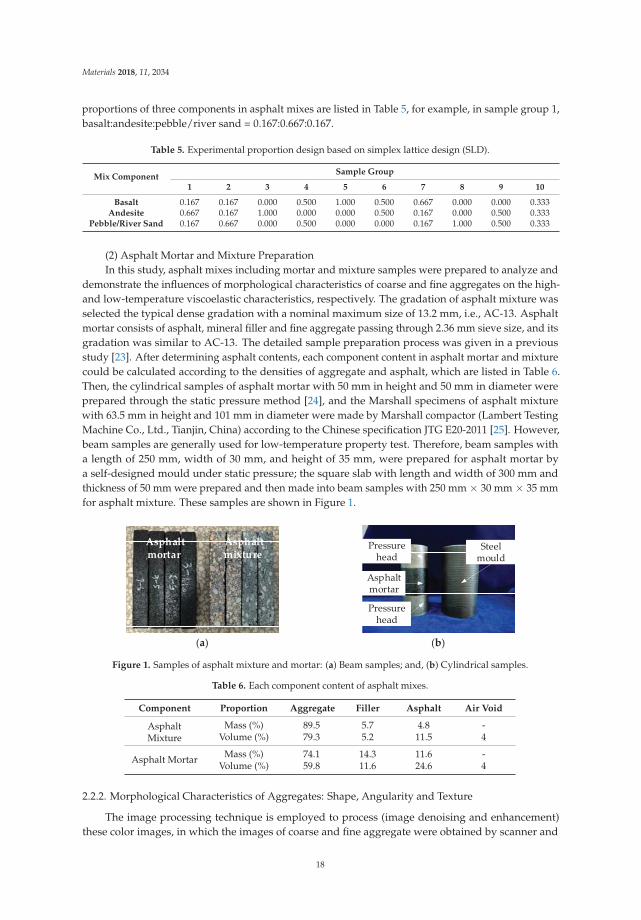
proportions of three components in asphalt mixes are listed in Table 5, for example, in sample group 1,basalt:andesite:pebble/river sand = 0.167:0.667:0.167.
Table 5. Experimental proportion design based on simplex lattice design (SLD).
Mix ComponentSample Group
1 2 3 4 5 6 7 8 9 10
Basalt 0.167 0.167 0.000 0.500 1.000 0.500 0.667 0.000 0.000 0.333Andesite 0.667 0.167 1.000 0.000 0.000 0.500 0.167 0.000 0.500 0.333
Pebble/River Sand 0.167 0.667 0.000 0.500 0.000 0.000 0.167 1.000 0.500 0.333
(2) Asphalt Mortar and Mixture PreparationIn this study, asphalt mixes including mortar and mixture samples were prepared to analyze and
demonstrate the influences of morphological characteristics of coarse and fine aggregates on the high-and low-temperature viscoelastic characteristics, respectively. The gradation of asphalt mixture wasselected the typical dense gradation with a nominal maximum size of 13.2 mm, i.e., AC-13. Asphaltmortar consists of asphalt, mineral filler and fine aggregate passing through 2.36 mm sieve size, and itsgradation was similar to AC-13. The detailed sample preparation process was given in a previousstudy [23]. After determining asphalt contents, each component content in asphalt mortar and mixturecould be calculated according to the densities of aggregate and asphalt, which are listed in Table 6.Then, the cylindrical samples of asphalt mortar with 50 mm in height and 50 mm in diameter wereprepared through the static pressure method [24], and the Marshall specimens of asphalt mixturewith 63.5 mm in height and 101 mm in diameter were made by Marshall compactor (Lambert TestingMachine Co., Ltd., Tianjin, China) according to the Chinese specification JTG E20-2011 [25]. However,beam samples are generally used for low-temperature property test. Therefore, beam samples witha length of 250 mm, width of 30 mm, and height of 35 mm, were prepared for asphalt mortar bya self-designed mould under static pressure; the square slab with length and width of 300 mm andthickness of 50 mm were prepared and then made into beam samples with 250 mm × 30 mm × 35 mmfor asphalt mixture. These samples are shown in Figure 1.
Asphaltmortar
Asphaltmixture
Asphaltmortar
Pressurehead
Pressurehead
Steelmould
(a) (b)
Figure 1. Samples of asphalt mixture and mortar: (a) Beam samples; and, (b) Cylindrical samples.
Table 6. Each component content of asphalt mixes.
Component Proportion Aggregate Filler Asphalt Air Void
AsphaltMixture
Mass (%) 89.5 5.7 4.8 -Volume (%) 79.3 5.2 11.5 4
Asphalt Mortar Mass (%) 74.1 14.3 11.6 -Volume (%) 59.8 11.6 24.6 4
2.2.2. Morphological Characteristics of Aggregates: Shape, Angularity and Texture
The image processing technique is employed to process (image denoising and enhancement)these color images, in which the images of coarse and fine aggregate were obtained by scanner and
18
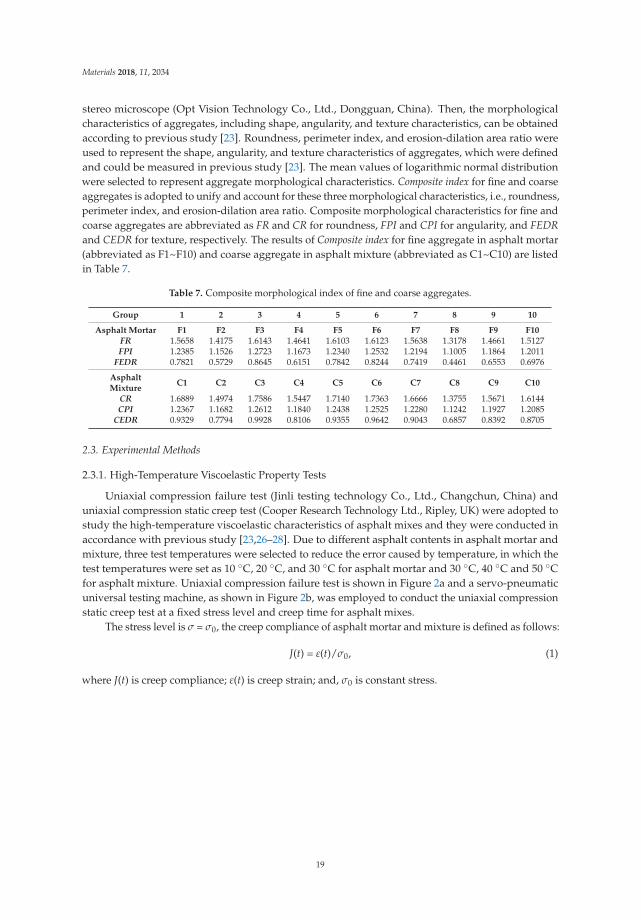
Materials 2018, 11, 2034
stereo microscope (Opt Vision Technology Co., Ltd., Dongguan, China). Then, the morphologicalcharacteristics of aggregates, including shape, angularity, and texture characteristics, can be obtainedaccording to previous study [23]. Roundness, perimeter index, and erosion-dilation area ratio wereused to represent the shape, angularity, and texture characteristics of aggregates, which were definedand could be measured in previous study [23]. The mean values of logarithmic normal distributionwere selected to represent aggregate morphological characteristics. Composite index for fine and coarseaggregates is adopted to unify and account for these three morphological characteristics, i.e., roundness,perimeter index, and erosion-dilation area ratio. Composite morphological characteristics for fine andcoarse aggregates are abbreviated as FR and CR for roundness, FPI and CPI for angularity, and FEDRand CEDR for texture, respectively. The results of Composite index for fine aggregate in asphalt mortar(abbreviated as F1~F10) and coarse aggregate in asphalt mixture (abbreviated as C1~C10) are listedin Table 7.
Table 7. Composite morphological index of fine and coarse aggregates.
Group 1 2 3 4 5 6 7 8 9 10
Asphalt Mortar F1 F2 F3 F4 F5 F6 F7 F8 F9 F10FR 1.5658 1.4175 1.6143 1.4641 1.6103 1.6123 1.5638 1.3178 1.4661 1.5127FPI 1.2385 1.1526 1.2723 1.1673 1.2340 1.2532 1.2194 1.1005 1.1864 1.2011
FEDR 0.7821 0.5729 0.8645 0.6151 0.7842 0.8244 0.7419 0.4461 0.6553 0.6976
AsphaltMixture
C1 C2 C3 C4 C5 C6 C7 C8 C9 C10
CR 1.6889 1.4974 1.7586 1.5447 1.7140 1.7363 1.6666 1.3755 1.5671 1.6144CPI 1.2367 1.1682 1.2612 1.1840 1.2438 1.2525 1.2280 1.1242 1.1927 1.2085
CEDR 0.9329 0.7794 0.9928 0.8106 0.9355 0.9642 0.9043 0.6857 0.8392 0.8705
2.3. Experimental Methods
2.3.1. High-Temperature Viscoelastic Property Tests
Uniaxial compression failure test (Jinli testing technology Co., Ltd., Changchun, China) anduniaxial compression static creep test (Cooper Research Technology Ltd., Ripley, UK) were adopted tostudy the high-temperature viscoelastic characteristics of asphalt mixes and they were conducted inaccordance with previous study [23,26–28]. Due to different asphalt contents in asphalt mortar andmixture, three test temperatures were selected to reduce the error caused by temperature, in which thetest temperatures were set as 10 ◦C, 20 ◦C, and 30 ◦C for asphalt mortar and 30 ◦C, 40 ◦C and 50 ◦Cfor asphalt mixture. Uniaxial compression failure test is shown in Figure 2a and a servo-pneumaticuniversal testing machine, as shown in Figure 2b, was employed to conduct the uniaxial compressionstatic creep test at a fixed stress level and creep time for asphalt mixes.
The stress level is σ = σ0, the creep compliance of asphalt mortar and mixture is defined as follows:
J(t) = ε(t)/σ0, (1)
where J(t) is creep compliance; ε(t) is creep strain; and, σ0 is constant stress.
19
Materials 2018, 11, 2034
Cylindricalsample
LVDT
Cylindricalsample
COOPER loadingcontrol system
(a) (b)
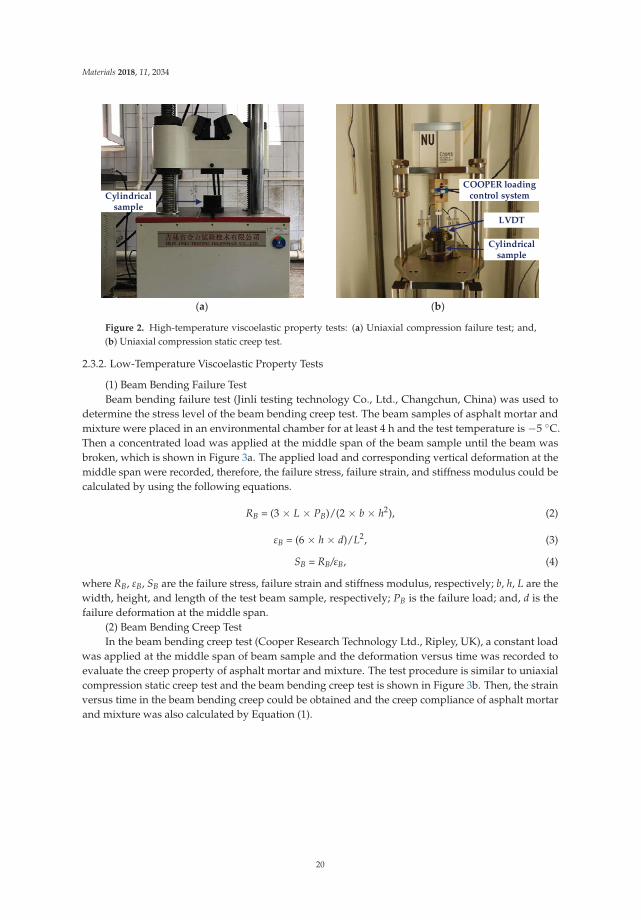
Figure 2. High-temperature viscoelastic property tests: (a) Uniaxial compression failure test; and,(b) Uniaxial compression static creep test.
2.3.2. Low-Temperature Viscoelastic Property Tests
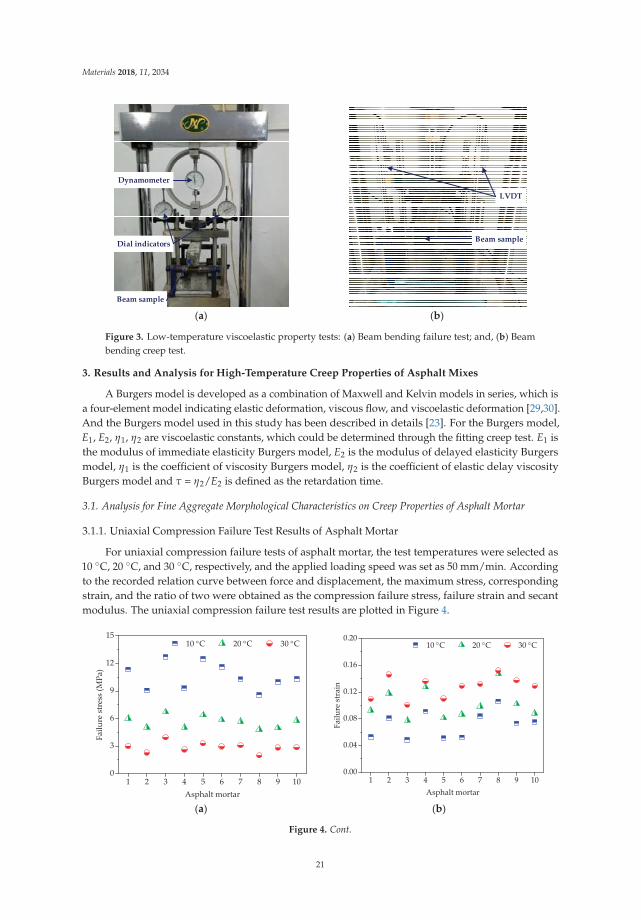
(1) Beam Bending Failure TestBeam bending failure test (Jinli testing technology Co., Ltd., Changchun, China) was used to
determine the stress level of the beam bending creep test. The beam samples of asphalt mortar andmixture were placed in an environmental chamber for at least 4 h and the test temperature is −5 ◦C.Then a concentrated load was applied at the middle span of the beam sample until the beam wasbroken, which is shown in Figure 3a. The applied load and corresponding vertical deformation at themiddle span were recorded, therefore, the failure stress, failure strain, and stiffness modulus could becalculated by using the following equations.
RB = (3 × L × PB)/(2 × b × h2), (2)
εB = (6 × h × d)/L2, (3)
SB = RB/εB, (4)
where RB, εB, SB are the failure stress, failure strain and stiffness modulus, respectively; b, h, L are thewidth, height, and length of the test beam sample, respectively; PB is the failure load; and, d is thefailure deformation at the middle span.
(2) Beam Bending Creep TestIn the beam bending creep test (Cooper Research Technology Ltd., Ripley, UK), a constant load
was applied at the middle span of beam sample and the deformation versus time was recorded toevaluate the creep property of asphalt mortar and mixture. The test procedure is similar to uniaxialcompression static creep test and the beam bending creep test is shown in Figure 3b. Then, the strainversus time in the beam bending creep could be obtained and the creep compliance of asphalt mortarand mixture was also calculated by Equation (1).
20
Materials 2018, 11, 2034
Beam sample
Dial indicators
Dynamometer
Beam sample
LVDT
(a) (b)
Figure 3. Low-temperature viscoelastic property tests: (a) Beam bending failure test; and, (b) Beambending creep test.
3. Results and Analysis for High-Temperature Creep Properties of Asphalt Mixes
A Burgers model is developed as a combination of Maxwell and Kelvin models in series, which isa four-element model indicating elastic deformation, viscous flow, and viscoelastic deformation [29,30].And the Burgers model used in this study has been described in details [23]. For the Burgers model,E1, E2, η1, η2 are viscoelastic constants, which could be determined through the fitting creep test. E1 isthe modulus of immediate elasticity Burgers model, E2 is the modulus of delayed elasticity Burgersmodel, η1 is the coefficient of viscosity Burgers model, η2 is the coefficient of elastic delay viscosityBurgers model and τ = η2/E2 is defined as the retardation time.
3.1. Analysis for Fine Aggregate Morphological Characteristics on Creep Properties of Asphalt Mortar
3.1.1. Uniaxial Compression Failure Test Results of Asphalt Mortar
For uniaxial compression failure tests of asphalt mortar, the test temperatures were selected as10 ◦C, 20 ◦C, and 30 ◦C, respectively, and the applied loading speed was set as 50 mm/min. Accordingto the recorded relation curve between force and displacement, the maximum stress, correspondingstrain, and the ratio of two were obtained as the compression failure stress, failure strain and secantmodulus. The uniaxial compression failure test results are plotted in Figure 4.
1 2 3 4 5 6 7 8 9 100
3
6
9
12
1510 C 20 C 30 C
Failu
restress
(MPa
)
Asphalt mortar
1 2 3 4 5 6 7 8 9 100.00
0.04
0.08
0.12
0.16
0.2010 C 20 C 30 C
Failu
restrain
Asphalt mortar
(a) (b)
Figure 4. Cont.
21
Materials 2018, 11, 2034
1 2 3 4 5 6 7 8 9 100
50
100
150
200
250
30010 C 20 C 30 C
Secant
mod
ulus
(MPa
)
Asphalt mortar
(c)
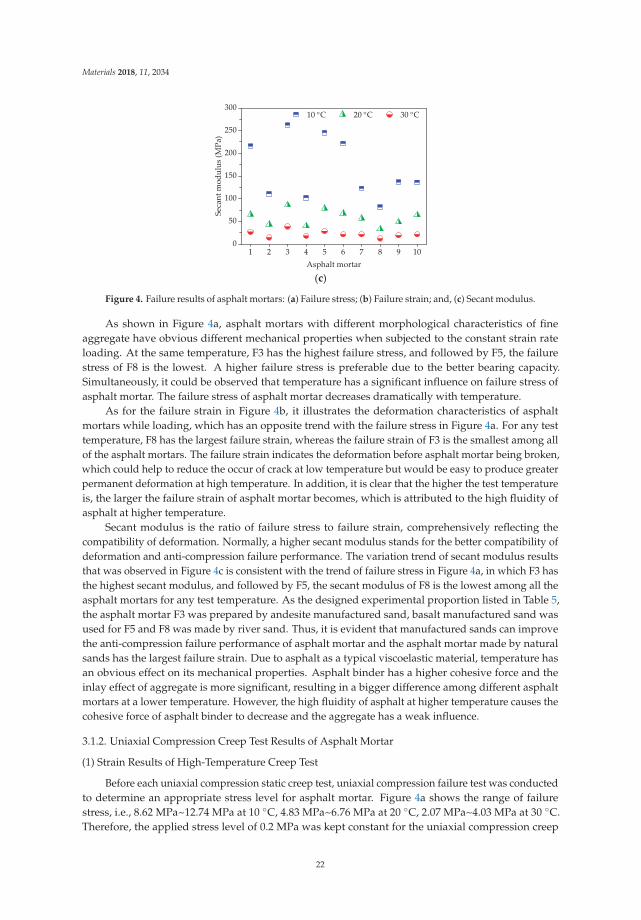
Figure 4. Failure results of asphalt mortars: (a) Failure stress; (b) Failure strain; and, (c) Secant modulus.
As shown in Figure 4a, asphalt mortars with different morphological characteristics of fineaggregate have obvious different mechanical properties when subjected to the constant strain rateloading. At the same temperature, F3 has the highest failure stress, and followed by F5, the failurestress of F8 is the lowest. A higher failure stress is preferable due to the better bearing capacity.Simultaneously, it could be observed that temperature has a significant influence on failure stress ofasphalt mortar. The failure stress of asphalt mortar decreases dramatically with temperature.
As for the failure strain in Figure 4b, it illustrates the deformation characteristics of asphaltmortars while loading, which has an opposite trend with the failure stress in Figure 4a. For any testtemperature, F8 has the largest failure strain, whereas the failure strain of F3 is the smallest among allof the asphalt mortars. The failure strain indicates the deformation before asphalt mortar being broken,which could help to reduce the occur of crack at low temperature but would be easy to produce greaterpermanent deformation at high temperature. In addition, it is clear that the higher the test temperatureis, the larger the failure strain of asphalt mortar becomes, which is attributed to the high fluidity ofasphalt at higher temperature.
Secant modulus is the ratio of failure stress to failure strain, comprehensively reflecting thecompatibility of deformation. Normally, a higher secant modulus stands for the better compatibility ofdeformation and anti-compression failure performance. The variation trend of secant modulus resultsthat was observed in Figure 4c is consistent with the trend of failure stress in Figure 4a, in which F3 hasthe highest secant modulus, and followed by F5, the secant modulus of F8 is the lowest among all theasphalt mortars for any test temperature. As the designed experimental proportion listed in Table 5,the asphalt mortar F3 was prepared by andesite manufactured sand, basalt manufactured sand wasused for F5 and F8 was made by river sand. Thus, it is evident that manufactured sands can improvethe anti-compression failure performance of asphalt mortar and the asphalt mortar made by naturalsands has the largest failure strain. Due to asphalt as a typical viscoelastic material, temperature hasan obvious effect on its mechanical properties. Asphalt binder has a higher cohesive force and theinlay effect of aggregate is more significant, resulting in a bigger difference among different asphaltmortars at a lower temperature. However, the high fluidity of asphalt at higher temperature causes thecohesive force of asphalt binder to decrease and the aggregate has a weak influence.
3.1.2. Uniaxial Compression Creep Test Results of Asphalt Mortar
(1) Strain Results of High-Temperature Creep Test
Before each uniaxial compression static creep test, uniaxial compression failure test was conductedto determine an appropriate stress level for asphalt mortar. Figure 4a shows the range of failurestress, i.e., 8.62 MPa~12.74 MPa at 10 ◦C, 4.83 MPa~6.76 MPa at 20 ◦C, 2.07 MPa~4.03 MPa at 30 ◦C.Therefore, the applied stress level of 0.2 MPa was kept constant for the uniaxial compression creep
22
Materials 2018, 11, 2034
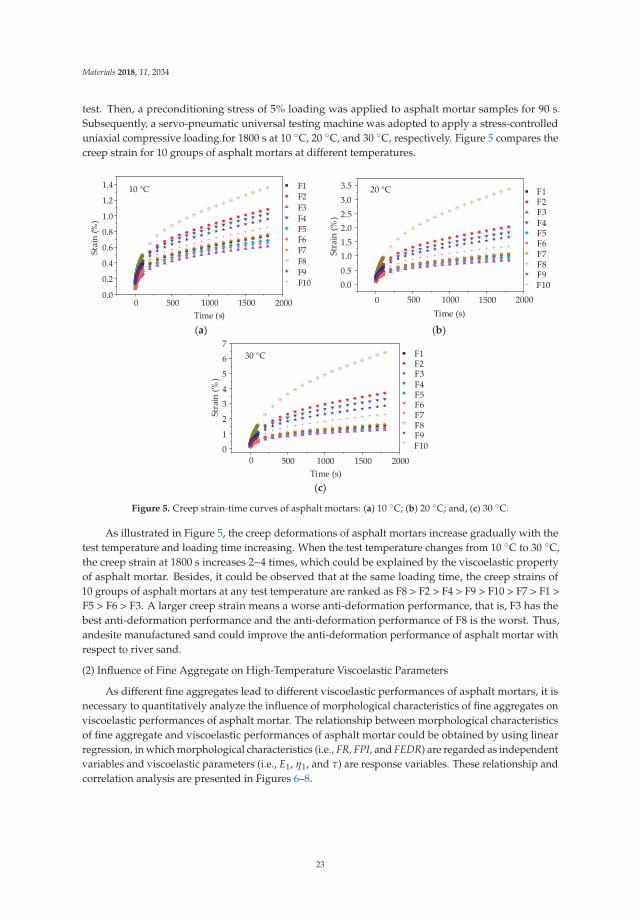
test. Then, a preconditioning stress of 5% loading was applied to asphalt mortar samples for 90 s.Subsequently, a servo-pneumatic universal testing machine was adopted to apply a stress-controlleduniaxial compressive loading for 1800 s at 10 ◦C, 20 ◦C, and 30 ◦C, respectively. Figure 5 compares thecreep strain for 10 groups of asphalt mortars at different temperatures.
10
Time (s)
Stain(%
)
0 500 1000 1500 20000.0
0.2
0.4
0.6
0.8
1.0
1.2
1.4 10 °C F1F2F3F4F5F6F7F8F9F10
20
Time (s)
Strain
(%)
0 500 1000 1500 2000
0.00.51.01.52.02.53.03.5
F1F2F3F4F5F6F7F8F9F10
20 °C
(a) (b)
30
Time (s)
Strain
(%)
0 500 1000 1500 20000
F1F2F3F4F5F6F7F8F9F10
30 °C
1
2
3
4
5
6
7
(c)
Figure 5. Creep strain-time curves of asphalt mortars: (a) 10 ◦C; (b) 20 ◦C; and, (c) 30 ◦C.
As illustrated in Figure 5, the creep deformations of asphalt mortars increase gradually with thetest temperature and loading time increasing. When the test temperature changes from 10 ◦C to 30 ◦C,the creep strain at 1800 s increases 2~4 times, which could be explained by the viscoelastic propertyof asphalt mortar. Besides, it could be observed that at the same loading time, the creep strains of10 groups of asphalt mortars at any test temperature are ranked as F8 > F2 > F4 > F9 > F10 > F7 > F1 >F5 > F6 > F3. A larger creep strain means a worse anti-deformation performance, that is, F3 has thebest anti-deformation performance and the anti-deformation performance of F8 is the worst. Thus,andesite manufactured sand could improve the anti-deformation performance of asphalt mortar withrespect to river sand.
(2) Influence of Fine Aggregate on High-Temperature Viscoelastic Parameters
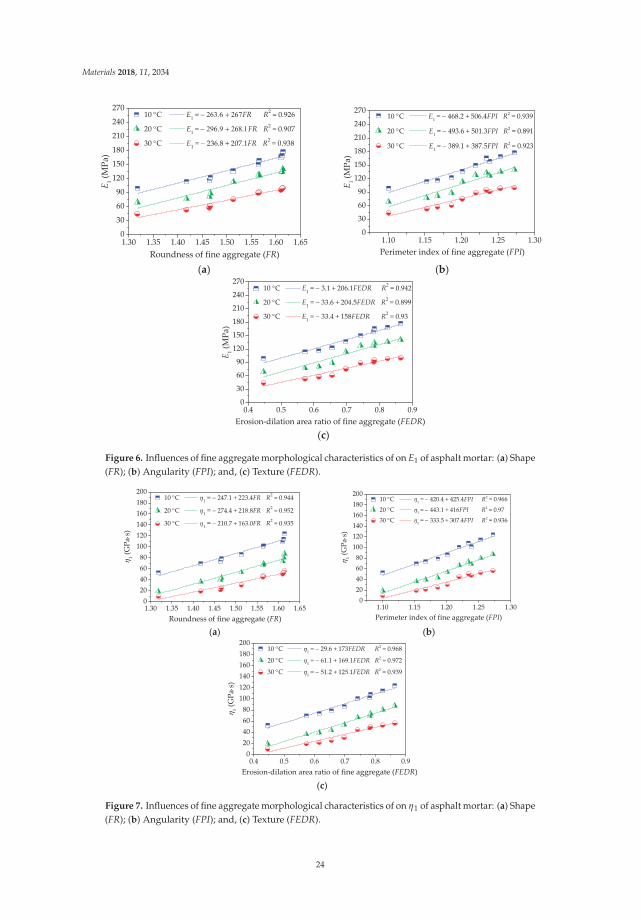
As different fine aggregates lead to different viscoelastic performances of asphalt mortars, it isnecessary to quantitatively analyze the influence of morphological characteristics of fine aggregates onviscoelastic performances of asphalt mortar. The relationship between morphological characteristicsof fine aggregate and viscoelastic performances of asphalt mortar could be obtained by using linearregression, in which morphological characteristics (i.e., FR, FPI, and FEDR) are regarded as independentvariables and viscoelastic parameters (i.e., E1, η1, and τ) are response variables. These relationship andcorrelation analysis are presented in Figures 6–8.
23
Materials 2018, 11, 2034
1.30 1.35 1.40 1.45 1.50 1.55 1.60 1.650
30
60
90
120
150
180
210
240
27010 C E1 = FR R2 = 0.926
20 C E1 = FR R2 = 0.907
30 C E1 = 236.8 + 207.1FR R2 = 0.938
E 1(M
Pa)
Roundness of fine aggregate (FR)1.10 1.15 1.20 1.25 1.30
0
30
60
90
120
150
180
210
240
27010 C E1 = 468.2 + 506.4FPI R2 = 0.939
20 C E1 = 493.6 + 501.3FPI R2 = 0.891
30 C E1 = 389.1 + 387.5FPI R2 = 0.923
E 1(M
Pa)
Perimeter index of fine aggregate (FPI)
(a) (b)
0.4 0.5 0.6 0.7 0.8 0.90
30
60
90
120
150
180
210
240
27010 C E1 = 3.1 + 206.1FEDR R2 = 0.942
20 C E1 = 33.6 + 204.5FEDR R2 = 0.899
30 C E1 = 33.4 + 158FEDR R2 = 0.93
E 1(M
Pa)
Erosion dilation area ratio of fine aggregate (FEDR)
(c)
Figure 6. Influences of fine aggregate morphological characteristics of on E1 of asphalt mortar: (a) Shape(FR); (b) Angularity (FPI); and, (c) Texture (FEDR).
1.30 1.35 1.40 1.45 1.50 1.55 1.60 1.65020406080100120140160180200
10 C 1 = 247.1 + 223.4FR R2 = 0.944
20 C 1 = 274.4 + 218.8FR R2 = 0.952
30 C 1 = 210.7 + 163.0FR R2 = 0.935
1(G
Pas)
Roundness of fine aggregate (FR)1.10 1.15 1.20 1.25 1.30
020406080100120140160180200
10 C 1 = 420.4 + 425.4FPI R2 = 0.966
20 C 1 = 443.1 + 416FPI R2 = 0.97
30 C 1 = 333.5 + 307.4FPI R2 = 0.936
1(G
Pas)
Perimeter index of fine aggregate (FPI)
(a) (b)
0.4 0.5 0.6 0.7 0.8 0.9020406080100120140160180200
10 C 1 = 29.6 + 173FEDR R2 = 0.968
20 C 1 = 61.1 + 169.1FEDR R2 = 0.972
30 C 1 = 51.2 + 125.1FEDR R2 = 0.939
1(G
Pas)
Erosion dilation area ratio of fine aggregate (FEDR)
(c)
Figure 7. Influences of fine aggregate morphological characteristics of on η1 of asphalt mortar: (a) Shape(FR); (b) Angularity (FPI); and, (c) Texture (FEDR).
24
Materials 2018, 11, 2034
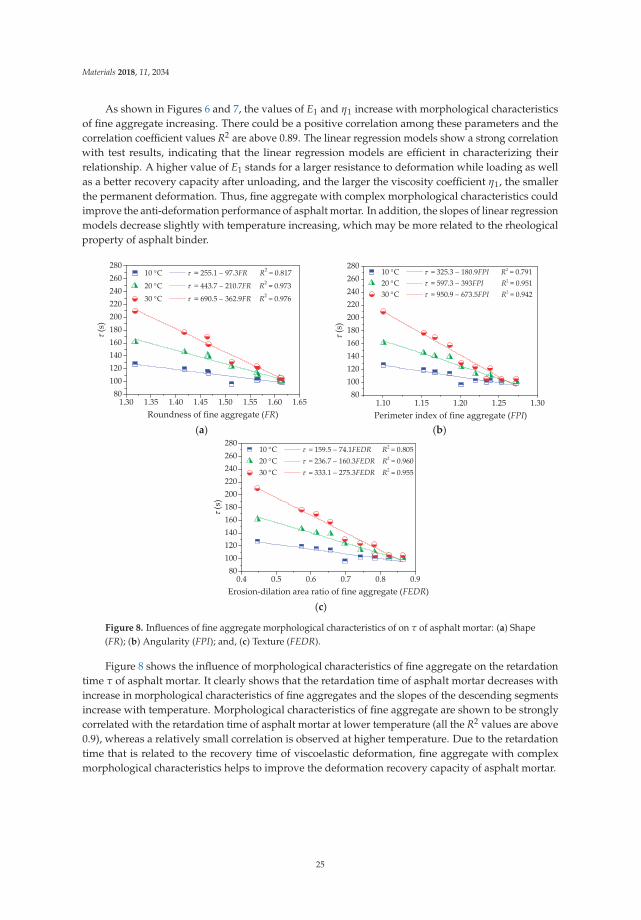
As shown in Figures 6 and 7, the values of E1 and η1 increase with morphological characteristicsof fine aggregate increasing. There could be a positive correlation among these parameters and thecorrelation coefficient values R2 are above 0.89. The linear regression models show a strong correlationwith test results, indicating that the linear regression models are efficient in characterizing theirrelationship. A higher value of E1 stands for a larger resistance to deformation while loading as wellas a better recovery capacity after unloading, and the larger the viscosity coefficient η1, the smallerthe permanent deformation. Thus, fine aggregate with complex morphological characteristics couldimprove the anti-deformation performance of asphalt mortar. In addition, the slopes of linear regressionmodels decrease slightly with temperature increasing, which may be more related to the rheologicalproperty of asphalt binder.
1.30 1.35 1.40 1.45 1.50 1.55 1.60 1.6580100120140160180200220240260280
10 C = 255.1 97.3FR R2 = 0.817
20 C = 443.7 210.7FR R2 = 0.973
30 C = 690.5 362.9FR R2 = 0.976
(s)
Roundness of fine aggregate (FR)1.10 1.15 1.20 1.25 1.30
80100120140160180200220240260280
10 C = 325.3 180.9FPI R2 = 0.79120 C = 597.3 393FPI R2 = 0.95130 C = 950.9 673.5FPI R2 = 0.942
(s)
Perimeter index of fine aggregate (FPI)(a) (b)
0.4 0.5 0.6 0.7 0.8 0.980100120140160180200220240260280
10 C = 159.5 74.1FEDR R2 = 0.80520 C = 236.7 160.3FEDR R2 = 0.96030 C = 333.1 275.3FEDR R2 = 0.955
(s)
Erosion dilation area ratio of fine aggregate (FEDR)
(c)
Figure 8. Influences of fine aggregate morphological characteristics of on τ of asphalt mortar: (a) Shape(FR); (b) Angularity (FPI); and, (c) Texture (FEDR).
Figure 8 shows the influence of morphological characteristics of fine aggregate on the retardationtime τ of asphalt mortar. It clearly shows that the retardation time of asphalt mortar decreases withincrease in morphological characteristics of fine aggregates and the slopes of the descending segmentsincrease with temperature. Morphological characteristics of fine aggregate are shown to be stronglycorrelated with the retardation time of asphalt mortar at lower temperature (all the R2 values are above0.9), whereas a relatively small correlation is observed at higher temperature. Due to the retardationtime that is related to the recovery time of viscoelastic deformation, fine aggregate with complexmorphological characteristics helps to improve the deformation recovery capacity of asphalt mortar.
25
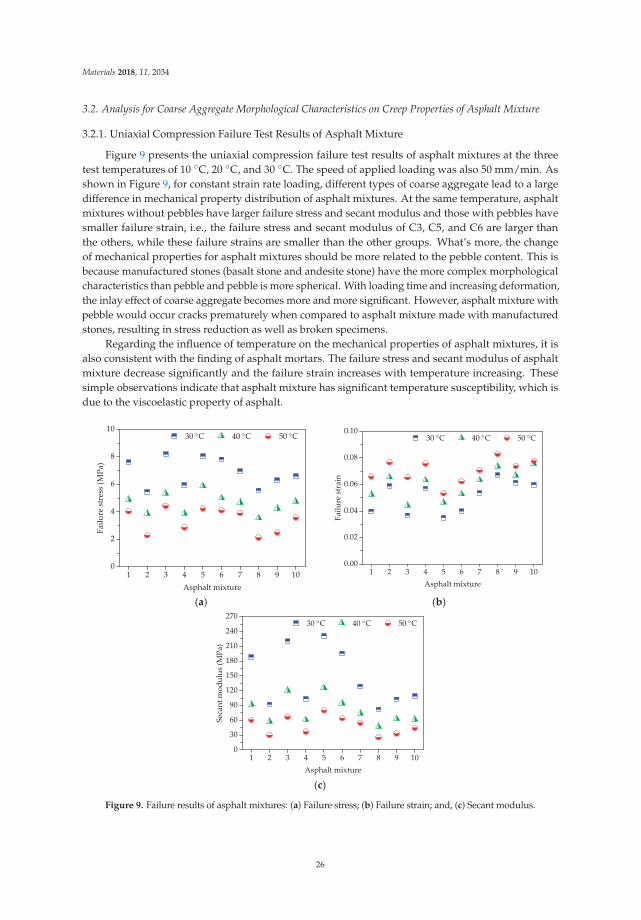
Materials 2018, 11, 2034
3.2. Analysis for Coarse Aggregate Morphological Characteristics on Creep Properties of Asphalt Mixture
3.2.1. Uniaxial Compression Failure Test Results of Asphalt Mixture
Figure 9 presents the uniaxial compression failure test results of asphalt mixtures at the threetest temperatures of 10 ◦C, 20 ◦C, and 30 ◦C. The speed of applied loading was also 50 mm/min. Asshown in Figure 9, for constant strain rate loading, different types of coarse aggregate lead to a largedifference in mechanical property distribution of asphalt mixtures. At the same temperature, asphaltmixtures without pebbles have larger failure stress and secant modulus and those with pebbles havesmaller failure strain, i.e., the failure stress and secant modulus of C3, C5, and C6 are larger thanthe others, while these failure strains are smaller than the other groups. What’s more, the changeof mechanical properties for asphalt mixtures should be more related to the pebble content. This isbecause manufactured stones (basalt stone and andesite stone) have the more complex morphologicalcharacteristics than pebble and pebble is more spherical. With loading time and increasing deformation,the inlay effect of coarse aggregate becomes more and more significant. However, asphalt mixture withpebble would occur cracks prematurely when compared to asphalt mixture made with manufacturedstones, resulting in stress reduction as well as broken specimens.
Regarding the influence of temperature on the mechanical properties of asphalt mixtures, it isalso consistent with the finding of asphalt mortars. The failure stress and secant modulus of asphaltmixture decrease significantly and the failure strain increases with temperature increasing. Thesesimple observations indicate that asphalt mixture has significant temperature susceptibility, which isdue to the viscoelastic property of asphalt.
1 2 3 4 5 6 7 8 9 100
2
4
6
8
1030 C 40 C 50 C
Failu
restress
(MPa
)
Asphalt mixture
1 2 3 4 5 6 7 8 9 100.00
0.02
0.04
0.06
0.08
0.1030 C 40 C 50 C
Failu
restrain
Asphalt mixture
(a) (b)
1 2 3 4 5 6 7 8 9 100
30
60
90
120
150
180
210
240
27030 C 40 C 50 C
Secant
mod
ulus
(MPa
)
Asphalt mixture
(c)
Figure 9. Failure results of asphalt mixtures: (a) Failure stress; (b) Failure strain; and, (c) Secant modulus.
26
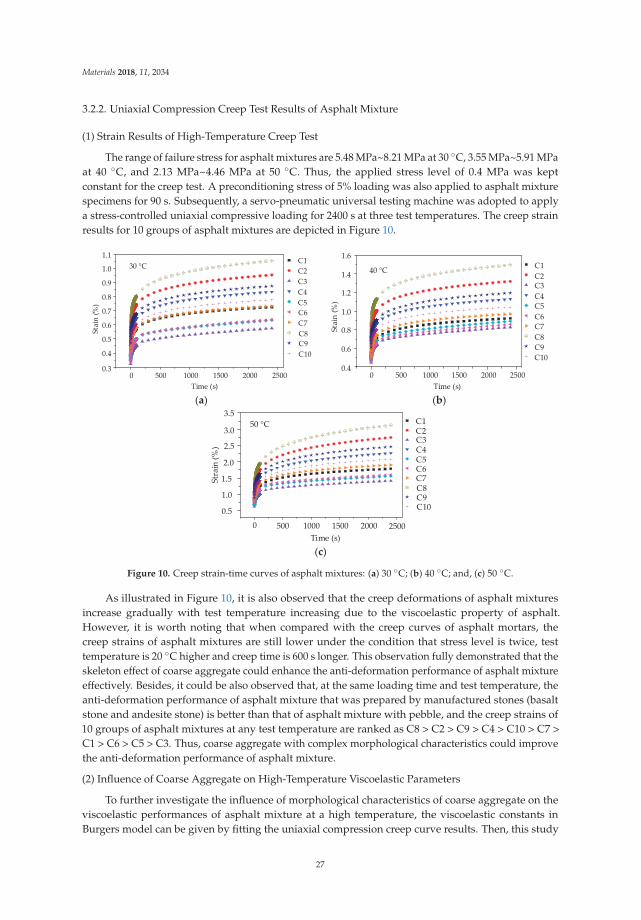
Materials 2018, 11, 2034
3.2.2. Uniaxial Compression Creep Test Results of Asphalt Mixture
(1) Strain Results of High-Temperature Creep Test
The range of failure stress for asphalt mixtures are 5.48 MPa~8.21 MPa at 30 ◦C, 3.55 MPa~5.91 MPaat 40 ◦C, and 2.13 MPa~4.46 MPa at 50 ◦C. Thus, the applied stress level of 0.4 MPa was keptconstant for the creep test. A preconditioning stress of 5% loading was also applied to asphalt mixturespecimens for 90 s. Subsequently, a servo-pneumatic universal testing machine was adopted to applya stress-controlled uniaxial compressive loading for 2400 s at three test temperatures. The creep strainresults for 10 groups of asphalt mixtures are depicted in Figure 10.
30
Time (s)
Stain(%
)
0 500 1000 1500 20000.3
0.4
0.5
0.6
0.7
0.8
0.9
1.0 30 °CC1C2C3C4C5C6C7C8C9C10
2500
1.1
40
Time (s)
Stain(%
)
0 500 1000 1500 20000.4
0.6
0.8
1.0
1.2
1.4
1.6
40 °C C1C2C3C4C5C6C7C8C9C10
2500
(a) (b)
50
Time (s)
Strain
(%)
0 500 1000 1500 2000
0.5
C1C2C3C4C5C6C7C8C9C10
50 °C
1.0
1.5
2.0
2.5
3.0
3.5
2500
(c)
Figure 10. Creep strain-time curves of asphalt mixtures: (a) 30 ◦C; (b) 40 ◦C; and, (c) 50 ◦C.
As illustrated in Figure 10, it is also observed that the creep deformations of asphalt mixturesincrease gradually with test temperature increasing due to the viscoelastic property of asphalt.However, it is worth noting that when compared with the creep curves of asphalt mortars, thecreep strains of asphalt mixtures are still lower under the condition that stress level is twice, testtemperature is 20 ◦C higher and creep time is 600 s longer. This observation fully demonstrated that theskeleton effect of coarse aggregate could enhance the anti-deformation performance of asphalt mixtureeffectively. Besides, it could be also observed that, at the same loading time and test temperature, theanti-deformation performance of asphalt mixture that was prepared by manufactured stones (basaltstone and andesite stone) is better than that of asphalt mixture with pebble, and the creep strains of10 groups of asphalt mixtures at any test temperature are ranked as C8 > C2 > C9 > C4 > C10 > C7 >C1 > C6 > C5 > C3. Thus, coarse aggregate with complex morphological characteristics could improvethe anti-deformation performance of asphalt mixture.
(2) Influence of Coarse Aggregate on High-Temperature Viscoelastic Parameters
To further investigate the influence of morphological characteristics of coarse aggregate on theviscoelastic performances of asphalt mixture at a high temperature, the viscoelastic constants inBurgers model can be given by fitting the uniaxial compression creep curve results. Then, this study
27
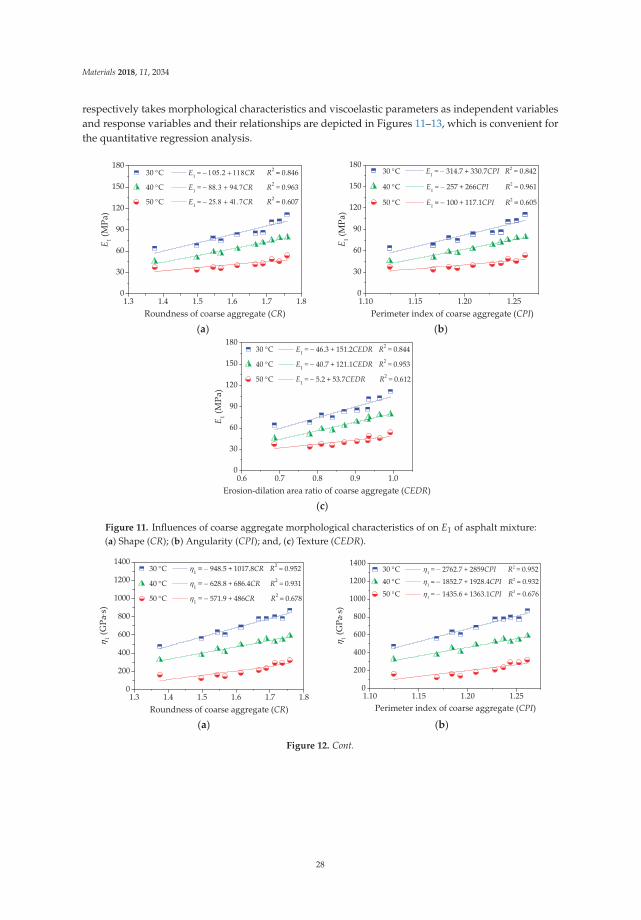
Materials 2018, 11, 2034
respectively takes morphological characteristics and viscoelastic parameters as independent variablesand response variables and their relationships are depicted in Figures 11–13, which is convenient forthe quantitative regression analysis.
1.3 1.4 1.5 1.6 1.7 1.80
30
60
90
120
150
18030 C E1 = CR R2 = 0.846
40 C E1 = CR R2 = 0.963
50 C E1 = CR R2 = 0.607
E 1(M
Pa)
Roundness of coarse aggregate (CR)1.10 1.15 1.20 1.250
30
60
90
120
150
18030 C E1 = 314.7 + 330.7CPI R2 = 0.842
40 C E1 = 257 + 266CPI R2 = 0.961
50 C E1 = 100 + 117.1CPI R2 = 0.605
E 1(M
Pa)
Perimeter index of coarse aggregate (CPI)
(a) (b)
0.6 0.7 0.8 0.9 1.00
30
60
90
120
150
18030 C E1 = 46.3 + 151.2CEDR R2 = 0.844
40 C E1 = 40.7 + 121.1CEDR R2 = 0.953
50 C E1 = 5.2 + 53.7CEDR R2 = 0.612
E 1(M
Pa)
Erosion dilation area ratio of coarse aggregate (CEDR)
(c)
Figure 11. Influences of coarse aggregate morphological characteristics of on E1 of asphalt mixture:(a) Shape (CR); (b) Angularity (CPI); and, (c) Texture (CEDR).
1.3 1.4 1.5 1.6 1.7 1.80
200
400
600
800
1000
1200
140030 C 1 = 948.5 + 1017.8CR R2 = 0.952
40 C 1 = 628.8 + 686.4CR R2 = 0.931
50 C 1 = 571.9 + 486CR R2 = 0.678
1(G
Pas)
Roundness of coarse aggregate (CR)1.10 1.15 1.20 1.250
200
400
600
800
1000
1200
140030 C 1 = 2762.7 + 2859CPI R2 = 0.952
40 C 1 = 1852.7 + 1928.4CPI R2 = 0.932
50 C 1 = 1435.6 + 1363.1CPI R2 = 0.676
1(G
Pas)
Perimeter index of coarse aggregate (CPI)
(a) (b)
Figure 12. Cont.
28
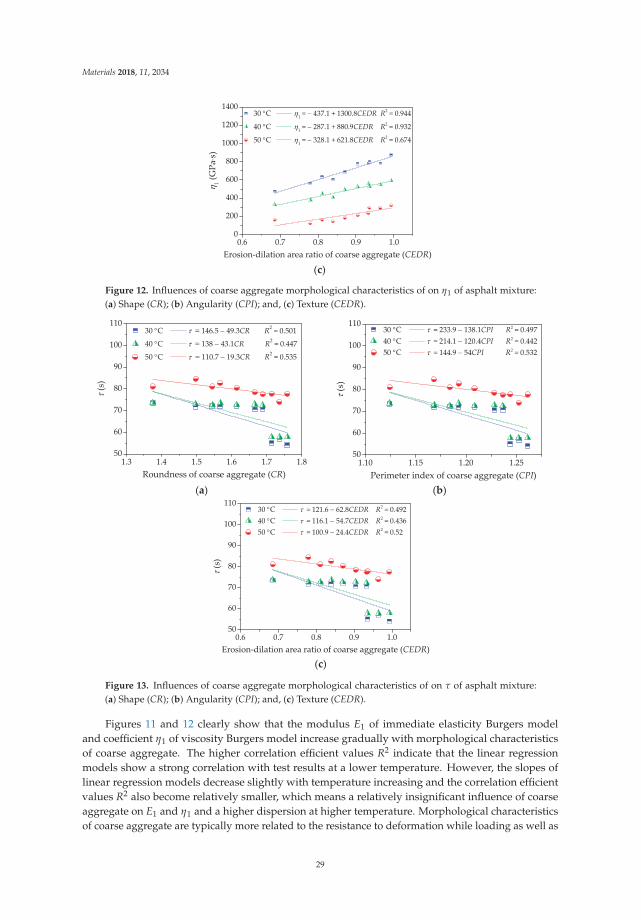
Materials 2018, 11, 2034
0.6 0.7 0.8 0.9 1.00
200
400
600
800
1000
1200
140030 C 1 = 437.1 + 1300.8CEDR R2 = 0.944
40 C 1 = 287.1 + 880.9CEDR R2 = 0.932
50 C 1 = 328.1 + 621.8CEDR R2 = 0.674
1(G
Pas)
Erosion dilation area ratio of coarse aggregate (CEDR)
(c)
Figure 12. Influences of coarse aggregate morphological characteristics of on η1 of asphalt mixture:(a) Shape (CR); (b) Angularity (CPI); and, (c) Texture (CEDR).
1.3 1.4 1.5 1.6 1.7 1.850
60
70
80
90
100
11030 C = 146.5 49.3CR R2 = 0.501
40 C = 138 43.1CR R2 = 0.447
50 C = 110.7 19.3CR R2 = 0.535
(s)
Roundness of coarse aggregate (CR)1.10 1.15 1.20 1.25
50
60
70
80
90
100
11030 C = 233.9 138.1CPI R2 = 0.49740 C = 214.1 120.4CPI R2 = 0.44250 C = 144.9 54CPI R2 = 0.532
(s)
Perimeter index of coarse aggregate (CPI)(a) (b)
0.6 0.7 0.8 0.9 1.050
60
70
80
90
100
11030 C = 121.6 62.8CEDR R2 = 0.49240 C = 116.1 54.7CEDR R2 = 0.43650 C = 100.9 24.4CEDR R2 = 0.52
(s)
Erosion dilation area ratio of coarse aggregate (CEDR)
(c)
Figure 13. Influences of coarse aggregate morphological characteristics of on τ of asphalt mixture:(a) Shape (CR); (b) Angularity (CPI); and, (c) Texture (CEDR).
Figures 11 and 12 clearly show that the modulus E1 of immediate elasticity Burgers modeland coefficient η1 of viscosity Burgers model increase gradually with morphological characteristicsof coarse aggregate. The higher correlation efficient values R2 indicate that the linear regressionmodels show a strong correlation with test results at a lower temperature. However, the slopes oflinear regression models decrease slightly with temperature increasing and the correlation efficientvalues R2 also become relatively smaller, which means a relatively insignificant influence of coarseaggregate on E1 and η1 and a higher dispersion at higher temperature. Morphological characteristicsof coarse aggregate are typically more related to the resistance to deformation while loading as well as
29
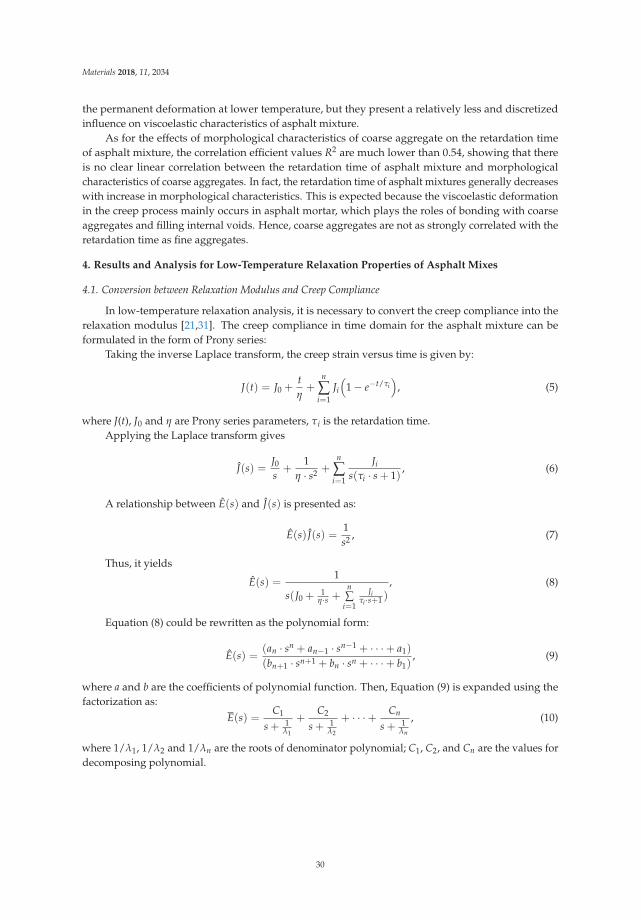
Materials 2018, 11, 2034
the permanent deformation at lower temperature, but they present a relatively less and discretizedinfluence on viscoelastic characteristics of asphalt mixture.
As for the effects of morphological characteristics of coarse aggregate on the retardation timeof asphalt mixture, the correlation efficient values R2 are much lower than 0.54, showing that thereis no clear linear correlation between the retardation time of asphalt mixture and morphologicalcharacteristics of coarse aggregates. In fact, the retardation time of asphalt mixtures generally decreaseswith increase in morphological characteristics. This is expected because the viscoelastic deformationin the creep process mainly occurs in asphalt mortar, which plays the roles of bonding with coarseaggregates and filling internal voids. Hence, coarse aggregates are not as strongly correlated with theretardation time as fine aggregates.
4. Results and Analysis for Low-Temperature Relaxation Properties of Asphalt Mixes
4.1. Conversion between Relaxation Modulus and Creep Compliance
In low-temperature relaxation analysis, it is necessary to convert the creep compliance into therelaxation modulus [21,31]. The creep compliance in time domain for the asphalt mixture can beformulated in the form of Prony series:
Taking the inverse Laplace transform, the creep strain versus time is given by:
J(t) = J0 +tη+
n
∑i=1
Ji
(1 − e−t/τi
), (5)
where J(t), J0 and η are Prony series parameters, τi is the retardation time.Applying the Laplace transform gives
J(s) =J0
s+
1η · s2 +
n
∑i=1
Jis(τi · s + 1)
, (6)
A relationship between E(s) and J(s) is presented as:
E(s) J(s) =1s2 , (7)
Thus, it yields
E(s) =1
s(J0 +1
η·s +n∑
i=1
Jiτi ·s+1 )
, (8)
Equation (8) could be rewritten as the polynomial form:
E(s) =(an · sn + an−1 · sn−1 + · · ·+ a1)
(bn+1 · sn+1 + bn · sn + · · ·+ b1), (9)
where a and b are the coefficients of polynomial function. Then, Equation (9) is expanded using thefactorization as:
E(s) =C1
s + 1λ1
+C2
s + 1λ2
+ · · ·+ Cn
s + 1λn
, (10)
where 1/λ1, 1/λ2 and 1/λn are the roots of denominator polynomial; C1, C2, and Cn are the values fordecomposing polynomial.
30
Materials 2018, 11, 2034
Applying the inverse Laplace transform to Equation (10) leads to the relaxation modulus of thegeneralized Maxwell model with an individual spring element:
E(t) = E∞ +n
∑i=1
Eie−t/ρi , (11)
where E∞ is the equilibrium modulus; Ei is the elastic modulus of the ith Maxwell element and ρi isthe relaxation time of the ith Maxwell element; and, n is the number of Maxwell element.
4.2. Analysis for Fine Aggregate Morphological Characteristics on Relaxation Properties of Asphalt Mortar
4.2.1. Beam Bending Failure Test Results of Asphalt Mortar
The test temperature was −5 ◦C and the speed of applied loading was 50 mm/min in the beambending failure test of asphalt mortar to determine an appropriate stress level for further beam bendingcreep test. The beam specimens of asphalt mortars were placed in an environmental chamber for atleast 4 h and the beam bending failure test results could be expressed as the average of three replicatesfor each group of asphalt mortars. Figure 14 shows the bending failure stress, bending failure strain,and stiffness modulus results of all the asphalt mortars.
1 2 3 4 5 6 7 8 9 100
2
4
6
8
10
12
14
Failu
restress
(MPa
)
Asphalt mortar beams1 2 3 4 5 6 7 8 9 10
0
1000
2000
3000
4000
5000
6000
7000
Failu
restrain
()
Asphalt mortar beams
(a) (b)
1 2 3 4 5 6 7 8 9 100
300
600
900
1200
1500
1800
2100
2400
2700
Stiffness
mod
ulus
(MPa
)
Asphalt mortar beams
(c)
Figure 14. Failure results of asphalt mortar beams: (a) Failure stress; (b) Failure strain; and,(c) Stiffness modulus.
As shown in Figure 14a, asphalt mortars with different morphological characteristics of fineaggregate have obvious different ultimate loads in the beam bending failure test. The bending failurestress could be ranked from big to small, as follows: F5 > F3 > F6 > F7 > F1 > F10 > F4 > F9 > F2> F8. The bigger the bending failure stress, the more the ultimate load and the better the bending
31
Materials 2018, 11, 2034
failure performance. Therefore, due to the better cohesive effect between fine aggregate with complexmorphological characteristics and asphalt binder, it is evident that manufactured sands can improvethe bending failure strength of asphalt mortar.
Figure 14b compares the maximum deformation of asphalt mortars in the beam bending failuretest. The bending failure strains for 10 groups of asphalt mortars are ranked as F8 > F2 > F9 > F4 > F10> F6 > F7 > F1 > F5 > F3. A higher bending failure strain is preferable for the low-temperature crackingresistance, which indicates that the asphalt mortar made by manufactured sands is easier to producethe low-temperature embrittlement. This is because fine aggregate with complex morphologicalcharacteristics would occur the stress concentration phenomenon while loading, leading to cracks atstress concentration points.
As for the stiffness modulus in Figure 14c, stiffness modulus characterizes the compatibility ofdeformation, comprehensively reflecting the relationship between load and deformation. Figure 14cclearly shows that the stiffness modulus can be ranked as: F3 > F5 > F6 > F1 > F7 > F10 > F4 > F9 > F2> F8. Asphalt mortar prepared by river sand has the smallest stiffness modulus, suggesting that riversand could improve the low-temperature cracking resistance of the asphalt mortar.
4.2.2. Beam Bending Creep Test Results of Asphalt Mortar
(1) Strain Results of Low-Temperature Creep TestA servo-pneumatic universal testing machine was used to conduct the low-temperature creep
test at −5 ◦C for 1800 s. The bending stress level was set as 1.38 MPa for the stress-controlled uniaxialcompressive loading. Based on the measured test results, Figure 15 depicts the bending strains againstthe loading time in the beam bending creep test. It clearly shows that the bending strains of beamsamples increase gradually with the loading time and the creep strains for 10 testing groups areranked as F8 > F2 > F9 > F4 > F10 > F7 > F1 > F5 > F6 > F3. Asphalt mortar that is prepared by riversand (i.e., F8) has the largest strain, whereas asphalt mortar prepared by andesite manufactured sand(i.e., F3) has the smallest strain. What is more, the bending creep strain exhibits a rising trend withthe content of river sand. This observation is consistent with the morphological analysis that, dueto river sands close to spherical, the more river sands asphalt mortar has, the weaker the inlay effectof aggregates.
Time (s)
Strain
()
0 500 1000 1500 20000.0
4000
8000
12,000
16,000F1F2F3F4F5F6F7F8F9F10
5 °C
Figure 15. Creep strain-time curves of asphalt mortar beams.
The bending creep strain curves in Figure 15 were used to determine the creep compliance byusing the fitting method. Then, based on the conversion between the relaxation modulus and creepcompliance, the Prony series model of relaxation modulus could be conducted for 10 groups of asphaltmortars. In general, the relaxation time is on an axis using the logarithmic scale and the relaxationtime are selected as 0.5 s, 5 s, 50 s, 500 s, and 5000 s. Table 8 summarizes the parameters of Prony seriesmodel of relaxation modulus and the R2 values for asphalt mortars. It is found that the Prony seriesmodel can provide excellent fittings with R2 values larger than 0.998, indicating that this Prony seriesmodel is able to accurately describe the relaxation characteristics of asphalt mortars. Subsequently,
32
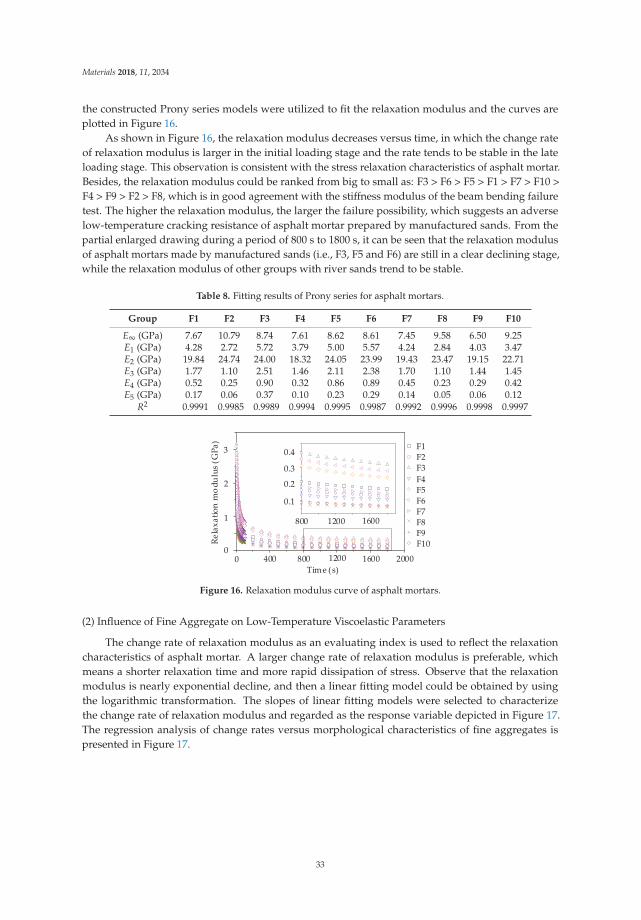
Materials 2018, 11, 2034
the constructed Prony series models were utilized to fit the relaxation modulus and the curves areplotted in Figure 16.
As shown in Figure 16, the relaxation modulus decreases versus time, in which the change rateof relaxation modulus is larger in the initial loading stage and the rate tends to be stable in the lateloading stage. This observation is consistent with the stress relaxation characteristics of asphalt mortar.Besides, the relaxation modulus could be ranked from big to small as: F3 > F6 > F5 > F1 > F7 > F10 >F4 > F9 > F2 > F8, which is in good agreement with the stiffness modulus of the beam bending failuretest. The higher the relaxation modulus, the larger the failure possibility, which suggests an adverselow-temperature cracking resistance of asphalt mortar prepared by manufactured sands. From thepartial enlarged drawing during a period of 800 s to 1800 s, it can be seen that the relaxation modulusof asphalt mortars made by manufactured sands (i.e., F3, F5 and F6) are still in a clear declining stage,while the relaxation modulus of other groups with river sands trend to be stable.
Table 8. Fitting results of Prony series for asphalt mortars.
Group F1 F2 F3 F4 F5 F6 F7 F8 F9 F10
E∞ (GPa) 7.67 10.79 8.74 7.61 8.62 8.61 7.45 9.58 6.50 9.25E1 (GPa) 4.28 2.72 5.72 3.79 5.00 5.57 4.24 2.84 4.03 3.47E2 (GPa) 19.84 24.74 24.00 18.32 24.05 23.99 19.43 23.47 19.15 22.71E3 (GPa) 1.77 1.10 2.51 1.46 2.11 2.38 1.70 1.10 1.44 1.45E4 (GPa) 0.52 0.25 0.90 0.32 0.86 0.89 0.45 0.23 0.29 0.42E5 (GPa) 0.17 0.06 0.37 0.10 0.23 0.29 0.14 0.05 0.06 0.12
R2 0.9991 0.9985 0.9989 0.9994 0.9995 0.9987 0.9992 0.9996 0.9998 0.9997
Relax
ationmodu
lus(G
Pa)
800 1200 1600
0.1
0.2
0.3
0.4
0 400 800 1200 1600 2000
800 1200 1600
0
1
2
3
Time (s)
F1F2F3F4F5F6F7F8F9F10
0.1
0.2
0.3
0.4
Figure 16. Relaxation modulus curve of asphalt mortars.
(2) Influence of Fine Aggregate on Low-Temperature Viscoelastic Parameters
The change rate of relaxation modulus as an evaluating index is used to reflect the relaxationcharacteristics of asphalt mortar. A larger change rate of relaxation modulus is preferable, whichmeans a shorter relaxation time and more rapid dissipation of stress. Observe that the relaxationmodulus is nearly exponential decline, and then a linear fitting model could be obtained by usingthe logarithmic transformation. The slopes of linear fitting models were selected to characterizethe change rate of relaxation modulus and regarded as the response variable depicted in Figure 17.The regression analysis of change rates versus morphological characteristics of fine aggregates ispresented in Figure 17.
33
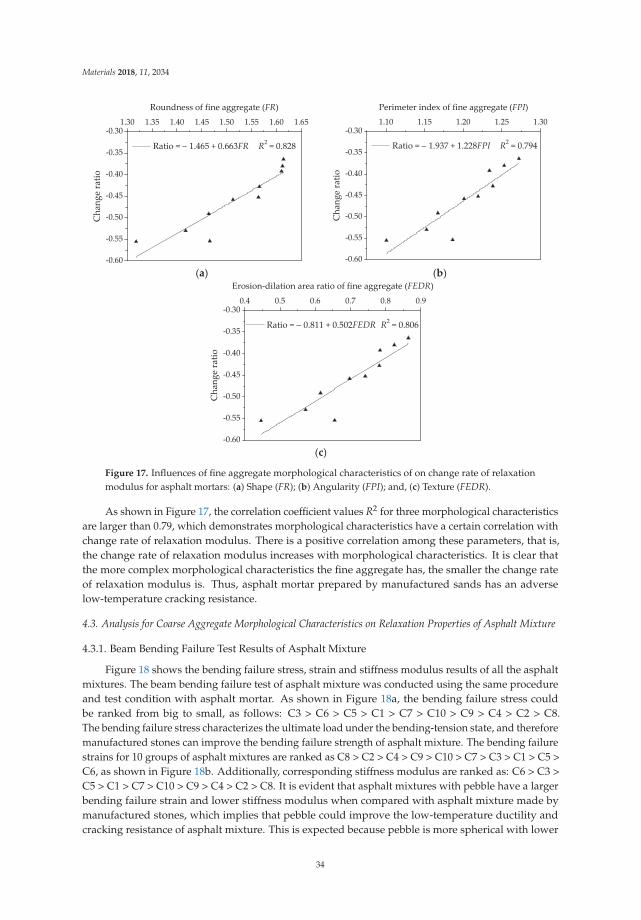
Materials 2018, 11, 2034
1.30 1.35 1.40 1.45 1.50 1.55 1.60 1.65
0.60
0.55
0.50
0.45
0.40
0.35
0.30
Roundness of fine aggregate (FR)
Ratio = 1.465 + 0.663FR R2 = 0.828
Cha
ngeratio
1.10 1.15 1.20 1.25 1.30
0.60
0.55
0.50
0.45
0.40
0.35
0.30
Perimeter index of fine aggregate (FPI)
Ratio = 1.937 + 1.228FPI R2 = 0.794
Cha
ngeratio
(a) (b)
0.4 0.5 0.6 0.7 0.8 0.9
0.60
0.55
0.50
0.45
0.40
0.35
0.30
Erosion dilation area ratio of fine aggregate (FEDR)
Ratio = 0.811 + 0.502FEDR R2 = 0.806
Cha
ngeratio
(c)
Figure 17. Influences of fine aggregate morphological characteristics of on change rate of relaxationmodulus for asphalt mortars: (a) Shape (FR); (b) Angularity (FPI); and, (c) Texture (FEDR).
As shown in Figure 17, the correlation coefficient values R2 for three morphological characteristicsare larger than 0.79, which demonstrates morphological characteristics have a certain correlation withchange rate of relaxation modulus. There is a positive correlation among these parameters, that is,the change rate of relaxation modulus increases with morphological characteristics. It is clear thatthe more complex morphological characteristics the fine aggregate has, the smaller the change rateof relaxation modulus is. Thus, asphalt mortar prepared by manufactured sands has an adverselow-temperature cracking resistance.
4.3. Analysis for Coarse Aggregate Morphological Characteristics on Relaxation Properties of Asphalt Mixture
4.3.1. Beam Bending Failure Test Results of Asphalt Mixture
Figure 18 shows the bending failure stress, strain and stiffness modulus results of all the asphaltmixtures. The beam bending failure test of asphalt mixture was conducted using the same procedureand test condition with asphalt mortar. As shown in Figure 18a, the bending failure stress couldbe ranked from big to small, as follows: C3 > C6 > C5 > C1 > C7 > C10 > C9 > C4 > C2 > C8.The bending failure stress characterizes the ultimate load under the bending-tension state, and thereforemanufactured stones can improve the bending failure strength of asphalt mixture. The bending failurestrains for 10 groups of asphalt mixtures are ranked as C8 > C2 > C4 > C9 > C10 > C7 > C3 > C1 > C5 >C6, as shown in Figure 18b. Additionally, corresponding stiffness modulus are ranked as: C6 > C3 >C5 > C1 > C7 > C10 > C9 > C4 > C2 > C8. It is evident that asphalt mixtures with pebble have a largerbending failure strain and lower stiffness modulus when compared with asphalt mixture made bymanufactured stones, which implies that pebble could improve the low-temperature ductility andcracking resistance of asphalt mixture. This is expected because pebble is more spherical with lower
34
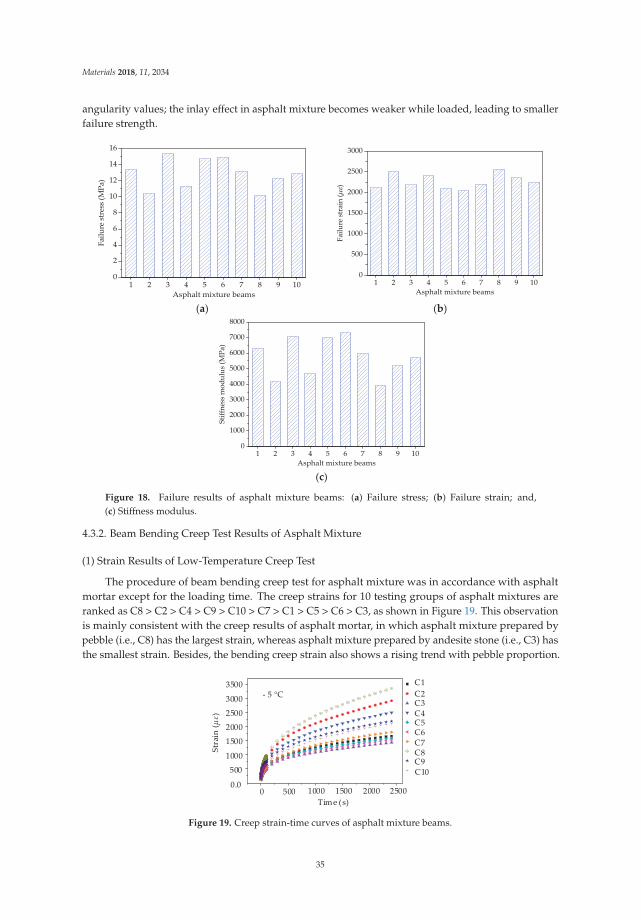
Materials 2018, 11, 2034
angularity values; the inlay effect in asphalt mixture becomes weaker while loaded, leading to smallerfailure strength.
1 2 3 4 5 6 7 8 9 100
2
4
6
8
10
12
14
16
Failu
restress(M
Pa)
Asphalt mixture beams1 2 3 4 5 6 7 8 9 10
0
500
1000
1500
2000
2500
3000
Failu
restrain(
)
Asphalt mixture beams
(a) (b)
1 2 3 4 5 6 7 8 9 100
1000
2000
3000
4000
5000
6000
7000
8000
Stiffnessmod
ulus
(MPa)
Asphalt mixture beams
(c)
Figure 18. Failure results of asphalt mixture beams: (a) Failure stress; (b) Failure strain; and,(c) Stiffness modulus.
4.3.2. Beam Bending Creep Test Results of Asphalt Mixture
(1) Strain Results of Low-Temperature Creep Test
The procedure of beam bending creep test for asphalt mixture was in accordance with asphaltmortar except for the loading time. The creep strains for 10 testing groups of asphalt mixtures areranked as C8 > C2 > C4 > C9 > C10 > C7 > C1 > C5 > C6 > C3, as shown in Figure 19. This observationis mainly consistent with the creep results of asphalt mortar, in which asphalt mixture prepared bypebble (i.e., C8) has the largest strain, whereas asphalt mixture prepared by andesite stone (i.e., C3) hasthe smallest strain. Besides, the bending creep strain also shows a rising trend with pebble proportion.
Time (s)
Strain
()
0 500 1000 1500 20000.0
500
1500
2500
3000
C1C2C3C4C5C6C7C8C9C10
5 °C
2500
1000
2000
3500
Figure 19. Creep strain-time curves of asphalt mixture beams.
35
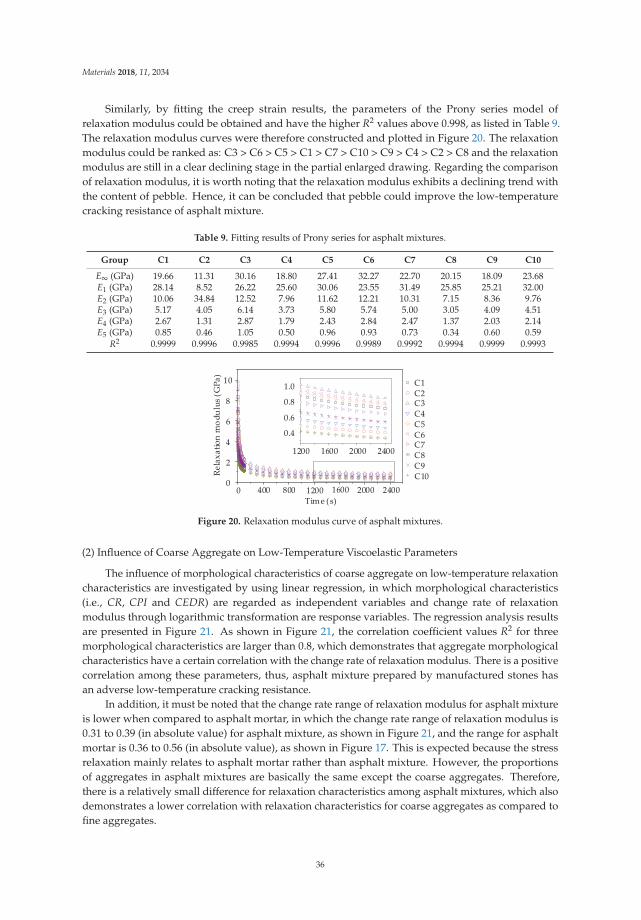
Materials 2018, 11, 2034
Similarly, by fitting the creep strain results, the parameters of the Prony series model ofrelaxation modulus could be obtained and have the higher R2 values above 0.998, as listed in Table 9.The relaxation modulus curves were therefore constructed and plotted in Figure 20. The relaxationmodulus could be ranked as: C3 > C6 > C5 > C1 > C7 > C10 > C9 > C4 > C2 > C8 and the relaxationmodulus are still in a clear declining stage in the partial enlarged drawing. Regarding the comparisonof relaxation modulus, it is worth noting that the relaxation modulus exhibits a declining trend withthe content of pebble. Hence, it can be concluded that pebble could improve the low-temperaturecracking resistance of asphalt mixture.
Table 9. Fitting results of Prony series for asphalt mixtures.
Group C1 C2 C3 C4 C5 C6 C7 C8 C9 C10
E∞ (GPa) 19.66 11.31 30.16 18.80 27.41 32.27 22.70 20.15 18.09 23.68E1 (GPa) 28.14 8.52 26.22 25.60 30.06 23.55 31.49 25.85 25.21 32.00E2 (GPa) 10.06 34.84 12.52 7.96 11.62 12.21 10.31 7.15 8.36 9.76E3 (GPa) 5.17 4.05 6.14 3.73 5.80 5.74 5.00 3.05 4.09 4.51E4 (GPa) 2.67 1.31 2.87 1.79 2.43 2.84 2.47 1.37 2.03 2.14E5 (GPa) 0.85 0.46 1.05 0.50 0.96 0.93 0.73 0.34 0.60 0.59
R2 0.9999 0.9996 0.9985 0.9994 0.9996 0.9989 0.9992 0.9994 0.9999 0.9993
1200 1600 2000 2400
0.4
0.6
0.8
1.0
Relax
ationmod
ulus(
GPa
)
0 400 800 1600 2000 2400
1200 1600 2000
0
2
6
10
Time (s)
C1C2C3C4C5C6C7C8C9C10
0.4
0.6
0.8
1.0
4
8
1200
2400
Figure 20. Relaxation modulus curve of asphalt mixtures.
(2) Influence of Coarse Aggregate on Low-Temperature Viscoelastic Parameters
The influence of morphological characteristics of coarse aggregate on low-temperature relaxationcharacteristics are investigated by using linear regression, in which morphological characteristics(i.e., CR, CPI and CEDR) are regarded as independent variables and change rate of relaxationmodulus through logarithmic transformation are response variables. The regression analysis resultsare presented in Figure 21. As shown in Figure 21, the correlation coefficient values R2 for threemorphological characteristics are larger than 0.8, which demonstrates that aggregate morphologicalcharacteristics have a certain correlation with the change rate of relaxation modulus. There is a positivecorrelation among these parameters, thus, asphalt mixture prepared by manufactured stones hasan adverse low-temperature cracking resistance.
In addition, it must be noted that the change rate range of relaxation modulus for asphalt mixtureis lower when compared to asphalt mortar, in which the change rate range of relaxation modulus is0.31 to 0.39 (in absolute value) for asphalt mixture, as shown in Figure 21, and the range for asphaltmortar is 0.36 to 0.56 (in absolute value), as shown in Figure 17. This is expected because the stressrelaxation mainly relates to asphalt mortar rather than asphalt mixture. However, the proportionsof aggregates in asphalt mixtures are basically the same except the coarse aggregates. Therefore,there is a relatively small difference for relaxation characteristics among asphalt mixtures, which alsodemonstrates a lower correlation with relaxation characteristics for coarse aggregates as compared tofine aggregates.
36
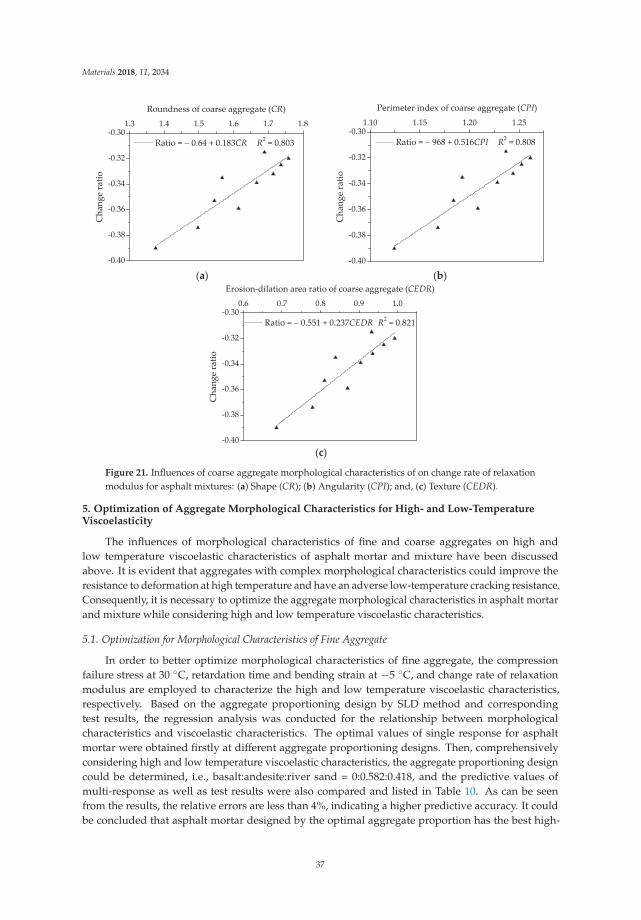
Materials 2018, 11, 2034
1.3 1.4 1.5 1.6 1.7 1.8
0.40
0.38
0.36
0.34
0.32
0.30
Roundness of coarse aggregate (CR)
Ratio = 0.64 + 0.183CR R2 = 0.803
Cha
ngeratio
1.10 1.15 1.20 1.25
0.40
0.38
0.36
0.34
0.32
0.30
Perimeter index of coarse aggregate (CPI)
Ratio = 968 + 0.516CPI R2 = 0.808
Cha
ngeratio
(a) (b)
0.6 0.7 0.8 0.9 1.0
0.40
0.38
0.36
0.34
0.32
0.30
Erosion dilation area ratio of coarse aggregate (CEDR)
Ratio = 0.551 + 0.237CEDR R2 = 0.821
Cha
ngeratio
(c)
Figure 21. Influences of coarse aggregate morphological characteristics of on change rate of relaxationmodulus for asphalt mixtures: (a) Shape (CR); (b) Angularity (CPI); and, (c) Texture (CEDR).
5. Optimization of Aggregate Morphological Characteristics for High- and Low-TemperatureViscoelasticity
The influences of morphological characteristics of fine and coarse aggregates on high andlow temperature viscoelastic characteristics of asphalt mortar and mixture have been discussedabove. It is evident that aggregates with complex morphological characteristics could improve theresistance to deformation at high temperature and have an adverse low-temperature cracking resistance.Consequently, it is necessary to optimize the aggregate morphological characteristics in asphalt mortarand mixture while considering high and low temperature viscoelastic characteristics.
5.1. Optimization for Morphological Characteristics of Fine Aggregate
In order to better optimize morphological characteristics of fine aggregate, the compressionfailure stress at 30 ◦C, retardation time and bending strain at −5 ◦C, and change rate of relaxationmodulus are employed to characterize the high and low temperature viscoelastic characteristics,respectively. Based on the aggregate proportioning design by SLD method and correspondingtest results, the regression analysis was conducted for the relationship between morphologicalcharacteristics and viscoelastic characteristics. The optimal values of single response for asphaltmortar were obtained firstly at different aggregate proportioning designs. Then, comprehensivelyconsidering high and low temperature viscoelastic characteristics, the aggregate proportioning designcould be determined, i.e., basalt:andesite:river sand = 0:0.582:0.418, and the predictive values ofmulti-response as well as test results were also compared and listed in Table 10. As can be seenfrom the results, the relative errors are less than 4%, indicating a higher predictive accuracy. It couldbe concluded that asphalt mortar designed by the optimal aggregate proportion has the best high-
37
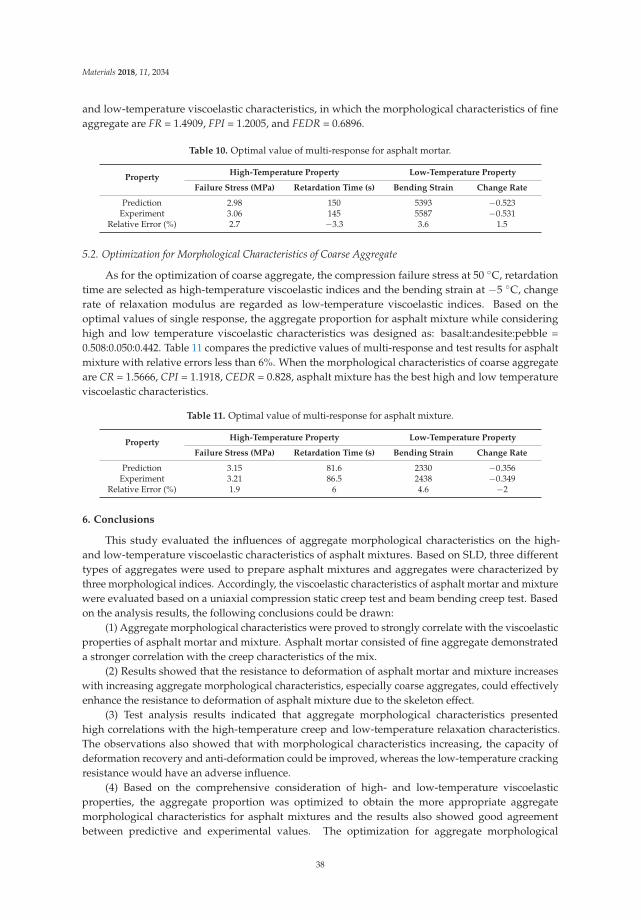
Materials 2018, 11, 2034
and low-temperature viscoelastic characteristics, in which the morphological characteristics of fineaggregate are FR = 1.4909, FPI = 1.2005, and FEDR = 0.6896.
Table 10. Optimal value of multi-response for asphalt mortar.
PropertyHigh-Temperature Property Low-Temperature Property
Failure Stress (MPa) Retardation Time (s) Bending Strain Change Rate
Prediction 2.98 150 5393 −0.523Experiment 3.06 145 5587 −0.531
Relative Error (%) 2.7 −3.3 3.6 1.5
5.2. Optimization for Morphological Characteristics of Coarse Aggregate
As for the optimization of coarse aggregate, the compression failure stress at 50 ◦C, retardationtime are selected as high-temperature viscoelastic indices and the bending strain at −5 ◦C, changerate of relaxation modulus are regarded as low-temperature viscoelastic indices. Based on theoptimal values of single response, the aggregate proportion for asphalt mixture while consideringhigh and low temperature viscoelastic characteristics was designed as: basalt:andesite:pebble =0.508:0.050:0.442. Table 11 compares the predictive values of multi-response and test results for asphaltmixture with relative errors less than 6%. When the morphological characteristics of coarse aggregateare CR = 1.5666, CPI = 1.1918, CEDR = 0.828, asphalt mixture has the best high and low temperatureviscoelastic characteristics.
Table 11. Optimal value of multi-response for asphalt mixture.
PropertyHigh-Temperature Property Low-Temperature Property
Failure Stress (MPa) Retardation Time (s) Bending Strain Change Rate
Prediction 3.15 81.6 2330 −0.356Experiment 3.21 86.5 2438 −0.349
Relative Error (%) 1.9 6 4.6 −2
6. Conclusions
This study evaluated the influences of aggregate morphological characteristics on the high-and low-temperature viscoelastic characteristics of asphalt mixtures. Based on SLD, three differenttypes of aggregates were used to prepare asphalt mixtures and aggregates were characterized bythree morphological indices. Accordingly, the viscoelastic characteristics of asphalt mortar and mixturewere evaluated based on a uniaxial compression static creep test and beam bending creep test. Basedon the analysis results, the following conclusions could be drawn:
(1) Aggregate morphological characteristics were proved to strongly correlate with the viscoelasticproperties of asphalt mortar and mixture. Asphalt mortar consisted of fine aggregate demonstrateda stronger correlation with the creep characteristics of the mix.
(2) Results showed that the resistance to deformation of asphalt mortar and mixture increaseswith increasing aggregate morphological characteristics, especially coarse aggregates, could effectivelyenhance the resistance to deformation of asphalt mixture due to the skeleton effect.
(3) Test analysis results indicated that aggregate morphological characteristics presentedhigh correlations with the high-temperature creep and low-temperature relaxation characteristics.The observations also showed that with morphological characteristics increasing, the capacity ofdeformation recovery and anti-deformation could be improved, whereas the low-temperature crackingresistance would have an adverse influence.
(4) Based on the comprehensive consideration of high- and low-temperature viscoelasticproperties, the aggregate proportion was optimized to obtain the more appropriate aggregatemorphological characteristics for asphalt mixtures and the results also showed good agreementbetween predictive and experimental values. The optimization for aggregate morphological
38
Materials 2018, 11, 2034
characteristics should be considered in asphalt mixture design in order to improve the performancesof asphalt pavement.
Author Contributions: Conceptualization, Y.C. and W.W.; Methodology, W.W. and J.T.; Validation, Y.C., J.T. andG.M.; Formal Analysis, M.X., X.X. and S.W.; Investigation, W.W., J.T. and S.W.; Writing-Original Draft Preparation,W.W.; Writing-Review & Editing, Y.C., M.X. and X.X.; Project Administration, Y.C.; Funding Acquisition, Y.C.
Funding: This research was funded by [National Natural Science Foundation of China] grant number [51678271]and [Science Technology Development Program of Jilin Province] grant number [20160204008SF] and supportedby Graduate Innovation Fund of Jilin University.
Acknowledgments: The authors would like to appreciate anonymous reviewers for their constructive suggestionsand comments to improve the quality of the paper.
Conflicts of Interest: The authors declare no conflict of interest.
References
1. Tang, F.L.; Xu, G.J.; Ma, T.; Kong, L.Y. Study on the Effect of Demulsification Speed of Emulsified Asphaltbased on Surface Characteristics of Aggregates. Materials 2018, 11, 1488. [CrossRef] [PubMed]
2. Wilson, J.; Klotz, L. Quantitative analysis of aggregate based on hough transform. Transp. Res. Rec. 1996,1530, 111–115. [CrossRef]
3. Kuo, C.Y.; Rollings, R.S.; Lynch, L.N. Morphological study of coarse aggregates using image analysis. J. Mater.Civ. Eng. 1998, 10, 135–142. [CrossRef]
4. Masad, E.; Button, J.W. Unified imaging approach for measuring aggregate angularity and texture.Comput.-Aided Civ. Inf. 2000, 15, 273–280. [CrossRef]
5. Kuo, C.Y.; Freeman, R. Imaging indices for quantification of shape, angularity, and surface texture ofaggregates. Transp. Res. Rec. 2000, 1721, 57–65. [CrossRef]
6. Wang, L.B.; Wamg, X.R.; Mohammad, L.; Abadie, C. Unified method to quantify aggregate shape angularityand texture using fourier analysis. J. Mater. Civ. Eng. 2005, 17, 498–504. [CrossRef]
7. Hu, J.; Qian, Z.D.; Wang, D.; Oeser, M. Influence of aggregate particles on mastic and air-voids in asphaltconcrete. Constr. Build. Mater. 2015, 93, 1–9. [CrossRef]
8. Xie, X.G.; Lu, G.Y.; Liu, P.F.; Wang, D.W.; Fan, Q.; Oeser, M. Evaluation of morphological characteristics offine aggregate in asphalt pavement. Constr. Build. Mater. 2017, 139, 1–8. [CrossRef]
9. Ding, X.H.; Ma, T.; Gao, W. Morphological characterization and mechanical analysis for coarse aggregateskeleton of asphalt mixture based on discrete-element modeling. Constr. Build. Mater. 2017, 154, 1048–1061.[CrossRef]
10. Xiao, Y.; Wang, F.; Cui, P.D.; Lei, L.; Lin, J.T.; Yi, M.W. Evaluation of Fine Aggregate Morphology by ImageMethod and Its Effect on Skid-Resistance of Micro-Surfacing. Materials 2018, 11, 920. [CrossRef] [PubMed]
11. Wang, D.H.; Ding, X.H.; Ma, T.; Zhang, W.G.; Zhang, D.Y. Algorithm for Virtual Aggregates’ ReconstitutionBased on Image Processing and Discrete-Element Modeling. Appl. Sci. 2018, 8, 738. [CrossRef]
12. Chen, J.S.; Shiah, M.S.; Chen, H.J. Quantification of coarse aggregate shape and its effect on engineeringproperties of hot-mix asphalt mixtures. J. Test. Eval. 2001, 29, 513–519.
13. Masad, E.; Olcott, D.; White, T.; Tashman, L. Correlation of fine aggregate imaging shape indices with asphaltmixture performance. Transp. Res. Rec. 2001, 1757, 148–156. [CrossRef]
14. Arasan, S.; Yenera, E.; Hattatoglu, F.; Hinislioglua, S.; Akbuluta, S. Correlation between shape of aggregateand mechanical properties of asphalt concrete. Road Mater. Pavement Des. 2011, 12, 239–262.
15. Singh, D.; Zaman, M.; Commuri, S. Inclusion of aggregate angularity, texture, and form in estimatingdynamic modulus of asphalt mixes. Road Mater. Pavement Des. 2012, 13, 327–344. [CrossRef]
16. Pan, T.Y.; Tutumluer, E.; Carpenter, S.H. Effect of coarse aggregate morphology on permanent deformationbehavior of hot mix asphalt. J. Transp. Eng. 2015, 132, 580–589. [CrossRef]
17. Valdes-Vidal, G.; Calabi-Floody, A.; Miro-Recasens, R.; Norambuena-Contreras, J. Mechanical behavior ofasphalt mixtures with different aggregate type. Constr. Build. Mater. 2015, 101, 474–481. [CrossRef]
18. Aragao, F.T.S.; Pazos, A.R.G.; da Motta, L.M.G.; Kim, Y.R.; do Nascimento, L.A.H. Effects of morphologicalcharacteristics of aggregate particles on the mechanical behavior of bituminous paving mixtures.Constr. Build. Mater. 2016, 123, 444–453. [CrossRef]
39
Materials 2018, 11, 2034
19. Liu, H.Q.; Luo, R.; Lv, H.J. Establishing continuous relaxation spectrum based on complex modulus tests toconstruct relaxation modulus master curves in compliance with linear viscoelastic theory. Constr. Build. Mater.2018, 165, 372–384. [CrossRef]
20. Luo, R.; Liu, H.Q. Improving the Accuracy of Dynamic Modulus Master Curves of Asphalt MixturesConstructed Using Uniaxial Compressive Creep Tests. J. Mater. Civ. Eng. 2017, 29, 04017032. [CrossRef]
21. Luo, R.; Lv, H.J.; Liu, H.Q. Development of Prony series models based on continuous relaxation spectrumsfor relaxation moduli determined using creep tests. Constr. Build. Mater. 2018, 168, 758–770. [CrossRef]
22. Gorman, J.W.; Hinman, J.E. Simplex lattice designs for multicomponent systems. Technometrics 1962, 4,463–487. [CrossRef]
23. Wang, W.S.; Cheng, Y.C.; Tan, G.J.; Tao, J.L. Analysis of aggregate morphological characteristics forviscoelastic properties of asphalt mixes using simplex lattice design. Materials 2018, 11, 1908. [CrossRef][PubMed]
24. Wang, C.; Guo, N.S.; Zhao, Y.H.; Tan, Y.Q. Air voids distribution of asphalt mixtures in different compactionmethods and aggregate gradations. J. Jilin Univ. (Eng. Technol. Ed.) 2014, 2014, 74–80. (In Chinese)
25. JTG E20-2011. Standard Test Methods of Bitumen and Bituminous Mixtures for Highway Engineering; Ministry ofTransport of the People’s Republic of China: Beijing, China, 2011. (In Chinese)
26. Guo, Q.L.; Li, L.L.; Cheng, Y.C.; Jiao, Y.B.; Xu, C. Laboratory evaluation on performance of diatomite andglass fiber compound modified asphalt mixture. Mater. Des. 2015, 66, 51–59. [CrossRef]
27. Guo, Q.L. Research on Internal Stress Distribution of Asphalt Mixture and Its Impact on ViscoelasticPerformance. Ph.D. Thesis, Jilin University, Changchun, China, 2013.
28. Tao, J.L. Research on Characteristics of Mineral Aggregate and Its Effect on High and Low TemperatureViscoelastic Performance of Asphalt Mixture. Ph.D. Thesis, Jilin University, Changchun, China, 2017.
29. Bai, F.; Yang, X.H.; Zeng, G.W. A stochastic viscoelastic–viscoplastic constitutive model and its application tocrumb rubber modified asphalt mixtures. Mater. Des. 2016, 89, 802–809. [CrossRef]
30. Arabani, M.; Kamboozia, N. New achievements in visco-elastoplastic constitutive model and temperaturesensitivity of glasphalt. Int. J. Pavement Eng. 2014, 2014, 810–830. [CrossRef]
31. Zhu, H.R.; Sun, L. A viscoelastic-viscoplastic damage constitutive model for asphalt mixtures based onthermodynamics. Int. J. Plast. 2013, 40, 81–100. [CrossRef]
© 2018 by the authors. Licensee MDPI, Basel, Switzerland. This article is an open accessarticle distributed under the terms and conditions of the Creative Commons Attribution(CC BY) license (http://creativecommons.org/licenses/by/4.0/).
40
materials
Article
Analysis of Aggregate Morphological Characteristicsfor Viscoelastic Properties of Asphalt Mixes UsingSimplex Lattice Design
Wensheng Wang 1 , Yongchun Cheng 1, Guojin Tan 1,* and Jinglin Tao 2,*
1 College of Transportation, Jilin University, Changchun 130025, China; [email protected] (W.W.);[email protected] (Y.C.)
2 Jiangxi Transportation Institute, Nanchang 330200, China* Correspondence: [email protected] (G.T.); [email protected] (J.T.); Tel.: +86-0431-8509-5446 (G.T.)
Received: 24 August 2018; Accepted: 5 October 2018; Published: 8 October 2018
Abstract: Morphological characteristics of aggregates have direct impacts on performances of asphaltmixes. This paper aims to investigate the effects of the morphological characteristics of fine and coarseaggregates on the high-temperature viscoelastic properties of asphalt mortars and mixtures. For thispurpose, an experimental proportion scheme was designed for asphalt mixes prepared with threedifferent types of aggregates (basalt, andesite and pebble/river sand) based on the simplex latticedesign (SLD) method. Three morphological parameters were chosen to characterize shape, angularityand texture of aggregates. Afterwards, the uniaxial compression creep test was conducted for asphaltmixes and the high-temperature viscoelastic properties were obtained based on Burgers model. Theeffects of fine and coarse aggregates on the viscoelastic properties are analyzed through asphaltmortars and mixtures, respectively. The results showed that aggregate morphological characteristicscorrelate with the high-temperature viscoelastic properties of asphalt mixes, especially for fineaggregates. Aggregates with complex morphological characteristics are conducive to improving thedeformation recovery and anti-deformation of asphalt mixes. Furthermore, coarse aggregates canenhance the anti-deformation of asphalt mixture effectively due to its skeleton effect.
Keywords: asphalt mixes; aggregate characteristics; simplex lattice design; viscoelastic properties
1. Introduction
Asphalt as a kind of composite material has been widely used in pavement and buildingconstructions. In general, aggregates in asphalt mixtures account for approximately over 90% ofmixtures by weight, which play a major role in its stability, durability and mechanical properties.Researchers in many countries have been trying to focus on the influence of aggregate morphologicalcharacteristics on performances of asphalt mixture [1–3].
A great number of laboratory tests have been developed in previous research to evaluate themorphological characteristics of aggregates. Wilson and Klotz [4] presented a method of measuringangularity using Hough transform for quantitative analysis of aggregate angularity. Kuo et al. [5] useda digital image-analysis method to investigate the morphologies of coarse aggregates and effectivelyquantified the morphological characteristics. The morphological characteristics were found to becorrelated well with indirect characterization test results by regression analysis. Wang et al. [6]developed a unified Fourier morphological analysis method to quantify aggregate morphologicalcharacteristics, which include shape, angularity and surface texture. The above analysis has beenconducted on coarse aggregates; however, investigations on fine aggregate morphology have attractedmore researchers. Masad and Button [7] investigated the angularity and texture of fine aggregates byusing the erosion-dilation method and form factor, in which angularity is analyzed by high-resolution
Materials 2018, 11, 1908; doi:10.3390/ma11101908 www.mdpi.com/journal/materials41
Materials 2018, 11, 1908
images and texture is described by low-resolution images. Kuo and Freeman [8] defined three imageindices—aspect ratio, angularity and roughness—to characterize overall shape, roundness of corners,and particle surface texture of fine aggregates, which could be calculated by shortest and longestdimensions, perimeters, convex perimeters and perimeters of ellipses. Xie et al. [9] evaluated themorphological characteristics of fine aggregates by using three methods and they found that differentmethods have respective applicability and precision, in which digital image processing technique isuseful for designing bituminous materials. Xiao et al. [10] studied fine aggregate morphology by usingthe aggregate image measurement system and discussed the influences of aggregate morphologicalcharacteristics on skid-resistance of single-grade micro-surfacing.
Based on previous research on aggregates’ morphological characteristics, the relationshipsbetween aggregate morphological characteristics and performances of asphalt mixtures were alsoinvestigated. Petersen et al. [11] aimed at evaluating the rutting resistance of asphalt mixture and foundthat the morphological characteristics of coarse aggregate correlated well with it. Arasan et al. [12]used the digital image processing method to analyze the shape indices of coarse aggregate and showeda good correlation between some shape indices of aggregate and volumetric performances of asphaltmixtures. Singh et al. [13] utilized aggregate shape parameters to estimate dynamic modulus of asphaltmixes by establishing a model. Pan et al. [14] investigated the effects of coarse aggregate morphologyon the permanent deformation of asphalt mixtures. The permanent deformation showed a strongcorrelation with surface texture and angularity; the former has significant influences on the permanentdeformation. Aragao et al. [15] evaluated the influence of morphological properties of aggregateson the mechanical behavior of bituminous mixtures. The results indicated that the morphologicalcharacteristics of coarse aggregate are strongly correlated with the resistance to rutting of asphaltmixtures. Besides, the aggregate surface texture was proven to be highly correlated to the performanceof mixtures and should be carefully considered in aggregate and asphalt mixture specifications.Valdes-Vidal et al. [16] investigated the influence of aggregate physical properties on the mechanicalproperties of asphalt concretes. Morphological characteristics as well as surface texture have beenconducted for three aggregates. The results demonstrated that the morphological characteristicsof coarse and fine aggregates influence strength and anti-cracking properties of asphalt concretes,which depend on the shredding process and the origin of aggregates. Masad et al. [17] addressed therelationship between the morphological characteristics of fine aggregate and performances of asphaltmixtures and they found that texture characteristics had the strongest correlation with rutting resistanceof asphalt mixtures. Therefore, the morphological characteristics of coarse and fine aggregates havesignificantly different influences on the performances of asphalt mixture.
Morphological characteristics of aggregates have direct impacts on performances of asphaltmixtures. Previous research has investigated the influences of aggregate morphological characteristicson the adhesion between the aggregate and asphalt, high- and low-temperature stability performances,and fatigue property. However, not much study has been conducted on the relationship between anaggregate’s morphological characteristics and viscoelastic properties of the asphalt mixture. Therefore,in order to investigate the influence of an aggregate’s morphological characteristics on asphalt mixture,this paper studied the effects of the morphological characteristics of fine and coarse aggregates on thehigh-temperature viscoelastic properties of asphalt mortars and mixtures.
In this paper, an experimental proportion design was created for asphalt mortars and mixturesprepared with three different types of aggregates, based on the simplex lattice design (SLD) method.Three indices are chosen to characterize aggregates—shape, angularity and texture. The objective is torelate the aggregate’s morphological characteristics to the viscoelastic properties of asphalt mixture.Based on Burgers viscoelastic model, the uniaxial compression static creep test was carried out toanalyze the high-temperature viscoelastic properties of asphalt mortar and mixture.
42
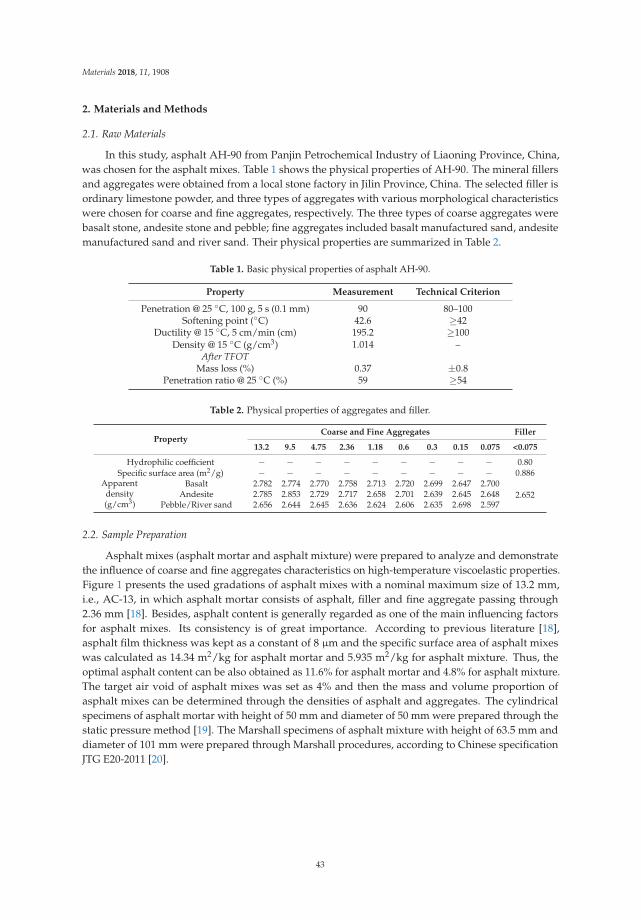
Materials 2018, 11, 1908
2. Materials and Methods
2.1. Raw Materials
In this study, asphalt AH-90 from Panjin Petrochemical Industry of Liaoning Province, China,was chosen for the asphalt mixes. Table 1 shows the physical properties of AH-90. The mineral fillersand aggregates were obtained from a local stone factory in Jilin Province, China. The selected filler isordinary limestone powder, and three types of aggregates with various morphological characteristicswere chosen for coarse and fine aggregates, respectively. The three types of coarse aggregates werebasalt stone, andesite stone and pebble; fine aggregates included basalt manufactured sand, andesitemanufactured sand and river sand. Their physical properties are summarized in Table 2.
Table 1. Basic physical properties of asphalt AH-90.
Property Measurement Technical Criterion
Penetration @ 25 ◦C, 100 g, 5 s (0.1 mm) 90 80–100Softening point (◦C) 42.6 ≥42
Ductility @ 15 ◦C, 5 cm/min (cm) 195.2 ≥100Density @ 15 ◦C (g/cm3) 1.014 –
After TFOTMass loss (%) 0.37 ±0.8
Penetration ratio @ 25 ◦C (%) 59 ≥54
Table 2. Physical properties of aggregates and filler.
PropertyCoarse and Fine Aggregates Filler
13.2 9.5 4.75 2.36 1.18 0.6 0.3 0.15 0.075 <0.075
Hydrophilic coefficient − − − − − − − − − 0.80Specific surface area (m2/g) − − − − − − − − − 0.886
Apparentdensity(g/cm3)
Basalt 2.782 2.774 2.770 2.758 2.713 2.720 2.699 2.647 2.7002.652Andesite 2.785 2.853 2.729 2.717 2.658 2.701 2.639 2.645 2.648
Pebble/River sand 2.656 2.644 2.645 2.636 2.624 2.606 2.635 2.698 2.597
2.2. Sample Preparation
Asphalt mixes (asphalt mortar and asphalt mixture) were prepared to analyze and demonstratethe influence of coarse and fine aggregates characteristics on high-temperature viscoelastic properties.Figure 1 presents the used gradations of asphalt mixes with a nominal maximum size of 13.2 mm,i.e., AC-13, in which asphalt mortar consists of asphalt, filler and fine aggregate passing through2.36 mm [18]. Besides, asphalt content is generally regarded as one of the main influencing factorsfor asphalt mixes. Its consistency is of great importance. According to previous literature [18],asphalt film thickness was kept as a constant of 8 μm and the specific surface area of asphalt mixeswas calculated as 14.34 m2/kg for asphalt mortar and 5.935 m2/kg for asphalt mixture. Thus, theoptimal asphalt content can be also obtained as 11.6% for asphalt mortar and 4.8% for asphalt mixture.The target air void of asphalt mixes was set as 4% and then the mass and volume proportion ofasphalt mixes can be determined through the densities of asphalt and aggregates. The cylindricalspecimens of asphalt mortar with height of 50 mm and diameter of 50 mm were prepared through thestatic pressure method [19]. The Marshall specimens of asphalt mixture with height of 63.5 mm anddiameter of 101 mm were prepared through Marshall procedures, according to Chinese specificationJTG E20-2011 [20].
43
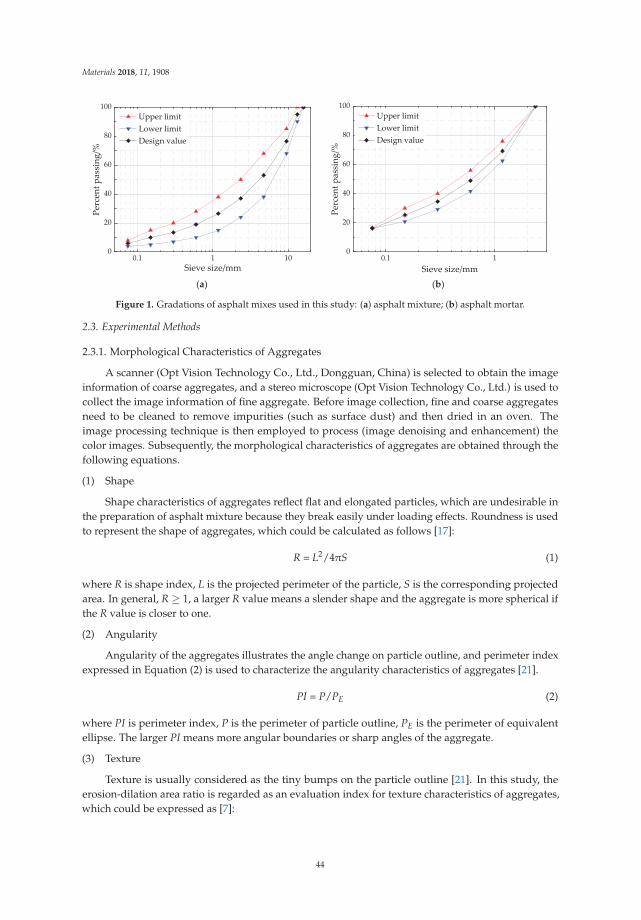
Materials 2018, 11, 1908
0.1 1 100
20
40
60
80
100Pe
rcen
t pas
sing
/%
Sieve size/mm
Upper limit Lower limit Design value
0.1 1
0
20
40
60
80
100
Perc
ent p
assi
ng/%
Sieve size/mm
Upper limit Lower limit Design value
(a) (b)
Figure 1. Gradations of asphalt mixes used in this study: (a) asphalt mixture; (b) asphalt mortar.
2.3. Experimental Methods
2.3.1. Morphological Characteristics of Aggregates
A scanner (Opt Vision Technology Co., Ltd., Dongguan, China) is selected to obtain the imageinformation of coarse aggregates, and a stereo microscope (Opt Vision Technology Co., Ltd.) is used tocollect the image information of fine aggregate. Before image collection, fine and coarse aggregatesneed to be cleaned to remove impurities (such as surface dust) and then dried in an oven. Theimage processing technique is then employed to process (image denoising and enhancement) thecolor images. Subsequently, the morphological characteristics of aggregates are obtained through thefollowing equations.
(1) Shape
Shape characteristics of aggregates reflect flat and elongated particles, which are undesirable inthe preparation of asphalt mixture because they break easily under loading effects. Roundness is usedto represent the shape of aggregates, which could be calculated as follows [17]:
R = L2/4πS (1)
where R is shape index, L is the projected perimeter of the particle, S is the corresponding projectedarea. In general, R ≥ 1, a larger R value means a slender shape and the aggregate is more spherical ifthe R value is closer to one.
(2) Angularity
Angularity of the aggregates illustrates the angle change on particle outline, and perimeter indexexpressed in Equation (2) is used to characterize the angularity characteristics of aggregates [21].
PI = P/PE (2)
where PI is perimeter index, P is the perimeter of particle outline, PE is the perimeter of equivalentellipse. The larger PI means more angular boundaries or sharp angles of the aggregate.
(3) Texture
Texture is usually considered as the tiny bumps on the particle outline [21]. In this study, theerosion-dilation area ratio is regarded as an evaluation index for texture characteristics of aggregates,which could be expressed as [7]:
44
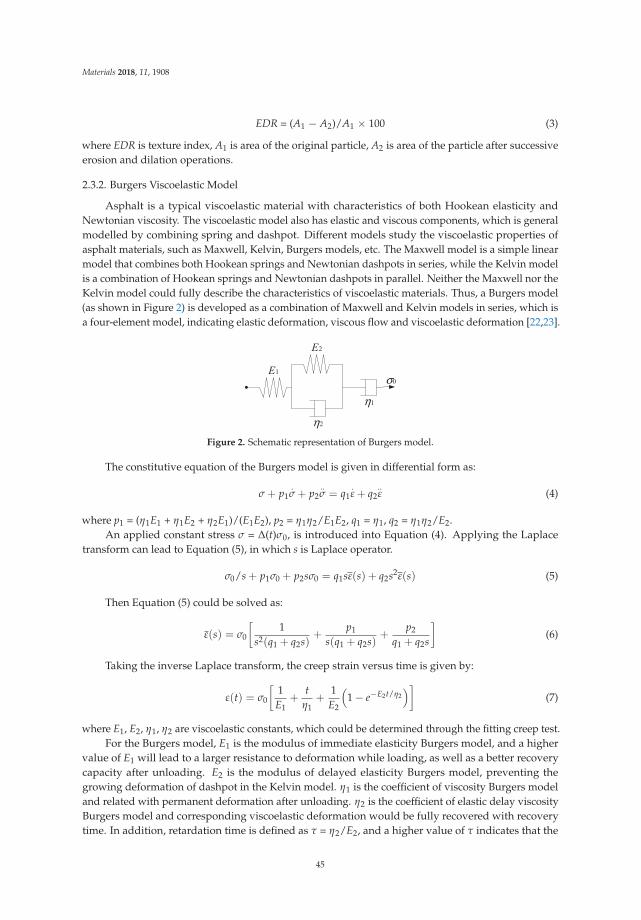
Materials 2018, 11, 1908
EDR = (A1 − A2)/A1 × 100 (3)
where EDR is texture index, A1 is area of the original particle, A2 is area of the particle after successiveerosion and dilation operations.
2.3.2. Burgers Viscoelastic Model
Asphalt is a typical viscoelastic material with characteristics of both Hookean elasticity andNewtonian viscosity. The viscoelastic model also has elastic and viscous components, which is generalmodelled by combining spring and dashpot. Different models study the viscoelastic properties ofasphalt materials, such as Maxwell, Kelvin, Burgers models, etc. The Maxwell model is a simple linearmodel that combines both Hookean springs and Newtonian dashpots in series, while the Kelvin modelis a combination of Hookean springs and Newtonian dashpots in parallel. Neither the Maxwell nor theKelvin model could fully describe the characteristics of viscoelastic materials. Thus, a Burgers model(as shown in Figure 2) is developed as a combination of Maxwell and Kelvin models in series, which isa four-element model, indicating elastic deformation, viscous flow and viscoelastic deformation [22,23].
E
E
η
η
σ
Figure 2. Schematic representation of Burgers model.
The constitutive equation of the Burgers model is given in differential form as:
σ + p1.σ + p2
..σ = q1
.ε + q2
..ε (4)
where p1 = (η1E1 + η1E2 + η2E1)/(E1E2), p2 = η1η2/E1E2, q1 = η1, q2 = η1η2/E2.An applied constant stress σ = Δ(t)σ0, is introduced into Equation (4). Applying the Laplace
transform can lead to Equation (5), in which s is Laplace operator.
σ0/s + p1σ0 + p2sσ0 = q1sε(s) + q2s2ε(s) (5)
Then Equation (5) could be solved as:
ε(s) = σ0
[1
s2(q1 + q2s)+
p1
s(q1 + q2s)+
p2
q1 + q2s
](6)
Taking the inverse Laplace transform, the creep strain versus time is given by:
ε(t) = σ0
[1
E1+
tη1
+1
E2
(1 − e−E2t/η2
)](7)
where E1, E2, η1, η2 are viscoelastic constants, which could be determined through the fitting creep test.For the Burgers model, E1 is the modulus of immediate elasticity Burgers model, and a higher
value of E1 will lead to a larger resistance to deformation while loading, as well as a better recoverycapacity after unloading. E2 is the modulus of delayed elasticity Burgers model, preventing thegrowing deformation of dashpot in the Kelvin model. η1 is the coefficient of viscosity Burgers modeland related with permanent deformation after unloading. η2 is the coefficient of elastic delay viscosityBurgers model and corresponding viscoelastic deformation would be fully recovered with recoverytime. In addition, retardation time is defined as τ = η2/E2, and a higher value of τ indicates that the
45
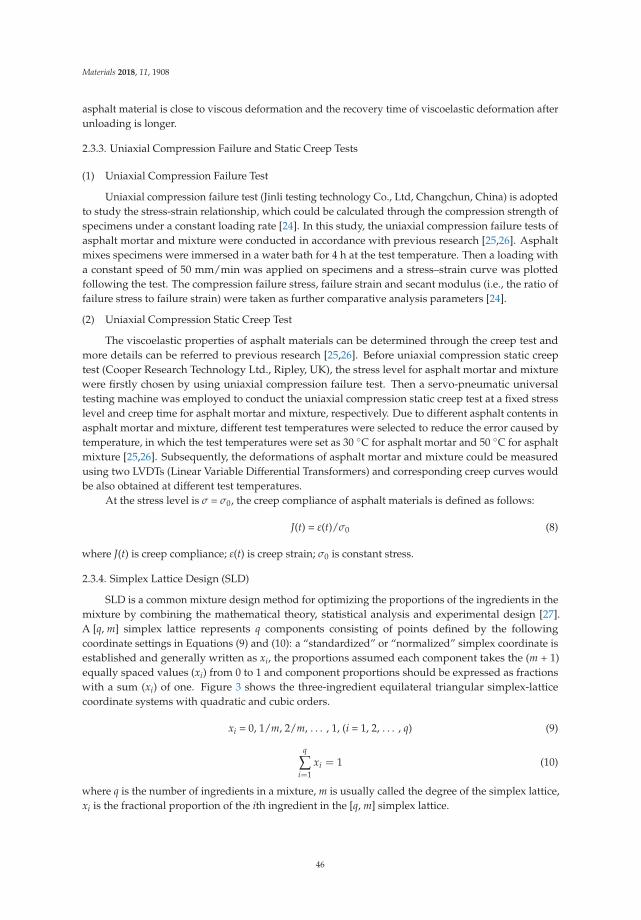
Materials 2018, 11, 1908
asphalt material is close to viscous deformation and the recovery time of viscoelastic deformation afterunloading is longer.
2.3.3. Uniaxial Compression Failure and Static Creep Tests
(1) Uniaxial Compression Failure Test
Uniaxial compression failure test (Jinli testing technology Co., Ltd, Changchun, China) is adoptedto study the stress-strain relationship, which could be calculated through the compression strength ofspecimens under a constant loading rate [24]. In this study, the uniaxial compression failure tests ofasphalt mortar and mixture were conducted in accordance with previous research [25,26]. Asphaltmixes specimens were immersed in a water bath for 4 h at the test temperature. Then a loading witha constant speed of 50 mm/min was applied on specimens and a stress–strain curve was plottedfollowing the test. The compression failure stress, failure strain and secant modulus (i.e., the ratio offailure stress to failure strain) were taken as further comparative analysis parameters [24].
(2) Uniaxial Compression Static Creep Test
The viscoelastic properties of asphalt materials can be determined through the creep test andmore details can be referred to previous research [25,26]. Before uniaxial compression static creeptest (Cooper Research Technology Ltd., Ripley, UK), the stress level for asphalt mortar and mixturewere firstly chosen by using uniaxial compression failure test. Then a servo-pneumatic universaltesting machine was employed to conduct the uniaxial compression static creep test at a fixed stresslevel and creep time for asphalt mortar and mixture, respectively. Due to different asphalt contents inasphalt mortar and mixture, different test temperatures were selected to reduce the error caused bytemperature, in which the test temperatures were set as 30 ◦C for asphalt mortar and 50 ◦C for asphaltmixture [25,26]. Subsequently, the deformations of asphalt mortar and mixture could be measuredusing two LVDTs (Linear Variable Differential Transformers) and corresponding creep curves wouldbe also obtained at different test temperatures.
At the stress level is σ = σ0, the creep compliance of asphalt materials is defined as follows:
J(t) = ε(t)/σ0 (8)
where J(t) is creep compliance; ε(t) is creep strain; σ0 is constant stress.
2.3.4. Simplex Lattice Design (SLD)
SLD is a common mixture design method for optimizing the proportions of the ingredients in themixture by combining the mathematical theory, statistical analysis and experimental design [27].A [q, m] simplex lattice represents q components consisting of points defined by the followingcoordinate settings in Equations (9) and (10): a “standardized” or “normalized” simplex coordinate isestablished and generally written as xi, the proportions assumed each component takes the (m + 1)equally spaced values (xi) from 0 to 1 and component proportions should be expressed as fractionswith a sum (xi) of one. Figure 3 shows the three-ingredient equilateral triangular simplex-latticecoordinate systems with quadratic and cubic orders.
xi = 0, 1/m, 2/m, . . . , 1, (i = 1, 2, . . . , q) (9)
q
∑i=1
xi = 1 (10)
where q is the number of ingredients in a mixture, m is usually called the degree of the simplex lattice,xi is the fractional proportion of the ith ingredient in the [q, m] simplex lattice.
46
Materials 2018, 11, 1908
Based on the relationship between mixture components and property responses of asphalt mixes,a regression equation can be fitted to the experimental data at the points of a [q, m] simplex lattice,which is expressed in the terms of the following polynomial equation:
y[q,m] = β0 +q
∑i=1
βixi +q
∑i≤j
βijxixj +q
∑i≤j≤k
βijkxixjxk + · · · (11)
where y[q, m] is the response, β0, βi, βij, βijk are the regression coefficients, xi, xj, xk are the fractionalproportion of the ingredients in the mixture.
x3 (0, 0, 1)
x1 (1, 0, 0)
x2 (0, 1, 0)
(1/2, 1/2, 0)
(0, 1/2, 1/2)
(1/2, 0, 1/2)
x1 (1, 0, 0)
x3 (0, 0, 1)x2 (0, 1, 0)
(1/3, 2/3, 0)
(2/3, 1/3, 0) (2/3, 0, 1/3)
(1/3, 0, 2/3)
(0, 2/3, 1/3) (0, 1/3, 2/3)
(1/3, 1/3, 1/3)
(a) (b)
Figure 3. Three-ingredient simplex-lattice coordinate systems: (a) [3, 2] SLD; (b) [3, 3] SLD.
In this study, the simplex lattice of [3, 2] shown in Figure 3a was used to investigate the effectsof the proportions of three mixture components on the viscoelastic properties of asphalt mixes usingDesign-Expert 8.0 software (Stat-Ease Inc., Minneapolis, MN, USA). The samples of asphalt mixes canbe prepared through mixing the three ingredients at different proportions. The independent variablefactors are the percentages of basalt (X1), andesite (X2) and pebble/river sand (X3), respectively. Thehigh-temperature viscoelastic properties are the modulus of immediate elasticity Burgers model (E1),coefficient of viscosity Burgers model (η1) and retardation time (τ), as dependent variables. Thedesigned experimental proportion need ten groups, which include three pure component treatments,three two-component mixtures and four “augment design”. Table 3 lists the proportions of threecomponents in asphalt mixes. And the quadratic order canonical polynomial equation derived fromEquation (11) can be given as:
y = β1x1 + β2x2 + β3x3 + β12x1x2 + β23x2x3 + β13x1x3 (12)
where y is the response, β1, β2, β3, β12, β23, β13 are the regression coefficients for linear andnon-linear terms.
Table 3. Experimental proportion design for the [3, 2] simplex lattice design (SLD).
Mix ComponentSample Code
1 2 3 4 5 6 7 8 9 10
Basalt (X1) 0.167 0.167 0.000 0.500 1.000 0.500 0.667 0.000 0.000 0.333Andesite (X2) 0.667 0.167 1.000 0.000 0.000 0.500 0.167 0.000 0.500 0.333Pebble/River
Sand (X3) 0.167 0.667 0.000 0.500 0.000 0.000 0.167 1.000 0.500 0.333
3. Results and Discussion
3.1. Results of Morphological Characteristics of Fine and Coarse Aggregates
Due to different morphological characteristics of aggregates with different particle sizes or variouscombinations, it is necessary to unify them in order to analyze their influence. Composite index for fine
47
Materials 2018, 11, 1908
and coarse aggregates is adopted to account for three morphological characteristics, i.e., roundness,perimeter index and erosion-dilation area ratio, which is given in Equation (13) [14].
Composite index =n
∑i=1
[(ai)(indexi)]/n
∑i=1
(ai) (13)
where Composite index includes composite roundness, composite perimeter index, and erosion-dilationarea ratio for fine and coarse aggregates abbreviated as FR, CR, FPI, CPI, FEDR, CEDR, respectively. aiis the gradation percentage of the ith aggregate. indexi is morphological characteristics index (R, PIand EDR) of the ith aggregate. The results of Composite index for fine aggregate in asphalt mortar(abbreviated as F1~F10) and coarse aggregate in asphalt mixture (abbreviated as C1~C10) are listedin Table 4.
Table 4. Composite morphological index of fine and coarse aggregates.
IndexSample Code
1 2 3 4 5 6 7 8 9 10
Asphalt Mortar (F1~F10)
FR 1.5658 1.4175 1.6143 1.4641 1.6103 1.6123 1.5638 1.3178 1.4661 1.5127FPI 1.2385 1.1526 1.2723 1.1673 1.2340 1.2532 1.2194 1.1005 1.1864 1.2011
FEDR 0.7821 0.5729 0.8645 0.6151 0.7842 0.8244 0.7419 0.4461 0.6553 0.6976
Asphalt Mixture (C1~C10)
CR 1.6889 1.4974 1.7586 1.5447 1.7140 1.7363 1.6666 1.3755 1.5671 1.6144CPI 1.2367 1.1682 1.2612 1.1840 1.2438 1.2525 1.2280 1.1242 1.1927 1.2085
CEDR 0.9329 0.7794 0.9928 0.8106 0.9355 0.9642 0.9043 0.6857 0.8392 0.8705
3.2. Analysis of Fine Aggregate Characteristics for Viscoelastic Properties of Asphalt Mortar Using SLD
3.2.1. Uniaxial Compression Failure Test Results
The uniaxial compression failure tests of asphalt mortar were performed at 30 ◦C, and the speedof applied loading was 50 mm/min. According to the recorded relation curve between force anddisplacement, the maximum stress, corresponding strain and the ratio of the two were obtained as thecompression failure stress, failure strain and secant modulus. The uniaxial compression failure testresults are plotted in Figure 4.
As shown in Figure 4a, asphalt mortars with various fine aggregate morphologies have obviousdifferent mechanical properties when subjected to a constant strain-rate loading. Sample F3 has thehighest failure stress, followed by F5; the failure stress of F8 is the lowest. In general, a higher failurestress is preferable due to better bearing capacity. Based on the stress results, it can be considered thatF3 has a better bearing capacity, and followed by F5, the bearing capacity of F8 is the lowest. As forthe failure strain in Figure 4b, it illustrates the deformation characteristics of asphalt mortars whileloading, which has the opposite trend with the failure stress in Figure 4a. Sample F8 has the largestfailure strain, whereas the failure strain of F3 is the smallest among all the asphalt mortars. The failurestrain indicates the deformation before the asphalt material being broken, which could help reduce theoccurrence of crack at low temperature, but would be easy to produce a greater permanent deformationat high temperatures. Secant modulus is the ratio of failure stress to failure strain, comprehensivelyreflecting the compatibility of deformation. Normally, a higher secant modulus stands for the bettercompatibility of deformation and anti-compression failure performance. Previous research has foundthat the shape and texture characteristics of aggregates have a strong correlation with the resistance ofasphalt mixes to permanent deformation measured using different wheel tracking devices [14,28]. Thefailure results are consistent with the morphological characteristics results of aggregates. Thus, it couldbe considered that asphalt mixes with complex morphological characteristics have higher failure stress,smaller strain, and higher secant modulus. The variation trend of secant modulus results observed in
48
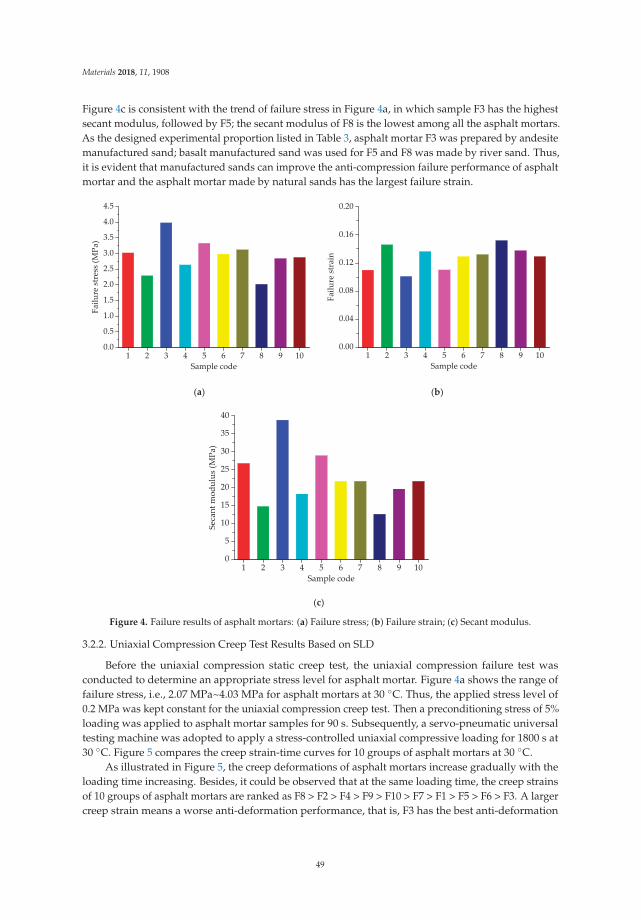
Materials 2018, 11, 1908
Figure 4c is consistent with the trend of failure stress in Figure 4a, in which sample F3 has the highestsecant modulus, followed by F5; the secant modulus of F8 is the lowest among all the asphalt mortars.As the designed experimental proportion listed in Table 3, asphalt mortar F3 was prepared by andesitemanufactured sand; basalt manufactured sand was used for F5 and F8 was made by river sand. Thus,it is evident that manufactured sands can improve the anti-compression failure performance of asphaltmortar and the asphalt mortar made by natural sands has the largest failure strain.
1 2 3 4 5 6 7 8 9 100.0
0.5
1.0
1.5
2.0
2.5
3.0
3.5
4.0
4.5
Failu
re s
tres
s (M
Pa)
Sample code 1 2 3 4 5 6 7 8 9 10
0.00
0.04
0.08
0.12
0.16
0.20
Failu
re s
trai
n
Sample code
(a) (b)
1 2 3 4 5 6 7 8 9 100
5
10
15
20
25
30
35
40
Seca
nt m
odul
us (M
Pa)
Sample code
(c)
Figure 4. Failure results of asphalt mortars: (a) Failure stress; (b) Failure strain; (c) Secant modulus.
3.2.2. Uniaxial Compression Creep Test Results Based on SLD
Before the uniaxial compression static creep test, the uniaxial compression failure test wasconducted to determine an appropriate stress level for asphalt mortar. Figure 4a shows the range offailure stress, i.e., 2.07 MPa~4.03 MPa for asphalt mortars at 30 ◦C. Thus, the applied stress level of0.2 MPa was kept constant for the uniaxial compression creep test. Then a preconditioning stress of 5%loading was applied to asphalt mortar samples for 90 s. Subsequently, a servo-pneumatic universaltesting machine was adopted to apply a stress-controlled uniaxial compressive loading for 1800 s at30 ◦C. Figure 5 compares the creep strain-time curves for 10 groups of asphalt mortars at 30 ◦C.
As illustrated in Figure 5, the creep deformations of asphalt mortars increase gradually with theloading time increasing. Besides, it could be observed that at the same loading time, the creep strainsof 10 groups of asphalt mortars are ranked as F8 > F2 > F4 > F9 > F10 > F7 > F1 > F5 > F6 > F3. A largercreep strain means a worse anti-deformation performance, that is, F3 has the best anti-deformation
49
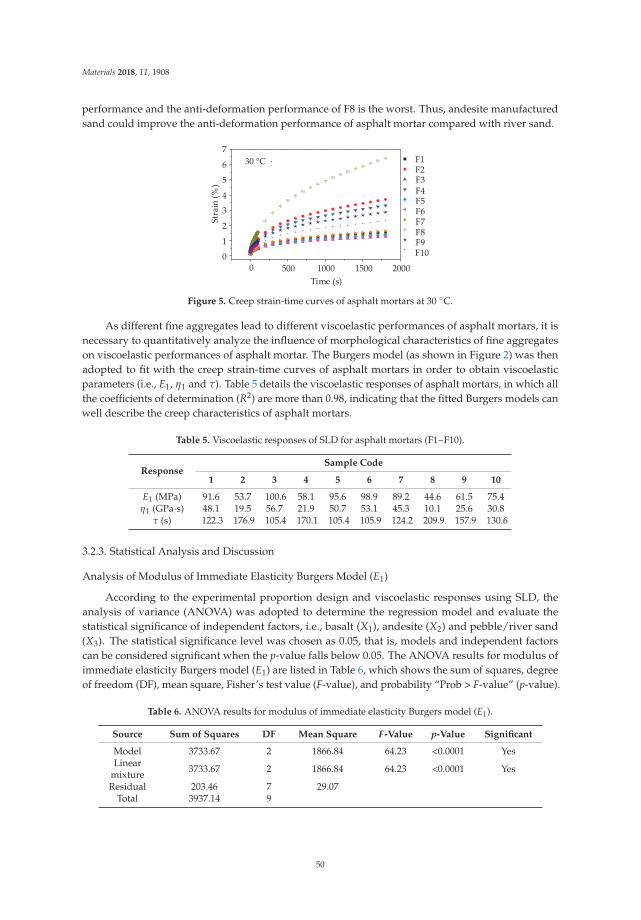
Materials 2018, 11, 1908
performance and the anti-deformation performance of F8 is the worst. Thus, andesite manufacturedsand could improve the anti-deformation performance of asphalt mortar compared with river sand.
Time (s)
Stra
in (%
)
0 500 1000 1500 20000
F1F2F3F4F5F6F7F8F9F10
30 °C
1
2
3
4
5
6
7
Figure 5. Creep strain-time curves of asphalt mortars at 30 ◦C.
As different fine aggregates lead to different viscoelastic performances of asphalt mortars, it isnecessary to quantitatively analyze the influence of morphological characteristics of fine aggregateson viscoelastic performances of asphalt mortar. The Burgers model (as shown in Figure 2) was thenadopted to fit with the creep strain-time curves of asphalt mortars in order to obtain viscoelasticparameters (i.e., E1, η1 and τ). Table 5 details the viscoelastic responses of asphalt mortars, in which allthe coefficients of determination (R2) are more than 0.98, indicating that the fitted Burgers models canwell describe the creep characteristics of asphalt mortars.
Table 5. Viscoelastic responses of SLD for asphalt mortars (F1~F10).
ResponseSample Code
1 2 3 4 5 6 7 8 9 10
E1 (MPa) 91.6 53.7 100.6 58.1 95.6 98.9 89.2 44.6 61.5 75.4η1 (GPa·s) 48.1 19.5 56.7 21.9 50.7 53.1 45.3 10.1 25.6 30.8
τ (s) 122.3 176.9 105.4 170.1 105.4 105.9 124.2 209.9 157.9 130.6
3.2.3. Statistical Analysis and Discussion
Analysis of Modulus of Immediate Elasticity Burgers Model (E1)
According to the experimental proportion design and viscoelastic responses using SLD, theanalysis of variance (ANOVA) was adopted to determine the regression model and evaluate thestatistical significance of independent factors, i.e., basalt (X1), andesite (X2) and pebble/river sand(X3). The statistical significance level was chosen as 0.05, that is, models and independent factorscan be considered significant when the p-value falls below 0.05. The ANOVA results for modulus ofimmediate elasticity Burgers model (E1) are listed in Table 6, which shows the sum of squares, degreeof freedom (DF), mean square, Fisher’s test value (F-value), and probability “Prob > F-value” (p-value).
Table 6. ANOVA results for modulus of immediate elasticity Burgers model (E1).
Source Sum of Squares DF Mean Square F-Value p-Value Significant
Model 3733.67 2 1866.84 64.23 <0.0001 YesLinear
mixture 3733.67 2 1866.84 64.23 <0.0001 Yes
Residual 203.46 7 29.07Total 3937.14 9
50
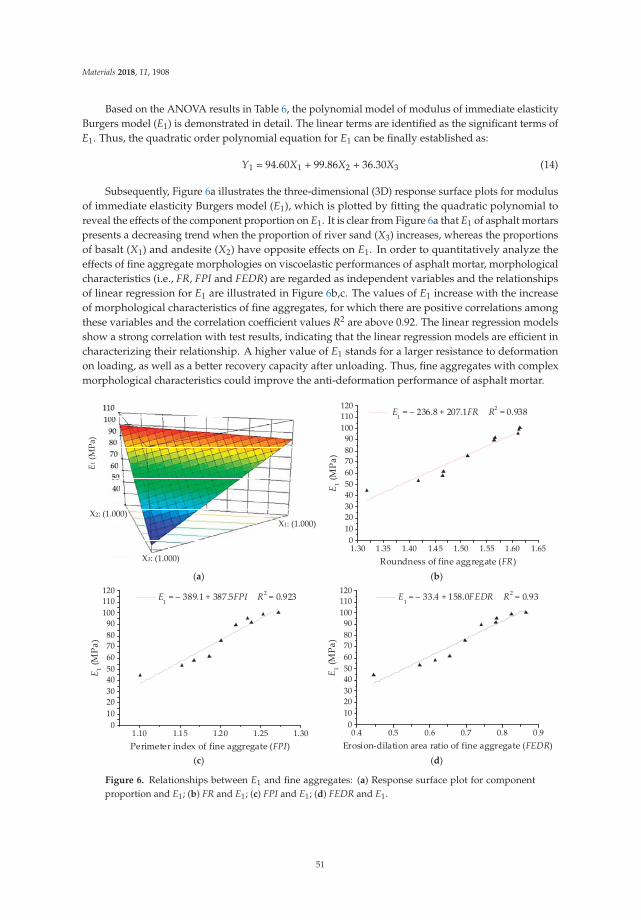
Materials 2018, 11, 1908
Based on the ANOVA results in Table 6, the polynomial model of modulus of immediate elasticityBurgers model (E1) is demonstrated in detail. The linear terms are identified as the significant terms ofE1. Thus, the quadratic order polynomial equation for E1 can be finally established as:
Y1 = 94.60X1 + 99.86X2 + 36.30X3 (14)
Subsequently, Figure 6a illustrates the three-dimensional (3D) response surface plots for modulusof immediate elasticity Burgers model (E1), which is plotted by fitting the quadratic polynomial toreveal the effects of the component proportion on E1. It is clear from Figure 6a that E1 of asphalt mortarspresents a decreasing trend when the proportion of river sand (X3) increases, whereas the proportionsof basalt (X1) and andesite (X2) have opposite effects on E1. In order to quantitatively analyze theeffects of fine aggregate morphologies on viscoelastic performances of asphalt mortar, morphologicalcharacteristics (i.e., FR, FPI and FEDR) are regarded as independent variables and the relationshipsof linear regression for E1 are illustrated in Figure 6b,c. The values of E1 increase with the increaseof morphological characteristics of fine aggregates, for which there are positive correlations amongthese variables and the correlation coefficient values R2 are above 0.92. The linear regression modelsshow a strong correlation with test results, indicating that the linear regression models are efficient incharacterizing their relationship. A higher value of E1 stands for a larger resistance to deformationon loading, as well as a better recovery capacity after unloading. Thus, fine aggregates with complexmorphological characteristics could improve the anti-deformation performance of asphalt mortar.
X1: (1.000)
X3: (1.000)
X2: (1.000)
E1 (M
Pa)
1.30 1.35 1.40 1.45 1.50 1.55 1.60 1.650
102030405060708090
100110120 E
1 = − 236.8 + 207.1FR R2 = 0.938
E 1 (MPa
)
Roundness of fine aggregate (FR) (a) (b)
1.10 1.15 1.20 1.25 1.300
102030405060708090
100110120
E1 = − 389.1 + 387.5FPI R2 = 0.923
E 1 (MPa
)
Perimeter index of fine aggregate (FPI) 0 .4 0.5 0.6 0.7 0.8 0.9
0102030405060708090
100110120
E1 = − 33.4 + 158.0FEDR R2 = 0.93
E 1 (MPa
)
Erosion-dilation area ratio of fine aggregate (FEDR)(c) (d)
Figure 6. Relationships between E1 and fine aggregates: (a) Response surface plot for componentproportion and E1; (b) FR and E1; (c) FPI and E1; (d) FEDR and E1.
51
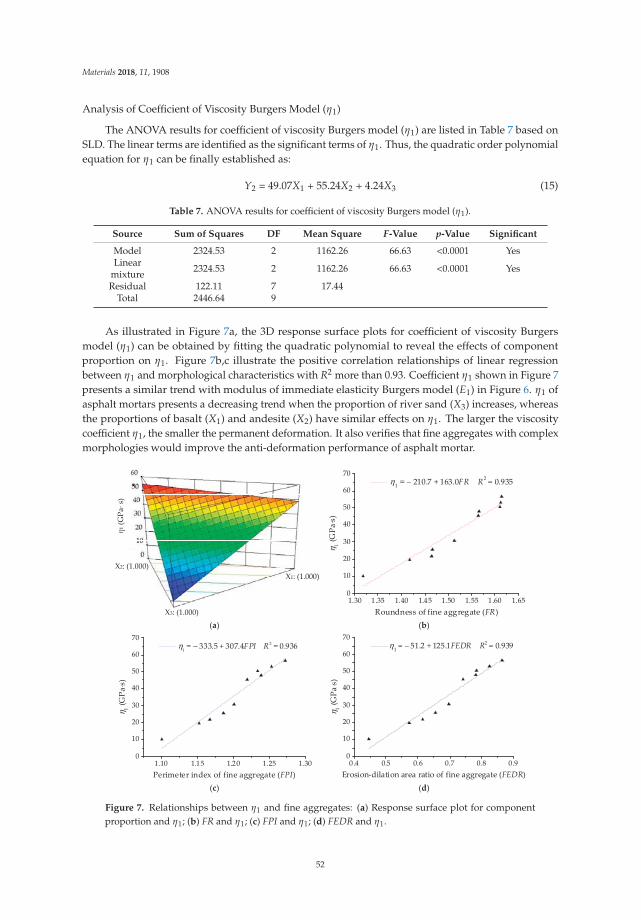
Materials 2018, 11, 1908
Analysis of Coefficient of Viscosity Burgers Model (η1)
The ANOVA results for coefficient of viscosity Burgers model (η1) are listed in Table 7 based onSLD. The linear terms are identified as the significant terms of η1. Thus, the quadratic order polynomialequation for η1 can be finally established as:
Y2 = 49.07X1 + 55.24X2 + 4.24X3 (15)
Table 7. ANOVA results for coefficient of viscosity Burgers model (η1).
Source Sum of Squares DF Mean Square F-Value p-Value Significant
Model 2324.53 2 1162.26 66.63 <0.0001 YesLinear
mixture 2324.53 2 1162.26 66.63 <0.0001 Yes
Residual 122.11 7 17.44Total 2446.64 9
As illustrated in Figure 7a, the 3D response surface plots for coefficient of viscosity Burgersmodel (η1) can be obtained by fitting the quadratic polynomial to reveal the effects of componentproportion on η1. Figure 7b,c illustrate the positive correlation relationships of linear regressionbetween η1 and morphological characteristics with R2 more than 0.93. Coefficient η1 shown in Figure 7presents a similar trend with modulus of immediate elasticity Burgers model (E1) in Figure 6. η1 ofasphalt mortars presents a decreasing trend when the proportion of river sand (X3) increases, whereasthe proportions of basalt (X1) and andesite (X2) have similar effects on η1. The larger the viscositycoefficient η1, the smaller the permanent deformation. It also verifies that fine aggregates with complexmorphologies would improve the anti-deformation performance of asphalt mortar.
X1: (1.000)
X3: (1.000)
X2: (1.000)
1 (G
Pa· s
)
1.30 1.35 1.40 1.45 1.50 1.55 1.60 1.650
10
20
30
40
50
60
70η1 = − 210.7 + 163.0FR R2 = 0.935
η 1 (GPa
⋅s)
Roundness of fine aggregate (FR)(a) (b)
1 .10 1.15 1.20 1.25 1.300
10
20
30
40
50
60
70 η1 = − 333.5 + 307.4FPI R2 = 0.936
η 1 (GPa
⋅s)
Perimeter index of fine aggregate (FPI)
0.4 0.5 0.6 0.7 0.8 0.90
10
20
30
40
50
60
70 η1 = − 51.2 + 125.1FEDR R2 = 0.939
η 1 (GPa
⋅s)
Erosion-dilation area ratio of fine aggregate (FEDR)(c) (d)
Figure 7. Relationships between η1 and fine aggregates: (a) Response surface plot for componentproportion and η1; (b) FR and η1; (c) FPI and η1; (d) FEDR and η1.
52
Materials 2018, 11, 1908
Analysis of Retardation Time (τ)
The ANOVA results for retardation time (τ) are listed in Table 8 based on SLD. The linear termsand non-linear terms (X1X3 and X1X2X3) are identified as the significant terms of τ. Thus, the quadraticorder polynomial equation for η1 can be finally established as:
Y3 = 105.52X1 + 106.11X2 + 210.16X3 + 50.52X1X3 − 349.97X1X2X3 (16)
Table 8. ANOVA results for retardation time (τ).
Source Sum of Squares DF Mean Square F-Value p-Value Significant
Model 11640.20 6 1940.03 189.13 0.0006 YesLinear
mixture 11444.80 2 5722.40 557.86 0.0001 Yes
X1X2 0.59 1 0.59 0.058 0.8255 NoX1X3 107.80 1 107.80 10.51 0.0478 YesX2X3 0.39 1 0.39 0.038 0.8584 No
X1X2X3 119.01 1 119.01 11.60 0.0423 YesResidual 30.77 3 10.26
Total 11670.97 9
As illustrated in Figure 8a, the 3D response surface plots for retardation time (τ) were alsoobtained by fitting the quadratic polynomial to reveal the effects of component proportion on τ. τ ofasphalt mortars presents a decreasing trend with increase in the proportion of basalt (X1) and andesite(X2), whereas the proportions of river sand (X3) have the opposite effect on τ. Figure 8b,c illustrate anegative correlation of linear regression between τ and morphological characteristics with R2 morethan 0.94. It clearly shows that the retardation time of asphalt mortar decreases with increase inmorphological characteristics of fine aggregates. As the retardation time is related to the recovery timeof viscoelastic deformation, fine aggregates with complex morphological characteristics help improvethe deformation recovery capacity of asphalt mortar.
3.3. Analysis of Coarse Aggregate Characteristics for Viscoelastic Properties of Asphalt Mixture Using SLD
3.3.1. Uniaxial Compression Failure Test Results
Figure 9 presents the uniaxial compression failure test results of asphalt mixtures at the testtemperature of 50 ◦C. The speed of applied loading was set at 50 mm/min. As shown in Figure 9, forconstant strain rate loading, different types of coarse aggregates lead to a large difference in mechanicalproperty distribution of asphalt mixtures. Asphalt mixtures without pebbles have larger failure stressand secant modulus and those with pebbles have smaller failure strain, i.e., the failure stress andsecant modulus of C3, C5 and C6 are larger than the others, while these failure strains are smallerthan the other groups. The change of mechanical properties of asphalt mixtures is more related topebble content. This is because manufactured stones (basalt stone and andesite stone) have morecomplex morphological characteristics than pebble and pebble is more spherical. With loading timeand increasing deformation, the inlay effect of coarse aggregates becomes more and more significant.However, asphalt mixture with pebbles would cracks prematurely compared to asphalt mixture madewith manufactured stones, resulting in stress reduction as well as broken specimens.
53
Materials 2018, 11, 1908
X1: (1.000)
X3: (1.000)X2: (1.000)
(s)
1.30 1.35 1.40 1.45 1.50 1.55 1.60 1.65
80
100
120
140
160
180
200
220
240τ = 690.5 − 362.9FR R2 = 0.976
τ (s
)
Roundness of fine aggregate (FR) (a) (b)
1.10 1.15 1.20 1.25 1.3080
100
120
140
160
180
200
220
240τ = 950.8 − 673.6FPI R2 = 0.942
τ (s
)
Perimeter index of fine aggregate (FPI)
0.4 0.5 0.6 0.7 0.8 0.980
100
120
140
160
180
200
220
240τ = 333.1 − 275.2FEDR R2 = 0.955
τ (s
)
Erosion-dilation area ratio of fine aggregate (FEDR)
(c) (d)
Figure 8. Relationships between τ and fine aggregates: (a) Response surface plot for componentproportion and τ; (b) FR and τ; (c) FPI and τ; (d) FEDR and τ.
1 2 3 4 5 6 7 8 9 100.0
0.5
1.0
1.5
2.0
2.5
3.0
3.5
4.0
4.5
Failu
re s
tres
s (M
Pa)
Sample code 1 2 3 4 5 6 7 8 9 10
0.00
0.02
0.04
0.06
0.08
Failu
re s
trai
n
Sample code
(a) (b)
1 2 3 4 5 6 7 8 9 100
10
20
30
40
50
60
70
Seca
nt m
odul
us (M
Pa)
Sample code (c)
Figure 9. Failure results of asphalt mixtures: (a) failure stress; (b) failure strain; (c) secant modulus.
54
Materials 2018, 11, 1908
3.3.2. Uniaxial Compression Creep Test Results Based on SLD
The range of failure stress for asphalt mixtures is 2.13 MPa~4.46 MPa at 50 ◦C. Thus, the appliedstress level of 0.4 MPa was kept constant for the creep test. A preconditioning stress of 5% loading wasalso applied to asphalt mixture specimens for 90 s. Subsequently, a servo-pneumatic universal testingmachine was adopted to apply a stress-controlled uniaxial compressive loading for 2400 s at 50 ◦C.Figure 10 compares the creep strain for 10 groups of asphalt mixtures.
Time (s)
Stra
in (%
)
0 500 1000 1500 2000
0.5
C1C2C3C4C5C6C7C8C9C10
50 °C
1.0
1.5
2.0
2.5
3.0
3.5
2500
Figure 10. Strain-time curves of asphalt mixtures at 50 ◦C.
As illustrated in Figure 10, it can be observed that at the same loading time, the anti-deformationperformance of asphalt mixture prepared by manufactured stones (basalt stone and andesite stone)is better than asphalt mixture with pebble, and the creep strains of 10 groups of asphalt mixtures atany test temperature are ranked as C8 > C2 > C9 > C4 > C10 > C7 > C1 > C6 > C5 > C3. Besides,it is worth noting that when compared with the creep curves of asphalt mortars shown in Figure 5,the creep strains of asphalt mixtures are still lower under the condition that stress level is twice, testtemperature is 20 ◦C higher, and creep time is 600 s longer. This observation fully demonstrated thatthe skeleton effect of coarse aggregates could effectively enhance the anti-deformation performance ofasphalt mixture. Thus, coarse aggregates with complex morphological characteristics could improvethe anti-deformation performance of asphalt mixture.
Similarly, the viscoelastic parameters of Burgers model were adopted to further quantitativelyinvestigate the influence of morphological characteristics of coarse aggregates. Table 9 details theviscoelastic responses of asphalt mixtures, in which all the coefficients of determination (R2) are morethan 0.97, indicating that the fitted Burgers models can well describe the creep characteristics ofasphalt mixtures.
Table 9. Viscoelastic responses of SLD for asphalt mixtures (C1~C10).
ResponseSample Code
1 2 3 4 5 6 7 8 9 10
E1 (MPa) 42.5 33.7 53.8 37.5 48.8 45.7 41.3 37.5 35.7 39.8η1 (GPa·s) 235.5 124.2 321.9 163.6 294.9 292.3 212.6 163.6 145.5 183.3
τ (s) 77.6 84.6 77.7 81.1 77.8 74.0 78.5 81.1 82.7 80.5
3.3.3. Statistical Analysis and Discussion
Analysis of Modulus of Immediate Elasticity Burgers Model (E1)
The ANOVA results for modulus of immediate elasticity Burgers model (E1) are listed in Table 10.The significant terms of E1 are identified as linear terms and non-linear terms (X1X2, X1X3 and X2X3).Thus, the quadratic order polynomial equation for η1 can be finally established as:
Y1 = 48.60X1 + 53.63X2 + 37.16X3 − 20.29X1X2 − 20.84X1X3 − 37.97X2X3 (17)
55
Materials 2018, 11, 1908
Table 10. ANOVA results for modulus of immediate elasticity Burgers model (E1).
Source Sum of Squares DF Mean Square F-Value p-Value Significant
Model 345.93 5 69.19 42.38 0.0015 YesLinear
mixture 231.36 2 115.68 70.86 0.0008 Yes
X1X2 20.84 1 20.84 12.77 0.0233 YesX1X3 21.98 1 21.98 13.46 0.0214 YesX2X3 72.96 1 72.96 44.69 0.0026 Yes
Residual 6.53 4 1.63Total 352.46 9
Figure 11 illustrates the relationships among modulus of immediate elasticity Burgers model (E1),component proportion, and morphological characteristics (i.e., CR, CPI and CEDR). Coarse aggregatesof various components present a similar trend with fine aggregates, E1 of asphalt mixtures presentsa decreasing trend with increase in the proportion of river sand (X3). The values of E1 increase withincrease in morphological characteristics of coarse aggregates, for which there are positive correlationsamong these variables; the correlation coefficient values R2 are around 0.6. This means a relativelyinsignificant influence of coarse aggregates on E1. Morphologies of coarse aggregates are generallymore related to the resistance to deformation while loading, but they present a relatively less anddiscretized influence on viscoelastic properties of asphalt mixture.
X1: (1.000)
X3: (1.000)
X2: (1.000)
E1 (M
Pa)
1 .3 1.4 1.5 1.6 1.7 1.80
10
20
30
40
50
60
70E1 = − 25.8 + 41.7CR R2 = 0.607
E 1 (MPa
)
Roundness of coarse aggregate (CR) (a) (b)
1 .10 1.15 1.20 1.25 1.300
10
20
30
40
50
60
70 E1 = − 100 + 117.1CPI R2 = 0.605
E 1 (MPa
)
Perimeter index of coarse aggregate (CPI)
0 .6 0.7 0.8 0.9 1.00
10
20
30
40
50
60
70 E1 = − 5.2 + 53.7CEDR R2 = 0.612
E 1 (MPa
)
Erosion-dilation area ratio of coarse aggregate (CEDR)
(c) (d)
Figure 11. Relationships between E1 and coarse aggregates: (a) Response surface plot for componentproportion and E1; (b) CR and E1; (c) CPI and E1; (d) CEDR and E1.
56
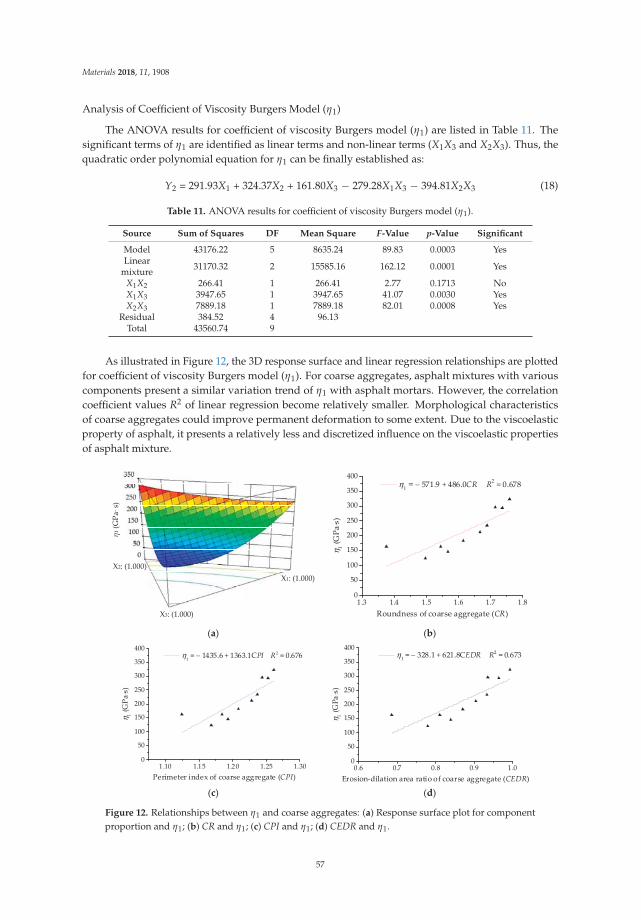
Materials 2018, 11, 1908
Analysis of Coefficient of Viscosity Burgers Model (η1)
The ANOVA results for coefficient of viscosity Burgers model (η1) are listed in Table 11. Thesignificant terms of η1 are identified as linear terms and non-linear terms (X1X3 and X2X3). Thus, thequadratic order polynomial equation for η1 can be finally established as:
Y2 = 291.93X1 + 324.37X2 + 161.80X3 − 279.28X1X3 − 394.81X2X3 (18)
Table 11. ANOVA results for coefficient of viscosity Burgers model (η1).
Source Sum of Squares DF Mean Square F-Value p-Value Significant
Model 43176.22 5 8635.24 89.83 0.0003 YesLinear
mixture 31170.32 2 15585.16 162.12 0.0001 Yes
X1X2 266.41 1 266.41 2.77 0.1713 NoX1X3 3947.65 1 3947.65 41.07 0.0030 YesX2X3 7889.18 1 7889.18 82.01 0.0008 Yes
Residual 384.52 4 96.13Total 43560.74 9
As illustrated in Figure 12, the 3D response surface and linear regression relationships are plottedfor coefficient of viscosity Burgers model (η1). For coarse aggregates, asphalt mixtures with variouscomponents present a similar variation trend of η1 with asphalt mortars. However, the correlationcoefficient values R2 of linear regression become relatively smaller. Morphological characteristicsof coarse aggregates could improve permanent deformation to some extent. Due to the viscoelasticproperty of asphalt, it presents a relatively less and discretized influence on the viscoelastic propertiesof asphalt mixture.
X1: (1.000)
X3: (1.000)
X2: (1.000)
1 (G
Pa· s
)
1 .3 1.4 1.5 1.6 1.7 1.8
0
50
100
150
200
250
300
350
400η1 = − 571.9 + 486.0CR R2 = 0.678
η 1 (GPa
⋅s)
Roundness of coarse aggregate (CR) (a) (b)
1.10 1.15 1.20 1.25 1.300
50
100
150
200
250
300
350
400η1 = − 1435.6 + 1363.1CPI R2 = 0.676
η 1 (GPa
⋅s)
Perimeter index of coarse aggregate (CPI) 0.6 0.7 0.8 0.9 1.0
0
50
100
150
200
250
300
350
400η1 = − 328.1 + 621.8CEDR R2 = 0.673
η 1 (GPa
⋅s)
Erosion-dilation area ratio of coarse aggregate (CEDR)
(c) (d)
Figure 12. Relationships between η1 and coarse aggregates: (a) Response surface plot for componentproportion and η1; (b) CR and η1; (c) CPI and η1; (d) CEDR and η1.
57
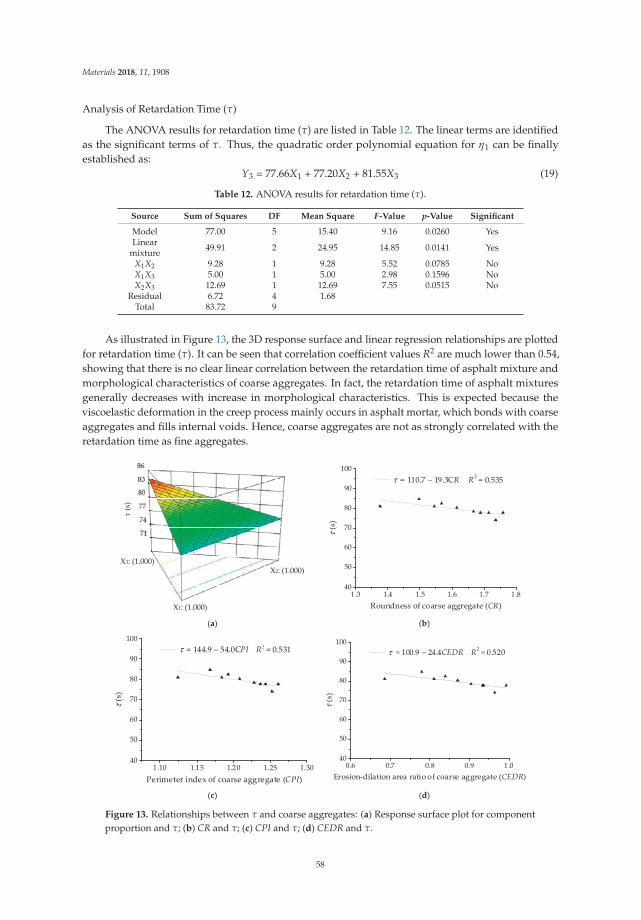
Materials 2018, 11, 1908
Analysis of Retardation Time (τ)
The ANOVA results for retardation time (τ) are listed in Table 12. The linear terms are identifiedas the significant terms of τ. Thus, the quadratic order polynomial equation for η1 can be finallyestablished as:
Y3 = 77.66X1 + 77.20X2 + 81.55X3 (19)
Table 12. ANOVA results for retardation time (τ).
Source Sum of Squares DF Mean Square F-Value p-Value Significant
Model 77.00 5 15.40 9.16 0.0260 YesLinear
mixture 49.91 2 24.95 14.85 0.0141 Yes
X1X2 9.28 1 9.28 5.52 0.0785 NoX1X3 5.00 1 5.00 2.98 0.1596 NoX2X3 12.69 1 12.69 7.55 0.0515 No
Residual 6.72 4 1.68Total 83.72 9
As illustrated in Figure 13, the 3D response surface and linear regression relationships are plottedfor retardation time (τ). It can be seen that correlation coefficient values R2 are much lower than 0.54,showing that there is no clear linear correlation between the retardation time of asphalt mixture andmorphological characteristics of coarse aggregates. In fact, the retardation time of asphalt mixturesgenerally decreases with increase in morphological characteristics. This is expected because theviscoelastic deformation in the creep process mainly occurs in asphalt mortar, which bonds with coarseaggregates and fills internal voids. Hence, coarse aggregates are not as strongly correlated with theretardation time as fine aggregates.
X1: (1.000)
X3: (1.000)X2: (1.000)
(s)
1 .3 1.4 1.5 1.6 1.7 1.840
50
60
70
80
90
100τ = 110.7 − 19.3CR R2 = 0.535
τ (s
)
Roundness of coarse aggregate (CR) (a) (b)
1 .10 1.15 1.20 1.25 1.3040
50
60
70
80
90
100τ = 144.9 − 54.0CPI R2 = 0.531
τ (s
)
Perimeter index of coarse aggregate (CPI)
0.6 0.7 0.8 0.9 1.040
50
60
70
80
90
100τ = 100.9 − 24.4CEDR R2 = 0.520
τ (s
)
Erosion-dilation area ratio of coarse aggregate (CEDR)
(c) (d)
Figure 13. Relationships between τ and coarse aggregates: (a) Response surface plot for componentproportion and τ; (b) CR and τ; (c) CPI and τ; (d) CEDR and τ.
58
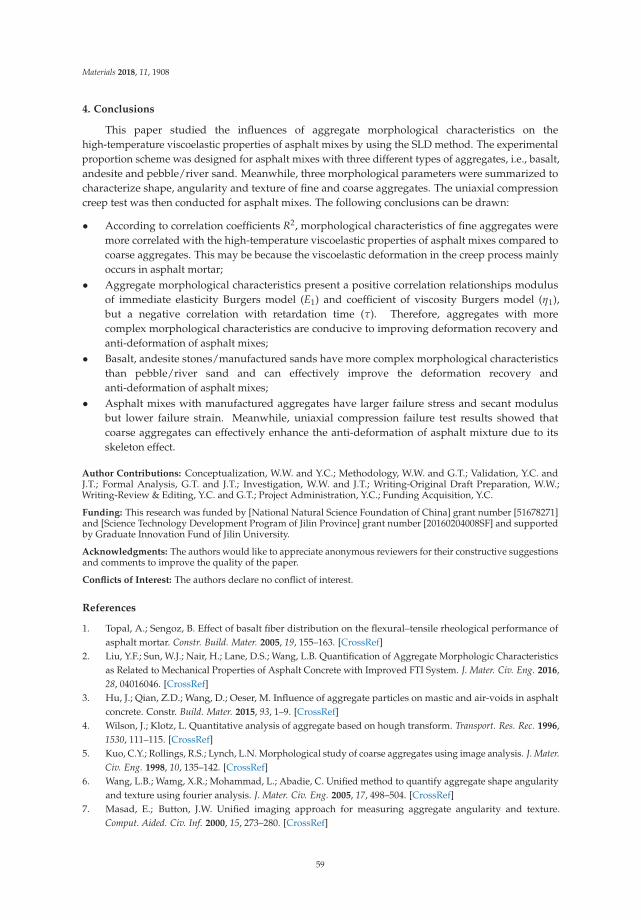
Materials 2018, 11, 1908
4. Conclusions
This paper studied the influences of aggregate morphological characteristics on thehigh-temperature viscoelastic properties of asphalt mixes by using the SLD method. The experimentalproportion scheme was designed for asphalt mixes with three different types of aggregates, i.e., basalt,andesite and pebble/river sand. Meanwhile, three morphological parameters were summarized tocharacterize shape, angularity and texture of fine and coarse aggregates. The uniaxial compressioncreep test was then conducted for asphalt mixes. The following conclusions can be drawn:
• According to correlation coefficients R2, morphological characteristics of fine aggregates weremore correlated with the high-temperature viscoelastic properties of asphalt mixes compared tocoarse aggregates. This may be because the viscoelastic deformation in the creep process mainlyoccurs in asphalt mortar;
• Aggregate morphological characteristics present a positive correlation relationships modulusof immediate elasticity Burgers model (E1) and coefficient of viscosity Burgers model (η1),but a negative correlation with retardation time (τ). Therefore, aggregates with morecomplex morphological characteristics are conducive to improving deformation recovery andanti-deformation of asphalt mixes;
• Basalt, andesite stones/manufactured sands have more complex morphological characteristicsthan pebble/river sand and can effectively improve the deformation recovery andanti-deformation of asphalt mixes;
• Asphalt mixes with manufactured aggregates have larger failure stress and secant modulusbut lower failure strain. Meanwhile, uniaxial compression failure test results showed thatcoarse aggregates can effectively enhance the anti-deformation of asphalt mixture due to itsskeleton effect.
Author Contributions: Conceptualization, W.W. and Y.C.; Methodology, W.W. and G.T.; Validation, Y.C. andJ.T.; Formal Analysis, G.T. and J.T.; Investigation, W.W. and J.T.; Writing-Original Draft Preparation, W.W.;Writing-Review & Editing, Y.C. and G.T.; Project Administration, Y.C.; Funding Acquisition, Y.C.
Funding: This research was funded by [National Natural Science Foundation of China] grant number [51678271]and [Science Technology Development Program of Jilin Province] grant number [20160204008SF] and supportedby Graduate Innovation Fund of Jilin University.
Acknowledgments: The authors would like to appreciate anonymous reviewers for their constructive suggestionsand comments to improve the quality of the paper.
Conflicts of Interest: The authors declare no conflict of interest.
References
1. Topal, A.; Sengoz, B. Effect of basalt fiber distribution on the flexural–tensile rheological performance ofasphalt mortar. Constr. Build. Mater. 2005, 19, 155–163. [CrossRef]
2. Liu, Y.F.; Sun, W.J.; Nair, H.; Lane, D.S.; Wang, L.B. Quantification of Aggregate Morphologic Characteristicsas Related to Mechanical Properties of Asphalt Concrete with Improved FTI System. J. Mater. Civ. Eng. 2016,28, 04016046. [CrossRef]
3. Hu, J.; Qian, Z.D.; Wang, D.; Oeser, M. Influence of aggregate particles on mastic and air-voids in asphaltconcrete. Constr. Build. Mater. 2015, 93, 1–9. [CrossRef]
4. Wilson, J.; Klotz, L. Quantitative analysis of aggregate based on hough transform. Transport. Res. Rec. 1996,1530, 111–115. [CrossRef]
5. Kuo, C.Y.; Rollings, R.S.; Lynch, L.N. Morphological study of coarse aggregates using image analysis. J. Mater.Civ. Eng. 1998, 10, 135–142. [CrossRef]
6. Wang, L.B.; Wamg, X.R.; Mohammad, L.; Abadie, C. Unified method to quantify aggregate shape angularityand texture using fourier analysis. J. Mater. Civ. Eng. 2005, 17, 498–504. [CrossRef]
7. Masad, E.; Button, J.W. Unified imaging approach for measuring aggregate angularity and texture.Comput. Aided. Civ. Inf. 2000, 15, 273–280. [CrossRef]
59
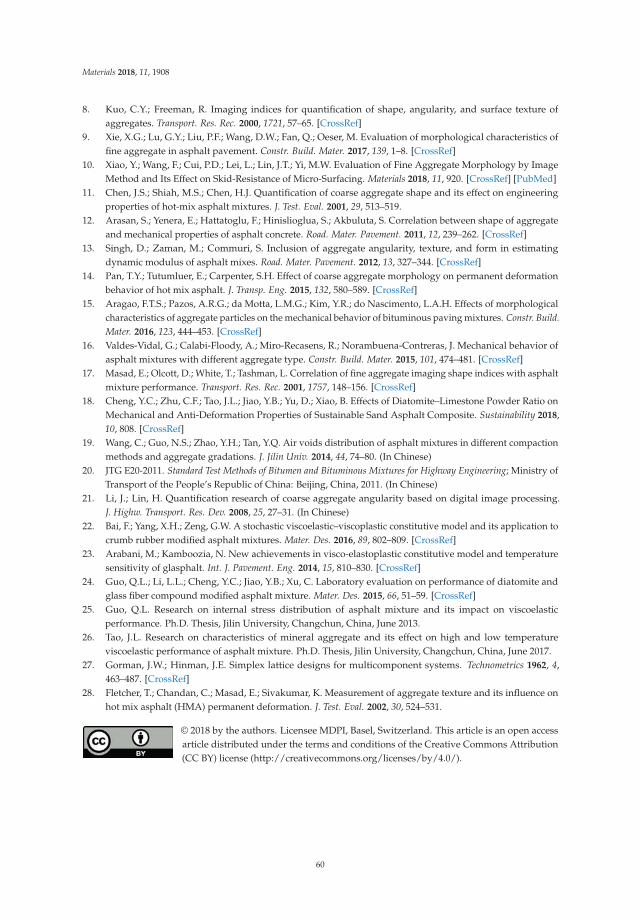
Materials 2018, 11, 1908
8. Kuo, C.Y.; Freeman, R. Imaging indices for quantification of shape, angularity, and surface texture ofaggregates. Transport. Res. Rec. 2000, 1721, 57–65. [CrossRef]
9. Xie, X.G.; Lu, G.Y.; Liu, P.F.; Wang, D.W.; Fan, Q.; Oeser, M. Evaluation of morphological characteristics offine aggregate in asphalt pavement. Constr. Build. Mater. 2017, 139, 1–8. [CrossRef]
10. Xiao, Y.; Wang, F.; Cui, P.D.; Lei, L.; Lin, J.T.; Yi, M.W. Evaluation of Fine Aggregate Morphology by ImageMethod and Its Effect on Skid-Resistance of Micro-Surfacing. Materials 2018, 11, 920. [CrossRef] [PubMed]
11. Chen, J.S.; Shiah, M.S.; Chen, H.J. Quantification of coarse aggregate shape and its effect on engineeringproperties of hot-mix asphalt mixtures. J. Test. Eval. 2001, 29, 513–519.
12. Arasan, S.; Yenera, E.; Hattatoglu, F.; Hinislioglua, S.; Akbuluta, S. Correlation between shape of aggregateand mechanical properties of asphalt concrete. Road. Mater. Pavement. 2011, 12, 239–262. [CrossRef]
13. Singh, D.; Zaman, M.; Commuri, S. Inclusion of aggregate angularity, texture, and form in estimatingdynamic modulus of asphalt mixes. Road. Mater. Pavement. 2012, 13, 327–344. [CrossRef]
14. Pan, T.Y.; Tutumluer, E.; Carpenter, S.H. Effect of coarse aggregate morphology on permanent deformationbehavior of hot mix asphalt. J. Transp. Eng. 2015, 132, 580–589. [CrossRef]
15. Aragao, F.T.S.; Pazos, A.R.G.; da Motta, L.M.G.; Kim, Y.R.; do Nascimento, L.A.H. Effects of morphologicalcharacteristics of aggregate particles on the mechanical behavior of bituminous paving mixtures. Constr. Build.Mater. 2016, 123, 444–453. [CrossRef]
16. Valdes-Vidal, G.; Calabi-Floody, A.; Miro-Recasens, R.; Norambuena-Contreras, J. Mechanical behavior ofasphalt mixtures with different aggregate type. Constr. Build. Mater. 2015, 101, 474–481. [CrossRef]
17. Masad, E.; Olcott, D.; White, T.; Tashman, L. Correlation of fine aggregate imaging shape indices with asphaltmixture performance. Transport. Res. Rec. 2001, 1757, 148–156. [CrossRef]
18. Cheng, Y.C.; Zhu, C.F.; Tao, J.L.; Jiao, Y.B.; Yu, D.; Xiao, B. Effects of Diatomite–Limestone Powder Ratio onMechanical and Anti-Deformation Properties of Sustainable Sand Asphalt Composite. Sustainability 2018,10, 808. [CrossRef]
19. Wang, C.; Guo, N.S.; Zhao, Y.H.; Tan, Y.Q. Air voids distribution of asphalt mixtures in different compactionmethods and aggregate gradations. J. Jilin Univ. 2014, 44, 74–80. (In Chinese)
20. JTG E20-2011. Standard Test Methods of Bitumen and Bituminous Mixtures for Highway Engineering; Ministry ofTransport of the People’s Republic of China: Beijing, China, 2011. (In Chinese)
21. Li, J.; Lin, H. Quantification research of coarse aggregate angularity based on digital image processing.J. Highw. Transport. Res. Dev. 2008, 25, 27–31. (In Chinese)
22. Bai, F.; Yang, X.H.; Zeng, G.W. A stochastic viscoelastic–viscoplastic constitutive model and its application tocrumb rubber modified asphalt mixtures. Mater. Des. 2016, 89, 802–809. [CrossRef]
23. Arabani, M.; Kamboozia, N. New achievements in visco-elastoplastic constitutive model and temperaturesensitivity of glasphalt. Int. J. Pavement. Eng. 2014, 15, 810–830. [CrossRef]
24. Guo, Q.L.; Li, L.L.; Cheng, Y.C.; Jiao, Y.B.; Xu, C. Laboratory evaluation on performance of diatomite andglass fiber compound modified asphalt mixture. Mater. Des. 2015, 66, 51–59. [CrossRef]
25. Guo, Q.L. Research on internal stress distribution of asphalt mixture and its impact on viscoelasticperformance. Ph.D. Thesis, Jilin University, Changchun, China, June 2013.
26. Tao, J.L. Research on characteristics of mineral aggregate and its effect on high and low temperatureviscoelastic performance of asphalt mixture. Ph.D. Thesis, Jilin University, Changchun, China, June 2017.
27. Gorman, J.W.; Hinman, J.E. Simplex lattice designs for multicomponent systems. Technometrics 1962, 4,463–487. [CrossRef]
28. Fletcher, T.; Chandan, C.; Masad, E.; Sivakumar, K. Measurement of aggregate texture and its influence onhot mix asphalt (HMA) permanent deformation. J. Test. Eval. 2002, 30, 524–531.
© 2018 by the authors. Licensee MDPI, Basel, Switzerland. This article is an open accessarticle distributed under the terms and conditions of the Creative Commons Attribution(CC BY) license (http://creativecommons.org/licenses/by/4.0/).
60
materials
Article
Study on the Effect of Demulsification Speedof Emulsified Asphalt Based on SurfaceCharacteristics of Aggregates
Fanlong Tang 1 ID , Guangji Xu 1, Tao Ma 1,* ID and Lingyun Kong 2
1 School of Transportation, Southeast University, Nanjing, Jiangsu 210096, China; [email protected] (F.T.);[email protected] (G.X.)
2 School of Civil Engineering & Architecture, Chongqing Jiaotong University, Chongqing 400074, China;[email protected]
* Correspondence: [email protected]
Received: 19 July 2018; Accepted: 14 August 2018; Published: 21 August 2018
Abstract: Aggregate is an indispensable raw material for emulsified asphalt construction. For thepurpose of explaining the influence of aggregate characteristics on the demulsification speed ofemulsified asphalt, the surface energy and specific surface area (SSA) characteristics of aggregateswere calculated based on the capillary rise method and the BET (Brunauer-Emmett-Teller) adsorptiontest. Afterwards, the effect of the surface energy and specific surface area of the aggregate on theemulsified asphalt demulsification speed was systematically studied by using ultraviolet spectroscopyas well as the orthogonal test. Experimental results indicate that the specific surface energy parameterof the aggregate is certainly related to the particle size of the aggregate. That is, the surface freeenergy of the unit system is proportional to the surface area A and the density of the interface unit.The specific surface area parameter of aggregates increases with the decrease of particle size, when theparticle size is reduced to 600 mesh, the specific surface area parameters of the three aggregatesselected in this paper tend to be consistent. Orthogonal experimental analysis demonstrates that thesurface energy and specific surface area have an impact on the emulsion breaking speed and they areproven to be positively correlated. Meanwhile, in the case of small particle sizes, there is no statisticallysignificant correlation between the physical properties of aggregates and the demulsification speedof emulsified asphalt, and the physical property of aggregates is not the main factor that affectsthe demulsification speed of the emulsified asphalt. On the contrary, the material properties of theaggregate, such as acid-base property and chargeability, are the dominant factors.
Keywords: limestone aggregates; emulsified asphalt; demulsification speed; surface energy; specificsurface area
1. Introduction
With the advent of the world’s energy crisis and the enhancement of human consciousness ofnature, emulsified asphalt, famous for its clean and eco-friendly properties, presents a prospect forlarge-scale use, and shows an increasing tendency of usage year-by-year [1–3].
By using this kind of asphalt emulsion to build a road, no heating is needed at room temperatureto spray, to pour into or mix, or to pave the surface or base layer of various structural pavements.Emulsified asphalt can be used in normal temperature construction and has the advantages of savingenergy, facilitating construction, saving asphalt, and protecting the environment [4–6]. In particular,the performance of emulsified asphalt modified with polymer is better than that without. It is generallyexpected that the asphalt modification can be used to help asphalt material to resist deformation athigh temperature, and to resist cracking at low temperature. Thus, high-temperature rutting and
Materials 2018, 11, 1488; doi:10.3390/ma11091488 www.mdpi.com/journal/materials61
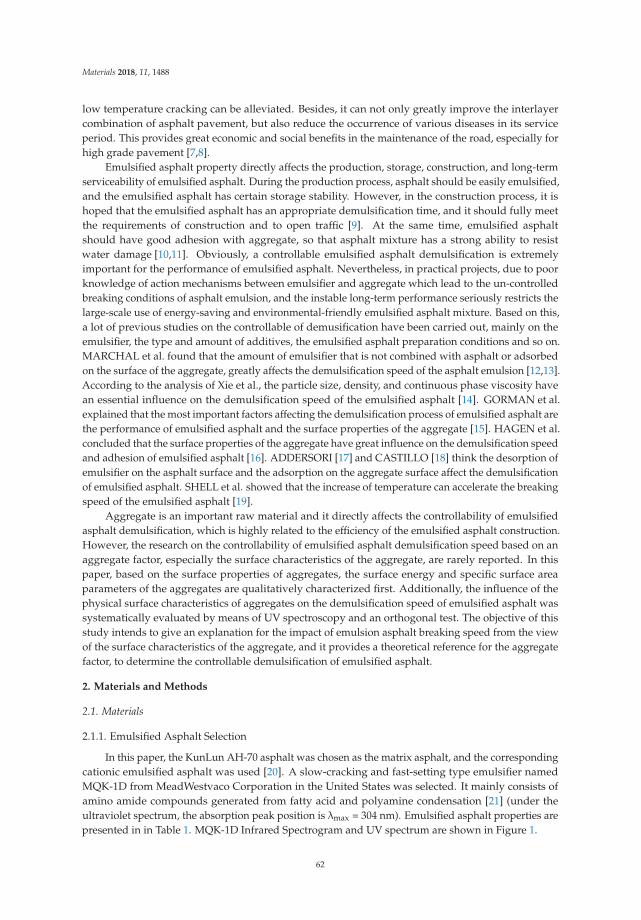
Materials 2018, 11, 1488
low temperature cracking can be alleviated. Besides, it can not only greatly improve the interlayercombination of asphalt pavement, but also reduce the occurrence of various diseases in its serviceperiod. This provides great economic and social benefits in the maintenance of the road, especially forhigh grade pavement [7,8].
Emulsified asphalt property directly affects the production, storage, construction, and long-termserviceability of emulsified asphalt. During the production process, asphalt should be easily emulsified,and the emulsified asphalt has certain storage stability. However, in the construction process, it ishoped that the emulsified asphalt has an appropriate demulsification time, and it should fully meetthe requirements of construction and to open traffic [9]. At the same time, emulsified asphaltshould have good adhesion with aggregate, so that asphalt mixture has a strong ability to resistwater damage [10,11]. Obviously, a controllable emulsified asphalt demulsification is extremelyimportant for the performance of emulsified asphalt. Nevertheless, in practical projects, due to poorknowledge of action mechanisms between emulsifier and aggregate which lead to the un-controlledbreaking conditions of asphalt emulsion, and the instable long-term performance seriously restricts thelarge-scale use of energy-saving and environmental-friendly emulsified asphalt mixture. Based on this,a lot of previous studies on the controllable of demusification have been carried out, mainly on theemulsifier, the type and amount of additives, the emulsified asphalt preparation conditions and so on.MARCHAL et al. found that the amount of emulsifier that is not combined with asphalt or adsorbedon the surface of the aggregate, greatly affects the demulsification speed of the asphalt emulsion [12,13].According to the analysis of Xie et al., the particle size, density, and continuous phase viscosity havean essential influence on the demulsification speed of the emulsified asphalt [14]. GORMAN et al.explained that the most important factors affecting the demulsification process of emulsified asphalt arethe performance of emulsified asphalt and the surface properties of the aggregate [15]. HAGEN et al.concluded that the surface properties of the aggregate have great influence on the demulsification speedand adhesion of emulsified asphalt [16]. ADDERSORI [17] and CASTILLO [18] think the desorption ofemulsifier on the asphalt surface and the adsorption on the aggregate surface affect the demulsificationof emulsified asphalt. SHELL et al. showed that the increase of temperature can accelerate the breakingspeed of the emulsified asphalt [19].
Aggregate is an important raw material and it directly affects the controllability of emulsifiedasphalt demulsification, which is highly related to the efficiency of the emulsified asphalt construction.However, the research on the controllability of emulsified asphalt demulsification speed based on anaggregate factor, especially the surface characteristics of the aggregate, are rarely reported. In thispaper, based on the surface properties of aggregates, the surface energy and specific surface areaparameters of the aggregates are qualitatively characterized first. Additionally, the influence of thephysical surface characteristics of aggregates on the demulsification speed of emulsified asphalt wassystematically evaluated by means of UV spectroscopy and an orthogonal test. The objective of thisstudy intends to give an explanation for the impact of emulsion asphalt breaking speed from the viewof the surface characteristics of the aggregate, and it provides a theoretical reference for the aggregatefactor, to determine the controllable demulsification of emulsified asphalt.
2. Materials and Methods
2.1. Materials
2.1.1. Emulsified Asphalt Selection
In this paper, the KunLun AH-70 asphalt was chosen as the matrix asphalt, and the correspondingcationic emulsified asphalt was used [20]. A slow-cracking and fast-setting type emulsifier namedMQK-1D from MeadWestvaco Corporation in the United States was selected. It mainly consists ofamino amide compounds generated from fatty acid and polyamine condensation [21] (under theultraviolet spectrum, the absorption peak position is λmax = 304 nm). Emulsified asphalt properties arepresented in in Table 1. MQK-1D Infrared Spectrogram and UV spectrum are shown in Figure 1.
62
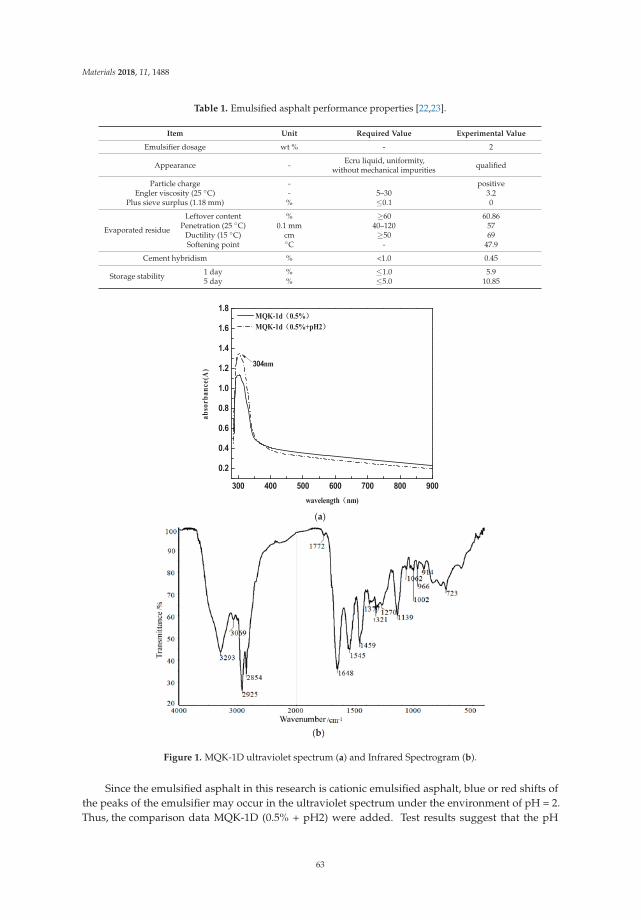
Materials 2018, 11, 1488
Table 1. Emulsified asphalt performance properties [22,23].
Item Unit Required Value Experimental Value
Emulsifier dosage wt % - 2
Appearance - Ecru liquid, uniformity,without mechanical impurities qualified
Particle charge - positiveEngler viscosity (25 ◦C) - 5–30 3.2
Plus sieve surplus (1.18 mm) % ≤0.1 0
Evaporated residue
Leftover content % ≥60 60.86Penetration (25 ◦C) 0.1 mm 40–120 57
Ductility (15 ◦C) cm ≥50 69Softening point ◦C - 47.9
Cement hybridism % <1.0 0.45
Storage stability 1 day % ≤1.0 5.95 day % ≤5.0 10.85
300 400 500 600 700 800 900
0.2
0.4
0.6
0.8
1.0
1.2
1.4
1.6
1.8
abso
rban
ce(A
)
wavelength nm)
MQK-1d 0.5% MQK-1d 0.5%+pH2
304nm
(a)
(b)
Figure 1. MQK-1D ultraviolet spectrum (a) and Infrared Spectrogram (b).
Since the emulsified asphalt in this research is cationic emulsified asphalt, blue or red shifts ofthe peaks of the emulsifier may occur in the ultraviolet spectrum under the environment of pH = 2.Thus, the comparison data MQK-1D (0.5% + pH2) were added. Test results suggest that the pH
63
Materials 2018, 11, 1488
value has no significant effect on the position of the emulsifier peak, and thus it can be consideredλmax = 304 nm.
2.1.2. Aggregate Selection
Representative domestic road aggregates were selected, followed by limestone, granite, basalt,and quartzite. Particle size distribution is 200 mesh, 300 mesh, 400 mesh, 500 mesh (mesh which isused to indicate the particle size of particles that can pass through the mesh. The higher the meshnumber, the smaller the particle size [24]). Then, the four aggregates were sampled by a quarteringmethod [25], and the crush value test, abrasion value test, adhesion test, and apparent density testwere performed. The basic performance indexes are shown in Table 2.
Table 2. The basic performance of the aggregate.
TechnicalIndicators
Crushing Value/%Los Angeles
Wear Value/%Adhesion Grade
With AsphaltApparent
Density/g/cm3
Limestone 18.2 15.8 5 2.700Basalt 9.7 10.3 3 2.707
Granite 15.3 14.1 3 2.677Quartzite 16.3 12.6 3 2.625
Requirements ≤28 ≤30
According to Table 2, it can be seen that the basic properties of the above four aggregates wereentirely able to meet the requirements of JTG E42-2005 of the Highway Engineering Aggregate TestProcedures and they could be used as tests.
2.2. Characterization of Emulsion Asphalt Demulsification Speed
Emulsified asphalt is a black, viscous emulsion at room temperature. When the external conditionschange (mechanical agitation, aggregate mixing, demulsifiers), demulsification occurs. However,in the process of demulsification, it is difficult to find the essential difference in the appearance,and it is impossible to directly evaluate the emulsion demulsification speed. Nevertheless, the natureof the demulsification process of emulsified asphalt lies in the separation of oil and water phases.In the centrifugal field outside, oil in water equilibrium system is broken up. The asphalt droplets,which are in a dispersed phase, rapidly aggregate and sink. With the continuous development ofemulsified asphalt demulsification, the concentration of emulsifier in the supernatant is continuouslyincreased until the equilibrium of emulsion breaking is reached. Based on this, this study used theUV spectroscopy analysis to characterize the breaking speed of emulsified asphalt by examining thechange of emulsifier concentration in the supernatant.
Ultraviolet spectroscopy is based on UV-visible spectrophotometry, which is generally consideredto be 200–800 nm, and is a spectral analysis method based on the molecules of differentsubstances [26,27]. According to the Lambert-Beer law, as a beam of parallel monochromatic lightpasses through an ideal solution of a single homogeneous, the absorbance and concentration of thesolution always exhibits a direct positive proportional relationship.
The procedure can be briefly described as follows: First, 40 g of an equal amount of emulsifiedasphalt was centrifugated (centrifugation temperature 20 ◦C) for different times. After this, 1 mLsupernatant with pipette was diluted with 50 mL distilled water for UV measurement. In order toobtain the proper simulation conditions for the demulsification process, the process was repeatedthree times first [28]. From the figure below, simulation process 1 used a centrifugal speed of 3000 rpm;the experimental conditions performed in process 2 were invariable, while a second supernatantcentrifugation was required. The detailed method of the second centrifugation is that the obtainedsolution was placed in a centrifuge tube and subjected to high-speed centrifugation again. Becauseof the difference in density, the asphalt particles were adsorbed onto the tube wall by the action of
64
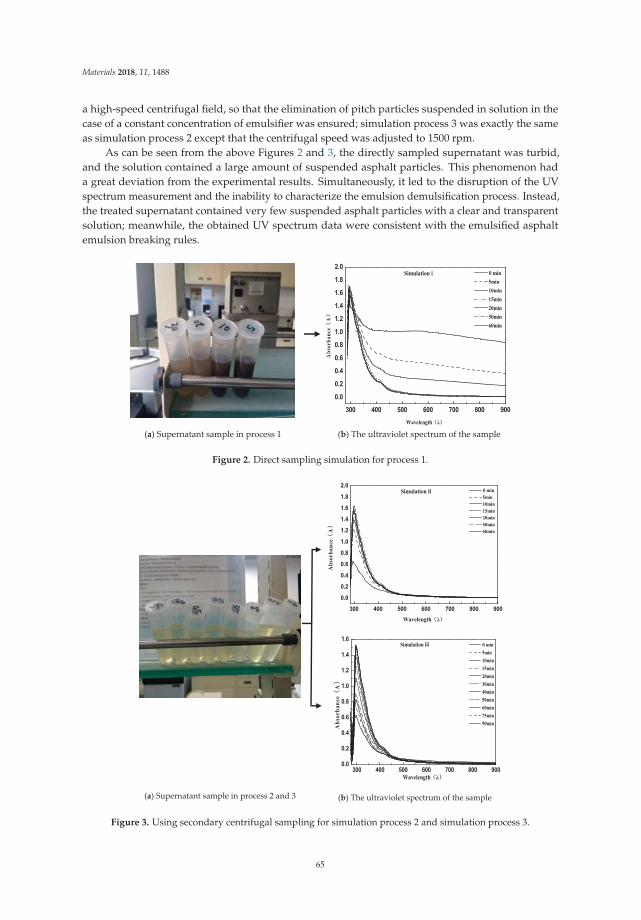
Materials 2018, 11, 1488
a high-speed centrifugal field, so that the elimination of pitch particles suspended in solution in thecase of a constant concentration of emulsifier was ensured; simulation process 3 was exactly the sameas simulation process 2 except that the centrifugal speed was adjusted to 1500 rpm.
As can be seen from the above Figures 2 and 3, the directly sampled supernatant was turbid,and the solution contained a large amount of suspended asphalt particles. This phenomenon hada great deviation from the experimental results. Simultaneously, it led to the disruption of the UVspectrum measurement and the inability to characterize the emulsion demulsification process. Instead,the treated supernatant contained very few suspended asphalt particles with a clear and transparentsolution; meanwhile, the obtained UV spectrum data were consistent with the emulsified asphaltemulsion breaking rules.
300 400 500 600 700 800 900
0.0
0.2
0.4
0.6
0.8
1.0
1.2
1.4
1.6
1.8
2.0
Abs
orba
nce
A
Wavelength
0 min 5min 10min 15min 20min 50min 60min
Simulation i
(a) Supernatant sample in process 1 (b) The ultraviolet spectrum of the sample
Figure 2. Direct sampling simulation for process 1.
300 400 500 600 700 800 900
0.0
0.2
0.4
0.6
0.8
1.0
1.2
1.4
1.6
1.8
2.0 0 min 5min 10min 15min 20min 50min 60min
Abs
orba
nce
A
Wavelength
Simulation ii
300 400 500 600 700 800 9000.0
0.2
0.4
0.6
0.8
1.0
1.2
1.4
1.6Simulation iii
Abs
orba
nce
A
Wavelength
0 min 5min 10min 15min 20min 30min 40min 50min 60min 75min 90min
(a) Supernatant sample in process 2 and 3 (b) The ultraviolet spectrum of the sample
Figure 3. Using secondary centrifugal sampling for simulation process 2 and simulation process 3.
65
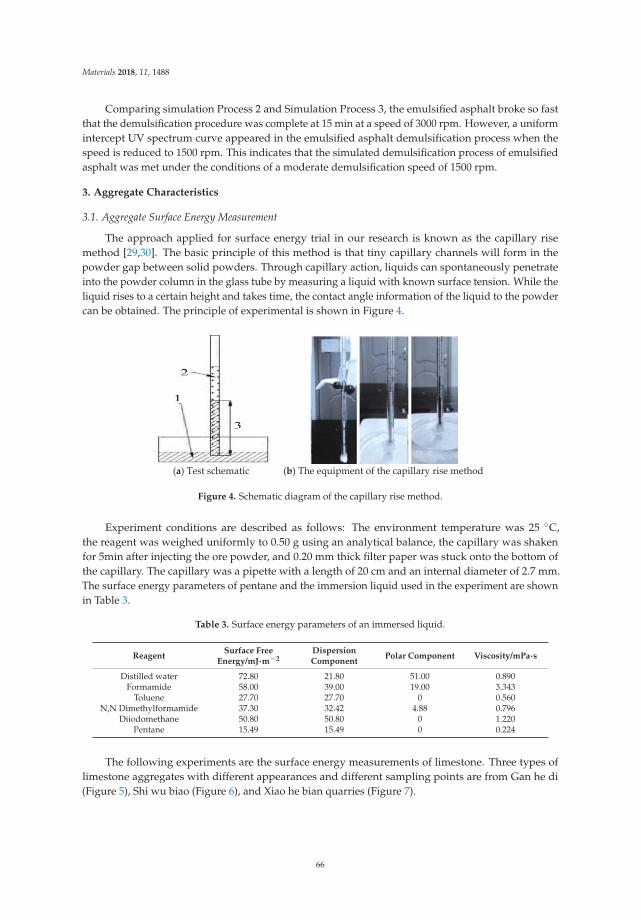
Materials 2018, 11, 1488
Comparing simulation Process 2 and Simulation Process 3, the emulsified asphalt broke so fastthat the demulsification procedure was complete at 15 min at a speed of 3000 rpm. However, a uniformintercept UV spectrum curve appeared in the emulsified asphalt demulsification process when thespeed is reduced to 1500 rpm. This indicates that the simulated demulsification process of emulsifiedasphalt was met under the conditions of a moderate demulsification speed of 1500 rpm.
3. Aggregate Characteristics
3.1. Aggregate Surface Energy Measurement
The approach applied for surface energy trial in our research is known as the capillary risemethod [29,30]. The basic principle of this method is that tiny capillary channels will form in thepowder gap between solid powders. Through capillary action, liquids can spontaneously penetrateinto the powder column in the glass tube by measuring a liquid with known surface tension. While theliquid rises to a certain height and takes time, the contact angle information of the liquid to the powdercan be obtained. The principle of experimental is shown in Figure 4.
(a) Test schematic (b) The equipment of the capillary rise method
Figure 4. Schematic diagram of the capillary rise method.
Experiment conditions are described as follows: The environment temperature was 25 ◦C,the reagent was weighed uniformly to 0.50 g using an analytical balance, the capillary was shakenfor 5min after injecting the ore powder, and 0.20 mm thick filter paper was stuck onto the bottom ofthe capillary. The capillary was a pipette with a length of 20 cm and an internal diameter of 2.7 mm.The surface energy parameters of pentane and the immersion liquid used in the experiment are shownin Table 3.
Table 3. Surface energy parameters of an immersed liquid.
ReagentSurface Free
Energy/mJ·m−2DispersionComponent
Polar Component Viscosity/mPa·s
Distilled water 72.80 21.80 51.00 0.890Formamide 58.00 39.00 19.00 3.343
Toluene 27.70 27.70 0 0.560N,N Dimethylformamide 37.30 32.42 4.88 0.796
Diiodomethane 50.80 50.80 0 1.220Pentane 15.49 15.49 0 0.224
The following experiments are the surface energy measurements of limestone. Three types oflimestone aggregates with different appearances and different sampling points are from Gan he di(Figure 5), Shi wu biao (Figure 6), and Xiao he bian quarries (Figure 7).
66
Materials 2018, 11, 1488
(a) Gan he di quarry (b) The appearance of Gan he di aggregate
Figure 5. Gan he di quarry (a) and stone appearance (b).
(a) Shi wu biao quarry (b) The appearance of Shi wu biao aggregate
Figure 6. Shi wu biao quarry (a) and stone appearance (b).
(a) Xiao he bian quarry (b) The appearance of Xiao he bian aggregate
Figure 7. Xiao he bian quarry (a) and stone appearance (b).
In order to reduce the number of experiments and possible chemical interference in the studyof physical properties, this test was only performed for limestone aggregates (the effective radius ofthis experiment was calibrated to use a low surface energy liquid pentane with a contact angle θ closeto zero).
The following case uses Gan he di (200 mesh) as an example, and the result as shown in Figure 8.
67
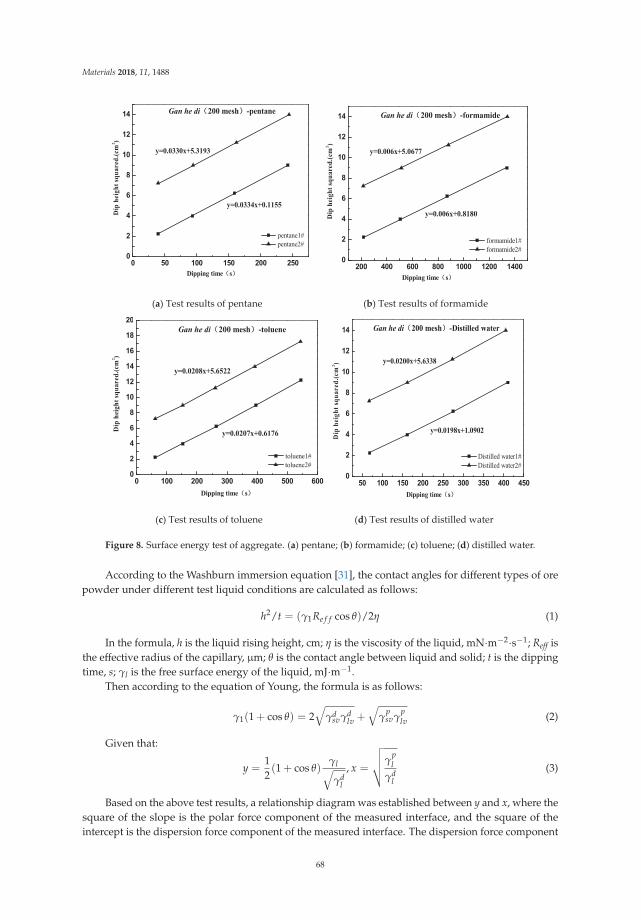
Materials 2018, 11, 1488
0 50 100 150 200 2500
2
4
6
8
10
12
14
y=0.0330x+5.3193
y=0.0334x+0.1155
Dipping time s
pentane1# pentane2#
Gan he di 200 mesh -pentaneD
ip h
eigh
t squ
ared
.(cm
2 )
200 400 600 800 1000 1200 1400
0
2
4
6
8
10
12
14
y=0.006x+0.8180
y=0.006x+5.0677
Dipping time s
Dip
hei
ght s
quar
ed.(c
m2 )
formamide1# formamide2#
Gan he di 200 mesh -formamide
(a) Test results of pentane (b) Test results of formamide
0 100 200 300 400 500 6000
2
4
6
8
10
12
14
16
18
20
y=0.0207x+0.6176
y=0.0208x+5.6522
Dip
hei
ght s
quar
ed.(c
m2 )
Dipping time s
Gan he di 200 mesh -toluene
toluene1# toluene2#
50 100 150 200 250 300 350 400 4500
2
4
6
8
10
12
14
y=0.0198x+1.0902
y=0.0200x+5.6338
Dip
hei
ght s
quar
ed.(c
m2 )
Dipping time s
Distilled water1# Distilled water2#
Gan he di 200 mesh -Distilled water
(c) Test results of toluene (d) Test results of distilled water
Figure 8. Surface energy test of aggregate. (a) pentane; (b) formamide; (c) toluene; (d) distilled water.
According to the Washburn immersion equation [31], the contact angles for different types of orepowder under different test liquid conditions are calculated as follows:
h2/t = (γ1Re f f cos θ)/2η (1)
In the formula, h is the liquid rising height, cm; η is the viscosity of the liquid, mN·m−2·s−1; Reff isthe effective radius of the capillary, μm; θ is the contact angle between liquid and solid; t is the dippingtime, s; γl is the free surface energy of the liquid, mJ·m−1.
Then according to the equation of Young, the formula is as follows:
γ1(1 + cos θ) = 2√
γdsvγd
lv +√
γpsvγ
plv (2)
Given that:
y =12(1 + cos θ)
γl√γd
l
, x =
√√√√γpl
γdl
(3)
Based on the above test results, a relationship diagram was established between y and x, where thesquare of the slope is the polar force component of the measured interface, and the square of theintercept is the dispersion force component of the measured interface. The dispersion force component
68
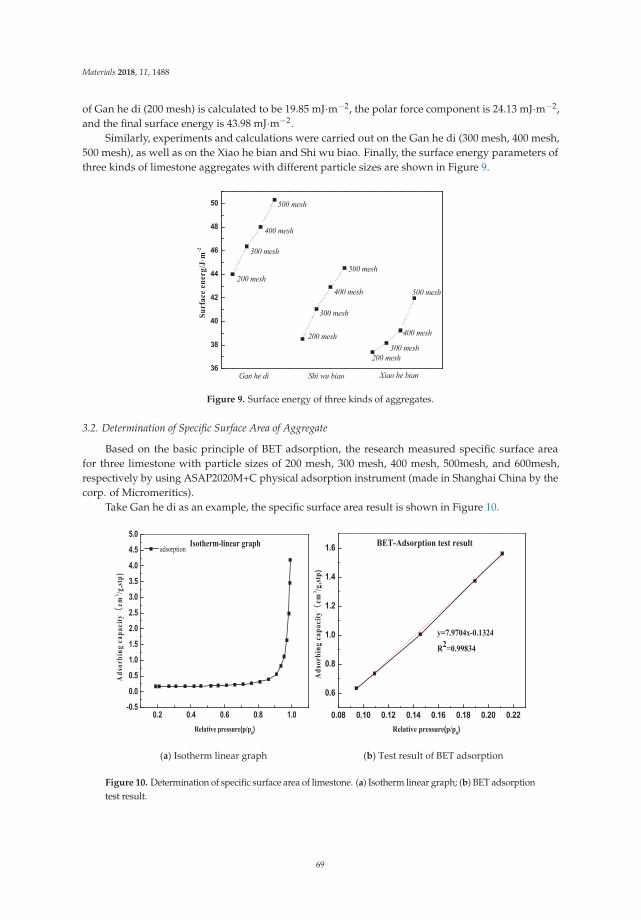
Materials 2018, 11, 1488
of Gan he di (200 mesh) is calculated to be 19.85 mJ·m−2, the polar force component is 24.13 mJ·m−2,and the final surface energy is 43.98 mJ·m−2.
Similarly, experiments and calculations were carried out on the Gan he di (300 mesh, 400 mesh,500 mesh), as well as on the Xiao he bian and Shi wu biao. Finally, the surface energy parameters ofthree kinds of limestone aggregates with different particle sizes are shown in Figure 9.
36
38
40
42
44
46
48
50
500 mesh
400 mesh
300 mesh200 mesh
200 mesh
300 mesh
400 mesh
500 mesh
500 mesh
400 mesh
300 mesh
200 mesh
Xiao he bianShi wu biao
Surf
ace
ener
g/J·
m-2
Gan he di Figure 9. Surface energy of three kinds of aggregates.
3.2. Determination of Specific Surface Area of Aggregate
Based on the basic principle of BET adsorption, the research measured specific surface areafor three limestone with particle sizes of 200 mesh, 300 mesh, 400 mesh, 500mesh, and 600mesh,respectively by using ASAP2020M+C physical adsorption instrument (made in Shanghai China by thecorp. of Micromeritics).
Take Gan he di as an example, the specific surface area result is shown in Figure 10.
0.2 0.4 0.6 0.8 1.0-0.5
0.0
0.5
1.0
1.5
2.0
2.5
3.0
3.5
4.0
4.5
5.0
Ads
orbi
ng c
apac
itycm
3 /g,st
p)
Relative pressure(p/p0)
adsorption Isotherm-linear graph
0.08 0.10 0.12 0.14 0.16 0.18 0.20 0.22
0.6
0.8
1.0
1.2
1.4
1.6
Relative pressure(p/p0)
Ads
orbi
ng c
apac
itycm
3 /g,st
p)
BET-Adsorption test result
y=7.9704x-0.1324
R2=0.99834
(a) Isotherm linear graph (b) Test result of BET adsorption
Figure 10. Determination of specific surface area of limestone. (a) Isotherm linear graph; (b) BET adsorptiontest result.
69
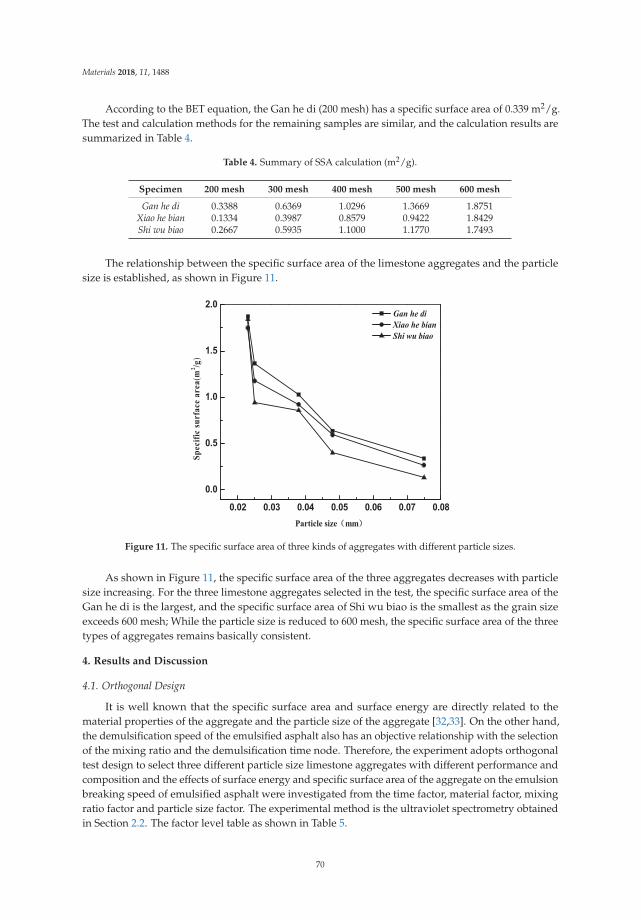
Materials 2018, 11, 1488
According to the BET equation, the Gan he di (200 mesh) has a specific surface area of 0.339 m2/g.The test and calculation methods for the remaining samples are similar, and the calculation results aresummarized in Table 4.
Table 4. Summary of SSA calculation (m2/g).
Specimen 200 mesh 300 mesh 400 mesh 500 mesh 600 mesh
Gan he di 0.3388 0.6369 1.0296 1.3669 1.8751Xiao he bian 0.1334 0.3987 0.8579 0.9422 1.8429Shi wu biao 0.2667 0.5935 1.1000 1.1770 1.7493
The relationship between the specific surface area of the limestone aggregates and the particlesize is established, as shown in Figure 11.
0.02 0.03 0.04 0.05 0.06 0.07 0.08
0.0
0.5
1.0
1.5
2.0
Spec
ific
surf
ace
area
(m2 /g
)
Particle size mm
Gan he di Xiao he bian Shi wu biao
Figure 11. The specific surface area of three kinds of aggregates with different particle sizes.
As shown in Figure 11, the specific surface area of the three aggregates decreases with particlesize increasing. For the three limestone aggregates selected in the test, the specific surface area of theGan he di is the largest, and the specific surface area of Shi wu biao is the smallest as the grain sizeexceeds 600 mesh; While the particle size is reduced to 600 mesh, the specific surface area of the threetypes of aggregates remains basically consistent.
4. Results and Discussion
4.1. Orthogonal Design
It is well known that the specific surface area and surface energy are directly related to thematerial properties of the aggregate and the particle size of the aggregate [32,33]. On the other hand,the demulsification speed of the emulsified asphalt also has an objective relationship with the selectionof the mixing ratio and the demulsification time node. Therefore, the experiment adopts orthogonaltest design to select three different particle size limestone aggregates with different performance andcomposition and the effects of surface energy and specific surface area of the aggregate on the emulsionbreaking speed of emulsified asphalt were investigated from the time factor, material factor, mixingratio factor and particle size factor. The experimental method is the ultraviolet spectrometry obtainedin Section 2.2. The factor level table as shown in Table 5.
70
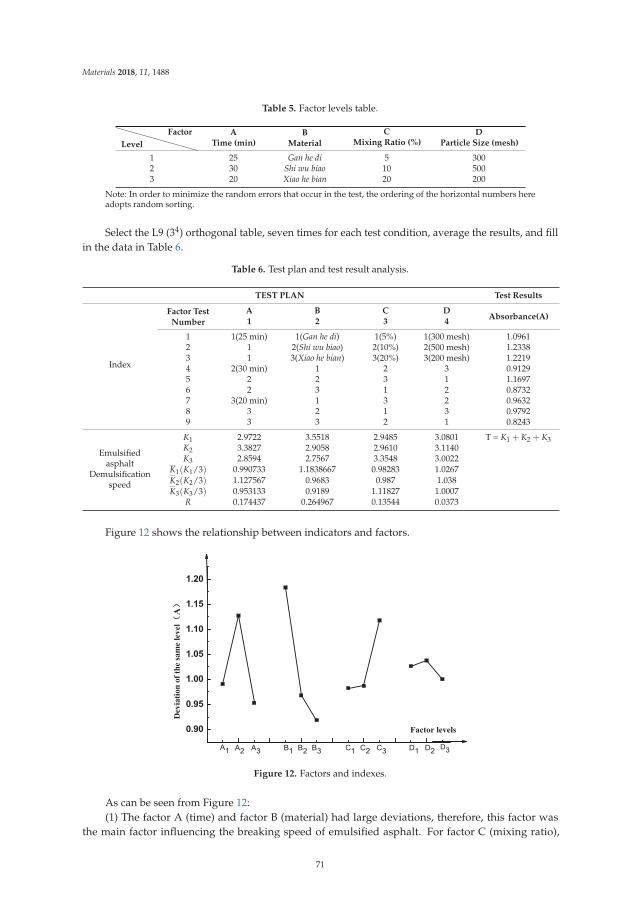
Materials 2018, 11, 1488
Table 5. Factor levels table.
Level
Factor ATime (min)
BMaterial
CMixing Ratio (%)
DParticle Size (mesh)
1 25 Gan he di 5 3002 30 Shi wu biao 10 5003 20 Xiao he bian 20 200
Note: In order to minimize the random errors that occur in the test, the ordering of the horizontal numbers hereadopts random sorting.
Select the L9 (34) orthogonal table, seven times for each test condition, average the results, and fillin the data in Table 6.
Table 6. Test plan and test result analysis.
TEST PLAN Test Results
Index
Factor TestNumber
A B C DAbsorbance(A)
1 2 3 4
1 1(25 min) 1(Gan he di) 1(5%) 1(300 mesh) 1.09612 1 2(Shi wu biao) 2(10%) 2(500 mesh) 1.23383 1 3(Xiao he bian) 3(20%) 3(200 mesh) 1.22194 2(30 min) 1 2 3 0.91295 2 2 3 1 1.16976 2 3 1 2 0.87327 3(20 min) 1 3 2 0.96328 3 2 1 3 0.97929 3 3 2 1 0.8243
Emulsifiedasphalt
Demulsificationspeed
K1 2.9722 3.5518 2.9485 3.0801 T = K1 + K2 + K3K2 3.3827 2.9058 2.9610 3.1140K3 2.8594 2.7567 3.3548 3.0022
K1(K1/3) 0.990733 1.1838667 0.98283 1.0267K2(K2/3) 1.127567 0.9683 0.987 1.038K3(K3/3) 0.953133 0.9189 1.11827 1.0007
R 0.174437 0.264967 0.13544 0.0373
Figure 12 shows the relationship between indicators and factors.
0.90
0.95
1.00
1.05
1.10
1.15
1.20
D3D2D1C3C2C1B3B2B1A3A2
Dev
iatio
n of
the
sam
e le
vel
A
A1
Factor levels
Figure 12. Factors and indexes.
As can be seen from Figure 12:(1) The factor A (time) and factor B (material) had large deviations, therefore, this factor was
the main factor influencing the breaking speed of emulsified asphalt. For factor C (mixing ratio),
71
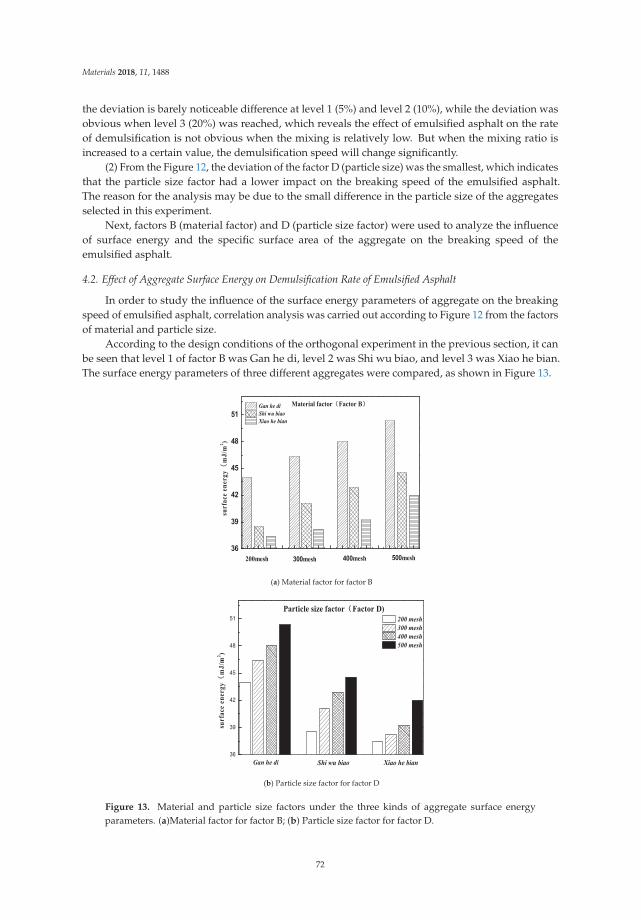
Materials 2018, 11, 1488
the deviation is barely noticeable difference at level 1 (5%) and level 2 (10%), while the deviation wasobvious when level 3 (20%) was reached, which reveals the effect of emulsified asphalt on the rateof demulsification is not obvious when the mixing is relatively low. But when the mixing ratio isincreased to a certain value, the demulsification speed will change significantly.
(2) From the Figure 12, the deviation of the factor D (particle size) was the smallest, which indicatesthat the particle size factor had a lower impact on the breaking speed of the emulsified asphalt.The reason for the analysis may be due to the small difference in the particle size of the aggregatesselected in this experiment.
Next, factors B (material factor) and D (particle size factor) were used to analyze the influenceof surface energy and the specific surface area of the aggregate on the breaking speed of theemulsified asphalt.
4.2. Effect of Aggregate Surface Energy on Demulsification Rate of Emulsified Asphalt
In order to study the influence of the surface energy parameters of aggregate on the breakingspeed of emulsified asphalt, correlation analysis was carried out according to Figure 12 from the factorsof material and particle size.
According to the design conditions of the orthogonal experiment in the previous section, it canbe seen that level 1 of factor B was Gan he di, level 2 was Shi wu biao, and level 3 was Xiao he bian.The surface energy parameters of three different aggregates were compared, as shown in Figure 13.
36
39
42
45
48
51 Gan he di Shi wu biao Xiao he bian
500mesh400mesh300mesh
surf
ace
ener
gym
J/m
2 )
200mesh
Material factor Factor B
(a) Material factor for factor B
36
39
42
45
48
51 200 mesh 300 mesh 400 mesh 500 mesh
Particle size factor Factor D)
Xiao he bianShi wu biaoGan he di
surf
ace
ener
gym
J/m
2 )
(b) Particle size factor for factor D
Figure 13. Material and particle size factors under the three kinds of aggregate surface energyparameters. (a)Material factor for factor B; (b) Particle size factor for factor D.
72
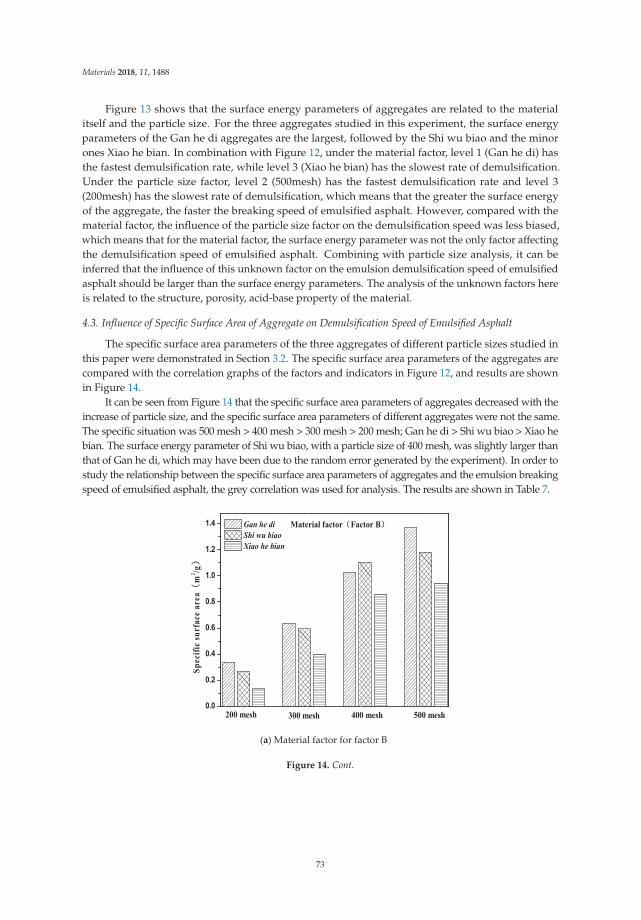
Materials 2018, 11, 1488
Figure 13 shows that the surface energy parameters of aggregates are related to the materialitself and the particle size. For the three aggregates studied in this experiment, the surface energyparameters of the Gan he di aggregates are the largest, followed by the Shi wu biao and the minorones Xiao he bian. In combination with Figure 12, under the material factor, level 1 (Gan he di) hasthe fastest demulsification rate, while level 3 (Xiao he bian) has the slowest rate of demulsification.Under the particle size factor, level 2 (500mesh) has the fastest demulsification rate and level 3(200mesh) has the slowest rate of demulsification, which means that the greater the surface energyof the aggregate, the faster the breaking speed of emulsified asphalt. However, compared with thematerial factor, the influence of the particle size factor on the demulsification speed was less biased,which means that for the material factor, the surface energy parameter was not the only factor affectingthe demulsification speed of emulsified asphalt. Combining with particle size analysis, it can beinferred that the influence of this unknown factor on the emulsion demulsification speed of emulsifiedasphalt should be larger than the surface energy parameters. The analysis of the unknown factors hereis related to the structure, porosity, acid-base property of the material.
4.3. Influence of Specific Surface Area of Aggregate on Demulsification Speed of Emulsified Asphalt
The specific surface area parameters of the three aggregates of different particle sizes studied inthis paper were demonstrated in Section 3.2. The specific surface area parameters of the aggregates arecompared with the correlation graphs of the factors and indicators in Figure 12, and results are shownin Figure 14.
It can be seen from Figure 14 that the specific surface area parameters of aggregates decreased with theincrease of particle size, and the specific surface area parameters of different aggregates were not the same.The specific situation was 500 mesh > 400 mesh > 300 mesh > 200 mesh; Gan he di > Shi wu biao > Xiao hebian. The surface energy parameter of Shi wu biao, with a particle size of 400 mesh, was slightly larger thanthat of Gan he di, which may have been due to the random error generated by the experiment). In order tostudy the relationship between the specific surface area parameters of aggregates and the emulsion breakingspeed of emulsified asphalt, the grey correlation was used for analysis. The results are shown in Table 7.
0.0
0.2
0.4
0.6
0.8
1.0
1.2
1.4 Gan he di Shi wu biao Xiao he bian
500 mesh400 mesh300 mesh200 mesh
Material factor Factor B
Sp
ecifi
c su
rfac
e ar
eam
2 /g
(a) Material factor for factor B
Figure 14. Cont.
73
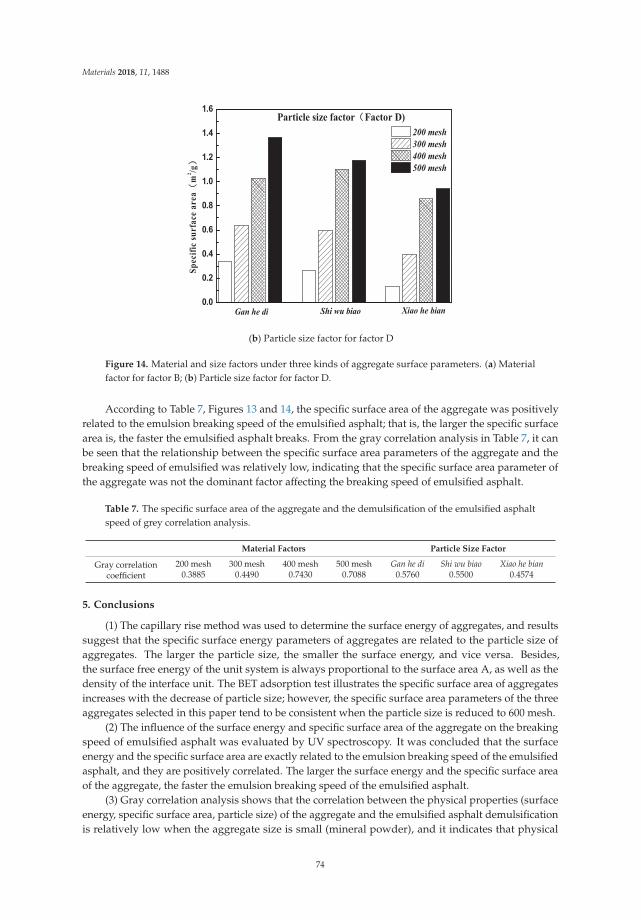
Materials 2018, 11, 1488
0.0
0.2
0.4
0.6
0.8
1.0
1.2
1.4
1.6
200 mesh 300 mesh 400 mesh 500 mesh
Xiao he bianShi wu biaoGan he di
Sp
ecifi
c su
rfac
e ar
eam
2 /g
Particle size factor Factor D)
(b) Particle size factor for factor D
Figure 14. Material and size factors under three kinds of aggregate surface parameters. (a) Materialfactor for factor B; (b) Particle size factor for factor D.
According to Table 7, Figures 13 and 14, the specific surface area of the aggregate was positivelyrelated to the emulsion breaking speed of the emulsified asphalt; that is, the larger the specific surfacearea is, the faster the emulsified asphalt breaks. From the gray correlation analysis in Table 7, it canbe seen that the relationship between the specific surface area parameters of the aggregate and thebreaking speed of emulsified was relatively low, indicating that the specific surface area parameter ofthe aggregate was not the dominant factor affecting the breaking speed of emulsified asphalt.
Table 7. The specific surface area of the aggregate and the demulsification of the emulsified asphaltspeed of grey correlation analysis.
Material Factors Particle Size Factor
Gray correlationcoefficient
200 mesh 300 mesh 400 mesh 500 mesh Gan he di Shi wu biao Xiao he bian0.3885 0.4490 0.7430 0.7088 0.5760 0.5500 0.4574
5. Conclusions
(1) The capillary rise method was used to determine the surface energy of aggregates, and resultssuggest that the specific surface energy parameters of aggregates are related to the particle size ofaggregates. The larger the particle size, the smaller the surface energy, and vice versa. Besides,the surface free energy of the unit system is always proportional to the surface area A, as well as thedensity of the interface unit. The BET adsorption test illustrates the specific surface area of aggregatesincreases with the decrease of particle size; however, the specific surface area parameters of the threeaggregates selected in this paper tend to be consistent when the particle size is reduced to 600 mesh.
(2) The influence of the surface energy and specific surface area of the aggregate on the breakingspeed of emulsified asphalt was evaluated by UV spectroscopy. It was concluded that the surfaceenergy and the specific surface area are exactly related to the emulsion breaking speed of the emulsifiedasphalt, and they are positively correlated. The larger the surface energy and the specific surface areaof the aggregate, the faster the emulsion breaking speed of the emulsified asphalt.
(3) Gray correlation analysis shows that the correlation between the physical properties (surfaceenergy, specific surface area, particle size) of the aggregate and the emulsified asphalt demulsificationis relatively low when the aggregate size is small (mineral powder), and it indicates that physical
74
Materials 2018, 11, 1488
microscopic characteristics are not the main factor that affect the emulsion breaking speed. Instead,the material properties (excluding physical properties) of the aggregate itself, such as acid-baseproperties and chargeability, are the dominant factors affecting the emulsified asphalt demulsification.
(4) The effect of the characteristics of aggregates on the emulsion breaking speed of emulsifiedasphalt, in this article, is restricted to small particle size fine aggregates (as well as mineral powder).The effects of the relevant characteristics of coarse aggregates on the demulsification speed of emulsifiedasphalts are currently unable to be determined. Therefore, it has to be admitted that conclusions havecertain limitations and further research is needed. Besides, for the coarse aggregates, a significantchange, as revealed in the particle size, further study on the relationship between the aggregates anddemulsification speed is necessary for.
Author Contributions: Investigation, F.T.; Methodology, T.M. and L.K.; Validation, T.M. and L.K.; Writing fororiginal draft, F.T.; Writing for review & editing, G.X.
Funding: This research was funded by National Natural Science Foundation of China (No. 51878164and No. 51378006), Natural Science Foundation of Jiangsu Province, China (BK20161421 and BK20140112),and Scientific Research Foundation of Graduate school of Southeast University (YBJJ 1843).
Acknowledgments: The authors would like to thank the fund from National Natural Science Foundation ofChina (No. 51508062 and No. 51378006), Natural Science Foundation of Jiangsu (BK20161421 and BK20140112),and the Open Fund of State Engineering Laboratory of Highway Maintenance Technology (Changsha Universityof Science & Technology, kfj160104).
Conflicts of Interest: The authors declare no conflict of interest.
References
1. Chen, D.; Jahrcn, C.T.; Lee, H.D.; Williams, R.; Kim, S.; Heitzman, M.; Kim, J. Effects of recycled materialson long-term performance of cold in-place recycled asphalt roads. J. Perform. Constr. Facil. 2009, 2, 270–280.[CrossRef]
2. Sclvaratnam, S. Long Term Performance Evaluation of Cold in-Place Recycling (ClR) Technique in Nevada.Ph.D. Thesis, University of Nevada, Reno, NV, USA, 2013.
3. Liu, S.L. Emulsified Asphalt and its Application in Road and Construction Engineering; China Building MaterialsPress: Beijing, China, 2008. (In Chinese)
4. Wang, T.; Shen, D.Y.; Xu, T. Photocatalytic degradation properties of V-doped TiO2 to automobile exhaust.Sci. Total Environ. 2017, 586, 347–354. [CrossRef] [PubMed]
5. Cherrington, M. The move to emulsions. Earthmover Civil Contractor 1992, 30, 33–36.6. Mathews, D.H. Surface-active agents in bituminous road surfacing. J. Appl. Chem. 1962, 12, 56–64. [CrossRef]7. He, H. Study on Properties of Modified Emulsified Asphalt and Micro Surface. Master’s Thesis, Chang’an
University, Xi’an, China, 15 June 2006. (In Chinese)8. Hung, K.; Xu, T.; Li, G.F. Heating effects of asphalt pavement during hot in-place recycling using DEM.
Constr. Build. Mater. 2016, 115, 62–69. [CrossRef]9. Redelius, P. A novel system for delayed breaking control of bitumen emulsions. In Proceedings of the First
World Congress on Emulsion, Paris, France, 19–22 October 1993.10. Shaw, D. Introduction to Colloid and Surface Chemistry; Butterworths: Oxford, UK, 1992.11. Shi, H.Q.; Xu, T.; Jiang, R.L. Combustion mechanism of four components separated from asphalt binder. Fuel
2017, 192, 18–26. [CrossRef]12. Marchal, J.L.; Julien, P.; Boussad, N. A new approach to cold mix design and performance. In Proceedings of
the 5th Eurobitume Congress, Stockholm, Sweden, 16–18 June 1993.13. Marchal, J.L.; Julien, P.; Boussad, N. Bitumen emulsions testing: Towards a better understanding of emulsion
behavior. In Proceedings of the 5th Eurobitume Congress, Stockholm, Sweden, 16–18 June 1993.14. Xie, L.B.; Yang, J.X.; Ling, C. Discussion on storage stability of emulsified asphalt. J. Highway Transp. Res. Dev.
2006, 9, 87–89. (In Chinese)15. Gorman, J.L.; Crawford, R.J.; Stannard, P.; Harding, I.H. The role of surface chemistry in bitumen
emulsion-aggregate interactions. Road Transp. Res. 1998, 7, 3.
75
Materials 2018, 11, 1488
16. Hagen, A.P.; Lee, D.W.; Jones, T.M. AspHalt-aggregate interactions characterised by zeta potential andretained strength measurements for natural and organosilane-treated aggregates. Transp. Res. Rec. 1996,1535, 111–116. [CrossRef]
17. Lyklema, J. Adsorption at solid-liquid interfaces with special reference to emulsion systems. Colloids Surf. A1994, 91, 25–38. [CrossRef]
18. Castillo, G.L.; Poirier, P.A.J.; Bourrell, M. Breaking of an asphalt emulsion on a mineral aggregate:phenomenology, modelling and optimization. In Proceedings of the First World Congress on Emulsion,Paris, France, 19–22 October 1993.
19. Whiteoak, D.; Read, J.; Hunter, R.N. The Shell Bitumen Handbook; Shell Bitumen: London, UK, 1990.20. Yuliestyan, A.; Garcia-morales, M.; Moreno, E. Assessment of modified lignin cationic emulsifier for bitumen
emulsions used in road paving. Mater. Des. 2017, 131, 242–251. [CrossRef]21. Zhang, Q.Q. Study on the Influence of Emulsification on the Properties of SBS Modified Asphalt. Ph.D. Thesis,
China University of Petroleum, Qingdao, China, 24 May 2012. (In Chinese)22. Highway science research institute of transportation department, ministry of transportation. In Test Procedures
for Asphalt and Asphalt Mixtures for Highway Engineering; China Communications Press: Beijing, China, 2011.(In Chinese)
23. Asphalt Institute. Superpave Performance Graded Asphalt Binder Specifications and Testing. Availableonline: https://trid.trb.org/view/661578 (accessed on 13 August 2018).
24. Tang, N. System and Process for Preparing Large-Particle Potassium Chloride by Cold-DecompositionCrystallization and Flotation Method with High-Sodium Potassic Salt Ore. WO 2014161248 A1, 9 October 2014.
25. Wu, H.J.; Li, Y.N.; Yang, K.Y. The Quartering Cup. CN 202420902, 15 March 2012.26. Marin, T.W.; Janik, I.; Bartels, D.M. Vacuum ultraviolet spectroscopy of the lowest-lying electronic state in
subcritical and supercritical water. Nat. Commun. 2016, 8, 15435. [CrossRef] [PubMed]27. Tanabe, I.; Kawasaki, Y. Far-ultraviolet spectral changes of titanium dioxide with gold nanoparticles by
ultraviolet and visible light. Spectrochim. Acta Part A 2018, 197, 103–106. [CrossRef] [PubMed]28. Kong, L.Y.; Tang, F.L.; Xu, Y. The demulsification of emulsified asphalt evaluation based on UV spectrum
velocity. J. Chang’an Univ. 2013, 37, 17–23. (In Chinese)29. Bilinski, B.; Holysz, L. Some theoretical and experimental limitations in the determination of surface free
energy of siliceous solids. Powder Technol. 1999, 102, 120–126. [CrossRef]30. Kong, L.Y.; Cao, H.P.; Zhang, Y.Z. External factors for contact angle of mineral fill with capillary rise method
and solutions. J. Harbin Inst. Technol. 2017, 46, 85–89.31. Fries, N.; Odic, K.; Dreyer, M. Wicking of Perfectly Wetting Liquids into a Metallic Mesh. In Proceedings of
the 2nd International Conference on Porous Media and its Applications in Science and Engineering ICPM2,Kauai, HI, USA, 17–21 June 2007.
32. Cheng, D.X.; Little, D.N.; Lytton, R.L. Surface free energy measurement of aggregates and its application toadhesion and moisture damage of asphalt-aggregate systems. In Proceedings of the International Center forAggregates Research 9th Annual Symposium: Aggregates—Concrete, Bases and Fines, Washington, DC,USA, 24 February 2001.
33. Thommes, M.; Kaneko, K.; Neimark, A.V. Physisorption of gases, with special reference to the evaluation ofsurface area and pore size distribution (IUPAC Technical Report). Chem. Int. 2011, 38, 25.
© 2018 by the authors. Licensee MDPI, Basel, Switzerland. This article is an open accessarticle distributed under the terms and conditions of the Creative Commons Attribution(CC BY) license (http://creativecommons.org/licenses/by/4.0/).
76
materials
Article
Improvement of Asphalt-Aggregate Adhesion UsingPlant Ash Byproduct
Zhuangzhuang Liu 1,2 , Xiaonan Huang 1,2, Aimin Sha 1,2,*, Hao Wang 3,* , Jiaqi Chen 3,4 and
Cheng Li 1,2
1 Key Laboratory of Special Area Highway Engineering, MOE, Xi’an 710064, China; [email protected] (Z.L.);[email protected] (X.H.); [email protected] (C.L.)
2 School of Highway, Chang’an University, Xi’an 710064, China3 Rutgers, The State University of New Jersey, Piscataway, NJ 08854, USA; [email protected] School of Civil Engineering, Central South University, Changsha 410083, China* Correspondence: [email protected] (H.W.); [email protected] (A.S.)
Received: 17 December 2018; Accepted: 8 February 2019; Published: 18 February 2019
Abstract: The adhesion bonding between asphalt and aggregate significantly influences fieldperformance and durability of asphalt pavement. Adhesion promoters are typically used to improveasphalt-aggregate bonding and minimize moisture-related pavement damage, such as cracking andraveling. This study evaluated the effectiveness of plant ash byproduct as adhesion promoter toimprove asphalt-aggregate adhesion performance. Three commonly used aggregate types (granite,basic rock, and limestone) and two asphalt binder types were used in laboratory testing. A modifiedstripping test method was developed to evaluate test results with image analysis and measurementof asphalt film thickness. The contact angle test and scanning electron microscopy (SEM) withenergy disperse spectroscopy (EDS) were conducted. Test results showed that plant ash lixiviumsignificantly improved asphalt-aggregate adhesion. Among three aggregate types, granite yieldedthe worst asphalt-aggregate adhesion for both control and treated specimens. The effectiveness ofadhesion promotion varied depending on the type of asphalt or aggregate and temperature. TheSEM/EDS observations showed that the mesh-like crystalline was formed at the interface betweenasphalt binder and aggregate in the treated specimen, which was believed to enhance the interfacialbonding and prevent asphalt film peeling off from aggregate.
Keywords: asphalt-aggregate adhesion; plant ash lixivium; stripping test; contact angle; interfacialtransition zone
1. Introduction
The adhesion strength of asphalt binders is an important parameter for durability of asphaltpavements. Poor bonding effect between asphalt binder and aggregate has long been identifiedas a major cause leading to accelerated damage of asphalt pavement [1]. When asphalt film startspeeling off from aggregates, the asphalt-aggregate adhesion strength is greatly reduced and resultsin debonding at the asphalt-aggregate interface [2,3]. Many previous studies have found that thedamages of asphalt pavements including cracking, raveling, and permanent deformation are related tothe degradation of asphalt-aggregate adhesion strength [4–7]. Therefore, to increase asphalt-aggregateadhesion strength and eventually improve the performance and durability of asphalt pavementsystems, better understanding of the bonding mechanism and microstructure of asphalt-aggregateinterface is needed [8,9].
The adhesion strength of asphalt-aggregate interface consists of three components: (1) physicalbonding from mechanical interlocking, (2) physicochemical adhesion caused by surface free energy, and(3) bonding due to interfacial chemical reactions [10]. To improve asphalt-aggregate bonding, various
Materials 2019, 12, 605; doi:10.3390/ma12040605 www.mdpi.com/journal/materials77
Materials 2019, 12, 605
adhesion promoters (also called anti-peeling agents) have been evaluated, such as fatty amines, organicamines, and nano admixtures [6,11–13]. Previous studies have found that polymer materials suchas Styrene-Butadiene-Styrene (SBS), Ethylene-Vinyl-Acetate (EVA), and crumb rubber can improvemoisture susceptibility of asphalt mixtures [14,15]. The promotors enhance the adhesion strength byadjusting surface energy of aggregate or forming chemical bonds between asphalt and aggregate [16].However, most interface bonding promoters are slaked lime-based products, which are strong alkalinematerials and may have adverse effects on the performance of asphalt mixtures. The previous studiesmainly focused on application and evaluation of asphalt antistripping promoters (SBS, EVA, etc.) [17].However, relatively few studies focused on evaluation of the effectiveness aggregate-promoters.
Plant ashes are byproducts from burning wheat straw, rice straw, wood straw, and corn cobs.Recent literatures reported the utilization of plant ashes (e.g., rich husk ash) in asphalt [18,19], sothat the plant ash modified asphalt-based materials achieved good engineering performance. If theplant ashes were immersed in water, a large amount of alkaline substances (i.e., KOH, Ca(OH)2) couldbe released, which has the potential to enhance the asphalt-aggregate adhesion. The main chemicalcompositions of plant ashes are SiO2, K2O, CaO, SO3, MgO, Na2O, Fe3O4, Al2O3, and TiO2 [20].However, the exact chemical compositions of plant ash lixivium vary depending on different rawmaterials (i.e., wheat straw, rice straw, wood straw, and corn cobs) [21–24]. The alkaline lixiviumhas great potential to modify the interface between asphalt and aggregate. In this study, plant ashlixivium was proposed to improve the asphalt-aggregate interface adhesion, which is rarely reportedin previous literatures.
The asphalt film stripping test (also called water-boiling test) is a conventional method used toevaluate the adhesion strength of asphalt [25,26]. The test is widely used due to its simple operationprocedure. The specimens after boiling are visually classified based on five-level criteria, which are notquantified criteria and could be subjective. Recently, image analysis method was concerned to providequantitative evaluation of rolling bottle test instead of visual observation only [27]. Hence, the imageanalysis was combined with the traditional test in this study to investigate the effectiveness of plantash treatment on interface bonding. In addition, advanced tests including contact angle test, SEM, andEDS were conducted to evaluate how the plant ash lixivium influence asphalt-aggregate adhesion bydirectly observing the microstructures of asphalt-aggregate interface zone. The observations can helpexplain the physicochemical adhesion mechanism of asphalt-aggregate system.
2. Testing Materials
2.1. Asphalt Binder and Aggregate
Two petroleum asphalts binders were used in this study, which were classified as #90A and #110Aaccording to penetration test values. The basic rheological properties of two binders are provided inTable 1. The penetration, softening point, and ductility were measured based on ASTM-D5, ASTM-D36,and ASTM-D113 standards, respectively [28–30].
Table 1. Basic rheological properties of two asphalt binders.
Asphalt Types Penetration at 25 ◦C/0.1 mm Softening Point/◦C Ductility at 15 ◦C/cm
#90 grade A petroleum asphalt 88.2 45.6 >100
#110 grade A petroleum asphalt 107 44.8 >200
In this study, three types of aggregates (i.e., granite, basic rock, and limestone) were selected.For different types of aggregates, the base number and surface electrical potential related to adhesioncharacteristics were reported in the literature [31], as shown in Table 2.
78
Materials 2019, 12, 605
Table 2. The base number and surface potential of aggregates [31].
Aggregate Types Granite Limestone Basic Rock
Base number 0.55 0.96 0.65
Surface potentials /mV −0.31 0.62 0.04
2.2. Plant Ash Lixivium
The fresh plant ash used in this study was the remnant after burning rice straw, wheat straw,wood, or corn cob. The plant ash was sieved through 0.3-mm sieve and dried in oven. The driedplant ash was then mixed with deionized water (pH = 6.7 at 20 ◦C) and stirred for 2 mins. In themixed suspension liquid, the plant ash released alkaline ions, which could change the pH value ofthe suspension. In this study, five testing specimens with different ash-to-water (A/W) mass ratioswere prepared in 500-mL glass beakers, as shown in Figure 1. After 30 min defecation, the lixiviums aspresented below are filtered with filter papers.
Figure 1. Plant ash lixivium suspensions with different ash-to-water (A/W) ratios.
The pH values of suspensions were measured at 0.5, 1, 2, 5, and 10 min after stirring with thebeginning of pH = 6.7 (deionized water). Figure 2 presents the changes of suspension’s pH value fromstirring. The result indicated that the higher ash/water ratio yielded the higher final pH values asshown in Figure 2a. The changing trends of pH values for different suspensions were found to besimilar, which showed rapid increase in the first 150 s and then remained with the relatively constantvalues. However, the pH value of the suspensions with high ash-water ratio increased at a faster ratethan those with low ash-water ratios, and yielded higher final pH values.
In solutions, the H+ and OH− ions concentration can be calculated based on the pH value becausepH = −lg(H+) = 14 − lg(OH−). It seems the ions leaching from the plant ash could be calculated basedon the pH data in Figure 2. However, in this study the solution contains K2CO3, KHCO3, KOH, KCl,and K2SO4 et al. It is hard to calculate the content of average ions released during the leaching, becauseKCl and K2SO4 rarely contributes to the pH value. However, the pH increasing must be linked to ionrelease, be they positive ions (K+, H+) or negative ions (OH−, Cl−, CO3
2−, HCO3−, SO4
2−) in thisstudy. Hence, the increased pH values were divided by time, as shown in Figure 2b. Thereby, thehigher pH value increased means the higher ions releasing rate. The results declared that the leachingprocess of ions from plant ash could be divided into three stages: (1) Stage I: 0–60 s when a largeamount of ions are released depending on the ash/water ratio; (2) Stage II: 60–300 s when the ionreleasing rate is significantly slowed; and (3) Stage III: >300 s when fewer ions could be released inplant ash lixivium.
The relationship between the final pH values and the ash-water ratios of the suspensions wasfound to be nonlinear, as shown in Figure 3. The final pH value of the suspension greatly increasedas the ash-water ratio increased from 0.02 to 0.075. Therefore, in this study, the plant ash lixivium
79
Materials 2019, 12, 605
was prepared using the ash/water ratio of 0.075, and the solution was defecated for 30 mins and thenfiltered using filter papers with 120 μm opening.
(a) (b)
Figure 2. The pH value changes of suspensions with plant ash lixivium: (a) pH and (b) change of pHwith time.
Figure 3. The relationship between final pH values and A/W ratios.
3. Adhesion Evaluation Using Conventional and Modified Stripping Tests
3.1. Conventional Stripping Test
The conventional stripping test (ASTM D3625) used to evaluate asphalt-aggregate adhesionwas conducted on aggregates with particle sizes ranging from 13.2 mm to 19 mm. In this study, thestripping test was conducted on three types of aggregates (granite, limestone, and basic rock). Thespecimens were soaked in the plant ash lixivium for one hour and then dried in oven at 80 ◦C for twohours. The control specimens were prepared following the same procedure except that the aggregateswere not soaked in the plant ash lixivium solution. To reduce the effect of asphalt film thickness, all thespecimens were coated with asphalt binder by immersing aggregates in liquid asphalt for 45 seconds,and then hanged at room temperature for 15 mins to remove extra free binder. Then the specimenswere boiled in water for 6 mins.
After boiling, the test specimens were visually classified based on the following criteria:Level 1: The asphalt film is completely moved by water. The removed asphalt binder is floating
on water surface, and the aggregate is barely covered.
80
Materials 2019, 12, 605
Level 2: Most of asphalt film is moved by water. The area of exposed aggregate is more than 30%of the total surface area of the specimen.
Level 3: The asphalt film can be moved by water, but most of the asphalt binder is preserved onthe surface of the aggregate. The area of exposed aggregate is less than 30% of the total surface area ofthe specimen.
Level 4: The asphalt film is barely moved by water, but the thickness of asphalt binder is uneven.The area of exposed aggregate is less than 10% of the total surface area of the specimen.
Level 5: The asphalt film is intact, and the area of exposed aggregate is close to 0% of the totalsurface area of the specimen.
The conventional test results showed that the lixivium treatment can increased the adhesionbonding of different types of aggregates by increasing the rating at least one level, as shown in Figure 4.For the #90 asphalt, the adhesion performance of asphalt-limestone and asphalt-basic rock were similar,but the asphalt-granite interface showed less adhesion bonding. For the #110 asphalt, basic rockshowed the best anti-stripping performance as compared to granite and limestone. In general, basicrock and limestone have better anti-stripping performance as compared to granite. It is inconclusiveon the effect of asphalt type on adhesion performance due to the unknown information on chemicalcomponents of asphalt and the complex nature of asphalt-aggregate adhesion. Regardless of the asphaltor aggregate type, the effectiveness of lixivium treatment on anti-stripping was found significant. Theimprovement in asphalt-aggregate adhesion can also be visually observed with the appearance ofaggregate after the stripping test, as shown in Figure 5.
(a) (b)
Figure 4. Asphalt-aggregate adhesion level based on stripping test: (a) #90 asphalt and (b) #110 asphalt(samples without treated were marked as control group, while the ones soaked with plant ash lixiviumwere marked as experimental group).
(a) (b) (c) (d)
Figure 5. Visual observation of granite aggregates after stripping test: (a) #90 asphalt (control); (b) #90asphalt (treated); (c) #110 asphalt (control); and (d) #110 asphalt (treated).
81
Materials 2019, 12, 605
It is noted that the conventional stripping test results determined using the five-level criteria areinfluenced by subjective ranking and test procedure. The conventional stripping test does not providefurther comparisons between the asphalt-aggregate interfaces having the same peeling-off grade.
3.2. Modified Stripping Test with Image Analysis
3.2.1. Adhesion Ratio and Asphalt Film Thickness
The conventional stripping test was modified by using image analysis to quantitatively analyzetest results. The conventional stripping test requires that the aggregate size should be between13.2 mm and 19 mm. In the modified stripping test, the asphalt binder was coated on the surfaceof flat rectangular specimens that were cut from larger aggregates. The surface areas of rectangularspecimens were found to be close to those of the spheres with approximately 18.5-mm diameter. Theranges of surface areas and the calculated equivalent sphere diameters of aggregates are shown inTable 3.
Table 3. The surface area and equivalent particle size of used rectangular aggregates.
AggregateCalculated Surface Area/mm2 Equivalent Sphere Diameter/mm
Min Max Average
Granite 976.37 1172.78 18.48
Basic rock 965.66 1145.95 18.32
Limestone 1032.01 1168.71 18.71
To evaluate the specimens, two parameters were defined responding to two situations. For thespecimens with aggregate surface exposure after boiling process, the adhesion ratio was defined asthe ratio of the non-exposed area in the specimen surface to its total surface area, which could bedetermined using image analysis. For the specimens without aggregate surface exposure after boilingprocess, the thickness of asphalt film was used to evaluate the adhesion performance.
Figure 6 shows the appearances of testing specimens after the stripping test. It was found thatmore asphalt film was peeled off from the control specimens as compared to the treated specimens.To quantify the adhesion performance, photos were taken on the front and back surfaces afterthe stripping test. A series of image processing techniques, including contrast enhancement andthresholding, were performed to convert the original photos to binary images, as shown in Figure 7.
(a) (b) (c) (d) (e) (f)
Figure 6. The specimens after modified stripping test: (a–c) control specimens with granite, basic rock,and limestone and (d–f) treated specimens with granite, basic rock, and limestone.
82
Materials 2019, 12, 605
Figure 7. The image processing of test specimens with #110 asphalt and granite aggregate: (a) originalimage and (b) binary image.
Based on the binary images, the surface areas of asphalt binder (black) and the exposed area ofaggregate specimen (white) can be determined. Therefore, the adhesion ratio was calculated usingEquations (1) and (2).
ηs =
n∑
i−1ηi
n(1)
ηi =Xb
Xw + Xb(2)
where ηs is the adhesion ratio (opposite to peeling off ratio); ηi is the adhesion ratio of surface i of thespecimen; n is the total number of surfaces of the specimen (n = 2 for the specimens); and Xw and Xbare the total number of white and black pixels in the binary image, respectively.
For the specimen without asphalt film peeling off, the average thickness of coated aggregate wasmeasured by the caliper and glass slides, as show in Figure 8. The glass slides were slightly compresseduntil the asphalt film contacted with the glass slides completely. The asphalt film thickness (δ) onspecimen could be calculated using Equation (3).
δ =δa − δs − (δg1 + δg2)
2(3)
where δa is the total thickness of specimen with glass slides (mm); δs is the thickness of the specimenwithout asphalt film (mm); and δg1 and δg2 are the thickness of the glass slides (mm).
Figure 8. Schematic of asphalt film thickness measurement.
3.2.2. Adhesion Performance Results
The test results show that the specimens with granite showed exposed aggregate surface afterboiling process, while the specimens with basic rock and limestone were still fully covered by asphaltfilm. The image analysis results of the granite aggregate specimen with different asphalt binders arepresented in Figure 9. The adhesion and stripping ratios clearly showed that the treatment usingplant ash lixivium improved adhesion performance significantly for both #90 and #110 asphalt binder.
83
Materials 2019, 12, 605
For instance, the stripping ratio of granite-asphalt (#90) was reduced from 27.95% to 2.67%. At thesame time, the stripping ratio of granite-asphalt (#110) changed from 32.89% to 2.74%.
(a) (b)
(c) (d)
Figure 9. The adhesion and stripping ratios of granite specimen after modified stripping test: (a)control specimen with #90 asphalt; (b) treated specimen with #90 asphalt; (c) control specimen with#100 asphalt; and (d) treated specimen with #110 asphalt.
For specimens with basic rock and limestone, the conventional stripping test cannot comparethe effects of treatment for basic rock and limestone specimens, because they both ranked at level 5.Hence, the modified stripping was developed providing quantitative index for adhesion performanceevaluation in this case. In the modified stripping test, the thicknesses of asphalt film before and afterthe boiling process could be calculated. Table 4 presents the asphalt film thickness and the relativeimprovement for basic rock and limestone treated with plant ash lixivium, respectively. In general, thetreatment of plant ash lixivium increased asphalt film thickness on aggregate surface after boiling. Thetreatment showed relatively higher effectiveness for the #110 asphalt in terms of the increasing ratio ofasphalt film thickness. However, no consistent trend was observed for comparing the effectiveness oftreatment on adhesion performance between basic rock and limestone. This is probably due to thecomplex mineral compositions of aggregates.
Table 4. The measured asphalt film thickness on aggregates and relative improvement.
Material
Average Thickness of Asphalt Film (mm)
#90 Asphalt #110 Asphalt
ControlTreated
SpecimenImprovement
RatioControl
TreatedSpecimen
ImprovementRatio
Basic Rock 0.22 0.32 45.5% 0.18 0.30 66.7%
Limestone 0.20 0.30 50.0% 0.16 0.26 62.5%
84
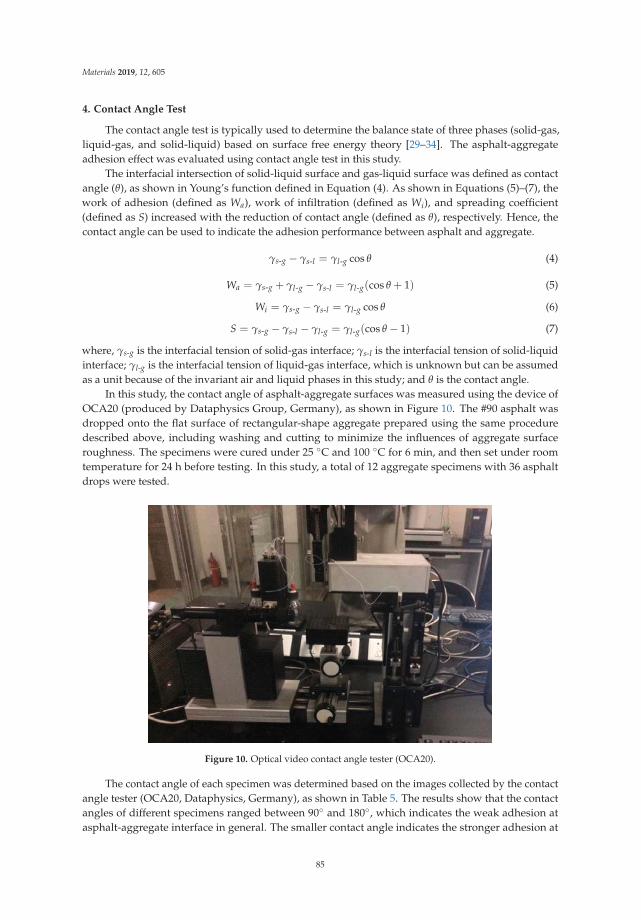
Materials 2019, 12, 605
4. Contact Angle Test
The contact angle test is typically used to determine the balance state of three phases (solid-gas,liquid-gas, and solid-liquid) based on surface free energy theory [29–34]. The asphalt-aggregateadhesion effect was evaluated using contact angle test in this study.
The interfacial intersection of solid-liquid surface and gas-liquid surface was defined as contactangle (θ), as shown in Young’s function defined in Equation (4). As shown in Equations (5)–(7), thework of adhesion (defined as Wa), work of infiltration (defined as Wi), and spreading coefficient(defined as S) increased with the reduction of contact angle (defined as θ), respectively. Hence, thecontact angle can be used to indicate the adhesion performance between asphalt and aggregate.
γs-g − γs-l = γl-g cos θ (4)
Wa = γs-g + γl-g − γs-l = γl-g(cos θ + 1) (5)
Wi = γs-g − γs-l = γl-g cos θ (6)
S = γs-g − γs-l − γl-g = γl-g(cos θ − 1) (7)
where, γs-g is the interfacial tension of solid-gas interface; γs-l is the interfacial tension of solid-liquidinterface; γl-g is the interfacial tension of liquid-gas interface, which is unknown but can be assumedas a unit because of the invariant air and liquid phases in this study; and θ is the contact angle.
In this study, the contact angle of asphalt-aggregate surfaces was measured using the device ofOCA20 (produced by Dataphysics Group, Germany), as shown in Figure 10. The #90 asphalt wasdropped onto the flat surface of rectangular-shape aggregate prepared using the same proceduredescribed above, including washing and cutting to minimize the influences of aggregate surfaceroughness. The specimens were cured under 25 ◦C and 100 ◦C for 6 min, and then set under roomtemperature for 24 h before testing. In this study, a total of 12 aggregate specimens with 36 asphaltdrops were tested.
Figure 10. Optical video contact angle tester (OCA20).
The contact angle of each specimen was determined based on the images collected by the contactangle tester (OCA20, Dataphysics, Germany), as shown in Table 5. The results show that the contactangles of different specimens ranged between 90◦ and 180◦, which indicates the weak adhesion atasphalt-aggregate interface in general. The smaller contact angle indicates the stronger adhesion at
85
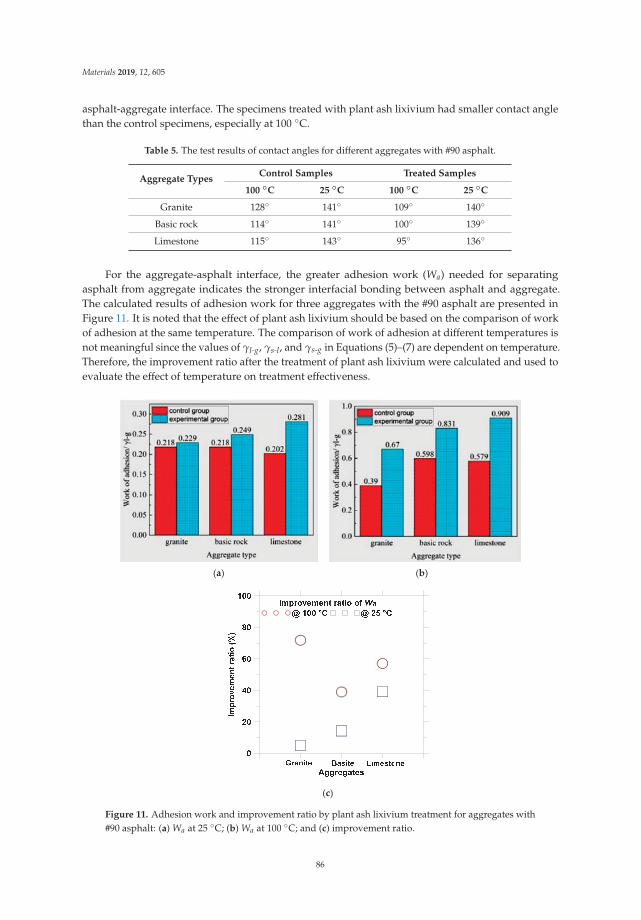
Materials 2019, 12, 605
asphalt-aggregate interface. The specimens treated with plant ash lixivium had smaller contact anglethan the control specimens, especially at 100 ◦C.
Table 5. The test results of contact angles for different aggregates with #90 asphalt.
Aggregate TypesControl Samples Treated Samples
100 ◦C 25 ◦C 100 ◦C 25 ◦C
Granite 128◦ 141◦ 109◦ 140◦
Basic rock 114◦ 141◦ 100◦ 139◦
Limestone 115◦ 143◦ 95◦ 136◦
For the aggregate-asphalt interface, the greater adhesion work (Wa) needed for separatingasphalt from aggregate indicates the stronger interfacial bonding between asphalt and aggregate.The calculated results of adhesion work for three aggregates with the #90 asphalt are presented inFigure 11. It is noted that the effect of plant ash lixivium should be based on the comparison of workof adhesion at the same temperature. The comparison of work of adhesion at different temperatures isnot meaningful since the values of γl-g, γs-l, and γs-g in Equations (5)–(7) are dependent on temperature.Therefore, the improvement ratio after the treatment of plant ash lixivium were calculated and used toevaluate the effect of temperature on treatment effectiveness.
(a) (b)
(c)
Figure 11. Adhesion work and improvement ratio by plant ash lixivium treatment for aggregates with#90 asphalt: (a) Wa at 25 ◦C; (b) Wa at 100 ◦C; and (c) improvement ratio.
86
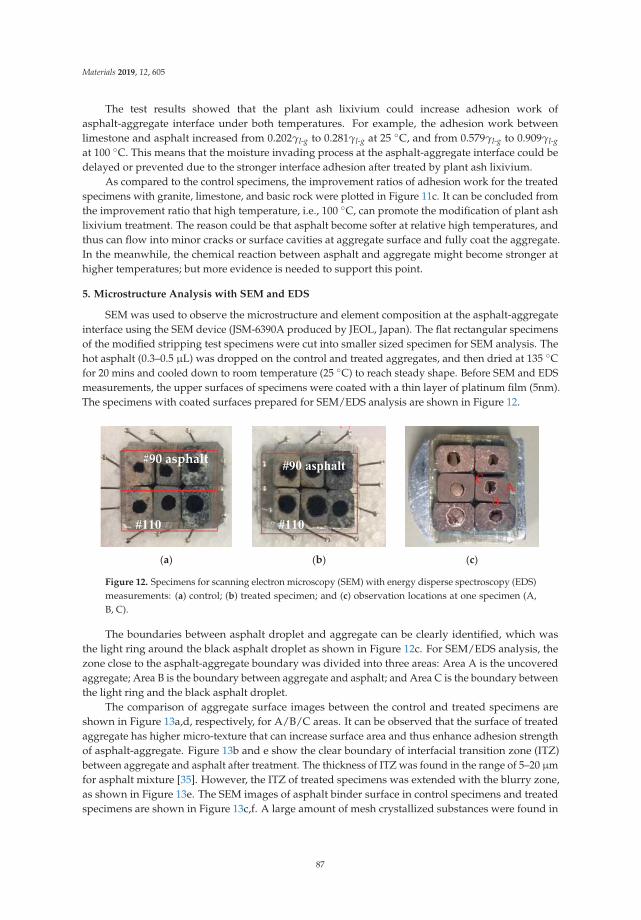
Materials 2019, 12, 605
The test results showed that the plant ash lixivium could increase adhesion work ofasphalt-aggregate interface under both temperatures. For example, the adhesion work betweenlimestone and asphalt increased from 0.202γl-g to 0.281γl-g at 25 ◦C, and from 0.579γl-g to 0.909γl-gat 100 ◦C. This means that the moisture invading process at the asphalt-aggregate interface could bedelayed or prevented due to the stronger interface adhesion after treated by plant ash lixivium.
As compared to the control specimens, the improvement ratios of adhesion work for the treatedspecimens with granite, limestone, and basic rock were plotted in Figure 11c. It can be concluded fromthe improvement ratio that high temperature, i.e., 100 ◦C, can promote the modification of plant ashlixivium treatment. The reason could be that asphalt become softer at relative high temperatures, andthus can flow into minor cracks or surface cavities at aggregate surface and fully coat the aggregate.In the meanwhile, the chemical reaction between asphalt and aggregate might become stronger athigher temperatures; but more evidence is needed to support this point.
5. Microstructure Analysis with SEM and EDS
SEM was used to observe the microstructure and element composition at the asphalt-aggregateinterface using the SEM device (JSM-6390A produced by JEOL, Japan). The flat rectangular specimensof the modified stripping test specimens were cut into smaller sized specimen for SEM analysis. Thehot asphalt (0.3–0.5 μL) was dropped on the control and treated aggregates, and then dried at 135 ◦Cfor 20 mins and cooled down to room temperature (25 ◦C) to reach steady shape. Before SEM and EDSmeasurements, the upper surfaces of specimens were coated with a thin layer of platinum film (5nm).The specimens with coated surfaces prepared for SEM/EDS analysis are shown in Figure 12.
(a) (b) (c)
#90 asphalt
Figure 12. Specimens for scanning electron microscopy (SEM) with energy disperse spectroscopy (EDS)measurements: (a) control; (b) treated specimen; and (c) observation locations at one specimen (A,B, C).
The boundaries between asphalt droplet and aggregate can be clearly identified, which wasthe light ring around the black asphalt droplet as shown in Figure 12c. For SEM/EDS analysis, thezone close to the asphalt-aggregate boundary was divided into three areas: Area A is the uncoveredaggregate; Area B is the boundary between aggregate and asphalt; and Area C is the boundary betweenthe light ring and the black asphalt droplet.
The comparison of aggregate surface images between the control and treated specimens areshown in Figure 13a,d, respectively, for A/B/C areas. It can be observed that the surface of treatedaggregate has higher micro-texture that can increase surface area and thus enhance adhesion strengthof asphalt-aggregate. Figure 13b and e show the clear boundary of interfacial transition zone (ITZ)between aggregate and asphalt after treatment. The thickness of ITZ was found in the range of 5–20 μmfor asphalt mixture [35]. However, the ITZ of treated specimens was extended with the blurry zone,as shown in Figure 13e. The SEM images of asphalt binder surface in control specimens and treatedspecimens are shown in Figure 13c,f. A large amount of mesh crystallized substances were found in
87
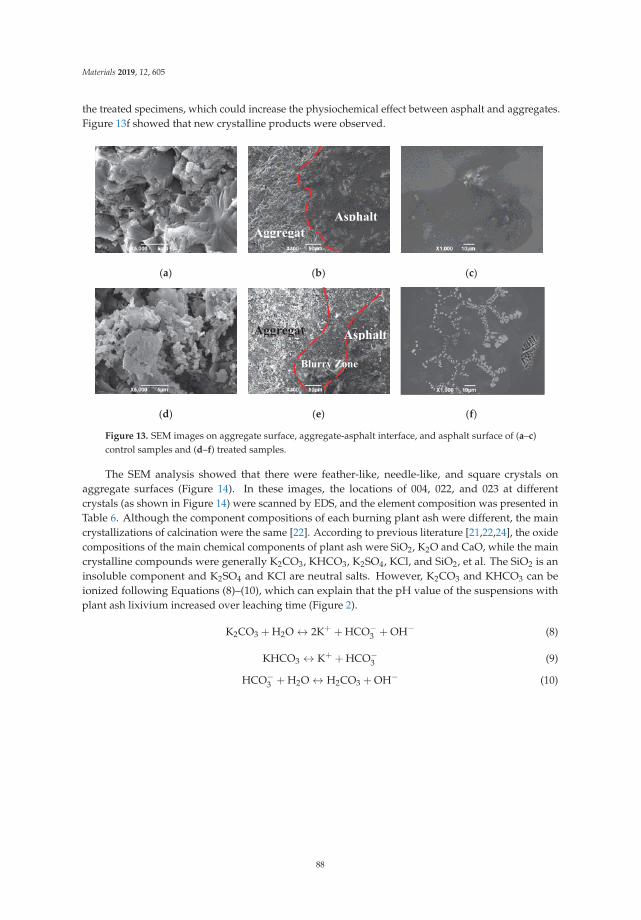
Materials 2019, 12, 605
the treated specimens, which could increase the physiochemical effect between asphalt and aggregates.Figure 13f showed that new crystalline products were observed.
(a) (b) (c)
(d) (e) (f)
Figure 13. SEM images on aggregate surface, aggregate-asphalt interface, and asphalt surface of (a–c)control samples and (d–f) treated samples.
The SEM analysis showed that there were feather-like, needle-like, and square crystals onaggregate surfaces (Figure 14). In these images, the locations of 004, 022, and 023 at differentcrystals (as shown in Figure 14) were scanned by EDS, and the element composition was presented inTable 6. Although the component compositions of each burning plant ash were different, the maincrystallizations of calcination were the same [22]. According to previous literature [21,22,24], the oxidecompositions of the main chemical components of plant ash were SiO2, K2O and CaO, while the maincrystalline compounds were generally K2CO3, KHCO3, K2SO4, KCl, and SiO2, et al. The SiO2 is aninsoluble component and K2SO4 and KCl are neutral salts. However, K2CO3 and KHCO3 can beionized following Equations (8)–(10), which can explain that the pH value of the suspensions withplant ash lixivium increased over leaching time (Figure 2).
K2CO3 + H2O ↔ 2K+ + HCO−3 + OH− (8)
KHCO3 ↔ K+ + HCO−3 (9)
HCO−3 + H2O ↔ H2CO3 + OH− (10)
88
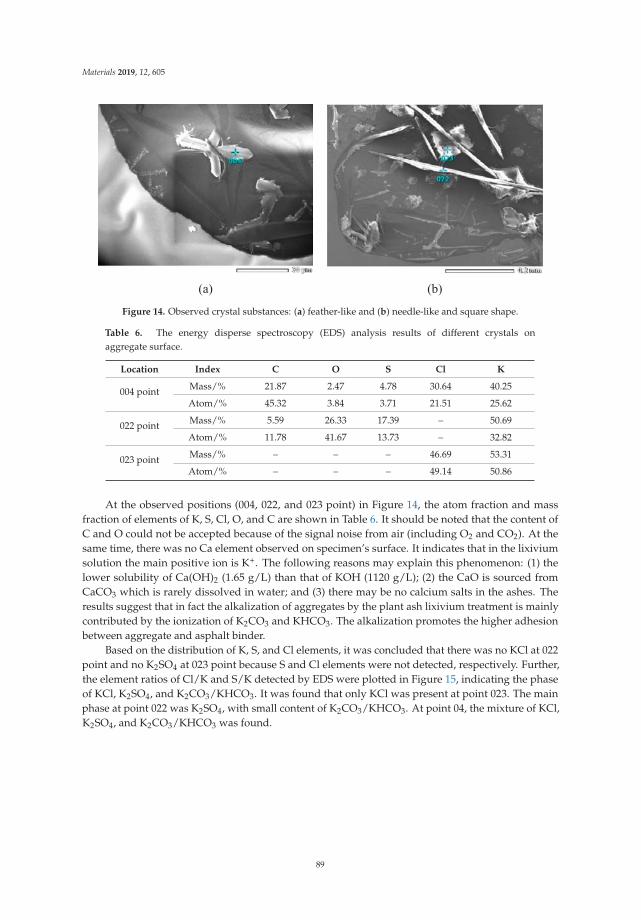
Materials 2019, 12, 605
Figure 14. Observed crystal substances: (a) feather-like and (b) needle-like and square shape.
Table 6. The energy disperse spectroscopy (EDS) analysis results of different crystals onaggregate surface.
Location Index C O S Cl K
004 point Mass/% 21.87 2.47 4.78 30.64 40.25
Atom/% 45.32 3.84 3.71 21.51 25.62
022 point Mass/% 5.59 26.33 17.39 – 50.69
Atom/% 11.78 41.67 13.73 – 32.82
023 point Mass/% – – – 46.69 53.31
Atom/% – – – 49.14 50.86
At the observed positions (004, 022, and 023 point) in Figure 14, the atom fraction and massfraction of elements of K, S, Cl, O, and C are shown in Table 6. It should be noted that the content ofC and O could not be accepted because of the signal noise from air (including O2 and CO2). At thesame time, there was no Ca element observed on specimen’s surface. It indicates that in the lixiviumsolution the main positive ion is K+. The following reasons may explain this phenomenon: (1) thelower solubility of Ca(OH)2 (1.65 g/L) than that of KOH (1120 g/L); (2) the CaO is sourced fromCaCO3 which is rarely dissolved in water; and (3) there may be no calcium salts in the ashes. Theresults suggest that in fact the alkalization of aggregates by the plant ash lixivium treatment is mainlycontributed by the ionization of K2CO3 and KHCO3. The alkalization promotes the higher adhesionbetween aggregate and asphalt binder.
Based on the distribution of K, S, and Cl elements, it was concluded that there was no KCl at 022point and no K2SO4 at 023 point because S and Cl elements were not detected, respectively. Further,the element ratios of Cl/K and S/K detected by EDS were plotted in Figure 15, indicating the phaseof KCl, K2SO4, and K2CO3/KHCO3. It was found that only KCl was present at point 023. The mainphase at point 022 was K2SO4, with small content of K2CO3/KHCO3. At point 04, the mixture of KCl,K2SO4, and K2CO3/KHCO3 was found.
89
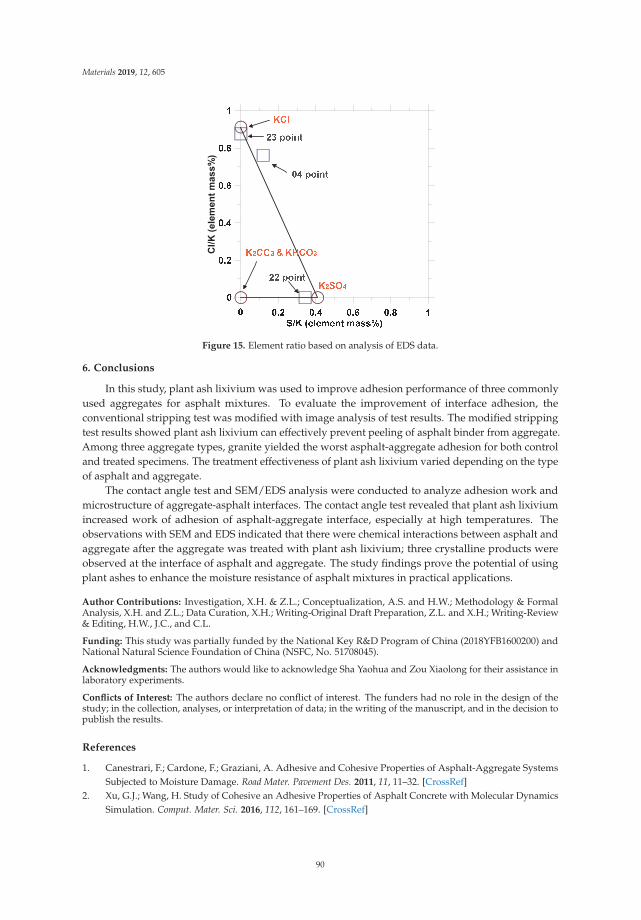
Materials 2019, 12, 605
Figure 15. Element ratio based on analysis of EDS data.
6. Conclusions
In this study, plant ash lixivium was used to improve adhesion performance of three commonlyused aggregates for asphalt mixtures. To evaluate the improvement of interface adhesion, theconventional stripping test was modified with image analysis of test results. The modified strippingtest results showed plant ash lixivium can effectively prevent peeling of asphalt binder from aggregate.Among three aggregate types, granite yielded the worst asphalt-aggregate adhesion for both controland treated specimens. The treatment effectiveness of plant ash lixivium varied depending on the typeof asphalt and aggregate.
The contact angle test and SEM/EDS analysis were conducted to analyze adhesion work andmicrostructure of aggregate-asphalt interfaces. The contact angle test revealed that plant ash lixiviumincreased work of adhesion of asphalt-aggregate interface, especially at high temperatures. Theobservations with SEM and EDS indicated that there were chemical interactions between asphalt andaggregate after the aggregate was treated with plant ash lixivium; three crystalline products wereobserved at the interface of asphalt and aggregate. The study findings prove the potential of usingplant ashes to enhance the moisture resistance of asphalt mixtures in practical applications.
Author Contributions: Investigation, X.H. & Z.L.; Conceptualization, A.S. and H.W.; Methodology & FormalAnalysis, X.H. and Z.L.; Data Curation, X.H.; Writing-Original Draft Preparation, Z.L. and X.H.; Writing-Review& Editing, H.W., J.C., and C.L.
Funding: This study was partially funded by the National Key R&D Program of China (2018YFB1600200) andNational Natural Science Foundation of China (NSFC, No. 51708045).
Acknowledgments: The authors would like to acknowledge Sha Yaohua and Zou Xiaolong for their assistance inlaboratory experiments.
Conflicts of Interest: The authors declare no conflict of interest. The funders had no role in the design of thestudy; in the collection, analyses, or interpretation of data; in the writing of the manuscript, and in the decision topublish the results.
References
1. Canestrari, F.; Cardone, F.; Graziani, A. Adhesive and Cohesive Properties of Asphalt-Aggregate SystemsSubjected to Moisture Damage. Road Mater. Pavement Des. 2011, 11, 11–32. [CrossRef]
2. Xu, G.J.; Wang, H. Study of Cohesive an Adhesive Properties of Asphalt Concrete with Molecular DynamicsSimulation. Comput. Mater. Sci. 2016, 112, 161–169. [CrossRef]
90
Materials 2019, 12, 605
3. Wang, H.; Lin, E.Q.; Xu, G.J. Molecular Dynamics Simulation of Asphalt-Aggregate Adhesion Strength withMoisture Effect. Int. J. Pavement Eng. 2017, 18, 414–423. [CrossRef]
4. Moraes, R.; Velasquez, R.; Bahia, H.U. Measuring the Effect of Moisture on Asphalt-Aggregate Bond withthe Bitumen Bond Strength Test. Transp. Res. Rec. 2011, 2209, 70–81. [CrossRef]
5. Faramarzi, M.; Golestani, B.; Lee, K.W. Improving moisture sensitivity and mechanical properties of sulfurextended asphalt mixture by nano-antistripping agent. Constr. Build. Mater. 2017, 133, 534–542. [CrossRef]
6. Mo, L.T.; Huurman, M.; Woldekidan, M.F. Investigation into material optimization and development forimproved ravelling resistant porous asphalt concrete. Mater. Des. 2010, 31, 3194–3206. [CrossRef]
7. Xu, T.; Wang, H.; Li, Z.D.; Zhao, Y.L. Evaluation of Permanent Deformation of Asphalt Mixtures UsingDifferent Laboratory Performance Tests. Constr. Build. Mater. 2014, 53, 561–567. [CrossRef]
8. Xu, G.J.; Wang, H. Molecular Dynamics Study of Interfacial Mechanical Behavior between Asphalt Binderand Mineral Aggregate. Constr. Build. Mater. 2016, 121, 246–254. [CrossRef]
9. Yi, J.Y.; Pang, X.Y.; Feng, D.C.; Pei, Z.S.; Xu, M.; Xie, S.N.; Huang, Y.D. Studies on surface energy of asphaltand aggregate at different scales and bonding property of asphalt-aggregate system. Road Mater. PavementDes. 2018, 19, 1102–1125. [CrossRef]
10. Bhasin, A.; Little, D.N.; Vasconcelos, K.L.; Masad, E.A. Surface Free Energy to Identify Moisture Sensitivityof Materials for Asphalt Mixes. J. Transp. Res. Board 2007, 2001, 37–45. [CrossRef]
11. Nejad, F.M.; Azarhoosh, A.R.; Hamedi, G.H. Influence of using nonmaterial to reduce the moisturesusceptibility of hot mix asphalt. Constr. Build. Mater. 2012, 31, 384–388. [CrossRef]
12. Arabani, M.; Roshani, H.; Hamedi, G.H. Estimating Moisture Sensitivity of Warm Mix Asphalt Modifiedwith Zycosoil as an Antistrip Agent Using Surface Free Energy Method. J. Mater. Civil Eng. 2012, 24, 889–897.[CrossRef]
13. Yusoff, N.I.; Breem, A.A.; Alattug, H.N. The effects of moisture susceptibility and ageing conditions onnano-silica/polymer-modified asphalt mixtures. Constr. Build. Mater. 2014, 72, 139–147. [CrossRef]
14. Gorkem, C.; Sengoz, B. Predicting stripping and moisture induced damage of asphalt concrete preparedwith polymer modified bitumen and hydrated lime. Constr. Build. Mater. 2009, 23, 2227–2236. [CrossRef]
15. Nejad, F.M.; Aghajani, P.; Modarres, A. Investigating the properties of crumb rubber modified bitumen usingclassic and SHRP testing methods. Constr. Building Mater. 2012, 26, 481–489. [CrossRef]
16. Moreno, F.; Rubio, M.C. Effect of aggregate nature on the fatigue-cracking behavior of asphalt mixes. Mater.Des. 2013, 47, 61–67. [CrossRef]
17. Lesueur, D.; Petit, J.; Ritter, H. The mechanisms of hydrated lime modification of asphalt mixtures:A state-of-the-art review. Road Mater. Pavement Des. 2013, 14, 1–16. [CrossRef]
18. Han, Z.; Sha, A.; Tong, Z.; Liu, Z.; Gao, J.; Zou, X.; Yuan, D. Study on the optimum rice husk ash contentadded in asphalt binder and its modification with bio-oil. Constr. Build. Mater. 2017, 147, 776–789. [CrossRef]
19. Arabani, M.; Tahami, S.A. Assessment of mechanical properties of rice husk ash modified asphalt mixture.Constr. Build. Mater. 2017, 149, 350–358. [CrossRef]
20. Thompson, D.N.; Shaw, P.G.; Lacey, J.A. Post-harvest processing methods for reduction of silica and alkalimetals in wheat straw. Appl. Biochem. Biotechnol. 2003, 105, 205–218. [CrossRef]
21. Yao, X.W.; Xu, K.L.; Yan, F. The Influence of Ashing Temperature on Ash Fouling and Slagging Characteristicsduring Combustion of Biomass Fuels. Bioresources 2017, 12, 1593–1610. [CrossRef]
22. Xiao, R.R.; Chen, X.L.; Wang, F.C. The physicochemical properties of different biomass ashes at differentashing temperature. Acta Energ. Sol. Sin. 2011, 32, 364–369. [CrossRef]
23. Grau, F.; Choo, H.; Hu, J. Engineering Behavior and Characteristics of Wood Ash and Sugarcane BagasseAsh. Materials 2015, 8, 6962–6977. [CrossRef] [PubMed]
24. Thy, P.; Jenkins, B.M.; Grundvig, S. High temperature elemental losses and mineralogical changes in commonbiomass ashes. Fuel 2006, 85, 783–795. [CrossRef]
25. Guo, M.; Tan, Y.Q.; Zhou, S.W. Multiscale Test Research on Interfacial Adhesion Property of Cold MixAsphalt. Constr. Build. Mater. 2014, 68, 769–776. [CrossRef]
26. Kim, Y.; Pinto, I.; Park, S. Experimental evaluation of anti-stripping additives in bituminous mixtures throughmultiple scale laboratory test results. Constr. Build. Mater. 2012, 29, 386–393. [CrossRef]
27. Lantieri, C.; Lamperti, R.; Simone, A.; Vignali, V.; Sangiorgi, C.; Dondi, G.; Magnani, M. Use of image analysisfor the evaluation of rolling bottle tests results. Int. J. Pavement Res. Technol. 2017, 10, 45–53. [CrossRef]
91
Materials 2019, 12, 605
28. ASTM Standard D5/D5M. Standard Test Method for Penetration of Bituminous Materials; ASTM International:West Conshohocken, PA, USA, 2013.
29. ASTM Standard D36/D36M. Standard Test Method for Softening Point of Asphalt (Ring-and-Ball Apparatus);ASTM International: West Conshohocken, PA, USA, 2009.
30. ASTM D 113-99. Standard Test Method for ductility Test; ASTM International: West Conshohocken, PA, USA,2002.
31. Zhang, K.; Zhang, Z.Q. Quantitative evaluation of the adhesion between asphalt and aggregate. J. Hefei Univ.Technol. 2015, 6, 810–815.
32. Arabani, M.; Hamedi, G.H. Using the Surface Free Energy Method to Evaluate the Effects of PolymericAggregate Treatment on Moisture Damage in Hot-Mix Asphalt. J. Mater. Civil Eng. 2011, 23, 802–811.[CrossRef]
33. Rossi, C.O.; Caputo, P.; Baldino, N. Quantitative evaluation of organosilane-based adhesion promoter effecton bitumen-aggregate bond by contact angle test. Int. J. Adhes. Adhes. 2017, 72, 117–122. [CrossRef]
34. Ma, F.; Hao, J.X.; Fu, Z. Surface free energy analysis of asphalt modified with natural asphalt. J. Traffic Transp.Eng. 2015, 15, 18–24.
35. Zhu, X.Y.; Yuan, Y.; Li, L.H.; Du, Y.C.; Li, F. Identification of interfacial transition zone in asphalt concretebased on nano-scale metrology techniques. Mater. Des. 2017, 129, 91–102. [CrossRef]
© 2019 by the authors. Licensee MDPI, Basel, Switzerland. This article is an open accessarticle distributed under the terms and conditions of the Creative Commons Attribution(CC BY) license (http://creativecommons.org/licenses/by/4.0/).
92
materials
Article
Diffusibility Enhancement of Rejuvenator byEpoxidized Soybean Oil and Its Influence on thePerformance of Recycled Hot Mix Asphalt Mixtures
Dongliang Kuang 1, Yuan Jiao 1, Zhou Ye 1, Zaihong Lu 2, Huaxin Chen 1, Jianying Yu 3,*
and Ning Liu 4
1 School of Materials Science and Engineering, Chang’an University, Xi’an 710064, China;[email protected] (D.K.); [email protected] (Y.J.); [email protected] (Z.Y.);[email protected] (H.C.)
2 Inner Mongolia Transportation Design Institute Co., Ltd., Huhhot 010000, China; [email protected] State Key Laboratory of Silicate Materials for Architectures, Wuhan University of Technology,
Wuhan 430070, China4 Highway Researching and Designing Institute of Qinghai Province, Xining 810001, China; [email protected]* Correspondence: [email protected]; Tel.: +86-027-5973-5080
Received: 26 March 2018; Accepted: 16 May 2018; Published: 18 May 2018
Abstract: Epoxidized soybean oil (ESO) was employed as a novel penetrant cooperating with aconventional rejuvenator (CR) for the recycling of reclaimed asphalt pavement (RAP). The influence ofESO on the diffusibility and the regenerating effects of CR on RAP were investigated. The diffusibilitytesting result shows that the diffusibility of CR is enhanced by the addition of ESO because the epoxygroup in ESO can facilitate asphaltene dispersion due to its high polarity, which simultaneouslyreduces the viscosity and improves the fluidity of aged bitumen so as to allow diffusion of therejuvenator into the aged bitumen. Road performance testing of a recycled hot mix asphalt mixture(RHMA) indicates that the fatigue and cracking resistance properties as well as the water stability ofRHMA containing CR can be improved by the addition of ESO due to the diffusibility enhancementof CR, which boosts the regenerating effect of CR on aged bitumen in RAP. The fatigue and crackingresistance properties as well as the water stability of the recycled hot mix asphalt mixture containingCR with 7 wt % ESO approximate those of the hot mix asphalt mixture composed of the same virginaggregates and bitumen. Taking into account the rutting resistance decline versus the addition ofESO, the content of ESO should not exceed 7 wt % of the conventional rejuvenator.
Keywords: reclaimed asphalt pavement; recycling; epoxidized soybean oil; rejuvenator; diffusing
1. Introduction
In the recycling of reclaimed asphalt pavement (RAP), the RAP is blended with virgin aggregate,virgin bitumen as well as a rejuvenator to fabricate recycled hot mix asphalt (RHMA), which canconserve natural resources and reduce environmental pollution [1–3].
RAP usually has lower road performance due to the aging of bitumen [4–6]. A rejuvenator thatcan reconstitute the chemical component and colloidal structure of aged bitumen to regenerate itsperformance [7,8] is crucial for the recycling of RAP. In previous studies, it was reported that therejuvenator and aged bitumen were initially blended evenly, and then a series of testing, including thephysical properties, rheological properties and chemical components, was conducted on the blends toinvestigate the influence of the rejuvenator on aged bitumen; the results indicate that the aged bitumencan reach the target performance grade if the appropriate amount of the rejuvenator is determined andadded [9–12].
Materials 2018, 11, 833; doi:10.3390/ma11050833 www.mdpi.com/journal/materials93
Materials 2018, 11, 833
However, for the practical recycling process of RHMA, the rejuvenator is first sprinkled on thesurface of RAP and then blended with virgin aggregate as well as virgin bitumen [13]. The processingtime usually lasts 45 to 60 s, so it is impossible for the rejuvenator to be uniformly mixed withaged bitumen in RAP as well as added virgin bitumen [14]. Therefore, the regeneration of agedbitumen in RAP is essentially dependent on the diffusion of the rejuvenator [15]. Previous research hasrevealed that the hardness and viscosity of aged bitumen in RAP are higher than unaged bitumen [16],which decreases the movement of the bitumen molecule; therefore, the fluidity of aged bitumen ispoor, and the diffusion of the rejuvenator into aged bitumen is obstructed [17]. In order to enhance thediffusibility of the rejuvenator into aged bitumen, some attempts such as decreasing the viscosity ofthe rejuvenator and increasing the preheating temperature of RAP have been made [18]; nevertheless,the improvement was finite. Therefore, it is necessary to develop new methods to enhance thediffusibility of the rejuvenator.
As mentioned above, the high hardness and viscosity of the aged bitumen make the rejuvenatordiffusion into aged bitumen difficult, which can be ascribed to the high asphaltene content [19].Therefore, the diffusibility of the rejuvenator can be enhanced by simultaneously reducing theasphaltene content and by increasing the fluidity of the aged bitumen.
Epoxidized soybean oil (ESO), a kind of plasticizer, has been widely applied in the production ofplastic, rubber and paint due to good fluidity, penetrability and temperature stability [20]. Recently,ESO has been used for the modification of oxidized bitumen; the results indicate that ESO displaysgood compatibility with the oxidized bitumen due to the polar epoxy group in ESO [21] and canfacilitate asphaltene dispersion [22], which benefits the colloidal structure transformation of theoxidized bitumen from gel to sol-gel; therefore, the fluidity of oxidized bitumen can be enhanced andthe viscosity can be reduced [23].
In this paper, ESO was adopted as a novel penetrant with a conventional rejuvenator (CR),and these were applied together for the recycling of RAP. In addition, the effects of ESO on thediffusibility and regenerating effects of the conventional rejuvenator were investigated.
2. Materials and Methods
2.1. Materials
Bitumen, i.e., AH-70 paving bitumen, was supplied by China Offshore Bitumen Co., Ltd., Taizhou,China. The physical properties and chemical components of the bitumen are listed in Table 1.
CR was prepared in the laboratory, and its physical properties are shown in Table 2.ESO was supplied by Tongxiang Chemical Co., Ltd. In Tongxiang, China. The properties of ESO
are listed in Table 3.RAP was obtained from Jingzhu Expressway in Hubei Province, China. The bitumen and
aggregates in RAP were separated according to ASTM D2172 [24]. The asphalt-aggregate ratio of RAPwas 3.8 wt %, determined according to ASTM D6307 [25]. The properties and chemical componentsof the aged bitumen and the gradation of the aggregates in RAP are displayed by Tables 4 and 5,respectively. Virgin aggregates, limestone coarse aggregate with a maximum sieve size of 19 mm andfine aggregate were supplied by Beishan Stone Factory in Chibi, China.
94
Materials 2018, 11, 833
Table 1. Physical properties and chemical components of AH-70.
Items Value
Physical properties
Softening point (◦C) 47.2Ductility (15 ◦C, cm) >150
Penetration (25 ◦C, 0.1 mm) 70Viscosity (60 ◦C, Pa·s) 232
Chemical components
Saturates (%) 12.2Aromatics (%) 50.2
Resins (%) 26.1Asphaltenes (%) 11.5
Table 2. Properties of CR.
Physical Properties Items
Viscosity at 60 ◦C (cst) 1700Flash point (◦C) >220
Viscosity ratio before and after TFOT 2.5Weight loss after TFOT (%) −2.6
Saturates content (%) <30
Table 3. Properties of ESO.
Properties Value
Molecular 1000Viscosity (cps, 25 ◦C) 350
Acid value 0.45Iodine value (%) 4.0Flash point (◦C) 280Epoxy value (%) 6.1
Weight loss after heating (%) 0.08Specific gravity (25 ◦C) 0.982
Table 4. Physical properties and chemical components of aged bitumen.
Items Value
Physical properties
Softening point (◦C) 58.3Ductility (15 ◦C, cm) 9.6
Penetration (25 ◦C, 0.1 mm) 30Viscosity (60 ◦C, Pa·s) 410
Chemical components
Saturates (%) 11.2Aromatics (%) 31.3
Resins (%) 29.1Asphaltenes (%) 28.4
Table 5. Gradation of aggregates in RAP.
Sieve (mm) 19 16 13.2 9.5 4.75 2.36 1.18 0.6 0.3 0.15 0.075
Passing (%) 100 99.2 98.3 90.9 68.4 50.3 34.1 26 17.4 14.3 4.7
2.2. Design and Preparation of RHMA
In this paper, AC-20 was selected as the objective gradation for RHMA. The Marshall Designprocedure was used for the designing of RHMA of AC-20; the content of RAP was 30 wt %.
95
Materials 2018, 11, 833
The designed gradation is presented in Table 6. The optimum asphalt aggregate ratio of 4.2 wt % wasdetermined according to Marshall testing.
Table 6. Gradation of RHMA.
Sieve (mm) 19 16 13.2 9.5 4.75 2.36 1.18 0.6 0.3 0.15 0.075
Passing (%) 96.7 87.5 78.3 60.2 42.2 25.3 18.7 15.4 11.5 9.2 6.1
Preparation of RHMA: first, RAP was heated to 110 ◦C; then, the rejuvenator plus ESO heatedto 100 ◦C as well as virgin coarse aggregates heated to 180 ◦C were placed in a stirrer at 180 ◦C andblended for 10 s. Then, virgin bitumen heated to 150 ◦C was added and blended for 90 s; finally,mineral powder was added and continuously blended for 90 s.
For comparison, a virgin hot mix asphalt (VHMA) mixture of AC-20 composed of the same virginbitumen and virgin aggregates as RHMA was also prepared as the control sample; the optimumasphalt aggregate ratio was 3.8 wt %. The selected gradation is presented in Table 7. The performanceof VHMA is described in Table 8.
Table 7. Gradation of VHMA.
Sieve (mm) 19 16 13.2 9.5 4.75 2.36 1.18 0.6 0.3 0.15 0.075
Passing (%) 97.1 87.5 76.6 55.7 38.2 27.5 18.8 16.2 12.7 10.2 5.1
Table 8. Performance of VHMA.
Performance VHMA
Rutting resistance d60 (mm) 2.263DS (time/mm) 1300
Water stability MS0 (%) 89TSR (%) 83
Fatigue property
Nf at 0.2 P (times) 10,350Nf at 0.3 P (times) 7951Nf at 0.4 P (times) 4642Nf at 0.5 P (times) 3617
Crack resistanceFailure strength (MPa) 7.3
Failure strain (%) 2990Failure stiffness modulus (MPa) 2120
2.3. Diffusibility Testing Procedure of Rejuvenators
The diffusibility of the rejuvenators was tested according to the following procedure reported inprevious research [26]:
a. Aged bitumen heated to 140 ◦C was poured into penetration molds A and B, of which the innerdiameter and height were 55 mm and 35 mm, respectively, and was then placed in an ovenat a temperature of 110 ◦C for 30 min. Then, the rejuvenator heated to 110 ◦C was coated onthe surface of the aged bitumen and maintained in an oven at 110 ◦C for 10 min to ensure therejuvenator was uniformly scattered on the surface of the aged bitumen. The dosages of theaged bitumen and rejuvenator were 50 g and 5 g, respectively.
b. Mold B was placed in an oven at a different temperature for a certain time or constanttemperature for different times, and then continuously placed in an oven without power supplyfor 2.5–3 h, allowing the temperature to decrease to room temperature gradually to reduce theinfluence of interface contraction induced by a rapid decline in temperature on the flatness ofthe rejuvenator coat.
96
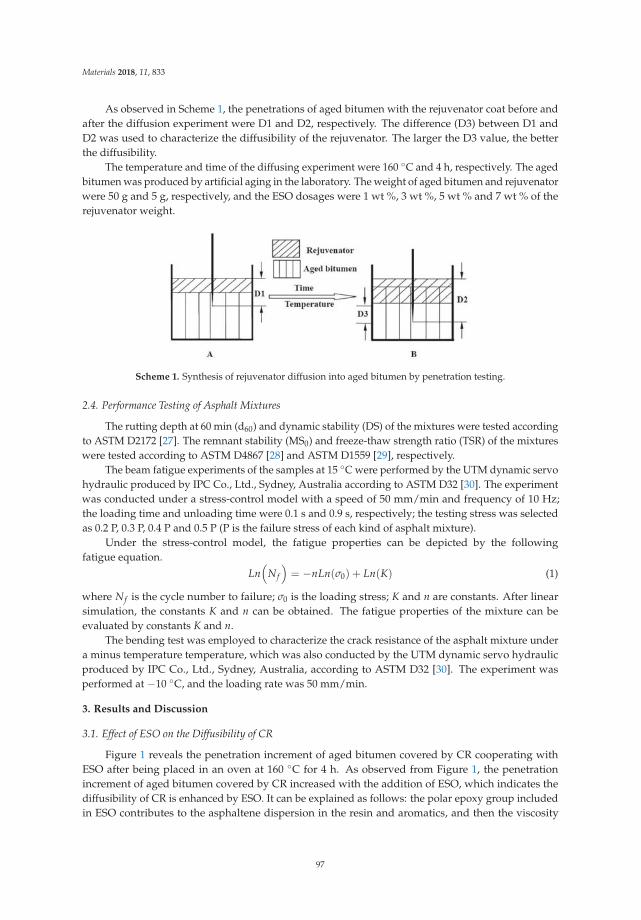
Materials 2018, 11, 833
As observed in Scheme 1, the penetrations of aged bitumen with the rejuvenator coat before andafter the diffusion experiment were D1 and D2, respectively. The difference (D3) between D1 andD2 was used to characterize the diffusibility of the rejuvenator. The larger the D3 value, the betterthe diffusibility.
The temperature and time of the diffusing experiment were 160 ◦C and 4 h, respectively. The agedbitumen was produced by artificial aging in the laboratory. The weight of aged bitumen and rejuvenatorwere 50 g and 5 g, respectively, and the ESO dosages were 1 wt %, 3 wt %, 5 wt % and 7 wt % of therejuvenator weight.
Scheme 1. Synthesis of rejuvenator diffusion into aged bitumen by penetration testing.
2.4. Performance Testing of Asphalt Mixtures
The rutting depth at 60 min (d60) and dynamic stability (DS) of the mixtures were tested accordingto ASTM D2172 [27]. The remnant stability (MS0) and freeze-thaw strength ratio (TSR) of the mixtureswere tested according to ASTM D4867 [28] and ASTM D1559 [29], respectively.
The beam fatigue experiments of the samples at 15 ◦C were performed by the UTM dynamic servohydraulic produced by IPC Co., Ltd., Sydney, Australia according to ASTM D32 [30]. The experimentwas conducted under a stress-control model with a speed of 50 mm/min and frequency of 10 Hz;the loading time and unloading time were 0.1 s and 0.9 s, respectively; the testing stress was selectedas 0.2 P, 0.3 P, 0.4 P and 0.5 P (P is the failure stress of each kind of asphalt mixture).
Under the stress-control model, the fatigue properties can be depicted by the followingfatigue equation.
Ln(
Nf
)= −nLn(σ0) + Ln(K) (1)
where Nf is the cycle number to failure; σ0 is the loading stress; K and n are constants. After linearsimulation, the constants K and n can be obtained. The fatigue properties of the mixture can beevaluated by constants K and n.
The bending test was employed to characterize the crack resistance of the asphalt mixture undera minus temperature temperature, which was also conducted by the UTM dynamic servo hydraulicproduced by IPC Co., Ltd., Sydney, Australia, according to ASTM D32 [30]. The experiment wasperformed at −10 ◦C, and the loading rate was 50 mm/min.
3. Results and Discussion
3.1. Effect of ESO on the Diffusibility of CR
Figure 1 reveals the penetration increment of aged bitumen covered by CR cooperating withESO after being placed in an oven at 160 ◦C for 4 h. As observed from Figure 1, the penetrationincrement of aged bitumen covered by CR increased with the addition of ESO, which indicates thediffusibility of CR is enhanced by ESO. It can be explained as follows: the polar epoxy group includedin ESO contributes to the asphaltene dispersion in the resin and aromatics, and then the viscosity
97
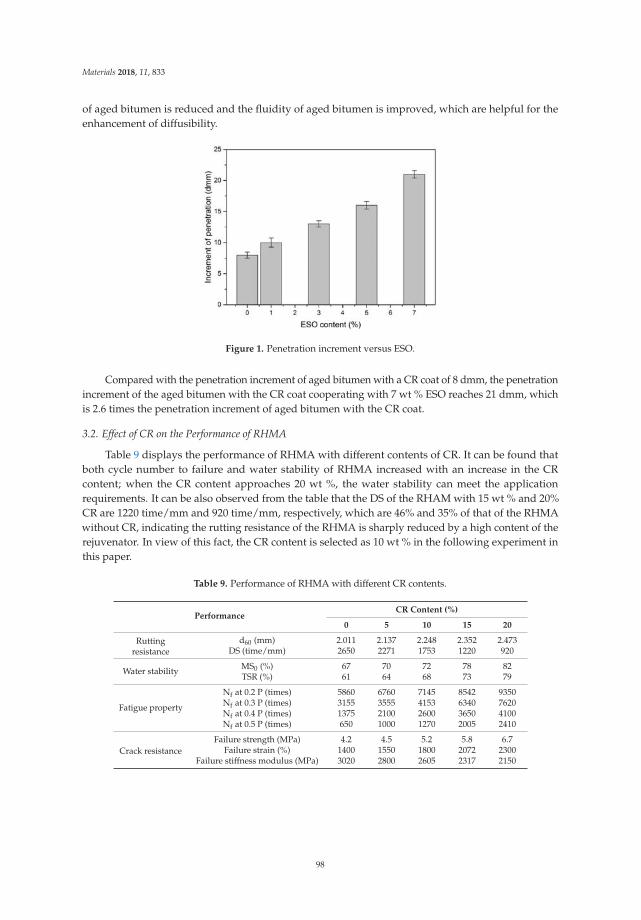
Materials 2018, 11, 833
of aged bitumen is reduced and the fluidity of aged bitumen is improved, which are helpful for theenhancement of diffusibility.
Figure 1. Penetration increment versus ESO.
Compared with the penetration increment of aged bitumen with a CR coat of 8 dmm, the penetrationincrement of the aged bitumen with the CR coat cooperating with 7 wt % ESO reaches 21 dmm, whichis 2.6 times the penetration increment of aged bitumen with the CR coat.
3.2. Effect of CR on the Performance of RHMA
Table 9 displays the performance of RHMA with different contents of CR. It can be found thatboth cycle number to failure and water stability of RHMA increased with an increase in the CRcontent; when the CR content approaches 20 wt %, the water stability can meet the applicationrequirements. It can be also observed from the table that the DS of the RHAM with 15 wt % and 20%CR are 1220 time/mm and 920 time/mm, respectively, which are 46% and 35% of that of the RHMAwithout CR, indicating the rutting resistance of the RHMA is sharply reduced by a high content of therejuvenator. In view of this fact, the CR content is selected as 10 wt % in the following experiment inthis paper.
Table 9. Performance of RHMA with different CR contents.
PerformanceCR Content (%)
0 5 10 15 20
Ruttingresistance
d60 (mm) 2.011 2.137 2.248 2.352 2.473DS (time/mm) 2650 2271 1753 1220 920
Water stability MS0 (%) 67 70 72 78 82TSR (%) 61 64 68 73 79
Fatigue property
Nf at 0.2 P (times) 5860 6760 7145 8542 9350Nf at 0.3 P (times) 3155 3555 4153 6340 7620Nf at 0.4 P (times) 1375 2100 2600 3650 4100Nf at 0.5 P (times) 650 1000 1270 2005 2410
Crack resistanceFailure strength (MPa) 4.2 4.5 5.2 5.8 6.7
Failure strain (%) 1400 1550 1800 2072 2300Failure stiffness modulus (MPa) 3020 2800 2605 2317 2150
98
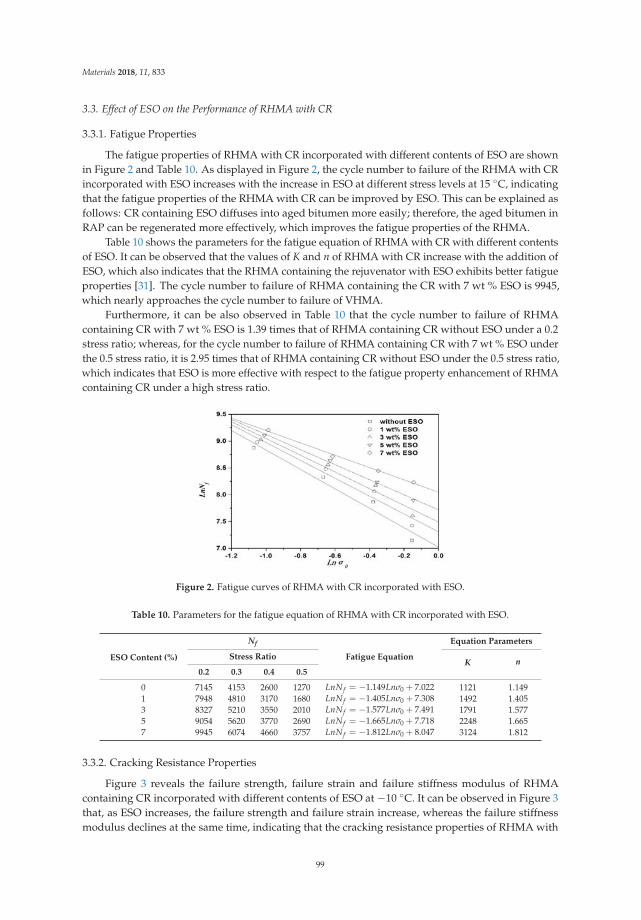
Materials 2018, 11, 833
3.3. Effect of ESO on the Performance of RHMA with CR
3.3.1. Fatigue Properties
The fatigue properties of RHMA with CR incorporated with different contents of ESO are shownin Figure 2 and Table 10. As displayed in Figure 2, the cycle number to failure of the RHMA with CRincorporated with ESO increases with the increase in ESO at different stress levels at 15 ◦C, indicatingthat the fatigue properties of the RHMA with CR can be improved by ESO. This can be explained asfollows: CR containing ESO diffuses into aged bitumen more easily; therefore, the aged bitumen inRAP can be regenerated more effectively, which improves the fatigue properties of the RHMA.
Table 10 shows the parameters for the fatigue equation of RHMA with CR with different contentsof ESO. It can be observed that the values of K and n of RHMA with CR increase with the addition ofESO, which also indicates that the RHMA containing the rejuvenator with ESO exhibits better fatigueproperties [31]. The cycle number to failure of RHMA containing the CR with 7 wt % ESO is 9945,which nearly approaches the cycle number to failure of VHMA.
Furthermore, it can be also observed in Table 10 that the cycle number to failure of RHMAcontaining CR with 7 wt % ESO is 1.39 times that of RHMA containing CR without ESO under a 0.2stress ratio; whereas, for the cycle number to failure of RHMA containing CR with 7 wt % ESO underthe 0.5 stress ratio, it is 2.95 times that of RHMA containing CR without ESO under the 0.5 stress ratio,which indicates that ESO is more effective with respect to the fatigue property enhancement of RHMAcontaining CR under a high stress ratio.
Figure 2. Fatigue curves of RHMA with CR incorporated with ESO.
Table 10. Parameters for the fatigue equation of RHMA with CR incorporated with ESO.
ESO Content (%)
Nf
Fatigue Equation
Equation Parameters
Stress RatioK n
0.2 0.3 0.4 0.5
0 7145 4153 2600 1270 LnNf = −1.149Lnσ0 + 7.022 1121 1.1491 7948 4810 3170 1680 LnNf = −1.405Lnσ0 + 7.308 1492 1.4053 8327 5210 3550 2010 LnNf = −1.577Lnσ0 + 7.491 1791 1.5775 9054 5620 3770 2690 LnNf = −1.665Lnσ0 + 7.718 2248 1.6657 9945 6074 4660 3757 LnNf = −1.812Lnσ0 + 8.047 3124 1.812
3.3.2. Cracking Resistance Properties
Figure 3 reveals the failure strength, failure strain and failure stiffness modulus of RHMAcontaining CR incorporated with different contents of ESO at −10 ◦C. It can be observed in Figure 3that, as ESO increases, the failure strength and failure strain increase, whereas the failure stiffnessmodulus declines at the same time, indicating that the cracking resistance properties of RHMA with
99
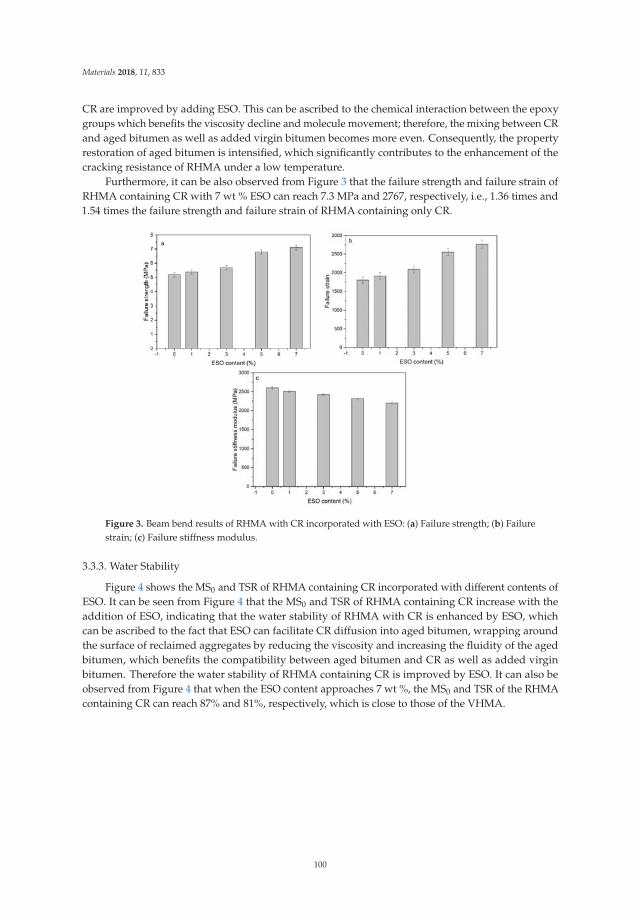
Materials 2018, 11, 833
CR are improved by adding ESO. This can be ascribed to the chemical interaction between the epoxygroups which benefits the viscosity decline and molecule movement; therefore, the mixing between CRand aged bitumen as well as added virgin bitumen becomes more even. Consequently, the propertyrestoration of aged bitumen is intensified, which significantly contributes to the enhancement of thecracking resistance of RHMA under a low temperature.
Furthermore, it can be also observed from Figure 3 that the failure strength and failure strain ofRHMA containing CR with 7 wt % ESO can reach 7.3 MPa and 2767, respectively, i.e., 1.36 times and1.54 times the failure strength and failure strain of RHMA containing only CR.
Figure 3. Beam bend results of RHMA with CR incorporated with ESO: (a) Failure strength; (b) Failurestrain; (c) Failure stiffness modulus.
3.3.3. Water Stability
Figure 4 shows the MS0 and TSR of RHMA containing CR incorporated with different contents ofESO. It can be seen from Figure 4 that the MS0 and TSR of RHMA containing CR increase with theaddition of ESO, indicating that the water stability of RHMA with CR is enhanced by ESO, whichcan be ascribed to the fact that ESO can facilitate CR diffusion into aged bitumen, wrapping aroundthe surface of reclaimed aggregates by reducing the viscosity and increasing the fluidity of the agedbitumen, which benefits the compatibility between aged bitumen and CR as well as added virginbitumen. Therefore the water stability of RHMA containing CR is improved by ESO. It can also beobserved from Figure 4 that when the ESO content approaches 7 wt %, the MS0 and TSR of the RHMAcontaining CR can reach 87% and 81%, respectively, which is close to those of the VHMA.
100
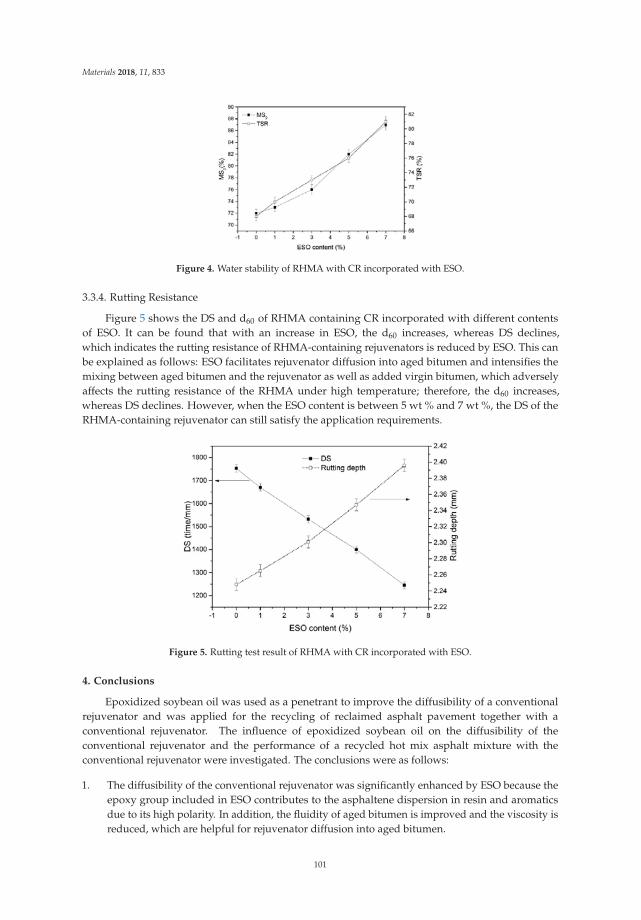
Materials 2018, 11, 833
Figure 4. Water stability of RHMA with CR incorporated with ESO.
3.3.4. Rutting Resistance
Figure 5 shows the DS and d60 of RHMA containing CR incorporated with different contentsof ESO. It can be found that with an increase in ESO, the d60 increases, whereas DS declines,which indicates the rutting resistance of RHMA-containing rejuvenators is reduced by ESO. This canbe explained as follows: ESO facilitates rejuvenator diffusion into aged bitumen and intensifies themixing between aged bitumen and the rejuvenator as well as added virgin bitumen, which adverselyaffects the rutting resistance of the RHMA under high temperature; therefore, the d60 increases,whereas DS declines. However, when the ESO content is between 5 wt % and 7 wt %, the DS of theRHMA-containing rejuvenator can still satisfy the application requirements.
Figure 5. Rutting test result of RHMA with CR incorporated with ESO.
4. Conclusions
Epoxidized soybean oil was used as a penetrant to improve the diffusibility of a conventionalrejuvenator and was applied for the recycling of reclaimed asphalt pavement together with aconventional rejuvenator. The influence of epoxidized soybean oil on the diffusibility of theconventional rejuvenator and the performance of a recycled hot mix asphalt mixture with theconventional rejuvenator were investigated. The conclusions were as follows:
1. The diffusibility of the conventional rejuvenator was significantly enhanced by ESO because theepoxy group included in ESO contributes to the asphaltene dispersion in resin and aromaticsdue to its high polarity. In addition, the fluidity of aged bitumen is improved and the viscosity isreduced, which are helpful for rejuvenator diffusion into aged bitumen.
101
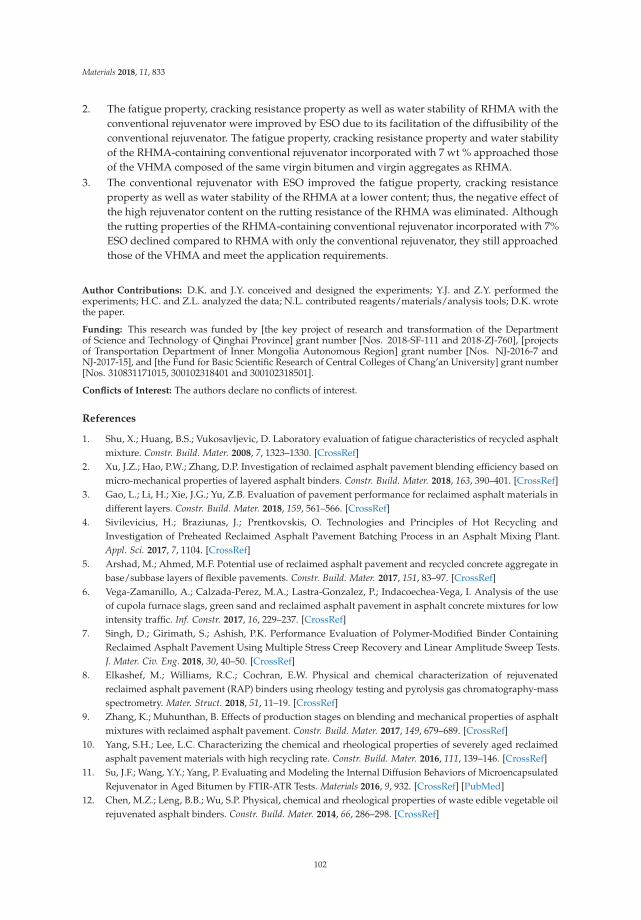
Materials 2018, 11, 833
2. The fatigue property, cracking resistance property as well as water stability of RHMA with theconventional rejuvenator were improved by ESO due to its facilitation of the diffusibility of theconventional rejuvenator. The fatigue property, cracking resistance property and water stabilityof the RHMA-containing conventional rejuvenator incorporated with 7 wt % approached thoseof the VHMA composed of the same virgin bitumen and virgin aggregates as RHMA.
3. The conventional rejuvenator with ESO improved the fatigue property, cracking resistanceproperty as well as water stability of the RHMA at a lower content; thus, the negative effect ofthe high rejuvenator content on the rutting resistance of the RHMA was eliminated. Althoughthe rutting properties of the RHMA-containing conventional rejuvenator incorporated with 7%ESO declined compared to RHMA with only the conventional rejuvenator, they still approachedthose of the VHMA and meet the application requirements.
Author Contributions: D.K. and J.Y. conceived and designed the experiments; Y.J. and Z.Y. performed theexperiments; H.C. and Z.L. analyzed the data; N.L. contributed reagents/materials/analysis tools; D.K. wrotethe paper.
Funding: This research was funded by [the key project of research and transformation of the Departmentof Science and Technology of Qinghai Province] grant number [Nos. 2018-SF-111 and 2018-ZJ-760], [projectsof Transportation Department of Inner Mongolia Autonomous Region] grant number [Nos. NJ-2016-7 andNJ-2017-15], and [the Fund for Basic Scientific Research of Central Colleges of Chang’an University] grant number[Nos. 310831171015, 300102318401 and 300102318501].
Conflicts of Interest: The authors declare no conflicts of interest.
References
1. Shu, X.; Huang, B.S.; Vukosavljevic, D. Laboratory evaluation of fatigue characteristics of recycled asphaltmixture. Constr. Build. Mater. 2008, 7, 1323–1330. [CrossRef]
2. Xu, J.Z.; Hao, P.W.; Zhang, D.P. Investigation of reclaimed asphalt pavement blending efficiency based onmicro-mechanical properties of layered asphalt binders. Constr. Build. Mater. 2018, 163, 390–401. [CrossRef]
3. Gao, L.; Li, H.; Xie, J.G.; Yu, Z.B. Evaluation of pavement performance for reclaimed asphalt materials indifferent layers. Constr. Build. Mater. 2018, 159, 561–566. [CrossRef]
4. Sivilevicius, H.; Braziunas, J.; Prentkovskis, O. Technologies and Principles of Hot Recycling andInvestigation of Preheated Reclaimed Asphalt Pavement Batching Process in an Asphalt Mixing Plant.Appl. Sci. 2017, 7, 1104. [CrossRef]
5. Arshad, M.; Ahmed, M.F. Potential use of reclaimed asphalt pavement and recycled concrete aggregate inbase/subbase layers of flexible pavements. Constr. Build. Mater. 2017, 151, 83–97. [CrossRef]
6. Vega-Zamanillo, A.; Calzada-Perez, M.A.; Lastra-Gonzalez, P.; Indacoechea-Vega, I. Analysis of the useof cupola furnace slags, green sand and reclaimed asphalt pavement in asphalt concrete mixtures for lowintensity traffic. Inf. Constr. 2017, 16, 229–237. [CrossRef]
7. Singh, D.; Girimath, S.; Ashish, P.K. Performance Evaluation of Polymer-Modified Binder ContainingReclaimed Asphalt Pavement Using Multiple Stress Creep Recovery and Linear Amplitude Sweep Tests.J. Mater. Civ. Eng. 2018, 30, 40–50. [CrossRef]
8. Elkashef, M.; Williams, R.C.; Cochran, E.W. Physical and chemical characterization of rejuvenatedreclaimed asphalt pavement (RAP) binders using rheology testing and pyrolysis gas chromatography-massspectrometry. Mater. Struct. 2018, 51, 11–19. [CrossRef]
9. Zhang, K.; Muhunthan, B. Effects of production stages on blending and mechanical properties of asphaltmixtures with reclaimed asphalt pavement. Constr. Build. Mater. 2017, 149, 679–689. [CrossRef]
10. Yang, S.H.; Lee, L.C. Characterizing the chemical and rheological properties of severely aged reclaimedasphalt pavement materials with high recycling rate. Constr. Build. Mater. 2016, 111, 139–146. [CrossRef]
11. Su, J.F.; Wang, Y.Y.; Yang, P. Evaluating and Modeling the Internal Diffusion Behaviors of MicroencapsulatedRejuvenator in Aged Bitumen by FTIR-ATR Tests. Materials 2016, 9, 932. [CrossRef] [PubMed]
12. Chen, M.Z.; Leng, B.B.; Wu, S.P. Physical, chemical and rheological properties of waste edible vegetable oilrejuvenated asphalt binders. Constr. Build. Mater. 2014, 66, 286–298. [CrossRef]
102
Materials 2018, 11, 833
13. Ma, T.; Huang, X.; Zhao, Y.; Zhang, Y. Influences of Preheating Temperature of RAP on Properties of Hot-MixRecycled Asphalt Mixture. J. Test. Eval. 2016, 26, 43–46. [CrossRef]
14. Vislavicius, K.; Sivilevicius, H. Effect of reclaimed asphalt pavement gradation variation on the homogeneityof recycled hot-mix asphalt. Arch. Civ. Mech. Eng. 2013, 13, 345–363. [CrossRef]
15. Ding, Y.J.; Huang, B.S.; Shu, X. Use of molecular dynamics to investigate diffusion between virgin and agedasphalt binders. Fuel 2016, 174, 267–273. [CrossRef]
16. Xiao, Y.; Li, C.; Wan, M. Study of the Diffusion of Rejuvenators and Its Effect on Aged Bitumen Binder.Appl. Sci. 2017, 7, 397. [CrossRef]
17. Mokhtari, A.; Lee, H.D.; Williams, R.C. A novel approach to evaluate fracture surfaces of aged andrejuvenator-restored asphalt using cryo-SEM and image analysis techniques. Constr. Build. Mater. 2017, 133,301–313. [CrossRef]
18. Anisimov, M.A.; Yudin, I.K.; Nikitin, V. Asphaltene Aggregation in Hydrocarbon Solutions Studied byPhoton Correlation Spectroscopy. J. Phys. Chem. 1995, 99, 9576–9580. [CrossRef]
19. Karlsson, R.; Isacsson, U. Application of FTIR-ATR to Characterization of Bitumen Rejuvenator Diffusion.J. Mater. Civ. Eng. 2003, 15, 157–165. [CrossRef]
20. Lee, S.; Park, M.S.; Shin, J. Effect of the individual and combined use of cardanol-based plasticizers andepoxidized soybean oil on the properties of PVC. Polym. Degrad. Stab. 2018, 147, 1–11. [CrossRef]
21. Calo, E.; Greco, A.; Maffezzoli, A. Effects of diffusion of a naturally-derived plasticizer from soft PVC.Polym. Degrad. Stab. 2011, 96, 784–789. [CrossRef]
22. Hashmi, S.M.; Firoozabadi, A. Self-assembly of resins and asphaltenes facilitates asphaltene dissolution byan organic acid. J. Colloid Interface Sci. 2013, 394, 115–123. [CrossRef] [PubMed]
23. Mangiafico, S.; Di Benedetto, H.; Sauzeat, C. Effect of colloidal structure of bituminous binder blends onlinear viscoelastic behaviour of mixtures containing Reclaimed Asphalt Pavement. Mater. Des. 2016, 111,126–139. [CrossRef]
24. ASTM D2172. Standard Test Methods for Quantitative Extraction of Asphalt Binder from Asphalt Mixtures;American Society for Testing Materials: West Conshohocken, PA, USA, 2001.
25. ASTM D6307. Standard Test Method for Asphalt Content of Asphalt Mixture by Ignition Method; American Societyfor Testing Materials: West Conshohocken, PA, USA, 2016.
26. Kuang, D.L.; Feng, Z.G.; Yu, J.Y. A New Approach for Evaluating Rejuvenator Diffusing into Aged Bitumen.J. Wuhan Univ. Technol. 2011, 26, 43–46. [CrossRef]
27. ASTM D3685. Standard Method to Test Deformation Resistance by Asphalt Wheel Tracking Test; American Societyfor Testing Materials: West Conshohocken, PA, USA, 2001.
28. ASTM D4867. Standard Test Method for Effect of Moisture on Asphalt Concrete Paving Mixtures; American Societyfor Testing Materials: West Conshohocken, PA, USA, 2009.
29. ASTM D1559. Standard Test Method for Resistance to Plastic Flow of Bituminous Mixtures Using MarshallApparatus; American Society for Testing Materials: West Conshohocken, PA, USA, 1982.
30. ASTM D7460-2010. Standard Test Method for Determining Fatigue Failure of Compacted Asphalt Concrete Subjectedto Repeated Flexural Bending; American Society for Testing Materials: West Conshohocken, PA, USA, 2010.
31. Wu, S.P.; Ye, Q.S.; Li, N. Investigation of rheological and fatigue properties of asphalt mixtures containingpolyester fibers. Constr. Build. Mater. 2008, 22, 2111–2115. [CrossRef]
© 2018 by the authors. Licensee MDPI, Basel, Switzerland. This article is an open accessarticle distributed under the terms and conditions of the Creative Commons Attribution(CC BY) license (http://creativecommons.org/licenses/by/4.0/).
103
materials
Article
Effect of Rejuvenator Containing Dodecyl BenzeneSulfonic Acid (DBSA) on Physical Properties,Chemical Components, Colloidal Structure andMicro-Morphology of Aged Bitumen
Dongliang Kuang 1,*, Zhou Ye 1, Lifeng Yang 2, Ning Liu 3, Zaihong Lu 4 and Huaxin Chen 1,*
1 Engineering Research Central of Pavement Materials, Ministry of Education, Chang’an University,Xi’an 710064, China; [email protected]
2 School of Civil Engineering, Qinghai University, Xining 810016, China; [email protected] Highway Researching and Designing Institute of Qinghai Province, Xining 810001, China; [email protected] Inner Mongolia Transportation Design Institute Co. LTD., Huhhot 010000, China; [email protected]* Correspondence: [email protected] (D.K.); [email protected] (H.C.); Tel.: +86-029-82337246 (H.C.)
Received: 24 July 2018; Accepted: 14 August 2018; Published: 20 August 2018
Abstract: DBSA was used as a solubilizer together with conventional rejuvenator (CR) to produce asolubilized rejuvenator (SR), two kinds of aged bitumen involving TFOT aged bitumen and PAV agedbitumen were obtained by thin film oven test (TFOT) and pressurized aging vessel (PAV), respectively.Effects of CR and SR on the physical properties, chemical components, colloidal structure andmicro-morphology of TFOT aged bitumen and PAV aged bitumen were investigated. Testing resultsof physical properties and chemical components indicated that CR and SR can replenish aged bitumenwith necessary aromatics, TFOT aged bitumen that chemical component variation deteriorates itsphysical properties. With regard to PAV aged bitumen, of which the performance attenuation liesin chemical components variation and colloidal structure transformation, even if the content of CRreached up to 10 wt %, the regenerated bitumen cannot meet the regeneration requirement yet due toits definite influence on colloidal structure transformation, comparatively, sulfonic group in SR canreact with the superficial atoms of asphaltenes to reform a solvation layer to facilitate the colloidalstructure transformation of PAV aged bitumen, performance and beelike structure of regeneratedPAV aged with bitumen with 10 wt % SR were approximated to that of virgin bitumen.
Keywords: aged bitumen; rejuvenator; solubilizer; colloidal structure; micro-morphology
1. Introduction
Bitumen has been widely applied in highway construction due to its excellent pavementperformance [1,2]. As an organic binder, bitumen is subjected to aging as a consequence of heatand oxygen during storage, mixing, transportation and paving, as well as service period [3–5], whichreduces the performance and service time of asphalt pavement [6,7]. Maintenances and reconstructionsare practically necessary for the damaged asphalt pavement to dispose of the premature distresses [8].In these processes, damaged asphalt pavement is firstly smashed and collected by road milling machine,which will produce huge amounts of reclaimed asphalt pavement (RAP) [9]. For the sake of resourceconservation and environmental protection, recycling of RAP is an effective and sustainable techniqueto cope with the RAP [10]. Compared with virgin asphalt mixture, RAP has lower road performancedue to bitumen aging [11], therefore the regenerating of aged bitumen is important for the recycling ofRAP [12].
It has been reported in previous studies that aging of bitumen is the main factor resulting in thepremature failure of asphalt pavement, which can be explained as following: The chemical components
Materials 2018, 11, 1476; doi:10.3390/ma11081476 www.mdpi.com/journal/materials104
Materials 2018, 11, 1476
proportions of bitumen are changed by aging [13,14], namely the asphaltenes content increases andaromatics content declines, which result in the decreasing in penetration and ductility as well asincreasing in softening point and viscosity [15].
Aging not only damage the performance, but also affects the colloidal structure involving thetype of colloidal structure and compatibility between chemical components. As it is known, thecolloidal solution of bitumen is composed of asphaltenes covered by solvation layer acting as themicellar nucleus and malthene acting as the dispersing medium [16]. However, the solvation layer issubjected to be destroyed by aging, and then the asphaltenes will precipitate from the other chemicalcomponents [17], coupling with the increment in asphaltenes content induced by aging, the surfaceof bitumen becomes rough, which can be observed by Atomic Force Microscopy (AFM) [18]. TheAFM testing conducted on bitumen indicates that the bitumen exhibits bee-like structure [19], and thedimension of bee-like structures of bitumen as well as the roughness of bitumen surface are increasedafter aging [20].
The aged bitumen can be classified as mild aged bitumen and severe aged bitumen accordingto the residual penetration of aged bitumen [21]. For mild aged bitumen, its chemical componentsvariation after aging dominantly influences the performance attenuation of bitumen, thus it can beeffectively regenerated by replenishing with necessary amount of aromatics, however, with regard tosevere aged bitumen, its performance attenuation is attributed to both chemical components variationand colloidal structure transformation [22], therefore replenishing aromatics and recovering colloidalstructure are both necessary for regeneration of severe aged bitumen.
Rejuvenators consisting of high proportion of aromatics have been widely applied for recyclingof RAP [23], which can replenish aged bitumen with necessary aromatics, thus it can regenerate mildaged bitumen effectively. However, for severely aged bitumen, of which the colloidal structure haschanged, the regeneration effect of rejuvenators including high proportion of aromatics is definite dueto its little influence on recovering of colloidal structure [24].
Dodecyl benzene sulfonic acid (DBSA) as a surfactant has been widely used in synthesis ofdetergent. The sulfonic group in DBSA can react with superficial atoms of removed substance byhydrogen-bond interaction and reform a spatial stability layer to facilitate the dissolving of removedsubstance [25]. In this paper, the DBSA was used as a solubilizer together with conventional rejuvenator(CR) to produce a solubilized rejuvenator (SR). Effects of DBSA on the physical properties, chemicalcomponents, colloidal structure and micro-morphology of different aged bitumen were investigated.
2. Materials and Methods
2.1. Materials
Bitumen, with penetration of 70 grade, was supplied by Shaanxi Guolin Hi-Tech Material Co.,Ltd., Xi’an, China, its physical properties and chemical component involving saturates (Sa), aromatics(Ar), resin (Re) and asphaltenes (As), were listed in Table 1. Fluid catalytic cracking slurry (FCC)heated to 100 ◦C and bitumen with penetration of 70 grade heated to 130 ◦C was initially blended inan iron container (Shaanxi Jingbo Hi-Tech Co., Ltd., Xi’an, China) for 15 min at a speed of 500 rpmto produce conventional rejuvenator (CR). For preparation of solubilized rejuvenator (SR), 1.5 wt %DBSA by weight of CR heated to 60 ◦C was added into CR heated to 110 ◦C and blended for 15 minat a speed of 500 rpm. The physical properties and chemical components of SR and CR are listed inTable 2.
105
Materials 2018, 11, 1476
Table 1. Physical properties and chemical components of virgin bitumen.
Items Value
Physical properties
Softening point (◦C) 45.2Penetration (25 ◦C, dmm) 74Ductility (10 ◦C, cm) 22Viscosity (135 ◦C, cp) 420
Colloidal structure Penetration index a 1.2
Chemical components
Saturates (%) 15.3Aromatics (%) 44.6Resins (%) 28.8Asphaltenes (%) 11.3
a Penetration index was calculated according to [26].
Table 2. Physical properties and chemical components of SR and CR.
Items SR CR
Physical properties
Flash point (◦C) >220 >220Viscosity (60 ◦C, Pa·s) 0.95 1.52Viscosity ratio after TFOT 1.7 2.1Weight loss after TFOT (%) −1.5 −2.2
Chemical components
Saturates (%) 13.3 12.5Aromatics (%) 62.7 64.2Resins (%) 17.3 15.4Asphaltenes (%) 6.7 7.9
2.2. Preparation of Aged Bitumen
Two aged bitumens were obtained by thin film oven test (TFOT, aging at 163 ◦C for 5 h accordingto [27] and pressurized aging vessel (Prentex, San Francisco, CA, USA) (PAV, aging at 100 ◦C for20 h under 2.1 MPa of air according to [28], respectively. The TFOT was employed to simulate theshort-term aging including storage, transport, mixing and paving process of the bitumen, whereas thePAV was used to simulate the long-term aging of the bitumen in service period. The aged bitumenprepared by TFOT and PAV were denoted as TA and PA respectively.
2.3. Preparation of Regenerated Bitumen
SR (or CR) heated to 110 ◦C was firstly added into aged bitumen heated to 150 ◦C, and the blendedat 150 ◦C with a speed of 500 rpm for 30 min to prepare regenerated bitumen, the content of SR (orCR) were 2, 4, 6, 8 and 10 wt % by weight of aged bitumen. The regenerated TA containing SR and CRwere denoted as SR-TA and CR-TA respectively; and the regenerated PA containing SR and CR weredenoted as SR-PA and CR-PA respectively.
2.4. Physical Properties Testing
Physical properties of virgin, aged, and regenerated bitumen, including softening point,penetration at 25 ◦C, ductility at 15 ◦C, and viscosity at 135 ◦C were tested according to the methodsin [29], [30], [26] and [31], respectively.
2.5. Chemical Components Testing
Bitumen was dissolved in n-heptane (Shaanxi Jingbo Hi-Tech Co., Ltd., Xi’an, China), asphalteneswas firstly separated according to [32] and its content was determined. Residual n-heptane wasevaporated and the residues were dissolved in toluene (Shaanxi Jingbo Hi-Tech Co., Ltd., Xi’an, China)to form a solution of 2% (w/v), then 1 μL sample solution was spotted on chromarods using a spotter.
106
Materials 2018, 11, 1476
Afterwards, the chromarods were expanded in n-heptane and toluene respectively. The contents ofsaturates, aromatics and resins were determined using Iatroscan MK-6 analyzer (Iatro LaboratoriesInc., Tokyo, Japan).
2.6. Colloidal Structure Characterization
The colloidal structure can be characterized by Penetration Index (PI) [26] and Colloidal StabilityIndex (CSI) [24]. The CSI and CSI are used for characterization of colloidal structure type and colloidalstructure stability, respectively.
With respect to the PI of less than −2, −2 to 2 and more than 2, the corresponding colloidalstructure of bitumen are Sol, Sol-Gel and Gel respectively [16]. The PI of virgin, aged, and regeneratedbitumen were calculated according to [26] in this paper.
The CSI calculated based on the chemical components testing [24], is adapted to characterize thestability of colloidal structure of regenerated bitumen in this paper, the more the CSI of regeneratedbitumen approximates that of virgin bitumen, the more the aged bitumen is regenerated. For obtainingthe CSI, the chemical components of the samples were determined according to the methods mentionedin 2.5, and then the CSI were calculated according to the following equation:
CSI =ArC + ReCAsC + SaC
(1)
where the ArC, ReC, AsC and SaC are the contents of aromatics, resin, asphaltenes andsaturates, respectively.
2.7. Micro-Morphology Characterization
Atomic force microscopy (AFM) (BRUKER, New York, NY, USA) that is capable of measuringtopographic features at nanometer-scale or even at atomic-scale resolution allows one to visualizeprecise details of surface topography of bitumen without special sample preparation [33]. In this paper,the AFM imaging was applied to characterize the microstructure of bitumen.
To obtain the samples for AFM observation, 1~1.5 g bitumen heated to 150 ◦C was laid on asteel disk with the size of 10 mm × 10 mm × 1 mm, and then self-cooled to ambient temperature(about 25 ◦C). All samples were stored in a container with a glass cap to prevent dust pick-up. TheAFM images were observed after the samples were annealed for a minimum of 24 h. The topographicimages were scanned in tapping mode with an etched silicon probe. The cantilever was 125 μm longwith the curvature radius of 5–10 nm. The drive frequency and amplitude were 260 kHz and 56 mW,respectively. The scan rate was 0.8 Hz. The AFM images showed a 15 μm × 15 μm region.
3. Results and Discussions
3.1. Characterization of TA and PA
Table 3 summaries the physical properties and chemical components of the TA and PA. Comparedwith virgin bitumen, the aged bitumen TA and PA exhibit lower penetration, ductility and aromaticscontent, but higher softening point, viscosity and asphaltenes content, which coincides with the resultsin previous studies.
It can be also observed from Table 3 that the PI of TA and PA are 1.7 and 3.5, indicate that thecolloidal structure of TA and PA are Sol-Gel and Gel respectively, which manifests that the PAV aginginfluences the bitumen more severely and leads to colloidal structure transformation.
107
Materials 2018, 11, 1476
Table 3. Physical properties and chemical components of TA and PA.
Items TA PA
Physical properties
Softening point (◦C) 53.2 59.7Penetration (25 ◦C, dmm) 40 28Ductility (10 ◦C, cm) 7.8 3.2Viscosity (135 ◦C, cp) 630 2050
Colloidal structure Penetration index 1.7 3.5
Chemical components
Saturates (%) 14.5 12.4Aromatics (%) 37.3 29.6Resins (%) 26.2 24.6Asphaltenes (%) 22.0 33.4
3.2. Physical Properties of Regenerated Bitumen
Figure 1a–d reveal the physical properties of regenerated TA and PA with different contents ofCR and SR. It can be observed from the figure that the addition of CR and SR increases the penetrationand ductility while decreases the softening point and viscosity.
Compared with CR, SR has more significant influence on the regeneration of aged bitumen. Asthe most important property of neat bitumen, the penetration of aged bitumen enhances rapidly withthe increasing in SR content, comparatively, the influence of the CR content is more moderate. It canbe seen from Figure 1a that the regenerated PA with 8 wt % SR owns a penetration of 62 dmm, whichmeets the requirement of regeneration, whereas the penetration of regenerated PA with 8 wt % CRis only 52 dmm, which is far from the requirement of regeneration. With continuous increasing incontents of SR and CR, the regenerated PA with 10 wt % SR owns a penetration of 72 dmm which isclose to that of virgin bitumen, whereas the regenerated PA containing 10 wt % CR merely owns apenetration of 61 dmm which is merely 80 % of virgin bitumen.
The changing of ductility is similar to that of penetration, as shown in Figure 1b, the ductilityincreases lineally with the increasing in rejuvenator content, and the ductility of regenerated bitumenwith SR is higher than that of regenerated bitumen with CR, the ductility of regenerated PA with10 wt % SR can be extended from 3.2 cm to 20 cm, which is approximate that of virgin bitumen,whereas the value is 16 cm for regenerated PA with 10 wt % CR.
The softening point and viscosity show an opposite changing to that of penetration and ductilitywith the addition of rejuvenator. The softening point and viscosity are decreased with the increasing inrejuvenator content. As shown by Figure 1c,d, the SR also influences the softening point and viscositymore significantly than CR, regenerated bitumen with SR shows lower softening point and viscositythan regenerated bitumen with CR at the same rejuvenator content.
It can be also found from Figure 1 that 8 wt % CR and SR can effectively regenerate the physicalproperties of TA to satisfy the regeneration requirement. With regard to PA, the necessary content ofSR for regenerating PA to satisfy the regeneration requirement is 10 wt %, but even if the content of CRreaches up to 10 wt %, the physical properties of PA cannot meet the regeneration requirement.
The result can be ascribed to that CR merely owns high proportion of aromatics, it can onlyregenerate aged bitumen by replenishing aromatics but can hardly restore the colloidal structure,therefore CR can effectively regenerate TA which maintains the same colloidal structure as virginbitumen, whereas with regard to PA, its colloidal structure has transformed from Sol-Gel to Gel,thus CR cannot effectively regenerate the physical properties of PA due to its definite influence oncolloidal structure restoration. Compared with CR, SR contains both high proportion of aromaticsand sulfonic group, it can replenishing PA with necessary aromatics and react with the superficialatoms of asphaltenes to reform the solvation layer covering the surface of asphaltenes, which facilitatesgathered asphaltenes stably disperse in colloidal solution at a smaller size and contributes the colloidalstructure restoration of PA, therefore SR can regenerate PA more effectively than CR.
108
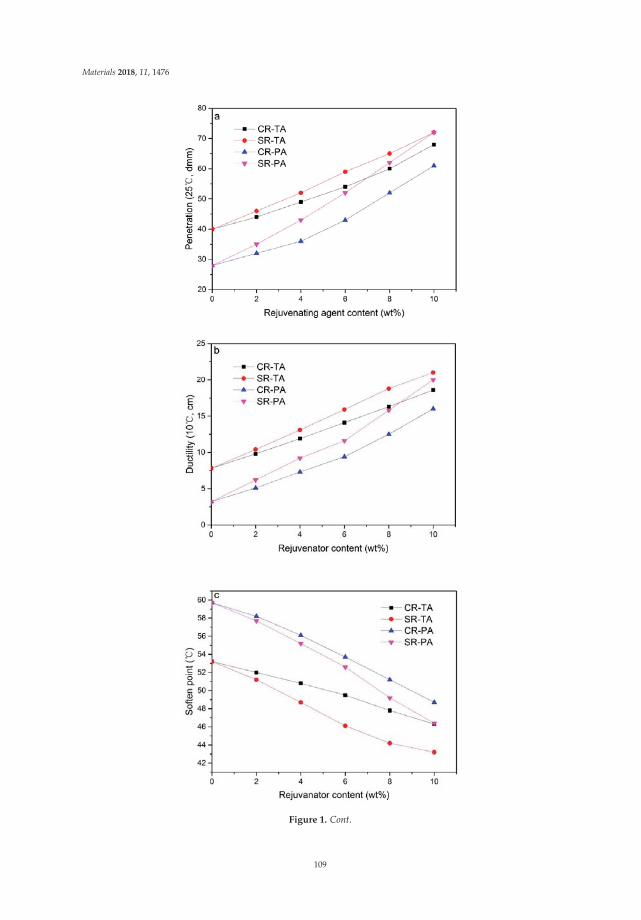
Materials 2018, 11, 1476
Figure 1. Cont.
109
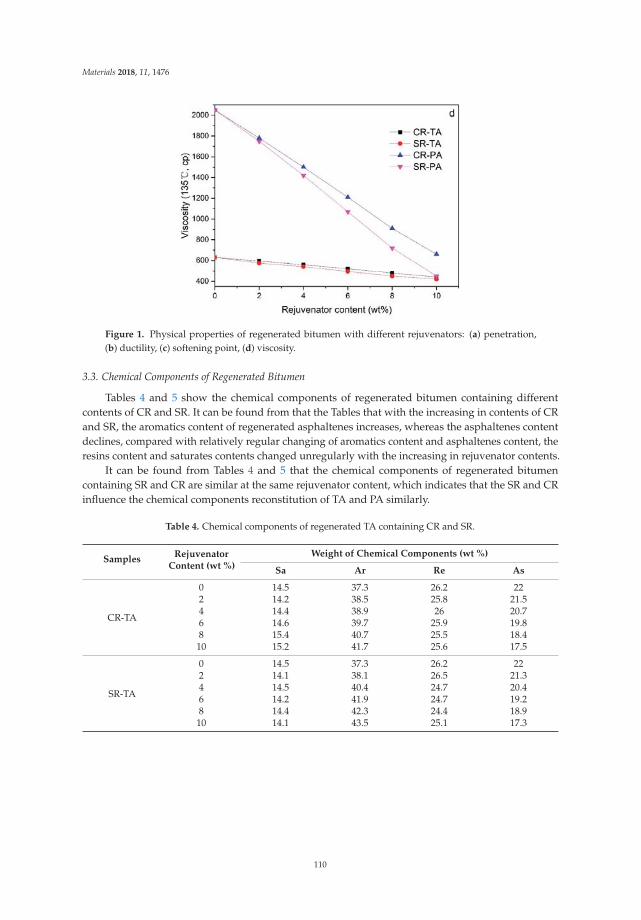
Materials 2018, 11, 1476
Figure 1. Physical properties of regenerated bitumen with different rejuvenators: (a) penetration,(b) ductility, (c) softening point, (d) viscosity.
3.3. Chemical Components of Regenerated Bitumen
Tables 4 and 5 show the chemical components of regenerated bitumen containing differentcontents of CR and SR. It can be found from that the Tables that with the increasing in contents of CRand SR, the aromatics content of regenerated asphaltenes increases, whereas the asphaltenes contentdeclines, compared with relatively regular changing of aromatics content and asphaltenes content, theresins content and saturates contents changed unregularly with the increasing in rejuvenator contents.
It can be found from Tables 4 and 5 that the chemical components of regenerated bitumencontaining SR and CR are similar at the same rejuvenator content, which indicates that the SR and CRinfluence the chemical components reconstitution of TA and PA similarly.
Table 4. Chemical components of regenerated TA containing CR and SR.
SamplesRejuvenator
Content (wt %)
Weight of Chemical Components (wt %)
Sa Ar Re As
CR-TA
0 14.5 37.3 26.2 222 14.2 38.5 25.8 21.54 14.4 38.9 26 20.76 14.6 39.7 25.9 19.88 15.4 40.7 25.5 18.4
10 15.2 41.7 25.6 17.5
SR-TA
0 14.5 37.3 26.2 222 14.1 38.1 26.5 21.34 14.5 40.4 24.7 20.46 14.2 41.9 24.7 19.28 14.4 42.3 24.4 18.9
10 14.1 43.5 25.1 17.3
110
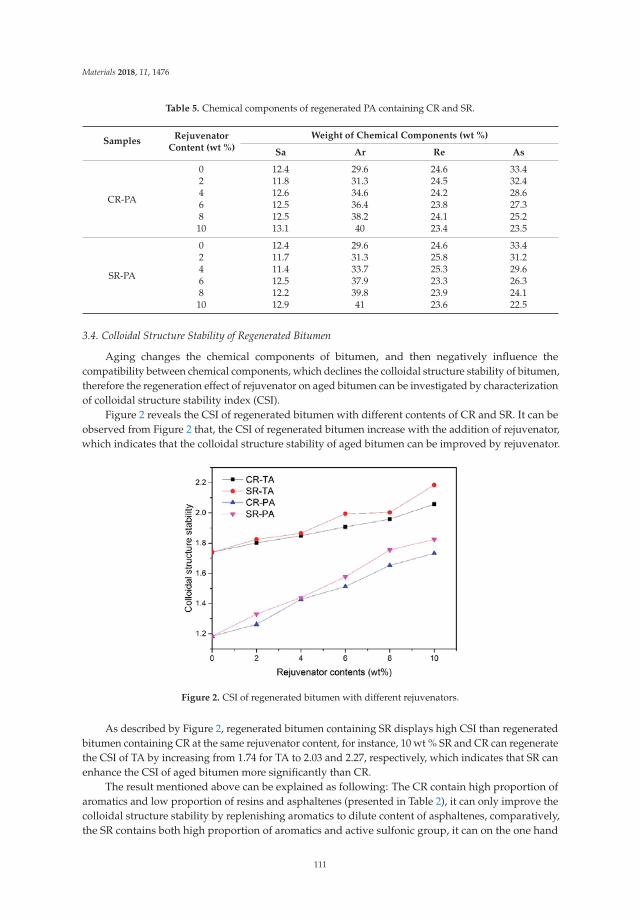
Materials 2018, 11, 1476
Table 5. Chemical components of regenerated PA containing CR and SR.
SamplesRejuvenator
Content (wt %)
Weight of Chemical Components (wt %)
Sa Ar Re As
CR-PA
0 12.4 29.6 24.6 33.42 11.8 31.3 24.5 32.44 12.6 34.6 24.2 28.66 12.5 36.4 23.8 27.38 12.5 38.2 24.1 25.2
10 13.1 40 23.4 23.5
SR-PA
0 12.4 29.6 24.6 33.42 11.7 31.3 25.8 31.24 11.4 33.7 25.3 29.66 12.5 37.9 23.3 26.38 12.2 39.8 23.9 24.1
10 12.9 41 23.6 22.5
3.4. Colloidal Structure Stability of Regenerated Bitumen
Aging changes the chemical components of bitumen, and then negatively influence thecompatibility between chemical components, which declines the colloidal structure stability of bitumen,therefore the regeneration effect of rejuvenator on aged bitumen can be investigated by characterizationof colloidal structure stability index (CSI).
Figure 2 reveals the CSI of regenerated bitumen with different contents of CR and SR. It can beobserved from Figure 2 that, the CSI of regenerated bitumen increase with the addition of rejuvenator,which indicates that the colloidal structure stability of aged bitumen can be improved by rejuvenator.
Figure 2. CSI of regenerated bitumen with different rejuvenators.
As described by Figure 2, regenerated bitumen containing SR displays high CSI than regeneratedbitumen containing CR at the same rejuvenator content, for instance, 10 wt % SR and CR can regeneratethe CSI of TA by increasing from 1.74 for TA to 2.03 and 2.27, respectively, which indicates that SR canenhance the CSI of aged bitumen more significantly than CR.
The result mentioned above can be explained as following: The CR contain high proportion ofaromatics and low proportion of resins and asphaltenes (presented in Table 2), it can only improve thecolloidal structure stability by replenishing aromatics to dilute content of asphaltenes, comparatively,the SR contains both high proportion of aromatics and active sulfonic group, it can on the one hand
111
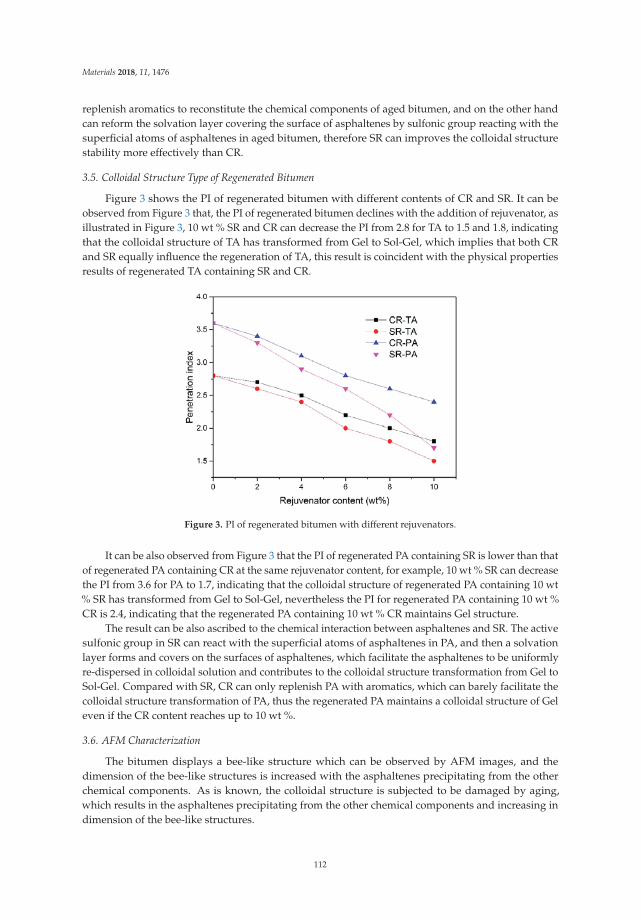
Materials 2018, 11, 1476
replenish aromatics to reconstitute the chemical components of aged bitumen, and on the other handcan reform the solvation layer covering the surface of asphaltenes by sulfonic group reacting with thesuperficial atoms of asphaltenes in aged bitumen, therefore SR can improves the colloidal structurestability more effectively than CR.
3.5. Colloidal Structure Type of Regenerated Bitumen
Figure 3 shows the PI of regenerated bitumen with different contents of CR and SR. It can beobserved from Figure 3 that, the PI of regenerated bitumen declines with the addition of rejuvenator, asillustrated in Figure 3, 10 wt % SR and CR can decrease the PI from 2.8 for TA to 1.5 and 1.8, indicatingthat the colloidal structure of TA has transformed from Gel to Sol-Gel, which implies that both CRand SR equally influence the regeneration of TA, this result is coincident with the physical propertiesresults of regenerated TA containing SR and CR.
Figure 3. PI of regenerated bitumen with different rejuvenators.
It can be also observed from Figure 3 that the PI of regenerated PA containing SR is lower than thatof regenerated PA containing CR at the same rejuvenator content, for example, 10 wt % SR can decreasethe PI from 3.6 for PA to 1.7, indicating that the colloidal structure of regenerated PA containing 10 wt% SR has transformed from Gel to Sol-Gel, nevertheless the PI for regenerated PA containing 10 wt %CR is 2.4, indicating that the regenerated PA containing 10 wt % CR maintains Gel structure.
The result can be also ascribed to the chemical interaction between asphaltenes and SR. The activesulfonic group in SR can react with the superficial atoms of asphaltenes in PA, and then a solvationlayer forms and covers on the surfaces of asphaltenes, which facilitate the asphaltenes to be uniformlyre-dispersed in colloidal solution and contributes to the colloidal structure transformation from Gel toSol-Gel. Compared with SR, CR can only replenish PA with aromatics, which can barely facilitate thecolloidal structure transformation of PA, thus the regenerated PA maintains a colloidal structure of Geleven if the CR content reaches up to 10 wt %.
3.6. AFM Characterization
The bitumen displays a bee-like structure which can be observed by AFM images, and thedimension of the bee-like structures is increased with the asphaltenes precipitating from the otherchemical components. As is known, the colloidal structure is subjected to be damaged by aging,which results in the asphaltenes precipitating from the other chemical components and increasing indimension of the bee-like structures.
112
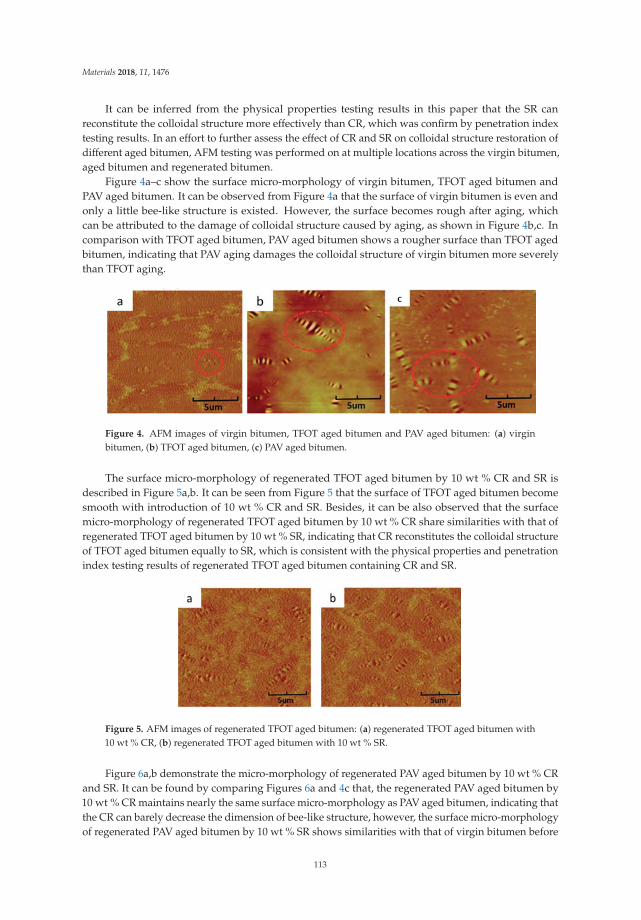
Materials 2018, 11, 1476
It can be inferred from the physical properties testing results in this paper that the SR canreconstitute the colloidal structure more effectively than CR, which was confirm by penetration indextesting results. In an effort to further assess the effect of CR and SR on colloidal structure restoration ofdifferent aged bitumen, AFM testing was performed on at multiple locations across the virgin bitumen,aged bitumen and regenerated bitumen.
Figure 4a–c show the surface micro-morphology of virgin bitumen, TFOT aged bitumen andPAV aged bitumen. It can be observed from Figure 4a that the surface of virgin bitumen is even andonly a little bee-like structure is existed. However, the surface becomes rough after aging, whichcan be attributed to the damage of colloidal structure caused by aging, as shown in Figure 4b,c. Incomparison with TFOT aged bitumen, PAV aged bitumen shows a rougher surface than TFOT agedbitumen, indicating that PAV aging damages the colloidal structure of virgin bitumen more severelythan TFOT aging.
Figure 4. AFM images of virgin bitumen, TFOT aged bitumen and PAV aged bitumen: (a) virginbitumen, (b) TFOT aged bitumen, (c) PAV aged bitumen.
The surface micro-morphology of regenerated TFOT aged bitumen by 10 wt % CR and SR isdescribed in Figure 5a,b. It can be seen from Figure 5 that the surface of TFOT aged bitumen becomesmooth with introduction of 10 wt % CR and SR. Besides, it can be also observed that the surfacemicro-morphology of regenerated TFOT aged bitumen by 10 wt % CR share similarities with that ofregenerated TFOT aged bitumen by 10 wt % SR, indicating that CR reconstitutes the colloidal structureof TFOT aged bitumen equally to SR, which is consistent with the physical properties and penetrationindex testing results of regenerated TFOT aged bitumen containing CR and SR.
Figure 5. AFM images of regenerated TFOT aged bitumen: (a) regenerated TFOT aged bitumen with10 wt % CR, (b) regenerated TFOT aged bitumen with 10 wt % SR.
Figure 6a,b demonstrate the micro-morphology of regenerated PAV aged bitumen by 10 wt % CRand SR. It can be found by comparing Figures 6a and 4c that, the regenerated PAV aged bitumen by10 wt % CR maintains nearly the same surface micro-morphology as PAV aged bitumen, indicating thatthe CR can barely decrease the dimension of bee-like structure, however, the surface micro-morphologyof regenerated PAV aged bitumen by 10 wt % SR shows similarities with that of virgin bitumen before
113
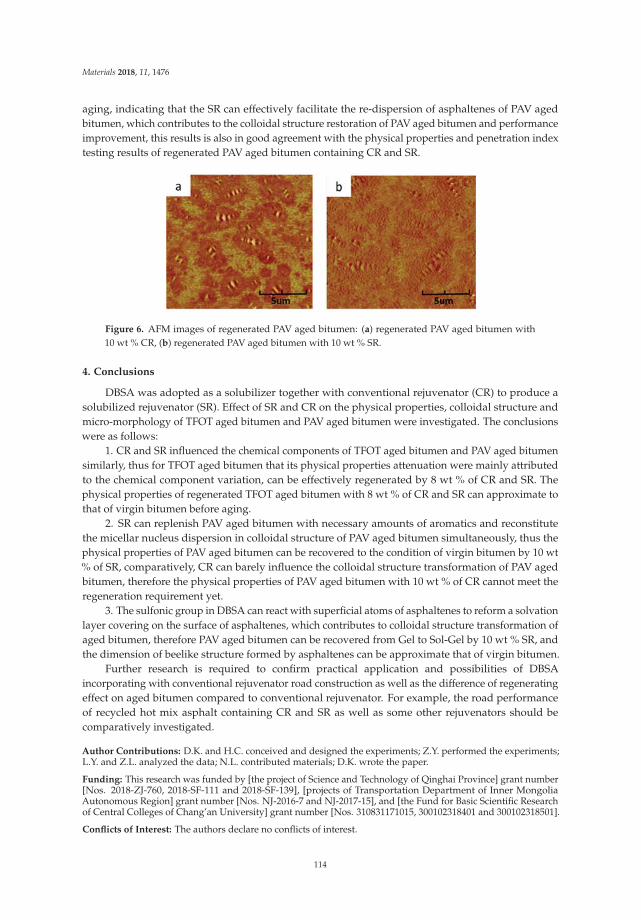
Materials 2018, 11, 1476
aging, indicating that the SR can effectively facilitate the re-dispersion of asphaltenes of PAV agedbitumen, which contributes to the colloidal structure restoration of PAV aged bitumen and performanceimprovement, this results is also in good agreement with the physical properties and penetration indextesting results of regenerated PAV aged bitumen containing CR and SR.
Figure 6. AFM images of regenerated PAV aged bitumen: (a) regenerated PAV aged bitumen with10 wt % CR, (b) regenerated PAV aged bitumen with 10 wt % SR.
4. Conclusions
DBSA was adopted as a solubilizer together with conventional rejuvenator (CR) to produce asolubilized rejuvenator (SR). Effect of SR and CR on the physical properties, colloidal structure andmicro-morphology of TFOT aged bitumen and PAV aged bitumen were investigated. The conclusionswere as follows:
1. CR and SR influenced the chemical components of TFOT aged bitumen and PAV aged bitumensimilarly, thus for TFOT aged bitumen that its physical properties attenuation were mainly attributedto the chemical component variation, can be effectively regenerated by 8 wt % of CR and SR. Thephysical properties of regenerated TFOT aged bitumen with 8 wt % of CR and SR can approximate tothat of virgin bitumen before aging.
2. SR can replenish PAV aged bitumen with necessary amounts of aromatics and reconstitutethe micellar nucleus dispersion in colloidal structure of PAV aged bitumen simultaneously, thus thephysical properties of PAV aged bitumen can be recovered to the condition of virgin bitumen by 10 wt% of SR, comparatively, CR can barely influence the colloidal structure transformation of PAV agedbitumen, therefore the physical properties of PAV aged bitumen with 10 wt % of CR cannot meet theregeneration requirement yet.
3. The sulfonic group in DBSA can react with superficial atoms of asphaltenes to reform a solvationlayer covering on the surface of asphaltenes, which contributes to colloidal structure transformation ofaged bitumen, therefore PAV aged bitumen can be recovered from Gel to Sol-Gel by 10 wt % SR, andthe dimension of beelike structure formed by asphaltenes can be approximate that of virgin bitumen.
Further research is required to confirm practical application and possibilities of DBSAincorporating with conventional rejuvenator road construction as well as the difference of regeneratingeffect on aged bitumen compared to conventional rejuvenator. For example, the road performanceof recycled hot mix asphalt containing CR and SR as well as some other rejuvenators should becomparatively investigated.
Author Contributions: D.K. and H.C. conceived and designed the experiments; Z.Y. performed the experiments;L.Y. and Z.L. analyzed the data; N.L. contributed materials; D.K. wrote the paper.
Funding: This research was funded by [the project of Science and Technology of Qinghai Province] grant number[Nos. 2018-ZJ-760, 2018-SF-111 and 2018-SF-139], [projects of Transportation Department of Inner MongoliaAutonomous Region] grant number [Nos. NJ-2016-7 and NJ-2017-15], and [the Fund for Basic Scientific Researchof Central Colleges of Chang’an University] grant number [Nos. 310831171015, 300102318401 and 300102318501].
Conflicts of Interest: The authors declare no conflicts of interest.
114
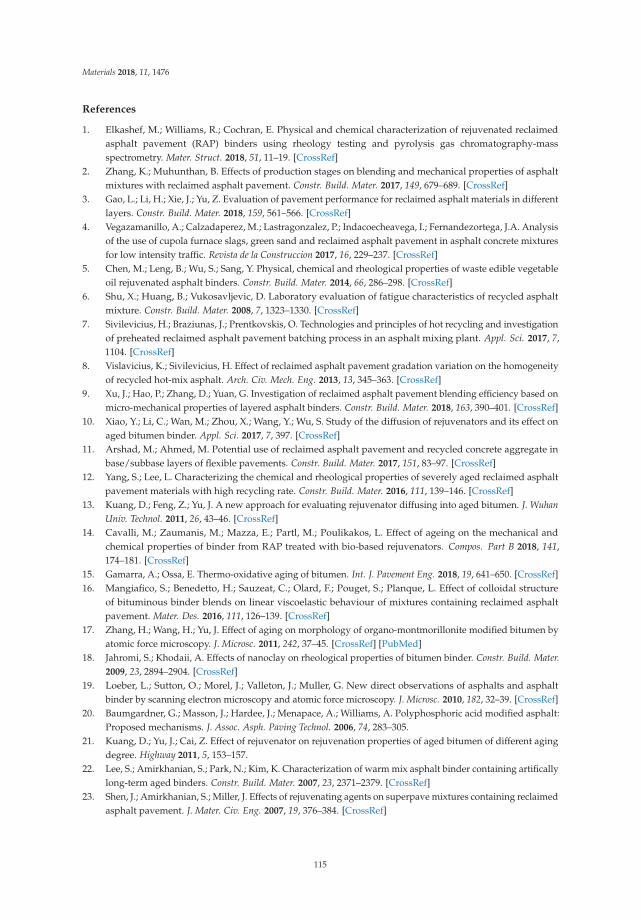
Materials 2018, 11, 1476
References
1. Elkashef, M.; Williams, R.; Cochran, E. Physical and chemical characterization of rejuvenated reclaimedasphalt pavement (RAP) binders using rheology testing and pyrolysis gas chromatography-massspectrometry. Mater. Struct. 2018, 51, 11–19. [CrossRef]
2. Zhang, K.; Muhunthan, B. Effects of production stages on blending and mechanical properties of asphaltmixtures with reclaimed asphalt pavement. Constr. Build. Mater. 2017, 149, 679–689. [CrossRef]
3. Gao, L.; Li, H.; Xie, J.; Yu, Z. Evaluation of pavement performance for reclaimed asphalt materials in differentlayers. Constr. Build. Mater. 2018, 159, 561–566. [CrossRef]
4. Vegazamanillo, A.; Calzadaperez, M.; Lastragonzalez, P.; Indacoecheavega, I.; Fernandezortega, J.A. Analysisof the use of cupola furnace slags, green sand and reclaimed asphalt pavement in asphalt concrete mixturesfor low intensity traffic. Revista de la Construccion 2017, 16, 229–237. [CrossRef]
5. Chen, M.; Leng, B.; Wu, S.; Sang, Y. Physical, chemical and rheological properties of waste edible vegetableoil rejuvenated asphalt binders. Constr. Build. Mater. 2014, 66, 286–298. [CrossRef]
6. Shu, X.; Huang, B.; Vukosavljevic, D. Laboratory evaluation of fatigue characteristics of recycled asphaltmixture. Constr. Build. Mater. 2008, 7, 1323–1330. [CrossRef]
7. Sivilevicius, H.; Braziunas, J.; Prentkovskis, O. Technologies and principles of hot recycling and investigationof preheated reclaimed asphalt pavement batching process in an asphalt mixing plant. Appl. Sci. 2017, 7,1104. [CrossRef]
8. Vislavicius, K.; Sivilevicius, H. Effect of reclaimed asphalt pavement gradation variation on the homogeneityof recycled hot-mix asphalt. Arch. Civ. Mech. Eng. 2013, 13, 345–363. [CrossRef]
9. Xu, J.; Hao, P.; Zhang, D.; Yuan, G. Investigation of reclaimed asphalt pavement blending efficiency based onmicro-mechanical properties of layered asphalt binders. Constr. Build. Mater. 2018, 163, 390–401. [CrossRef]
10. Xiao, Y.; Li, C.; Wan, M.; Zhou, X.; Wang, Y.; Wu, S. Study of the diffusion of rejuvenators and its effect onaged bitumen binder. Appl. Sci. 2017, 7, 397. [CrossRef]
11. Arshad, M.; Ahmed, M. Potential use of reclaimed asphalt pavement and recycled concrete aggregate inbase/subbase layers of flexible pavements. Constr. Build. Mater. 2017, 151, 83–97. [CrossRef]
12. Yang, S.; Lee, L. Characterizing the chemical and rheological properties of severely aged reclaimed asphaltpavement materials with high recycling rate. Constr. Build. Mater. 2016, 111, 139–146. [CrossRef]
13. Kuang, D.; Feng, Z.; Yu, J. A new approach for evaluating rejuvenator diffusing into aged bitumen. J. WuhanUniv. Technol. 2011, 26, 43–46. [CrossRef]
14. Cavalli, M.; Zaumanis, M.; Mazza, E.; Partl, M.; Poulikakos, L. Effect of ageing on the mechanical andchemical properties of binder from RAP treated with bio-based rejuvenators. Compos. Part B 2018, 141,174–181. [CrossRef]
15. Gamarra, A.; Ossa, E. Thermo-oxidative aging of bitumen. Int. J. Pavement Eng. 2018, 19, 641–650. [CrossRef]16. Mangiafico, S.; Benedetto, H.; Sauzeat, C.; Olard, F.; Pouget, S.; Planque, L. Effect of colloidal structure
of bituminous binder blends on linear viscoelastic behaviour of mixtures containing reclaimed asphaltpavement. Mater. Des. 2016, 111, 126–139. [CrossRef]
17. Zhang, H.; Wang, H.; Yu, J. Effect of aging on morphology of organo-montmorillonite modified bitumen byatomic force microscopy. J. Microsc. 2011, 242, 37–45. [CrossRef] [PubMed]
18. Jahromi, S.; Khodaii, A. Effects of nanoclay on rheological properties of bitumen binder. Constr. Build. Mater.2009, 23, 2894–2904. [CrossRef]
19. Loeber, L.; Sutton, O.; Morel, J.; Valleton, J.; Muller, G. New direct observations of asphalts and asphaltbinder by scanning electron microscopy and atomic force microscopy. J. Microsc. 2010, 182, 32–39. [CrossRef]
20. Baumgardner, G.; Masson, J.; Hardee, J.; Menapace, A.; Williams, A. Polyphosphoric acid modified asphalt:Proposed mechanisms. J. Assoc. Asph. Paving Technol. 2006, 74, 283–305.
21. Kuang, D.; Yu, J.; Cai, Z. Effect of rejuvenator on rejuvenation properties of aged bitumen of different agingdegree. Highway 2011, 5, 153–157.
22. Lee, S.; Amirkhanian, S.; Park, N.; Kim, K. Characterization of warm mix asphalt binder containing artificallylong-term aged binders. Constr. Build. Mater. 2007, 23, 2371–2379. [CrossRef]
23. Shen, J.; Amirkhanian, S.; Miller, J. Effects of rejuvenating agents on superpave mixtures containing reclaimedasphalt pavement. J. Mater. Civ. Eng. 2007, 19, 376–384. [CrossRef]
115
Materials 2018, 11, 1476
24. Kuang, D. Preparation of diffusible rejuvenator and its influence on performances of recycled bitumen andrecycled asphalt mixture. Ph.D. Thesis, Wuhan University of Technology, Wuhan, China, 28 June 2012.
25. Zargar, G.; Gheysari, R.; Takassi, M.; Rostami, A.; Zadehnazari, A. Evaluation of a sulfanilic acid basedsurfactant in crude oil demulsification: An experimental study. Oil Gas Sci. Technol. 2018, 73, 176–182.[CrossRef]
26. ASTM D 5. Standard Test Method for Penetration of Bituminous Materials; American Society for Testing Materials:West Conshohocken, PA, USA, 2005.
27. ASTM D 1754. Standard Test Method for Effects of Heat and Air on Asphaltic Materials; American Society forTesting Materials: West Conshohocken, PA, USA, 2014.
28. ASTM D 6521. Standard Practice for Accelerated Aging of Asphalt Binder Using a Pressurized Aging Vessel Lpar;American Society for Testing Materials: West Conshohocken, PA, USA, 2013.
29. ASTM D 36. Standard Test Method for Softening Point of Bitumen; American Society for Testing Materials: WestConshohocken, PA, USA, 2006.
30. ASTM D 113. Standard Test Method for Ductility of Bituminous Materials; American Society for Testing Materials:West Conshohocken, PA, USA, 2016.
31. ASTM D 113. Standard Test Method for Viscosity Determination of Asphalt at Elevated Temperatures Using aRotational Viscometer; American Society for Testing Materials: West Conshohocken, PA, USA, 2012.
32. ASTM D 4124. Standard Test Method for Separation of Asphalt into Four Fractions; American Society for TestingMaterials: West Conshohocken, PA, USA, 2018.
33. Yu, X.; Burnham, N.; Tao, M. Surface microstructure of bitumen characterized by atomic force microscopy.Adv. Colloid Interface Sci. 2015, 218, 17–33. [CrossRef] [PubMed]
© 2018 by the authors. Licensee MDPI, Basel, Switzerland. This article is an open accessarticle distributed under the terms and conditions of the Creative Commons Attribution(CC BY) license (http://creativecommons.org/licenses/by/4.0/).
116
materials
Article
Evaluation of Thermal-Mechanical Propertiesof Bio-Oil Regenerated Aged Asphalt
Tianyuan Yang 1,*, Meizhu Chen 1, Xinxing Zhou 2 and Jun Xie 1,*
1 State Key Laboratory of Silicate Materials for Architectures, Wuhan University of Technology,Wuhan 430070, China; [email protected]
2 Key Laboratory of Highway Construction and Maintenance Technology in Loess Region of the Ministryof Transport, Shanxi Transportation Research Institute, Taiyuan 030006, China; [email protected]
* Correspondence: [email protected] (T.Y.); [email protected] (J.X.)
Received: 9 October 2018; Accepted: 5 November 2018; Published: 8 November 2018
Abstract: Different proportions of bio-oil (5, 10, 15, and 20 wt%) were added into aged asphalt forits regeneration. Molecular dynamic simulations were used to measure the thermal and mechanicalperformances of bio-oil regenerated aged asphalt (BRAA). A new, simplified BRAA model was built tocalculate the specific heat capacity, thermal expansion coefficient, elastic constant, shear modulus, bulkmodulus, and Young’s modulus. Simulation results showed that the thermal expansion coefficient(CTE α) of asphalt at 298 K decreased by 10% after aging. Bio-oil of 5 wt% could make the CTE α
restore to the original level of base asphalt, while the addition of bio-oil would further decrease thespecific heat capacity of aged asphalt. The shear modulus (G), Young’s modulus (K) and bulk modulus(E) of asphalt increased after aging and decreased with the increasing amount of bio-oil. According tothe calculated E/G value, the ductility of aged asphalt increased by 6.0% with the addition of10 wt% bio-oil, while over 15 wt% bio-oil would make the ductility of BRAA decrease. In summary,the regeneration effects of bio-oil to the thermal expansion coefficient, flexibility, and ductility of agedasphalt had been proven, while excessive bio-oil would decrease the thermal stability of asphalt.
Keywords: thermal–mechanical properties; bio-oil; regeneration; aged asphalt; moleculardynamic simulation
1. Introduction
Asphalt mixture is a common pavement material. It provides a comfortable driving environmentfor vehicles. However, the pavement performance of asphalt mixture constantly decreases duringservice process. One of the key reasons is that asphalt, as a binder, is gradually aging under theinfluence of oxygen and ultraviolet [1–3]. In order to recycle and reuse the aged asphalt, a considerableamount of research has been done on the regeneration of aged asphalt. In 1915, asphalt recyclingtechnology was first explored by American Warren Bother who reused the aged asphalt by heatingwaste asphalt mixture [4]. After 1956, due to the initial formation of the US domestic high-graderoad network, the price of petroleum crude oil rose rapidly [5]. During the period from 1970 to 1989,the global oil crisis occurred and crude oil price continued to rise. The cost of new asphalt pavementincreased greatly, thus, people paid more attention to asphalt recycling technology. Regarding therecycling mechanism of aged asphalt, the regeneration of aged asphalt can be considered as thereverse process of asphalt aging. By means of adding specific substances, the composition of asphaltis adjusted to reverse its performance and return to an appropriate state that can be reused [6–8].Not only rheological properties but also changes in structure were considered as the indicators for theevaluation of asphalt regeneration effect. More testing methods, such as NMR, were used to investigatethe additive’s effects on aged asphalt [9].
Materials 2018, 11, 2224; doi:10.3390/ma11112224 www.mdpi.com/journal/materials117
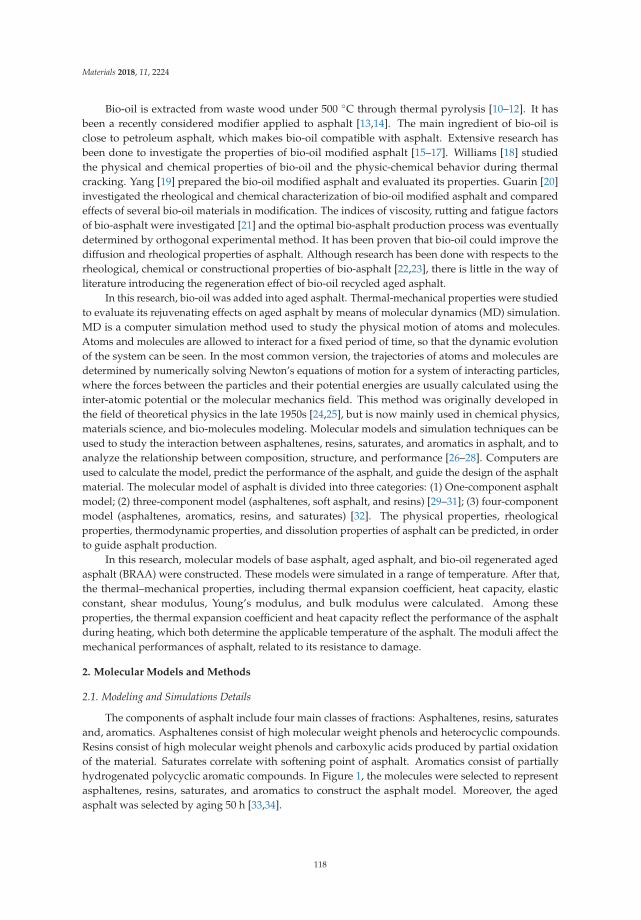
Materials 2018, 11, 2224
Bio-oil is extracted from waste wood under 500 ◦C through thermal pyrolysis [10–12]. It hasbeen a recently considered modifier applied to asphalt [13,14]. The main ingredient of bio-oil isclose to petroleum asphalt, which makes bio-oil compatible with asphalt. Extensive research hasbeen done to investigate the properties of bio-oil modified asphalt [15–17]. Williams [18] studiedthe physical and chemical properties of bio-oil and the physic-chemical behavior during thermalcracking. Yang [19] prepared the bio-oil modified asphalt and evaluated its properties. Guarin [20]investigated the rheological and chemical characterization of bio-oil modified asphalt and comparedeffects of several bio-oil materials in modification. The indices of viscosity, rutting and fatigue factorsof bio-asphalt were investigated [21] and the optimal bio-asphalt production process was eventuallydetermined by orthogonal experimental method. It has been proven that bio-oil could improve thediffusion and rheological properties of asphalt. Although research has been done with respects to therheological, chemical or constructional properties of bio-asphalt [22,23], there is little in the way ofliterature introducing the regeneration effect of bio-oil recycled aged asphalt.
In this research, bio-oil was added into aged asphalt. Thermal-mechanical properties were studiedto evaluate its rejuvenating effects on aged asphalt by means of molecular dynamics (MD) simulation.MD is a computer simulation method used to study the physical motion of atoms and molecules.Atoms and molecules are allowed to interact for a fixed period of time, so that the dynamic evolutionof the system can be seen. In the most common version, the trajectories of atoms and molecules aredetermined by numerically solving Newton’s equations of motion for a system of interacting particles,where the forces between the particles and their potential energies are usually calculated using theinter-atomic potential or the molecular mechanics field. This method was originally developed inthe field of theoretical physics in the late 1950s [24,25], but is now mainly used in chemical physics,materials science, and bio-molecules modeling. Molecular models and simulation techniques can beused to study the interaction between asphaltenes, resins, saturates, and aromatics in asphalt, and toanalyze the relationship between composition, structure, and performance [26–28]. Computers areused to calculate the model, predict the performance of the asphalt, and guide the design of the asphaltmaterial. The molecular model of asphalt is divided into three categories: (1) One-component asphaltmodel; (2) three-component model (asphaltenes, soft asphalt, and resins) [29–31]; (3) four-componentmodel (asphaltenes, aromatics, resins, and saturates) [32]. The physical properties, rheologicalproperties, thermodynamic properties, and dissolution properties of asphalt can be predicted, in orderto guide asphalt production.
In this research, molecular models of base asphalt, aged asphalt, and bio-oil regenerated agedasphalt (BRAA) were constructed. These models were simulated in a range of temperature. After that,the thermal–mechanical properties, including thermal expansion coefficient, heat capacity, elasticconstant, shear modulus, Young’s modulus, and bulk modulus were calculated. Among theseproperties, the thermal expansion coefficient and heat capacity reflect the performance of the asphaltduring heating, which both determine the applicable temperature of the asphalt. The moduli affect themechanical performances of asphalt, related to its resistance to damage.
2. Molecular Models and Methods
2.1. Modeling and Simulations Details
The components of asphalt include four main classes of fractions: Asphaltenes, resins, saturatesand, aromatics. Asphaltenes consist of high molecular weight phenols and heterocyclic compounds.Resins consist of high molecular weight phenols and carboxylic acids produced by partial oxidationof the material. Saturates correlate with softening point of asphalt. Aromatics consist of partiallyhydrogenated polycyclic aromatic compounds. In Figure 1, the molecules were selected to representasphaltenes, resins, saturates, and aromatics to construct the asphalt model. Moreover, the agedasphalt was selected by aging 50 h [33,34].
118
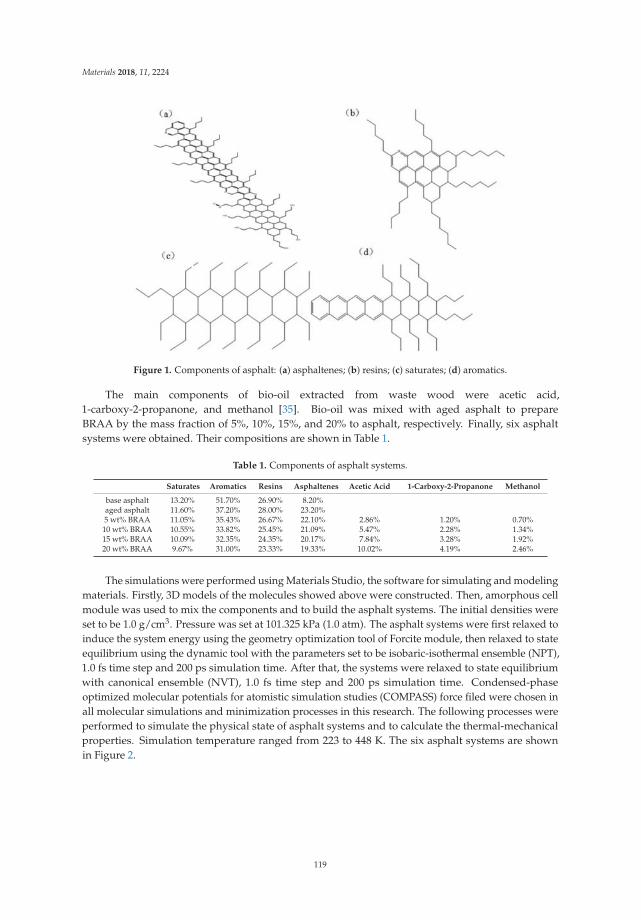
Materials 2018, 11, 2224
Figure 1. Components of asphalt: (a) asphaltenes; (b) resins; (c) saturates; (d) aromatics.
The main components of bio-oil extracted from waste wood were acetic acid,1-carboxy-2-propanone, and methanol [35]. Bio-oil was mixed with aged asphalt to prepareBRAA by the mass fraction of 5%, 10%, 15%, and 20% to asphalt, respectively. Finally, six asphaltsystems were obtained. Their compositions are shown in Table 1.
Table 1. Components of asphalt systems.
Saturates Aromatics Resins Asphaltenes Acetic Acid 1-Carboxy-2-Propanone Methanol
base asphalt 13.20% 51.70% 26.90% 8.20%aged asphalt 11.60% 37.20% 28.00% 23.20%5 wt% BRAA 11.05% 35.43% 26.67% 22.10% 2.86% 1.20% 0.70%
10 wt% BRAA 10.55% 33.82% 25.45% 21.09% 5.47% 2.28% 1.34%15 wt% BRAA 10.09% 32.35% 24.35% 20.17% 7.84% 3.28% 1.92%20 wt% BRAA 9.67% 31.00% 23.33% 19.33% 10.02% 4.19% 2.46%
The simulations were performed using Materials Studio, the software for simulating and modelingmaterials. Firstly, 3D models of the molecules showed above were constructed. Then, amorphous cellmodule was used to mix the components and to build the asphalt systems. The initial densities wereset to be 1.0 g/cm3. Pressure was set at 101.325 kPa (1.0 atm). The asphalt systems were first relaxed toinduce the system energy using the geometry optimization tool of Forcite module, then relaxed to stateequilibrium using the dynamic tool with the parameters set to be isobaric-isothermal ensemble (NPT),1.0 fs time step and 200 ps simulation time. After that, the systems were relaxed to state equilibriumwith canonical ensemble (NVT), 1.0 fs time step and 200 ps simulation time. Condensed-phaseoptimized molecular potentials for atomistic simulation studies (COMPASS) force filed were chosen inall molecular simulations and minimization processes in this research. The following processes wereperformed to simulate the physical state of asphalt systems and to calculate the thermal-mechanicalproperties. Simulation temperature ranged from 223 to 448 K. The six asphalt systems are shownin Figure 2.
119
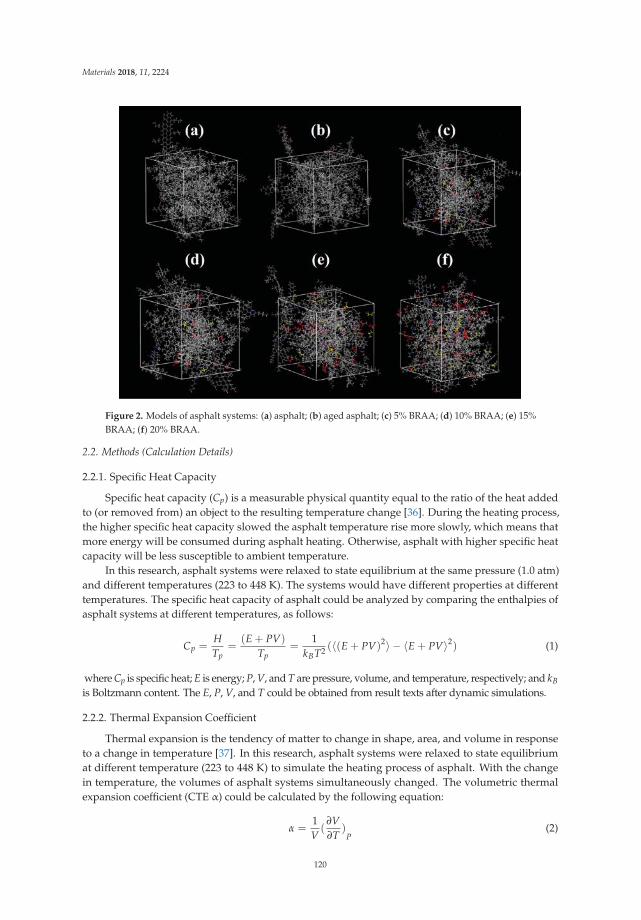
Materials 2018, 11, 2224
Figure 2. Models of asphalt systems: (a) asphalt; (b) aged asphalt; (c) 5% BRAA; (d) 10% BRAA; (e) 15%BRAA; (f) 20% BRAA.
2.2. Methods (Calculation Details)
2.2.1. Specific Heat Capacity
Specific heat capacity (Cp) is a measurable physical quantity equal to the ratio of the heat addedto (or removed from) an object to the resulting temperature change [36]. During the heating process,the higher specific heat capacity slowed the asphalt temperature rise more slowly, which means thatmore energy will be consumed during asphalt heating. Otherwise, asphalt with higher specific heatcapacity will be less susceptible to ambient temperature.
In this research, asphalt systems were relaxed to state equilibrium at the same pressure (1.0 atm)and different temperatures (223 to 448 K). The systems would have different properties at differenttemperatures. The specific heat capacity of asphalt could be analyzed by comparing the enthalpies ofasphalt systems at different temperatures, as follows:
Cp =HTp
=(E + PV)
Tp=
1kBT2 (〈(E + PV)2〉 − 〈E + PV〉2) (1)
where Cp is specific heat; E is energy; P, V, and T are pressure, volume, and temperature, respectively; and kBis Boltzmann content. The E, P, V, and T could be obtained from result texts after dynamic simulations.
2.2.2. Thermal Expansion Coefficient
Thermal expansion is the tendency of matter to change in shape, area, and volume in responseto a change in temperature [37]. In this research, asphalt systems were relaxed to state equilibriumat different temperature (223 to 448 K) to simulate the heating process of asphalt. With the changein temperature, the volumes of asphalt systems simultaneously changed. The volumetric thermalexpansion coefficient (CTE α) could be calculated by the following equation:
α =1V(
∂V∂T
)P
(2)
120
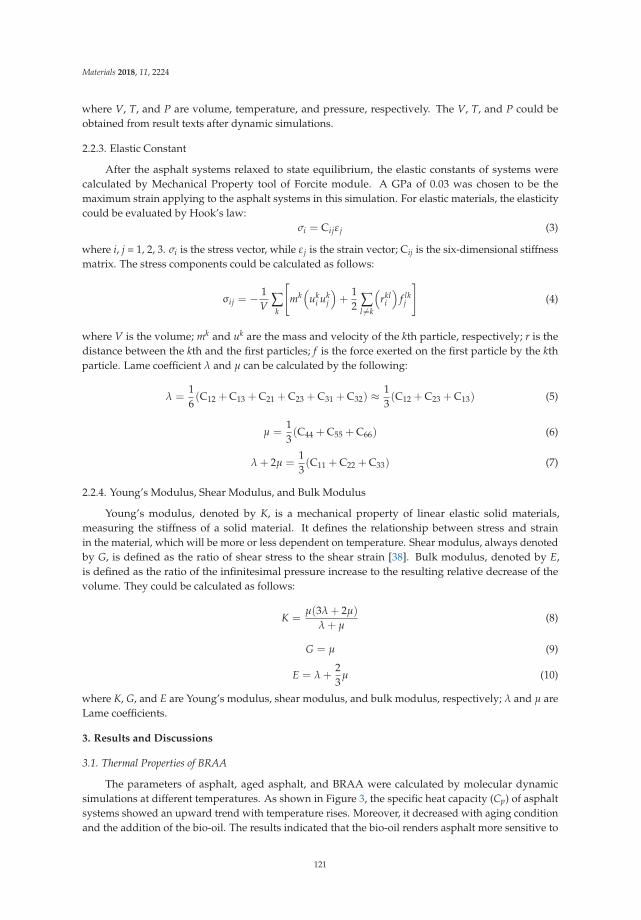
Materials 2018, 11, 2224
where V, T, and P are volume, temperature, and pressure, respectively. The V, T, and P could beobtained from result texts after dynamic simulations.
2.2.3. Elastic Constant
After the asphalt systems relaxed to state equilibrium, the elastic constants of systems werecalculated by Mechanical Property tool of Forcite module. A GPa of 0.03 was chosen to be themaximum strain applying to the asphalt systems in this simulation. For elastic materials, the elasticitycould be evaluated by Hook’s law:
σi = Cijε j (3)
where i, j = 1, 2, 3. σi is the stress vector, while ε j is the strain vector; Cij is the six-dimensional stiffnessmatrix. The stress components could be calculated as follows:
σij = − 1V ∑
k
[mk
(uk
i ukj
)+
12 ∑
l =k
(rkl
i
)f lkj
](4)
where V is the volume; mk and uk are the mass and velocity of the kth particle, respectively; r is thedistance between the kth and the first particles; f is the force exerted on the first particle by the kthparticle. Lame coefficient λ and μ can be calculated by the following:
λ =16(C12 + C13 + C21 + C23 + C31 + C32) ≈ 1
3(C12 + C23 + C13) (5)
μ =13(C44 + C55 + C66) (6)
λ + 2μ =13(C11 + C22 + C33) (7)
2.2.4. Young’s Modulus, Shear Modulus, and Bulk Modulus
Young’s modulus, denoted by K, is a mechanical property of linear elastic solid materials,measuring the stiffness of a solid material. It defines the relationship between stress and strainin the material, which will be more or less dependent on temperature. Shear modulus, always denotedby G, is defined as the ratio of shear stress to the shear strain [38]. Bulk modulus, denoted by E,is defined as the ratio of the infinitesimal pressure increase to the resulting relative decrease of thevolume. They could be calculated as follows:
K =μ(3λ + 2μ)
λ + μ(8)
G = μ (9)
E = λ +23
μ (10)
where K, G, and E are Young’s modulus, shear modulus, and bulk modulus, respectively; λ and μ areLame coefficients.
3. Results and Discussions
3.1. Thermal Properties of BRAA
The parameters of asphalt, aged asphalt, and BRAA were calculated by molecular dynamicsimulations at different temperatures. As shown in Figure 3, the specific heat capacity (Cp) of asphaltsystems showed an upward trend with temperature rises. Moreover, it decreased with aging conditionand the addition of the bio-oil. The results indicated that the bio-oil renders asphalt more sensitive to
121
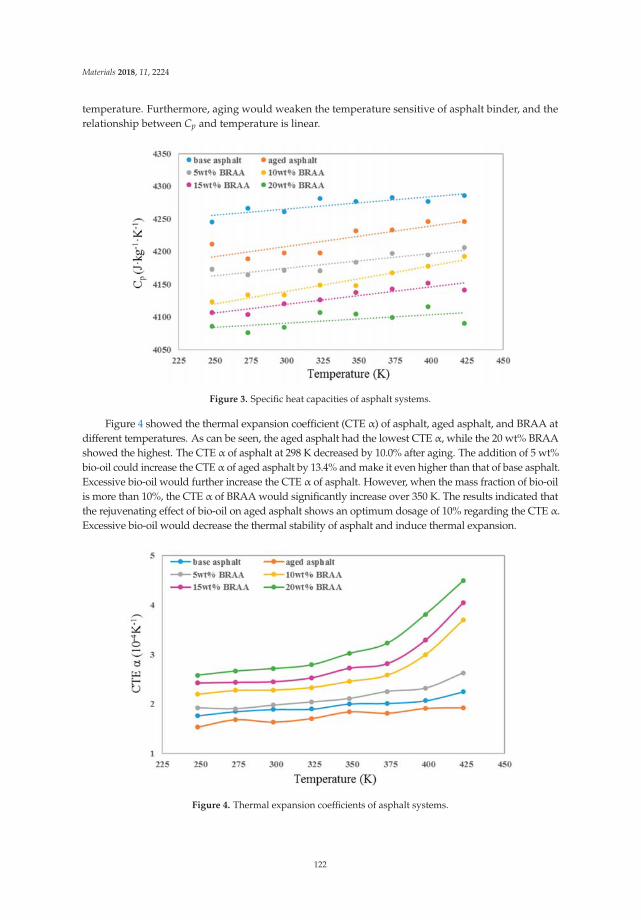
Materials 2018, 11, 2224
temperature. Furthermore, aging would weaken the temperature sensitive of asphalt binder, and therelationship between Cp and temperature is linear.
Figure 3. Specific heat capacities of asphalt systems.
Figure 4 showed the thermal expansion coefficient (CTE α) of asphalt, aged asphalt, and BRAA atdifferent temperatures. As can be seen, the aged asphalt had the lowest CTE α, while the 20 wt% BRAAshowed the highest. The CTE α of asphalt at 298 K decreased by 10.0% after aging. The addition of 5 wt%bio-oil could increase the CTE α of aged asphalt by 13.4% and make it even higher than that of base asphalt.Excessive bio-oil would further increase the CTE α of asphalt. However, when the mass fraction of bio-oilis more than 10%, the CTE α of BRAA would significantly increase over 350 K. The results indicated thatthe rejuvenating effect of bio-oil on aged asphalt shows an optimum dosage of 10% regarding the CTE α.Excessive bio-oil would decrease the thermal stability of asphalt and induce thermal expansion.
Figure 4. Thermal expansion coefficients of asphalt systems.
122
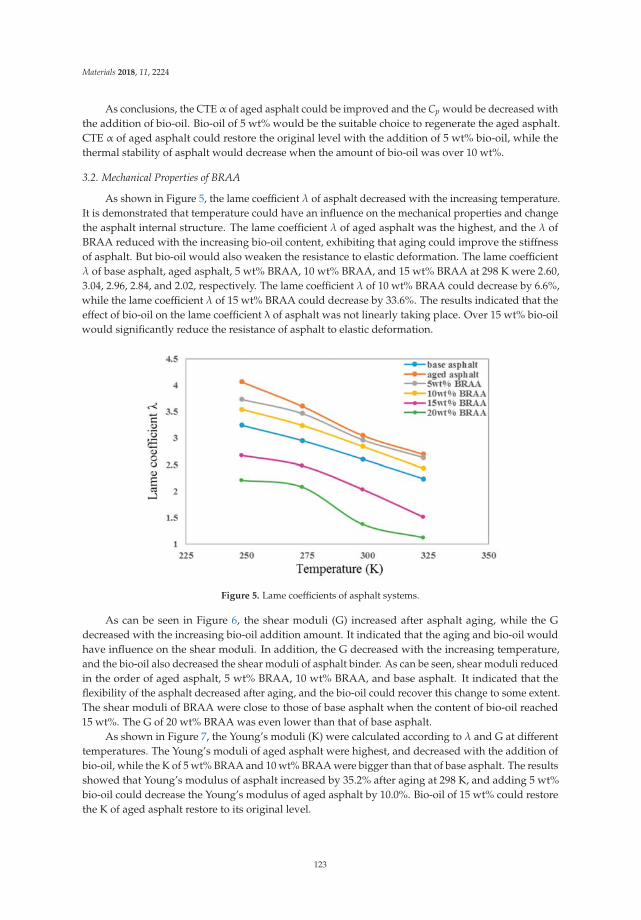
Materials 2018, 11, 2224
As conclusions, the CTE α of aged asphalt could be improved and the Cp would be decreased withthe addition of bio-oil. Bio-oil of 5 wt% would be the suitable choice to regenerate the aged asphalt.CTE α of aged asphalt could restore the original level with the addition of 5 wt% bio-oil, while thethermal stability of asphalt would decrease when the amount of bio-oil was over 10 wt%.
3.2. Mechanical Properties of BRAA
As shown in Figure 5, the lame coefficient λ of asphalt decreased with the increasing temperature.It is demonstrated that temperature could have an influence on the mechanical properties and changethe asphalt internal structure. The lame coefficient λ of aged asphalt was the highest, and the λ ofBRAA reduced with the increasing bio-oil content, exhibiting that aging could improve the stiffnessof asphalt. But bio-oil would also weaken the resistance to elastic deformation. The lame coefficientλ of base asphalt, aged asphalt, 5 wt% BRAA, 10 wt% BRAA, and 15 wt% BRAA at 298 K were 2.60,3.04, 2.96, 2.84, and 2.02, respectively. The lame coefficient λ of 10 wt% BRAA could decrease by 6.6%,while the lame coefficient λ of 15 wt% BRAA could decrease by 33.6%. The results indicated that theeffect of bio-oil on the lame coefficient λ of asphalt was not linearly taking place. Over 15 wt% bio-oilwould significantly reduce the resistance of asphalt to elastic deformation.
Figure 5. Lame coefficients of asphalt systems.
As can be seen in Figure 6, the shear moduli (G) increased after asphalt aging, while the Gdecreased with the increasing bio-oil addition amount. It indicated that the aging and bio-oil wouldhave influence on the shear moduli. In addition, the G decreased with the increasing temperature,and the bio-oil also decreased the shear moduli of asphalt binder. As can be seen, shear moduli reducedin the order of aged asphalt, 5 wt% BRAA, 10 wt% BRAA, and base asphalt. It indicated that theflexibility of the asphalt decreased after aging, and the bio-oil could recover this change to some extent.The shear moduli of BRAA were close to those of base asphalt when the content of bio-oil reached15 wt%. The G of 20 wt% BRAA was even lower than that of base asphalt.
As shown in Figure 7, the Young’s moduli (K) were calculated according to λ and G at differenttemperatures. The Young’s moduli of aged asphalt were highest, and decreased with the addition ofbio-oil, while the K of 5 wt% BRAA and 10 wt% BRAA were bigger than that of base asphalt. The resultsshowed that Young’s modulus of asphalt increased by 35.2% after aging at 298 K, and adding 5 wt%bio-oil could decrease the Young’s modulus of aged asphalt by 10.0%. Bio-oil of 15 wt% could restorethe K of aged asphalt restore to its original level.
123
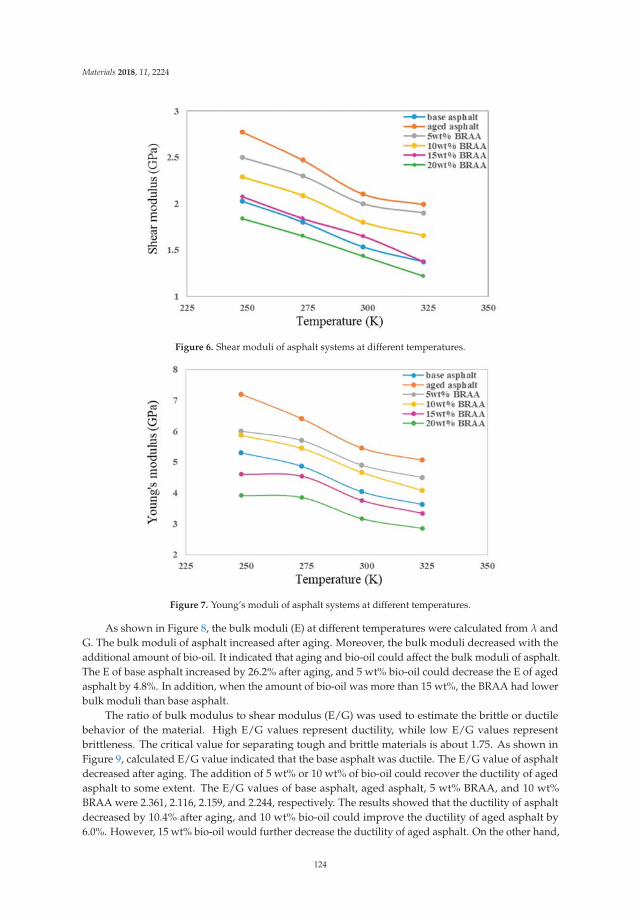
Materials 2018, 11, 2224
Figure 6. Shear moduli of asphalt systems at different temperatures.
Figure 7. Young’s moduli of asphalt systems at different temperatures.
As shown in Figure 8, the bulk moduli (E) at different temperatures were calculated from λ andG. The bulk moduli of asphalt increased after aging. Moreover, the bulk moduli decreased with theadditional amount of bio-oil. It indicated that aging and bio-oil could affect the bulk moduli of asphalt.The E of base asphalt increased by 26.2% after aging, and 5 wt% bio-oil could decrease the E of agedasphalt by 4.8%. In addition, when the amount of bio-oil was more than 15 wt%, the BRAA had lowerbulk moduli than base asphalt.
The ratio of bulk modulus to shear modulus (E/G) was used to estimate the brittle or ductilebehavior of the material. High E/G values represent ductility, while low E/G values representbrittleness. The critical value for separating tough and brittle materials is about 1.75. As shown inFigure 9, calculated E/G value indicated that the base asphalt was ductile. The E/G value of asphaltdecreased after aging. The addition of 5 wt% or 10 wt% of bio-oil could recover the ductility of agedasphalt to some extent. The E/G values of base asphalt, aged asphalt, 5 wt% BRAA, and 10 wt%BRAA were 2.361, 2.116, 2.159, and 2.244, respectively. The results showed that the ductility of asphaltdecreased by 10.4% after aging, and 10 wt% bio-oil could improve the ductility of aged asphalt by6.0%. However, 15 wt% bio-oil would further decrease the ductility of aged asphalt. On the other hand,
124
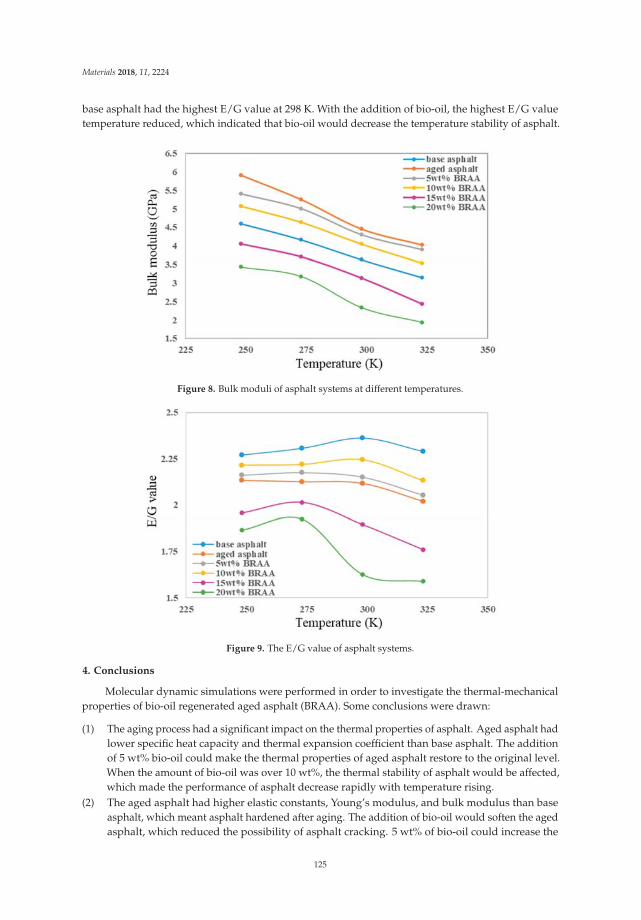
Materials 2018, 11, 2224
base asphalt had the highest E/G value at 298 K. With the addition of bio-oil, the highest E/G valuetemperature reduced, which indicated that bio-oil would decrease the temperature stability of asphalt.
Figure 8. Bulk moduli of asphalt systems at different temperatures.
Figure 9. The E/G value of asphalt systems.
4. Conclusions
Molecular dynamic simulations were performed in order to investigate the thermal-mechanicalproperties of bio-oil regenerated aged asphalt (BRAA). Some conclusions were drawn:
(1) The aging process had a significant impact on the thermal properties of asphalt. Aged asphalt hadlower specific heat capacity and thermal expansion coefficient than base asphalt. The additionof 5 wt% bio-oil could make the thermal properties of aged asphalt restore to the original level.When the amount of bio-oil was over 10 wt%, the thermal stability of asphalt would be affected,which made the performance of asphalt decrease rapidly with temperature rising.
(2) The aged asphalt had higher elastic constants, Young’s modulus, and bulk modulus than baseasphalt, which meant asphalt hardened after aging. The addition of bio-oil would soften the agedasphalt, which reduced the possibility of asphalt cracking. 5 wt% of bio-oil could increase the
125
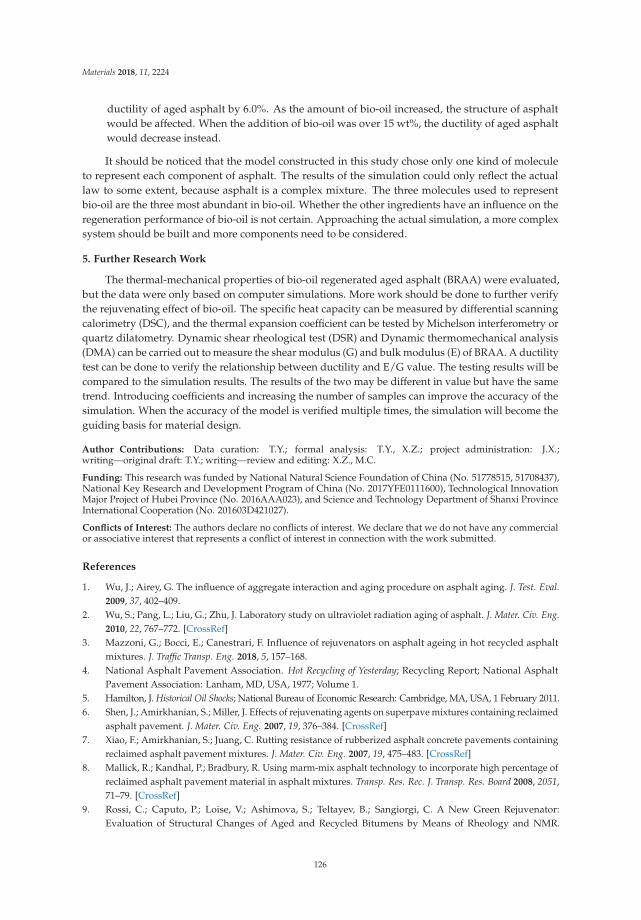
Materials 2018, 11, 2224
ductility of aged asphalt by 6.0%. As the amount of bio-oil increased, the structure of asphaltwould be affected. When the addition of bio-oil was over 15 wt%, the ductility of aged asphaltwould decrease instead.
It should be noticed that the model constructed in this study chose only one kind of moleculeto represent each component of asphalt. The results of the simulation could only reflect the actuallaw to some extent, because asphalt is a complex mixture. The three molecules used to representbio-oil are the three most abundant in bio-oil. Whether the other ingredients have an influence on theregeneration performance of bio-oil is not certain. Approaching the actual simulation, a more complexsystem should be built and more components need to be considered.
5. Further Research Work
The thermal-mechanical properties of bio-oil regenerated aged asphalt (BRAA) were evaluated,but the data were only based on computer simulations. More work should be done to further verifythe rejuvenating effect of bio-oil. The specific heat capacity can be measured by differential scanningcalorimetry (DSC), and the thermal expansion coefficient can be tested by Michelson interferometry orquartz dilatometry. Dynamic shear rheological test (DSR) and Dynamic thermomechanical analysis(DMA) can be carried out to measure the shear modulus (G) and bulk modulus (E) of BRAA. A ductilitytest can be done to verify the relationship between ductility and E/G value. The testing results will becompared to the simulation results. The results of the two may be different in value but have the sametrend. Introducing coefficients and increasing the number of samples can improve the accuracy of thesimulation. When the accuracy of the model is verified multiple times, the simulation will become theguiding basis for material design.
Author Contributions: Data curation: T.Y.; formal analysis: T.Y., X.Z.; project administration: J.X.;writing—original draft: T.Y.; writing—review and editing: X.Z., M.C.
Funding: This research was funded by National Natural Science Foundation of China (No. 51778515, 51708437),National Key Research and Development Program of China (No. 2017YFE0111600), Technological InnovationMajor Project of Hubei Province (No. 2016AAA023), and Science and Technology Department of Shanxi ProvinceInternational Cooperation (No. 201603D421027).
Conflicts of Interest: The authors declare no conflicts of interest. We declare that we do not have any commercialor associative interest that represents a conflict of interest in connection with the work submitted.
References
1. Wu, J.; Airey, G. The influence of aggregate interaction and aging procedure on asphalt aging. J. Test. Eval.2009, 37, 402–409.
2. Wu, S.; Pang, L.; Liu, G.; Zhu, J. Laboratory study on ultraviolet radiation aging of asphalt. J. Mater. Civ. Eng.2010, 22, 767–772. [CrossRef]
3. Mazzoni, G.; Bocci, E.; Canestrari, F. Influence of rejuvenators on asphalt ageing in hot recycled asphaltmixtures. J. Traffic Transp. Eng. 2018, 5, 157–168.
4. National Asphalt Pavement Association. Hot Recycling of Yesterday; Recycling Report; National AsphaltPavement Association: Lanham, MD, USA, 1977; Volume 1.
5. Hamilton, J. Historical Oil Shocks; National Bureau of Economic Research: Cambridge, MA, USA, 1 February 2011.6. Shen, J.; Amirkhanian, S.; Miller, J. Effects of rejuvenating agents on superpave mixtures containing reclaimed
asphalt pavement. J. Mater. Civ. Eng. 2007, 19, 376–384. [CrossRef]7. Xiao, F.; Amirkhanian, S.; Juang, C. Rutting resistance of rubberized asphalt concrete pavements containing
reclaimed asphalt pavement mixtures. J. Mater. Civ. Eng. 2007, 19, 475–483. [CrossRef]8. Mallick, R.; Kandhal, P.; Bradbury, R. Using marm-mix asphalt technology to incorporate high percentage of
reclaimed asphalt pavement material in asphalt mixtures. Transp. Res. Rec. J. Transp. Res. Board 2008, 2051,71–79. [CrossRef]
9. Rossi, C.; Caputo, P.; Loise, V.; Ashimova, S.; Teltayev, B.; Sangiorgi, C. A New Green Rejuvenator:Evaluation of Structural Changes of Aged and Recycled Bitumens by Means of Rheology and NMR.
126
Materials 2018, 11, 2224
In RILEM 252-CMB-Symposium on Chemo Mechanical Characterization of Bituminous Materials; Springer:Arcavacata di Rende, Italy, 2018; pp. 177–182.
10. Xiu, S.; Shahbazi, A. Bio-oil production and upgrading research: A review renewable and sustainable. EnergyRev. 2012, 16, 4406–4414.
11. Fini, E.; Kalberer, E.; Shahbazi, A.; Basti, M.; You, Z.; Ozer, H.; Aurangzeb, Q. Chemical characterizationof biobinder from swine manure: Sustainable modifier for asphalt binder. J. Mater. Civ. Eng. 2011, 23,1506–1513. [CrossRef]
12. Prakash, R.; Singh, R.; Murugan, S. Experimental investigation on a diesel engine fueled with bio-oil derivedfrom waste wood-biodiesel emulsions. Energy 2013, 55, 610–618. [CrossRef]
13. Yang, X.; You, Z. High temperature performance evaluation of bio-oil modified asphalt binders using theDSR and MSCR tests. Constr. Build. Mater. 2015, 76, 380–387. [CrossRef]
14. Gao, J.; Wang, H.; You, Z.; Mohd Hasan, M.R. Research on properties of bio-asphalt binders based on timeand frequency sweep test. Constr. Build. Mater. 2018, 160, 786–793. [CrossRef]
15. Yang, X.; You, Z.; Dai, Q. Performance Evaluation of asphalt binder modified by bio-oil generated fromwaste wood resources. Int. J. Pavement Res. Technol. 2013, 6, 431–439.
16. Yang, X.; You, Z.; Dai, Q.; Mills-Beale, J. Mechanical performance of asphalt mixtures modified by bio-oilsderived from waste wood resources. Constr. Build. Mater. 2014, 51, 424–431. [CrossRef]
17. Cuadri, A.; García-Morales, M.; Navarro, F.; Partal, P. Processing of bitumens modified by a bio-oil-derivedpolyurethane. Fuel 2014, 118, 83–90. [CrossRef]
18. Williams, A.; Jones, J.; Ma, L.; Pourkashanian, M. Pollutants from the combustion of solid biomass fuels.Prog. Energy Combust. Sci. 2012, 38, 113–137. [CrossRef]
19. Yang, S.; Suciptan, T.; Chang, Y. Investigation of rheological behavior of Japanese cedar based bio-binderas partial replacement for bituminous binder. In Proceedings of the Transportation Research Board 92ndAnnual Meeting, Washington, DC, USA, 13–17 January 2013.
20. Guarin, A.; Khan, A.; Butt, A.; Birgisson, B.; Kringos, N. An extensive laboratory investigation of the use ofbio-oil modified bitumen in road construction. Constr. Build. Mater. 2016, 106, 133–139. [CrossRef]
21. Sun, Z.; Yi, J.; Feng, D.; Kasbergen, C.; Scarpas, A.; Zhu, Y. Preparation of bio-bitumen by bio-oil based onfree radical polymerization and production process optimization. J. Clean. Prod. 2018, 189, 21–29. [CrossRef]
22. Sun, B.; Zhou, X. Diffusion and rheological properties of asphalt modified by bio-oil regenerant derivedfrom waste wood. J. Mater. Civ. Eng. 2017, 119, 1–11. [CrossRef]
23. Yang, X.; Mills-Beale, J.; You, Z. Chemical characterization and oxidative aging of bio-asphalt and itscompatibility with petroleum asphalt. J. Clean. Prod. 2017, 142, 1837–1847. [CrossRef]
24. Alder, B.; Wainwright, T. Studies in molecular dynamics. I. General method. J. Chem. Phys. 1959, 31, 459–466.[CrossRef]
25. Rahman, A. Correlations in the motion of atoms in liquid argon. Phys. Rev. 1964, 136, A405. [CrossRef]26. Boek, E.; Yakovlev, D.; Headen, T.F. Quantitative molecular representation of asphaltenes and molecular
dynamics simulation of their aggregation. Energy Fuels 2009, 23, 1209. [CrossRef]27. Pan, T.; Yu, Q.; Lloyd, S. Quantum-chemistry based study of beechwood lignin as an antioxidant of petroleum
asphalt. J. Mater. Civ. Eng. 2013, 10, 1477–1488. [CrossRef]28. Allen, M.; Tildesley, D. Computer Simulation of Liquids; Oxford University Press: Oxford, UK, 22 August 2017.29. Zhang, L.; Greenfield, M. Effects of polymer modification on properties and micro-structure of model asphalt
systems. Energy Fuels 2008, 22, 3363–3375. [CrossRef]30. Zhang, L.; Greenfield, M. Molecular orientation in model asphalts using molecular simulation. Energy Fuels
2007, 21, 1102–1111. [CrossRef]31. Groenzin, H.; Mullins, O. Molecular size and structure of asphaltenes from various sources. Energy Fuels
2000, 14, 677–684. [CrossRef]32. Li, D.; Greenfield, M. Chemical compositions of improved model asphalt systems for molecular simulations.
Fuel 2014, 115, 347–356. [CrossRef]33. Bai, A.; Zhou, X. Self-healing Properties of Bio-oil Regenerated Asphalt. J. Chongqing Jiaotong Univ. (Nat. Sci.)
2018, 8, 29–33.34. Nie, Y.; Zhang, Y.; Yu, J.; Kuang, D.L.; Zhang, X.P. Research on aging mechanism and recycling mechanism
based on asphalt four components analysis. Appl. Mech. Mater. 2012, 204–208, 1659–1664. [CrossRef]
127

Materials 2018, 11, 2224
35. Zhang, R. Fuels and Chemicals Derived from Biomass; Zhengzhou University Press: Zhengzhou, China,September 2004.
36. Halliday, D.; Resnick, R. Fundamentals of Physics; John Wiley & Sons: Hoboken, NJ, USA, 1981.37. Tipler, P.; Mosca, G. Physics for Scientists and Engineers; Macmillan: London, UK, 2007.38. McNaught, A. Compendium of Chemical Terminology; Blackwell Science: Oxford, UK, 1997.
© 2018 by the authors. Licensee MDPI, Basel, Switzerland. This article is an open accessarticle distributed under the terms and conditions of the Creative Commons Attribution(CC BY) license (http://creativecommons.org/licenses/by/4.0/).
128
materials
Article
A Comprehensive Evaluation of Rejuvenator onMechanical Properties, Durability, and DynamicCharacteristics of Artificially Aged Asphalt Mixture
Pan Pan 1,2,3, Yi Kuang 3,4, Xiaodi Hu 3,* and Xiao Zhang 1,2,*
1 Key Laboratory of Highway Construction and Maintenance Technology in Loess Region, Ministry ofTransport, Taiyuan 030006, China; [email protected]
2 Key Laboratory of Highway Construction and Maintenance Technology in Loess Region, ShanxiTransportation Research Institute, Taiyuan 030006, China
3 School of Civil Engineering and Architecture, Wuhan Institute of Technology, Wuhan 430205, China;[email protected]
4 State Key Laboratory of Silicate Materials for Architectures, Wuhan University of Technology,Wuhan 430070, China
* Correspondence: [email protected] (X.H.); [email protected] (X.Z.);Tel.: +86-027-87194823 (X.H.); +86-0351-7585750 (X.Z.)
Received: 29 July 2018; Accepted: 27 August 2018; Published: 29 August 2018
Abstract: In this study, the aged asphalt binder and mixture were laboratory prepared throughshort-term ageing testing and long-term ageing testing. Firstly, the effect of rejuvenator on physicalproperties of aged asphalt binders was investigated. In addition, a series of laboratory tests wereperformed to evaluate the influence of ageing and rejuvenator content on the mechanical properties,durability and dynamic characteristics of asphalt mixtures. Physical test results of asphalt bindertestified that rejuvenator used can efficiently recover the aged asphalt binder. However, the effect ofageing and rejuvenator content exhibits different trends depending on the physical property testsconducted. Moreover, artificially aged asphalt mixture with rejuvenator has better ability to resistmoisture damage and ravelling. In addition, the ITSR value is more suitable to evaluate the moisturesusceptibility for asphalt recycling. Although rejuvenator improves the thermal cracking resistanceand fatigue property of aged asphalt mixture, rejuvenated mixture shows greater modulus andinferior ability to resist reflective cracking than the unaged mixture. Moreover, rejuvenated mixtureshows less dependence on frequency at high temperature regions and stronger dependence at lowtemperature regions compared to unaged and long-term aged mixtures.
Keywords: artificially aged asphalt mixture; rejuvenator; durability; dynamic characteristics;overlay tester
1. Introduction
Asphalt mixture is widely used as a common road material for structural layers of pavementworldwide. During the service period, weather conditions and repeated load would deteriorate themechanical performance and durability of the asphalt mixture, and then lead to some irreversiblepavement distresses such as ravelling, rutting, cracking, etc. Removal of old pavement structureconsequently produces a large amount of reclaimed asphalt pavement (RAP). For instance, more than60,000,000 t of RAP material can be obtained annually in China [1]. To reduce the construction costand generate environmental benefits, different countries have launched a series of experimental andpractical researches on application of RAP material in new pavement construction [2,3].
Previous studies have confirmed that ageing of asphalt binder is the main cause of durabilityfailure of asphalt pavement [4–6]. The ageing processes of asphalt pavement consists of short-term
Materials 2018, 11, 1554; doi:10.3390/ma11091554 www.mdpi.com/journal/materials129
Materials 2018, 11, 1554
ageing during the mixing and construction phase, and long-term ageing during the service life in thefield. There are many reasons that can lead to asphalt binder ageing including oxidation, volatilization,absorption by aggregate, thermal polymerization, etc. [7]. According to the molecular characteristics,asphalt binder can be divided into four fractions: saturates, aromatics, resins, and asphaltenes. From thechemical composition point of view, ageing effect increases resins and asphaltenes while reducesaromatics in RAP binder, compared to the virgin asphalt binder [8]. Due to the aged RAP binder,recycling asphalt pavement is prone to ravelling and low temperature cracking [9–11]. Based on thecomponent control theory of asphalt recycling, soft binder is needed to reduce the asphaltene contentand increase the aromatic content of the aged RAP binder, in order to minimize the negative impact ofusing RAP material in recycling asphalt pavement.
Rejuvenators, including plant oils, waster derived oils and engineered products, can provide analternative method to restore the aged asphalt for hot asphalt recycling [12–14]. Many research studieshave been conducted to evaluate the effectiveness of different types of rejuvenators on artificially agedasphalt binder or/and aged RAP binder. In this case, the aged binder is heated and blended with therejuvenator. Chen et al. investigated the effect of waste edible vegetable oil on artificially aged asphaltbinder. They concluded that waste edible vegetable oil can be used as a rejuvenator in recycling asphaltpavement [8]. Based on Superpave design specification, Zaumanis et al. developed a procedure todetermine the optimum rejuvenator content for modifying RAP binder [15]. It is highlighted thatconsidering ageing effect is helpful for better understanding the effect mechanism of rejuvenator onRAP binder [16]. Although the rejuvenator can recover the physical and rheological properties ofaged asphalt binder to some extent, the rejuvenated asphalt binder is more prone to ageing than thevirgin binder [17]. Moreover, both experimental and simulation results testified that the diffusionand distribution of rejuvenator play an important role in affecting the engineering performance ofrecycling asphalt mixture [18,19]. In a study conducted by Wang et al., the mortar transfer ratio (MTR)test was employed to study the diffusion characteristics of rejuvenator in aged asphalt [20].
By summarizing the present recycled asphalt techniques, Moghaddam et al. found that the mostcommon way to use rejuvenator is mixing them with aged asphalt mixture at high temperature [2].According to Chinese Specification, the rejuvenator is added and mixed with the reclaimed asphaltmixture, new aggregate and virgin asphalt to obtain the recycling asphalt mixture [21]. Therefore,it is worth noting that the actual production of hot asphalt recycling is quite different from thatof the rejuvenated asphalt binder. Im et al. compared three different rejuvenators on engineeringperformance of asphalt mixtures containing recycles materials. They concluded that the effectivenessof rejuvenators prepared by different sources on recycled asphalt mixture depends on the engineeringproperties concerned [22].
For proper field usage of rejuvenator, it is of high priority to balance the cracking and ruttingperformance of recycled asphalt mixture. The rejuvenator should reduce fatigue and low temperaturecracking potential whilst maintaining stability to rutting [23,24]. Therefore, it is necessary to obtain acomprehensive understanding of the engineering properties for rejuvenated asphalt mixture. Moreover,there is also a need for sufficient understanding of the dynamic characteristics of recycled hot mixasphalt. These problems of recycled hot mix asphalt with rejuvenator provide the motivation toundertake this research.
In this study, a series of laboratory tests were conducted to investigate the influences of rejuvenatorcontent on mechanical properties, durability and dynamic characteristics of artificially aged asphaltmixture. By studying the effect of using different amounts of a rejuvenator in recycled HMA and inaged binders subjected to different ageing times, this paper can not only clarify the effect of ageingprocess and rejuvenator content on the concerned properties of asphalt binder and HMA, but alsodemonstrate the suitability of available test or indicator to evaluate the performance of rejuvenatedasphalt mixture. The finding of this study could help to gain a comprehensive understanding ofrejuvenated asphalt mixture, and therefore contributes to proper usage of rejuvenator in recycledasphalt pavement.
130
Materials 2018, 11, 1554
2. Materials and Experimental
2.1. Materials
AH-90 paving asphalt with a penetration of 96 dmm (deci-millimetre, 25 ◦C), a softening pointof 48.6 ◦C and a ductility of 156 cm was obtained from the Hubei Guochang Hi-tech Material Co.,Ltd., Wuhan, China. The crushed diabase aggregate has a density of 2.953 g/cm3 and a particle sizeless than 16 mm. The limestone filler (LF) with a density of 2.699 g/cm3 was used as the mineralfiller. The rejuvenator in this study was petroleum derived product, which was obtained from market.Table 1 illustrates the technical parameters of rejuvenator.
Table 1. Technical parameters of rejuvenator.
Properties Rejuvenator Test Method
Form LiquidColor Brown
pH 5.6 pH test paperViscosity (25 ◦C), SFS 15 ASTM D-244
Solute component (wt %) 60 ASTM D-244Regeneration component (wt %) 8 ASTM D-2006-70Asphaltene component (wt %) 0.75
2.2. Sample Preparation
For asphalt binder, aged samples were prepared by the thin film oven test, TFOT (ASTM D1754)and the pressurized ageing vessel, PAV test (ASTM D6521). The detailed TFOT and PAV test procedureswere described in a previous research work [25]. For the standard PAV test, asphalt binder sampleis needed to be placed in the PAV for 20 h ± 10 min. To simulate different long-term ageing history,TFOT aged asphalt binders were treated by PAV test within 5 h, 10 h, 15 h and 20 h, respectively.Generally, 20 h of PAV ageing approximates 2 to 3 years of asphalt pavement in service. Another TFOTaged binder without PAV test was employed as a control sample. Then, four dosages of rejuvenator(2.0%, 4.0%, 6.0% and 8.0%, by weight of binder) were added into each TFOT and PAV aged asphaltbinder. The rejuvenated binder was blended using the propeller mixer at a constant speed of 800 rpmfor 20 min at 135 ◦C. All the aged and rejuvenated asphalt binders were used for physical propertiestests in Section 2.3.
Figure 1 shows the gradation curve of asphalt mixture with the nominal maximum size of 13 mm.The upper and lower limits of gradation followed to the Chinese Specification of JTG F40-2004 [26].The content of mineral filler was 4% by weight of aggregate and the optimum asphalt content was 4.7%by weight of asphalt mixture. Aged asphalt mixtures were prepared by short-term ageing (STA) testand long-term ageing (LTA) test according to JTG E20 T0734 [27]. During the STA test, the incompactasphalt mixture was firstly spread to a height of 50 mm on a metal pan and placed in a force draft ovenat 135 ◦C for 4 h. Then the compacted samples were prepared by STA aged mixture to perform LTAtest, which were placed in the oven at 85 ◦C for 5 days. Finally, heated LTA aged sample was brokenapart and then mixed with rejuvenator to prepare rejuvenated sample. All the unaged, LTA aged,and rejuvenated samples were used for mechanical properties, durability and dynamic modulus testsin Section 2.4.
131
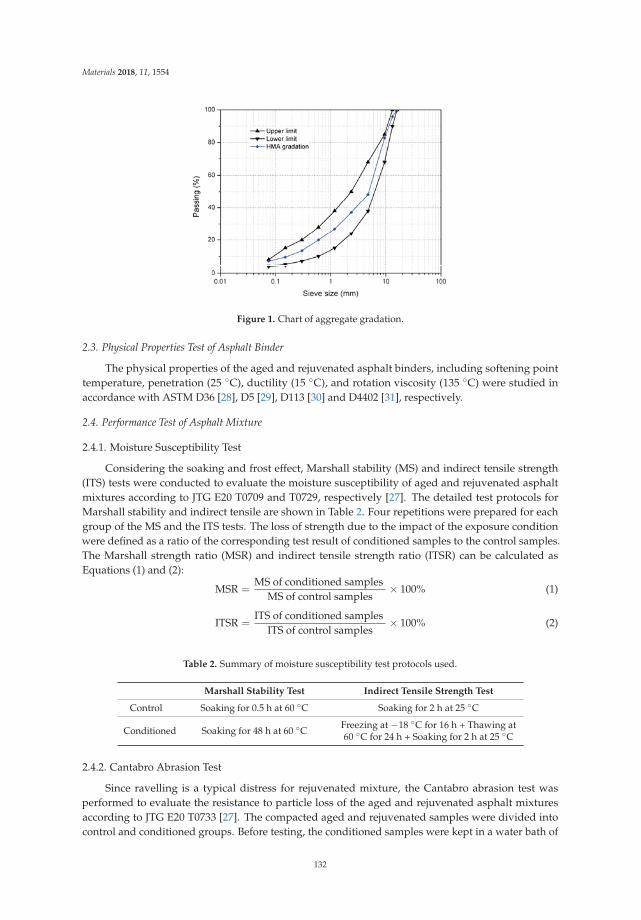
Materials 2018, 11, 1554
Figure 1. Chart of aggregate gradation.
2.3. Physical Properties Test of Asphalt Binder
The physical properties of the aged and rejuvenated asphalt binders, including softening pointtemperature, penetration (25 ◦C), ductility (15 ◦C), and rotation viscosity (135 ◦C) were studied inaccordance with ASTM D36 [28], D5 [29], D113 [30] and D4402 [31], respectively.
2.4. Performance Test of Asphalt Mixture
2.4.1. Moisture Susceptibility Test
Considering the soaking and frost effect, Marshall stability (MS) and indirect tensile strength(ITS) tests were conducted to evaluate the moisture susceptibility of aged and rejuvenated asphaltmixtures according to JTG E20 T0709 and T0729, respectively [27]. The detailed test protocols forMarshall stability and indirect tensile are shown in Table 2. Four repetitions were prepared for eachgroup of the MS and the ITS tests. The loss of strength due to the impact of the exposure conditionwere defined as a ratio of the corresponding test result of conditioned samples to the control samples.The Marshall strength ratio (MSR) and indirect tensile strength ratio (ITSR) can be calculated asEquations (1) and (2):
MSR =MS of conditioned samples
MS of control samples× 100% (1)
ITSR =ITS of conditioned samples
ITS of control samples× 100% (2)
Table 2. Summary of moisture susceptibility test protocols used.
Marshall Stability Test Indirect Tensile Strength Test
Control Soaking for 0.5 h at 60 ◦C Soaking for 2 h at 25 ◦C
Conditioned Soaking for 48 h at 60 ◦C Freezing at −18 ◦C for 16 h + Thawing at60 ◦C for 24 h + Soaking for 2 h at 25 ◦C
2.4.2. Cantabro Abrasion Test
Since ravelling is a typical distress for rejuvenated mixture, the Cantabro abrasion test wasperformed to evaluate the resistance to particle loss of the aged and rejuvenated asphalt mixturesaccording to JTG E20 T0733 [27]. The compacted aged and rejuvenated samples were divided intocontrol and conditioned groups. Before testing, the conditioned samples were kept in a water bath of
132
Materials 2018, 11, 1554
20 ◦C for 20 h. Then, four repetitions for each group were individually put in the Los Angeles abrasiondevice without steel balls. The abrasion test would be stopped when Los Angeles drum rotated for300 revolutions at a speed of 30–33 revolutions per minute. After testing, the loose particles broken offfrom the surface of the testing sample were discarded. The mass loss ratio of sample before and afterthe test was adopted to evaluate the resistance to particle loss of mixture, which can be calculated asEquation (3):
Massloss =
(1 − sample mass after test
sample mass before test
)× 100% (3)
2.4.3. Wheel Tracking Test
The wheel tracking test was employed to evaluate the resistance to permanent deformation ofthe aged and rejuvenated asphalt mixtures under dry condition. The size of test sample is 300 mmin length, 300 mm in width and 50 mm in height. Before testing, the aged and rejuvenated sampleswere kept in the test device of 60 ◦C for 6 h. The repeated load was 0.7 MPa at 60 ◦C and the wheelspeed was 42 passes per minute. The rutting depth of samples during the testing process was recorded.Dynamic stability can be calculated by the rutting depth of 45 min and 60 min as Equation (4) accordingto JTG E20 T0719 [27].
DS =15 × 42
RD60 − RD45(4)
where DS is dynamic stability, times/mm; RD45 and RD60 are the rutting depth at 45 and 60 minrespectively, mm.
2.4.4. Dynamic Uniaxial Compression Test
Dynamic uniaxial compression test was also carried out to assess the high temperature stabilityof the aged and rejuvenated asphalt mixtures according to BS EN 12697-25 [32]. Test samples with adiameter of 100 mm and a height of 110 mm were prepared by coring and cutting the SGC samples.Before testing, the aged and rejuvenated samples were kept in the test device of 60 ◦C for 4 h.A haversine load with a peak stress of 0.7 MPa was applied on the sample for 3600 s at 60 ◦C.
2.4.5. Three-Point Bending Test
Three-point bending test was employed to evaluate the low temperature performance of the agedand rejuvenated asphalt mixtures according to JTG E20 T0715 [27]. The beam samples with 250 mmin length, 30 mm in width and 35 mm in height, were tested by a loading of 50 mm/min at −10 ◦C.Before testing, the samples were kept in the test device of −10 ◦C for 8 h. Four test repetitions wereprepared for each mixture and the average value was used. The flexural strength, flexural strain, andflexural stiffness modulus were calculated by following equations:
RB =3LPB
2bh2 (5)
εB =6hdL2 (6)
SB =RB
εB(7)
where PB is peak load at failure, kN; RB is flexural strength, MPa; εB is flexural strain; SB is flexuralstiffness modulus, MPa; L, b and h are length, width and height of sample, respectively, mm.
2.4.6. Overlay Tester
The Overlay Tester (OT) was conducted to evaluate the reflective cracking resistance of theaged and rejuvenated asphalt mixtures according to TxDOT standard specification Tex-248F [33].
133
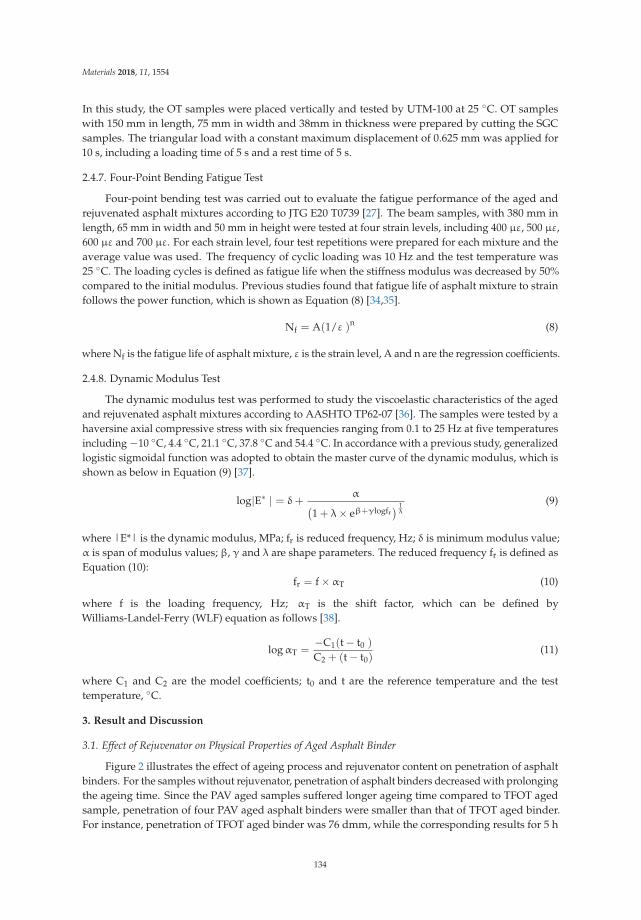
Materials 2018, 11, 1554
In this study, the OT samples were placed vertically and tested by UTM-100 at 25 ◦C. OT sampleswith 150 mm in length, 75 mm in width and 38mm in thickness were prepared by cutting the SGCsamples. The triangular load with a constant maximum displacement of 0.625 mm was applied for10 s, including a loading time of 5 s and a rest time of 5 s.
2.4.7. Four-Point Bending Fatigue Test
Four-point bending test was carried out to evaluate the fatigue performance of the aged andrejuvenated asphalt mixtures according to JTG E20 T0739 [27]. The beam samples, with 380 mm inlength, 65 mm in width and 50 mm in height were tested at four strain levels, including 400 με, 500 με,600 με and 700 με. For each strain level, four test repetitions were prepared for each mixture and theaverage value was used. The frequency of cyclic loading was 10 Hz and the test temperature was25 ◦C. The loading cycles is defined as fatigue life when the stiffness modulus was decreased by 50%compared to the initial modulus. Previous studies found that fatigue life of asphalt mixture to strainfollows the power function, which is shown as Equation (8) [34,35].
Nf = A(1/ε )n (8)
where Nf is the fatigue life of asphalt mixture, ε is the strain level, A and n are the regression coefficients.
2.4.8. Dynamic Modulus Test
The dynamic modulus test was performed to study the viscoelastic characteristics of the agedand rejuvenated asphalt mixtures according to AASHTO TP62-07 [36]. The samples were tested by ahaversine axial compressive stress with six frequencies ranging from 0.1 to 25 Hz at five temperaturesincluding −10 ◦C, 4.4 ◦C, 21.1 ◦C, 37.8 ◦C and 54.4 ◦C. In accordance with a previous study, generalizedlogistic sigmoidal function was adopted to obtain the master curve of the dynamic modulus, which isshown as below in Equation (9) [37].
log|E∗ | = δ+α(
1 + λ× eβ+γlogfr) 1λ
(9)
where |E*| is the dynamic modulus, MPa; fr is reduced frequency, Hz; δ is minimum modulus value;α is span of modulus values; β, γ and λ are shape parameters. The reduced frequency fr is defined asEquation (10):
fr = f × αT (10)
where f is the loading frequency, Hz; αT is the shift factor, which can be defined byWilliams-Landel-Ferry (WLF) equation as follows [38].
logαT =−C1(t − t0 )
C2 + (t − t0)(11)
where C1 and C2 are the model coefficients; t0 and t are the reference temperature and the testtemperature, ◦C.
3. Result and Discussion
3.1. Effect of Rejuvenator on Physical Properties of Aged Asphalt Binder
Figure 2 illustrates the effect of ageing process and rejuvenator content on penetration of asphaltbinders. For the samples without rejuvenator, penetration of asphalt binders decreased with prolongingthe ageing time. Since the PAV aged samples suffered longer ageing time compared to TFOT agedsample, penetration of four PAV aged asphalt binders were smaller than that of TFOT aged binder.For instance, penetration of TFOT aged binder was 76 dmm, while the corresponding results for 5 h
134
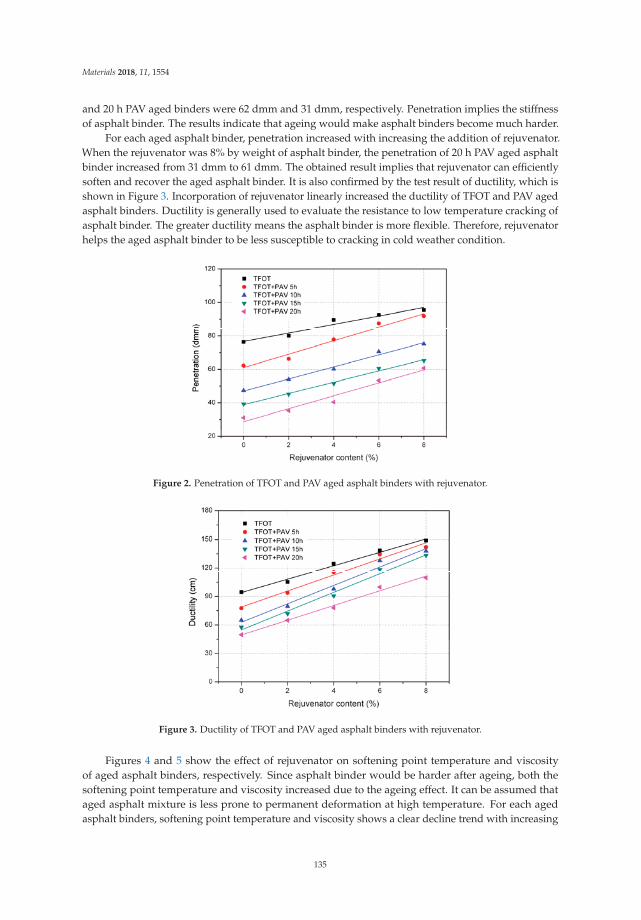
Materials 2018, 11, 1554
and 20 h PAV aged binders were 62 dmm and 31 dmm, respectively. Penetration implies the stiffnessof asphalt binder. The results indicate that ageing would make asphalt binders become much harder.
For each aged asphalt binder, penetration increased with increasing the addition of rejuvenator.When the rejuvenator was 8% by weight of asphalt binder, the penetration of 20 h PAV aged asphaltbinder increased from 31 dmm to 61 dmm. The obtained result implies that rejuvenator can efficientlysoften and recover the aged asphalt binder. It is also confirmed by the test result of ductility, which isshown in Figure 3. Incorporation of rejuvenator linearly increased the ductility of TFOT and PAV agedasphalt binders. Ductility is generally used to evaluate the resistance to low temperature cracking ofasphalt binder. The greater ductility means the asphalt binder is more flexible. Therefore, rejuvenatorhelps the aged asphalt binder to be less susceptible to cracking in cold weather condition.
Figure 2. Penetration of TFOT and PAV aged asphalt binders with rejuvenator.
Figure 3. Ductility of TFOT and PAV aged asphalt binders with rejuvenator.
Figures 4 and 5 show the effect of rejuvenator on softening point temperature and viscosityof aged asphalt binders, respectively. Since asphalt binder would be harder after ageing, both thesoftening point temperature and viscosity increased due to the ageing effect. It can be assumed thataged asphalt mixture is less prone to permanent deformation at high temperature. For each agedasphalt binders, softening point temperature and viscosity shows a clear decline trend with increasing
135
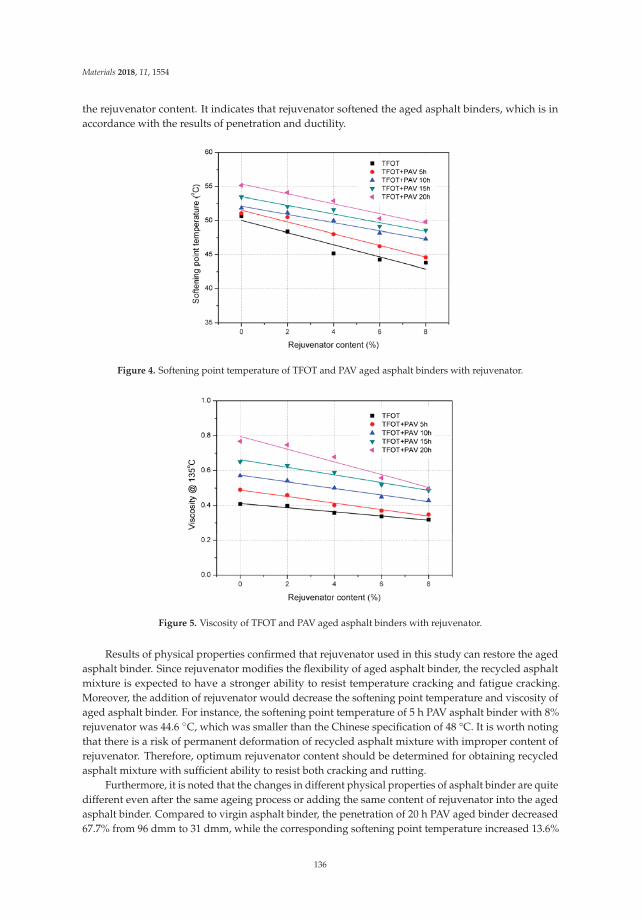
Materials 2018, 11, 1554
the rejuvenator content. It indicates that rejuvenator softened the aged asphalt binders, which is inaccordance with the results of penetration and ductility.
Figure 4. Softening point temperature of TFOT and PAV aged asphalt binders with rejuvenator.
Figure 5. Viscosity of TFOT and PAV aged asphalt binders with rejuvenator.
Results of physical properties confirmed that rejuvenator used in this study can restore the agedasphalt binder. Since rejuvenator modifies the flexibility of aged asphalt binder, the recycled asphaltmixture is expected to have a stronger ability to resist temperature cracking and fatigue cracking.Moreover, the addition of rejuvenator would decrease the softening point temperature and viscosity ofaged asphalt binder. For instance, the softening point temperature of 5 h PAV asphalt binder with 8%rejuvenator was 44.6 ◦C, which was smaller than the Chinese specification of 48 °C. It is worth notingthat there is a risk of permanent deformation of recycled asphalt mixture with improper content ofrejuvenator. Therefore, optimum rejuvenator content should be determined for obtaining recycledasphalt mixture with sufficient ability to resist both cracking and rutting.
Furthermore, it is noted that the changes in different physical properties of asphalt binder are quitedifferent even after the same ageing process or adding the same content of rejuvenator into the agedasphalt binder. Compared to virgin asphalt binder, the penetration of 20 h PAV aged binder decreased67.7% from 96 dmm to 31 dmm, while the corresponding softening point temperature increased 13.6%
136
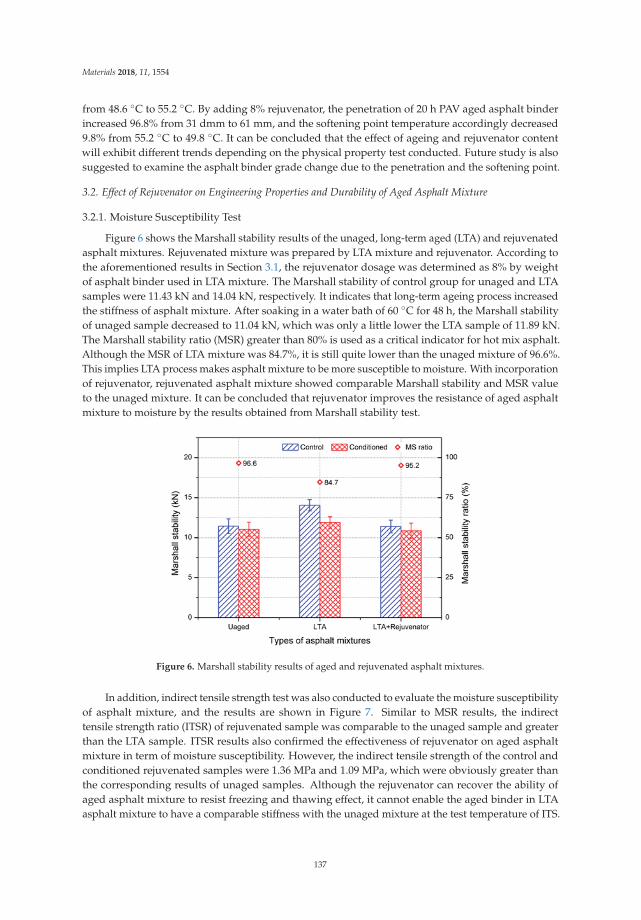
Materials 2018, 11, 1554
from 48.6 ◦C to 55.2 ◦C. By adding 8% rejuvenator, the penetration of 20 h PAV aged asphalt binderincreased 96.8% from 31 dmm to 61 mm, and the softening point temperature accordingly decreased9.8% from 55.2 ◦C to 49.8 ◦C. It can be concluded that the effect of ageing and rejuvenator contentwill exhibit different trends depending on the physical property test conducted. Future study is alsosuggested to examine the asphalt binder grade change due to the penetration and the softening point.
3.2. Effect of Rejuvenator on Engineering Properties and Durability of Aged Asphalt Mixture
3.2.1. Moisture Susceptibility Test
Figure 6 shows the Marshall stability results of the unaged, long-term aged (LTA) and rejuvenatedasphalt mixtures. Rejuvenated mixture was prepared by LTA mixture and rejuvenator. According tothe aforementioned results in Section 3.1, the rejuvenator dosage was determined as 8% by weightof asphalt binder used in LTA mixture. The Marshall stability of control group for unaged and LTAsamples were 11.43 kN and 14.04 kN, respectively. It indicates that long-term ageing process increasedthe stiffness of asphalt mixture. After soaking in a water bath of 60 ◦C for 48 h, the Marshall stabilityof unaged sample decreased to 11.04 kN, which was only a little lower the LTA sample of 11.89 kN.The Marshall stability ratio (MSR) greater than 80% is used as a critical indicator for hot mix asphalt.Although the MSR of LTA mixture was 84.7%, it is still quite lower than the unaged mixture of 96.6%.This implies LTA process makes asphalt mixture to be more susceptible to moisture. With incorporationof rejuvenator, rejuvenated asphalt mixture showed comparable Marshall stability and MSR valueto the unaged mixture. It can be concluded that rejuvenator improves the resistance of aged asphaltmixture to moisture by the results obtained from Marshall stability test.
Figure 6. Marshall stability results of aged and rejuvenated asphalt mixtures.
In addition, indirect tensile strength test was also conducted to evaluate the moisture susceptibilityof asphalt mixture, and the results are shown in Figure 7. Similar to MSR results, the indirecttensile strength ratio (ITSR) of rejuvenated sample was comparable to the unaged sample and greaterthan the LTA sample. ITSR results also confirmed the effectiveness of rejuvenator on aged asphaltmixture in term of moisture susceptibility. However, the indirect tensile strength of the control andconditioned rejuvenated samples were 1.36 MPa and 1.09 MPa, which were obviously greater thanthe corresponding results of unaged samples. Although the rejuvenator can recover the ability ofaged asphalt mixture to resist freezing and thawing effect, it cannot enable the aged binder in LTAasphalt mixture to have a comparable stiffness with the unaged mixture at the test temperature of ITS.
137
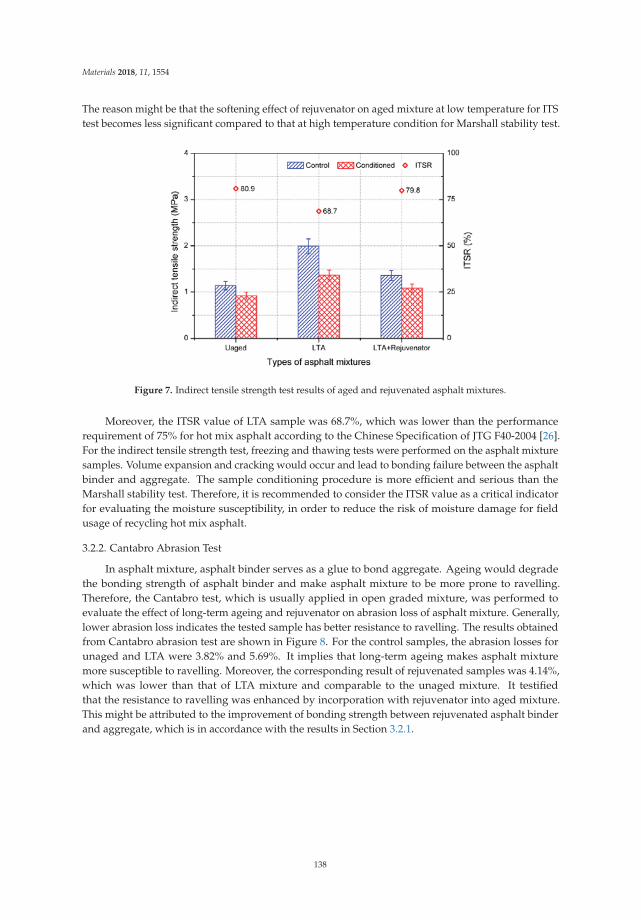
Materials 2018, 11, 1554
The reason might be that the softening effect of rejuvenator on aged mixture at low temperature for ITStest becomes less significant compared to that at high temperature condition for Marshall stability test.
Figure 7. Indirect tensile strength test results of aged and rejuvenated asphalt mixtures.
Moreover, the ITSR value of LTA sample was 68.7%, which was lower than the performancerequirement of 75% for hot mix asphalt according to the Chinese Specification of JTG F40-2004 [26].For the indirect tensile strength test, freezing and thawing tests were performed on the asphalt mixturesamples. Volume expansion and cracking would occur and lead to bonding failure between the asphaltbinder and aggregate. The sample conditioning procedure is more efficient and serious than theMarshall stability test. Therefore, it is recommended to consider the ITSR value as a critical indicatorfor evaluating the moisture susceptibility, in order to reduce the risk of moisture damage for fieldusage of recycling hot mix asphalt.
3.2.2. Cantabro Abrasion Test
In asphalt mixture, asphalt binder serves as a glue to bond aggregate. Ageing would degradethe bonding strength of asphalt binder and make asphalt mixture to be more prone to ravelling.Therefore, the Cantabro test, which is usually applied in open graded mixture, was performed toevaluate the effect of long-term ageing and rejuvenator on abrasion loss of asphalt mixture. Generally,lower abrasion loss indicates the tested sample has better resistance to ravelling. The results obtainedfrom Cantabro abrasion test are shown in Figure 8. For the control samples, the abrasion losses forunaged and LTA were 3.82% and 5.69%. It implies that long-term ageing makes asphalt mixturemore susceptible to ravelling. Moreover, the corresponding result of rejuvenated samples was 4.14%,which was lower than that of LTA mixture and comparable to the unaged mixture. It testifiedthat the resistance to ravelling was enhanced by incorporation with rejuvenator into aged mixture.This might be attributed to the improvement of bonding strength between rejuvenated asphalt binderand aggregate, which is in accordance with the results in Section 3.2.1.
138
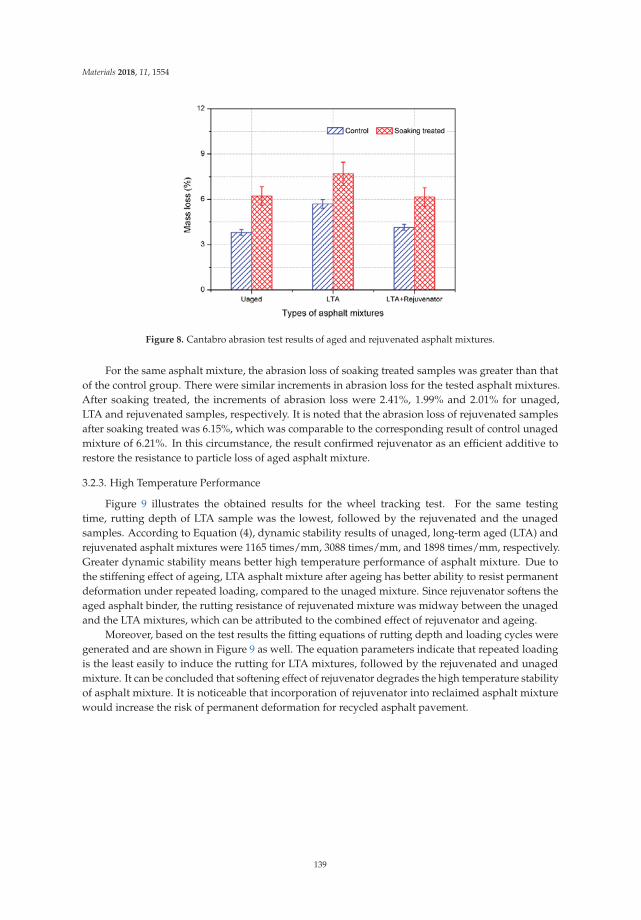
Materials 2018, 11, 1554
Figure 8. Cantabro abrasion test results of aged and rejuvenated asphalt mixtures.
For the same asphalt mixture, the abrasion loss of soaking treated samples was greater than thatof the control group. There were similar increments in abrasion loss for the tested asphalt mixtures.After soaking treated, the increments of abrasion loss were 2.41%, 1.99% and 2.01% for unaged,LTA and rejuvenated samples, respectively. It is noted that the abrasion loss of rejuvenated samplesafter soaking treated was 6.15%, which was comparable to the corresponding result of control unagedmixture of 6.21%. In this circumstance, the result confirmed rejuvenator as an efficient additive torestore the resistance to particle loss of aged asphalt mixture.
3.2.3. High Temperature Performance
Figure 9 illustrates the obtained results for the wheel tracking test. For the same testingtime, rutting depth of LTA sample was the lowest, followed by the rejuvenated and the unagedsamples. According to Equation (4), dynamic stability results of unaged, long-term aged (LTA) andrejuvenated asphalt mixtures were 1165 times/mm, 3088 times/mm, and 1898 times/mm, respectively.Greater dynamic stability means better high temperature performance of asphalt mixture. Due tothe stiffening effect of ageing, LTA asphalt mixture after ageing has better ability to resist permanentdeformation under repeated loading, compared to the unaged mixture. Since rejuvenator softens theaged asphalt binder, the rutting resistance of rejuvenated mixture was midway between the unagedand the LTA mixtures, which can be attributed to the combined effect of rejuvenator and ageing.
Moreover, based on the test results the fitting equations of rutting depth and loading cycles weregenerated and are shown in Figure 9 as well. The equation parameters indicate that repeated loadingis the least easily to induce the rutting for LTA mixtures, followed by the rejuvenated and unagedmixture. It can be concluded that softening effect of rejuvenator degrades the high temperature stabilityof asphalt mixture. It is noticeable that incorporation of rejuvenator into reclaimed asphalt mixturewould increase the risk of permanent deformation for recycled asphalt pavement.
139
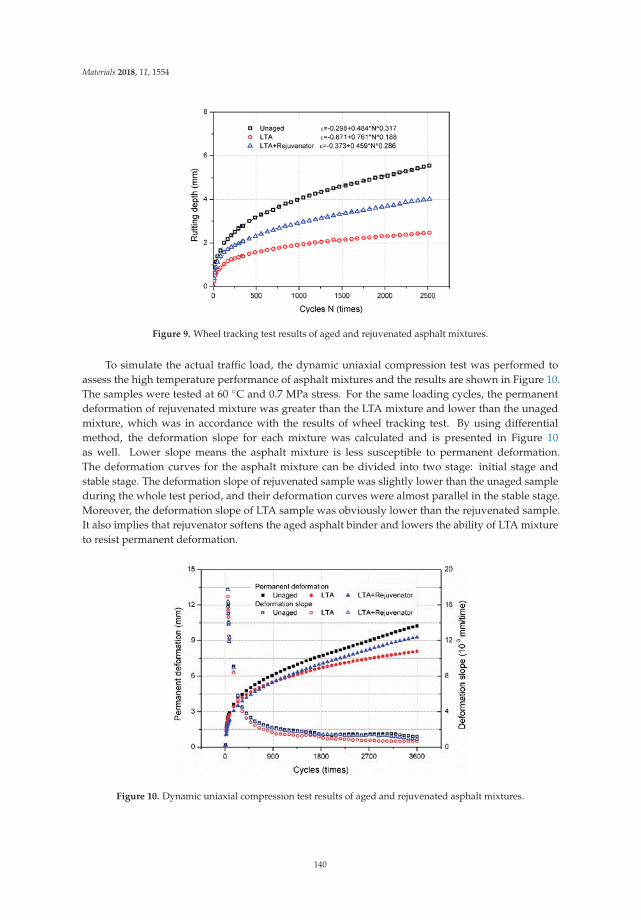
Materials 2018, 11, 1554
Figure 9. Wheel tracking test results of aged and rejuvenated asphalt mixtures.
To simulate the actual traffic load, the dynamic uniaxial compression test was performed toassess the high temperature performance of asphalt mixtures and the results are shown in Figure 10.The samples were tested at 60 ◦C and 0.7 MPa stress. For the same loading cycles, the permanentdeformation of rejuvenated mixture was greater than the LTA mixture and lower than the unagedmixture, which was in accordance with the results of wheel tracking test. By using differentialmethod, the deformation slope for each mixture was calculated and is presented in Figure 10as well. Lower slope means the asphalt mixture is less susceptible to permanent deformation.The deformation curves for the asphalt mixture can be divided into two stage: initial stage andstable stage. The deformation slope of rejuvenated sample was slightly lower than the unaged sampleduring the whole test period, and their deformation curves were almost parallel in the stable stage.Moreover, the deformation slope of LTA sample was obviously lower than the rejuvenated sample.It also implies that rejuvenator softens the aged asphalt binder and lowers the ability of LTA mixtureto resist permanent deformation.
Figure 10. Dynamic uniaxial compression test results of aged and rejuvenated asphalt mixtures.
140
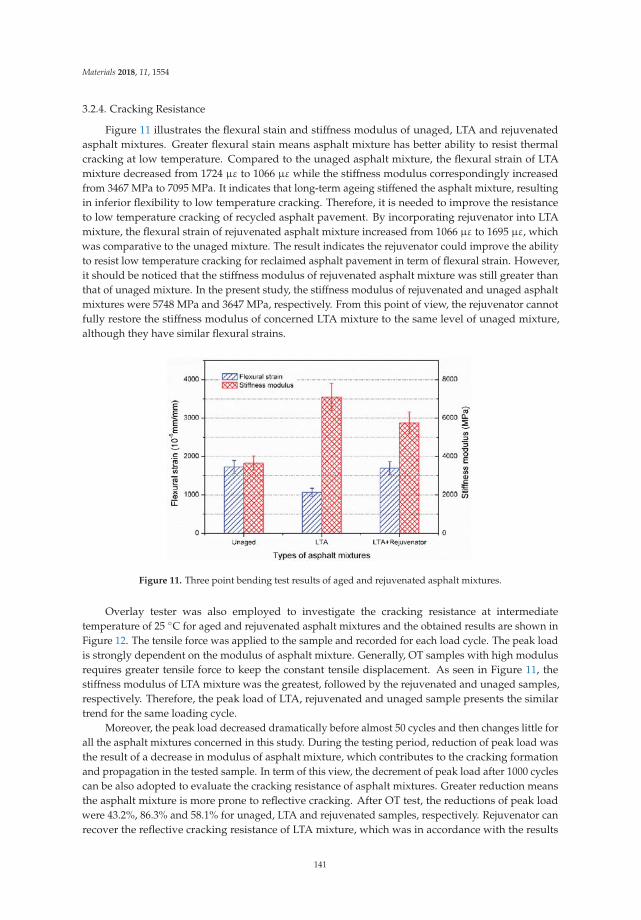
Materials 2018, 11, 1554
3.2.4. Cracking Resistance
Figure 11 illustrates the flexural stain and stiffness modulus of unaged, LTA and rejuvenatedasphalt mixtures. Greater flexural stain means asphalt mixture has better ability to resist thermalcracking at low temperature. Compared to the unaged asphalt mixture, the flexural strain of LTAmixture decreased from 1724 με to 1066 με while the stiffness modulus correspondingly increasedfrom 3467 MPa to 7095 MPa. It indicates that long-term ageing stiffened the asphalt mixture, resultingin inferior flexibility to low temperature cracking. Therefore, it is needed to improve the resistanceto low temperature cracking of recycled asphalt pavement. By incorporating rejuvenator into LTAmixture, the flexural strain of rejuvenated asphalt mixture increased from 1066 με to 1695 με, whichwas comparative to the unaged mixture. The result indicates the rejuvenator could improve the abilityto resist low temperature cracking for reclaimed asphalt pavement in term of flexural strain. However,it should be noticed that the stiffness modulus of rejuvenated asphalt mixture was still greater thanthat of unaged mixture. In the present study, the stiffness modulus of rejuvenated and unaged asphaltmixtures were 5748 MPa and 3647 MPa, respectively. From this point of view, the rejuvenator cannotfully restore the stiffness modulus of concerned LTA mixture to the same level of unaged mixture,although they have similar flexural strains.
Figure 11. Three point bending test results of aged and rejuvenated asphalt mixtures.
Overlay tester was also employed to investigate the cracking resistance at intermediatetemperature of 25 ◦C for aged and rejuvenated asphalt mixtures and the obtained results are shown inFigure 12. The tensile force was applied to the sample and recorded for each load cycle. The peak loadis strongly dependent on the modulus of asphalt mixture. Generally, OT samples with high modulusrequires greater tensile force to keep the constant tensile displacement. As seen in Figure 11, thestiffness modulus of LTA mixture was the greatest, followed by the rejuvenated and unaged samples,respectively. Therefore, the peak load of LTA, rejuvenated and unaged sample presents the similartrend for the same loading cycle.
Moreover, the peak load decreased dramatically before almost 50 cycles and then changes little forall the asphalt mixtures concerned in this study. During the testing period, reduction of peak load wasthe result of a decrease in modulus of asphalt mixture, which contributes to the cracking formationand propagation in the tested sample. In term of this view, the decrement of peak load after 1000 cyclescan be also adopted to evaluate the cracking resistance of asphalt mixtures. Greater reduction meansthe asphalt mixture is more prone to reflective cracking. After OT test, the reductions of peak loadwere 43.2%, 86.3% and 58.1% for unaged, LTA and rejuvenated samples, respectively. Rejuvenator canrecover the reflective cracking resistance of LTA mixture, which was in accordance with the results
141
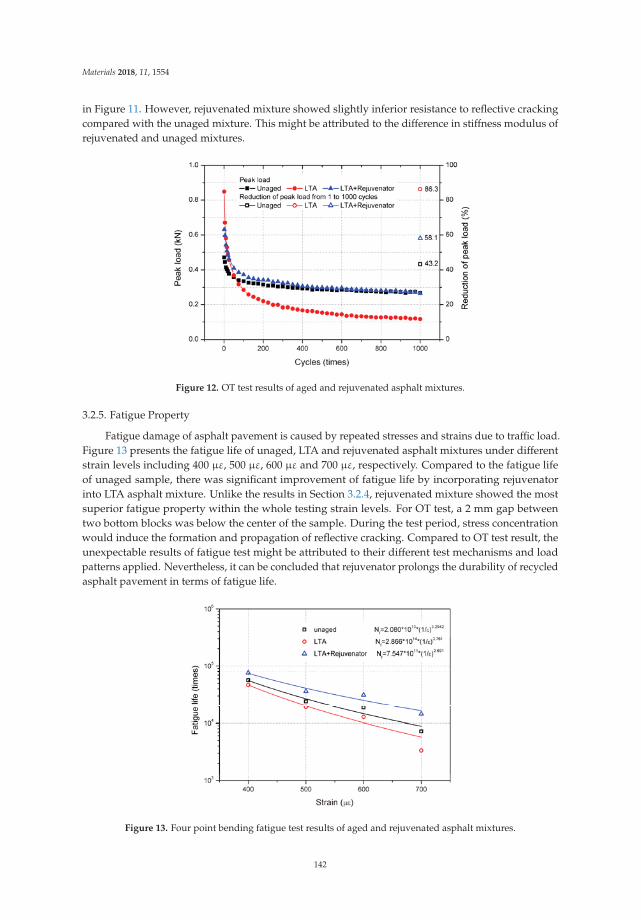
Materials 2018, 11, 1554
in Figure 11. However, rejuvenated mixture showed slightly inferior resistance to reflective crackingcompared with the unaged mixture. This might be attributed to the difference in stiffness modulus ofrejuvenated and unaged mixtures.
Figure 12. OT test results of aged and rejuvenated asphalt mixtures.
3.2.5. Fatigue Property
Fatigue damage of asphalt pavement is caused by repeated stresses and strains due to traffic load.Figure 13 presents the fatigue life of unaged, LTA and rejuvenated asphalt mixtures under differentstrain levels including 400 με, 500 με, 600 με and 700 με, respectively. Compared to the fatigue lifeof unaged sample, there was significant improvement of fatigue life by incorporating rejuvenatorinto LTA asphalt mixture. Unlike the results in Section 3.2.4, rejuvenated mixture showed the mostsuperior fatigue property within the whole testing strain levels. For OT test, a 2 mm gap betweentwo bottom blocks was below the center of the sample. During the test period, stress concentrationwould induce the formation and propagation of reflective cracking. Compared to OT test result, theunexpectable results of fatigue test might be attributed to their different test mechanisms and loadpatterns applied. Nevertheless, it can be concluded that rejuvenator prolongs the durability of recycledasphalt pavement in terms of fatigue life.
Figure 13. Four point bending fatigue test results of aged and rejuvenated asphalt mixtures.
142
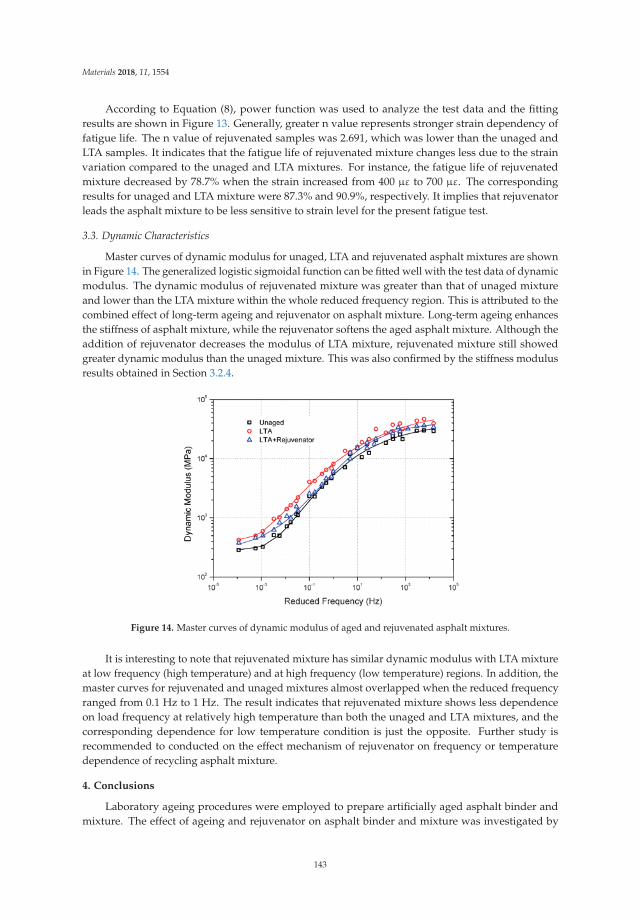
Materials 2018, 11, 1554
According to Equation (8), power function was used to analyze the test data and the fittingresults are shown in Figure 13. Generally, greater n value represents stronger strain dependency offatigue life. The n value of rejuvenated samples was 2.691, which was lower than the unaged andLTA samples. It indicates that the fatigue life of rejuvenated mixture changes less due to the strainvariation compared to the unaged and LTA mixtures. For instance, the fatigue life of rejuvenatedmixture decreased by 78.7% when the strain increased from 400 με to 700 με. The correspondingresults for unaged and LTA mixture were 87.3% and 90.9%, respectively. It implies that rejuvenatorleads the asphalt mixture to be less sensitive to strain level for the present fatigue test.
3.3. Dynamic Characteristics
Master curves of dynamic modulus for unaged, LTA and rejuvenated asphalt mixtures are shownin Figure 14. The generalized logistic sigmoidal function can be fitted well with the test data of dynamicmodulus. The dynamic modulus of rejuvenated mixture was greater than that of unaged mixtureand lower than the LTA mixture within the whole reduced frequency region. This is attributed to thecombined effect of long-term ageing and rejuvenator on asphalt mixture. Long-term ageing enhancesthe stiffness of asphalt mixture, while the rejuvenator softens the aged asphalt mixture. Although theaddition of rejuvenator decreases the modulus of LTA mixture, rejuvenated mixture still showedgreater dynamic modulus than the unaged mixture. This was also confirmed by the stiffness modulusresults obtained in Section 3.2.4.
Figure 14. Master curves of dynamic modulus of aged and rejuvenated asphalt mixtures.
It is interesting to note that rejuvenated mixture has similar dynamic modulus with LTA mixtureat low frequency (high temperature) and at high frequency (low temperature) regions. In addition, themaster curves for rejuvenated and unaged mixtures almost overlapped when the reduced frequencyranged from 0.1 Hz to 1 Hz. The result indicates that rejuvenated mixture shows less dependenceon load frequency at relatively high temperature than both the unaged and LTA mixtures, and thecorresponding dependence for low temperature condition is just the opposite. Further study isrecommended to conducted on the effect mechanism of rejuvenator on frequency or temperaturedependence of recycling asphalt mixture.
4. Conclusions
Laboratory ageing procedures were employed to prepare artificially aged asphalt binder andmixture. The effect of ageing and rejuvenator on asphalt binder and mixture was investigated by
143
Materials 2018, 11, 1554
a series of laboratory tests in this study. Based on the research results, conclusions could be drawnas follows.
(1) Aged asphalt binder can be recovered to some extent by incorporating with rejuvenator.However, the effect of ageing and rejuvenator on asphalt binder differs from the physicalproperties concerned.
(2) Rejuvenated asphalt mixture has comparable resistance to moisture damage and ravelling.ITSR value is recommended as an indicator for evaluating the moisture susceptibility for recyclingasphalt pavement.
(3) With similar flexural strain, rejuvenated asphalt mixture has greater modulus and inferior abilityto resist reflective cracking than the unaged mixture.
(4) Rejuvenated asphalt mixture, which is less sensitive to strain level, shows better fatigue propertythan unaged mixture.
(5) Compared to unaged and LTA mixtures, rejuvenated mixture shows less dependence on frequencyat high temperature regions and stronger dependence at low temperature regions.
The study compared the mechanical properties, durability, and dynamic characteristics of unaged,long-term aged, and rejuvenated asphalt mixtures by a series of available laboratory tests. Further studycould be conducted on clarifying the rejuvenating mechanisms and effectiveness of different types ofrejuvenators for reclaimed asphalt pavement. In addition, anti-ageing properties of rejuvenated asphaltmixture should be examined by both laboratory and field studies. Furthermore, critical indicators ofrejuvenated asphalt mixture should be proposed to ensure the durability of recycled asphalt pavement.
Author Contributions: Data curation, Y.K.; Formal analysis, X.H.; Funding acquisition, X.H. and X.Z.;Investigation, P.P.; Methodology, X.H.; Writing—Original Draft, Y.K.; Writing—Review & Editing, P.P.
Funding: The authors acknowledge the support provided by the Open Fund of Key Laboratory of HighwayConstruction and Maintenance Technology in Loess Region, Ministry of Transport and Key Laboratory ofHighway Construction and Maintenance Technology in Loess Region, Shanxi (No. KLTLR-Y14-6), the Scienceand Technology Project of Department of Transportation of Hubei Province (No. 2017-538-1-10), the ScienceFoundation of Wuhan Institute of Technology (No. K201846) and Open Fund of State Key Laboratory of SilicateMaterials for Architectures, Wuhan University of Technology (SYSJJ2018-22). Authors are very grateful for theirfinancial support.
Acknowledgments: We would like to express our gratitude to the editors and the reviewers for their constructiveand helpful review comments. The authors also wish to thank Shaopeng Wu and Yue Xiao (Wuhan University ofTechnology) for their help in providing the material used for experiments.
Conflicts of Interest: The authors declare no conflicts of interest.
References
1. Lin, J.; Hong, J.; Xiao, Y. Dynamic characteristics of 100% cold recycled asphalt mixture using asphaltemulsion and cement. J. Clean. Prod. 2017, 156, 337–344. [CrossRef]
2. Moghaddam, T.B.; Baaj, H. The use of rejuvenating agents in production of recycled hot mix asphalt:A systematic review. Constr. Build. Mater. 2016, 114, 805–816. [CrossRef]
3. Dinis-Almeida, M.; Castro-Gomes, J.; Sangiorgi, C.; Zoorob, S.E.; Afonso, M.L. Performance of warm mixrecycled asphalt containing up to 100% RAP. Constr. Build. Mater. 2016, 112, 1–6. [CrossRef]
4. Bell, A. Summary report on the ageing of asphalt-aggregate system. Transp. Res. Board 1989, 10, 1–121.5. Airey, G.D. State of the art report on ageing test methods for bituminous pavement materials. Int. J.
Pavement Eng. 2003, 4, 165–176. [CrossRef]6. Zaumanis, M.; Mallick, R.B. Review of very high-content reclaimed asphalt use in plant-produced pavements:
state of the art. Int. J. Pavement Eng. 2015, 16, 39–55. [CrossRef]7. Chen, M.; Leng, B.; Wu, S.; Sang, Y. Physical, chemical and rheological properties of waste edible vegetable
oil rejuvenated asphalt binders. Constr. Build. Mater. 2014, 66, 286–298. [CrossRef]8. Chen, M.; Xiao, F.; Putman, B.; Leng, B.; Wu, S. High temperature properties of rejuvenating recovered
binder with rejuvenator, waste cooking and cotton seed oils. Constr. Build. Mater. 2014, 59, 10–16. [CrossRef]
144
Materials 2018, 11, 1554
9. Daniel, J.S.; Lachance, A. Mechanistic and volumetric properties of asphalt mixtures with recycled asphaltpavement. Transport. Res. Rec. 2005, 1929, 28–36. [CrossRef]
10. Molenaar, A.A.A.; Hagos, E.T.; van de Ven, M.F.C. Effects of ageing on the mechanical characteristics ofbituminous binders in PAC. J. Mater. Civ. Eng. 2010, 22, 779–787. [CrossRef]
11. Xiao, F.; Airkhanian, S.N.; Wu, B. Fatigue and stiffness evaluations of reclaimed asphalt pavement in hot mixasphalt mixtures. J. Test. Eval. 2011, 39, 234–242.
12. Zaumanis, M.; Mallick, R.B.; Frank, R. Evaluation of different recycling agents for restoring aged asphaltbinder and performance of 100% recycled asphalt. Mater. Struct. 2015, 48, 2475–2488. [CrossRef]
13. Ma, T.; Hussain, B.U.; Enad, M.; Hajj, E.Y. Estimating allowable RAP in asphalt mixes to meet target lowtemperature PG requirements. J. Assoc. Asphalt Paving Technol. 2010, 79, 473–495.
14. Kuang, D.; Jiao, Y.; Ye, Z.; Lu, Z.; Chen, H.; Yu, J.; Liu, N. Diffusibility enhancement of rejuvenator byepoxidized soybean oil and its influence on the performance of recycled hot mix asphalt mixtures. Materials2017, 10, 574. [CrossRef] [PubMed]
15. Zaumanis, M.; Mallick, R.B.; Frank, R. Determining optimum rejuvenator dose for asphalt recycling basedon superpave performance grade specifications. Constr. Build. Mater. 2014, 69, 159–166. [CrossRef]
16. Cavalli, M.C.; Zaumanis, M.; Mazza, E.; Partl, M.N.; Poulikakos, L.D. Ageing effect on rheology and crackingbehaviour of reclaimed binder with bio-based rejuvenators. J. Clean. Prod. 2018, 189, 88–97. [CrossRef]
17. Ongel, A.; Hugener, M. Impact of rejuvenators on ageing properties of bitumen. Constr. Build. Mater. 2015,94, 467–474. [CrossRef]
18. Ma, T.; Huang, X.; Zhao, Y.; Zhang, Y. Evaluation of the diffusion and distribution of the rejuvenator for hotasphalt recycling. Constr. Build. Mater. 2015, 98, 530–536. [CrossRef]
19. Zhang, Y.; van de Ven, M.F.C.; Molenaar, A.A.A.; Wu, S. Assessment of effectiveness of rejuvenators onartificially aged mortar. J. Mater. Civ. Eng. 2016, 28, 04016079. [CrossRef]
20. Wang, F.; Wang, Z.; Li, C.; Xiao, Y.; Wu, S.; Pan, P. The Rejuvenating Effect in Hot Asphalt Recycling byMortar Transfer Ratio and Image Analysis. Materials 2017, 10, 574. [CrossRef] [PubMed]
21. JTG F41—Technical Specification for Highway Asphalt Pavement Recycling; Ministry of Transport of the People’sRepublic of China: Beijing, China, 2008. (In Chinese)
22. Im, S.; Zhou, F.; Lee, R.; Scullion, T. Impacts of rejuvenators on performance and engineering properties ofasphalt mixtures containing recycled materials. Constr. Build. Mater. 2014, 53, 596–603. [CrossRef]
23. Im, S.; Karki, P.; Zhou, F. Development of new mix design method for asphalt mixtures containing RAP andrejuvenators. Constr. Build. Mater. 2016, 115, 727–734. [CrossRef]
24. Zaumanis, M.; Mallick, R.B.; Poulikakos, L.; Frank, R. Influence of six rejuvenators on theperformance properties of reclaimed asphalt pavement (RAP) binder and 100% recycled asphalt mixtures.Constr. Build. Mater. 2014, 71, 538–550. [CrossRef]
25. Pan, P.; Wu, S.; Hu, X.; Liu, G.; Li, B. Effect of material composition and environmental condition on thermalcharacteristics of conductive asphalt concrete. Materials 2017, 10, 218. [CrossRef] [PubMed]
26. JTG F40—Technical Specifications for Construction Highway Asphalt Pavements; Ministry of Transport of thePeople’s Republic of China: Beijing, China, 2004. (In Chinese)
27. JTG E20—Ministry of Transport of the People’s Republic of China. Standard Test Methods of Bitumen and BituminousMixtures for Highway Engineering; Ministry of Transport of the People’s Republic of China: Beijing, China,2011. (In Chinese)
28. ASTM D36/D36M-14e1—Standard Test Method for Softening Point of Bitumen (Ring-and-Ball Apparatus);ASTM International: West Conshohocken, PA, USA, 2014.
29. ASTM D113-17—Standard Test Method for Ductility of Bituminous Materials; ASTM International:West Conshohocken, PA, USA, 2017.
30. ASTM D5/D5M-13—Standard Test Method for Penetration of Bituminous Materials; ASTM International:West Conshohocken, PA, USA, 2013.
31. ASTM D4402/D4402M-15—Standard Test Method for Viscosity Determination of Asphalt at Elevated TemperaturesUsing a Rotational Viscometer; ASTM International: West Conshohocken, PA, USA, 2015.
32. BS EN 12697-25—Bituminous Mixtures Test Methods: Cyclic Compression Test; British Standard Institute:London, UK, 2016.
33. Tex-248-F—Test Procedure for Overlay Test; Texas Department of Transportation: Austin, TX, USA, 2009.
145
Materials 2018, 11, 1554
34. Hu, X.; Wang, N.; Pan, P.; Bai, T. Performance evaluation of asphalt mixture using brake pad waste as mineralfiller. Constr. Build. Mater. 2017, 138, 410–417. [CrossRef]
35. Modarres, A.; Hamedi, H. Developing laboratory fatigue and resilient modulus models for modified asphaltmixes with waste plastic bottles (PET). Constr. Build. Mater. 2014, 68, 259–267. [CrossRef]
36. AASHTO TP 62-07—Standard Test Method for Determining Dynamic Modulus of Hot-Mix Asphalt (HMA);American Association of State Highway and Transportation Officials: Washington, DC, USA, 2007.
37. Ruan, L.; Luo, R.; Hu, X.; Pan, P. Effect of bell-shaped loading and haversine loading on the dynamicmodulus and resilient modulus of asphalt mixtures. Constr. Build. Mater. 2018, 161, 124–131. [CrossRef]
38. Pellinen, T.; Zofka, A.; Marasteanu, M.; Funk, N. Asphalt mixture stiffness predictive models. J. Assoc.Asphalt Paving Technol. 2007, 76, 575–625.
© 2018 by the authors. Licensee MDPI, Basel, Switzerland. This article is an open accessarticle distributed under the terms and conditions of the Creative Commons Attribution(CC BY) license (http://creativecommons.org/licenses/by/4.0/).
146
materials
Article
Assessment on Physical and Rheological Properties ofAged SBS Modified Bitumen ContainingRejuvenating Systems of Isocyanate andEpoxy Substances
Zhelun Li 1 , Xiong Xu 2,* , Jianying Yu 1,* and Shaopeng Wu 1
1 State Key Laboratory of Silicate Materials for Architectures, Wuhan University of Technology, Wuhan430070, China; [email protected] (Z.L.); [email protected] (S.W.)
2 School of Civil Engineering and Architecture, Wuhan Institute of Technology, Wuhan 430074, China* Correspondence: [email protected] (X.X.); [email protected] (J.Y.);
Tel.: +86-158-7171-9331 (X.X.); +86-133-6728-9333 (J.Y.)
Received: 1 January 2019; Accepted: 13 February 2019; Published: 19 February 2019
Abstract: Styrene–butadiene copolymer (SBS)-modified bitumen (SMB) is widely applied inpavement construction. With yearly services, many SMB wastes urgently need to be reclaimedfor repaving roads based on the objectives of environmental protection, landfill saving, as well asresource utilization. The present work is focused on the investigation of the physical and rheologicalproperties of aged SMB incorporated with rejuvenating systems consisting of fluid catalytic crackingslurry (FCC slurry), C12–14 aliphatic glycidyl ether (AGE), diphenylmethane diisocyanate (MDI),and other additives. The rejuvenating systems containing the main components of 10% FCC slurry,10%FCC/3%AGE, and 10%FCC/3%AGE/1% MDI were respectively recorded as Ra, Rb, and Rc. Theresults indicate that both Rb and Rc have obvious workability that make contributions for improvingcomprehensive physical properties while slightly reducing the softening point, which were alsoproven to be effective for the re-rejuvenation of re-aged binder. The higher viscous-elastic temperaturecaused by the agglomeration of binder molecules in aged SMB could be dropped to a lower valuewith rejuvenating systems, while improving the low-temperature crack resistance. With the use ofthe Rb and Rc rejuvenating systems, the high-temperature deformation resistance of aged SMB fell,approaching the performance of fresh SMB. Vibration noise consumption could be improved foraged SMB incorporated with Rb and Rc in the form of viscous loss, while the effects for re-aged SMBcontaining the same rejuvenating systems were weakened but still effective.
Keywords: SBS-modified bitumen; rejuvenating systems; physical properties; viscous-elastictemperature; rutting factor; vibration noise consumption
1. Introduction
Along with the booming development of highway construction in China, tri-blockstyrene–butadiene copolymer (SBS)-modified bitumen is widely applied in high-class pavement dueto its advantageous high- and low-temperature performance, driving comfort, smooth surface, andabrasive resistance [1–4]. Despite that, during the in-service period, a series of physical and chemicalchanges resulting in the performance deterioration of SBS-modified bitumen (SMB) occur underthe comprehensive effect of the natural environment such as heat, UV, oxygen, and rainwater [5–8].Furthermore, a great deal of waste SMB is constantly produced and causes huge resource and landfillwaste as well as environmental hazards [9,10]. Accordingly, the problem of high-quality rejuvenationfor waste SMB urgently needs to be solved.
Materials 2019, 12, 618; doi:10.3390/ma12040618 www.mdpi.com/journal/materials147
Materials 2019, 12, 618
The aging of SMB includes not only oxidation and poly-condensation of base bitumen, but alsothe oxidative degradation of SBS, which differs from the aging of base bitumen [11]. Owing to theoxidative degradation of SBS, the road performances of SMB after long-term aging significantly drop tohardly meet standardized requirements [12–15]. Thus, the consideration regarding the comprehensiveperformance recovery of SMB should be taken for both aged bitumen and aged SBS. As of now,some publications have reported that the rejuvenation of aged SMB can be realized by adding freshSMB and/or rich aromatic oils [16–20]. For instance, Gong et al. investigated the physical andchemical properties of aged SMB mixed with bio-oil derived from biodiesel residue, and discoveredthat the bio-oil could be used to achieve the goal of rejuvenating aged SMB and enhance its physicalproperties, while mitigating the highly-oxidized components aggregated and dispersing the asphaltmolecules [21]. Chen et al. conducted a study using waste edible vegetable oil to rejuvenate agedasphalt binder containing SBS by testing the physical and rheological properties, and found that wasteedible vegetable oil is suitable for the recycling of aged SBS modified asphalt with the result of betterperformance recovery [22].
Although these kinds of physical components have some advantages in restoring most of theproperties of aged SMB, the performance recovery is only for aged bitumen binder and not agedpolymer. In fact, some publications have reported that the oxidation and degradation of SBS wouldsimultaneously occur during the oxidative aging step, with the destructed polymer pieces formingwith oxygen-containing groups such as hydroxyl and carbonyl groups [23–26]. Considering the useof those groups, we propose an in-situ chemical reaction to amend the molecular structure of SBSpolymer in order to improve the properties of bitumen binder. In view of this emerging idea, thenovelty differs from other reports in trying to use the reactive components to make a partial connectionamong degraded polymer, and the high aromatic mixtures to adjust the chemical composition of agedvirgin bitumen are both involved.
This present work aims to solve the issue of high-quality recycling of aged SMB by using theselected rejuvenating system consisting of fluid catalytic cracking slurry (FCC slurry), C12–14 aliphaticglycidyl ether (AGE), diphenylmethane diisocyanate (MDI), and other additives. The physical andrheological properties of aged SMB incorporating the rejuvenating systems were systematicallyinvestigated, and the re-rejuvenation effects of the selected rejuvenating system are discussedand analyzed.
2. Experimental
2.1. Raw Materials
The used SBS modified bitumen (SBS/bitumen, 5/100) was obtained in the laboratory by mixinglinear SBS (1301, S/B = 30/70) and base bitumen (SK-70). FCC slurry was selected to improve thechemical components of aged bitumen binder. The relative mass percentages in saturates, aromatics,resins, and asphaltenes were 8.82%, 75.23%, 7.93%, and 8.02%, respectively. AGE is a low-viscosityend-epoxy molecule that can penetrate into the binder and disperse the agglomeration formed fromaging. MDI was selected to limit the dropping high-temperature properties of rejuvenated SMBthrough the chemical consolidation reaction.
2.2. Aging Procedure of SMB
The evenly dispersed SMB specimens were standardly prepared for pressure aging vessel (PAV)aging. The aging experiments were as follows in order of the thin film oven test (TFOT, referringto ASTM D1754) and the PAV test (referring to ASTM D6521) [27], the lab conditions of which were163 ◦C × 5 h and 100 ◦C × 2.1 MPa × 20 h (in air atmosphere) to simulate the short-term mixing andpaving process and the long-term working aging of SMB, respectively.
148
Materials 2019, 12, 618
2.3. Rejuvenation for Aged SMB
The aged SMB specimens above were quantitatively weighed and shifted to an agitated vesselfor hot mix rejuvenation. Until the stable temperature of 150 ◦C was reached, the low-speed agitationstarted, while 10% FCC slurry, 3% AGE and other low amounts of additives with or without 1%MDI were respectively mixed into the binder for 20 min to prepare three kinds of rejuvenated SMB.The rejuvenating systems containing the main components of 10% FCC slurry, 10%FCC/3%AGE,and 10%FCC/3%AGE/1% MDI are respectively abbreviated as Ra, Rb, and Rc for reference inthis manuscript.
2.4. Tests for Physical Properties
The physical properties of various SMB specimens as mentioned above, included viscosity at 135◦C, softening point, penetration at 25 ◦C, and ductility at 5 ◦C were measured according to ASTMD4402, ASTM D36, ASTM D5, and ASTM D113, respectively [28–31]. Additionally, the experimentalresults of the primary physical properties of fresh and PAV-aged SMB are presented in Table 1.
Table 1. Primary physical properties of styrene–butadiene copolymer modified bitumen (SMB) beforeand after pressure aging vessel (PAV) aging.
Technical Index Fresh SMB PAV-Aged SMB
Ductility at 5 ◦C (cm) 36.8 1.2Softening point (◦C) 70.5 63.1
Viscosity at 135 ◦C (Pa·s) 2.56 2.85Penetration at 25 ◦C (dmm) 48 17
2.5. Tests for Rheological Properties
The rheological characteristics of the various SMB specimens mentioned above were testedusing a dynamic shear rheometer (DSR, MCR101, Anton Paar, Graz, Austria). The tests for rheologicalproperties were conducted under strain-controlled conditions at 10 rad/s with the heat rate of 2 ◦C/minbetween the temperature ranges of −10 and 80 ◦C. During the test, plates with an 8 mm diameterand a 2 mm gap below 30 ◦C and plates with a 25 mm diameter and a 1 mm gap above 30 ◦C wererespectively used. According to the manufacturing specifications, related rheological parameters suchas elastic modulus (G′), viscous modulus (G”), complex modulus (G*), phase angle (δ), and ruttingfactor (G*/sin δ) were simultaneously obtained to assess the rheological properties of rejuvenated SMB.
3. Results and Discussion
3.1. Effect of Rejuvenating Systems on the Physical Properties of Aged SMB
Table 2 presents the related experimental results regarding the physical properties and recoveryrates of aged SMB incorporating rejuvenating systems. From the table, with rejuvenating systems, theimprovement on the ductility and penetration of aged SMB was clearly visible, while the softening pointand viscosity both dropped to some extent. The differences in the physical properties of rejuvenatedSMB containing Ra, Rb, and Rc were easily observed in that Rb and Rc had significant advantages inmaking contributions to the ductility recovery, penetration recovery, and viscosity reduction of agedSMB—except for the softening point—in comparison with Ra. The explanation for the results is thatthe epoxy components play a vital effect in diffusing and dispersing the agglomerated substances ofthe aged binder. Meanwhile, compared with Rb, the slight weakness of Rc for improving the physicalproperties is the reaction consolidation caused between MDI and aged SMB.
Furthermore, the data show that the use of Rb and Rc for aged SMB promoted ductility recoveryrates approaching 76.6% and 67.1%, penetration recovery rates of 112.5% and 95.9%, the viscosityindexes were 37.5% and 49.2%, and the softening point retention rates were 71.6% and 79.1% while the
149
Materials 2019, 12, 618
results of rejuvenated SMB containing Ra were respectively 37.0%, 70.8%, 44.9%, and 79.7%. The datashown here indicate that the rejuvenating systems containing AGE with or without MDI can workbetter to both restore the physical properties of aged SMB and obtain rejuvenated SMB with variousbehaviors suitable for re-application.
Table 2. Physical properties and recovery rates of aged SMB incorporating rejuvenating systems.
Technical Index Aged SMBRejuvenated SMB
EquationRa Rb Rc
Ductility at 5 ◦C (cm) 1.2 13.6 28.2 24.7 -Softening point (◦C) 63.1 56.2 50.5 55.8 -
Penetration at 25 ◦C (dmm) 17 34 54 47 -Viscosity at 135 ◦C (Pa·s) 2.85 1.15 0.96 1.26 -
Ductility recovery rate (%) - 37.0 76.6 67.1
PCR = PRPF
× 100%Softening point retention rate (%) - 79.7 71.6 79.1Penetration recovery rate (%) - 70.8 112.5 95.9
Viscosity index (%) - 44.9 37.5 49.2
Note: In the equation, PCR refers to the performance recovery ratio for rejuvenated binder; PR refers to the valuefor physical properties of rejuvenated binder; and PF refers to the value for the physical properties of fresh binder.
3.2. Effect of Rejuvenating Systems on the Physical Properties of Second Aged SMB
Figures 1–4 display the physical properties of ductility, softening point, penetration, and viscosityof aged SMB containing Rb and Rc, respectively. It is clear that rejuvenated SMBs containing Rb or Rc,after second aging, almost lost their low-temperature ductility, accompanied by a rise in the softeningpoint. When Rb and Rc were selected again for the rejuvenation of second-aged SMB, the ductilityincreased by 23.7 and 20.2 cm with the recovery rates of 67.7% and 57.6%, while the softening pointdecreased by 5.1 ◦C and 3.4 ◦C with retention rates of 74.5% and 80.6%. The results indicate that therejuvenating system can, to some degree, restore the low-temperature properties of second-aged SMBand depress the significant deterioration of high-temperature properties.
Meanwhile, the penetration increased by 25 dmm and 21 dmm with recovery rates of 97.9%and 83.3%, which illustrates that the use of these kinds of rejuvenating systems was still effective inrestoring the penetration of second-aged SMB. Lastly, the results of the viscosity index (46.1% and65.2%) show that the viscous behavior of second-aged SMB were improved using Rb, and increasedwith the addition of MDI. In other words, the use of Rc was effective in restoring the low-temperatureproperties and limited the sharp fall of high-temperature properties for the second-aged SMB. Toconclude, both Rb and Rc had good working abilities for recycling re-aged SMB in order to achievebetter properties.
Figure 1. Effect of rejuvenating systems on the ductility of second-aged SMB.
150
Materials 2019, 12, 618
Figure 2. Effect of rejuvenating systems on the softening point of second-aged SMB.
Figure 3. Effect of rejuvenating systems on the penetration of second-aged SMB.
Figure 4. Effect of rejuvenating systems on the viscosity of second-aged SMB.
3.3. Effect of Rejuvenating Systems on the Viscous-Elastic Behavior of Aged SMB
The viscous-elastic characteristics of aged SMB with incorporated rejuvenating systems arepresented in Figure 5. As depicted in Figure 5a, the values of G′ and G” of fresh SMB after agingincreased, and the viscous-elastic temperature shifted to a higher level from 14.6 ◦C to 24.2 ◦C,indicating that the deformation resistance of fresh SMB increased during the aging period, causingthe viscous portion (G” after 14.6 ◦C) of fresh SMB to tend to the harder portion before 24.2 ◦C.From Figure 5b, it can be clearly seen that the values of G′ and G” of rejuvenated SMB were tosome extent lower than the aged one, and the viscous-elastic temperature of aged SMB decreasedwith the addition of rejuvenators. Compared with Ra, the exhibited viscous behaviors of Rb- and
151
Materials 2019, 12, 618
Rc-rejuvenated SMB were more obvious, the viscous-elastic temperatures of which decreased to 8.1 ◦Cand 12.1 ◦C, respectively. The findings illustrate that rejuvenating systems such as Rb and Rc providethe benefit of activating the hard components in aged SMB to the viscous components, and improve thelow-temperature crack resistance. The reason for the higher viscous-elastic temperature of rejuvenatedSMB containing Rc depends upon the chemical reactions between the isocyanate groups and theformed reactive groups (e.g., –OH and –COOH) in aged binder [9].
(a)
(b)
Figure 5. Viscous-elastic characteristics of (a) fresh and aged SMB and (b) rejuvenated SMB.
3.4. Effect of Rejuvenating Systems on the Physical Properties of Aged SMB
The loss tangent (tan δ) is a vital indicator used to depict the damping loss of materials. Figure 6displays its tendency and changing law for various bitumen specimens containing fresh, aged, andrejuvenated types. Useful and interesting information obtained from the figure is that the loss tangentof fresh SMB decreased with aging, however, to a certain degree, the loss tangent of aged SMBincreased with rejuvenation. In other words, with the hardening of fresh SMB during the aging period,the damping loss was be reduced on the basis of elastic energy storage, and when the aged SMBswere rejuvenated with Ra, Rb, and Rc, the damping loss was recover to a higher level. These resultsindicate that the vibration consumption of aged SMB containing rejuvenating systems may give thempotential for use in reducing tire–ground noise. Differences in the damping loss of rejuvenated SMBincorporating Rb and Rc can mainly be attributed to the fact that the chemical reactions betweenisocyanate and aged SMB cause the partial hardening of the mixes, leading to a decrement of theviscous loss.
152
Materials 2019, 12, 618
Figure 6. Effect of rejuvenating systems on the loss tangent of aged SMB.
3.5. Effect of Rejuvenating Systems on the Complex Modulus and Phase Angle of Aged SMB
The complex modulus and phase angle of aged SMB with rejuvenating systems are displayed inFigure 7. In the temperature region between −5 and 30 ◦C, the complex modulus and phase angle offresh SMB respectively increased and decreased after aging. With rejuvenation, the complex modulusrecovered to that of the original or lower level of fresh SMB, while the phase angle increased to near toor greater than the level of the fresh SMB. Compared with Rc, Rb had a more obvious role in promotingthe temperature sensitivity of aged SMB. All of the results demonstrate that the rejuvenating systems,particularly Rb, can activate the transfer of the hard components to the soft components in aged SMB,allowing superior rheological characteristics to be obtained.
Figure 7. Effect of rejuvenating systems on the complex modulus and phase angle of aged SMB.
3.6. Effect of Rejuvenating Systems on Rutting Factor of Aged SMB
Figure 8 shows the rutting factors of aged SMB incorporating Ra, Rb, and Rc with increasingtemperature. The temperature points inserted in this figure refer to the requirements of the SHRPspecification. It can be seen that the rutting factor of fresh SMB visibly increased after aging, whilethe rutting factor reduced with rejuvenation, among which rejuvenated SMB containing Rb exhibitedthe greatest decrease. The results obtained indicate that the rejuvenation systems, especially Rb, hadsignificant effects in decreasing the high-temperature characteristics of aged SMB. The findings showthat depending upon the low-viscosity epoxy components in Rb, it can easily permeate into the agedbinder and disperse the agglomerated substances formed by aging. Additionally, from the insertedfigure, it can be seen that the rutting factor of rejuvenated SMB containing Rc was somewhat higher incomparison with that containing Rb, demonstrating that the chemical reaction between Rc and aged
153
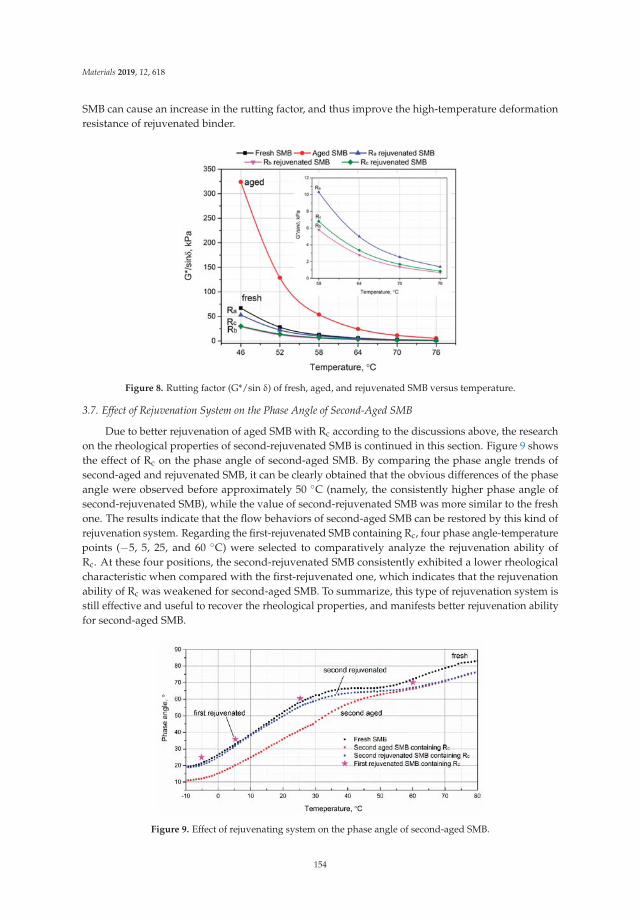
Materials 2019, 12, 618
SMB can cause an increase in the rutting factor, and thus improve the high-temperature deformationresistance of rejuvenated binder.
Figure 8. Rutting factor (G*/sin δ) of fresh, aged, and rejuvenated SMB versus temperature.
3.7. Effect of Rejuvenation System on the Phase Angle of Second-Aged SMB
Due to better rejuvenation of aged SMB with Rc according to the discussions above, the researchon the rheological properties of second-rejuvenated SMB is continued in this section. Figure 9 showsthe effect of Rc on the phase angle of second-aged SMB. By comparing the phase angle trends ofsecond-aged and rejuvenated SMB, it can be clearly obtained that the obvious differences of the phaseangle were observed before approximately 50 ◦C (namely, the consistently higher phase angle ofsecond-rejuvenated SMB), while the value of second-rejuvenated SMB was more similar to the freshone. The results indicate that the flow behaviors of second-aged SMB can be restored by this kind ofrejuvenation system. Regarding the first-rejuvenated SMB containing Rc, four phase angle-temperaturepoints (−5, 5, 25, and 60 ◦C) were selected to comparatively analyze the rejuvenation ability ofRc. At these four positions, the second-rejuvenated SMB consistently exhibited a lower rheologicalcharacteristic when compared with the first-rejuvenated one, which indicates that the rejuvenationability of Rc was weakened for second-aged SMB. To summarize, this type of rejuvenation system isstill effective and useful to recover the rheological properties, and manifests better rejuvenation abilityfor second-aged SMB.
Figure 9. Effect of rejuvenating system on the phase angle of second-aged SMB.
154
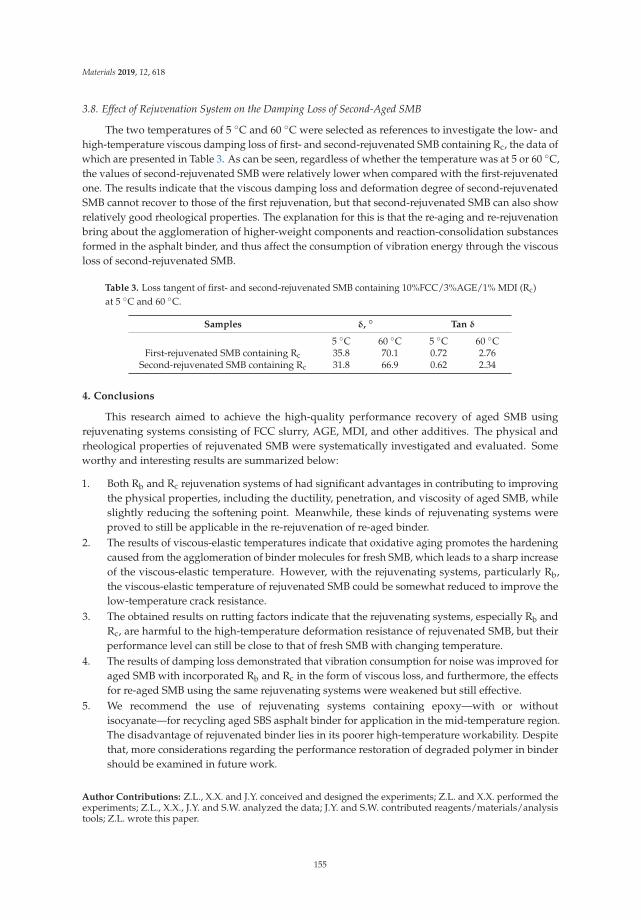
Materials 2019, 12, 618
3.8. Effect of Rejuvenation System on the Damping Loss of Second-Aged SMB
The two temperatures of 5 ◦C and 60 ◦C were selected as references to investigate the low- andhigh-temperature viscous damping loss of first- and second-rejuvenated SMB containing Rc, the data ofwhich are presented in Table 3. As can be seen, regardless of whether the temperature was at 5 or 60 ◦C,the values of second-rejuvenated SMB were relatively lower when compared with the first-rejuvenatedone. The results indicate that the viscous damping loss and deformation degree of second-rejuvenatedSMB cannot recover to those of the first rejuvenation, but that second-rejuvenated SMB can also showrelatively good rheological properties. The explanation for this is that the re-aging and re-rejuvenationbring about the agglomeration of higher-weight components and reaction-consolidation substancesformed in the asphalt binder, and thus affect the consumption of vibration energy through the viscousloss of second-rejuvenated SMB.
Table 3. Loss tangent of first- and second-rejuvenated SMB containing 10%FCC/3%AGE/1% MDI (Rc)at 5 ◦C and 60 ◦C.
Samples δ, ◦ Tan δ
5 ◦C 60 ◦C 5 ◦C 60 ◦CFirst-rejuvenated SMB containing Rc 35.8 70.1 0.72 2.76
Second-rejuvenated SMB containing Rc 31.8 66.9 0.62 2.34
4. Conclusions
This research aimed to achieve the high-quality performance recovery of aged SMB usingrejuvenating systems consisting of FCC slurry, AGE, MDI, and other additives. The physical andrheological properties of rejuvenated SMB were systematically investigated and evaluated. Someworthy and interesting results are summarized below:
1. Both Rb and Rc rejuvenation systems of had significant advantages in contributing to improvingthe physical properties, including the ductility, penetration, and viscosity of aged SMB, whileslightly reducing the softening point. Meanwhile, these kinds of rejuvenating systems wereproved to still be applicable in the re-rejuvenation of re-aged binder.
2. The results of viscous-elastic temperatures indicate that oxidative aging promotes the hardeningcaused from the agglomeration of binder molecules for fresh SMB, which leads to a sharp increaseof the viscous-elastic temperature. However, with the rejuvenating systems, particularly Rb,the viscous-elastic temperature of rejuvenated SMB could be somewhat reduced to improve thelow-temperature crack resistance.
3. The obtained results on rutting factors indicate that the rejuvenating systems, especially Rb andRc, are harmful to the high-temperature deformation resistance of rejuvenated SMB, but theirperformance level can still be close to that of fresh SMB with changing temperature.
4. The results of damping loss demonstrated that vibration consumption for noise was improved foraged SMB with incorporated Rb and Rc in the form of viscous loss, and furthermore, the effectsfor re-aged SMB using the same rejuvenating systems were weakened but still effective.
5. We recommend the use of rejuvenating systems containing epoxy—with or withoutisocyanate—for recycling aged SBS asphalt binder for application in the mid-temperature region.The disadvantage of rejuvenated binder lies in its poorer high-temperature workability. Despitethat, more considerations regarding the performance restoration of degraded polymer in bindershould be examined in future work.
Author Contributions: Z.L., X.X. and J.Y. conceived and designed the experiments; Z.L. and X.X. performed theexperiments; Z.L., X.X., J.Y. and S.W. analyzed the data; J.Y. and S.W. contributed reagents/materials/analysistools; Z.L. wrote this paper.
155
Materials 2019, 12, 618
Funding: This research was funded by the Fundamental Research Funds for the Central Universities(2016-YB-010).
Acknowledgments: This work is supported by the Fundamental Research Funds for the Central Universities(2016-YB-010). The authors gratefully acknowledge the financial support. Thanks are also honestly due to mysupervisor’s responsibility for the experienced test and paper writing. We are very grateful for the help from ourresearch project groups.
Conflicts of Interest: The authors declare no conflict of interest.
References
1. Zhao, X.Y.; Wang, S.F.; Wang, Q.; Yao, H.R. Rheological and structural evolution of SBS modified asphaltsunder natural weathering. Fuel 2016, 184, 242–247. [CrossRef]
2. Durrieu, F.; Farcas, F.; Mouillet, V. The influence of UV aging of a styrene/butadiene/styrene modifiedbitumen: Comparison between laboratory and on site aging. Fuel 2007, 86, 1446–1451. [CrossRef]
3. Cong, P.; Luo, W.; Xu, P.; Zhao, H. Investigation on recycling of SBS modified asphalt binders containingfresh asphalt and rejuvenating agents. Constr. Build. Mater. 2015, 91, 225–231. [CrossRef]
4. Xu, X.; Yu, J.Y.; Wang, R.Y.; Hu, J.X.; Xue, L.H. Investigation of road performances of reaction-rejuvenatedSBS modified bitumen mixture. Constr. Build. Mater. 2018, 183, 523–533. [CrossRef]
5. Xiao, F.P.; Putman, B.; Amirkhanian, S. Rheological characteristics investigation of high percentage RAPbinders with WMA technology at various aging states. Constr. Build. Mater. 2015, 98, 315–324. [CrossRef]
6. Yan, C.Q.; Xiao, F.P.; Huang, W.; Quan, L. Critical matters in using Attenuated Total Reflectance FourierTransform Infrared to characterize the polymer degradation in Styrene–Butadiene–Styrene-modified asphaltbinders. Polym. Test. 2018, 70, 289–296. [CrossRef]
7. Xu, S.; Yu, J.Y.; Hu, C.B.; Qin, D.F.; Xue, L.H. Laboratory evaluation of rejuvenation effect of reactiverejuvenator on aged SBS modified bitumen. Mater. Struct. 2017, 50, 233. [CrossRef]
8. Nian, T.F.; Li, P.; Wei, X.Y.; Wang, P.H.; Li, H.S.; Guo, R. The effect of freeze-thaw cycles on durabilityproperties of SBS-modified bitumen. Constr. Build. Mater. 2018, 187, 77–88. [CrossRef]
9. Xu, X.; Yu, J.Y.; Xue, L.H.; He, B.Y.; Du, W.; Zhang, H.; Li, Y. Effect of reactive rejuvenating system on physicalproperties and rheological characteristics of aged SBS modified bitumen. Constr. Build. Mater. 2018, 176,35–42. [CrossRef]
10. Poulikakos, L.D.; Santos, S.; Bueno, M.; Kuentzel, S.; Hugener, M.; Partl, M.N. Influence of short and longterm aging on chemical, microstructural and macro-mechanical properties of recycled asphalt mixtures.Constr. Build. Mater. 2014, 51, 414–423. [CrossRef]
11. Xu, X.; Yu, J.Y.; Zhang, C.L.; Cao, Z.L.; Gu, Y.; Xue, L.H. Effect of reactive rejuvenators on structure andproperties of UV-aged SBS modified bitumen. Constr. Build. Mater. 2017, 155, 780–788. [CrossRef]
12. Singh, S.K.; Kumar, Y.; Ravindranath, S.S. Thermal degradation of SBS in bitumen during storage: Influenceof temperature, SBS concentration, polymer type and base bitumen. Polym. Degrad. Stabil. 2018, 147, 64–75.[CrossRef]
13. Wang, T.; Xiao, F.P.; Amirkhanian, S.; Huang, W.D.; Zheng, M.L. A review on low temperature performancesof rubberized asphalt materials. Constr. Build. Mater. 2017, 145, 483–505. [CrossRef]
14. Hao, J.T.; Cao, P.Y.; Liu, Z.H.; Wang, Z.X.; Xia, S.F. Developing of a SBS polymer modified bitumen to avoidlow temperature cracks in the asphalt facing of a reservoir in a harsh climate region. Constr. Build. Mater.2017, 150, 105–113. [CrossRef]
15. RRasool, T.; Yao, H.R.; Hassan, A.; Wang, S.F.; Zhang, H.Y. In-field aging process of high content SBSmodified asphalt in porous pavement. Polym. Degrad. Stabil. 2018, 155, 220–229. [CrossRef]
16. Chen, M.Z.; Xiao, F.P.; Putman, B.; Leng, B.B.; Wu, S.P. High temperature properties of rejuvenating recoveredbinder with rejuvenator, waste cooking and cotton seed oils. Constr. Build. Mater. 2014, 59, 10–16. [CrossRef]
17. Zhu, H.; Xu, G.; Gong, M.; Yang, J. Recycling long-term-aged asphalts using bio-binder/plasticizer-basedrejuvenator. Constr. Build. Mater. 2017, 147, 117–129. [CrossRef]
18. Qiu, Y.J.; Ding, H.B.; Rahman, A.; Wang, W.Q. Damage characteristics of waste engine oil bottom rejuvenatedasphalt binder in the non-linear range and its microstructure. Constr. Build. Mater. 2018, 174, 202–209.[CrossRef]
156
Materials 2019, 12, 618
19. Asli, H.; Ahmadinia, E.; Zargar, M.; Mohamed, R.K. Investigation on physical properties of waste cookingoil–rejuvenated bitumen binder. Constr. Build. Mater. 2012, 37, 398–405. [CrossRef]
20. Zargar, M.; Ahmadinia, E.; Asli, H.; Karim, M.R. Investigation of the possibility of using waste cooking oil asa rejuvenating agent for aged bitumen. J. Hazard. Mater. 2012, 233, 254–258. [CrossRef]
21. Gong, M.H.; Yang, J.; Zhang, J.Y.; Zhu, H.R.; Tong, T.Z. Physical-chemical properties of aged asphaltrejuvenated by bio-oil derived from biodiesel residue. Constr. Build. Mater. 2016, 105, 35–45. [CrossRef]
22. Chen, M.Z.; Leng, B.B.; Wu, S.P.; Sang, Y. Physical, chemical and rheological properties of waste ediblevegetable oil rejuvenated asphalt binders. Constr. Build. Mater. 2014, 66, 286–298. [CrossRef]
23. Xu, X.; Yu, J.Y.; Xue, L.H.; Zhang, C.L.; Zha, Y.G.; Gu, Y. Investigation of Molecular Structure and ThermalProperties of Thermo-Oxidative Aged SBS in Blends and Their Relations. Materials 2017, 10, 768. [CrossRef][PubMed]
24. Xu, X.; Yu, J.Y.; Zhang, C.L.; Xu, S.; Xue, L.H.; Xie, D. Investigation of aging behavior and thermal stability ofstyrene-butadiene-styrene tri-block copolymer in blends. Polymer (Korea) 2016, 40, 947–953. [CrossRef]
25. Wu, S.P.; Pang, L.; Mo, L.T.; Chen, Y.C.; Zhu, G.J. Influence of aging on the evolution of structure, morphologyand rheology of base and SBS modified bitumen. Constr. Build. Mater. 2009, 23, 1005–1010. [CrossRef]
26. Singh, R.P.; Desai, S.M.; Solanky, S.S.; Thanki, P.N. Photodegradation and stabilization ofstyrene-butadiene-styrene rubber. J. Appl. Polym. Sci. 2000, 75, 1103–1114. [CrossRef]
27. Standard Practice for Accelerated Aging of Asphalt Binder Using a Pressurized Aging Vessel (PAV); ASTM D6521;ASTM International: West Conshohocken, PA, USA, 2018.
28. Standard Test Method for Viscosity Determination of Asphalt at Elevated Temperatures Using a Rotational Viscometer;ASTM D4402; ASTM International: West Conshohocken, PA, USA, 2015.
29. Standard Test Method for Softening Point of Bitumen (Ring-and-Ball Apparatus); ASTM D36; ASTM International:West Conshohocken, PA, USA, 2014.
30. Standard Test Method for Penetration of Bituminous Materials; ASTM D5; ASTM International:West Conshohocken, PA, USA, 2013.
31. Standard Test Method for Ductility of Asphalt Materials; ASTM D113; ASTM International: West Conshohocken,PA, USA, 2017.
© 2019 by the authors. Licensee MDPI, Basel, Switzerland. This article is an open accessarticle distributed under the terms and conditions of the Creative Commons Attribution(CC BY) license (http://creativecommons.org/licenses/by/4.0/).
157
materials
Article
Investigation of the Potential Use of Calcium AlginateCapsules for Self-Healing in Porous Asphalt Concrete
Shi Xu 1,*, Xueyan Liu 1, Amir Tabakovic 1,2,3 and Erik Schlangen 1
1 Civil Engineering and Geosciences, Delft University of Technology, Delft 2628CN, The Netherlands;[email protected] (X.L.); [email protected] (A.T.); [email protected] (E.S.)
2 Research Enterprise and Innovation, Dublin Institute of Technology, Dublin D07 EWV4, Ireland3 School of Civil Engineering, University College Dublin, Dublin D04 K3H4, Ireland* Correspondence: [email protected]; Tel.: +31(0)-15-27-85944
Received: 21 November 2018; Accepted: 29 December 2018; Published: 7 January 2019
Abstract: Improving the healing capacity of asphalt is proving to be an effective method to prolongthe service life of an asphalt pavement. The calcium alginate capsules encapsulating rejuvenatorhave been developed and proved to provide successful localized crack healing in asphalt mastic.However, it is not known whether this self-healing asphalt system will improve healing capacity ofa full asphalt mix. To this aim, this paper reports on study which investigate effect of the calciumalginate capsules onto self-healing capacity of the porous asphalt mix. X-ray computed tomography(XCT) was used to visualize the distribution of the capsules in porous asphalt. The effect of thecapsules on fracture resistance of porous asphalt concrete was studied by semi-circular bending (SCB)tests. A semi-circular bending and healing programme was carried out to evaluate the healing effectof these capsules in porous asphalt concrete. Indirect Tensile Stiffness Modulus (ITSM) tests wereemployed in order to investigate the influence of the capsules on the stiffness of the porous asphaltconcrete. The results indicate that incorporating calcium alginate capsules significantly improve thehealing capacity of porous asphalt concrete without compromising its performance.
Keywords: self-healing; asphalt; rejuvenation; calcium alginate capsules
1. Introduction
The asphalt healing phenomenon was first reported by Bazin in 1967 [1], since then, it capturedattention of road engineers and material scientists. Self-healing became a hotspot in the research fieldof bituminous materials [2]. The healing mechanism can be explained as interpenetration and bonding,which means the cracking interface will disappear as a function of time that the cracking surfaces arebrought in contact, and this phenomenon can be accelerated with a temperature increase [3]. In the lifecycle of an asphalt pavement, the self-healing capacity of asphalt plays an important role against thefatigue damages, which is considered by pavement engineers in predicting the performance of asphaltpavement [2]. However, the intrinsic healing capacity of asphalt pavement itself is not sufficient toprovide an efficient healing and significant life extension. Aimed to prolong the service life of asphaltpavement with self-healing technologies, more researches focused on the development of extrinsichealing methods in asphalt.
The induction healing methods, including induction heating and microwave heating, have beenintensively investigated in the past ten years [4]. The concept lies on the induction heating of theembedded conductive particles to improve the healing capacity of a pavement [5–8]. The researchfindings indicate that the induction healing method has significant healing effect on the micro cracks inasphalt pavement. However, this technology could not reduce the ageing of asphalt or even acceleratethe ageing with high temperature, which might results in a stiffer asphalt binder which leads toincreased cracking and pavement failure.
Materials 2019, 12, 168; doi:10.3390/ma12010168 www.mdpi.com/journal/materials158
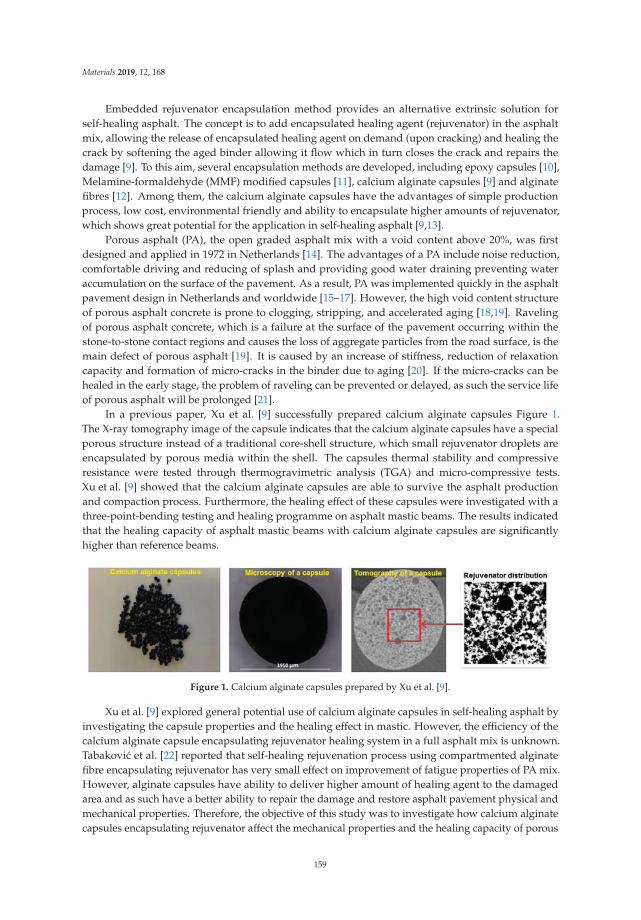
Materials 2019, 12, 168
Embedded rejuvenator encapsulation method provides an alternative extrinsic solution forself-healing asphalt. The concept is to add encapsulated healing agent (rejuvenator) in the asphaltmix, allowing the release of encapsulated healing agent on demand (upon cracking) and healing thecrack by softening the aged binder allowing it flow which in turn closes the crack and repairs thedamage [9]. To this aim, several encapsulation methods are developed, including epoxy capsules [10],Melamine-formaldehyde (MMF) modified capsules [11], calcium alginate capsules [9] and alginatefibres [12]. Among them, the calcium alginate capsules have the advantages of simple productionprocess, low cost, environmental friendly and ability to encapsulate higher amounts of rejuvenator,which shows great potential for the application in self-healing asphalt [9,13].
Porous asphalt (PA), the open graded asphalt mix with a void content above 20%, was firstdesigned and applied in 1972 in Netherlands [14]. The advantages of a PA include noise reduction,comfortable driving and reducing of splash and providing good water draining preventing wateraccumulation on the surface of the pavement. As a result, PA was implemented quickly in the asphaltpavement design in Netherlands and worldwide [15–17]. However, the high void content structureof porous asphalt concrete is prone to clogging, stripping, and accelerated aging [18,19]. Ravelingof porous asphalt concrete, which is a failure at the surface of the pavement occurring within thestone-to-stone contact regions and causes the loss of aggregate particles from the road surface, is themain defect of porous asphalt [19]. It is caused by an increase of stiffness, reduction of relaxationcapacity and formation of micro-cracks in the binder due to aging [20]. If the micro-cracks can behealed in the early stage, the problem of raveling can be prevented or delayed, as such the service lifeof porous asphalt will be prolonged [21].
In a previous paper, Xu et al. [9] successfully prepared calcium alginate capsules Figure 1.The X-ray tomography image of the capsule indicates that the calcium alginate capsules have a specialporous structure instead of a traditional core-shell structure, which small rejuvenator droplets areencapsulated by porous media within the shell. The capsules thermal stability and compressiveresistance were tested through thermogravimetric analysis (TGA) and micro-compressive tests.Xu et al. [9] showed that the calcium alginate capsules are able to survive the asphalt productionand compaction process. Furthermore, the healing effect of these capsules were investigated with athree-point-bending testing and healing programme on asphalt mastic beams. The results indicatedthat the healing capacity of asphalt mastic beams with calcium alginate capsules are significantlyhigher than reference beams.
Figure 1. Calcium alginate capsules prepared by Xu et al. [9].
Xu et al. [9] explored general potential use of calcium alginate capsules in self-healing asphalt byinvestigating the capsule properties and the healing effect in mastic. However, the efficiency of thecalcium alginate capsule encapsulating rejuvenator healing system in a full asphalt mix is unknown.Tabakovic et al. [22] reported that self-healing rejuvenation process using compartmented alginatefibre encapsulating rejuvenator has very small effect on improvement of fatigue properties of PA mix.However, alginate capsules have ability to deliver higher amount of healing agent to the damagedarea and as such have a better ability to repair the damage and restore asphalt pavement physical andmechanical properties. Therefore, the objective of this study was to investigate how calcium alginatecapsules encapsulating rejuvenator affect the mechanical properties and the healing capacity of porous
159
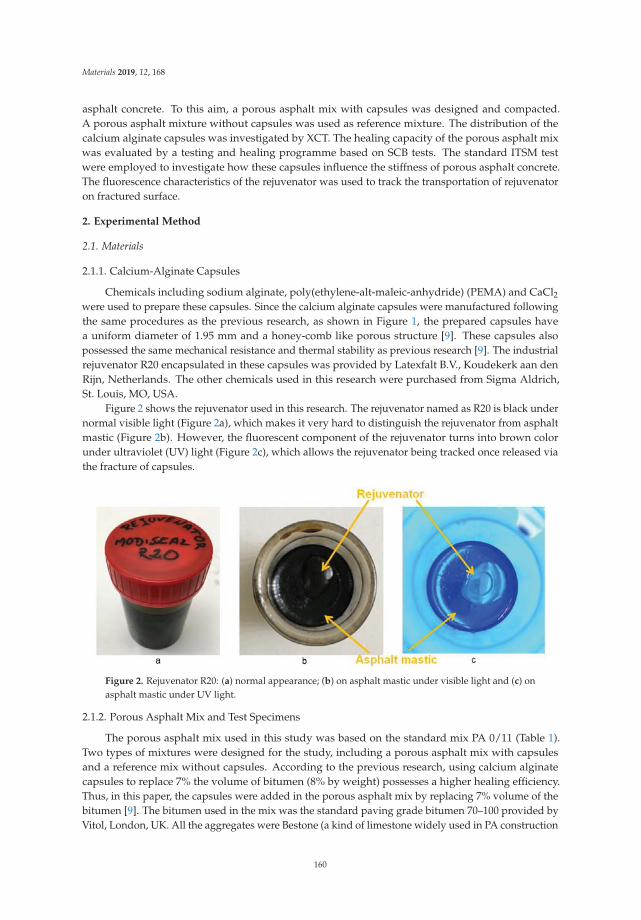
Materials 2019, 12, 168
asphalt concrete. To this aim, a porous asphalt mix with capsules was designed and compacted.A porous asphalt mixture without capsules was used as reference mixture. The distribution of thecalcium alginate capsules was investigated by XCT. The healing capacity of the porous asphalt mixwas evaluated by a testing and healing programme based on SCB tests. The standard ITSM testwere employed to investigate how these capsules influence the stiffness of porous asphalt concrete.The fluorescence characteristics of the rejuvenator was used to track the transportation of rejuvenatoron fractured surface.
2. Experimental Method
2.1. Materials
2.1.1. Calcium-Alginate Capsules
Chemicals including sodium alginate, poly(ethylene-alt-maleic-anhydride) (PEMA) and CaCl2were used to prepare these capsules. Since the calcium alginate capsules were manufactured followingthe same procedures as the previous research, as shown in Figure 1, the prepared capsules havea uniform diameter of 1.95 mm and a honey-comb like porous structure [9]. These capsules alsopossessed the same mechanical resistance and thermal stability as previous research [9]. The industrialrejuvenator R20 encapsulated in these capsules was provided by Latexfalt B.V., Koudekerk aan denRijn, Netherlands. The other chemicals used in this research were purchased from Sigma Aldrich,St. Louis, MO, USA.
Figure 2 shows the rejuvenator used in this research. The rejuvenator named as R20 is black undernormal visible light (Figure 2a), which makes it very hard to distinguish the rejuvenator from asphaltmastic (Figure 2b). However, the fluorescent component of the rejuvenator turns into brown colorunder ultraviolet (UV) light (Figure 2c), which allows the rejuvenator being tracked once released viathe fracture of capsules.
Figure 2. Rejuvenator R20: (a) normal appearance; (b) on asphalt mastic under visible light and (c) onasphalt mastic under UV light.
2.1.2. Porous Asphalt Mix and Test Specimens
The porous asphalt mix used in this study was based on the standard mix PA 0/11 (Table 1).Two types of mixtures were designed for the study, including a porous asphalt mix with capsulesand a reference mix without capsules. According to the previous research, using calcium alginatecapsules to replace 7% the volume of bitumen (8% by weight) possesses a higher healing efficiency.Thus, in this paper, the capsules were added in the porous asphalt mix by replacing 7% volume of thebitumen [9]. The bitumen used in the mix was the standard paving grade bitumen 70–100 provided byVitol, London, UK. All the aggregates were Bestone (a kind of limestone widely used in PA construction
160
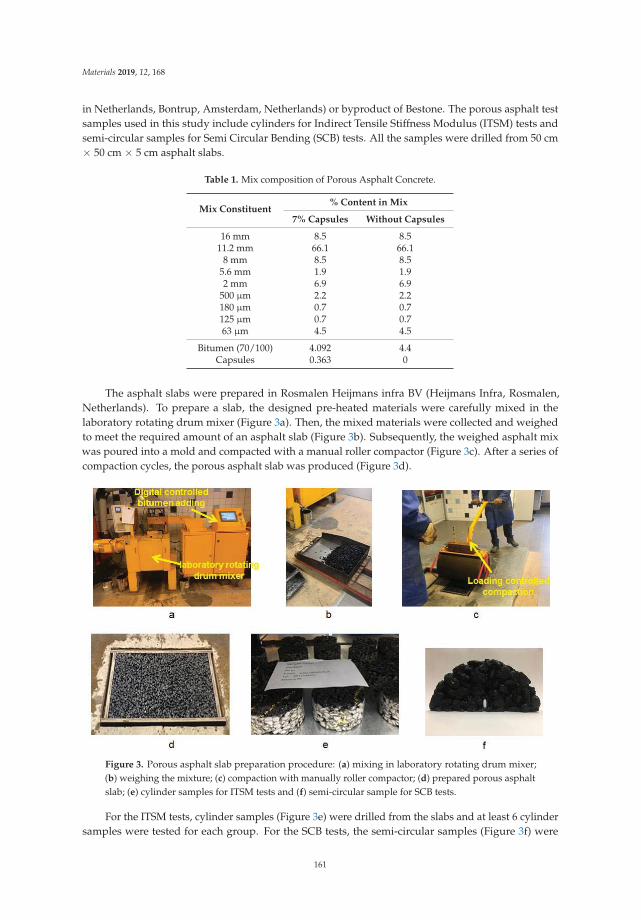
Materials 2019, 12, 168
in Netherlands, Bontrup, Amsterdam, Netherlands) or byproduct of Bestone. The porous asphalt testsamples used in this study include cylinders for Indirect Tensile Stiffness Modulus (ITSM) tests andsemi-circular samples for Semi Circular Bending (SCB) tests. All the samples were drilled from 50 cm× 50 cm × 5 cm asphalt slabs.
Table 1. Mix composition of Porous Asphalt Concrete.
Mix Constituent% Content in Mix
7% Capsules Without Capsules
16 mm 8.5 8.511.2 mm 66.1 66.1
8 mm 8.5 8.55.6 mm 1.9 1.92 mm 6.9 6.9
500 μm 2.2 2.2180 μm 0.7 0.7125 μm 0.7 0.763 μm 4.5 4.5
Bitumen (70/100) 4.092 4.4Capsules 0.363 0
The asphalt slabs were prepared in Rosmalen Heijmans infra BV (Heijmans Infra, Rosmalen,Netherlands). To prepare a slab, the designed pre-heated materials were carefully mixed in thelaboratory rotating drum mixer (Figure 3a). Then, the mixed materials were collected and weighedto meet the required amount of an asphalt slab (Figure 3b). Subsequently, the weighed asphalt mixwas poured into a mold and compacted with a manual roller compactor (Figure 3c). After a series ofcompaction cycles, the porous asphalt slab was produced (Figure 3d).
Figure 3. Porous asphalt slab preparation procedure: (a) mixing in laboratory rotating drum mixer;(b) weighing the mixture; (c) compaction with manually roller compactor; (d) prepared porous asphaltslab; (e) cylinder samples for ITSM tests and (f) semi-circular sample for SCB tests.
For the ITSM tests, cylinder samples (Figure 3e) were drilled from the slabs and at least 6 cylindersamples were tested for each group. For the SCB tests, the semi-circular samples (Figure 3f) were
161
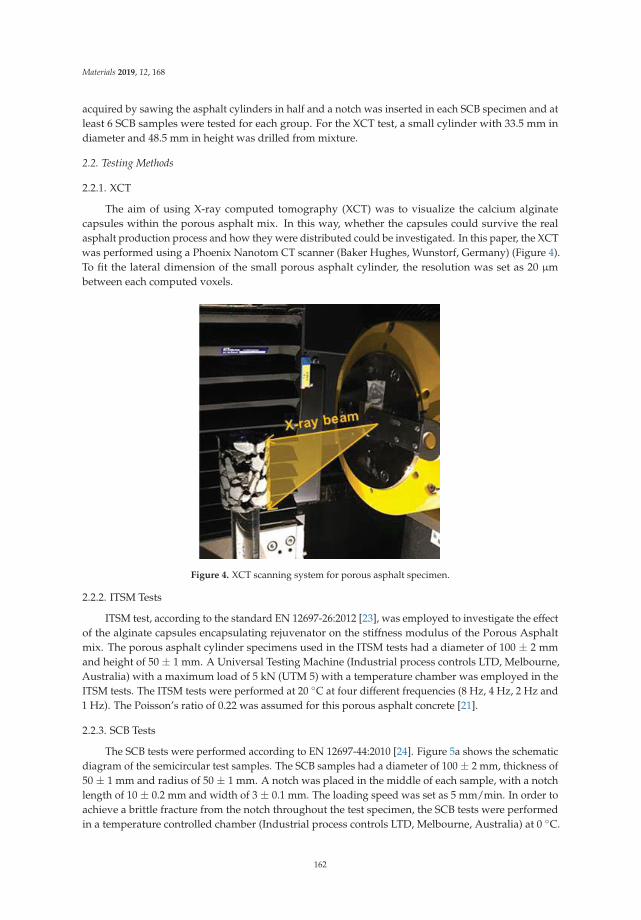
Materials 2019, 12, 168
acquired by sawing the asphalt cylinders in half and a notch was inserted in each SCB specimen and atleast 6 SCB samples were tested for each group. For the XCT test, a small cylinder with 33.5 mm indiameter and 48.5 mm in height was drilled from mixture.
2.2. Testing Methods
2.2.1. XCT
The aim of using X-ray computed tomography (XCT) was to visualize the calcium alginatecapsules within the porous asphalt mix. In this way, whether the capsules could survive the realasphalt production process and how they were distributed could be investigated. In this paper, the XCTwas performed using a Phoenix Nanotom CT scanner (Baker Hughes, Wunstorf, Germany) (Figure 4).To fit the lateral dimension of the small porous asphalt cylinder, the resolution was set as 20 μmbetween each computed voxels.
Figure 4. XCT scanning system for porous asphalt specimen.
2.2.2. ITSM Tests
ITSM test, according to the standard EN 12697-26:2012 [23], was employed to investigate the effectof the alginate capsules encapsulating rejuvenator on the stiffness modulus of the Porous Asphaltmix. The porous asphalt cylinder specimens used in the ITSM tests had a diameter of 100 ± 2 mmand height of 50 ± 1 mm. A Universal Testing Machine (Industrial process controls LTD, Melbourne,Australia) with a maximum load of 5 kN (UTM 5) with a temperature chamber was employed in theITSM tests. The ITSM tests were performed at 20 ◦C at four different frequencies (8 Hz, 4 Hz, 2 Hz and1 Hz). The Poisson’s ratio of 0.22 was assumed for this porous asphalt concrete [21].
2.2.3. SCB Tests
The SCB tests were performed according to EN 12697-44:2010 [24]. Figure 5a shows the schematicdiagram of the semicircular test samples. The SCB samples had a diameter of 100 ± 2 mm, thickness of50 ± 1 mm and radius of 50 ± 1 mm. A notch was placed in the middle of each sample, with a notchlength of 10 ± 0.2 mm and width of 3 ± 0.1 mm. The loading speed was set as 5 mm/min. In order toachieve a brittle fracture from the notch throughout the test specimen, the SCB tests were performedin a temperature controlled chamber (Industrial process controls LTD, Melbourne, Australia) at 0 ◦C.
162
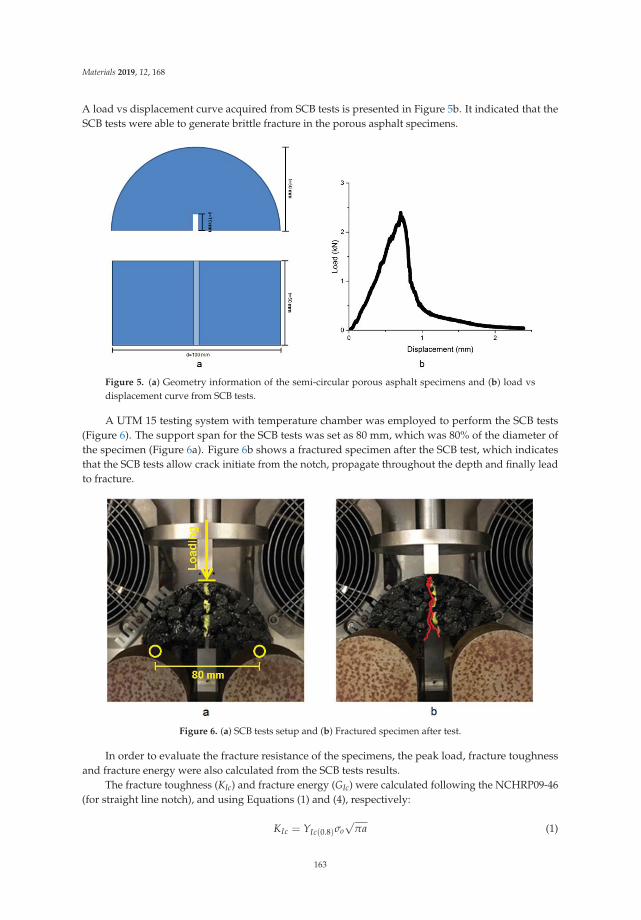
Materials 2019, 12, 168
A load vs displacement curve acquired from SCB tests is presented in Figure 5b. It indicated that theSCB tests were able to generate brittle fracture in the porous asphalt specimens.
Figure 5. (a) Geometry information of the semi-circular porous asphalt specimens and (b) load vsdisplacement curve from SCB tests.
A UTM 15 testing system with temperature chamber was employed to perform the SCB tests(Figure 6). The support span for the SCB tests was set as 80 mm, which was 80% of the diameter ofthe specimen (Figure 6a). Figure 6b shows a fractured specimen after the SCB test, which indicatesthat the SCB tests allow crack initiate from the notch, propagate throughout the depth and finally leadto fracture.
Figure 6. (a) SCB tests setup and (b) Fractured specimen after test.
In order to evaluate the fracture resistance of the specimens, the peak load, fracture toughnessand fracture energy were also calculated from the SCB tests results.
The fracture toughness (KIc) and fracture energy (GIc) were calculated following the NCHRP09-46(for straight line notch), and using Equations (1) and (4), respectively:
KIc = YIc(0.8)σo√
πa (1)
163
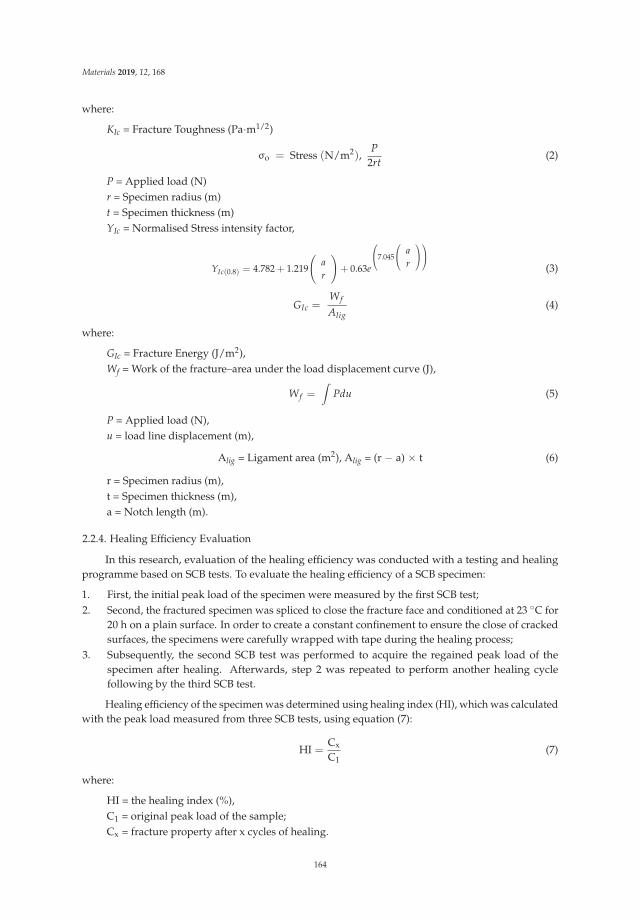
Materials 2019, 12, 168
where:
KIc = Fracture Toughness (Pa·m1/2)
σo = Stress (N/m2),P
2rt(2)
P = Applied load (N)r = Specimen radius (m)t = Specimen thickness (m)YIc = Normalised Stress intensity factor,
YIc(0.8) = 4.782 + 1.219
(ar
)+ 0.63e
⎛⎝7.045
⎛⎝ a
r
⎞⎠⎞⎠
(3)
GIc =Wf
Alig(4)
where:
GIc = Fracture Energy (J/m2),Wf = Work of the fracture–area under the load displacement curve (J),
Wf =∫
Pdu (5)
P = Applied load (N),u = load line displacement (m),
Alig = Ligament area (m2), Alig = (r − a) × t (6)
r = Specimen radius (m),t = Specimen thickness (m),a = Notch length (m).
2.2.4. Healing Efficiency Evaluation
In this research, evaluation of the healing efficiency was conducted with a testing and healingprogramme based on SCB tests. To evaluate the healing efficiency of a SCB specimen:
1. First, the initial peak load of the specimen were measured by the first SCB test;2. Second, the fractured specimen was spliced to close the fracture face and conditioned at 23 ◦C for
20 h on a plain surface. In order to create a constant confinement to ensure the close of crackedsurfaces, the specimens were carefully wrapped with tape during the healing process;
3. Subsequently, the second SCB test was performed to acquire the regained peak load of thespecimen after healing. Afterwards, step 2 was repeated to perform another healing cyclefollowing by the third SCB test.
Healing efficiency of the specimen was determined using healing index (HI), which was calculatedwith the peak load measured from three SCB tests, using equation (7):
HI =Cx
C1(7)
where:
HI = the healing index (%),C1 = original peak load of the sample;Cx = fracture property after x cycles of healing.
164
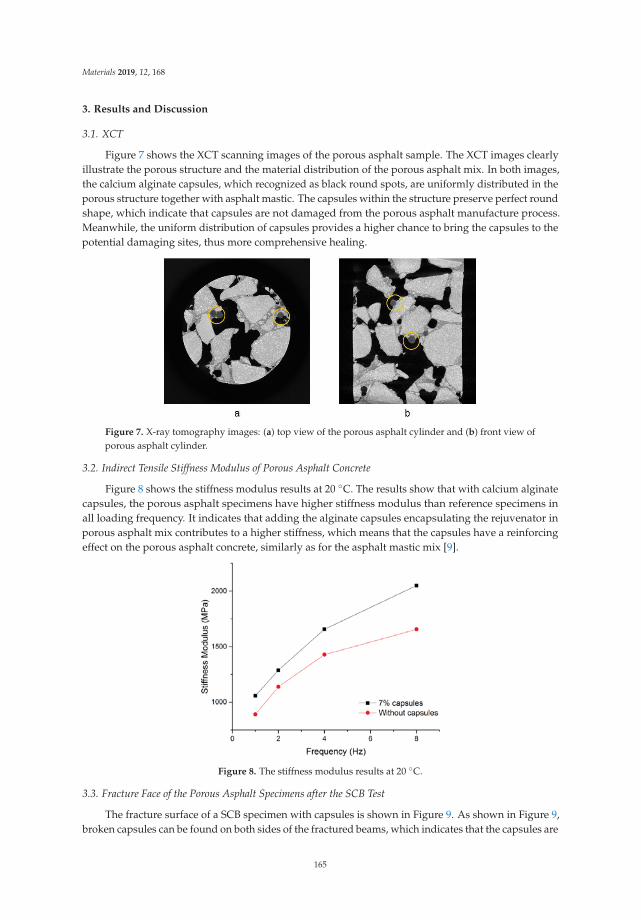
Materials 2019, 12, 168
3. Results and Discussion
3.1. XCT
Figure 7 shows the XCT scanning images of the porous asphalt sample. The XCT images clearlyillustrate the porous structure and the material distribution of the porous asphalt mix. In both images,the calcium alginate capsules, which recognized as black round spots, are uniformly distributed in theporous structure together with asphalt mastic. The capsules within the structure preserve perfect roundshape, which indicate that capsules are not damaged from the porous asphalt manufacture process.Meanwhile, the uniform distribution of capsules provides a higher chance to bring the capsules to thepotential damaging sites, thus more comprehensive healing.
Figure 7. X-ray tomography images: (a) top view of the porous asphalt cylinder and (b) front view ofporous asphalt cylinder.
3.2. Indirect Tensile Stiffness Modulus of Porous Asphalt Concrete
Figure 8 shows the stiffness modulus results at 20 ◦C. The results show that with calcium alginatecapsules, the porous asphalt specimens have higher stiffness modulus than reference specimens inall loading frequency. It indicates that adding the alginate capsules encapsulating the rejuvenator inporous asphalt mix contributes to a higher stiffness, which means that the capsules have a reinforcingeffect on the porous asphalt concrete, similarly as for the asphalt mastic mix [9].
Figure 8. The stiffness modulus results at 20 ◦C.
3.3. Fracture Face of the Porous Asphalt Specimens after the SCB Test
The fracture surface of a SCB specimen with capsules is shown in Figure 9. As shown in Figure 9,broken capsules can be found on both sides of the fractured beams, which indicates that the capsules are
165
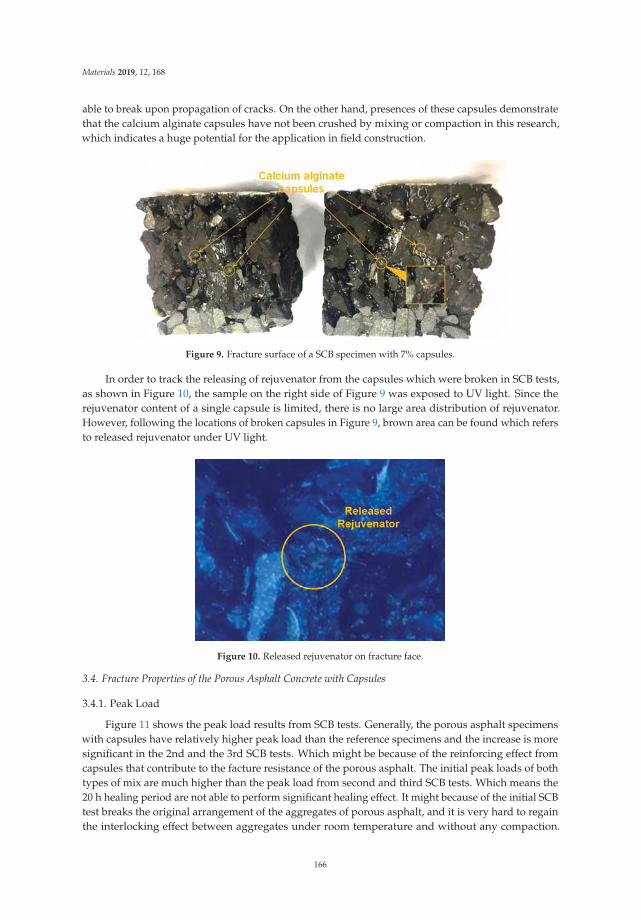
Materials 2019, 12, 168
able to break upon propagation of cracks. On the other hand, presences of these capsules demonstratethat the calcium alginate capsules have not been crushed by mixing or compaction in this research,which indicates a huge potential for the application in field construction.
Figure 9. Fracture surface of a SCB specimen with 7% capsules.
In order to track the releasing of rejuvenator from the capsules which were broken in SCB tests,as shown in Figure 10, the sample on the right side of Figure 9 was exposed to UV light. Since therejuvenator content of a single capsule is limited, there is no large area distribution of rejuvenator.However, following the locations of broken capsules in Figure 9, brown area can be found which refersto released rejuvenator under UV light.
Figure 10. Released rejuvenator on fracture face.
3.4. Fracture Properties of the Porous Asphalt Concrete with Capsules
3.4.1. Peak Load
Figure 11 shows the peak load results from SCB tests. Generally, the porous asphalt specimenswith capsules have relatively higher peak load than the reference specimens and the increase is moresignificant in the 2nd and the 3rd SCB tests. Which might be because of the reinforcing effect fromcapsules that contribute to the facture resistance of the porous asphalt. The initial peak loads of bothtypes of mix are much higher than the peak load from second and third SCB tests. Which means the20 h healing period are not able to perform significant healing effect. It might because of the initial SCBtest breaks the original arrangement of the aggregates of porous asphalt, and it is very hard to regainthe interlocking effect between aggregates under room temperature and without any compaction.
166
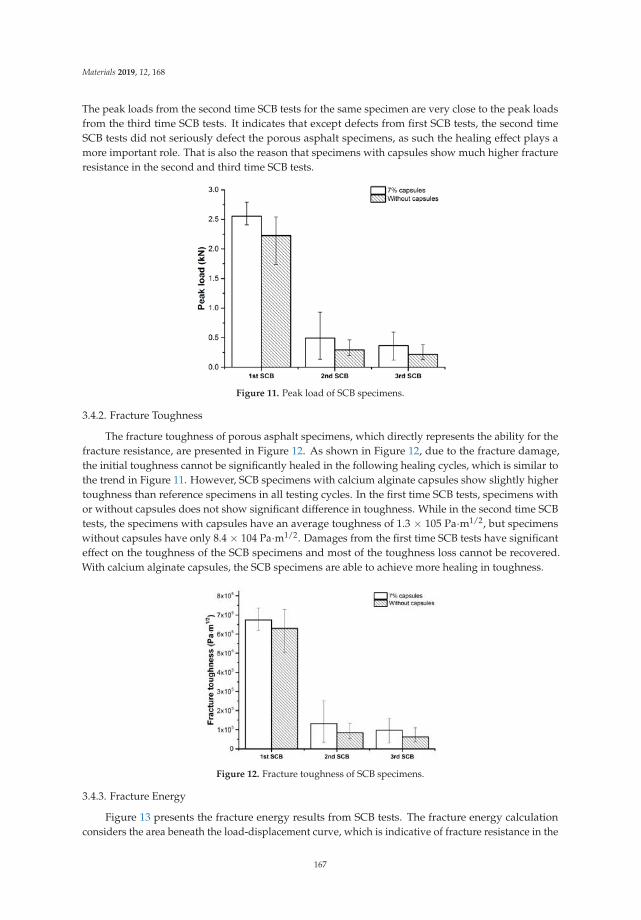
Materials 2019, 12, 168
The peak loads from the second time SCB tests for the same specimen are very close to the peak loadsfrom the third time SCB tests. It indicates that except defects from first SCB tests, the second timeSCB tests did not seriously defect the porous asphalt specimens, as such the healing effect plays amore important role. That is also the reason that specimens with capsules show much higher fractureresistance in the second and third time SCB tests.
Figure 11. Peak load of SCB specimens.
3.4.2. Fracture Toughness
The fracture toughness of porous asphalt specimens, which directly represents the ability for thefracture resistance, are presented in Figure 12. As shown in Figure 12, due to the fracture damage,the initial toughness cannot be significantly healed in the following healing cycles, which is similar tothe trend in Figure 11. However, SCB specimens with calcium alginate capsules show slightly highertoughness than reference specimens in all testing cycles. In the first time SCB tests, specimens withor without capsules does not show significant difference in toughness. While in the second time SCBtests, the specimens with capsules have an average toughness of 1.3 × 10⁵ Pa·m1/2, but specimenswithout capsules have only 8.4 × 10⁴ Pa·m1/2. Damages from the first time SCB tests have significanteffect on the toughness of the SCB specimens and most of the toughness loss cannot be recovered.With calcium alginate capsules, the SCB specimens are able to achieve more healing in toughness.
Figure 12. Fracture toughness of SCB specimens.
3.4.3. Fracture Energy
Figure 13 presents the fracture energy results from SCB tests. The fracture energy calculationconsiders the area beneath the load-displacement curve, which is indicative of fracture resistance in the
167
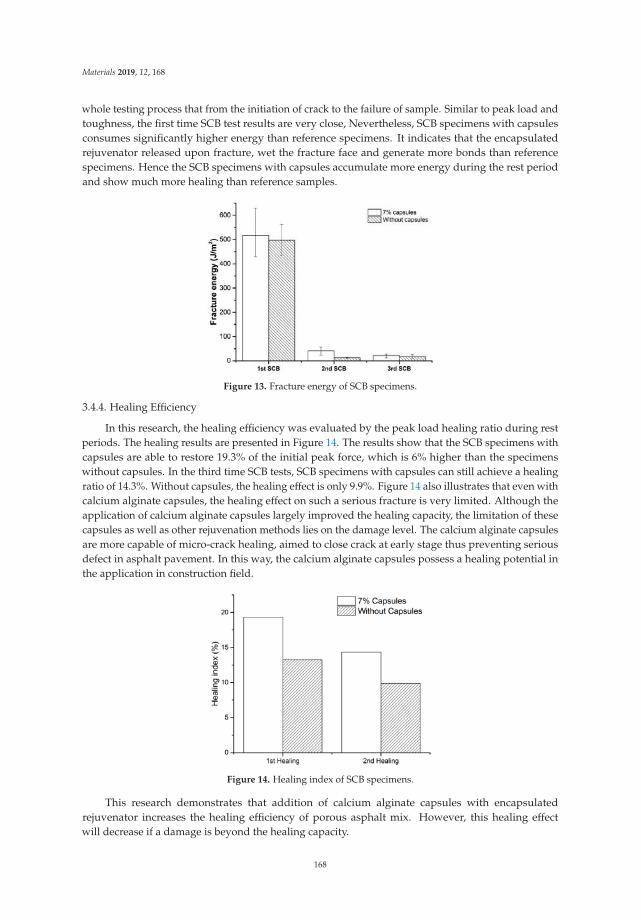
Materials 2019, 12, 168
whole testing process that from the initiation of crack to the failure of sample. Similar to peak load andtoughness, the first time SCB test results are very close, Nevertheless, SCB specimens with capsulesconsumes significantly higher energy than reference specimens. It indicates that the encapsulatedrejuvenator released upon fracture, wet the fracture face and generate more bonds than referencespecimens. Hence the SCB specimens with capsules accumulate more energy during the rest periodand show much more healing than reference samples.
Figure 13. Fracture energy of SCB specimens.
3.4.4. Healing Efficiency
In this research, the healing efficiency was evaluated by the peak load healing ratio during restperiods. The healing results are presented in Figure 14. The results show that the SCB specimens withcapsules are able to restore 19.3% of the initial peak force, which is 6% higher than the specimenswithout capsules. In the third time SCB tests, SCB specimens with capsules can still achieve a healingratio of 14.3%. Without capsules, the healing effect is only 9.9%. Figure 14 also illustrates that even withcalcium alginate capsules, the healing effect on such a serious fracture is very limited. Although theapplication of calcium alginate capsules largely improved the healing capacity, the limitation of thesecapsules as well as other rejuvenation methods lies on the damage level. The calcium alginate capsulesare more capable of micro-crack healing, aimed to close crack at early stage thus preventing seriousdefect in asphalt pavement. In this way, the calcium alginate capsules possess a healing potential inthe application in construction field.
Figure 14. Healing index of SCB specimens.
This research demonstrates that addition of calcium alginate capsules with encapsulatedrejuvenator increases the healing efficiency of porous asphalt mix. However, this healing effectwill decrease if a damage is beyond the healing capacity.
168
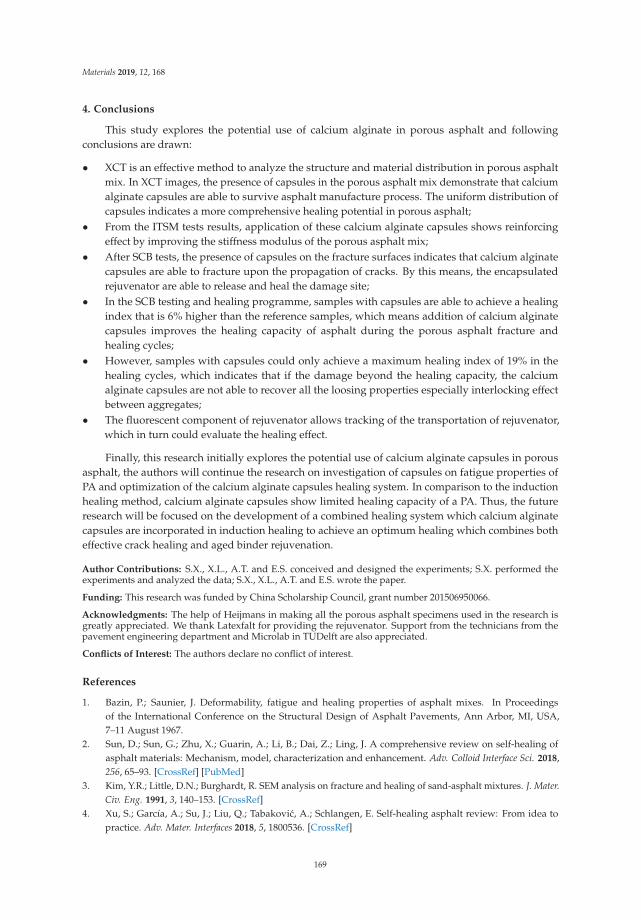
Materials 2019, 12, 168
4. Conclusions
This study explores the potential use of calcium alginate in porous asphalt and followingconclusions are drawn:
• XCT is an effective method to analyze the structure and material distribution in porous asphaltmix. In XCT images, the presence of capsules in the porous asphalt mix demonstrate that calciumalginate capsules are able to survive asphalt manufacture process. The uniform distribution ofcapsules indicates a more comprehensive healing potential in porous asphalt;
• From the ITSM tests results, application of these calcium alginate capsules shows reinforcingeffect by improving the stiffness modulus of the porous asphalt mix;
• After SCB tests, the presence of capsules on the fracture surfaces indicates that calcium alginatecapsules are able to fracture upon the propagation of cracks. By this means, the encapsulatedrejuvenator are able to release and heal the damage site;
• In the SCB testing and healing programme, samples with capsules are able to achieve a healingindex that is 6% higher than the reference samples, which means addition of calcium alginatecapsules improves the healing capacity of asphalt during the porous asphalt fracture andhealing cycles;
• However, samples with capsules could only achieve a maximum healing index of 19% in thehealing cycles, which indicates that if the damage beyond the healing capacity, the calciumalginate capsules are not able to recover all the loosing properties especially interlocking effectbetween aggregates;
• The fluorescent component of rejuvenator allows tracking of the transportation of rejuvenator,which in turn could evaluate the healing effect.
Finally, this research initially explores the potential use of calcium alginate capsules in porousasphalt, the authors will continue the research on investigation of capsules on fatigue properties ofPA and optimization of the calcium alginate capsules healing system. In comparison to the inductionhealing method, calcium alginate capsules show limited healing capacity of a PA. Thus, the futureresearch will be focused on the development of a combined healing system which calcium alginatecapsules are incorporated in induction healing to achieve an optimum healing which combines botheffective crack healing and aged binder rejuvenation.
Author Contributions: S.X., X.L., A.T. and E.S. conceived and designed the experiments; S.X. performed theexperiments and analyzed the data; S.X., X.L., A.T. and E.S. wrote the paper.
Funding: This research was funded by China Scholarship Council, grant number 201506950066.
Acknowledgments: The help of Heijmans in making all the porous asphalt specimens used in the research isgreatly appreciated. We thank Latexfalt for providing the rejuvenator. Support from the technicians from thepavement engineering department and Microlab in TUDelft are also appreciated.
Conflicts of Interest: The authors declare no conflict of interest.
References
1. Bazin, P.; Saunier, J. Deformability, fatigue and healing properties of asphalt mixes. In Proceedingsof the International Conference on the Structural Design of Asphalt Pavements, Ann Arbor, MI, USA,7–11 August 1967.
2. Sun, D.; Sun, G.; Zhu, X.; Guarin, A.; Li, B.; Dai, Z.; Ling, J. A comprehensive review on self-healing ofasphalt materials: Mechanism, model, characterization and enhancement. Adv. Colloid Interface Sci. 2018,256, 65–93. [CrossRef] [PubMed]
3. Kim, Y.R.; Little, D.N.; Burghardt, R. SEM analysis on fracture and healing of sand-asphalt mixtures. J. Mater.Civ. Eng. 1991, 3, 140–153. [CrossRef]
4. Xu, S.; García, A.; Su, J.; Liu, Q.; Tabakovic, A.; Schlangen, E. Self-healing asphalt review: From idea topractice. Adv. Mater. Interfaces 2018, 5, 1800536. [CrossRef]
169
Materials 2019, 12, 168
5. García, Á.; Schlangen, E.; van de Ven, M.; van Vliet, D. Induction heating of mastic containing conductivefibers and fillers. Mater. Struct. 2011, 44, 499–508. [CrossRef]
6. Liu, Q.; Schlangen, E.; van de Ven, M. Induction healing of porous asphalt concrete beams on an elasticfoundation. J. Mater. Civ. Eng. 2012, 25, 880–885. [CrossRef]
7. Gallego, J.; del Val, M.A.; Contreras, V.; Páez, A. Heating asphalt mixtures with microwaves to promoteself-healing. Constr. Build. Mater. 2013, 42, 1–4. [CrossRef]
8. Norambuena-Contreras, J.; Garcia, A. Self-healing of asphalt mixture by microwave and induction heating.Mater. Des. 2016, 106, 404–414. [CrossRef]
9. Xu, S.; Tabakovic, A.; Liu, X.; Schlangen, E. Calcium alginate capsules encapsulating rejuvenator as healingsystem for asphalt mastic. Constr. Build. Mater. 2018, 169, 379–387. [CrossRef]
10. García, Á.; Schlangen, E.; van de Ven, M.; Sierra-Beltrán, G. Preparation of capsules containing rejuvenatorsfor their use in asphalt concrete. J. Hazard. Mater. 2010, 184, 603–611. [CrossRef] [PubMed]
11. Su, J.-F.; Qiu, J.; Schlangen, E. Stability investigation of self-healing microcapsules containing rejuvenator forbitumen. Polym. Degrad. Stab. 2013, 98, 1205–1215. [CrossRef]
12. Tabakovic, A.; Post, W.; Cantero, D.; Copuroglu, O.; Garcia, S.; Schlangen, E. The reinforcement and healing ofasphalt mastic mixtures by rejuvenator encapsulation in alginate compartmented fibres. Smart Mater. Struct.2016, 25, 084003. [CrossRef]
13. Xu, S.; Tabakovic, A.; Liu, X.; Schlangen, E. Preparation of calcium alginate capsules and the application inasphalt mastic. In Proceedings of the 6th International Conference on Self-Healing Materials, Friedrichshafen,Germany, 25–28 June 2017.
14. Van Der Zwan, J.T.; Goeman, T.; Gruis, H.; Swart, J.; Oldenburger, R. Porous asphalt wearing courses in theNetherlands: State of the art review. Transp. Res. Rec. 1990, 1265, 95–110.
15. McDaniel, R.; Thornton, W. Field evaluation of a porous friction course for noise control. In Proceedings ofthe Annual Meeting of the Transportation Research Board, Washington, DC, USA, 9–13 January 2005.
16. Bolzan, P.; Nicholls, J.; Huber, G. Searching for superior performing porous asphalt wearing courses.In Proceedings of the 80th Transportation Research Board Annual Meeting, Washington DC, USA,7–11 January 2001.
17. Pasetto, M.; Baldo, N. Comparative performance analysis of bituminous mixtures with EAF steel slags:A laboratory evaluation. In Proceedings of the 2008 Global Symposium on Recycling, Waste Treatment andClean Technology, Cancun, Mexico, 12–15 October 2008; pp. 565–570.
18. Kim, H.; Sokolov, K.; Poulikakos, L.; Partl, M. Fatigue evaluation of porous asphalt composites with carbonfiber reinforcement polymer grids. Transp. Res. Re. J. Transp. Res. Board 2009, 2116, 108–117. [CrossRef]
19. Klomp, A. Life Period of Porous Asphalt; Dutch Road and Hydraulic Engineering Institute Report:Rijkswaterstaat, The Netherlands, 1996.
20. Hagos, E.T. The Effect of Aging on Binder Properties of Porous Asphalt Concrete. Ph.D. Thesis, DelftUniversity of Technology, Delft, The Netherlands, 2008.
21. Liu, Q.; García, Á.; Schlangen, E.; van de Ven, M. Induction healing of asphalt mastic and porous asphaltconcrete. Constr. Build. Mater. 2011, 25, 3746–3752. [CrossRef]
22. Tabakovic, A.; Schuyffel, L.; Karac, A.; Schlangen, E. An evaluation of the efficiency of compartmentedalginate fibres encapsulating a rejuvenator as an asphalt pavement healing system. Appl. Sci. 2017, 7, 647.[CrossRef]
23. Bituminous Mixtures. Test Methods for Hot Mix Asphalt, Part 26: Stiffness; EN 12697-26; CEN: Brussel,Belgium, 2004.
24. Bituminous Mixtures. Test Methods for Hot Mix Asphalt, Part 44: Crack Propagation by Semi-Circular BendingTest; EN 12697-44; CEN: Brussel, Belgium, 2010.
© 2019 by the authors. Licensee MDPI, Basel, Switzerland. This article is an open accessarticle distributed under the terms and conditions of the Creative Commons Attribution(CC BY) license (http://creativecommons.org/licenses/by/4.0/).
170
materials
Article
Microfluidic Synthesis of Ca-Alginate Microcapsulesfor Self-Healing of Bituminous Binder
Benan Shu 1, Shaopeng Wu 1,*, Lijie Dong 2, Qing Wang 2 and Quantao Liu 1
1 State Key Laboratory of Silicate Materials for Architectures, Wuhan University of Technology,Wuhan 430070, China; [email protected] (B.S.); [email protected] (Q.L.)
2 State Key Laboratory of Advanced Technology for Materials Synthesis and Processing,School of Materials Science and Engineering, Wuhan University of Technology, Wuhan 430070, China;[email protected] (L.D.); [email protected] (Q.W.)
* Correspondence: [email protected]; Tel./Fax: +86-(0)27-87054920
Received: 11 April 2018; Accepted: 17 April 2018; Published: 19 April 2018
Abstract: This work aims to develop an original alginate micro-emulsion combining with dropletsmicrofluidic method to produce multinuclear Ca-alginate microcapsules containing rejuvenator forthe self-healing of bituminous binder. The sizes of the Ca-alginate microcapsules could be easilycontrolled by tuning flow rates of the continuous and dispersed phases. The addition of a surfactantTween80 not only improved the stability of the emulsion, but it also effectively reduced the size ofthe microcapsules. Size predictive mathematical model of the microcapsules was proposed throughthe analysis of fluid force. Optical microscope and remote Fourier infrared test confirmed themultinuclear structure of Ca-alginate microcapsules. Thermogravimetric analysis showed that themicrocapsules coated with nearly 40% rejuvenator and they remained intact during the preparationof bitumen specimen at 135 ◦C. Micro self-healing process of bituminous binder with multinuclearCa-alginate microcapsules containing rejuvenator was monitored and showed enhanced self-healingperformance. Tensile stress-recovery test revealed that the recovery rate increased by 32.08% (in thecase of 5% microcapsules), which meant that the Ca-alginate microcapsules containing rejuvenatorcould effectively enhance the self-healing property of bituminous binder.
Keywords: Ca-alginate microcapsules; microfluidic; self-healing; bitumen
1. Introduction
Self-healing materials as a kind of intelligent material have attracted increasing interest becauseit can automatically repair the internal structural damage of the material [1–6]. Bitumen-a is widelyused material in pavements has a limited service life. The bituminous pavement would produce microcracks under the action of load, temperature, ultraviolet light, and so on. Although it has a certainself-healing ability, it will develop into a macro crack under the action of continuous traffic load [7–10].In view of this, bitumen containing various capsules with self-healing property to prolong its servicelife has been widely investigated [11–15]. However, synthesis of those capsules generally has somedisadvantages: limited encapsulation, high cost, and complex synthesis process. Sodium alginate,for its low cost, ease of use, and non-toxicity has been intended to be used to prepare microcapsulesfor the self-healing of bitumen. Garcia et al. [16,17] reported on the fabrication of porous calciumalginate spheres containing sunflower oil for the self-healing of bitumen mixture. The oil content of thecapsules prepared by this method was limited and the particle size was too large to repair the microcracks in the bitumen. Size distribution would influence self-healing performance of microcapsulesin bitumen [18,19]. In view of this, different-sized and high rejuvenator loading calcium alginatemicrocapsules are badly needed.
Materials 2018, 11, 630; doi:10.3390/ma11040630 www.mdpi.com/journal/materials171
Materials 2018, 11, 630
At present, there are two mechanisms for the synthesis of alginate microcapsules: forward gelationand reverse gelation. For the forward gelation, Ren et al. [20] reported using oil/water/oil (O/W/O)double emulsions as templates to synthesis alginate microcapsules with oil core by a microfluidicdevice. The effect of the inner and outer diameters of quartz glass tube on the size of Ca-alginatemicrocapsules was analyzed. Kuan-Wen Yeh et al. [21] reported that Ca-alginate microcapsuleswith tea-tree oil were synthesized after the addition of calcium chloride solution to the sodiumalginate solution in the flask with mixing and the release model was studied. The microcapsuleshad a large particle size distribution. Romanowsky et al. [22] have demonstrated a parallelizedmicrofluidic design by making double emulsions of water/octanol/water (W/O/W) to preparevarious encapsulation like Ca-alginate microcapsules with oil cores. Supaporn et al. [23] synthesizedthe Ca-alginate microcapsules containing eucalyptus oil with a narrow size distribution via Shirasuporous glass (SPG) membrane. The concentration of alginate solution, temperature, and releasemodel were investigated. Chew et al. [24] proposed that Kenaf seed oil was encapsulated usingco-extrusion technology with a high methoxyl pectin (HMP)-enhanced alginate shell. Schmit et al. [25]showed that the oil droplets were pumped into alginate/CaCO3 solution and the formed O/Wemulsion was added drop wise to the oil–acetic acid bath through a co-flow junction microfluidicdevice. However, the distribution and dissolution of CaCO3 limited the morphology of the capsules.Marquis et al. [26] described two-step approach allowing the encapsulation of several oil micro-dropletswithin alginate micro-gels. Cotton cellulose nanocrystals and calcium carbonate was used to preparePickering emulsion in the first step, oil micro-droplets resulting from the Pickering emulsion wereencapsulated within alginate micro-gels using microfluidics. Evandro Martins et al. [27,28] proposed atechnique of oil encapsulation in Ca-alginate microcapsules by inverse gelation. The oil containingcalcium ions dropped into the sodium alginate solution, and the calcium ions diffused from insideto outside to obtain capsules. The reverse gelation mechanism has also been extensively studiedby other researchers [29–32]. However, those methods usually either involved multiple fluids to becontrolled simultaneously in the process of experiments, or cumbersome preparation which makesmass production difficult. Furthermore, the diffusion of calcium ions makes it easy for alginatesolution to form a whole block of hydrogel and the secondary dissolution of capsules in reversegelation makes it difficult to produce separable capsules. Moreover, the formation mechanism ofdroplets in microfluidic devices has not been deeply studied.
To the best of our knowledge, it seems there is no published paper concerning the synthesis ofusing alginate micro-emulsion combining droplets microfluidic. In view of this, this paper performeda micro-emulsion of alginate and rejuvenator combining with droplets microfluidic method to produceCa-alginate microcapsules. The size can be easily controlled and the formation mechanism of theemulsion droplets in microfluidic device was deeply studied from the point of view of the fluidforce. Then a size predictive mathematical model of the microcapsules was proposed. In addition,the self-healing performance of bitumen containing the microcapsules was investigated. This researchprovides possibilities for industrial large-scale production of Ca-alginate microcapsules containingrejuvenators, extending the service life of bituminous materials—such as bitumen highways, bitumenwaterproofing layers, and bitumen anticorrosive materials—and realizing development of a moresustainable and green construction industry related to bitumen materials.
2. Materials and Methods
2.1. Materials
Sodium alginate, Tween80, and anhydrous calcium chloride (CaCl2·2H2O) were purchased fromSinopharm Chemical Reagent Co., Ltd. (Beijing, China). 70A (70A is an abbreviation of bitumen with60/80 pen grade) bitumen was supplied by KOCH Bitumen Co., Ltd. (Wuhan, China) and propertiesare shown in Table 1. Rejuvenator was obtained from Hubei Bo Run Chemical Technology Co., Ltd.
172
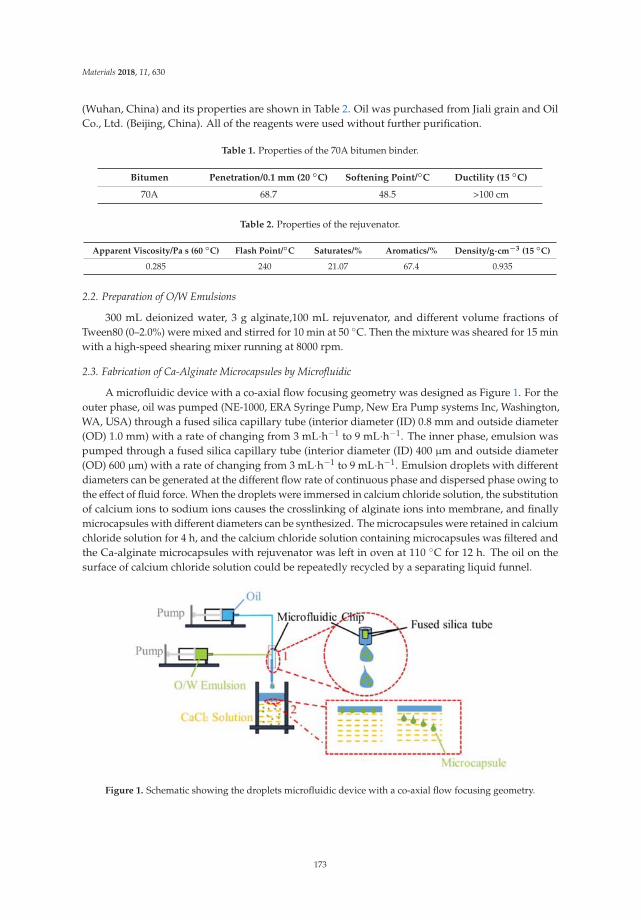
Materials 2018, 11, 630
(Wuhan, China) and its properties are shown in Table 2. Oil was purchased from Jiali grain and OilCo., Ltd. (Beijing, China). All of the reagents were used without further purification.
Table 1. Properties of the 70A bitumen binder.
Bitumen Penetration/0.1 mm (20 ◦C) Softening Point/◦C Ductility (15 ◦C)
70A 68.7 48.5 >100 cm
Table 2. Properties of the rejuvenator.
Apparent Viscosity/Pa s (60 ◦C) Flash Point/◦C Saturates/% Aromatics/% Density/g·cm−3 (15 ◦C)
0.285 240 21.07 67.4 0.935
2.2. Preparation of O/W Emulsions
300 mL deionized water, 3 g alginate,100 mL rejuvenator, and different volume fractions ofTween80 (0–2.0%) were mixed and stirred for 10 min at 50 ◦C. Then the mixture was sheared for 15 minwith a high-speed shearing mixer running at 8000 rpm.
2.3. Fabrication of Ca-Alginate Microcapsules by Microfluidic
A microfluidic device with a co-axial flow focusing geometry was designed as Figure 1. For theouter phase, oil was pumped (NE-1000, ERA Syringe Pump, New Era Pump systems Inc, Washington,WA, USA) through a fused silica capillary tube (interior diameter (ID) 0.8 mm and outside diameter(OD) 1.0 mm) with a rate of changing from 3 mL·h−1 to 9 mL·h−1. The inner phase, emulsion waspumped through a fused silica capillary tube (interior diameter (ID) 400 μm and outside diameter(OD) 600 μm) with a rate of changing from 3 mL·h−1 to 9 mL·h−1. Emulsion droplets with differentdiameters can be generated at the different flow rate of continuous phase and dispersed phase owing tothe effect of fluid force. When the droplets were immersed in calcium chloride solution, the substitutionof calcium ions to sodium ions causes the crosslinking of alginate ions into membrane, and finallymicrocapsules with different diameters can be synthesized. The microcapsules were retained in calciumchloride solution for 4 h, and the calcium chloride solution containing microcapsules was filtered andthe Ca-alginate microcapsules with rejuvenator was left in oven at 110 ◦C for 12 h. The oil on thesurface of calcium chloride solution could be repeatedly recycled by a separating liquid funnel.
Figure 1. Schematic showing the droplets microfluidic device with a co-axial flow focusing geometry.
173
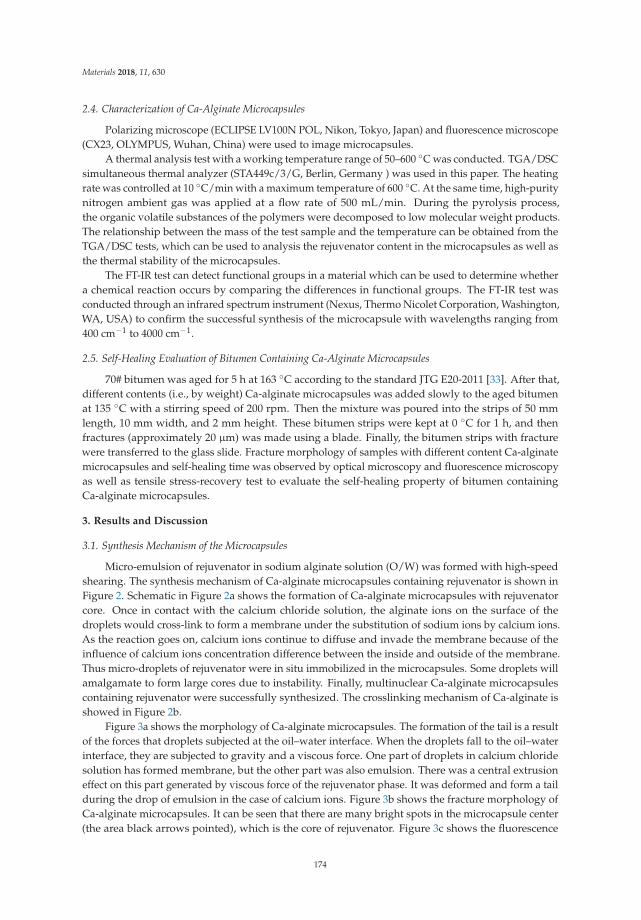
Materials 2018, 11, 630
2.4. Characterization of Ca-Alginate Microcapsules
Polarizing microscope (ECLIPSE LV100N POL, Nikon, Tokyo, Japan) and fluorescence microscope(CX23, OLYMPUS, Wuhan, China) were used to image microcapsules.
A thermal analysis test with a working temperature range of 50–600 ◦C was conducted. TGA/DSCsimultaneous thermal analyzer (STA449c/3/G, Berlin, Germany ) was used in this paper. The heatingrate was controlled at 10 ◦C/min with a maximum temperature of 600 ◦C. At the same time, high-puritynitrogen ambient gas was applied at a flow rate of 500 mL/min. During the pyrolysis process,the organic volatile substances of the polymers were decomposed to low molecular weight products.The relationship between the mass of the test sample and the temperature can be obtained from theTGA/DSC tests, which can be used to analysis the rejuvenator content in the microcapsules as well asthe thermal stability of the microcapsules.
The FT-IR test can detect functional groups in a material which can be used to determine whethera chemical reaction occurs by comparing the differences in functional groups. The FT-IR test wasconducted through an infrared spectrum instrument (Nexus, Thermo Nicolet Corporation, Washington,WA, USA) to confirm the successful synthesis of the microcapsule with wavelengths ranging from400 cm−1 to 4000 cm−1.
2.5. Self-Healing Evaluation of Bitumen Containing Ca-Alginate Microcapsules
70# bitumen was aged for 5 h at 163 ◦C according to the standard JTG E20-2011 [33]. After that,different contents (i.e., by weight) Ca-alginate microcapsules was added slowly to the aged bitumenat 135 ◦C with a stirring speed of 200 rpm. Then the mixture was poured into the strips of 50 mmlength, 10 mm width, and 2 mm height. These bitumen strips were kept at 0 ◦C for 1 h, and thenfractures (approximately 20 μm) was made using a blade. Finally, the bitumen strips with fracturewere transferred to the glass slide. Fracture morphology of samples with different content Ca-alginatemicrocapsules and self-healing time was observed by optical microscopy and fluorescence microscopyas well as tensile stress-recovery test to evaluate the self-healing property of bitumen containingCa-alginate microcapsules.
3. Results and Discussion
3.1. Synthesis Mechanism of the Microcapsules
Micro-emulsion of rejuvenator in sodium alginate solution (O/W) was formed with high-speedshearing. The synthesis mechanism of Ca-alginate microcapsules containing rejuvenator is shown inFigure 2. Schematic in Figure 2a shows the formation of Ca-alginate microcapsules with rejuvenatorcore. Once in contact with the calcium chloride solution, the alginate ions on the surface of thedroplets would cross-link to form a membrane under the substitution of sodium ions by calcium ions.As the reaction goes on, calcium ions continue to diffuse and invade the membrane because of theinfluence of calcium ions concentration difference between the inside and outside of the membrane.Thus micro-droplets of rejuvenator were in situ immobilized in the microcapsules. Some droplets willamalgamate to form large cores due to instability. Finally, multinuclear Ca-alginate microcapsulescontaining rejuvenator were successfully synthesized. The crosslinking mechanism of Ca-alginate isshowed in Figure 2b.
Figure 3a shows the morphology of Ca-alginate microcapsules. The formation of the tail is a resultof the forces that droplets subjected at the oil–water interface. When the droplets fall to the oil–waterinterface, they are subjected to gravity and a viscous force. One part of droplets in calcium chloridesolution has formed membrane, but the other part was also emulsion. There was a central extrusioneffect on this part generated by viscous force of the rejuvenator phase. It was deformed and form a tailduring the drop of emulsion in the case of calcium ions. Figure 3b shows the fracture morphology ofCa-alginate microcapsules. It can be seen that there are many bright spots in the microcapsule center(the area black arrows pointed), which is the core of rejuvenator. Figure 3c shows the fluorescence
174
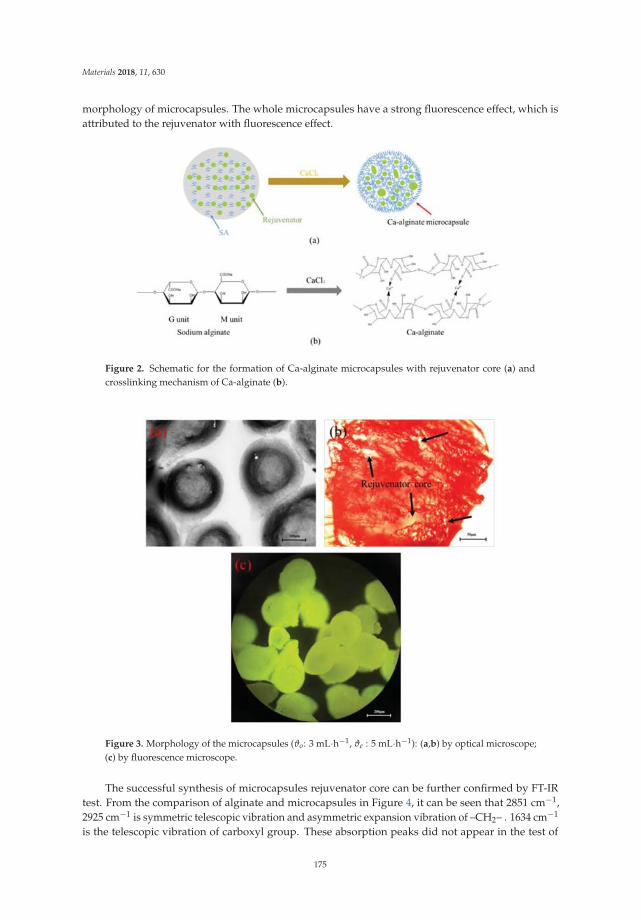
Materials 2018, 11, 630
morphology of microcapsules. The whole microcapsules have a strong fluorescence effect, which isattributed to the rejuvenator with fluorescence effect.
Figure 2. Schematic for the formation of Ca-alginate microcapsules with rejuvenator core (a) andcrosslinking mechanism of Ca-alginate (b).
Figure 3. Morphology of the microcapsules (ϑo: 3 mL·h−1, ϑe : 5 mL·h−1): (a,b) by optical microscope;(c) by fluorescence microscope.
The successful synthesis of microcapsules rejuvenator core can be further confirmed by FT-IRtest. From the comparison of alginate and microcapsules in Figure 4, it can be seen that 2851 cm−1,2925 cm−1 is symmetric telescopic vibration and asymmetric expansion vibration of –CH2– . 1634 cm−1
is the telescopic vibration of carboxyl group. These absorption peaks did not appear in the test of
175
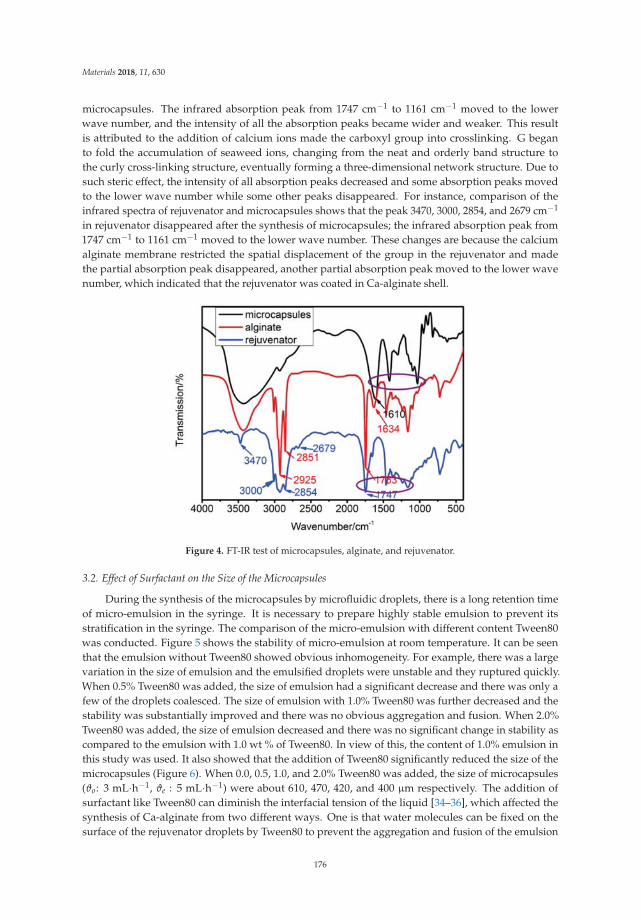
Materials 2018, 11, 630
microcapsules. The infrared absorption peak from 1747 cm−1 to 1161 cm−1 moved to the lowerwave number, and the intensity of all the absorption peaks became wider and weaker. This resultis attributed to the addition of calcium ions made the carboxyl group into crosslinking. G beganto fold the accumulation of seaweed ions, changing from the neat and orderly band structure tothe curly cross-linking structure, eventually forming a three-dimensional network structure. Due tosuch steric effect, the intensity of all absorption peaks decreased and some absorption peaks movedto the lower wave number while some other peaks disappeared. For instance, comparison of theinfrared spectra of rejuvenator and microcapsules shows that the peak 3470, 3000, 2854, and 2679 cm−1
in rejuvenator disappeared after the synthesis of microcapsules; the infrared absorption peak from1747 cm−1 to 1161 cm−1 moved to the lower wave number. These changes are because the calciumalginate membrane restricted the spatial displacement of the group in the rejuvenator and madethe partial absorption peak disappeared, another partial absorption peak moved to the lower wavenumber, which indicated that the rejuvenator was coated in Ca-alginate shell.
Figure 4. FT-IR test of microcapsules, alginate, and rejuvenator.
3.2. Effect of Surfactant on the Size of the Microcapsules
During the synthesis of the microcapsules by microfluidic droplets, there is a long retention timeof micro-emulsion in the syringe. It is necessary to prepare highly stable emulsion to prevent itsstratification in the syringe. The comparison of the micro-emulsion with different content Tween80was conducted. Figure 5 shows the stability of micro-emulsion at room temperature. It can be seenthat the emulsion without Tween80 showed obvious inhomogeneity. For example, there was a largevariation in the size of emulsion and the emulsified droplets were unstable and they ruptured quickly.When 0.5% Tween80 was added, the size of emulsion had a significant decrease and there was only afew of the droplets coalesced. The size of emulsion with 1.0% Tween80 was further decreased and thestability was substantially improved and there was no obvious aggregation and fusion. When 2.0%Tween80 was added, the size of emulsion decreased and there was no significant change in stability ascompared to the emulsion with 1.0 wt % of Tween80. In view of this, the content of 1.0% emulsion inthis study was used. It also showed that the addition of Tween80 significantly reduced the size of themicrocapsules (Figure 6). When 0.0, 0.5, 1.0, and 2.0% Tween80 was added, the size of microcapsules(ϑo: 3 mL·h−1, ϑe : 5 mL·h−1) were about 610, 470, 420, and 400 μm respectively. The addition ofsurfactant like Tween80 can diminish the interfacial tension of the liquid [34–36], which affected thesynthesis of Ca-alginate from two different ways. One is that water molecules can be fixed on thesurface of the rejuvenator droplets by Tween80 to prevent the aggregation and fusion of the emulsion
176
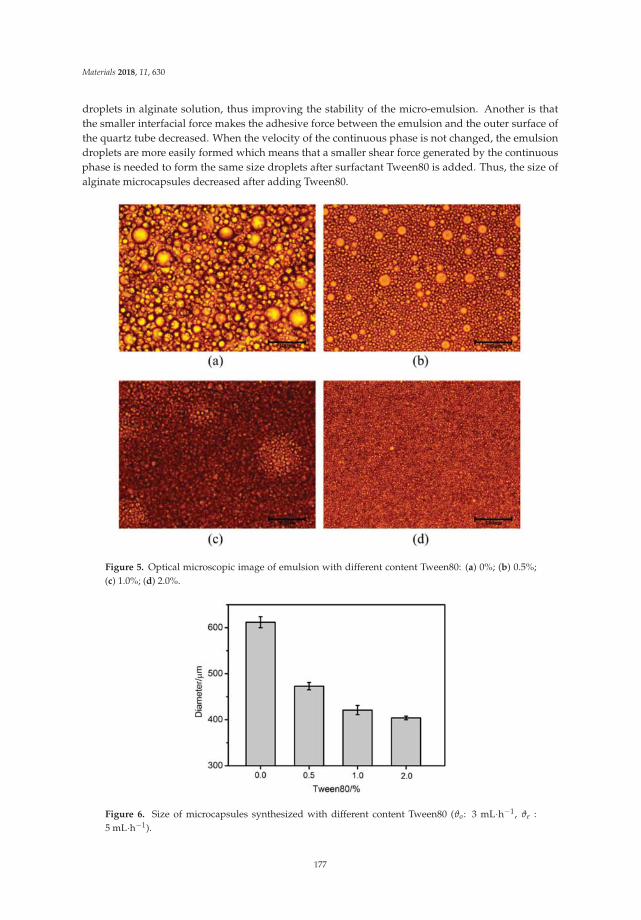
Materials 2018, 11, 630
droplets in alginate solution, thus improving the stability of the micro-emulsion. Another is thatthe smaller interfacial force makes the adhesive force between the emulsion and the outer surface ofthe quartz tube decreased. When the velocity of the continuous phase is not changed, the emulsiondroplets are more easily formed which means that a smaller shear force generated by the continuousphase is needed to form the same size droplets after surfactant Tween80 is added. Thus, the size ofalginate microcapsules decreased after adding Tween80.
Figure 5. Optical microscopic image of emulsion with different content Tween80: (a) 0%; (b) 0.5%;(c) 1.0%; (d) 2.0%.
Figure 6. Size of microcapsules synthesized with different content Tween80 (ϑo: 3 mL·h−1, ϑe :5 mL·h−1).
177
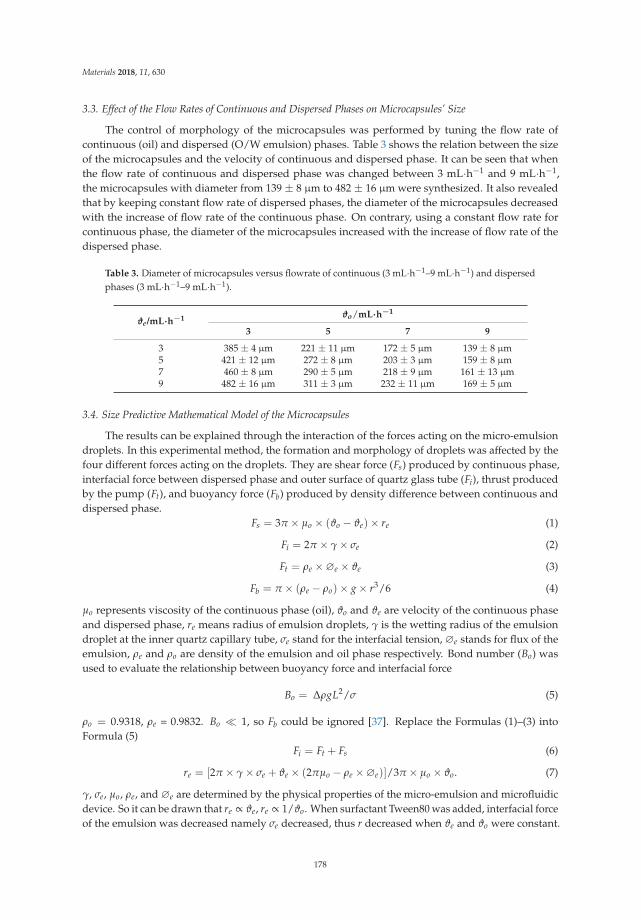
Materials 2018, 11, 630
3.3. Effect of the Flow Rates of Continuous and Dispersed Phases on Microcapsules’ Size
The control of morphology of the microcapsules was performed by tuning the flow rate ofcontinuous (oil) and dispersed (O/W emulsion) phases. Table 3 shows the relation between the sizeof the microcapsules and the velocity of continuous and dispersed phase. It can be seen that whenthe flow rate of continuous and dispersed phase was changed between 3 mL·h−1 and 9 mL·h−1,the microcapsules with diameter from 139 ± 8 μm to 482 ± 16 μm were synthesized. It also revealedthat by keeping constant flow rate of dispersed phases, the diameter of the microcapsules decreasedwith the increase of flow rate of the continuous phase. On contrary, using a constant flow rate forcontinuous phase, the diameter of the microcapsules increased with the increase of flow rate of thedispersed phase.
Table 3. Diameter of microcapsules versus flowrate of continuous (3 mL·h−1–9 mL·h−1) and dispersedphases (3 mL·h−1–9 mL·h−1).
ϑe/mL·h−1 ϑo/mL·h−1
3 5 7 9
3 385 ± 4 μm 221 ± 11 μm 172 ± 5 μm 139 ± 8 μm5 421 ± 12 μm 272 ± 8 μm 203 ± 3 μm 159 ± 8 μm7 460 ± 8 μm 290 ± 5 μm 218 ± 9 μm 161 ± 13 μm9 482 ± 16 μm 311 ± 3 μm 232 ± 11 μm 169 ± 5 μm
3.4. Size Predictive Mathematical Model of the Microcapsules
The results can be explained through the interaction of the forces acting on the micro-emulsiondroplets. In this experimental method, the formation and morphology of droplets was affected by thefour different forces acting on the droplets. They are shear force (Fs) produced by continuous phase,interfacial force between dispersed phase and outer surface of quartz glass tube (Fi), thrust producedby the pump (Ft), and buoyancy force (Fb) produced by density difference between continuous anddispersed phase.
Fs = 3π × μo × (ϑo − ϑe)× re (1)
Fi = 2π × γ × σe (2)
Ft = ρe ×∅e × ϑe (3)
Fb = π × (ρe − ρo)× g × r3/6 (4)
μo represents viscosity of the continuous phase (oil), ϑo and ϑe are velocity of the continuous phaseand dispersed phase, re means radius of emulsion droplets, γ is the wetting radius of the emulsiondroplet at the inner quartz capillary tube, σe stand for the interfacial tension, ∅e stands for flux of theemulsion, ρe and ρo are density of the emulsion and oil phase respectively. Bond number (Bo) wasused to evaluate the relationship between buoyancy force and interfacial force
Bo = ΔρgL2/σ (5)
ρo = 0.9318, ρe = 0.9832. Bo � 1, so Fb could be ignored [37]. Replace the Formulas (1)–(3) intoFormula (5)
Fi = Ft + Fs (6)
re = [2π × γ × σe + ϑe × (2πμo − ρe ×∅e)]/3π × μo × ϑo. (7)
γ, σe, μo, ρe, and ∅e are determined by the physical properties of the micro-emulsion and microfluidicdevice. So it can be drawn that re ∝ ϑe, re ∝ 1/ϑo. When surfactant Tween80 was added, interfacial forceof the emulsion was decreased namely σe decreased, thus r decreased when ϑe and ϑo were constant.
178
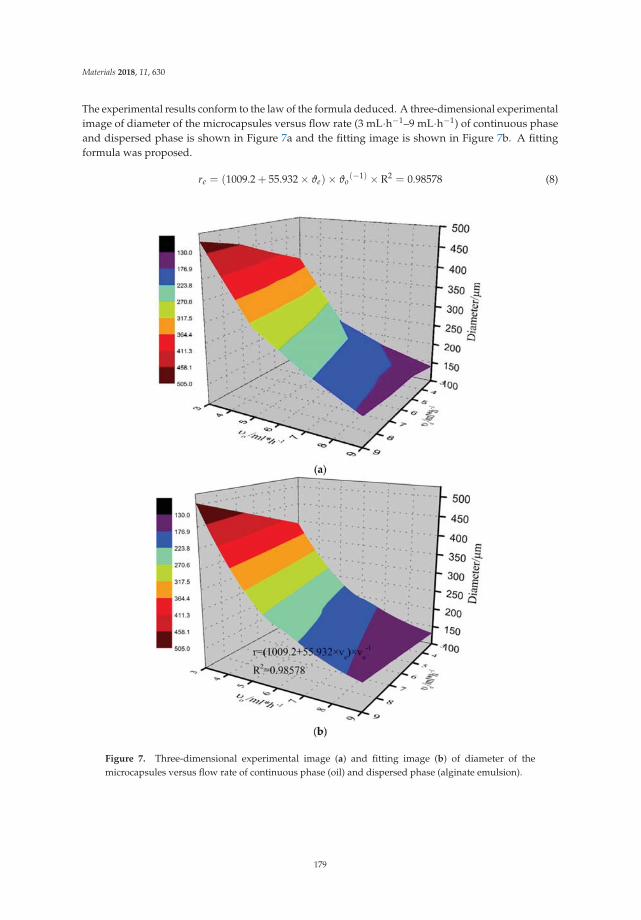
Materials 2018, 11, 630
The experimental results conform to the law of the formula deduced. A three-dimensional experimentalimage of diameter of the microcapsules versus flow rate (3 mL·h−1–9 mL·h−1) of continuous phaseand dispersed phase is shown in Figure 7a and the fitting image is shown in Figure 7b. A fittingformula was proposed.
re = (1009.2 + 55.932 × ϑe)× ϑo(−1) × R2 = 0.98578 (8)
Figure 7. Three-dimensional experimental image (a) and fitting image (b) of diameter of themicrocapsules versus flow rate of continuous phase (oil) and dispersed phase (alginate emulsion).
179
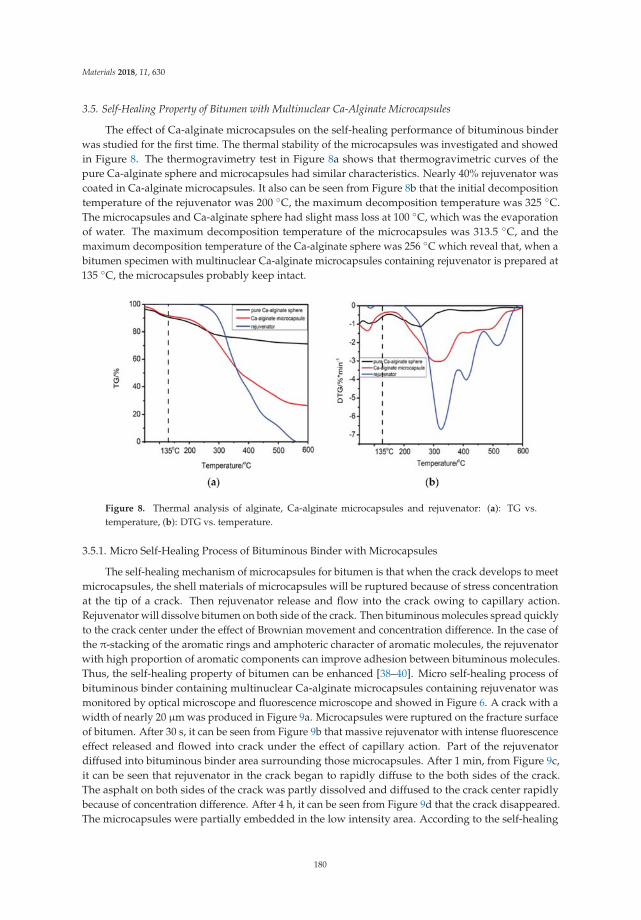
Materials 2018, 11, 630
3.5. Self-Healing Property of Bitumen with Multinuclear Ca-Alginate Microcapsules
The effect of Ca-alginate microcapsules on the self-healing performance of bituminous binderwas studied for the first time. The thermal stability of the microcapsules was investigated and showedin Figure 8. The thermogravimetry test in Figure 8a shows that thermogravimetric curves of thepure Ca-alginate sphere and microcapsules had similar characteristics. Nearly 40% rejuvenator wascoated in Ca-alginate microcapsules. It also can be seen from Figure 8b that the initial decompositiontemperature of the rejuvenator was 200 ◦C, the maximum decomposition temperature was 325 ◦C.The microcapsules and Ca-alginate sphere had slight mass loss at 100 ◦C, which was the evaporationof water. The maximum decomposition temperature of the microcapsules was 313.5 ◦C, and themaximum decomposition temperature of the Ca-alginate sphere was 256 ◦C which reveal that, when abitumen specimen with multinuclear Ca-alginate microcapsules containing rejuvenator is prepared at135 ◦C, the microcapsules probably keep intact.
Figure 8. Thermal analysis of alginate, Ca-alginate microcapsules and rejuvenator: (a): TG vs.temperature, (b): DTG vs. temperature.
3.5.1. Micro Self-Healing Process of Bituminous Binder with Microcapsules
The self-healing mechanism of microcapsules for bitumen is that when the crack develops to meetmicrocapsules, the shell materials of microcapsules will be ruptured because of stress concentrationat the tip of a crack. Then rejuvenator release and flow into the crack owing to capillary action.Rejuvenator will dissolve bitumen on both side of the crack. Then bituminous molecules spread quicklyto the crack center under the effect of Brownian movement and concentration difference. In the case ofthe π-stacking of the aromatic rings and amphoteric character of aromatic molecules, the rejuvenatorwith high proportion of aromatic components can improve adhesion between bituminous molecules.Thus, the self-healing property of bitumen can be enhanced [38–40]. Micro self-healing process ofbituminous binder containing multinuclear Ca-alginate microcapsules containing rejuvenator wasmonitored by optical microscope and fluorescence microscope and showed in Figure 6. A crack with awidth of nearly 20 μm was produced in Figure 9a. Microcapsules were ruptured on the fracture surfaceof bitumen. After 30 s, it can be seen from Figure 9b that massive rejuvenator with intense fluorescenceeffect released and flowed into crack under the effect of capillary action. Part of the rejuvenatordiffused into bituminous binder area surrounding those microcapsules. After 1 min, from Figure 9c,it can be seen that rejuvenator in the crack began to rapidly diffuse to the both sides of the crack.The asphalt on both sides of the crack was partly dissolved and diffused to the crack center rapidlybecause of concentration difference. After 4 h, it can be seen from Figure 9d that the crack disappeared.The microcapsules were partially embedded in the low intensity area. According to the self-healing
180
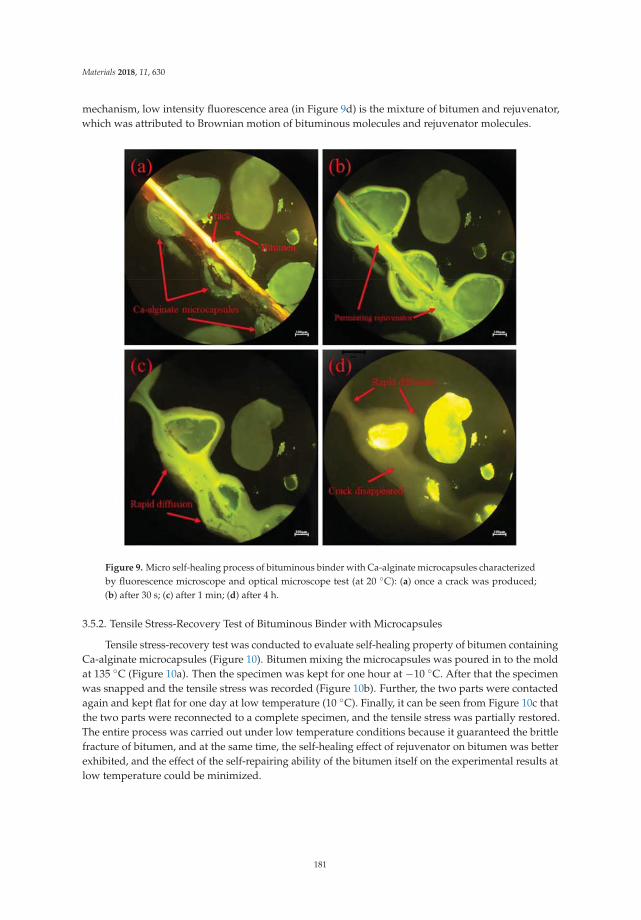
Materials 2018, 11, 630
mechanism, low intensity fluorescence area (in Figure 9d) is the mixture of bitumen and rejuvenator,which was attributed to Brownian motion of bituminous molecules and rejuvenator molecules.
Figure 9. Micro self-healing process of bituminous binder with Ca-alginate microcapsules characterizedby fluorescence microscope and optical microscope test (at 20 ◦C): (a) once a crack was produced;(b) after 30 s; (c) after 1 min; (d) after 4 h.
3.5.2. Tensile Stress-Recovery Test of Bituminous Binder with Microcapsules
Tensile stress-recovery test was conducted to evaluate self-healing property of bitumen containingCa-alginate microcapsules (Figure 10). Bitumen mixing the microcapsules was poured in to the moldat 135 ◦C (Figure 10a). Then the specimen was kept for one hour at −10 ◦C. After that the specimenwas snapped and the tensile stress was recorded (Figure 10b). Further, the two parts were contactedagain and kept flat for one day at low temperature (10 ◦C). Finally, it can be seen from Figure 10c thatthe two parts were reconnected to a complete specimen, and the tensile stress was partially restored.The entire process was carried out under low temperature conditions because it guaranteed the brittlefracture of bitumen, and at the same time, the self-healing effect of rejuvenator on bitumen was betterexhibited, and the effect of the self-repairing ability of the bitumen itself on the experimental results atlow temperature could be minimized.
181
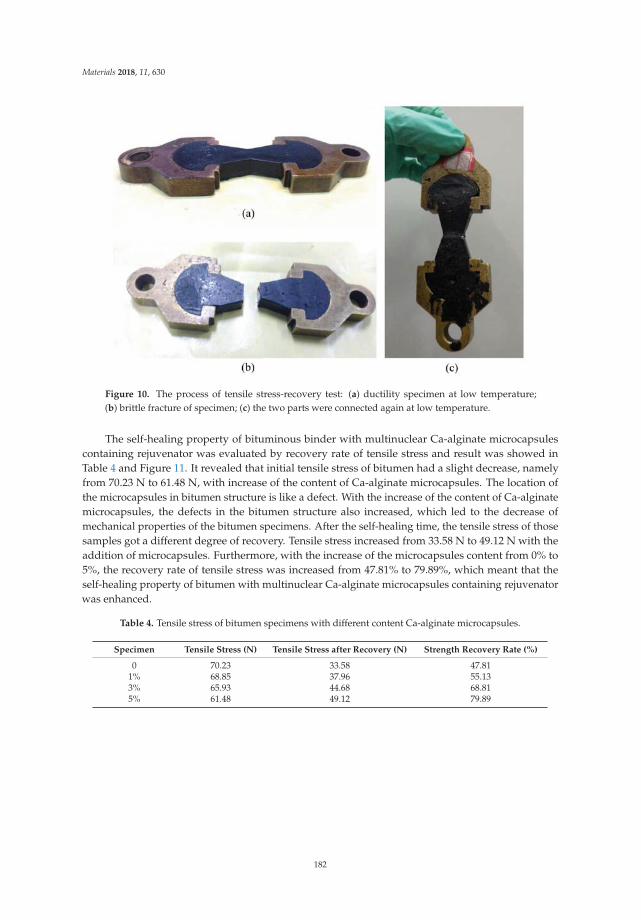
Materials 2018, 11, 630
Figure 10. The process of tensile stress-recovery test: (a) ductility specimen at low temperature;(b) brittle fracture of specimen; (c) the two parts were connected again at low temperature.
The self-healing property of bituminous binder with multinuclear Ca-alginate microcapsulescontaining rejuvenator was evaluated by recovery rate of tensile stress and result was showed inTable 4 and Figure 11. It revealed that initial tensile stress of bitumen had a slight decrease, namelyfrom 70.23 N to 61.48 N, with increase of the content of Ca-alginate microcapsules. The location ofthe microcapsules in bitumen structure is like a defect. With the increase of the content of Ca-alginatemicrocapsules, the defects in the bitumen structure also increased, which led to the decrease ofmechanical properties of the bitumen specimens. After the self-healing time, the tensile stress of thosesamples got a different degree of recovery. Tensile stress increased from 33.58 N to 49.12 N with theaddition of microcapsules. Furthermore, with the increase of the microcapsules content from 0% to5%, the recovery rate of tensile stress was increased from 47.81% to 79.89%, which meant that theself-healing property of bitumen with multinuclear Ca-alginate microcapsules containing rejuvenatorwas enhanced.
Table 4. Tensile stress of bitumen specimens with different content Ca-alginate microcapsules.
Specimen Tensile Stress (N) Tensile Stress after Recovery (N) Strength Recovery Rate (%)
0 70.23 33.58 47.811% 68.85 37.96 55.133% 65.93 44.68 68.815% 61.48 49.12 79.89
182
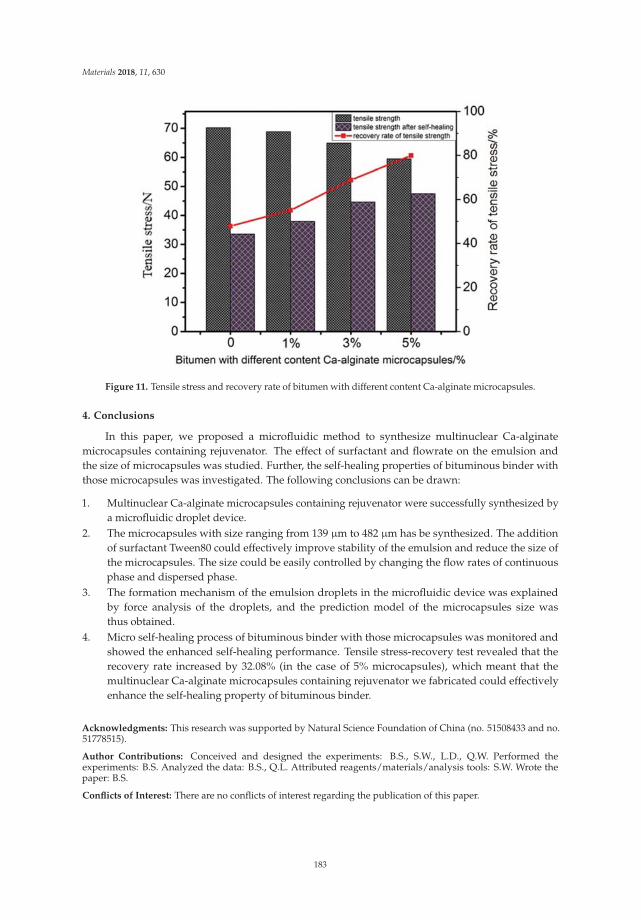
Materials 2018, 11, 630
Figure 11. Tensile stress and recovery rate of bitumen with different content Ca-alginate microcapsules.
4. Conclusions
In this paper, we proposed a microfluidic method to synthesize multinuclear Ca-alginatemicrocapsules containing rejuvenator. The effect of surfactant and flowrate on the emulsion andthe size of microcapsules was studied. Further, the self-healing properties of bituminous binder withthose microcapsules was investigated. The following conclusions can be drawn:
1. Multinuclear Ca-alginate microcapsules containing rejuvenator were successfully synthesized bya microfluidic droplet device.
2. The microcapsules with size ranging from 139 μm to 482 μm has be synthesized. The additionof surfactant Tween80 could effectively improve stability of the emulsion and reduce the size ofthe microcapsules. The size could be easily controlled by changing the flow rates of continuousphase and dispersed phase.
3. The formation mechanism of the emulsion droplets in the microfluidic device was explainedby force analysis of the droplets, and the prediction model of the microcapsules size wasthus obtained.
4. Micro self-healing process of bituminous binder with those microcapsules was monitored andshowed the enhanced self-healing performance. Tensile stress-recovery test revealed that therecovery rate increased by 32.08% (in the case of 5% microcapsules), which meant that themultinuclear Ca-alginate microcapsules containing rejuvenator we fabricated could effectivelyenhance the self-healing property of bituminous binder.
Acknowledgments: This research was supported by Natural Science Foundation of China (no. 51508433 and no.51778515).
Author Contributions: Conceived and designed the experiments: B.S., S.W., L.D., Q.W. Performed theexperiments: B.S. Analyzed the data: B.S., Q.L. Attributed reagents/materials/analysis tools: S.W. Wrote thepaper: B.S.
Conflicts of Interest: There are no conflicts of interest regarding the publication of this paper.
183
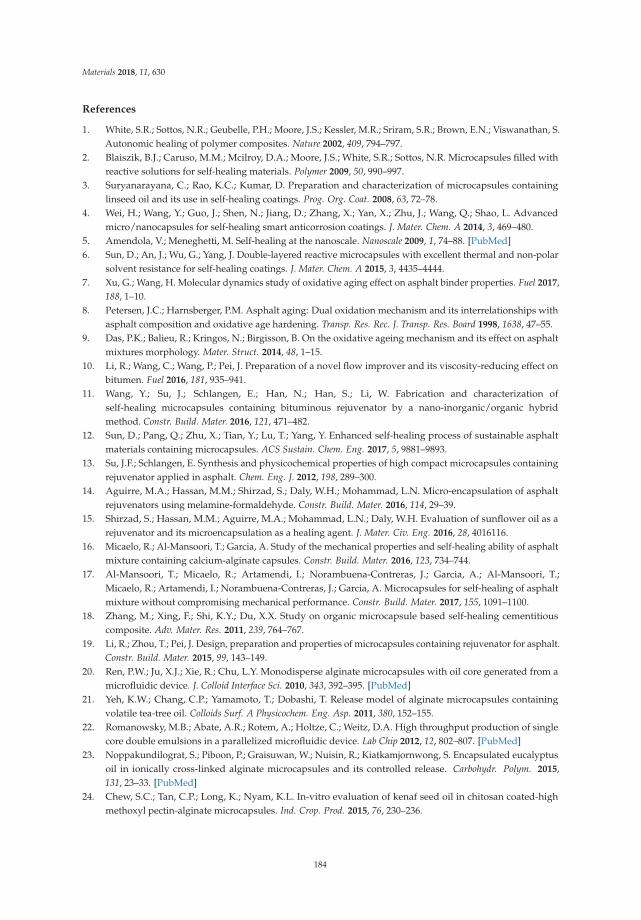
Materials 2018, 11, 630
References
1. White, S.R.; Sottos, N.R.; Geubelle, P.H.; Moore, J.S.; Kessler, M.R.; Sriram, S.R.; Brown, E.N.; Viswanathan, S.Autonomic healing of polymer composites. Nature 2002, 409, 794–797.
2. Blaiszik, B.J.; Caruso, M.M.; Mcilroy, D.A.; Moore, J.S.; White, S.R.; Sottos, N.R. Microcapsules filled withreactive solutions for self-healing materials. Polymer 2009, 50, 990–997.
3. Suryanarayana, C.; Rao, K.C.; Kumar, D. Preparation and characterization of microcapsules containinglinseed oil and its use in self-healing coatings. Prog. Org. Coat. 2008, 63, 72–78.
4. Wei, H.; Wang, Y.; Guo, J.; Shen, N.; Jiang, D.; Zhang, X.; Yan, X.; Zhu, J.; Wang, Q.; Shao, L. Advancedmicro/nanocapsules for self-healing smart anticorrosion coatings. J. Mater. Chem. A 2014, 3, 469–480.
5. Amendola, V.; Meneghetti, M. Self-healing at the nanoscale. Nanoscale 2009, 1, 74–88. [PubMed]6. Sun, D.; An, J.; Wu, G.; Yang, J. Double-layered reactive microcapsules with excellent thermal and non-polar
solvent resistance for self-healing coatings. J. Mater. Chem. A 2015, 3, 4435–4444.7. Xu, G.; Wang, H. Molecular dynamics study of oxidative aging effect on asphalt binder properties. Fuel 2017,
188, 1–10.8. Petersen, J.C.; Harnsberger, P.M. Asphalt aging: Dual oxidation mechanism and its interrelationships with
asphalt composition and oxidative age hardening. Transp. Res. Rec. J. Transp. Res. Board 1998, 1638, 47–55.9. Das, P.K.; Balieu, R.; Kringos, N.; Birgisson, B. On the oxidative ageing mechanism and its effect on asphalt
mixtures morphology. Mater. Struct. 2014, 48, 1–15.10. Li, R.; Wang, C.; Wang, P.; Pei, J. Preparation of a novel flow improver and its viscosity-reducing effect on
bitumen. Fuel 2016, 181, 935–941.11. Wang, Y.; Su, J.; Schlangen, E.; Han, N.; Han, S.; Li, W. Fabrication and characterization of
self-healing microcapsules containing bituminous rejuvenator by a nano-inorganic/organic hybridmethod. Constr. Build. Mater. 2016, 121, 471–482.
12. Sun, D.; Pang, Q.; Zhu, X.; Tian, Y.; Lu, T.; Yang, Y. Enhanced self-healing process of sustainable asphaltmaterials containing microcapsules. ACS Sustain. Chem. Eng. 2017, 5, 9881–9893.
13. Su, J.F.; Schlangen, E. Synthesis and physicochemical properties of high compact microcapsules containingrejuvenator applied in asphalt. Chem. Eng. J. 2012, 198, 289–300.
14. Aguirre, M.A.; Hassan, M.M.; Shirzad, S.; Daly, W.H.; Mohammad, L.N. Micro-encapsulation of asphaltrejuvenators using melamine-formaldehyde. Constr. Build. Mater. 2016, 114, 29–39.
15. Shirzad, S.; Hassan, M.M.; Aguirre, M.A.; Mohammad, L.N.; Daly, W.H. Evaluation of sunflower oil as arejuvenator and its microencapsulation as a healing agent. J. Mater. Civ. Eng. 2016, 28, 4016116.
16. Micaelo, R.; Al-Mansoori, T.; Garcia, A. Study of the mechanical properties and self-healing ability of asphaltmixture containing calcium-alginate capsules. Constr. Build. Mater. 2016, 123, 734–744.
17. Al-Mansoori, T.; Micaelo, R.; Artamendi, I.; Norambuena-Contreras, J.; Garcia, A.; Al-Mansoori, T.;Micaelo, R.; Artamendi, I.; Norambuena-Contreras, J.; Garcia, A. Microcapsules for self-healing of asphaltmixture without compromising mechanical performance. Constr. Build. Mater. 2017, 155, 1091–1100.
18. Zhang, M.; Xing, F.; Shi, K.Y.; Du, X.X. Study on organic microcapsule based self-healing cementitiouscomposite. Adv. Mater. Res. 2011, 239, 764–767.
19. Li, R.; Zhou, T.; Pei, J. Design, preparation and properties of microcapsules containing rejuvenator for asphalt.Constr. Build. Mater. 2015, 99, 143–149.
20. Ren, P.W.; Ju, X.J.; Xie, R.; Chu, L.Y. Monodisperse alginate microcapsules with oil core generated from amicrofluidic device. J. Colloid Interface Sci. 2010, 343, 392–395. [PubMed]
21. Yeh, K.W.; Chang, C.P.; Yamamoto, T.; Dobashi, T. Release model of alginate microcapsules containingvolatile tea-tree oil. Colloids Surf. A Physicochem. Eng. Asp. 2011, 380, 152–155.
22. Romanowsky, M.B.; Abate, A.R.; Rotem, A.; Holtze, C.; Weitz, D.A. High throughput production of singlecore double emulsions in a parallelized microfluidic device. Lab Chip 2012, 12, 802–807. [PubMed]
23. Noppakundilograt, S.; Piboon, P.; Graisuwan, W.; Nuisin, R.; Kiatkamjornwong, S. Encapsulated eucalyptusoil in ionically cross-linked alginate microcapsules and its controlled release. Carbohydr. Polym. 2015,131, 23–33. [PubMed]
24. Chew, S.C.; Tan, C.P.; Long, K.; Nyam, K.L. In-vitro evaluation of kenaf seed oil in chitosan coated-highmethoxyl pectin-alginate microcapsules. Ind. Crop. Prod. 2015, 76, 230–236.
184
Materials 2018, 11, 630
25. Schmit, A.; Courbin, L.; Marquis, M.; Renard, D.; Panizza, P. A pendant drop method for the production ofcalibrated double emulsions and emulsion gels. RSC Adv. 2014, 4, 28504–28510.
26. Marquis, M.; Alix, V.; Capron, I.; Cuenot, S.; Zykwinska, A. Microfluidic encapsulation of pickering oilmicrodroplets into alginate microgels for lipophilic compound delivery. ACS Biomater. Sci. Eng. 2016,2, 535–543.
27. Martins, E.; Renard, D.; Davy, J.; Marquis, M.; Poncelet, D. Oil core microcapsules by inverse gelationtechnique. J. Microencapsul. 2015, 32, 86–95. [PubMed]
28. Martins, E.; Poncelet, D.; Rodrigues, R.C.; Renard, D. Oil encapsulation in core-shell alginate capsules byinverse gelation II: Comparison between dripping techniques using W/O or O/W emulsions. J. Microencapsul.2017, 34, 522–534. [PubMed]
29. Abang, S.; Chan, E.S.; Poncelet, D. Effects of process variables on the encapsulation of oil in ca-alginatecapsules using an inverse gelation technique. J. Microencapsul. 2012, 29, 417–428. [PubMed]
30. Celli, G.B.; Teixeira, A.G.; Duke, T.G.; Brooks, M.S.L. Encapsulationof lycopene from watermelonin calcium-alginate microparticles using an optimised inverse-gelation method by response surfacemethodology. Int. J. Food Sci. Technol. 2016, 51, 1523–1529.
31. Vandenberg, G.W.; De, L.N.J. Evaluation of protein release from chitosan-alginate microcapsules producedusing external or internal gelation. J. Microencapsul. 2008, 18, 433–441.
32. Li, X.; Wu, Z.; He, Y.; Ye, B.C.; Wang, J. Preparation and characterization of monodisperse microcapsules withalginate and bentonite via external gelation technique encapsulating Pseudomonas putida Rs-198. J. Biomater.Sci. Polym. Ed. 2017, 28, 1556–1571. [PubMed]
33. Standard Test Methods of Bitumen and Bituminous Mixtures for Highway Engineering: JTG E20-2011; ChinaHighway & Transportation Standards: Beijing, China, 2011.
34. Mirchi, V.; Saraji, S.; Goual, L.; Piri, M. Dynamic interfacial tension and wettability of shale in the presence ofsurfactants at reservoir conditions. Fuel 2015, 148, 127–138.
35. Nowak, E.; Xie, Z.; Kovalchuk, N.M.; Matar, O.K.; Mjh, S. Bulk advection and interfacial flows in the binarycoalescence of surfactant-laden and surfactant-free drops. Soft Matter 2017, 13, 4616–4628. [PubMed]
36. Herdes, C.; Santiso, E.E.; James, C.; Eastoe, J.; Müller, E.A. Modelling the interfacial behaviour of dilutelight-switching surfactant solutions. J. Colloid Interface Sci. 2015, 445, 16–23. [PubMed]
37. Neeson, M.J.; Chan, D.Y.; Tabor, R.F. Compound pendant drop tensiometry for surface tension measurementat zero Bond number. Langmuir ACS J. Surf. Colloids 2014, 30, 15388–15391.
38. Lee, H.J.; Kim, Y.R. Viscoelastic continuum damage model of asphalt concrete with healing. J. Eng. Mech.1998, 124, 1224–1232.
39. Bonnaure, F.P. Laboratory investigation of the influence of rest periods on the fatigue characteristics ofbituminous mixes. In Proceedings of the Asphalt Paving Technology, Kansas City, MO, USA; 1982. Availableonline: https://trid.trb.org/view/725881 (accessed on 19 April 2018).
40. García, Á.; Schlangen, E.; van de Ven, M.; Sierra-Beltrán, G. Preparation of capsules containing rejuvenatorsfor their use in asphalt concrete. J. Hazard. Mater. 2010, 184, 603–611. [PubMed]
© 2018 by the authors. Licensee MDPI, Basel, Switzerland. This article is an open accessarticle distributed under the terms and conditions of the Creative Commons Attribution(CC BY) license (http://creativecommons.org/licenses/by/4.0/).
185
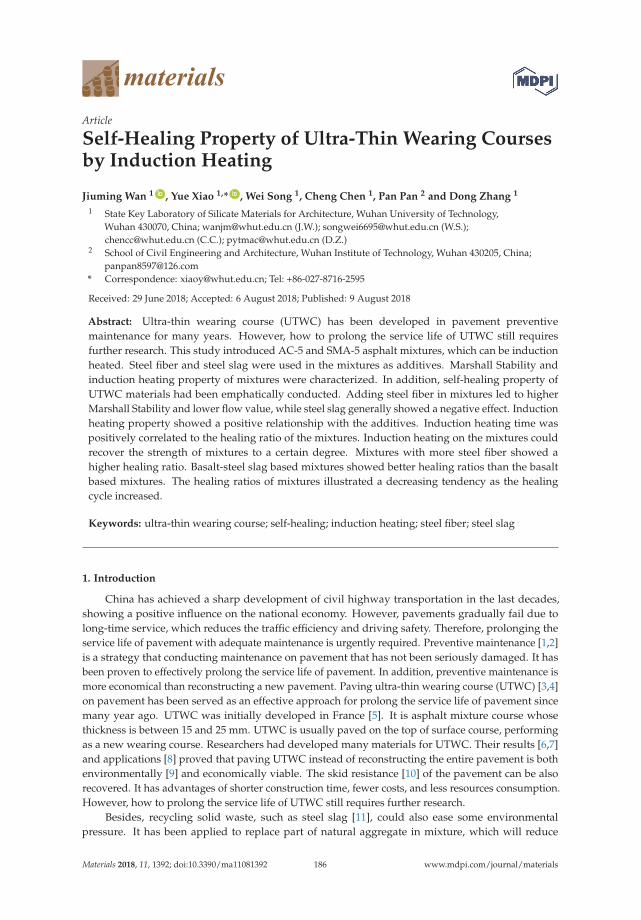
materials
Article
Self-Healing Property of Ultra-Thin Wearing Coursesby Induction Heating
Jiuming Wan 1 ID , Yue Xiao 1,* ID , Wei Song 1, Cheng Chen 1, Pan Pan 2 and Dong Zhang 1
1 State Key Laboratory of Silicate Materials for Architecture, Wuhan University of Technology,Wuhan 430070, China; [email protected] (J.W.); [email protected] (W.S.);[email protected] (C.C.); [email protected] (D.Z.)
2 School of Civil Engineering and Architecture, Wuhan Institute of Technology, Wuhan 430205, China;[email protected]
* Correspondence: [email protected]; Tel: +86-027-8716-2595
Received: 29 June 2018; Accepted: 6 August 2018; Published: 9 August 2018
Abstract: Ultra-thin wearing course (UTWC) has been developed in pavement preventivemaintenance for many years. However, how to prolong the service life of UTWC still requiresfurther research. This study introduced AC-5 and SMA-5 asphalt mixtures, which can be inductionheated. Steel fiber and steel slag were used in the mixtures as additives. Marshall Stability andinduction heating property of mixtures were characterized. In addition, self-healing property ofUTWC materials had been emphatically conducted. Adding steel fiber in mixtures led to higherMarshall Stability and lower flow value, while steel slag generally showed a negative effect. Inductionheating property showed a positive relationship with the additives. Induction heating time waspositively correlated to the healing ratio of the mixtures. Induction heating on the mixtures couldrecover the strength of mixtures to a certain degree. Mixtures with more steel fiber showed ahigher healing ratio. Basalt-steel slag based mixtures showed better healing ratios than the basaltbased mixtures. The healing ratios of mixtures illustrated a decreasing tendency as the healingcycle increased.
Keywords: ultra-thin wearing course; self-healing; induction heating; steel fiber; steel slag
1. Introduction
China has achieved a sharp development of civil highway transportation in the last decades,showing a positive influence on the national economy. However, pavements gradually fail due tolong-time service, which reduces the traffic efficiency and driving safety. Therefore, prolonging theservice life of pavement with adequate maintenance is urgently required. Preventive maintenance [1,2]is a strategy that conducting maintenance on pavement that has not been seriously damaged. It hasbeen proven to effectively prolong the service life of pavement. In addition, preventive maintenance ismore economical than reconstructing a new pavement. Paving ultra-thin wearing course (UTWC) [3,4]on pavement has been served as an effective approach for prolong the service life of pavement sincemany year ago. UTWC was initially developed in France [5]. It is asphalt mixture course whosethickness is between 15 and 25 mm. UTWC is usually paved on the top of surface course, performingas a new wearing course. Researchers had developed many materials for UTWC. Their results [6,7]and applications [8] proved that paving UTWC instead of reconstructing the entire pavement is bothenvironmentally [9] and economically viable. The skid resistance [10] of the pavement can be alsorecovered. It has advantages of shorter construction time, fewer costs, and less resources consumption.However, how to prolong the service life of UTWC still requires further research.
Besides, recycling solid waste, such as steel slag [11], could also ease some environmentalpressure. It has been applied to replace part of natural aggregate in mixture, which will reduce
Materials 2018, 11, 1392; doi:10.3390/ma11081392 www.mdpi.com/journal/materials186
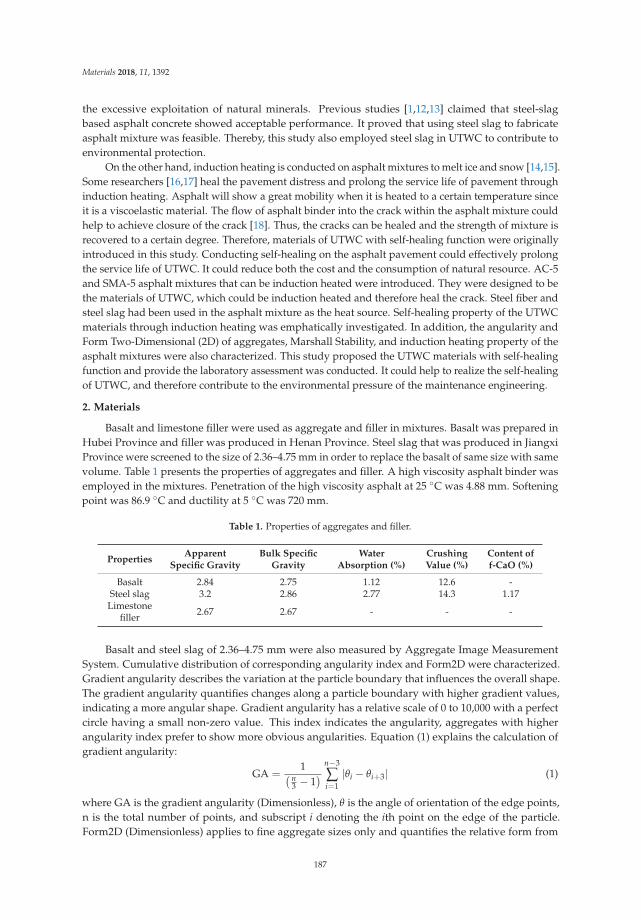
Materials 2018, 11, 1392
the excessive exploitation of natural minerals. Previous studies [1,12,13] claimed that steel-slagbased asphalt concrete showed acceptable performance. It proved that using steel slag to fabricateasphalt mixture was feasible. Thereby, this study also employed steel slag in UTWC to contribute toenvironmental protection.
On the other hand, induction heating is conducted on asphalt mixtures to melt ice and snow [14,15].Some researchers [16,17] heal the pavement distress and prolong the service life of pavement throughinduction heating. Asphalt will show a great mobility when it is heated to a certain temperature sinceit is a viscoelastic material. The flow of asphalt binder into the crack within the asphalt mixture couldhelp to achieve closure of the crack [18]. Thus, the cracks can be healed and the strength of mixture isrecovered to a certain degree. Therefore, materials of UTWC with self-healing function were originallyintroduced in this study. Conducting self-healing on the asphalt pavement could effectively prolongthe service life of UTWC. It could reduce both the cost and the consumption of natural resource. AC-5and SMA-5 asphalt mixtures that can be induction heated were introduced. They were designed to bethe materials of UTWC, which could be induction heated and therefore heal the crack. Steel fiber andsteel slag had been used in the asphalt mixture as the heat source. Self-healing property of the UTWCmaterials through induction heating was emphatically investigated. In addition, the angularity andForm Two-Dimensional (2D) of aggregates, Marshall Stability, and induction heating property of theasphalt mixtures were also characterized. This study proposed the UTWC materials with self-healingfunction and provide the laboratory assessment was conducted. It could help to realize the self-healingof UTWC, and therefore contribute to the environmental pressure of the maintenance engineering.
2. Materials
Basalt and limestone filler were used as aggregate and filler in mixtures. Basalt was prepared inHubei Province and filler was produced in Henan Province. Steel slag that was produced in JiangxiProvince were screened to the size of 2.36–4.75 mm in order to replace the basalt of same size with samevolume. Table 1 presents the properties of aggregates and filler. A high viscosity asphalt binder wasemployed in the mixtures. Penetration of the high viscosity asphalt at 25 ◦C was 4.88 mm. Softeningpoint was 86.9 ◦C and ductility at 5 ◦C was 720 mm.
Table 1. Properties of aggregates and filler.
PropertiesApparent
Specific GravityBulk Specific
GravityWater
Absorption (%)CrushingValue (%)
Content off-CaO (%)
Basalt 2.84 2.75 1.12 12.6 -Steel slag 3.2 2.86 2.77 14.3 1.17Limestone
filler 2.67 2.67 - - -
Basalt and steel slag of 2.36–4.75 mm were also measured by Aggregate Image MeasurementSystem. Cumulative distribution of corresponding angularity index and Form2D were characterized.Gradient angularity describes the variation at the particle boundary that influences the overall shape.The gradient angularity quantifies changes along a particle boundary with higher gradient values,indicating a more angular shape. Gradient angularity has a relative scale of 0 to 10,000 with a perfectcircle having a small non-zero value. This index indicates the angularity, aggregates with higherangularity index prefer to show more obvious angularities. Equation (1) explains the calculation ofgradient angularity:
GA =1( n
3 − 1) n−3
∑i=1
|θi − θi+3| (1)
where GA is the gradient angularity (Dimensionless), θ is the angle of orientation of the edge points,n is the total number of points, and subscript i denoting the ith point on the edge of the particle.Form2D (Dimensionless) applies to fine aggregate sizes only and quantifies the relative form from
187
Materials 2018, 11, 1392
two-dimensional images of aggregate particles. It has a relative scale of 0 to 20. Form2D indicatesthe sphericity of the aggregate. Aggregates of higher Form2D value show more obvious circle shape,and a perfect circular aggregate has a Form2D value of zero. The form index Form2D is expressed byEquation (2).
Form2D =θ=360−Δθ
∑θ=0
[Rθ+Δθ − Rθ
Rθ
](2)
where, Rθ is the radius of the particle at an angle of θ, Δθ is the incremental difference in the angle.Angularity index and Form2D describe particle shape of aggregate. Figure 1 presents the gradientangularity of basalt and steel slag. The data points of steel slag were higher than that of basalt whenthe angularity index is below 3700. Conversely, it showed lower cumulative of particles when theangularity index is over 3700. Figure 2 expresses the Form2D of basalt and steel slag. The cumulativeof particles of steel slag were higher than that of basalt when the value of Form2D is below 10.Tables 2 and 3 express the statistical result of particle number and proportion in different angularityrange and Form2D range, which quantify the data more intuitively. The proportion of steel slag withangularity range of 5400–10,000 and 3750–10,000 were 7.39% and 29.06%, while that of basalt was1.5% and 24%. The proportions of steel slag with high and extreme angularity were higher than basalt.According to Table 3, proportion of steel slag with Form2D range of 0–6.5 and 0–8 were 39.9% and61.6%, while that of basalt were 23% and 55%. It suggested that proportion of steel slag with circularshape and moderate circular shape were higher than basalt. Therefore, steel slag that was used in thisstudy had a more circular shape and higher angularity than basalt.
Figure 1. Gradient angularity of basalt and steel slag.
Figure 2. Form2D of basalt and steel slag.
188
Materials 2018, 11, 1392
Table 2. Particle number and proportion in different angularity range.
Angularity RangeBasalt Steel Slag
Particle Number Proportion Particle Number Proportion
Low (≤2100) 9 4.50% 18 8.87%Moderate (2100–3975) 143 71.50% 126 62.07%
High (3975–5400) 45 22.50% 44 21.67%Extreme (5400–10,000) 3 1.50% 15 7.39%
Table 3. Particle number and proportion in different Form2D range.
Form2D RangeBasalt Steel Slag
Particle Number Proportion Particle Number Proportion
Low (≤6.5) 46 23.0% 81 39.9%Moderate (6.5–8) 64 32.0% 44 21.7%
High (8–10.75) 75 37.5% 62 30.5%Extreme (10.75–20) 15 7.5% 16 7.9%
Steel fiber with length of 4.2–5.0 mm and equivalent diameter of 70–130 μm was used. The densityand the melting point of the steel fiber were 7.85 g/cm3 and 1530 ◦C. It could help to realize theinduction heating function of mixtures. Additionally, the lignin fiber was used as stabilizer in SMA-5mixture, its length was of 4–6 mm and PH value was 7.5 ± 1.0. The oil absorption rate of the ligninfiber was more than five times of the fiber mass, and the mass ratio of lignin fiber-aggregate was 0.3%.
3. Research Program
3.1. Mixture Design
AC-5 asphalt mixture had been designed according to the specification “JTG F40 2004”, whichspecifies the design method and the corresponding standards of asphalt mixture in China. SMA-5asphalt mixture was designed according to AASHTO. Mixtures without steel slag were named asbasalt based mixtures. Steel slag of 2.36–4.75 mm was proposed to replace the same size basalt as thesame volume. Mixtures that contained steel slag were labelled as basalt-steel slag based mixtures.Figures 3 and 4 illustrate the gradations of AC-5 and SMA-5 mixtures. The replacement of steel slagdoes not change the corresponding designed gradations. For all AC-5 mixtures, the binder-aggregatemass ratio was 6.2%. The asphalt binder-aggregate mass ratio of all SMA-5 mixtures was 6.5%.The mixing temperature was 175 ◦C, and the mold temperature was 165 ◦C.
Figure 3. Gradations of AC-5 mixtures.
189
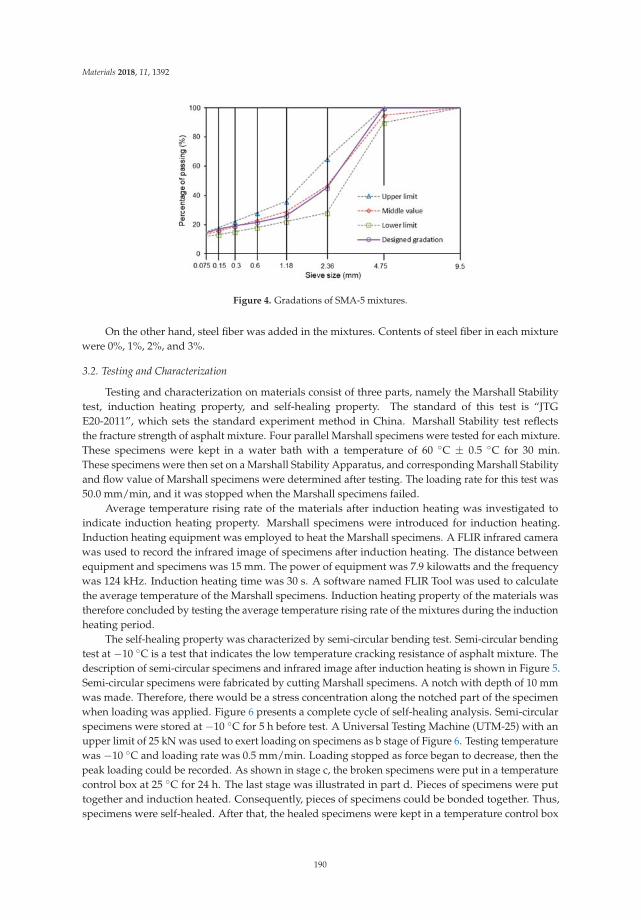
Materials 2018, 11, 1392
Figure 4. Gradations of SMA-5 mixtures.
On the other hand, steel fiber was added in the mixtures. Contents of steel fiber in each mixturewere 0%, 1%, 2%, and 3%.
3.2. Testing and Characterization
Testing and characterization on materials consist of three parts, namely the Marshall Stabilitytest, induction heating property, and self-healing property. The standard of this test is “JTGE20-2011”, which sets the standard experiment method in China. Marshall Stability test reflectsthe fracture strength of asphalt mixture. Four parallel Marshall specimens were tested for each mixture.These specimens were kept in a water bath with a temperature of 60 ◦C ± 0.5 ◦C for 30 min.These specimens were then set on a Marshall Stability Apparatus, and corresponding Marshall Stabilityand flow value of Marshall specimens were determined after testing. The loading rate for this test was50.0 mm/min, and it was stopped when the Marshall specimens failed.
Average temperature rising rate of the materials after induction heating was investigated toindicate induction heating property. Marshall specimens were introduced for induction heating.Induction heating equipment was employed to heat the Marshall specimens. A FLIR infrared camerawas used to record the infrared image of specimens after induction heating. The distance betweenequipment and specimens was 15 mm. The power of equipment was 7.9 kilowatts and the frequencywas 124 kHz. Induction heating time was 30 s. A software named FLIR Tool was used to calculatethe average temperature of the Marshall specimens. Induction heating property of the materials wastherefore concluded by testing the average temperature rising rate of the mixtures during the inductionheating period.
The self-healing property was characterized by semi-circular bending test. Semi-circular bendingtest at −10 ◦C is a test that indicates the low temperature cracking resistance of asphalt mixture. Thedescription of semi-circular specimens and infrared image after induction heating is shown in Figure 5.Semi-circular specimens were fabricated by cutting Marshall specimens. A notch with depth of 10 mmwas made. Therefore, there would be a stress concentration along the notched part of the specimenwhen loading was applied. Figure 6 presents a complete cycle of self-healing analysis. Semi-circularspecimens were stored at −10 ◦C for 5 h before test. A Universal Testing Machine (UTM-25) with anupper limit of 25 kN was used to exert loading on specimens as b stage of Figure 6. Testing temperaturewas −10 ◦C and loading rate was 0.5 mm/min. Loading stopped as force began to decrease, then thepeak loading could be recorded. As shown in stage c, the broken specimens were put in a temperaturecontrol box at 25 ◦C for 24 h. The last stage was illustrated in part d. Pieces of specimens were puttogether and induction heated. Consequently, pieces of specimens could be bonded together. Thus,specimens were self-healed. After that, the healed specimens were kept in a temperature control box
190
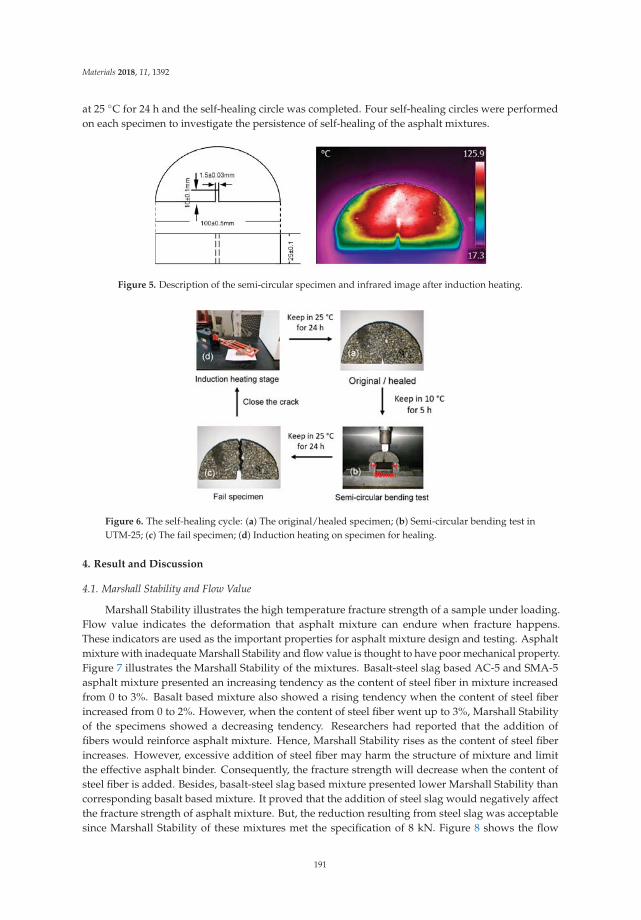
Materials 2018, 11, 1392
at 25 ◦C for 24 h and the self-healing circle was completed. Four self-healing circles were performedon each specimen to investigate the persistence of self-healing of the asphalt mixtures.
Figure 5. Description of the semi-circular specimen and infrared image after induction heating.
Figure 6. The self-healing cycle: (a) The original/healed specimen; (b) Semi-circular bending test inUTM-25; (c) The fail specimen; (d) Induction heating on specimen for healing.
4. Result and Discussion
4.1. Marshall Stability and Flow Value
Marshall Stability illustrates the high temperature fracture strength of a sample under loading.Flow value indicates the deformation that asphalt mixture can endure when fracture happens.These indicators are used as the important properties for asphalt mixture design and testing. Asphaltmixture with inadequate Marshall Stability and flow value is thought to have poor mechanical property.Figure 7 illustrates the Marshall Stability of the mixtures. Basalt-steel slag based AC-5 and SMA-5asphalt mixture presented an increasing tendency as the content of steel fiber in mixture increasedfrom 0 to 3%. Basalt based mixture also showed a rising tendency when the content of steel fiberincreased from 0 to 2%. However, when the content of steel fiber went up to 3%, Marshall Stabilityof the specimens showed a decreasing tendency. Researchers had reported that the addition offibers would reinforce asphalt mixture. Hence, Marshall Stability rises as the content of steel fiberincreases. However, excessive addition of steel fiber may harm the structure of mixture and limitthe effective asphalt binder. Consequently, the fracture strength will decrease when the content ofsteel fiber is added. Besides, basalt-steel slag based mixture presented lower Marshall Stability thancorresponding basalt based mixture. It proved that the addition of steel slag would negatively affectthe fracture strength of asphalt mixture. But, the reduction resulting from steel slag was acceptablesince Marshall Stability of these mixtures met the specification of 8 kN. Figure 8 shows the flow
191
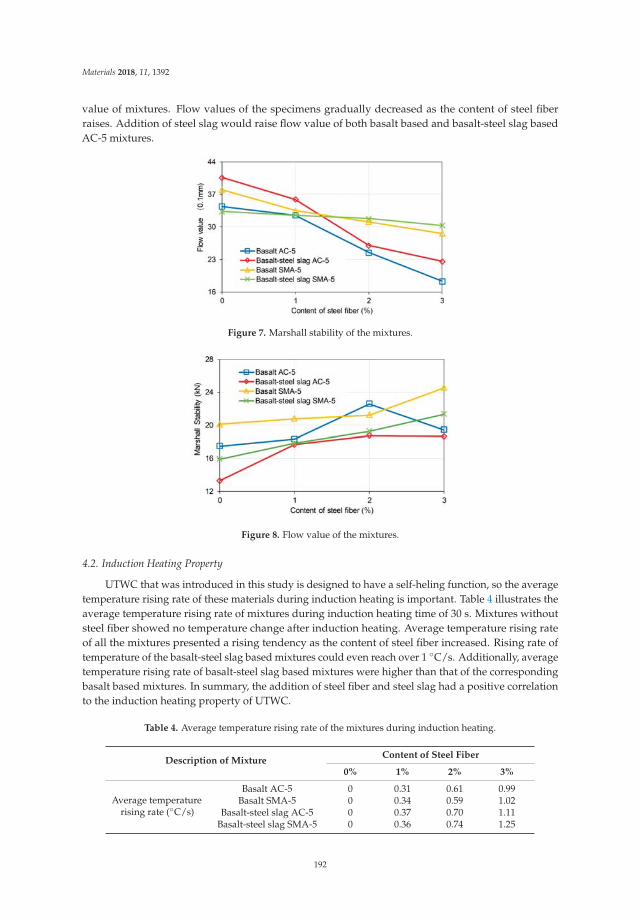
Materials 2018, 11, 1392
value of mixtures. Flow values of the specimens gradually decreased as the content of steel fiberraises. Addition of steel slag would raise flow value of both basalt based and basalt-steel slag basedAC-5 mixtures.
Figure 7. Marshall stability of the mixtures.
Figure 8. Flow value of the mixtures.
4.2. Induction Heating Property
UTWC that was introduced in this study is designed to have a self-heling function, so the averagetemperature rising rate of these materials during induction heating is important. Table 4 illustrates theaverage temperature rising rate of mixtures during induction heating time of 30 s. Mixtures withoutsteel fiber showed no temperature change after induction heating. Average temperature rising rateof all the mixtures presented a rising tendency as the content of steel fiber increased. Rising rate oftemperature of the basalt-steel slag based mixtures could even reach over 1 ◦C/s. Additionally, averagetemperature rising rate of basalt-steel slag based mixtures were higher than that of the correspondingbasalt based mixtures. In summary, the addition of steel fiber and steel slag had a positive correlationto the induction heating property of UTWC.
Table 4. Average temperature rising rate of the mixtures during induction heating.
Description of MixtureContent of Steel Fiber
0% 1% 2% 3%
Average temperaturerising rate (◦C/s)
Basalt AC-5 0 0.31 0.61 0.99Basalt SMA-5 0 0.34 0.59 1.02
Basalt-steel slag AC-5 0 0.37 0.70 1.11Basalt-steel slag SMA-5 0 0.36 0.74 1.25
192
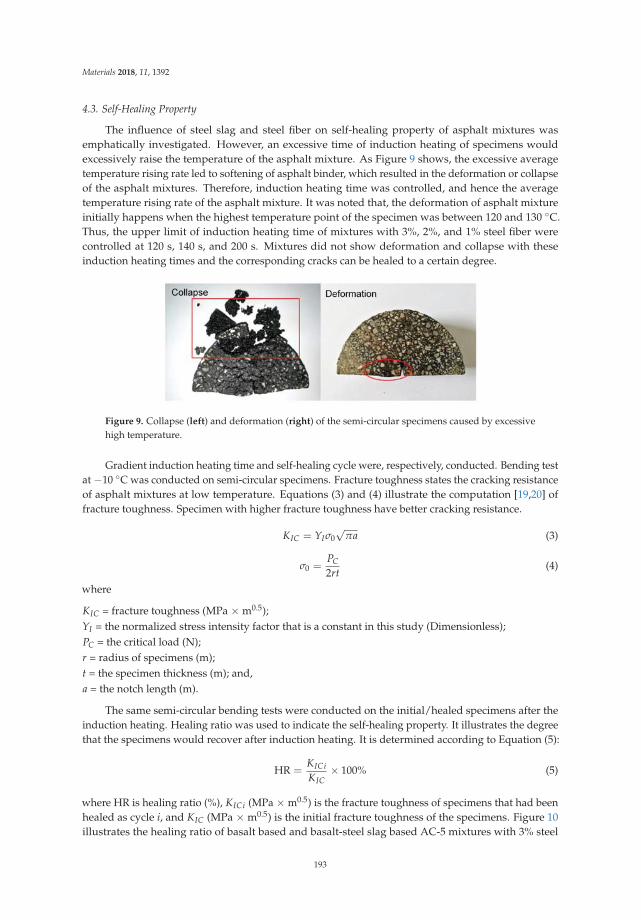
Materials 2018, 11, 1392
4.3. Self-Healing Property
The influence of steel slag and steel fiber on self-healing property of asphalt mixtures wasemphatically investigated. However, an excessive time of induction heating of specimens wouldexcessively raise the temperature of the asphalt mixture. As Figure 9 shows, the excessive averagetemperature rising rate led to softening of asphalt binder, which resulted in the deformation or collapseof the asphalt mixtures. Therefore, induction heating time was controlled, and hence the averagetemperature rising rate of the asphalt mixture. It was noted that, the deformation of asphalt mixtureinitially happens when the highest temperature point of the specimen was between 120 and 130 ◦C.Thus, the upper limit of induction heating time of mixtures with 3%, 2%, and 1% steel fiber werecontrolled at 120 s, 140 s, and 200 s. Mixtures did not show deformation and collapse with theseinduction heating times and the corresponding cracks can be healed to a certain degree.
Figure 9. Collapse (left) and deformation (right) of the semi-circular specimens caused by excessivehigh temperature.
Gradient induction heating time and self-healing cycle were, respectively, conducted. Bending testat −10 ◦C was conducted on semi-circular specimens. Fracture toughness states the cracking resistanceof asphalt mixtures at low temperature. Equations (3) and (4) illustrate the computation [19,20] offracture toughness. Specimen with higher fracture toughness have better cracking resistance.
KIC = YIσ0√
πa (3)
σ0 =PC2rt
(4)
where
KIC = fracture toughness (MPa × m0.5);YI = the normalized stress intensity factor that is a constant in this study (Dimensionless);PC = the critical load (N);r = radius of specimens (m);t = the specimen thickness (m); and,a = the notch length (m).
The same semi-circular bending tests were conducted on the initial/healed specimens after theinduction heating. Healing ratio was used to indicate the self-healing property. It illustrates the degreethat the specimens would recover after induction heating. It is determined according to Equation (5):
HR =KICiKIC
× 100% (5)
where HR is healing ratio (%), KICi (MPa × m0.5) is the fracture toughness of specimens that had beenhealed as cycle i, and KIC (MPa × m0.5) is the initial fracture toughness of the specimens. Figure 10illustrates the healing ratio of basalt based and basalt-steel slag based AC-5 mixtures with 3% steel
193
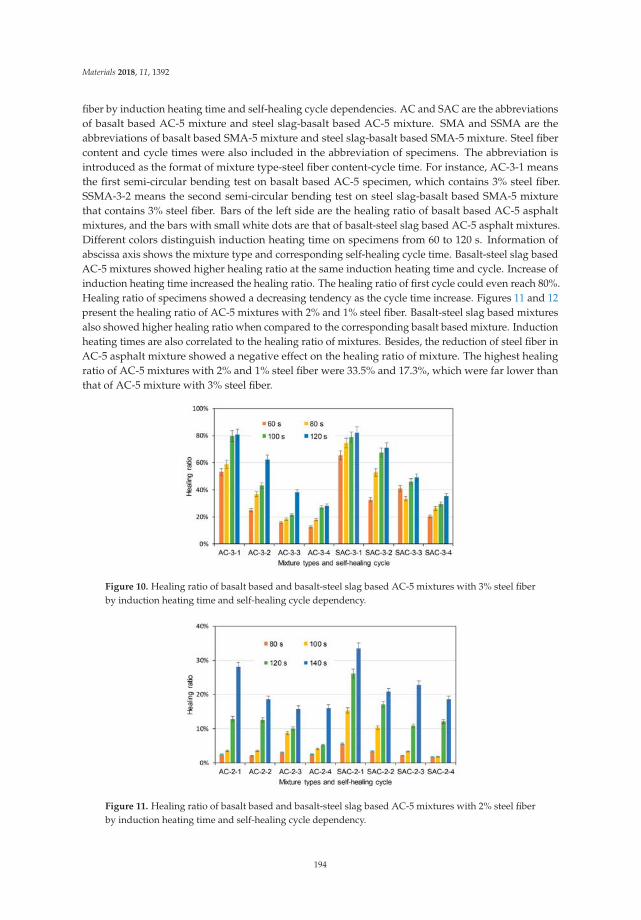
Materials 2018, 11, 1392
fiber by induction heating time and self-healing cycle dependencies. AC and SAC are the abbreviationsof basalt based AC-5 mixture and steel slag-basalt based AC-5 mixture. SMA and SSMA are theabbreviations of basalt based SMA-5 mixture and steel slag-basalt based SMA-5 mixture. Steel fibercontent and cycle times were also included in the abbreviation of specimens. The abbreviation isintroduced as the format of mixture type-steel fiber content-cycle time. For instance, AC-3-1 meansthe first semi-circular bending test on basalt based AC-5 specimen, which contains 3% steel fiber.SSMA-3-2 means the second semi-circular bending test on steel slag-basalt based SMA-5 mixturethat contains 3% steel fiber. Bars of the left side are the healing ratio of basalt based AC-5 asphaltmixtures, and the bars with small white dots are that of basalt-steel slag based AC-5 asphalt mixtures.Different colors distinguish induction heating time on specimens from 60 to 120 s. Information ofabscissa axis shows the mixture type and corresponding self-healing cycle time. Basalt-steel slag basedAC-5 mixtures showed higher healing ratio at the same induction heating time and cycle. Increase ofinduction heating time increased the healing ratio. The healing ratio of first cycle could even reach 80%.Healing ratio of specimens showed a decreasing tendency as the cycle time increase. Figures 11 and 12present the healing ratio of AC-5 mixtures with 2% and 1% steel fiber. Basalt-steel slag based mixturesalso showed higher healing ratio when compared to the corresponding basalt based mixture. Inductionheating times are also correlated to the healing ratio of mixtures. Besides, the reduction of steel fiber inAC-5 asphalt mixture showed a negative effect on the healing ratio of mixture. The highest healingratio of AC-5 mixtures with 2% and 1% steel fiber were 33.5% and 17.3%, which were far lower thanthat of AC-5 mixture with 3% steel fiber.
Figure 10. Healing ratio of basalt based and basalt-steel slag based AC-5 mixtures with 3% steel fiberby induction heating time and self-healing cycle dependency.
Figure 11. Healing ratio of basalt based and basalt-steel slag based AC-5 mixtures with 2% steel fiberby induction heating time and self-healing cycle dependency.
194
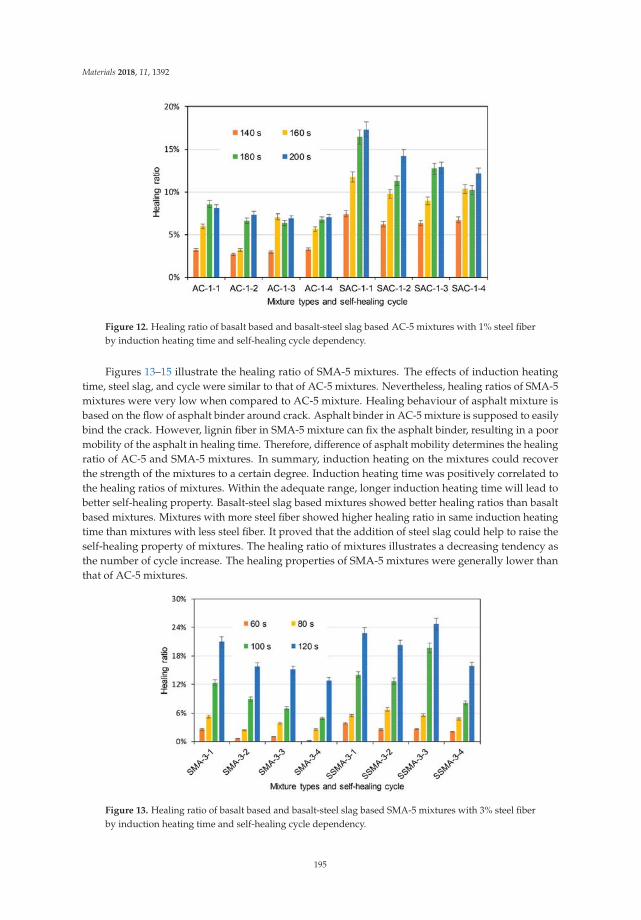
Materials 2018, 11, 1392
Figure 12. Healing ratio of basalt based and basalt-steel slag based AC-5 mixtures with 1% steel fiberby induction heating time and self-healing cycle dependency.
Figures 13–15 illustrate the healing ratio of SMA-5 mixtures. The effects of induction heatingtime, steel slag, and cycle were similar to that of AC-5 mixtures. Nevertheless, healing ratios of SMA-5mixtures were very low when compared to AC-5 mixture. Healing behaviour of asphalt mixture isbased on the flow of asphalt binder around crack. Asphalt binder in AC-5 mixture is supposed to easilybind the crack. However, lignin fiber in SMA-5 mixture can fix the asphalt binder, resulting in a poormobility of the asphalt in healing time. Therefore, difference of asphalt mobility determines the healingratio of AC-5 and SMA-5 mixtures. In summary, induction heating on the mixtures could recoverthe strength of the mixtures to a certain degree. Induction heating time was positively correlated tothe healing ratios of mixtures. Within the adequate range, longer induction heating time will lead tobetter self-healing property. Basalt-steel slag based mixtures showed better healing ratios than basaltbased mixtures. Mixtures with more steel fiber showed higher healing ratio in same induction heatingtime than mixtures with less steel fiber. It proved that the addition of steel slag could help to raise theself-healing property of mixtures. The healing ratio of mixtures illustrates a decreasing tendency asthe number of cycle increase. The healing properties of SMA-5 mixtures were generally lower thanthat of AC-5 mixtures.
Figure 13. Healing ratio of basalt based and basalt-steel slag based SMA-5 mixtures with 3% steel fiberby induction heating time and self-healing cycle dependency.
195
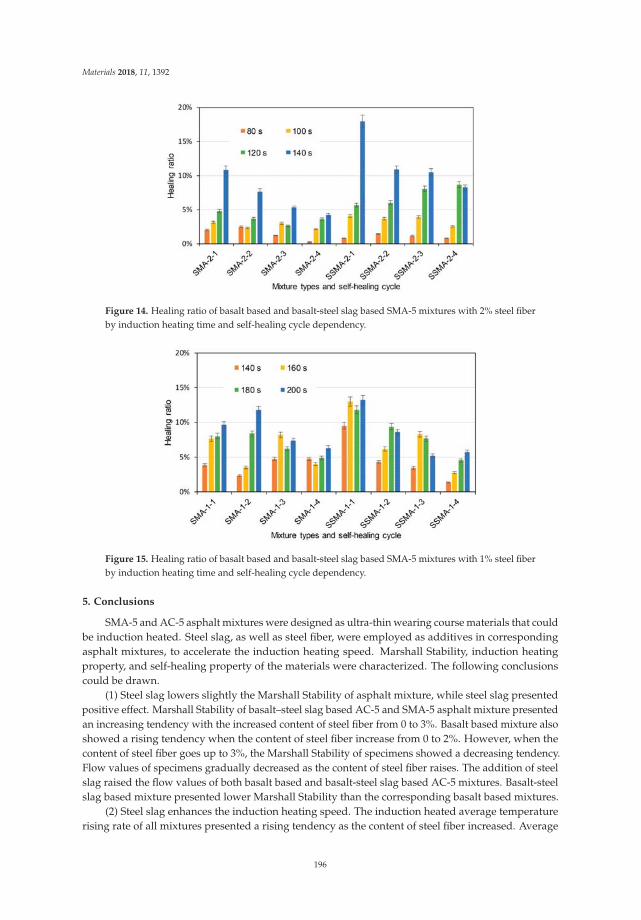
Materials 2018, 11, 1392
Figure 14. Healing ratio of basalt based and basalt-steel slag based SMA-5 mixtures with 2% steel fiberby induction heating time and self-healing cycle dependency.
Figure 15. Healing ratio of basalt based and basalt-steel slag based SMA-5 mixtures with 1% steel fiberby induction heating time and self-healing cycle dependency.
5. Conclusions
SMA-5 and AC-5 asphalt mixtures were designed as ultra-thin wearing course materials that couldbe induction heated. Steel slag, as well as steel fiber, were employed as additives in correspondingasphalt mixtures, to accelerate the induction heating speed. Marshall Stability, induction heatingproperty, and self-healing property of the materials were characterized. The following conclusionscould be drawn.
(1) Steel slag lowers slightly the Marshall Stability of asphalt mixture, while steel slag presentedpositive effect. Marshall Stability of basalt–steel slag based AC-5 and SMA-5 asphalt mixture presentedan increasing tendency with the increased content of steel fiber from 0 to 3%. Basalt based mixture alsoshowed a rising tendency when the content of steel fiber increase from 0 to 2%. However, when thecontent of steel fiber goes up to 3%, the Marshall Stability of specimens showed a decreasing tendency.Flow values of specimens gradually decreased as the content of steel fiber raises. The addition of steelslag raised the flow values of both basalt based and basalt-steel slag based AC-5 mixtures. Basalt-steelslag based mixture presented lower Marshall Stability than the corresponding basalt based mixtures.
(2) Steel slag enhances the induction heating speed. The induction heated average temperaturerising rate of all mixtures presented a rising tendency as the content of steel fiber increased. Average
196
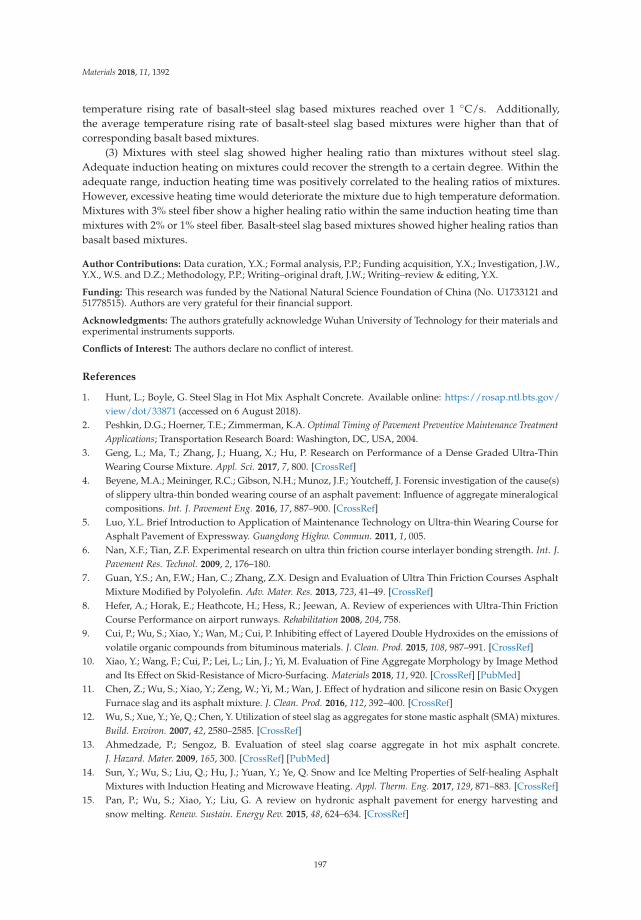
Materials 2018, 11, 1392
temperature rising rate of basalt-steel slag based mixtures reached over 1 ◦C/s. Additionally,the average temperature rising rate of basalt-steel slag based mixtures were higher than that ofcorresponding basalt based mixtures.
(3) Mixtures with steel slag showed higher healing ratio than mixtures without steel slag.Adequate induction heating on mixtures could recover the strength to a certain degree. Within theadequate range, induction heating time was positively correlated to the healing ratios of mixtures.However, excessive heating time would deteriorate the mixture due to high temperature deformation.Mixtures with 3% steel fiber show a higher healing ratio within the same induction heating time thanmixtures with 2% or 1% steel fiber. Basalt-steel slag based mixtures showed higher healing ratios thanbasalt based mixtures.
Author Contributions: Data curation, Y.X.; Formal analysis, P.P.; Funding acquisition, Y.X.; Investigation, J.W.,Y.X., W.S. and D.Z.; Methodology, P.P.; Writing–original draft, J.W.; Writing–review & editing, Y.X.
Funding: This research was funded by the National Natural Science Foundation of China (No. U1733121 and51778515). Authors are very grateful for their financial support.
Acknowledgments: The authors gratefully acknowledge Wuhan University of Technology for their materials andexperimental instruments supports.
Conflicts of Interest: The authors declare no conflict of interest.
References
1. Hunt, L.; Boyle, G. Steel Slag in Hot Mix Asphalt Concrete. Available online: https://rosap.ntl.bts.gov/view/dot/33871 (accessed on 6 August 2018).
2. Peshkin, D.G.; Hoerner, T.E.; Zimmerman, K.A. Optimal Timing of Pavement Preventive Maintenance TreatmentApplications; Transportation Research Board: Washington, DC, USA, 2004.
3. Geng, L.; Ma, T.; Zhang, J.; Huang, X.; Hu, P. Research on Performance of a Dense Graded Ultra-ThinWearing Course Mixture. Appl. Sci. 2017, 7, 800. [CrossRef]
4. Beyene, M.A.; Meininger, R.C.; Gibson, N.H.; Munoz, J.F.; Youtcheff, J. Forensic investigation of the cause(s)of slippery ultra-thin bonded wearing course of an asphalt pavement: Influence of aggregate mineralogicalcompositions. Int. J. Pavement Eng. 2016, 17, 887–900. [CrossRef]
5. Luo, Y.L. Brief Introduction to Application of Maintenance Technology on Ultra-thin Wearing Course forAsphalt Pavement of Expressway. Guangdong Highw. Commun. 2011, 1, 005.
6. Nan, X.F.; Tian, Z.F. Experimental research on ultra thin friction course interlayer bonding strength. Int. J.Pavement Res. Technol. 2009, 2, 176–180.
7. Guan, Y.S.; An, F.W.; Han, C.; Zhang, Z.X. Design and Evaluation of Ultra Thin Friction Courses AsphaltMixture Modified by Polyolefin. Adv. Mater. Res. 2013, 723, 41–49. [CrossRef]
8. Hefer, A.; Horak, E.; Heathcote, H.; Hess, R.; Jeewan, A. Review of experiences with Ultra-Thin FrictionCourse Performance on airport runways. Rehabilitation 2008, 204, 758.
9. Cui, P.; Wu, S.; Xiao, Y.; Wan, M.; Cui, P. Inhibiting effect of Layered Double Hydroxides on the emissions ofvolatile organic compounds from bituminous materials. J. Clean. Prod. 2015, 108, 987–991. [CrossRef]
10. Xiao, Y.; Wang, F.; Cui, P.; Lei, L.; Lin, J.; Yi, M. Evaluation of Fine Aggregate Morphology by Image Methodand Its Effect on Skid-Resistance of Micro-Surfacing. Materials 2018, 11, 920. [CrossRef] [PubMed]
11. Chen, Z.; Wu, S.; Xiao, Y.; Zeng, W.; Yi, M.; Wan, J. Effect of hydration and silicone resin on Basic OxygenFurnace slag and its asphalt mixture. J. Clean. Prod. 2016, 112, 392–400. [CrossRef]
12. Wu, S.; Xue, Y.; Ye, Q.; Chen, Y. Utilization of steel slag as aggregates for stone mastic asphalt (SMA) mixtures.Build. Environ. 2007, 42, 2580–2585. [CrossRef]
13. Ahmedzade, P.; Sengoz, B. Evaluation of steel slag coarse aggregate in hot mix asphalt concrete.J. Hazard. Mater. 2009, 165, 300. [CrossRef] [PubMed]
14. Sun, Y.; Wu, S.; Liu, Q.; Hu, J.; Yuan, Y.; Ye, Q. Snow and Ice Melting Properties of Self-healing AsphaltMixtures with Induction Heating and Microwave Heating. Appl. Therm. Eng. 2017, 129, 871–883. [CrossRef]
15. Pan, P.; Wu, S.; Xiao, Y.; Liu, G. A review on hydronic asphalt pavement for energy harvesting andsnow melting. Renew. Sustain. Energy Rev. 2015, 48, 624–634. [CrossRef]
197
Materials 2018, 11, 1392
16. Gómez-Meijide, B.; Ajam, H.; Lastra-González, P.; Garcia, A. Effect of air voids content on asphalt self-healingvia induction and infrared heating. Constr. Build. Mater. 2016, 126, 957–966. [CrossRef]
17. Menozzi, A.; Garcia, A.; Partl, M.N.; Tebaldi, G.; Schuetz, P. Induction healing of fatigue damage in asphalttest samples. Constr. Build. Mater. 2015, 74, 162–168. [CrossRef]
18. Liu, Q.; Wu, S.; Schlangen, E. Induction heating of asphalt mastic for crack control. Constr. Build. Mater. 2013,41, 345–351. [CrossRef]
19. Lim, I.L.; Johnston, I.W.; Choi, S.K. Stress intensity factors for semi-circular specimens underthree-point bending. Eng. Fract. Mech. 1993, 44, 363–382. [CrossRef]
20. Li, X.; Marasteanu, M. Evaluation of the low temperature fracture resistance of asphalt mixtures using thesemi circular bend test. J. Assoc. Asphalt Paving Technol. 2004, 73, 401–426.
© 2018 by the authors. Licensee MDPI, Basel, Switzerland. This article is an open accessarticle distributed under the terms and conditions of the Creative Commons Attribution(CC BY) license (http://creativecommons.org/licenses/by/4.0/).
198
materials
Article
Effect of Healing Agents on Crack Healing of Asphaltand Asphalt Mortar
Changluan Pan 1, Ping Tang 1, Martin Riara 1,2, Liantong Mo 1,*, Mingliang Li 3 and Meng Guo 4
1 State Key Lab of Silicate Materials for Architectures, Wuhan University of Technology, Wuhan 430070, China;[email protected] (C.P.); [email protected] (P.T.); [email protected] (M.R.)
2 Department of Physics and Electronics, South Eastern Kenya University, 170-90200 Kitui, Kenya3 Research Institute of Highway Ministry of Transport, Beijing 100088, China; [email protected] College of Architecture and Civil Engineering, Beijing University of Technology, Beijing 100124, China;
[email protected]* Correspondence: [email protected]; Tel.: +86-27-8729-2641
Received: 19 June 2018; Accepted: 2 August 2018; Published: 7 August 2018
Abstract: This study investigated the effect of seven healing agents on crack healing ability oflong-term aged asphalt and its mortar. Different healing agents including sunflower oil, aromatic oil,bitumen emulsion, and maltene-based emulsions were used. The crack healing of asphalt made useof two asphalt disk samples and healing was evaluated using direct tensile tests. For asphalt mortar,notched semi-circular samples were used. Test results indicated that the crack healing of asphalt andits mortar depended strongly on the type of healing agent. In general, asphalt healed faster than itsmortar. Asphalt healing could be well improved by using oil agents, while asphalt mortar could bewell healed with maltene-based emulsions. The crack healing of asphalt mortar developed rapidlyfollowed by a steady state of increase. Initial crack healing using healing agents could be contributedby the diffusion and softening effects, which resulted in low strength recovery. Long term healingcould lead to the bonding reconstitution in the cracks, which were decisive for the final strength gain.The promising healing agent should be able to achieve maximum strength recovery to resist crackingas well as a sufficient re-healing ability to deal with crack opening and closing.
Keywords: asphalt; asphalt mortar; healing agents; crack healing; healing model
1. Introduction
Asphalt mixture usually consists of coarse aggregate, fine sand, filler, and bitumen. Asphalt pavementspaved with hot asphalt mixture are safe, economic, and durable. Their design life is about 16 years forhighways and freeways in China [1]. During the long period of service life, fatigue cracks, thermal cracks,and reflective cracks occur in asphalt pavements due to traffic loads and environmental conditions [2–4].Cracks give easy access to water and moisture permeation in asphalt concrete, as well as pavement structure.As a result, water-induced damage could happen under the dynamic water pressure and pumping effect ofrepeated wheel loadings [5]. The premature distresses including stripping bleeding and pothole significantlyaffects the driving safety and comfort, as well as the service life of asphalt pavement. It is, thus, necessary tofill and seal the cracks in due course to prevent progressive water damage.
Bituminous materials have self-healing property, which is helpful for crack healing to recoverstiffness, extend fatigue life and regain strength [6–9]. It was reported that induction heatingand embedding microcapsules containing rejuvenator agents could promote crack healing [10–17].Magnetic induction heating and microwave heating technology could heat bituminous materials andheal cracks [18–23]. Asphalt mixtures containing microcapsules were found to promote crack healingby release the rejuvenator agents into the cracks [24–27]. These technologies are effective in healing
Materials 2018, 11, 1373; doi:10.3390/ma11081373 www.mdpi.com/journal/materials199
Materials 2018, 11, 1373
micro-cracks, while for macro-cracks, additional materials are needed to fill in the gap and promotecrack healing [28,29].
Asphalt mortar is a composite material consisting of fine aggregates, fillers, and bitumen. It isan important binding material in asphalt concrete to hold coarse aggregates together and form theskeleton for loading support. Since asphalt mortar is rich of bitumen, it was found to significantlyaffect the performance of recycled asphalt mixtures [30]. Asphalt, asphalt mortar, and asphalt mixturesall have an important role on the crack resistance and healing of asphalt pavements. Some studiesindicated that the self-healing properties of bituminous materials reduced at the direction of scalefrom bitumen, asphalt mastic, asphalt mortars, and asphalt mixtures. The addition of filler, fine sand,and coarse aggregates could significantly decrease the self-healing ability of bituminous materials [6–9].It was found that the healing strongly depends on the crack size. Cracks at the meso scale and macroscale might hardly heal completely. It becomes necessary to introduce heat or healing agents topromote the healing of open cracks.
This study aims at a better understanding of the crack healing ability of asphalt and asphalt mortarcontaining healing agents. Different healing agents including sunflower oil, aromatic oil, bitumenemulsion, and maltene-based emulsion were used to promote the crack healing. The healing agentswere applied on the fractured surfaces of long-term aged asphalt sample, as well as its mortar samples.The crack healing of asphalt samples was tested after healing for 1 day, 2 days, and 4 days by means ofthe strength recovery. For the mortar healing, longer healing time was considered for 1–60 days toimprove healing. Mortar specimens were tested and the recovery of stiffness, strength, and fractureenergy was used as healing indicators. Effects of various agents on crack healing were investigatedand a model was proposed to predict the development of mortar healing over time.
2. Materials and Methods
2.1. Materials
Long-term aged asphalt and asphalt mortar which contained basalt aggregate, limestone mineralfiller and SBS (Styrene Butadiene Styrene) modified asphalt was used in this study. Table 1 givesthe aggregate gradation of the studied mortar. The gradation was determined from the fine fraction(smaller than 4.7 mm sieve size) of AC-13 mixture gradation specified in Chinese Standard of HighwayAsphalt Pavement Design, JTG D20-2017 [1]. An SBS-modified asphalt binder that was commonlyused in the surface wearing course was employed. Its main properties are as follows: penetration of73 mm, ductility of 52.1 at 5 ◦C, and softening point of 68 ◦C. Long-term aged asphalt was obtainedafter subjected to RTFOT (Rolling Thin Film Oven Test) aging and PAV (Pressure Aging Vessel) agingaccording ASTM D6521-18 [31]. The used basalt aggregate had a Los Angeles abrasion value of7.8%, a crushed stone value of 12.0%, a flakiness and elongation index of 8.5%, and a specific gravityof 2.961 g/cm3. Limestone mineral filler with a density of 2.83 g/cm3 and chemical compositionof 51.8% CaO, 3.49% SiO2 and 1.29% Al2O3 was used. The asphalt content of asphalt mortar wasdetermined by 9.2% by taking into account the optimum asphalt content of 4.7% for AC-13 asphaltmixture and the percentage of fine aggregate in the total mixed aggregate.
Seven different healing agents were used in this study and their origins are briefly describedbelow. These healing agents used could be classified into sunflower oil, aromatic oil, bitumen emulsion,and maltene-based emulsion. The use of renewable bio-oil as a modifier for petroleum asphalt hasrecently been getting more attention [32–34]. Sunflower oil was, thus, to represent a renewablebio-oil as the healing agent. Aromatic oil was chosen because it is part of bitumen’s compositionand was proven to have a significant effect on asphalt rejuvenation [35,36]. The content of aromatichydrocarbon of the used aromatic oil employed was 78% according to ASTM D2140 [37]. The smokepoint of sunflower cooking oil was 227 ◦C, while the flash point was 315 ◦C.
200
Materials 2018, 11, 1373
Table 1. Aggregate gradations for the AC-13 mortar.
Sieve Size(mm)
Upper Limitation(%)
Lower Limitation(%)
Passing Percent(%)
4.75 100 100 1002.36 100 48 66.81.18 76 30 50.20.6 56 20 32.80.3 40 14 22.50.15 30 10 14.50.075 16 8 9.6
In order to compare the crack healing ability between these two types of oil and their emulsions,sunflower oil and aromatic oil were emulsified by using 60% oil, 2.5% cationic emulsifier, 0.3% stabilizer,and 37.2% water. The solution was controlled at 60–70 ◦C, while the oil was heated up to 110–120 ◦C.The oil emulsion was prepared by a high shear colloid mill for 2 min in the laboratory.
Two maltene-based emulsions, named HA-2, and HA-3 were commercial pavement maintenanceagents. Both of them were cationic emulsions with a high content of aromatics. For the purpose ofcomparison, one base asphalt emulsion, named BBE was used. The related technical requirements ofthe used BBE meet with those for PC-1 base asphalt emulsion according to Technical Specification forConstruction of Highway Asphalt Pavements, JTG F40-2004 [38].
In total, seven healing agents were used in this study, which are listed as follows: sunflower oil (KY),sunflower oil emulsion (KR), aromatic oil (FY), aromatic oil emulsion (FR), two commercial maltene-basedemulsions (HA-2 and HA-3), and base asphalt emulsion (BBE). Table 2 gives the test results on the measuredviscosity and the four components (saturates, aromatics, resins, and asphaltenes) determined by means ofthin-layer chromatography (TLC) interfaced with flame ionization detection (FID) (IATROSCAN MK-6,LSI Medience Corporate, Tokyo, Japan) [39]. The particle size of the healing emulsions including KR, FR,HA-2, HA-3, and BBE agents was observed by an XSP-16A biological microscope produced by NanjingJiangnan Yongxin Optical Co., Ltd. (Nanjing, China) Almost all of particles are less than 10 μm and morethan 80% of them were less than 5 μm.
Table 2. Chemical composition and viscosity of the healing agents.
Healing Agents
Chemical Composition (%) Viscosity
Saturates Aromatics Resins AsphaltenesResidue at 60 ◦C
(Pa s)Emulsion at 25 ◦C
(cp)
KY 1.5 86.3 10.0 2.2 0.5–5 –FY 7.3 84.5 3.3 4.9 30–50 –KR 1.5 86.3 10.0 2.2 0.5–5 30–50FR 7.3 84.5 3.3 4.9 30–50 40–60
HA-2 18.1 48.6 22.2 11.1 140–160 50–70HA-3 12.2 70.1 11.2 6.5 100–120 45–65BBE 14.1 29.6 43.5 12.8 210–230 150–170
Note: KY = sunflower oil; KR = sunflower oil emulsion; FY = aromatic oil; FR = aromatic oil emulsion; HA-2 andHA-3 = two commercial agents; BBE = base asphalt emulsion.
2.2. Sample Fabrication
The asphalt sample was prepared by using two pieces of asphalt disks as indicated by Figure 1.To prepare the asphalt disk, a small drop of asphalt was placed on the surface of a round nail 14 mmin diameter and pressed to obtain a thick asphalt film around 0.4–0.6 mm. Two nails coated withasphalt films were put together with or without applying healing agents on the surface of asphalt disks.After applying the healing agent, the two disks were adhered together vertically and compressed bythe weight of the top nail. In order to determine the asphalt tensile strength, a similar asphalt sample,but with one asphalt disk of 1 mm thickness to adhere two nails was prepared. The tensile strengthobtained on this asphalt sample that only consists of one asphalt disk is defined as the original strength.
201
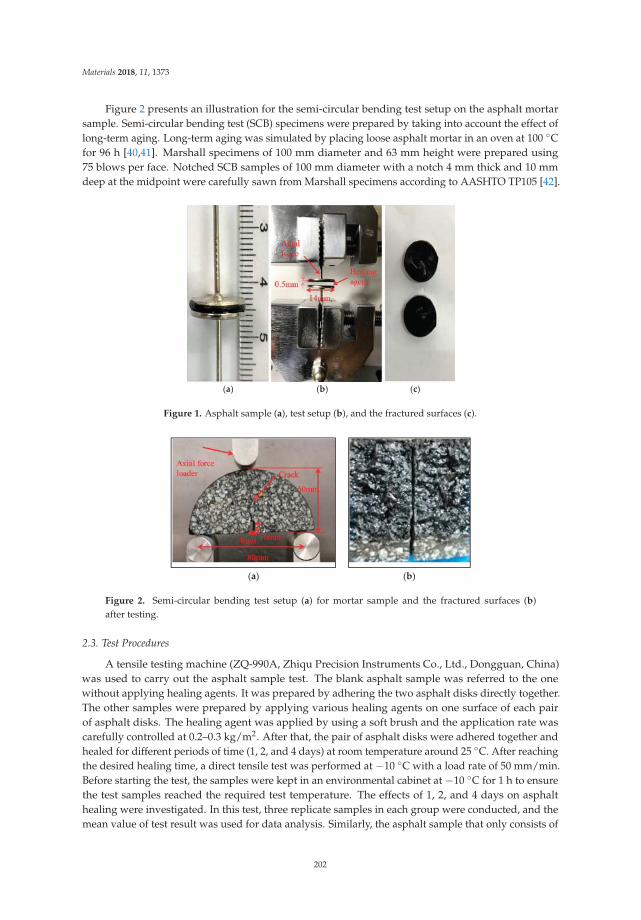
Materials 2018, 11, 1373
Figure 2 presents an illustration for the semi-circular bending test setup on the asphalt mortarsample. Semi-circular bending test (SCB) specimens were prepared by taking into account the effect oflong-term aging. Long-term aging was simulated by placing loose asphalt mortar in an oven at 100 ◦Cfor 96 h [40,41]. Marshall specimens of 100 mm diameter and 63 mm height were prepared using75 blows per face. Notched SCB samples of 100 mm diameter with a notch 4 mm thick and 10 mmdeep at the midpoint were carefully sawn from Marshall specimens according to AASHTO TP105 [42].
(a) (b) (c)
Figure 1. Asphalt sample (a), test setup (b), and the fractured surfaces (c).
(a) (b)
Figure 2. Semi-circular bending test setup (a) for mortar sample and the fractured surfaces (b)after testing.
2.3. Test Procedures
A tensile testing machine (ZQ-990A, Zhiqu Precision Instruments Co., Ltd., Dongguan, China)was used to carry out the asphalt sample test. The blank asphalt sample was referred to the onewithout applying healing agents. It was prepared by adhering the two asphalt disks directly together.The other samples were prepared by applying various healing agents on one surface of each pairof asphalt disks. The healing agent was applied by using a soft brush and the application rate wascarefully controlled at 0.2–0.3 kg/m2. After that, the pair of asphalt disks were adhered together andhealed for different periods of time (1, 2, and 4 days) at room temperature around 25 ◦C. After reachingthe desired healing time, a direct tensile test was performed at −10 ◦C with a load rate of 50 mm/min.Before starting the test, the samples were kept in an environmental cabinet at −10 ◦C for 1 h to ensurethe test samples reached the required test temperature. The effects of 1, 2, and 4 days on asphalthealing were investigated. In this test, three replicate samples in each group were conducted, and themean value of test result was used for data analysis. Similarly, the asphalt sample that only consists of
202
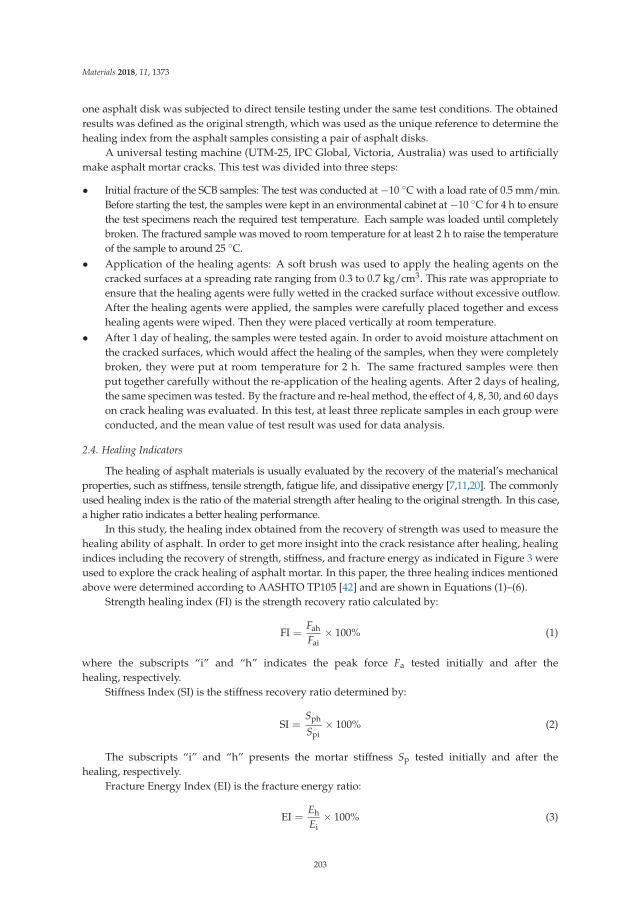
Materials 2018, 11, 1373
one asphalt disk was subjected to direct tensile testing under the same test conditions. The obtainedresults was defined as the original strength, which was used as the unique reference to determine thehealing index from the asphalt samples consisting a pair of asphalt disks.
A universal testing machine (UTM-25, IPC Global, Victoria, Australia) was used to artificiallymake asphalt mortar cracks. This test was divided into three steps:
• Initial fracture of the SCB samples: The test was conducted at −10 ◦C with a load rate of 0.5 mm/min.Before starting the test, the samples were kept in an environmental cabinet at −10 ◦C for 4 h to ensurethe test specimens reach the required test temperature. Each sample was loaded until completelybroken. The fractured sample was moved to room temperature for at least 2 h to raise the temperatureof the sample to around 25 ◦C.
• Application of the healing agents: A soft brush was used to apply the healing agents on thecracked surfaces at a spreading rate ranging from 0.3 to 0.7 kg/cm3. This rate was appropriate toensure that the healing agents were fully wetted in the cracked surface without excessive outflow.After the healing agents were applied, the samples were carefully placed together and excesshealing agents were wiped. Then they were placed vertically at room temperature.
• After 1 day of healing, the samples were tested again. In order to avoid moisture attachment onthe cracked surfaces, which would affect the healing of the samples, when they were completelybroken, they were put at room temperature for 2 h. The same fractured samples were thenput together carefully without the re-application of the healing agents. After 2 days of healing,the same specimen was tested. By the fracture and re-heal method, the effect of 4, 8, 30, and 60 dayson crack healing was evaluated. In this test, at least three replicate samples in each group wereconducted, and the mean value of test result was used for data analysis.
2.4. Healing Indicators
The healing of asphalt materials is usually evaluated by the recovery of the material’s mechanicalproperties, such as stiffness, tensile strength, fatigue life, and dissipative energy [7,11,20]. The commonlyused healing index is the ratio of the material strength after healing to the original strength. In this case,a higher ratio indicates a better healing performance.
In this study, the healing index obtained from the recovery of strength was used to measure thehealing ability of asphalt. In order to get more insight into the crack resistance after healing, healingindices including the recovery of strength, stiffness, and fracture energy as indicated in Figure 3 wereused to explore the crack healing of asphalt mortar. In this paper, the three healing indices mentionedabove were determined according to AASHTO TP105 [42] and are shown in Equations (1)–(6).
Strength healing index (FI) is the strength recovery ratio calculated by:
FI =FahFai
× 100% (1)
where the subscripts “i” and “h” indicates the peak force Fa tested initially and after thehealing, respectively.
Stiffness Index (SI) is the stiffness recovery ratio determined by:
SI =Sph
Spi× 100% (2)
The subscripts “i” and “h” presents the mortar stiffness Sp tested initially and after thehealing, respectively.
Fracture Energy Index (EI) is the fracture energy ratio:
EI =EhEi
× 100% (3)
203
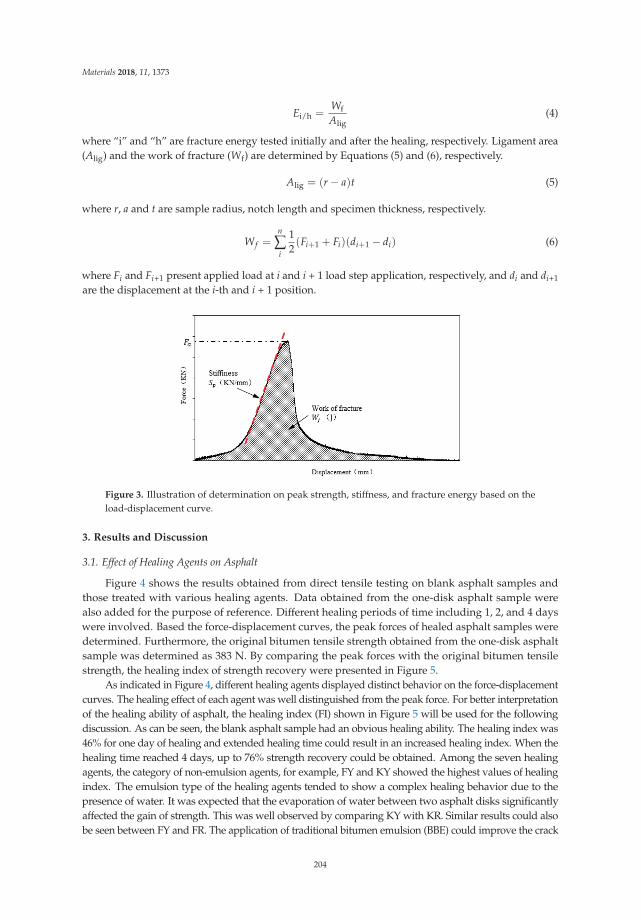
Materials 2018, 11, 1373
Ei/h =WfAlig
(4)
where “i” and “h” are fracture energy tested initially and after the healing, respectively. Ligament area(Alig) and the work of fracture (Wf) are determined by Equations (5) and (6), respectively.
Alig = (r − a)t (5)
where r, a and t are sample radius, notch length and specimen thickness, respectively.
Wf =n
∑i
12(Fi+1 + Fi)(di+1 − di) (6)
where Fi and Fi+1 present applied load at i and i + 1 load step application, respectively, and di and di+1
are the displacement at the i-th and i + 1 position.
Figure 3. Illustration of determination on peak strength, stiffness, and fracture energy based on theload-displacement curve.
3. Results and Discussion
3.1. Effect of Healing Agents on Asphalt
Figure 4 shows the results obtained from direct tensile testing on blank asphalt samples andthose treated with various healing agents. Data obtained from the one-disk asphalt sample werealso added for the purpose of reference. Different healing periods of time including 1, 2, and 4 dayswere involved. Based the force-displacement curves, the peak forces of healed asphalt samples weredetermined. Furthermore, the original bitumen tensile strength obtained from the one-disk asphaltsample was determined as 383 N. By comparing the peak forces with the original bitumen tensilestrength, the healing index of strength recovery were presented in Figure 5.
As indicated in Figure 4, different healing agents displayed distinct behavior on the force-displacementcurves. The healing effect of each agent was well distinguished from the peak force. For better interpretationof the healing ability of asphalt, the healing index (FI) shown in Figure 5 will be used for the followingdiscussion. As can be seen, the blank asphalt sample had an obvious healing ability. The healing index was46% for one day of healing and extended healing time could result in an increased healing index. When thehealing time reached 4 days, up to 76% strength recovery could be obtained. Among the seven healingagents, the category of non-emulsion agents, for example, FY and KY showed the highest values of healingindex. The emulsion type of the healing agents tended to show a complex healing behavior due to thepresence of water. It was expected that the evaporation of water between two asphalt disks significantlyaffected the gain of strength. This was well observed by comparing KY with KR. Similar results could alsobe seen between FY and FR. The application of traditional bitumen emulsion (BBE) could improve the crack
204
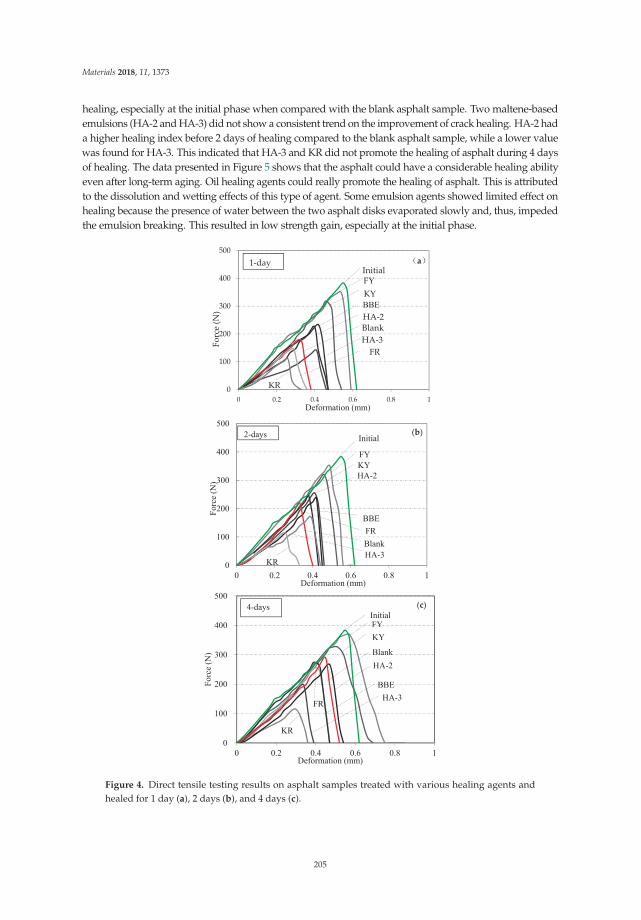
Materials 2018, 11, 1373
healing, especially at the initial phase when compared with the blank asphalt sample. Two maltene-basedemulsions (HA-2 and HA-3) did not show a consistent trend on the improvement of crack healing. HA-2 hada higher healing index before 2 days of healing compared to the blank asphalt sample, while a lower valuewas found for HA-3. This indicated that HA-3 and KR did not promote the healing of asphalt during 4 daysof healing. The data presented in Figure 5 shows that the asphalt could have a considerable healing abilityeven after long-term aging. Oil healing agents could really promote the healing of asphalt. This is attributedto the dissolution and wetting effects of this type of agent. Some emulsion agents showed limited effect onhealing because the presence of water between the two asphalt disks evaporated slowly and, thus, impededthe emulsion breaking. This resulted in low strength gain, especially at the initial phase.
0
100
200
300
400
500
0 0.2 0.4 0.6 0.8 1
Forc
e (N
)
Deformation (mm)
FYKY
HA-3
HA-2BBE
Blank
KR
FR
1-dayInitial
a
0
100
200
300
400
500
0 0.2 0.4 0.6 0.8 1
Forc
e (N
)
Deformation (mm)
FYKYHA-2
BBE
BlankFR
HA-3KR
2-days Initial(b)
0
100
200
300
400
500
0 0.2 0.4 0.6 0.8 1
Forc
e (N
)
Deformation (mm)
FYKY
HA-2
HA-3
KR
FR
BBE
4-days
Blank
Initial(c)
Figure 4. Direct tensile testing results on asphalt samples treated with various healing agents andhealed for 1 day (a), 2 days (b), and 4 days (c).
205
Materials 2018, 11, 1373
Figure 5. Healing index of strength recovery (FI) for various healing agents determined by taking intoaccount the original bitumen tensile strength of 383 N.
3.2. Appearance of Fractured Surface for Asphalt
Figure 6 shows the fractured surfaces of asphalt samples healed by various healing agents.It should be noted that the direct tensile testing was performed at −10 ◦C. At such a low temperature,asphalt, especially after long term aging, tended to have a brittle failure. When the pair of asphaltdisks was adhered together, the crack interface could be the weak link for fracture if the crack was notcompletely healed. For this reason, the observation of the fracture surfaces could be very useful forevaluation of failure mode, as well as the diffusion of the healing agents. Three failure modes couldbe expected: failure within the crack interface, failure through the asphalt disks, and adhesive failurebetween asphalt disk and the nail. After inspection of all the fractured samples, it was found that all ofthe nails were covered with black asphalt binder and the adhesive failure between the asphalt disk andthe nail was hardly seen. This indicated that the adhesive strength between the asphalt disk and thenail was much higher than the cohesive strength of the asphalt, as well as the crack healing strength.Among the seven healing agents, sunflower oil (KY) and aromatic oil (FY) provided strong healingeffects for asphalt cracks. For this reason, the fracture surfaces tended to occur within the asphalt disks,but not the crack surfaces. However, sunflower oil emulsion (KR) exhibited the lowest healing effect.Therefore, the failure was concentrated on the crack interface between two asphalt disks. This wasproven by the observation of sticky residue on both surfaces of the fractured sample. When the healingtime was increased to 4 days, the same failure mode happened, but drier and harder fracture surfaceswere observed. This indicated that the healing agent was gradually diffused in the asphalt disks and,thus, led to increased healing strength. When the healing index was higher than 70%, the failurewas likely changed from the crack interface to the asphalt disks, or a mixed failure of both could beobserved. The above discussion indicates that some of the used healing agents could really improvethe crack healing of asphalt and prevent crack failure. The strength gain depended on the interactionbetween the asphalt and the used healing agents. Extended healing time, thus, improved the healingstrength. The failure mode and the hardness of the fracture surfaces could be an indicator for theinteraction between asphalt and the healing agent.
206
Materials 2018, 11, 1373
HA-3 HA-2 BBE FR KR FY KY
(a)
(b)
Figure 6. Fracture surfaces for various asphalt samples after (a) 1 day and (b) 4 days of healing.
3.3. Healing of Asphalt Mortar
Tables 3 and 4 present a summary of test results obtained on the strength, stiffness, and fractureenergy of asphalt mortar treated with and without healing agents. It should be noted that the initialstrength, stiffness, and fracture energy stand for the original mechanical properties. When the mortarspecimens were cracked and healed without treating with healing agents, the recovery of strength,stiffness, and fracture energy was very low. It indicated that the self-healing ability of mortar sampleswas insufficient to repair cracks at room temperature. On the contrary, mortar samples treated withhealing agents showed an obvious increase in these mechanical parameters, which implied that healingagents were effective to promote mortar crack healing.
It can also be seen that healing time played an important role in the healing of asphalt binder.As expected, extended healing time could promote the development of crack healing. Among therecovery of strength, stiffness and facture energy, strength, and fracture energy showed a clear increasetrend as the healing time increased, while stiffness did not show a particular change tendency.This, therefore, indicated that stiffness could not be employed as a healing index of crack repairof asphalt mortar. Compared with the recovery of fracture energy after treating with healing agents,the strength gain increased rapidly with healing time and, thus, may well distinguish the developmentof crack healing from various healing agents. Considering that fracture energy represents the crackresistance and propagation, both of strength and fracture energy were used as healing indicators toevaluate the crack healing performance of asphalt mortar treated with various agents.
Table 3. Test results of strength, stiffness, and fracture energy obtained from blank, sunflower oil-,and aromatic oil-treated mortar samples.
Healing AgentsHealing Time
(days)Strength
(kN)Stiffness(N/mm)
Fracture Energy(J/m2)
Blank(pure asphalt)
Initial 3.15 9.47 4.351 0.18 0.80 0.092 0.23 0.93 0.114 0.38 2.87 0.188 0.44 2.99 0.27
KY oil
Initial 3.27 9.34 3.901 0.62 5.92 0.562 0.74 6.39 0.674 0.88 7.06 0.698 1.03 6.87 0.81
207
Materials 2018, 11, 1373
Table 3. Cont.
Healing AgentsHealing Time
(days)Strength
(kN)Stiffness(N/mm)
Fracture Energy(J/m2)
FY oil
Initial 2.92 11.81 3.971 0.76 4.83 0.562 0.95 6.91 0.634 1.16 7.58 0.708 1.39 5.34 0.87
KR emulsion
Initial 3.41 8.90 4.551 0.46 2.65 0.272 0.50 2.99 0.304 0.55 2.37 0.448 0.65 3.08 0.57
FR emulsion
Initial 2.74 9.26 3.631 0.66 3.11 0.602 0.84 5.52 0.594 1.02 7.43 0.708 1.19 5.21 0.76
Table 4. Test results of strength, stiffness and fracture energy obtained from base asphalt emulsion andcommercial maltene-based emulsion treated mortar samples.
Healing AgentsHealing Time
(days)Strength
(kN)Stiffness(N/mm)
Fracture Energy(J/m2)
BBE emulsion
Initial 3.20 9.19 4.211 0.86 7.82 0.362 0.95 7.30 0.454 1.28 9.93 0.518 1.32 5.85 0.87
HA-2 emulsion
Initial 2.99 6.67 3.861 1.10 3.66 0.452 1.28 2.94 0.454 1.33 8.86 1.118 1.60 8.63 1.00
HA-3 emulsion
Initial 3.16 8.85 4.201 1.33 3.90 0.492 1.43 8.87 0.544 1.55 6.04 1.038 1.78 7.45 1.10
3.4. Appearance of Fractured Surface for Asphalt Mortar
Figure 7 shows the appearance of the cracked zones for mortar specimens after 1, 2, 4, and 8 dayshealing. These pictures were taken after the applied load reached the peak value during testing. As canbe seen, the cracked zones treated with sunflower oil (KY) and aromatic oil (FY) showed filaments inthe initial days. However, these filaments tended to disappear after longer healing time. This similarphenomenon was also observed on the pictures of sunflower oil emulsions (KR) and aromatic oilemulsion (FR). The water in their two emulsions tended to reduce the crack healing when comparedwith the un-emulsified oil.
208
Materials 2018, 11, 1373
1-day 2-days 4-days 8-days
KY
FY
KP
FR
BBE
HA-2
HA-3
Figure 7. Appearance of the cracked surfaces for healed asphalt mortar after different healing times.
The quantitative data showed in Tables 3 and 4 indicated that BBE, HA-2 and HA-3 had relativebetter healing performance. This is in agreement with the qualitative data in Figure 7 indicated bylarge amount of thin filaments which could be seen even after 8 days healing. In addition, the fractureof healed mortar samples was caused by cohesive failure. This indicated that the strength recoveryof mortar crack really depends on the interaction between mortar and healing agent. According toGuo’s study, the four components (saturates, aromatics, resins, and asphaltenes) of bitumen hada great influence on diffusion, adhesion, and cohesion work [43]. High diffusion speed of lowmolecular weight saturates and aromatics helped to activate and soften the asphalt binder on thecrack surfaces and thus promote healing. High adhesion work of aromatics and asphaltenes couldprevent interfacial adhesive failure. Cohesion strength would benefit from resins and asphaltenes.The results showed in Table 2 indicated that aromatics rich agents could really improve the crackhealing. However, the existence of aromatics was likely to act as softening additive for the cracks.
209
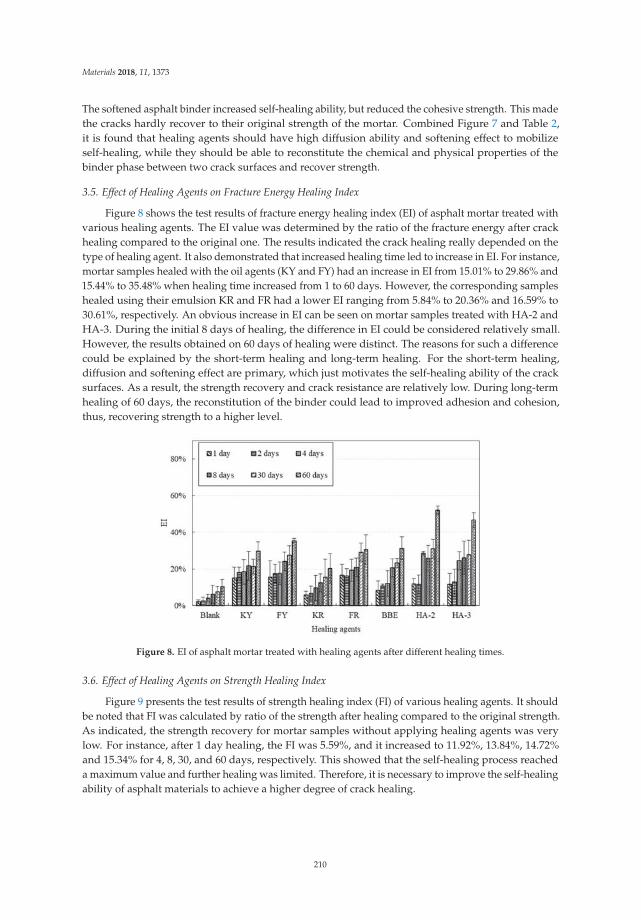
Materials 2018, 11, 1373
The softened asphalt binder increased self-healing ability, but reduced the cohesive strength. This madethe cracks hardly recover to their original strength of the mortar. Combined Figure 7 and Table 2,it is found that healing agents should have high diffusion ability and softening effect to mobilizeself-healing, while they should be able to reconstitute the chemical and physical properties of thebinder phase between two crack surfaces and recover strength.
3.5. Effect of Healing Agents on Fracture Energy Healing Index
Figure 8 shows the test results of fracture energy healing index (EI) of asphalt mortar treated withvarious healing agents. The EI value was determined by the ratio of the fracture energy after crackhealing compared to the original one. The results indicated the crack healing really depended on thetype of healing agent. It also demonstrated that increased healing time led to increase in EI. For instance,mortar samples healed with the oil agents (KY and FY) had an increase in EI from 15.01% to 29.86% and15.44% to 35.48% when healing time increased from 1 to 60 days. However, the corresponding sampleshealed using their emulsion KR and FR had a lower EI ranging from 5.84% to 20.36% and 16.59% to30.61%, respectively. An obvious increase in EI can be seen on mortar samples treated with HA-2 andHA-3. During the initial 8 days of healing, the difference in EI could be considered relatively small.However, the results obtained on 60 days of healing were distinct. The reasons for such a differencecould be explained by the short-term healing and long-term healing. For the short-term healing,diffusion and softening effect are primary, which just motivates the self-healing ability of the cracksurfaces. As a result, the strength recovery and crack resistance are relatively low. During long-termhealing of 60 days, the reconstitution of the binder could lead to improved adhesion and cohesion,thus, recovering strength to a higher level.
Figure 8. EI of asphalt mortar treated with healing agents after different healing times.
3.6. Effect of Healing Agents on Strength Healing Index
Figure 9 presents the test results of strength healing index (FI) of various healing agents. It shouldbe noted that FI was calculated by ratio of the strength after healing compared to the original strength.As indicated, the strength recovery for mortar samples without applying healing agents was verylow. For instance, after 1 day healing, the FI was 5.59%, and it increased to 11.92%, 13.84%, 14.72%and 15.34% for 4, 8, 30, and 60 days, respectively. This showed that the self-healing process reacheda maximum value and further healing was limited. Therefore, it is necessary to improve the self-healingability of asphalt materials to achieve a higher degree of crack healing.
210
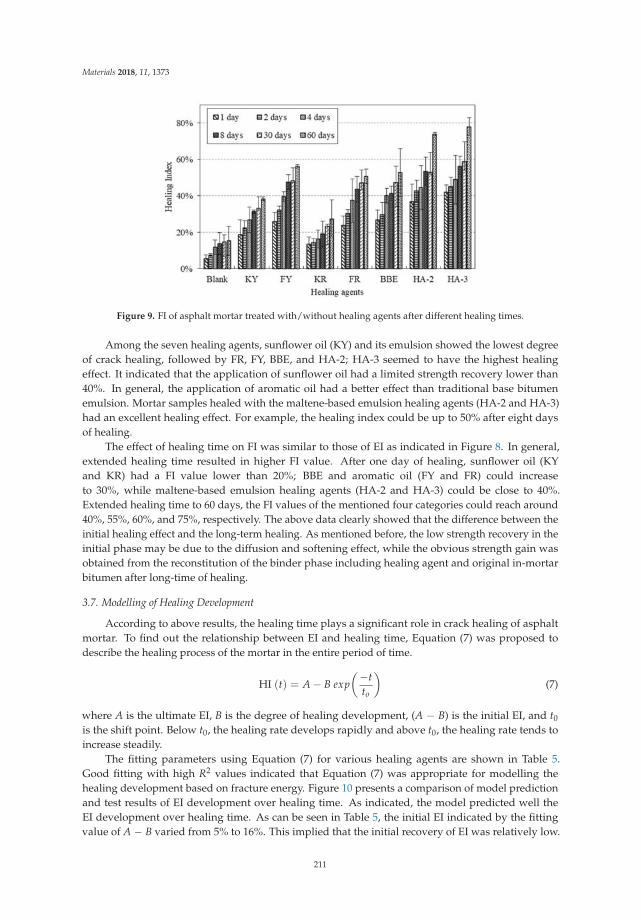
Materials 2018, 11, 1373
Figure 9. FI of asphalt mortar treated with/without healing agents after different healing times.
Among the seven healing agents, sunflower oil (KY) and its emulsion showed the lowest degreeof crack healing, followed by FR, FY, BBE, and HA-2; HA-3 seemed to have the highest healingeffect. It indicated that the application of sunflower oil had a limited strength recovery lower than40%. In general, the application of aromatic oil had a better effect than traditional base bitumenemulsion. Mortar samples healed with the maltene-based emulsion healing agents (HA-2 and HA-3)had an excellent healing effect. For example, the healing index could be up to 50% after eight daysof healing.
The effect of healing time on FI was similar to those of EI as indicated in Figure 8. In general,extended healing time resulted in higher FI value. After one day of healing, sunflower oil (KYand KR) had a FI value lower than 20%; BBE and aromatic oil (FY and FR) could increaseto 30%, while maltene-based emulsion healing agents (HA-2 and HA-3) could be close to 40%.Extended healing time to 60 days, the FI values of the mentioned four categories could reach around40%, 55%, 60%, and 75%, respectively. The above data clearly showed that the difference between theinitial healing effect and the long-term healing. As mentioned before, the low strength recovery in theinitial phase may be due to the diffusion and softening effect, while the obvious strength gain wasobtained from the reconstitution of the binder phase including healing agent and original in-mortarbitumen after long-time of healing.
3.7. Modelling of Healing Development
According to above results, the healing time plays a significant role in crack healing of asphaltmortar. To find out the relationship between EI and healing time, Equation (7) was proposed todescribe the healing process of the mortar in the entire period of time.
HI (t) = A − B exp(−t
to
)(7)
where A is the ultimate EI, B is the degree of healing development, (A − B) is the initial EI, and t0
is the shift point. Below t0, the healing rate develops rapidly and above t0, the healing rate tends toincrease steadily.
The fitting parameters using Equation (7) for various healing agents are shown in Table 5.Good fitting with high R2 values indicated that Equation (7) was appropriate for modelling thehealing development based on fracture energy. Figure 10 presents a comparison of model predictionand test results of EI development over healing time. As indicated, the model predicted well theEI development over healing time. As can be seen in Table 5, the initial EI indicated by the fittingvalue of A − B varied from 5% to 16%. This implied that the initial recovery of EI was relatively low.
211
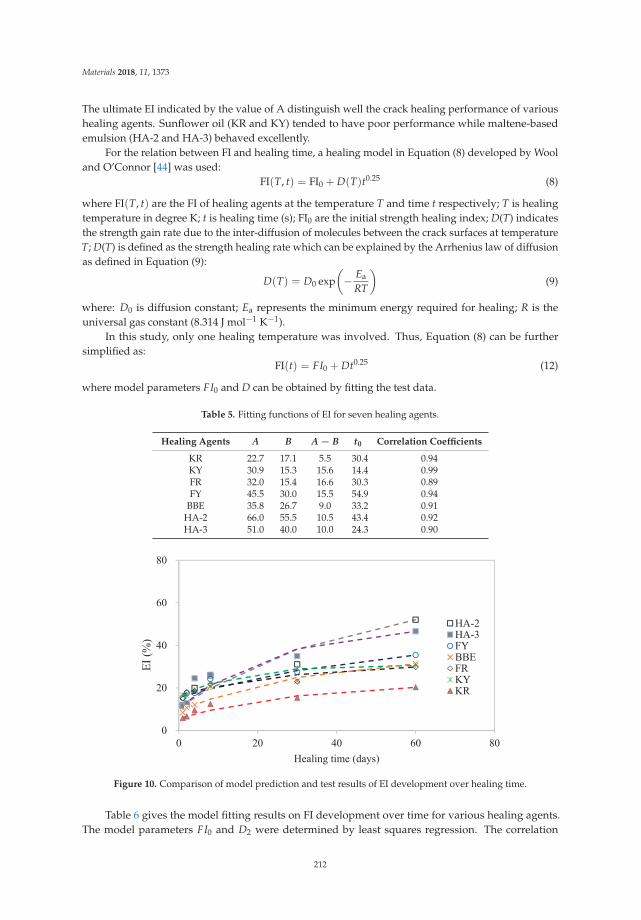
Materials 2018, 11, 1373
The ultimate EI indicated by the value of A distinguish well the crack healing performance of varioushealing agents. Sunflower oil (KR and KY) tended to have poor performance while maltene-basedemulsion (HA-2 and HA-3) behaved excellently.
For the relation between FI and healing time, a healing model in Equation (8) developed by Wooland O’Connor [44] was used:
FI(T, t) = FI0 + D(T)t0.25 (8)
where FI(T, t) are the FI of healing agents at the temperature T and time t respectively; T is healingtemperature in degree K; t is healing time (s); FI0 are the initial strength healing index; D(T) indicatesthe strength gain rate due to the inter-diffusion of molecules between the crack surfaces at temperatureT; D(T) is defined as the strength healing rate which can be explained by the Arrhenius law of diffusionas defined in Equation (9):
D(T) = D0 exp(− Ea
RT
)(9)
where: D0 is diffusion constant; Ea represents the minimum energy required for healing; R is theuniversal gas constant (8.314 J mol−1 K−1).
In this study, only one healing temperature was involved. Thus, Equation (8) can be furthersimplified as:
FI(t) = FI0 + Dt0.25 (12)
where model parameters FI0 and D can be obtained by fitting the test data.
Table 5. Fitting functions of EI for seven healing agents.
Healing Agents A B A − B t0 Correlation Coefficients
KR 22.7 17.1 5.5 30.4 0.94KY 30.9 15.3 15.6 14.4 0.99FR 32.0 15.4 16.6 30.3 0.89FY 45.5 30.0 15.5 54.9 0.94
BBE 35.8 26.7 9.0 33.2 0.91HA-2 66.0 55.5 10.5 43.4 0.92HA-3 51.0 40.0 10.0 24.3 0.90
0
20
40
60
80
0 20 40 60 80
EI (%
)
Healing time (days)
HA-2HA-3FYBBEFRKYKR
Figure 10. Comparison of model prediction and test results of EI development over healing time.
Table 6 gives the model fitting results on FI development over time for various healing agents.The model parameters FI0 and D2 were determined by least squares regression. The correlation
212
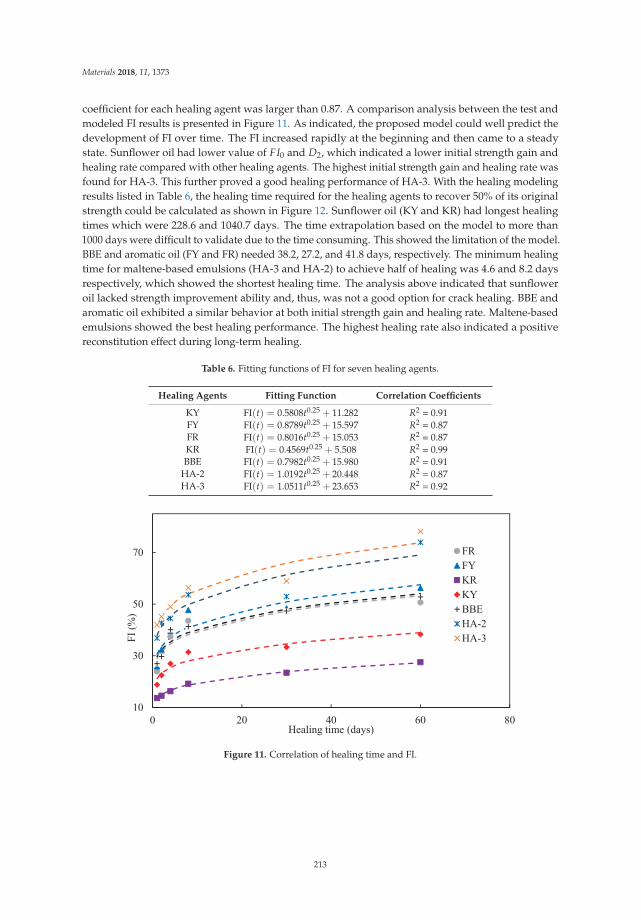
Materials 2018, 11, 1373
coefficient for each healing agent was larger than 0.87. A comparison analysis between the test andmodeled FI results is presented in Figure 11. As indicated, the proposed model could well predict thedevelopment of FI over time. The FI increased rapidly at the beginning and then came to a steadystate. Sunflower oil had lower value of FI0 and D2, which indicated a lower initial strength gain andhealing rate compared with other healing agents. The highest initial strength gain and healing rate wasfound for HA-3. This further proved a good healing performance of HA-3. With the healing modelingresults listed in Table 6, the healing time required for the healing agents to recover 50% of its originalstrength could be calculated as shown in Figure 12. Sunflower oil (KY and KR) had longest healingtimes which were 228.6 and 1040.7 days. The time extrapolation based on the model to more than1000 days were difficult to validate due to the time consuming. This showed the limitation of the model.BBE and aromatic oil (FY and FR) needed 38.2, 27.2, and 41.8 days, respectively. The minimum healingtime for maltene-based emulsions (HA-3 and HA-2) to achieve half of healing was 4.6 and 8.2 daysrespectively, which showed the shortest healing time. The analysis above indicated that sunfloweroil lacked strength improvement ability and, thus, was not a good option for crack healing. BBE andaromatic oil exhibited a similar behavior at both initial strength gain and healing rate. Maltene-basedemulsions showed the best healing performance. The highest healing rate also indicated a positivereconstitution effect during long-term healing.
Table 6. Fitting functions of FI for seven healing agents.
Healing Agents Fitting Function Correlation Coefficients
KY FI(t) = 0.5808t0.25 + 11.282 R2 = 0.91FY FI(t) = 0.8789t0.25 + 15.597 R2 = 0.87FR FI(t) = 0.8016t0.25 + 15.053 R2 = 0.87KR FI(t) = 0.4569t0.25 + 5.508 R2 = 0.99BBE FI(t) = 0.7982t0.25 + 15.980 R2 = 0.91
HA-2 FI(t) = 1.0192t0.25 + 20.448 R2 = 0.87HA-3 FI(t) = 1.0511t0.25 + 23.653 R2 = 0.92
10
30
50
70
0 20 40 60 80
FI (%
)
Healing time (days)
FRFYKRKYBBEHA-2HA-3
Figure 11. Correlation of healing time and FI.
213
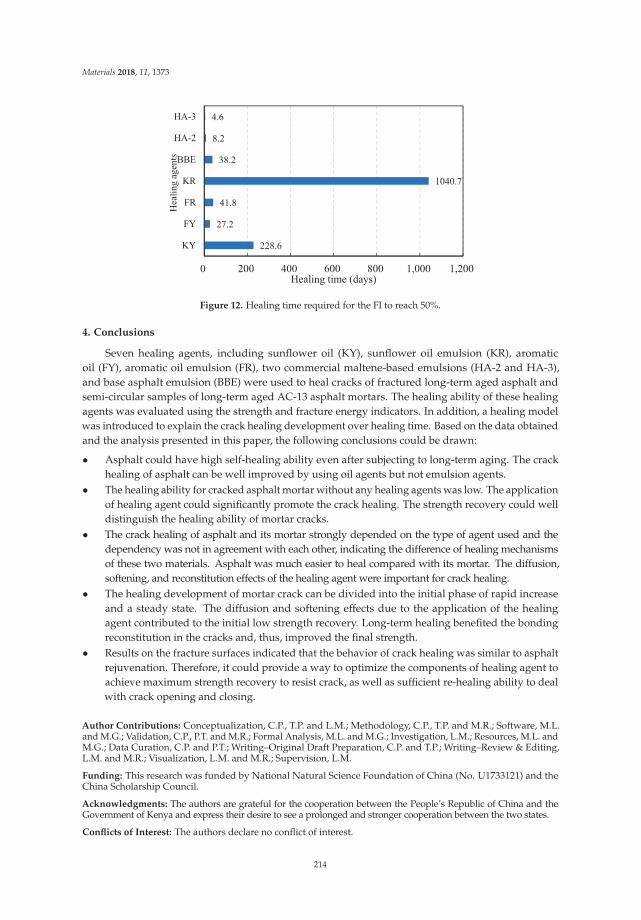
Materials 2018, 11, 1373
228.6
27.2
41.8
1040.7
38.2
8.2
4.6
0 200 400 600 800 1,000 1,200
KY
FY
FR
KR
BBE
HA-2
HA-3
Healing time (days)
Hea
ling
agen
ts
Figure 12. Healing time required for the FI to reach 50%.
4. Conclusions
Seven healing agents, including sunflower oil (KY), sunflower oil emulsion (KR), aromaticoil (FY), aromatic oil emulsion (FR), two commercial maltene-based emulsions (HA-2 and HA-3),and base asphalt emulsion (BBE) were used to heal cracks of fractured long-term aged asphalt andsemi-circular samples of long-term aged AC-13 asphalt mortars. The healing ability of these healingagents was evaluated using the strength and fracture energy indicators. In addition, a healing modelwas introduced to explain the crack healing development over healing time. Based on the data obtainedand the analysis presented in this paper, the following conclusions could be drawn:
• Asphalt could have high self-healing ability even after subjecting to long-term aging. The crackhealing of asphalt can be well improved by using oil agents but not emulsion agents.
• The healing ability for cracked asphalt mortar without any healing agents was low. The applicationof healing agent could significantly promote the crack healing. The strength recovery could welldistinguish the healing ability of mortar cracks.
• The crack healing of asphalt and its mortar strongly depended on the type of agent used and thedependency was not in agreement with each other, indicating the difference of healing mechanismsof these two materials. Asphalt was much easier to heal compared with its mortar. The diffusion,softening, and reconstitution effects of the healing agent were important for crack healing.
• The healing development of mortar crack can be divided into the initial phase of rapid increaseand a steady state. The diffusion and softening effects due to the application of the healingagent contributed to the initial low strength recovery. Long-term healing benefited the bondingreconstitution in the cracks and, thus, improved the final strength.
• Results on the fracture surfaces indicated that the behavior of crack healing was similar to asphaltrejuvenation. Therefore, it could provide a way to optimize the components of healing agent toachieve maximum strength recovery to resist crack, as well as sufficient re-healing ability to dealwith crack opening and closing.
Author Contributions: Conceptualization, C.P., T.P. and L.M.; Methodology, C.P., T.P. and M.R.; Software, M.L.and M.G.; Validation, C.P., P.T. and M.R.; Formal Analysis, M.L. and M.G.; Investigation, L.M.; Resources, M.L. andM.G.; Data Curation, C.P. and P.T.; Writing–Original Draft Preparation, C.P. and T.P.; Writing–Review & Editing,L.M. and M.R.; Visualization, L.M. and M.R.; Supervision, L.M.
Funding: This research was funded by National Natural Science Foundation of China (No. U1733121) and theChina Scholarship Council.
Acknowledgments: The authors are grateful for the cooperation between the People’s Republic of China and theGovernment of Kenya and express their desire to see a prolonged and stronger cooperation between the two states.
Conflicts of Interest: The authors declare no conflict of interest.
214
Materials 2018, 11, 1373
References
1. JTG D20-2017 Standard of Highway Asphalt Pavement Design; People’s Republic of China CommunicationPress: Beijing, China, 2017.
2. Sol-Sánchez, M.; Fiume, A.; Moreno-Navarro, F.; Rubio-Gámez, M.C. Analysis of fatigue cracking of warmmix asphalt. influence of the manufacturing technology. Int. J. Fatigue 2018, 110, 197–203. [CrossRef]
3. Liu, J.; Zhao, S.; Li, L.; Li, P.; Saboundjian, S. Low temperature cracking analysis of asphalt binders andmixtures. Cold Reg. Sci. Technol. 2017, 141, 78–85. [CrossRef]
4. Fang, H.; Luo, H.; Zhu, H. The feasibility of continuous construction of the base and asphalt layers of asphaltpavement to solve the problem of reflective cracks. Constr. Build. Mater. 2016, 119, 80–88. [CrossRef]
5. Kakar, M.R.; Hamzah, M.O.; Valentin, J. A review on moisture damages of hot and warm mix asphalt andrelated investigations. J. Clean. Prod. 2015, 99, 39–58. [CrossRef]
6. Qiu, J.; Van de Ven, M.F.C.; Wu, S.; Molenaar, A. Investigating self-healing behavior of pure bitumen usingdynamic shear rheometer. Fuel 2011, 90, 2710–2720. [CrossRef]
7. Qiu, J.; Van de Ven, M.F.C.; Molenaar, A. Crack-healing investigation in bituminous materials.J. Mater. Civ. Eng. 2013, 25, 864–870. [CrossRef]
8. Sun, S.; Sun, G.; Zhu, X.; Pang, Q.; Yu, F.; Lin, T. Identification of wetting and molecular diffusion stagesduring self-healing process of asphalt binder via fluorescence microscope. Constr. Build. Mater. 2017, 132,230–239. [CrossRef]
9. Lv, Q.; Huang, W.; Xiao, F. Laboratory evaluation of self-healing properties of various modified asphalt.Constr. Build. Mater. 2017, 136, 192–201. [CrossRef]
10. González, A.; Norambuena-Contreras, J.; Storey, L.; Schlangene, E. Self-healing properties of recycled asphaltmixtures containing metal waste: An approach through microwave radiation heating. J. Environ. Manag.2018, 214, 242–251. [CrossRef] [PubMed]
11. García, Á.; Schlangen, E.; Van de Ven, M. Properties of capsules containing rejuvenators for their use inasphalt concrete. Fuel 2011, 90, 583–591. [CrossRef]
12. Pamulapati, Y.; Elseifi, M.A.; Cooper, S.B.; Mohammad, L.N.; Elbagalati, O. Evaluation of self-healing of asphaltconcrete through induction heating and metallic fibers. Constr. Build. Mater. 2017, 146, 66–75. [CrossRef]
13. Al-Mansoori, T.; Norambuena-Contreras, J.; Micaelo, R.; Garcia, A. Self-healing of asphalt mastic by theaction of polymeric capsules containing rejuvenators. Constr. Build. Mater. 2018, 161, 330–339. [CrossRef]
14. Al-Mansoori, T.; Micaelo, R.; Artamendi, I.; Norambuena-Contreras, J.; Garcia, A. Microcapsules for self-healingof asphalt mixture without compromising mechanical performance. Constr. Build. Mater. 2017, 155, 1091–1100.[CrossRef]
15. Ba, H.D.; Park, D.W.; Le, T.H.M. Effect of rejuvenators on the crack healing performance of recycled asphaltpavement by induction heating. Constr. Build. Mater. 2018, 164, 246–254.
16. Apostolidis, P.; Liu, X.; Scarpas, A.; Kasbergen, C.; van de Ven, M.F.C. Advanced evaluation of asphaltmortar for induction healing purposes. Constr. Build. Mater. 2016, 126, 9–25. [CrossRef]
17. Norambuena-Contreras, J.; Yalcin, E.; Garcia, A.; Al-Mansoori, T.; Yilmaz, M.; Hudson-Griffiths, R. Effect ofmixing and ageing on the mechanical and self-healing properties of asphalt mixtures containing polymericcapsules. Constr. Build. Mater. 2018, 175, 254–266. [CrossRef]
18. Dai, Q.; Wang, Z.; Hasan, M.R.M. Investigation of induction healing effects on electrically conductive asphaltmastic and asphalt concrete beams through fracture-healing tests. Constr. Build. Mater. 2013, 49, 729–737. [CrossRef]
19. Gallego, J.; del Val, M.A.; Contreras, V.; Paez, A. Heating asphalt mixtures with microwaves to promoteself-healing. Constr. Build. Mater. 2013, 42, 1–4. [CrossRef]
20. Vila-Cortavitarte, M.; Jato-Espino, D.; Castro-Fresno, D.; Calzada-Pérez, M.Á. Self-healing capacity of asphaltmixtures including by-products both as aggregates and heating inductors. Materials 2018, 11, 800. [CrossRef]
21. Karimi, M.M.; Jahanbakhsh, H.; Jahangiri, B.; Nejad, F.M. Induced heating-healing characterization ofactivated carbon modified asphalt concrete under microwave radiation. Constr. Build. Mater. 2018, 178,254–271. [CrossRef]
22. Sun, Y.; Wu, S.; Liu, Q.; Zeng, W.; Chen, Z.; Ye, Q.; Pan, P. Self-healing performance of asphalt mixturesthrough heating fibers or aggregate. Constr. Build. Mater. 2017, 150, 673–680. [CrossRef]
215
Materials 2018, 11, 1373
23. Gonzalez, A.; Norambuena-Contreras, J.; Storey, L.; Schlangen, E. Effect of RAP and fibers addition onasphalt mixtures with self-healing properties gained by microwave radiation heating. Constr. Build. Mater.2017, 159, 164–174. [CrossRef]
24. Garcia, A.; Jelfs, J.; Austin, C.J. Internal asphalt mixture rejuvenation using capsules. Constr. Build. Mater.2015, 101, 309–316. [CrossRef]
25. Micaelo, R.; Al-Mansoori, T.; Garcia, A. Study of the mechanical properties and self-healing ability of asphaltmixture containing calcium-alginate capsules. Constr. Build. Mater. 2016, 123, 734–744. [CrossRef]
26. Xu, S.; Tabakovic, A.; Liu, X.; Schlangen, E. Calcium alginate capsules encapsulating rejuvenator as healingsystem for asphalt mastic. Constr. Build. Mater. 2018, 169, 379–387. [CrossRef]
27. Xue, B.; Wang, H.; Pei, J.; Li, R.; Zhang, J.; Fan, Z. Study on self-healing microcapsule containing rejuvenatorfor asphalt. Constr. Build. Mater. 2017, 135, 641–649. [CrossRef]
28. Lin, J.; Hong, J.; Huang, C.; Liu, J.; Wu, S. Effectiveness of rejuvenator seal materials on performance ofasphalt pavement. Constr. Build. Mater. 2014, 55, 63–68. [CrossRef]
29. Riara, M.; Tang, P.; Mo, L.; Javilla, B.; Wu, S. Investigation into crack healing of asphalt mixtures usinghealing agents. Constr. Build. Mater. 2018, 161, 45–52. [CrossRef]
30. Wang, F.; Wang, Z.; Li, C.; Xiao, Y.; Wu, S.; Pan, P. The rejuvenating effect in hot asphalt recycling by mortartransfer ratio and image analysis. Materials 2017, 10, 574. [CrossRef] [PubMed]
31. ASTM D6521-18 Standard Practice for Accelerated Aging of Asphalt Binder Using a Pressurized Aging Vessel (PAV);ASTM International: West Conshohocken, PA, USA, 2018.
32. Kuang, D.; Jiao, Y.; Ye, Z.; Lu, Z.; Chen, H.; Yu, J.; Liu, N. Diffusibility enhancement of rejuvenator byepoxidized soybean oil and its influence on the performance of recycled hot mix asphalt mixtures. Materials2018, 11, 833. [CrossRef] [PubMed]
33. Zhang, D.; Chen, M.; Wu, S.; Liu, J.; Amirkhanian, S. Analysis of the relationships between waste cooking oilqualities and rejuvenated asphalt properties. Materials 2017, 10, 508. [CrossRef] [PubMed]
34. Qu, X.; Liu, Q.; Wang, C.; Wang, D.; Oeser, M. Effect of co-Production of renewable biomaterials on theperformance of asphalt binder in macro and micro perspectives. Materials 2018, 11, 244. [CrossRef] [PubMed]
35. Zaumanis, M.; Mallick, R.B.; Poulikakos, L.; Frank, R. Influence of six rejuvenators on the performance propertiesof reclaimed asphalt pavement (RAP) binder and 100% recycled asphalt mixtures. Constr. Build. Mater. 2014, 71,538–550. [CrossRef]
36. Ma, T.; Huang, X.; Zhao, Y.; Zhang, Y. Evaluation of the diffusion and distribution of the rejuvenator for hotasphalt recycling. Constr. Build. Mater. 2015, 98, 530–536. [CrossRef]
37. ASTM D2140-08 Standard Practice for Calculating Carbon-Type Composition of Insulating Oils of Petroleum Origin;ASTM International: West Conshohocken, PA, USA, 2017.
38. JTG F40-2004 Technical Specification for Construction of Highway Asphalt Pavements; People’s Republic of ChinaMinistry of Transport: Beijing, China, 2004.
39. Dunn, K.; Chilingarian, G.V.; Lian, H.; Wang, Y.; Yen, T.F. Analysis of asphalt and its components by thin-layerchromatography. In Asphaltenes and Asphalts, 2nd ed.; Yen, T.F., Chilingarian, G.V., Eds.; Elsevier Science:Amsterdam, The Netherlands, 2000; Volume 40B, pp. 305–317.
40. Tang, P. Effect of Crack Healing of Bituminous Mortar and Concrete with Healing Agents. Master’s Thesis,Wuhan University of Technology, Wuhan, China, May 2018.
41. Riara, M.; Tang, P.; Mo, L.; Hong, W.; Chen, M.; Wu, S. Evaluation of moisture and temperature effect oncrack healing of asphalt mortar and mixtures using healing agents. Constr. Build. Mater. 2018, 177, 388–394.[CrossRef]
42. AASHTO TP105 Standard Method of Test for Determining the Fracture Energy of Asphalt Mixtures Using theSemicircular Bend Geometry (SCB); AASHTO: Washington, DC, USA, 2015.
43. Guo, M. Study on Mechanism and Multiscale Evaluation Method of Interfacial Interaction between AsphaltBinder and Mineral Aggregate. Ph.D. Thesis, Harbin Institute of Technology, Harbin, China, December 2015.
44. Wool, R.P.; O’Connor, K.M. A theory crack healing in polymers. J. Appl. Phys. 1981, 52, 5953–5963. [CrossRef]
© 2018 by the authors. Licensee MDPI, Basel, Switzerland. This article is an open accessarticle distributed under the terms and conditions of the Creative Commons Attribution(CC BY) license (http://creativecommons.org/licenses/by/4.0/).
216
materials
Article
Heating Characteristics and Induced HealingEfficiencies of Asphalt Mixture via Induction andMicrowave Heating
Quantao Liu 1,2, Cheng Chen 1, Bin Li 1, Yihan Sun 3 and Hechuan Li 1,*
1 State Key Laboratory of Silicate Materials for Architectures, Wuhan University of Technology,Luoshi Road 122, Wuhan 430070, China; [email protected] (Q.L.); [email protected] (C.C.);[email protected] (B.L.)
2 National & Local Joint Engineering Laboratory for Transportation and Civil Engineering Materials,Chongqing Jiaotong University, Chongqing 400074, China
3 Zhejiang Provincial Institute of Communications Planning, Design & Research, Hangzhou 310015, China;[email protected]
* Correspondence: [email protected]; Tel.: +86-155-2722-6172
Received: 7 May 2018; Accepted: 28 May 2018; Published: 29 May 2018
Abstract: This paper investigates the heating characteristics and induced healing efficiencies ofasphalt mixture containing steel fiber under induction heating and microwave heating. The heatingcharacteristics of an asphalt mixture with different heating methods were studied with an infraredcamera. The healing performance of the asphalt mixture specimens in different healing conditionswere investigated by observing the crack closure and testing the fracture resistance recovery afterhealing. The results showed that the heating speed at the surface of asphalt mixture with inductionheating was much higher than that with microwave machine heating, under a similar outputpower and the same method of radiation. While the temperature distribution within the asphaltmixture under induction heating was quite uneven, microwave heating resulted in a more uniformtemperature distribution. The effective heating depth of microwave heating is much higher than thatof induction heating. Gradient healing occurred within the sample heated with induction healing,while a uniform healing effect can be achieved with microwave heating.
Keywords: asphalt mixture; microwave heating; induction heating; effective heating depth;induced healing
1. Introduction
Asphalt is a typical temperature-sensitive material, and its self-healing ability is highly dependenton temperature. Heating has been used by many researchers to enhance the self-healing properties ofasphalt and asphalt mixtures [1–5]. Electromagnetic induction, microwave, and infrared heatingmethods were widely applied to increase the temperature of an asphalt mixture for healingpurpose [6,7]. A suitable temperature can lead to low viscosity and good flow performance of asphaltbinders, resulting in significant improvement of the self-healing properties of the asphalt binder andthe restoration of micro-structural damages within the asphalt mixture [8,9].
It has been demonstrated that induction heating can be used to improve the healing capability ofasphalt mixtures [10–12]. During induction heating, asphalt mortar containing conductive particles isexposed to an alternating electromagnetic field with a frequency in the order of kilohertz [13]. Inductionenergy heats the metallic fibers by means of high-frequency alternating electromagnetic fields,which are able to induce eddy currents in materials that are electrically and magnetically susceptible.The heat energy diffuses into the asphalt binder to increase the temperature. Asphalt mixture can be
Materials 2018, 11, 913; doi:10.3390/ma11060913 www.mdpi.com/journal/materials217
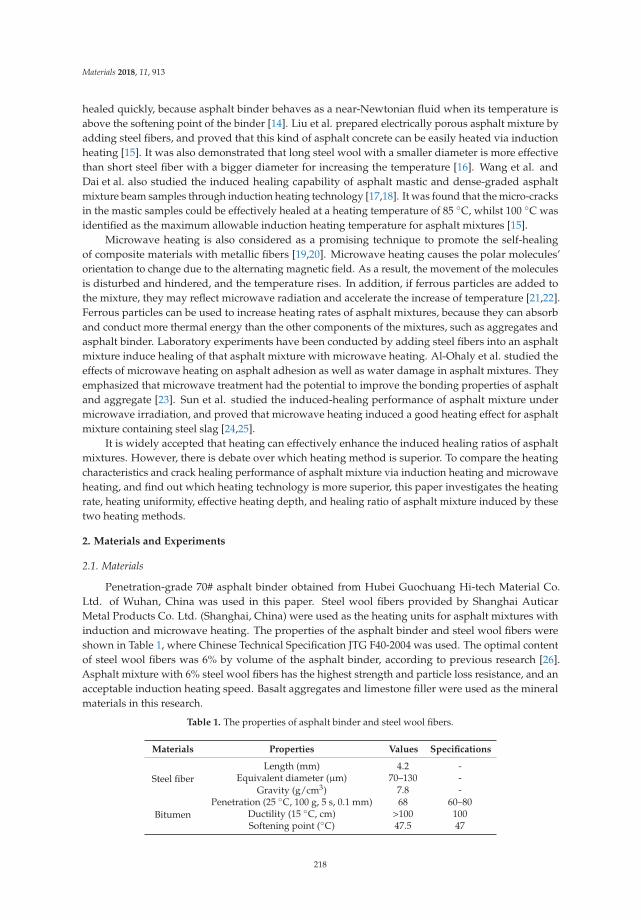
Materials 2018, 11, 913
healed quickly, because asphalt binder behaves as a near-Newtonian fluid when its temperature isabove the softening point of the binder [14]. Liu et al. prepared electrically porous asphalt mixture byadding steel fibers, and proved that this kind of asphalt concrete can be easily heated via inductionheating [15]. It was also demonstrated that long steel wool with a smaller diameter is more effectivethan short steel fiber with a bigger diameter for increasing the temperature [16]. Wang et al. andDai et al. also studied the induced healing capability of asphalt mastic and dense-graded asphaltmixture beam samples through induction heating technology [17,18]. It was found that the micro-cracksin the mastic samples could be effectively healed at a heating temperature of 85 ◦C, whilst 100 ◦C wasidentified as the maximum allowable induction heating temperature for asphalt mixtures [15].
Microwave heating is also considered as a promising technique to promote the self-healingof composite materials with metallic fibers [19,20]. Microwave heating causes the polar molecules’orientation to change due to the alternating magnetic field. As a result, the movement of the moleculesis disturbed and hindered, and the temperature rises. In addition, if ferrous particles are added tothe mixture, they may reflect microwave radiation and accelerate the increase of temperature [21,22].Ferrous particles can be used to increase heating rates of asphalt mixtures, because they can absorband conduct more thermal energy than the other components of the mixtures, such as aggregates andasphalt binder. Laboratory experiments have been conducted by adding steel fibers into an asphaltmixture induce healing of that asphalt mixture with microwave heating. Al-Ohaly et al. studied theeffects of microwave heating on asphalt adhesion as well as water damage in asphalt mixtures. Theyemphasized that microwave treatment had the potential to improve the bonding properties of asphaltand aggregate [23]. Sun et al. studied the induced-healing performance of asphalt mixture undermicrowave irradiation, and proved that microwave heating induced a good heating effect for asphaltmixture containing steel slag [24,25].
It is widely accepted that heating can effectively enhance the induced healing ratios of asphaltmixtures. However, there is debate over which heating method is superior. To compare the heatingcharacteristics and crack healing performance of asphalt mixture via induction heating and microwaveheating, and find out which heating technology is more superior, this paper investigates the heatingrate, heating uniformity, effective heating depth, and healing ratio of asphalt mixture induced by thesetwo heating methods.
2. Materials and Experiments
2.1. Materials
Penetration-grade 70# asphalt binder obtained from Hubei Guochuang Hi-tech Material Co.Ltd. of Wuhan, China was used in this paper. Steel wool fibers provided by Shanghai AuticarMetal Products Co. Ltd. (Shanghai, China) were used as the heating units for asphalt mixtures withinduction and microwave heating. The properties of the asphalt binder and steel wool fibers wereshown in Table 1, where Chinese Technical Specification JTG F40-2004 was used. The optimal contentof steel wool fibers was 6% by volume of the asphalt binder, according to previous research [26].Asphalt mixture with 6% steel wool fibers has the highest strength and particle loss resistance, and anacceptable induction heating speed. Basalt aggregates and limestone filler were used as the mineralmaterials in this research.
Table 1. The properties of asphalt binder and steel wool fibers.
Materials Properties Values Specifications
Steel fiberLength (mm) 4.2 -
Equivalent diameter (μm) 70–130 -Gravity (g/cm3) 7.8 -
BitumenPenetration (25 ◦C, 100 g, 5 s, 0.1 mm) 68 60–80
Ductility (15 ◦C, cm) >100 100Softening point (◦C) 47.5 47
218
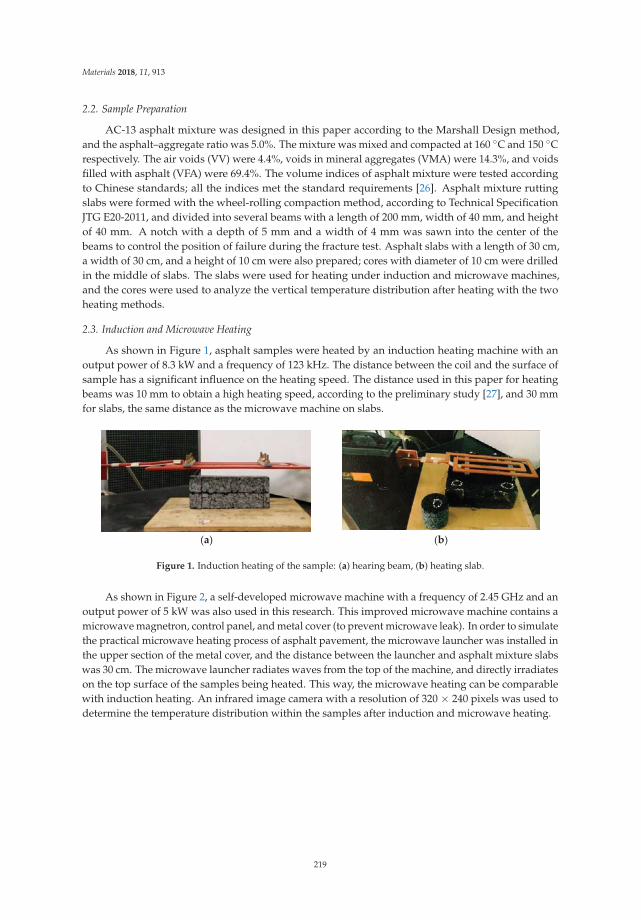
Materials 2018, 11, 913
2.2. Sample Preparation
AC-13 asphalt mixture was designed in this paper according to the Marshall Design method,and the asphalt–aggregate ratio was 5.0%. The mixture was mixed and compacted at 160 ◦C and 150 ◦Crespectively. The air voids (VV) were 4.4%, voids in mineral aggregates (VMA) were 14.3%, and voidsfilled with asphalt (VFA) were 69.4%. The volume indices of asphalt mixture were tested accordingto Chinese standards; all the indices met the standard requirements [26]. Asphalt mixture ruttingslabs were formed with the wheel-rolling compaction method, according to Technical SpecificationJTG E20-2011, and divided into several beams with a length of 200 mm, width of 40 mm, and heightof 40 mm. A notch with a depth of 5 mm and a width of 4 mm was sawn into the center of thebeams to control the position of failure during the fracture test. Asphalt slabs with a length of 30 cm,a width of 30 cm, and a height of 10 cm were also prepared; cores with diameter of 10 cm were drilledin the middle of slabs. The slabs were used for heating under induction and microwave machines,and the cores were used to analyze the vertical temperature distribution after heating with the twoheating methods.
2.3. Induction and Microwave Heating
As shown in Figure 1, asphalt samples were heated by an induction heating machine with anoutput power of 8.3 kW and a frequency of 123 kHz. The distance between the coil and the surface ofsample has a significant influence on the heating speed. The distance used in this paper for heatingbeams was 10 mm to obtain a high heating speed, according to the preliminary study [27], and 30 mmfor slabs, the same distance as the microwave machine on slabs.
(a) (b)
Figure 1. Induction heating of the sample: (a) hearing beam, (b) heating slab.
As shown in Figure 2, a self-developed microwave machine with a frequency of 2.45 GHz and anoutput power of 5 kW was also used in this research. This improved microwave machine contains amicrowave magnetron, control panel, and metal cover (to prevent microwave leak). In order to simulatethe practical microwave heating process of asphalt pavement, the microwave launcher was installed inthe upper section of the metal cover, and the distance between the launcher and asphalt mixture slabswas 30 cm. The microwave launcher radiates waves from the top of the machine, and directly irradiateson the top surface of the samples being heated. This way, the microwave heating can be comparablewith induction heating. An infrared image camera with a resolution of 320 × 240 pixels was used todetermine the temperature distribution within the samples after induction and microwave heating.
219
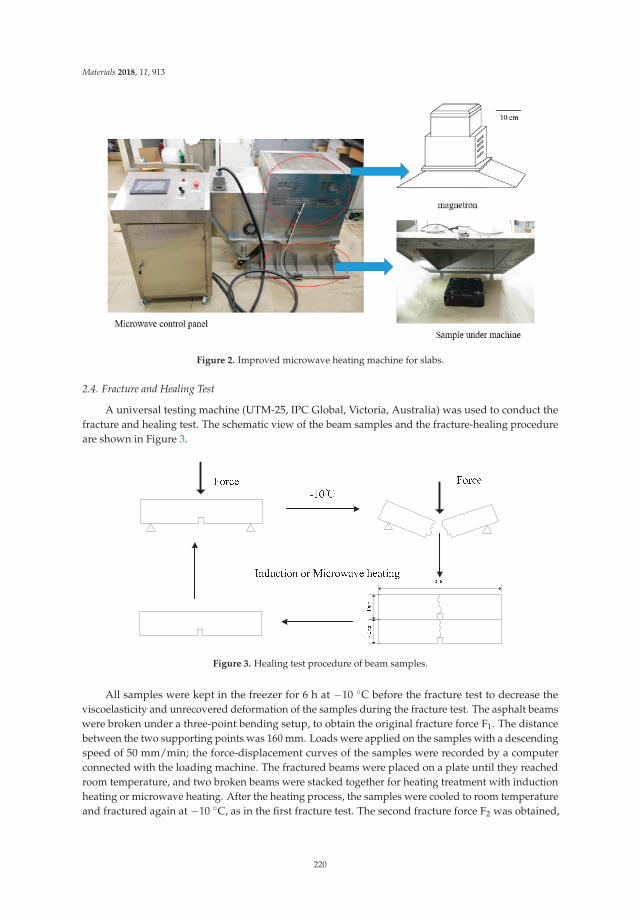
Materials 2018, 11, 913
Figure 2. Improved microwave heating machine for slabs.
2.4. Fracture and Healing Test
A universal testing machine (UTM-25, IPC Global, Victoria, Australia) was used to conduct thefracture and healing test. The schematic view of the beam samples and the fracture-healing procedureare shown in Figure 3.
Figure 3. Healing test procedure of beam samples.
All samples were kept in the freezer for 6 h at −10 ◦C before the fracture test to decrease theviscoelasticity and unrecovered deformation of the samples during the fracture test. The asphalt beamswere broken under a three-point bending setup, to obtain the original fracture force F1. The distancebetween the two supporting points was 160 mm. Loads were applied on the samples with a descendingspeed of 50 mm/min; the force-displacement curves of the samples were recorded by a computerconnected with the loading machine. The fractured beams were placed on a plate until they reachedroom temperature, and two broken beams were stacked together for heating treatment with inductionheating or microwave heating. After the heating process, the samples were cooled to room temperatureand fractured again at −10 ◦C, as in the first fracture test. The second fracture force F2 was obtained,
220
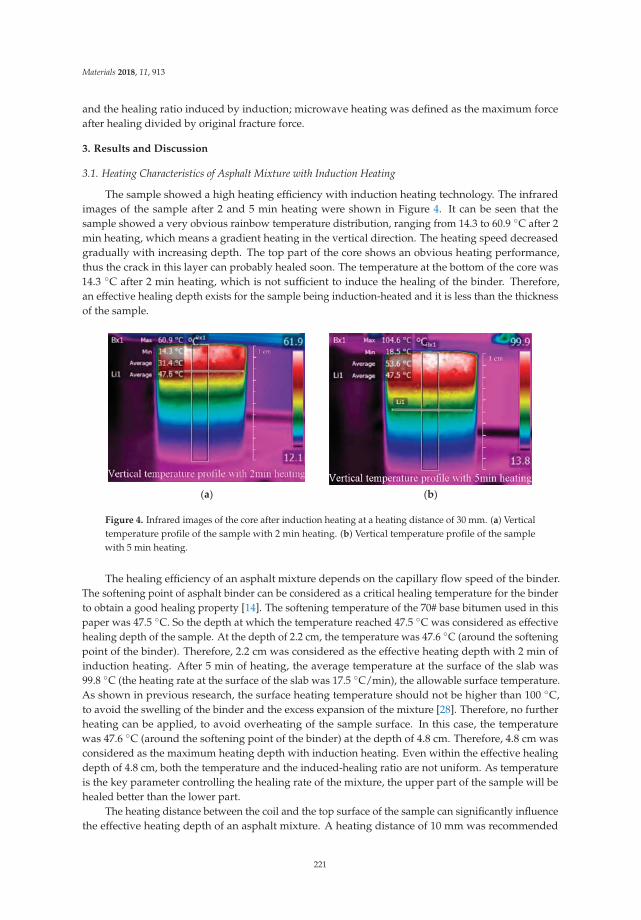
Materials 2018, 11, 913
and the healing ratio induced by induction; microwave heating was defined as the maximum forceafter healing divided by original fracture force.
3. Results and Discussion
3.1. Heating Characteristics of Asphalt Mixture with Induction Heating
The sample showed a high heating efficiency with induction heating technology. The infraredimages of the sample after 2 and 5 min heating were shown in Figure 4. It can be seen that thesample showed a very obvious rainbow temperature distribution, ranging from 14.3 to 60.9 ◦C after 2min heating, which means a gradient heating in the vertical direction. The heating speed decreasedgradually with increasing depth. The top part of the core shows an obvious heating performance,thus the crack in this layer can probably healed soon. The temperature at the bottom of the core was14.3 ◦C after 2 min heating, which is not sufficient to induce the healing of the binder. Therefore,an effective healing depth exists for the sample being induction-heated and it is less than the thicknessof the sample.
(a) (b)
Figure 4. Infrared images of the core after induction heating at a heating distance of 30 mm. (a) Verticaltemperature profile of the sample with 2 min heating. (b) Vertical temperature profile of the samplewith 5 min heating.
The healing efficiency of an asphalt mixture depends on the capillary flow speed of the binder.The softening point of asphalt binder can be considered as a critical healing temperature for the binderto obtain a good healing property [14]. The softening temperature of the 70# base bitumen used in thispaper was 47.5 ◦C. So the depth at which the temperature reached 47.5 ◦C was considered as effectivehealing depth of the sample. At the depth of 2.2 cm, the temperature was 47.6 ◦C (around the softeningpoint of the binder). Therefore, 2.2 cm was considered as the effective heating depth with 2 min ofinduction heating. After 5 min of heating, the average temperature at the surface of the slab was99.8 ◦C (the heating rate at the surface of the slab was 17.5 ◦C/min), the allowable surface temperature.As shown in previous research, the surface heating temperature should not be higher than 100 ◦C,to avoid the swelling of the binder and the excess expansion of the mixture [28]. Therefore, no furtherheating can be applied, to avoid overheating of the sample surface. In this case, the temperaturewas 47.6 ◦C (around the softening point of the binder) at the depth of 4.8 cm. Therefore, 4.8 cm wasconsidered as the maximum heating depth with induction heating. Even within the effective healingdepth of 4.8 cm, both the temperature and the induced-healing ratio are not uniform. As temperatureis the key parameter controlling the healing rate of the mixture, the upper part of the sample will behealed better than the lower part.
The heating distance between the coil and the top surface of the sample can significantly influencethe effective heating depth of an asphalt mixture. A heating distance of 10 mm was recommended
221
Materials 2018, 11, 913
for the practical application of induction heating on asphalt pavement [15]. The vertical temperaturedistribution and the effective heating depths of the asphalt concrete samples with different heatingperiods, at a heating distance of 10 mm, are shown in Figure 5. It can be seen that the effective healingdepth increased with the increase of the heating time. The effective healing depth was 10.9 mm afterheating for 20 s, while the depth increased to 60.1 mm after 100 s of heating. However, the surfacetemperature of the sample reached 129.9 ◦C after heating for 100 s, and the beam sample sufferedserious swelling deformation. At 60 s of heating, the sample surface approached its allowable heatingtemperature of 100 ◦C, and the effective depth of asphalt mixture with induction heating was around42.8 mm, which can be assumed to be the maximum effective depth of asphalt mixture at this heatingdistance. Extending the heating time further will result in excess expansion deformation of the mixture.It can be noted that a smaller heating distance between the coil and the sample (higher heating speed)resulted in a lower effective heating depth of the mixture.
80
70
60
50
40
30
20
10
020 40 60 80 100 120 140
Temperature(°C )
Dep
th(m
m)
0s 20s 40s 60s 80s 100s
47.5°CSoftening point temperature
Heating time (s) 20 40 60 80 100 Surface
temperature (°C) 55.5 79.2 98.7 115.4 129.9
Effective function range (mm) 10.9 32.6 42.8 50.7 60.1
Vertical temperature change rate (°C/mm) 0.35 0.61 0.83 1.01 1.15
Figure 5. Vertical temperature distribution of the samples at a heating distance of 10 mm.
3.2. Healing Performance of an Asphalt Mixture at Different Induction Heating Temperature Gradients
Figure 6a shows the infrared image of beams after 60 s induction heating at a heating distance of10 mm. It can be seen from the infrared image that sample showed a good heating effect, especiallyat the top layers. The temperature distribution presented a rainbow-like gradient, which shows anuneven heating effect in the vertical direction. It can also be seen that the average temperaturesof upper and lower beams were 72.1 ◦C and 39.4 ◦C, respectively, and the temperature differencebetween upper and lower beams reached 32.7 ◦C. The temperature distribution of the beams wasanalyzed from the infrared image shown in Figure 6b. It is worth noting that the ratio above 46.6 ◦C(around softening point of asphalt) was 55%, meaning that half of the cracks can be healed at thiscritical healing temperature, according to Tang’s results [14].
222
Materials 2018, 11, 913
Figure 6. The (a) infrared image and (b) temperature distribution of the beam sample with 60 sinduction heating.
In order to obtain the healing efficiency at different depths of the sample, two asphalt beams werestacked together during heating and separated after cooling. The damaged area was photographedin the same position before and after healing, to observe the healing phenomenon of the cracks.The maximum fracture forces before and after healing were measured, and the healing ratio of upperand lower beams was obtained. The healing behaviors of the mixture at three temperature gradients(60 ◦C, 80 ◦C, 100 ◦C, as well as surface temperature) were investigated.
The crack healing phenomenon of the upper beam at different temperatures under inductionheating is shown in Figure 7. The gradient healing phenomenon of the beam can be seen by comparingthe cracks before and after healing. When the surface temperature of the sample was 60 ◦C, the crackwas not healed, and can be seen clearly after heating due to low heating temperature and the resultantlimited healing effect. As shown in Figure 7b, the shallow crack disappeared when the sample surfacewas heated to 80 ◦C, while the crack in the lower part can still be seen clearly after healing. This meansthat the healing effect of the sample tends to deteriorate with as the depth increases. When thesurface temperature of the beam reached 100 ◦C, all cracks disappeared, but partial deformation canbe seen at the surface of beams. It should be noted that some broken aggregates cannot be healed,because induced healing only occurs within asphalt mastic due to asphalt flow. The broken of theaggregates will significantly affect the strength recovery ratio of the samples.
Table 2 shows the induction healing ratios of the samples with different surface heatingtemperatures. It can be seen from the healing efficiency results that the healing ratios of the upperbeams increased with the increase of the surface temperature. The healing ratio of the sample at surfacetemperatures of 60 ◦C, 80 ◦C, and 100 ◦C was 30.8%, 42.8%, and 65.7%, respectively. While there wasno healing with the lower beams until the surface temperature reached 100 ◦C. This is mainly relatedto the temperature gradient distribution. The asphalt binder in the lower beam had no ability to flowand heal the cracks at the lower surface temperatures of 60 ◦C and 80 ◦C. The temperature of the lowerbeam ranged from 32.4 ◦C to 47.0 ◦C when the surface temperature was 80 ◦C. As the temperature ofthe lower beams did not reach the softening point temperature of the binder, the cracks in the lowerbeams were almost not healed, and can be clearly seen after heating. The temperature of a smallpartial of the lower beam was higher than 47.5 ◦C when surface temperature reached 100 ◦C, so a lowhealing ratio of 12.6% was obtained in the lower beam. Based on the crack healing phenomenon andthe corresponding healing ratios, it can be concluded that the gradient healing phenomenon of asphaltmixture exists with induction heating, and is mainly related to temperature gradient distributionwithin the sample.
223
Materials 2018, 11, 913
(a)
(b)
(c)
Figure 7. Healing phenomenon at different temperatures under induction heating. (a) Crack healingphenomenon at 60 ◦C: crack not healed; (b) Crack healing phenomenon at 80 ◦C: crack partially healed;(c) Crack healing phenomenon at 100 ◦C: fully healed, except for broken stone.
Table 2. Induction healing ratios of the samples with different surface heating temperatures.
BeamsSurface Temperature
60 ◦C 80 ◦C 100 ◦C
Upper beam 30.8% 42.8% 65.7%Lower beam 0 0 12.6%
224
Materials 2018, 11, 913
3.3. Heating Characteristics of Asphalt Mixture with Microwave Heating
Figure 8 shows the infrared image of the asphalt slab and core after heating for 15 min withthe microwave machine. The average temperature of the slab surface reached 58.4 ◦C, and thetemperature of the core ranged from 50.2 ◦C to 33.2 ◦C from top to bottom. In the top 7 cm of the core,the temperature ranged from 40.2 ◦C to 50.2 ◦C, with an average temperature of 45.4 ◦C, showing amuch more uniform distribution than induction heating. The average temperature at the depth of 4 cmwas 46 ◦C, around the softening point of the binder. It can be considered that the effective depth of themixture was 4 cm after heating 15 min with the microwave machine.
(a) (b)
(c) (d)
Figure 8. Infrared images of slab and core after heating for 15 min with improved microwave machine.(a) Surface temperature profile of slab after heating; (b) Vertical temperature profile of core after heating;(c) Slab sample; (d) Core sample.
After heating for 25 min, the average surface temperature of the slab was 91.2 ◦C, and the heatingrate at the surface of the slab was 3.12 ◦C/min. The longitudinal temperature of the core ranged from55.8 to 82.1 ◦C, which was higher than the softening point of the binder. This means that the heatingdepth has increased to the whole depth of the sample with a surface temperature lower than 100 ◦C.It can be concluded then that extending the heating time can increase the effective heating depth ofasphalt mixture heated with the microwave equipment.
To sum up, the heating functional range of the asphalt mixture with the microwave machinewas more than 10 cm under 25 min of heating, which was much deeper than the maximum heatingdepth of induction heating (4.8 cm). However, the heating speed of the mixture under inductionheating (17.5 ◦C/min) was much higher than that with microwave heating (3.12 ◦C/min). In addition,the uniformity of microwave heating was much higher than that of induction heating, which has agradient distribution. The two heating methods have their own heating characteristics, which shouldbe considered in practical application.
225
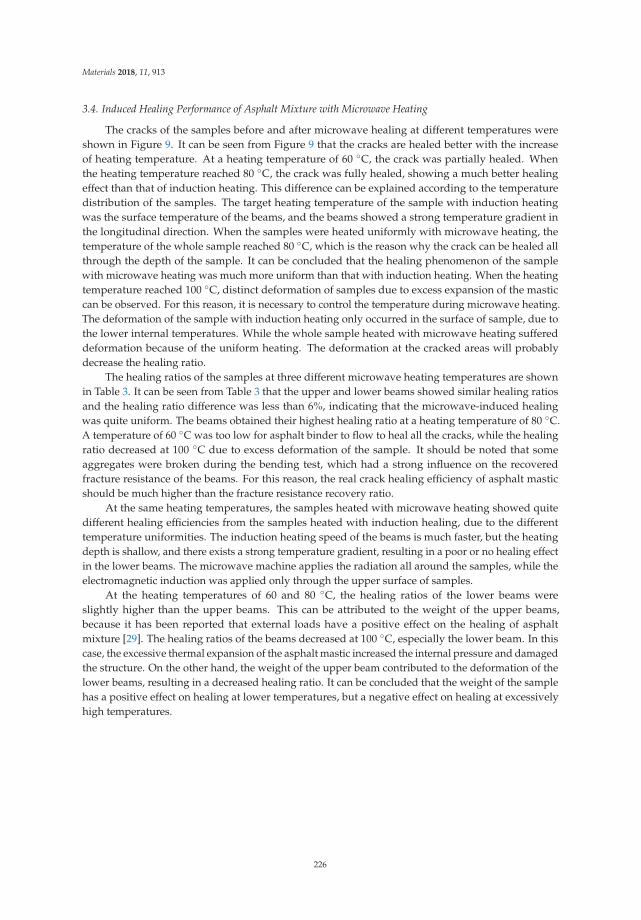
Materials 2018, 11, 913
3.4. Induced Healing Performance of Asphalt Mixture with Microwave Heating
The cracks of the samples before and after microwave healing at different temperatures wereshown in Figure 9. It can be seen from Figure 9 that the cracks are healed better with the increaseof heating temperature. At a heating temperature of 60 ◦C, the crack was partially healed. Whenthe heating temperature reached 80 ◦C, the crack was fully healed, showing a much better healingeffect than that of induction heating. This difference can be explained according to the temperaturedistribution of the samples. The target heating temperature of the sample with induction heatingwas the surface temperature of the beams, and the beams showed a strong temperature gradient inthe longitudinal direction. When the samples were heated uniformly with microwave heating, thetemperature of the whole sample reached 80 ◦C, which is the reason why the crack can be healed allthrough the depth of the sample. It can be concluded that the healing phenomenon of the samplewith microwave heating was much more uniform than that with induction heating. When the heatingtemperature reached 100 ◦C, distinct deformation of samples due to excess expansion of the masticcan be observed. For this reason, it is necessary to control the temperature during microwave heating.The deformation of the sample with induction heating only occurred in the surface of sample, due tothe lower internal temperatures. While the whole sample heated with microwave heating suffereddeformation because of the uniform heating. The deformation at the cracked areas will probablydecrease the healing ratio.
The healing ratios of the samples at three different microwave heating temperatures are shownin Table 3. It can be seen from Table 3 that the upper and lower beams showed similar healing ratiosand the healing ratio difference was less than 6%, indicating that the microwave-induced healingwas quite uniform. The beams obtained their highest healing ratio at a heating temperature of 80 ◦C.A temperature of 60 ◦C was too low for asphalt binder to flow to heal all the cracks, while the healingratio decreased at 100 ◦C due to excess deformation of the sample. It should be noted that someaggregates were broken during the bending test, which had a strong influence on the recoveredfracture resistance of the beams. For this reason, the real crack healing efficiency of asphalt masticshould be much higher than the fracture resistance recovery ratio.
At the same heating temperatures, the samples heated with microwave heating showed quitedifferent healing efficiencies from the samples heated with induction healing, due to the differenttemperature uniformities. The induction heating speed of the beams is much faster, but the heatingdepth is shallow, and there exists a strong temperature gradient, resulting in a poor or no healing effectin the lower beams. The microwave machine applies the radiation all around the samples, while theelectromagnetic induction was applied only through the upper surface of samples.
At the heating temperatures of 60 and 80 ◦C, the healing ratios of the lower beams wereslightly higher than the upper beams. This can be attributed to the weight of the upper beams,because it has been reported that external loads have a positive effect on the healing of asphaltmixture [29]. The healing ratios of the beams decreased at 100 ◦C, especially the lower beam. In thiscase, the excessive thermal expansion of the asphalt mastic increased the internal pressure and damagedthe structure. On the other hand, the weight of the upper beam contributed to the deformation of thelower beams, resulting in a decreased healing ratio. It can be concluded that the weight of the samplehas a positive effect on healing at lower temperatures, but a negative effect on healing at excessivelyhigh temperatures.
226
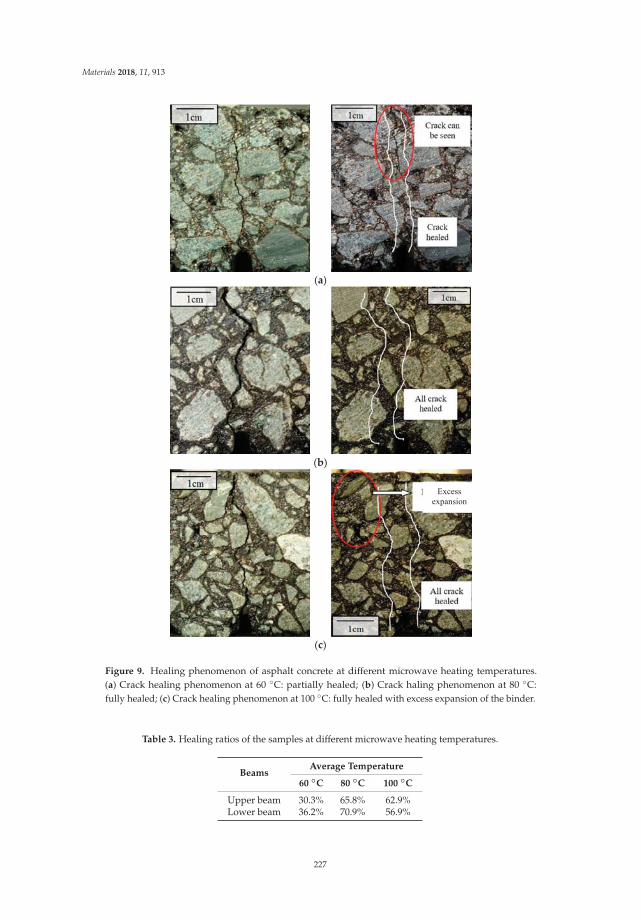
Materials 2018, 11, 913
(a)
(b)
(c)
Excess expansion
Figure 9. Healing phenomenon of asphalt concrete at different microwave heating temperatures.(a) Crack healing phenomenon at 60 ◦C: partially healed; (b) Crack haling phenomenon at 80 ◦C:fully healed; (c) Crack healing phenomenon at 100 ◦C: fully healed with excess expansion of the binder.
Table 3. Healing ratios of the samples at different microwave heating temperatures.
BeamsAverage Temperature
60 ◦C 80 ◦C 100 ◦C
Upper beam 30.3% 65.8% 62.9%Lower beam 36.2% 70.9% 56.9%
227
Materials 2018, 11, 913
4. Conclusions
The heating characteristics and induced healing efficiencies of asphalt mixture containing steelfibers under both induction and microwave heating were studied in this paper. Based on the results,the following conclusions can be drawn:
1. There is a strong temperature gradient through the thickness of asphalt sample heated withinduction heating. The temperature difference between the surface and bottom of the sampleincreased with the heating time. An effective heating depth exists for each induction heating time,and the maximum effective heating depth of asphalt mixture with induction heating is around48 mm, based on the allowable maximum surface temperature. It is inadvisable to increase theeffective heating depth of the sample by extending the induction heating time, which will resultin excess expansion deformation of the mixture.
2. Gradient healing phenomenon exists with the sample heated via induction heating, and is mainlyrelated to temperature gradient distribution. The upper part of the sample healed much betterthan the lower part.
3. Microwave heating is relatively uniform in a longitudinal distribution, and the heating uniformityis independent of heating time.
4. Microwave heating causes more uniform crack healing in an asphalt mixture. The weight of thesample has a positive effect on healing at lower temperatures, but a negative effect on healing atexcessively high temperatures.
5. Under the similar power and same radiation way, induction heating is fast and inhomogeneousin the longitudinal direction, while microwave heating is slow and uniform. The effective heatingdepth of microwave heating is much higher than that of induction heating.
Author Contributions: Conceptualization, Q.L. and Y.S.; Methodology, C.C. and B.L.; Formal Analysis, Q.L.;Investigation, B.L. and H.L.; Writing-Original Draft Preparation, B.L. and C.C.; Writing-Review & Editing, Q.L.and H.L..; Supervision, Y.S.; Project Administration, Q.L.; Funding Acquisition, Q.L.
Funding: This research was funded by National Natural Science Foundation of China (No. 51508433 andNo. 51778515); the National & Local Joint Engineering Laboratory for Transportation and Civil EngineeringMaterials, Chongqing Jiaotong University (No. LHSYS-2016-04); and the National Key Research and DevelopmentProgram of China (No. 2017YFE0111600). The authors gratefully acknowledge their financial support.
Conflicts of Interest: The authors declare no conflict of interest.
References
1. Norambuena-Contreras, J.; Garcia, Á. Self-healing of asphalt mixture by microwave and induction heating.Mater. Des. 2016, 106, 404–414. [CrossRef]
2. Liu, Q.; García, Á.; Schlangen, E.; van de Ven, M. Induction healing of asphalt mastic and porous asphaltconcrete. Constr. Build. Mater. 2010, 25, 3746–3752. [CrossRef]
3. Li, R.; Wang, C.; Wang, P.; Pei, J. Preparation of a novel flow improver and its viscosity-reducing effect onbitumen. Fuel 2016, 181, 935–941. [CrossRef]
4. Qiu, J.; van de Ven, M.F.C.; Wu, S.P.; Yu, J.Y.; Molenaar, A.A.A. Investigating the self healing capability ofbituminous binders. Road Mater. Pavement Des. 2009, 10, 81–94. [CrossRef]
5. García, Á.; Schlangen, E.; van de Ven, M.; Liu, Q. Induction heating of mastic containing conductive fibersand fillers. Constr. Build. Mater. 2009, 23, 3175–3181. [CrossRef]
6. Gallego, J.; del Val, M.A.; Contreras, V.; Paez, A. Heating asphalt mixtures with microwaves to promoteself-healing. Constr. Build. Mater. 2013, 42, 1–4. [CrossRef]
7. Gómez-Meijide, B.; Ajam, H.; Lastra-González, P.; García, Á. Effect of air voids content on asphalt self-healingvia induction and infrared heating. Constr. Build. Mater. 2016, 126, 957–966. [CrossRef]
8. Wang, Z.; Dai, Q.; Porter, D.; You, Z. Investigation of microwave healing performance of electricallyconductive carbon fiber modified asphalt mixture beams. Constr. Build. Mater. 2016, 126, 1012–1019.[CrossRef]
228
Materials 2018, 11, 913
9. Tan, Y.; Shan, L.; Kim, Y.R.; Underwood, B.S. Healing characteristics of asphalt binder. Constr. Build. Mater.2012, 27, 570–577. [CrossRef]
10. Liu, Q.; Wu, S.; Schlangen, E. Induction heating of asphalt mastic for crack control. Constr. Build. Mater. 2013,41, 345–351. [CrossRef]
11. García, Á.; Bueno, M.; Norambuena-Contreras, J.; Partl, M. Induction healing of dense asphalt concrete.Constr. Build. Mater. 2013, 49, 1–7. [CrossRef]
12. Ayar, P.; Moreno-Navarro, F.; Rubio-Gámez, M.C. The healing capability of asphalt pavements: A state ofthe art review. J. Clean. Prod. 2016, 113, 28–40. [CrossRef]
13. García, Á.E.; Schlangen, E.; van de Ven, M.; Liu, Q. A simple model to define induction heating in asphaltmastic. Constr. Build. Mater. 2012, 31, 38–46. [CrossRef]
14. Tang, J.; Liu, Q.; Wu, S.; Ye, Q.; Sun, Y.; Schlangen, E. Investigation of the optimal self-healing temperaturesand healing time of asphalt binders. Constr. Build. Mater. 2016, 113, 1029–1033. [CrossRef]
15. Liu, Q.; Schlangen, E.; van de Ven, M.; van Bochove, G.; van Montfort, J. Evaluation of the induction healingeffect of porous asphalt concrete through four point bending fatigue test. Constr. Build. Mater. 2012, 29,403–409. [CrossRef]
16. Liu, Q.; Schlangen, E.; van de Ven, M.; García, Á. Healing of porous asphalt concrete via induction heating.Road Mater. Pavement Des. 2010, 11, 527–542.
17. Wang, Z.; Dai, Q.; Yang, X. Integrated computational-experimental approach for evaluating recoveredfracture strength after induction healing of asphalt concrete beam samples. Constr. Build. Mater. 2016, 106,700–710. [CrossRef]
18. Dai, Q.; Wang, Z.; Hasan, M.R.M. Investigation of induction healing effects on electrically conductive asphaltmastic and asphalt concrete beams through fracture-healing tests. Constr. Build. Mater. 2013, 49, 729–737.[CrossRef]
19. Norambuena-Contreras, J.; Serpell, R.; Valdes, V.; Gonzalez, A.; Schlangen, E. Effect of fibres addition on thephysical and mechanical properties of asphalt mixtures with crack-healing purposes by microwave radiation.Constr. Build. Mater. 2016, 127, 369–382. [CrossRef]
20. Pamulapati, Y.; Elseifi, M.; Cooper, S.; Mohammad, L.; Elbagalati, O. Evaluation of self-healing of asphaltconcrete through induction heating and metallic fibers. Constr. Build. Mater. 2017, 146, 66–75. [CrossRef]
21. Collin, R.E. Foundations for Microwave Engineering; Willey: Hoboken, NJ, USA, 2000.22. Wang, Z.; Wang, H.; An, D.; Ai, T.; Zhao, P. Laboratory investigation on deicing characteristics of asphalt
mixtures using magnetite aggregate as microwave-absorbing materials. Constr. Build. Mater. 2016, 124,589–597. [CrossRef]
23. Alohaly, A.; Terrel, R.L. Effect of Microwave Heating on Adhesion and Moisture Damage of Asphalt Mixtures;National Research Council, Transportation Research Board: Washington, DC, USA, 1998.
24. Sun, Y.; Wu, S.; Liu, Q.; Li, B.; Fang, H.; Ye, Q. The healing properties of asphalt mixtures suffered moisturedamage. Constr. Build. Mater. 2016, 127, 418–424. [CrossRef]
25. Sun, Y.; Liu, Q.; Wu, S.; Shang, F. Microwave heating of steel slag asphalt mixture. Key Eng. Mater. 2014, 599,193–197. [CrossRef]
26. Yu, W. Study of the Induction Healing Behaviors of Hot Warm Mix Asphalt. Master’s Thesis, WuhanUniversity of Technology, Wuhan, China, 2017.
27. Liu, Q.; Yu, W.; Wu, S.P.; Schlangen, E.; Pan, P. A comparative study of the induction healing behaviors ofhot and warm mix asphalt. Constr. Build. Mater. 2017, 144, 663–670. [CrossRef]
28. Liu, Q.; Schlangen, E.; van de Ven, M. Induction Healing of porous asphalt concrete beams on an elasticfoundation. J. Mater. Civil Eng. 2013, 25, 880–885. [CrossRef]
29. Moreno-Navarro, F.; Ayar, P.; Sol-Sanchez, M.; Rubiogamez, M.C. Exploring the recovery of fatigue damage inbituminous mixtures at macro-crack level: the influence of temperature, time, and external loads. Road Mater.Pavement Des. 2017, 18, 293–303. [CrossRef]
© 2018 by the authors. Licensee MDPI, Basel, Switzerland. This article is an open accessarticle distributed under the terms and conditions of the Creative Commons Attribution(CC BY) license (http://creativecommons.org/licenses/by/4.0/).
229
materials
Article
Initial Self-Healing Temperatures of Asphalt MasticsBased on Flow Behavior Index
Chao Li, Shaopeng Wu *, Guanyu Tao and Yue Xiao ID
State Key Laboratory of Silicate Materials for Architectures, Wuhan University of Technology,Wuhan 430070, China; [email protected] (C.L.); [email protected] (G.T.); [email protected] (Y.X.)* Correspondence: [email protected]; Tel.: +86-027-8788-3743
Received: 3 April 2018; Accepted: 24 May 2018; Published: 29 May 2018
Abstract: Increasing temperature is a simple and convenient method to accelerate the self-healingprocess of bitumen. However, bitumen may not achieve the healing capability at lower temperature,and may be aged if temperature is too high. In addition, the bitumen is mixed with mineral filler andformed as asphalt mastic in asphalt concrete, so it is more accurate to study the initial self-healingfrom the perspective of asphalt mastic. The primary purpose of this research was to examine theinitial self-healing temperature of asphalt mastic, which was determined by the flow behavior indexobtained from the flow characteristics. Firstly, the texture and geometry characteristics of twofillers were analyzed, and then the initial self-healing temperature of nine types of asphalt mastic,pure bitumen (PB) and styrene-butadiene-styrene (SBS) modified bitumen were determined by theflow behavior index. Results demonstrate that the average standard deviation of gray-scale texturevalue of limestone filler (LF) is 21.24% lower than that of steel slag filler (SSF), showing that the steelslag filler has a better particle distribution and geometry characteristics. Also the initial self-healingtemperatures of asphalt mastics with 0.2, 0.4 and 0.6 LF-PB volume ratio are 46.5 ◦C, 47.2 ◦C and49.4 ◦C, which are 1.4 ◦C, 0.8 ◦C and 0.4 ◦C higher than that of asphalt mastics with SSF-PB, but notsuitable for the evaluation of asphalt mastic contained SBS modified bitumen because of uniquestructure and performance of SBS.
Keywords: initial self-healing temperature; asphalt mastic; flow behavior index; steel slag; limestone
1. Introduction
Due to the impacts of the natural environment and traffic load, asphalt pavement is prone togenerate rutting, cracking, looseness and other deformations during the service life [1,2]. At present,to recover these deformations, many maintenance techniques have been developed, such as slurryseal, micro surfacing, gravel seal and other pavement rehabilitation techniques [3–5]. However,these methods are passive maintenance after apparent or more serious damages of the road, not onlyconsuming high maintenance cost and affect the safety of pavement and traffic, but also causing a greatwaste of resources and environmental pollution. Therefore, it is urgent to develop other advancedpreventive maintenance technology to prolong the service life of asphalt concrete.
Asphalt concrete can be recognized as a type of self-healing materials according to severalresearches [6,7]. During the intermittent period of loading, some of the micro cracks in the asphaltconcrete can close/repair themselves automatically, resulting in the recovery of the asphalt pavementperformance [8,9]. The existing study suggests that the self-healing capacity of bitumen is associatedwith the temperature variation closely, while in higher temperature, the elastic recovery, viscousflow and molecular diffusion of bitumen can be accelerated to heal the cracks [6,10,11]. Nowadays,researchers have developed so many technics to realize the increase of temperature, such as inductionheating, microwave heating, infrared heating and so on. So it still needs efforts to find suitable
Materials 2018, 11, 917; doi:10.3390/ma11060917 www.mdpi.com/journal/materials230
Materials 2018, 11, 917
temperature to conduct heating process. Bituminous materials may not achieve the healing capabilityif temperature is below suitable self-healing temperature, also may be aged or deteriorate the pavementperformance if temperature is too high. According to the viscosity and flow characteristics of bitumen,researchers can select suitable temperature to be the initial self-healing temperature, and guide themaintenance work.
However, in the asphalt concrete, the bitumen is mixed with mineral filler and formed as asphaltmastic, which finally endows the asphalt concrete with self-healing properties, so it can be consideredas a more promising and appropriate perspective to study the viscosity and flow characteristics ofasphalt mastic to determine the initial self-healing temperature. According to the former researches,asphalt materials could be recognized as a viscoelastic material and act like a Newtonian liquid at hightemperature [12]. The Newtonian flow characteristic can be fitted through the following power lawrelationship [13,14]:
η∗ = m|ω|n−1 (1)
where:
ω represents frequency;η* represents complex viscosity;m and n represents the fitting parameters.
The dimensionless parameter n is also called the flow behavior index. The measured materialcorresponds to a Newtonian fluid while n equals 1.0, and appears a higher degree of pseudoplasticproperties while n is less than 1. If n transfers in the variation from 0.9 to 1.0, asphalt mastic can berecognized as near-Newtonian liquid which processes flow characteristic [15]. The temperature when nequals 0.9 was confirmed as the initial self-healing temperature in this research. In this paper, limestonefiller and steel slag filler were blended with pure bitumen and SBS (styrene-butadiene-styrene) modifiedbitumen by different filler-bitumen volume ratio to form nine types of asphalt mastic. Firstly, the textureand geometry characteristics of two fillers were analyzed in this research. Secondly, the initialself-healing temperature of nine types of asphalt mastic, pure bitumen and SBS modified bitumenwere determined by the flow behavior index. Research findings can be beneficial to maintenancework by selecting suitable temperature based on the type of filler, bitumen and filler-bitumen ration,so that contributing to save energy and reduce energy consumption. In addition, selecting suitabletemperature can delay the aging and prolong the service life of bituminous materials.
2. Materials and Methods
2.1. Raw Materials
The 60/80 penetration graded pure bitumen (PB) and styrene-butadiene-styrene (SBS) modifiedbitumen mixed by 60/80 penetration graded pure bitumen and 4.5% dosage of SBS particles whichsupplied by Guochuang Co., Ltd., Wuhan, Hubei, China, were applied in this research. Limestone filler(LF) was obtained from Agoura Stone Processing Factory, Inner Mongolia, China. While accordingto former research [16], steel slag filler (SSF) was prepared by milling raw Basic Oxygen Furnace(BOF) steel slags supplied by Wuhan Iron and Steel, Wuhan, China, whose original particle size was9.5–13.2 mm. The basic properties of raw materials were concluded in Table 1.
231
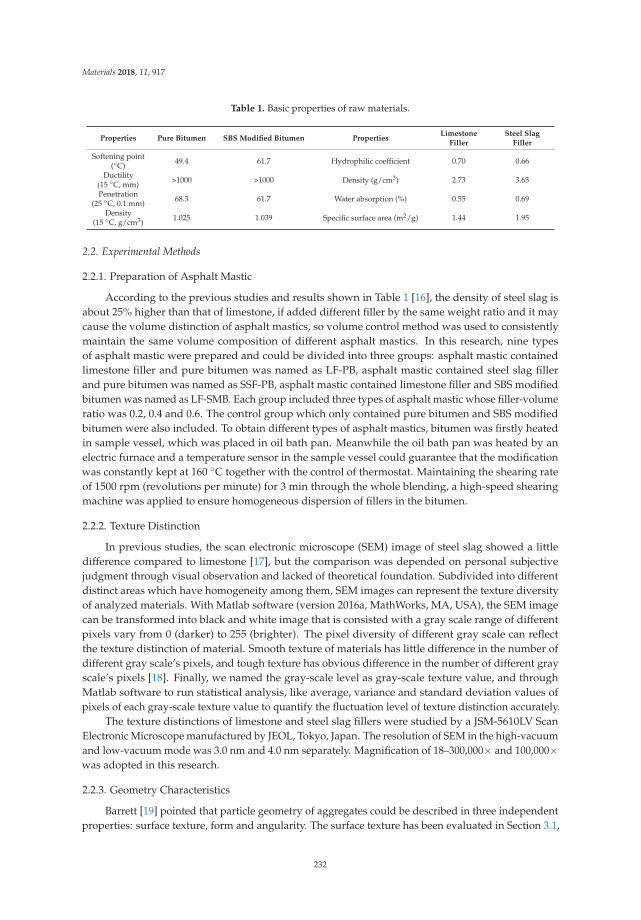
Materials 2018, 11, 917
Table 1. Basic properties of raw materials.
Properties Pure Bitumen SBS Modified Bitumen PropertiesLimestone
FillerSteel Slag
Filler
Softening point(◦C) 49.4 61.7 Hydrophilic coefficient 0.70 0.66
Ductility(15 ◦C, mm) >1000 >1000 Density (g/cm3) 2.73 3.65
Penetration(25 ◦C, 0.1 mm) 68.3 61.7 Water absorption (%) 0.55 0.69
Density(15 ◦C, g/cm3) 1.025 1.039 Specific surface area (m2/g) 1.44 1.95
2.2. Experimental Methods
2.2.1. Preparation of Asphalt Mastic
According to the previous studies and results shown in Table 1 [16], the density of steel slag isabout 25% higher than that of limestone, if added different filler by the same weight ratio and it maycause the volume distinction of asphalt mastics, so volume control method was used to consistentlymaintain the same volume composition of different asphalt mastics. In this research, nine typesof asphalt mastic were prepared and could be divided into three groups: asphalt mastic containedlimestone filler and pure bitumen was named as LF-PB, asphalt mastic contained steel slag fillerand pure bitumen was named as SSF-PB, asphalt mastic contained limestone filler and SBS modifiedbitumen was named as LF-SMB. Each group included three types of asphalt mastic whose filler-volumeratio was 0.2, 0.4 and 0.6. The control group which only contained pure bitumen and SBS modifiedbitumen were also included. To obtain different types of asphalt mastics, bitumen was firstly heatedin sample vessel, which was placed in oil bath pan. Meanwhile the oil bath pan was heated by anelectric furnace and a temperature sensor in the sample vessel could guarantee that the modificationwas constantly kept at 160 ◦C together with the control of thermostat. Maintaining the shearing rateof 1500 rpm (revolutions per minute) for 3 min through the whole blending, a high-speed shearingmachine was applied to ensure homogeneous dispersion of fillers in the bitumen.
2.2.2. Texture Distinction
In previous studies, the scan electronic microscope (SEM) image of steel slag showed a littledifference compared to limestone [17], but the comparison was depended on personal subjectivejudgment through visual observation and lacked of theoretical foundation. Subdivided into differentdistinct areas which have homogeneity among them, SEM images can represent the texture diversityof analyzed materials. With Matlab software (version 2016a, MathWorks, MA, USA), the SEM imagecan be transformed into black and white image that is consisted with a gray scale range of differentpixels vary from 0 (darker) to 255 (brighter). The pixel diversity of different gray scale can reflectthe texture distinction of material. Smooth texture of materials has little difference in the number ofdifferent gray scale’s pixels, and tough texture has obvious difference in the number of different grayscale’s pixels [18]. Finally, we named the gray-scale level as gray-scale texture value, and throughMatlab software to run statistical analysis, like average, variance and standard deviation values ofpixels of each gray-scale texture value to quantify the fluctuation level of texture distinction accurately.
The texture distinctions of limestone and steel slag fillers were studied by a JSM-5610LV ScanElectronic Microscope manufactured by JEOL, Tokyo, Japan. The resolution of SEM in the high-vacuumand low-vacuum mode was 3.0 nm and 4.0 nm separately. Magnification of 18–300,000× and 100,000×was adopted in this research.
2.2.3. Geometry Characteristics
Barrett [19] pointed that particle geometry of aggregates could be described in three independentproperties: surface texture, form and angularity. The surface texture has been evaluated in Section 3.1,
232
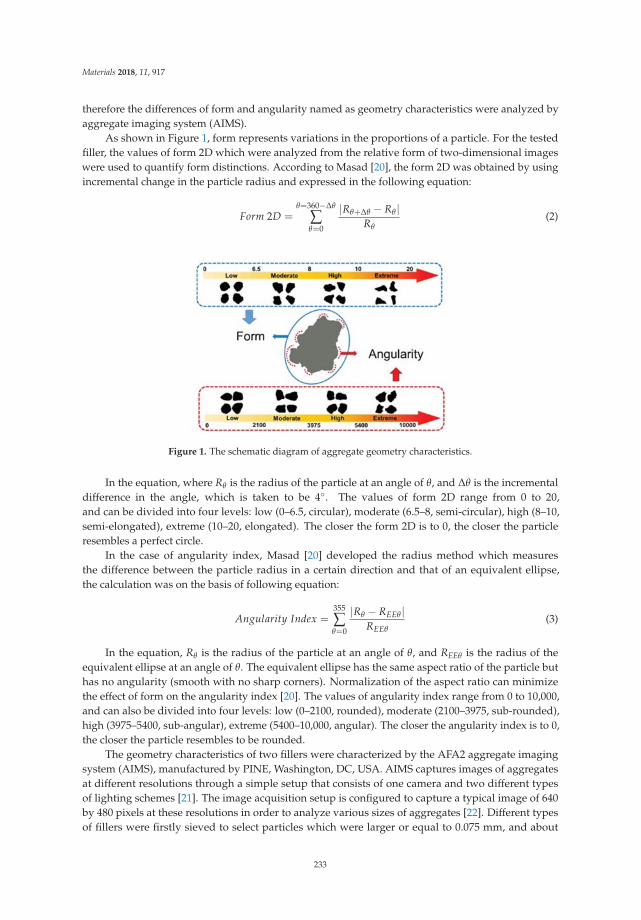
Materials 2018, 11, 917
therefore the differences of form and angularity named as geometry characteristics were analyzed byaggregate imaging system (AIMS).
As shown in Figure 1, form represents variations in the proportions of a particle. For the testedfiller, the values of form 2D which were analyzed from the relative form of two-dimensional imageswere used to quantify form distinctions. According to Masad [20], the form 2D was obtained by usingincremental change in the particle radius and expressed in the following equation:
Form 2D =θ=360−Δθ
∑θ=0
|Rθ+Δθ − Rθ |Rθ
(2)
Figure 1. The schematic diagram of aggregate geometry characteristics.
In the equation, where Rθ is the radius of the particle at an angle of θ, and Δθ is the incrementaldifference in the angle, which is taken to be 4◦. The values of form 2D range from 0 to 20,and can be divided into four levels: low (0–6.5, circular), moderate (6.5–8, semi-circular), high (8–10,semi-elongated), extreme (10–20, elongated). The closer the form 2D is to 0, the closer the particleresembles a perfect circle.
In the case of angularity index, Masad [20] developed the radius method which measuresthe difference between the particle radius in a certain direction and that of an equivalent ellipse,the calculation was on the basis of following equation:
Angularity Index =355
∑θ=0
|Rθ − REEθ |REEθ
(3)
In the equation, Rθ is the radius of the particle at an angle of θ, and REEθ is the radius of theequivalent ellipse at an angle of θ. The equivalent ellipse has the same aspect ratio of the particle buthas no angularity (smooth with no sharp corners). Normalization of the aspect ratio can minimizethe effect of form on the angularity index [20]. The values of angularity index range from 0 to 10,000,and can also be divided into four levels: low (0–2100, rounded), moderate (2100–3975, sub-rounded),high (3975–5400, sub-angular), extreme (5400–10,000, angular). The closer the angularity index is to 0,the closer the particle resembles to be rounded.
The geometry characteristics of two fillers were characterized by the AFA2 aggregate imagingsystem (AIMS), manufactured by PINE, Washington, DC, USA. AIMS captures images of aggregatesat different resolutions through a simple setup that consists of one camera and two different typesof lighting schemes [21]. The image acquisition setup is configured to capture a typical image of 640by 480 pixels at these resolutions in order to analyze various sizes of aggregates [22]. Different typesof fillers were firstly sieved to select particles which were larger or equal to 0.075 mm, and about
233
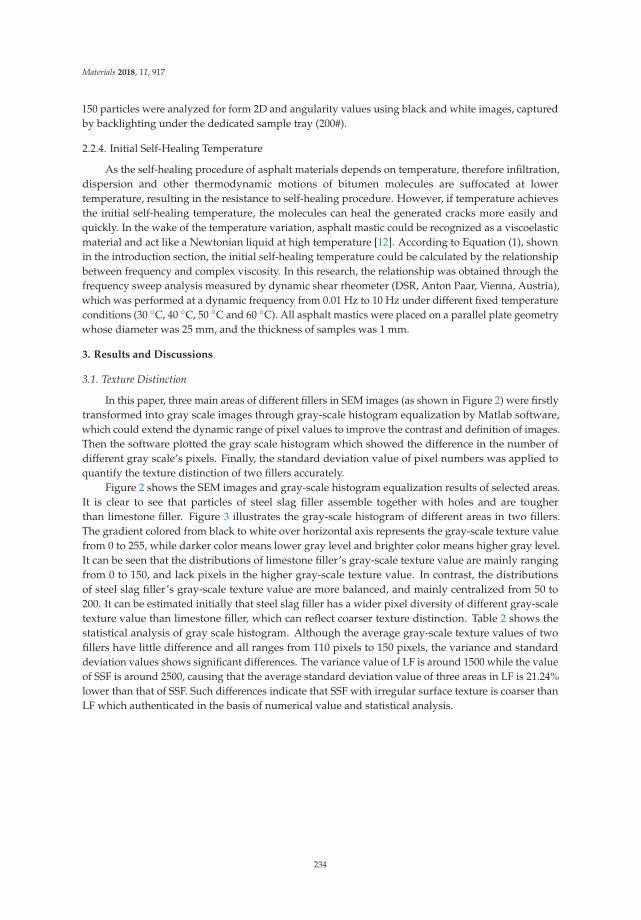
Materials 2018, 11, 917
150 particles were analyzed for form 2D and angularity values using black and white images, capturedby backlighting under the dedicated sample tray (200#).
2.2.4. Initial Self-Healing Temperature
As the self-healing procedure of asphalt materials depends on temperature, therefore infiltration,dispersion and other thermodynamic motions of bitumen molecules are suffocated at lowertemperature, resulting in the resistance to self-healing procedure. However, if temperature achievesthe initial self-healing temperature, the molecules can heal the generated cracks more easily andquickly. In the wake of the temperature variation, asphalt mastic could be recognized as a viscoelasticmaterial and act like a Newtonian liquid at high temperature [12]. According to Equation (1), shownin the introduction section, the initial self-healing temperature could be calculated by the relationshipbetween frequency and complex viscosity. In this research, the relationship was obtained through thefrequency sweep analysis measured by dynamic shear rheometer (DSR, Anton Paar, Vienna, Austria),which was performed at a dynamic frequency from 0.01 Hz to 10 Hz under different fixed temperatureconditions (30 ◦C, 40 ◦C, 50 ◦C and 60 ◦C). All asphalt mastics were placed on a parallel plate geometrywhose diameter was 25 mm, and the thickness of samples was 1 mm.
3. Results and Discussions
3.1. Texture Distinction
In this paper, three main areas of different fillers in SEM images (as shown in Figure 2) were firstlytransformed into gray scale images through gray-scale histogram equalization by Matlab software,which could extend the dynamic range of pixel values to improve the contrast and definition of images.Then the software plotted the gray scale histogram which showed the difference in the number ofdifferent gray scale’s pixels. Finally, the standard deviation value of pixel numbers was applied toquantify the texture distinction of two fillers accurately.
Figure 2 shows the SEM images and gray-scale histogram equalization results of selected areas.It is clear to see that particles of steel slag filler assemble together with holes and are tougherthan limestone filler. Figure 3 illustrates the gray-scale histogram of different areas in two fillers.The gradient colored from black to white over horizontal axis represents the gray-scale texture valuefrom 0 to 255, while darker color means lower gray level and brighter color means higher gray level.It can be seen that the distributions of limestone filler’s gray-scale texture value are mainly rangingfrom 0 to 150, and lack pixels in the higher gray-scale texture value. In contrast, the distributionsof steel slag filler’s gray-scale texture value are more balanced, and mainly centralized from 50 to200. It can be estimated initially that steel slag filler has a wider pixel diversity of different gray-scaletexture value than limestone filler, which can reflect coarser texture distinction. Table 2 shows thestatistical analysis of gray scale histogram. Although the average gray-scale texture values of twofillers have little difference and all ranges from 110 pixels to 150 pixels, the variance and standarddeviation values shows significant differences. The variance value of LF is around 1500 while the valueof SSF is around 2500, causing that the average standard deviation value of three areas in LF is 21.24%lower than that of SSF. Such differences indicate that SSF with irregular surface texture is coarser thanLF which authenticated in the basis of numerical value and statistical analysis.
234
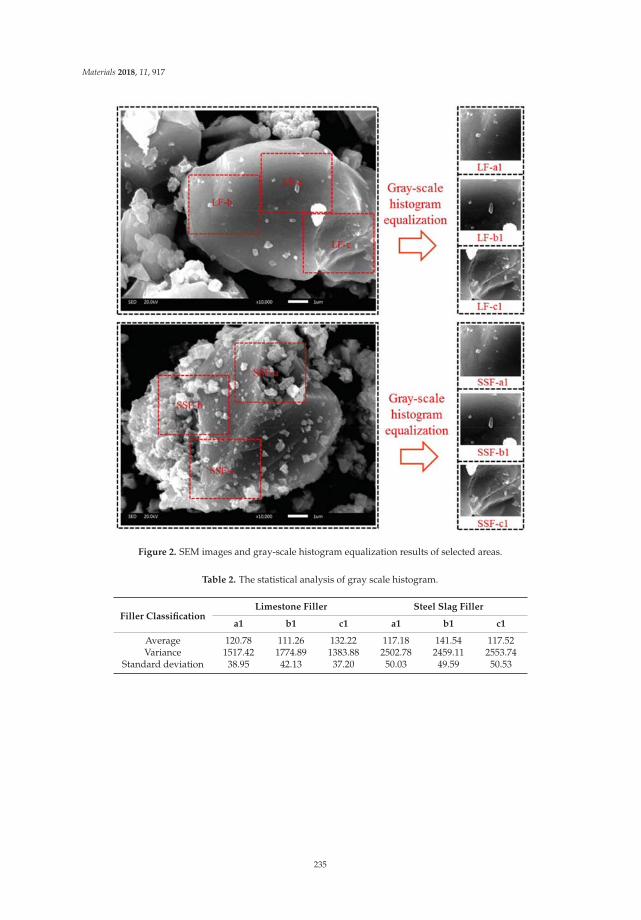
Materials 2018, 11, 917
Figure 2. SEM images and gray-scale histogram equalization results of selected areas.
Table 2. The statistical analysis of gray scale histogram.
Filler ClassificationLimestone Filler Steel Slag Filler
a1 b1 c1 a1 b1 c1
Average 120.78 111.26 132.22 117.18 141.54 117.52Variance 1517.42 1774.89 1383.88 2502.78 2459.11 2553.74
Standard deviation 38.95 42.13 37.20 50.03 49.59 50.53
235
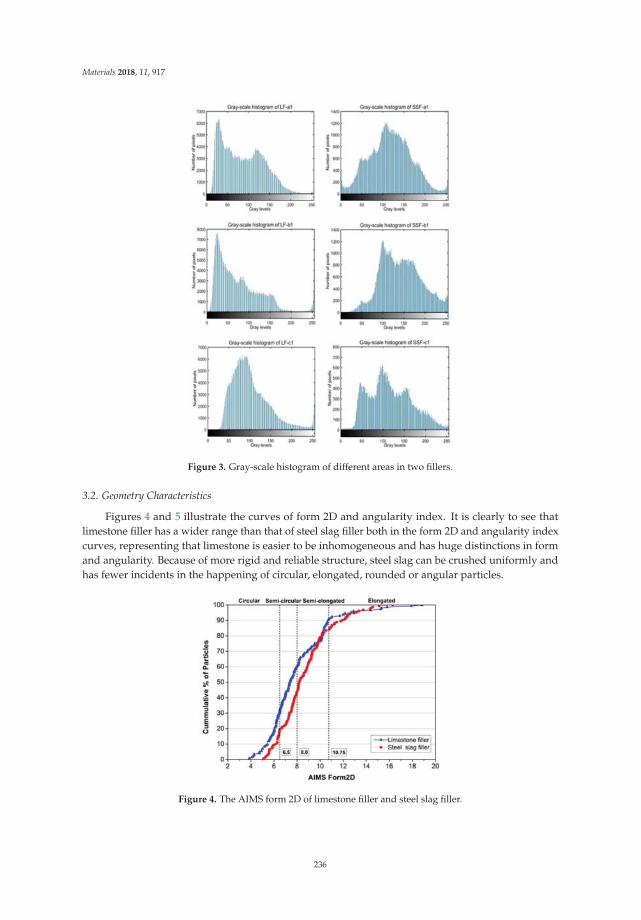
Materials 2018, 11, 917
Figure 3. Gray-scale histogram of different areas in two fillers.
3.2. Geometry Characteristics
Figures 4 and 5 illustrate the curves of form 2D and angularity index. It is clearly to see thatlimestone filler has a wider range than that of steel slag filler both in the form 2D and angularity indexcurves, representing that limestone is easier to be inhomogeneous and has huge distinctions in formand angularity. Because of more rigid and reliable structure, steel slag can be crushed uniformly andhas fewer incidents in the happening of circular, elongated, rounded or angular particles.
Figure 4. The AIMS form 2D of limestone filler and steel slag filler.
236
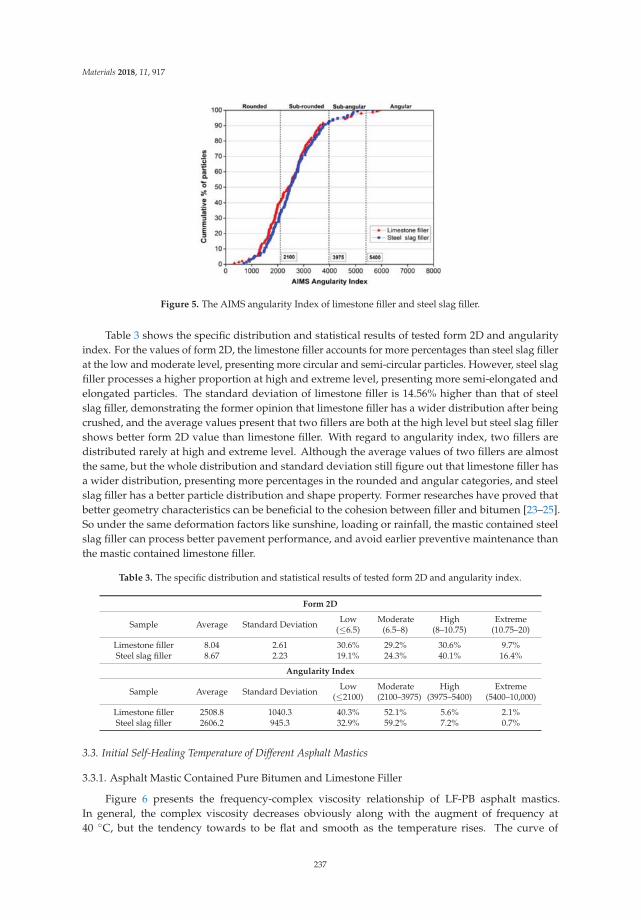
Materials 2018, 11, 917
Figure 5. The AIMS angularity Index of limestone filler and steel slag filler.
Table 3 shows the specific distribution and statistical results of tested form 2D and angularityindex. For the values of form 2D, the limestone filler accounts for more percentages than steel slag fillerat the low and moderate level, presenting more circular and semi-circular particles. However, steel slagfiller processes a higher proportion at high and extreme level, presenting more semi-elongated andelongated particles. The standard deviation of limestone filler is 14.56% higher than that of steelslag filler, demonstrating the former opinion that limestone filler has a wider distribution after beingcrushed, and the average values present that two fillers are both at the high level but steel slag fillershows better form 2D value than limestone filler. With regard to angularity index, two fillers aredistributed rarely at high and extreme level. Although the average values of two fillers are almostthe same, but the whole distribution and standard deviation still figure out that limestone filler hasa wider distribution, presenting more percentages in the rounded and angular categories, and steelslag filler has a better particle distribution and shape property. Former researches have proved thatbetter geometry characteristics can be beneficial to the cohesion between filler and bitumen [23–25].So under the same deformation factors like sunshine, loading or rainfall, the mastic contained steelslag filler can process better pavement performance, and avoid earlier preventive maintenance thanthe mastic contained limestone filler.
Table 3. The specific distribution and statistical results of tested form 2D and angularity index.
Form 2D
Sample Average Standard Deviation Low(≤6.5)
Moderate(6.5–8)
High(8–10.75)
Extreme(10.75–20)
Limestone filler 8.04 2.61 30.6% 29.2% 30.6% 9.7%Steel slag filler 8.67 2.23 19.1% 24.3% 40.1% 16.4%
Angularity Index
Sample Average Standard Deviation Low(≤2100)
Moderate(2100–3975)
High(3975–5400)
Extreme(5400–10,000)
Limestone filler 2508.8 1040.3 40.3% 52.1% 5.6% 2.1%Steel slag filler 2606.2 945.3 32.9% 59.2% 7.2% 0.7%
3.3. Initial Self-Healing Temperature of Different Asphalt Mastics
3.3.1. Asphalt Mastic Contained Pure Bitumen and Limestone Filler
Figure 6 presents the frequency-complex viscosity relationship of LF-PB asphalt mastics.In general, the complex viscosity decreases obviously along with the augment of frequency at40 ◦C, but the tendency towards to be flat and smooth as the temperature rises. The curve of
237
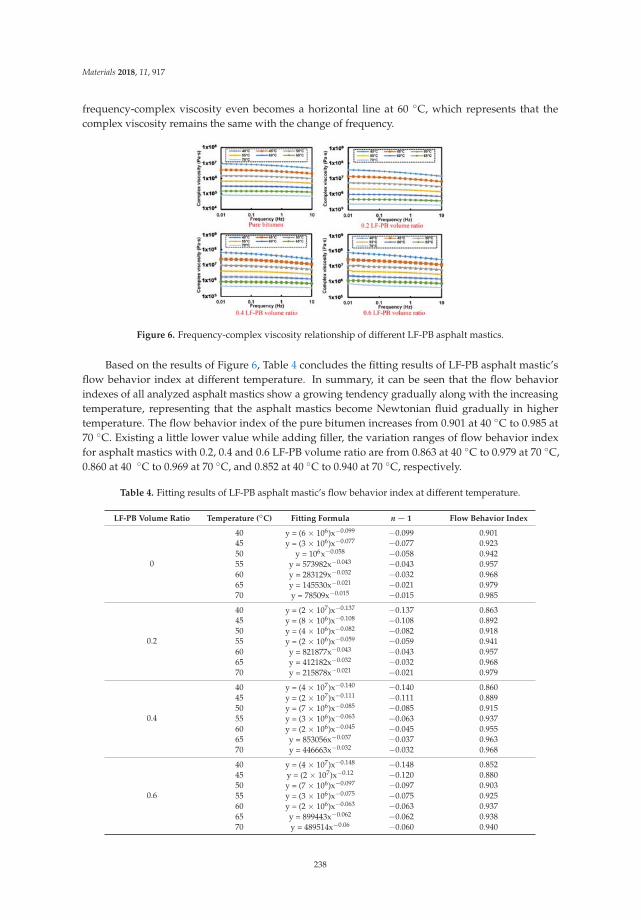
Materials 2018, 11, 917
frequency-complex viscosity even becomes a horizontal line at 60 ◦C, which represents that thecomplex viscosity remains the same with the change of frequency.
Figure 6. Frequency-complex viscosity relationship of different LF-PB asphalt mastics.
Based on the results of Figure 6, Table 4 concludes the fitting results of LF-PB asphalt mastic’sflow behavior index at different temperature. In summary, it can be seen that the flow behaviorindexes of all analyzed asphalt mastics show a growing tendency gradually along with the increasingtemperature, representing that the asphalt mastics become Newtonian fluid gradually in highertemperature. The flow behavior index of the pure bitumen increases from 0.901 at 40 ◦C to 0.985 at70 ◦C. Existing a little lower value while adding filler, the variation ranges of flow behavior indexfor asphalt mastics with 0.2, 0.4 and 0.6 LF-PB volume ratio are from 0.863 at 40 ◦C to 0.979 at 70 ◦C,0.860 at 40 ◦C to 0.969 at 70 ◦C, and 0.852 at 40 ◦C to 0.940 at 70 ◦C, respectively.
Table 4. Fitting results of LF-PB asphalt mastic’s flow behavior index at different temperature.
LF-PB Volume Ratio Temperature (◦C) Fitting Formula n − 1 Flow Behavior Index
0
40 y = (6 × 10⁶)x−0.099 −0.099 0.90145 y = (3 × 10⁶)x−0.077 −0.077 0.92350 y = 106x−0.058 −0.058 0.94255 y = 573982x−0.043 −0.043 0.95760 y = 283129x−0.032 −0.032 0.96865 y = 145530x−0.021 −0.021 0.97970 y = 78509x−0.015 −0.015 0.985
0.2
40 y = (2 × 10⁷)x−0.137 −0.137 0.86345 y = (8 × 10⁶)x−0.108 −0.108 0.89250 y = (4 × 10⁶)x−0.082 −0.082 0.91855 y = (2 × 10⁶)x−0.059 −0.059 0.94160 y = 821877x−0.043 −0.043 0.95765 y = 412182x−0.032 −0.032 0.96870 y = 215878x−0.021 −0.021 0.979
0.4
40 y = (4 × 10⁷)x−0.140 −0.140 0.86045 y = (2 × 10⁷)x−0.111 −0.111 0.88950 y = (7 × 10⁶)x−0.085 −0.085 0.91555 y = (3 × 10⁶)x−0.063 −0.063 0.93760 y = (2 × 10⁶)x−0.045 −0.045 0.95565 y = 853056x−0.037 −0.037 0.96370 y = 446663x−0.032 −0.032 0.968
0.6
40 y = (4 × 10⁷)x−0.148 −0.148 0.85245 y = (2 × 10⁷)x−0.12 −0.120 0.88050 y = (7 × 10⁶)x−0.097 −0.097 0.90355 y = (3 × 10⁶)x−0.075 −0.075 0.92560 y = (2 × 10⁶)x−0.063 −0.063 0.93765 y = 899443x−0.062 −0.062 0.93870 y = 489514x−0.06 −0.060 0.940
238
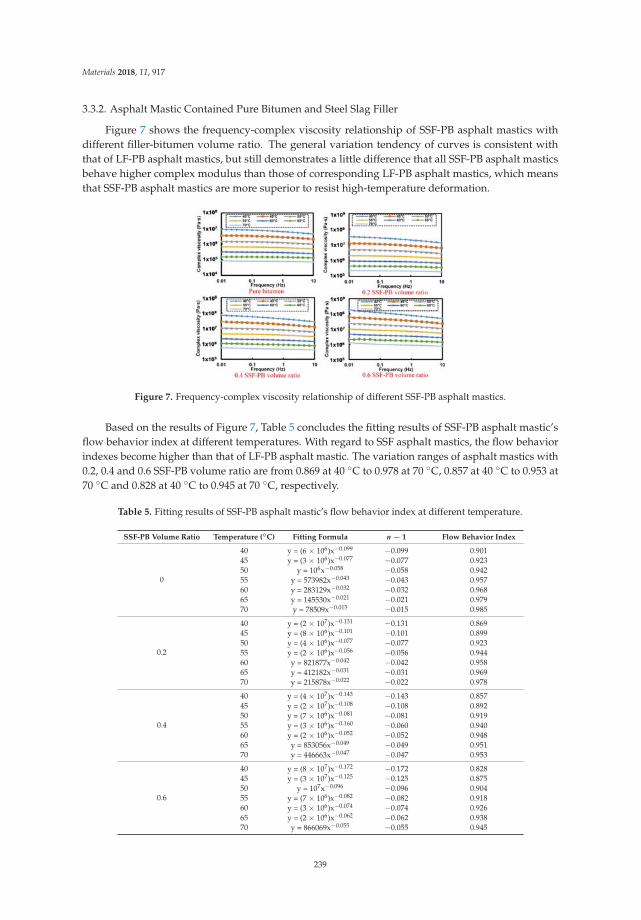
Materials 2018, 11, 917
3.3.2. Asphalt Mastic Contained Pure Bitumen and Steel Slag Filler
Figure 7 shows the frequency-complex viscosity relationship of SSF-PB asphalt mastics withdifferent filler-bitumen volume ratio. The general variation tendency of curves is consistent withthat of LF-PB asphalt mastics, but still demonstrates a little difference that all SSF-PB asphalt masticsbehave higher complex modulus than those of corresponding LF-PB asphalt mastics, which meansthat SSF-PB asphalt mastics are more superior to resist high-temperature deformation.
Figure 7. Frequency-complex viscosity relationship of different SSF-PB asphalt mastics.
Based on the results of Figure 7, Table 5 concludes the fitting results of SSF-PB asphalt mastic’sflow behavior index at different temperatures. With regard to SSF asphalt mastics, the flow behaviorindexes become higher than that of LF-PB asphalt mastic. The variation ranges of asphalt mastics with0.2, 0.4 and 0.6 SSF-PB volume ratio are from 0.869 at 40 ◦C to 0.978 at 70 ◦C, 0.857 at 40 ◦C to 0.953 at70 ◦C and 0.828 at 40 ◦C to 0.945 at 70 ◦C, respectively.
Table 5. Fitting results of SSF-PB asphalt mastic’s flow behavior index at different temperature.
SSF-PB Volume Ratio Temperature (◦C) Fitting Formula n − 1 Flow Behavior Index
0
40 y = (6 × 10⁶)x−0.099 −0.099 0.90145 y = (3 × 10⁶)x−0.077 −0.077 0.92350 y = 106x−0.058 −0.058 0.94255 y = 573982x−0.043 −0.043 0.95760 y = 283129x−0.032 −0.032 0.96865 y = 145530x−0.021 −0.021 0.97970 y = 78509x−0.015 −0.015 0.985
0.2
40 y = (2 × 10⁷)x−0.131 −0.131 0.86945 y = (8 × 10⁶)x−0.101 −0.101 0.89950 y = (4 × 10⁶)x−0.077 −0.077 0.92355 y = (2 × 10⁶)x−0.056 −0.056 0.94460 y = 821877x−0.042 −0.042 0.95865 y = 412182x−0.031 −0.031 0.96970 y = 215878x−0.022 −0.022 0.978
0.4
40 y = (4 × 10⁷)x−0.143 −0.143 0.85745 y = (2 × 10⁷)x−0.108 −0.108 0.89250 y = (7 × 10⁶)x−0.081 −0.081 0.91955 y = (3 × 10⁶)x−0.160 −0.060 0.94060 y = (2 × 10⁶)x−0.052 −0.052 0.94865 y = 853056x−0.049 −0.049 0.95170 y = 446663x−0.047 −0.047 0.953
0.6
40 y = (8 × 10⁷)x−0.172 −0.172 0.82845 y = (3 × 10⁷)x−0.125 −0.125 0.87550 y = 107x−0.096 −0.096 0.90455 y = (7 × 10⁶)x−0.082 −0.082 0.91860 y = (3 × 10⁶)x−0.074 −0.074 0.92665 y = (2 × 10⁶)x−0.062 −0.062 0.93870 y = 866069x−0.055 −0.055 0.945
239
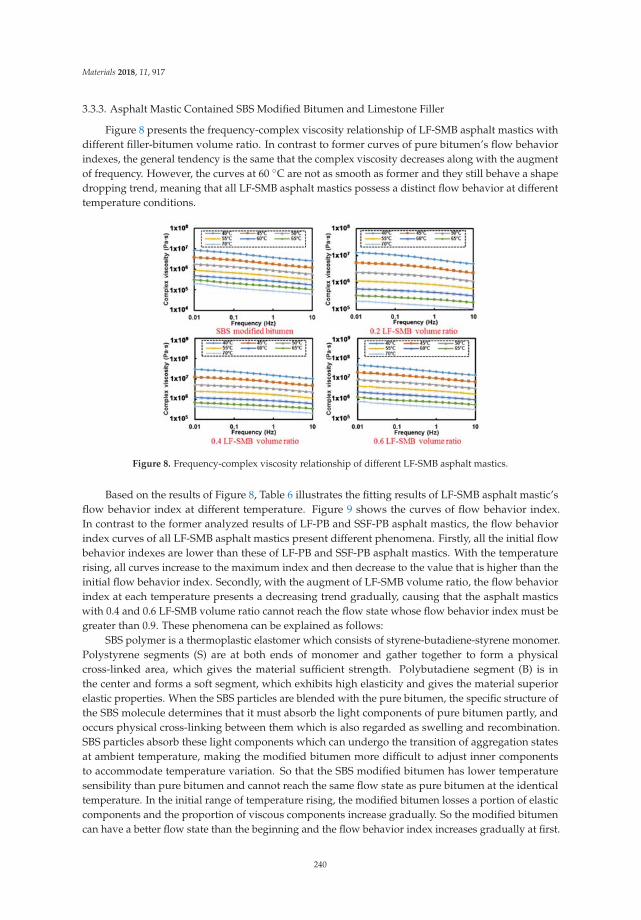
Materials 2018, 11, 917
3.3.3. Asphalt Mastic Contained SBS Modified Bitumen and Limestone Filler
Figure 8 presents the frequency-complex viscosity relationship of LF-SMB asphalt mastics withdifferent filler-bitumen volume ratio. In contrast to former curves of pure bitumen’s flow behaviorindexes, the general tendency is the same that the complex viscosity decreases along with the augmentof frequency. However, the curves at 60 ◦C are not as smooth as former and they still behave a shapedropping trend, meaning that all LF-SMB asphalt mastics possess a distinct flow behavior at differenttemperature conditions.
Figure 8. Frequency-complex viscosity relationship of different LF-SMB asphalt mastics.
Based on the results of Figure 8, Table 6 illustrates the fitting results of LF-SMB asphalt mastic’sflow behavior index at different temperature. Figure 9 shows the curves of flow behavior index.In contrast to the former analyzed results of LF-PB and SSF-PB asphalt mastics, the flow behaviorindex curves of all LF-SMB asphalt mastics present different phenomena. Firstly, all the initial flowbehavior indexes are lower than these of LF-PB and SSF-PB asphalt mastics. With the temperaturerising, all curves increase to the maximum index and then decrease to the value that is higher than theinitial flow behavior index. Secondly, with the augment of LF-SMB volume ratio, the flow behaviorindex at each temperature presents a decreasing trend gradually, causing that the asphalt masticswith 0.4 and 0.6 LF-SMB volume ratio cannot reach the flow state whose flow behavior index must begreater than 0.9. These phenomena can be explained as follows:
SBS polymer is a thermoplastic elastomer which consists of styrene-butadiene-styrene monomer.Polystyrene segments (S) are at both ends of monomer and gather together to form a physicalcross-linked area, which gives the material sufficient strength. Polybutadiene segment (B) is inthe center and forms a soft segment, which exhibits high elasticity and gives the material superiorelastic properties. When the SBS particles are blended with the pure bitumen, the specific structure ofthe SBS molecule determines that it must absorb the light components of pure bitumen partly, andoccurs physical cross-linking between them which is also regarded as swelling and recombination.SBS particles absorb these light components which can undergo the transition of aggregation statesat ambient temperature, making the modified bitumen more difficult to adjust inner componentsto accommodate temperature variation. So that the SBS modified bitumen has lower temperaturesensibility than pure bitumen and cannot reach the same flow state as pure bitumen at the identicaltemperature. In the initial range of temperature rising, the modified bitumen losses a portion of elasticcomponents and the proportion of viscous components increase gradually. So the modified bitumencan have a better flow state than the beginning and the flow behavior index increases gradually at first.
240
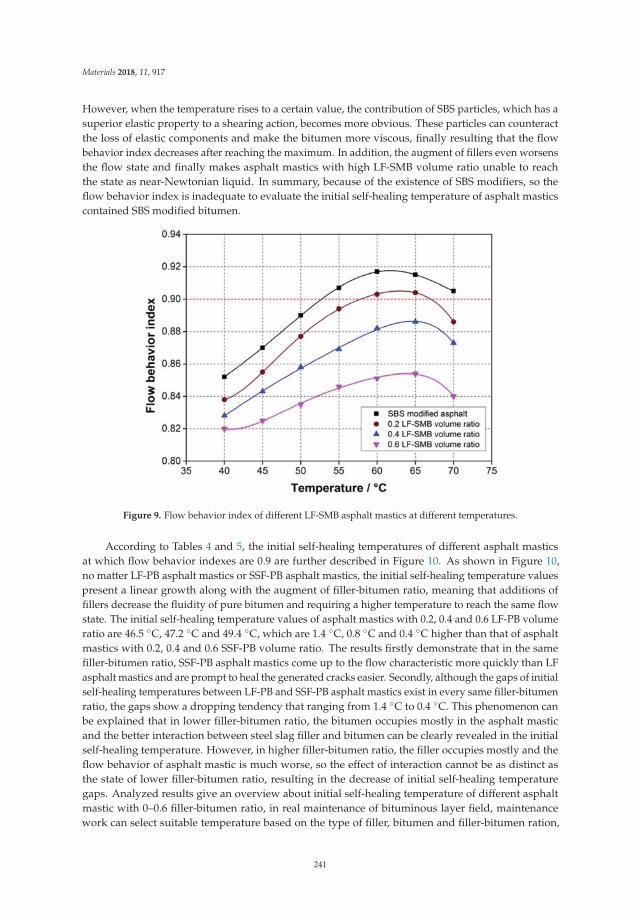
Materials 2018, 11, 917
However, when the temperature rises to a certain value, the contribution of SBS particles, which has asuperior elastic property to a shearing action, becomes more obvious. These particles can counteractthe loss of elastic components and make the bitumen more viscous, finally resulting that the flowbehavior index decreases after reaching the maximum. In addition, the augment of fillers even worsensthe flow state and finally makes asphalt mastics with high LF-SMB volume ratio unable to reachthe state as near-Newtonian liquid. In summary, because of the existence of SBS modifiers, so theflow behavior index is inadequate to evaluate the initial self-healing temperature of asphalt masticscontained SBS modified bitumen.
Figure 9. Flow behavior index of different LF-SMB asphalt mastics at different temperatures.
According to Tables 4 and 5, the initial self-healing temperatures of different asphalt masticsat which flow behavior indexes are 0.9 are further described in Figure 10. As shown in Figure 10,no matter LF-PB asphalt mastics or SSF-PB asphalt mastics, the initial self-healing temperature valuespresent a linear growth along with the augment of filler-bitumen ratio, meaning that additions offillers decrease the fluidity of pure bitumen and requiring a higher temperature to reach the same flowstate. The initial self-healing temperature values of asphalt mastics with 0.2, 0.4 and 0.6 LF-PB volumeratio are 46.5 ◦C, 47.2 ◦C and 49.4 ◦C, which are 1.4 ◦C, 0.8 ◦C and 0.4 ◦C higher than that of asphaltmastics with 0.2, 0.4 and 0.6 SSF-PB volume ratio. The results firstly demonstrate that in the samefiller-bitumen ratio, SSF-PB asphalt mastics come up to the flow characteristic more quickly than LFasphalt mastics and are prompt to heal the generated cracks easier. Secondly, although the gaps of initialself-healing temperatures between LF-PB and SSF-PB asphalt mastics exist in every same filler-bitumenratio, the gaps show a dropping tendency that ranging from 1.4 ◦C to 0.4 ◦C. This phenomenon canbe explained that in lower filler-bitumen ratio, the bitumen occupies mostly in the asphalt masticand the better interaction between steel slag filler and bitumen can be clearly revealed in the initialself-healing temperature. However, in higher filler-bitumen ratio, the filler occupies mostly and theflow behavior of asphalt mastic is much worse, so the effect of interaction cannot be as distinct asthe state of lower filler-bitumen ratio, resulting in the decrease of initial self-healing temperaturegaps. Analyzed results give an overview about initial self-healing temperature of different asphaltmastic with 0–0.6 filler-bitumen ratio, in real maintenance of bituminous layer field, maintenancework can select suitable temperature based on the type of filler, bitumen and filler-bitumen ration,
241
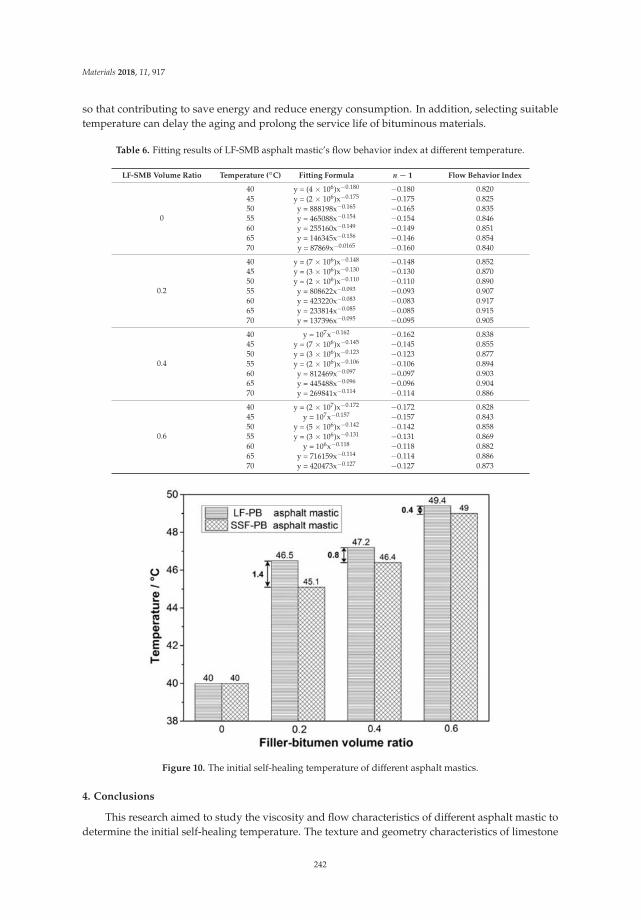
Materials 2018, 11, 917
so that contributing to save energy and reduce energy consumption. In addition, selecting suitabletemperature can delay the aging and prolong the service life of bituminous materials.
Table 6. Fitting results of LF-SMB asphalt mastic’s flow behavior index at different temperature.
LF-SMB Volume Ratio Temperature (◦C) Fitting Formula n − 1 Flow Behavior Index
0
40 y = (4 × 10⁶)x−0.180 −0.180 0.82045 y = (2 × 10⁶)x−0.175 −0.175 0.82550 y = 888198x−0.165 −0.165 0.83555 y = 465088x−0.154 −0.154 0.84660 y = 255160x−0.149 −0.149 0.85165 y = 146345x−0.156 −0.146 0.85470 y = 87869x−0.0165 −0.160 0.840
0.2
40 y = (7 × 10⁶)x−0.148 −0.148 0.85245 y = (3 × 10⁶)x−0.130 −0.130 0.87050 y = (2 × 10⁶)x−0.110 −0.110 0.89055 y = 808622x−0.093 −0.093 0.90760 y = 423220x−0.083 −0.083 0.91765 y = 233814x−0.085 −0.085 0.91570 y = 137396x−0.095 −0.095 0.905
0.4
40 y = 107x−0.162 −0.162 0.83845 y = (7 × 10⁶)x−0.145 −0.145 0.85550 y = (3 × 10⁶)x−0.123 −0.123 0.87755 y = (2 × 10⁶)x−0.106 −0.106 0.89460 y = 812469x−0.097 −0.097 0.90365 y = 445488x−0.096 −0.096 0.90470 y = 269841x−0.114 −0.114 0.886
0.6
40 y = (2 × 10⁷)x−0.172 −0.172 0.82845 y = 107x−0.157 −0.157 0.84350 y = (5 × 10⁶)x−0.142 −0.142 0.85855 y = (3 × 10⁶)x−0.131 −0.131 0.86960 y = 106x−0.118 −0.118 0.88265 y = 716159x−0.114 −0.114 0.88670 y = 420473x−0.127 −0.127 0.873
Figure 10. The initial self-healing temperature of different asphalt mastics.
4. Conclusions
This research aimed to study the viscosity and flow characteristics of different asphalt mastic todetermine the initial self-healing temperature. The texture and geometry characteristics of limestone
242
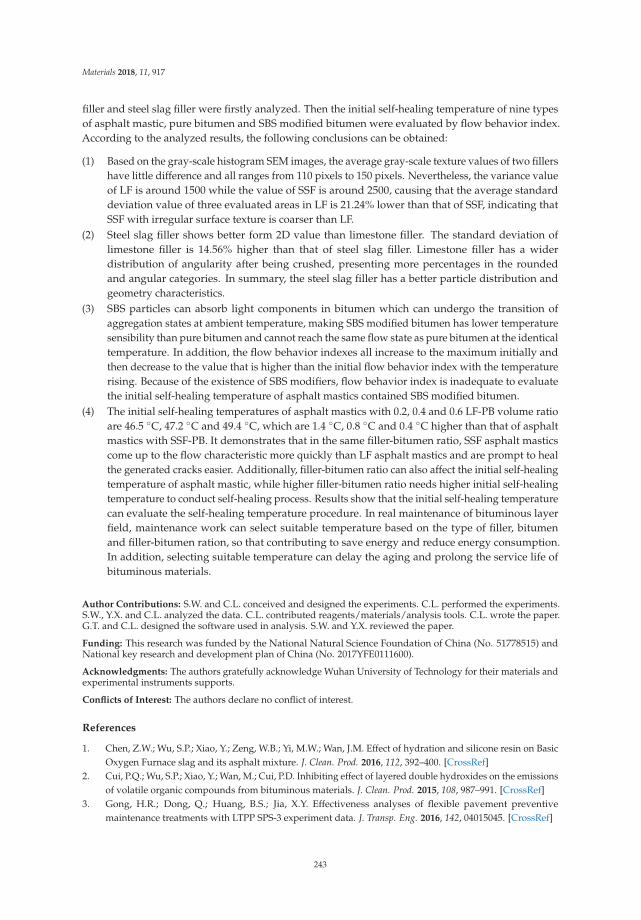
Materials 2018, 11, 917
filler and steel slag filler were firstly analyzed. Then the initial self-healing temperature of nine typesof asphalt mastic, pure bitumen and SBS modified bitumen were evaluated by flow behavior index.According to the analyzed results, the following conclusions can be obtained:
(1) Based on the gray-scale histogram SEM images, the average gray-scale texture values of two fillershave little difference and all ranges from 110 pixels to 150 pixels. Nevertheless, the variance valueof LF is around 1500 while the value of SSF is around 2500, causing that the average standarddeviation value of three evaluated areas in LF is 21.24% lower than that of SSF, indicating thatSSF with irregular surface texture is coarser than LF.
(2) Steel slag filler shows better form 2D value than limestone filler. The standard deviation oflimestone filler is 14.56% higher than that of steel slag filler. Limestone filler has a widerdistribution of angularity after being crushed, presenting more percentages in the roundedand angular categories. In summary, the steel slag filler has a better particle distribution andgeometry characteristics.
(3) SBS particles can absorb light components in bitumen which can undergo the transition ofaggregation states at ambient temperature, making SBS modified bitumen has lower temperaturesensibility than pure bitumen and cannot reach the same flow state as pure bitumen at the identicaltemperature. In addition, the flow behavior indexes all increase to the maximum initially andthen decrease to the value that is higher than the initial flow behavior index with the temperaturerising. Because of the existence of SBS modifiers, flow behavior index is inadequate to evaluatethe initial self-healing temperature of asphalt mastics contained SBS modified bitumen.
(4) The initial self-healing temperatures of asphalt mastics with 0.2, 0.4 and 0.6 LF-PB volume ratioare 46.5 ◦C, 47.2 ◦C and 49.4 ◦C, which are 1.4 ◦C, 0.8 ◦C and 0.4 ◦C higher than that of asphaltmastics with SSF-PB. It demonstrates that in the same filler-bitumen ratio, SSF asphalt masticscome up to the flow characteristic more quickly than LF asphalt mastics and are prompt to healthe generated cracks easier. Additionally, filler-bitumen ratio can also affect the initial self-healingtemperature of asphalt mastic, while higher filler-bitumen ratio needs higher initial self-healingtemperature to conduct self-healing process. Results show that the initial self-healing temperaturecan evaluate the self-healing temperature procedure. In real maintenance of bituminous layerfield, maintenance work can select suitable temperature based on the type of filler, bitumenand filler-bitumen ration, so that contributing to save energy and reduce energy consumption.In addition, selecting suitable temperature can delay the aging and prolong the service life ofbituminous materials.
Author Contributions: S.W. and C.L. conceived and designed the experiments. C.L. performed the experiments.S.W., Y.X. and C.L. analyzed the data. C.L. contributed reagents/materials/analysis tools. C.L. wrote the paper.G.T. and C.L. designed the software used in analysis. S.W. and Y.X. reviewed the paper.
Funding: This research was funded by the National Natural Science Foundation of China (No. 51778515) andNational key research and development plan of China (No. 2017YFE0111600).
Acknowledgments: The authors gratefully acknowledge Wuhan University of Technology for their materials andexperimental instruments supports.
Conflicts of Interest: The authors declare no conflict of interest.
References
1. Chen, Z.W.; Wu, S.P.; Xiao, Y.; Zeng, W.B.; Yi, M.W.; Wan, J.M. Effect of hydration and silicone resin on BasicOxygen Furnace slag and its asphalt mixture. J. Clean. Prod. 2016, 112, 392–400. [CrossRef]
2. Cui, P.Q.; Wu, S.P.; Xiao, Y.; Wan, M.; Cui, P.D. Inhibiting effect of layered double hydroxides on the emissionsof volatile organic compounds from bituminous materials. J. Clean. Prod. 2015, 108, 987–991. [CrossRef]
3. Gong, H.R.; Dong, Q.; Huang, B.S.; Jia, X.Y. Effectiveness analyses of flexible pavement preventivemaintenance treatments with LTPP SPS-3 experiment data. J. Transp. Eng. 2016, 142, 04015045. [CrossRef]
243
Materials 2018, 11, 917
4. Robati, M.; Carter, A.; Lommerts, B.J.; Cotiuga, I.; Perraton, D. New Colored Micro-surfacing Formulationwith Improved Durability and Performance. In Proceedings of the International Conference on Asphalt,Pevement Engineering and Infrastructure, Liverpool, UK, 26–27 February 2014.
5. Barcena, R.; Martin, A.E.; Hazlett, D. Performance-graded binder specification for surface treatments. Transp.Res. Rec. J. Transp. Res. Board 2002, 1810, 63–71. [CrossRef]
6. Garcia, A.; Norambuena-Contreras, J.; Partl, M.N. Experimental evaluation of dense asphalt concreteproperties for induction heating purposes. Constr. Build. Mater. 2013, 46, 48–54. [CrossRef]
7. Demenois, J.; Carriconde, F.; Bonaventure, P.; Maeght, J.L.; Stoke, A.; Rey, F. Impact of plant root functionaltraits and associated mycorrhizas on the aggregate stability of a tropical Ferralsol. Geoderma 2018, 312, 6–16.[CrossRef]
8. Garcia, A. Self-healing of open cracks in asphalt mastic. Fuel 2012, 93, 264–272. [CrossRef]9. Sun, Y.H.; Wu, S.P.; Liu, Q.T.; Li, B.; Fang, H.; Ye, Q.S. The healing properties of asphalt mixtures suffered
moisture damage. Constr. Build. Mater. 2016, 127, 418–424. [CrossRef]10. Qiu, J.; van de Ven, M.F.C.; Wu, S.; Yu, J.; Molenaar, A.A.A. Investigating the self healing capability of
bituminous binders. Road Mater. Pavement 2009, 10, 81–94. [CrossRef]11. Sun, D.; Zhang, L.; Liang, G. Review on self-healing behavior of asphalt concrete(1) mechanism and
characterization methods of self-healing behavior. Pet. Asph. 2011, 5, 4.12. Garcia-Morales, M.; Partal, P.; Navarro, F.J.; Martinez-Boza, F.; Gallegos, C.; Gonzalez, N.; Gonzalez, O.;
Munoz, M.E. Viscous properties and microstructure of recycled eva modified bitumen. Fuel 2004, 83, 31–38.[CrossRef]
13. Sung, Y.T.; Kum, C.K.; Lee, H.S.; Kim, J.S.; Yoon, H.G.; Kim, W.N. Effects of crystallinity and crosslinking onthe thermal and rheological properties of ethylene vinyl acetate copolymer. Polymer 2005, 46, 11844–11848.[CrossRef]
14. Carreau, P.J. Rheology of Polymeric Systems: Principles and Application; Hanser Publishers: München, Germany, 1997.15. Heyes, D.M.; Mitchell, P.J.; Visscher, P.B. Viscoelasticity and near-newtonian behaviour of concentrated
dispersions by Brownian dynamics simulations. In Trends in Colloid and Interface Science VIII; Springer: Berlin,Germany, 1994; pp. 179–182.
16. Li, C.; Chen, Z.W.; Wu, S.P.; Li, B.; Xie, J.; Xiao, Y. Effects of steel slag fillers on the rheological properties ofasphalt mastic. Constr. Build. Mater. 2017, 145, 383–391. [CrossRef]
17. Li, C.; Xiao, Y.; Chen, Z.W.; Wu, S.P. Crack resistance of asphalt mixture with steel slag powder. Emerg. Mater.Res. 2017, 6, 214–218. [CrossRef]
18. Baqersad, M.; Hamedi, A.; Mohammadafzali, M.; Ali, H. Asphalt mmixture segregation detection: Digitalimage processing approach. Adv. Mater. Sci. Eng. 2017, 2017, 9493408. [CrossRef]
19. Barrett, P.J. The shape of rock particles, a critical review. Sedimentology 1980, 27, 291–303. [CrossRef]20. Masad, E.; Olcott, D.; White, T.; Tashman, L. Correlation of fine aggregate imaging shape indices with asphalt
mixture performance. Geomaterials 2001, 1757, 148–156. [CrossRef]21. Masad, E.A. Aggregate Imaging System (AIMS): Basics and Applications; Texas Transportation Institute: College
Station, TX, USA, 2005.22. Gudimettla, J.; Myers, L.A. AIMS: The Future in Rapid, Automated Aggregate Shape and Texture
Measurement. In Proceedings of the Conference of the Canadian Technical Asphalt Association,Charlottetown, PE, Canada, 5–8 November 2006.
23. Wang, H.; Al-Qadi, I.L.; Faheem, A.F.; Bahia, H.U.; Yang, S.H.; Reinke, G.H. Effect of mineral fillercharacteristics on asphalt mastic and mixture rutting potential. Transp. Res. Rec. 2011, 2208, 33–39. [CrossRef]
24. Chen, Z.W.; Xie, J.; Xiao, Y.; Chen, J.Y.; Wu, S.P. Characteristics of bonding behavior between basic oxygenfurnace slag and asphalt binder. Constr. Build. Mater. 2014, 64, 60–66. [CrossRef]
25. Cardone, F.; Frigio, F.; Ferrotti, G.; Canestrari, F. Influence of mineral fillers on the rheological response ofpolymer-modified bitumens and mastics. J. Traffic Transp. Eng. 2015, 2, 373–381. [CrossRef]
© 2018 by the authors. Licensee MDPI, Basel, Switzerland. This article is an open accessarticle distributed under the terms and conditions of the Creative Commons Attribution(CC BY) license (http://creativecommons.org/licenses/by/4.0/).
244

MDPISt. Alban-Anlage 66
4052 BaselSwitzerland
Tel. +41 61 683 77 34Fax +41 61 302 89 18
www.mdpi.com
Materials Editorial OfficeE-mail: [email protected]
www.mdpi.com/journal/materials


MDPI St. Alban-Anlage 66 4052 Basel Switzerland
Tel: +41 61 683 77 34 Fax: +41 61 302 89 18
www.mdpi.com ISBN 978-3-03921-015-2


