Embed Size (px)
Citation preview


VOLUME I RECEPTORS -- MAMMALS
BIRDS
VOLUME II RECEPTORS -- BIRDS
VOLUME III RECEPTORS -- FISH, LITTORAL, BENTHOS
VOLUME IV RECEPTORS -- FISH, LITTORAL, BENTHOS
VOLUME V RECEPTORS -- MICROBIOLOGY
CONTAMINANT BASELINES
VOLUME VI EFFECTS
VOLUME VII TRANSPORT
VOLUME VIII TRANSPORT
VOLUME IX HAZARDS
VOLUME X HAZARDS
DATA MANAGEMENT

EnvironmentalAssessmentof theAlaskanContinental ShelfAnnual Reports of Principal Investigatorsfor the year ending March 1979
Volume III. Receptors - Fish, Littoral, Benthos
Outer Continental Shelf Environmental Assessment ProgramBoulder, Colorado
October 1979
U.S. DEPARTMENT OF COMMERCENational Oceanic and Atmospheric Administration
U.S. DEPARTMENT OF INTERIORBureau of Land Management

DISCLAIMER
Mention of a commercial company or product does not constitutean endorsement by National Oceanic and Atmospheric Administration.Use for publicity or advertising purposes of information from thispublication concerning proprietary products or the tests of suchproducts is not authorized.
ACKNOWLEDGMENT
These annual reports were submitted as part of contractswith the Outer Continental Shelf Environmental Assessment Programunder major funding from the Bureau of Land Management.
ii

RECEPTORS -- FISH, LITTORAL, BENTHOS
CONTENTS
RU # PI - Agency Title Page
5 Feder, H. - Institute of Marine Distribution, Abundance, Community 1Science (IMS), Structure and Trophic RelationshipsUniv. of Alaska, of the Nearshore Benthos of CookFairbanks, AK Inlet and NEGOA
5 Feder, H. - IMS, Univ. of Alaska, Distribution, Abundance, Community 84
Fairbanks, AK Structure and Trophic Relationshipsof the Nearshore Benthos of theKodiak Shelf
6 Carey, A. - Oregon St. Univ. The Distribution, Abundance, Diversity 208Corvallis, OR and Productivity of the Western
Beaufort Sea Benthos
356 Broad, A. - Western Washington Environmental Assessment of Selected 361Univ., Habitats in the Beaufort and ChukchiBellingham, WA Littoral System
359 Horner, R. - Seattle, WA Beaufort Sea Plankton Studies 543
iii

OCSEAP ANNUAL REPORT
Contract: #03-5-022-56
Task Order: #15
Research Unit: #5
Reporting Period: 4/1/78-3/31/79
Number of Pages: 77
DISTRIBUTION, ABUNDANCE, COMMUNITY STRUCTURE
AND TROPHIC RELATIONSHIPS OF THE NEARSHORE BENTHOS
OF COOK INLET AND NEGOA
Dr. H. M. Feder, Principal Investigator
Assisted by A. J. Paul
with
Max Hoberg
Stephen Jewett
Kristy McCumby
Judy McDonald
Randy Rice
Phyllis Shoemaker
Institute of Marine Science
University of Alaska
Fairbanks, Alaska 99701
March 1979

ACKNOWLEDGEMENTS
We would like to thank the officers and crew of the NOAA vessels involved
in sampling in lower Cook Inlet, and Tom Rosenthal of the M/V Searcher for
excellent support of trawling activities adjacent to Hinchinbrook Entrance,
Prince William Sound. We would also like to thank the following personnel
of the Institute of Marine Science, University of Alaska: Cydney Hansen and
the staff of the data processing group for most effective assistance, Ana Lea
Vincent for drafting, and the publications staff for aid in preparation of this
report.
2

TABLE OF CONTENTS
ACKNOWLEDGEMENTS . . . . . . . . . . . . . . . . . . . . . .
LIST OF TABLES . . . . . . . . . . . . . . . . . . . . . . .
LIST OF FIGURES . . . .. . . . . . . . . . . . . . . . . . .
SECTION I
DISTRIBUTION, ABUNDANCE, COMMUNITY STRUCTURE AND
TROPHIC RELATIONSHIPS OF THE NEARSHORE BENTHOS OF COOK INLET
AND THE NORTHEAST GULF OF ALASKA
I. SUMMARY OF OBJECTIVES, CONCLUSIONS, AND IMPLICATIONS
WITH RESPECT TO OCS OIL AND GAS DEVELOPMENT . . . . . . . . .
II. INTRODUCTION. . . .. . . . . . . . . . . . . . . . . . . . .
General Nature and Scope of Study . . . . . . . . . . . . . .
Relevance to Problems of Petroleum Development. . . . . . . .
III. CURRENT STATE OF KNOWLEDGE. . . . . . . . . . . . . . . . . .
Gulf of Alaska. . . . . . . . . . . . . . . . . . . . .. .
IV. STUDY AREAS . .. . . . . . . . . . . . . . . . . . . . . . .
V. SOURCES, METHODS AND RATIONALE OF DATA COLLECTION . . . . . .
Lower Cook Inlet. .. . . . . . . . . . . . . . . . . . . . .
Northeast Gulf of Alaska. . . . . . . . . . . . . . . . . . .
VI. RESULTS . . . . . . . . . . . . . . . . . . . . . . . . . .
Lower Cook Inlet... . . . . . . . . . . . . . . . . . . . .
Northeast Gulf of Alaska. ....... . . . . . . . . . . .
Food Studies . . . . . . . . . . . . . . . . . . . . . . . .
VII. DISCUSSION. . . . . .. . . . . . . . . . . . . . . . . . . .
Lower Cook Inlet. . . .. . .. . . . . . . . . . . . . . . .
Northeast Gulf of Alaska. . . . . . . . . . . . . . . . . . .
VIII. CONCLUSIONS . .. . . . . . . . . . . . . . . . . . . . . . .
Lower Cook Inlet.... . . . . . . . . . . . . . . . . . .
Northeast Gulf of Alaska. . . . . . . . . . . . . . . . . . .
IX. NEEDS FOR FURTHER STUDY . . . . . . . . . . . . . . . . . . .
X. SUMMARY OF FOURTH QUARTER OPERATIONS. . . . . . . . . . . . .
A. Ship or Laboratory Activities . . . . . . . . . . . . . .
B. Problems Encountered.... . . . . . . . . . . . . . . .
C. Milestones. . . . . . . . . . . . . . . . . . . . . . .
REFERENCES . . . . . . . . . . . . . . . . . . . .
3

TABLE OF CONTENTS
CONTINUED
SECTION II
SUMMARY REPORTKEY ORGANISMS IN BENTHIC FOOD WEBS AND THEIR
RELATIONSHIP TO IMPORTANT HABITATS IN LOWER COOK INLET
I. SUMMARY OF OBJECTIVES, CONCLUSIONS, AND IMPLICATIONSWITH RESPECT TO OCS OIL AND GAS DEVELOPMENT... . . . . . .
II. INTRODUCTION . . . . . . .. . . . . . . . . . . . . . . .
General Nature and Scope of Study. . . . . . . . . . . . . .Relevance to Problems of Petroleum Development . . . . . . .
III. CURRENT STATE OF KNOWLEDGE . . . . . . . . . . . . . . . . .
IV. STUDY AREA . . . . .. . . . . . . . . . . . . . . . . . . .
V. SOURCES, METHODS, AND RATIONALE OF DATA COLLECTION . . . . .
VI. RESULTS - DISCUSSION . . . . . . . . . . . . . . . . . . . .
Important Habitats for Biologically ImportantCrustacea . . . . . . . . . . . . . . . . . . . . . . . . .
Snow crab . . . . . . . . . . . . . . . . . . . . . . . .King crab. .. . . . . . . . . . . . . . . . . . . . . . .Dungeness crab . . . . . . . . . . . . . . . . . . . . .
VII. CONCLUSIONS. . .. . . . . . . . . . . . . . . . . . . . . .
VIII. NEEDS FOR FURTHER STUDY. . . . . . . . . . . . . . . . . . .
REFERENCES . .. . . . . . . . . . . . . . . . . . . . . . .
APPENDIX I . . . . . . . . . . . . . . . . . . . . . . . . .
4

LIST OF TABLES
TABLE I. Mean Number and percent ovigerous king, snow and
Dungeness crabs captured in all quantitativetrawls in 1977 and 1978 in Lower Cook Inlet. . . . . . . . .
TABLE II. Size distribution of Chionoecetes bairdi fromselected trawls from Cook Inlet stations . . . . . . . . . .
TABLE III. Mean number of pink, humpy, coonstripe andsidestripe shrimps captured in trawls in CookInlet, 1977 and 1978 . . . . . . . . . . . . . . . . . . . .
TABLE IV. Food of Cook Inlet snow crab, October 1976 . . . . . . . . .
TABLE V. Food of Cook Inlet snow crab, November 1977. . . . . . . . .
TABLE VI. Food of Cook Inlet snow crab, March 1978 . . . . . . . . ..
TABLE VII. Food of Cook Inlet Chionoecetes bairdi, July 1979. . . . . .
TABLE VIII. Number of prey specimens in snow crab stomachs bysize and sex, October 1976 . . . . . . . . . . . . . . . . .
TABLE IX. Food of Cook Inlet snow crab by size of crab,November 1977 . . . . . . . . . . . . . . . . . . . . . . .
TABLE X. The percent fullness of stomach (%f), mean dry weight(g) of stomach contents (xdw), percent of dry weightplant and animal tissue (%t), and percent sedimentweight (%s) of Chionoecetes bairdi, Cook Inlet,November 1977 . . . . . . . . . . . . . . . . . . . . . . .
TABLE XI. A comparison of percent fullness of stomachs of CookInlet snow crab at different times of capture. . . . . . . .
TABLE XII. Percent fullness of stomachs of Chionoecetesbairdi after feeding in the laboratory (5 0 C) . . . . . . . .
TABLE XIII. Consumption of Macoma batthica by Chionoecetesbairdi over a twenty-four hour period. . . . . . . . . . . .
TABLE XIV. Food of Paralithodes camtschatica from KamishakBay, Cook Inlet, Alaska. . . . . . . . . . . . . . . . . . .
TABLE XV. Food of Paralithodes camtschatica from KachemakBay, Cook Inlet, Alaska... . . . . . . . . . . . . . . . .
TABLE XVI. Food of Cancer magister with carapace width greaterthan 50 mm from Cook Inlet, Alaska . . . . . . . . . . . . .
TABLE XVII. Food of Cancer magister with carapace widths of 22-45mm from Cook Inlet, Alaska . . . . . . . . . . . . . . . . .
5

LIST OF FIGURES
Figure 1. Lower Cook Inlet Benthic Stations occupied 1976 - 1978.
The shaded portion represents the tract selection area .
Figure 2. Locations of stations where snow crab, king crab and
Dungeness crab were captured for stomach analysis . . . . .
Figure 3. Lower Cook Inlet Grab Stations for which infaunal data
available. All data will be included in Final Report. . . .
Figure 4. Lower Cook Inlet Benthic Trawl Stations and regions
for grouping data for 1976, 1977 and 1978 . . . . . . . . .
6

SECTION I
DISTRIBUTION, ABUNDANCE, COMMUNITY STRUCTURE AND
TROPHIC RELATIONSHIPS OF THE NEARSHORE BENTHOS OF COOK INLET
AND THE NORTHEAST GULF OF ALASKA
7

I. SUMMARY OF OBJECTIVES, CONCLUSIONS, AND IMPLICATIONSWITH RESPECT TO OCS OIL AND GAS DEVELOPMENT
The long-term objectives of this study are: 1) a qualitative and
quantitative inventory of benthic species within and adjacent to identi-
fied oil-lease sites in the northeast Gulf of Alaska (NEGOA) and lower
Cook Inlet, 2) a description of spatial distribution patterns of selected
species in the designated study areas, and 3) observations of biological
interrelationships, specifically trophic interactions, between components
of the benthic biota in designated study areas.
Forty-two widely dispersed permanent stations for quantitative grab
sampling have been established in the northeastern Gulf of Alaska, and
these stations represent a reasonable nucleus around which a monitoring
program can be developed. Sixty-one widely dispersed stations were oc-
cupied with a van Veen grab in Cook Inlet; thirteen of these stations
were ultimately selected for detailed analysis.
A pipe dredge was used in lower Cook Inlet to compliment data obtained
by grab and trawl, and was also valuable for obtaining large numbers of
clams used in age-growth studies.
The general patchiness of fauna initially observed at most stations
in the Gulf of Alaska suggested that at least five replicates be taken per
station. At least this number of replicates were taken at all stations.
Analysis of grab data by the end of the project should enable us to suggest
the optimum number of replicates per station for monitoring programs.
One hundred and forty stations were occupied with an otter trawl
in the northeastern Gulf of Alaska. Forty-seven stations were occupied with
three types of trawls in Cook Inlet.
Four hundred and fifty-seven invertebrate species were collected
in the grab sampling program, and 168 invertebrate species were taken
in the trawl program in the northeast Gulf of Alaska. Two hundred and
eleven species have been determined from the grab sampling program, and 189
invertebrate species from the trawl and dredge programs in Cook Inlet.
It is probable that all species with numerical and biomass importance have
been collected in all areas of investigation and that only rare species will
be added in future sampling.
8

Basic information on diversity, dominance and evenness is now avail-
able for all permanent stations on the NEGOA grid. Caution is indicated
in the interpretation of these values until further data are available over
a longer time base.
Infaunal invertebrates taken by van Veen grab in the northeast Gulf of
Alaska have been used to comprehend station/species aggregations by clu-
ster analysis. Preliminary groupings of stations into three basic clusters
have been accomplished. Further understanding of station clustering has
been gained by clustering species, and constructing two-way coincidence
tables of species vs. station groups. By this means, specific groupings of
species can be related to station clusters, and intermediate positions of
stations (or clusters) can be determined by the particular groupings of
species they have in common.
The joint National Marine Fisheries Service trawl charter for inves-
tigation of epifaunal invertebrates and demersal fishes in the northeast
Gulf of Alaska was effective, and excellent spatial coverage was achieved.
However, no seasonal information was obtained for this area. Trawl surveys
in lower Cook Inlet achieved good coverage, although only limited seasonal
data were obtained. Integration of information from these cruises with infaunal
benthic data will enhance our understanding of these shelf ecosystems.
Information on feeding biology of species from the Gulf of Alaska is
available from literature analysis and information collected on Outer
Continental Shelf Environmental Assessment Program (OCSEAP) cruises. A
Kodiak Island food web has been developed. The major food items in the web
were polychaetes, gastropods (snails), pelecypods (clams), amphipods,
hermit crabs, true crabs, and shrimps. Snow and king crabs fed heavily on
benthic animals that, in turn, relied in whole or in part on sediment-
associated organic material, detritus, bacteria, and benthic diatoms for
food. The invertebrates in two Kodiak bays relied on a variety of feeding
methods while fishes tended to be predators. The principal food groups used by
the Pacific cod, Gadus macrocephalus, at all sites in the northeast Gulf of
Alaska and the Kodiak shelf were molluscs, crustaceans, and fishes. There
were some small quantities (less than 10% of the total occurrence) of annelids,
euphausiids and mysids, isopods and echinoderms taken by cod. A food web,
9

inclusive of major epifaunal species, for Cook Inlet is also available. The
snow crab, Chionoecetes bairdi, fed, in order of decreasing importance, on
clams, hermit crabs, barnacles and crangonid shrimps. King crabs, Paralithodes
camntschatica, in Cook Inlet fed on two deposit-feeding clams, Nuculana and
Macoma, and barnacles.
Clam studies in Cook Inlet have resulted in age-growth data for
six species: Nucula tenuis, Nuculana fossa, Glycymeris subobsoleta,
Macoma calcarea, Tellina nuculoides and Spisula polynyma. Such age-growth
analyses will make available biological parameters useful for long-range
monitoring programs in these areas.
Initial assessment of all data suggests that: 1) sufficient station
and/or area uniqueness exists to permit development of monitoring programs
based on species composition at selected stations utilizing both grab and
trawl sampling techniques, and 2) adequate numbers of biologically well-
known, unique, abundant, and/or large species are available to permit
nomination of likely monitoring candidates for the areas once industrial
activity is initiated.
II. INTRODUCTION
General Nature and Scope of Study
The operations connected with oil exploration, production, and trans-
portation in the Gulf of Alaska present a wide spectrum of potential dangers
to the marine environment (see Olson and Burgess, 1967, for general discussion
of marine pollution problems). Adverse effects on the marine environment of
these areas cannot be quantitatively assessed, or even predicted, unless
background data are recorded prior to industrial development.
Insufficient long-term information about an environment, and the basic
biology and recruitment of species in that environment, can lead to erroneous
interpretations of changes in types and density of species that might occur
if the area becomes altered (see Nelson-Smith, 1973; Pearson, 1971, 1972,
1975; Rosenberg 1973, for general discussions on benthic biological investi-
gations in industrialized marine areas). Populations of marine species
fluctuate over a time span of a few to 30 years (Lewis, 1970, and personal
communication). Such fluctuations are typically unexplainable because of
10

absence of long-term data on physical and chemical environmental para-
meters in association with biological information on the species involved
(Lewis, 1970, and personal communication).
Benthic organisms (primarily the infauna but also sessile and slow-
moving epifauna) are particularly useful as indicator species for a
disturbed area because they tend to remain in place, typically react to
long-range environmental changes, and by their presence, generally reflect
the nature of the substratum. Consequently, the organisms of the infaunal
benthos have frequently been chosen to monitor long-term pollution effects,
and are believed to reflect the biological health of a marine area (see
Pearson, 1971, 1972, 1975; and Rosenberg, 1973 for discussion on long-term
usage of benthic organisms for monitoring pollution).
The presence of large numbers of benthic epifaunal species of actual
or potential commercial importance (crabs, shrimps, snails, fin fishes)
in the Gulf of Alaska further dictates the necessity of understanding benthic
communities there since many commercial species feed on infaunal and small
epifaunal residents of the benthos (see Zenkevitch, 1963, for a discussion
of the interaction of commercial species and the benthos; also see
appropriate discussions in Feder, 1977 and 1978). Any drastic changes in
density of the food benthos could affect the health and numbers of these
commercially important species.
Experience in pollution-prone areas of England (Smith, 1968), Scotland
(Pearson, 1972, 1975), and California (Straughan, 1971) suggests that at
the completion of an initial study, selected stations should be examined
regularly on a long-term basis to determine changes in species content,
diversity, abundance and biomass. Such long-term data acquisition should
make it possible to differentiate between normal ecosystem variation and
pollutant-induced biological alteration. Intensive investigations of the
benthos of the Gulf of Alaska are essential to understand the trophic
interactions involved in these areas and the changes that might take place
once oil-related activities are initiated.
The benthic biological program in the northeast Gulf of Alaska (NEGOA)
has emphasized development of an inventory of species as part of the exami-
nation of biological, physical and chemical components of those portions
of the shelf slated for oil exploration and drilling activity. In addition,
11
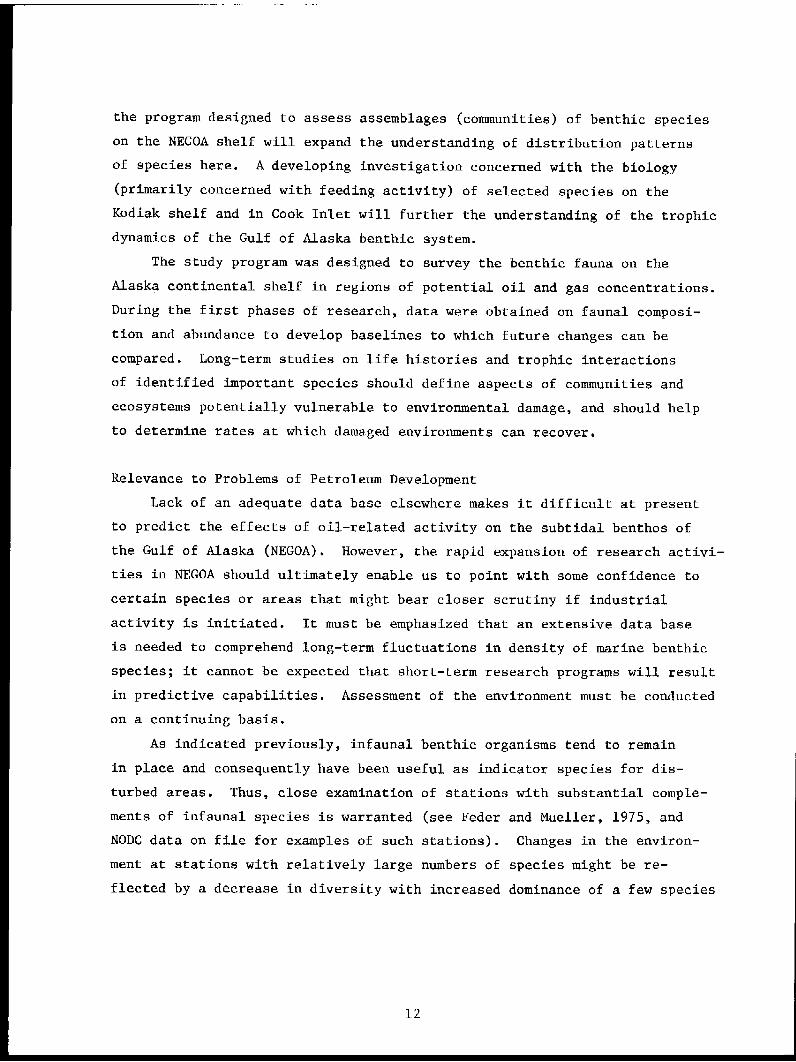
the program designed to assess assemblages (communities) of benthic species
on the NEGOA shelf will expand the understanding of distribution patterns
of species here. A developing investigation concerned with the biology
(primarily concerned with feeding activity) of selected species on the
Kodiak shelf and in Cook Inlet will further the understanding of the trophic
dynamics of the Gulf of Alaska benthic system.
The study program was designed to survey the benthic fauna on the
Alaska continental shelf in regions of potential oil and gas concentrations.
During the first phases of research, data were obtained on faunal composi-
tion and abundance to develop baselines to which future changes can be
compared. Long-term studies on life histories and trophic interactions
of identified important species should define aspects of communities and
ecosystems potentially vulnerable to environmental damage, and should help
to determine rates at which damaged environments can recover.
Relevance to Problems of Petroleum Development
Lack of an adequate data base elsewhere makes it difficult at present
to predict the effects of oil-related activity on the subtidal benthos of
the Gulf of Alaska (NEGOA). However, the rapid expansion of research activi-
ties in NEGOA should ultimately enable us to point with some confidence to
certain species or areas that might bear closer scrutiny if industrial
activity is initiated. It must be emphasized that an extensive data base
is needed to comprehend long-term fluctuations in density of marine benthic
species; it cannot be expected that short-term research programs will result
in predictive capabilities. Assessment of the environment must be conducted
on a continuing basis.
As indicated previously, infaunal benthic organisms tend to remain
in place and consequently have been useful as indicator species for dis-
turbed areas. Thus, close examination of stations with substantial comple-
ments of infaunal species is warranted (see Feder and Mueller, 1975, and
NODC data on file for examples of such stations). Changes in the environ-
ment at stations with relatively large numbers of species might be re-
flected by a decrease in diversity with increased dominance of a few species
12

(see Nelson-Smith, 1973 for further discussion of oil-related changes in
diversity). Likewise, stations with substantial numbers of epifaunal species
should be assessed on a continuing basis (see Feder and Mueller, 1975; Feder,
1977; Jewett and Feder, 1976 for references to relevant stations). The
potential effects of loss of species to the trophic structure in the Gulf
of Alaska cannot be assessed at this time, but the problem can be better
addressed once benthic food studies resulting from current projects are
available (Feder, unpublished data from Cook Inlet, Bering Sea; Jewett and
Feder, 1976; Feder, 1977; Feder and Jewett, 1977; Smith et al., 1977).
Data indicating the effects of oil on most subtidal benthic inverte-
brates are fragmentary (see Boesch, et al., 1974; Malins, 1977 for review;
Baker, 1977 for a general review of marine ecology and oil pollution), but
echinoderms are "notoriously sensitive to any reduction in water quality"
(Nelson-Smith, 1973). Echinoderms (ophiuroids, asteroids, and holothur-
oids) are conspicuous members of the benthos of the Gulf of Alaska (see
Feder, 1977 for references to relevant stations in the northeast Gulf of
Alaska), and could be affected by oil activities there. Asteroids (sea
stars) and ophiuroids (brittle stars) are components of the diet of large
crabs (for example king crabs feed on sea stars and brittle stars: unpub.
data, Guy Powell, Alaska Dept. of Fish and Game; Feder, 1977) and demersal
fishes. Snow crabs (Chionoecetes spp.) are conspicuous members of the shallow
shelf of NEGOA and lower Cook Inlet, and support commercial fisheries of
considerable importance. Laboratory experiments with this species have shown
that postmolt individuals lose most of their legs after exposure to Prudhoe
Bay crude oil; obviously this aspect of the biology of the snow crab must be
considered in the continuing assessment of this species (Karinen and Rice,
1974). Little other direct data based on laboratory experiments are avail-
able for subtidal benthic species (see Nelson-Smith, 1973). Experimentation
on toxic effects of oil on other common members of the subtidal benthos
should be strongly encouraged for the near future in OCS programs.
A direct relationship between trophic structure (feeding type) and
bottom stability has been demonstrated by Rhoads (see Rhoads, 1974 for
review). A diesel fuel spill resulted in oil becoming adsorbed on sediment
particles with resultant mortality of many deposit feeders on sublittoral
13

muds. Bottom stability was altered with the death of these organisms, and
a new complex of species became established in the altered substratum. The
most common members of the infauna of the Gulf of Alaska and the Bering Sea
are deposit feeders; thus, oil-related mortality of these species could re-
sult in a changed near-bottom sedimentary regime with subsequent alteration
of species composition.
As suggested above, upon completion of initial baseline studies in
pollution prone areas, selected stations should be examined regularly on
a long-term basis. Cluster analysis techniques, supplemented by principal
components and/or principal coordinate analysis, should provide techniques
for the selection of stations useful for monitoring the infauna (see Feder,
1978; Feder and Matheke, in press) for such studies in NEGOA). In addition,
these techniques should provide an insight into normal ecosystem variation
(Clifford and Stephenson, 1975; Williams and Stephenson, 1973; Stephenson
et at., 1974). Also, intensive examination of the biology (e.g., age,
growth, condition, reproduction, recruitment, and feeding habits) of selected
species should afford obvious clues of environmental alteration.
III. CURRENT STATE OF KNOWLEDGE
Gulf of Alaska
Little was known about the biology of the invertebrate benthos of the
northeast Gulf of Alaska (NEGOA) at the time that OCSEAP studies were ini-
tiated there, although a compilation of some relevant data on the Gulf of
Alaska was available (Rosenberg, 1972). A short but intensive survey in the
summer of 1975 added some benthic biological data for a specific area south
of the Bering Glacier (Bakus and Chamberlain, 1975). Results of the latter
study are similar to those reported by Feder and Mueller (1975) in their OCSEAP
investigation. Some scattered data based on trawl surveys by the Bureau of
Commercial Fisheries (National Marine Fisheries Service) were available,
but much of the information on the invertebrate fauna was so general as
to have little value. A summarization of existing literature is included
in Feder and Mueller (1977) and AEIDC and ISEGR (1974).
In the summer and fall of 1961 and spring of 1962, otter trawls were
used to survey the shellfishes and bottomfishes on the continental shelf
and upper continental slope in NEGOA (Hitz and Rathjen, 1965). The surveys
14

were part of a long-range program begun in 1950 to determine the size of
bottomfish stocks in the northeastern Pacific Ocean between southern Oregon
and northwest Alaska. Invertebrates taken in the trawls were of secondary
interest, and only major groups and/or species were recorded. Invertebrates
that comprised 27 percent of the total catch were grouped into eight cate-
gories; heart urchins (Echinoidea), snow crabs (Chionoecetes bairdi), sea
stars (Asteroidea), Dungeness crabs (Cancer magister), scallops (Pecten
caurinus), shrimps (Pandalus borealis, P. platyceros, and Pandalopsis
dispar), king crabs (Paralithodes camtschatica), and miscellaneous invertebrates
(shells, sponges, etc.) (Hitz and Rathjen, 1965). Heart urchins accounted
for about 50 percent of the invertebrate catch and snow crabs ranked second,
representing about 22 percent. Approximately 20 percent of the total
invertebrate catch was composed of sea stars.
Further knowledge of invertebrate stocks in the north Pacific is scant.
The International Pacific Halibut Commission (IPHC) surveys parts of the
Gulf of Alaska annually, and records selected commercially important inver-
tebrates; however, non-commercial species are discarded. The benthic in-
vestigations of Feder and Mueller (1975), Feder et al. (1976) and Matheke
et al., (in press), and Feder, (1977) represent the first intensive qualita-
tive and quantitative examinations of the benthic infauna and epifauna of
the Gulf of Alaska.
Data on the infauna collected in the first year (1974-1975) of the
OCSEAP study in NEGOA served as a springboard and an intensive data base
for the studies in 1975-1977. Information in the literature will aid in the
interpretation of the biology of some dominant infaunal organisms in the Gulf
of Alaska. The use of cluster and multivariate techniques for the analysis
of infaunal data (now being applied to our data from the Gulf of Alaska;
Matheke et al., in press; Feder and Matheke, in press) has been widely used
by numerous investigators examining shallow-water marine environments.
Techniques are well reviewed in Clifford and Stephenson (1975).
Few data on non-commercially important benthic invertebrates of lower Cook
Inlet were available until recent OCSEAP studies were initiated [Feder,
1977 and D. Lees, unpub. data and reports; draft copy of lower Cook Inlet
15

Synthesis Report, 1977 (Scientific Applications, 1977)]. The primary data
available were principally catch and assessment records for commercial
shellfish species. Based on OCSEAP feeding studies accomplished in lower
Cook Inlet, NEGOA, and the Kodiak Shelf (Feder, 1977; Feder, 1978; Feder and
Jewett, 1977), it is apparent that benthic invertebrates play an important
role in the food dynamics of commercial crabs and demersal fishes on the
Gulf of Alaska shelf.
Dennis Lees (unpub. data) suggests that the macrophytes of the inter-
tidal and shallow subtidal regions produce materials utilized by detriti-
vores in shallow and deep waters throughout Cook Inlet. Many of the organisms
depending on these plant materials are either of commercial importance or
are food items important to commercial species. In the past few years
information linking the macrophyte producers to commercially important species
has begun to emerge, but the full importance of this linkage has yet to be
recognized. Many marine birds and mammals depend heavily on organisms living
in the inshore areas which in turn are dependent on plant material produced
by macrophytes. Studies by D. Lees and Feder (OCSEAP data) strongly suggest
that the abundant deposit feeders in lower Cook Inlet are concentrated in
regions of detrital accumulations (e.g. Kamashak Bay).
IV. STUDY AREAS
The established stations for the NEGOA and Cook Inlet study areas are
tabulated, figured and discussed in the 1977 OCSEAP Annual Reports (Feder,
1977; 1978;). Additional stations of opportunity were established in the
summer of 1978 in Port Etches (Hinchinbrook Island) and Zaikof and Rocky
Bays (both on Montague Island) (locations of stations in the latter areas
will be included in the NEGOA Final Report).
V. SOURCES, METHODS AND RATIONALE OF DATA COLLECTION
Lower Cook Inlet
Detailed methodology for the investigations of 1976-78 is included in
Feder (1977, 1978). Sampling was accomplished with an Eastern otter trawl,
16
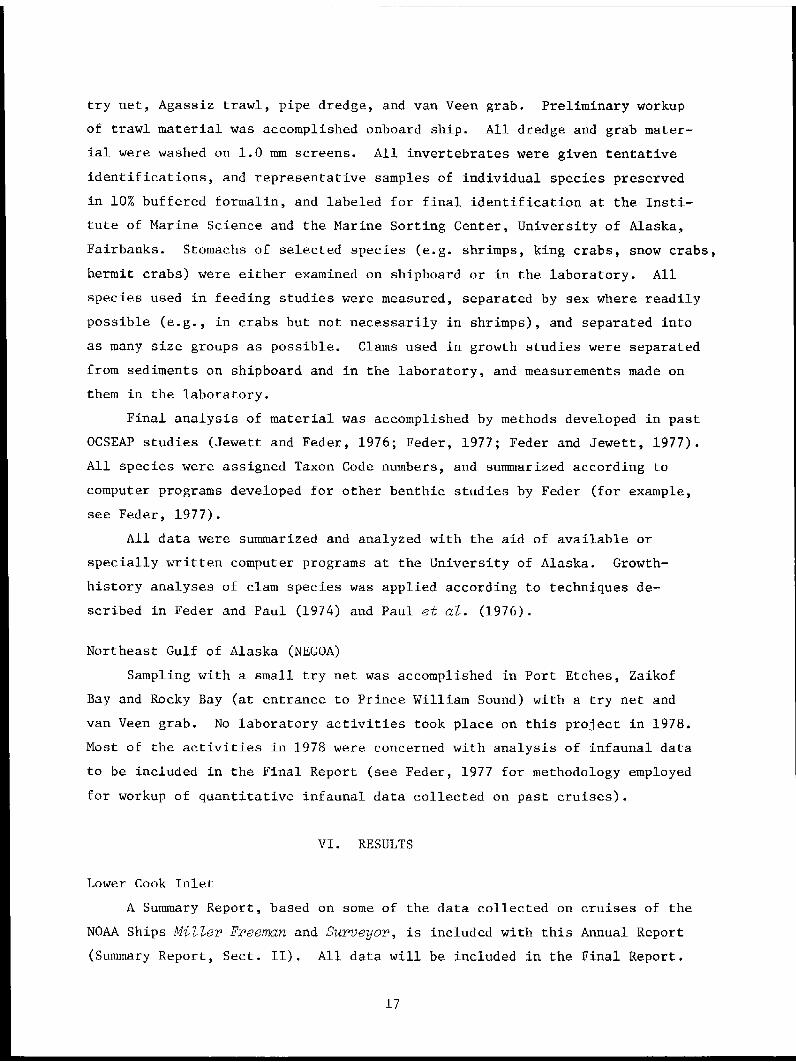
try net, Agassiz trawl, pipe dredge, and van Veen grab. Preliminary workup
of trawl material was accomplished onboard ship. All dredge and grab mater-
ial were washed on 1.0 mm screens. All invertebrates were given tentative
identifications, and representative samples of individual species preserved
in 10% buffered formalin, and labeled for final identification at the Insti-
tute of Marine Science and the Marine Sorting Center, University of Alaska,
Fairbanks. Stomachs of selected species (e.g. shrimps, king crabs, snow crabs,
hermit crabs) were either examined on shipboard or in the laboratory. All
species used in feeding studies were measured, separated by sex where readily
possible (e.g., in crabs but not necessarily in shrimps), and separated into
as many size groups as possible. Clams used in growth studies were separated
from sediments on shipboard and in the laboratory, and measurements made on
them in the laboratory.
Final analysis of material was accomplished by methods developed in past
OCSEAP studies (Jewett and Feder, 1976; Feder, 1977; Feder and Jewett, 1977).
All species were assigned Taxon Code numbers, and summarized according to
computer programs developed for other benthic studies by Feder (for example,
see Feder, 1977).
All data were summarized and analyzed with the aid of available or
specially written computer programs at the University of Alaska. Growth-
history analyses of clam species was applied according to techniques de-
scribed in Feder and Paul (1974) and Paul et al. (1976).
Northeast Gulf of Alaska (NEGOA)
Sampling with a small try net was accomplished in Port Etches, Zaikof
Bay and Rocky Bay (at entrance to Prince William Sound) with a try net and
van Veen grab. No laboratory activities took place on this project in 1978.
Most of the activities in 1978 were concerned with analysis of infaunal data
to be included in the Final Report (see Feder, 1977 for methodology employed
for workup of quantitative infaunal data collected on past cruises).
VI. RESULTS
Lower Cook Inlet
A Summary Report, based on some of the data collected on cruises of the
NOAA Ships Miller Freeman and Surveyor, is included with this Annual Report
(Summary Report, Sect. II). All data will be included in the Final Report.
17

1732 specimens of juvenile king and snow crabs, and adult shrimps from
lower Cook Inlet were examined for food contents in stomachs. The shrimp
species and numbers of each species examined are as follows:
Pandalus goniurus (humpy shrimp) - 176
Pandalus borealis (pink shrimp) - 257
Pandalus hypsinotus (coonstripe shrimp) - 159
Pandalus danae (no common name) - 27
Crangon dalti (sand or gray shrimp) - 858
Crangon fransciscorum (sand or gray shrimp) - 12
Crangon communis (sand or gray shrimp) - 25
Sclerocrangon boreas (no common name) - 49
Lebbeus groenlandica (no common name) - 25
108 juvenile snow crab and 35 post larval king crab are included in the above
total of specimens examined. Adult snow, king and Dungeuess crab stomachs
were also examined. Data and discussions are either found in Summary Report II
of this Annual Report (also see Paul et al., in press) or will be summarized in
the Final Report.
Observations of shallow-water areas by D. Lees (subcontract to this study)
will be included and discussed in the Final Report.
Northeast Gulf of Alaska (NEGOA)
Epifaunal samples were collected in Port Etches (Hinchinbrook Island) on
board the R/V Acona in March 1978. Additional epifaunal and infaunal samples
were collected July - August 1978 in Port Etches, Zaikof and Rocky Bays (all
at entrance to Prince William Sound) on the M/V Searcher.
Activities for the past year have consisted primarily of data analysis
and manuscript preparation for the NEGOA infaunal Final Report. This report
is in its final phases of preparation (Feder and Matheke, in press).
A Final Report entitled, "Distribution and Abundance of some Epibenthic
Invertebrates of the Northeastern Gulf of Alaska With Notes on the Feeding
Biology of Selected Species," was submitted to OCSEAP in August 1978.
Food Studies
Food studies in Cook Inlet have centered on the snow crab, Chionoecetes
bairdi, the king crab (Paralithodes camtschatica), the Dungeness crab
(Cancer magister), shrimps of the Families Pandalidae and Crangonidae, and
the known prey species taken by these organisms. The goal of these studies
18

is to expand and make the food webs presented in previous reports more
comprehensible (Feder, 1977, 1978). The results of these studies will also
be useful in (1) explaining the distribution of adult and juvenile of the
above species, (2) understanding the interrelationships of these species to
other organisms, such as some bottom fishes, which also feed in the benthic
environment, and (3) describing the effect of feeding by these species on
the populations of prey species.
The results of some of the above studies are included in Feder (1977;
1978) and in the Summary Report (Summary Report, Sect. II of this Annual
Report).
A master's thesis treating the feeding biology and trophic interactions
of the abundant crangonid shrimp Crangon dalli, is in progress. Completion
date for this thesis is expected to coincide with the submission period for
the lower Cook Inlet Final Report.
VII. DISCUSSION
Lower Cook Inlet
A preliminary discussion of (1) important habitats for biologically
important Crustacea in lower Cook Inlet, and (2) the food of snow, king and
Dungeness crabs in lower Cook Inlet are included in this Annual Report as
Summary Report II.
Additional food data on three crangonid shrimps (Crangon dalli,
C. franciscorum, ScZerocrangon boreas), one species of hippolytid shrimp
(Lebbeus groenlandica), and four species of pandalid shrimps (Pandalus
borealis - pink, P. goniurus - humpy, P. hypsinotus - coonstripe, and P.
danae - no common name) will be included and discussed in the Final Report.
Additional discussions on the performance of the van Veen grab, number
of grabs taken per station, station coverage, species composition, biomass,
food studies, and clam studies are included in Feder (1978) and Feder and
Matheke (in press).
Northeast Gulf of Alaska (NEGOA)
Data and discussions for NEGOA investigations are available in the OCSEAP
Annual Reports for 1977 and 1978 (Feder, 1977, 1978) and the Final Report on
the epifauna (Feder and Jewett, 1978; also see Jewett and Feder, 1976).
19
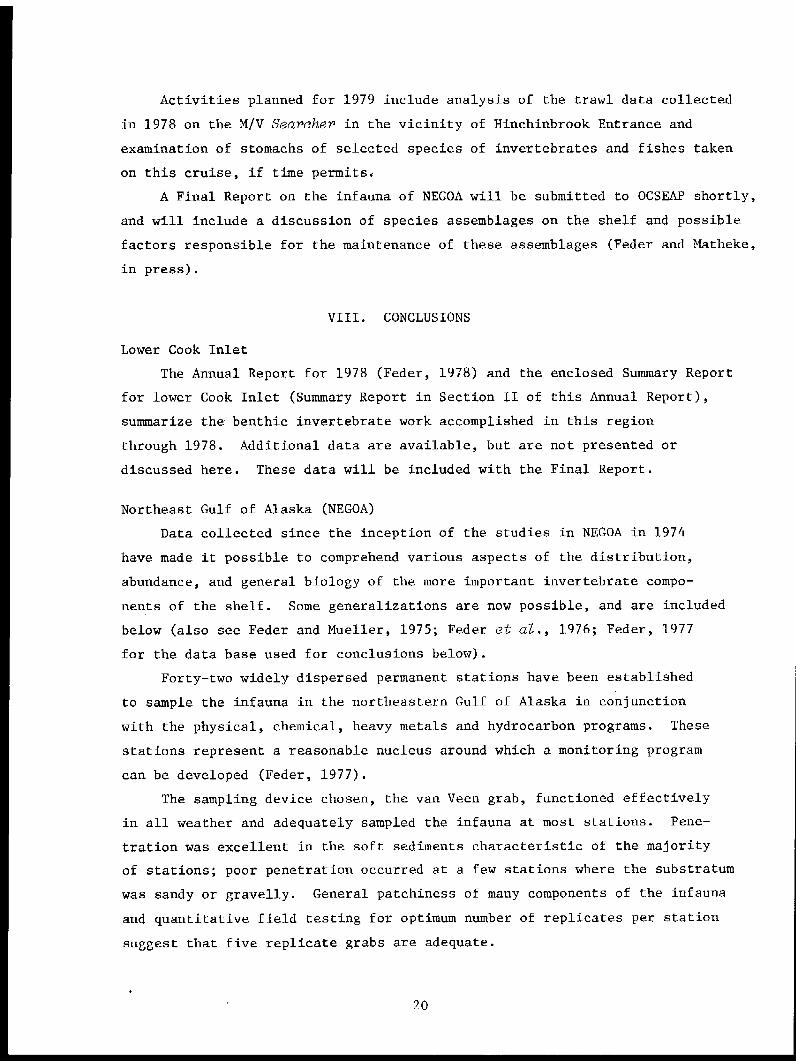
Activities planned for 1979 include analysis of the trawl data collected
in 1978 on the M/V Searcher in the vicinity of Hinchinbrook Entrance and
examination of stomachs of selected species of invertebrates and fishes taken
on this cruise, if time permits.
A Final Report on the infauna of NEGOA will be submitted to OCSEAP shortly,
and will include a discussion of species assemblages on the shelf and possible
factors responsible for the maintenance of these assemblages (Feder and Matheke,
in press).
VIII. CONCLUSIONS
Lower Cook Inlet
The Annual Report for 1978 (Feder, 1978) and the enclosed Summary Report
for lower Cook Inlet (Summary Report in Section II of this Annual Report),
summarize the benthic invertebrate work accomplished in this region
through 1978. Additional data are available, but are not presented or
discussed here. These data will be included with the Final Report.
Northeast Gulf of Alaska (NEGOA)
Data collected since the inception of the studies in NEGOA in 1974
have made it possible to comprehend various aspects of the distribution,
abundance, and general biology of the more important invertebrate compo-
nents of the shelf. Some generalizations are now possible, and are included
below (also see Feder and Mueller, 1975; Feder et al., 1976; Feder, 1977
for the data base used for conclusions below).
Forty-two widely dispersed permanent stations have been established
to sample the infauna in the northeastern Gulf of Alaska in conjunction
with the physical, chemical, heavy metals and hydrocarbon programs. These
stations represent a reasonable nucleus around which a monitoring program
can be developed (Feder, 1977).
The sampling device chosen, the van Veen grab, functioned effectively
in all weather and adequately sampled the infauna at most stations. Pene-
tration was excellent in the soft sediments characteristic of the majority
of stations; poor penetration occurred at a few stations where the substratum
was sandy or gravelly. General patchiness of many components of the infauna
and quantitative field testing for optimum number of replicates per station
suggest that five replicate grabs are adequate.
20

There is now a reasonable understanding, for grab stations occupied on
the NEGOA shelf, of the invertebrate species present and general species dis-
tribution. Four hundred and fifty-seven (457) species have been identified.
Fourteen marine phyla are represented in the collections. The important
groups, in terms of number of species in descending order, are the polychae-
tous annelids, mollusca, arthropod crustaceans, and echinoderms. It is prob-
able that all species with numerical and biomass importance have been col-
lected and that only rare species will be added to the list in the future.
The diversity indices included in the 1976 Annual Report (Feder et al.,
1976), Simpson, Brillouin, and Shannon-Wiener, are complimentary since the
former reflects dominance of a few species and the latter two are weighted
in favor of rare species. Values calculated in the 1977 Annual Report (Feder,
1977), in general, reflect these weightings. A preliminary examination of
the two measures of evenness (or equitability) indicates a reasonable rela-
tionship to the calculated diversity values. In general, high measures of
evenness show numerical codominance of many species (with low Simpson index
and high Shannon-Wiener and Brillouin indices) while low evenness measures
imply marked dominance of a few species (high Simpson index and low Shannon-
Wiener and Brillouin indices). All of these indices and measures must still
be interpreted with considerable caution until more data are available.
Further assessment of the meaning of the calculated values will be included
in the NEGOA Final Report.
Criteria established for Biologically Important Taxa (BIT) for the grab
data have delineated 95 species. Representative members of the BIT should
be the organisms most intensively studied for their general biology in
future work on the NEGOA shelf.
Information on feeding biology of most species has been compiled. Most
of the information for the northeast Gulf of Alaska is from literature source
material; it is suggested that experimental work on feeding biology of sel-
ected species be encouraged for this region (Feder and Matheke, in press).
Clustering techniques have supplied valuable insights into species
distributions on the shelf of the northeast Gulf of Alaska (see Clifford
and Stephenson, 1975 for review of numerical classification). The
preliminary grouping of stations by three different classification schemes
has delineated three basic clusters - Group I, which is characterized by
21

a group of stations south of Prince William Sound; Group II, which gener-
ally consists of stations close to shore; and Group III, composed of sta-
tions that are at or near the shelf edge. Further insight into the meaning
of stations clustered by our analysis is gained by means of the two-way
coincidence table of station groups vs. species groups. Specific groupings
of species can be related to station clusters, and intermediate positions
of stations (or clusters) can be determined by the particular groupings of
species they have in common. Some insight into the stability of the clus-
ter groups should be gleaned by examination of clustering of the second
year station data. Analysis of this data is completed, and is included
in the Final Report (Feder and Matheke, in press) now ready to submit to
OCSEAP (preliminary data and analysis are included as Appendix Table V in
Feder, 1977).
Initial assessment of data printouts of infaunal species (data to
be stored at the National Environmental Data Center) indicates that (1)
sufficient station uniqueness exists to permit development of an adequate
monitoring program based on species composition at selected stations,
and (2) adequate numbers of unique, abundant, and/or large species are
available to ultimately permit nomination of likely monitoring candi-
dates.
The trawl survey on the NEGOA shelf for investigation of epifaunal
invertebrates and demersal fishes was effective (Jewett and Feder, 1976;
Feder and Jewett, 1978). The major limitations of the survey were those
imposed by the selectivity of the gear used and the seasonal movements
of certain species taken. In addition, rocky bottom areas were not sampled
since otter trawls of the type used in the survey could only be fished
on relatively smooth bottom. However, the study was effective for determining
the epibenthic invertebrates and demersal fishes present on sediment bottom
and for achieving maximum spatial coverage of the area. Integration of
this information with data on the infaunal benthos (Feder et al., 1976;
Feder, 1977) should enhance our understanding of the shelf ecosystem.
To date the epifaunal investigation by OCSEAP discussed above represents
the only intensive taxonomic survey of epibenthic invertebrates in the
Gulf of Alaska (Feder and Jewett, 1978). Although Hitz and Rathjen (1965)
22

surveyed invertebrates and bottom fishes on the continental shelf of
the northeast Gulf of Alaska in 1961 and 1962, invertebrates taken in
their trawls were of secondary interest. Only major invertebrate species
and/or groups were recorded, and organisms were grouped into eight
categories in descending order of importance: heart urchins (Echinoidea),
snow crabs (Chionoecetes bairdi), scallops (Pecten caurinus), shrimps
(Pandalus borealis, P. platyceros, and Pandalopsis dispar), king crabs
(Paralithodes camtschatica), and miscellaneous invertebrates (shells,
sponges, etc.). Additional data on commercially important shellfishes are
available in Ronholt et al. (1976).
Analysis of epifaunal data from the present NEGOA investigation
(Feder and Jewett, 1978) indicates that molluscs, crustaceans, and
echinoderms are the leading invertebrate groups on the shelf with the
commercially important crab, Chionoecetes bairdi, clearly dominating all
other species. Furthermore, stomach analysis of the Pacific cod, Gadus
macrocephalus, on the adjacent Kodiak shelf area, reveals that C. bairdi
is a dominant food item of that fish. Thus, the Pacific cod, a non-commercial
species which has commerical potential (Jewett, 1977; and 1978), is preying
intensively on a species of great commercial significance. Laboratory
experiments with C. bairdi have shown that postmolt individuals lose most of
their legs after exposure to Prudhoe Bay crude oil (Karinen and Rice, 1974).
The results of these experiments must be seriously considered as the petroleum
resources in the Gulf of Alaska are developed.
Highest densities of Chionoecetes bairdi, Pandalus borealis, Ophiura
sarsi, Ctenodiscus crispatus, and fishes were recorded in the vicinity of
the Copper River delta southwest of Kayak Island (see Ronholt et al., 1976,
for distribution and density data for fishes there). Little is known about
the productivity of this area, but primary and secondary production may be
higher there as a result of nutrients supplied by the Copper River. Further-
more, enhanced productivity there may be related to the presence of gyres
that extend vertically from the water surface to the bottom (Galt, 1976).
The biological samples now available for the eipifauna from three bays
adjacent to Hinchinbrook Entrance, Prince William Sound (Port Etches,
Zaikof Bay, Rocky Bay) should be useful as a data base in the event of an
23

oil tanker accident adjacent to these sensitive areas. Furthermore,
Port Etches has been suggested as a possible site to tow damaged tankers
following accidents in Prince William Sound (Melteff, 1978).
Availability of many readily identifiable, biologically well-under-
stood infaunal and epifaunal invertebrates is a preliminary to the devel-
opment of monitoring programs. Sizeable biomasses of taxonomically
well-known molluscs, crustaceans, and echinoderms were typical of most
of our stations, and many species of these phyla were sufficiently abun-
dant to represent organisms potentially useful as monitoring tools. The
present investigation clarifies some aspects of the biology of many
of these organisms, and should increase the reliability of future moni-
toring programs for the NEGOA shelf and lower Cook Inlet.
IX. NEEDS FOR FURTHER STUDY
The number of grab stations occupied in lower Cook Inlet and NEGOA
was dictated by available ship time and funding for processing of samples.
Thus, a relatively small number of stations were occupied on the extensive
shelf of the northeastern Gulf of Alaska and in lower Cook Inlet. It is
possible that some areas of biological importance were omitted. Additional
stations should be occupied in the future to accumulate data for some
of the larger unsampled areas.
All samples taken on a semi-seasonal basis in lower Cook Inlet and
NEGOA should be processed, and all data made available. Analysis of all
archived samples will make it possible to better comprehend the seasonality
of benthic infauna.
Selected members of the infauna should be chosen for intensive study
as soon as possible so that basic information can be available for monitor-
ing programs. Specific biological parameters that should be examined for
each species selected are reproduction, recruitment, growth, age, feeding
biology, and trophic interactions with other invertebrates and vertebrates.
The advantage of cluster analysis techniques, used to examine infauna,
is that it provides a method for delineating station groups useful for
developing monitoring schemes and delimiting areas that can be used in
studies of trophic interactions. It is obvious that food webs will vary
24

in areas with differing species assemblages. An inaccurate or even
erroneous description of the shelf ecosystem could occur if trophic data
collected on species from one station cluster (with its complement of
species) is loosely applied to another area encompassing a totally dif-
ferent station cluster (with its differing complement of species). Thus,
continuing development of clustering and other multivariate techniques
should be pursued to refine methods so that the best approach is available
to an offshore monitoring program.
It appears that temporal change in species groups at stations may
lead to confusion in the interpretation of station groups if stations are
always pooled in time. Williams and Stephenson's (1973) technique (species
x time x sites) provides an excellent solution to this problem, but it re-
quires that a study area be completely sampled at least three times per
year. Additional sampling will be necessary to understand temporal
variability of infauna.
The cruises on NOAA vessels for grab-sampling and dredging, and the
extensive trawl program in lower Cook Inlet and NEGOA resulted in relatively
good coverage of the benthos for invertebrates. The needs for the future
are (1) the development of a monitoring plan, (2) acquisition of additional
data on a seasonal basis inclusive of intensive sampling of stomachs of a
diversity of species, and (3) assessment of the sediment - deposit feeder -
predator relationships.
It is highly recommended that serious thought be given to the deve-
lopment of an extensive modeling effort in the northeastern Gulf of
Alaska inclusive of Kodiak and Cook Inlet. The substantial body of data
on trophic interactions of organisms of the benthos, collected by Feder
(1977), Feder and Jewett (1977), and Smith et al. (1977) for this region,
suggests that a sufficiently large data base may now be available to
initiate such an effort or at least to convene workshops to assess the data
base available for the development of a benthic model.
X. SUMMARY OF FOURTH QUARTER OPERATIONS
A. Ship or Laboratory Activities
1. Ship or field activities:
a. No field activities in lower Cook Inlet or NEGOA for this quarter
25

2. Methods, results and discussion
a. Analysis of all grab data from NEGOA was completed, and a
Final Report is in the final stages of preparation.
b. Stomach analyses of juvenile snow and king crabs, and
nine species of shrimps from Cook Inlet are in progress.
c. A thesis on the sand or gray shrimp Crangon dalli is now
in its final stages of preparation.
d. A major portion of this quarter was used in the preparation
of the Annual Report and developing major sections for the
Final Report.
e. A summary report by Alaska Coastal Research (subcontract to
R.U. #5) is in final stages of preparation, and will be
included with the Final Report.
B. Problems Encountered
No major problems were encountered during this quarter.
C. Milestones
It is intended to maintain a consistent schedule for report prepara-
tion. Some of the reports will be subdivided into sections, each section
to be submitted as it is completed. The latter procedure should increase
the data flow and data interpretation available to OCSEAP. The schedule
for report submissions and the Final Reports submitted are as follows:
1. Kodiak (Alitak and Ugak Bays) Final Report - Submitted November, 1977.
2. Norton Sound-Chukchi Sea Final Report - Submitted February, 1977.
3. Cook Inlet Summary Report - Submitted mid-March, 1978.
4. Bering Sea Epifauna Final Report - Submitted May 1978.
5. NEGOA Epifauna Final Report. I. - Submitted August 1978.
6. NEGOA Infauna Final Report - To be submitted May 1979.
7. Bering Sea Infauna Final Report - To be submitted June 1979.
8. Cook Inlet Final Report - To be submitted December 1979.
9. NEGOA Epifauna Final Report II - To be submitted October 1979.
26
REFERENCES
Arctic Environmental Information and Data Center (AEIDC) and Institute of
Social Economic and Government Research (ISEGR). 1974. The western
Gulf of Alaska - A summary of available knowledge. Univ. of Alaska,
Anchorage.
Bakus, G. J. and D. W. Chamberlain. 1975. An Oceanographic and Marine
Biological Study in the Gulf of Alaska. Report submitted to Atlantic
Richfield, Co. 57 pp.
Baker, J. M. (ed.). 1977. Marine Ecology and Oil Pollution. John Wileyand Sons, New York, N.Y. 566 p.
Boesch, D. F., C. H. Hershner and J. H. Milgram. 1974. Oil Spills andthe Marine Environment. Ballinger Publ., Co., Cambridge, Mass. 114 p.
Clifford, H. T. and W. Stephenson. 1975. An Introduction to NumericalClassification. Academic Press. 229 p.
Feder, H. M. 1977. The distribution, abundance, diversity, and biologyof benthic organisms in the Gulf of Alaska and the Bering Sea. AnnualRept. to NOAA. R.U. #281/5/303 Inst. Mar. Sci., Univ. of Alaska. 340 p.
Feder, H. M. 1978. Distribution, abundance, community structure, andtrophic relationships of the nearshore benthos of the Kodiak Shelf,Cook Inlet, northeast Gulf of Alaska and the Bering Sea. AnnualRept. to NOAA. R.U. 3281/5/303 Inst. Mar. Sci., Univ. of Alaska. 315 p.
Feder, H. M. and S. C. Jewett. 1977. The distribution, abundance, biomass,and diversity of the epifauna in two bays (Alitak and Ugak) of KodiakIsland, Alaska. Inst. Mar. Sci. Rept. R77-3, Univ. of Alaska, Fair-banks. 74 p.
Feder, H. M. and S. C. Jewett. 1978. Distribution and abundance of someepibenthic invertebrates of the northeastern Gulf of Alaska with noteson the feeding biology of selected species. Final Rept. to NOAA.R.U. #5. Inst. Mar. Sci., Univ. of Alaska. 70 p.
Feder, H. M. and G. E. M. Matheke. In press. Distribution, abundance, communitystructure, and trophic relationships of the benthic infauna of thenortheast Gulf of Alaska. Final Report to NOAA. R.U. #5. Inst. Mar.Sci., Univ. of Alaska.
Feder, H. M. and G. Mueller. 1975. Environmental Assessment of the North-east Gulf of Alaska: Benthic Biology. First year final report to theNational Oceanic and Atmospheric Administration. 200 p.
Feder, H. M. and G. Mueller. 1977. A summarization of existing literatureand unpublished data on the distribution, abundance, and productivityof benthic organisms of the Gulf of Alaska and Bering Sea. Third yearAnnual Rept. to NOAA. R.U. #282/301. 3,300 p. (computer printout).
27

Feder, H. M. and A. J. Paul. 1974. Age, Growth and Size-weight Relationshipsof the Soft Shell Clam, Mya arenaria, in Prince William Sound, Alaska.Proc. Natl. Shellfish Assoc. 64:45-52.
Feder, H. M., G. J. Mueller, G. Matheke and S. C. Jewett. 1976. Environ-mental Assessment of the Gulf of Alaska: Benthic Biology. Annual Rept.to NOAA. R.U. #281. 176 p.
Gait, J. A. 1976. Circulation studies on the Alaskan Continental Shelf offthe Copper River Shelf. NOAA Tech. Rept. U. S. Government PrintingOffice, Washington, D. C. 36 p.
Hitz, C. R. and W. F. Rathjen. 1965. Bottom trawling surveys of the north-eastern Gulf of Alaska. Comm. Fish. Review. 27(9):1-15.
Jewett, S. C. 1977. Food of the Pacific cod, Gadus macrocephalus Tilesius,near Kodiak Island, Alaska. M. S. Thesis, Univ. of Alaska. 23 p.
Jewett, S. 1978. Summer food of the Pacific cod, Gadus macrocephalus,near Kodiak Island, Alaska. Fish Bull. 76:700-706.
Jewett, S. C. and H. M. Feder. 1976. Distribution and abundance of someepibenthic invertebrates of the northeast Gulf of Alaska with noteson feeding biology. Inst. Mar. Sci., Rept. R76-8, Univ. of Alaska,Fairbanks. 61 p.
Karinen, J. F. and S. D. Rice. 1974. Effects of Prudhoe Bay crude oilon molting tanner crabs, Chionoecetes bairdi. Marine Fisheries Review36(7):31-37.
Lewis, J. R. 1970. Problems and approaches to baseline studies in coastalcommunities. FAO Technical Conference on Marine Pollution and itsEffect on Living Resources and Fishing. FIR:MP 70/E-22. 7 p.
Malins, D. C. (ed.) 1977. Effects of Petroleum on Arctic and SubarcticMarine Environments and Organisms. Biological Effects. Academic Press,Inc., New York, N.Y. Vol. 2. 512 p.
Matheke, G. E. M., H. M. Feder, G. J. Mueller. In press. Numerical Analysisof benthic infauna in the northeastern Gulf of Alaska. Proc. of 27thAnnu. Alaska Sci. Conf.
Melteff, B. (ed.) 1978. Proceedings of the MESA workshop in Prince WilliamSound. Sea Grant Rep. 78-9. 163 p.
Nelson-Smith, A. 1973. Oil Pollution and Marine Ecology. Paul Elek(Scientific Books) Ltd., London. 260 p.
Olson, T. A. and F. J. Burgess. (eds.) 1967. Pollution and Marine Ecology.Interscience, New York. 364 p.
28

Paul, A. J., J. M. Paul and H. M. Feder. 1976. Age, Growth, and Recruit-ment of the Butter Clam, Saxidomus gigantea, on Porpoise Island, South-east Alaska. Proc. Natl. Shellfish Assoc. 66:26-28.
Paul, A. J., H. M. Feder, and S. C. Jewett. In press. Food of the snowcrab, Chionoecetes bairdi Rathbun 1924, from Cook Inlet, Alaska.Crustaceana.
Pearson, T. H. 1971. The benthic ecology of Loch Linnhe and Loch Eil,a sea loch system on the west coast of Scotland. III. The effecton the benthic fauna of the introduction of pulp mill effluent. J.Exp. Mar. Biol. Ecol. 6:211-233.
Pearson, T. H. 1972. The effect of industrial effluent from pulp andpaper mills on the marine benthic environment. Proc. Roy. Soc. Lond.B. 130:469-485.
Pearson, T. H. 1975. The benthic ecology of Loch Linnhe and Loch Eil,a sea loch system on the west coast of Scotland. IV. Changes in thebenthic fauna attributable to organic enrichment. J. Exp. Mar. Biot.Ecol. 20:1-41.
Rhoads, D. C. 1974. Organisms-sediment relations on the muddy sea floor.Oceanogr. Mar. Biol. Annu. Rev. 12:263-300.
Ronholt, L. L., H. H. Shippen and E. S. Brown. 1976. An assessment ofthe demersal fish and invertebrate resources of the northeasternGulf of Alaska, Yakutat Bay to Cape Cleare, May-August 1975. U.S.Dept. Comm. NOAA Nat. Mar. Fish. Serv., N.W. Fish. Center Proc.Rept. 1976. 184 p.
Rosenberg, D. H. 1972. A review of the oceanography and renewable resourcesof the northern Gulf of Alaska. Inst. Mar. Sci. Rept. R72-23, SeaGrant Rept. 73-3, Univ. of Alaska, Fairbanks. 690 p.
Rosenberg, R. 1973. Succession in benthic macrofauna in the Swedishfjord subsequent to the closure of a sulphite pulp mill. Oikos24:244-258.
Scientific Applications Inc. 1977. Preliminary environmental assessmentof lower Cook Inlet: A report based on NOAA/OCSEAP Synthesis MeetingNovember 76-18, 1976. Anchorage, Alaska. 169 p.
Smith, J. E. (ed.) 1968. Torrey Canyon Pollution and Marine Life.Cambridge Univ. Press, Cambridge. 196 p.
Smith, R., A. Paulson and J. Rose. 1977. Food and feeding relationshipsin the benthic and demersal fishes of the Gulf of Alaska and BeringSea. Annual Rept. to NOAA. R.U. #284. 38 p.
29

Stephenson, W., W. T. Williams and S. Cook. 1974. The macrobenthos ofsoft bottoms in Moreton Bay (south of Peel Island). Mem. Queensl.Mus. 17:73-124.
Stoker, S. W. 1973. Winter studies of under-ice benthos and the contin-ental shelf of the northeastern Bering Sea. M.S. Thesis, Univ. Alaska,Fairbanks. 60 p.
Straughan, D. 1971. Biological and oceanographical survey of the SantaBarbara Channel oil spill 1969-1970. Allan Hancock Foundation, Univ.of Southern California, Los Angeles. 425 p.
Wigutoff, N. B. and C. B. Carlson. 1950. S. S. Pacific Explorer, Pt. V.1948 Operations in the North Pacific and Bering Sea.
Williams, W. T. and W. Stephenson. 1973. The analysis of three-dimensionaldata (sites x species x time) in marine ecology. J. Exp. Mar. Biol.Ecol. 11:207-227.
Zenkevitch, L. A. 1963. Biology of the Seas of the USSR. George Allenand Unwin., Ltd., London. 955 p.
30

SECTION II
SUMMARY REPORT
KEY ORGANISMS IN BENTHIC FOOD WEBS AND THEIR
RELATIONSHIP TO IMPORTANT HABITATS IN LOWER COOK INLET
31

I. SUMMARY OF OBJECTIVES, CONCLUSIONS, AND IMPLICATIONS WITH RESPECT TO
OCS OIL AND GAS DEVELOPMENT
It was the intent of this investigation to broaden the background
on composition, distribution, and biology of the infaunal and epifaunal
invertebrates of lower Cook Inlet. The specific objectives were: (1)
a quantitative and qualitative inventory of dominant benthic invertebrate
species, (2) a description of spatial distribution patterns of selected
species, and (3) preliminary observations of biological interrelationships
between selected segments of the benthic biota.
Much of the baseline data on infaunal and epifaunal species needed
prior to onset of petroleum-related activities in lower Cook Inlet is now
documented. The van Veen grab, the only quantitative infaunal sampling
device used, was of limited value because the high proportion of sand in
sediments generally impeded grab penetration. On the other hand, a pipe
dredge, also used to sample the infauna, provided valuable qualitative
data. Agassiz trawls, try-nets, and Eastern otter trawls made it pos-
sible to quantitatively sample the larger, more motile species.
In general, species composition decreased with larger sampling gear.
Although only 13 stations were sampled with the van Veen grab, they yielded
211 species. The number of species taken by the small Agassiz trawl (149)
exceeded the number taken by large Eastern otter trawl (53).
Biomass (g/m2) from grabs and trawls were strikingly different. Use
of trawls resulted in loss of infaunal and small epifaunal organisms, im-
portant components of the benthic biomass. Therefore, the total benthic
biomass value is best expressed by combining both grab and trawl values.
Seventy-four percent of the species taken by grab were polychaetous
annelids and molluscs; 56% of the pipe-dredge species were polychaetes
and molluscs. Snow crabs (Chionoecetes bairdi) dominated the catches at
most trawl stations. Based on the large numbers of juvenile snow crabs
taken by trawl and found in fish stomachs in the deep-water region east
of Cape Douglas, it appears that this ares is a major snow crab nursery
ground. The importance of this crustacean in lower Cook Inlet is further
emphasized by the existence of an intensive fishery for C. bairdi in lower
Cook Inlet.
32

Food data for snow crab (Chionoecetes bairdi), king crab (Para-
lithodes camtschatica), Dungeness crab (Cancer magister), 9 species of
shrimps, and 19 species of fishes are now available. The importance
of deposit-feeding clams in the diet of king and snow crabs, and some
bottomfishes is clear. It is suggested that comprehension of the re-
lationship between oil, sediment, deposit-feeding clams, king and snow
crabs is essential to understand the potential impact of oil on the latter
two commercially important species.
Initial assessment of all data suggests that: (1) sufficient station
uniqueness exists to permit development of monitoring programs based on
species composition at selected stations utilizing grab, dredge, and trawl
sampling techniques, and (2) adequate numbers of biologically well-known,
unique, and/or large species are available to permit nomination of likely
monitoring candidates once industrial activity is initiated.
II. INTRODUCTION
General Nature and Scope of Study
The operations connected with oil exploration, production, and trans-
portation in Cook Inlet present a wide spectrum of potential dangers to the
marine environment (see Olson and Burgess, 1967, for general discussion of
marine pollution problems). Adverse effects of oil on the marine environment
of these areas cannot be assessed, or even predicted, unless background
data are recorded prior to industrial development. Insufficient long-term
information about an environment, and the basic biology of species in that
environment, can lead to erroneous interpretations of changes in types and
density of species that might occur if the area becomes altered (see Lewis,
1970; Nelson-Smith, 1973; Pearson, 1971, 1972; Rosenberg, 1973, for general
discussions on benthic biological investigations in industrialized marine
areas).
Benthic invertebrates (primarily the infauna, and slow-moving epi-
fauna) are useful as indicator species for a disturbed area because they
tend to remain in place, typically react to long-range environmental
changes, and, by their presence, generally reflect the nature of the sub-
stratum. Consequently, organisms of the infaunal benthos have frequently
been chosen to monitor long-term pollution effects, and are believed to
33

reflect the biological health of a marine area (see Pearson, 1971, 1972,
1975; and Rosenberg, 1973, for discussion on long-term usage of benthic
organisms for monitoring pollution). The presence of numerous benthic
epifaunal species of actual or potential commercial importance (crabs,
shrimps, fin fishes) in lower Cook Inlet emphasizes the need to under-
stand benthic communities there since many commercial species feed on
infaunal and small epifaunal residents of the benthos (see Zenkevitch,
1963; Feder, 1977a; Feder and Jewett, 1977; Jewett, 1978; Paul et al.,
in press; and this report for discussions of the interaction of commercial
species and the invertebrate benthos). Any drastic changes in density of
the food benthos would directly impact these commercially important species.
Experience in pollution-prone areas of England (Smith, 1968), Scotland
(Pearson, 1972, 1975), and California (Straughan, 1971) suggests that at
the completion of an exploratory study, selected stations should be examined
regularly on a long-term basis to determine any changes in species compo-
sition, diversity, abundance and biomass. Such long-term data acquisition
should make it possible to differentiate between normal ecosystem variation
and pollutant-induced biological alteration. Intensive investigations of
the benthos of lower Cook Inlet are also essential to understand trophic
interactions there and to predict changes that might take place once oil-
related activities are initiated.
A benthic biological program in the northeast Gulf of Alaska (NEGOA)
provided a qualitative and quantitative inventory of prominent species of
the benthic infauna and epifauna there (Feder et aZ., 1976; Jewett and
Feder, 1976). In addition, investigations concerned with the biology of
selected benthic species from NEGOA and the Kodiak shelf (Jewett and Feder,
1976; Feder and Jewett, 1977; Jewett, 1978) have furthered our understanding
of the overall Gulf of Alaska benthic system (Feder, 1977a). Initiation
of a program designed to examine the subtidal benthos of lower Cook Inlet
expanded coverage of the Gulf of Alaska benthic system and extended the
assessment of fauna of the Gulf into little-known shallow-water benthic
systems. The study reported here is a preliminary examination of the
sediment-dwelling benthic fauna of lower Cook Inlet, and is intended to
precede a greater overall investigation of lower Cook Inlet (Feder, 1977b).
34

Relevance to Problems of Petroleum Development
The effects of oil pollution on subtidal benthic systems have, until
recently, been neglected, and only a few studies on such systems, con-
ducted after serious oil spills, have been published (see Boesch et al.,
1974; Malins, 1977; Nelson-Smith, 1973, for reviews; Baker, 1976, for a
general review of marine ecology and oil pollution). Lack of a broad data
base makes it difficult to predict the effects of oil-related activity on
the subtidal benthos of lower Cook Inlet. However, the rapid expansion of
Outer Continental Shelf Environmental Assessment Program (OCSEAP)-sponsored
research activities in this body of water should ultimately enable us to
point with some confidence to certain species, biological events, and areas
that might bear closer scrutiny once industrial activity is initiated. It
must be reemphasized that a considerable time frame is needed to comprehend
long-term fluctuations in density of marine benthic species; thus, it cannot
be expected that short-term research programs will result in predictive
capabilities.
As indicated previously, infaunal benthic organisms tend to remain
in place and, consequently, have been useful as indicator species for
disturbed areas. Thus, close examination of stations with substantial
complements of infaunal species is warranted (see Feder and Mueller,
1975; National Oceanic Data Center (NODC) data on file for examples of
such stations). Changes in the environment at these stations might be
reflected in a decrease in diversity of species with increased dominance
of a few (see Nelson-Smith, 1973, for further discussion of oil-related
changes in diversity). Likewise, stations with substantial numbers of
epifaunal species should be assessed on a continuing basis. The potential
effects of loss of species to the overall trophic structure in lower Cook
Inlet can be partially assessed on the basis of benthic food studies (e.g.
see, Jewett and Feder, 1976; Feder, 1977a; Feder and Jewett, 1977).
The snow crab (Chionoecetes bairdi) is a conspicuous member of the
shallow shelf of lower Cook Inlet, and supports a commercial fishery of
considerable importance there. Laboratory experiments with this species
have shown that postmolt individuals lose most of their legs after exposure
to Prudhoe Bay crude oil; obviously this aspect of the biology of the snow
35

crab must be considered in the continuing assessment of this species
(Karinen and Rice, 1974). Few other direct data based on laboratory
experiments are available for subtidal benthic species (Nelson-Smith,
1973; also see Malins, 1977). Experimentation on toxic effects of oil
on other common members of the subtidal benthos should be strongly en-
couraged in lower Cook Inlet as well as for all Outer Continental Shelf
(OCS) areas of investigation. In addition, potential effects of loss of
sensitive species to the trophic structure of Cook Inlet must be examined.
A direct relationship between trophic structure (feeding type) and
bottom stability has been demonstrated by Rhoads (see Rhoads, 1974, for
review). He describes a diesel fuel spill that resulted in oil becoming
adsorbed on sediment particles which in turn caused death of many deposit
feeders living on sublittoral muds. Bottom stability was altered with the
death of these organisms, and a new complex of species became established
in the altered substratum. Many common members of the infauna of lower
Cook Inlet are deposit feeders; thus, oil-related mortality of these
species could likewise result in a changed near-bottom sedimentary regime
with subsequent alteration of species composition there. In addition, the
commercially important king (Paralithodes camtschatica) and snow crabs
(Chionoecetes bairdi), and some bottom fishes, use deposit-feeding inverte-
brates as food; also, varying amounts of sediment are found in the digestive
tract of snow crabs (Feder, 1977a; Feder and Jewett, 1977) and other benthic
Crustacea (data in present report). Thus, contamination of the bottom by oil
might directly or indirectly affect these commercial species in lower Cook
Inlet.
III. CURRENT STATE OF KNOWLEDGE
A compilation of data is available on commercially important shellfish
of lower Cook Inlet. The U.S. Bureau of Commercial Fisheries (National
Marine Fisheries Service) have conducted distribution and abundance surveys
in this area on shrimps and crabs since 1958 (see references below). More
recent investigations on larval and/or adult stages of shellfish species
have been carried out (Hennick, 1973; ADF&G, 1976; Feder, 1977a). A de-
tailed examination of the food of snow crabs from lower Cook Inlet is
included in Paul et al. (in press).
36
The snow crab, Chionoecetes bairdi Rathbun, a common epibenthic
invertebrate found in Cook Inlet has been commerically harvested there
since 1968. The annual catches for the area from 1968 to 1976 ranged
from 590 to 3600 metric tons. The 1975-76 Cook Inlet catch was worth
approximately 1.3 million U.S. dollars to the fisherman (catch and price
data-Allen Davis, Alaska Dept. of Fish and Game, Homer, Alaska, person.
commun., 1976). Approximately 55% of the snow crab caught in the Inlet
came from the Kamishak Bay area, 18% from the mouth of the Inlet, and
15% from the Kachemak area.
The king crab, Paralithodes camtschatica, is also commercially
harvested in Cook Inlet, Alaska. Approximately 69% if the king crab are
caught in the Kamishak Bay area with an additional 34% in the Kachemak
Bay region. The remainder are captured near the mouth of the Inlet.
Catches of king crab from the Inlet averaged 1,860 metric tons during
1971-1975 (Alaska 1976 catch and production statistical leaflet No. 28).
Dungeness crab occurs primarily in Kachemak Bay. Catches of
Dungeness crab from Cook Inlet averaged 141 metric tons during 1971-1975
(Alaska 1976 catch and production statistical leaflet No. 28).
Data on non-commercial, benthic invertebrates are not as extensive
as that available for commercial species in lower Cook Inlet (U.S. Bureau
of Commercial Fisheries, 1958, 1961, 1963 cited in U.S. Dept. Inter., 1977;
Feder, 1977a). Further studies on the interactions of selected benthic
invertebrate species from lower Cook Inlet are currently underway (Feder,
1977b). Littoral zone studies have been conducted (Dames and Moore, 1977)
and are being continued by Lees (1977).
IV. STUDY AREA
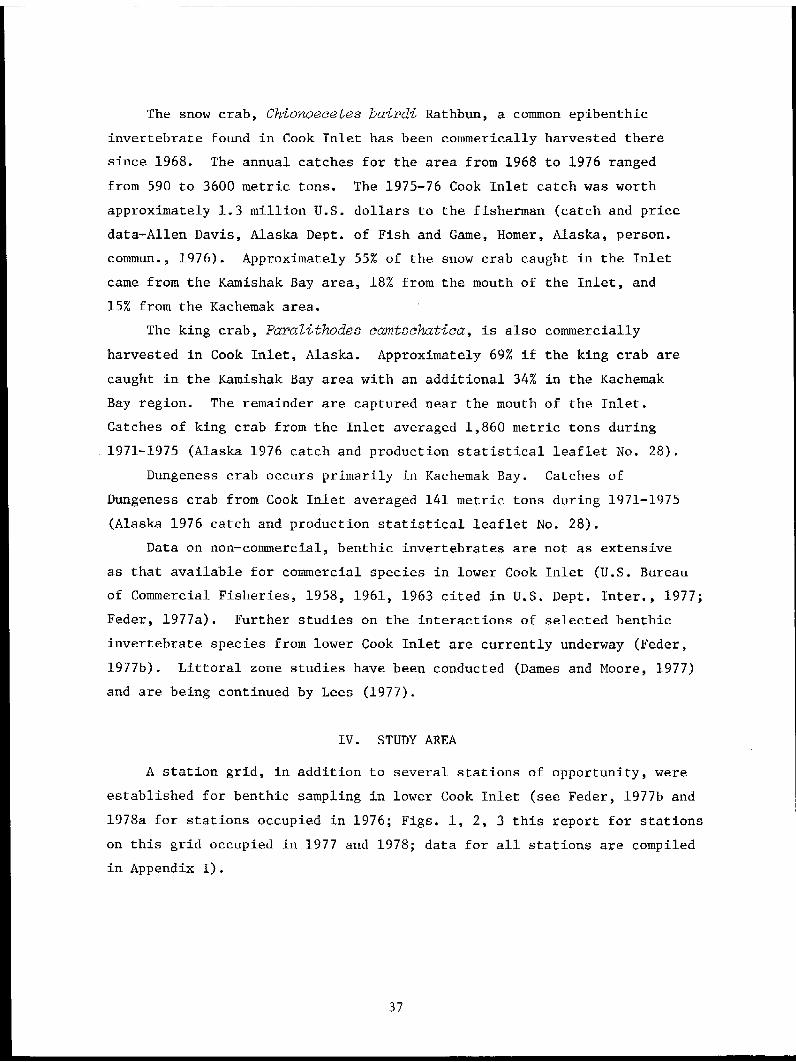
A station grid, in addition to several stations of opportunity, were
established for benthic sampling in lower Cook Inlet (see Feder, 1977b and
1978a for stations occupied in 1976; Figs. 1, 2, 3 this report for stations
on this grid occupied in 1977 and 1978; data for all stations are compiled
in Appendix I).
37

Figure 1. Lower Cook Inlet Benthic Stations occupied 1976-1978. The
shaded portion represents the tract selection area.
38

Figure 2. Locations of stations where snow crab, king crab and Dungeness crabwere captured for stomach analysis.
39

Figure 3. Lower Cook Inlet Grab Stations for which infaunal data available.
All data will be included in Final Report.
40

V. SOURCES, METHODS, AND RATIONALE OF DATA COLLECTION
Benthic infauna and epifauna were collected aboard the R/V Moana Wave
from March 30-April 15, 1976, and the NOAA Ships Miller Freeman and Surveyor
on a series of cruises from October 1976 to July 1978. Sampling in 1976
2was carried out using a 0.1 m van Veen grab, a pipe dredge (36 x 91 cm),
an Agassiz trawl (2.0 m horizontal opening), a try-net (3.7 m horizontal
opening), and a clam dredge. Sampling in 1977-78 was conducted with a van
Veen grab, pipe dredge, Agassiz trawl, 400-mesh Eastern otter trawl (12.2
m horizontal opening), and a clam dredge. The pipe dredge, try-net, clam
dredge, and bottom skimmer were used for qualitative sampling only, while
the van Veen grab, Agassiz and Eastern otter trawl data were treated quanti-
tatively. Five or six grabs were generally obtained at selected stations.
Sampling time for the Agassiz and Eastern otter trawls was usually 15 and
30 minutes, respectively.
Material from each grab was washed on a 1.0 mm stainless steel screen,
and preserved in 10% formalin buffered with hexamine. Labeled samples were
returned to the Marine Sorting Center, University of Alaska, where all
organisms were identified, counted, and wet-weighed after excess moisture
was removed.
The pipe dredge was used to, (1) determine if the van Veen grab was
adequately sampling infauna; (2) provide additional infaunal data in areas
where van Veen grabs could not penetrate properly; (3) provide specimens
for comparison with items found in stomachs of crabs and fishes examined
in feeding studies; and (4) collect large numbers of clams for age-growth
investigations. Clams were removed from pipe-dredge samples, preserved
in 10% buffered formalin, and shipped to the Seward Marine Station for
examination. The remainder of the material from the dredge was examined
in Fairbanks.
All invertebrates from trawls were sorted on shipboard, given tenta-
tive identifications, counted, weighed, and aliquot samples of individual
species preserved and labeled for final identification at the Institute of
Marine Science, University of Alaska.
After final identification, all invertebrate species were assigned
code numbers to facilitate computer analysis of data (Mueller, 1975).
41

Representative and voucher samples of invertebrates were stored at the
Institute of Marine Science, University of Alaska, Fairbanks, Alaska.
The crabs used for the feeding studies discussed in this report
were taken by trawl from October 1976 to July 1978. Stations selected
for detailed examination were those where crabs were abundant.
The stomachs of snow crab, king crab, Dungeness crab, and selected
species of fishes were collected. Stomachs were removed immediately,
fixed in 10% buffered formalin, and their contents examined with a dis-
section and/or compound microscope in the laboratory in Fairbanks. Prey
organisms were counted and identified to the lowest possible taxon. If
the number of prey could not be determined, contents were recorded as a
single specimen of the food item. This was often the case with barnacles
and occasionally bivalves. Crabs were separated by size, sex, and state
of maturity. Male snow crabs with carapace widths greater than 110 mm
were considered sexually mature (Brown and Powell, 1972). Female snow
crabs were classified as immature (pre-reproductive) or mature (repro-
ductive or post-reproductive) based on the enlarged abdomen, modified
pleopods, and egg clutch of the adults (Yoshida, 1941). Food items were
recorded as frequency of occurrence, in which prey items were expressed
as the percent of the predator containing various food items relative to
the total number of the predator analyzed.
The percent of fullness of snow crab stomachs was examined by injecting
the stomachs with water until full, then emptying the contents into graduated
centrifuge tubes, centrifuging and then determining the percent of total
volume that consisted of stomach contents.
Stomach contents of snow crabs from selected stations were dried at 600C,
weighed and then digested with Potassium Hydroxide and redried to determine
what percentage of the weight was animal and plant tissue (IBP Handbook 16).
Next, large pieces of carapace were removed and the sample treated with
concentrated hydrochloric acid to elimate calcareous shell and carapace
fragments. The sample was redried to determine the weight of sediments
present. Sediment weight determined by this method is somewhat conserva-
tive since carbonates naturally associated with the sediment are destroyed.
Snow crabs were fed live Macoma balthica in the laboratory to determine
typical prey consumption rates.
42

Sampling with dredges, grabs and trawls at each station made it
possible to obtain information on potential prey of snow crab, and facili-
tated indentification of stomach contents.
In 1976 an extensive trawl survey of Cook Inlet was undertaken to
determine distribution and abundance of benthic invertebrates (Feder,
1978a). This survey was utilized to determine critical habitats in the
Inlet. Stations where king (Paralithodes camtschatica), and snow,
(Chionoecetes bairdi), and Dungeness crabs, (Cancer magister), and pandalid
shrimps were abundant were selected for continued study in 1977 and 1978.
In addition, three stations established by Pacific Marine Environmental
Laboratory (PMEL) and two by Oregon State University scientists were
occupied to enable integration with these studies. The primary objective
of the 1977 and 1978 trawling activities was to collect stomachs from the
commercially important crustaceans and some of their major prey species.
These data are necessary to determine key organisms in the benthic food
web. Information on size distribution of the snow crab and the reproduc-
tive biology of this crab and other commercially important crustaceans
was also obtained from the data.
The critical habitats for commercially important crustaceans include
the areas where adults are captured by fisheries activities (summarized
by ADF&G, 1976) and areas where juveniles, egg bearing females, and
moulting individuals are found. Many of these areas were identified
during the 1976, 1977-1978 surveys. However, other areas, not defined,
probably exist because only a limited number of stations were occupied
in the surveys.
VI. RESULTS - DISCUSSION
Important Habitats for Biologically Important Crustacea
All data reported here are primarily based on the 1977-78 survey
(Feder, 1978a); some comparative data are included. Data from the 1976
surveys will be integrated with the 1977-78 survey in the Final Report.
Major concentrations of snow crabs were found primarily in the
western part of lower Cook Inlet in all surveys. In terms of numbers,
the largest catches occurred at stations 5(111 crab per km fished), 25
43

(100 per km fished), A53 (50 per km fished), 8 (43 per km fished), 18
(17 per km fished), A62 (15 per km fished), and 27 (11 per km fished),
(Table I). At all other stations in the Inlet the average number captured
in all trawls was less than 10 per km fished. In Kachemak Bay, snow crabs
were most abundant at stations 41 and 40 with an average of 8 and 5 snow
crabs per km fished (Table I).
The size-distribution data for snow crabs (Table II) indicate that
the areas sampled are inhabited by size segregated populations. Snow
crabs less than 20 mm carapace width were encountered primarily near the
mouth of the Inlet and lower Kamishak Bay. Station 5 was the area where
these small crabs were most abundant ranging from 7 to 414 per km fished.
Station 8 (4 to 135 per km fished) and 25 (8 to 238 per km fished) also
had significant numbers of these young crabs (Table II). The size distri-
bution data suggest the existence of a nursery area for snow crabs that
encompasses stations 5, 6, 7, 8, 18, 23, 25, 53, and A53 (Table II), and
strengthens the qualitative assessment of 1976 that also indicated this
region (in particular stations 5, 6, 7, and 8) to be a nursery ground for
snow crabs (Feder, 1978a). Stations 6 and 23 are in the current lease area
and the other stations, with the exception of 53 and A53, are directly in
the path of prevailing currents which flow southward over the lease area.
The absence of snow crabs less than 20 mm carapace width in the Kachemak
Bay area is puzzling since the area supports a commercial fishery. Their
absence in Kachemak Bay may be due to recruitment failure, or perhaps crabs
move from the nursery area described above or from other nursery areas not
discovered, to Kachemak Bay and other parts of the Inlet. Further observa-
tions on the distribution of these small crabs are necessary to determine
the importance of nursery areas as a source of recruitment to Cook Inlet
and the adjacent Gulf of Alaska.
Low numbers of sub-adult crabs 21 to 80 mm carapace widths, were
encountered at all snow crab study stations (Table I). Perhaps snow
crabs of this size range inhabits shallow waters not sampled. It is
essential to know where this important size group of crab is located
if the dynamics of this important species and its potential interaction
with oil is to be comprehended.
44

TABLE I
MEAN NUMBER AND PERCENT OVIGEROUS KING, SNOW AND DUNGENESS CRABSCAPTURED IN ALL QUANTITATIVE TRAWLS IN 1977 AND 1978
IN LOWER COOK INLET
45

TABLE II
SIZE DISTRIBUTION OF CHIONOECETES BAIRDI FROM
SELECTED TRAWLS FROM COOK INLET STATIONS.DATA FROM ALL QUANTITATIVE TRAWLS 1977 AND 1978
46
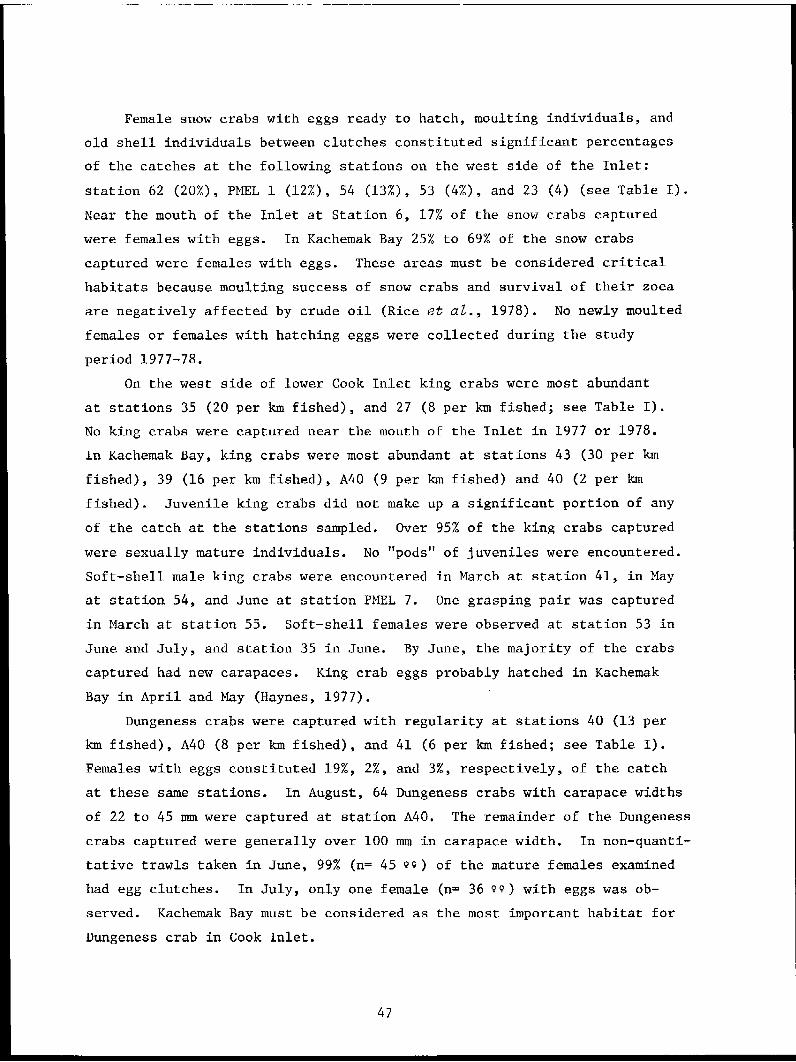
Female snow crabs with eggs ready to hatch, moulting individuals, and
old shell individuals between clutches constituted significant percentages
of the catches at the following stations on the west side of the Inlet:
station 62 (20%), PMEL 1 (12%), 54 (13%), 53 (4%), and 23 (4) (see Table I).
Near the mouth of the Inlet at Station 6, 17% of the snow crabs captured
were females with eggs. In Kachemak Bay 25% to 69% of the snow crabs
captured were females with eggs. These areas must be considered critical
habitats because moulting success of snow crabs and survival of their zoea
are negatively affected by crude oil (Rice et al., 1978). No newly moulted
females or females with hatching eggs were collected during the study
period 1977-78.
On the west side of lower Cook Inlet king crabs were most abundant
at stations 35 (20 per km fished), and 27 (8 per km fished; see Table I).
No king crabs were captured near the mouth of the Inlet in 1977 or 1978.
In Kachemak Bay, king crabs were most abundant at stations 43 (30 per km
fished), 39 (16 per km fished), A40 (9 per km fished) and 40 (2 per km
fished). Juvenile king crabs did not make up a significant portion of any
of the catch at the stations sampled. Over 95% of the king crabs captured
were sexually mature individuals. No "pods" of juveniles were encountered.
Soft-shell male king crabs were encountered in March at station 41, in May
at station 54, and June at station PMEL 7. One grasping pair was captured
in March at station 55. Soft-shell females were observed at station 53 in
June and July, and station 35 in June. By June, the majority of the crabs
captured had new carapaces. King crab eggs probably hatched in Kachemak
Bay in April and May (Haynes, 1977).
Dungeness crabs were captured with regularity at stations 40 (13 per
km fished), A40 (8 per km fished), and 41 (6 per km fished; see Table I).
Females with eggs constituted 19%, 2%, and 3%, respectively, of the catch
at these same stations. In August, 64 Dungeness crabs with carapace widths
of 22 to 45 mm were captured at station A40. The remainder of the Dungeness
crabs captured were generally over 100 mm in carapace width. In non-quanti-
tative trawls taken in June, 99% (n= 45 99) of the mature females examined
had egg clutches. In July, only one female (n= 36 99) with eggs was ob-
served. Kachemak Bay must be considered as the most important habitat for
Dungeness crab in Cook Inlet.
47
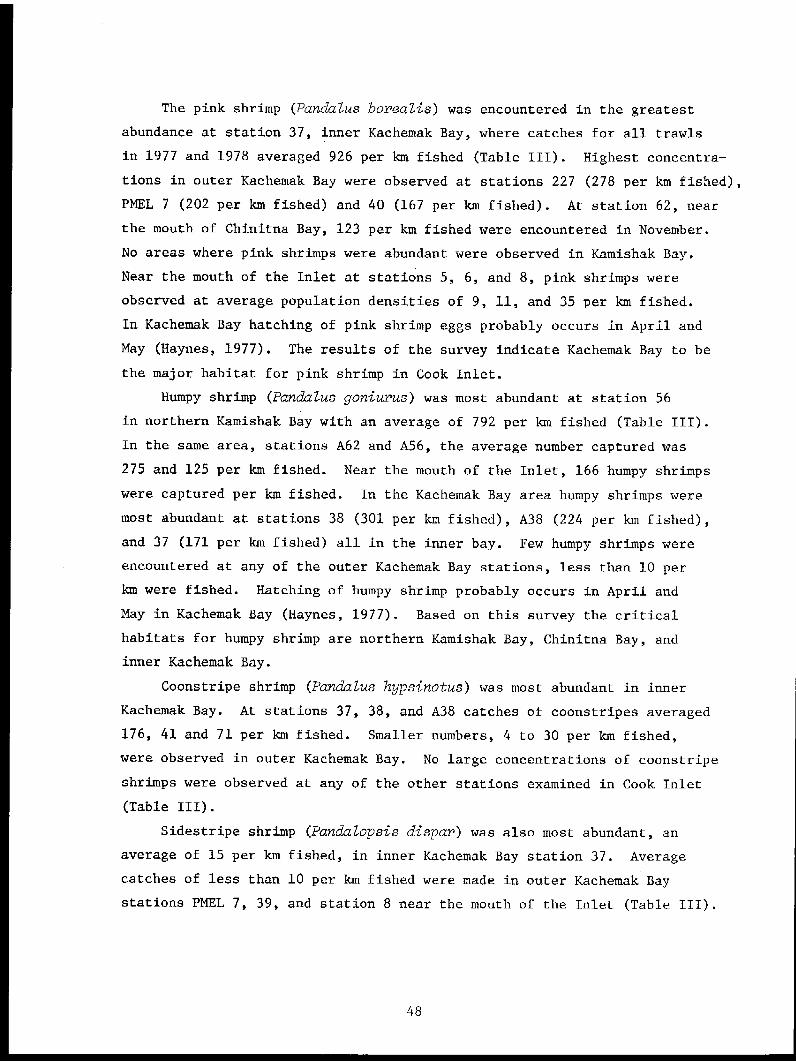
The pink shrimp (Pandalus borealis) was encountered in the greatest
abundance at station 37, inner Kachemak Bay, where catches for all trawls
in 1977 and 1978 averaged 926 per km fished (Table III). Highest concentra-
tions in outer Kachemak Bay were observed at stations 227 (278 per km fished),
PMEL 7 (202 per km fished) and 40 (167 per km fished). At station 62, near
the mouth of Chinitna Bay, 123 per km fished were encountered in November.
No areas where pink shrimps were abundant were observed in Kamishak Bay.
Near the mouth of the Inlet at stations 5, 6, and 8, pink shrimps were
observed at average population densities of 9, 11, and 35 per km fished.
In Kachemak Bay hatching of pink shrimp eggs probably occurs in April and
May (Haynes, 1977). The results of the survey indicate Kachemak Bay to be
the major habitat for pink shrimp in Cook Inlet.
Humpy shrimp (Pandalus goniurus) was most abundant at station 56
in northern Kamishak Bay with an average of 792 per km fished (Table III).
In the same area, stations A62 and A56, the average number captured was
275 and 125 per km fished. Near the mouth of the Inlet, 166 humpy shrimps
were captured per km fished. In the Kachemak Bay area humpy shrimps were
most abundant at stations 38 (301 per km fished), A38 (224 per km fished),
and 37 (171 per km fished) all in the inner bay. Few humpy shrimps were
encountered at any of the outer Kachemak Bay stations, less than 10 per
km were fished. Hatching of humpy shrimp probably occurs in April and
May in Kachemak Bay (Haynes, 1977). Based on this survey the critical
habitats for humpy shrimp are northern Kamishak Bay, Chinitna Bay, and
inner Kachemak Bay.
Coonstripe shrimp (Pandalus hypsinotus) was most abundant in inner
Kachemak Bay. At stations 37, 38, and A38 catches of coonstripes averaged
176, 41 and 71 per km fished. Smaller numbers, 4 to 30 per km fished,
were observed in outer Kachemak Bay. No large concentrations of coonstripe
shrimps were observed at any of the other stations examined in Cook Inlet
(Table III).
Sidestripe shrimp (Pandalopsis dispar) was also most abundant, an
average of 15 per km fished, in inner Kachemak Bay station 37. Average
catches of less than 10 per km fished were made in outer Kachemak Bay
stations PMEL 7, 39, and station 8 near the mouth of the Inlet (Table III).
48

TABLE III
MEAN NUMBER OF PINK, HUMPY, COONSTRIPE AND SIDESTRIPE
SHRIMPS CAPTURED IN TRAWLS IN COOK INLET, 1977 AND 1978
49
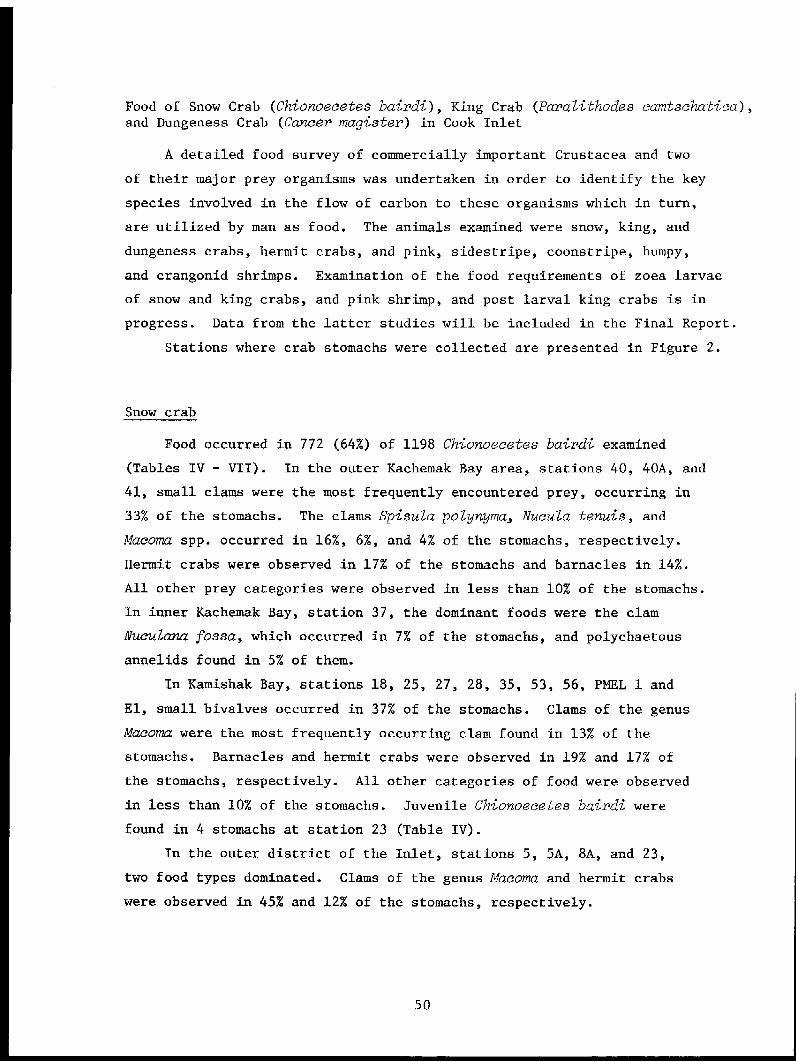
Food of Snow Crab (Chionoecetes bairdi), King Crab (Paralithodes camtschatica),and Dungeness Crab (Cancer magister) in Cook Inlet
A detailed food survey of commercially important Crustacea and two
of their major prey organisms was undertaken in order to identify the key
species involved in the flow of carbon to these organisms which in turn,
are utilized by man as food. The animals examined were snow, king, and
dungeness crabs, hermit crabs, and pink, sidestripe, coonstripe, humpy,
and crangonid shrimps. Examination of the food requirements of zoea larvae
of snow and king crabs, and pink shrimp, and post larval king crabs is in
progress. Data from the latter studies will be included in the Final Report.
Stations where crab stomachs were collected are presented in Figure 2.
Snow crab
Food occurred in 772 (64%) of 1198 Chionoecetes bairdi examined
(Tables IV - VII). In the outer Kachemak Bay area, stations 40, 40A, and
41, small clams were the most frequently encountered prey, occurring in
33% of the stomachs. The clams Spisula polynyma, Nucula tenuis, and
Macoma spp. occurred in 16%, 6%, and 4% of the stomachs, respectively.
Hermit crabs were observed in 17% of the stomachs and barnacles in 14%.
All other prey categories were observed in less than 10% of the stomachs.
In inner Kachemak Bay, station 37, the dominant foods were the clam
Nuculana fossa, which occurred in 7% of the stomachs, and polychaetous
annelids found in 5% of them.
In Kamishak Bay, stations 18, 25, 27, 28, 35, 53, 56, PMEL 1 and
El, small bivalves occurred in 37% of the stomachs. Clams of the genus
Macoma were the most frequently occurring clam found in 13% of the
stomachs. Barnacles and hermit crabs were observed in 19% and 17% of
the stomachs, respectively. All other categories of food were observed
in less than 10% of the stomachs. Juvenile Chionoecetes bairdi were
found in 4 stomachs at station 23 (Table IV).
In the outer district of the Inlet, stations 5, 5A, 8A, and 23,
two food types dominated. Clams of the genus Macoma and hermit crabs
were observed in 45% and 12% of the stomachs, respectively.
50

TABLE IV
FOOD OF COOK INLET SNOW CRAB, OCTOBER 1976. DATA RECORDED AS FREQUENCY
OF OCCURRENCE OF FOOD ITEMS

TABLE V
FOOD OF COOK INLET SNOW CRAB, NOVEMBER 1977. DATA RECORDED AS FREQUENCYOF OCCURRENCE OF FOOD ITEMS

TABLE VI
FOOD OF COOK INLET SNOW CRAB, MARCH 1978. DATA RECORDED AS FREQUENCYOF OCCURRENCE OF FOOD ITEMS

TABLE VII
FOOD OF COOK INLET CHIONOECETES BAIRDI, JULY 1979. DATA RECORDED AS FREQUENCY
OF OCCURRENCE OF FOOD ITEMS

Throughout Cook Inlet, snow crab stomachs with food commonly con-
tained the remains of several barnacles or clams. In one stomach, 16
recently settled Macoma spp. were observed. Few stomachs contained more
than one large crustacean. The total number of each prey, estimated
primarily by counting hard parts of prey, is presented in Table VIII.
These data must be considered qualitative since the estimates are made
by counting shell and exoskeleton; soft, easily digested tissues are
underestimated. Also, feeding observations in the laboratory have
demonstrated that snow crabs may often eat the tissue of small bivalves
without ingesting much of the shell (these observations will be discussed
in more detail in the Final Report).
No difference was detected in the frequency of occurrence of prey in
Chionoecetes bairdi of different sexes or sizes examined (Tables VIII - IX).
Barnacles, hermit crabs, crangonid shrimps, and small clams are
widely distributed throughout lower Cook Inlet (see Feder, 1978a), and
are fed upon by Chionoecetes bairdi in proportion to their abundance.
Other species used for food are discontinuous in their distribution of
lower Cook Inlet (Feder, 1978a). This discontinuous distribution, prob-
ably more than their acceptability as food, explains the infrequent
occurrence of these species in snow crab stomachs.
Small amounts of sediment were observed in stomachs of crabs, from
the three areas; however, sediment seldom contributed to more than 16%
of the dried weight of stomach contents (Table X).
In the Kodiak area the most commonly encountered stomach contents
were small clams, shrimps, plant material, and sediment (Feder et al.,
1977b; Feder and Jewett, 1977). In Cook Inlet plant material, possibly
eelgrass, was only observed in one stomach.
Tarverdieva (1976) found in the southeastern Bering Sea that adult
C. bairdi feed mainly on polychaetes (60-70%). Echinoderms were found
in less than 10% of the stomachs, and mollusks play a large role only
in feeding of the young (63%) which live separately from the adults.
Commercial-size C. opilio feeds, as C. bairdi, mainly on polychaetes
(more than 50% with respect to predominance), and the young and non-
commercial part of the population feed on crustaceans (30-40%), poly-
chaetes (20-30%, and mollusks 20%). Feder (1978b) reported polychaetes,
55

TABLE VIII
NUMBER OF PREY SPECIMENS IN SNOW CRAB STOMACHSBY SIZE AND SEX, OCTOBER 1976
56

TABLE VIII
CONTINUED
57
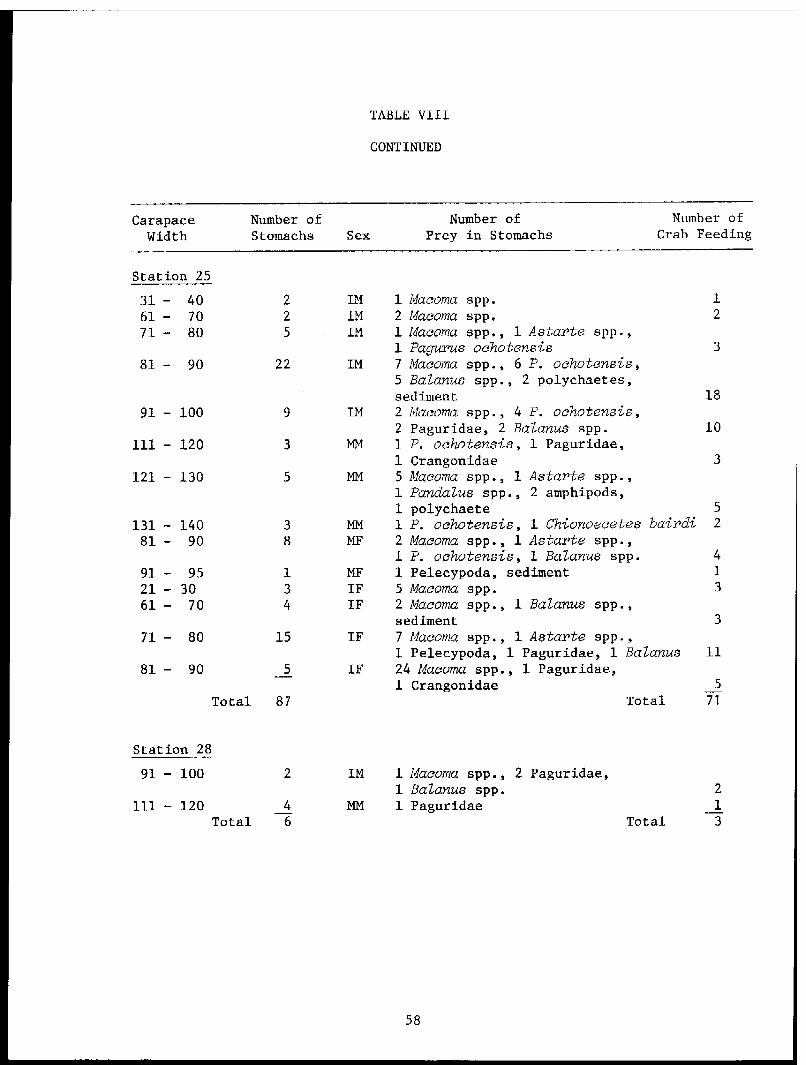
TABLE VIII
CONTINUED
58

TABLE VIII
CONTINUED
59

TABLE IX
FOOD OF COOK INLET SNOW CRAB BY SIZE OF CRAB, NOVEMBER 1977.DATA RECORDED AS FREQUENCY OF OCCURRENCE OF FOOD ITEMS

TABLE X
THE PERCENT FULLNESS OF STOMACH (%f), MEAN DRY WEIGHT (g) OF STOMACH CONTENTS (xdw),PERCENT OF DRY WEIGHT PLANT AND ANIMAL TISSUE (%t), AND PERCENT SEDIMENT WEIGHT (%s) OF
CHIONOECETES BAIRDI, COOK INLET, NOVEMBER 1977
clams and ophiuroids as important food items for C. opilio in the south-
eastern Bering Sea.
Yasuda (1967) examined stomachs of Chionoecetes opiZio elongatus
Rathbun from Japanese waters, and found the most frequently occurring
invertebrate prey to be brittle stars (Ophiura sp.), and young C. opilio
eZongatus, and protobranch clams. Polychaetes, shrimps, gastropods,
scaphopods and flatfishes were also taken by C. opiZio elongatus.
Polychaetes and gastropods were common in Cook Inlet but rarely
preyed upon. It is possible that with a dissection microscope, often
used in stomach analyses, very small polychaete fragments were not
observed and that this group may occur more frequently in snow crab
stomachs than reported. Brittle stars are relatively rare in the
lower Cook Inlet. In Cook Inlet cannibalism was infrequent. Scapho-
pods and fishes were encountered in few C. bairdi stomachs.
A comparison of the percent fullness of stomachs of Cook Inlet
snow crab at different times of day (Table XI) indicates that there
are no definite day-night trends in the fullness of snow crab stomachs.
These data also indicate the normal degree of stomach fullness encountered
in fall, spring, and summer collections. Data on percent fullness of
stomachs, average dry weight of stomach contents, and percent tissue
weight of stomach contents is presented in Table X. In the laboratory,
total clearance of the stomach required 3 days (Table XII). In the
laboratory consumption of Macoma batthica tissue by snow crab averaged
4.2% and 3.4% of total live weight and total dry weight of snow crab,
respectively (Table XIII). These data may be useful in indicating a change
in feeding habits resulting from a change in the environment, such as the
addition of oil.
King crab
A total of 117 king crab stomachs were examined from Kamishak Bay,
90% contained food. The mean carapace length of all crab examined was
105 mm with a range of 35-150 mm. The three most frequently observed
individual foods were barnacles, 81%; bivalves of the family Mytilidae,
probably Modiolus sp., 13%; and hermit crabs, 12%. In addition, 17
other categories of food items were observed; none occurred in more than
62

TABLE XI
A COMPARISON OF PERCENT FULLNESS OF STOMACHS OF COOK INLET SNOW CRABAT DIFFERENT TIMES OF CAPTURE
63

TABLE XII
PERCENT FULLNESS OF STOMACHS OF CHIONOECETES BAIRDI
AFTER FEEDING IN THE LABORATORY (50C)
64
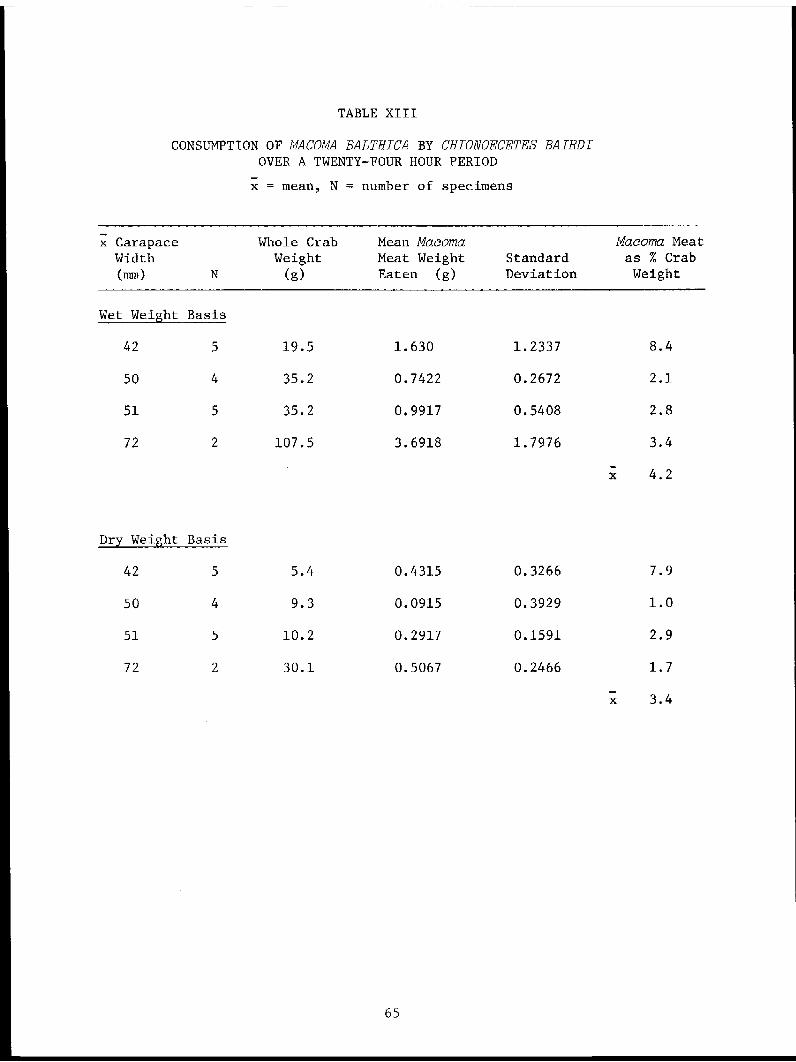
TABLE XIII
CONSUMPTION OF MACOMA BALTHICA BY CHIONOECETES BAIRDI
OVER A TWENTY-FOUR HOUR PERIOD
65

6% of the stomachs. Bivalves (clams), all species combined, occurred in
27% of the stomachs, and gastropods were found in 12% of the stomachs
(Table XIV). In May, 41% of the crabs with empty stomachs were newly
molted or molting individuals.
Stomachs from crabs in Kamishak Bay generally contained only barnacle
remains. Eighteen king crabs collected at station 35 in November 1977
had full stomachs, and were feeding exclusively on the barnacles, Balanus
crenatus. The contents of these stomachs were digested in KOH and
barnacle shell weights remaining after KOH digestion and rinsing with
distilled water determined. The average shell and meat weights of 100
barnacles taken from the same trawls, were determined in a similar manner.
An estimation of the average number of barnacles, based on shell weight,
in each stomach was made. The stomachs contained the equivalent of 11.2
(s.d. = 7.4) barnacles per crab. The average wet meat weight for the
eleven barnacles would be 2g.
In Kachemak Bay, 113 king crabs were captured, 72% contained food.
Bivalves, all species together, occurred in 60% of the stomachs. The
clam, Spisula polynyma, was the most frequently occurring prey species,
observed in 38% of the stomachs. Barnacles were found in 14% of the
stomachs. The snail, Neptunea lyrata, occurred in 11% of the stomachs
(Table XV). By examining shell thickness and sizes of resilium or
cardinal teeth of Spisula polynyma shells in stomachs, it was possible
to estimate sizes and age of the clams eaten (see Feder, 1978a clam-
aging methodology and data). In the 43 king crab stomachs containing
S. polynyma, 13 had large clam meats and pieces of shell 1 to 2 mm
thick. Spisula with shells this thick would exceed 80 mm in shell length
and be seven years of age or older. Shells of S. polynyma, probably less
than 10 mm in length (young of the year or one year old clams) occurred
in 30 stomachs. Pieces of Neptunea lyrata opercula up to 15 mm in length
were found in the stomachs of adult crabs.
In contrast to Kamishak Bay, king crab in Kachemak Bay, generally
contained the remains of a variety of organisms. For example, one
specimen contained 21 small Spisula polynyma, 2 Solariella sp. (snail),
1 Oenopota sp. (snail), and Balanus sp. shell.
66

TABLE XIV
FOOD OF PARALITHODES CAMITSCHATICA FROM KAMISHAK BAY, COOK INLET, ALASKA.DATA RECORDED AS FREQUENCY OF OCCURRENCE OF FOOD ITEMS

TABLE XV
FOOD OF PARALITHODES CAMTSCHATICA FROM KACHEMAK BAY, COOK INLET, ALASKA.DATA RECORDED AS FREQUENCY OF OCCURRENCE OF FOOD ITEMS

Sixteen king crabs were captured at station 6 near the mouth of the
Inlet. In the 12 that contained food, 10 had eaten Nuculana fossa. These
stomachs contained between 10 and 25 of these small bivalves. Clams of
the genus Macoma occurred in 4 stomachs, and one crab had unidentifiable
crustacean remains.
Tarverdieva (1976) provides information on feeding of king crabs from
Bristol Bay, Alaska. There, echinoderms and molluscs were the predominant
food items occurring in 50% and 35% of the stomachs respectively. Feder
(1978b) observed Chionocardium ciliatum in 67%, Solariella spp. in 55%,
Naculana fossa in 50%, Cistenides sp. and brittle stars of the family
Amphiuridae in 35% of 124 king crab stomachs from the southeastern Bering
Sea. Takeuchi (1968a, b) examined the food of king crabs from the Kamchatka
region of Japan, and found that molluscs, crustaceans, and echinoderms
were the main food items. Takeuchi (1967) found that the frequency of
occurrence of the above prey groups in crab stomachs corresponded to the
relative abundance of these organisms. In Cook Inlet, barnacles, clams,
snails, and hermit crabs are widely distributed (Feder, 1978a), and are
fed upon in proportion to their abundance. At the stations examined,
small echinoderms were relatively rare (Feder, 1978a).
Dungeness crab
Food occurred in 331, 80%, of the 413 Dungeness crab stomachs
examined (Tables XVI and XVII). The average shell width of the Dungeness
crabs examined was 142 mm with a range of 22 to 210 mm. The individuals
over 50 mm carapace width preyed primarily on small bivalves, barnacles,
and amphipods (Table XVI). Small clams were the most important food items,
present in 67% of the stomachs. The clam Spisula polynyma was the most
frequently occurring species, observed in 48% of the stomachs. All other
prey species occurred in less than 5% of the stomachs examined.
In 93% of the Cancer magister stomachs containing Spisula polynyma,
the shell fragments belonged to clams probably less than 10 mm in shell
length (young of the year or one-year old clams). By counting the number
of umbos or hinge ligaments present, it was possible to make an estimate
of the number of small S. polynyma present in some stomachs. The maximum
69

TABLE XVI
FOOD OF CANCER MAGISTER WITH CARAPACE WIDTH GREATER THAN 50 mm FROM COOK INLET, ALASKA

TABLE XVII
FOOD OF CANCER MAGISTER WITH CARAPACE WIDTHS OF 22-45 mm FROM COOK INLET, ALASKA

number countable was 125 young clams. The meats of large S. polynyma
and pieces of shell 1 to 2 mm thick were observed in 29 stomachs.
In the one sample of Cancer magister composed of crabs with carapace
widths or 22 to 44 mm (Table XVII), the most frequently occurring animals
were: Foraminifera, 36%; Polychaeta, 28; barnacles, 28%; and small clams
25%. The individuals with empty stomachs were generally in a newly molted
or molting condition.
In a northern California study, the five most frequently observed
categories of prey for Cancer magister were: clams, 35%; fishes, 24%;
isopods, 17%; amphipods, 16%; and razor clams (Sitiqua patula), 12%
(Gotshall, 1977). Butler (1954) examined C. magister from British
Columbia, Canada, and found that crustaceans (59%) and clams (56%) were
the most frequently occurring food items. Butler (1954) reported fish
remains in only 4 Dungeness stomachs.
The results of the previous two studies are similar to our data
in that all three investigations show that clams and several kinds of
crustaceans are important as prey for Cancer magister. The major dif-
ference between the studies is the importance of fishes in the diet of
northern California Dungeness crabs, and the low frequency of occurrence
of fishes in crab diets in British Columbia and Cook Inlet. Isopods or
razor clams were rarely encountered in grabs or dredges in Cook Inlet.
The mollusc most commonly taken by dredging and in the stomachs of other
predators in the study area, was Spisula polynyma. Therefore, the high
incidence of predation on this species is probably a reflection of its
abundance.
VII. CONCLUSIONS
The trawl surveys of 1977-78 extend the data collected in 1976 for
important habitats of commercially-harvested Crustacea in lower Cook
Inlet (Feder, 1978a). In 1977-78, snow crabs were most abundant on the
western side of the Inlet in Kamishak Bay (15 to 100 crab per km fished).
Catches were less than 10 snow crab per km fished at all other stations
trawled in the Inlet. Snow crabs less than 20 mm carapace width (i.e.
juveniles) were found only in outer Kamishak Bay and between Cape Douglas
72

and the Barren Islands. This apparent snow crab nursery area includes
parts of the lease area. Few snow crabs of 20 to 80 mm carapace widths
were captured at any of the stations occupied. The areas that this size
grouping inhabit are currently unknown.
The important habitats, based on abundance, for king crabs were in
Kamishak Bay Stations 35 and 27 and Kachemak Bay Stations 43, 39, 40 and
A40. Dungeness crabs were observed only in mid-Kachemak Bay Stations 40,
A40, and 41. With the exception of a large number of humpy shrimp captured
in northern Kamishak Bay, Station 56, the major concentrations of pink,
humpy, sidestripe and coonstripe shrimps were found in inner Kachemak Bay;
lesser numbers of these shrimps were observed in mid-Kachemak Bay.
The areas discussed above must be considered among the known important
habitats for commercially harvested crustaceans in Cook Inlet. Furthermore,
Cook Inlet crude oil negatively affects survival of the zoea of these commer-
cial Crustacea and the moulting success of juvenile snow crabs (Rice et al.,
1976). Oil input in these important habitat areas could be damaging to adult
stocks if a spill occurred (1) at the period of peak larval abundance in the
upper layers of the water column, or (2) shortly after settlement and meta-
morphosis of young on the bottom.
The most frequently observed prey types in snow crab stomachs were small
bivalves (especially Macoma spp., Spisula polynyma, Nacula tenuis, Naculana
fossa), hermit crabs and barnacles. These same organisms as well as mussels
and the snail Neptunea lyrata were found to be important prey for king crabs,
Dungeness crabs fed primarily on young individuals of the clam Spisula
polynyma. The results indicate that small bivalves, barnacles, and hermit
crabs are key species in the food webs of the commercially important crabs
of lower Cook Inlet. No data concerning the effect of Cook Inlet crude oil
on the bivalves, barnacles, and hermit crabs utilized as food by the commer-
cially important crabs is available. Work by D. Shaw (person. commun; unpub.
data), Shaw et al (1976), and Feder et al. (1976) indicate that the survival
rate, condition index, filtering rate, growth, and burrowing behavior of
Macoma baZthica are negatively affected by Prudhoe Bay crude oil.
The Final Report for lower Cook Inlet will include a complete analysis
of clam growth, growth history, natural mortality rates, age-size-meat weight-
carbon values, and biomass by station for selected species of clams. Estimates
73

of secondary productivity of clams were restricted to 1976 preliminary
observations only; curtailment of funds and the field program in 1978-79
precluded completion of this task. Grab data including species composition,
biomass and diversity will be available for 24 stations (Fig. 3). These
stations are either in the current lease area, areas where commercially
important benthic organisms were encountered in the trawl survey, or re-
present PMEL detritus-trap stations (J. Lawrence, PMEL, person. commun.).
These stations will be grouped into 7 areas: inner Kachemak Bay, mid-
Kachemak Bay, outer Kachemak Bay, central zone, lower Kamishak Bay, upper
Kamishak Bay, and outer region (Fig. 4). When possible, distribution of
feeding types and biomass will be integrated, with information on detrital
deposition rates and bacterial activity levels available from other OCSEAP
projects in lower Cook Inlet.
The trawl data will be regionalized in the same manner as the grab
data (Figs. 2, 3, 4). The results of the trawl survey will include mean
(and standard deviations) of numbers and weights of individuals by species
for each station occupied. The data will be a summarization for all
quantitative data collected at stations between April 1976 and August 1978.
Information on size distribution for snow crab and distribution of egg-
bearing females will be available for all commercially important crustaceans.
Data on nursery areas for snow crabs located in lower Cook Inlet will also
be available.
A major goal of the Final Report for lower Cook Inlet will be a descrip-
tion of critical habitats and periods of vulnerability of key invertebrates
to oil pollution. A first assessment of some of these critical habitats is
included in this Annual Report.
Food data beyond that which occurs in the Annual Report, i.e. snow crab,
king crab and Dungeness crab data, will be available for six species of hermit
crabs, three species of crangonid shrimps, five species of pandalid shrimps,
and several species of fishes. Feeding observations will also be extended
to cover the zoea larvae of king crab, snow crab, and pink shrimp in the
laboratory. Relative to the latter studies, data will be available on prey
concentrations necessary for successful feeding response of these zoea.
These data are necessary to analyze food availability as a factor affecting
survival of larvae of the above species. Information on post-larval king
74

Figure 4. Lower Cook Inlet Benthic Trawl Stations and regions for
grouping data for 1976, 1977 and 1978.
75

crab collected by Alaska Department of Fish and Game from Kachemak Bay
will also be included in the Final Report.
Limited laboratory observations amd experiments on reproduction,
molting, and feeding of snow and king crabs will be available. Data for
this part of the study will be limited since laboratory work was eliminated
from the 1978-1979 project period, and these observations and experiments
were not initiated until late 1978.
VIII. NEEDS FOR FURTHER STUDIES
Suggestions for further work in Cook Inlet are included in the 1979
Annual Report, Section I of this document.
In addition, the following studies are highly recommended:
1. Examine juvenile snow crab feeding habits.
2. Find nursery areas for snow crabs on the east side of Cook Inlet.
3. Examine small bays throughout Cook Inlet for crab and shrimp
distributions, abundance, and reproductive activities.
4. Initiate a major program to understand recruitment and natural
mortalities in crab and shrimp populations in Cook Inlet.
76

REFERENCES
Alaska Department of Fish and Game (ADF&G). 1976. A Fish and WildlifeResource Inventory of the Cook Inlet - Kodiak Areas. Under contractto Alaska Coastal Management Program, Division of Policy Developmentand Planning, Anchorage. 2 Vols., Vol. 2 - Fisheries. 434 pp.
Baker, J. M. (ed). 1976. Marine Ecology and Oil Pollution. John Wileyand Sons, New York, N. Y. and Toronto, Ont. 566 p.
Boesch, D. F., C. H. Hershner and J. H. Milgram. 1974. Oil Spills andthe Marine Environment. Ballinger Publ., Co., Cambridge, Mass. 114 p.
Butler, T. H. 1954. Food of the commercial crab in Queen Charlotte Islandsregion. Fish. Res. Bd. Canada, Pac. Prog. Rept. No. 99:3-5.
Dames, and Moore. 1977. Reconnaissance of the intertidal and shallowsubtidal biotic - lower Cook Inlet. Final Report to NOAA, OCSEAP.315 p.
Feder, H. M. 1977a. The distribution, abundance, diversity and biologyof benthic organisms in the Gulf of Alaska and the Bering Sea. AnnualReport to NOAA. R.U. Nos. 281, 5, 303. Inst. Mar. Sci., Univ.Alaska, Fairbanks. 340 p.
Feder, H. M. 1977b. Distribution, abundance, community structure andtrophic relationships of the nearshore benthos of the Kodiak Shelf,Cook Inlet, and northeast Gulf of Alaska. R.U. No. 5. ResearchProposal to National Oceanic and Atmospheric Administration, OuterContinental Shelf Environmental Assessment Program. 46 p.
Feder, H. M. 1978a. Distribution, abundance, community structure, andtrophic relationships of nearshore benthos of the Kodiak shelf, CookInlet, Northeast Gulf of Alaska and the Bering Sea. Annual reportto N.O.A.A. R.U. Nos. 281, 5, 303. Inst. Mar. Sci., Univ. of Alaska,Fairbanks. 296 p.
Feder, H. M. 1978b. Survey of the epifaunal invertebrates of the south-eastern Bering Sea. Final Report to NOAA. R.U. No. 5, Inst. Mar. Sci.,Univ. of Alaska, Fairbanks. 126 p.
Feder, H. M., G. J. Mueller. 1975. Environmental Assessment of the North-east Gulf of Alaska: Benthic Biology. First year Final Report to theNational Oceanic and Atmospheric Administration. 200 p.
Feder, H. M., G. J. Mueller, G. Matheke and S. C. Jewett. 1976. Environ-mental Assessment of the Gulf of Alaska: Benthic Biology. Secondyear Annual Report to NOAA, R.U. No. 281. 176 p.
77

Feder, H. M. and S. C. Jewett. 1977. The distribution, abundance, and
diversity of the epifaunal benthic organisms in two bays (Alitak
and Ugak) of Kodiak Island, Alaska. Final Report to NOAA. R.U.
No. P29. Inst. Mar. Sci., Univ. of Alaska. 79 p.
Feder, H. M. et al., 1976. The Sediment Environment of Port Valdez,Alaska: The Effect of Oil on this Ecosystem. Ecological Research
Series. EPA-600/3-76-086. 322 p.
Gotshall, D. W. 1977. Stomach contents of northern California Dungeness
crabs, Cancer magister. Calif. Fish and Game, 63(1):43-51.
Haynes, E. 1977. Summary status on the distribution of king crab and
pandalid shrimp larvae Kachemak Bay-Lower Cook Inlet, Alaska, 1976.Environmental studies of Kachemak Bay and Lower Cook Inlet. Vol. IV.Alaska Department of Fish and Game, Anchorage.
Hennick, D. 1973. Cook Inlet shellfish investigations, commercialfisheries research development act. Alaska Department of Fishand Game Project No. 5-29-R. Juneau, Alaska 21 p.
Jewett, S. C. 1978. Summer food of the Pacific cod, Gadus macrocephalusnear Kodiak Island, Alaska. Fish. Bull. 76:700-706.
Jewett, S. C. and H. M. Feder. 1976. Distribution and abundance ofsome epibenthic invertebrates of the northeast Gulf of Alaska, withnotes on the feeding biology of selected species. Inst. Mar. Sci.R76-8. 61 p.
Karinen, J. F. and S. D. Rice. 1974. Effects of Prudhoe Bay crude oilon molting tanner crabs, Chionoecetes bairdi. Mar. Fish. Rev.36(7):31-37.
Lees, D. C. 1977. Ecological studies of intertidal and shallow subtidalhabits in lower Cook Inlet. OCSEAP Research Proposal R.U. No. 417.
Lewis, J. R. 1970. Problems and approaches to baseline studies incoastal communities. FAO Technical Conference on Marine pollutionand its effect on living resources and fishing. FIR:MP 70/E-22. 7 p.
Malins, D. C., ed. 1977. Effects of petroleum on arctic and subarcticmarine environments and organisms. Biological effects. AcademicPress, Inc. New York, N. Y., Vol. 2. 512 p.
Mueller, G. 1975. A preliminary taxon list and code for ADP processing.Sea Grant Project A/77-02. 159 p.
Nelson-Smith, A. 1973. Oil Pollution and Marine Ecology. Paul Elek(Scientific Books) Ltd., London. 260 p.
Olson, T. A. and F. J. Burgess, eds. 1967. Pollution and Marine Ecology.Interscience, New York. 364 p.
78
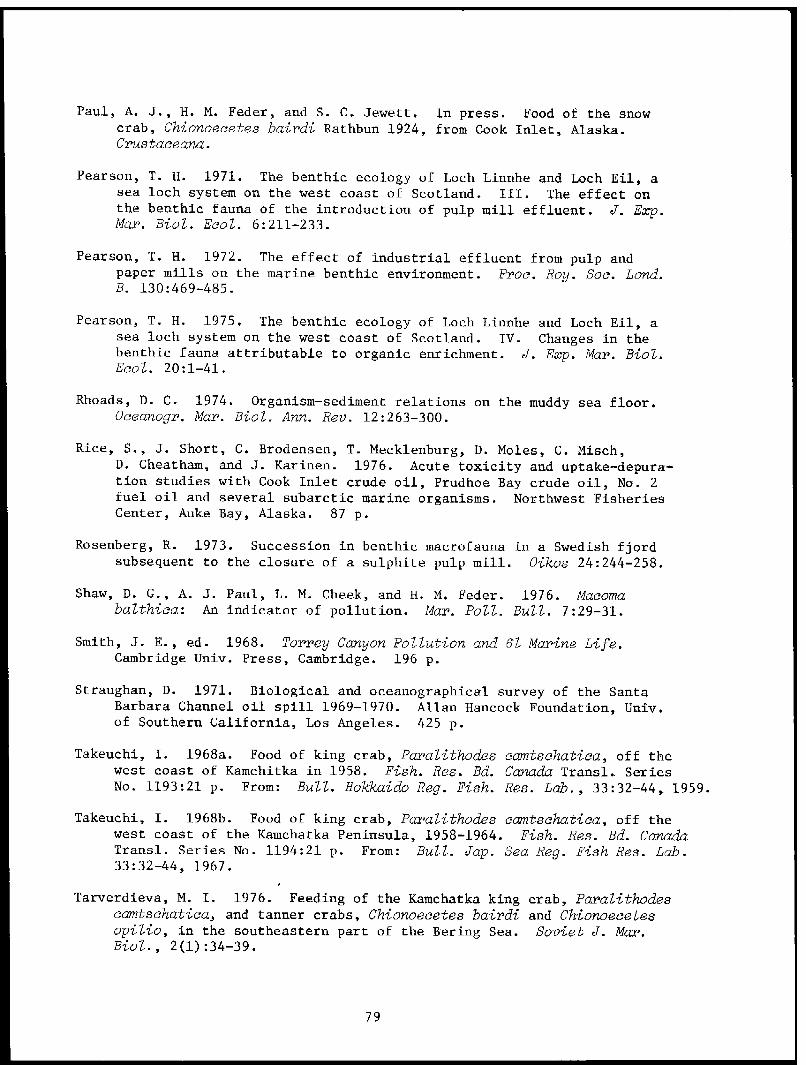
Paul, A. J., H. M. Feder, and S. C. Jewett. In press. Food of the snowcrab, Chionoecetes bairdi Rathbun 1924, from Cook Inlet, Alaska.Crustaceana.
Pearson, T. H. 1971. The benthic ecology of Loch Linnhe and Loch Eil, asea loch system on the west coast of Scotland. III. The effect onthe benthic fauna of the introduction of pulp mill effluent. J. Exp.Mar. Biol. Ecol. 6:211-233.
Pearson, T. H. 1972. The effect of industrial effluent from pulp andpaper mills on the marine benthic environment. Proc. Roy. Soc. Lond.B. 130:469-485.
Pearson, T. H. 1975. The benthic ecology of Loch Linnhe and Loch Eil, asea loch system on the west coast of Scotland. IV. Changes in thebenthic fauna attributable to organic enrichment. J. Exp. Mar. Biol.Ecol. 20:1-41.
Rhoads, D. C. 1974. Organism-sediment relations on the muddy sea floor.Oceanogr. Mar. Biol. Ann. Rev. 12:263-300.
Rice, S., J. Short, C. Brodensen, T. Mecklenburg, D. Moles, C. Misch,D. Cheatham, and J. Karinen. 1976. Acute toxicity and uptake-depura-tion studies with Cook Inlet crude oil, Prudhoe Bay crude oil, No. 2fuel oil and several subarctic marine organisms. Northwest FisheriesCenter, Auke Bay, Alaska. 87 p.
Rosenberg, R. 1973. Succession in benthic macrofauna in a Swedish fjordsubsequent to the closure of a sulphite pulp mill. Oikos 24:244-258.
Shaw, D. G., A. J. Paul, L. M. Cheek, and H. M. Feder. 1976. Macomabalthica: An indicator of pollution. Mar. Poll. Bull. 7:29-31.
Smith, J. E., ed. 1968. Torrey Canyon Pollution and 61 Marine Life.Cambridge Univ. Press, Cambridge. 196 p.
Straughan, D. 1971. Biological and oceanographical survey of the SantaBarbara Channel oil spill 1969-1970. Allan Hancock Foundation, Univ.of Southern California, Los Angeles. 425 p.
Takeuchi, I. 1968a. Food of king crab, Paralithodes camtschatica, off thewest coast of Kamchitka in 1958. Fish. Res. Bd. Canada Transl. SeriesNo. 1193:21 p. From: Bull. Hokkaido Reg. Fish. Res. Lab., 33:32-44, 1959.
Takeuchi, I. 1968b. Food of king crab, Paralithodes camtschatica, off thewest coast of the Kamchatka Peninsula, 1958-1964. Fish. Res. Bd. CanadaTransl. Series No. 1194:21 p. From: Bull. Jap. Sea Reg. Fish Res. Lab.33:32-44, 1967.
Tarverdieva, M. I. 1976. Feeding of the Kamchatka king crab, Paralithodescamtschatica, and tanner crabs, Chionoecetes bairdi and Chionoecetesopilio, in the southeastern part of the Bering Sea. Soviet J. Mar.Biol., 2(1):34-39.
79

U.S. Department of Interior. 1977. Lower Cook Inlet Final EnvironmentalImpact Statements. Alaska Outer Continental Shelf Office. Vol. 1.561 p.
Yasuda, T. 1967. Feeding habit of the zuwai-gani, Chionoecetes opilioelongatus, in Wakasa Bay. I. Specific composition of the stomachcontents. Bull. Jap. Soc. Sci. Fish. 33(4):315-319. (Transl. fromJapanese by Fish. Res. Bd. Can., Transl. Ser. No. 1111.)
Yoshida, H. 1941. On the reproduction of useful crabs in N. Korea. II.Suishan Kenkyushi 36:116-123. (pp. 116-121 transl. from Japanese byHack Chin Kim, Nat. Mar. Fish. Ser. Seattle).
Zenkevitch, L. 1963. Biology of the Seas of the USSR. George Allenand Unwin., Ltd., London. 955 p.
80

APPENDIX I
81

LOWER COOK INLET BENTHIC STATIONS OCCUPIED 1976-1978
82

CONTINUED
83

Contract: #03-5-022-56Task Order: #15Research Unit: #5Reporting Period: 4/1/78-3/31/79Number of Pages: 113
ANNUAL REPORT
DISTRIBUTION, ABUNDANCE, COMMUNITY STRUCTURE AND TROPHICRELATIONSHIPS OF THE NEARSHORE BENTHOS OF THE KODIAK SHELF
H. M. Feder, Principal Investigator
With
Max Hoberg and Stephen C. Jewett
May 1979
84
ACKNOWLEDGEMENTS
We would like to thank the officers and crew of the NOAA Ship
Miller Freeman, the R/V Commando, and the M/V Yankee Clipper for their
assistance in data collection. Thanks also go to the Alaska Depart-
ment of Fish & Game (ADF&G) and Fisheries Research Institute (FRI)
personnel for their assistance onboard ship. A special acknowledge-
ment goes to Guy C. Powell of ADF&G Kodiak for his assistance in the
collection of king crabs via SCUBA. We would also like to thank the
following Institute of Marine Science, University of Alaska, personnel:
John Rose, Camille Stevens, and Kristy McCumby for shipboard and
laboratory assistance; Cydney Hansen and Robert Sutherland for assistance
in data processing; and Suzette Carlson, Ana Lea Vincent and the IMS
Publication Staff for aid in preparation of this report.
85

TABLE OF CONTENTS
ACKNOWLEDGEMENTS . . . . . . . . . . . . . . . . . . . . . . .
LIST OF TABLES . . . . . . . . . . . . . . . . . . . . . . . . . . .
LIST OF FIGURES. .. . . . . . . . . . . . . . . . . . . . . . . . .
I. SUMMARY OF OBJECTIVES, CONCLUSIONS AND IMPLICATIONSWITH RESPECT TO OCS OIL AND GAS DEVELOPMENT . . . . . . . . .
II. INTRODUCTION . . . . . . . . . . . . . . . . . . . . . . . .
GENERAL NATURE AND SCOPE OF STUDY. . . . . . . . . . . . .RELEVANCE TO PROBLEMS OF PETROLEUM DEVELOPMENT . . . . . .
III. CURRENT STATE OF KNOWLEDGE . . . . .. . . . . . . . . . . .
IV. STUDY AREA . . . . . . . . . . . . . . . . . . . . . . . . .
V. SOURCES, METHODS AND RATIONALE OF DATA COLLECTION . . . . . .
VI. RESULTS . .. . . . . . . . . . . . . . . . . . . . . . . . .
TRAWL DATA: DISTRIBUTION-BIOMASS . . . . . . . . . . . .
Izhut Bay . . . . . . . . . . . . . . . . . . . . . .
April 1978 .. . . . . . . . . . . . . . . . . .May 1978 . . . . . . . . . . . . . . . . . . . .June 1978. . . . . . . . . . . . . . . . . . . .July 1978..... . . . . . . . . . . . . . . .August 1978...... . . . . . . . . . . . . .November 1978. . . . . . . . . . . . . . . . . .
Kiliuda Bay . . . . . . . . . . . . . . . . . . . . .
April 1978 . . . . . . . . . . . . . . . . . . .June 1978 . . . . . . . . . . . . . . . . . . .July 1978. . . . . . . . . . . . . . . . . . . .August 1978. .. . . . . . . . . . . . . . . . .November 1978. . . . . . . . . . . . . . . . . .
Portlock Bank - March 1978. . . . . . . . . . . . . .
Kodiak Shelf - June-July 1978 . . . . . . . . . . ..
PIPE DREDGE DATA: DISTRIBUTION - RELATIVE ABUNDANCE . .
REPRODUCTIVE OBSERVATIONS. . . . . . . . . . . . . . . . .
86

TABLE OF CONTENTS (CONT'D)
FOOD STUDIES. . . .. . . . . . . . . . . . . . . . . . . .
Paralithodes amntschatica (Red King Crab). . . . . . .
Izhut Bay . . . . . . . . . . . . . . . . . . . . . .
June 1978 . . . . . . . . . . . . . . . . . .July 1978 . . . . . . . . . . . . . . . . . . . .
Kiliuda Bay . . . . . . . . . . . . . . . . . . . . .
April 1978. .. . . . . . . . . . . . . . . . . .June 1978 . . . . . . . . . . . . . . . . . . . .July 1978 . . . . . . . . . . . . . . . . . . . .August 1978 . . .. . . . . . . . . . . . . . . .November 1978 . ... . . . . . . . . . . . . . .
Near Island Basin..... . . . . . . . . . . . . . .
May 1978. .. . . . . . . . . . . . . . . . . . .June 1978 .. . . . . . . . . . . . . . . . . . .
McLinn Island - May 1978 . ... . . . . . . . . . . .
Anton Larsen Bay - Site No. 1 - June 1978. . . . . . .
Anton Larsen Bay - Site No. 2 - June 1978. . . . . . .
Kodiak Shelf - June-July 1978. . . . . . . . . . . . .
Chionoecetes bairdi (Snow Crab) andPandalus borealis (Pink Shrimp)... . . . . . . . .
Pycnopodia helianthoides (Sunflower Sea Star) -Izhut Bay. May, June, August, November 1978 .
Gadus macrocephalus (Pacific Cod). . . . . . . . . . .
Kodiak Shelf - June-July 1978.. . . . . . . . .Izhut Bay - 1978. . . . . . . . . . . . . . . . .Kiliuda Bay - 1978. . . . . . . . . . . . . . . .
Theragra chalcogramma (Walleye Pollock) -Kiliuda Bay 1978 . . . . . . . . . . . . . . . . . .
Hemilepidotus jordani (Jellow Irish Lord) -Porlock Bank - 1978. . . . . . . . . . . . . . . . .
Kodiak Shelf - June-July 1978 . . . . . . . . . .
87

TABLE OF CONTENTS (CONT'D)
Myoxocephalus sp. (Sculpins) -Kodiak Shelf, June-July 1978 . . . . . . . . . . . .
Izhut Bay - 1978. . . . . . . . . . . . . . . . .
Hypoglossoides elassodon (Flathead Sole) -Kodiak Shelf - June-July 1978... . . . . . . . . .
Lepidopsetta bilineata (Rock Sole) -Kodiak Shelf - June-July 1978. . . . . . . . . . . .
Atheresthes stomias (Arrowtooth Flounder) -Kodiak Shelf - June-July 1978 . . . . . . . . . . .
Pleurogrammus monopterigius (Atka Mackerel) -Kodiak Shelf - June-July 1978 . . .. . . . . . . .
Anaplopoma fimbria (Sablefish) -Kodiak Shelf - June-July 1978. . . . . . . . . . . .
VII. DISCUSSION . . . . . . . . . . . . . . . . . . . . . . . . . .
DISTRIBUTION - BIOMASS . . . . . . . . . . . . . . . . ..
Izhut and Kiliuda Bays . . . . . . . . . . . . . .
Paraithodes ccamtschatica (King Crab). . . . . . . . .Chionoecetes bairdi (Snow Crab)... . . . . . . . . .Pandalus borealis (Pink Shrimp)... . . . . . . . . .
Portlock Bank . . . . . . . . . . . . . . . . . . . .
Kodiak Shelf . . . . . . . . . . . . . . . . . . . . .
Paralithodes camtschatica (King Crab). . . . . . . . .Chionoecetes bairdi (Snow Crab) . . . . . . . . . . .Pandalus borealis (Pink Shrimp). . . . . . . . . . . .
FOOD STUDIES . . . . . . . . . . . . . . . . . . . . . . .
Paralithodes camtschatica (King Crab). . . . . . . . .Pyonopodia helianthoides (Sunflower Sea Star) .. . .Gadus macrocephalus (Pacific Cod). . . . . . . . . . .Theragra chalcogramma (Walleye Pollock) . . . . . . .Myoxocephalus spp. and Hemilepidotus
jordani (Sculpins) . . . . . . . . . . . . . . . . .Hippoglossoides elassodon (Flathead Sole). . . . . . .Lepidopsetta bilineata (Rock Sole)... . . . . . . .Atheresthes stomias (Arrowtooth Flounder). . . . . . .PZeurogrammus monopterigius (Atka Mackerel). . . . . .Anaplopoma fimbria (Sablefish) . . . . . . . . . . . .
88

TABLE OF CONTENTS (CONT'D)
VIII. CONCLUSIONS . . . . . . . . . . . . . . . . . . . . . . . . . .
IX. NEEDS FOR FURTHER STUDY .. . . . . . . . . . . . . . . . .
X. SUMMARY OF FOURTH QUARTER OPERATIONS. . . . . . . . . . . . . .
XI. REFERENCES . . . . . . . . . . . . . . . . . . . . . . . . . .
APPENDIX A . . . . . . . . . . . . . . . . . . . . . . . . .. ... .
APPENDIX B . . . . . . . . . . . . . . . . . . . . . . . . . . . . . .
89

LIST OF TABLES
Table I. The number of stomachs from each predatorexamined by sampling area and collectionperiod . . . . . . . . . . . . . . . . . . . . . . . . . .
Table II. Trawl stations occupied in Izhut and KaliudaBays, 1978, and stations where large numbersof king crabs, snow crabs and/or pink shrimpwhere collected . . . . . . . . . . . . . . . . . . . . .
Table III. Summary of trawl activities from Izhut andKiliuda Bays, 1978 . . . . . . . . . . . . . . . . . . . .
Table IV. Percent biomass composition of the invertebratesPhyla of Izhut and Kiliuda Bays, 1978. . . . . . . . . . .
Table V. Percent biomass composition of the invertebratefamilies of Izhut and Kiliuda Bays, 1978 . . . . . . . . .
Table VI. Percent biomass composition of the invertebratesof Izhut and Kiliuda Bays, 1978 . . . . . . . . . . . ..
Table VII. Invertebrates taken by trawl in Izhut Bay, 1978 .. . ..
Table VIII. Invertebrates taken by trawl in Kiliuda Bay,1978 . . . . . . . . . . . . . . . . . . . . . . . . . . .
Table IX. Percent biomass composition of the leadinginvertebrates species collected near PortlockBank, March 1978 . . . . . . . . . . . . . . . . . . . . .
Table X. Percent biomass composition of the leadinginvertebrate species collected on the KodiakShelf, June - July 1978 . . . . . . . . . . . . . . . ..
Table XI. Invertebrates taken by trawl on the KodiakShelf, 1978. . . . .. . . . . . . . . . . . . . . . . . .
Table XII. Stomach contents of king crabs collected viatrawls in Izhut Bay, June 1978 . . . . . . . . . . . . . .
Table XIII. Intestine contents of king crabs (Paralithodescamtschatica) from the Kodiak Island region,1978 . . . . . . . . . . . . . . . . . . . . . . . . . .
Table XIV. Stomach contents of king crabs collected viatrawls in Izhut Bay, July 1978 . . . . . . . . . . . . . .
Table XV. Stomach contents of king crabs collected viatrawls in Kiliuda Bay, April 1978. . . . . . . . . . . . .
90

LIST OF TABLES (CONT'D)
Table XVI. Stomach contents of king crabs collected via
trawls in Kiliuda Bay, June 1978 . . . . . . . . . . ..
Table XVII. Stomach contents of king crabs collected via
trawls in Kiliuda Bay, July 1978 . . . . . . . . . . . .
Table XVIII. Stomach contents of king crabs collected via
trawls in Kiliuda Bay, August 1978 . . . . . . . . . . .
Table XIX. Stomach contents of king crabs collected via
trawls in Kiliuda Bay, November 1978 . . . . . . . . . .
Table XX. Stomach contents of king crabs collected viaSCUBA in near island basin, May 1978 . . . . . . . . . .
Table XXI. Stomach contents of king crabs collected via
SCUBA in near island basin, June 1978. . . . . . . . . .
Table XXII. Stomach contents of king crabs collected via
SCUBA in near McLinn Island, May 1978. . . . . . . . . .
Table XXIII. Stomach contents of king crabs collected via
SCUBA at Anton Larsen Bay, Site #1. June 1978 . . ...
Table XXIV. Stomach contents of king crabs collected via
SCUBA at Anton Larsen Bay, Site #2. June 1978 .....
Table XXV. Stomach contents of king crabs collected via
trawls on the Kodiak Shelf, June-July 1978 . . . . . . .
Table XXVI. Station data and stomach contents of king
crabs collected via trawls on the Kodiak Shelf,June-July 1978 . . . . . . . . . . . . . . . . . . . . .
Table XXVII. Stomach contents of additional selectedspecies from the Kodiak Island region, 1978. . . . . . .
91

LIST OF FIGURES
Figure 1. Benthic trawl stations occupied in Izhut Bay,Afognak Island, 1978. The bay is divided into
three areas referred to in the text. . . . . . . . . . . . .
Figure 2. Benthic trawl stations occupied in Kiliuda Bay,
Kodiak Island, 1978. The bay is divided into
four areas referred to in the text . . . . . . . . . . . . .
Figure 3. Locations where king crabs were collected viaSCUBA for stomach analysis, 1978.. . . . . . . . . . . . . .
Figure 4. Benthic trawl stations occupied adjacent toPortlock Bank, March 1978. . . . . . . . . . . . . . . . . .
Figure 5. Benthic stations occupied on the Kodiak
continental shelf, June-July 1978 . . . . . . . . . . . ..
92

I. SUMMARY OF OBJECTIVES, CONCLUSIONS AND IMPLICATIONSWITH RESPECT TO OCS OIL AND GAS DEVELOPMENT
Until recently little was known about the biology of the invertebrates
of the shallow, nearshore benthos of Kodiak Island. Since these inverte-
brates may be the ones most affected by petroleum operaions in waters
adjacent to Kodiak Island, baseline data on these species are essential
before industrial activities begin there.
The specific objectives of this investigation of Kodiak Island
addressed in this Annual Report are:
1. On a limited basis, assess distribution and relative abundance ofepifaunal invertebrates in selected bays and offshore areas.
2. Determine the feeding habits of the principal inshore epifaunalinvertebrate species, emphasizing king crabs, and selectedbottomfishes.
Thirty-nine permanent benthic stations were established in two bays -
25 stations in Izhut Bay and 14 stations in Kiliuda Bay. These stations
were sampled with a try net and/or a 400-mesh Eastern otter trawl on six
separate cruises: April, May, June, July, August, and November 1978.
Taxonomic analysis of the epifauna collected delineated nine phyla in each
bay. The dominant invertebrate species had distinct biomass differences
between the bays. Important species, in terms of biomass, in Izhut Bay
were snow crabs (Chionoecetes bairdi) and sunflower sea stars (Pycnopodia
helianthoides). Kiliuda Bay was dominated by king crabs (Paralithodes
camtschatica), snow crabs, and pink shrimps (Pandalus borealis).
Offshore sampling was conducted in March 1978 adjacent to Portlock Bank
and in June-July 1978 along the entire east side of the Kodiak Island conti-
nental shelf. The most important group, in terms of biomass, collected near
Portlock Bank was echinoderms, specifically sea stars and sea urchins. King
and snow crabs were the second-most important group from this area. Kodiak
shelf sampling in June-July revealed king and snow crabs as the dominant
species.
Stomachs of king crabs collected via trawling and spring SCUBA activities,
contained a wide variety of prey. Prey of crabs from Izhut Bay was dominated
by fishes. Crabs from Kiliuda Bay mainly preyed upon molluscs, specifically
93

clams. Food obtained from king crabs from the June-July 1978 Kodiak shelf
sampling consisted mainly of clams and cockles, however, crustaceans and
fishes were also important. King crabs collected during SCUBA sampling
mainly contained clams and acorn barnacles.
Food data for king and snow crabs, and pink shrimps will be available
for the Final Report, and these data, in conjunction with similar data from
Cook Inlet and the Bering Sea, will enhance our understanding of the tro-
phic role of these crustaceans in their respective ecosystems. Additional
food data for the sea star Pycnopodia helianthoides and bottomfishes, as
well as an assessment of the literature, will make it possible to develop
a food web for benthic and nektobenthic species of inshore and offshore
waters around Kodiak Island. Comprehension of basic food interrelationships
is essential for assessment of the potential impact of oil on the crab-
shrimp-dominated benthic systems of the waters adjacent to Kodiak.
The importance of deposit-feeding clams in the diet of king and snow
crabs in Kodiak waters has been demonstrated by preliminary feeding data
collected there. It is suggested that an understanding of the relationship
between oil, sediment, deposit-feeding clams, and crabs be developed in a
further attempt to understand the possible impact of oil on the two commer-
cially important species of crabs in the Kodiak area.
Initial assessment of data suggests that a few unique, abundant and/
or large invertebrate species (king crab, snow crab, several species of
clams) are characteristic of the bays investigated and that these species
may represent organisms that could be useful for monitoring purposes.
It is suggested that a complete understanding of the benthic systems
of Kodiak waters can only be obtained when the infauna is also assessed in
conjunction with the epifauna. Based on stomach analyses, infaunal species
are important food items for king and snow crabs. However, the infaunal
components of the Kodiak shelf have not been quantitatively investigated
to date. A program designed to examine the infauna should be initiated in
the very near future.
94

II. INTRODUCTION
GENERAL NATURE AND SCOPE OF STUDY
The operations connected with oil exploration, production, and trans-
portation in the northeast Gulf of Alaska (NEGOA) and waters adjacent to
Kodiak Island present a wide spectrum of potential dangers to the marine
environment (see Olson and Burgess, 1967 and Malins, 1977 for general
discussion of marine pollution problems). Adverse effects on the marine
environment of this area cannot be assessed, or even predicted, unless
background data are recorded prior to industrial development.
Insufficient long-term information about an environment, and the basic
biology and recruitment of species in that environment, can lead to erroneous
interpretations of changes in types and density of species that might occur
if the area becomes altered (see Nelson-Smith, 1973; Pearson, 1971, 1972,
1975; Rosenberg, 1973 for general discussions on benthic biological investi-
gations in industrialized marine areas). Populations of marine species
fluctuate over a time span of a few to 30 years, but such fluctuations are
typically unexplainable because of the absence of long-term data (Lewis,
1970; and personal communication).
Benthic organisms (primarily the infauna but also sessile and slow-
moving epifauna) are particularly useful as indicator species for a dis-
turbed area because they tend to remain in place, typically react to long-
rang environmental changes, and by their presence, generally reflect the
nature of the substratum. Consequently, the organisms of the infaunal
benthos have frequently been chosen to monitor long-term pollution effects,
and are believed to reflect the biological health of a marine area (see
Pearson, 1971, 1972, 1975 and Rosenberg, 1973 for discussion on long-term
usage of benthic organisms for monitoring pollution; and Feder and Matheke,
in press; for data and discussion on the infauna of NEGOA).
The presence of large numbers of epifaunal species of actual or poten-
tial commercial importance (crabs, shrimps, snails, finfishes) in NEGOA and
on the shallow shelf adjacent to Kodiak Island further dictates the necessity
of understanding benthic communities since many commercial species feed on
infaunal and small epifaunal residents of the benthos (see Zenkevitch, 1963
for a discussion of the interaction of commercial species and the benthos;
95

also see appropriate discussion in Feder et al., 1978a; Feder et al., 1978b).
Any drastic changes in density of the food benthos could affect the health
and numbers of these commercially important species.
Experience in pollution-prone areas of England (Smith, 1968); Scotland
(Pearson, 1972, 1975); and California (Straughan, 1971) suggests that at
the completion of an initial study, selected stations should be examined
regularly on a long-term basis to determine changes in species content,
diversity, abundance and biomass. Such long-term data acquisition should
make it possible to differentiate between normal ecosystem variation and
pollutan-induced biological alteration. Intensive investigations of the
benthos of the Kodiak Continental Shelf are essential to understand the
trophic interactions involved in this area and the changes that might take
place once oil-related activitiies are initiated.
The benthic biological program in NEGOA (Feder, 1978) has emphasized
development of an inventory of species as part of the examination by the
Outer Continental Shelf Environmental Assessment Program (OCSEAP) of bio-
logical, physical and chemical components of shelf slated for oil explora-
tion and drilling activity. In addition, a program designed to quantita-
tively assess assemblages (communities) of benthic species on the NEGOA
shelf has expanded the understanding of distribution patterns of species
there (Feder et at., 1978a; Feder and Matheke, in press). Investigations
connected with distribution, abundance, community structure, and trophic
relationships of benthic species in Cook Inlet, two Kodiak Island bays,
and the S. E. Bering Sea have recently been completed (Feder et at., 1978a;
Feder and Jewett, 1977; Feder et al., 1978b). However, detailed information
on the temporal and spatial variability of the benthic fauna is sparse.
The project considered in this Annual Report was designed to survey
the benthic fauna including feeding interactions, on the Kodiak Island shelf
in regions of potential oil and gas concentrations. Data were obtained
seasonally on faunal composition and abundance to develop baselines to
which future changes could be compared. Long-term studies on life histories
and trophic interactions of important species should define aspects of
communities and ecosystems potentially vulnerable to environmental damage,
and should help to determine rates at which damaged environments can recover.
96

RELEVANCE TO PROBLEMS OF PETROLEUM DEVELOPMENT
Lack of an adequate data base elsewhere makes it difficult to predict
the effects of oil-related activity on the subtidal benthos of the Kodiak
shelf. However, OCSEAP - sponsored research activities on the shelf should
ultimately enable us to point to certain species or areas that might bear
closer scrutiny once industrial activity is initiated. It must be empha-
sized that a considerable time frame is needed to comprehend long-term
fluctuations in density of marine benthic species; thus, it cannot be ex-
pected that short-term research programs will result in predictive capa-
bilities. Assessment of the environment must be conducted on a continuing
basis.
As indicated previously, infaunal organisms tend to remain in place
and, consequently, have been useful as indicator species for disturbed areas.
Thus, close examination of stations with substantial complements of infaunal
species is warranted (see Feder and Mueller, 1975; Feder and Matheke, in
press, and NODC data on file for examples of such stations). Changes in
the environment at stations with relatively large numbers of species might
be reflected by a decrease in diversity with increased dominance of a few
species (see Nelson-Smith, 1973 for further discussion of oil-related changes
in diversity). The potential effects of loss of species to the trophic
structure on the Kodiak shelf cannot be assessed at this time, but the prob-
lem can be better addessed once benthic food studies resulting from recent
projects are analyzed (Jewett and Feder, 1976; Feder et al., 1978a; Feder
and Jewett, 1977, 1978; Smith et al., 1978).
Data indicating the effect of oil on subtidal benthic invertebrates
are fragmentary (see Boesch et al., 1974; Malins, 1977 and Nelson-Smith,
1973 for reviews; Baker, 1977 for a general review of marine ecology and
oil pollution), and virtually no data are available for the Kodiak shelf.
Snow crabs (Chionoecetes bairdi) are conspicuous members of the shallow
shelf of the Gulf of Alaska, inclusive of the Kodiak region, and this species
supports a commercial fishery of considerable importance. Laboratory experi-
ments with this species have shown that postmolt individuals lose most of
their legs after exposure to Prudhoe Bay crude oil; obviously this aspect
of the biology of the snow crab must be considered in the continuing
97

assessment of this species (Karinen and Rice, 1974). Mecklenburg et al.
(1976) examined the effects of Cook Inlet crude oil water soluble fractions
on survival and molting of king crab (Paralithodes camtschatica) and coon-
stripe shrimp (Pandalus hypsinotus) larvae. Molting was permanently in-
hibited by exposing both larvae for 72 hours at a concentration of 0.8 to
0.9 ppm. Larvae that failed to molt had died in seven days, although the
contaminated water had been replaced with clean water. Although high con-
centrations of oil killed the larvae in 96 hours, lower concentrations
disrupted swimming and molting in the same period and also ultimately
resulted in death. Little other direct data based on laboratory experiments
are available for subtidal benthic species. Experimentation on toxic effects
of oil on other common members of the subtidal benthos should be encouraged
in future in OCSEAP programs.
A direct relationship between trophic structure (feeding type) and
bottom stability has been demonstrated by Rhoads (see Rhoads, 1974 for
review). A diesel fuel spill resulted in oil becoming absorbed on sediment
particles with resultant mortality of many deposit feeders on sublittoral
muds. Bottom stability was altered with the death of these organisms, and
a new complex of species became established in the altered substratum. The
most common members of the infauna of the Gulf of Alaska and the Bering Sea
are deposit feeders; thus, oil-related mortality of these species could re-
sult in a changed near-bottom sedimentary regime with subsequent alteration
of species composition.
As suggested above, upon completion of initial baseline studies in
pollution prone areas, selected stations should be examined regularly on
a long-term basis. Also, intensive examination of the biology (e.g., age,
growth, condition, reproduction, recruitment, and feeding habits) of selected
species should afford obvious clues of environmental alteration.
III. CURRENT STATE OF KNOWLEDGE
Few data on non-commercially important invertebrates of the nearshore
benthos of the Gulf of Alaska were published until recent OCSEAP studies
were initiated, e.g. Feder (1977), although a summary of information prior
to OCSEAP was available in the literature review of Rosenberg (1972).
98

To date, Russian workers have published most of the data from the western
Gulf of Alaska (AEIDC, 1974); however, OCSEAP investigations in the north-
east Gulf of Alaska (NEGOA) provide some useful data from adjacent areas
(Feder, 1977; Feder et al., 1978a). The Soviet benthic work was accom-
plished in the deeper waters of the Kodiak shelf, and was of a semi-
quantitative nature with little data useful for predicting the effects of
oil on the benthos.
The exploratory trawl program of the National Marine Fisheries Service
is the most extensive investigation of commercially important species of
the Kodiak shelf (Ronholt et aZ., 1978; unpublished data; reports available
from the National Marine Fisheries Service Laboratory, Kodiak). Some informa-
tion on non-commercial invertebrates species is included in the data reports
of the National Marine Fisheries Service, but the general nature of the tax-
onomy of species caught on their surveys makes their data difficult to
interpret. However, the dominant groups of organisms likely to be encountered
in the offshore waters of the Kodiak shelf are suggested by these studies.
The International Pacific Halibut Commission surveys parts of the Kodiak
shelf annually, but only records commercially important species of crabs and
fishes; non-commercially important invertebrate and fish species are generally
lumped together in the survey reports with little specific information
available.
Additional, but unpublished data on the epifauna in the vicinity of
Kodiak Island are available as a by-product of the Alaska Department of Fish
and Game King Crab Indexing Surveys (inquiries concerning these reports may
be directed to Alaska Department of Fish and Game, Box 686, Kodiak).
A compilation of data on renewable resources of the Kodiak shelf is
included in the publication on Kodiak by AEIDC (1974).
A recent inshore survey of the Kodiak shelf examined the invertebrate
benthos, and collected limited data on the food of the yellowfin sole (Feder
and Jewett, 1977). This study investigated the distribution, abundance,
aspects of reproduction, and feeding interactions of the benthos of two bays
of Kodiak Island, Alitak and Ugak Bays. The food of the Pacific cod and
two species of sculpins from the outer Kodiak shelf are presented in Jewett
(1978) and Jewett and Powell (in prep.), respectively. Sufficient data were
99

available from these studies and MacDonald and Petersen (1976) to develop
a preliminary food web for the two bays and inshore waters around Kodiak
Island (Feder and Jewett, 1977). The potential response of the inshore benthic
system to oil-related activities in the two bays and inshore waters around
Kodiak island is discussed in Feder and Jewett (1977).
Commercial catch statistics of Kodiak crab stocks in past years showed
classic exploitation patterns with a peak year catch occurring in the 1965-
66 season. Since that time, annual harvest levels (quotas) have been imposed.
Recent data substantiate that king crab stocks are responding to the reduced
fishing pressure resulting from this management decision, and populations
are apparently in the rebuilding phase. The two most commercially utilized
stocks are southern district stocks II and III which cover Kodiak Island's
southern waters to the continental shelf edge (Guy Powell and Alaska Depart-
ment of Fish and Game Reports, unpub.). Recent trawl studies conducted in
two Kodiak Bays (Alitak and Ugak) show king crabs as the dominant species
there (Feder and Jewett, 1977). Alitak Bay is also a major king crab breed-
ing area (Gray and Powell, 1966; Kingsbury and James, 1971).
Based on OCSEAP feeding studies initiated in the northeast Gulf of
Alaska (inclusive of Cook Inlet) and two bays on Kodiak Island (Feder, 1977;
Feder and Jewett, 1977), it is apparent that benthic invertebrates play a
major role in the food dynamics of commercial crabs and demersal fishes on
the Kodiak shelf.
Although OCSEAP sponsored research has initiated some inshore benthic
studies in the Kodiak area, the coverage has been restricted geographically.
Furthermore, little offshore benthic data is available to integrate with
the inshore benthic work. Species found in bays, shallow inshore areas and
deeper benthos of the Kodiak shelf are all highly mobile, and some of the
more important species (e.g. king crabs, snow crabs, halibut) migrate between
deep and shallow water during the course of a year. Data collected for these
species only from inshore areas will not address their biological interac-
tions in deeper shelf waters. Expansion of the data base from inshore to
offshore waters is especially important to fully comprehend the biology of
the commercially important king crab. The commercial pursuit of the latter
100
species results in the most important invertebrate fishery in Alaska waters,
and Kodiak king crab stocks support a substantial portion of the fishery.
IV. STUDY AREA
A large number of stations were occupied on the Kodiak Continental
Shelf in conjunction with the Alaska Department of Fish and Game and National
Marine Fisheries Service (Appendix A, Table 1). Inshore areas most extensively
sampled by trawl included Izhut Bay, located on the southeast side of Afognak
Island, and Kiliuda Bay, located on the east side of Kodiak Island (Figs. 1
and 2). Additional inshore areas were sampled on Kodiak Island by SCUBA:
Near Island Basin; McLinn Island, and Anton Larsen Bay (Fig. 3). Outer shelf
stations were occupied by trawl near Portlock Bank (Fig. 4), and by trawl and
pipe dredge along the east side of the Kodiak Island Shelf (Fig. 5).
V. SOURCES, METHODS AND RATIONALE OF DATA COLLECTION
Data on benthic epifauna, including feeding data on crabs, and fishes,
were collected during ten cruises in 1978-79. The NOAA Ship Miller Freeman
was used primarily for offshore sampling, and the M/V Yankee Clipper and the
R/V Commando were used primarily for inshore collecting.
Sampling from the Miller Freeman was conducted 21-24 March 1978, 19-9
June-July 1978, and 14-24 February 1979 using a commercial-size 400-mesh
Eastern otter trawl (12.2 m horizontal opening). A pipe dredge was also
used from the Freeman in June-July 1978 and February 1979 to obtain in-
vertebrates to aid in the identification of invertebrate and fish stomach
contents.
The Yankee Clipper sampled 10-22 April, 7-15 May, 7-22 June, 9-21 July,
and 8-23 August 1978. The Commando also sampled 7-15 May, 7-22 June, 9-21
July, and 8-23 August 1978, in addition to 4-17 November 1978 and 1-20 March
1979. A trynet (6.1 m horizontal opening) was used from the Clipper, and a
try-net and Eastern otter trawl were used from the Commando.
Exploratory diving for crabs, via SCUBA, was conducted near the city
of Kodiak in May, June and October 1978. SCUBA-caught king crabs, obtained
for stomach analysis, were caught in May at Near Island Basin (57°47.0' lat.
N, 152°3.0' long. W and near McLinn Island (57°46.2' lat. N, 152°27.0' long. W.)
101

Figure 1. Benthic trawl stations occupied in Izhut Bay, Afognak Island,1978. The bay is divided into three areas referred to in thetext.
102

Figure 2. Benthic trawl stations occupied in Kiliuda Bay, Kodiak Island, 1978. They bay is dividedinto four areas referred to in the text.

Figure 3. Locations where king crabs were collected via SCUBA for stomachanalysis, 1978.
104

Figure 4. Benthic trawl stations occupied adjacent to Portlock Bank, March 1978.
105

Figure 5. Benthic stations occupied on the Kodiak continental shelf, June-July 1979.
106

and in June at Near Island Basin and two locations in Anton Larsen Bay
(57°52.0' lat. N, 152°37.4' long. W and 57°52.5' lat. N, 152°39.0' long. W).
Invertebrates from the trawls were sorted on shipboard, given tentative
identifications, counted and weighed. Aliquot samples of individual taxa
were labeled and preserved for final identification at the University of
Alaska, Fairbanks. Invertebrates from the pipe dredge were sorted, identified,
and counted at the University of Alaska. Non-commercial invertebrates from
some Izhut and Kiliuda Bay stations in June and August were inadvertently
not recorded.
Biomass per unit area (g/m 2) is included for all trawl data and is
calculated as follows:k
Biomass = E [weight/(distance fished x trawl width)]i=l
Analysis of food habits of a variety of predators taken by trawl was
conducted in the laboratory at the University of Alaska. A summary of the
number of stomachs examined by sampling area and collection period is in-
cluded in Table I.
On shipboard, king crabs selected for stomach analysis were measured
(length in millimeters) and weighed (wet weight in grams). Carapace length
is defined as the distance from the posterior margin of the right orbital
indentation to the mid-point of the posterior marginal indentation. Crabs
were categorized as belonging to one of eight classes (Powell et at., 1974):
(1) juvenile females less than 120 mm; (2) adult females greater than 94 mm;
(3) newshell males less than 100 mm - individuals that molted during the
last molting period; (4) oldshell males less than 100 mm - individuals that
failed to molt during the last molting period, often referred to as skipmolts;
(5) very oldshell males less than 100 mm - individuals that failed to molt
during the two or more molting periods, often referred to as double skipmolts;
(6) newshell males greater than 100 mm; (7) oldshell males greater than 100
mm; and (8) very oldshell males greater than 100 mm. Stomachs 1 and intestines
removed and were placed in plastic "Whirlpak" bags and fixed in 10% buffered
formalin and final identification at the University of Alaska, Fairbanks.
¹In this study, references to crab stomachs includes that portion extending
from the terminal portion of the esophagus to the beginning of the intes-tine.
107

TABLE I
THE NUMBER OF STOMACHS FROM EACH PREDATOR EXAMINED BY SAMPLING AREA AND COLLECTION PERIOD. ALL PREDATORS WERE TAKEN BY TRAWL.

In the laboratory, stomach contents were removed, and sorted by taxon.
Each taxon was blotted dry, weighed to the nearest 0.001 g, measured volu-
metrically by water displacement to the nearest 0.01 ml. Taxon weighing was
accomplished by weighing a vial with a known quantity of water and then
weighing the vial and water plus the taxon. The difference in the two weights
equal the taxon weight.
Food material may never completely fill a stomach to the theoretical
maximum volume. Large quantities of digestive fluids, in addition to hard
and bulky food material that is not readily compressed prevents filling to
capacity.
The fullness of stomach was calculated using a method adapted from
Cunningham (1969) for southeast Bering Sea king crabs. He delineated a
curvilinear relationship between king crab length and the theoretical
maximum stomach volume. To do this, he measured the maximum stomach volume
of 216 crabs which ranged from 80-180 mm carapace length. The regression2
formula was Y = 34.25 - 0.72x + 0.0047x , and the correlation coefficient
was 0.899. Since king crabs examined in our study were similar in size to
those examined by Cunningham, we used his regression formula with our crabs
to calculate the theoretical maximum volumes. The percent of fullness was
derived by dividing the observed volume by the theoretical maximum volume.
The prey in the intestines of king crabs were examined and recorded by
frequency of occurrence.
Fish stomachs were examined when possible, and contents were recorded
as frequency of occurrence.
109

VI. RESULTS
TRAWL DATA: DISTRIBUTION-BIOMASS
Izhut Bay
April 1978 (Tables II-VII; Fig. 1)
Eight stations were successfully trawled with a try net in Izhut Bay,
April 1978. All station depths were less than 36 m. The mean epi-2
faunal invertebrate biomass was 1.56 g/m , and the dominant phyla, in
terms of percent biomass, were Porifera (21.9%) and Echinodermata (61.7%).
Sponges were not identified to species. The leading echinoderm species
was the sea star Pycnopodia helianthoides (60.7%). The only commercially-
important invertebrate was the snow crab Chionoecetes bairdi which com-
prised 3.7% of the invertebrate biomass. The majority of snow crabs came
from Kitoi Bay, Area III, station 554.
May 1978 (Tables II-VII; Fig. 1)
A total of 14 stations were occupied in Izhut Bay in May, 12 with a
try net and two with an otter trawl. The mean epifaunal invertebrate2
biomass for all stations was 1.83 g/m . Leading phyla were Arthropoda
(Crustacea) (44% of the biomass) and Echinodermata (50.8%). Arthropods
consisted primarily of the pink shrimp Pandalus borealis (22.5%),
Chionoecetes bairdi (12.7%), the king crab Paralithodes camtschatica (3.9%),
and the dungeness crab Cancer magister (3.7%). The largest catch of P.2
borealis came from Area III at station 557; 33.7 kg or 3.45 g/m . The
largest snow crab catch was 26.5 kg in Area I at station 3. Dominant
echinoderms were the sea stars Pyonopodia helianthoides (37.9%) and
Stylasterias forreri (11.4%).
June 1978 (Tables II-VII; Fig. 1)
Benthic trawling in Izhut Bay in June was successfully accomplished
at 14 stations, 11 try net stations and three otter trawl stations. Use
of the try net aboard the Yankee Clipper was restricted to stations in
less than 73 m of water due to the loss of the trawl winch on the preceding
cruises (May 1978). The try net had to be deployed via the use of a
capstan and 5/8 inch polyethylene line. Several unsuccessful attempts to
110

TABLE II
TRAWL STATIONS OCCUPIED IN IZHUT AND KILIUDA BAYS, 1978, AND STATIONS WHERE LARGE NUMBERS
OF KING. CRABS, SNOW CRABS AND/OR PINK SHRIMP WERE COLLECTED

TABLE III
SUMMARY OF TRAWL ACTIVITIES FROM IZHUT AND KILIUDA BAYS, 1978

TABLE IV
PERCENT BIOMASS COMPOSITION OF THE INVERTEBRATE PHYLA OFIZHUT AND KILIUDA BAYS, 1978
113

TABLE V
PERCENT BIOMASS COMPOSITON OF THE INVERTEBRATE FAMILIESOF IZHUT AND KILIUDA BAYS, 1978
114

TABLE VI
PERCENT BIOMASS COMPOSITION OF THE INVERTEBRATES
OF IZHUT AND KILIUDA BAYS, 1978
115

TABLE VII
INVERTEBRATES TAKEN BY TRAWL IN IZHUT BAY, 1978
X = Taxon Collected
116
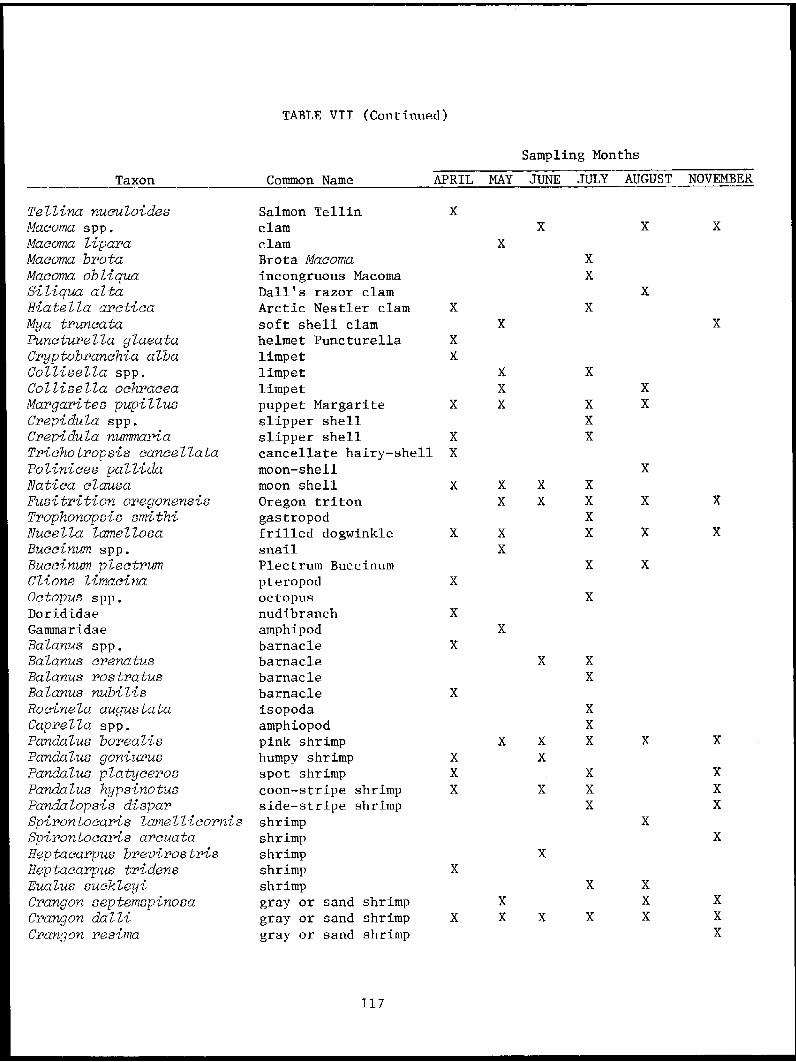
TABLE VII (Continued)
117

TABLE VII (Continued)
118

TABLE VII (Continued)
119

sample stations deeper than 73 m were made. Of the five tows taken aboard
the Commando, two were taken at depths of 174-201 m, stations 7 and 8 in
Area I. These two tows yielded a total of 840 Chionoecetes bairdi and 22
Paralithodes camtschatica. Approximately 65-75% of the C. bairdi were
relatively soft; most had formed a new exoskeleton and were nearing ecdysis.
Several of the P. cantschatica were also in this condition. The mean epi-2
faunal invertebrate biomass for all stations was 7.10 g/m . Dominant phyla
from all stations were Arthropoda (83.4%) and Echinodermata (15.6%).
Chionoecetes bairdi (78.8%) and Pycnopodia helianthoides (14.9%) were the
most important arthropods and echinoderms, respectively.
July 1978 (Tables II-VII; Fig. 1)
Nineteen stations were successfully sampled in Izhut Bay in July.
The try net was used at 15 stations and the otter trawl was used at four2stations. The mean invertebrate biomass was 2.74 g/m . Dominant taxa,
in terms of percent biomass, were arthropods (58.7%), specifically,
Chionoecetes bairdi (30%) and Pandalus borealis (12.3%), and echinoderms
(33.3%), specifically, Pycnopodia helianthoides (26.8%).
The greatest diversity occurred southwest of Pillar Cape in Area I
at station 585 where approximately 62 species of invertebrates were taken.
In Saposa Bay, with the exception of the sea anemone Metridium senile, both
tows contained dead and decaying invertebrate and plant material. The
strong odor of H2S in the black mud was present in both tows. Of the four
tows taken by otter trawls, two (Area I, stations 8 and 9) were taken at
depths of 87 to 189 m. These two tows yielded 350 Chionoecetes bairdi.
Eighteen Paralithodes camtschatica came from station 9. Stations 557 of
Area III and 526 and 527 of Area II yielded the largest catches of pink
shrimp.
August 1978 (Tables II-VII; Fig. 1)
A total of 15 successful tows were made in Izhut Bay in August, 12
with the try net and three with the otter trawl. The mean invertebrate2
biomass was 3.41 g/m . Arthropods and echinoderms contributed most to the
biomass with 64.7% and 32.9% respectively. Pandalid shrimps, specifically
Pandalus borealis (44.8%) dominated the arthropod biomass. Chionoecetes
120

bairdi contributed 13.9% of the biomass. Station 557 of Area III yielded
the largest catch of pink shrimp (200 kg). Stations 6 and 8 of Area I
were important C. bairdi stations. Important echinoderms were the sea
stars Pycnopodia helianthoides (26.7%) and Evasterias troschelii (5.2%).
Stations in Saposa Bay and Kitoi Bay were nearly devoid of living
organisms.
Large concentrations of the Pacific sand lance Ammodytes hexapterus,
were noted in most portions of Izhut Bay.
November 1978 (Tables II-VII; Fig. 1)
November sampling in Izhut Bay yielded 15 successful stations, 11
with try net and four with otter trawl. Two Saposa Bay stations were
inaccessible due to the large size of the Commando. The mean inverte-
brate biomass was 2.16 g/m2. The biomass was again dominated by arthro-
pods (56.9%) and echinoderms (40.3%). Major arthropods were Chionoecetes
bairdi (44.7%) and Cancer magister (10.7%). Most C. bairdi came from
station 7 of Area I. Pycnopodia helianthoides again dominated the echino-
derms with 38.8% of the biomass.
Kiliuda Bay
April 1978 (Tables II-VI, VIII; Fig. 2)
Only six try net stations were successfully sampled in Kiliuda Bay
in April. Five stations were less than 36 m deep and one was at approx-2
imately 100 m. The mean invertebrate biomass was 2.04 g/m . Arthropods
(90.4% of the biomass), mainly Paralithodes camtschatica (72.9%), made up
the majority of the biomass. The majority of king crabs came from Shear-
water and Santa Flavia Bay at stations 576, 578, 579 and 580.
June 1978 (Tables II-VI, VIII; Fig. 2)
Successful stations sampled in Kiliuda Bay in June totaled eight,
five with try net and three with otter trawl. The mean invertebrate
biomass was 3.63g/m2. Only commercially-important invertebrates were
recorded. Paralithodes camtschatica and Chionoecetes bairdi made up 72.9%
and 26.4% of the mean invertebrate biomass, respectively. Stations 3 and
4 of Area I yielded the greatest number of P. camtschatica. The majority
121

(~85%) of C. bairdi greater than 160 mm in carapace width were soft-shelled
crabs which had recently undergone ecdysis. The highest catch of C. bairdi
was 55.6 kg in Area I, station 5.
July 1978 (Tables II-VI, VIII; Fig. 2)
July sampling in Kiliuda Bay yielded ten successful stations; seven
with try net and three with otter trawl. The mean invertebrate biomass was2
2.23 g/m . Arthropods were the leading group. Paralithodes camtschatica
and Chionoecetes bairdi accounted for 48.2% and 23.3% of the invertebrate
biomass, respectively. Stations 1 and 4 of Area I and stations 579 and
580 of Area IV yielded the greatest catch of P. camtschatica. Large catches
of C. bairdi came from stations 579, 580 and 6. The cnidarian Metridium
senile also made up 12.1% of the biomass.
August 1978 (Tables II-VI, VIII; Fig. 2)
A total of nine stations were successfully sampled in Kiliuda Bay in
August. Six stations were sampled by try net and three stations were sampled2
by otter trawl. The mean invertebrate biomass was 4.68 g/m . The biomass
was dominated by arthropods (96.9%), specifically, Pandalus borealis (69.3%),
Chionoecetes bairdi (13.4%), and Paralithodes camtschatica (11.3%). Large
catches of C. bairdi came from Areas I and IV, stations 2 and 579 respectively.
Stations 2 and 5 in Area I yielded large catches of P. camtschatica. Most P.
borealis came from station SHR. Station 5 yielded high numbers of the large
Pacific cod Gadus macrocephalus and walleye pollock Theragra chatcogramma.
November 1978 (Tables II-VI, VIII; Fig. 2)
November sampling in Kiliuda Bay yielded eight successful stations; six
with try net and two with otter trawl. One otter trawl site and one try net
station were not sampled due to large numbers of "stored" king crab pots and
"fishing" dungeness crab pots. The mean invertebrate biomass was 4.95 g/m ,
with arthropods again dominating the biomass (96.1%). Leading species were
Pandalus borealis (58.1%), Paralithodes camtschatica (24.4%), and Chionoecetes
bairdi (7.8%). Most shrimps were taken from Area I at stations SHR and 5.
Important P. camtschatica stations were 7 and SHR. Snow crabs were mainly
taken at stations 5 and 7.
122

TABLE VIII
INVERTEBRATES TAKEN BY TRAWL IN KILIUDA BAY, 1978
123

TABLE VIII
CONTINUED
124

TABLE VIII
CONTINUED
125

Portlock Bank
March 1978 (Tables IX, XI; Fig. 3)
In March 1978, 12 stations were occupied adjacent to Portlock Bank
by the Miller Freeman. The mean invertebrate biomass was low, 0.47 g/m22
The highest biomass station was station 9 where the biomass was 1.02 g/2
The major phyla were Echinodermata (37.1% of the biomass), Arthropoda
(30.8%), and Mollusca (28.0%). Leading echinoderms were the sea star
Dipsacaster borealis (24.7%), the sea urchin StrongyZocentrotus spp. (10.2%),
and the sea star Diplopteraster multipes (2.2%). Largest catches of Diplo-
pteraster came from stations 5 and 12. Important arthropods were
Chionoecetes bairdi and Paralithodes camtschatica which made up 24.6% and
5.0% of the total invertebrate biomass, respectively. Highest catches of
Chionoecetes came from stations 3 and 4. Dominant molluscs were the snail
Fusitriton oregonensis (14.5%), the snail Neptunea lyrata (6.9%), and
Octopus sp. (4.4%).
Kodiak Shelf
June-July 1978 (Tables X, XI; Fig. 5)
In June-July 1978, 16 stations were occupied by the Miller Freeman on
the Kodiak Continental Shelf. One station, station 2, was not considered
quantitative because the net was torn, however, fish stomachs were examined2
from this station. The mean invertebrate biomass was 3.94 g/m . Arthropods
made up 80.5% of the biomass. Paralithodes camtschatica and Chionoecetes
bairdi accounted for 50.9% and 42.4%, respectively of the arthropod biomass
and 41% and 34%, respectively of the total invertebrate biomass. Para-
lithodes camtschatica was present at nine stations. Highest catches of P.
camtschatica came from stations 7, 8 and 9. The king crab catch at stations
7 and 8 mainly consisted of ovigerous females (78%). King crabs at station
9 were mainly ovigerous females (48%) and adult males (46%).
Chionoecetes bairdi was present at 13 stations and large catches came
from stations 7, 12 and 13. Pandalus borealis also made up 4.2% of the
total biomass. Pandalus borealis was present at seven stations and was
most abundant at station 13.
The second leading phylum was Cnidaria, contributing 8.8% of the biomass.
Leading cnidarians were the sea pen Ptilosarcus gurneyi (3.6% of the biomass),
126

TABLE IX
PERCENT BIOMASS COMPOSITION OF THE LEADING INVERTEBRATE SPECIESCOLLECTED NEAR PORTLOCK BANK, MARCH 1978
TABLE X
PERCENT BIOMASS COMPOSITION OF THE LEADING INVERTEBRATE SPECIES
COLLECTED ON THE KODIAK SHELF, JUNE - JULY 1978
127

TABLE XI
INVERTEBRATES TAKEN BY TRAWL ON THE KODIAK SHELF, 1978
128

TABLE XI
CONTINUED
129

TABLE XI
CONTINUED
130

the sea anemone Metridium spp. (2.5%), and Actiniidae (2.3%). The largest
catch of Ptilosarcus came from station 1.
Echinoderms ranked third in biomass (7.9%). Dominant echinoderms
were the sand dollar Echinarachnius parma and sea cucumbers, Holothuroidea,
which contributed 3.7% and 3.3% of the total biomass, respectively. Echin-
arachnius parma was mainly taken at station 1.
PIPE DREDGE DATA: DISTRIBUTION - RELATIVE ABUNDANCE
Pipe dredge data collected on the Kodiak Shelf in June-July 1978 and
February 1979 to aid in the identification of fish and invertebrate stomach
contents will be included in the Final Report.
REPRODUCTIVE OBSERVATIONS
Reproductive data collected throughout this study will be presented
in the Final Report.
FOOD STUDIES
Paralithodes camtschatica (king crab)
Izhut Bay
June 1978 (Tables XII, XIII; Fig. 1)
King crabs were collected for food analysis in Izhut Bay in June at
stations 7 and 8 of Area I. Twenty-two crabs were taken, of which, 55%
were ovigerous females and 36% were newshell males greater than 100 mm in
length. Twenty of the crabs were feeding on a total of 18 taxa. The mean
percent fullness was 5.5 ± 7.9%. King crab stomachs were dominated by
fishes; 55% by frequency of occurrence and 69% by weight. Arthropods,
echinoderms, and molluscs each accounted for less than 5% of the total
food weight.
Food examined from the intestines of Izhut Bay king crabs was similar
to food found in the stomachs.
July 1978 (Tables XIII, XIV; Fig. 1)
The 18 king crabs collected in July at Izhut Bay, Area I, station 9,
were composed of ovigerous females (66.7%) and newshell males greater than
100 mm in length (33.3%). All but one crab were feeding. Nine different
131

TABLE XII
STOMACH CONTENTS OF KING CRABS COLLECTED VIA TRAWLS IN IZHUT BAY
132

TABLE XIII
INTESTINE CONTENTS OF KING CRABS (Paralithodes camtschatica)FROM THE KODIAK ISLAND REGION, 1978
133

TABLE XIII
CONTINUED
134

TABLE XIII
CONTINUED
135

TABLE XIII
CONTINUED
136

TABLE XIII
CONTINUED
137

TABLE XIII
CONTINUED
138

TABLE XIII
CONTINUED
139

140
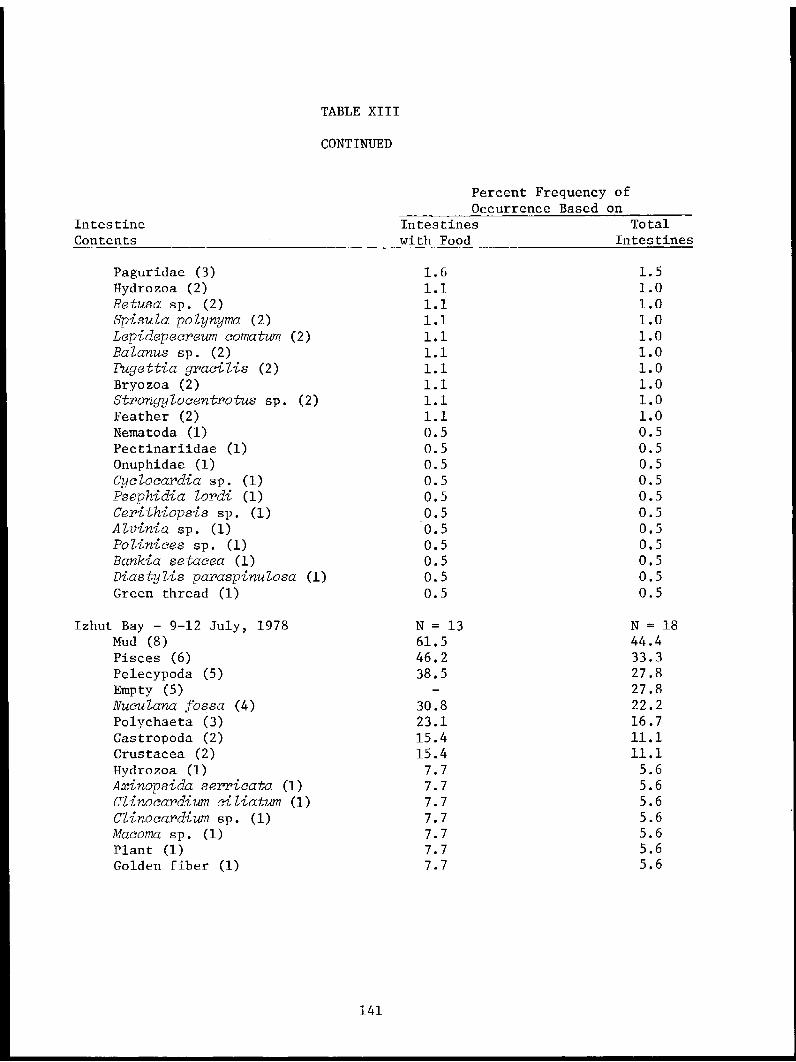
141

142
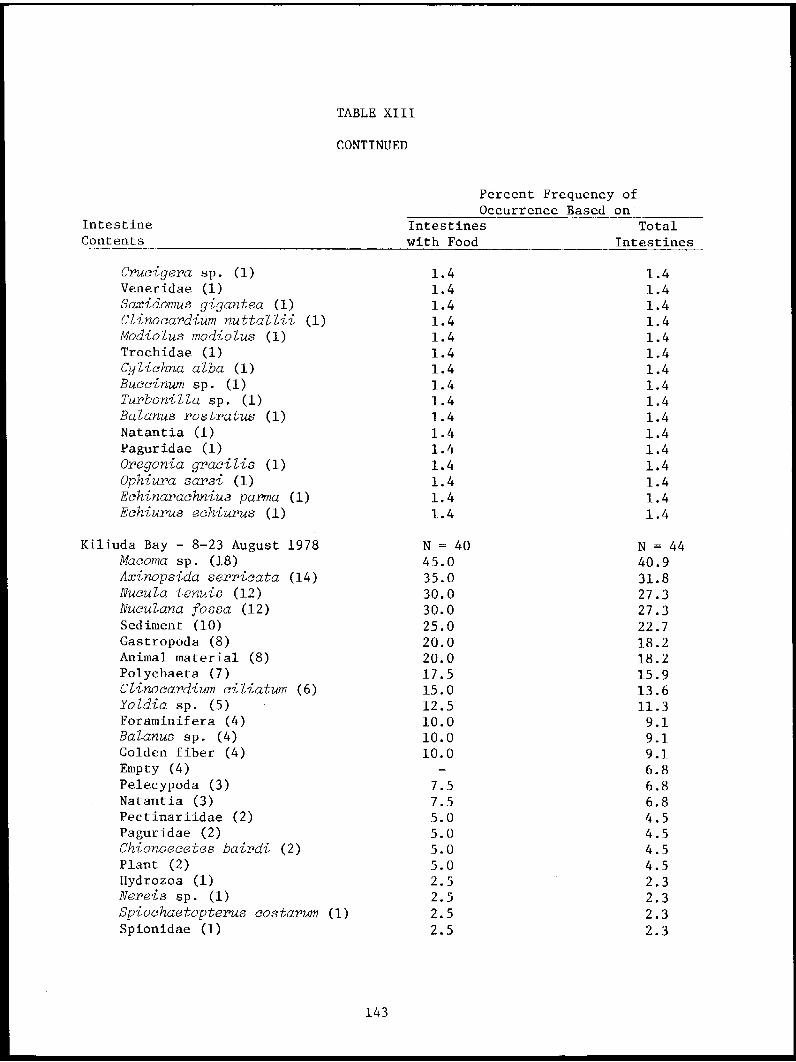
143

144

TABLE XIV
STOMACH CONTENTS OF KING CRABS COLLECTED VIA TRAWLS IN IZHUT BAY
July 1978. Mean Depth 177 meters
145

prey taxa were identified. The mean fullness was 10.3 ± 10.4%. As in
June, the leading prey was fishes; 78% by frequency of occurrence and 92.8%
of the total food weight. Molluscan prey was only 1.5% of the total weight.
Food found in the intestine of Izhut Bay king crabs was similar to food
found in the stomachs.
Kiliuda Bay
April 1978 (Tables XIII, XV; Fig. 2)
Forty-nine king crabs collected in Kiliuda Bay in April came from
stations 576, 577, 578, 579, 580 and SHR. Only 16 (33%) of the crabs
collected contained food. Twenty different taxa were identified. The
mean fullness of the 49 stomachs was 1.9 ± 8.1%. The crab class composi-
tion was mainly ovigerous females (57.1%) and newshell males greater than
100 mm in length (22.4%). No single prey dominated the stomach contents.
The bivalve molluscs Nuculana sp., Clinocardium spp. and Nucula tenuis each
made up 2% or less of the total prey weight. Decapod crustaceans (crabs
and/or shrimps) were found in 8% of the crab examined but only accounted
for 3.2% of the weight. Fishes were found in 2% of the crabs and accounted
for 6.7% of the weight. Seventy percent of the food weight was unidentified
animal material.
Food found in the intestines of Kiliuda Bay king crabs was similar
to food found in the stomachs.
June 1978 (Tables XIII, XVI; Fig. 2)
Eighty-three king crabs collected in Kiliuda Bay in June were of mixed
composition i.e., 12% were ovigerous females, 8.4% were newshell males less
than 100 mm long, 3.6% were oldshell males less than 100 mm, 18.1% were new-
shell males greater than 100 mm, 55.4% were oldshell males greater than
100 mm, and 2.4% were very oldshell males greater than 100 mm. All king
crabs examined came from seven stations: 3, 4, 5, 576, 578, 579 and 580.
Most crabs examined were feeding (95%). A total of 44 different prey taxa
were identified. The mean fullness was 6.9 ± 9.3%. Important prey, in
terms of percent of total prey weight, were pelecypod molluscs (clams),
specifically, Nuculana sp. (14.4%) and Macoma spp. (13.9%). Crustaceans
were dominated by barnacles, Balanus spp., (32%) and decapods 6.3%). Fishes
also accounted for 8.3% of the prey weight.
146

TABLE XV
STOMACH CONTENTS OF KING CRABS COLLECTED VIA TRAWLS IN KILIUDA BAY
April 1978. Mean Depth 38.6±30.4 meters
147

TABLE XVI
STOMACH CONTENTS OF KING CRABS COLLECTED VIA TRAWLS IN KILIUDA BAY
June 1978. Mean depth 46±25 meters
148

Food found in the intestines of Kiliuda Bay king crabs was similar to
food found in the stomachs.
July 1978 (Tables XIII, XVII; Fig. 2)
Seventy-one king crabs were collected in Kiliuda Bay in July at
stations 1, 4, 6, 576, 578, 579, 580 and SHR. The crabs were mainly
ovigerous females (57.5%), oldshell males greater than 100 mm in carapace
length (18.3%), and newshell males greater than 100 mm (11.3%). All but
one crab contained food. The mean percent fullness was 8.8 ± 9.5%.
Sixty-five different taxa were identified as prey. The most important
prey items, in terms of percent of total food weight, were the Arthropoda.
Barnacles, mainly Balanus crenatus, accounted for more than 50% of the food
weight. Chionoecetes bairdi occurred in 27% of the stomachs examined but
made up only 5.1% of the weight. Another important food group was the Pele-
cypoda (clams, cockles). The clams Nuculana spp. and Macoma spp. accounted
for 15.8% and 11.1% of the weight, respectively. Nucula tenuis and Clino-
cardium ciliatum contributed 4.8% and 2.5% of the weight, respectively.
Fishes composed 1.4% of the food weight.
Food from the intestines of these king crabs was similar to food found
in the stomachs.
August 1978 (Tables XIII, XVIII; Fig. 2)
Forty-four king crabs were collected for food analysis at stations 2,
4, 5, 579 and SHR. The crabs were mainly composed of newshell males
greater than 100 mm in length (43.2%), oldshell males greater than 100 mm
(25%), and ovigerous females (25%). Twelve of the crabs had empty sto-
machs. The mean percent fullness was 1.9 ± 3.2%. Thirty different prey
taxa were identified. Prey was dominated by pelecypod molluscs, specifically,
Macoma sp. (48.3% of weight), Nuculana sp. (11.4%), and Nucula tenuis (7.2%).
Decapods occurred in 11% of the stomachs but accounted for only 0.9% of the
weight. The sea urchin Strongylocentrotus droebachiensis occurred in only
2% of the crabs but accounted for 15.2% of the weight.
Food found in the intestines of Kiliuda Bay king crabs was similar to
food found in the stomachs.
149

TABLE XVII
STOMACH CONTENTS OF KING CRABS COLLECTED VIA TRAWLS IN KILIUDA BAY
July 1978. Mean Depth 52+31 meters
150

TABLE XVIII
STOMACH CONTENTS OF KING CRABS COLLECTED VIA TRAWLS IN KILIUDA BAYAugust 1978. Mean Depth 71±27 meters
151

November 1978 (Tables XIII, XIX; Fig. 2)
Fifty-five king crabs were collected for food analysis in Area I at
stations 7 and SHR. The crabs were mainly composed of juvenile females
(32.7%), ovigerous females (36.4%), and newshell males greater than
100 mm (18.2%). Forty-nine (89% of all crabs examined) contained food.
The mean percent fullness was 7.8 ± 12.4%, and the total identified
food taxa was 28. Molluscs and arthropods were the dominant foods.
Leading molluscs were the clams Macoma sp. (18.8% of the total weight) and
Axinopsida serricata (4.9%), and gastropods (0.5%). Arthropods were
dominated by Chionoecetes bairdi (3.4%) and Pandalus sp. (18.1%). Fishes
composed 5.7% of the prey weight.
Food found in the intestines of Kiliuda Bay king crabs was similar
to food found in the stomachs.
Near Island Basin
May 1978 (Tables XIII, XX; Fig. 3)
In early May 1978, large concentrations of king crabs were located in
Near Island Basin adjacent to the Kodiak city boat harbor. The crabs were
first sighted from a skiff as they congregated just below the exposed low
intertidal region. Portions of the crabs were uncovered. Subsequent SCUBA
diving revealed several hundred crabs in the low intertidal and shallow sub-
tidal regions. All crabs appeared to have new exoskeletons. King crabs
were observed feeding on green algae, polychaetous annelids, clams - Proto-
thaca staminea, Mya arenaria -, Balanus spp., Strongylocentrotus
droebachiensis, and sea stars - Pycnopodia hetianthoides and Evasterias
troschelii. Small king crabs (15 mm in length) were found under rocks.
Diving was again accomplished at the Near Island Basin site in mid-
May. King crabs were congregated in the shallow sub-tidal region only.
A few crabs were observed feeding on the cockle Clinocardium nuttallii.
Thirty-five crabs were randomly collected for stomach analysis. The crabs
were mainly immature males and females, although some mature individuals
of both sexes were taken.
All crabs taken in mid-May contained food. Thirty-seven prey taxa
were identified, and the mean percent fullness was 4.9 ± 7.5%. Prey items
dominating the stomach weight were molluscs, specifically Macoma spp.
152

TABLE XIX
STOMACH CONTENTS OF KING CRABS COLLECTED VIA TRAWLS IN KILIUDA BAY
November 1978. Mean Depth 89.5±10.6 meters
153
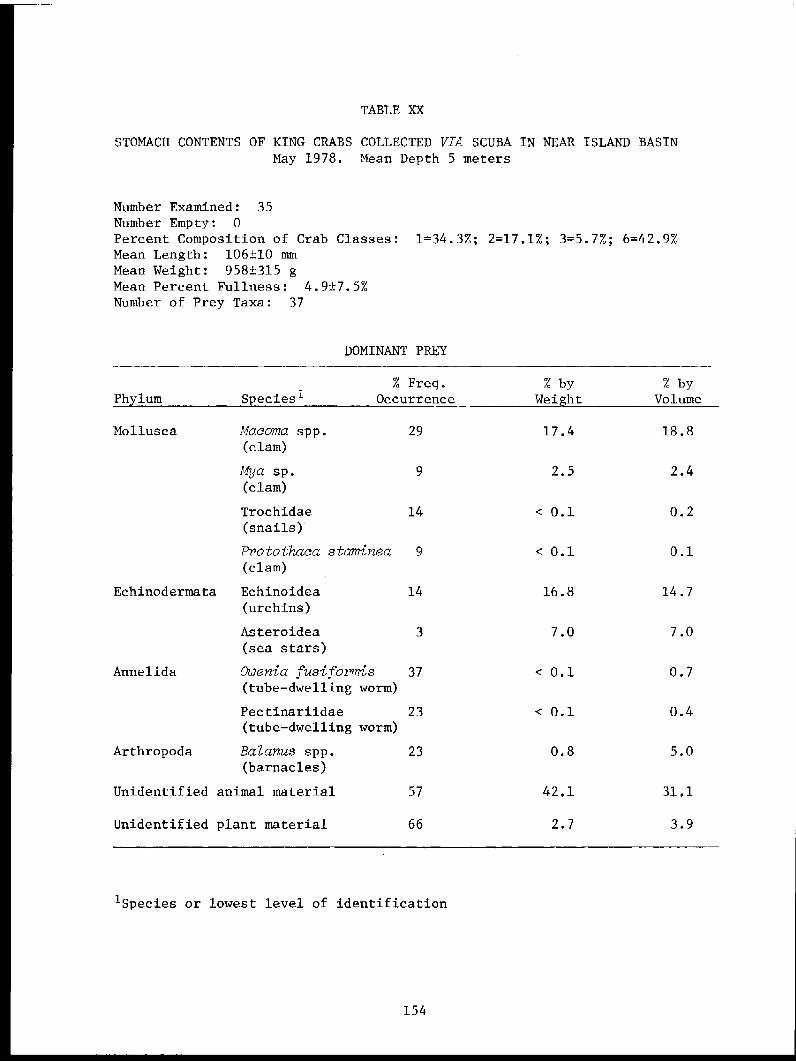
TABLE XX
STOMACH CONTENTS OF KING CRABS COLLECTED VIA SCUBA IN NEAR ISLAND BASIN
May 1978. Mean Depth 5 meters
154

(17.4%), and echinoderms, specifically sea urchins (16.8%). Other impor-
tant molluscs were the clams Mya sp. (2.5%). Protothaca staminea and
gastropods of the family Trochidae each accounted for < 0.1% of the total
food weight. Sea stars consisted of 7% of the total food weight. The
annelids, Owenia fusiformis and pectinarids, and barnacles, BaZanus spp.,
were frequently found among stomach contents although they contributed
little to the overall volume.
Intestines were not examined for food content.
June 1978 (Tables XIII, XXI; Fig. 3)
The Near Island Basin site was revisited in mid-June. Crabs were
in the same location as in May, however, unlike the aggregative behavior
of crabs in May, individuals in June were mainly solitary. The crab class
composition was also the same as in May. Crabs were observed feeding on
Protothaca staminea. Dense clouds of mud in deeper water suggested that
crabs were actively feeding in the immediate vicinity. Thirty-two king
crabs were randomly collected for food analysis. All contained food.
Thirty prey taxa were identified and the mean percent stomach full-
ness was 7.6 ± 7.6%. Barnacles were the most important prey contributing
33% of the food weight. Unidentified pelecypods (10.6%), Macoma spp. (3.5%),
and Protothaca staminea (0.3%) were the most important clams. Once again
annelid worms were dominated by Owenia fusiformis and pectinarids, the
latter worms were frequently taken but added little to the total prey
weight.
Food examined from the intestines of Near Island Basin king crabs
was similar to food found in their stomachs.
McLinn Island
May 1978 (Tables XIII, XXII; Fig. 3)
Diving near McLinn Island in mid-May yielded 49 king crabs for stomach
analysis. Crabs were not widely dispersed, but were found in aggregates
of 4-8 crabs at a mean depth of 9 m. Most crabs were inactive at the time
of capture. Most were immature, newshell crabs of both sexes (mean length
100 ± 9 mm). All crabs examined in the laboratory contained food (48 dif-
ferent prey taxa) with a mean percent fullness of 9.3 ± 11.8%. Dominant
155

TABLE XXI
STOMACH CONTENTS OF KING CRABS COLLECTED VIA SCUBA IN NEAR ISLAND BASIN
June 1978. Mean Depth 6 meters
156

TABLE XXII
STOMACH CONTENTS OF KING CRABS COLLECTED VIA SCUBA IN NEAR McLINN ISLAND
May 1978. Mean Depth 9 meters
157

prey items were molluscs and crustaceans. Unidentified clams were the
main molluscs taken and contributed 30% of the weight. Important clams
that were identified were Hiatella arctica (5.1%), Macoma spp. (1.5%), and
Protothaca staminea (0.9%). The snail Trichotropis cancellata contributed
8.5% by weight. Unidentified decapods (2.7%) and Balanus spp. (3.3%)
were the most important crustaceans.
Food examined from the intestines of McLinn Island king crabs was
similar to food found in their stomachs.
An attempt was made to locate king crabs via SCUBA in the shallows
of Kalsin and Womans Bay in mid-May. No crabs were found although they
were reported one week earlier by ADF&G divers.
The McLinn Island site was revisited in mid-June and no crabs were
found.
Food examined from the intestines of McLinn Island crabs was similar
to food found in their stomachs.
Anton Larsen Bay - Site #1
June 1978 (Tables XIII, XXIII; Fig. 3)
Two sites were examined by SCUBA in Anton Larsen Bay to obtain king
crabs. One collection (site #1) was made across the bay from the boat
ramp. The dive began on a steep slope at 19 m. Ascending up the slope
toward shore it was apparent that barnacles had recently been removed
from the rocky substrate. King crabs were observed at 5 m depth as single
individuls or groups of 2-4. All were actively feeding. Thirty-one crabs
were collected, of which 9.4% were ovigerous females and 81.3% were old-
shell males. Only four of the crabs examined in the laboratory did not
contain food. The mean percent fullness of all crabs examined was 4.4 ±
5.2%. Stomach contents were dominated by Balanus spp. Barnacles made up
56.2% of the stomach weight. Molluscs, specifically Macoma spp. (4.0%),
gastropods (1.5%), Protothaca staminea (0.5%), and Clinocardium spp. (0.8%)
were also important. Hydroids were frequently taken (52%) but yielded
only 0.2% of the volume.
Food examined from the intestines of Anton Larsen Bay site #1 king
crabs was similar to food found in their stomachs.
158

TABLE XXIII
STOMACH CONTENTS OF KING CRABS COLLECTED VIA SCUBA AT ANTON LARSEN BAYSite #1. June 1978. Mean Depth 5 meters
159

Anton Larsen Bay - Site #2
June 1978 (Table XIII, XXIV; Fig. 3)
The second collection of king crabs in Anton Larsen Bay was in a rocky,
kelp-covered region approximately 1.8 km west of the boat ramp. A few crabs
were observed feeding on barnacles. Approximately 12 large and very old-
shell male king crabs were found dead and decaying in this region. Twenty-
one crabs were collected at an average depth of 9 m; 40% were ovigerous
females and 50% were oldshell males of mixed maturity. All crabs examined
in the laboratory, except one, contained food. Food was similar to that
found in the crabs at site #1. Barnacles, mainly Balanus crenatus, accounted
for 77% of the total prey weight. Major molluscs consisted of unidentified
clams (1.8%), Protothaca staminea (1.7%), Hiatella arctica (0.3%), and
Macoma spp. (1.1%). Hydroids were found in 76% of the crabs examined, but
accounted for only 0.2% of the weight.
Food examined from the intestines of king crabs from Anton Larsen Bay
site #2 was similar to food found in their stomachs.
Kodiak Shelf
June-July 1978 (Tables XIII, XXV, XXVI; Fig. 5)
The June-July cruise on the Kodiak Shelf yielded 196 king crabs from
nine stations. One hundred and eighty-seven crabs (95%) had food in their
stomachs. The crabs were mainly composed of ovigerous females (42.9%) and
newshell males greater than 100 mm in carapace length (42.3%). The mean
percent fullness was 9.1 ± 10%. Although station 14 had the highest mean
percent stomach fullness, 21.4 ± 18.2%, only four crabs were collected and
examined. Crabs of stations 13 and 9 also had high stomach fullnesses,
16.2 ± 26.7% and 13.5 ± 9.1%, respectively. King crabs from station 9 had
the highest diversity of prey taxa (63) and the highest diversity of prey
taxa within a single crab (25). The fullest king crab stomach was 78.1%
full; a 112 mm ovigerous female from station 13. This crab was feeding on
Chionoecetes bairdi and fish.
Eighty-six different prey taxa were identified from crabs taken at all
stations. Dominant prey belonged to three phyla: Mollusca, Arthropoda and
Chordata. Clams were the most important molluscs. The clams Nuculana spp.
160

TABLE XXIV
STOMACH CONTENTS OF KING CRABS COLLECTED VIA SCUBA AT ANTON LARSEN BAY
Site #2. June 1978. Mean Depth 9 meters
161

TABLE XXV
STOMACH CONTENTS OF KING CRABS COLLECTED VIA TRAWLS ON THE KODIAK SHELF
June-July 1978. Mean Depth 118±44 meters
162

TABLE XXVI
STATION DATA AND STOMACH CONTENTS OF KING CRABS COLLECTED VIATRAWLS ON THE KODIAK SHELF
June-July 1978
163

and Nucula tenuis made up 22.5% and 8.4% of the weight, respectively, and
were important prey at stations 7, 8, 9 and 10. Important arthropods were
unidentified decapods (6.0%), Chionoecetes bairdi (4.4%), and the pea crab
Pinnixa occidentalis (9.4%). The decapods were important prey at stations
7, 8, 11, 12 and 14. Chionoecetes bairdi was important prey at stations 9,
13 and 14, and Pinnixa occidentalis was important at station 12. Fishes
accounted for 19.6% of the weight and were found in 29% of the crabs.
Fishes were important prey at stations 8, 10, 11, 12, 13 and 14. Unidenti-
fied animal material made up 10.4%.
Food found in king crab intestines were similar to food found in their
stomachs.
Chionoecetes bairdi (snow crab) and Pandalus borealis (pink shrimp)
Feeding data on snow crabs and the pink shrimps will appear in the
Final Report.
Pycnopodia helianthoides (sunflower sea star)
Izhut Bay
May, June, August & November 1978 (Table XXVII)
In four months of sampling for sunflower sea stars, 199 were examined
for food and 148 (74%) contained food. The sea stars were sampled at a
variety of stations. Molluscs dominated the stomach contents in all months.
The snails Oenopota sp. and Solariella sp. were consistently taken as
food. Dominant clams included Nuculana fossa, Psephidia lordi and Spisula
polynyma.
Pycnopodia examined in May and June by SCUBA in shallow bays adjacent
to the city of Kodiak, were observed feeding on the cockle Clinocardium
nuttallii, the clams Mya arenaria, Protothaca staminea, and Saxidomus
gigantea, and barnacles.
Gadus macrocephalus (Pacific cod)
Kodiak Shelf (Table XXVII; Fig. 5)
Pacific cod stomachs examined from the June-July 1978 cruise were dominated
by crustaceans. Ninety-six percent of all cod examined were feeding, and 41
164

TABLE XXVII
STOMACH CONTENTS OF ADDITIONAL SELECTED SPECIES
FROM THE KODIAK ISLAND REGION, 1978
165

TABLE XXVII
CONTINUED
166

TABLE XXVII
CONTINUED
167

TABLE XXVII
CONTINUED
168

TABLE XXVII
CONTINUED
169

TABLE XXVII
CONTINUED
170

TABLE XXVII
CONTINUED
171

TABLE XXVII
CONTINUED
172

TABLE XXVII
CONTINUED
173

TABLE XXVII
CONTINUED
174

prey taxa were identified. The most frequent species were Chionoecetes
bairdi (32.1%), Pandalus borealis (26.8%), Euphausiacea (23.7%), fishes
(18.4%), crangonid shrimps (14.2%), the pea crab Pinnixa occidentalis
(10%), and walleye pollock Theragra chalcogramma (10%). All cod came from
stations 1, 3, 4, 5, 6, 9, 10, 11, 13, 22 and 44. The highest frequency of
C. bairdi in cod stomachs came from stations 4, 9 and 11. Pandalus borealis,
as a food item, was mainly taken at stations 11 and 13.
Izhut Bay (Table XXVII; Fig. 1)
A total of 18 Pacific cod were examined in mid-May 1978. Seventeen
fish contained food; only four taxa were present. The most frequently
occurring prey was Pandalus borealis (83.3%). Unidentified fishes (22.2%)
and Chionoecetes bairdi (16.7%) were less frequently found. Cod were
taken from stations 2 and 3.
Kiliuda Bay (Table XXVII; Fig. 2)
Twenty Pacific cod were examined during the August 1978 sampling.
Stomach contents contained only two taxa. All were feeding on Pandalus
borealis and four were feeding on P. hypsinotus. All 20 fish came from
station 5.
Theragra chalcogramma (walleye pollock)
Kiliuda Bay (Table XXVII; Fig. 2)
Pandalid shrimps were the food of walleye pollock from Kiliuda Bay
in August 1978. Pandalus borealis was found in all 20 fish examined and
P. hypsinotus was only found in four stomachs. All pollock were examined
from station 5.
Hemilepidotus jordani (yellow Irish lord)
Portlock Bank (Table XXVII; Fig. 4)
Thirty-nine yellow Irish lord were examined during the March 1978
cruise. A total of 17 prey taxa were found in 36 feeding fish. Leading
prey, in terms of frequency of occurrence, were Chionoecetes bairdi
(48.7%), the hermit crab Pagurus ochotensis (20.5%), shrimps (12.8%), and
175

amphipods (10.3%). Polychaeteous annelids and fishes occurred in 15.4% of
the fish. Yellow Irish lord were examined from stations 1, 2, and 5.
Kodiak Shelf (Table XXVII; Fig. 5)
Yellow Irish lord examined from the June-July cruise was dominated
by polychaetes (19.6% frequency occurrency), Pinnixa occidentalis (15.9%),
and Chionoecetes bairdi (10.6%). Thirty different prey taxa were found
in 152 feeding fish. All fish came from stations 3, 4, 5, 6, 9, 10, 11,
12, 13, 22, and 44. The highest frequency of polychaetes in yellow Irish
lords came from station 4 and 44. Pinnixa was mainly taken at station 12.
Myoxocephalus spp. (sculpins)
Kodiak Shelf (Table XXVII; Fig. 5)
Sculpins examined (72) on the June-July 1978 cruise contained 19 dif-
ferent prey taxa. Only 47 (65%) contained food. Dominant food items were
unidentified fishes (36.1%) and Pandalus borealis (12.5%). Sculpins came
from station 1, 3, 5, 6, 8, 10, 11, and 22.
Izhut Bay (Table XXVII; Fig. 1)
Sculpins examined (19) in May 1978 mainly contained Pandalus borealis
(52.6%) and Chionoecetes bairdi (31.6%). Sculpins were examined for food
contents from stations 2 and 3.
Hippoglossoides elassodon (flathead sole)
Kodiak Shelf (Table XXVII; Fig. 5)
One hundred and fifty-six flathead sole stomachs were examined during
June-July 1978. A total of 118 (76%) were feeding. Although 28 prey were
identified, the only dominant food items were Pandalus borealis (29.5%)
and Euphausiacea (13.5%). Flathead sole came from nine stations: 3, 4, 5,
6, 9, 11, 13, 14, and 44. Pink shrimp dominated the prey at stations 11,
13, and 14.
176
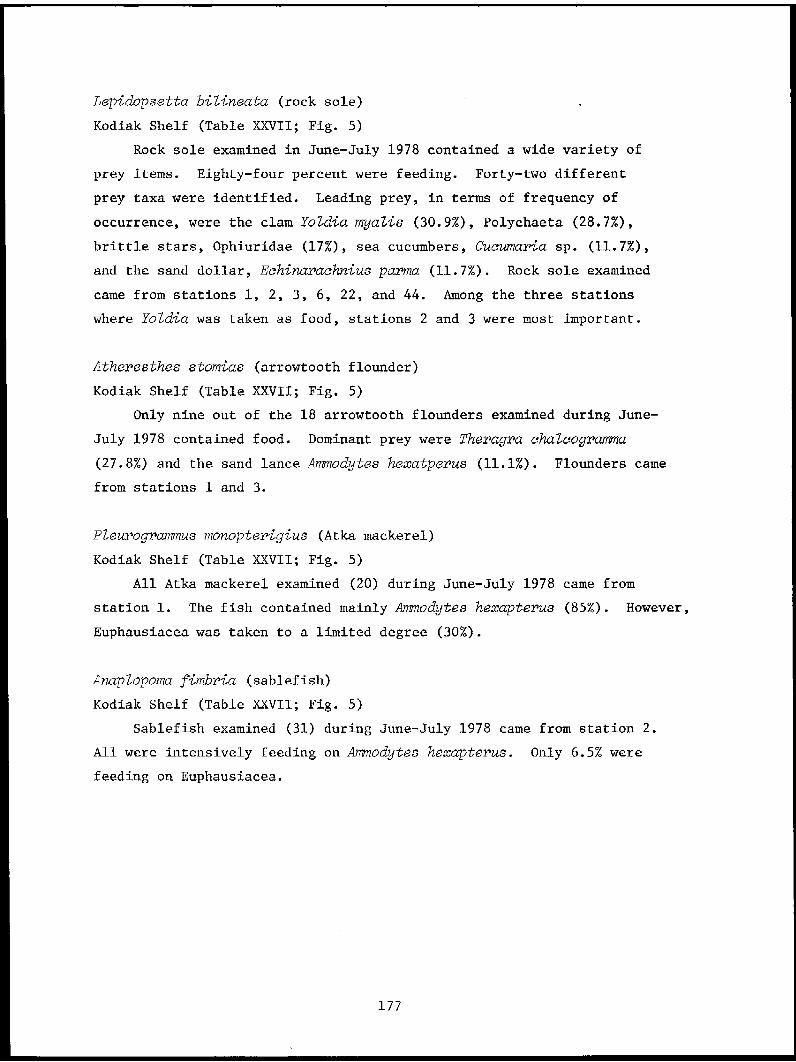
Lepidopsetta bilineata (rock sole)
Kodiak Shelf (Table XXVII; Fig. 5)
Rock sole examined in June-July 1978 contained a wide variety of
prey items. Eighty-four percent were feeding. Forty-two different
prey taxa were identified. Leading prey, in terms of frequency of
occurrence, were the clam Yoldia myalis (30.9%), Polychaeta (28.7%),
brittle stars, Ophiuridae (17%), sea cucumbers, Cucumaria sp. (11.7%),
and the sand dollar, Echinarachnius parma (11.7%). Rock sole examined
came from stations 1, 2, 3, 6, 22, and 44. Among the three stations
where Yoldia was taken as food, stations 2 and 3 were most important.
Atheresthes stomias (arrowtooth flounder)
Kodiak Shelf (Table XXVII; Fig. 5)
Only nine out of the 18 arrowtooth flounders examined during June-
July 1978 contained food. Dominant prey were Theragra chalcogramma
(27.8%) and the sand lance Ammodytes hexatperus (11.1%). Flounders came
from stations 1 and 3.
PZeurogrammus monopterigius (Atka mackerel)
Kodiak Shelf (Table XXVII; Fig. 5)
All Atka mackerel examined (20) during June-July 1978 came from
station 1. The fish contained mainly Ammodytes hexapterus (85%). However,
Euphausiacea was taken to a limited degree (30%).
Anaplopoma fimbria (sablefish)
Kodiak Shelf (Table XXVII; Fig. 5)
Sablefish examined (31) during June-July 1978 came from station 2.
All were intensively feeding on Ammodytes hexapterus. Only 6.5% were
feeding on Euphausiacea.
177

VII. DISCUSSION
TRAWL DATA: DISTRIBUTION-BIOMASS
Since crustaceans, specifically commercially-important species,
dominated the epifaunal biomass, the following discussion is limited
to those species i.e., Paralithodes camtschatica, Chionoecetes bairdi,
and Pandalus borealis. A limited discussion for the other epifaunal
species included in the results of this annual report will be deferred
to the Final Report. Data obtained from February and March 1979 cruises
will also be included in the Final Report.
Izhut and Kiliuda Bays
Paralithodes camtschatica (king crab)
A necessary prerequisite for the management of Alaska's king
crab fishery is knowledge of the crabs' distribution, abundance, and
behavior. King crabs follow yearly migration patterns between deep and
shallow waters. Most authors agree that king crabs migrate to shallow
waters to spawn during March, April, and May (Marukawa, 1933; Rumyantsev,
1945; Vingradov, 1945; Wallace et al., 1949; Bright et al., 1960; Powell,
1964). The inshore areas of Kodiak Island provide a suitable environment
where molting, breeding and feeding activities take place (Wallace et al.,
1949; Powell and Nickerson, 1965; Gray and Powell, 1966; Kingsbury and
James, 1971; Kingsbury et al., 1974; Feder and Jewett, 1977, present report).
After breeding, king crabs gradually migrate to deeper water. King crabs
are known to breed in the offshore ocean environment (McMullen, 1967).
Based on data collected in the present study, Izhut Bay apparently is
not an important area for king crabs (see Tables II-VII). The king crab
biomass here never exceeded 5.4% of the total invertebrate biomass. The
only appreciable quantities came from Area 1, at the entrance to the bay,
at stations 7, 8, and 9 in June and July (Fig. 1).
Unlike Izhut Bay, Kiliuda Bay yielded king crabs from a variety of
stations. Evidence of the spring migration of crabs into shallow water
was seen in April and June when the crab biomass was highest. Crabs in
April were only found in Areas III and IV, Shearwater Bay and Santa Flavia
Bay, respectively. The July, August, and November king crab biomass was
178

much lower than April and June, but still not as low as the king crab
biomass in Izhut Bay in June or July. Crabs found in Kiliuda Bay in
June through November came from Areas I and IV. The fact that adult
crabs were present through early winter suggests the presence of a
resident population in Kiliuda Bay.
Benthic trawling has been conducted in two other Kodiak Island Bays,
Alitak and Ugak Bay (Feder and Jewett, 1977). The king crab biomass
from Alitak Bay in June, July, August 1976, and March 1977 was 12.9%,
26.6%, 26.9%, and 68% respectively. These data reflect an influx of
adult crabs in March to spawn, and unlike Kiliuda Bay, by June most
crabs had migrated from the bay. Changes in the king crab biomasses
from Ugak Bay are not as explainable. During the June, July, August,
and March sampling the percent of the invertebrate biomass that was
king crabs was 17%, 44.3%, 46.7%, and 30.1% respectively (Feder and
Jewett, 1977). King crabs in Ugak Bay were mainly juveniles.
Chionoecetes bairdi (snow crab)
Snow crabs inhabit the entire Kodiak Shelf to a depth of over 400
meters with greatest concentrations found below 130 meters (ADF&G, 1976;
Donaldson, 1977). Adult snow crabs move into the shallower portions
of their habitat in early spring to spawn (Bright, 1967; AEIDC, 1974;
ADF&G, 1976). Exact depths and site preferences for spawning in Kodiak
are not known; however, 50-130 meters depths are used south of the Alaska
Peninsula (AEIDC, 1974). Snow crabs typically move into deeper water
in the fall. Except for spawning migrations, which are less extensive
than king crab migrations, snow crabs (Chionoecetes spp.) appear to remain
in a given location (Watson, 1969).
Data collected during the present study (see Tables II-VII) indicate
that snow crabs in Izhut Bay were mainly located in Area I, outer Izhut
Bay, although the largest catch for April was made at station 554 in Area
III. Area II did not contain any appreciable quantity of crabs in any
sampling period. June sampling yielded the largest catch of snow crabs (78.8%
of the biomass) and April yielded the lowest catch (3.7%).
179

Snow crabs in Kiliuda Bay were also found primarily in the outer
portion of the bay, Areas I and IV. Both Izhut and Kiliuda Bays, as well
as Alitak and Ugak Bays, are producers of snow crabs in commercial quan-
tities (ADF&G, unpub. reports; Feder and Jewett, 1977). Furthermore,
commercial snow crab gear was prevalent in the outer portions of Izhut
and Kiliuda Bays in February 1979.
Pandalus borealis (pink shrimp)
Adult pink shrimps inhabit water depths from the intertidal region
to beyond the continental shelf (AEIDC, 1974). They appear to concentrate
in specific areas around Kodiak, especially in bays and submarine gullies,
such as Sitkalidak, Marmot and Afognak Bays, Horse's Head and Marmot Gullies,
the Kiliuda Trough and the northeast section of the Shelikof Strait (ADF&G,
1976; Ronholt et al., 1978). During 1975-76 shrimp biomass was estimated at
5500-9500 metric tons in the Kiliuda trough area (ADF&G, 1976).
Pink shrimps were important to the invertebrate biomass in Izhut and
Kiliuda Bay as well as Alitak and Ugak Bays (Feder and Jewett, 1977). The
largest catches in Izhut Bay came from small bays in May, July, and August
i.e., station 526 and 527 of Area II and station 557 of Area III. Pink
shrimps were not present in Izhut Bay in April, June, and November sampling.
Ivanov (1969) reported that pink shrimps move into shallow bays and around
islands to spawn in August and September.
In Kiliuda Bay, high biomasses were noted in August and November at
stations SHR and 5 of Area I.
Portlock Bank
The only commercial species in any abundance found adjacent to Portlock
Bank stations was the snow crab, Chionoecetes bairdi. Although it was a
dominant species it still made up less than 25% of the total invertebrate
biomass, and was mainly found at two stations. Large numbers of snow
crabs and/or king crabs were seldom associated with the organisms that
were common to stations near Portlock Bank i.e., sea stars, urchins, and
large snails. Nevertheless, Portlock Bank is considered an important off-
shore shallow area for king crab (McMullen, 1967) and snow crab (ADF&G, 1976).
180
It is not surprising that pink shrimps were absent from these stations,
since, as previously noted, pink shrimps mainly concentrate in bays and
submarine gullies (ADF&G, 1976; Ronholt et al., 1978).
Kodiak Shelf
Paralithodes camtschatica (king crab)
Two of the three stations where most king crabs were present were
located off Alitak Bay at the south end of the island (Fig. 5). The compo-
sition of king crabs in outer Alitak Bay during June 17-22 1976 (Feder and
Jewett, 1977) was similar to the king crab composition found at stations 7
and 8 of the present study in June-July, i.e., mainly ovigerous females.
Alitak Bay has a past history as a king crab mating ground (Kingsbury and
James, 1971; Feder and Jewett, 1977), and has been a major producer of
commercial-sized crabs in the Kodiak Island area since 1953 (Gray and Powell,
1966). Outer Alitak Bay was also the site of king crab distribution, abun-
dance, and composition studies conducted by the Alaska Department of Fish
and Game during the summer months of 1962 and 1970 (Gray and Powell, 1966;
Kingsbury et al., 1974).
Station 9, located in an ADF&G statistical region, sometimes known as
the "Horse's Head", was another station where large numbers of adult king
crabs were taken. The "Horse's Head" annually supports one of the largest
concentrations of legal size king crabs (145 mm carapace length) (ADF&G,
unpub. reports).
Chionoecetes bairdi (snow crab)
Snow crab biomass was high in June-July at stations 7, located in outer
Alitak Bay, and 13 and 14 located off Izhut Bay of Afognak Island (Fig. 5).
Alaska Department of Fish and Game crab population index studies of Kodiak
Island, show moderate catches of snow crabs in the vicinity of Alitak Bay
(Donaldson, 1977). The area off Izhut Bay was not sampled during the above
index studies, and so relative abundance data are not available to compare
with findings of the present study. Snow crab data from stations 13 and 14
are parallel with snow crab data from our Izhut Bay sampling.
181

Pandalus borealis (pink shrimp)
The seven stations where pink shrimps were caught were nearshore
stations (stations 7, 8, 10, 11, 13, and 14) with the exception of
station 5, located in the outer Sitkalidak gully (Fig. 5). The largest
concentration came from station 13 in outer Izhut Bay. At this station
flathead sole and Pacific cod were intensively feeding on pink shrimps
(see section on Food Studies for appropriate fish species).
FOOD STUDIES
Paralithodes camtschatica (king crab)
Year-round food habits of the Alaska king crab are difficult to assess
due to the migratory nature of the crab. For this reason, it is essential
to know the general areas where the greatest concentrations of crabs can be
expected at particular months of the year, and it is at these areas that
the crabs should be sampled seasonally for their food contents.
Feeding takes place throughout the year in the Bering Sea and Okhotsk
Sea, except during the molting-mating periods when feeding ceases or is at
a minimum (Kun and Mikulich, 1954; Kulichkova, 1955; and Cunningham, 1969).
Kulichkova (1955) demonstrated that the duration of fasting before and after
these periods does not extend beyond a few weeks. King crabs that were
examined for food in April in Kiliuda Bay were all newshell crabs that had
recently undergone ecdysis. Feeding activity of the latter crabs was
minimal, and only 16 out of 49 (33%) crabs contained food. Stomach data and
SCUBA observations indicate that feeding resumes at shallow depths before
deep-water migration and continues throughout the year.
The chief prey items of king crabs in shallow Kodiak regions were bar-
nacles and soft-shelled clams. Kulichkova (1955), who examined king crabs
within a commercial king crab fishing region in the Okhotsk Sea, found that
recently molted crabs mainly fed on the young of the clam TeZZina lutea
while hardshell crabs fed on the clam Siliqua media. He also noted that the
chief food of recently molted king crabs taken from a depth of 16 m con-
sisted of barnacles. He suggests that crabs need to replace the calcium
carbonate lost during molting and that young clams and barnacles of shallow
waters represent an abundant resource to fulfill this need. Feeding data in
the present study indicate that barnacles are a prey item throughout the
182

year, but are only an important component of the diet in the spring and
summer months.
Although barnacles are seldom prey for king crabs in the fall and
winter months, Feder et al. (1978a) report intensive feeding on barnacles
in November 1977 in lower Cook Inlet. All crabs examined had barnacles
in their stomachs, and 60% were feeding exclusively on barnacles. The
volcanic eruption of St. Augustine Island, lower Cook Inlet in February
1976 provided a new benthic substrate, pumice, suitable for barnacle
settlement. Prior to the eruption, much of the surrounding area was com-
posed of unconsolidated sediments unsuitable for barnacle settlement.
Settlement was ultimately followed by the appearance of various species
of crabs, and the subsequent predation by these crabs on the barnacles.
Little is known about the effect of petroleum hydrocarbons on bar-
nacles. The hydrocarbon content of goose barnacles (Lepas fascicularis)
living on tarballs has been compared with the hydrocarbon content of the
tarballs (Morris, 1973). While there is some contamination of the bar-
nacles, there is no evidence of gross pollution and the analyses suggested
that oil hydrocarbons are assimilated and then discharged, unmetabolized,
quite rapidly.
Bivalve molluscs, principally clams, were the dominant food of king
crabs from Kiliuda Bay and the Kodiak Continental Shelf (fishes were the
dominant food in Izhut Bay). Molluscs dominate the food of king crabs in
many northern waters. Feniuk (1945), Kulichkova (1955), and Takeuchi
(1959, 1967) analyzed the feeding of king crabs in the Okhotsk Sea near
the western shore of Kamchatka, and found pelecypods and gastropods to
dominate the diet. The works of McLaughlin and Hebard (1959), Cunningham
(1969), Tarverdieva (1976) and Feder and Jewett (1978 and in press), carried
out in the southern Bering Sea, also showed pelecypods and gastropods as
important king crab food items. The most common molluscs fed upon by king
crabs from most regions are protobranch clams, i.e. Nuculana, Nucula and
Yoldia, and snails of the family Trochidae. Other important clam prey are
representatives of the families Tellinidae and Cardiidae.
There is no evidence to show that king crabs are scavengers (Cunningham,
1969). However, data from the present study suggest that scavenging can be
an important dietary stratagem, although predation is the major method for
183

acquiring food. King crab stomachs examined in Izhut Bay and the Kodiak
continental shelf in June and July were dominated by fishes. During both
sampling months in Izhut Bay active feeding by large numbers of sooty
shearwaters, black-legged kittiwakes and Steller sea lions was observed
from the sampling vessel. The shearwaters and kittiwakes were feeding
on the schooling fishes, capelin and Pacific sand lance (Pers. Comm.
Gerald Sanger, USF&WS), and it is probable that the sea lions were also
feeding on these fishes. Kulichlova (1955) reported that king crabs
from the west coast of South Sakhalin contained herring at 13.4% of the
total stomach fullness. He reports that the fish were not alive when
taken from the sea bed. Fishes were found in 10% of all Bering Sea king
crabs examined by Cunningham (1969). Feniuk (1945) also found fishes
(2% frequency of occurrence) among stomach contents of hard-shelled king
crabs off the west Kamchatkan shelf. In the cases where fishes are taken,
it probably represents a prey of opportunity with high energy value. It is
probable that schooling fishes that are heavily preyed upon at the surface
are falling to the benthos after being injured or regurgitated by the preda-
tors. These fishes in turn are being taken in a scavenging manner by king
crabs. Live fishes, especially schooling fishes, are doubtfully taken by
the relatively lethargic king crabs.
Some food species of king crabs are area specific. King crabs examined
from the Kodiak Shelf in June-July 1978 came from nine widely separated
stations (Fig. 4). Although the foods from crabs examined at these stations
were mainly pelecypods (Table XXV), distinct differences could be detected
in the dominant prey items taken between stations (Table XXVI). Clams were
only important, in terms of total weight, at stations 7, 8, 9, and 10. Im-
portant prey at other stations were fishes at stations 8, 10, 11, 12, 13,
and 14, the pea crab Pinnixa occidentalis at station 12; the brittle star
Ophiura sarsi at station 1; and the snow crab Chionoecetes bairdi at station 8.
Other regional differences in king crab food have been reported.
Cunningham (1969) determined that echinoderms (Ophiura sarsi, the basket star
Gorgonocephalus sp., StrongyZocentrotus sp., and Echinarachnius sp.) were the
most important food (based on total food weight) of S.E. Bering Sea crabs.
Molluscs (37%) and crustaceans (10%) were next in importance. Feder and
Jewett (1978 and in press) found molluscs as the most frequently consumed
184
group (87.1%) among S.E. Bering Sea king crab, although echinoderms were
also frequently taken (66.1%). Kun and Mikulich (1954) found wide food
differences between king crabs from the Kurile Islands, Tartar Strait,
and Okhotsk Sea. The sand dollar Echinarachnius parma dominated the food
by weight of king crabs from the Kurile Islands. The sea urchin Strongylo-
centrotus sp. dominated in the Gulf of Tartar, and the Greenland cockle
Serripes groenlandicus dominated the prey in the southern Okhotsk Sea.
In addition to regional food differences detected in the present
study, the prey taken within any region was usually very diverse. Crabs
collected via SCUBA within small sampling areas of Near Island Basin,
McLinn Island, and Anton Larsen Bay contained 21 to 48 different prey taxa.
Among the 86 different prey taxa taken by Kodiak Shelf king crabs, 63 taxa
were identified from stomachs at a single station and 25 taxa were identi-
fied from a single crab. The number of prey species was lowest in Izhut
Bay crabs.
Most methods employed in obtaining an index of stomach fullness in
decapod crustaceans are not comparable. Feniuk's (1945) method, also used
by McLaughlin and Hebard (1959), was a cumulative ratio based on visual
estimates of the cardiac, gastric mill, and pyloric regions of the stomach.
Kun and Mikulich (1954), Kulichkova (1955), and Tarverdieva (1976), employing
a method not fully comprehensible from the literature, also estimated stomach
fullness by observation and fullness in parts per 10,000. Takeuchi (1959,
1967) derived a fullness index by using the ratio of crab body weight to
food content weight. The Feeding Index of Fullness employed by Cunningham
(1969) and the present study was derived from a ratio of observed volume to
theoretical volume. Visual estimates of fullness are not determined by this
method. Cunningham (1969) pointed out that the use of the mathematical
approximation (maximum volume) is necessary since an accurate volume cannot
be obtained from stomachs preserved in formalin which typically become
distorted after preservation.
The smallest size group, 98-120 mm, of king crab from the S.E. Bering
Sea examined by Cunningham (1969) had a mean Index (percent) of Fullness
of 38 ± 15% while the largest size group, 161-187 mm, had the smallest Index,
9 ± 13%.
185
It is evident from data in the present report that crabs from Kodiak,
in general, were not as full as those from the S.E. Bering Sea. Forty-
three percent of king crabs examined by McLaughlin and Hebard (1959) were
1-20% full. Cunningham (1969) reported the maximum stomach fullness of
a single crab was 86%, while the fullness of any crab in the Kodiak study
did not exceed 78%. A detailed comparison of crab stomach fullness of
Kodiak king crabs with that of crabs from the southeastern Bering Sea
(Cunningham, 1969) will be made once Kodiak crabs are examined by size
groups.
Differences in food types among king crab size groups and sexes in
Kodiak will be presented in the Final Report. Kun and Mikulich (1954),
Kulichkova (1955), and McLaughlin and Hebard (1969) found no difference
in food groups between sexes of Paralithodes camtschatica, and Kun and
Mikulich (1954), Kulichkova (1955), Cunningham (1969), and Tarverdieva
(1976) found no difference in food groups between size groups.
Pyonopodia helianthoides (sunflower sea star)
The food of Pyonopodia collected in Prince William Sound was examined
by Paul and Feder (1975). Most specimens came from the intertidal region
although some subtidal specimens were taken. In general, intertidal
Pyonopodia was feeding on a variety of food items. The most commonly
encountered prey items in the stomachs of intertidal Pycnopodia were the
blue mussel Mytilus edulis. As many as 275 small M. edulis were found in
a single stomach. Other important prey of intertidal specimens were the
clams Protothaca staminea, Saxidomus gigantea, and unidentified small
gastropods. Subtidal Pycnopodia prey was dominated by the protobranch
clam Nuculana fossa and small gastropods.
The food of subtidal Pycnopodia collected in Izhut Bay was similar to
that found in the subtidal specimens cf. Paul and Feder (1975), i.e., small
gastropods, in this case Oenopota sp. and SolarieZZa sp., and small clams
including Nuculana fossa.
One of the known predators and food competitors of Pycnopodia is the
king crab. Many Pycnopodia observed by SCUBA were tightly squeezed into
rock crevices when king crabs were in the vicinity. This behavior is
assumed to be an avoidance response.
186

Gadus macrocephalus (Pacific cod)
Data on stomach contents from some 4200 Pacific cod from the
vicinity of Kodiak, Alaska has been presented (Jewett, 1978). Most of
these fish were captured in crab pots; some 344 were taken in bottom
trawls from the same area. Data were presented in percent frequency
of occurrence and actual frequency of occurrence. Only summer sampling
was conducted.
The most important food categories in both pot-caught and trawl-
caught cod were fishes, crabs, shrimps and amphipods, in decreasing
order of occurrence. The fish most frequently eaten was the walleye
pollock Theragra chaZcogramma, with Pacific sand lance Ammodytes
hexapterus, and flatfishes (Pleuronectidae) also contributing frequently
to the diet of cod. Juveniles of the snow crab Chionoecetes bairdi was
the most frequently occurring food species, appearing in almost 40% of
the stomachs examined.
Jewett (1978) also presents data which indicate little year-to-year
variation in the summer diet of Pacific cod in the Kodiak area. He
also suggests that food organisms shift in frequency with increased size
in cod. Fish and cephalopod frequencies in the diet seemed to be directly
related to size, while amphipod and polychaete frequencies were inversely
related to size of predator.
Data from 29 Pacific cod from the southeastern Bering Sea show
pink shrimp as the most frequently consumed food item (Feder and Jewett,
1978 and in press). Walleye pollock, amphipods, and snow crabs were taken
less frequently.
Food of Pacific cod examined in the present study was consistent with
Pacific cod food found by Jewett (1978).
Theragra chalcogramma (walleye pollock)
Pollock examined on the Kodiak Shelf by Jewett and Powell (unpubl.)
were mainly feeding on pink shrimp and euphausiids.
Smith et al. (1978) examined pollock from the northeastern Gulf of
Alaska and the southeastern Bering Sea. Gulf of Alaska fish (standard
length X = 344 ± 84 mm) as well as Bering Sea fish (standard length X =
270 ± 145 mm) mainly contained euphausiids.
187

Young British Columbia pollock, from 4-22 mm standard length, fed on
copepods and their eggs (Barraclough, 1967) while adults fed on shrimps,
sand lance and herring (Hart, 1949). Armstrong and Winslow (1968) report
Alaska pollock feeding on young pink, chum and coho salmon. Suyehiro
(1942) reported small shrimps, benthic amphipods euphausiids and copepods
in the stomachs of pollock from the Aleutians. Andriyashev (1964) listed
mysids and amphipods as the major foods of Bering Sea pollock with
Chionoecetes opilio (snow crab) also present. He also reports that pollock
from Peter the Great Bay and Sakhalin feed on surf smelt and capelin in the
spring and shift to planktonic crustaceans in the summer. Nikolskii (1961)
lists pollock food organisms from Asian waters as mysids, euphausiids,
smelt and capelin.
Myoxocephalus spp. and Hemilepidotus jordani (sculpins)
Summer food of the sculpins Myoxocephalus spp. and Hemilepidotus
jordani, near Kodiak Island were examined by Jewett and Powell (in prep.).
Crabs were the dominant food of both genera. Major prey of Myoxocepha-
lus spp. were the crabs Chionoecetes bairdi and Hyas lyratus, and fishes.
Major prey consumed by H. jordani were also C. bairdi and H. lyratus,
in addition to another crab, Oregonia gracilis, and amphipods.
Crabs, specifically Chionoecetes bairdi, were important in Izhut
Bay Myoxocephalus, but not in those specimens examined from the Kodiak
Shelf. Pink shrimp, Pandalus borealis, was an important prey Myoxoce-
phalus in both regions.
Crabs were important prey in Hemilepidotus from Portlock Bank and
the Kodiak Shelf.
Hippoglossoides elassodon (flathead sole)
Smith et al. (1978) examined 247 flathead sole in the Gulf of Alaska
and 39 flathead sole from the Bering Sea. Euphausiids (probably all
Thysanoessa spp.) and the brittle star, Ophiura sarsi, contributed most
of the diet of the 139 feeding individuals from the Gulf of Alaska.
The Bering Sea data suggest that the shrimp, Pandalus borealis is the
most important spring prey, while mysids, amphipods, and Ophiura sarsi
188
dominated summer feeding. Crangonid shrimps and juvenile pollock were
the most important autumn prey in the Bering Sea.
The dominant prey of flathead sole in the present study is consis-
tent with flathead food as determined by Smith et al. (1978).
Lepidopsetta bitineata (rock sole)
Little is known about the feeding habits of the rock sole. Rock sole
examined in the present study were feeding intensely. Although YoZdia
myalis was the leading prey species it was only taken at two stations.
Polychaetes, the second most frequent food group, was taken at four of
the six stations. In general, food of rock sole from the Kodiak area is
similar to that described by other authors.
Skalkin (1963) and Shubnikov and Lisovenko (1964) report that the
Bering Sea diet consists chiefly of polychaetes followed by molluscs and
crustaceans (mainly shrimp). Kravitz et al. (1976) found that rock sole
in Oregon waters fed mainly on ophiuroids. Feeding is much reduced during
the winter, and is most intense in June and July.
Of 166 Bering Sea rock sole examined by Smith et al. (1978), 80 were
empty. Eleven families of polychaetes contributed most of the food con-
sumed. Crustaceans, pelecypods, ophiuroids and fishes were also important.
Atheresthes stomias (arrowtooth flounder)
The few arrowtooth flounder examined in the present study were
dominated by a fish diet.
Smith et al. (1978) examined arrowtooth flounder from the northeast
Gulf of Alaska. Crustaceans were the most frequently occurring prey items
consumed. Of this group, decapods were most often taken, with euphausiids
the second most commonly consumed. By number and volume, however,
euphausiids were more important. Shuntov (1965) reported that the walleye
pollock was the principal food item of the arrowtooth flounder in the Bering
Sea.
Fishes were the second most frequently occurring prey items. Members
of the families Osmeridae, Gadidae, and Zoarcidae, in descending order of
frequency of occurrence, were the most common.
189

PZeurogrammus monopterigius (Atka mackerel)
We were unable to locate any references pertaining to the food of
the Atka mackerel. However, lingcod, another hexagrammid, are voracious
feeders of fishes such as herring and sand lance (Hart, 1973). Therefore,
based on the food of the closely related lingcod and the food of Atka
mackerel in the present study, it appears that fishes are consistent with
the Atka mackerel's normal prey.
Anaplopoma fimbria (sablefish)
The sablefish in the present study were full of sand lance. Shubnikov
(1963) reported that food items of Bering Sea sablefish were also primarily
fishes, including small gadids, flatfishes, gobies, capelin, and herring as
well as benthic and nektonic invertebrates.
VIII. CONCLUSIONS
Thirty-nine permanent benthic stations were established in two bays -
25 stations in Izhut Bay and 14 stations in Kiliuda Bay. There is now a
general, qualitative understanding, on a station basis for the months sampled,
of the distribution and abundance of the major epifaunal invertebrates of
the study areas. The dominant invertebrate species had distinct biomass
differences between the bays with snow crabs (Chionoecetes bairdi) and
sunflower sea stars (Pyonopodia helianthoides) important in Izhut Bay and
king crabs (Paralithodes camtschatica), snow crabs, and pink shrimps
(Pandalus borealis) dominant in Kiliuda Bay.
The most important group, in terms of biomass, collected near Portlock
Bank was the Echinodermata, specifically sea stars and sea urchins. King
and snow crabs were the second-most important group from this area. Kodiak
shelf sampling in June-July revealed king and snow crabs as the dominant
species.
Stomachs of king crabs collected in bays and on the shelf of Kodiak
Island contained a wide variety of prey items. Food of crabs from Izhut
Bay was dominated by fishes while crabs from Kiliuda Bay preyed primarily
on molluscs, specifically clams. Food of king crabs from the Kodiak shelf
consisted mainly of clams and cockles, although crustaceans and fishes were
also important. King crabs taken inshore by SCUBA primarily contained
190

acorn barnacles and clams. Barnacles were a major food resource for king
crabs in Kiliuda Bay and inshore areas sampled by SCUBA in June and July.
Food data for king and snow crabs, and pink shrimps will be available
for the Final Report, and these data, in conjunction with similar data
from other Alaska waters, will enhance our understanding of the trophic
role of these crustaceans in their respective ecosystems. The additional
food data available to the Final Report as well as an assessment of the
literature will make it possible to develop a food web for inshore and
offshore areas of the Kodiak shelf. Comprehension of trophic interac-
tions of benthic species is essential to comprehend the potential impact
of oil on the crab-shrimp-dominated waters adjacent to Kodiak.
The importance of deposit-feeding clams in the diet of king and snow
crabs in Kodiak waters has been demonstrated by preliminary feeding data
collected there. It is suggested that an understanding of the relation-
ship between oil, sediment, deposit-feeding clams, and crabs be developed
in a further attempt to understand the possible impact of oil on the two
commercially important species of crabs in the Kodiak area.
Initial assessment of data suggests that a few unique, abundant and/
or large invertebrate species (king crabs, snow crabs, several species of
clams) are characteristic of the bays investigated and that these species
may represent organisms that could be useful for monitoring purposes.
It is suggested that a complete understanding of the benthic systems
of Kodiak waters can only be obtained when the infauna is also assessed
in conjunction with the epifauna. Based on stomach analyses, infaunal
species are important food items for king and snow crabs. However, the
infaunal components of the Kodiak shelf have not been quantitatively
investigated to date. A program designed to examine the infauna should be
initiated in the very near future.
IX. NEEDS FOR FURTHER STUDY
Although the trawling activities were satisfactory in a general way
for qualitatively determining the distribution and abundance of epifauna,
a substantial component of both bays - the infauna - was not sampled.
Since infaunal species represent important food items, it is essential
191

that the use of grabs and/or dredges be accomplished at the bay stations
in the near future.
In addition, relative to the suggestions in Problems Encountered in
Section X, it is highly recommended that an Eastern otter trawl be used
in the near future if either of the two study bays is to be used for
monitoring activities.
An attempt should be made to quantify the carbon flow in the crab-
shrimp dominated shelf adjacent to Kodiak. Serious consideration should
ultimately be given to developing a predictive model embodying trophic
interactions in Kodiak and adjacent waters.
X. SUMMARY OF FOURTH QUARTER OPERATIONS
SHIP ACTIVITIES
I. Ship or Field Activities
A. Ship schedules and name of vessel
1. NOAA Ship Miller Freeman, 14-24 February 1979
2. R/V Commando, 5-18 March 1979
B. Scientific Party
a. NOAA Ship Miller Freeman - S. C. Jewett and R. L. Rice
b. R/V Commando - K. McCumby
C. Methods
1. NOAA Ship Miller Freeman
a. Sampling Gear: Selected stations were occupied with a
standard 400-mesh Eastern otter trawl, pipe dredge (36 cm x
91 cm) and small otter trawl (6.2 m opening). A CTD was
taken at each station.
b. Processing of Material:
Material taken by 400-mesh otter trawl was sorted, counted,
and weighed. Commercial crabs were also sexed. Various
species were examined for food items. Some material including
all crab stomachs and shrimp were preserved in formalin for
later laboratory examination.
Only crangonid shrimps were utilized from the small otter
trawl. These specimens were kept alive for later laboratory
experiments.
Pipe dredge material was washed on deck with sea water over a
1.0 mm screen. All washed material was preserved for later labo-
ratory examination and used to aid in crab, shrimp, and fish sto-
mach contents.
192

Stomachs of crabs were removed and preserved for later labora-tory examination. Whole pink shrimps were also preserved(see Appendix B, Table I).
Stomachs of selected species of fishes were examined on boardship and contents were recorded for frequency of occurrence(see Appendix B, Table I).
2. R/V Commando
Izhut and Kiliuda Bay stations were sampled with a 400-meshEastern otter trawl.
When the weather conditions made it possible, the trawl materialwas sorted and weighted immediately. However, when weatherconditions were such as to prevent working on deck, the inverte-brates were placed in labeled buckets and were worked up laterwhen anchored in calmer waters.
II. Results
A. Cruise activities
1. NOAA Ship Miller Freeman
a. 400-mesh Eastern Otter Trawl: Fifteen stations were occupied;the catch was enumerated at 14 stations (see Appendix B, Fig. 1).
b. Small Otter Trawl: Five stations were occupied and crangonidshrimp were obtained from each.
c. Pipe Dredge: Pipe dredges were obtained from all 15 stations.The average volume was 70 liters of substrate. Station IMS 13and IMS 3 mainly contained coarse sand and gravel and manyModiolus sp. (mussel). Most other stations contained fine greymud with few organisms.
d. Trophic Studies: Few (22 males) king crab were found on thiscruise, presumably due to their movement to shallow water formating. All snow crab that were caught were in excellent,hard-shell condition. Flatfishes, in general, were eatingvery little, presumably due to their advanced reproductivestate; the sexual condition of most species was ripe. YellowIrish lord was the only fish species not indicating sexualripeness. This species was also not feeding intensively.
2. R/V Commando
a. Ishut Bay: A total of four otter trawl tows and nine towswith the try net were taken in Izhut Bay.
Stomachs were removed from three Paralithodes camtschatica(king crab) and preserved in 10% buffered formalin. Seventy-one Chionoecetes bairdi (snow crab) stomachs were collectedand preserved. The stomachs from fifty-two Pycnopodiahelianthoides (sea star) were examined for food. Approximately400 Pandalus borealis (pink shrimp) were collected forstomach analysis.
193

b. Kiliuda Bay: Six try net tows were made in Kiliuda Bay;
one yielded no catch. Three otter trawl tows were also
made.
A total of thirty-eight king crab stomachs and eighteen
snow crab stomachs were obtained and preserved for analysis.
Approximately 300 pink shrimp were collected for stomach
analysis.
B. Laboratory Activities
Stomachs of king crabs, snow crabs, and pink shrimps were examined.
C. Problems Encountered and Recommended Changes
1. NOAA Ship Miller Freeman
a. Eleven of the 12 high priority stations, as outlined in the
project instructions, were occupied. Station IMS 13, the only
one not occupied, was deleted due to the presence of crab gear.
Four additional, new stations (23, S2, S3, and SS5) were occupied.
b. We were unable to fish on February 14th due to bad weather. Only
one trawl was taken on February 20th and 21st due to delays in re-
pairing the ripped net. Only one trawl was taken on February 23rd
due to inability to find trawlable bottom.
2. Inshore-bay activities
The small try net made available on most cruises of this study(not including R/V Commando) was inadequate for proper sampling of
the epibenthos. It is possible that crabs, shrimps, and fishes
were absent from the areas sampled; however, limited trawling with
a 400-mesh Eastern otter trawl in stations adjacent to try net sta-
tions yielded significant catches of the above organisms. The try
net was picking up small bottomfishes to satisfy objectives of ADF&G
and FRI. However, based on the effectiveness of past trawl studies,
i.e. Ugak and Alitak, with the Eastern otter trawl, the try net did
not properly satisfy our objectives requiring quantitative sampling
of benthic invertebrates.
III. Acknowledgements
Thanks go to the officers and crew of the Miller Freeman for their
assistance. We also appreciate the assistance of Kenneth Waldron,
Ann Materese, and Gary Shigenaka of NWAFC.
194

REFERENCES
Alaska Department of Fish and Game (ADF&G). 1976. A Fish and WildlifeResource Inventory of the Cook Inlet - Kodiak Areas. Under contractto Alaska Coastal Management Program, Division of Policy Developmentand Planning, Anchorage. 2 Vols., Vol. 2 - Fisheries. 434 pp.
Arctic Environmental Information and Data Center. 1975. Kadyak - abackground for living. Univ. Alaska, AEIDC Publ. No. B-75, SeaGrant Publ. No. 75-9. 326 pp.
Andriyashev, A. P. 1964. Fishes of the northern seas of the USSR. Transl.Isr. Prog. Sci. Tansl. 617 pp.
Armstrong, R. H. and P. C. Winslow. 1968. An incidence of walleye pollockfeeding on salmon young. Trans. Amer. Fish. Soc. 97:202-203.
Baker, J. M. (ed). 1976. Marine Ecology and Oil Pollution. John Wileyand Sons, New York, N. Y. and Toronto, Ont. 566 pp.
Barraclough, W. E. 1967. Data record. Number, size and food of larvaland juvenile fish caught with a tow boat surface trawl in the Straitof Georgia, April 25-29, 1966. Fish. Res. Bd. Can. MS Rep. Ser.922:54.
Boesch, D. F., C. H. Hershner and J. H. Milgram. 1974. Oil Spills andthe Marine Environment. Ballinger Publishing Co., Cambridge, Mass.114 pp.
Bright, D. B. 1967. life histories of the king crab, Paralithodes camtschatica,and the "Tanner" crab, Chionoecetes bairdi, in Cook Inlet, Alaska, Univ.of S. Calif., Ph.D. thesis. 265 pp.
Bright, D. B., F. E. Durham, and J. W. Knudsen. MS, 1960. King crab investi-gations of Cook Inlet, Alaska. Department of Biology, Allan HancockFoundation, University of Southern California at Los Angeles, 180 pp.
Cunningham, D. T. 1969. A study of the food and feeding relationships ofthe Alaskan king crab Paralithodes camtschatica. Master thesis, SanDiego State College. 78 pp.
Donaldson, W. 1977. Kodian Alaska Tanner Crab (Chionoecetes bairdi) Research.Comm. Fish. Res. and Devel. Act. Proj. No. 5-35-R. Rept. Per. 7/1/73-6/30/76. 140 pp.
Feder, H. M. 1977. The distribution, abundance, diversity and biology ofbenthic organisms in the Gulf of Alaska and the Bering Sea. AnnualReport to NOAA. R.U. Nos. 281, 5, 303. Inst. Mar. Sci., Univ.Alaska, Fairbanks. 340 pp.
195

Feder, H. M. 1978. Distribution, abundance, community structure andtrophic relationships of the nearshore benthos of the Kodiak Shelf,
Cook Inlet and NEGOA. Renewal proposal FY '79 to NOAA, OCSEAP. 68 pp.
Feder, H. M. and S. C. Jewett. 1977. The distribution, abundance, and
diversity of the epifaunal benthic organisms in two bays (Alitakand Ugak) of Kodiak Island, Alaska. Final Report to NOAA. R.U.
No. P29. Inst. Mar. Sci., Univ. of Alaska. 79 pp.
Feder, H. M. and S. C. Jewett. 1978. Survey of the epifaunal invertebratesof Norton Sound, the southeastern Chukchi Sea, and Kotzebue Sound.
Inst. Mar. Sci., Univ. of Alaska Rept. R78-1, 124 pp.
Feder, H. M. and S. C. Jewett. In press. Survey of the epifaunal inverte-
brates of the southeastern Bering Sea with notes on the feeding biology
of selected species. Inst. Mar. Sci., Univ. of Alaska, Rept. R78-5.
Feder, H. M. and G. E. Matheke, in press. The distribution, abundance
community structure and trophic relationships of the benthic infaunaof the northeastern Gulf of Alaska. Inst. Mar. Sci, Univ. of Alaska,
Rept. R78-8.
Feder, H. M. and G. Mueller. 1975. Environmental Assessment of the North-
east Gulf of Alaska: Benthic Biology. First year Final Report to the
National Oceanic and Atmospheric Administration. 200 pp.
Feder, H. M., S. C. Jewett, M. Hoberg, A. J. Paul, J. McDonald, G. Matheke,
and J. Rose. 1978a. Distribution, abundance, community structure,and trophic relationships of the nearshore benthos of the Kodiak Shelf,
Cook Inlet, northeast Gulf of Alaska and the Bering Sea. Annual Report
to NOAA, OCSEAP. R.U. No. 281/5/303. 315 pp.
Feder, H. M., J. Hilsinger, M. Hoberg, S. C. Jewett, and J. Rose. 1978b.
Survey of the epifaunal invertebrates of the Southeastern Bering Sea.
Final Report to NOAA, OCSEAP. R.U. No. 5. 126 pp.
Feniuk. V. F. 1945. Analiz soderzhimogo zheludkov Kamchatskogo kraba(Analysis of stomach contents of king crab) [in English, Japanese,
and Russian]. Izvestiia Tikhookeanskii nauchno-issledovatel skii
Institut Rybnogo Khoziaistava i Okeanografii, Vladivostok. Izv.
TINRO [J. Pac. Sci. Inst. Fish. Oceanogr., Vladivostok] 19:71-78.
Gray, G. W. and G. C. Powell. 1966. Sex ratios and distribution of spawn-
ing king crabs in Alitak Bay, Kodiak Island, Alaska (Decapoda Anomura,
Lithodidae). Crustaceana 10(3):303-309.
Hart, J. L. 1949. Food of fish of the cod family. Fis. Res. Can. Pac.
Prog. Rep. 79:35-36.
Hart. J. L. 1973. Pacific fishes of Canada. Fish. Res. Bd. Canada Bull.
180. 740 pp.
196

Ivanov, B. G. 1969. The biology and ditribution of the northern shrimp,
Pandatus borealis Kr., in the Bering Sea and the Gulf of Alaska. FAO
Fish. Rept. 57(3):800-810.
Jewett, S. C. 1978. Summer food of the Pacific cod, Gadus macrocephalus
near Kodiak Island, Alaska. Fish Bull. 76(3):700-706.
Jewett, S. C. and H. M. Feder. 1976. Distribution and abundance of some
epibenthic invertebrates of the northeast Gulf of Alaska, with notes
on the feeding biology of selected species. Inst. Mar. Sci. R76-8.
61 pp.
Jewett, S. C. and G. C. Powell. In preparation. Summer food of the Sculpins,
Myoxocephalus spp. and Hemilepidotus jordani, near Kodiak Island, Alaska.
Karinen, J. F. and S. D. Rice. 1974. Effects of Prudhoe Bay crude oil on
molting tanner crabs, Chionoecetes bairdi. Mar. Fish. Rev. 36(7):31-37.
Kingsbury, A. P. and K. E. James. 1971. Abundance and composition of king
crabs in the Alitak and Kaguyak Bay areas during April and June, 1970.
Alaska Dept. Fish Game Inf. Leafl. No. 152. 42 pp.
Kingsbury, A. P., N. P. Johnson, and R. J. Kaiser. 1974. King crab study.
Comm. Fish. Res. and Devel. Act. Proj. No. 5-22-R. Completion Rept.
for period 7/1/69-6/30/72. 93 pp.
Kravitz, M. J., W. G. Pearcy and M. P. Guin. 1976. Food of five species
of co-occurring flatfishes on Oregon's continental shelf. Fish. Bull.
74(4):984-990.
Kulichkova. V. A. 1955. Pitanie Kamchatskogo kraba v vesenne-letnii period
u Beregov Kamchatki i Sakhalina (Feeding of Kamchatka crabs during the
spring-summer period on the shores of Kamchatka and Saghalin) [in Russian
and English]. Izv. TINRO [J. Pac. Sci. Inst. Fish. Oceanogr.,
Vladivostok] 43:21-42.
Kun, M. S., and L. V. Mikulich. 1954. Sostav pishchi dalnevostochnykh
promy slovikh krabov v letnii period (Diet composition of Far Eastern
crabs of commercial quality during the summer) [in Russian, Japanese,
and English]. Izv. TINRO [J. Pac. Sci. Inst. Fish. Oceanogr.,
Vladivostok] 41:319-332.
Lewis, J. R. 1970. Problems and approaches to base-line studies in coastal
communities. FAO Tech. Conf. on Mar. Pollution and its Effect on
Living Resources and Fishing. FIR:MP 70/E-22. 7 pp.
McDonald, K. B. and K. K. Petersen. 1976. Kodiak Island: physical envir-
onment, biota, and potential problems related to oil exploration.
A scientific report based primarily on OCSEAP-sponsored research.
Science Applications, Inc., Boulder, Colorado. 146 pp.
197

McLaughlin, P. A. and J. F. Hebard. 1961. Stomach contents of the BeringSea king crab. Intl. North Pac. Fish. Comm. BuZZ. 5:5-8.
McMullen, J. C. 1967. King crab Paralithodes camtschatica (Tilesius)offshore breeding study on Marmot Flats, Kodiak Island, Spring of1967. ADF&G Informational Leaflet No. 112. 12 pp.
Malins, D. C., ed. 1977. Effects of petroleum on arctic and subarcticmarine environments and organisms. Biological effects. AcademicPress, Inc., New York, N. Y., Vol. 2. 512 pp.
Marukawa, H. 1933. Biological and fishery research on Japanese kingcrab, Paralithodes camtschatica (Tilesius) [in English and Japanese].J. Imp. Fish. Exp. Sta., Tokyo 4(37):152 pp.
Mecklenburg, T. A., S. D. Rice, and J. F. Karinen. 1976. Effects of CookInlet crude oil water soluble fractions on survival and molting of kingcrab (Paralithodes camtschatica) and coonstripe shrimp (Pandalus hypsinotuslarvae. Proceeding of the 27th Alaska Science Conference. AbstractsVol. 1. 183 pp.
Morris, R. J. 1973. Uptake and discharge of petroleum hydrocarbons bybarnacles. Mar. Poll. Bull. 4(6):107-109.
Nelson-Smith, A. 1973. Oil Pollution and Marine Ecology. Paul Elek(Scientific Books) Ltd., London. 260 pp.
Nikolskii, G. V. 1961. Special Ichthyology. Israel Program for Sci.Transl.
Olson, T. A. and F. J. Burgess, eds. 1967. Pollution and Marine Ecology.Interscience, New York. 364 pp.
Paul, A. J. and H. M. Feder. 1975. The food of the sea star Pycnopodiahelianthoides (Brandt) in Prince William Sound, Alaska. Ophelia 14:15-22.
Pearson, T. H. 1971. The benthic ecology of Loch Linnhe and Loch Eil,a sea loch system on the west coast of Scotland. III. The effect onthe benthic fauna of the introduction of pulp mill effluent. J. Exp.Mar. Biol. Ecol. 6:211-233.
Pearson, T. H. 1972. The effect of industrial effluent from pulp and papermills on the marine benthic environment. Proc. Roy. Soc. Lond. B.130:469-485.
Pearson, T. H. 1975. The benthic ecology of Loch Linnhe and Loch Eil, asea loch system on the west coast of Scotland. IV. Changes in thebenthic fauna attributable to organic enrichment. J. Exp. Mar. Biol.Ecol. 20:1-41.
198

Powell, G. C. 1964. Fishing mortality and movements of adult male king
crabs, Paralithodes ccmtschatica (Tilesius), released seaward from
Kodiak Island, Alaska. Trans. Am. Fish. Soc., 93(3):295-300.
Powell, G. G., R. Kaiser, and R. Peterson. 1974. King crab study, comp.
rep. for period 1/1/72-6/30/73. Proj. No. 5-30-R, Comm. Fish. Res.
and Devel. Act. 70 pp.
Powell G. C. and R. B. Nickerson. 1965. Aggregations among juvenile king
crabs (Paralithodes ccmtschatica, Tilesius) Kodiak, Alaska. Animal
Behaviour 13:2-3.
Rhoads, D. C. 1974. Organism-sediment relations on the muddy sea floor.
Oceanogr. Mar. Biol. Ann. Rev. 12:263-300.
Ronholt, L. L., H. H. Shippen and E. S. Brown. 1978. Demersal fish and
shellfish resources of the Gulf of Alaska from Cape Spencer to Unimak
Pass, 1948-76: A historical review. NOAA/OCSEAP R.U. No. 174, Final
Report, 2:1-955.
Rosenberg, D. H. 1972. A review of the oceanography and renewable resources
of the northern Gulf of Alaska. Report R72-23, Inst. Mar. Sci., Univ.
of Alaska, Fairbanks. Sea Grant Report 73-3, 690 pp.
Rosenberg, R. 1973. Succession in benthic macrofauna in a Swedish fjord
subsequent to the closure of a sulphite pulp mill. Oikos 24:244-258.
Rumyantsev, L. E. 1945. [the migration of crab along the southern part
of the west coast of Kamchatka.] Izvestiia Tikhookeanskogo N.-I. Instituta
Rybnogo Khoziaistva I Okeanografii, 19:55-70.
Shubnikow, D. A. 1963. Data on the biology of sablefish of the Bering Sea.
(Transl. from Russian by Isr. Prog. Sci. Transl. Jerusalem, as Soviet
Fish. Inv. Northeast Pacific, Part I p. 287-296, Avail from Nat'l.
Tech. Inf. Serv., Springfield, Va. as TT67-51203.)
Shubnikov, D. A. and L. A. Lisovenko. 1964. Data on the biology of rock
sole of the southeastern Bering Sea. In: Sov. Fish. Inv. N. Pac. Pt.
II: 220-226. Isr. Prog. Sci. Transl. TT67-51204.
Shuntov, V. P. 1965. Distribution of the Greenland halibut and arrowtooth
halibuts in the North Pacific. (Transl. from Russian by Isr. Prog.
Sci. Transl., Jerusalem, as Soviet Fish. Invest. Northeast Pacific,
Part IV, p. 220-226. Avail. from Nat'l. Tech. Inf. Serv., Springfield,
Va. as TT67-51206.)
Skalkin. V. A. 1963. Diet of flatfishes in the southeastern Bering Sea.
In: Sov. Fish. Invest. N. Pac. Pt. I: 235-250. Isr. Prog. Sci.
Transl. TT67-51203. 333 pp.
199

Smith, J. E., ed. 1968. 'Torrey Canyon' Pollution and Marine Life.Cambridge Univ. Press, Cambridge. 196 pp.
Smith, R., A. Paulson, J. and J. Rose. 1978. Food and feeding relation-ships in the benthic and demersal fishes of the Gulf of Alaska andBering Sea. Ann. Rep. to NOAA R.U. #284, Inst. Mar. Sci., Univ. Alaska,Fairbanks, 70 pp.
Straughan, D. 1971. Biological and oceanographical survey of the SantaBarbara Channel oil spill 1969-1970. Allan Hancock Foundation, Univ.of Southern California, Los Angeles. 425 pp.
Suyehiro, Y. 1942. A study on the digestive system and feeding habits offish. Jap. J. Zool. 10:1-303.
Takeuchi, I. 1959. Food of king crab (Paralithodes camtschatica) off thewest coast of Kamchatka in 1958. Bull. Hokkaido Reg. Fish. Res. Lab.20:67-75. (Transl. from Jap.-Fish. Res. Bd. Can. Transl. Ser. No. 1193.)
Takeuchi, I. 1967. Food of king crab, Paralithodes camtschatica, off thewest coast of the Kamtchatka peninsula, 1958-1964. Bull. Jap. SeaReg. Fish. Res. Lab. 33:32-44. (Transl. from Jap.-Fish. Res. Bd. Can.Transl. Ser. No. 1194.).
Tarverdieva, M.I. 1976. Feeding of the Kamchatka king crab, Paralithodescamtschatica and tanner crabs, Chionoecetes bairdi and Chionoecetesopilio in the southeastern part of the Bering Sea. Biologiya Morya2(1):41-48. (Transl. from Russian).
Vinogradov, L. G. 1945. Godichnyi tsikl zhizni i migratsii kraba v serernoichasti zapadnokam-chatskogo shelfa (The annual life cycles and migra-tions of crabs in the northern part of the west Kamchatka shelf) [inRussian and Japanese]. Izv. TINRO [J. Pac. Sci. Inst. Fish. Oceanogr.,Vladivostok] 19:3-54.
Wallace, M. M., C. J. Pertuit and A. H. Huatum. 1949. Contributions to thebiology of the king crab, Paralithodes camtschatica (Tilesius). U.S.Fish and Wildlife Service, Fishery Leaflet, 340:1-49.
Watson. 1969. Biological investigations on the spider crab, Chionoecetesopilio. Proc. meeting on Atlantic crab fishery development. Can.Fish. Rept. 13:24-27.
Zenkevitch, L. A. 1963. Biology of the Seas of the USSR. George Allenand Unwin., Ltd., London. 955 pp.
200

APPENDIX A
201

TABLE I
BENTHIC TRAWL AND SCUBA STATIONS OCCUPIED IN
THE KODIAK REGION, 1978
202

TABLE ICONTINUED
203

APPENDIX B
204

TABLE I
STATIONS OCCUPIED, TYPE OF ACTIVITY AT STATION, AND NUMBER OF STOMACHS COLLECTED OR EXAMINED

TABLE I
CONTINUED

Figure 1. Stations occupied by the NOAA Ship Miller Freeman, 14-24 February 1979.From Cruise Report NOAA Ship Miller Freeman.

ANNUAL REPORT
Contract No. 03-5-022-68, Task Order 5Research Unit #6
Reporting Period: 1 April 1978-31 March 1979
The distribution, abundance, diversity and
productivity of the western Beaufort Sea benthos.
Andrew G. Carey, Jr., Principal Investigator
School of Oceanography
Oregon State University
Corvallis, Oregon 97331
April 6, 1979
208

TABLE OF CONTENTS
Page
I. Summary . ............................... ... .................... 1
II. IntroductionA. General nature and scope of study........................ 2B. Specific objectives.................................... 5C. Relevance to problems of petroleum development........... 7
III. Current state of knowledge..................................... 8
IV. Study area............... ......................................... 9
V. Sources, methods and rationale of data collectionA. WEBSEC.................................................. 10B. OCS-Coastal and Shelf................................... 10C. Temporal Variability Study Methods...................... 10D. Epontic ice algal community relationships with the
benthic fauna and environment...................... 11
VI. ResultsA. Depth Distribution........................ ........... 12B. Temporal Variability................................... 33C. Zoogeography of western Beaufort Sea Polychaeta
(Annelida) .. ...... ...... ............ ............. . 41
VII. Discussion............ .............. .. ........................... 124
VIII. Conclusions............................ .. ...................... . 125
IX. Summary of January-March Quarter (RU #6 & #6W).................. 126
X. Auxiliary Material..................................... ........ 150
209

1.
I. Summary of Objectives, Conclusions, and Implications with Respect to OCSOil and Gas Development.
Extensive exploration and development for oil and gas on the Alaskan andCanadian continental shelf have the potential to significantly influence themarine environment of the Beaufort Sea. It is impossible with our presentknowledge to accurately predict the consequences of petroleum development on themarine benthos.
The past and continuing goal of this project has been to acquire the knowledgeof the ecology of benthic invertebrate faunas of the Beaufort Sea continental shelfnecessary to evaluate the-consequences of offshore oil and gas development. Thedistribution and abundance of the fauna has been examined in detail with studiesof the spatial and temporal variability of these. These data will provide abaseline against which future changes in the benthic environment and communitystructure can be evaluated. Of current importance are: (1) the definition oftemporal changes in sublittoral community structure, (2) the determination of thelife histories and secondary production estimates of dominant and ecologicallyimportant species, (3) the description of the benthic food web, and (4) the studyof the ecology of benthic invertebrates important as prey organisms to the marinemammals, birds, and fishes. Now that broad ecological patterns of benthicinvertebrates on the Beaufort Sea shelf are becoming fairly well known, it isimperative to define the dynamic processes maintaining temporal and spatial structure.
210

2.
II. Introduction
A. General nature and scope of the study.
The present benthic ecological studies on the continental shelf includefunctional, process-oriented research that is built on a strong base of descrip-tive work on ecological patterns and their relationship to the environment. Sea-sonal changes in the numerical abundance and biomass of the large macro-infauna(>1.0 mm) are defined at stations across the shelf. The benthic food web andits relationship to bird, fish and mammalian predators and the relationshipsbetween the epontic ice algal community and the benthic community beneath areunder investigation.
The species composition, distribution and abundance of the benthos are beingdefined in the southwestern Beaufort Sea. Species and station groupings arestatistically analyzed and the relationships to the bottom environment and tothe biological relationships explored. Dominant species are identified. Thesepatterns provide an insight into the relative importance of various features ofthe environment in determining the distribution and abundance of the benthicinvertebrate fauna. Abundance patterns provide data on potentially productiveareas of the shelf that may support the large and important top predators. Bio-logical and ecological information on important prey species are necessary foran understanding of the functioning of the oceanic food web.
The development of the research on the continental shelf benthic invertebrateshas proceeded along a logical sequence. As very little was known about the faunaat the initiation of the exploration and developmental phases of the oil and gasfields on the Alaskan North Slope, the early research involved basic survey workon the 1971 and 1972 U.S. Coast Guard oceanographic cruises in the Beaufort Sea,WEBSEC-71 and WEBSEC-72. Initial processing and analysis of bottom grab andotter trawl samples and bottom photographs were sponsored by the OceanographicSection of the National Science Foundation by a grant to the Principal Investigator.
When NOAA, under sponsorship of BLM, started an environmental assessmentresearch program around the continental shelves of Alaska, Oregon State Universityparticipated in the benthic program in the Beaufort Sea. A combination NSF andNOAA/BLM research program supported several approaches and phases of research.Detailed analysis of benthic communities and identification of the total polychaeteworm fauna over a wide range of depths could be accomplished under the NationalScience Foundation's auspices. Further continental shelf survey sampling couldbe continued under the OCSEAP with the cooperation of the Coast Guard and theirBeaufort Sea icebreaker program. With NOAA's interest and logistics support,seasonal sampling and study of temporal changes in the continental shelf communities
could be accomplished for the first time.
During the first year of operation a major objective of Task Order #4 forRU #6 was to summarize the literature and unpublished data. The majority of thisinformation came from the work-up of the samples and the analysis of the dataalready on hand at Oregon State University as a result of participation in the
WEBSEC program. The objectives for Task Order #5 under the present researchcontract for RU #6 emphasize the delineation of the benthic food web and thedescription of the coastal benthos. Efforts to characterize the composition ofthe Beaufort Sea fauna to the species level are continuing as this is a critical
step toward understanding the dynamics of the benthic ecosystem. Detailed studieson temporal changes in the continental shelf benthic communities continue.
211

3.
The OCS research on benthic ecology has been directed toward defining thedistribution and abundance of the sea floor organisms, estimating the naturalrange of spatial and temporal variability, determining the effects of the environ-ment on the fauna, estimating various biological rates, and delimiting the foodweb interactions of the benthic invertebrates.
The present benthic ecological studies on the continental shelf includefunctional, process-oriented research that is built on a strong base of descrip-tive work on ecological patterns and their relationship to the environment.Seasonal changes in the total numerical abundance and biomass of the large macro-infauna (>1.0 mm) are defined at stations across the shelf. The benthic food weband its relationship to bird, fish and mammalian predators are under investigation.
The species composition, distribution and abundance of the benthos are beingdefined in the southwestern Beaufort Sea. Species and station groupings arestatistically analyzed and the relationships to the bottom environment and tobiological relationships explored. Dominant species are identified. Thesepatterns provide an insight into the relative importance of various features ofthe environment in determining the distribution and abundance of the benthicinvertebrate fauna. Abundance patterns provide data on potentially productiveareas of the shelf that may support the large and important top predators. Bio-logical and ecological information on important prey species are necessary for anunderstanding of the functioning of the oceanic food web.
It has come to the attention of NOAA/BLM-OCSEAP that further year-round infor-mation is needed on the oceanographic and ecological processes taking place in thecoastal waters of the Beaufort Sea. As exploratory and probably production drill-ing will take place in lagoonal and coastal waters out to 20 meters depth, studiesare planned in this region to determine if the winter-spring months are biologicallyquiescent or whether organisms may be active and/or vulnerable to the oil-relatedactivities during the ice-covered months of the year.
The research being undertaken in cooperation with other scientists, isoriented toward the processes maintaining the coastal and lagoonal ecosystems inthe Beaufrot Sea. Of particular interest is the source of carbon that fuels theheterotrophic organisms living within the system. In lower latitude oceanicwaters most of the carbon fixed by photosynthesis is ultimately derived from thephytoplankton, but in coastal waters much of the organic material may be land-derived. Water acts as a three dimensional reservoir and transporter of livingand non-living organic carbon. The carbon cycle is a complex one that involvesa large extent on interacting organisms. The benthos as an ecological groupdepend to a large extent on detritus that falls down to them. In the ice-coveredwaters of the Arctic, the epontic diatoms on the undersurface of the sea ice isan added source of carbon to the system (Horner, 1976), and in shoal watersbenthic algae add to the primary production (Matheke and Horner, 1974). In thecoastal Beaufort Sea and its bordering lagoons detrital peat from the coastalerosion may also add carbon.
The underice diatom bloom is known to exist in coastal waters in the ChukchiSea off Barrow, AK (Homer and Alexander, 1972) and in the Eskimo Lakes, anestuarine inlet from the eastern Beaufort Sea (Grainger, 1975). Though its arealextent either in coastal waters or offshore over the continental shelf is nowknown, it has been suggested that these epontic diatoms could be an importantenergy source to the southern Beaufort Sea ecosystem (Clasby, et al. 1976) and
212
4.
for the Chukchi Sea (Hameedi, 1978). The pennate diatoms may fall to the seafloor upon ice melt in June (Matheke and Horner, 1974). There are very few icealgae data from the Beaufort Sea and no direct measurements to determine if theepontic diatoms fall to the bottom during ice melt. It is not resolved whetherthe ice algae add to the phytoplankton population (Hameedi, 1978) or fall to thesea floor (Matheke and Horner, 1974).
Various organisms become associated with the ice-sea water interface as thediatom bloom progresses through the months of April, May and June (Horner, 1976).Nematode worms are most abundant but harpacticoid copepods, amphipods andpolychaete larvae have been observed on the underice surface. A coastal amphipodOnisimus affinis, an important member of the demersal fish food chain, has beenreported as migrating up to the epontic community presumably to feed (Percy, 1975).
The degree of linkage between the underice epontic community and the benthiccommunity beneath is not known. There is no direct evidence that this "upsidedown benthic community" is important in the energetics of the bottom communitiesthemselves (Horner, 1976; Hameedi, 1978). It has been hypothesized that thesinking of detritus and diatom cells from the epontic community could provide asizeable downward organic input to the benthic communities and that the verticalmigration of benthic fauna up to the ice undersurface could provide anothersignificant and earlier source of energy-rich organics to certain faunal groupsof the benthos.
The research pilot project (RU #6W) on the interactions of the benthiccommunity and the underice epontic community should provide necessary backgrounddata for the design of detailed studies to prove whether direct fluxes of foodmaterials and organisms exist between the two surfaces.
The scope of the proposed project has been narrowed in terms of research tobe accomplished, but not in terms of the objectives or hypothesis to be tested.Funding constraints dictate a pilot project, but careful selection of indicatororganisms and critical processes should provide estimates of the degree of inter-action between the sea ice undersurface and the sediment surface below should bepossible.
Harpacticoid copepods are known to be associated with both the epontic andthe benthic communities. These are small crustaceans that are easy to quantita-tively sample with small cores. Though some species of gammarid amphipods arecritical in the benthic food web (Carey, 1978), careful quantitative samplingof these larger organisms would require a substantial increase in the effortexpended in this subproject. However, this epifaunal group will be wualitativelysampled by scoop net along the underice surface, along the sediment surface andmidway between the two substrates to determine if benthic species become associatedwith the epontic community in April through early June. If feasible upward anddownward-oriented traps similar to stream insect emergent traps will be deployedto attempt the collection of vertically migrating fauna such as the gammarid speciesOnissimus affinis.
213

5.
B. Specific Objectives
Objective I - Beaufort Sea Macrofaunal and Megafaunal Benthic Food Web StudiesBased on Icebreaker Cruises
1) The numerical density, biomass and gross taxonomic composition of the largebenthic macro-infauna (>1.0 mm) will be obtained at three water column andintegrated benthic food web stations in the lease area from samples collectedduring the 1978 USCGC NORTHWIND cruise to the western Beaufort Sea.
2) The identification of prey and predator species important in the benthicfood web will be undertaken as far as possible for the selected 1978 stations.
3) The gastrointestinal tract contents of selected species of benthic inverte-brates and demersal fishes (to be supplied by ADF and G and OSU) will beanalyzed as far as possible to determine the food web links within thebenthic communities and the ocean ecosystem.
4) The species composition, distribution and relative abundance of the macro-epifauna will be determined at three characteristic food web stations.
5) The distribution and abundance of primary benthic prey species (when ident-ified) will be summarized for the Beaufort Sea continental shelf from extantprocessed samples and analyzed data plus the new data to be acquired fromthe 1978 summer field season samples.
6) The numerical density biomass and gross taxonomic structure of the largemacro-infauna (>1.0 mm) at the 5 standard benthic seasonal stations will beobtained across the continental shelf on the Pitt Point Transect.
Justification
Food web studies are important because these feeding links are the routes
by which energy, elements and pollutants are transferred from one trophic levelto another. Such studies are necessary to identify the keystone species andimportant feeding areas on the Beaufort Sea continental shelf. Icebreakers are
a suitable platform for integrated multidisciplinary research, and many parts ofthe coastal food web were studied during the 1978 curise. Efforts were made
during the cruise to sample inshore of the 20 meter contour and in the leasearea. Sampling will be coordinated as much as possible with the inshore effortsof Carter Broad (RU #356) on the R/V ALUMIAK. Efforts were made to include theouter edges of the oil and gas exploratory case area within the 20 meter contours.
Objective II - The life history, reproductive activity and yearly variabilityof selected benthic species at standard stations on the PittPoint Transect.
1) The reproductive activity and population size structure of abundant speciesof bivalve molluscs, gammarid amphipods and polychaete worms will be deter-
mined as far as possible from the 1975-76 Smith-McIntyre grab samples on hand.
2) The yearly variability in numerical density and biomass of dominant specieswill be determined at the benthic Pitt Point stations.
214

6.
Objective III
General: To determine the interrelationships between the underice eponticcommunity and the underlying benthic community in the Boulder Patchand in Ste. Fansson Sound in the spring of 1979.
Specific: To determine the abundance and taxonomic composition by major groupof the meiofauna and small macrofauna of the organisms on the under-surface of the sea ice and associated with the sediments below.
To determine the abundance and species composition of the harpacticoidcopepods in the sediments and the undersurface of the sea ice.
To determine the downward flux of particles, e.g. fecal pellets,detritus, benthic diatoms from the undersurface of the ice to thesediment-water interface.
To determine if vagile benthic fauna, e.g. gammarid amphipods andharpacticoid copepods, undergo vertical migrations up to the productiveepontic community in April and May and downward to the sediments uponice break-up and melt in June.
Selected References
Clasby, R.C., R. Homer and V. Alexander. 1973. An in situ method for measuringprimary productivity of ARctic sea ice algae. J. Fish. Res. Board Can.30:835-838.
Gardner, W.D. 1977. Fluxes, dynamics and chemistry of suspended particles in'the ocean. Ph.D. Thesis. M.I.T./W.H.O.I. Joint Program. 401 pp.
Grainger, E.H. 1975. Biological productivity of the southern Beaufort Sea:
The physical-chemical environment and the plankton. Beaufort Sea Project
Technical Rpt. No. 12a. 82 pp.
Hameedi, M.J. 1978. Aspects of water column primary productivity in the Chukchi
Sea during the summer. Marine Biology 48:37-46.
Homer, R.A. 1976. Sea ice organisms. Oceanogr. Mar. Biol. Ann. Rev. 14:167-182.
Matheke, G.E.M. and R.Horner. 1974. Primary productivity of the benthic micro-
algae in the Chukchi Sea near Barrow, Alaska. J. Fish. Res. Board Can.31:1779-1786.
Percy, J.A. 1975. Ecological physiology of arctic marine invertebrates.Temperature and salinity relationships of the amphipod Onisimus affinisH.J. Hansen. J. exp. mar. Biol. Ecol. 20:99-117.
215
7
C. Relevance to Problems Associated with Petroleum Development.
Extensive exploratory and production drilling for petroleum on the Alaskanand Canadian continental shelf has the potential to significantly influence themarine benthic environment and its associated biota. It is impossible with thepresent state of our knowledge of the benthos and the Arctic environment toaccurately predict either the long or short term consequences of oil and gasdevelopment on the marine invertebrate benthos and the benthic food web. Onlyrecently has descriptive baseline data on species distribution, composition,and abundance become available with estimates of variability in space and time.
216

8.
III. Current State of Knowledge
Since intensive sampling of the benthos of the southwestern Beaufort Seabeginning in 1971, ample collections have been made to define the broad ecologicalpatterns of the bottom invertebrate organisms. These data have been submitted aspart of the Final Report of NOAA/BLM-OCSEAP Contract No. 03-5-022-68, Task OrderNo. 4 submitted to NOAA by the Benthic Ecology Group at Oregon State Universityunder Dr. Andrew G. Carey, Jr. in Quarterly and Annual Reports for Task OrderNo. 5 of RU #6, and in publications (Carey, Ruff, Castillo and Dickinson, 1974;Carey and Ruff, 1977; Montagna and Carey, 1978; Bilyard and Carey, unpublishedM.S.).
Temporal and spatial variability are also fairly well defined, but theprocesses involved in maintaining these are not known. In some areas the scoringof the sea floor by ice gouging appears to increase the patchiness of the largeinfauna (Carey et al., 1974 and Carey and Ruff, 1977). It is suggested that thetemporal variability of the outer continental shelf communities are seasonal andcaused by reproductive cycles, but no data are yet available to test this hypoth-esis (Carey, Ruff, and Montagna, unpublished M.S.).
Benthic invertebrates that are important as food sources of marine mammalsand birds have been designated by other research groups (UR's 230, 232, 172 and196), but the ecology of these particular prey species are not well known.Research has just been initiated on the benthic food web itself; its structureand rates are not known at the present time.
In summary, most of our information about the benthic invertebrates isdescriptive in nature, and the studies of the processes that cause the describedpatterns are only just in the beginning stages.
References
Bilyard, G.R. and A.G. Carey, Jr. Distributional patterns of western BeaufortSea polychaetous annelids (unpublished M.S.).
Carey, A.G., Jr., R.E. Ruff, J.G. Castillo, and Dickinson. 1974. BenthicEcology of the Western Beaufort Sea Continental Margin: PreliminaryResults. In: The Coast and Shelf of the Beaufort Sea, J.C. Reed and J.E.Sater, Editors. Arctic Institute of North America, pp. 665-680.
Carey, A.G., Jr., and R.E. Ruff. 1977. Ecological Studies of the Benthos inthe Western Beaufort Sea with Special Reference to Bivalve Molluscs. In:Polar Oceans, M.J. Dunbar, Editor. Arctic Institute of North America,pp. 505-530.
Montagna, P.A. and A.G. Carey, Jr. 1978. Distributional notes of Harpacticoida(Crustacea: Copepoda) collected from the Beaufort Sea (Arctic Ocean) Astarte11: in press.
217

9.
IV. Study Area
The Beaufort Sea is an integral part of the Arctic Ocean (Coachman andAagaard, 1974). Normally the sea ice melts and is advected seaward during Julyand August in the southern fringe of the sea over the continental shelf. Thisis a response to regional wind stresses which are variable from year to year.For example, in some years the polar pack ice can remain adjacent to the coast-line throughout the entire season. The extent of ice cover during the sunlitsummer months affects wind mixing of surface waters and the penetration of lightinto the water column. These factors affect the onset and intensity of phyto-plankton production which is highly variable and of low magnitude (Horner, 1976;Clasby, Alexander and Horner, 1976). The keels of sea ice pressure ridgesploughing through the sediments cause significant disturbance of the benthicenvironment in water depths between 20 and 40 meters (Barnes and Reimnitz, 1974;Reimnitz and Barnes, 1974). They gouge the bottom as they are transported acrossthe inner shelf by the Beaufort Sea gyral circulation and by wind stress.
Generally the bottom water masses of the southwestern Beaufort Sea arestable, and except for the shallow coastal zone, differ little in thermohalinecharacteristics throughout the year (Coachman and Aagaard, 1974). However, theouter shelf region from Point Barrow to about 150°W is influenced by Bering-Chukchi water that is advected as a subsurface layer and moves around PointBarrow throughout the year in pulses controlled in part by atmospheric pressuregradients (Hufford et al., 1977). Coastal upwelling was observed in the BarterIsland region on the shelf near 143°W during the summer of 1971 when the pack icehad moved relatively far offshore (Mountain, 1974).
References
Barnes, P.W. and E. Reimnitz. 1974. Sedimentary processes on arctic shelves offthe northern coast of Alaska. In: The Coast and Shelf of the Beaufort Sea,pp. 439-476. J.C. Reid and J.E. Sater (Eds.). Arctic Institute of North America.
Clasby, R.C., V. Alexander and R. Horner. 1976. Primary productivity of sea-icealgae. In: Assessment of the Arctic Marine Environment: -Selected Topics,pp. 289-304. D.W. Hood and D.C. Burrell (Eds.). Institute of Marine Science,University of Alaska, Fairbanks.
Coachman, L.K. and K. Aagaard. 1974. Physical oceanography of Arctic and Sub-arctic seas. In: Marine Geology and Oceanography of the Arctic Seas;pp. 1-72. Y. Herman (Ed.). Springer-Verlag, New York.
Horner, R.A. 1976. Sea ice organisms. Oceanogr. Mar. Biol. Ann. Rev. 14:167-182.
Hufford, G., K. Aagaard, R. Callaway, F. Carsey, J. Imm, B. Matthews, R. Seifert,and W. Wiseman. 1977. Physical Oceanography. In: Beaufort Sea SynthesisReport, pp. 20-42. OCSEAP Arctic Project Office, Fairbanks, AK.
Mountain, D.G. 1974. Preliminary analysis of Beaufort shelf circulation insummer. In: J.C. Reed and J.E. Sater (Eds.) Proc. Sympos. Beaufort SeaCoast and Shelf Res. Arctic Institute of North America. pp. 27-42.
Reimnitz, E. and P.W. Barnes. 1974. Sea ice as a geologic agent on the BeaufortSea shelf of Alaska. In: Proc. Sympos. Beaufort Sea Coast and Shelf Res.Arctic Institute of North America. pp. 301-354.
218

10.
V. Sources, Methods and Rationale of Data Collection
In general, two areas of continuing benthic ecological research are: (1) theextension of research into a food web project which is designed to elucidate thebiological interactions within the benthos and between the benthic organisms andother portions of the ecosystem; and (2) the further accumulation of data fromexisting samples to provide a more complete understanding of the patterns ofdistribution and abundance of benthic invertebrates across the continental shelf.This descriptive detailing will provide baseline data with more accurate estimatesof natural spatial and temporal variability.
To date, the experimental design has included a description of the benthicmacro-infaunal and mega-epifaunal communities based on the WEBSEC and OCS samples.Numerical densities, total biomass, and major taxonomic composition have all beenexamined. As the species within the taxonomic groups have been identified,statistical analysis have delimited species and station groupings, and these groupshave been correlated with the environmental characteristics of the benthic boundary.Estimates of natural spatial variability have been of major concern, and thedescriptive phases of the research have been extended through a twelve month periodto provide estimates of temporal variability and to provide initial information ofthe life histories of the arctic invertebrates. The study of interactive pathwayswith other portions of the ecosystem through the food web is a logical extensionof the current benthic research.
A. WEBSEC
2A large series of Smith-McIntyre 0.1 m grab samples were collected during
the 1971 and 1972 WEBSEC cruises of the U.S. Coast Guard. These formed the basisfor our initial survey of the large benthic infauna (>1.0 mm) and mega-epifauna(>1.3 cm). Five grab samples were collected per station. Details of methodologymay be found in the 1977 Final Report for RU #6 Task Order #4, and in Carey andRuff (1977). These samples form the source of much of the polychaete resultsreported here. Gordon R. Bilyard under support of the National Science Foundationand NOAA/BLM is analyzing these collections as part of his Ph.D. dissertation.
B. OCS - Coastal and Shelf
Continued sampling of the benthos for the OCS program has added survey in-formation critical to the description and understanding of species distributionsand abundances and ecological patterns. A minimum of 5 quantitative grabs perstation has been adherred to as a sampling strategy whenever possible.
The OCSEAP-sponsored foodweb cruise in the Beaufort Sea during the 1977summer sampling season allowed the sampling of further stations in previouslyunsurveyed areas (Figure 1) on the continental shelf and continental slope. Thecoastal areas sampled from the R/V ALUMIAK are summarized in Figure 2 and Table 1.
C. Temporal Variability Study Methods
In October 1975 we inititate year-round sampling at standard stations acrossthe southwestern Beaufort Sea continental shelf. Our major objectives were:(a) to determine the degree and timing of changes, if any, in the numericalabundance, biomass, and species composition of the benthic communities and (b) todetermine the size distribution and reproductive activity of dominant species
219

11.
V. C. Temporal Variability Study Methods (continued)
throughout the year. Five stations at 15 meter depth intervals from 25 to 100meters were sampled on five occasions over a 13-month period off Pitt Point,Alaska. Sampling was accomplished from an icebreaker during the summer fieldseason and with the aid of a helicopter during the remainder of the year- Aminimum of five standard 0.1 m2 Smith-McIntyre grab samples were taken at eachstation occupied.
Navigation was by DEW station radar, depth sounder, and sometimes aided byOMEGA during ice field trips and by satellite navigator, Loran-C and depthsounder on the summer cruise. New techniques and lighweight gear were developedfor use of the grab through the ice on airborne trips. The basic station set-upconsisted of a steel pipe tripod positioned over a 1.2 m square hole in the iceand a portable gasoline hydro winch hauling 3/16" cable rigged through blocks.
The collected sediment was initially washed through 0.42 and 1.0 mm sieves,and the larger infaunal organisms (>1.0 mm) were sorted into major taxonomicgroups, counted and weighed (wet) in the laboratory. Numerical density is basedon all taxa (>1.0 mm) except foraminiferans and nematodes. Wet-preserved weightincludes soft-bodied organisms (>1-0 mm); for greater accuracy and fidelityshelled molluscs, ophiuroids and 5 large, rare specimens weighing more than 3.0 geach were excluded. Significance of seasonal difference (P) was determined bythe Kruskal-Wallis one-way analysis by ranks: J.M. Elliot, Some Methods for theStatistical Analysis of Samples of Benthic Invertebrates. (Freshwater BiologicalAssociation, Scientific Publication No. 25, Ambleside, England 1971), p. 118.During the last quarter, the 0.5-1.0 mm fraction of the grab samples have beenpicked and rough sorted. This allows further analysis of temporal variability,particularly of the juvenile macro-faunal forms for definition of periods ofrecruitment of young into the benthic populations. (See Quarterly Report fordetailed data summaries.)
D. Epontic ice algal community relationships with the benthic fauna andenvironment.
During the last quarter preliminary fieldwork was accomplished as the initialphase of a study of the interrelationships between the "benthic" community thatdevelops on the undersurface of coastal sea ice and the benthic community below.
Cores of sediments and ice were taken by divers, and vertical animal migration
traps and particle collectors were also deployed. Further details on thesetechniques may be found in the Quarterly Report appended to this Annual Report.
220

12.
VI. Results (A summary of earlier results and conclusions can be found in theexpanded Quarterly Report for the period 1 October - 31 December 1978 forRU #6.)
A. Depth distribution and abundance of dominant pelecypod molluscs and poly-chaetous annelids across the western Beaufort Sea continental shelf.
There is clear evidence of depth zonation of species from the tw6 majortaxonomic groups, the bivalve molluscs and the polychaete worms (Figures 1-19.Specimens from these groups from the RU #6 Smith-McIntyre grab collections havealmost entirely been identified to species. Detailed quantitative ecologicalgrouping analyses have been undertaken for the polychaetes collected on WEBSEC-71and 72 and several OCS icebreaker cruises (Bilyard and Carey, unpublished M.S.).Preliminary ecological analyses for the bivalves and the remaining polychaetesare in progress.
The preliminary distribution-abundance data are summarized for the PingokIsland and Barter Island transects for 12 dominant species of bivalves and 26dominant species of polychaetes. The depths sampled range from 5 meters in thecoastal environment to 100 meters at the edge of the continental shelf. Eachstation was sampled by 5 to 10 multiple grab samples from the 1976-78 summerseasons. The deeper stations were occupied by the USCGC GLACIER and the coastalones by the R/V ALUMIAK. In the bar graphs (Figures 1 through 19) the abundanceof each species is plotted for the 8 depths across the shelf on the two transects.Zeros are interpreted as absences, and a zero count in a depth zone of low faunaldensity is interpreted as being within the normal ecological range of that species.In the latter case, the depth range is inferred to extend over the whole depthrange within which the species was collected. At the present stage of analysis onlypreliminary comments can be made about these data; and only two transects aresummarized.
The bivalve molluscs are distributed across the entire shelf areas sampled(Figures 1-6). Most of the species are abundant on the inner half of the continen-tal shelf. Some of the abrupt changes in average abundance per square meter maybe directly or indirectly caused by the effect of ice gouging and hydrographicand/or geologic characteristics of the shear zone. This zone of active ice de-formation and pressure-ridging is at an average depth of 25 meters on the BeaufortSea continental shelf. If these significant changes in distribution and abundanceare caused by the ice gouging in the active shear zone, the effects could be causedby direct destruction as well as by indirect effects, e.g. increased turbidity ofthe water, increased localized erosion and deposition, etc.
Though some of the basic distributional patterns of individual species aresimilar for both transects, distinct differences are present in some molluscandistributional patterns between the two regions of the shelf. These are probablycaused by differences in the environment, or perhaps to patchiness of the organisms,but in any case it is difficult to generalize from these data at the present time.
The polychaetous annelids are also distributed across the entire continentalshelf in the areas sampled (Figures 7-19; Table 1). These data also suggest somecharacteristic depth distribution-abundance patterns; some species are found onthe inner shelf e.g. Marenzellaria wireni (Figure 7), some on the mid-shelf e.g.Cistenides hyperborea (Figure 13), and others on the outer shelf e.g. Lumbrinerisminuta (Figure 16). Still other species e.g. Minuspio cirrifera (Figure 16) aredistributed across the entire shelf, but may show large abundances nearshore.Bimodal patterns of distribution and abundance of scae species, e.g. Micronephthysminuta (Figure 19) suggest again some direct and/or indirect effects of the ice-gouging phenomenon associated with the seasonal sea ice shear zone.
221

Figure 1. Bivalve mollusc distribution-abundance patterns across the Beaufort Sea shelf.

Figure 2. Bivalve mollusc distribution-abundance patterns across the Beaufort Sea shelf.

Figure 3. Bivalve mollusc distribution-abundance patterns across the Beaufort Sea shelf.
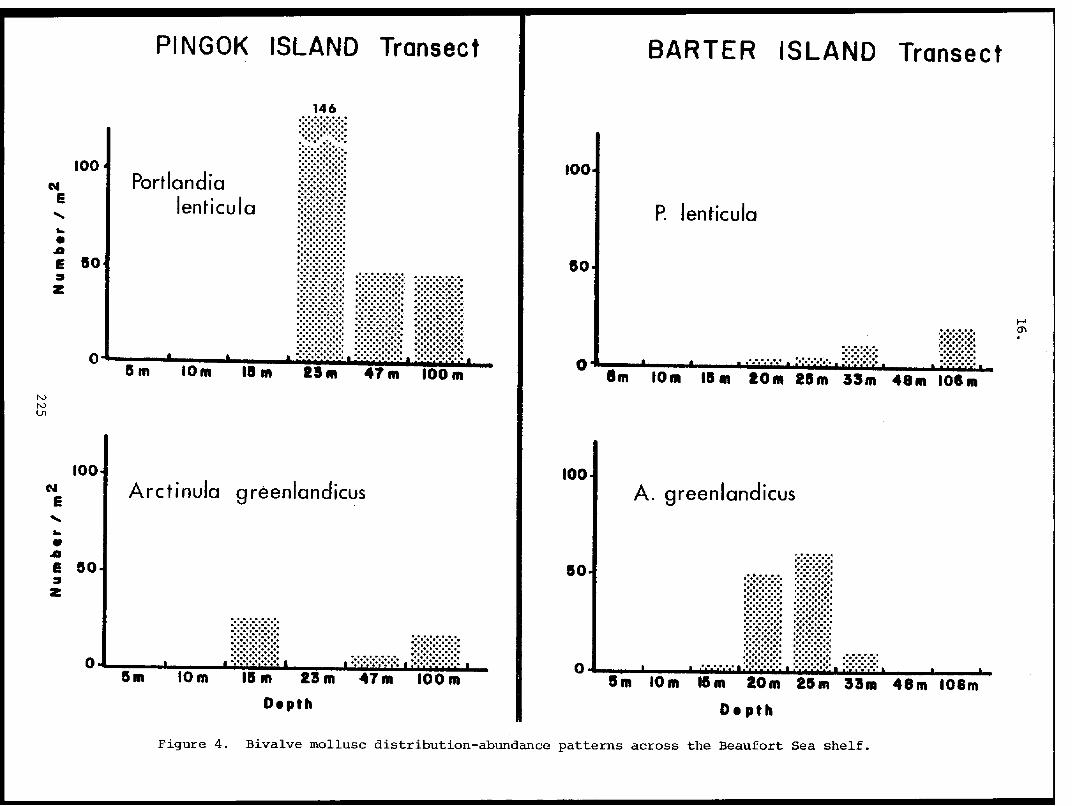
Figure 4. Bivalve mollusc distribution-abundance patterns across the Beaufort Sea shelf.

Figure 5. Bivalve mollusc distribution-abundance patterns across the Beaufort Sea shelf.

Figure 6. Bivalve mollusc distribution-abundance patterns across the Beaufort Sea shelf.

Figure 7. Polychaetous annelid distribution-abundance patterns across the Beaufort Sea shelf.

Figure 8. Polychaetous annelid distribution-abundance patterns across the Beaufort Sea shelf.

Figure 9. Polychaetous annelid distribution-abundance patterns across the Beaufort Sea shelf.

Figure 10. Polychaetous annelid distribution-abundance patterns across the Beaufort Sea shelf.

Figure 11. Polychaetous annelid distribution-abundance patterns across the Beaufort Sea shelf.

Figure 12. Polychaetous annelid distribution-abundance patterns across the Beaufort Sea shelf.

Figure 13. Polychaetous annelid distribution-abundance patterns across the Beaufort Sea shelf.

Figure 14. Polychaetous annelid distribution-abundance patterns across the Beaufort Sea shelf.

Figure 15. Polychaetous annelid distribution-abundance patterns across the Beaufort Sea shelf.

Figure 16. Polychaetous annelid distribution-abundance patterns across the Beaufort Sea shelf.

Figure 17. Polychaetous annelid distribution-abundance patterns across the Beaufort Sea shelf.
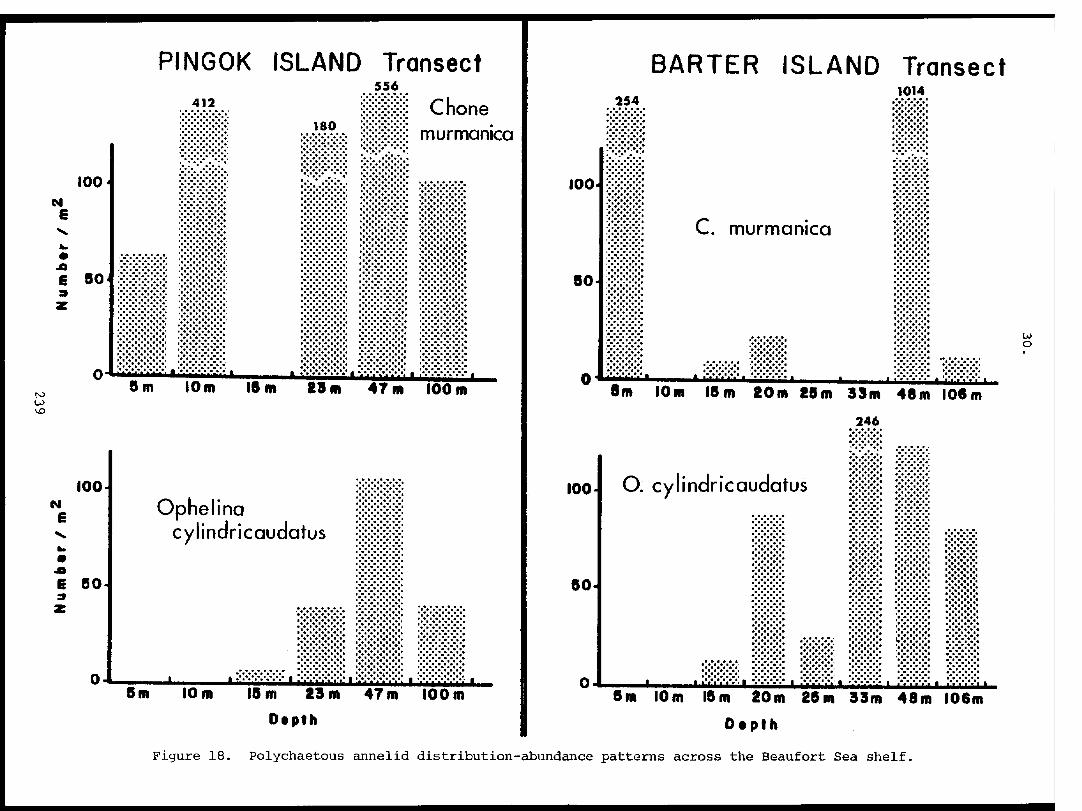
Figure 18. Polychaetous annelid distribution-abundance patterns across the Beaufort Sea shelf.

Figure 19. Polychaetous annelid distribution-abundance patterns across the Beaufort Sea shelf.

Table 1. Summary of the distribution-abundances for the dominant species of polychaete worms on two stationtransects across the western Beaufort Sea continental shelf. The data are experessed as numbersper square meter.
241

33.
Additional data and further statistical analyses including error terms arenecessary before regional conclusions can be drawn for the western Beaufort Seacontinental shelf. As additional analysis and synthesis is undertaken somegeneral conclusions about the distribution-abundance and species groupingpatterns can be drawn for important prey species in the marine coastal and con-tinental shelf food web.
B. Temporal variability of benthic infauna across the continental shelf on theOCS Station Transect - Pitt Point.
Further analysis of the' macro-infaunal time series samples from the OCSPitt Point Station Transect (Figure 20) has been undertaken. The small fraction(0.5-1.0 mm) of the Smith-McIntyre grab samples has now been completely picked,rough-sorted and quantified (See the appended Quarterly Report for the remainingdetailed data Tables). These data now allow a closer examination of therecruitment process of young individuals to the benthic populations throughoutthe year. The preliminary mean data (Figure 21) demonstrate significant changesin faunal numerical density, particularly in the small macrofaunal fraction(0.5-1.00 mm) and at the edge of the continental shelf. At station PPB-100 at100 meters depth, maximum numbers were found in August 1976, while maximumnumbers of large macro-fauna (>1.0 mm) were found in May, 1976. It is evidentthat population changes in smaller-sized groups such as the nematode worms,the harpacticoid copepods and ostracods contribute most of the variability(Tables 2 - 7) that occurs season to season. It is difficult to determine thelife history patterns of the macro-infauna at the stage of analysis. Analysisof the reproduction and recruitment of individual species populations will benecessary before more firm conclusions can be drawn concerning the causes ofthe temporal changes in the continental shelf infaunal communities.
242

Figure 20. Location chart illustrating the five seasonal stations sampledon the Pitt Point Transect.
243

Figure 21. Mean data demonstrating significant changes in faunalnumerical density.
244

Table 2. Percent composition of dominant major taxa of the small macro-infauna(0.5-1.0 mm in size) at station PPB-25 during the period November 1975through November 1976.
245
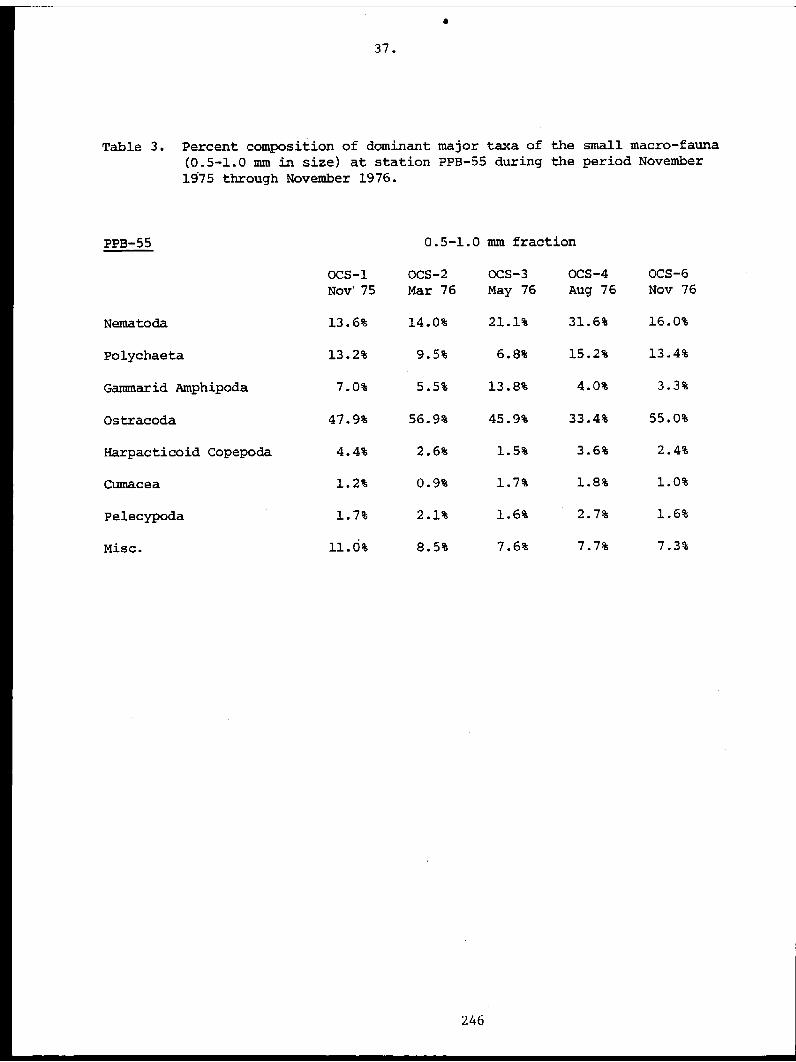
Table 3. Percent composition of dominant major taxa of the small macro-fauna(0.5-1.0 mm in size) at station PPB-55 during the period November1975 through November 1976.
246

Table 4. Percent composition of dominant major taxa of the small macro-infauna(0.5-1.0 mm in size) at station PPB-100 during the period November1975 through November 1976.
247

Table 5. Percent composition of dominant major taxa of the large macro-infauna(>1.0 mm in size) at station PPB-25 during the period November 1975through November 1976.
248

Table 6. Percent composition of dominant major taxa of the large macro-infauna(>1.0 mm in size) at station PPB-55 during the period November 1975through November 1976.
249

Table 7. Percent composition of dominant major taxa of the large macro-infauna(>1.0 mm in size) at station PPB-100 during the period November 1975through November 1976.
250

41.
VI. Results (continued)
C. The zoogeography of western Beaufort Sea Polychaeta (Annelida).*
ABSTRACT
The western Beaufort Sea polychaete fauna may be divided into sublittoraland bathyal components. Sublittoral species occur at depths of less than 141 m,but may be stenobathic or eurybathic. Bathyal species are found exclusivelybelow 358 m.
The youthful character of the sublittoral fauna, as evidenced by the dominanceof Amphiboreal-arctic species, the near absence of endemic species, and therelatively low number of species in the sublittoral environment, is attributedto invasion of the sublittoral environment during interglacial intervals. The
prevalence of endemic and Atlantic-boreoarctic species and the absence of Pacific-boreoarctic species within the bathyal fauna reflects the relative isolation ofthe bathyal and abyssal Arctic Ocean: some bathyal faunal exchange between theAtlantic and Arctic Oceans across the North Atlantic Transversal Ridge has beenpermitted since the Miocene, while the shallowness of the Bering Strait hasprevented a similar exchange of Pacific and Arctic bathyal faunas since the LateCretaceous. Isolation of the basin below 1098 m has been of sufficient duration(65 m.y.) for a strong endemic fauna to evolve.
*This section is extracted from the draft version of a manuscript by G.R. Bilyardand A.G. Carey, Jr. to be submitted to Sarsia within the next quarter.
251

42.
I. INTRODUCTION
The zoogeography of high arctic regions has been investigated through thestudy of benthic polychaetes from the western Beaufort Sea (Point Barrow toDemarcation Line). Holthe (1978) has shown that despite the tendency towardwidespread geographic distribution and eurybathy within the group, the study ofpolychaetous annelids can significantly contribute to our understanding of marinezoogeography. The intent of this discussion is to elucidate the zoogeographicrelationships of the western Beaufort Sea polychaete fauna, and to interpretthose relationships through consideration of the evolution of the Arctic Oceanbasin and present and past attributes of the western Beaufort Sea marine environ-ment. Comparisons with other groups of benthic invertebrates will be includedin the discussion.
252

43.
II. MATERIALS AND METHODS
The benthic invertebrates of the western Beaufort Sea (20-4200 m) wereintensively sampled during the Western Beaufort Sea Ecological Cruises (1971-1972) and the Outer Continental Shelf Environmental Assessment Program Cruises(1975-1978). Samples collected at 58 stations across the continental shelf andslope (Fig. 1, Table 1) were selected for detailed analysis of the polychaetefauna. Included were 151 Smith-McIntyre grab samples (0.1 m 2 ; Smith andMcIntyre, 1954), 19 otter trawl samples (3.7 and 6.7 m headrope semi-balloonshrimp trawls lined with 1.3 cm stretch mesh), and 3 box core samples (0.25 m2;Sandia-Hessler box corer, Model Mk-3).
Terminology consistent with that of Holthe (1978) has been used to grouppolychaete species by the similarity of their geographic distributions. Arcticspecies are defined as those species occurring north of 66.5°N latitude.Amphiboreal-arctic species are found in the arctic, boreal Pacific (Bering Seaand Sea of Okhotsk), and boreal Atlantic (Laborador Sea, Norwegian-GreenlandSea and the waters of Greenland, Iceland, and northern Europe). Pacific-boreo-arctic species inhabit arctic waters and the boreal waters of the Pacific, butdo not occur in the boreal waters of the Atlantic. Atlantic-boreoarctic species
inhabit arctic waters and the boreal waters of the Atlantic, but do not occur inthe boreal waters of the Pacific.
Undescribed species, which have been given letter designations in thefollowing discussion (e.g., Allia sp. A), are considered as Arctic species.Since some of these species may be collected in subarctic regions in the future,
the level of endemism in the western Beaufort Sea polychaete fauna may beoverestimated. Generic assignments for undescribed species follow Fauchald (1977).
III. RESULTS
The polychaete species encountered in this study may be divided into a sub-littoral fauna and a bathyal fauna. The sublittoral fauna includes 114 specieswith upper depth range limits of 20 to 140 m (Table 2). All degrees of stenobathyand eurybathy are exhibited by sublittoral species. Assigned to the bathyal fauna
(Table 3) are 17 species with minimum depths of occurrence in excess of 358 m.One described sublittoral species (Barantolla americana) and four described bathyal
species (Ephesiella macrocirrus, Sigambra tentaculata, Allia abranchiata, Aricidea
tetrabranchia) have not been previously collected in arctic waters.
The absence of species with upper depth range limits of 141 to 358 m probablyreflects sampling intensity (Table 1), rather than a gap in the occurrence of
additional species with increasing depth, yet the assignment of species to the
sublittoral or bathyal faunas may be justified by the substantial difference inthe zoogeographic affinities of the two faunas. The sublittoral fauna (Table 3)is predominantly composed of Amphiboreal-arctic species (89 species, 77% of the
fauna), the vast majority of which (78 species) also occur in temperate and.or
tropical latitudes. Species with Arctic (4 described species; 7 undescribed
species), Atlantic-boreoarctic (9 species), and Pacific-boreoarctic (6 species)
distributions account for only 23% of the fauna. By contrast, a majority (9) of
the bathyal species (Table 3) are undescribed and probably endemic to the Arctic
Ocean. Five bathyal species are Atlantic-boreoarctic, three are Amphiboreal-
arctic, and none are Pacific-boreoarctic.
253

Fig. 1. Polychaete stations (1-58) in the western Beaufort Sea. Depth contours are in meters.

Table 1. Stations and samples selected for analysis of the polychaete fauna.
255

Table 1 (continued).
256

Table 2. The sublittoral polychaete fauna. Species found in temperateand/or tropical latitudes are preceeded by an asterisk (*). Depthranges within the study area are noted. Undescribed taxa are given
letter designations.
257

Table 2 (continued).
258

Table 2 (continued).
259

Table 3. The bathyal polychaete fauna. Species found in temperate and/ortropical latitudes are preceeded by an asterisk (*). Depth ranges withinstudy area are noted. Undescribed taxa are given letter designations.
260

51.
IV. DISCUSSION
The sublittoral fauna
Zoogeographic affinities of the sublittoral polychaete fauna are not atypicalwithin the Arctic Ocean basin. A polychaete fauna dominated by Amphiboreal-arcticspecies, but including some Pacific-boreoarctic and Atlantic-boreoarctic specieswas reported from the Canadian Archipelago (Grainger, 1954). Similarly, abouthalf the species of western Beaufort Sea bivalve molluscs with upper depth rangesshallower than 356 m exhibit amphiboreal-Arctic distributions. The balance ofthe bivalve fauna includes Atlantic-boreoarctic (32%) and Pacific-boreoarctic(17%) species (Bernard, in press). A predominance of species with geographicdistributions extending into the Atlantic and/or Pacific Oceans, coupled with adearth of endemic species, has also been reported for isopod crustaceans (Menzieset al., 1973), sea stars (Grainger, 1966), bryozoans (Powell, 1968), and a mixedcollection of benthic invertebrates from the Point Barrow region (MacGinitie, 1955).
The absence of a strong endemic component and the consequent boreal characterof the Arctic Ocean sublittoral fauna have been cited as evidence of a youthfulfauna (Zenkevitch, 1963; Briggs, 1974; Knox and Lowry, 1977). Zoogeographicaffinities of the western Beaufort Sea sublittoral polychaete fauna further sub-stantiate the boreal character of the sublittoral fauna and are supportive of thishypothesis.
That the shallow water fauna appears to be depauperate in numbers of specieshas also been presented as evidence in s-pport of an immature fauna (Zenkevitch,1963; Dunbar, 1968; Knox and.Lowry, 1977). Knox and Lowry (1977) estimate that300 species of polychaetes occur in the Arctic Ocean. By comparison, more than650 species probably occur in the Antarctic region (Knox and Lowry, 1977), morethan 750 species probably occur in the shallow waters off South Africa (Day, 1967),and about 550 species of polychaetes have been reported from depths of less than200 m off southern California (Hartman, 1969a; Hartman, 1969b). The collectionof 114 species of sublittoral polychaetes in the present study is, therefore, notinconsistent with the concept of a depauperate shallow water fauna.
Climatic changes during the Pliocene and Pleistocene are likely responsiblefor the youthful character of the sublittoral fauna (Zenkevitch, 1963; Dunbar,1968). The intervals of Northern Hemisphere glaciation which began at 3.0 m.y.B.P.and intensified to maximum severity about 0.4 m.y.B.P. (Berggren, 1972) generallypersist about 90,000 years; interglacial intervals generally persist about 10,000years (Broecker and van Donk, 1970). In the arctic glacial intervals wereprobably accompanied by seasonal pack ice from 2.43 m.y.B.P. to 0.7 m.y. B.P.,and permanent pack ice thereafter (Herman and O'Neil, 1975).
A conservative reconstruction of full glacial conditions in the arctic wouldinclude a sea-level drop of about 85 m (CLIMAP Project Members, 1976), ice sheetsover North America, Greenland, Iceland, Great Britain, Scandanavia, the BarentsSea, and the Kara Sea (Boulton and Rhodes, 1974; Hughes et al., 1977; Kvasov andBlazhchishin, 1978), and thick pack ice and/or floating ice shelves within theArctic Ocean basin (Hughes et al., 1977). Thick permanent pack ice would havesubstantially decreased light transmission, and hence, primary productivity inthe water column, while lowered sea-level and the presence of grounded ice sheetson most of the present continental shelves would have severely reduced the arealextent of the sublittoral environment.
261

52.
Under such severe conditions, which are thought to have abated less than
10,000 years ago (Hughes et al., 1977), the elimination of many sublittoral
species probably occurred (Bernard, in press). Loss of habitat and low nutrient
supply were the probable agents of faunal extinction, as Dunbar (1968) has shown
that low temperature alone is insufficient to preclude the existence of a rich
marine fauna. Re-invasion of the sbulittoral environment by Atlantic and Pacific
species during interglacial intervals would be consistent with the hypothesis
of an immature sublittoral fauna, depauperate in the total number of species and
in the number of endemic species.
The bathyal fauna
Different zoogeographic affinities of the fauna found exclusively below 300
or 400 m in the Arctic Ocean are not unique to the polychaetous annelids. Few
endemic species of isopods are found on the continental shelf, but endemic and
Atlantic-boreoarctic species are prevalent in the isopod fauna below 425 m
(Menzies et al., 1973). Of the seven species of western Beaufort Sea bivalves
with upper depth range limits in excess of 300 m, four are endemic and three
have Atlantic-boreoarctic distributions (Bernard, in press). In addition, the
bathyal ostracod fauna (Joy and Clark, 1977) and the total benthic invertebrate
fauna in bathyal and abyssal depths off Siberia (Zenkevitch, 1963) are dominated
by endemic and Atlantic-boreoarctic species. Conspicuously absent from the
bathyal fauna of this and other studies (Zenkevitch, 1963; Menzies et al., 1973;
Joy and Clark, 1977; Bernard, in press) is a Pacific-boreoarctic element.
The composition of the bathyal polychaete fauna clearly reflects the geological
history of the Arctic Ocean basin. The absence of Pacific-boreoarctic polychaetes
and other taxa is due to the effectiveness of the Bering Strait as a topographic
barrier to faunal dispersion. After having been emergent since the Late Cretaceous,
the Bering land bridge submerged briefly during the Middle and Late Miocene
(Hopkins and Scholl, 1970). Subsidence to its present elevation at 3.5 m.y.B.P.
during the Pliocene (Hopkins and Scholl, 1970) has permitted the exchange of
shallow water species at a maximum depth of 70 m only during interglacial intervals.
Hence, no exchange of truly bathyal or abyssal species between'the Arctic and
Pacific Oceans has been possible for over 65 m.y.
Domination of the Arctic Ocean bathyal fauna by endemic and Atlantic-boreo-
arctic species is well documented (Ekman, 1953; Zenkevitch, 1963; this study), and
understandable within an historical framework. Although the northward extension
of the Mid-Atlantic Redge generated a deep-water connection between the Arctic
Ocean and the Norwegian-Greenland Sea during the Oligocene (Talwani and Eldholm,
1977), the presence of the North Atlantic Transversal Ridge between Greenland,
Iceland, and Great Britain prevented deep water faunal exchange. Submergence of
that portion of the ridge between Iceland and the Faeroe Islands began in the
Oligocene and was sufficient to permit substantial water exchange sometime during
the Miocene (Schrader et al., 1976). An exchange of Arctic and Atlantic bathyal
species was probably initiated at that time.
Because the North Atlantic Transversal Ridge has never been deeper than at
present (average, 500-600 m; maximum, 1098 m), only those bathyal and abyssal
bivalves which occur at 560 m or less are found in both the Arctic and Atlantic
Ocean basins (Clarke, 1963). Similarly, of the eight described species of bathyal
polychaetes found in this study, six occur at depths of less than 1,000 m in the
Atlantic Ocean. The remaining two species (Ephesiella macrocirrus, 2000-2500 m;
Allia abranchiata, 1500-2000 m) are known from only one study (Hartman, 1965).
262

53.
The existence of many endemic bathyal and abyssal species is explained bygeographic isolation. The Arctic Ocean has not been in contact with the Atlanticor Pacific Oceans at depths greater than 1098 m since possibly the Late Cretaceous(65 m.y.B.P.) and adequate time for speciation has elapsed.
By its presence the endemic fauna further reveals that the Arctic Ocean hasnot been anoxic in the recent past. If permanent ice cover on the Arctic Oceanand Norwegian-Greenland Sea during glacial intervals (CLIMPA Project Members,1976) had prevented a flow of oxygenated water into the ARctic Ocean at depth,extinction of the bathyal and abyssal faunas would have ensued. The existantendemic fauna is too rich to have evolved since the end of the last glacial interval.
263

54.
REFERENCES
Berggren, W.A. 1972. The Late Pliocene-Pleistocene glaciation. InitialReports of the Deep Sea Drilling Project. 12:953-963.
Bernard, F.R., in press. Bivalve molluscs of the western Beaufort Sea.Natural History Museum of Los Angeles County, Science Series.
Boulton, G.S. and M. Rhodes. 1974. Isostatic uplift and glacial historyin northern Spitsbergen. Geol. Mag. 111:481-500.
Briggs, J.C. 1974. Marine zoogeography. New York: McGraw-Hill Book Co. 475 pp.
Broecker, W.S. and J. van Donk. 1970. Insolation changes, ice volumes,and the 018 record in deep-sea cores. Rev. Geophys. & Space Phys.8:169-198.
Clarke, A.H. 1963. On the origin and relationships of the Arctic Oceanabyssal mollusc fauna. XVI International Congress of Zoology, vol. 1,p. 202.
CLIMAP Project Members. 1976. The surface of the ice-age earth.Science, N.Y. 191:1131-1144.
Day, J.H. 1967. A monograph on the polychaeta of southern Africa. London:
The British Museum of Natural History. 2 vols., 878 pp.
Dunbar, M.J. 1968. Ecological development in polar regions. EnglewoodCliffs, N.J.: Prentice-Hall, Inc. 119 pp.
Ekman, S. 1953. Zoogeography of the sea. London: Sidgwick and JacksonLtd. 417 pp.
Fauchald, K. 1977. The polychaete worms, definitions to the orders, families
and genera. Natural History Museum of Los Angeles County. ScienceSeries 28. 188 pp.
Grainger, E.H. 1954. Polychaetous annelids of Ungava Bay, Hudson Strait,Frobisher Bay and Cumberland Sound. J. Fish. Res. Bd Can. 11:507-528.
Grainger, E.H. 1966. Sea stars (Echinodermata:Asteroidea) of arctic North
America. Bull Fish. Res. Bd Can., No. 152. 70 pp.
Hartman, O. 1965. Deep-water benthic polychaetous annelids off New Englandto Bermuda and other North Atlantic areas. Allan Hancock Fdn Occ. Pap.
28:1-378.
Hartman, O. 1969a. Atlas of the errantiate polychaetous annelids from
California. Los Angeles: Allan Hancock Foundation, University ofSouthern California. 828 pp.
Hartman, 0. 1969b. Atlas of the sedentariate polychaetous annelids from
California. Los Angeles: Allan Hancock Foundation, University of
Southern California. 812 pp.
264

55.
Herman, Y. and J.R. O'Neil. 1975. Arctic palaeosalinities during LateCainozoic time. Nature, Lond. 258:591-595.
Holthe, T. 1978. The zoogeography of the Terebellomorpha (Polychaeta) ofthe northern European waters. Sarsia 63:191-198.
Hopkins, D.M. and D.W. Scholl. 1970. Tectonic development of Beringia, LateMesozoic to Holocene. Bull. Am. Ass. Petro. Geol. 54:2486-2487.
Hughes, T, Denton, G.H., and M.G. Grosswald. 1977. Was there a late-Würmarctic ice sheet? Nature, Lond. 266:596-602.
Joy , J.A. and D.L. Clark. 1977. The distribution, ecology and systematics ofthe benthic Ostracoda of the central Arctic Ocean. Micropaleontology23:129-154.
Knox, G.A. and J.K. Lowry. 1977. A comparison between the benthos of theSouthern Ocean and the North Polar Ocean with special reference to theAmphipoda and Polychaeta. In Polar Oceans, pp. 423-462. M.J. Dunbar,ed. Calgary, Alberta: The Arctic Institute of North America.
Kvasov, D.D. and A.I. Blazhchisnin. 1978. The key to sources of the Plioceneand Pleistocene glaciation is at the bottom of the Barents Sea. Nature,Lond. 273:138-140.
MacGinitie, G.E. 1955. Distribution and ecology of the marine invertebratesof Point Barrow, Alaska. Smithsonian. misc. Collns. 128 (no. 9):1-201.
Menzies, R.J., George, R.Y., and G.T. Rowe. 1973. Abyssal environmentand ecology of the world oceans. New York: John Wiley and Sons, Inc.488 pp.
Powell, N.A. 1968. Bryozoa (Polyzoa) of arctic Canada. J. Fish. Res. BdCan. 25:2269-2320.
Schrader, H.-J., Bjørklund, K., Manum, S., Martini, E., and J. van Hinte.1976. Cenozoic biostratigraphy, physical stratigraphy and paleooceanographyin the Norwegian-Greenland Sea, deep-sea drilling project leg 28paleontological synthesis. Initial Reports of the Deep Sea DrillingProject. 38:1197-1211. Washington, D.C.: U.S. Government Printing Office.
Smith, W. and A.D. McIntyre. 1954. A spring-loaded bottom sampler.J. mar. biol. Ass. U.K. 33:257-264.
Talwani, M. and O. Eldholm. 1977. Evolution of the Norwegian-Greenland Sea.Bull geol. Soc. Am. 88:969-999.
Zenkevitch, L. 1963. Biology of the seas of the U.S.S.R. New York:John Wiley and Sons, Inc. 955 pp.
265

56.
VI. Results (continued)
D, Polychaeta (Annelida): Data Sheets
One hundred thirty-three species of polychaetes (Table ) have beencollected and identified from the continental shelf and slope of the westernBeaufort Sea (20-4200 m). Species given letter designations in Table 1 (example:Eclysippe sp. A) are new to science and will be described at a later date in an
appropriate journal. The assistance of Dr. Kristian Fauchald is gratefullyacknowledged: the high degree of taxonomic accuracy achieved in this studywould not have been possible without his help.
The following data include all samples of polychaetes which have beencompletely sorted and identified to the species level as of March 1, 1979.(Unidentified material was, in most cases, too damaged to permit identification.)The data given below were generated from samples collected during the WesternBeaufort Sea Ecological Cruises of 1971 (WEBSEC-71) and 1972 (WEBSEC-72), and
during the Outer Continental Shelf Environmental Assessment Program cruises of
Summer, 1976 (OCS-4) and Summer, 1977 (OCS-7). Station designations (U.S.C.G.,Oceanographic Report No. CG373-64, 1974) for stations occupied during the WEBSEC
cruises are included on the data sheets: a WBS designation indicates theWestern Beaufort Sea Ecological Cruise station number, while a CG designationindicates the Coast Guard station number.
Sampling gear included a Smith-McIntyre grab (SMG), a 1/4m 2 Hessler-Sandiabox corer (BxC), and two otter trawls (OTB). Both otter trawls (3.7m and 6.7m
headropes) were lined with 1.3cm stretch mesh. Only Smith-McIntyre grab data
should be considered quantitative in the following data set, since the box
corer over-penetrated the bottom sediments when deployed, and the area sampledby the otter trawls is difficult to quantify.
The Smith-McIntyre grab data collected during the WEBSEC-71 cruise, exclusive
of Smith-McIntyre grabs 885, 886, and 887, formed the data base for the manuscript"Distributional Patterns of Western Beaufort Sea Polychaetous Annelids" which was
submitted to the journal Marine Biology in January, 1979. A draft of this manu-
script (by G.R. Bilyard and A.G. Carey, Jr.) was included as part of the QuarterlyReport to NOAA-OCSEAP for the period 1 October - 31 December, 1978 (Contract No.
03-5-022-68, Research Unit #6).
266

57.
Table
AMPHARETIDAE
Amage auricula Malmgren, 1866Ampharete acutifrons (Grube, 1860)Ampharete arctica Malmgren, 1866Ampharete vega (Wirén, 1883)Amphicteis gunneri (Sars, 1835)Eclysippe sp. AGlyphanostomum pallescens (Théel, 1879)Lysippe labiata Malmgren 1866Melinna cristata (Sars, 1851)Sabellides borealis Sars, 1856Genus "A"
APISTOBRANCHIDAEApistobranchus tullbergi (Théel, 1879)
CAPITELLIDAEBarantolla americana Hartman, 1963Capitella capitata (Fabricius, 1780)Heteromastus filiformis (Claparède, 1864)Parheteromastus sp. AGenus "B"
CHAETOPTERIDAESpiochaetopterus typicus Sars, 1856
CIRRATULIDAEChaetozone setosa Malmgren, 1867Cirratulus cirratus (Miller, 1776)Tharyx ? acutus Webster and Benedict, 1887
COSSURIDAECossura longocirrata Webster and-Benedict, 1887Cossura sp. A
DORVILLEIDAESchistomeringos caecus (Webster and Benedict, 1884)Schistomeringos sp. A
FLABELLIGERIDAEBrada incrustata Støp-Bowitz, 1948Brada inhabilis (Rathke, 1843)Brada nuda Annenkova, 1922Brada villosa (Rathke, 1843)Diplocirrus hirsutus (Hansen, 1879)Diplocirrus longisetosus (v. Marenzeller, 1890)Pherusa plumosa (Müller, 1776)
GONIADIDAEGlycinde wireni Arwidsson, 1899
HESIONIDAENereimyra aphroditoides (Fabricius, 1780)
267

58.
LUMBRINERIDAELumbrineris fragilis (Müller, 1776)Lumbrineris impatiens (Claparède, 1868)Lumbrineris latreilli (Audouin and Milne-Edwards, 1833)Lumbrineris minuta Théel, 1879Lumbrineris sp. ALumbrineris sp. B
MAGELONIDAEMagelona longicornis Johnson, 1901
MALDANIDAEClymenura polaris (Théel, 1879)Lumbriclymene minor Arwidsson, 1907Maldane sarsi Malmgren, 1865Notoproctus oculatus var. arctica Arwidsson, 1907Petaloproctus tenuis (Théel, 1879)Praxillella praetermissa (Malmgren, 1865)
NEPHTYIDAEAglaophamus malmgreni (Théel, 1879)Micronephthys minuta (Th4el, 1879)Nephtys ciliata (Müller, 1776)Nephtys discors Ehlers, 1868Nephtys paradoxa Malm
NEREIDAENereis zonata Malmgren,' 1867Nicon sp. A
ONUPHIDAENothria conchylega (Sars, 1835)Onuphis quadricuspis Sars, 1872)
OPHELIIDAEOphelina abranchiata Støp-Bowitz, 1948Ophelina acuminata Oersted, 1843Ophelina cylindricaudatus (Hansen, 1879)Ophelina sp. ATachytrypane sp. A
ORBINIIDAEScoloplos acutus (Verrill, 1873)
OWENIIDAEMyriochele heeri Malmgren, 1867Owenia fusiformis delle Chiaje, 1841
PARAONIDAEAllia abranchiata (Hartman, 1965)Allia suecica (Elaison, 1920)Allia sp. AAricidea tetrabranchia Hartman and Fauchald, 1971Aricidea ushakovi Zachs, 1925Paraonis sp. ATauberia gracilis (Tauber, 1879)
268

59.
PECTINARIIDAECistenides hyperborea (Malmgren, 1865)
PHYLLODOCIDAEAnaitides citrina (Malmgren, 1865)Anaitides groenlandica (Oersted, 1843)Eteone flava (Fabricius, 1780)Eteone longa (Fabricius, 1780)Mysta barbata (Malmgren, 1865)Mystides borealis Théel, 1879Paranaitis wahlbergi (Malmgren, 1865)
PILARGIIDAESigambra tentaculata (Treadwell, 1941)
POLYNOIDAEAntinoella badia (Théel, 1879)Antinoella sarsi (Malmgren, 1865)Arcteobia anticostiensis (McIntosh, 1874)Enipo gracilis Verrill, 1874Eucranta villosa Malmgren, 1865Eunoe oerstedi (Malmgren, 1865)Gattyana cirrosa (Pallas, 1766)Harmothoe imbricata (Linnaeus, 1767)Lagisca extenuata (Grube, 1840)Melaenis loveni Malmgren, 1865
SABELLIDAEBranchiomma infarcta (Kröyer, 1856)Chone duneri Malmgren, 1867Chone infundibuliformis Kröyer, 1856Chone murmanica Lukasch, 1910Euchone papillosa (Sars, 1851)Jasmineira schaudinni Augener, 19i2
SCALIBREGMIDAEPolyphysia crassa (Oersted, 1843)Scalibregma inflatum Rathke, 1843
SERPULIDAEApomatus globifer Théel, 1879
SIGALIONIDAEPholoe minuta (Fabricius, 1780)
SPAERODORIDAEEphesiella macrocirrus Hartman and Fauchald, 1971Sphaerodoridium claparedii (Greef, 1866)Sphaerodoridium sp. ASphaerodoropsis biserialis (Berkeley and Berkeley, 1944)Sphaerodoropsis minuta (Webster and Benedict, 1887)Sphaerodoropsis sp. ASphaerodoropsis sp. CSphaerodorum gracilis (Rathke, 1843)
269

60.
SPIONIDAELaonice cirrata (Sars, 1851)Minuspio cirrifera (Wiren, 1883)Polydora caulleryi Mesnil, 1897Prionospio steenstrupi Malmgren, 1867
SPIRORBIDAEDexiospira spirillum (Linnaeus, 1758)Spirorbis granulatus (Linnaeus, 1767)
STERNASPIDAESternaspis fossor Stimpson, 1854
SYLLIDAEAutolytus alexandri Malmgren, 1867Autolytus fallax Malmgren, 1867Exogone dispar (Webster, 1879).Exogone naidina Oersted, 1845Sphaerosyllis erinaceus (Claparede, 1863)Typosyllis cornuta (Rathke, 1843)Typosyllis fasciata (Malmgren, 1867)
TEREBELLIDAEArtacama proboscidea Malmgren, 1866Axionice flexuosa (Grube, 1860)Lanassa nordenskioldi Malmgren, 1866Lanassa venusta Malm, 1874Laphania boecki Malmgreh, 1866Leaena abranchiata Malmgren, 1866Nicolea zostericola Oersted, 1844Polycirrus medusa Grube, 1855Proclea graffi (Langerhans, 18441
TRICHOBRANCHIDAETerebellides stroemi Sars, 1835Trichobranchus glacialis (Malmgren, 1866)
TROCHOCHAETIDAETrochochaeta carica (Birula, 1897)
270

61.
SMG 829 Station WBS-1/CG-1 SMG 830 Station WBS-1/CG-170°15.5'N 143°39.6'W 70°15.5'N 143°39.6'W34m 19 August 1971 33m 19 August 1971R/V GLACIER WEBSEC-71 R/V GLACIER WEBSEC-71Sieve mesh aperture - 1.00mm Sieve mesh aperture - 1.00mm
POLYCHAETA POLYCHAETA
Allia suecica 27 Allia suecica 17Anaitides groenlandica 2 Anaitides groenlandica 2Barantolla americana 7 Antinoella badia 1Chaetozone setosa 9 Apistobranchus tullbergi 1Cossura longocirrata 2 Barantolla americana 1Diplocirrus hirsutus 1 Chaetozone setosa 7Eteone longa 1 Cossura longocirrata 3Exogone dispar 4 Dexiospira spirillum 1Heteromastus filiformis 12 Diplocirrus hirsutus 2Laphania boecki 1 Exogone naidina 2Lumbriclymene minor 1 Heteromastus filiformis. 10Lumbrineris minuta 18 Lumbrineris fragilis 2Lysippe labiata 4 Lumbrineris minuta 18Maldane sarsi 34 Lysippe labiata 1Melaenis loveni 1 Maldane sarsi 63Melinna cristata 3 Melinna cristata 1Micronephthys minuta 4 Micronephthys minuta 1Nereis zonata 4 Nereis zonata 2Ophelina cylindricaudatus 27 Ophelina cylindricaudatus 34Paraonis sp. A 3 Pholoe minuta 15Pholoe minuta 7 Polydora caulleryi 1Polydora caulleryi 1 Prionospio steenstrupi 13Prionospio steenstrupi 4 Scoloplos acutus 1Scalibregma inflatum 4 Sphaerodorum gracilis 4Scoloplos acutus 1 Sternaspis fossor 1Tauberia gracilis 36 Tauberia gracilis 15Tharyx ? acutus 38 Terebellides stroemi 2Typosyllis cornuta 1 Tharyx ? acutus 28Genus "A" (Ampharetidae) 1
UNIDENTIFIED POLYCHAETA UNIDENTIFIED POLYCHAETA
Ampharetidae 2 Maldanidae 3Cirratulidae 1 Phyllodocidae 1Maldanidae 13 Polynoidae 1Spionidae 1
271
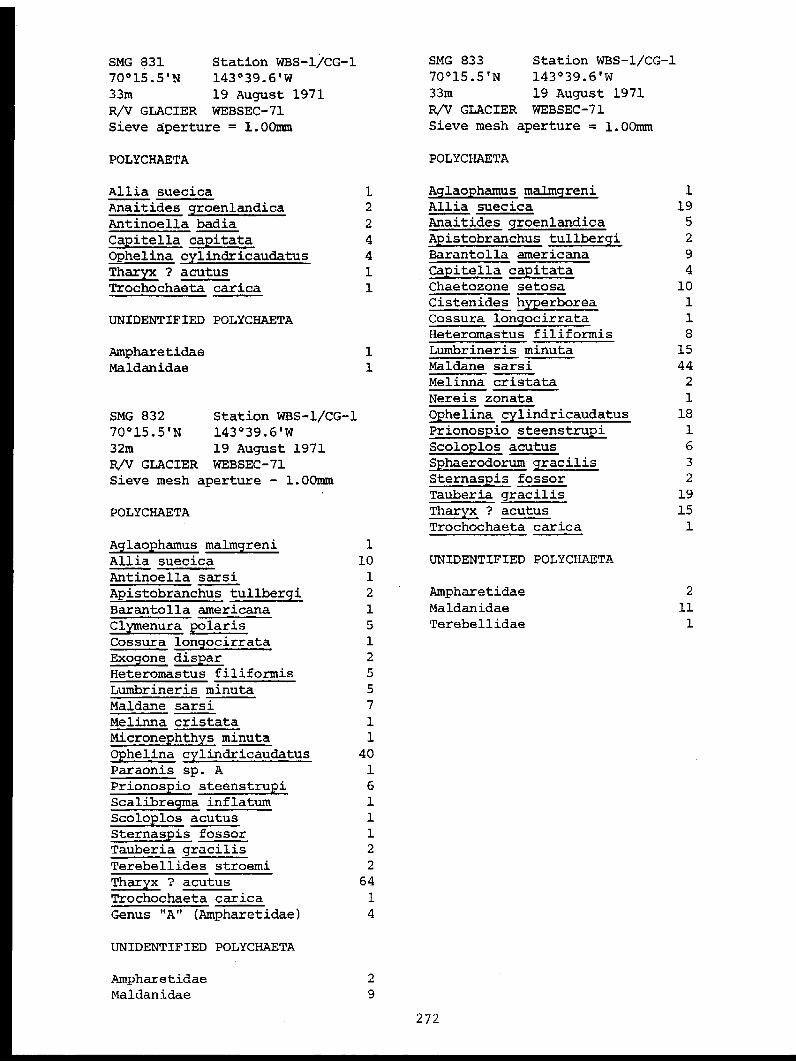
SMG 831 Station WBS-1/CG-1 SMG 833 Station WBS-1/CG-170°15.5'N 143°39.6'W 70°15.5'N 143°39.6'W
33m 19 August 1971 33m 19 August 1971R/V GLACIER WEBSEC-71 R/V GLACIER WEBSEC-71
Sieve aperture = 1.00mm Sieve mesh aperture = 1.00mm
POLYCHAETA POLYCHAETA
Allia suecica 1 Aglaophamus malmgreni 1Anaitides groenlandica 2 Allia suecica 19
Antinoella badia 2 Anaitides groenlandica 5Capitella capitata 4 Apistobranchus tullbergi 2
Ophelina cylindricaudatus 4 Barantolla americana 9
Tharyx ? acutus 1 Capitella capitata 4Trochochaeta carica 1 Chaetozone setosa 10
Cistenides hyperborea 1
UNIDENTIFIED POLYCHAETA Cossura longocirrata 1Heteromastus filiformis 8
Ampharetidae 1 Lumbrineris minuta 15
Maldanidae 1 Maldane sarsi 44Melinna cristata 2Nereis zonata 1
SMG 832 Station WBS-1/CG-1 Ophelina cylindricaudatus 18
70°15.5'N 143 039.6'W Prionospio steenstrupi 1
32m 19 August 1971 Scoloplos acutus 6R/V GLACIER WEBSEC-71 Sphaerodorum gracilis 3
Sieve mesh aperture - 1.00mm Sternaspis fossor 2Tauberia gracilis 19
POLYCHAETA Tharyx ? acutus 15Trochochaeta carica 1
Aglaophamus malmgreni 1Allia suecica 10 UNIDENTIFIED POLYCHAETA
Antinoella sarsi 1Apistobranchus tullbergi 2 Ampharetidae 2
Barantolla americana 1 Maldanidae 11Clymenura polaris 5 Terebellidae 1Cossura longocirrata 1Exogone dispar 2Heteromastus filiformis 5Lumbrineris minuta 5Maldane sarsi 7Melinna cristata 1Micronephthys minuta 1Ophelina cylindricaudatus 40Paraonis sp. A 1Prionospio steenstrupi 6Scalibregma inflatum 1Scoloplos acutus 1Sternaspis fossor 1Tauberia gracilis 2Terebellides stroemi 2Tharyx ? acutus 64Trochochaeta carica 1Genus "A" (Ampharetidae) 4
UNIDENTIFIED POLYCHAETA
Ampharetidae 2Maldanidae 9
272

63.
SMG 834 Station WBS-2/CG-370°27'N 143°34'W48m 20 August 1971R/V GLACIER WEBSEC-71Sieve mesh aperture = 1.00mm
POLYCHAETA
Allia suecica 2 UNIDENTIFIED POLYCHAETAAmpharete acutifrons 5Ampharete arctica 3 Maldanidae 4Ampharete vega 1 Terebellidae 1Amphicteis gunneri 1Anaitides groenlandica 2Apistobranchus tullbergi 1Autolytus fallax 2Clymenura polaris 5Chone duneri 4Chone murmanica 11Cossura longocirrata 1Diplocirrus longisetosus 2Eteone longa 2Eucranta villosa 1Euchone papillosa 1Exogone dispar 11Exogone naidina 3Gattyana cirrosa 1Glyphanostomum pallescens 1Lagisca extenuata 4Lanassa nordenskioldi 1Laonice cirrata 1Laphania boecki 6Lumbrineris fragilis 1Lumbrineris minuta 6Melinna cristata 13Micronephthys minuta 14Myriochele heeri 1Nereimyra aphroditoides 1Nereis zonata 9Nothria conchylega 2Ophelina cylindricaudatus 11Parheteromastus sp. A 2Pholoe minuta 9Pherusa plumosa 1Prionospio steenstrupi 2Scalibregma inflatum 6Sphaerodoropsis minuta 1Spirorbis granulatus 7Tauberia gracilis 1Terebellides stroemi 15Tharyx ? acutus 4Typosyllis cornuta 4Typosyllis fasciata 1
273

64.
SMG 835 Station WBS-2/CG-3 SMG 386 Station WBS-2/CG-370°27'N 143°34'W 70°27'N 143°34'W48m 20 August 1971 48m 20 August 1971R/V GLACIER WEBSEC-71 R/VGLACIER WEBSEC-71Sieve mesh aperture = 1.00mm Sieve mesh aperture = 1.00mm
POLYCHAETA POLYCHAETA
Allia suecica 4 Allia suecica 4Ampharete acutifrons 8 Ampharete acutifrons 7Ampharete arctica 4 Ampharete arctica 1Ampharete vega 1 Amphicteis gunneri 1Anaitides groenlandica 1 Autolytus alexandri 1Antinoella sarsi 1 Autolytus fallax 2Apistobranchus tullbergi 1 Chaetozone setosa 1Autolytus fallax 1 Chone duneri 2Chone duneri 2 Chone murmanica 146Chone murmanica 141 Cirratulus cirratus 1Euchone papillosa 2 Clymenura polaris 1Eucranta villosa 2 Diplocirrus longisetosus 2Exogone dispar 22 Exogone dispar 5Exogone naidina 3 Exogone naidina 5Glyphanostomum pallescens 4 Heteromastus filiformis 9Heteromastus filiformis 6 Lagisca extenuata 3Lagisca extenuata 3 Lanassa nordenskioldi 2Laonice cirrata 1 Laonice cirrata 2Laphania boecki 1 Laphania boecki 1Lumbrineris minuta 5 Lumbrineris fragilis 2Maldane sarsi 3 Lumbrineris minuta 13Melinna cristata 8 Lysippe labiata 3Micronephthys minuta 16 Melinna cristata 5Myriochele heeri 2 Micronephthys minuta 17Nereimyra aphroditoides 3 Minuspio cirrifera 3Nereis zonata 2 Myriochele heeri 4Nicolea zostericola 1 Nereimyra aphroditoides 1Notoproctus oculatus var. Nereis zonata 4
arctica 1 Nicolea zostericola 1Ophelina cylindricaudatus 6 Nothria conchylega 1Owenia fusiformis 2 Ophelina cylindricaudatus 15Pholoe minuta 12 Parheteromastus sp. A 11Prionospio steenstrupi 4 Pholoe minuta 21Scalibregma inflatum 2 Polycirrus medusa 1Sphaerodorum gracilis 6 Praxillella praetermissa 1Spirorbis granulatus 1 Prionospio steenstrupi 2Terebellides stroemi 15 Scalibregma inflatum 1Tharyx ? acutus 15 Sphaerodorum gracilis 3Typosyllis cornuta 2 Terebellides stroemi 26
Tharyx ? acutus 8UNIDENTIFIED POLYCHAETA Trichobranchus glacialis 1
Typosyllis cornuta 1Maldanidae 9Sabellidae 1 UNIDENTIFIED POLYCHAETATerebellidae 2
Ampharetidae 1Maldanidae 7Sabellidae 2Terebellidae 2
274

65.
SMG 837 Station WBS-2/CG-3 SMG 838 Station WBS-2/CG-370°27'N 143°34'W 70°27'N 143°34'W48m 20 August 1971 48m 20 August 1971R/V GLACIER WEBSEC-71 R/V GLACIER WEBSEC-71Sieve mesh aperture - 1.00mm Sieve mesh aperture - 1.00mm
POLYCHAETA POLYCHAETA
Allia suecica 10 Allia suecica 5Ampharete acutifrons 4 Ampharete acutifrons 1Ampharete arctica 3 Ampharete arctica 2Antinoella badia 1 Autolytus alexandri 1Antinoella sarsi 1 Autolytus fallax 1Autolytus alexandri 2 Axionice flexuosa 4Autolytus fallax 3 Brada nuda 2Dexiospira spirillum 1 Chaetozone setosa 1Eucranta villosa 1 Chone duneri 1Euchone papillosa 2 Chone murmanica 74
Exogone dispar 7 Clymenura polaris 1Exogone naidina 3 Diplocirrus longisetosus 1Heteromastus filiformis 3 Exogone dispar 6Lanassa nordenskioldi 3 Lagisca extenuata 1Lanassa venusta 4 Lanassa nordenskioldi 2Laonice cirrata 1 Lanassa venusta 8Laphania boecki 2 Laonice cirrata 1Lumbrineris minuta 4 Laphania boecki 1Lysippe labiata 3 Lumbrineris minuta 8Maldane sarsi 2 Maldane sarsi 5Melinna cristata 14 Melinna cristata 11Micronephthys minuta 22 Micronephthys minuta 10Minuspio cirrifera 2 Minuspio cirrifera 11Myriochele heeri 3 Nereis zonata 3Nereimyra aphroditoides 2 Nicolea zostericola 1Nereis zonata 5 Notoproctus oculatus var.Nicolea zostericola 3 arctica 1Ophelina cylindricaudatus 19 Ophelina cylindricaudatus 13Parheteromastus sp. A 1 Parheteromastus sp. A 4Pholoe minuta 8 Pholoe minuta 10Polycirrus medusa 1 Polycirrus medusa 2Prionospio steenstrupi 5 Praxillella praetermissa 1Sphaerodorum gracilis 7 Spirorbis granulatus 1Sphaerosyllis erinaceus 2 Terebellides stroemi 12Spirorbis granulatus 1 Thary ? acutus 10Terebellides stroemi 12 Typosyllis cornuta 2Tharyx ? acutus 17 Typosyllis fasciata 1Trichobranchus glacialis 1Typosyllis cornuta 3 UNIDENTIFIED POLYCHAETA
UNIDENTIFIED POLYCHAETA Maldanidae 3Terebellidae 2
Maldanidae 12Polynoidae 2Sabellidae 3Terebellidae 1
275

66.
SMG 839 Station WBS-3/CG-5 SMG 841 Station WBS-3/CG-570°34.6'N 143°38'W 70°34.6'N 143°38'W106m 20 August 1971 105m 20 August 1971R/V GLACIER WEBSEC-71 R/V GLACIER WEBSEC-71Sieve mesh aperture = 1.00mm Sieve mesh aperture = 1.00mm
POLYCHAETA POLYCHAETA
Allia suecica 8 Allia suecica 1Artacama proboscidea 1 Anaitides groenlandica 1Chaetozone setosa 6 Chaetozone setosa 3Diplocirrus longisetosus 1 Eteone longa 1Euchone papillosa 1 Exogone dispar 1Heteromastus filiformis 6 Heteromastus filiformis 4Laonice cirrata 3 Lumbrineris minuta 30Lumbrineris minuta 12 Lysippe labiata 4Lysippe labiata 2 Maldane sarsi 7Nereimyra aphroditoides 1 Micronephthys minuta 1Nereis zonata 1 Minuspio cirrifera 9Ophelina cylindricaudatus 7 Ophelina cylindricaudatus 6Sphaerodoropsis biserialis 4 Pholoe minuta 1Spiochaetopterus typicus 17 Scoloplos acutus 2Terebellides stroemi 2 Spiochaetopterus typicus 20Tharyx ? acutus 13 Tauberia gracilis 4Typosyllis cornuta 4 Terebellides stroemi 5
Tharyx ? acutus 15
UNIDENTIFIED POLYCHAETASMG 840 Station WBS-3/CG-570°34.6'N 143°38'W Polynoidae 1106m 20 August 1971R/V GLACIER WEBSEC-71Sieve mesh aperture = 1.00mm
POLYCHAETA
Chaetozone setosa 6Chone murmanica 1Diplocirrus longisetosus 3Eucranta villosa 1Heteromastus filiformis 8Lagisca extenuata 2Laonice cirrata 1Lumbrineris minuta 13Lysippe labiata 1Minuspio cirrifera 2Nereis zonata 1Ophelina cylindricaudatus 15Sphaerodorum gracilis 1Spiochaetopterus typicus 14Terebellides stroemi 5Tharyx ? acutus 2Typosyllis cornuta 6
276

67.
SMG 842 Station WBS-3/CG-5 SMG 843 Station WBS-3/CG-570°34.6'N 143°38'W 70°34.6'N 143°38'W105m 20 August 1971 109m 20 August 1971R/V GLACIER WEBSEC-71 R/V GLACIER WEBSEC-71Sieve mesh aperture = 1.00mm Sieve mesh aperture = 1.00mm
POLYCHAETA POLYCHAETA
Allia suecica 2 Aglaophamus malmgreni 1Allia sp. A 2 Allia suecica 1Anaitides groenlandica 2 Allia sp. A 5Chaetozone setosa 14 Anaitides groenlandica 1Chone murmanica 5 Chaetozone setosa 14Eteone longa 2 Eteone longa 1Exogone naidina 1 Eucranta villosa 2Heteromastus filiformis 5 Heteromastus filiformis 12Lagisca extenuata 3 Laonice cirrata 1Laonice cirrata 3 Lumbrineris fragilis 1Lumbrineris minuta 37 Lumbrineris minuta 48Lysippe labiata 5 Lysippe labiata 3Maldane sarsi 2 Maldane sarsi 5Micronephthys minuta 18 Micronephthys minuta 40Minuspio cirrifera 10 Minuspio cirrifera 5Myriochele heeri 1 Myriochele heeri 1Onuphis quadricuspis 1 Ophelina cylindricaudatus 3Ophelina cylindricaudatus 10 Pholoe minuta 13Pholoe minuta 11 Prionospio steenstrupi 7Prionospio steenstrupi 5 Scoloplos acutus 13Scoloplos acutus 11 Spiochaetopterus typicus 15Spiochaetopterus typicus 33 Tauberia gracilis 12Tauberia gracilis 31 Terebellides stroemi 28Terebellides stroemi 15 Tharyx ? acutus 12Tharyx ? acutus 17Typosyllis cornuta 1
277

68.
SMG 844 Station WBS-4/CG-6 SMG 845 Station WBS-4/CG-670°45.6'N 143°35.4'W 70°45.6'N 143°35.4'W494m 20 August 1971 494m 20 August 1971R/V GLACIER WEBSEC-71 R/V GLACIER WEBSEC-71Sieve mesh aperture = 1.00mm Sieve mesh aperture = 1.00mm
POLYCHAETA POLYCHAETA
Allia suecica 16 Allia suecica 7Barantolla americana 1 Amage auricula 3Chone duneri 2 Barantolla americana 3Eteone longa 1 Eclysippe sp. A 6Heteromastus filiformis 2 Ephesiella macrocirrus 1Jasmineira schaudinni 1 Heteromastus filiformis 2Lumbrineris minuta 2 Laonice cirrata 1Lumbrineris sp. B 3 Lumbrineris minuta 4Maldane sarsi 63 Lumbrineris sp. B 1Melinna cristata 2 Maldane sarsi 52Minuspio cirrifera 3 Melinna cristata 4Nephtys ciliata 1 Minuspio cirrifera 1Onuphis quadricuspis 1 Onuphis quadricuspis 5Paraonis sp. A 2 Owenia fusiformis 1Terebellides stroemi 1 Schistomeringos sp. A 2Tharyx ? acutus 1 Sigambra tentaculata 3Typosyllis cornuta 2 Tharyx ? acutus 2
UNIDENTIFIED POLYCHAETA UNIDENTIFIED POLYCHAETA
Capitellidae 1 Maldanidae 4
278

69.
SMG 846 Station WBS-4/CG-6 SMG 848 Station WBS-4/CG-670°45.6'N 143°35.4'W 70°45.6'N 143°35.4'W494m 21 August 1971 498m 21 August 1971R/V GLACIER WEBSEC-71 R/V GLACIER WEBSEC-71Sieve mesh aperture = 1.00mm Sieve mesh aperture = 1.00mm
POLYCHAETA POLYCHAETA
Aglaophamus malmgreni 1 Aglaophamus malmgreni 1Allia suecica 9 Allia suecica 17Amage auricula 3 Amage auricula 1Barantolla americana 3 Barantolla americana 4Chone duneri 2 Eclysippe sp. A 4Eclysippe sp. A 8 Jasmineira schaudinni 3Eteone longa 1 Heteromastus filiformis 2
Jasmineira schaudinni 1 Laonice cirrata 1Lumbrineris sp. B 5 Lumbrineris minuta 3Maldane sarsi 77 Lumbrineris sp. B 3Melinna cristata 1 Maldane sarsi 71Minuspio cirrifera 1 Melinna cristata 5Myriochele heeri 1 Minuspio cirrifera 1Schistomeringos sp. A 2 Myriochele heeri 4Sigambra tentaculata 1 Mysta barbata 1Tharyx ? acutus 1 Notoproctus oculatus var.
Typosyllis cornuta 1 arctica 2
Sigambra tentaculata 1UNIDENTIFIED POLYCHAETA Tharyx ? acutus 8
Typosyllis cornuta 1Maldanidae 2
UNIDENTIFIED POLYCHAETA
SMG 847 Station WBS-4/CG-6 CapitellidaeCapitelldae 170 045.6'N 143 0 35.4'W Maldanidae 4496m 21 August 1971R/V GLACIER WEBSEC-71Sieve mesh aperture = 1.00mm
POLYCHAETA
Allia suecica 16Amage auricula 7Aricidea ushakovi 2Barantolla americana 1Chone duneri 2Eclysippe sp. A 17Glyphanostomum pallescens 1Jasmineira schaudinni 4Lumbrineris minuta 5Maldane sarsi 83Melinna cristata 6Minuspio cirrifera 7Onuphis quadricuspis 1Ophelina abranchiata 1Schistomeringos sp. A 3Sigambra tentaculata 2Tauberia gracilis 1Terebellides stroemi 2Tharyx ? acutus 10
279
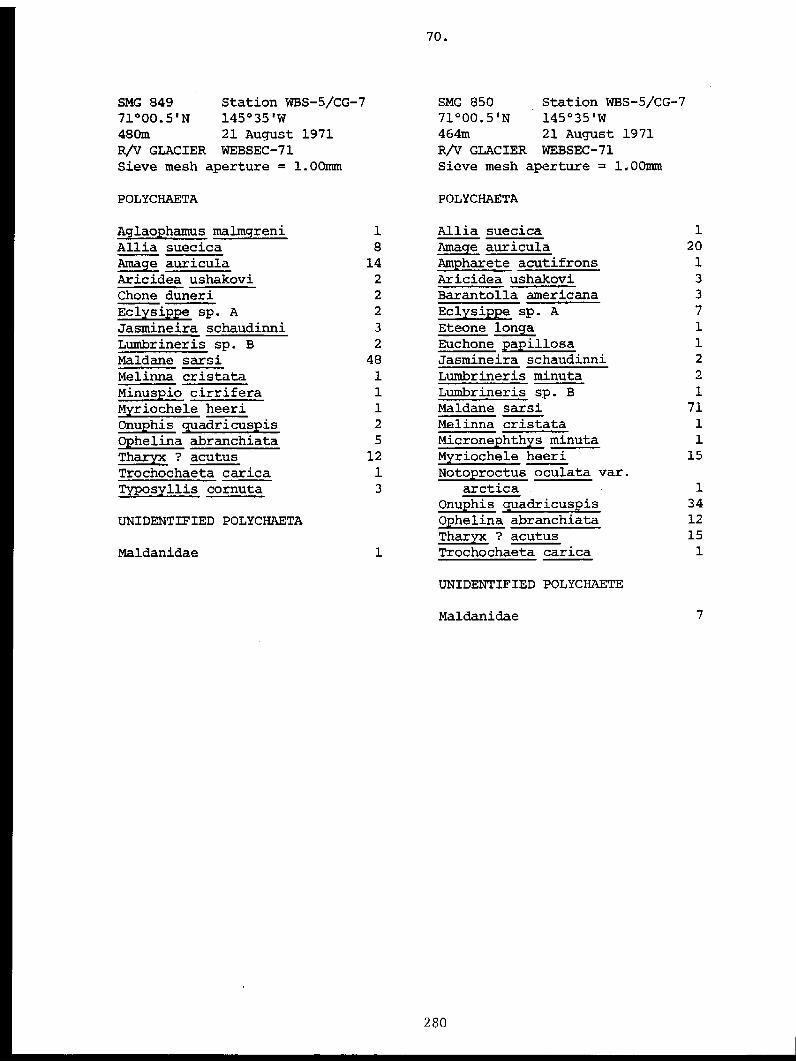
70.
SMG 849 Station WBS-5/CG-7 SMG 850 Station WBS-5/CG-771°00.5'N 145°35'W 71°00.5'N 145°35'W480m 21 August 1971 464m 21 August 1971R/V GLACIER WEBSEC-71 R/V GLACIER WEBSEC-71Sieve mesh aperture = 1.00mm Sieve mesh aperture = 1.00mm
POLYCHAETA POLYCHAETA
Aglaophamus malmgreni 1 Allia suecica 1Allia suecica 8 Amaqe auricula 20Amage auricula 14 Ampharete acutifrons 1Aricidea ushakovi 2 Aricidea ushakovi 3Chone duneri 2 Barantolla americana 3Eclysippe sp. A 2 Eclysippe sp. A 7
Jasmineira schaudinni 3 Eteone longa 1Lumbrineris sp. B 2 Euchone papillosa 1Maldane sarsi 48 Jasmineira schaudinni 2
Melinna cristata 1 Lumbrineris minuta 2
Minuspio cirrifera 1 Lumbrineris sp. B 1Myriochele heeri 1 Maldane sarsi 71Onuphis quadricuspis 2 Melinna cristata 1
Ophelina abranchiata 5 Micronephthys minuta 1Tharyx ? acutus 12 Myriochele heeri 15
Trochochaeta carica 1 Notoproctus oculata var.Typosyllis cornuta 3 arctica 1
Onuphis quadricuspis 34
UNIDENTIFIED POLYCHAETA Ophelina abranchiata 12
Tharyx ? acutus 15Maldanidae 1 Trochochaeta carica 1
UNIDENTIFIED POLYCHAETE
Maldanidae 7
280

71.
SMG 851 Station WBS-5/CG-7 SMG 853 Station WBS-5/CG-771°00.5'N 145°35'W 71°00.5'N 145°35'W450m 21 August 1971 476m 21 August 1971R/V GLACIER WEBSEC-71 R/V GLACIER WEBSEC-71Sieve mesh aperture = 1.00mm Sieve mesh aperture = 1.00mm
POLYCHAETA POLYCHAETA
Allia suecica 3 Aglaophamus malmgreni 1Amage auricula 5 Allia suecica 6Aricidea ushakovi 1 Amage auricula 7Barantolla americana 3 Aricidea ushakovi 2Eclysippe sp. A 1 Barantolla americana 4Jasmineira schaudinni 3 Chone duneri 1Lumbrineris minuta 1 Eclysippe sp. A 5Lumbrineris sp. B 1 Heteromastus filiformis 2Maldane sarsi 74 Jasmineira schaudinni 3Onuphis quadricuspis 9 Lumbrineris sp. B 2Ophelina abranchiata 11 Maldane sarsi 51Tharyx ? acutus 7 Melinna cristata 1Typosyllis cornuta 1 Myriochele heeri 1
Onuphis quadricuspis 7UNIDENTIFIED POLYCHAETA Ophelina abranchiata 14
Scoloplos acutus 1Maldanidae 2 Sigambra tentaculata 1
Sphaerodoropsis biserialis 1Sternaspis fossor 1
SMG 852 Station WBS-5/CG-7 Terebellides stroemi 271000.5'N 145 035'W Tharyx ? acutus 2447m 21 August 1971 Typosyllis cornuta 2R/V GLACIER WEBSEC-71Sieve mesh aperture = 1.00mm UNIDENTIFIED POLYCHAETA
POLYCHAETA Ampharetidae 1Maldanidae 5
Allia suecica 5Amage auricula 8Anaitides groenlandica 1Aricidae ushakovi 1Barantolla americana 4Chone duneri 1Eclysippe sp. A 3Heteromastus filiformis 1Jasmineira schaudinni 2Lanassa nordenskioldi 1Lumbrineris sp. B 2Maldane sarsi 57Onuphis quadricuspis 4Ophelina abranchiata 6Schistomeringos sp. A 1Sigambra tentaculata 1Tharyx ? acutus 18Typosyllis cornuta 2
UNIDENTIFIED POLYCHAETA
Maldanidae 2281

72.
SMG 854 Station WBS-6/CG-8 SMG 855 Station WBS-6/CG-870°48.5'N 145°56.1'W 70°48.5'N 145°56.1'W84m 22 August 1971 84m 22 August 1971R/V GLACIER WEBSEC-71 R/V GLACIER WEBSEC-71Sieve mesh aperture = 1.00mm Sieve mesh aperture = 1.00mm
POLYCHAETA POLYCHAETA
Allia suecica 14 Allia suecica 3Ampharete arctica 1 Ampharete arctica 1Amphicteis gunneri 1 Amphicteis gunneri 1Capitella capitata 1 Chaetozone setosa 3Chaetozone setosa 1 Chone murmanica 1Chone duneri 1 Heteromastus filiformis 9Chone murmanica 12 Lumbrineris minuta 4Eteone longa 1 Lysippe labiata 1Glyphanostomum pallescens 5 Maldane sarsi 1Heteromastus filiformis 9 Minuspio cirrifera 2Laphania boecki 2 Ophelina cylindricaudatus 11Lumbrineris minuta 6 Pholoe minuta 1Lysippe labiata 1 Spiochaetopterus typicus 10Maldane sarsi 3 Terebellides stremi 6Melinna cristata 1 Tharyx ? acutus 3Micronephthys minuta 1 Typosyllis cornuta 7Minuspio cirrifera 5Myriochele heeri 14 UNIDENTIFIED POLYCHAETAMystides borealis 1Ophelina cylindricaudatus 13 Maldanidae 1Pholoe minuta 4Prionospio steenstrupi 1Scalibregma inflatum 1Spiochaetopterus typicus 8Terebellides stroemi 5Tharyx ? acutus 12Typosyllis cornuta 4
UNIDENTIFIED POLYCHAETA
Maldanidae 1Scalibregmidae 1Spionidae 1Terebellidae 1
282

73.
SMG 856 Station WBS-6/CG-8 SMG 857 Station WBS-6/CG-870°48.5'N 145°56.1'W 70°48.5'W 145°56.1'W84m 22 August 1971 83m 22 August 1971R/V GLACIER WEBSEC-71 R/V GLACIER WEBSEC-71Sieve mesh aperture = 1.00mm Sieve mesh aperture = 1.00mm
POLYCHAETA POLYCHAETA
Allia suecica 3 Allia suecica 4Ampharete arctica 2 Antinoella sarsi 2Anaitides groenlandica 1 Chaetozone setosa 3Barantolla americana 2 Chone murmanica 7Chone duneri 3 Eclysippe sp. A 2Chone murmanica 8 Exogone dispar 1Exogone dispar 1 Exogone naidina 1Exogone naidina 1 Glyphanostomum pallescens 1Heteromastus filiformis 16 Heteromastus filiformis 7Lagisca extenuata 1 Laphania boecki 1Laonice cirrata 1 Lumbrineris minuta 4Lumbrineris minuta 8 Lysippe labiata 5Lysippe labiata 3 Maldane sarsi 3Maldane sarsi 4 Minuspio cirrifera 4Melinna cristata 1 Myriochele heeri 19Minuspio cirrifera 7 Ophelina cylindricaudatus 13Myriochele heeri 17 Pholoe minuta 4Ophelina cylindricaudatus 11 Polycirrus medusa 1Pholoe minuta 6 Proclea graffii 1Polyphysia crassa 1 Scalibregma inflatum 1Sphaerodoridium sp. A 1 Sphaerodoropsis biserialis 1Sphaerodorum gracilis 1 Spiochaetopterus typicus 2Spiochaetopterus typicus 4 Terebellides stroemi 4Terebellides stroemi 3 Tharyx ? acutus 1Tharyx ? acutus 18 Typosyllis cornuta 1Typosyllis cornuta 3
UNIDENTIFIED POLYCHAETAUNIDENTIFIED POLYCHAETA
Maldanidae 2Ampharetidae 1
283

74.
SMG 858 Station WBS-7/CG-9 SMG 859 Station WBS-7/CG-970°48.5'N 145°56.1'W 70°44'N 145°52'W81m 22 August 1971 57m 22 August 1971R/V GLACIER WEBSEC-71 R/V GLACIER WEBSEC-71Sieve mesh aperture = 1.00mm Sieve mesh aperture = 1.00mm
POLYCHAETA POLYCHAETA
Allia suecica 6 Allia suecica 6Anaitides groenlandica 1 Anaitides groenlandica 1Chaetozone setosa 2 Antinoella sarsi 2Chone murmanica 17 Barantolla americana 5Exogone naidina 1 Chaetozone setosa 4Heteromastus filiformis 4 Chone duneri 1Lumbrineris minuta 9 Chone murmanica 2
Lysippe labiata 1 Exogone dispar 1
Maldane sarsi 3 Heteromastus filiformis 11Minuspio cirrifera 1 Lagisca extenuata 2
Ophelina cylindricaudatus 8 Lanassa venusta 1Pholoe minuta 1 Laphania boecki 1
Prionospio steenstrupi 2 Lysippe labiata 4Sphaerodoropsis sp. B 1 Lumbrineris minuta 17Spiochaetopterus typicus 3 Maldane sarsi 12Terebellides stroemi 5 Melinna cristata 4Thary ? acutus 9 Micronephthys minuta 6Typosyllis cornuta 2 Minuspio cirrifera 1
Nephtys ciliata 1UNIDENTIFIED POLYCHAETA Onuphis quadricuspis 1
Ophelina cylindricaudatus 15
Flabelligeridae 1 Pholoe minuta 2
Terebellidae 1 Polydora caulleryi 1Prionospio steenstrupi 1Scalibregma inflatum 2Terebellides stroemi 3Tharyx ? acutus 22
Typosyllis cornuta 1
UNIDENTIFIED POLYCHAETA
Maldanidae 1
284

75.
SMG 860 Station WBS-7/CG-970°44'N 145°52'w58m 22 August 1971R/V GLACIER WEBSEC-71Sieve mesh aperture - 1.00 mm
POLYCHAETA
Allia suecica 4 Spiochaetopterus typicus 2Ampharete acutifrons 9 Terebellides stroemi 6Ampharete arctica 2 Tharyx ? acutus 28Ampharete vega 1 Typosyllis cornuta 7Anaitides citrina 1Antinoella sarsi 2 UNIDENTIFIED POLYCHAETAApistobranchus tullbergi 1Autolytus fallax 2 Dorvilleidae 1Axionice flexuosa 1 Maldanidae 4Barantolla americana 4 Sabellidae 1Capitella capitata 1 Terebellidae 2Chaetozone setosa 8Chone murmanica 39Eteone longa 1Euchone papillosa 1Exogone dispar 3Exogone naidina 6Gattyana cirrosa 1Heteromastus filiformis 26Lagisca extenuata 3Lanassa nordenskioldi 7Lanassa venusta 1Laphania boecki 1Leaena abranchiata 2Lumbrineris fragilis 1Lumbrineris impatiens 1Lumbrineris minuta 35Lysippe labiata 6Maldane sarsi 10Micronephthys minuta 10Minuspio cirrifera 2Myriochele heeri 3Nicolea zostericola 2Onuphis quadricuspis 1Ophelina cylindricaudatus 21Parheteromastus sp. A 4Pholoe minuta 6Polycirrus medusa 3Polydora caulleryi 2Polyphysia crassa 1Prionospio steenstrupi 4Scalibregma inflatum 1Schistomeringos caecus 2Sphaerosyllis erinaceus 1
285

76.
SMG 861 Station WBS-7/CG-9 SMG 862 Station WBS-7/CG-970°44'N 145°52'W 70°44'N 145°52'W57m 22 August 1971 57m 22 August 1971R/V GLACIER WEBSEC-71 R/V GLACIER WEBSEC-71Sieve mesh aperture = 1.00mm Sieve mesh aperture = 1.00mm
POLYCHAETA POLYCHAETA
Allia suecica 12 Allia suecica 6Ampharete acutifrons 1 Ampharete acutifrons 10Ampharete arctica 2 Ampharete arctica 3Ampharete vega 6 Barantolla americana 4Antinoella sarsi 1 Brada inhabilis 1Apistobranchus tullbergi 1 Capitella capitata 1Autolytus fallax 1 Chaetozone setosa 16Barantolla americana 10 Chone duneri 3Brada nuda 2 Chone murmanica 15Chaetozone setosa 16 Diplocirrus longisetosus 1Chone duneri 2 Eteone longa 1Chone murmanica 12 Exogone dispar 2Diplocirrus longisetosus 3 Exogone naidina 6Exogone dispar 5 Heteromastus filiformis 10Exogone naidina 3 Lagisca extenuata 4Heteromastus filiformis 20 Lanassa nordenskioldi 1Jasmineira schaudinni 1 Lumbrineris.minuta 20Lagisca extenuata 2 Lysippe labiata 3Laphania boecki 1 Maldane sarsi 8Lumbrineris fragilis 1 Melinna cristata 3Lumbrineris minuta 38 Micronephthys minuta 3Lysippe labiata 2 Minuspio cirrifera 2Maldane sarsi 9 Ophelina cylindricaudatus 20Melinna cristata 2 Owenia fusiformis 3Micronephthys minuta 5 Paraonis sp. A 3Minuspio cirrifera 2 Parheteromastus sp A 4Myriochele heeri 2 Pholoe minuta 8Nereimyra aphroditoides 1 Prionospio steenstrupi 2Ophelina cylindricaudatus 11 Scalibregma inflatum 5Paraonis sp. A 1 Spiochaetopterus typicus 1Parheteromastus sp. A 7 Terebellides stroemi 10Pholoe minuta 10 Tharyx ? acutus 18Polydora caulleryi 1 Typosyllis cornuta 1Prionospio steenstrupi 4Scalibregma inflatum 2 UNIDENTIFIED POLYCHAETASpiochaetopterus typicus 1Spirorbis granulatus 1 Sabellidae 3Terebellides stroemi 5 Terebellidae 3Tharyx ? acutus 24Typosyllis cornuta 2
UNIDENTIFIED POLYCHAETA
Opheliidae (Travisia spp.) 6Polynoidae 1
286

77.
SMG 863 Station WBS-7/CG-9 SMG 864 Station WBS-8/CG-1270°44'N 145°52'W 70°18'N 146°05'W57m 22 August 1971 27m 22 August 1971R/V GLACIER WEBSEC-71 R/V GLACIER WEBSEC-71Sieve mesh aperture = 1.00mm Sieve mesh aperture = 1.00mm
POLYCHAETA POLYCHAETA
Allia suecica 8 Anaitides groenlandica 3Ampharete acutifrons 3 Antinoella sarsi 1Anaitides groenlandica 3 Apistobranchus tullbergi 1Autolytus fallax 1 Capitella capitata 10Barantolla americana 3 Chaetozone setosa 3Chaetozone setosa 9 Chone murmanica 4Chone murmanica 13 Clymenura polaris 1Diplocirrus longisetosus 2 Cossura longocirrata 5Heteromastus filiformis 20 Diplocirrus longisetosa 1Lanassa nordenskioldi 1 Eteone longa 3Lanassa venusta 1 Heteromastus filiformis 43Laphania boecki 1 Micronephthys minuta 1Lumbrineris fragilis 2 Nephtys ciliata 1Lumbrineris minuta 16 Nereimyra aphroditoides 2Lysippe labiata 2 Ophelina cylindricaudatus 17Maldane sarsi 2 Pholoe minuta 9Melinna cristata 1 Prionospio steenstrupi 1Minuspio cirrifera 3 Scalibregma inflatum 2Nereis zonata 2 Scoloplos acutus 1Ophelina cylindricaudatus 30 Terebellides stroemi 1Parheteromastus sp. A 3 Tharyx ? acutus 3Pholoe minuta 3Prionospio steenstrupi 4 UNIDENTIFIED POLYCHAETAScalibregma inflatum 2Terebellides stroemi 6 Maldanidae 1Tharyx ? acutus 6 Syllidae 1Trochochaeta carica 1Typosyllis cornuta 2
UNIDENTIFIED POLYCHAETA
Maldanidae 1
287

78.
SMG 865 Station WBS-8/CG-12 SMG866 Station WBS-8/CG-1270°18'N 146°05'W 70°18'N 146°05'W26m 22 August 1971 26m 22 August 1971R/V GLACIER WEBSEC-71 R/V GLACIER WEBSEC-71Sieve mesh aperture = 1.00mm Sieve mesh aperture = 1.00mm
POLYCHAETA POLYCHAETA
Allia suecica 10 Allia sp. A 1Allia sp. A 1 Antinoella sarsi 1Anaitides groenlandica 3 Apistobranchus tullbergi 2Apistobranchus tullbergi 5 Capitella capitata 152Artacama proboscidea 1 Chaetozone setoas 13Brada villosa 1 Chone murmanica 6Capitella capitata 20 Cistenides hyperborea 1Chaetozone setoas 28 Cossura longocirrata 14Chone duneri 1 Eteone longa 14Chone murmanica 4 Heteromastus filiformis 82Cistenides hyperborea 1 Lumbrineris minuta 2Cossura longocirrata 5 Micronephthys minuta 7Eteone longa 14 Minuspio cirrifera 12Heteromastus filiformis 45 Nereimyra aphroditoides 2Lumbrineris minuta 8 Ophelina cylindricaudatus 8Micronephthys minuta 17 Parheteromastus sp. A 7Nicolea zostericola 1 Pholoe minuta 1Ophelina cylindricaudatus 8 Praxillella praetermissa 1Pholoe minuta 5 Prionospio steenstrupi 20Praxillella praetermissa 1 Scalibregma inflatum 1Prionospio steenstrupi 9 Scoloplos acutus 8Scalibregma inflatum 3 Sternaspis fossor 1Scoloplos acutus 4 Terebellides stroemi 3Sternaspis fossor 5 Tharyx ? acutus 28Terebellides stroemi 6Tharyx ? acutus 59 UNIDENTIFIED POLYCHAETA
UNIDENTIFIED POLYCHAETA Dorvilleidae 1Maldanidae 1
Maldanidae 3Terebellidae 1
288

79.
SMG 867 WBS-8/CG-12 SMG 868 Station WBS-8/CG-1270°18'N 146°05'W 70°18'N 146°05'W26m 22 August 1971 26m 22 August 1971R/V GLACIER WEBSEC-71 R/V GLACIER WEBSEC-71Sieve mesh aperture = 1.00mm Sieve mesh aperture = 1.00mm
POLYCHAETA POLYCHAETA
Aglaophamus malmgreni 1 Anaitides groenlandica 1Anaitides groenlandica 1 Ampharete vega 1Antinoella sarsi 2 Autolytus fallax 1Apistobranchus tullbergi 34 Capitella capitata 1Aricidea ushakovi 5 Chaetozone setosa 2
Artacama proboscidea 1 Chone murmanica 3
Capitella capitata 1 Heteromastus filiformis 2
Chaetozone setosa 5 Nereimyra aphroditoides 5
Chone murmanica 19 Pholoe minuta 1
Clymenura polaris 3 Prionospio steenstrupi 58
Cossura longocirrata 4 Scalibregma inflatum 1
Heteromastus filiformis 36 Tharyx ? acutus 1
Micronephthys minuta 6Minuspio cirrifera 1 UNIDENTIFIED POLYCHAETA
Nereimyra aphroditoides 2Nicolea zostericola 9 Ampharetidae 1
Ophelina cylindricaudatus 45Parheteromastus sp. A 2Pholoe minuta 4Prionospio steenstrupi 15Proclea graffii 3 SMG 885 Station WBS-12/CG-19
Scalibregma inflatum 1 71000.0'N 147004'W
Schistomeringos caecus 4 700m 24 August 1971
Sphaerodoropsis minuta 1 R/V GLACIER WEBSEC-71
Sternaspis fossor 4 Sieve mesh aperture = 1.00mmTerebellides stroemi 3Tharyx ? acutus 33 POLYCHAETA
Typosyllis cornuta 1Allia suecica 5
UNIDENTIFIED POLYCHAETA Aricidea ushakovi 1Eteone longa 4
Dorvilleidae 2 Laonice cirrata 13
Maldanidae 2 Lumbrineris minuta 5
Terebellidae 1 Maldane sarsi 9Minuspio cirrifera 82Ophelina cylindricaudatus 1Scoloplos acutus 3
Sigambra tentaculata 1Tharyx ? acutus 3
289

80.
SMG 886 Station WBS-12/CG-19 SMG 888 Station WBS-13/CG-2071°00.0'N 147°04.0'W 71°13.7'N 147°22.6'W574m 24 August 1971 3010m 25 August 1971R/V GLACIER WEBSEC-71 R/V GLACIER WEBSEC-71Sieve mesh aperture = 1.00mm Sieve mesh aperture = 1.00mm
POLYCHAETA POLYCHAETA
Allia suecica 13 Lumbrineris minuta 2Amage auricula 1 Maldane sarsi 1Cossura longocirrata 2 Minuspio cirrifera 1Eclysippe sp. A 4 Myriochele heeri 1Eteone longa 1 Sigambra tentaculata 7Heteromastus filiformis 4 Tharyx ? acutus 1Laonice cirrata 2Lumbrineris minuta 2Maldane sarsi 102Minuspio cirrifera 19 SMG 889 Station WBS-13/CG-20Myriochele heeri 73 71°19'N 147°46.0'WOnuphis quadricuspis 2 2295m 25 August 1971Ophelina abranchiata 2 R/V GLACIER WEBSEC-71Parheteromastus sp. A 1 Sieve mesh aperture = 1.00mmScoloplos acutus 1Sigambra tentaculata 1 POLYCHAETASternaspis fossor 1Terebellides stroemi 2 Sigambra tentaculata 7Tharyx ? acutus 1 Tharyx ? acutus 1
SMG-887 Station WBS-12/CG-19 SMG 890 Station WBS-13/CG-2071°00.0'N 147°04.0'W 71°19.3'N 147°47.1'W633m 24 August 1971 2377m 25 August 1971R/V GLACIER WEBSEC-71 R/V GLACIER WEBSEC_&LSieve mesh aperture = 1.00mm Sieve mesh aperture = 1.00mm
POLYCHAETA POLYCHAETA
Allia suecica 18 Lumbrineris sp. A 3Aricidea ushakovi 1 Ophelina abranchiata 3Heteromastus filiformis 2 Ophelina sp. A 1Lumbrineris minuta 2 Sigambra tentaculata 2Maldane sarsi 12 Tharyx ? acutus 2Minuspio cirrifera 34Scoloplos acutus 5Sigambra tentaculata 5Tharyx ? acutus 2Trochochaeta carica 1
290

81.
SMG 891 Station WBS-13/CG-20 SMG 913 Station WBS-19/CG-2970°19.6'N 147°48.2'W 71°08.5'N 148°00.0'W2560m 25 August 1971 430m 29 August 1971Sieve mesh aperture = 1.00mm Sieve mesh aperture = 1.00mm
POLYCHAETA POLYCHAETA
Aglaophamus malmgreni 3 Allia sp. A 2Heteromastus filiformis 1 Barantolla americana 22Lumbrineris minuta 2 Capitella capitata 1Lumbrineris sp. A 1 Chaetozone setosa 3Micronephthys minuta 1 Eteone longa 2Myriochele heeri 1 Heteromastus filiformis 2
Ophelina abranchiata 4 Laonice cirrata 14Ophelina sp. A 2 Lumbrineris minuta 12Sigambra tentaculata 9 Maldane sarsi 234Tharyx ? acutus 7 Micronephthys minuta 1
Minuspio cirrifera 27Nephtys ciliata 1Nereimyra aphroditoides 1
SMG 892 Station WBS-13/CG-20 Onuphis quadricuspis 4
71020'N 147 050'W Scoloplos acutus 182800m 25 August 1971 Sphaerodoridium sp. A 1R/V GLACIER WEBSEC-71 Spiochaetopterus typicus 2Sieve mesh aperture = 1.00mm Steraspis fossor 2
Tauberia gracilis 11POLYCHAETA Tharyx ? acutus 2
Trochochaeta carica 3
Aglaophamus malmgreni 1Lumbrineris minuta 2 UNIDENTIFIED POLYCHAETAOphelina abranchiata 1Sigambra tentaculata 11 Maldanidae 1Tharyx ? acutus 5Lumbrineris sp. A 2
291
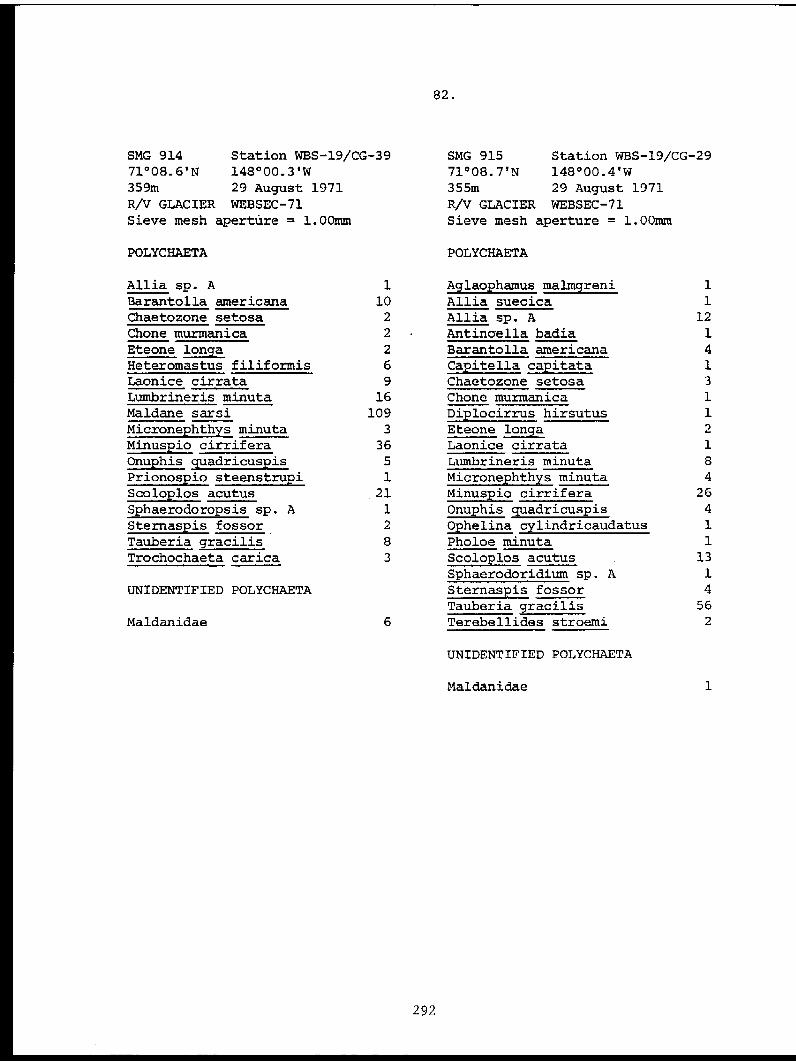
82.
SMG 914 Station WBS-19/CG-39 SMG 915 Station WBS-19/CG-2971°08.6'N 148°00.3'W 71°08.7'N 148°00.4'W359m 29 August 1971 355m 29 August 1971R/V GLACIER WEBSEC-71 R/V GLACIER WEBSEC-71Sieve mesh aperture = 1.00mm Sieve mesh aperture = 1.00mm
POLYCHAETA POLYCHAETA
Allia sp. A 1 Aglaophamus malmgreni 1Barantolla americana 10 Allia suecica 1Chaetozone setosa 2 Allia sp. A 12Chone murmanica 2 Antinoella badia 1Eteone longa 2 Barantolla americana 4Heteromastus filiformis 6 Capitella capitata 1Laonice cirrata 9 Chaetozone setosa 3Lumbrineris minuta 16 Chone murmanica 1Maldane sarsi 109 Diplocirrus hirsutus 1Micronephthys minuta 3 Eteone longa 2Minuspio cirrifera 36 Laonice cirrata 1Onuphis quadricuspis 5 Lumbrineris minuta 8Prionospio steenstrupi 1 Micronephthys minuta 4Scoloplos acutus 21 Minuspio cirrifera 26Sphaerodoropsis sp. A 1 Onuphis quadricuspis 4Sternaspis fossor 2 Ophelina cylindricaudatus 1Tauberia gracilis 8 Pholoe minuta 1Trochochaeta carica 3 Scoloplos acutus 13
Sphaerodoridium sp. A 1UNIDENTIFIED POLYCHAETA Sternaspis fossor 4
Tauberia gracilis 56Maldanidae 6 Terebellides stroemi 2
UNIDENTIFIED POLYCHAETA
Maldanidae 1
292

83.
SMG 916 Station WBS-19/CG-29 SMG 917 Station WBS-19/CG-2971°08.9'N 148°00.8'W 71°09'N 148°01.0'W335m 29 August 1971 324m 29 August 1971R/V GLACIER WEBSEC-71 R/V GLACIER WEBSEC-71Sieve mesh aperture = 1.00mm Sieve mesh aperture = 1.00mm
POLYCHAETA POLYCHAETA
Allia sp. A 6 Antinoella badia 1Antinoella badia 1 Barantolla americana 4Barantolla americana 6 Chaetozone setosa 9Chaetozone setosa 12 Eteone longa 5Chone murmanica 1 Heteromastus filiformis 2Cossura longocirrata 1 Laonice cirrata 6Eteone longa 2 Lanassa venusta 1Heteromastus filiformis 5 Lumbrineris minuta 12Laonice cirrata 9 Maldane sarsi 2Lumbrineris minuta 23 Micronephthys minuta 23Melinna cristata 1 Minuspio cirrifera 3Micronephthys minuta 8 Nephtys ciliata 3Minuspio cirrifera 12 Onuphis quadricuspis 2Nephtys ciliata 1 Ophelina cylindricaudatus 12Onuphis quadricuspis 2 Pholoe minuta 2Ophelina cylindricaudatus 24 Prionospio steenstrupi 1Pholoe minuta 2 Scoloplos acutus 61Prionospio steenstrupi 1 Spiochaetopterus typicus 4Scoloplos acutus 38 Sternaspis fossor 2Sternaspis fossor 3 Tauberia gracilis 37Tharyx ? acutus 9 Tharyx ? acutus 19
UNIDENTIFIED POLYCHAETA UNIDENTIFIED POLYCHAETA
Maldanidae 1 Ampharetidae 1Maldanidae 2
293

84.
SMG 919 Station WBS-20/CG-30 SMG 918 Station WBS-20/CG-3071°06'N 147°57'W 71°06'N 147°57'W85m 30 August 1971 94m 30 August 1971R/V GLACIER WEBSEC-71 R/V GLACIER WEBSEC-71Sieve mesh aperture = 1.00mm Sieve mesh aperture = 1.00mm
POLYCHAETA POLYCHAETA
Allia suecica 4 Allia suecica 4
Chaetozone setosa 1 Ampharete arctica 1Chone murmanica 22 Antinoella sarsi 1Exogone naidina 2 Apistobranchus tullbergi 2
Gattyana cirrosa 1 Axionice flexuosa 1Glyphanostomum pallescens 1 Barantolla americana 3Laonice cirrata 1 Chone murmanica 11Lumbrineris minuta 8 Clymenura polaris 6Lysippe labiata 3 Cossura longocirrata 14Melinna cristata 1 Exogone naidina 1Micronephthys minuta 11 Heteromastus filiformis 5
Minuspio cirrifera 2 Lanassa venusta 1Myriochele heeri 7 Laonice cirrata 27
Ophelina cylindricaudatus 4 Laphania boecki 1
Paraonis sp. A 1 Lumbrineris minuta 13
Parheteromastus sp. A 1 Lysippe labiata 27
Pholoe minuta 8 Maldane sarsi 8Polydora caulleryi 1 Micronephthys minuta 27
Scalbregma inflatum 1 Minuspio cirrifera 8
Schistomeringos caecus 1 Myriochele heeri 1
Sphaerodoropsis biserialis 1 Onuphis quadricuspis 1
Spiochaetopterus typicus 17 Ophelina cylindricaudatus 9
Tauberia gracilis 1 Parheteromastus sp. A 2
Terebellides stroemi 14 Pholoe minuta 6
Tharyx ? acutus 8 Scalibregma inflatum 1Scoloplos acutus 5
UNIDENTIFIED POLYCHAETA Spiochaetopterus typicus 19Sternaspis fossor 3
Maldanidae 1 Tauberia gracilis 20
Sabellidae 10 Terebellides stroemi 14
Terebellidae 1 Tharyx ? acutus 23
Typosyllis cornuta 1
UNIDENTIFIED POLYCHAETA
Maldanidae 1Sabellidae 2
294

85.
SMG 920 Station WBS-20/CG-30 SMG 921 Station WBS-20/CG-3071006'N 147 057'W 71006'N 147 057'W100m 30 August 1971 106m 30 August 1971R/V GLACIER WEBSEC-71 R/V GLACIER WEBSEC-71Sieve mesh aperture = 1.00mm Sieve mesh aperture = 1.00mm
POLYCHAETA POLYCHAETA
Chaetozone setosa 2 Ampharete arctica 1Chone murmanica 13 Chone murmanica 6Clymenura polaris 1 Clymenura polaris 3Eteone longa 1 Euchone papillosa 1Glyphanostomum pallescens 2 Heteromastus filiformis 1Heteromastus filiformis 1 Lagisca extenuata 3Lagisca extenuata 1 Laphania boecki 3Lumbrineris fragilis 1 Lumbrineris minuta 5Lumbrineris impatiens 2 Lysippe labiata 6Lumbrineris minuta 4 Maldane sarsi 4
Lysippe labiata 1 Micronephthys minuta 11Maldane sarsi 3 Minuspio cirrifera 1Micronephthys minuta 4 Nephtys ciliata 1Minuspio cirrifera 2 Ophelina cylindricaudatus 4Myriochele heeri 1 Parheteromastus sp. A 1Ophelina cylindricaudatus 4 Pholoe minuta 1Scoloplos acutus 1 Scoloplos acutus 2Spiochaetopterus typicus 12 Sphaerodorum gracilis 2Terebellides stroemi 3 Spiochaetopterus typicus 7Tharyx ? acutus 5 Terebellides stroemi 3Trochochaeta carica 1 Tharyx ? acutus 4
Typosyllis cornuta 1UNIDENTIFIED POLYCHAETA
UNIDENTIFIED POLYCHAETASabellidae 3
Sabellidae 1
295

86.
SMG 922 Station WBS-20/CG-30 SMG 933 Station WBS-23/CG-4471°06'N 147°57'W 71°01'N 148°22.7'W11lm 30 August 1971 48m 31 August 1971RV GLACIER WEBSEC-71 R/V GLACIER WEBSEC-71Sieve mesh aperture = 1.00mm Sieve mesh aperture = 1.00mm
POLYCHAETA POLYCHAETA
Allia suecica 2 Allia suecica 18Antinoella sarsi 1 Ampharete arctica 5Apistobranchus tullbergi 1 Autolytus fallax 1Barantolla americana 3 Barantolla americana 6Clymenura polaris 2 Chaetozone setosa 41Lumbrineris minuta 12 Chone murmanica 28Lysippe labiata 9 Eteone longa 1Maldane sarsi 5 Exogone naidina 5Micronephthys minuta 15 Gattyana cirrosa 2Minuspio cirrifera 1 Heteromastus filiformis 13Ophelina cylindricaudatus 1 Lagisca extenuata 1Parheteromastus sp. A 3 Laphania boecki 1Pholoe minuta 1 Lanassa venusta 1Scoloplos acutus 4 Leaena abranchiata 1Spiochaetopterus typicus 34 Lumbrineris fragilis 3Sternaspis fossor 2 Lumbrineris minuta 14Tauberia gracilis 1 Lysippe labiata 5Terebellides stroemi 5 Maldane sarsi 1Tharyx ? acutus 7 Minuspio cirrifera 3
Nereimyra aphroditoides 25UNIDENTIFIED POLYCHAETA Nereis zonata 10
Ophelina cylindricaudatus 7Maldanidae 2 Paraonis sp. A 2
Parheteromastus sp. A 8Pholoe minuta 3Prionospio steenstrupi 2Scalibregma inflatum 9Scoloplos acutus 3Spirorbis granulatus 2Terebellides stroemi 8Tharyx ? acutus 27
Typosyllis cornuta 3
UNIDENTIFIED POLYCHAETA
Maldanidae 1Sabellidae 26Spionidae 1Terebellidae 1
296

87.
SMG 934 Station WBS-23/CG-44 SMG 935 Station WBS-23/CG-4471°01'N 148°22.7'W 71°01.0'N 148°22.7'W46.5m 31 August 1971 47m 31 August 1971R/V GLACIER WEBSEC-71 R/V GLACIER WEBSEC-71Sieve mesh aperture = 1.00mm Sieve mesh aperture = 1.00mm
POLYCHAETA POLYCHAETA
Allia suecica 20 Allia suecica 22Antinoella sarsi 1 Ampharete acutifrons 4Autolytus fallax 1 Ampharete arctica 1Barantolla americana 9 Antinoella sarsi 1Chaetozone setosa 26 Apistobranchus tullbergi 1Chone duneri 1 Autolytus fallax 1Chone murmanica 56 Barantolla americana 4Clymenura polaris 4 Chaetozone setosa 31Diplocirrus longisetosus 1 Chone duneri 1Eteone longa 2 Chone murmanica 85Exogone naidina 4 Diplocirrus hirsutus 1Heteromastus filiformis 11 Diplocirrus longisetosus 1Laonice cirrata 2 Exogone naidina 13Laphania boecki 2 Heteromastus filiformis 1Lumbrineris minuta 27 Lagisca extenuata 1Lysippe labiata 4 Laphania boecki 3Maldane sarsi 5 Lumbrineris fragilis 3Micronephthys minuta 8 Lumbrineris minuta 26Minuspio cirrifera 2 Lysippe labiata 10Nereimyra aphroditoides 1 Micronephthys minuta 14Onuphis quadricuspis 3 Nephtys ciliata 1Ophelina cylindricaudatus 9 Nephtys paradoxa 1Paraonis sp. A 1 Nereimyra aphroditoides 7Parheteromastus sp. A 12 Nereis zonata 1Pholoe minuta 9 Ophelina acuminata 1Polydora caulleryi 1 Ophelina cylindricaudatus 14Prionospio steenstrupi 13 Paraonis sp. A 1Scalibregma inflatum 5 Parheteromastus sp. A 3Scoloplos acutus 4 Pholoe minuta 14Tauberia gracilis 2 Polycirrus medusa 3Terebellides stroemi 10 Prionospio steenstrupi 19Tharyx ? acutus 38 Scalibregma inflatum 1
Schistomeringos caecus 1UNIDENTIFIED POLYCHAETA Scoloplos acutus 1
Sphaerodoropsis biserialis 1Maldanidae 4 Terebellides stroemi 8Sabellidae 5 Tharyx ? acutus 29Terebellidae 4 Typosyllis cornuta 6
UNIDENTIFIED POLYCHAETA
Maldanidae 2Sabellidae 17
297

88.
SMG 936 Station WBS-23/CG-44 SMG 937 Station WBS-23/CG-4471°01.0'N 148°22.7'W 71°01.0'N 148°22.7'W47m 31 August 1971 47m 31 August 1971R/V GLACIER WEBSEC-71 R/V GLACIER WEBSEC-71Sieve mesh aperture = 1.00mm Sieve mesh aperture = 1.00mm
POLYCHAETA POLYCHAETA
Allia suecica 10 Allia suecica 14Ampharete acutifrons 9 Ampharete acutifrons 9Ampharete arctica 1 Ampharete arctica 1Amphicteis gunneri 1 Amphicteis gunneri 3Anaitides groenlandica 1 Antinoella sarsi 3Antinoella sarsi 1 Artacama proboscidea 1Barantolla americana 4 Autolytus fallax 2Brada nuda 1 Barantolla americana 4Chaetozone setosa 6 Brada villosa 1Chone duneri 1 Chaetozone setosa 18Chone murmanica 63 Chone duneri 1Exogone naidina 3 Chone infundibuliformis 1Heteromastus filiformis 1 Chone murmanica 46Lagisca extenuata 2 Cirratulus cirratus 2Laonice cirrata 2 Eteone longa 1Laphania boecki 4 Exogone naidina 5Lumbrineris fragilis 1 Gattyana cirrosa 1Lumbrineris minuta 7 Heteromastus filiformis 9Lysippe labiata 1 Lagisca extenuata 1Maldane sarsi 2 Laonice cirrata 3Melinna cristata 1 Laphania boecki 1Minuspio cirrifera 1 Lumbrineris fragilis 1Micronephthys minuta 8 Lumbrineris minuta 23Nereimyra aphroditoides 17 Maldane sarsi 3Nereis zonata 14 Melinna cristata 1Ophelina cylindricaudatus 8 Micronephthys minuta 7Parheteromastus sp. A 1 Minuspio cirrifera 3Pholoe minuta 1 Myriochele heeri 1Prionospio steenstrupi 4 Nereimyra aphroditoides 8Scalibregma inflatum 4 Ophelina cylindricaudatus 14Spirorbis granulatus 6 Paraonis sp. A 2Terebellides stroemi 6 Parheteromastus sp. A 6Tharyx ? acutus 17 Pholoe minuta 12
Polycirrus medusa 1UNIDENTIFIED POLYCHAETA Polydora caulleryi 1
Praxillella praetermissa 1Maldanidae 2 Prionospio steenstrupi 11Sabellidae 17 Scalibregma inflatum 3
Sphaerodoridium sp. A 1Spirorbis granulatus 2Terebellides stroemi 15Tharyx ? acutus 31
Typosyllis cornuta 1
UNIDENTIFIED POLYCHAETA
Ampharetidae 1Maldanidae 2Sabellidae 34Terebellidae 2
298

89.
SMG 943 Station WBS-26/CG-57 SMG 946 Station WBS-26/CG-5771°21.0'N 149°26.2'W 71°21.3'N 149°32.2'W1926m 4 September 1971 1800m 4 September 1971R/V GLACIER WEBSEC-71 R/V GLACIER WEBSEC-71Sieve mesh aperture = 1.00mm Sieve mesh aperture = 1.00mm
POLYCHAETA POLYCHAETA
Capitella capitata 1 Allia suecica 4Diplocirrus longisetosus 1 Capitella capitata 5Lumbrineris minuta 5 Diplocirrus hirsutus 1Minuspio cirrifera 26 Lumbrineris minuta 10Onuphis quadricuspis 1 Minuspio cirrifera 35Ophelina abranchiata 1 Ophelina cylindricaudatus 1Ophelina cylindricaudatus 1 Sigambra tentaculata 10Scoloplos acutus 2Sigambra tentaculata 9Sternaspis fossor 1 SMG 947 Station WBS-26/CG-57
71°21.5'N 149°37.0'W1622m 4 September 1971
SMG 944 Station WBS-26/CG-57 R/V GLACIER WEBSEC-7171°21.1'N 149°28.8'W Sieve mesh aperture = 1.00mm1729m 4 September 1971R/V GLACIER WEBSEC-71 POLYCHAETASieve mesh aperture = 1.00mm
Allia suecica 10POLYCHAETA Laonice cirrata 1
Lumbrineris minuta 9Lumbrineris minuta 7 Minuspio cirrifera 63Minuspio cirrifera 5 Owenia fusiformis 17Ophelina abranchiata 5 Sigambra tentaculata 11Sigambra tentaculata 10 Terebellides stroemi 2
Terebellides stroemi 3UNIDENTIFIED POLYCHAETA
SMG 945 Station WBS-26/CG-57 Maldanidae 571°21.2'N 149°30.4'W1618m 4 September 1971R/V GLACIER WEBSEC-71Sieve mesh aperture = 1.00mm
POLYCHAETA
Aricidea ushakovi 1Heteromastus filiformis 2Lumbrineris minuta 22Minuspio cirrifera 23Ophelina abranchiata 2Sigambra tentaculata 23Terebellides stroemi 5
UNIDENTIFIED POLYCHAETA
Ampharetidae 1
299
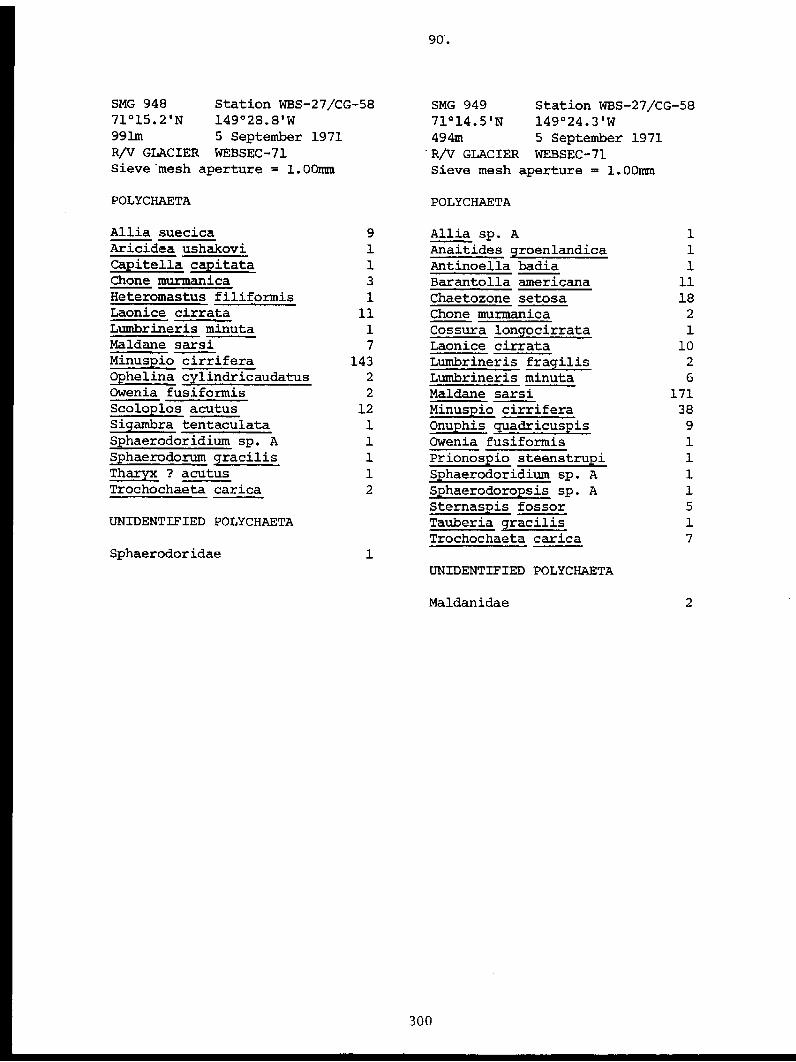
90.
SMG 948 Station WBS-27/CG-58 SMG 949 Station WBS-27/CG-5871°15.2'N 149°28.8'W 71°14.5'N 149°24.3'W991m 5 September 1971 494m 5 September 1971R/V GLACIER WEBSEC-71 R/V GLACIER WEBSEC-71Sieve mesh aperture = 1.00mm Sieve mesh aperture = 1.00mm
POLYCHAETA POLYCHAETA
Allia suecica 9 Allia sp. A 1Aricidea ushakovi 1 Anaitides groenlandica 1Capitella capitata 1 Antinoella badia 1Chone murmanica 3 Barantolla americana 11Heteromastus filiformis 1 Chaetozone setosa 18Laonice cirrata 11 Chone murmanica 2Lumbrineris minuta 1 Cossura longocirrata 1Maldane sarsi 7 Laonice cirrata 10Minuspio cirrifera 143 Lumbrineris fragilis 2Ophelina cylindricaudatus 2 Lumbrineris minuta 6Owenia fusiformis 2 Maldane sarsi 171Scoloplos acutus 12 Minuspio cirrifera 38Sigambra tentaculata 1 Onuphis quadricuspis 9Sphaerodoridium sp. A 1 Owenia fusiformis 1Sphaerodorum gracilis 1 Prionospio steenstrupi 1Tharyx ? acutus 1 Sphaerodoridium sp. A 1Trochochaeta carica 2 Sphaerodoropsis sp. A 1
Sternaspis fossor 5UNIDENTIFIED POLYCHAETA Tauberia gracilis 1
Trochochaeta carica 7Sphaerodoridae 1
UNIDENTIFIED POLYCHAETA
Maldanidae 2
300

91.
SMG 950 Station WBS-27/CG-58 SMG 951 Station WBS-27/CG-5871°14.3'N 149°23.0'W 71°14.2'N 149°22.3'W695m 5 September 1971 717m 5 September 1971R/V GLACIER WEBSEC-71 R/V GLACIER WEBSEC-71Sieve mesh aperture = 1.00mm Sieve mesh aperture = 1.00mm
POLYCHAETA POLYCHAETA
Capitella capitata 3 Allia sp. A 5Chaetozone setosa 8 Antinoella badia 1Chone murmanica 3 Barantolla americana 7Cossura longocirrata 2 Capitella capitata 2Eteone longa 1 Chaetozone setosa 2Laonice cirrata 3 Chone murmanica 1Lumbrineris minuta 6 Cossura longocirrata 7Maldane sarsi 13 Eteone longa 1Micronephthys minuta 1 Laonice cirrata 5Minuspio cirrifera 464 Lumbrineris minuta 7Ophelina cylindricaudatus 2 Maldane sarsi 20Owenia fusiformis 3 Micronephthys minuta 3Scoloplos acutus 3 Minuspio cirrifera 252Sphaerodoridium sp. A 4 Owenia fusiformis 3Sphaerodoropsis sp. B 2 Prionospio steenstrupi 1Tauberia gracilis 5 Sphaerodoridium sp. A 1
Spiochaetopterus typicus 1UNIDENTIFIED POLYCHAETA Tauberia gracilis 9
Maldanidae 18 UNIDENTIFIED POLYCHAETA
Maldanidae 13
301

92.
SMG 952 Station WBS-27/CG-58 SMG 963 Station WBS-30/CG-6371°14.1'N 149°21.7'W 70°43.0'N 149°00.0'W603m 5 September 1971 24m 7 September 1971R/V GLACIER WEBSEC-71 R/V GLACIER WEBSEC-71Sieve mesh aperture = 1.00mm Sieve mesh aperture = 1.00mm
POLYCHAETA POLYCHAETA
Allia suecica 2 Aglaophamus malmgreni 1Barantolla americana 2 Allia sp. A 2Capitella capitata 2 Ampharete acutifrons 3Chaetozone setosa 5 Anaitides groenlandica 1Chone murmanica 4 Brada villosa 4Cossura longocirrata 5 Chaetozone setosa 4Eteone longa 3 Chone murmanica 17Laonice cirrata 16 Cistenides hyperborea 1Lumbrineris fragilis 1 Clymenura polaris 1Lumbrineris minuta 2 Cossura longocirrata 1Maldane sarsi 17 Eteone longa 1Micronephthys minuta 4 Heteromastus filiformis 32Minuspio cirrifera 124 Lumbrineris minuta 3Ophelina cylindricaudatus 1 Lysippe labiata 3Owenia fusiformis 1 Micronephthys minuta 2Scoloplos acutus 4 Nephtys ciliata 1Sigambra tentaculata 1 Ophelina cylindricaudatus 13Sphaerodoropsis sp. B 1 Parheteromastus sp. A 1Spiochaetopterus typicus 2 Pholoe minuta 13Tauberia gracilis 11 Prionospio steenstrupi 5
Proclea graffii 2
UNIDENTIFIED POLYCHAETA Scoloplos acutus 5Sternaspis fossor 1
Maldanidae 2 Terebellides stroemi 3Tharyx ? acutus 22Genus "A" (Ampharetidae 4
UNIDENTIFIED POLYCHAETA
Sabellidae 1
SMG 964 Station WBS-30/CG-6370043.0'N 149 000.0'W24m 7 September 1971R/V GLACIER WEBSEC-71Sieve mesh aperture = 1.00mm
POLYCHAETA
Capitella capitata 13Chaetozone setosa 2Chone murmanica 7Lumbrineris minuta 1Minuspio cirrifera 64Scalibregma inflatum 1Sphaerodoropsis minuta 1
302

93.
SMG 965 Station WBS-30/CG-63 SMG 966 Station WBS-30/CG-6370°43.0'W 143°00.0'W 70°43.0'N 149°00.0'W23m 7 September 1971 23m 7 September 1971R/V GLACIER WEBSEC-71 R/V GLACIER WEBSEC-71Sieve mesh aperture = 1.00mm Sieve mesh aperture = 1.00mm
POLYCHAETA POLYCHAETA
Allia suecica 7 Allia suecica 2Antinoella sarsi 2 Antinoella sarsi 1Apistobranchus tullbergi 1 Chaetozone setosa 1Brada villosa 1 Chone duneri 1Capitella capitata 156 Chone murmanica 10Chaetozone setosa 6 Clymenura polaris 1Chone murmanica 49 Cossura longocirrata 1Cistenides hyperborea 1 Eteone longa 1Clymenura polaris 6 Lagisca extenuata 1Cossura longocirrata 12 Lumbrineris minuta 1Eteone flava 1 Minuspio cirrifera 2Eteone longa 3 Ophelina cylindricaudatus 3Heteromastus filiformis 11 Parheteromastus sp. A 3Lumbrineris minuta 12 Pholoe minuta 2Lysippe labiata 13 Proclea graffii 1Micronephthys minuta 2 Terebellides stroemi 1Minuspio cirrifera 4 Tharyx ? acutus 1Nephtys ciliata 1 Trochochaeta carica 1Ophelina cylindricaudatus 1 Genus "A" (Ampharetidae) 1Parheteromastus sp. A 7Pholoe minuta 37 UNIDENTIFIED POLYCHAETAPraxillella praetermissa 6Prionospio steenstrupi 2 Ampharetidae 1Proclea graffii 1 Maldanidae 1Schistomeringos caecus 2Scoloplos acutus 4Sternaspis fossor 27Terebellides stroemi 2Tharyx ? acutus 78Typosyllis cornuta 1Genus "A" (Ampharetidae) 18
UNIDENTIFIED POLYCHAETA
Ampharetidae 4Dorvilleidae 1Maldanidae 1
303

94.
SMG 967 Station WBS-30/CG-63 SMG 968 Station WBS-33/CG-7170°43.0'N 149°00.0'W 71°0 4.1'N 151°22.3'W23m 7 September 1971 20m 9 SeptemberR/V GLACIER WEBSEC-71 R/V GLACIER WEBSEC-71Sieve mesh aperture = 1.00mm Sieve mesh aperture = 1.00mm
POLYCHAETA POLYCHAETA
Allia suecica 3 Anaitides groenlandica 1Anaitides groenlandica 1 Antinoella badia 1Antinoella sarsi 1 Apistobranchus tullbergi 1Capitella capitata 5 Chaetozone setosa 1Chone murmanica 7 Chone murmanica 18Cossura longocirrata 7 Cistenides hyperborea 1Dexiospira spirillum 1 Clymenura polaris 1Eteone flava 1 Cossura longocirrata 13Heteromastus filiformis 10 Eteone longa 2Lumbrineris fragilis 4 Micronephthys minuta 12Lumbrineris impatiens 4 Minuspio cirrifera 3Minuspio cirrifera 4 Nephtys ciliata 1Ophelina cylindricaudatus 3 Ophelina cylindricaudatus 24Parheteromastus sp. A 1 Pholoe minuta 6Pholoe minuta 5 Prionospio steenstrupi 6Schistomeringos caecus 1 Scoloplos acutus 1Spirorbis granulatus 4 Sternaspis fossor 1Tharyx ? acutus 21 Terebellides stroemi 1
UNIDENTIFIED POLYCHAETA UNIDENTIFIED POLYCHAETA
Dorvilleidae 1 Maldanidae 1Spionidae 1 Sphaerodoridae 1
Spionidae 2
304

SMG 969 Station WBS-33/CG-71 SMG 971 Station WBS-33/CG-7171°04.1'N 151°22.2'W 71°04.1'N 151°21.6'W21m 9 September 1971 21m 9 September 1971R/V GLACIER WEBSEC-71 R/V GLACIER WEBSEC-71Sieve mesh aperture = 1.00mm Sieve mesh aperture = 1.00mm
POLYCHAETA POLYCHAETA
Allia sp. A 2 Allia suecica 1Anaitides groenlandica 1 Allia sp. A 2Barantolla americana 1 Apistobranchus tullbergi 2Capitella capitata 2 Capitella capitata 2Chone duneri 1 Chone murmanica 1Cossura longocirrata 2 Cistenides hyperborea 1Eteone flava 1 Cossura longocirrata 3Eteone longa 1 Micronephthys minuta 12Heteromastus filiformis 1 Minuspio cirrifera 2Micronephthys minuta 10 Nephtys ciliata 2Minuspio cirrifera 4 Ophelina cylindricaudatus 11Nephtys ciliata 1 Pholoe minuta 2Ophelina cylindricaudatus 8 Prionospio steenstrupi 2Ophelina acuminata 1 Scalibregma inflatum 1Paraonis sp. A 1 Scoloplos acutus 2Pholoe minuta 3 Sternaspis fossor 2Prionospio steenstrupi 2 Terebellides stroemi 2Scalibregma inflatum 3 Tharyx ? acutus 2Scoloplos acutus 1
SMG 970 Station WBS-33/CG-71 SMG 972 Station WBS-33/CG-7171°04.1'N 151°22.1'W 71°04.1'N 151°21.5'W21m 9 September 1971 21m 9 September 1971R/V GLACIER WEBSEC-71 R/V GLACIER WEBSEC-71Sieve mesh aperture = 1.00mm Sieve mesh aperture = 1.00mm
POLYCHAETA POLYCHAETA
Allia sp. A 1 Allia sp. A 1Ampharete vega 1 Apistobranchus fullbergi 1Chaetozone setosa 1 Capitella capitata 1Cistenides hyperborea 17 Chaetozone setosa 1Cossura longocirrata 7 Clymenura polaris 1Eteone longa 1 Cossura longocirrata 5Heteromastus filiformis 1 Heteromastus filiformis 1
Micronephthys minuta 21 Lysippe labiata 1Minuspio cirrifera 3 Micronephthys minuta 8Nephtys ciliata 1 Ophelina acuminata 1
Ophelina acuminata 1 Pholoe minuta 3Ophelina cylindricaudatus 12 Prionospio steenstrupi 1
Pholoe minuta 9 Scoloplos acutus 4Scalibregma inflatum 1 Sternaspis fossor 3Sternaspis fossor 1 Tauberia gracilis 4Tauberia gracilis 1 Terebellides stroemi 3
Terebellides stroemi 1 Tharyx ? acutus 3
UNIDENTIFIED POLYCHAETA
Maldanidae 4Spionidae 1
305

96.
SMG 973 Station WBS-34/CG-72 SMG 974 Station WBS-34/CG-7271°10.1'N 151°08.9'W 71°10.0'N 151°09.0'W45m 9 September 1971 45m 9 September 1971R/V GLACIER WEBSEC-71 R/V GLACIER WEBSEC-71Sieve mesh aperture = 1.00mm Sieve mesh aperture = 1.00mm
POLYCHAETA POLYCHAETA
Allia suecica 2 Allia suecica 1Autolytus fallax 1 Anaitides groenlandica 1Barantolla americana 2 Barantolla americana 5Chaetozone setosa 5 Chaetozone setosa 7Chone murmanica 9 Chone murmanica 11Clymenura polaris 2 Cistenides hyperborea 1Eteone longa 1 Cossura longocirrata 1Heteromastus filiformis 7 Heteromastus filiformis 5Lumbrineris impatiens 3 Laphania boecki 3Lumbrineris minuta 25 Lumbrineris impatiens 9Lysippe labiata 4 Lumbrineris minuta 25Maldane sarsi 10 Lysippe labiata 4Micronephthys minuta 18 Maldane sarsi 12Nephtys ciliata 1 Micronephthys minuta 12Ophelina cylindricaudatus 3 Minuspio cirrifera 1Onuphis quadricuspis 5 Ophelina cylindricaudatus 1Parheteromastus sp. A 1 Paraonis sp. A 1Pholoe minuta 1 Pholoe minuta 1Polydora caulleryi 4 Prionospio steenstrupi 7Praxillella praetermissa 1 Proclea graffii 2Prionospio steenstrupi 8 Schistomeringos caecus 1Proclea graffii 2 Scoloplos acutus 15Scalibregma inflatum 4 Sternaspis fossor 1Scoloplos acutus 7 Tauberia gracilis 6Sphaerodoridium claparedii 1 Terebellides stroemi 7Tauberia gracilis 10 Tharyx ? acutus 35Terebellides stroemi 5 Typosyllis cornuta 2Tharyx ? acutus 14 Genus "A" (Ampharetidae) 7Typosyllis fasciata 1Genus "A" (Ampharetidae) 5 UNIDENTIFIED POLYCHAETA
UNIDENTIFIED POLYCHAETA Maldanidae 2Spionidae 1
Maldanidae 1Polynoidae 1
306

97.
SMG 975 Station WBS-34/CG-72 SMG 976 Station WBS-34/CG-72
71°09.9'N 151°09.1'W 71°09.9'N 151°09.3'W
45m 9 September 1971 45m 9 September 1971
R/V GLACIER WEBSEC-71 R/V GLACIER WEBSEC-71Sieve mesh aperture = 1.00mm Sieve mesh aperture = 1.00mm
POLYCHAETA POLYCHAETA
Allia suecica 4 Allia sp. A 2Allia sp. A 1 Antinoella sarsi 1Anaitides groenlandica 1 Barantolla americana 7Antinoella sarsi 1 Chaetozone setosa 5Autolytus fallax 2 Chone muranica 5Barantolla americana 9 Clvmenura polaris 7
Capitella capitata 1 Cossura longocirrata 1
Chaetozone setosa 9 Diplocirrus longisetosus 2
Chone murmanica 3 Euchone papillosa 1
Cossura longocirrata 1 Exogone naidina 1
Eteone longa 1 Lumbrineris fragilis 1Exogone dispar 3 Lumbrineris impatiens 3Heteromastus filiformis 5 Lumbrineris minuta 16
Laphania boecki 1 Lysippe labiata 9
Lumbrineris fragilis 1 Maldane sarsi 8
Lumbrineris impatiens 5 Micronephthys minuta 7
Lumbrineris minuta 14 Onuphis quadricuspis 13
Lysippe labiata 2 Ophelina cylindricaudatus 1
Magelone lonqicornis 1 Pholoe minuta 1
Maldane sarsi 11 Polydora caulleryi 2
Micronephthys minuta 20 Prionospio steenstrupi 6
Minuspio cirrifera 1 Proclea graffii 4
Onuphis quadricuspis 8 Scalibreqma inflatum 1
Ophelina cylindricaudatus 4 Scoloplos acutus 9
Paraonis sp. A 1 Tauberia gracilis 11
Pholoe minuta 3 Terebellides stroemi 1
Prionospio steenstrupi 6 Tharvx ? acutus 30
Proclea graffii 1 Genus "A" (Ampharetidae) 9
Schistomeringos caecus 1Scoloplos acutus 7 UNIDENTIFIED POLYCHAETA
Spiochaetopterus typicus 2Sternaspis fossor 2 Maldanidae 2Tauberia gracilis 10Tharyx ? acutus 43Terebellides stroemi 4Genus "A" (Ampharetidae) 5
UNIDENTIFIED POLYCHAETA
Lumbrineridae 1Maldanidae 2
307

98.
SMG 977 Station WBS-34/CG-72 SMG 983 Station WBS-36/CG-7571°09.8'N 151°09.4'W 71°14.8'N 150°27.6'W45m 9 September 1971 132m 10 September 1971R/V GLACIER WEBSEC-71 R/V GLACIER WEBSEC-71Sieve mesh aperture = 1.00mm Sieve mesh aperture = 1.00mm
POLYCHAETA POLYCHAETA
Ampharete acutifrons 1 Allia sp. A 5Antinoella badia 1 Ampharete acutifrons 4Capitella capitata 1 Antinoella sarsi 1Chaetozone setosa 9 Autolytus alexandri 1Chone murmanica 3 Barantolla americana 4Cossura longocirrata 3 Chaetozone setosa 14Eteone flava 1 Chone murmanica 10Euchone papillosa 1 Clymenura polaris 1Lagisca extenuata 1 Cossura longocirrata 1Lumbrineris fragilis 1 Diplocirrus hirsutus 1Lumbrineris impatiens 5 Diplocirrus longisetosus 1Lumbrineris minuta 15 Eteone longa 4Lysippe labiata 4 Gattyana cirrosa 1Maldane sarsi 6 Heteromastus filiformis 3Micronephthys minuta 26 Laphania boecki 1Nephtys ciliata 1 Laonice cirrata 1Onuphis quadricuspis 4 Lumbrineris impatiens 1Ophelina cylindricaudatus 1 Lumbrineris minuta 32Pholoe minuta 1 Lysippe labiata 37Polydora caulleryi 1 Micronephthys minuta 49Prionospio steenstrupi 8 Myriochele heeri 14Scalibreqma inflatum 1 Paraonis sp. A 1Scoloplos acutus 21 Parheteromastus sp. A 1Spiochaetopterus typicus 1 Pholoe minuta 6Sternaspis fossor 1 Proclea graffii 1Tauberia gracilis 8 Scoloplos acutus 7Terebellides stroemi 12 Spiochaetopterus typidus 28Tharyx ? acutus 51 Sternaspis fossor 1Typosyllis cornuta 9 Terebellides stroemi 7Genus "A" (Ampharetidae) 4 Tharyx ? acutus 32
Trochochaeta carica 3UNIDENTIFIED POLYCHAETA Typosyllis cornuta 2
Maldanidae 1 UNIDENTIFIED POLYCHAETASphaerodoridae 1
Maldanidae 10Opheliidae (Travisia sp.) 1
308
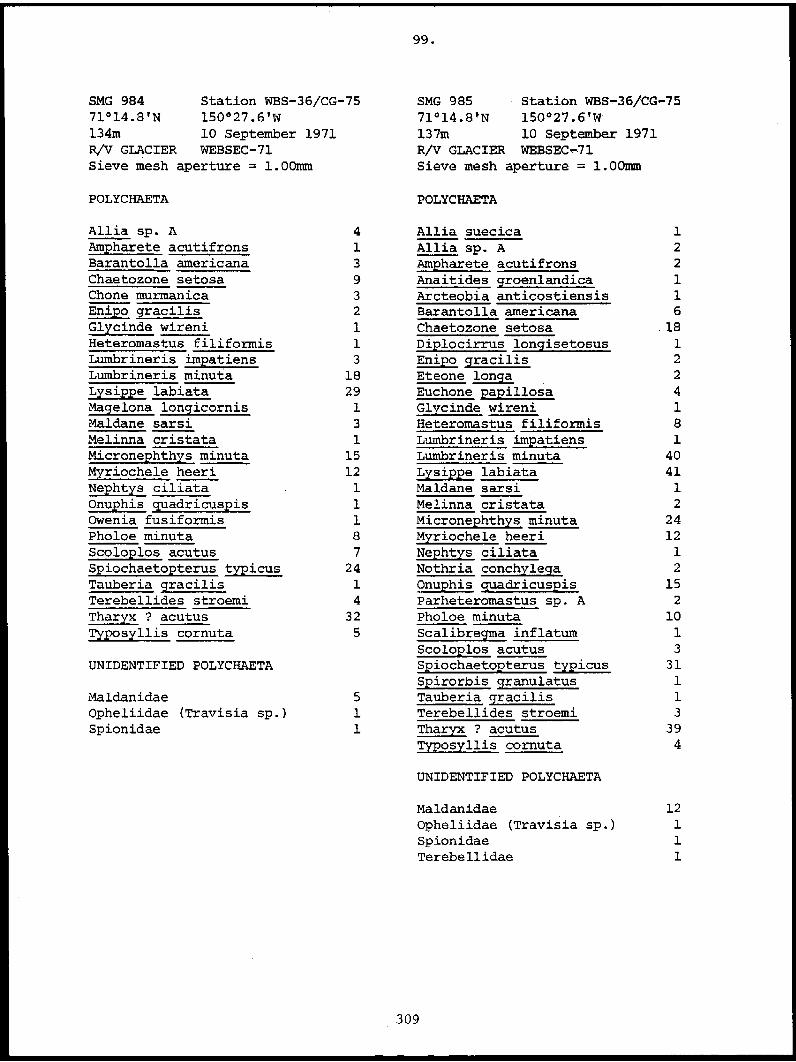
99.
SMG 984 Station WBS-36/CG-75 SMG 985 Station WBS-36/CG-7571°14.8'N 150°27.6'W 71°14.8'N 150°27.6'W134m 10 September 1971 137m 10 September 1971R/V GLACIER WEBSEC-71 R/V GLACIER WEBSEC-71Sieve mesh aperture = 1.00mm Sieve mesh aperture = 1.00mm
POLYCHAETA POLYCHAETA
Allia sp. A 4 Allia suecica 1Ampharete acutifrons 1 Allia sp. A 2Barantolla americana 3 Ampharete acutifrons 2Chaetozone setosa 9 Anaitides groenlandica 1Chone murmanica 3 Arcteobia anticostiensis 1Enipo gracilis 2 Barantolla americana 6Glycinde wireni 1 Chaetozone setosa 18Heteromastus filiformis 1 Diplocirrus longisetosus 1Lumbrineris impatiens 3 Enipo gracilis 2Lumbrineris minuta 18 Eteone longa 2Lysippe labiata 29 Euchone papillosa 4Magelona longicornis 1 Glycinde wireni 1Maldane sarsi 3 Heteromastus filiformis 8Melinna cristata 1 Lumbrineris impatiens 1Micronephthys minuta 15 Lumbrineris minuta 40Myriochele heeri 12 Lysippe labiata 41Nephtys ciliata 1 Maldane sarsi 1Onuphis quadricuspis 1 Melinna cristata 2Owenia fusiformis 1 Micronephthys minuta 24Pholoe minuta 8 Myriochele heeri 12Scoloplos acutus 7 Nephtys ciliata 1Spiochaetopterus typicus 24 Nothria conchylega 2Tauberia gracilis 1 Onuphis quadricuspis 15Terebellides stroemi 4 Parheteromastus sp. A 2Tharyx ? acutus 32 Pholoe minuta 10Typosyllis cornuta 5 Scalibregma inflatum 1
Scoloplos acutus 3UNIDENTIFIED POLYCHAETA Spiochaetopterus typicus 31
Spirorbis granulatus 1Maldanidae 5 Tauberia gracilis 1Opheliidae (Travisia sp.) 1 Terebellides stroemi 3Spionidae 1 Tharyx ? acutus 39
Typosyllis cornuta 4
UNIDENTIFIED POLYCHAETA
Maldanidae 12Opheliidae (Travisia sp.) 1Spionidae 1Terebellidae 1
309

100.
SMG 986 Station WBS-36/CG-75 SMG 987 Station WBS-36/CG-75
71°14.8'N 150°27.6'W 71°14.8'N 150°27.6'W
139m 10 September 1971 140m 10 September 1971
R/V GLACIER WEBSEC-71 R/V GLACIER WEBSEC-71
Sieve mesh aperture = 1.00mm Sieve mesh aperture = 1.00mm
POLYCHAETA POLYCHAETA
Allia sp. A 1 Ampharete acutifrons 1
Ampharete acutifrons 3 Barantolla americana 4
Ampharete arctica 1 Chaetozone setosa 9
Anaitides groenlandica 1 Cistenides hyperborea 2
Antinoella sarsi 1 Cossura longocirrata 1
Chaetozone setosa 21 Eteone longa 2
Cossura longocirrata 3 Euchone papillosa 8
Eteone longa 1 Glycinde wireni 1
Euchone papillosa 6 Heteromastus filiformis 1
Heteromastus filiformis 1 Laphania boecki 1
Lumbrineris impatiens 1 Lumbrineris impatiens 2
Lumbrineris minuta 36 Lumbrineris minuta 36
Lysippe labiata 23 Lysippe labiata 56
Maldane sarsi 2 Maldane sarsi 1
Melinna cristata 1 Melinna cristata 1
Micronephthys minuta 12 Micronephthys minuta 21
Minuspio cirrifera 1 Myriochele heeri 2
Myriochele heeri 13 Nephtys ciliata 1
Nephtys ciliata 2 Nothria conchylega 3
Nothria conchylega 1 Onuphis quadricuspis 3
Onuphis quadricuspis 7 Ophelina cylindricaudatus 1
Parheteromastus sp. A 1 Owenia fusiformis 4
Pholoe minuta 7 Paraonis sp. A 1
Proclea graffii 2 Petaloproctus tenuis 1
Scoloplos acutus 2 Pholoe minuta 6
Sphaerodorum gracilis 1 Polydora caulleryi 1
Spiochaetopterus typicus 21 Scalibregma inflatum 1
Tauberia gracilis 2 Scoloplos acutus 3
Terebellides stroemi 2 Sphaerodorum gracilis 1
Tharyx ? acutus 35 Spiochaetopterus typicus 19
Trichobranchus glacialis 1 Tauberia gracilis 1
Typosyllis cornuta 5 Terebellides stroemi 3
Tharyx ? acutus 34
UNIDENTIFIED POLYCHAETA Typosyllis cornuta 1
Maldanidae 5 UNIDENTIFIED POLYCHAETA
Opheliidae 2Maldanidae 9Opheliidae (Travisia sp.) 2
310

101.
SMG 994 Station WBS-38/CG-78 SMG 993 Station WBS-38/CG-7870°58.1'N 149°59.1'W 70°58.1'N 149°59.1'W28m 11 September 1971 28m 11 September 1971R/V GLACIER WEBSEC-71 R/V GLACIER WEBSEC-71Sieve mesh aperture = 1.00mm Sieve mesh aperture = 1.00mm
POLYCHAETA POLYCHAETA
Ampharete acutifrons 1 Anaitides groenlandica 2Antinoella sarsi 3 Antinoella sarsi 3Brada villosa 1 Brada villosa 1Capitella capitata 19 Capitella capitata 2Chone murmanica 14 Chone murmanica 3Eteone longa 2 Micronephthys minuta 1Exogone naidina 1 Minuspio cirrifera 24Micronephthys minuta 7 Nereimyra aphroditoides 3
Minuspio cirrifera 40 Ophelina cylindricaudatus 1Nereimyra aphroditoides 3 Pholoe minuta 5
Ophelina cylindricaudatus 4 Scalibregma inflatum 1Pholoe minuta 1 Tharyx ? acutus 2Scalibregma inflatum 1Tharyx ? acutus 9 UNIDENTIFIED POLYCHAETATrochochaeta carica 1
Terebellidae 1UNIDENTIFIED POLYCHAETA
Dorvilleidae 1
311

102.
SMG 995 Station WBS-38/CG-78 SMG 996 Station WBS-38/CG-7870°58.1'N 149°59.1'W 71°58.0'N 149°59.1'W28m 11 September 1971 27m 11 September 1971R/V GLACIER WEBSEC-71 R/V GLACIER WEBSEC-71Sieve mesh aperture = 1.0mm Sieve mesh aperture = 1.00mm
POLYCHAETA POLYCHAETA
Aglaophamus malmgreni 1 Anaitides groenlandica 1Allia sp. A 10 Antinoella sarsi 1Anaitides groenlandica 3 Capitella capitata 8Antinoella sarsi 2 Chaetozone setosa 2Barantolla americana 5 Chone murmanica 5Capitella capitata 16 Nereimyra aphroditoides 1Chaetozone setosa 2 Scalibregma inflatum 1Chone murmanica 24 Tharyx ? acutus 2Cossura longocirrata 51Eteone longa 2Heteromastus filiformis 2Lumbrineris minuta 1Minuspio cirrifera 63 SMG 997 Station WBS-38/CG-78Nereimyra aphroditoides 3 70°50.8'N 149°59.1'WOphelina acuminata 1 27m 11 September 1971Pholoe minuta 3 R/V GLACIER WEBSEC-71Scalibregma inflatum 1 Sieve mesh aperture = 1.00mmScoloplos acutus 1Sternaspis fossor 1 POLYCHAETATauberia gracilis 8
Tharyx ? acutus 25 Capitella capitata 4Genus "A" (Ampharetidae) 1 Chaetozone setosa 2
Chone murmanica 8UNIDENTIFIED POLYCHAETA Tharyx ? acutus 1
Dorvilleidae 1
312

103.
SMG 1003 Station WBS-40/CG-8271°08.3'N 149°47.7'W45m 11 September 1971R/V GLACIER WEBSEC-71Sieve mesh aperture = 1.00mm
POLYCHAETA Unidentified Polychaeta
Allia suecica 7 Maldanidae 2Ampharete acutifrons 4 Terebellidae 1Autolytus fallax 2Barantolla americana 11Capitella capitata 9Chaetozone setosa 12Chone murmanica 5Cistenides hyperborea 1Clymenura polaris 5Cossura longocirrata 1Diplocirrus hirsutus 1Diplocirrus longisetosus 1Eteone longa 1Exogone naidina 8Glycinde wireni 1Laonice cirrata 1Heteromastus filiformis 6Lumbrineris fragilis 1Lumbrineris impatiens 2Lumbrineris minuta 17Lysippe labiata 3Magelona longicornis 1Maldane sarsi 18Micronephthys minuta 38Myriochele heeri 1Mysta barbata 1Nephtys ciliata 1Nereimyra aphroditoides 1Nicolea zostericola 1Onuphis quadricuspis 3Paraonis sp. A 3Pholoe minuta 5Polydora caulleryi 2Prionospio steenstrupi 11Proclea graffii 3Scalibregma inflatum 1Scoloplos acutus 14Spiochaetopterus typicus 1Tauberia gracilis 12Terebellides stroemi 5Tharyx ? acutus 31Genus "A" (Ampharetidae) 1
313
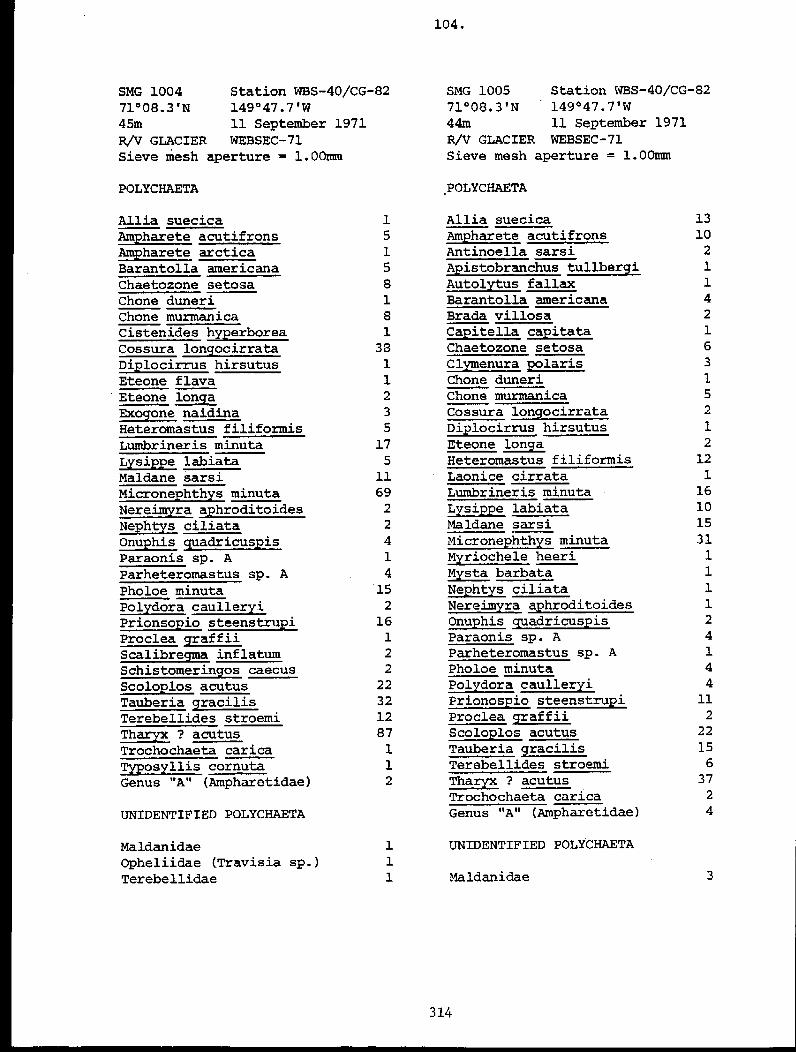
104.
SMG 1004 Station WBS-40/CG-82 SMG 1005 Station WBS-40/CG-82
71°08.3'N 149°47.7'W 71°08.3'N 149°47.7'W45m 11 September 1971 44m 11 September 1971
R/V GLACIER WEBSEC-71 R/V GLACIER WEBSEC-71Sieve mesh aperture = 1.00m Sieve mesh aperture = 1.00mm
POLYCHAETA POLYCHAETA
Allia suecica 1 Allia suecica 13Ampharete acutifrons 5 Ampharete acutifrons 10
Ampharete arctica 1 Antinoella sarsi 2
Barantolla americana 5 Apistobranchus tullbergi 1
Chaetozone setosa 8 Autolytus fallax 1
Chone duneri 1 Barantolla americana 4Chone murmanica 8 Brada villosa 2Cistenides hyperborea 1 Capitella capitata 1Cossura longocirrata 38 Chaetozone setosa 6Diplocirrus hirsutus 1 Clymenura polaris 3Eteone flava 1 Chone duneri 1Eteone longa 2 Chone murmanica 5Exogone naidina 3 Cossura longocirrata 2Heteromastus filiformis 5 Diplocirrus hirsutus 1
Lumbrineris minuta 17 Eteone longa 2
Lysippe labiata 5 Heteromastus filiformis 12
Maldane sarsi 11 Laonice cirrata 1
Micronephthys minuta 69 Lumbrineris minuta 16
Nereimyra aphroditoides 2 Lysippe labiata 10
Nephtys ciliata 2 Maldane sarsi 15
Onuphis quadricuspis 4 Micronephthys minuta 31
Paraonis sp. A 1 Myriochele heeri 1
Parheteromastus sp. A 4 Mysta barbata 1
Pholoe minuta 15 Nephtys ciliata 1
Polydora caulleryi 2 Nereimyra aphroditoides 1
Prionsopio steenstrupi 16 Onuphis quadricuspis 2
Proclea graffii 1 Paraonis sp. A 4Scalibregma inflatum 2 Parheteromastus sp. A 1
Schistomeringos caecus 2 Pholoe minuta 4Scoloplos acutus 22 Polydora caulleryi 4Tauberia gracilis 32 Prionospio steenstrupi 11
Terebellides stroemi 12 Proclea graffii 2
Thary ? acutus 87 Scoloplos acutus 22
Trochochaeta carica 1 Tauberia gracilis 15
Typosyllis cornuta 1 Terebellides stroemi 6
Genus "A" (Ampharetidae) 2 Tharyx ? acutus 37Trochochaeta carica 2
UNIDENTIFIED POLYCHAETA Genus "A" (Ampharetidae) 4
Maldanidae 1 UNIDENTIFIED POLYCHAETAOpheliidae (Travisia sp.) 1Terebellidae 1 Maldanidae 3
314

105.
SMG 1006 Station WBS-40/CG-82 SMG 1007 Station WBS-40/CG-8271°08.3'N 149°47.7'W 71°08.3'N 149°47.7'W44m 11 September 1971 44m 11 September 1971R/V GLACIER WEBSEC-71 R/V GLACIER WEBSEC-71Sieve mesh aperture = 1.00mm Sieve mesh aperture = 1.00mm
POLYCHAETA POLYCHAETA
Allia suecica 9 Allia suecica 1Ampharete acutifrons 10 Ampharete acutifrons 1Anaitides groenlandica 3 Barantolla americana 7Barantolla americana 9 Capitalla capitata 2Chaetozone setosa 7 Chaetozone setosa 7Chone duneri 3 Chone murmanica 5Chone murmanica 3 Euchone papillosa 1Clymenura polaris 2 Glycinde wireni 1Eteone longa 4 Heteromastus filiformis 4Exogone naidina 1 Laphania boecki 1Heteromastus filiformis 6 Lumbrineris minuta 9Lumbrineris minuta 20 Lysippe labiata 4Lysippe labiata 2 Maldane sarsi 17Maldane sarsi 12 Micronephthys minuta 23Micronephthys minuta 24 Mysta barbata 1Mysta barbata 1 Nereimyra aphroditoides 4Nephtys ciliata 1 Nephtys ciliata 2
Onuphis quadricuspis 6 Nephtys paradoxa 1Paraonis sp. A 3 Onuphis quadricuspis 2Parheteromastus sp. A 5 Paraonis sp. A 3Pholoe minuta 5 Parheteromastus sp. A 3Polydora caulleryi 1 Pholoe minuta 3Prionospio steenstrupi 8 Polydora caulleryi 6
Proclea graffii 1 Prionospio steenstrupi 10
Scalibreqma inflatum 2 Proclea raffii 2
Scoloplos acutus 12 Sabellides borealis 2Spiochaetopterus typicus 1 Scalibregma inflatum 1Tauberia gracilis 12 Scoloplos acutus 19Terebellides stroemi 8 Sphaerodorum gracilis 1Tharyx ? acutus 33 Tauberia gracilis 5Trochochaeta carica 3 Terebellides stroemi 6
Typosyllis cornuta 1 Tharyx ? acutus 24Genus "A" (Ampharetidae) 1 Trochochaeta carica 2
Genus "A" (Ampharetidae) 1UNIDENTIFIED POLYCHAETA
UNIDENTIFIED POLYCHAETAMaldanidae 3Spionidae 1 Maldanidae 2Terebellidae 1 Spionidae 1
315

106.
SMG 1008 Station WBS-41/CG-83 SMG 1009 Station WBS-41/CG-8371°12.2'N 149°44.8'W 71°12.2'N 149°44.8'W169m 11 September 1971 189m 11 September 1971R/V GLACIER WEBSEC-71 R/V GLACIER WEBSEC-71Sieve mesh aperture = 1.00mm Sieve mesh aperture = 1.00mm
POLYCHAETA POLYCHAETA
Allia sp. A 7 Allia sp. A 19Ampharete arctica 1 Antinoella sarsi 1Anaitides groenlandica 1 Apistobranchus tullbergi 1Antinoella badia 1 Artacama proboscidea 1Antinoella sarsi 1 Barantolla americana 3Artacama proboscidea 1 Chaetozone setosa 11Barantolla americana 3 Cossura longocirrata 4Chaetozone setosa 5 Eteone longa 3Heteromastus filiformis 1 Laphania boecki 1Laphania boecki 1 Lumbrineris minuta 13Lumbrineris minuta 22 Lysippe labiata 5Lysippe labiata 4 Maldane sarsi 1Micronephthys minuta 29 Micronephthys minuta 44Nereimyra aphroditoides 1 Nephtys ciliata 1Onuphis quadricuspis 1 Nereimyra aphroditoides 1Owenia fusiformis 2 Prionospio steenstrupi 8Prionospio steenstrupi 5 Procela graffii 2Scoloplos acutus 20 Scoloplos acutus 27Sphaerodoridium sp. A 1 Spiochaetopterus typicus 1Spiochaetopterus typicus 5 Tauberia gracilis 12Tauberia gracilis 6 Terebellides stroemi 2Terebellides stroemi 5 Tharyx ? acutus 47Tharyx ? acutus 77
UNIDENTIFIED POLYCHAETAUNIDENTIFIED POLYCHAETA
Maldanidae 2Chaetopteridae 1
316

107.
SMG 1010 Station WBS-41/CG-83 SMG 1011 Station WBS-41/CG-8371°12.2'N 149°44.8'W 71°12.2'N 149°44.8'W204m 11 September 1971 216m 11 September 1971R/V GLACIER WEBSEC-71 R/V GLACIER WEBSEC-71Seive mesh aperture = 1.00mm Sieve mesh aperture = 1.00mm
POLYCHAETA POLYCHAETA
Allia sp. A 54 Allia sp. A 56Barantolla americana 1 Anaitides groenlandica 1Chaetozone setosa 18 Artacama proboscidea 2Cossura longocirrata 72 Barantolla americana 1Eteone longa 3 Chaetozone setosa 21Heteromastus filiformis 1 Cossura longocirrata 4Laphania boecki 2 Eteone longa 4Lumbrineris minuta 13 Heteromastus filiformis 1Lysippe labiata 3 Lumbrineris minuta 21Micronephthys minuta 125 Lysippe labiata 7Myriochele heeri 1 Micronephthys minuta 63Nephtys ciliata 5 Nephtys ciliata 7Onuphis quadricuspis 1 Onuphis quadricuspis 2Praxillella praetermissa 1 Prionospio steenstrupi 18Prionospio steenstrupi 17 Proclea graffii 8Scoloplos acutus 46 Scoloplos acutus 41Sternaspis fossor 2 Sphaerodoridium sp. A 1Tauberia gracilis 42 Spiochaetopterus typicus 5Terebellides stroemi 3 Tauberia gracilis 27Tharyx ? acutus 94 Terebellides stroemi 8
Tharyx ? acutus 86UNIDENTIFIED POLYCHAETA
UNIDENTIFIED POLYCHAETAMaldanidae 1Spionidae 1 Maldanidae 3
317

108.
SMG 1012 Station WBS-41/CG-83 SMG 1013 Station WBS-42/CG-8471°12.2'N 149°44.8'W 71°18.3'N 150°21.6'W232m 11 September 1971 540m 12 September 1971R/V GLACIER WEBSEC-71 R/V GLACIER WEBSEC-71Sieve mesh aperture = 1.00mm Sieve mesh aperture = 1.00mm
POLYCHAETA POLYCHAETA
Allia sp. A 32 Allia sp. A 1Antinoella sarsi 2 Anaitides groenlandica 1Artacama proboscidea 1 Barantolla americana 8Barantolla americana 3 Capitella capitata 1Chaetozone setosa 31 Chaetozone setosa 2Cistenides hyperborea 1 Chone murmanica 1Cossura longocirrata 20 Cossura longocirrata 8Eteone longa 8 Eteone longa 1Heteromastus filiformis 1 Laonice cirrata 7Lumbrineris minuta 29 Lumbrineris minuta 14Lysippe labiata 6 Maldane sarsi 47Maldane sarsi 2 Micronephthys minuta 1Micronephthys minuta 41 Munispio cirrifera 221Minuspio cirrifera 1 Ophelina cylindricaudatus 4Myriochele heeri 3 Owenia fusiformis 16Nephtys ciliata 2 Scoloplos acutus 10Prionospio steenstrupi 8 Sphaerodoridium sp. A 4Proclea graffii 5 Sphaerodoropsis sp. B 4Scoloplos acutus 46 Spiochaetopterus typicus 3Tauberia gracilis 36 Tauberia gracilis 7Terebellides stroemi 4Tharyx ? acutus 103 UNIDENTIFIED POLYCHAETA
UNIDENTIFIED POLYCHAETA Maldanidae 4
Chaetopteridae 1Dorvilleidae 1Terebellidae 1
318

109.
SMG 1014 Station WBS-42/CG-84 SMG 1015 Station WBS-42/CG-8471°17.9'N 150°20.9'W 71°17.5'N 150°20.0'W678m 12 September 1971 676m 12 September 1971R/V GLACIER WEBSEC-71 R/V GLACIER WEBSEC-71Sieve mesh aperture = 1.00mm Sieve mesh aperture = 1.00mm
POLYCHAETA POLYCHAETA
Allia sp. A 2 Allia sp. A 2Barantolla americana 4 Barantolla americana 9Chaetozone setosa 3 Capitella capitata 1Eteone longa 1 Chaetozone setosa 4Laonice cirrata 6 Chone murmanica 5Lumbrineris minuta 11 Cossura longocirrata 9Maldane sarsi 50 Eteone longa 3Minuspio cirrifera 139 Laonice cirrata 13Ophelina cylindricaudatus 1 Lumbrineris minuta 19Scoloplos acutus 6 Maldane sarsi 231Sphaerodoridium sp. A 1 Micronephthys minuta 1Sphaerodoropsis sp. B 1 Minuspio cirrifera 116Spiochaetopterus typicus 2 Onuphis quadricuspis 3Tauberia gracilis 10 Owenia fusiformis 433
Petaloproctus tenuis 2UNIDENTIFIED POLYCHAETA Pholoe minuta 2
Prionospio steenstrupi 1Maldanidae 4 Scoloplos acutus 6
Sphaerodoridium sp. A 4Sphaerodoropsis sp. B 3Spiochaetopterus typicus 2Tauberia gracilis 10Trochochaeta carica 1
UNIDENTIFIED POLYCHAETA
Ampharetidae 1Maldanidae 10
319

110.
SMG 1016 Station WBS-42/CG-84 SMG 1017 Station WBS-42/CG-8471°17.3'N 150°19.5'W 71°16.8'N 150°18.5'W759m 12 September 1971 831m 12 September 1971R/V GLACIER WEBSEC-71 R/V GLACIER WEBSEC-71Sieve mesh aperture = 1.00mm Sieve mesh aperture - 1.00mm
POLYCHAETA POLYCHAETA
Allia sp. A 3 Allia sp. A 6Barantolla americana 2 Antinoella sarsi 1Capitella capitata 2 Barantolla americana 1Chaetozone setosa 1 Capitella capitata 17Chone murmanica 3 Chaetozone setosa 1Clymenura polaris 1 Chone murmanica 9Eteone longa 1 Cossura longocirrata 12Heteromastus filiformis 1 Eteone longa 3Laonice cirrata 2 Laonice cirrata 4Lumbrineris minuta 21 Lumbrineris minuta 10Maldane sarsi 40 Maldane sarsi 22Minuspio cirrifera 245 Micronephthys minuta 1Ophelina cylindricaudatus 1 Minuspio cirrifera 131Owenia fusiformis 50 Nephtys ciliata 1Scoloplos acutus 8 Ophelina cylindricaudatus 2Sphaerodoridium sp. A 2 Owenia fusiformis 51Sphaerodoropsis sp. B 4 Scoloplos acutus 7Tauberia gracilis 3 Sphaerodoridium sp. A 4
Sphaerodoropsis sp. B 1UNIDENTIFIED POLYCHAETA Tauberia gracilis 5
Maldanidae 1 UNIDENTIFIED POLYCHAETAOpheliidae (Travisia sp.) 1
Maldanidae 14Opheliidae (Travisia sp.)
320

111.
SMG 1018 Station WBS-43/CG-85 SMG 1020 Station WBS-43/CG-85
71°22.0'N 150°38.0'W 71°22.0'N 150°38.0'W821m 12 September 1971 887m 12 September 1971
R/V GLACIER WEBSEC-71 R/V GLACIER WEBSEC-71Sieve mesh aperture = 1.00mm Sieve mesh aperture = 1.00mm
POLYCHAETA POLYCHAETA
Allia suecica 1 Aglaophamus malmgreni 1Capitella capitata 3 Allia suecica 7Chaetozone setosa 1 Antinoella sarsi 2
Chone murmanica 1 Barantolla americana 2
Cossura longocirrata 1 Chaetozone setosa 1
Eteone longa 1 Heteromastus filiformis 1
Laonice cirrata 4 Laonice cirrata 5Minuspio cirrifera 124 Lumbrineris minuta 7Owenia fusiformis 26 Maldane sarsi 6
Scoloplos acutus 2 Minuspio cirrifera 85
Sigambra tentaculata 1 Ophelina cylindricaudatus 1
Tauberia gracilis 24 Owenia fusiformis 10
Terebellides stroemi 1 Scoloplos acutus 6Sphaerodoropsis sp. A 1
UNIDENTIFIED POLYCHAETA Tauberia gracilis 1
Maldanidae 4 UNIDENTIFIED POLYCHAETA
Maldanidae 1
SMG 1019 Station WBS-43/CG-85 SMG 1021 Station WBS-43/CG-85
71°.22.0'N 150°38.0'W 71°22.0'N 150°38.0'W
795m 12 September 1971 923m 12 September 1971
R/V GLACIER WEBSEC-71 R/V GLACIER WEBSEC-71
Sieve mesh aperture = 1.00mm Sieve mesh aperture = 1.00mm
POLYCHAETA POLYCHAETA
Allia suecica 3 Allia suecica 3
Barantolla americana 1 Capitella capitata 6
Laonice cirrata 6 Laonice cirrata 6
Lumbrineris minuta 3 Lumbrineris minuta 6
Maldane sarsi 21 Maldane sarsi 6
Minuspio cirrifera 72 Minuspio cirrifera 109
Ophelina cylindricaudatus 1 Ophelina cylindricaudatus 1
Sigambra tentaculata 5 Owenia fusiformis 16
Scoloplos acutus 5
UNIDENTIFIED POLYCHAETA Sigambra tentaculata 1
Sphaerodoropsis sp.B 1
Maldanidae 6UNIDENTIFIED POLYCHAETA
Maldanidae 5
321

112.
SMG 1022 Station WBS-43/CG-85 SMG 1024 Station WBS-44/CG-8671°22.0'N 150°38.0'W 71°46.0'N 150°35.0'W997m 12 September 1971 2204m 14 September 1971R/V GLACIER WEBSEC-71 R/V GLACIER WEBSEC-71Sieve mesh aperture - 1.00mm Sieve mesh aperture = 1.00mm
POLYCHAETA POLYCHAETA
Allia suecica 3 Antinoella badia 1Capitella capitata 3 Cossura sp. A 2Cossura longocirrata 1 Lumbrineris minuta 4Laonice cirrata 7 Ophelina sp. A 1Lumbrineris minuta 3 Owenia fusiformis 1Maldane sarsi 11 Sigambra tentaculata 2Micronephthys minuta 1 Tharyx ? acutus 20Minuspio cirrifera 311Ophelina cylindricaudatus 3 UNIDENTIFIED POLYCHAETAOwenia fusiformis 4Scoloplos acutus 2 Terebellidae 1Tauberia gracilis 11
UNIDENTIFIED POLYCHAETA
Maldanidae 4
SMG 1023 Station WBS-44/CG-86 SMG 1025 Station WBS-44/CG-8671°45.1'N 150°35.0'W 71°46.8'N 150°35.0'W2139m 14 September 1971 2461m 14 September 1971R/V GLACIER WEBSEC-71 R/V GLACIER WEBSEC-71Sieve mesh aperture = 1.00mm Sieve mesh aperture = 1.00mm
POLYCHAETA POLYCHAETA
Lumbrineris minuta 7 Lumbrineris minuta 7Minuspio cirrifera 1 Minuspio cirrifera 1Ophelina abranchiata 1 Ophelina abranchiata 1Owenia fusiformis 1 Ophelina sp. A 1Sigambra tentaculata 3 Sigambra tentaculata 11Tharyx ? acutus 7 Tharyx ? acutus 11
322
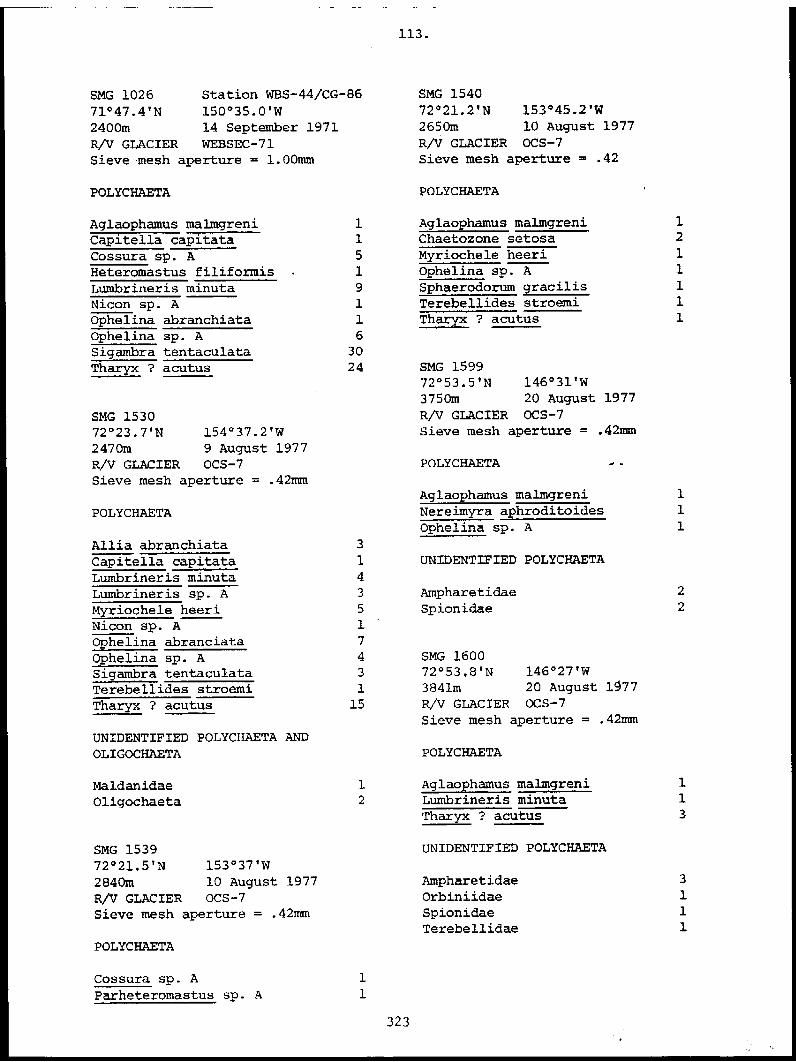
113.
SMG 1026 Station WBS-44/CG-86 SMG 1540
71°47.4'N 150°35.0'W 72°21.2'N 153°45.2'W
2400m 14 September 1971 2650m 10 August 1977
R/V GLACIER WEBSEC-71 R/V GLACIER OCS-7
Sieve mesh aperture = 1.00mm Sieve mesh aperture = .42
POLYCHAETA POLYCHAETA
Aglaophamus malmgreni 1 Aglaophamus malmgreni 1
Capitella capitata 1 Chaetozone setosa 2
Cossura sp. A 5 Myriochele heeri 1
Heteromastus filiformis 1 Ophelina sp. A 1
Lumbrineris minuta 9 Sphaerodorum gracilis 1
Nicon sp. A 1 Terebellides stroemi 1
Ophelina abranchiata 1 Tharyx ? acutus 1
Ophelina sp. A 6Sigambra tentaculata 30Tharyx ? acutus 24 SMG 1599
72053.5'N 146 031'W3750m 20 August 1977
SMG 1530 R/V GLACIER OCS-7
72023.7'N 154 037.2'W Sieve mesh aperture = .42mm
2470m 9 August 1977R/V GLACIER OCS-7 POLYCHAETA
Sieve mesh aperture = .42mmAglaophamus malmgreni 1
POLYCHAETA Nereimyra aphroditoides 1
Ophelina sp. A 1
Allia abranchiata 3
Capitella capitata 1 UNIDENTIFIED POLYCHAETA
Lumbrineris minuta 4Lumbrineris sp. A 3 Ampharetidae 2
Myriochele heeri 5 Spionidae 2Nicon sp. A 1Ophelina abranciata 7Ophelina sp. A 4 SMG 1600Sigambra tentaculata 3 72053.8'N 146 027'W
Terebellides stroemi 1 3841m 20 August 1977
Tharyx ? acutus 15 R/V GLACIER OCS-7Sieve mesh aperture = .42mm
UNIDENTIFIED POLYCHAETA ANDOLIGOCHAETA POLYCHAETA
Maldanidae 1 Aglaophamus malmgreni 1
Oligochaeta 2 Lumbrineris minuta 1Tharyx ? acutus 3
SMG 1539 UNIDENTIFIED POLYCHAETA72°21.5'N 153°37'W2840m 10 August 1977 Ampharetidae 3
R/V GLACIER OCS-7 Orbiniidae 1Sieve mesh aperture = .42mm Spionidae 1
Terebellidae 1
POLYCHAETA
Cossura sp. A 1
Parheteromastus sp. A 1
323

114.
SMG 1601 SMG 160472°56'N 146°34'W 72°56.5'N 146°30'W3511m 20 August 1977 4200m 21 August 1977R/V GLACIER OCS-7 R/V GLACIER OCS-7Sieve mesh aperture = .42mn Sieve mesh aperture = .42mm
POLYCHAETA POLYCHAETA
Allia suecica 1 Aglaophamus malmgreni 1Lumbrineris minuta 1
UNIDENTIFIED POLYCHAETA Tharyx ? acutus 2
Spionidae 1 UNIDENTIFIED POLYCHAETATerebellidae 1
Ampharetidae 2Spionidae 2
SMG 160272°58'N 146°29'W3576m 20 August 1977 SMG 1605R/V GLACIER OCS-7 72°49'N 146°25'WSieve mesh aperture = .42mm 3566m 21 August 1977
R/V GLACIER OCS-7Sieve mesh aperture = .42mm
POLYCHAETAPOLYCHAETA
Aglaophamus malmgreni 1Allia abranchiata 2 Ophelina sp. A 1Tharyx ? acutus 2 Tharyx ? acutus 2
UNIDENTIFIED POLYCHAETA UNIDENTIFIED POLYCHAETA
Ampharetidae 2 Ampharetidae 1Spionidae 1Terebellidae 1
SMG 160672048'N 146 024'W
SMG 1603 3569m 22 August 197772055.8'N 146 036'W R/V GLACIER OCS-73843m 21 August 1977 Sieve mesh aperture = .42mmR/V GLACIER OCS-7Sieve mesh aperture = .42mm POLYCHAETA
POLYCHAETA Tharyx ? acutus 1
Aglaophamus malmgreni 1 UNIDENTIFIED POLYCHAETAAllia abranchiata 1Tharyx ? acutus 1 Spionidae 1
UNIDENTIFIED POLYCHAETA
Ampharetidae 1Spionidae 1
324

115.
SMG 1607 SMG 161072°46.5'N 146°23'W 70°51'N 141°36.8'W3570m 22 August 1977 1958m 24 August 1977R/V GLACIER OCS-7 R/V GLACIER OCS-7Sieve mesh aperture = .42mm Sieve mesh aperture = .42mm
POLYCHAETA POLYCHAETA
Aglaophamus malmgreni 1 Aglaophamus malmgreni 1Allia abranchiata 1 Allia abranchiata 6Ophelina sp. A 1 Aricidea tetrabranchia 5Tharyx ? acutus .2 Chaetozone setosa 26
Ophelina sp. A 1UNIDENTIFIED POLYCHAETA Tachytrypane sp. A 2
Genus "B" (Capitellidae) 3Ampharetidae 1Spionidae 2 UNIDENTIFIED POLYCHAETA AND OLIGOCHAETA
Spionidae 2SMG 1608 Family unknown 172°42'N 143°40'W Oligochaeta 33336m 22 August 1977R/V GLACIER OCS-7Sieve mesh aperture = .42mm SMG 1611
70°51'N 141°41'WPOLYCHAETA 1976m 24 August 1977
R/V GLACIER OCS-7Allia abranchiata 1 Sieve mesh aperture = .42mmLumbrineris minuta 2Ophelina sp. A 1 POLYCHAETATerebellides stroemi 1
Aricidea tetrabranchia 4UNIDENTIFIED POLYCHAETA Chaetozone setosa 1
Ophelina sp. A 1Ampharetidae 3Orbiniidae 1 UNIDENTIFIED POLYCHAETE
Family unknown 5SMG 160972°55'N 142°05'W3475m 23 August 1977R/V GLACIER OCS-7Sieve mesh aperture = .42mm
POLYCHAETA
Allia abranchiata 1Aricidea tetrabranchia 3
UNIDENTIFIED POLYCHAETA
Ampharetidae 1
325
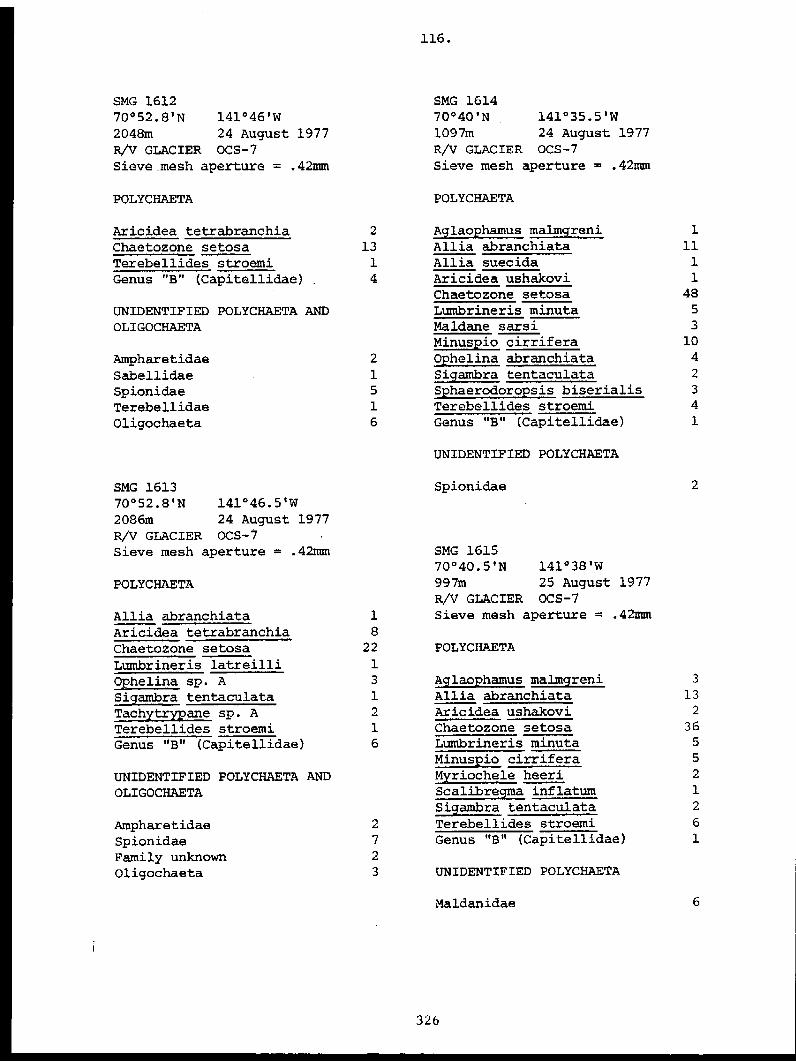
116.
SMG 1612 SMG 161470°52.8'N 141°46'W 70°40'N 141°35.5'W2048m 24 August 1977 1097m 24 August 1977R/V GLACIER OCS-7 R/V GLACIER OCS-7Sieve.mesh aperture = .42mm Sieve mesh aperture = .42mm
POLYCHAETA POLYCHAETA
Aricidea tetrabranchia 2 Aglaophamus malmgreni 1Chaetozone setosa 13 Allia abranchiata 11Terebellides stroemi 1 Allia suecida 1Genus "B" (Capitellidae) 4 Aricidea ushakovi 1
Chaetozone setosa 48
UNIDENTIFIED POLYCHAETA AND Lumbrineris minuta 5
OLIGOCHAETA Maldane sarsi 3Minuspio cirrifera 10
Ampharetidae 2 Ophelina abranchiata 4Sabellidae 1 Sigambra tentaculata 2Spionidae 5 Sphaerodoropsis biserialis 3Terebellidae 1 Terebellides stroemi 4Oligochaeta 6 Genus "B" (Capitellidae) 1
UNIDENTIFIED POLYCHAETA
SMG 1613 Spionidae 270052.8'N 141°46.5'W2086m 24 August 1977R/V GLACIER OCS-7Sieve mesh aperture = .42mm SMG 1615
70040.5'N 141 038'W
POLYCHAETA 997m 25 August 1977R/V GLACIER OCS-7
Allia abranchiata 1 Sieve mesh aperture = .42mm
Aricidea tetrabranchia 8Chaetozone setosa 22 POLYCHAETA
Lumbrineris latreilli 1Ophelina sp. A 3 Aglaophamus malmgreni 3
Sigambra tentaculata 1 Allia abranchiata 13
Tachytrypane sp. A 2 Aricidea ushakovi 2
Terebellides stroemi 1 Chaetozone setosa 36
Genus "B" (Capitellidae) 6 Lumbrineris minuta 5Minuspio cirrifera 5
UNIDENTIFIED POLYCHAETA AND Myriochele heeri 2
OLIGOCHAETA Scalibregma inflatum 1Sigambra tentaculata 2
Ampharetidae 2 Terebellides stroemi 6
Spionidae 7 Genus "B" (Capitellidae) 1Family unknown 2Oligochaeta 3 UNIDENTIFIED POLYCHAETA
Maldanidae 6
326

117.
SMG 1616 SMG 161770°40.6'N 141°41.1'W 70°42'N 141°41.1'W686m 25 August 1977 640m 25 August 1977R/V GLACIER OCS-7 R/V GLACIER OCS-7Sieve mesh aperture = .42mm Sieve mesh aperture = .42mm
POLYCHAETA POLYCHAETA
Aglaophamus malmgreni 1 Aglaophamus malmgreni 2Allia abranchiata 12 Allia abranchiata 7Amage auricula 1 Allia suecica 3Aricidea ushakovi 1. Amage auricula 2Chaetozone setosa 11 Ampharete acutifrons 1Eclysippe sp. A 32 Aricidea ushakovi 2Lumbrineris latreilli 2 Chaetozone setosa 2Lumbrineris minuta 1 Eclysippe sp. A 15Maldane sarsi 9 Eteone flava 2Minuspio cirrifera 14 Heteromastus filiformis 1Myriochele heeri 20 Laonice cirrata 1Nereimyra aphroditoides 3 Lumbrineris impatiens 1Notoproctus oculatus Maldane sarsi 14
var. arctica 4 Melinna cristata 1Schistomeringos sp. A 2 Minuspio cirrifera 15Sigambra tentaculata 1 Myriochele heeri 2Sphaerodoropsis biserialis 2 Nereimyra aphroditoides 2Terebellides stroemi 3 Ophelina sp. A 1Genus "B" (Capitellidae) 3 Scalibregma inflatum 1
Schistomeringos sp. A 4UNIDENTIFIED POLYCHAETA Sigambra tentaculata 4
Sphaerodoropsis biserialis 2Ampharetidae 1 Terebellides stroemi 1Terebellidae 1 Tharyx ? acutus 28
UNIDENTIFIED POLYCHAETA AND OLIGOCHAETA
Maldanidae 3Terebellidae 5Oligochaeta 2
327

118.
SMG 1618 SMG 161970°42.5'N 141°38.5'W 70°40.6'N 141°43'W644m 25 August 1977 659m 25 August 1977R/V GLACIER OCS-7 R/V GLACIER OCS-7Sieve mesh aperture = .42mm Sieve mesh aperture = .42mm
POLYCHAETA POLYCHAETA
Allia abranchiata 1 Allia abranchiata 5Allia suecica 14 Allia suecica 3Amage auricula 2 Aricidea ushakovi 1Chaetozone setosa 11 Eclysippe sp. A 11Eclysippe sp. A 15 Eteone flava 1Eteone flava 1 Heteromastus filiformis 1Heteromastus filiformis 2 Laonice cirrata 1Jasmineira schaudinni 1 Lumbrineris minuta 2Laonice cirrata 3 Lumbrineris sp. B 2Lumbrineris minuta 1 Maldane sarsi 6Lumbrineris sp. B 1 Minuspio cirrifera 20Maldane sarsi 16 Myriochele heeri 1Minuspio cirrifera 12 Nereimyra aphroditoides 1Myriochele heeri 2 Ophelina abranchiata 2Nereimyra aphroditoides 4 Scalibregma inflatum 1Ophelina abranchiata 5 Schistomeringos sp. A 3Scalibregma inflatum 1 Sigambra tentaculata 2Schistomeringos sp. A 3 Sphaerodoropsis biserialis 2Sigambra tentaculata 6 Sphaerodorum gracilis 1Sphaerodoropsis biserialis 2 Terebellides stroemi 1Sphaerodorum gracilis 1 Tharyx ? acutus 26Terebellides stroemi 3 Genus "B" (Capitellidae) 1Tharyx ? acutus 46Genus "B" (Capitellidae) 2 UNIDENTIFIED POLYCHAETA AND OLIGOCHAETA
UNIDENTIFIED POLYCHAETA Maldanidae 1Oligochaeta 1
Maldanidae 1Terebellidae 1
328
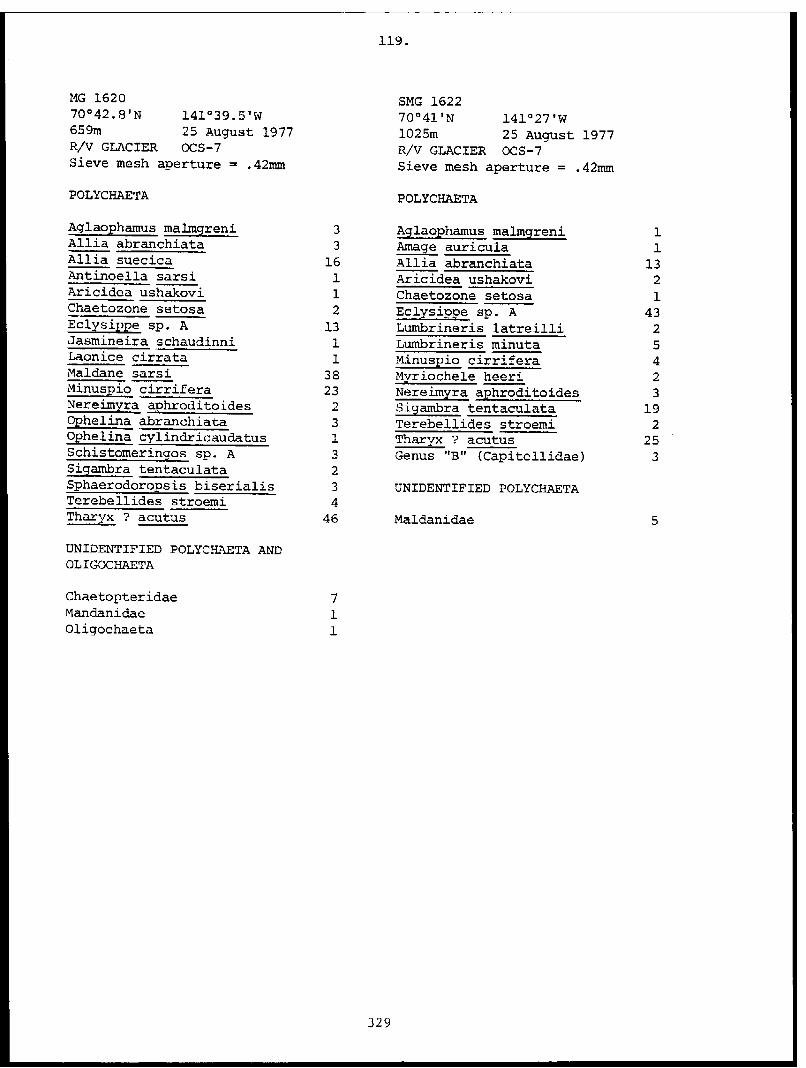
119.
MG 1620 SMG 162270°42.8'N 141°39.5'W 70°41'N 141°27'W659m 25 August 1977 1025m 25 August 1977R/V GLACIER OCS-7 R/V GLACIER OCS-7Sieve mesh aperture = .42mm Sieve mesh aperture = .42mm
POLYCHAETA POLYCHAETA
Aglaophamus malmgreni 3 Aglaophamus malmgreni 1Allia abranchiata 3 Amage auricula 1Allia suecica 16 Allia abranchiata 13Antinoella sarsi 1 Aricidea ushakovi 2Aricidea ushakovi 1 Chaetozone setosa 1Chaetozone setosa 2 Eclysippe sp. A 43Eclysippe sp. A 13 Lumbrineris latreilli 2Jasmineira schaudinni 1 Lumbrineris minuta 5Laonice cirrata 1 Minuspio cirrifera 4Maldane sarsi 38 Myriochele heeri 2Minuspio cirrifera 23 Nereimyra aphroditoides 3Nereimyra aphroditoides 2 Sigambra tentaculata 19Ophelina abranchiata 3 Terebellides stroemi 2Ophelina cylindricaudatus 1 Tharyx ? acutus 25Schistomeringos sp. A 3 Genus "B" (Capitellidae) 3Sigambra tentaculata 2Sphaerodoropsis biserialis 3 UNIDENTIFIED POLYCHAETATerebellides stroemi 4Tharyx ? acutus 46 Maldanidae 5
UNIDENTIFIED POLYCHAETA ANDOLIGOCHAETA
Chaetopteridae 7Mandanidae 1Oligochaeta 1
329

120.
SMG 1661 SMG 1664
71°12'N 145°35'W 71°05'N 146°33'W
2104m 30 August 1977 1144m 31 August 1977/O R/V GLACIER (CS-7 R/V GLACIER OCS-7
Sieve mesh aperture = .42mm Sieve mesh aperture = .42mm
POLYCHAETA POLYCHAETA
Allia abranchiata 15 Allia abranchiata 2Chaetozone setosa 1 Allia suecica 4Lumbrineris minuta 2 Aricidea ushakovi 2Lumbrineris sp. A 2 Eteone flava 1Minuspio cirrifera 1 Lumbrineris minuta 7Myriochele heeri 4 Minuspio cirrifera 7Ophelina sp. A 1 Myriochele heeri 11Sigambra tentaculata 41 Sigambra tentaculata 16Tharyx ? acutus 14
UNIDENTIFIED POLYCHAETAUNIDENTIFIED POLYCHAETA ANDOLIGOCHAETA Serpulidae 1
Terebellidae 1Lumbrineridae 2Spionidae 2Family unknown 1Oligochaeta
SMG 166371°05'N 146°33'W1144m 31 August 1977R/V GLACIER OCS-7Sieve mesh aperture = .42mm
POLYCHAETA
Allia suecica 8Chaetozone setosa 1Laonice cirrata 21Maldane sarsi 5Minuspio cirrifera 28Ophelina cylindricaudatus 1Scalibregma inflatum 2Sigambra tentaculata 2Sphaerodoropsis biserialis 1Tharyx ? acutus 1
330

121.
OTB 419 Station WBS-31/CG-64 OTB 447 Station WBS-2/CG-270°43'N 149°02'W 70°22.9'N 143°30.1'W50m 6 September 1971 51m 4 August 1972R/V GLACIER WEBSEC-71 R/V GLACIER WEBSEC-72
POLYCHAETA POLYCHAETA
Aglaophamus malmgreni 2 Gattyana cirrosa 2Cistenides hyperborea 16 Lagisca extenuata 1Euchone papillosa 1
OTB 449 Station WBS-3/CG-4OTB 420 Station WBS-32/CG-66 70°43.1'N 143°42.8'W70°43'N 149°06'W 464m 5 August 197231m 7 September 1971 R/VGLACIER WEBSEC-72R/V GLACIER WEBSEC-71
POLYCHAETAPOLYCHAETA
Apomatus globifer 11Cistenides hyperborea 1 Branchiomma infarcta 1Lumbrineris fragilis 14 Maldane sarsi 13
Nothria conchylega 8
OTB 445 Station WBS-1/CG-170°14.1'N 143°23.5'W OTB 450 Station WBS-5/CG-937m 4 August 1972 70°34.8'N 144°23.1'WR/V GLACIER WEBSEC-72 71m 7 August 1972
R/V GLACIER WEBSEC-72POLYCHAETA
POLYCHAETACistenides hyperborea 1Sabellides borealis 1 Aglaophamus malmgreni 8
Amage auricula 4Ampharete acutifrons 1
OTB 446 Station WBS-1/CG-1 Ampharete arctica 270°14.1'N 143°23.5'W Amphicteis gunneri 1428m 4 August 1972 Anaitides citrina 4R/V GLACIER WEBSEC-72 Anaitides groenlandica 4
Axionice flexuosa 3POLYCHAETA Eclysippe sp. A 3
Glyphanostomum pallescens 9Euchone papillosa 2 Lumbrineris fragilis 15
Melinna cristata 8Nereis zonata 9Nothria conchylega 15Paranaitis wahlbergi 2Polyphysia crassa 1Scalibregma inflatum 1
UNIDENTIFIED POLYCHAETA
Opheliidae (Travisia spp.) 1
331

122.
OTB 452 Station WBS-6/CG-10 OTB 456 Station WBS-10/CG-1670°20'N 144°40'W 70°40.8'N 145°24.9'W41m 7 August 1972 79m 9 August 1972R/V GLACIER WEBSEC-72 R/V GLACIER WEBSEC-72
POLYCHAETA POLYCHAETA
Bradia inhabilis 1 Nereis zonata 1Nothria conchylega 8
OTB 453 Station WBS-7/CG-1170°10.9'N 144°30.5'W OTB 457 Station WBS-11/CG-1727m 8 August 1972 70°51.5'N 145°17'WR/V GLACIER WEBSEC-72 57m 9 August 1972
R/V GLACIER WEBSEC-72POLYCHAETA
POLYCHAETAAntinoella sarsi 2Brada incrustata 1 Amphicteis gunneri 2Brada inhabilis 1Brada villosa 2Euchone papillosa 1 OTB 459 Station WBS-13/CG-24Eunoe oerstedi 1 70°35.1'N 146°35.3'WHarmothoe imbricata 2 48m 13 August 1972Melaenis loveni 6 R/V GLACIER WEBSEC-72Polyphysia crassa 1Sabellides borealis 9 POLYCHAETAScalibregma inflatum 5
Aglaophamus malmgreni 3
OTB 454 Station WBS-8/CG-1270°18.7'N 145°13'W OTB 460 Station WBS-14/CG-2530m 8 August 1972 70°20'N 146°28'WR/V GLACIER WEBSEC-72 34m 14 August 1972
R/V GLACIER WEBSEC-72POLYCHAETA
POLYCHAETANereis zonata 1Polyphysia crassa 1 Aglaophamus malmgreni 5
Anaitides groenlandica 2Cistenides hyperborea 3
OTB 455 Station WBS-9/CG-15 Euchone papillosa 1270°33'N 145°40'W Eunoe oerstedi 250m 9 August 1972 Polyphysia crassa 1R/V GLACIER WEBSEC-72
POLYCHAETA OTB 461 Station WBS-15/CG-2670°21.7'N 146°32.7'W
Axionice flexuosa 4 27m 14 August 1972Brada inhabilis 3 R/V GLACIER WEBSEC-72Nereis zonata 1Nicolea zostericola 1 POLYCHAETANothria conchylega 1
Cistenides hyperborea 5Euchone papillosa 1
332

123.
OTB 463 Station WBS-17/CG-28 BxC 04970°31.5'N 147°32'W 71°43.6'N 151°46.5'W29m 15 August 1972 1643m 29 August 1976R/V GLACIER WEBSEC-72 R/V GLACIER OCS-4
Sieve mesh aperture = .42mmPOLYCHAETA
POLYCHAETACistenides hyperborea 22Melaenis loveni 1 Antinoella sarsi 1Nereis zonata 2 Capitella capitata 1
Heteromastus filiformis 10Laonice cirrata 4
OTB 466 Station WBS-21/CG-36 Lumbrineris minuta 371°11.6'N 148°32.1'W Minuspio cirrifera 21159m 18 August 1972 Myriochele heeri 11R/V GLACIER WEBSEC-72
UNIDENTIFIED POLYCHAETAPOLYCHAETA
Maldanidae 3Nereis zonata 5
BxC 050OTB 467 Station WBS-22/CG-37 71°43.6'N 151°46.5'W71°05.7'N 148°41'W 1659m 29 August 197655m 19 August 1972 R/V GLACIER OCS-4R/V GLACIER WEBSEC-72 Sieve mesh aperture = .42mm
POLYCHAETA POLYCHAETA
Aglaophamus malmgreni 4 Aglaophamus malmgreni 1Amphicteis gunneri 3 Capitella capitata 6Anaitides groenlandica 1 Heteromastus filiformis 10
Nephtys ciliata 1 Laonice cirrata 3Nereis zonata 6 Lumbrineris minuta 2
Onuphis quadrucuspis 1 Minuspio cirrifera 145
Typosyllis cornuta 1 Myriochele heeri 16Sigambra tentaculata 7
BxC 048 UNIDENTIFIED POLYCHAETA71°44'N 151°45'W1738m 29 August 1976 Flabelligeridae 1R/V GLACIER OCS-4 Maldanidae 3Sieve mesh aperture = .42mm
POLYCHAETA
Capitella capitata 2Heteromastus filiformis 8Laonice cirrata 1Minuspio cirrifera 45Myriochele heeri 22Sigambra tentaculata 4
UNIDENTIFIED POLYCHAETA
Maldanidae 1
333

124.
VII. Discussion
From the data accumulated during the past year, it is evident that thereare seasonal, offshore-onshore, and geographic patterns in the structure of thesouthwestern Beaufort Sea benthic infaunal communities.
Perhaps the most significant and surprising finding is the seasonalityobserved in the outer continental shelf communities. The abundant fauna appearsto have a significant increase in numerical abundance in May (>1.0 mm in size)and in August for the smaller macro-infauna (0.5-1.0 mm in size). At the presentstage of analysis, it is difficult to determine the underlying causes for thesetrends. Species population size structure and abundance data are necessary forthe small fauna (e.g. harpacticoid copepods and nematode worms) and for the largemacrofauna (e.g. polychaete worms and gammarid amphipods). The population sizestructure of dominant species should be defined throughout the year to determinepatterns of life history in the southwestern Beaufort Sea continental shelf. Itis evident that at the three stations on the inner, mid and outer shelf, thereare some major differences in reproduction and community structure.
The implications to be derived from these results describing a biologicallyactive fauna in an arctic region with low primary production are intriguing.These results imply a more productive Beaufort Sea ecosystem than previouslythought. The average results point to the need for detailed life history studiesof the most abundant species now on hand. Further field research to describethese seasonal changes in more detail and to measure usable carbon inputs to theecosystem are also called for. Ice algae production and tundra peat detritusinputs are potential sources that should be defined throughout the year; theseinputs are likely to vary at varying distances from the coastline.
The abundance patterns of the larger benthic infauna (>1.0 mm) in the coastalzone demonstrate a nearshore maximum in numerical density with an intermediatelow and an offshore maximum. Hypotheses for processes that maintain these patternsare suggested by the bimodality of numerical density and correlations with environ-mental features. The abundance peak nearshore may be caused by inputs of detritalpeat from coastal erosion and river run-off, while that near the edge of the shelfmay be the region where the lower current energies allow oceanic detritus and finesedimentary particles to settle out. The abundance low is strongly correlatedwith the sea ice shear zone region. It is not known how long-lasting the destructiveeffects of ice scour are; it is possible that such scours would take a long time torecover previous sedimentary cover and characteristics owing to the low sedimenta-tion rates on the arctic Alaskan shelf. It is also evident from the distribution-abundance patterns of the dominant bivalve and polychaete species across the shelfthat species are adapted to live in narrow to broad environmental ranges. Somelive on the inner shelf, some on the mid-shelf and some at the shelf edge. Otherscan be distributed across the entire shelf from 5 to 100 meters depth.
Preliminary analysis of the distribution and abundance of polychaete speciesindicate that the eastern and western regions of the research area are differentecologically. The numbers of species and number of specimens at each stationalong the 3 transects summarized to date demonstrate a striking similarity betweenthe 2 eastern transects and the contrast in pattern of the transect off Cape Halkett.Previous research (Carey 1977 Final Rpt. T.O. #4) has shown the uniqueness of theBarter Island area. The zoogeographic analyses indicate that the continental shelffauna is relatively young and depauperate in species and ubiquitous in distribution.The deep fauna contains more endemic species and ones that have North Atlanticaffinities.
334

125.
VIII. Conclusions
1. The benthic communities (>0.5 mm in size) on the outer continental shelfundergo seasonal changes in numerical density and biomass. (Reasonably Firm)
2. The benthic infauna (>1.0 mm) are at maximum abundance nearshore and on theouter shelf with a minimum at 15-25 meters depth. (Reasonably Firm)
3. Gammarid amphipod species are influenced by depth; an inner, middle, andouter shelf fauna can be distinguished across the continental shelf off PittPoint. (Reasonably Firm)
4. Polychaete worms are more abundant nearshore near the Barter Island region,and offshore to the west near Cape Halkett. (Reasonably Firm)
5. Environmental features most influencing the benthic invertebrate communitieson the Beaufort Sea continental shelf include sediment type, depth, nearshoresalinity, river and lagoon detritus export, organic inputs, ice gouging, andpredation. (Preliminary)
6. The small benthic macro-infauna (0.5-1.0 mm) form a major portion of theinfaunal community across the Beaufort Sea continental shelf on the OCS PittPoint Transect station line.
335

126.
IX. Summary of January-March Quarter (RU #6 and #6W)
A. Field Trip Activities1. Field trip schedule
a. Dates: (1) 8-15 Mar. 1979: (2) 24 Mar-2 Apr. 1979: cancelledb. Name of vesselc. Aircraft: helicopterd. NOAA
2. Scientific Partya. Andrew G. Carey, Jr.: 8-15 Mar. 1979
School of OceanographyOregon State UniversityCorvallis, Oregon 97331
b. Kenneth Dunten and divers: 8-15 Mar. 1979Department of ZoologyWestern Washington State UniversityBellingham, Washington
c. Bryan Mathews and divers: cancelled because of bad weatherInstitute of Marine ScienceUniversity of AlaskaFairbanks, Alaska 99701
3. Methods
336

127.
IX. Summary of January-March Quarter (RU #6 and #6W) (continued)
3 a. Field Sampling (NOAA-OCSEAP Boulder Patch Ice Community-Benthos)
1. Priorities - a) ice cores
b) sediment cores - faunac) sediment traps (5-day deployment preferred)d) vertical migration traps (5-day deployment preferred)
1. large2. small
e) handnet sweeps (2 each)
1. ice-water interface2. sediment-water interface
f) sediment cores - environmental datag) water samples - environmental data
2. Schedule -(to be changed as necessary)a) First OSU Benthos dive day
1. ice cores (20)2. deployment of traps
a. sediment traps (2 frames)(caps left on the 8 cylinders)
b. small migration trap(upper and lower corks left inserted)
c. large migration trap(upper and lower corks left inserted)
3. sediment cores - fauna collected as possible4. removal of caps and corks on traps
b) Second OSU Benthos dive day (4 intervening days)1. cap and cork traps2. sediment cores - fauna (20 or remainder).3. sediment core - environment4. water samples - environment
a. ice-water interfaceb. bottom water
5. thermometer readingsa. ice-water interfaceb. bottom water
6. handnet sweepsa. ice-water interface (2)b. sediment-water interface (2)
7. retrieval of trapsa. small vertical migration trapb. large vertical migration trapc. sediment traps (2 frames)
337

128.
3. Preparation for fieldwork
a. Ice cores1. Check cores for cleanliness and for clarity of numerical markings.2. Put 20 cores (+ extras) plus 40 no. 8 rubber corks (+ extras) plus
40 red plastic core caps (+ extras) in field box.3. Fill out field sheets as far as possible.
b. Sediment cores1. Check cores for cleanliness and for clarity of numerical markings.2. Put 20 50cc syringe core tubes (+ extras) plus 40 no. 5 rubber corks
plus plastic electrical tape into field box.3. Fill out field sheets as far as possible.4. Check on availability of core extruders and sample jars.
c. Sediment traps1. Check on cleanliness of cylinders and caps and on tightness of cylinder
parts and the quadrupod frame.2. Obtain 5 plastic 2-1/2 collapsible carboys of sea water.3. Filter approximately 10 gallons of sea water and fill cylinders to top.
Use Nuclepore and pre-filter (see processing for set-up).4. Cap plus securely seat rubber cork in vent hole.5. Make sure salt blocks are available.
d. Vertical migration traps (LVMT+SVMT)1. Check that all pieces of traps are present and assembled for field.
The taped jar trap units should be clean and should not have been usedfor formaldehyde.
2. Check bridle and float length-height and adjust to ambient field conditions.3. Fill trap jar units with filtered sea water and place corks securely in
mouth of funnels.
e. Miscellaneous
1. Check general supplies for fieldwork.2. Fully brief divers and outline the next day's diving program.3. Place collectors outside early enough before helo flight so water
inside cools down.
338

129.
4. Sampling
a. Ice cores (ICB) - 201. 20 3.5 cm diameter plastic core tubes plus 40 rubber corks (no. 8's) in
diver carry bag.2. A diver or divers should scout area for appropriate soft ice to sample.
The undersurface of the ice should be soft, but thin enough sd that the
tube penetrates soft ice completely to hard ice above.
3. Divers to work in pairs with one pushing open core tubes through soft
ice on undersurface of sea ice. The 2nd diver should hand an open core
tube to the 1st diver, then corks, and finally should take corked core
tube and place in carrying bag. A new open tube should be handed to
1st diver for a repeat of the operation.4. Coring
a. Each open core tube should be pushed slowly through soft ice and should
be seated firmly at soft ice-hard ice interface.b. A cork should be firmly pushed into lower open end of tube.
c. The top end of the tube should be temporarily closed with a heavy
duty small spatula (on a thong) or a gloved hand. It may be necessary
to dig ice away from side of table to do this.d. The tube is removed from ice and a cork pushed solidly into the top
open end.e. The filled core tubes should be placed in a carry bag for return to the
surface.f. Observations should be made about the ice, associated animals, environ-
ment in general and the quality of the coring. These should be reported
to the biologist.g. The ice cores should be taken at random in an appropriate soft ice
environment on the undersurface of the sea ice
5. The 20 ice cores should be taken the first Benthos Dive Day but can be
split between the two days.
b. Sediment cores - fauna (SCB's)1. 20 50-cc plastic syringe core tubes plus 40 rubber corks (no. 5's) in
diver carry bag.2. A diver or divers should scout area for appropriate soft sediment to sample.
Patches of mud are present in the Boulder Patch near boulders and in
depressions.3. Divers should work in pairs in a similar fashion to the ice coring. One
diver should push open core tube into sediment, and the 2nd diver should
hand him corks, and finally take the corked tube from the 1st diver and
place in plastic rack. (TUBES SHOULD REMAIN UPRIGHT)
4. Coringa. Open small sediment core tube should be firmly pushed into sediment with
heel of diver's hand. Penetration is difficult in these sediments,
but should be at least 3 cm.b. A cork should be firmly pushed into open upper end of tube.
c. The lower end of the core tube should be temporarily but carefully
closed with the heavy duty small spatula (on a thong on a wrist).
It may be necessary to remove some sediment from side of tube to push
spatula flat underneath coring tube.
d. A cork should be firmly placed in lower open end of core tube.
339

e. The corked sample tube should be carefully stored vertically inplastic core bute rack sitting on the sediment surface. It shouldbe carried carefully back to dive hole in vertical position.
f. Observations should be made about sediments, sediment distribution,associated large animals and should be reported to the biologist uponreturn to surface.
g. The sediment cores should be taken at random within the softer sedimentpatches.
5. These samples should not be allowed to freeze.
C. Sediment Traps (STB)1. The 2 bottom racks with 4 capped cylindrical particle traps each should
be transported to the dive site as complete units. Each one will be filledwith nuclepore-filtered water.
2. The divers should have scouted the area and planned to locate these andthe vertical migration traps in a location typical of the site with softice but away from all the coring (and current meter servicing activities).
3. The sediment trap frames can be transported one at a time with the bridle;1 (perhaps 2) small buoys will be needed for flotation.
4. The traps should be placed about 10 feet apart and left with caps on untilthe end of the day's diving.
5. The bridle can be left clipped to one frame for retrieval.6. The floats should be returned to the dive hut for attachment to the vertical
migration trap anchor weights to facilitate transporting to the trap area.7. These samples should not be allowed to freeze.
d. Vertical Migration Traps (VMTB)1. The 2 Vertical Migration Traps should be transported to the dive site as
assembled units and each trap chamber filled with water. Corks shouldbe seated firmly into the funnel throats. The Large Vertical MigrationTrap (LVMTB) should be lashed together for transport with the trap chambersand funnels stabilized by appropriate lines.
2. These VMT's should be located under typical soft underice environmentalconditions and near the sediment traps in an undisturbed area.
3. Deploymenta. Small vertical migration trap.
(1) The Small VMT (SVMT) should be deployed first for practice. Itsanchor should be heavier than the thick-walled aluminum pipe sectionand may need a float for buoyant transport to location.
340

131.
(2) The flotation on the unit is self-contained.(3) The trap should be rigged to be oriented halfway between the ice
undersurface and the sediment surface.b. Large Vertical Migration Trap (LVMT)
(1) The anchor weight should be located first; 3-4 buoys should besnapped on for ease in diver handling.
(2) The trap unit should be carried to the study site by 'a diver. Acontrasting polypropylene line should be used to temporarily lashthe two 1-meter rings together for ease in handling.
(3) The trap should be placed in proper orientation, the lashing removed,and the anchor snapped onto lower bridle. One float at a timeshould be'unsnapped from the anchor weight and should be snappedonto the upper 1-meter ring. Two floats on the ring at 1800 toone another are adequate for floatation.
(4) The corks protecting the trap chambers should be carefully keptin place during deployment and until any suspended sediment settlesor is moved away by currents.
(5) The lower bridle, the floats and the next extensions should beadjusted if necessary and made true so that the unit is orientedcorrectly.
(6) If the height between the underice surface and the sediment isless than necessary for the present trap rig, the floats shouldbe repositioned around the upper ring in horizontal position (a)or the small trawl head rope floats should be placed on the uppernet lashing for flotation with less vertical height.
(7) These samples should not be allowed to freeze.
341

132.
e. Handnets (2)1. Two separate sweeps with the two nets should be made of the underice surface.
The nets should be used to just scrape the ice surface so it doesn't rapidlyclog with slush ice. Preferably tracklines several meters long should be
made to maximize animal collection. If necessary, hunt out individuallarger animals, e.g. amphipods, mysids, fishes, and polychaetes.
2. Two separate sweeps with the two nets should be made at the sediment-water
interface. Just the very surface sediment should be allowed to enter net.
Tracklines at least several meters long should be made,but hunting of
individual specimens may be necessary.3. When sampling with a net is completed the bag (0.5 mm NYTEX mesh) should
be folded back over the stainless steel rod frame to prevent animal excape-
ment.4. These samples cannot be frozen.
f. Sediment cores - environmental1. 3 large cores (3.5 cm diameter) should be taken of the sediments in the
areas previously sampled for particle size and organic analyses.2. The coring procedure should be the same as with the small faunal sediment
cores.
g. Water samples1. A salinity bottle should be filled at the ice-water interface and at the
water-sediment interface.2. These cannot be frozen.3. An in situ salinometer should be used for a continuous profile when an
instrument is available.
h. Water temperatures1. Thermometer readings should be made at the ice-water interface and at the
water-sediment interface.2. A continuous profile should be made and readings recorded every meter of
water depth when an appropriate instrument is available.
342

133.
5. Sample Processing
a. Field1. Ice cores
a. Cap with red plastic caps upon retrieval to surface.b. Note condition of cores and ice within each numbered core tube.c. Note diver observations about ice conditions, coring success and
problems.d. These samples should not be allowed to freeze solid.
2. Sediment coresa. Tape corks on core tubesb. Note diver observations of cores and sediment sampled, including
patchiness.NOTE: Core tubes should be kept upright.
c. These samples should not be allowed to freeze.3. Sediment traps
a. The caps should be checked upon retrieval for firm seating and toensure that the corks are firmly in place.
b. The quadrupod frames and collectors should be transported to thelaboratory as an assembled unit for protection of the samples.
c. These samples should not be allowed to freeze.4. Vertical migration traps
a. Upon retrieval, corks should be immediately checked for firm seating.b. The upper and lower chambers should alternately be preserved and
capped securely.c. New jars should then be used for each deployment and should be firmly
taped together with duct tape. (The formalin may have effect on thelater trapping efficiency of the units.)
d. The trap jar units should be removed from the VMT's and placed in fieldbox for transport to the laboratory.
3. These samples should not be allowed to freeze.5. Handnet samples
a. Upon retrieval by the divers the handnets should be washed down andthe samples washed out into sample jars.
b. Samples to be preserved with neutralized 10% formalin.c. These samples should not be allowed to freeze.
b. Laboratory1. Ice Cores (ICB)
a. ICB's should be allowed to melt and then should be concentrated through63 µm small diameter sieve.
b. The screen should be carefully flushed and backwashed into sample jarwith filtered seawater from wash bottle.
c. Preserve sample with buffered formalin to make 10% concentration.d. Double label - inside plus outside.e. Complete field sheets.f. Screen should be rinsed in fresh water between samples.g. Cores should be rinsed in fresh water before storage.
2. Sediment Cores (SCB)a. Any pertinent observations on sediment and core samples should be made.b. SCB's should be extruded in 1 cm increments into sample jars (2 oz.).
Rinse of extruder into last jar with wash bottle.c. The overlying water should be decanted off and preserved in separate
jar before extruding sediment.d. Preserve sample with buffered formalin to make 10% concentration.
343

134.
e. Double label - inside and outside jar.f. SCB's should be washed and cleaned in fresh water before storage.
3. Vertical migration trapsa. Carefully transfer contents of trap jar units to storage jars.b. Double label - inside and outside.c. Add any further pertinent notes to field sheets.d. Two new jar units should be taped together for the next deployment.
c. Sediment Traps - Benthos (STB)1. The STB cylinders should remain undisturbed in the laboratory for 2 hours
to allow particles to settle.2. Set up filtration units and vacuum pump with a
protective plastic sheet hood over the sinkarea. A vacuum bypass should be build intothe system with a T-connector and screw clampto provide control over vacuum intensity.3-4 filter units can be used to maximize efficiency.1 liter vacuum flasks with volumetric markingsshould be used.
3. After the initial period for particle settling in the cylinders, carefullysiphon off upper 36 cm's or so of water down to about 10 cm's. Filterupper water through nuclepore filter(s) and freeze in labeled jar with
dividing plastic circles.4. Filter remaining water and particles through nuclepore filter in 100 ml
aliquots. Gently mix sample before each sample transfer to equalize
particle concentrations. NB - Each filter should be a collection from a
measured volume of water; they should be equal if possible.5. The filtration volume, rate, number of filter units, etc. may have to be
adjusted to best suit the sample conditions. This will be true when glass
fiber filters are added to the procedure for OCS-11.6. The filters should remain frozen at Prudhoe Bay and during transport to
OSU. Dry ice (snow) and insulated box can be ordered from NARL [CharlotteSchneider, Stockroom].
344

135.
B. Laboratory Analysis1. Scientific Personnel
a. Andrew G. Carey, Jr. Principal InvestigatorAssociate Professor
Responsibilities: coordination, evaluation, analysis,and reporting
b. James Keniston Research Assistant (part-time)Responsibilities: data management, statistical analysis
c. Paul Montagna Research AssistantResponsibilities: sample processing, biomass measurements,
harpacticoid copepod and crustaceansystematics, and field collection
d. R. Eugene Ruff Research AssistantResponsibilities: species list compilation, sample processing,
reference museum curation, polychaetesystematics, field collection, and laboratorymanagement
e. Paul Scott Research AssistantResponsibilities: sample processing, data summary, molluscan
systematics and sample collection.
2. Methods: laboratory analysesa. Ice epontic community and benthic community - Boulder Patch,
Stefannson Sound.
1. New separation techniques have been tested to separate thesmaller fauna, including the indicator group of meiofaunalorganisms, Harpacticoid Copepoda. A suspension of colloidalsilica (LUDOX) is used with centrifugal forces to separatethe fauna from the sedimentary debris. The technique hasproven to be effective and efficient.
2. Identification of the indicator organisms, HarpacticoidaCopepoda, by Paul Montagna continues on schedule.
b. The small macro-infauna (0.5-1.0 mm in size)
1. Standard picking techniques under the dissecting microscopehave been utilized to pick and sort this fraction of samplescollected from the OCS Pitt Point Station Transect Line andother pertinent areas.
3. Sample localitiesa. Stefannson Sound Boulder Patchb. OCS lease area - Beaufort Seac. OCS Transect Line - Pitt Point (PPB).
345

136-
B. Laboratory Analysis (continued)
4. Data collected and analyzed
a. The small macro-fauna (0.5-1.0 mm in size) have been picked
and sorted to major taxonomic category from 60 PPB seasonal
samples (Tables 8-20).
b. Pelecypod molluscs (Bivalvia)The pelecypods in all samples sorted to date have beenidentified by Paul Scott with the aid of Frank Bernardof the Fisheries Research Board of Canada, Nanaimo.
c. Harpacticoid CopepodaIdentifications continue by Paul Montagna.
d. PolychaetaIdentifications of the coastal (5-25 meters depth) continue
by R.E. Ruff.
346

Table 8 : Total infaunal densities per 1 m2 on the Pitt Point seasonaltransect line.
347

Table 9: Animal densities for PPB-25 (OCS-1) 0.50 mm fraction, collected 26 October 1975. Each
sample is a 0.1 m2 Smith-McIntyre grab.

Table 10: Animal densities for PPB-25 (OCS-2) 0.50 mm fraction, collected 12 March 1976. Eachsample is from a 0.1 m2 Smith-McIntyre grab.

Table 11: Animal densities for PPB-25 (OCS-4) 0.50 mm fraction, collected 1 September 1976. Eachsample is from a 0.1 m2 Smith-McIntyre grab.

Table 12: Animal densities for PPB-25 (OCS-6) 0.50 mm fraction, collected 11 November 1976. Eachsample is from a 0.1 m2 Smith-McIntyre grab.

Table 13: Animal densities for PPB-55 (OCS-1) 0.50 mm fraction, collected 28 October 1975. Eachsample is 1/4 of a 0.1 m² Smith-McIntyre grab.

Table 14: Animal densities for PPB-55 (OCS-2) 0.50 mm fraction, collected 18 March 1976. Eachsample is 1/4 of a 0.1 m² Smith-McIntyre grab.

Table 15: Animal densities for PPB-55 (OCS-4) 0.50 mm fraction, collected 31 August 1976. Eachsample is 1/4 of a 0.1 m² Smith-McIntyre grab.

Table 16: Animal densities for PPB-55 (OCS-6) 0.50 mm fractions, collected 4 November 1976. Eachsample is from a 0.1 m² Smith-McIntyre grab.

Table 17: Animal densities for PPB-100 (OCS-1) 0.50 mm fraction, collected 30 October 1975. Eachsample is from a 0.1 m² Smith-McIntyre grab.
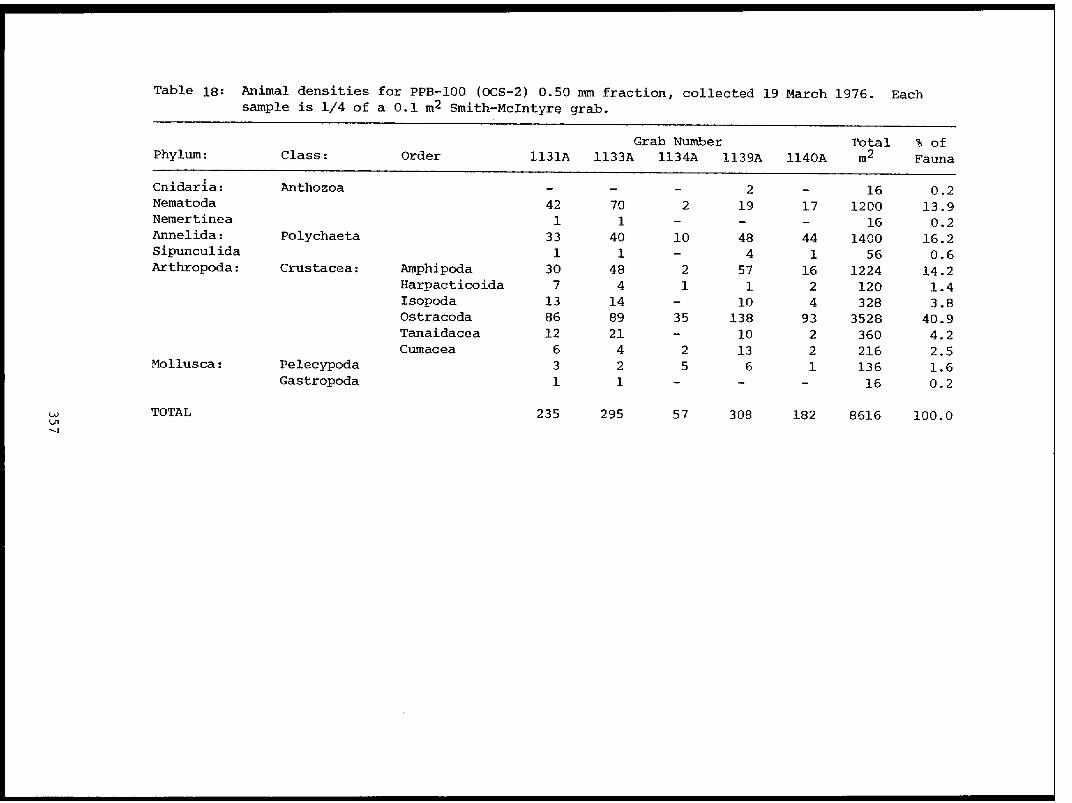
Table 18: Animal densities for PPB-100 (OCS-2) 0.50 mm fraction, collected 19 March 1976. Eachsample is 1/4 of a 0.1 m² Smith-McIntyre grab.

Table 19 Animal densities for PPB-100 (OCS-4) 0.50 mm fraction, collected 30 August 1976. Eachsample is 1/4 of a 0.1 m² Smith-McIntyre grab.

Table 20: Animal densities for PPB-100 (OCS-6) 0.50 mm fraction collected 3 November 1976.Each sample is 1/4 of a 0.1 m² Smith-McIntyre grab.

150.
X. Auxiliary Material
A. References Used (Bibliography)See Reference Lists at end of each report section.
B. Papers in Preparation or in Print
a. Oregon State University Publications
Bilyard, G.R. and A.G. Carey, Jr. Distributional patterns of western BeaufortSea polychaetous annelids. Mar. Biol. (Under revision).
Bilyard, G.R. and A.G. Carey, Jr. Zoogeography of Beaufort Sea Polychaeta(In Preparation)
Carey, A.G., Jr., R.E. Ruff, J.G. Castillo and J.J. Dickinson. 1974. Benthicecology of the western Beaufort Sea continental margin, pp. 665-580. InThe Coast and Shelf of the Beaufort Sea. J.C. Reed and J.E. Sater (Eds.).Arctic Institute of North America. 750 pp.
Carey, A.G., Jr. and R.E. Ruff. 1977. Ecological studies of the benthos in thewestern Beaufort Sea with special reference to bivalve molluscs, pp 505-530.In Polar Oceans. M.J. Dunbar (Ed.) Arctic Institute of North America. 681 pp.
Carey, A.G., Jr., R.E. Ruff and P.A. Montagna. Seasonality in Beaufort Sea benthos:Evidence for a more productive Arctic ecosystem? (Unpublished manuscript)
Castillo, J.G. 1976. Analysis of the benthic Cumacea and Gammaridean Amphipodafrom the western Beaufort Sea. Unpublished Ph.D. Dissertation, OregonState University.
Montagna, P.A. and A.G. Carey, Jr. 1978. Distributional notes of Harpacticoidea(Crustacea:Copepoda) collected from the Beaufort Sea (Arctic Ocean) Astarte11. In Press.
Montagna, P.A. 1978. Cervinia langi n. sp. and Pseudocervinia magna (Smirnov,1946) from the Beaufort Sea (Alaska, U.S.A.) Trans. Amer. Micros. Soc.:In Press.
b. Other Publications (Wholly or partially derived from the work ofA.G. Carey.
Bernard, F.R. Bivalve molluscs of the western Beaufort Sea. Science Bulletinof the Los Angeles County Museum of Natural History (In Press).
Laubitz, D.R. 1977. A revision of the genera Dulichia Krøyer and ParadulichiaBoeck (Amphipoda, Podoceridae). Can. J. Zool. 55:942-982.
Mathews, D. 1973. A baseline for Beaufort. Exxon USA 12:3-7.
McAllister, D.E. 1975. A new species of Arctic Eelpout, Lycodes sagittarius,from the Beaufort Sea, Alaska, and the Kara Sea USSR (Pisces: Zoarcidae).Nat. Mus. Canada Publications in Biological Oceanography, No. 9.
360

Contract 03-5-022-81Research Unit 356April 1, 1979 to March 31, 19799 pages plus 180 appended pages
ANNUAL REPORT
ENVIRONMENTAL ASSESSMENT OF SELECTED HABITATS
IN THE BEAUFORT AND CHUKCHI LITTORAL SYSTEM
Principal Investigator: A. C. BroadWestern Washington University
A. C. Broad
Alexander Benedict
Kenneth Dunton
Helmut Koch
D. T. Mason
D. E. Schneider
Susan V. Schonberg
361
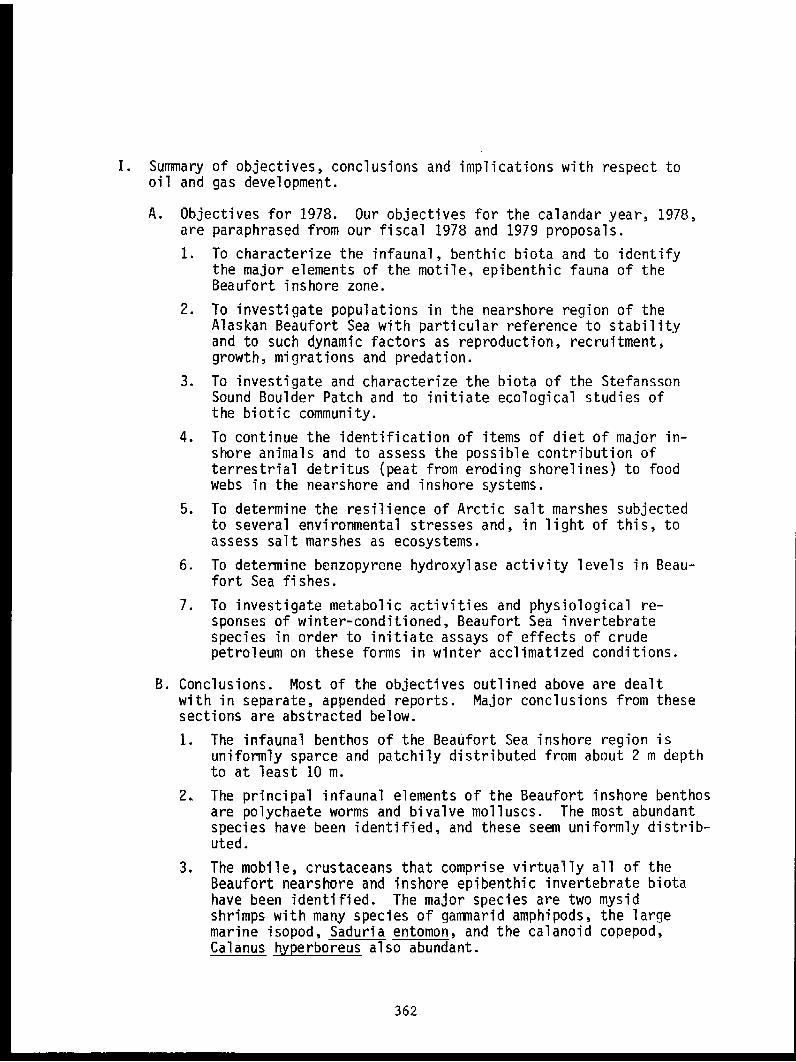
I. Summary of objectives, conclusions and implications with respect tooil and gas development.
A. Objectives for 1978. Our objectives for the calandar year, 1978,are paraphrased from our fiscal 1978 and 1979 proposals.
1. To characterize the infaunal, benthic biota and to identifythe major elements of the motile, epibenthic fauna of theBeaufort inshore zone.
2. To investigate populations in the nearshore region of theAlaskan Beaufort Sea with particular reference to stabilityand to such dynamic factors as reproduction, recruitment,growth, migrations and predation.
3. To investigate and characterize the biota of the StefanssonSound Boulder Patch and to initiate ecological studies ofthe biotic community.
4. To continue the identification of items of diet of major in-shore animals and to assess the possible contribution ofterrestrial detritus (peat from eroding shorelines) to foodwebs in the nearshore and inshore systems.
5. To determine the resilience of Arctic salt marshes subjectedto several environmental stresses and, in light of this, toassess salt marshes as ecosystems.
6. To determine benzopyrene hydroxylase activity levels in Beau-fort Sea fishes.
7. To investigate metabolic activities and physiological re-sponses of winter-conditioned, Beaufort Sea invertebratespecies in order to initiate assays of effects of crudepetroleum on these forms in winter acclimatized conditions.
B. Conclusions. Most of the objectives outlined above are dealtwith in separate, appended reports. Major conclusions from thesesections are abstracted below.
1. The infaunal benthos of the Beaufort Sea inshore region isuniformly sparce and patchily distributed from about 2 m depthto at least 10 m.
2. The principal infaunal elements of the Beaufort inshore benthosare polychaete worms and bivalve molluscs. The most abundantspecies have been identified, and these seem uniformly distrib-uted.
3. The mobile, crustaceans that comprise virtually all of theBeaufort nearshore and inshore epibenthic invertebrate biotahave been identified. The major species are two mysidshrimps with many species of gammarid amphipods, the largemarine isopod, Saduria entomon, and the calanoid copepod,Calanus hyperboreus also abundant.
362

2
4. During the summer season, the nearshore infaunal biota isfairly stable with trends in number and average size thatmay reflect movement into the nearshore zone in early summer,recruitment, growth and either predation or emigration in latesummer. The mobile crustaceans are least abundant early inthe ice-free season and reach a population peak in mid summer,possibly reflecting movement into the nearshore region followedby emigration in late summer.
5. The biota of the Stefansson Sound Boulder Patch is unlike thatof those marine communities previously known from the BeaufortSea and, while the individual species are not new, the associa-tion of them in a sessile, kelp-dominated community has notbeen reported before.
6. Many marine invertebrates of the Beaufort Sea ingest peat, butseem to derive no nutritional benefit from it. Gammarussetosus, however, does assimilate some of the organic contentof ingested peat and is able to assimilate part of Laminariaas well.
7. Arctic salt marshes are sensitive to oil, cover by sand, orphysical disturbance, and marshes in the north (Beaufort coast)are several times moe suceptible to damage (or are damaged byless of any stressor) than are marshes near the Arctic circle(Chukchi coast).
C. Implications.
1. Except for the Stefansson Sound Boulder Patch, there is noknown unique or unusual benthic habitat in the Beaufort, in-shore or nearshore regions. The implication for explorationand development is that, from the viewpoint of the benthicbiologist, no part of the nearshore or inshore zones is pre-ferrable to any other--except for Stefansson Sound. Datapreviously reported by us and those reported here for Nuva-gapak Lagoon, indicate that the benthonic biomass of lagoonsystems and that, in general, alteration of a unit area oflagoon bottom will have a greater overall effect on benthosthan will comparable alteration of a similar area of open seabottom.
2. The Stefansson Sound region is a biological habitat that, forpractical purposes, may be considered unique and, at leastuntil this community and its overall contribution to the Beau-fort Sea are better known than now is the case, should not bedisturbed.
3. Carbon from detritus of terrestrial origin enters the Beaufortmarine food web through Gammarus setosus and, possibly otherspecies. The full importance of this contribution is yet tobe evaluated, but there are implications for attempts at shore-line stabilization and, interference with currents that trans-port materials alongshore. We have data that indicate a rela-tionship between the presence of peat and the abundance of
363

3
benthos. Peat enters the system as material of large particlesize and, in time, breaks down possibly as a result of beingingested by animals. The organic content of peat of smallparticle size is reduced over that of the larger sized (and,presumably, younger) peat. Directly or indirectly, this or-ganic material becomes available to the marine biotic community.Because developments which may require shoreline stabilizationand interference with longshore transport are imminent and be-cause this same development may introduce into the marine envi-ronment materials that can affect the avilability of detritalcarbon to the marine biota, it is important that the extent ofthis contribution and the pathways by which it occurs are knownat the earliest possible date.
5. Arctic salt marshes are important in the feeding of geese andbrant as well as other animals. These marshes are sensitiveto oil, and those on the Beaufort coast especially so. Bar-ring accidents during exploration, development and production,these marshes, which are usually above water level, are notthreatened by petroleum development per se, but this sensitivityshould be borne in mind and contingency plans for protection ofmarshes is the event of accidents should be made.
II. Introduction:
This report consists of five, separate appended sections or chapters.
Each is intended to be complete in itself, and each either deals inde-
pendently with introductory material including sections on state of
knowledge, the study area, sources and rationale of data collection,
methods, presentation of results, conclusions, and discussion--or such
has already been presented in previous annual reports.
The first section deals with the inshore benthic and epibenthic
fauna, and is the result of the 1977 Beaufort Sea cruise of the RV
ALUMIAK. Now being processed in our laboratory are samples from the
1978 ALUMIAK Beaufort cruise in which some of the same stations were
revisited, and more thorough coverage of the current lease zone was
possible.
The second section is a presentation of data obtained in repetitive,
nearshore samples of Beaufort Sea sites made in 1977. Awaiting labora-
tory analysis are comparable samples from the Chukchi coast made in 1978.
In the third section of the report, a description of the Stefansson
Sound Boulder Patch based on field work carried out in 1978 and part of
1979 is given. Field work in Stefansson Sound is continuing.
364

4
The fourth section describes experiments done on feeding of Gam-
marus setosus and other nearshore species during the summer of 1978.
These experiments will continue in 1979.
The fifth section of this report is a brief presentation of some
of the effects of perturbation of Arctic salt marshes in 1977 and 1978
and updates a comparable treatment made a year ago. It is noteworthy
that effects of oil added to marshes in 1977 were intensifying in 1978.
Subsequently, we will present results of the use of marsh invertebrates
to assay for oil (or effects of oil on marsh invertebrates) and results
of a study of black brant dependence on marshes.
Not dealt with further in this report is the measurement of benzo-
pyrene hydroxylase activity. Fishes collected during the 1978 summer
thawed in transit to Bellingham, casting doubt upon the negative re-
sults obtained. Additional fish were obtained in 1979, but these have
not yet been analyzed. Since these were collected prior to drilling,
we still should obtain activity levels that precede any petroleum
activity in the Alaskan Beaufort Sea.
Finally, physiological experiments in progress are described briefly
in the report of fourth quarter activities.
365

5
Summary of Fourth Quarter Operations
I. Field and laboratory activities.
A. Field work
1. At NARL, Barrow: physiological investigations.
a. D. E. Schneider - January 10 to March 15b. J. Hanes - January 16 to end of quarterc. W. Pounds - February 16 to end of quarter
2. At Deadhorse and Stefansson Sound Dive Site: K. Duntonand dive team (J. Olsen, P. Plesha, G. Smith)
a. February 21 to March 15.
B. Scientific Party (except as noted, all of Western WashingtonUniversity)
1. A. C. Broad, Principal Investigator (half time)
2. D. E. Schneider, Associate Investigator
3. Ken Dunton, Assistant Investigator
4. Helmut Koch, Laboratory Supervisor
5. James Hanes, Marine Technician (after January 16)
6. Mark Childers, Research Aide
7. Wendy Pounds, Research Aide (after February 16)
8. Susan Schonberg, Research Aide (half time)
9. Alexander Benedict, Computer Programmer (hourly wages)
10. Laboratory Assistants (hourly wages)
a. Dawn Christmanb. Neil Safrinc. Russell Thorsend. Jon Zehr
11. Work-study students (no cost to contract)
a. Ron Adamsb. Robert Cruggerc. Philip Dennyd. Bruce Fletchere. Gary Smithf. Russell Wellington
12. Contracted services (not University employees)
a. John Olson, diverb. Paul Plesha, mechanic and technicianc. Gary F. Smith, diver
C. Methods -- see text of appropriate sections of annual report.
366

6
D. Sample localities -- see sections 3 and 4 of annual report.
E. Data collected or analyzed.
1. See sections 3 and 4 of annual report
2. Laboratory work continued on analysis of 1978 ALUMIAK samples.
F. Milestone chart update: none required.
II. Results:
The investigation of physiological responses of arctic shallow-
water marine animals to winter conditions was continued during the
second quarter. Major emphasis was placed upon determining tolerance
levels to salinity extremes and the effect of salinity upon determin-
ing tolerance levels to salinity extremes and the effect of salinity
upon respiration. The following experiments were either completed or
initiated:
Acute salinity tolerance. Animals were transferred directly from
their normal field salinity of about 32%oto a stress salinity. Experi-
ments were carried out in pint plastic freezer boxes containing about
400 ml of the desired salinity and 5 animals. At least 10 animals were
exposed to each stress salinity. The animals were checked daily for
mortality and a subjective rating of their activity level was made.
Experiments were terminated after 7 days. Table Q-1 lists the acute
salinity tolerance experiments run.
Table Q-1. Acute Salinity Tolerance Experiments
Gradual salinity tolerance. Animals were transferred from their
normal field salinity of about 32‰to either higher or lower salinities
in 5‰ increments every 2 days. Mortality and subjective rating of their
activity level was recorded daily. Table Q-2 lists the gradual salinity
tolerance experiments run.
367

7
Table Q-2. Gradual Salinity Tolerance Experiments
Crude Oil Toxicity: Preliminary experiments were begun to assess
the toxicity of sea water--crude oil emulsions to some of the common
species. Prudhoe Bay crude oil was agitated with sea water for one
hour on a mechanical shaker. The emulsions were transferred to sepra-
tory funnels and allowed to settle for 3 hours before being directly
used in tolerance experiments. Animals were exposed to emulsions for
4 days and fresh emulsions were prepared daily. The animals were
checked for mortality and a subjective rating of their activity was
made daily. Anonyx nugax and Mysis litoralis were tested at 32‰
salinity and oil concentrations of 25, 250, and 1000 pl/50ml sea water.
Anonyx nugax was tested under double stress conditions of 32%oand 40%o
with an oil concentration of 25 µl/500ml sea water.
Respiration measurements. The rate of 02 consumption was deter-
mined as a function of salinity for Anonyx nugax, Boeckosimus affinis
and Mysis litoralis. Measurements were made using a Gilson Differen-
tial Respirometer with 15 ml flasks. Single animals were placed in 5
ml of the appropriate salinity sea water and run for at least 6 hours.
Bath temperature was maintained at -1.0°C and the room was darkened to
simulate winter light conditions. Animals were transferred from their
field salinity of 32%oto the test salinity in 5‰increments every 2
days. They were maintained at the test salinity for 6 days prior to
determination of their respiration rates. At least 16 animals were
run at each test salinity. Anonyx nugax was run at 15, 20, 32, 40, 45,
and 50‰. Boeckosimus affinis was run at 10, 15, 20, 32, 40, 45, 50,
and 55‰. Mysis litoralis was run at 10, 15, 20, 32, 40, 45, and 50‰.
368

8
Experiments on the effect of crude oil - sea water emulsions on the
respiration of the above species were initiated but not completed dur-
ing this quarter.
The results of the physiological studies will be presented in a
later report when a full data set is available for interpretation.
Analysis of the existing data indicates that Anonyx nugax is the least
euryhaline of the 3 species studied and does not tolerate salinities
out of the range 15 - 45%overy well. Boeckosimus affinis is the most
euryhaline species and tolerates salinities in the range of < 10‰ to
65%osuccessfully. Mysis litoralis is intermediate and survives well
at salinities ranging from about 5 - 45%o.
The investigation of the trophic relationships of the Arctic
shallow-water marine animals continued with the collection and preser-
vation of freshly produced fecal pellets for later analysis. Some of
these pellets have been analyzed during this quarter as time permits.
A single peat assimilation experiment was performed under winter condi-
tions with Mysis litoralis. The results of this experiment have been
included in the annual report, section 4.
Activities of the team working in Stefansson Sound have been incor-
porated in section 3 of the annual report.
369
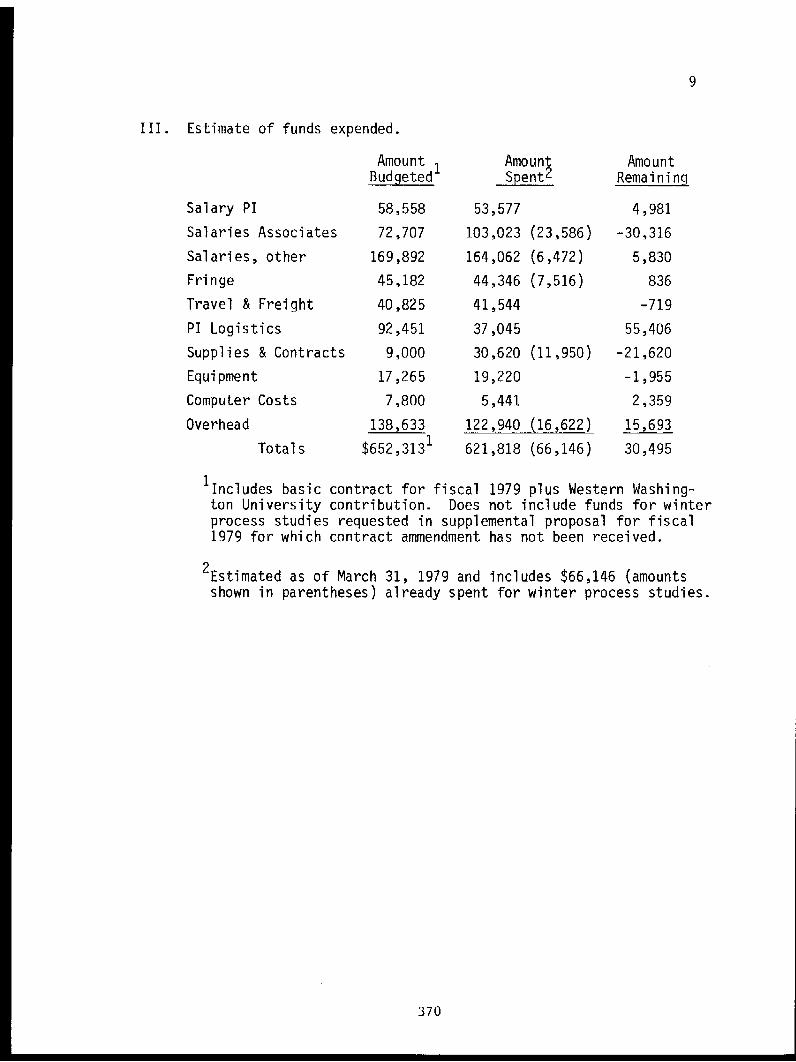
9
III. Estimate of funds expended.
Amount Amount AmountBudgeted Spent2 Remaining
Salary PI 58,558 53,577 4,981
Salaries Associates 72,707 103,023 (23,586) -30,316
Salaries, other 169,892 164,062 (6,472) 5,830
Fringe 45,182 44,346 (7,516) 836
Travel & Freight 40,825 41,544 -719
PI Logistics 92,451 37,045 55,406
Supplies & Contracts 9,000 30,620 (11,950) -21,620
Equipment 17,265 19,220 -1,955
Computer Costs 7,800 5,441 2,359
Overhead 138,633 122,940 (16,622) 15,693
Totals $652,3131 621,818 (66,146) 30,495
Includes basic contract for fiscal 1979 plus Western Washing-ton University contribution. Does not include funds for winterprocess studies requested in supplemental proposal for fiscal1979 for which contract ammendment has not been received.
2 Estimated as of March 31, 1979 and includes $66,146 (amountsshown in parentheses) already spent for winter process studies.
370

A further contribution to knowledge of the benthic and
epibenthic fauna of the Beaufort Sea inshore region.
A. C. Broad
Previously, we have reported that the Beaufort Sea nearshore¹ (less
than 2 m deep) fauna is poor in species, number of individuals, diversity,
and biomass, and that the Chukchi coast north of Point Hope does not
differ from the Beaufort littoral in these parameters. The Beaufort in-
shore (2 to 20 m) benthic infauna differs from that of the nearshore
region in that it is both richer and more diverse. These same differ-
ences do not obtain when the motile, epibenthic animals of the Beaufort
nearshore and inshore zones are compared, and our data indicate that the
same population of motile organisms is sampled in the Beaufort nearshore
and inshore and in the Chukchi nearshore north of Point Hope. There are
real differences in biomass and number of species of infaunal animals in
the Chukchi Sea north and south of Point Hope. A comparison of diversity,
however, does not indicate the same differences. The number of motile,
epibenthic species found south of Point Hope exceed those north of that
point, but the data on diversity and biomass do not indicate that the
populations are different.
Data collected in 1977 during the cruise of RV ALUMIAK from Barrow
eastward to Tapkaurak Entrance (at which point further progress was im-
peded by ice) add to our understanding of the fauna of the inshore region
and are reported in this section.
Methods
RV ALUMIAK sailed from Barrow on August 2, and returned on August 26,
1977. During the cruise 17 transects were made of the inshore region of
the Beaufort Sea and 44 stations were sampled. The number and type of
samples made at each station and the location of all stations are given
in appended table 1.1.
The sampling protocol at each station was:
371

1-2
A. For infaunal benthos samples a 0.1 m2 Smith-McIntyre grab was
employed. With few exceptions, three grab samples were made at
each station. The samples were washed on board in a cascading,
multiple seive system in which the controlling (lower) mesh size
was of 0.423mm NITEX. The larger stones retained in the coarser
seives were inspected and, unless harboring sessile animals, dis-
carded. All other retained material was bagged on board, pre-
served in hexamine-buffered formalin, and shipped to Bellingham
for analysis.
B. Motile, epibenthic animals were sampled by towing a WILDCO scrape/
skid dredge (Cat. No. 171) with 1.05mm mesh net for five minutes.
To assure that this net actually sampled at the bottom, approxi-
mately 2 kg of lead weights were attached to the towing bridle
about 45 cm ahead of the net itself. Samples were preserved on
board in buffered formalin.
C. Surface plankton was sampled by towing a 20.3 cm diameter, coni-
cal plankton net of 153pm nylon mesh for five minutes. The sam-
ples were preserved immediately in hexamine buffered formalin.
D. A sample for sediment analysis was taken with either the Smith-
McIntyre or with a O.1m 2 Van Veen grab. A sample of approximately
500 ml was preserved for subsequent analysis.
E. A temperature-salinity profile was made by means of a Yellow
Springs Instrument model 33 SCT meter. A Secchi disc reading
was made, and the depth was measured by means of a lead line.
F. In Bellingham, all dredge and grab samples were soaked to remove
formalin and sorted under 2x magnification (Luxo illuminated
magnifier). In most instances, the samples were stained with a
rose bengal solution. All organisms were removed, identified,
counted and weighed to the nearest mg by species (wet weight taken
immediately after blotting dry), and then preserved in 35% propanol
or 70% ethanol.
G. Plankton samples are not treated further in this report.
372

1-3
H. Sediment samples were dry-sieved with a U.S. standard seive
series using a mechanical sorter or, for finer particle sizes,
wet seived in comparable seives. Particles of phi sizes -2 to
-4 were considered gravel. Phi sizes -1 to +3 were called course
sand. Fine sand was phi size +4, and smaller particles were
classified as mud. Sediment data are referred to below but will
be reported elsewhere.
Results
Salinity and temperature at each benthic station and characteriza-
tion of major substrate types are given in appended Table 1.1. Species of
all animals captured in the grabs and dredge are listed in appended Table
1.2. Data on animals taken in grabs are found in appended Tables 1.3 to
1.46. The catches of motile epibenthic organisms are summarized in ap-
pended Table 1.47.
Due possibly to rain and the resultant difficulty in keeping the
SCT meter dry, we sometimes found salinity and temperature readings to be
erratic. Those of questionable validity are marked with an asterisk in
Table 1.1
Discussion
Each transect was sampled at depths of approximately 5 and 10 m, and
some were continued shoreward to a 2 m sample. In order to test whether
there were important faunistic differences between these depths, the data
were grouped around three class intervals (2 - 3.5 m, 5 - 6 m, and 9 -
11.5 m) for comparison. The result of 3-way analyses of variance and,
where indicated, Newman-Keuls multiple range tests, are given in Table
1.48. What differences are revealed by these tests do not support the
notion of depth-dependent, faunistic differences. Instead, it is most
reasonable to accept a general notion of patchy uniformity in the 2 - 10 m
depth region of the Beaufort shelf of Alaska.
When the infaunal data are grouped by depth intervals, the variances
of sample populations are high, and standard deviations are usually larger
than sample means. Ranges of both biomass and number of animals grouped
373

1-4
Table 1.48. ANOVAs of Smith-McIntyre grab samples made at three depthintervals: 2 = 2-3.5m; 5 = 5-6m; 10 - 9-11.5m (See Table 1.1 for depthat each station). For each analysis there are 122 degrees of freedomwithin the three populations, and 2 between them. Where F values indi-cate that the three samples were not from a single population (p < 0.05),a Newman-Keuls multiple range test was run to identify differences.
by taxonomic category are great at all depths. In a few instances adjacent
samples made at the same station differ from one another by orders of mag-
nitude. In general, the variation between biomass samples at single sta-
tions exceeds that between numbers of animals. These differences may be
attributed in part to large individuals which, although not numerous,
account for sometimes large portions of biomass samples. Noteworthy are
the polychaetes Arenicola glacialis and Sternaspis scutata, the isopod
Saduria entomon, and the bivalves Astarte borealis, Macoma loveni, and
Macoma calcarea. Grabs do not always penetrate uniformly due to substrate
differences, and substrates do not accommodate the same populations of
animals. Still, despite these inherent sampling errors, the data indicate
a patchy distribution of animals in the inshore zone of the Beaufort Sea.
Of the 44 benthic stations sampled for infauna, 32 have peat in the
substratum, and 12 did not (see Table 1.1). Not only was peat not noted
on board ship at these 12 stations, it was not found in the material
374

1-5
returned to our laboratory. There are fewer total animals and smaller
biomass, and comparable differences in both polychaetes and bivalve mol-
lusks and in the biomass of amphipods, in the no-peat stations as shown
in Table 1.49, but the significance of this may have less to do with the
peat than with other factors. Absence of peat from a station in a region
in which it usually is found, implies some reason why peat does not settle
or remain, and this rather than the lack of peat may affect the settling
of larvae or survival of infaunal species.
Table 1.49. ANOVA of Smith McIntyre grab samples made at stations wherepeat was found and at stations where peat was lacking. For each analy-sis there are 122 degrees of freedom within the two populations and 1 be-tween them. The 12 stations at which peat was lacking are indicated onTable 1.1.
Analysis of the peat-free stations shows that 6 are at depths of
2-3m, 3 at 5-6m and 3 at 9-10m. This represents 55% of the 2-3m stations
and much lower proportions (19 and 18% respectively) of the intermediate
and deeper stations, but it does not relate the lack of peat to depth
alone. At the stations where peat was not found, bottom sediments were
taken. Nine had less than 4% mud (phi size < + 4), but two had more than
50% (54 and 56%) mud. Of the 32 stations where peat was found, one was
not sampled for substrate analysis; 18 had more than 50% mud (average
77.2%), 10 had from 8 to 48% mud (average 28.4%), and 3 had only 1 to 3%
375

1-6
mud). The species most abundant at the stations where peat was not found
were essentially the same as those found elsewhere.
Tables 1.3 to 1.46 list the infaunal species considered most abun-
dant at each station. A species was included if it were present in a
quantity equal to either 1 gram of wet weight per m2 or 100 individuals
per m² in at least one sample. This evaluation, therefore, is a subjec-
tive one, but results in listing species that may be numerous but individ-
ually small and those that are large but occur less often. Clearly, the
characteristic infaunal organisms of the Beaufort inshore region are poly-
chaetes and bivalves. Those polychaetes that were most frequently en-
countered in a sequence of roughly declining abundance are: Prionospio
cirrifera, Tharyx spp., Chone sp., Terebellides stroemi, Ampharete vega,
Scolecolipides arctius, Melanis loveni, Spio filicornis, Praxillella
praetermissa, Scoloplos armiger, Sternaspis scutata, Nephtys caeca, and
Sphaerodoropsis minuta. The most abundant bivalves, again in a descending
sequence of frequency of appearance in the tables, are: Portlandia
arctica, Liocyma fluctuosa, Portlandia intermedia, Boreacola vadosa,
Macoma loveni, Macoma calcarea, Cytodaria kurriana, Astarte borealis,
and Axinopsida orbiculata. These polychaete and bivalve species comprise
most of the characteristic, infaunal benthos of the Beaufort inshore zone.
We have been unable to detect variations in the composition of this
characteristic fauna with depth, presence or absence of peat, or substrate
type. In stations nearest beaches, bivalves usually are absent, possibly
because the stress of ice gouging is too great, and there appears to be
an increase in bivalve biomass with increasing depth, but our data do not
support this statistically.
Previously, we have reported that the numerous (although individually
very small) enchytraeid worms found in the nearshore zone do not occur in
the inshore region. Our Tables 1.3 to 1.46 show Oligochaetes in several
of our 5 and 10 m stations. With the exception of station C1B, at the
eastern extremity of our sampling and possibly under some influence from
the MacKenzie River, all of these oligochaetes are tubificids instead of
enchytraeids.
The motile, epibenthic fauna of the Beaufort inshore region as re-
vealed by sampling with a small epibenthic sled net with 1.05mm mesh
376

1-7
is summarized in Table 1.47. In every instance some usually very minor
part of the catch is not listed because the unlisted animals were gener-
ally insignificant in number and in biomass but included a large variety
of animals that would have made the species column needlessly long. Most
of these animals were polychaetes or other infaunal organisms that indi-
cated that the net, instead of sliding along the bottom on its runners,
sometimes was digging in. This was particularly evident at stations with
especially soft substrates. The efficiency of the net in sampling epi-
benthic organisms, therefore, varied with firmness of the bottom. Divers
have noted avoidance of nets of this type by mysids and other crustaceans 3
which is also reason to question whether catches reported are always com-
parable to quantities otherwise sampled or even to other samples made with
the same gear.
With these qualifications, it is still evident that the epibenthic
fauna of the Beaufort inshore region consists of, in a sequence of de-
creasing abundance: Mysis littoralis; several species of amphipods, es-
pecially Acanthostepheia behringiensis, Onisimus glacialis, Rozinante
fragilis, Gammarus zaddachi, Boekosimus affinis and B. plautus, Monocu-
lopsis longicornis, Monoculodes sp., Apherusa megalops and A. glacialis,
Halirages sp., Weyprechtia pinguis, Acanthostepheia incarinata, and
Gammaracanthus loricatus; Mysis relicta; Saduria entomon; Colanus hyper-
boreus; and Thysanoessa raschii. All are crustaceans. Gammarus setosa
and Onisimus litoralis, probably the most abundant epibenthic crustaceans
of the nearshore zone, were less numerous in our samples from the inshore
region than the species named above. Parathemisto libellula, while pres-
ent, was not abundant, but this may reflect the efficiency of a net fish-
ing near the bottom instead of the actual abundance of this important
food species.
Finally, six of the stations sampled in 1977 also were sampled in
1976. A comparison of these stations for the two years is given in Table
1.50. At these six stations, and generally otherwise in 1977, amphipods
accounted for a smaller proportion of the benthic infaunal biota than
was so in 1976. In both years, polychaetes and bivalves were the more
consistent infaunal elements with both showing usually a higher propor-
tion of totals in 1977.
377

Table 1.50. Comparison of infaunal benthos at six Beaufort Sea inshore stations sampled in 1976 and1977. Data are in percent of total for both number/m² and wet weight biomass/m².

1-9
NOTES
In our prior reports we have referred to the region from 2 to 5 m
deep as "nearshore" and have used "littoral" for depths of less than 2 m.
More recently (see Weller, G. et al., 1978. Environmental Assessment of
the Alaskan Continental Shelf: Interim Synthesis: Beaufort/Chukchi.
N.O.A.A. Environmental Research Laboratories, Boulder, Colorado, August,
1978) a convention has been adopted by OCSEAP workers that synonomizes
"nearshore" and "littoral" as we formerly used the word.
Broad, A. C., et al., 1978. In: Environmental Assessment of the
Alaskan Continental Shelf. Annual Reports of Principal Investigators
for the year ending March, 1978. N.O.A.A., Outer Continental Shelf En-
vironmental Assessment Program, Boulder, Colorado. In press.
3 Weller, G. et al., 1 c.
379

Table 1.1. Summary of Benthic and Related Samplesmade by RU356 from ALUMIAK, 1977

Table 1.1 Continued

Table 1.2. Animal species captured in bottom grabs and sled nets (see textfor description of equipment) at Beaufort Sea stations between 2 and 11.5mdeep from R/V ALUMIAK, 1977. Unk. after a family name or the name of ahigher taxon implies unknown member(s) of that family or group. The sequenceof species in the table is that of the NODC taxonomic code.
382
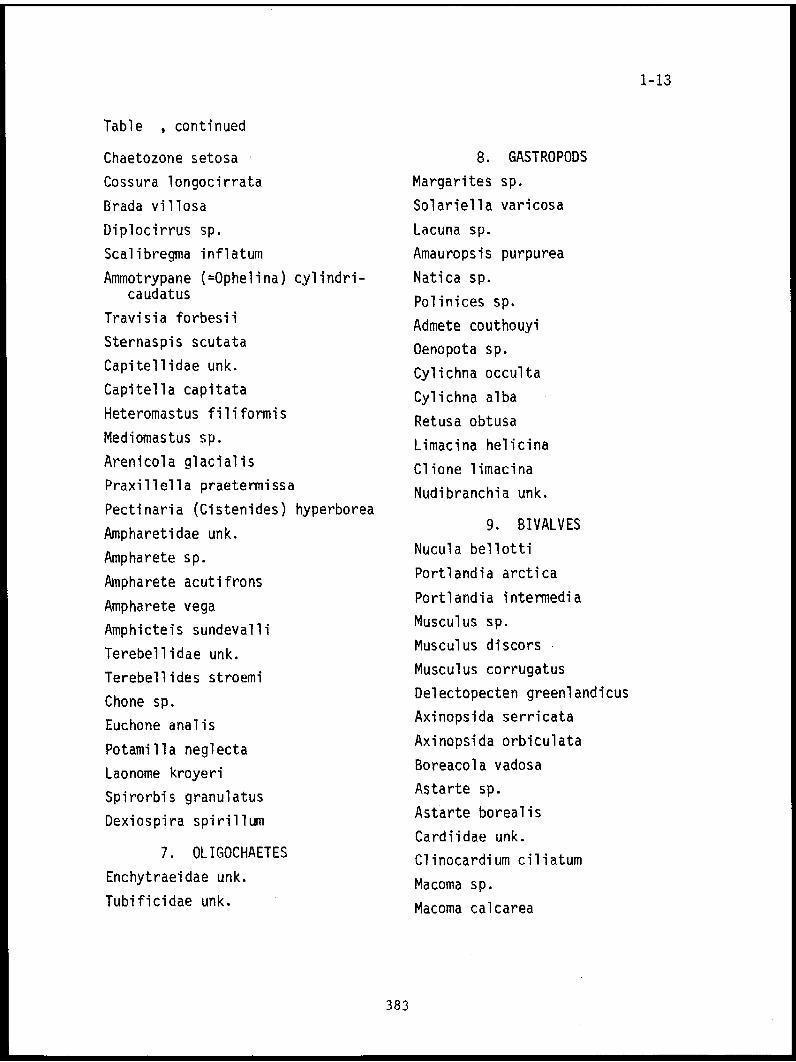
Table , continued
383

Table , continued
384
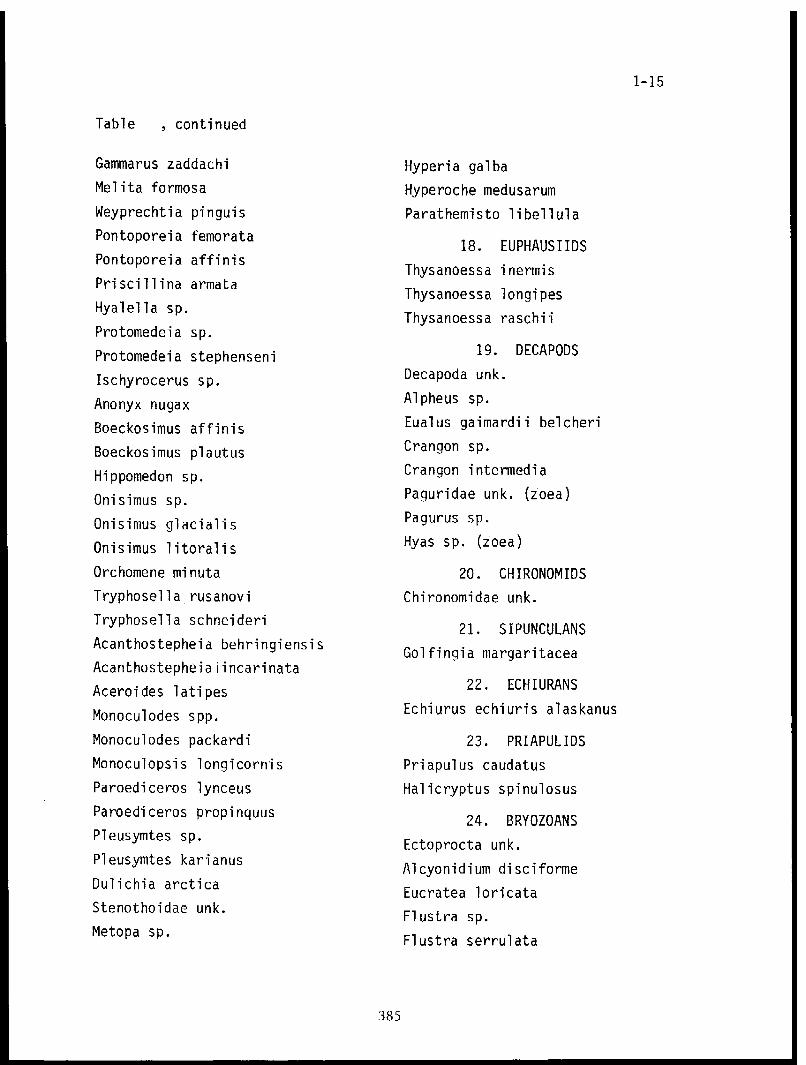
Table , continued
385

Table , continued
386

TABLE 1.3. WET WEIGHT BIOMASS AND NUMBER OF INDIVIDUALS OF SIX CATEGORIES OFMACROBENTHONIC ANIMALS PER m2 AT STATION C1A (70°08.1'N, 143°11.4'W, 3.5 m,depth) IN AUGUST, 1977. DATA ARE DERIVED FROM CATCH OF O.lm 2 SMITH-MCINTYREGRAB SCREENED THROUGH 0.423mm NITEX. PRINCIPAL SPECIES ARE THOSE REPRESENTEDBY EITHER 1.Og OF WET WEIGHT BIOMASS OR 100 INDIVIDUALS PER m2 IN AT LEAST ONESAMPLE. IF FOLLOWED BY !, THE SPECIES ACCOUNTED FOR VIRTUALLY ALL OF THE NUM-BER OR MASS OF THAT TAXONOMIC CATEGORY IN AT LEAST ONE SAMPLE.
387

TABLE 1.4. WET WEIGHT BIOMASS AND NUMBER OF INDIVIDUALS OF SIX CATEGORIES OFMACROBENTHONIC ANIMALS PER m² AT STATION C1B (70°09.4'N, 143°08.4'W, 10 m,depth) IN AUGUST, 1977. DATA ARE DERIVED FROM CATCH OF O.lm 2 SMITH-MCINTYREGRAB SCREENED THROUGH 0.423mm NITEX. PRINCIPAL SPECIES ARE THOSE REPRESENTEDBY EITHER 1.Og OF WET WEIGHT BIOMASS OR 100 INDIVIDUALS PER m2 IN AT LEAST ONESAMPLE. IF FOLLOWED BY !, THE SPECIES ACCOUNTED FOR VIRTUALLY ALL OF THE NUM-BER OR MASS OF THAT TAXONOMIC CATEGORY IN AT LEAST ONE SAMPLE.
388

TABLE 1.5. WET WEIGHT BIOMASS AND NUMBER OF INDIVIDUALS OF SIX CATEGORIES OFMACROBENTHONIC ANIMALS PER m² AT STATION C4F (70°08.3'N, 143°41.0'W, 5 m,depth) IN AUGUST, 1977. DATA ARE DERIVED FROM CATCH OF O.lm 2 SMITH-MCINTYREGRAB SCREENED THROUGH 0.423mm NITEX. PRINCIPAL SPECIES ARE THOSE REPRESENTEDBY EITHER 1.Og OF WET WEIGHT BIOMASS OR 100 INDIVIDUALS PER m² IN AT LEAST ONESAMPLE. IF FOLLOWED BY !, THE SPECIES ACCOUNTED FOR VIRTUALLY ALL OF THE NUM-BER OR MASS OF THAT TAXONOMIC CATEGORY IN AT LEAST ONE SAMPLE.
389

TABLE 1.6. WET WEIGHT BIOMASS AND NUMBER OF INDIVIDUALS OF SIX CATEGORIES OF
MACROBENTHONIC ANIMALS PER m² AT STATION C4G (70°09.0'N, 143°41.0'W, 10 m,depth) IN AUGUST, 1977. DATA ARE DERIVED FROM CATCH OF O.lm² SMITH-MCINTYREGRAB SCREENED THROUGH 0.423mm NITEX. PRINCIPAL SPECIES ARE THOSE REPRESENTEDBY EITHER 1.0g OF WET WEIGHT BIOMASS OR 100 INDIVIDUALS PER m² IN AT LEAST ONESAMPLE. IF FOLLOWED BY !, THE SPECIES ACCOUNTED FOR VIRTUALLY ALL OF THE NUM-BER OR MASS OF THAT TAXONOMIC CATEGORY IN AT LEAST ONE SAMPLE.
390

TABLE 1.7. WET WEIGHT BIOMASS AND NUMBER OF INDIVIDUALS OF SIX CATEGORIES OFMACROBENTHONIC ANIMALS PER m² AT STATION DØA (70°05.7'N, 144°05.0'W, 5 m,depth) IN AUGUST, 1977. DATA ARE DERIVED FROM CATCH OF O.lm 2 SMITH-MCINTYREGRAB SCREENED THROUGH 0.423mm NITEX. PRINCIPAL SPECIES ARE THOSE REPRESENTEDBY EITHER 1.Og OF WET WEIGHT BIOMASS OR 100 INDIVIDUALS PER m² IN AT LEAST ONESAMPLE. IF FOLLOWED BY !, THE SPECIES ACCOUNTED FOR VIRTUALLY ALL OF THE NUM-BER OR MASS OF THAT TAXONOMIC CATEGORY IN AT LEAST ONE SAMPLE.
391

TABLE 1.8. WET WEIGHT BIOMASS AND NUMBER OF INDIVIDUALS OF SIX CATEGORIES OFMACROBENTHONIC ANIMALS PER m² AT STATION DOB (70°07.5'N, 144°05.0'W, 10 m,depth) IN AUGUST, 1977. DATA ARE DERIVED FROM CATCH OF O.lm² SMITH-MCINTYREGRAB SCREENED THROUGH 0.423mm NITEX. PRINCIPAL SPECIES ARE THOSE REPRESENTEDBY EITHER 1.Og OF WET WEIGHT BIOMASS OR 100 INDIVIDUALS PER m² IN AT LEAST ONESAMPLE. IF FOLLOWED BY !, THE SPECIES ACCOUNTED FOR VIRTUALLY ALL OF THE NUM-BER OR MASS OF THAT TAXONOMIC CATEGORY IN AT LEAST ONE SAMPLE.
392

TABLE 1.9. WET WEIGHT BIOMASS AND NUMBER OF INDIVIDUALS OF SIX CATEGORIES OFMACROBENTHONIC ANIMALS PER m² AT STATION D5A (70°00.4'N, 144°54.4'W, 5 m,depth) IN AUGUST, 1977. DATA ARE DERIVED FROM CATCH OF O.lm² SMITH-MCINTYREGRAB SCREENED THROUGH 0.423mm NITEX. PRINCIPAL SPECIES ARE THOSE REPRESENTEDBY EITHER 1.Og OF WET WEIGHT BIOMASS OR 100 INDIVIDUALS PER m² IN AT LEAST ONESAMPLE. IF FOLLOWED BY !, THE SPECIES ACCOUNTED FOR VIRTUALLY ALL OF THE NUM-BER OR MASS OF THAT TAXONOMIC CATEGORY IN AT LEAST ONE SAMPLE.
393
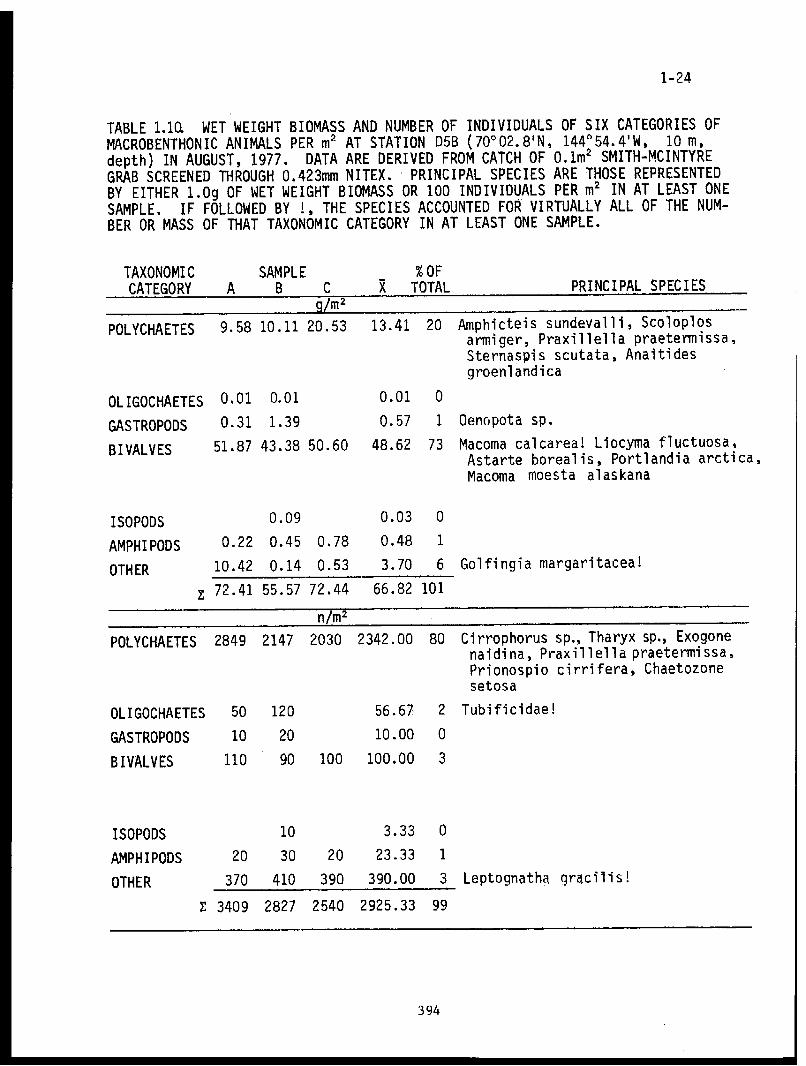
TABLE 1.10. WET WEIGHT BIOMASS AND NUMBER OF INDIVIDUALS OF SIX CATEGORIES OFMACROBENTHONIC ANIMALS PER m² AT STATION D5B (70°02.8'N, 144°54.4'W, 10 m,depth) IN AUGUST, 1977. DATA ARE DERIVED FROM CATCH OF O.lm² SMITH-MCINTYREGRAB SCREENED THROUGH 0.423mm NITEX. PRINCIPAL SPECIES ARE THOSE REPRESENTEDBY EITHER 1.0g OF WET WEIGHT BIOMASS OR 100 INDIVIDUALS PER m² IN AT LEAST ONESAMPLE. IF FOLLOWED BY !, THE SPECIES ACCOUNTED FOR VIRTUALLY ALL OF THE NUM-BER OR MASS OF THAT TAXONOMIC CATEGORY IN AT LEAST ONE SAMPLE.
394
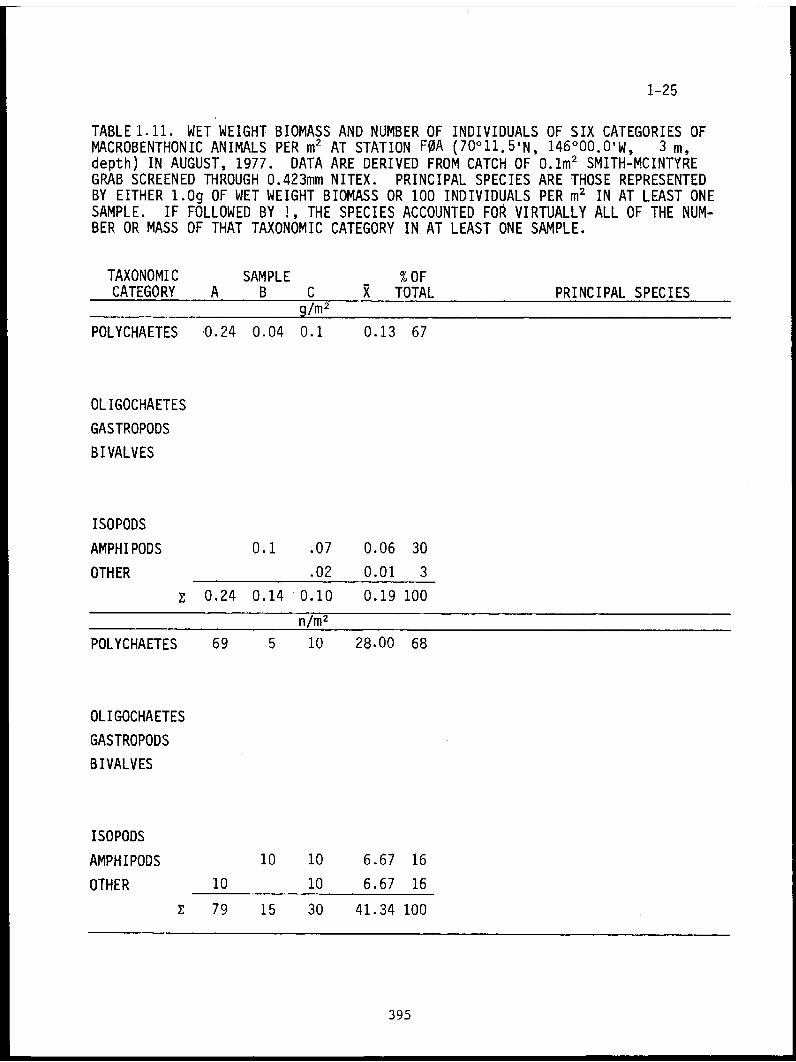
TABLE 1.11. WET WEIGHT BIOMASS AND NUMBER OF INDIVIDUALS OF SIX CATEGORIES OFMACROBENTHONIC ANIMALS PER m² AT STATION F0A (70°11.5'N, 146°00.0'W, 3 m,depth) IN AUGUST, 1977. DATA ARE DERIVED FROM CATCH OF O.lm² SMITH-MCINTYREGRAB SCREENED THROUGH 0.423mm NITEX. PRINCIPAL SPECIES ARE THOSE REPRESENTEDBY EITHER 1.Og OF WET WEIGHT BIOMASS OR 100 INDIVIDUALS PER m² IN AT LEAST ONESAMPLE. IF FOLLOWED BY !, THE SPECIES ACCOUNTED FOR VIRTUALLY ALL OF THE NUM-BER OR MASS OF THAT TAXONOMIC CATEGORY IN AT LEAST ONE SAMPLE.
395

TABLE 1.12. WET WEIGHT BIOMASS AND NUMBER OF INDIVIDUALS OF SIX CATEGORIES OFMACROBENTHONIC ANIMALS PER m² AT STATION FØB (70°11.6'N, 146°00.0'W, 5 m,depth) IN AUGUST, 1977. DATA ARE DERIVED FROM CATCH OF O.lm² SMITH-MCINTYREGRAB SCREENED THROUGH 0.423mm NITEX. PRINCIPAL SPECIES ARE THOSE REPRESENTEDBY EITHER 1.0g OF WET WEIGHT BIOMASS OR 100 INDIVIDUALS PER m² IN AT LEAST ONESAMPLE. IF FOLLOWED BY !, THE SPECIES ACCOUNTED FOR VIRTUALLY ALL OF THE NUM-BER OR MASS OF THAT TAXONOMIC CATEGORY IN AT LEAST ONE SAMPLE.
396

TABLE 1.13. WET WEIGHT BIOMASS AND NUMBER OF INDIVIDUALS OF SIX CATEGORIES OFMACROBENTHONIC ANIMALS PER m² AT STATION FØC (70°12.4'N, 146°00.0'W, 10 m,depth) IN AUGUST, 1977. DATA ARE DERIVED FROM CATCH OF O.lm² SMITH-MCINTYREGRAB SCREENED THROUGH 0.423mm NITEX. PRINCIPAL SPECIES ARE THOSE REPRESENTEDBY EITHER 1.Og OF WET WEIGHT BIOMASS OR 100 INDIVIDUALS PER m² IN AT LEAST ONESAMPLE. IF FOLLOWED BY !, THE SPECIES ACCOUNTED FOR VIRTUALLY ALL OF THE NUM-BER OR MASS OF THAT TAXONOMIC CATEGORY IN AT LEAST ONE SAMPLE.
397

TABLE 1.14. WET WEIGHT BIOMASS AND NUMBER OF INDIVIDUALS OF SIX CATEGORIES OFMACROBENTHONIC ANIMALS PER m² AT STATION G3B (70°13.6'N, 147°36.8'W, 2 m,depth) IN AUGUST, 1977. DATA ARE DERIVED FROM CATCH OF O.lm² SMITH-MCINTYREGRAB SCREENED THROUGH 0.423mm NITEX. PRINCIPAL SPECIES ARE THOSE REPRESENTEDBY EITHER 1.Og OF WET WEIGHT BIOMASS OR 100 INDIVIDUALS PER m² IN AT LEAST ONESAMPLE. IF FOLLOWED BY !, THE SPECIES ACCOUNTED FOR VIRTUALLY ALL OF THE NUM-BER OR MASS OF THAT TAXONOMIC CATEGORY IN AT LEAST ONE SAMPLE.
398

TABLE 1.15. WET WEIGHT BIOMASS AND NUMBER OF INDIVIDUALS OF SIX CATEGORIES OFMACROBENTHONIC ANIMALS PER m² AT STATION G3C (70°16.0'N, 147°38.0'W, 5 m,depth) IN AUGUST, 1977. DATA ARE DERIVED FROM CATCH OF O.lm² SMITH-MCINTYREGRAB SCREENED THROUGH 0.423mm NITEX. PRINCIPAL SPECIES ARE THOSE REPRESENTEDBY EITHER 1.Og OF WET WEIGHT BIOMASS OR 100 INDIVIDUALS PER m² IN AT LEAST ONESAMPLE. IF FOLLOWED BY !, THE SPECIES ACCOUNTED FOR VIRTUALLY ALL OF THE NUM-BER OR MASS OF THAT TAXONOMIC CATEGORY IN AT LEAST ONE SAMPLE.
399

TABLE 1.16. WET WEIGHT BIOMASS AND NUMBER OF INDIVIDUALS OF SIX CATEGORIES OFMACROBENTHONIC ANIMALS PER m² AT STATION G3D (70°24.8'N, 147°35.6'W, 9 m,depth) IN AUGUST, 1977. DATA ARE DERIVED FROM CATCH OF O.lm² SMITH-MCINTYREGRAB SCREENED THROUGH 0.423mm NITEX. PRINCIPAL SPECIES ARE THOSE REPRESENTEDBY EITHER 1.Og OF WET WEIGHT BIOMASS OR 100 INDIVIDUALS PER m² IN AT LEAST ONESAMPLE. IF FOLLOWED BY !, THE SPECIES ACCOUNTED FOR VIRTUALLY ALL OF THE NUM-BER OR MASS OF THAT TAXONOMIC CATEGORY IN AT LEAST ONE SAMPLE.
400
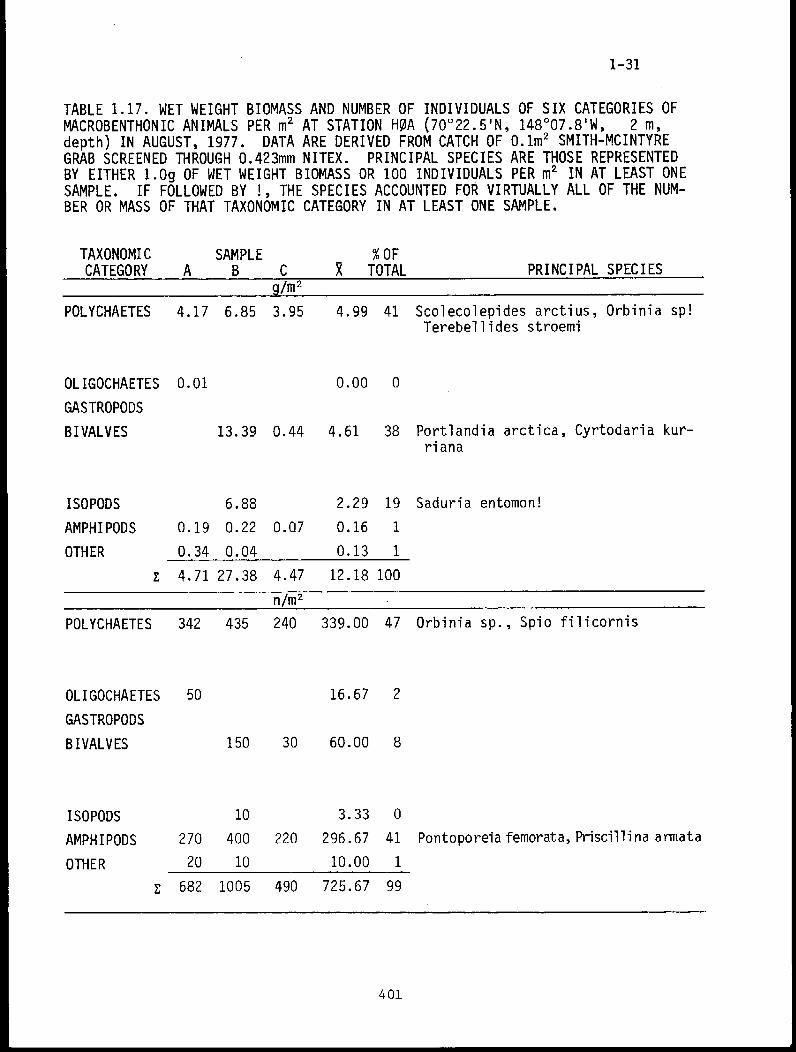
TABLE 1.17. WET WEIGHT BIOMASS AND NUMBER OF INDIVIDUALS OF SIX CATEGORIES OFMACROBENTHONIC ANIMALS PER m² AT STATION HØA (70°22.5'N, 148°07.8'W, 2 m,depth) IN AUGUST, 1977. DATA ARE DERIVED FROM CATCH OF O.lm² SMITH-MCINTYREGRAB SCREENED THROUGH 0.423mm NITEX. PRINCIPAL SPECIES ARE THOSE REPRESENTEDBY EITHER 1.Og OF WET WEIGHT BIOMASS OR 100 INDIVIDUALS PER m² IN AT LEAST ONESAMPLE. IF FOLLOWED BY !, THE SPECIES ACCOUNTED FOR VIRTUALLY ALL OF THE NUM-BER OR MASS OF THAT TAXONOMIC CATEGORY IN AT LEAST ONE SAMPLE.
401

TABLE 1.18. WET WEIGHT BIOMASS AND NUMBER OF INDIVIDUALS OF SIX CATEGORIES OFMACROBENTHONIC ANIMALS PER m² AT STATION HOB (70°24.3'N, 148°06.6'W, 5 m,depth) IN AUGUST, 1977. DATA ARE DERIVED FROM CATCH OF O.lm² SMITH-MCINTYREGRAB SCREENED THROUGH 0.423mm NITEX. PRINCIPAL SPECIES ARE THOSE REPRESENTEDBY EITHER 1.Og OF WET WEIGHT BIOMASS OR 100 INDIVIDUALS PER m² IN AT LEAST ONESAMPLE. IF FOLLOWED BY !, THE SPECIES ACCOUNTED FOR VIRTUALLY ALL OF THE NUM-BER OR MASS OF THAT TAXONOMIC CATEGORY IN AT LEAST ONE SAMPLE.
402

TABLE 1.19. WET WEIGHT BIOMASS AND NUMBER OF INDIVIDUALS OF SIX CATEGORIES OFMACROBENTHONIC ANIMALS PER m² AT STATION HOC (70°29.8'N, 148°01.2'W, 10 m,depth) IN AUGUST, 1977. DATA ARE DERIVED FROM CATCH OF O.lm² SMITH-MCINTYREGRAB SCREENED THROUGH 0.423mm NITEX. PRINCIPAL SPECIES ARE THOSE REPRESENTEDBY EITHER 1.0g OF WET WEIGHT BIOMASS OR 100 INDIVIDUALS PER m² IN AT LEAST ONESAMPLE. IF FOLLOWED BY !, THE SPECIES ACCOUNTED FOR VIRTUALLY ALL OF THE NUM-BER OR MASS OF THAT TAXONOMIC CATEGORY IN AT LEAST ONE SAMPLE.
403

TABLE 1.20. WET WEIGHT BIOMASS AND NUMBER OF INDIVIDUALS OF SIX CATEGORIES OFMACROBENTHONIC ANIMALS PER m² AT STATION H3B (70°24.0'N, 148°32.4'W, 2 m,depth) IN AUGUST, 1977. DATA ARE DERIVED FROM CATCH OF O.lm² SMITH-MCINTYREGRAB SCREENED THROUGH 0.423mm NITEX. PRINCIPAL SPECIES ARE THOSE REPRESENTEDBY EITHER 1.Og OF WET WEIGHT BIOMASS OR 100 INDIVIDUALS PER m² IN AT LEAST ONESAMPLE. IF FOLLOWED BY !, THE SPECIES ACCOUNTED FOR VIRTUALLY ALL OF THE NUM-BER OR MASS OF THAT TAXONOMIC CATEGORY IN AT LEAST ONE SAMPLE.
404

TABLE 1.21. WET WEIGHT BIOMASS AND NUMBER OF INDIVIDUALS OF SIX CATEGORIES OFMACROBENTHONIC ANIMALS PER m² AT STATION H3G (70°25.7'N, 148°32.4'W, 5 m,depth) IN AUGUST, 1977. DATA ARE DERIVED FROM CATCH OF O.lm² SMITH-MCINTYREGRAB SCREENED THROUGH 0.423mm NITEX. PRINCIPAL SPECIES ARE THOSE REPRESENTEDBY EITHER 1.Og OF WET WEIGHT BIOMASS OR 100 INDIVIDUALS PER m² IN AT LEAST ONESAMPLE. IF FOLLOWED BY !, THE SPECIES ACCOUNTED FOR VIRTUALLY ALL OF THE NUM-BER OR MASS OF THAT TAXONOMIC CATEGORY IN AT LEAST ONE SAMPLE.
405

TABLE 1.22. WET WEIGHT BIOMASS AND NUMBER OF INDIVIDUALS OF SIX CATEGORIES OF
MACROBENTHONIC ANIMALS PER m² AT STATION H3H (70°30.2'N, 148°32.4'W, 11 m,depth) IN AUGUST, 1977. DATA ARE DERIVED FROM CATCH OF O.lm² SMITH-MCINTYREGRAB SCREENED THROUGH 0.423mm NITEX. PRINCIPAL SPECIES ARE THOSE REPRESENTEDBY EITHER 1.Og OF WET WEIGHT BIOMASS OR 100 INDIVIDUALS PER m² IN AT LEAST ONE
SAMPLE. IF FOLLOWED BY !, THE SPECIES ACCOUNTED FOR VIRTUALLY ALL OF THE NUM-
BER OR MASS OF THAT TAXONOMIC CATEGORY IN AT LEAST ONE SAMPLE.
406

TABLE 1.23. WET WEIGHT BIOMASS AND NUMBER OF INDIVIDUALS OF SIX CATEGORIES OFMACROBENTHONIC ANIMALS PER m² AT STATION 13G (70°34.5'N, 149°30.0'W, 10 m,depth) IN AUGUST, 1977. DATA ARE DERIVED FROM CATCH OF O.lm² SMITH-MCINTYREGRAB SCREENED THROUGH 0.423mm NITEX. PRINCIPAL SPECIES ARE THOSE REPRESENTEDBY EITHER 1.Og OF WET WEIGHT BIOMASS OR 100 INDIVIDUALS PER m² IN AT LEAST ONESAMPLE. IF FOLLOWED BY !, THE SPECIES ACCOUNTED FOR VIRTUALLY ALL OF THE NUM-BER OR MASS OF THAT TAXONOMIC CATEGORY IN AT LEAST ONE SAMPLE.
407

TABLE 1.24. WET WEIGHT BIOMASS AND NUMBER OF INDIVIDUALS OF SIX CATEGORIES OFMACROBENTHONIC ANIMALS PER m² AT STATION I3H (70°33.8'N, 149°30.0'W, 5 m,depth) IN AUGUST, 1977. DATA ARE DERIVED FROM CATCH OF O.1m² SMITH-MCINTYREGRAB SCREENED THROUGH 0.423mm NITEX. PRINCIPAL SPECIES ARE THOSE REPRESENTEDBY EITHER 1.0g OF WET WEIGHT BIOMASS OR 100 INDIVIDUALS PER m² IN AT LEAST ONESAMPLE. IF FOLLOWED BY !, THE SPECIES ACCOUNTED FOR VIRTUALLY ALL OF THE NUM-BER OR MASS OF THAT TAXONOMIC CATEGORY IN AT LEAST ONE SAMPLE.
408

TABLE 1.25. WET WEIGHT BIOMASS AND NUMBER OF INDIVIDUALS OF SIX CATEGORIES OFMACROBENTHONIC ANIMALS PER m² AT STATION J2A (70°32.7'N, 150°25.0'W, 2 m,depth) IN AUGUST, 1977. DATA ARE DERIVED FROM CATCH OF O.lm² SMITH-MCINTYREGRAB SCREENED THROUGH 0.423mm NITEX. PRINCIPAL SPECIES ARE THOSE REPRESENTEDBY EITHER 1.Og OF WET WEIGHT BIOMASS OR 100 INDIVIDUALS PER m² IN AT LEAST ONESAMPLE. IF FOLLOWED BY !, THE SPECIES ACCOUNTED FOR VIRTUALLY ALL OF THE NUM-BER OR MASS OF THAT TAXONOMIC CATEGORY IN AT LEAST ONE SAMPLE.
409

TABLE 1.26 WET WEIGHT BIOMASS AND NUMBER OF INDIVIDUALS OF SIX CATEGORIES OF
MACROBENTHONIC ANIMALS PER m² AT STATION J2B (70°33.5'N, 150°25.0'W, 5 m,depth) IN AUGUST, 1977. DATA ARE DERIVED FROM CATCH OF O.lm² SMITH-MCINTYRE
GRAB SCREENED THROUGH 0.423mm NITEX. PRINCIPAL SPECIES ARE THOSE REPRESENTEDBY EITHER 1.Og OF WET WEIGHT BIOMASS OR 100 INDIVIDUALS PER m² IN AT LEAST ONE
SAMPLE. IF FOLLOWED BY !, THE SPECIES ACCOUNTED FOR VIRTUALLY ALL OF THE NUM-BER OR MASS OF THAT TAXONOMIC CATEGORY IN AT LEAST ONE SAMPLE.
410

TABLE 1.27. WET WEIGHT BIOMASS AND NUMBER OF INDIVIDUALS OF SIX CATEGORIES OFMACROBENTHONIC ANIMALS PER m² AT STATION J2C (70°35.5'N, 150°25.0'W, 10 m,depth) IN AUGUST, 1977. DATA ARE DERIVED FROM CATCH OF O.lm² SMITH-MCINTYREGRAB SCREENED THROUGH 0.423mm NITEX. PRINCIPAL SPECIES ARE THOSE REPRESENTEDBY EITHER 1.0g OF WET WEIGHT BIOMASS OR 100 INDIVIDUALS PER m² IN AT LEAST ONESAMPLE. IF FOLLOWED BY !, THE SPECIES ACCOUNTED FOR VIRTUALLY ALL OF THE NUM-BER OR MASS OF THAT TAXONOMIC CATEGORY IN AT LEAST ONE SAMPLE.
411

TABLE 1.28. WET WEIGHT BIOMASS AND NUMBER OF INDIVIDUALS OF SIX CATEGORIES OFMACROBENTHONIC ANIMALS PER m² AT STATION K2A (70°39.2'N, 151°27.2'W, 10 m,depth) IN AUGUST, 1977. DATA ARE DERIVED FROM CATCH OF O.1m² SMITH-MCINTYREGRAB SCREENED THROUGH 0.423mm NITEX. PRINCIPAL SPECIES ARE THOSE REPRESENTEDBY EITHER 1.Og OF WET WEIGHT BIOMASS OR 100 INDIVIDUALS PER m² IN AT LEAST ONESAMPLE. IF FOLLOWED BY !, THE SPECIES ACCOUNTED FOR VIRTUALLY ALL OF THE NUM-BER OR MASS OF THAT TAXONOMIC CATEGORY IN AT LEAST ONE SAMPLE.
412

TABLE 1.29. WET WEIGHT BIOMASS AND NUMBER OF INDIVIDUALS OF SIX CATEGORIES OFMACROBENTHONIC ANIMALS PER m² AT STATION K3A (70°36.7'N, 151°33.5'W, 5 m,depth) IN AUGUST, 1977. DATA ARE DERIVED FROM CATCH OF O.1m² SMITH-MCINTYREGRAB SCREENED THROUGH 0.423mm NITEX. PRINCIPAL SPECIES ARE THOSE REPRESENTEDBY EITHER 1.Og OF WET WEIGHT BIOMASS OR 100 INDIVIDUALS PER m² IN AT LEAST ONESAMPLE. IF FOLLOWED BY !, THE SPECIES ACCOUNTED FOR VIRTUALLY ALL OF THE NUM-BER OR MASS OF THAT TAXONOMIC CATEGORY IN AT LEAST ONE SAMPLE.
413

TABLE 1.30. WET WEIGHT BIOMASS AND NUMBER OF INDIVIDUALS OF SIX CATEGORIES OFMACROBENTHONIC ANIMALS PER m² AT STATION K4A (70°34.0'N, 151°40.1'W, 2 m,depth) IN AUGUST, 1977. DATA ARE DERIVED FROM CATCH OF O.lm² SMITH-MCINTYREGRAB SCREENED THROUGH 0.423mm NITEX. PRINCIPAL SPECIES ARE THOSE REPRESENTEDBY EITHER 1.Og OF WET WEIGHT BIOMASS OR 100 INDIVIDUALS PER m² IN AT LEAST ONESAMPLE. IF FOLLOWED BY !, THE SPECIES ACCOUNTED FOR VIRTUALLY ALL OF THE NUM-BER OR MASS OF THAT TAXONOMIC CATEGORY IN AT LEAST ONE SAMPLE.
414

TABLE 1.31. WET WEIGHT BIOMASS AND NUMBER OF INDIVIDUALS OF SIX CATEGORIES OFMACROBENTHONIC ANIMALS PER m² AT STATION LØA (70°53.5'N, 152°08.7'W, 10 m,depth) IN AUGUST, 1977. DATA ARE DERIVED FROM CATCH OF O.lm² SMITH-MCINTYREGRAB SCREENED THROUGH 0.423mm NITEX. PRINCIPAL SPECIES ARE THOSE REPRESENTEDBY EITHER 1.Og OF WET WEIGHT BIOMASS OR 100 INDIVIDUALS PER m² IN AT LEAST ONESAMPLE. IF FOLLOWED BY !, THE SPECIES ACCOUNTED FOR VIRTUALLY ALL OF THE NUM-BER OR MASS OF THAT TAXONOMIC CATEGORY IN AT LEAST ONE SAMPLE.
415

TABLE 1.32. WET WEIGHT BIOMASS AND NUMBER OF INDIVIDUALS OF SIX CATEGORIES OFMACROBENTHONIC ANIMALS PER m² AT STATION L1A (70°50.8'N, 152°15.5'W, 2 m,depth) IN AUGUST, 1977. DATA ARE DERIVED FROM CATCH OF O.lm² SMITH-MCINTYREGRAB SCREENED THROUGH 0.423mm NITEX. PRINCIPAL SPECIES ARE THOSE REPRESENTEDBY EITHER 1.Og OF WET WEIGHT BIOMASS OR 100 INDIVIDUALS PER m² IN AT LEAST ONESAMPLE. IF FOLLOWED BY !, THE SPECIES ACCOUNTED FOR VIRTUALLY ALL OF THE NUM-BER OR MASS OF THAT TAXONOMIC CATEGORY IN AT LEAST ONE SAMPLE.
416

TABLE 1.33. WET WEIGHT BIOMASS AND NUMBER OF INDIVIDUALS OF SIX CATEGORIES OFMACROBENTHONIC ANIMALS PER m² AT STATION L1B (70°51.3'N, 152°14.0'W, 5 m,depth) IN AUGUST, 1977. DATA ARE DERIVED FROM CATCH OF O.lm² SMITH-MCINTYREGRAB SCREENED THROUGH 0.423mm NITEX. PRINCIPAL SPECIES ARE THOSE REPRESENTEDBY EITHER 1.0g OF WET WEIGHT BIOMASS OR 100 INDIVIDUALS PER m² IN AT LEAST ONESAMPLE. IF FOLLOWED BY !, THE SPECIES ACCOUNTED FOR VIRTUALLY ALL OF THE NUM-BER OR MASS OF THAT TAXONOMIC CATEGORY IN AT LEAST ONE SAMPLE.
417
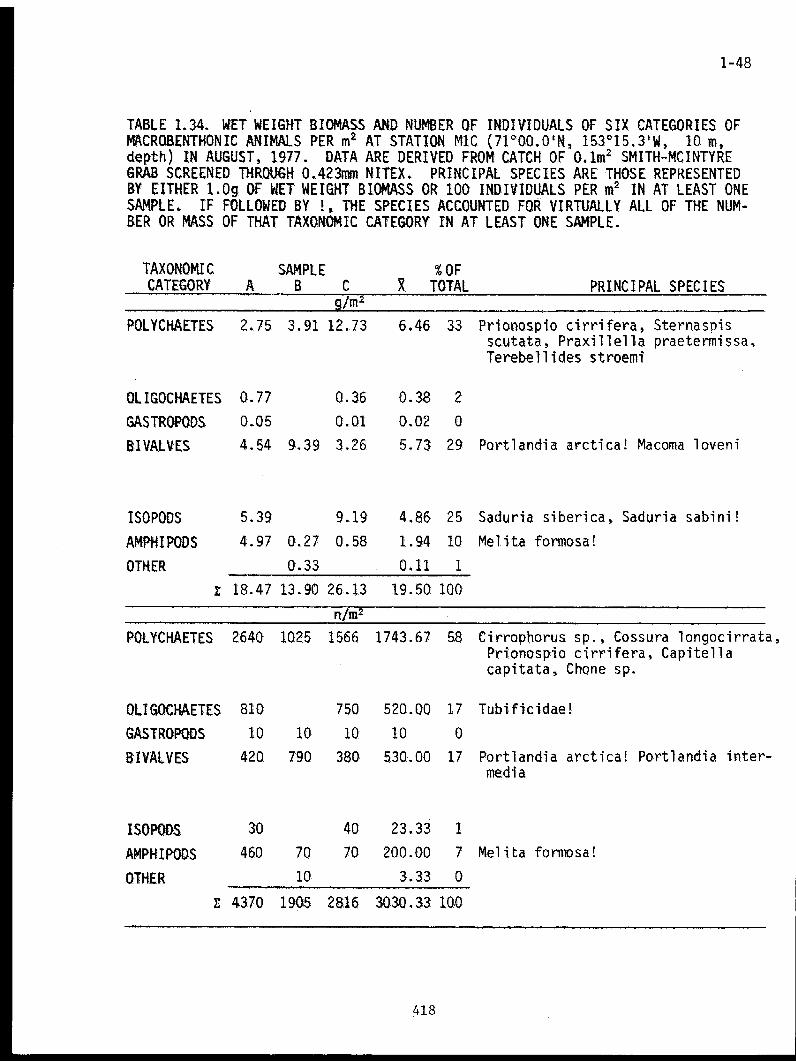
TABLE 1.34. WETWEEIGHT BIOMASS AND NUMBER OF INDIVIDUALS OF SIX CATEGORIES OFMACROBENTHONIC ANIMALS PER m² AT STATION M1C (71°00.0'N, 153°15.3'W, 10 m,depth) IN AUGUST, 1977. DATA ARE DERIVED FROM CATCH OF O.lm² SMITH-MCINTYREGRAB SCREENED THROUGH 0.423mm NITEX. PRINCIPAL SPECIES ARE THOSE REPRESENTEDBY EITHER 1.Og OF WET WEIGHT BIOMASS OR 100 INDIVIDUALS PER m² IN AT LEAST ONESAMPLE. IF FOLLOWED BY !, THE SPECIES ACCOUNTED FOR VIRTUALLY ALL OF THE NUM-BER OR MASS OF THAT TAXONOMIC CATEGORY IN AT LEAST ONE SAMPLE.
418

TABLE 1.35. WET WEIGHT BIOMASS AND NUMBER OF INDIVIDUALS OF SIX CATEGORIES OFMACROBENTHONIC ANIMALS PER m² AT STATION MID (70°56.6'N, 153°15.3'W, 5 m,depth) IN AUGUST, 1977. DATA ARE DERIVED FROM CATCH OF O.lm² SMITH-MCINTYREGRAB SCREENED THROUGH 0.423mm NITEX. PRINCIPAL SPECIES ARE THOSE REPRESENTEDBY EITHER 1.Og OF WET WEIGHT BIOMASS OR 100 INDIVIDUALS PER m² IN AT LEAST ONESAMPLE. IF FOLLOWED BY !, THE SPECIES ACCOUNTED FOR VIRTUALLY ALL OF THE NUM-BER OR MASS OF THAT TAXONOMIC CATEGORY IN AT LEAST ONE SAMPLE.
419

TABLE 1.36. WET WEIGHT BIOMASS AND NUMBER OF INDIVIDUALS OF SIX CATEGORIES OFMACROBENTHONIC ANIMALS PER m² AT STATION M1E (70°55.3'N, 153°15.3'W, 3 m,depth) IN AUGUST, 1977. DATA ARE DERIVED FROM CATCH OF O.lm² SMITH-MCINTYREGRAB SCREENED THROUGH 0.423mm NITEX. PRINCIPAL SPECIES ARE THOSE REPRESENTEDBY EITHER 1.Og OF WET WEIGHT BIOMASS OR 100 INDIVIDUALS PER m² IN AT LEAST ONESAMPLE. IF FOLLOWED BY !, THE SPECIES ACCOUNTED FOR VIRTUALLY ALL OF THE NUM-BER OR MASS OF THAT TAXONOMIC CATEGORY IN AT LEAST ONE SAMPLE.
420

TABLE 1.37. WET WEIGHT BIOMASS AND NUMBER OF INDIVIDUALS OF SIX CATEGORIES OFMACROBENTHONIC ANIMALS PER m² AT STATION N1A (70°55.2'N, 154°13.5'W, 5 m,depth) IN AUGUST, 1977. DATA ARE DERIVED FROM CATCH OF O.1m² SMITH-MCINTYREGRAB SCREENED THROUGH 0.423mm NITEX. PRINCIPAL SPECIES ARE THOSE REPRESENTEDBY EITHER 1.Og OF WET WEIGHT BIOMASS OR 100 INDIVIDUALS PER m² IN AT LEAST ONESAMPLE. IF FOLLOWED BY !, THE SPECIES ACCOUNTED FOR VIRTUALLY ALL OF THE NUM-BER OR MASS OF THAT TAXONOMIC CATEGORY IN AT LEAST ONE SAMPLE.
421

TABLE 1.38. WET WEIGHT BIOMASS AND NUMBER OF INDIVIDUALS OF SIX CATEGORIES OFMACROBENTHONIC ANIMALS PER m² AT STATION N1C (71°00.6'N, 154°10.5'W, 10 m,depth) IN AUGUST, 1977. DATA ARE DERIVED FROM CATCH OF O.lm² SMITH-MCINTYREGRAB SCREENED THROUGH 0.423mm NITEX. PRINCIPAL SPECIES ARE THOSE REPRESENTEDBY EITHER 1.Og OF WET WEIGHT BIOMASS OR 100 INDIVIDUALS PER m² IN AT LEAST ONESAMPLE. IF FOLLOWED BY !, THE SPECIES ACCOUNTED FOR VIRTUALLY ALL OF THE NUM-BER OR MASS OF THAT TAXONOMIC CATEGORY IN AT LEAST ONE SAMPLE.
422

TABLE 1.39. WET WEIGHT BIOMASS AND NUMBER OF INDIVIDUALS OF SIX CATEGORIES OFMACROBENTHONIC ANIMALS PER m² AT STATION N4A (71°04.O'N, 154°41.5'W, 5 m,depth) IN AUGUST, 1977. DATA ARE DERIVED FROM CATCH OF O.lm² SMITH-MCINTYREGRAB SCREENED THROUGH 0.423mm NITEX. PRINCIPAL SPECIES ARE THOSE REPRESENTEDBY EITHER 1.0g OF WET WEIGHT BIOMASS OR 100 INDIVIDUALS PER m² IN AT LEAST ONESAMPLE. IF FOLLOWED BY !, THE SPECIES ACCOUNTED FOR VIRTUALLY ALL OF THE NUM-BER OR MASS OF THAT TAXONOMIC CATEGORY IN AT LEAST ONE SAMPLE,
423

TABLE 1.40. WET WEIGHT BIOMASS AND NUMBER OF INDIVIDUALS OF SIX CATEGORIES OFMACROBENTHONIC ANIMALS PER m² AT STATION N4B (71°05.5'N, 154°35.7'W, 10 m,depth) IN AUGUST, 1977. DATA ARE DERIVED FROM CATCH OF O.lm² SMITH-MCINTYREGRAB SCREENED THROUGH 0.423mm NITEX. PRINCIPAL SPECIES ARE THOSE REPRESENTEDBY EITHER 1.0g OF WET WEIGHT BIOMASS OR 100 INDIVIDUALS PER m² IN AT LEAST ONESAMPLE. IF FOLLOWED BY !, THE SPECIES ACCOUNTED FOR VIRTUALLY ALL OF THE NUM-BER OR MASS OF THAT TAXONOMIC CATEGORY IN AT LEAST ONE SAMPLE.
424

TABLE 1.41. WET WEIGHT BIOMASS AND NUMBER OF INDIVIDUALS OF SIX CATEGORIES OFMACROBENTHONIC ANIMALS PER m² AT STATION O4C (71°14.3'N, 155°40.5'W, 2 m,depth) IN AUGUST, 1977. DATA ARE DERIVED FROM CATCH OF O.lm² SMITH-MCINTYREGRAB SCREENED THROUGH 0.423mm NITEX. PRINCIPAL SPECIES ARE THOSE REPRESENTEDBY EITHER 1.0g OF WET WEIGHT BIOMASS OR 100 INDIVIDUALS PER m² IN AT LEAST ONESAMPLE. IF FOLLOWED BY !, THE SPECIES ACCOUNTED FOR VIRTUALLY ALL OF THE NUM-BER OR MASS OF THAT TAXONOMIC CATEGORY IN AT LEAST ONE SAMPLE.
425

TABLE 1.42. WET WEIGHT BIOMASS AND NUMBER OF INDIVIDUALS OF SIX CATEGORIES OFMACROBENTHONIC ANIMALS PER m² AT STATION 04D (71°14.7'N, 155°40.5'W, 5 m,depth) IN AUGUST, 1977. DATA ARE DERIVED FROM CATCH OF O.lm² SMITH-MCINTYREGRAB SCREENED THROUGH 0.423mm NITEX. PRINCIPAL SPECIES ARE THOSE REPRESENTEDBY EITHER 1.Og OF WET WEIGHT BIOMASS OR 100 INDIVIDUALS PER m² IN AT LEAST ONESAMPLE. IF FOLLOWED BY !, THE SPECIES ACCOUNTED FOR VIRTUALLY ALL OF THE NUM-BER OR MASS OF THAT TAXONOMIC CATEGORY IN AT LEAST ONE SAMPLE.
426

TABLE 1.43. WET WEIGHT BIOMASS AND NUMBER OF INDIVIDUALS OF SIX CATEGORIES OFMACROBENTHONIC ANIMALS PER m² AT STATION 04E (71°17.2'N, 155°40.5'W, 10 m,depth) IN AUGUST, 1977. DATA ARE DERIVED FROM CATCH OF O.lm² SMITH-MCINTYREGRAB SCREENED THROUGH 0.423mm NITEX. PRINCIPAL SPECIES ARE THOSE REPRESENTEDBY EITHER 1.Og OF WET WEIGHT BIOMASS OR 100 INDIVIDUALS PER m² IN AT LEAST ONESAMPLE. IF FOLLOWED BY !, THE SPECIES ACCOUNTED FOR VIRTUALLY ALL OF THE NUM-BER OR MASS OF THAT TAXONOMIC CATEGORY IN AT LEAST ONE SAMPLE.
427
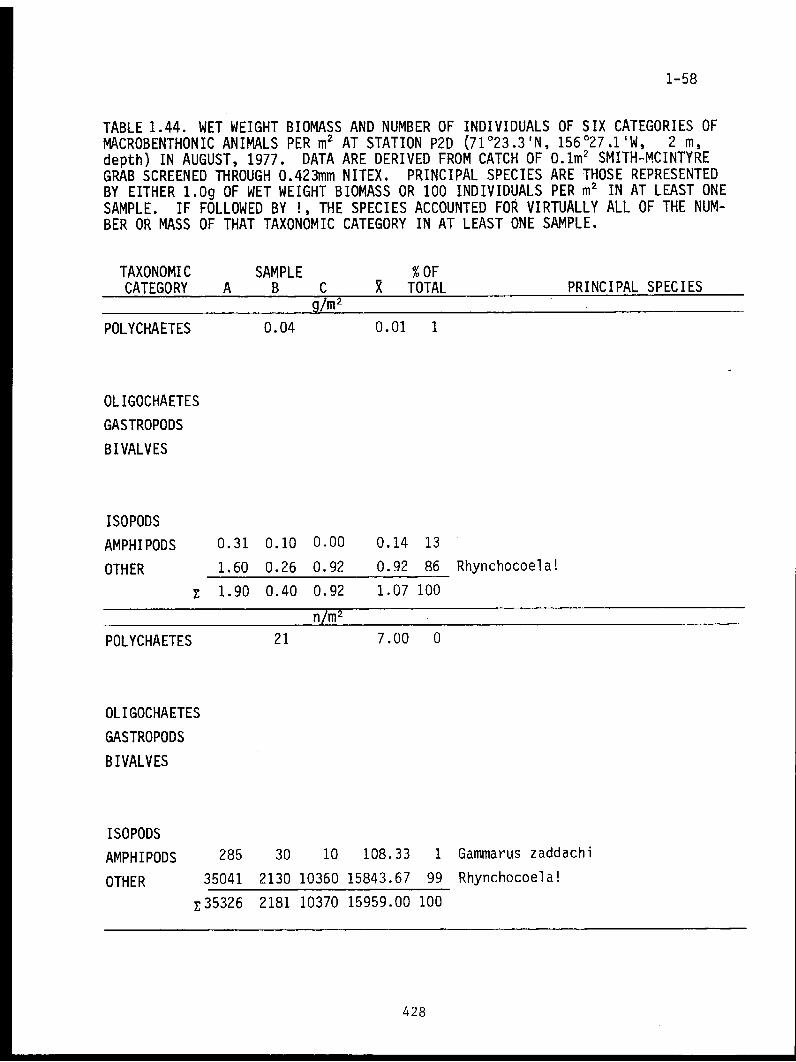
TABLE 1.44. WET WEIGHT BIOMASS AND NUMBER OF INDIVIDUALS OF SIX CATEGORIES OFMACROBENTHONIC ANIMALS PER m² AT STATION P2D (71°23.3'N, 156°27.1'W, 2 m,depth) IN AUGUST, 1977. DATA ARE DERIVED FROM CATCH OF O.lm² SMITH-MCINTYREGRAB SCREENED THROUGH 0.423mm NITEX. PRINCIPAL SPECIES ARE THOSE REPRESENTEDBY EITHER 1.Og OF WET WEIGHT BIOMASS OR 100 INDIVIDUALS PER m² IN AT LEAST ONESAMPLE. IF FOLLOWED BY !, THE SPECIES ACCOUNTED FOR VIRTUALLY ALL OF THE NUM-BER OR MASS OF THAT TAXONOMIC CATEGORY IN AT LEAST ONE SAMPLE.
428

TABLE 1.45. WET WEIGHT BIOMASS AND NUMBER OF INDIVIDUALS OF SIX CATEGORIES OFMACROBENTHONIC ANIMALS PER m² AT STATION P2E (71°23.4'N, 156°27.0'W, 6 m,depth) IN AUGUST, 1977. DATA ARE DERIVED FROM CATCH OF O.lm² SMITH-MCINTYREGRAB SCREENED THROUGH 0.423mm NITEX. PRINCIPAL SPECIES ARE THOSE REPRESENTEDBY EITHER 1.Og OF WET WEIGHT BIOMASS OR 100 INDIVIDUALS PER m² IN AT LEAST ONESAMPLE. IF FOLLOWED BY !, THE SPECIES ACCOUNTED FOR VIRTUALLY ALL OF THE NUM-BER OR MASS OF THAT TAXONOMIC CATEGORY IN AT LEAST ONE SAMPLE.
429
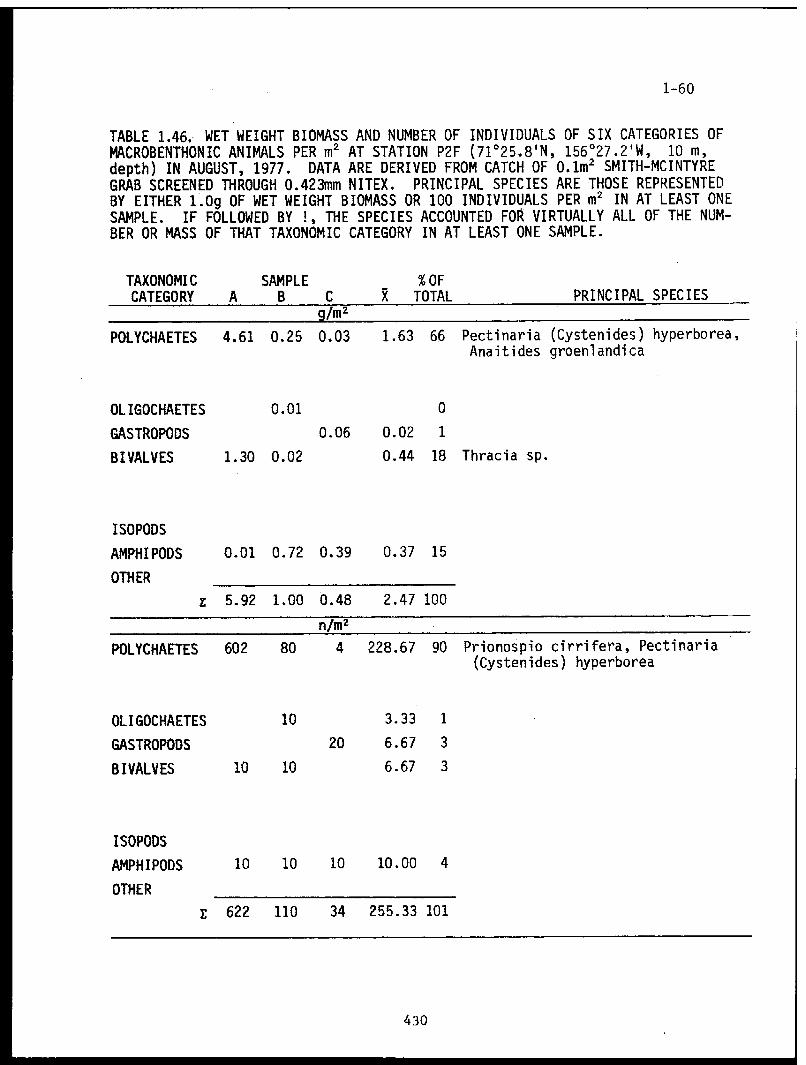
TABLE 1.46. WET WEIGHT BIOMASS AND NUMBER OF INDIVIDUALS OF SIX CATEGORIES OFMACROBENTHONIC ANIMALS PER m² AT STATION P2F (71°25.8'N, 156°27.2'W, 10 m,depth) IN AUGUST, 1977. DATA ARE DERIVED FROM CATCH OF O.1m² SMITH-MCINTYREGRAB SCREENED THROUGH 0.423mm NITEX. PRINCIPAL SPECIES ARE THOSE REPRESENTEDBY EITHER 1.Og OF WET WEIGHT BIOMASS OR 100 INDIVIDUALS PER m² IN AT LEAST ONESAMPLE. IF FOLLOWED BY !, THE SPECIES ACCOUNTED FOR VIRTUALLY ALL OF THE NUM-BER OR MASS OF THAT TAXONOMIC CATEGORY IN AT LEAST ONE SAMPLE.
430

TABLE 1.47: Catch of epibenthic sled net at several Beaufort Sea stations in 1977. See text for discus-sion of net and technique. Locations of stations are given in tables 1.3 to 1.46. Data are standardizedfor a 50 m tow and are comparable to sled net data reported previously by RU-356, but should not be usedin direct comparison to data from bottom grabs. Wet weight biomass in grams appears in columns g andnumbers of animals in columns n.

Table 1.47, continued

Table 1.47, continued

Table 1.47, continued

Table 1.47, continued

Table 1.47, continued

Repetitive Sampling of the Beaufort
Nearshore Region in 1977
A. C. Broad
Introduction
In 1977, repetitive sampling at selected Beaufort and Chukchi shore
stations was begun. This program was designed to yield data on composi-
tion of nearshore biota, whether this structure is stable or subject to
seasonal variation, annual and seasonal reproductive events, immigration
to or emigration from the nearshore region, and other events that might
contribute to ecological assessment. In this report, we deal with eastern
Beaufort Sea stations sampled three times during the 1977 summer.
Methods
Beach transects and extensions of transects were made at Nuvagapak
Point in the Arctic Wildlife Range, at Barter Island, Prudhoe Bay and in
the Colville River delta. The locations of stations sampled are given
in appended tables 2.1 to 2.7. The methods employed in sampling are
those that have been reported previously. Infaunal benthos was sampled
with a pole-mounted Ekman grab (0.0231m2 ) and washed in the field in a
0.516mm screen-bottomed pail. Motile, epibenthic organisms were sampled
with a Wildco (Cat. No. 171) scrape/skid dredge with 1.05mm mesh bag.
Salinity and temperature data with a YS1 Model 33 SCT meter, surface
plankton samples and substrate samples for bottom analyses were taken
and will be dealt with in a future report.
All samples were preserved in the field in 10% formalin and shipped
to Bellingham where they were sorted, weighed, and subsequently preserved
in alcohol.
Results
Infaunal benthos at depths of less than about 0.5 m yielded virtually
no animals during the 1977 sampling of selected stations. The yields of
437

2-2
Ekman grabs, expressed in grams of wet weight biomass per m2 and number
of individuals per m2 of several taxonomic categories of animals, percen-
tage composition of the fauna in both mass and numbers, and average
weights of individuals are given in Tables 2.1 to 2.7 appended to this
section. Tables 2.8 to 2.14 give comparable data for motile, epibenthic
animals taken in the scrape/skid dredge or sled net. Those wet weight
biomass data expressed as "K" values are in grams rounded to the nearest
100 mg. When large catches of mysids were made, the total biomass so
far exceeded that of other animals that errors introduced by this abre-
viation are negligible.
Discussion
In Nuvagapak Lagoon, Prudhoe Bay, and the Colville River delta
(Tables 2.2, 2.5 and 2.7), infaunal biomass was greater than at other
stations which probably reflects not only the larger number of samples
and the greater depth of the collections but also a stability based on
that depth and the larger biomass. The shallower stations sometimes
showed marked variation between sampling periods attributable to motile
isopods and amphipods included in the samples and to generally low
numbers of individuals and, possibly, to patchy distribution. Neverthe-
less, the infaunal benthos was, throughout, more stable than was the
epibenthos (Tables 2.7 to 2.14).
The samples made with the sled net must not be compared directly
with those taken with the Ekman grab. While the latter are quantitative,
the sled net, at best, is approximately so. The area covered by the net
during a 50m tow is approximately 19 m2, but the net does not behave in a
standard manner when towed, sometimes digging in and sometimes skimming
the surface. Animals may avoid the net which, when full or partially so,
tends to push water away from its mouth. The sled net data, therefore,
are used only in comparison within that group, but trends shown in the
epibenthos may be considered along with trends in the infaunal benthos.
While the benthos was generally stable, the catches of the epibenthic
sled net varied widely in numbers and in biomass during the summer. The
samples from the deeper stations (Tables 2.9, 2.12, and 2.14) were gener-
ally larger than those from the shallower ones, especially when comparisons
438

2-3
were made between locations close to one another, but, as noted elsewhere
by us, the differences between nearshore and inshore epibenthic crustacean
samples is not as striking as is the difference between the infaunal popu-
lations of the two regions.
A reasonably consistent trend in the samples of both motile, epiben-
thic animals and infauna is an increase in the number of individuals in mid-
summer over that in the earliest samples. In part, this may be the result
of immigration into the nearshore region following melting of the shorefast
ice, but this would hardly obtain for oligochaetes and polychaetes. De-
spite the increase in number, there is usually a decrease in polychaete bio-
mass in midsummer, and this is reflected in a smaller average size of in-
dividuals. A decrease in average size of infaunal amphipods also is shown
in the Ekman grab data, but generally (Table 2.8 provides an exception)
epibenthic amphipods and mysids increased in number and biomass in midsum-
mer and, hence, in average size of individuals.
These observations are consistent with early summer recruitment of
young (following late winter or spring reproduction) polychaetes and in-
faunal (burrowing) amphipods which begin to enter catches by midsummer. If
the same recruitment obtains for mysids, our data do not illustrate it.
In a most general way, our data for polychaetes, mysids, and Saduria
entomon show a larger average size of individuals in late summer than in
midsummer and, often, a decrease in both number and biomass. Such trends
are consistent with growth and predation during the summer. Our infaunal
amphipod data also show that larger individuals were caught late in the
summer. The sled net, however, which should be less effective in sampling
burrowing forms (but Pontoporeia affinis was abundant in these catches)
caught usually smaller amphipods at the summer's end than it had earlier.
Whether this apparent decrease in average size is the result of recruit-
ment of young later in the season, we are not prepared to say.
It should be stressed that the data on which this brief discussion was
based are quotients of biomass of samples divided by number of individuals.
Such statistics may suggest dynamics of populations and, thereby, indicate
the desirability of studies, but can not, in themselves, establish recruit-
ment, predation or growth rates. The trends noted could also have resulted
from different mobility of different sizes of the more active animals.
439

TABLE 2.1. NUVAGAPAK POINT - BENTHIC FAUNA IN 1977.

TABLE 2.2. NUVAGAPAK LAGOON - BENTHIC FAUNA IN 1977.

TABLE 2.3. BARTER ISLAND - BENTHIC FAUNA IN 1977.

TABLE 2.4. PRUDHOE SHORE -BENTHIC FAUNA IN 1977.

TABLE 2.5. PRUDHOE BAY - BENTHIC FAUNA IN 1977.

TABLE 2.6. COLVILLE SHORE - BENTHIC FAUNA IN 1977.

TABLE 2.7. COLVILLE DELTA - BENTHIC FAUNA IN 1977.

Table 2.8. Nuvagapak Point epibenthic fauna in 1977.
447
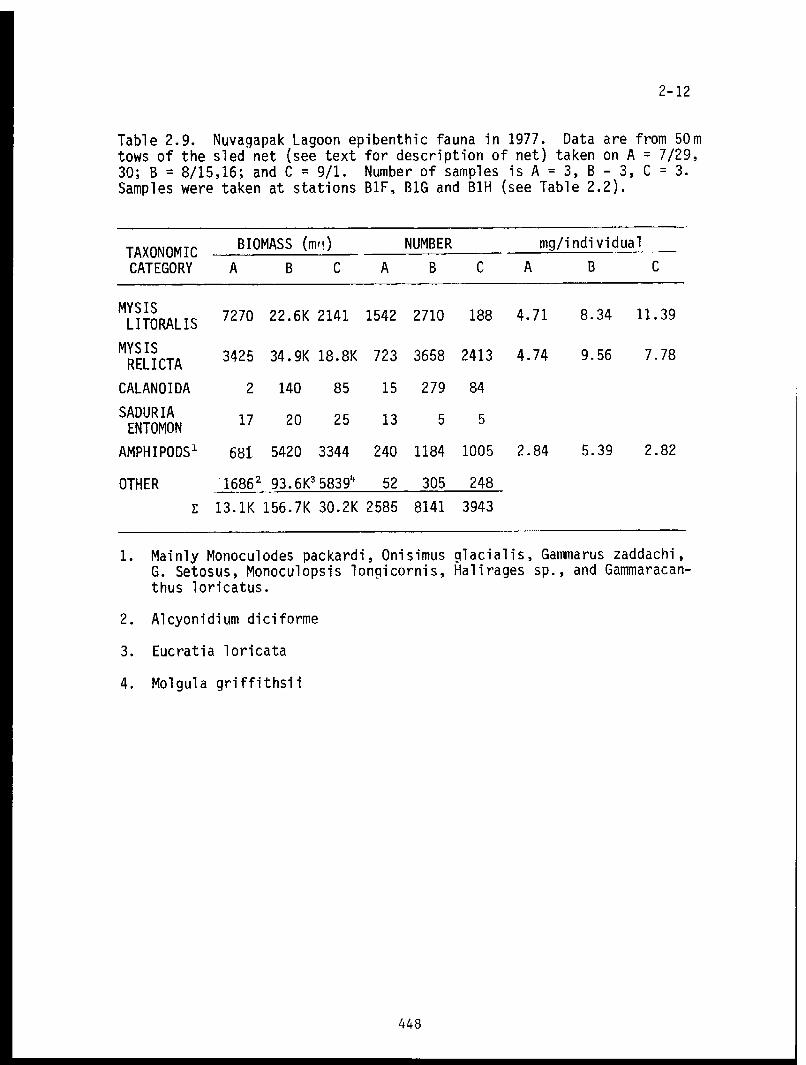
Table 2.9. Nuvagapak Lagoon epibenthic fauna in 1977.
448

Table 2.10. Barter Island epibenthic fauna in 1977.
449

Table 2.11. Prudhoe shore epibenthic fauna in 1977.
450

Table 2.12. Prudhoe Bay epibenthic fauna in 1977.
451
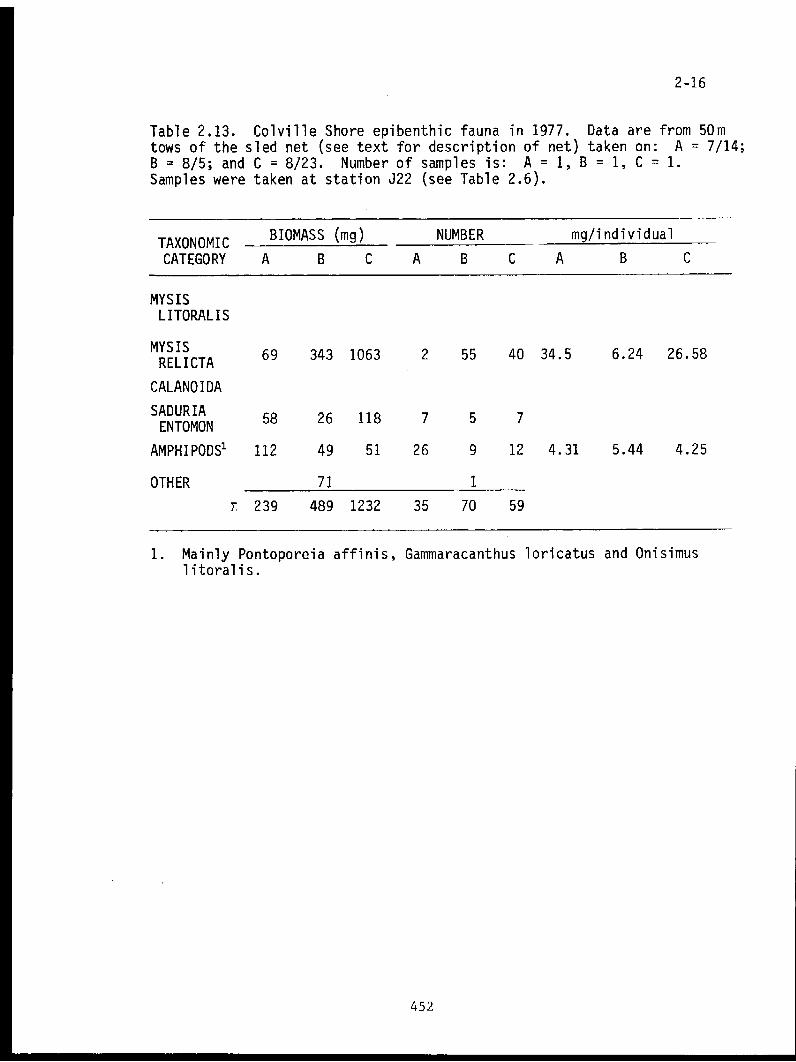
Table 2.13. Colville Shore epibenthic fauna in 1977.
452

Table 2.14. Colville delta epibenthic fauna in 1977.
453

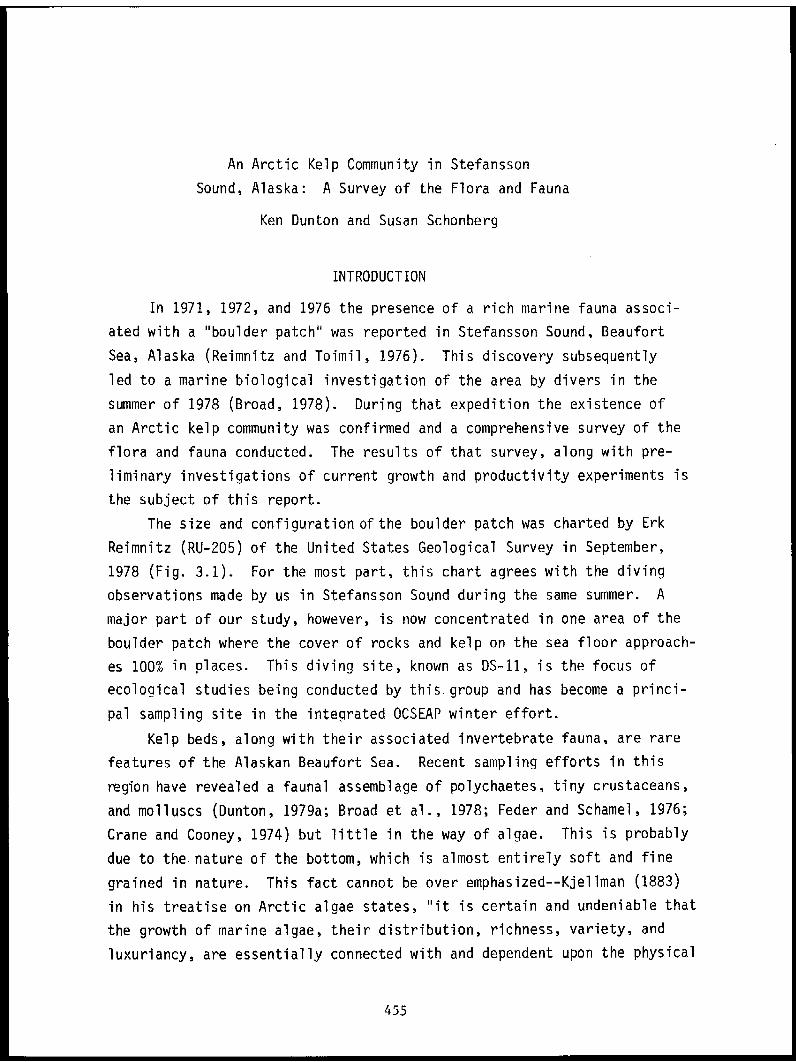
An Arctic Kelp Community in Stefansson
Sound, Alaska: A Survey of the Flora and Fauna
Ken Dunton and Susan Schonberg
INTRODUCTION
In 1971, 1972, and 1976 the presence of a rich marine fauna associ-
ated with a "boulder patch" was reported in Stefansson Sound, Beaufort
Sea, Alaska (Reimnitz and Toimil, 1976). This discovery subsequently
led to a marine biological investigation of the area by divers in the
summer of 1978 (Broad, 1978). During that expedition the existence of
an Arctic kelp community was confirmed and a comprehensive survey of the
flora and fauna conducted. The results of that survey, along with pre-
liminary investigations of current growth and productivity experiments is
the subject of this report.
The size and configuration of the boulder patch was charted by Erk
Reimnitz (RU-205) of the United States Geological Survey in September,
1978 (Fig. 3.1). For the most part, this chart agrees with the diving
observations made by us in Stefansson Sound during the same summer. A
major part of our study, however, is now concentrated in one area of the
boulder patch where the cover of rocks and kelp on the sea floor approach-
es 100% in places. This diving site, known as DS-11, is the focus of
ecological studies being conducted by this group and has become a princi-
pal sampling site in the integrated OCSEAP winter effort.
Kelp beds, along with their associated invertebrate fauna, are rare
features of the Alaskan Beaufort Sea. Recent sampling efforts in this
region have revealed a faunal assemblage of polychaetes, tiny crustaceans,
and molluscs (Dunton, 1979a; Broad et al., 1978; Feder and Schamel, 1976;
Crane and Cooney, 1974) but little in the way of algae. This is probably
due to the nature of the bottom, which is almost entirely soft and fine
grained in nature. This fact cannot be over emphasized--Kjellman (1883)
in his treatise on Arctic algae states, "it is certain and undeniable that
the growth of marine algae, their distribution, richness, variety, and
luxuriancy, are essentially connected with and dependent upon the physical
455

3-2
Fig. 3.1. The location of the boulder patch. From Reimnitz and Ross
(1978).
456


3-4
nature of the bottom" and "wherever the bottom is very loose, i.e. formed
of mud, sand, and clay, algae are wanting, because there are here no larg-
er solid objects to afford that foothold which they need, at least during
some part of their existence, in order to attain full and normal develop-
ment." Nevertheless, kelp occur as drift and kelp beds have been occasion-
ally documented in the Alaskan Arctic. Mohr, et al. (1953) dredged in a
kelp bed just east of Barrow near Peard Bay in the Chukchi Sea and found
abundant laminarioids along with red algae but "relatively few" inverte-
brates. Laminarioids were also collected off Tigvariak Island and Spy
Island by the Canadian Arctic Expedition 1913-1918 (Collins, 1927). Frag-
ments of kelp have been reported in Harrison Bay, Western Simpson Lagoon,
offshore of Jones Island, west of Narwhal, west of Flaxman and in Camden
Bay (Wilimousky, cited in Mohr, 1953) by various U.S. Arctic expeditions.
Perhaps the first diver to observe the kelp beds off Point Barrow
was Stewart Grant (pers. comm.) who photographed them in 1970. His pictures
show a bottom littered with laminarioids attached to shells, pebbles and
small rocks but devoid of attached invertebrate life. Presumably, a
combination of limited substrate and the unstable nature of the bottom
prohibited the colonization and establishment of sessile marine inverte-
brates. The recent discovery of a large boulder patch associated with
much kelp and a rich marine fauna and flora was therefore noteworthy,
environmentally in terms of industrial development, and ecologically in
terms of pure scientific interst.
As a result of this discovery and the subsequent SCUBA observations
by Reimnitz and Toimil (1976),a comprehensive biological survey on the
diversity and abundance of biota and extent of the boulder patch was com-
pleted in the summer of 1978. Since then the emphasis has been on learn-
ing more about the ecology of the community. Long term in situ experi-
ments initiated in August, 1978, were designed to provide information on;
(1) sedimentation rates, (2) the growth rates of algae and (3) the rate
and time of colonization, growth, and establishment of animals and algae
on bare rock surfaces. Such information, along with baseline summer and
winter data, will hopefully reveal the age and health of the community,
its importance in the Arctic ecosystem in terms of energetics and organic
productivity, and its resilience to physical disturbance.
458

3-5
The Stefansson Sound kelp community consists almost entirely of or-
ganisms that are sessile, and they must either cope with or succumb to
unfavorable environmental conditions created by offshore industrial ac-
tivities. Two problems which benthic organisms in this community are most
likely to face as a result of these activities are, (1) chemical contamin-
ation of their environment, and (2) physical disturbance. This study is
not concerned with the effects of contaminants on marine organisms.
The potential physical effects of offshore oil and gas exploration
may well deserve the greatest consideration with regard to the Stefansson
Sound kelp community. The proximity of the boulder patch to already exist-
ing drill sites (e.g. Exxon Duck Island, six miles) and its presence within
a lease area might further endanger a community which is already considered
rare. These physical effects could be either direct or indirect. A
direct effect would involve an actual spatial conflict between industrial
equipment and the benthic community itself. Increased rates of sedimenta-
tion (smothering the organisms) and higher water turbidity (decreasing
the amount of light available for the algae) as a result of bottom dis-
turbances upstream from the community are examples of possible indirect
physical effects. A knowledge of the organisms and the process of community
development through creation of artificial disturbances should provide
some insight with respect to management of the region.
STUDY AREA
The diving effort was carried out in the region of Stefansson Sound
located between Foggy Island Bay to the south and the McClure Islands on
the north (Fig. 3.1). The Sagavanirktok River discharges into Stefansson
Sound about six miles southwest of the principal diving sites. Water
depths ranged between 6 and 9 meters at all dive locations and the compo-
sition of the sea floor varied considerably.
Cobbles and boulders covered with marine growth were found in only 7
of 16 locations examined (Table 3.1). Of these seven, six were located
within a two square mile area (Fig. 3.2). Most of the sea bottom in this
region consisted of scattered pebbles, cobbles, and boulders on a base of
soft mud or hard, compacted clay. Boulders up to two meters across and a
meter high were sometimes observed. At DS-11 the sea floor was littered
459

TABLE 3.1. Location of dive sites in Stefansson Sound during the 1978Summer field season.
460
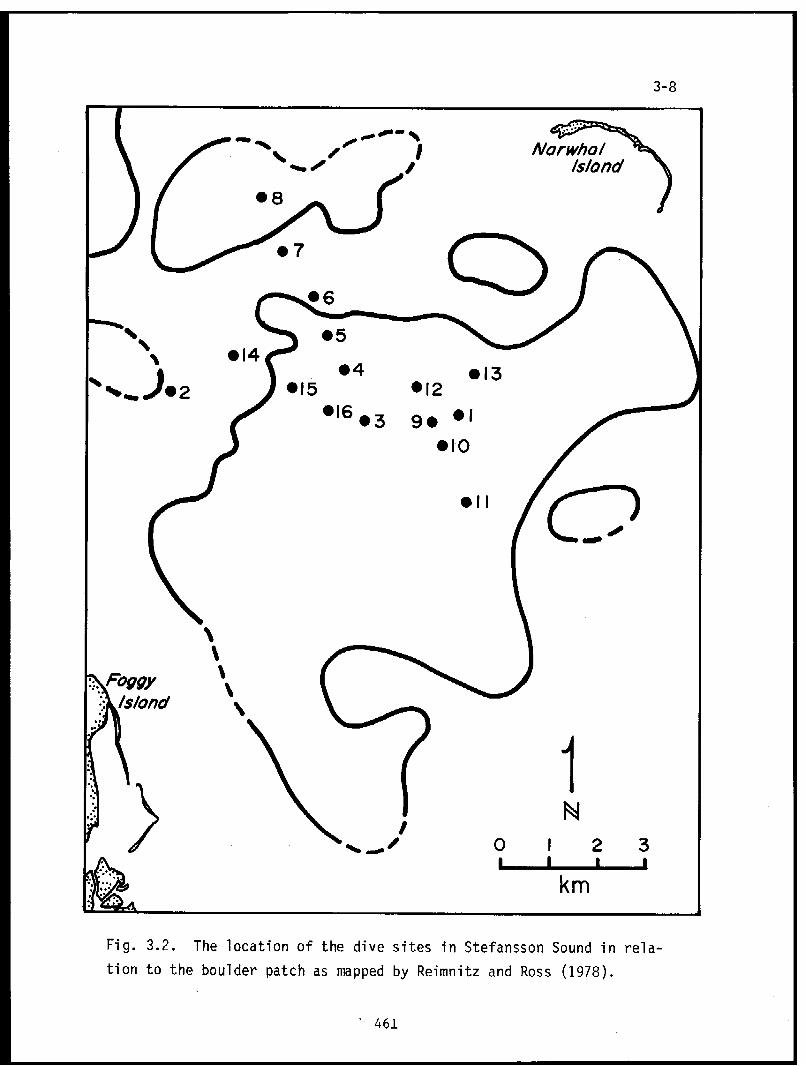
Fig. 3.2. The location of the dive sites in Stefansson Sound in rela-
tion to the boulder patch as mapped by Reimnitz and Ross (1978).
461

3-9
with rocks and supported an extensive kelp community of unknown size. This
site became the focus of the winter sampling program. A layer of silt,
which varied in thickness during the year, was usually observed on algae
and rock surfaces.
Reimnitz and Ross (1978) believe the gravel, cobbles, and boulders in
Stefansson Sound are lag deposits resulting from the erosion of boulder-
rich portions of the Gubic formation. These rocks are thought to be part
of the Flaxman formation (Leffingwell, E. de K., 1919) which were believed
to have been ice rafted into the area and became part of the Gubic Forma-
tion at an earlier time. The existence of this boulder bed, in what ap-
pears from its close proximity to the Sagavanirktok River to be a deposi-
tional environment, raises important questions yet to be answered.
METHODS
Summer Field Sampling and Logistics
The field team for this project consisted of a team leader/diver,
two SCUBA divers, and a marine technician, During the summer we operated
from Narwhal Island, about five miles from the principal dive sites in
Stefansson Sound. Facilities were provided by the Naval Arctic Research
Laboratory which maintains a camp on the island. Other field support
including NOAA helicopter assistance, housing facilities in Deadhorse,
and a 21 foot Boston Whaler were provided by OCSEAP. The Boston Whaler
was used in transportation to and from the dive sites for ten day periods
between July 20 and August 21, 1978. For a more detailed account of the
field activities of this group during the 1978 summer field season see
Dunton (1979b).
Exploration of the Stefansson Sound boulder patch was accomplished
by a diving survey during the summer of 1978 which involved spot diving
along transects of known degree bearings. Occasionally a Ross SL 500 re-
cording fathometer was used in such exploratory work, but its effective-
ness as a tool to delineate the presence or absence of boulders varied.
Typically, following the successful location of a kelp bed, the site was
marked with buoys and a 50 meter transect line (marked in meters) set on
the bottom. Once in the water, divers used an underwater communications
system to coordinate work efforts and relayed data to a surface tape
462

3-10
recorder. Based on visual observations while swimming the transect line,
divers reported information (and responded to inquiries from the surface)
on:
1. The physical environment, which included data on approximatewater turbidity and visibility, and currents.
2. The sea floor, which included comments on the nature of thesediments, topographical features, surface detritus, and quan-titative data on rock and algal cover.
3. The biota, which involved a description of the organisms seen,collected, or photographed, and any notes on their respectivedensity, location or behavior.
In addition to the visual observations and collections made by divers,
an attempt was made to obtain quantitative data on the biota without using
destructive sampling techniques. This was accomplished by mounting a
camera on an apparatus which framed pictures into either a 1/4 or 1/20 m2
format (Fig. 3.3). These photographs were taken on various rock substrata
at random and were used to obtain density estimates of many invertebrate
species (Fig. 3.4). A Nikonas III camera equipped with a 15 mm Nikkor
wide angle lens and Nautilus YS-35 and YS-150 strobes was used in all the
underwater photography. To aid in laboratory identification, close-up
pictures of the organisms were taken with extension tubes on a 28 mm
Nikkor lens to obtain a 1:2 reproduction ratio.
Winter Field Sampling and Logistics
Data from in situ experiments initiated in August, 1978, were col-
lected at Dive Site 11 in November, 1978 and March 1979. A Helle pinger
receiver was used to locate a pinger marking the dive site under the ice.
Divers worked from a dive hole located inside a heated 16 x 20 foot NARL
parcoll. OCSEAP provided field logistic support, lodging in Deadhorse
and NOAA helicopter assistance.
Because floculent sediment was easily stirred up by turbulence, sam-
pling was done by one person at a time in November. A second person re-
mained on standby and rotated with the first between active and standby
duty. The divers were tethered to the surface and equipped with a com-
plete back-up air support system. Each of the two divers made two dives
per day, working in total darkness under extremely turbid conditions.
463

3-11
Fig. 3.3. Feet high to avoid stirring bottom sediments, a diver photo-
graphs the boulder patch benthic community using a 1/4 m2 framer. The
headphones are used in underwater communications.
Fig. 3.4. A close-up of the benthic community using a 1/20 m2 camera
framer reveals an assortment of sponges, red algae, and hydroids. The
sponge near the top of the framer is Choanites lutkenii; below it are
two sponges of Phakettia cribrosa. Hydroids are scattered, but one
clump can be seen on the top left. The red algae include Lithothamnium
(encrusting), Rhodomela subfusca (filamentous, to the right of the
sponges), and Phycodrys rubens (clump to the left of the sponges).
464

465

3-13
The following tasks were completed in both November and March.
1. Analyze and/or photograph experimental plots used in recoloniza-tion studies. Denude new plots where designated by team leader.
2. Measure tagged kelp to obtain new growth increments. Tag andpunch additional individuals.
3. Measure sediment depth in trays and install new trays.
4. Record physical measurements on visibility, ice thickness, cur-rents, water temperature, salinity; note changes in the physicalenvironment.
5. Photograph the community.
6. Collect new or uncommon organisms.
7. Note changes in the biotic components.
8. Sample the benthic infauna using an airlift (March).
9. Determine algal biomass per m2 (March).
10. Assist Schneider (RU-356), Schell (RU-537) and Horner (RU-359)in underwater sampling.
11. Study underice features with Reimnitz (RU-205) in March. Thisteam also retrieved equipment for Matthews (RU-526), and assistedin underwater studies for LGL (RU-467) and Carey (RU-6) underadditional OCS contract funding.
RESULTS AND DISCUSSION
The Nature of the Boulder Patchand the Physical Environment
The Stefansson Sound boulder patch includes two types of habitats;
(1) dense rocky areas, rich in flora and fauna and extensive in nature
(Fig. 3.5), and (2) regions of scattered rocks characterized by isolated
patches of marine life (Fig. 3.6). Several kelp beds were found by this
team in Stefansson Sound, three of which (DS-1, DS-3, and DS-11) were
studied and sampled. Kelp and attached animal life were also observed
at DS-8, DS-9, DS-10, and DS-12. All sites in which kelp were reported
lie within the confines of the boulder patch as mapped by Reimnitz (Fig.
3.2). Dive Site 11 was the only area that had a densely covered rock
bottom with an extensive and abundant flora and fauna.
Regions characterized by cobbles or boulders were usually associated
with a hard bottom consisting of either stiff silty clays, or well consol-
idated coarse materials (e.g., gravels and sands). At DS-8 the bottom
consisted entirely of coarse sands which were probably transported from
466


3-14
Fig. 3.5. A view of the kelp community at DS-11. A light patch or sorus
(the fertile portion of the plant) appears on many of the Laminaria
blades. The sponge in the center is Choanites lutkenii.
Fig. 3.6. Our transect line intersects a patch of rocks with attached
plant and animal life at DS-1. The area around the rocks is mud and
silt.
468

469

3-16
nearby barrier islands. At other areas examined, the bottom consisted
of soft muds and silts. Silt was present at all sites examined and was
particularly evident on lighter rock surfaces. It was easily thrown in-
to suspension by the divers and was the primary cause of poor underwater
visibility. A summary of the physical characteristics of each dive site
including data on the nature and content of the sea floor is presented in
Table 3.2. Dive Site 11 had the densest rock (41.7%) and algal cover
(37.3%), was the shallowest of the dive sites and was the most extensive
in terms of rock cover. A diving survey showed boulders and cobbles
covering at least 40,000 square meters of sea floor in the area.
Salinity and temperature data were recorded through the summer at
various diving sites (Table 3.3). Water temperatures rose 4.7 degrees
to a high of 7.90C in early August, as salinities dropped 4.5 ppt to a
low of 22.4 ppt. By late August temperatures had dropped to less than
1°C and salinities had risen to 26.3 ppt. Salinities were generally
higher and temperatures lower at the bottom than at the surface, the
difference being on the order of 0.2 -2.5 ppt and 0.5 - 2 degrees re-
spectively.
The Flora and Fauna of theStefansson Sound Boulder Patch
The Stefansson Sound boulder patch supports a well established kelp
community characterized by several species of red and brown algae, and a
diverse assortment of invertebrate life reporesenting every major taxon-
omic group. The most conspicuous and dominant member of the community
is the brown alga, Laminaria solidungla which is exclusively circumpolar
in distribution. Two other kelp species, Laminaria saccharina and Alaria
esculenta appear occasionally and together with L. solidungla from a
brown algal overstory. In areas where kelp cover was reduced or absent,
another floral assemblage, typified by several species of filamentous and
bladed red algae, dominated (Figs. 3.4, 3.7 and 3.8). These species in-
cluded Phycodrys rubens, Neodilsea integra, Phyllophora truncata,
Rhodomela subfusca and to a lesser extent, Odonthalia dentata and Ahn-
feltia plicata. These red algal species, along with Lithothamnium, a
widespread encrusting red algae, comprised a patchy algal understory.
470

TABLE 3.2. Summary of the dive sites in Stefansson Sound. Rock and algal covers at DS-1, DS-3, andDS-11 are mean scores calculated from at least 23 one m2 quadrats. In all other cases, with the ex-ception of water depth and current direction, the data represent independent estimates made by thedivers.

TABLE 3.2 continued

TABLE 3.3. Average salinity and temperature values at some of the divingsites in July and August. There was little variation in salinity andtemperature between the surface and the bottom at any of the sites.
473

3-20
Fig. 3.7. Rocks and algae smothered with silt characterize the bottom
at DS-11 in November, 1978. The pink soft coral Eunephytes rubiformis
(top center) stands next to Laminaria solidungla. To the right of the
seastar is the eelpout, Gymnelis viridis. An encrusting sponge is
attached to Phycodrys (left middle).
Fig. 3.8. A close-up of the bottom at DS-11 shows a community
dominated by the red encrusting alga Lithothamnium, and the bladed alga
Phycodrys rubens. Other algae include Rhodomela subfusca (top) and
Phyllophora truncata (bottom).
474

475

3-22
To a large degree, the diverse and rich assemblage of invertebrate and
vertebrate animals is dependent on the microhabitats and additional
substrate space afforded to them by the algae community.
A complete list of the fauna collected at the three principal dive
sites (DS-1, DS-3, and DS-11) is presented in Table 3.4A. This table in-
cludes previously unencountered species collected by divers at DS-11 in
November, 1978, and those reported living in the soft underice environ-
ment in March, 1979. In the context of this study a species was con-
sidered: widespread (W), if it was continually observed by a diver as
he swam; common (C) if it was frequent in occurrence but not widespread;
and rare (R) if it was encountered only occasionally. The species of
algae taken by divers at the three sites are listed in Table 3.4B. The
densities of large epilithic species and some of the motile invertebrates
are depicted in Table 3.5A. Percent cover of the primary understory
species--red algae, hydrozoans, and encrusting sponges are listed in
Table 3.5B. The densities and percent covers were calculated from a
total of 54 photographs of 1/20 m2 quadrats taken at DS-1, DS-3, and DS-
11. The densities and percent covers are based on areas of 40% rock
cover or better.
Of the invertebrate phyla, the sponges and the cnidarians were the
most conspicuous. This was due to the large size of some species, a high
abundance, and their striking shapes and colors. Phakettia cribrosa and
Choanites lutkenii (Fig. 3.4, 3.5) were abundant and had a combined den-
sity of 5.5/m2. The delicate pink soft coral Eunephtyes rubiformis
(Fig. 3.7) was the most photographed organism of the boulder patch. It
was widespread (4.8/m2) and individuals from 2 cm in size to two feet in
height were observed. At least four different colorful sea anenomes
(order Actinaria) were photographed and collected, but remain unidenti-
fied. Cerianthus, an anenome-like anthozoan, was observed frequently but
not collected. Tubularia, a stalked hydrozoan, was abundant at DS-1 and
DS-3 but infrequent at DS-11. Its mean density of 2.6/m2 is considered
high for all three dive sites. Other hydrozoans formed a turf like cover-
ing on rocks in company with small sponges, bryozoans, Rhodomela (a fila-
mentous red alga), and stringy masses of the red alga Phycodrys (Fig. 3.4).
476

TABLE 3.4A. An annotated list of the fauna collected at three dive sites inthe Stefansson sound boulder patch in July and August, 1978. "N" or "M"denote organisms collected in November, 1978 or March 1979 respectively.Frequency estimates are denoted as: W = widespread, C = common, or R =rare (see text) and are presented where possible.
477

Table 3.4A, continued
478

Table 3.4A, continued
479

Table 3.4A, continued
480

Table 3.4A, continued
481

TABLE 3.4B. Algae collected at the three dive sites in the Stefansson Soundboulder patch during July and August, 1978.
482

TABLE 3.5A. Mean densities (n/m²) of large epilithic and some non-epilithicinvertebrates in the boulder patch based on 54 photographed 1/20 m² quad-rats. Densities are based on a minimum of 40% rock cover. Hydrozoans andsmall sponge species are treated in Table 3.5B.
483

TABLE 3.5B. Percent cover (%) of various red algal species, hydrozoans,and small sponges attached to rocks in the kelp community understory.Covers are based on 54 photographed 1/20 m2 quadrats and a minimum of 40%rock cover.
484

3-31
Polychaetes, nematodes, and nemerteans were usually collected in the
soft sediment between the boulders and cobbles. Some of these worms made
tracks in the top soft layer of sediment which were distinguishable from
the wider tracks made by gastropods. The tubicolous polychaete Spirorbis
granulatus formed small (to 4 mm) spiralled tubes found on rocks, algae,
hydroids and snail shells. Its calculated density of 10.4/m 2 is probably
low. The fanworm Potamilla neglecta was less abundant but larger, its
membranous tube having a length of 8 cm or better. In March, 1979 gravid
polychaete scaleworms (Antinoella sarsi) were found living in the soft
underice environment. Divers estimated their numbers at 0-3/m 2 .
Molluscs, particularly the gastropods Buccinum, Neptunea, Natica,
Margarites, and Plicifusus were collected frequently. Natica clausa was
usually found on the blades of Laminaria as were about five different
types of Nudibranchs. Egg clusters belonging to Buccinum were common on
the stipes of Laminaria solidungla at several dive sites including DS-8.
Pelecypods were not collected in abundance although many shells of Astarte
borealis were scattered on the sea floor at the principal dive sites.
The largest mobile invertebrate was the crustacean Hyas coarctatus
alutaceus. Divers frequently came across this animal and the hermit
crab, Pagurus trigonocheirus, while working in thick kelp, but seldom
saw them on kelp free bottoms. Other mobile crustaceans included numer-
ous mysids (not collected), amphipods and rarely, isopods. In March, 1979
a number of amphipods were collected moving in and around the soft under-
ice environment. Four species are listed in Table 3.4A.
Several five and six rayed seastars, Leptasterias spp. and one ten
rayed sunstar, Crossaster papposus, were collected in this study. These
seastars were found attached to rocks, Laminaria fronds, or lying on the
sea floor. Only two feeding observations were recorded on these animals
underwater. One seastar was seen eating a polychaete worm in August and
three were feeding on the remains of a fish (Liparis) in March, 1979.
Sea spiders, bryozoans, and ascidians were some of the more unusual
animals that fascinated the divers underwater. The sea spider (Pycnogonid)
Nymphon grossipes, a bizarre looking animal underwater (a photograph ap-
pears in Dunton, 1979b) was occasionally seen scavenging around rocks
485

3-32
beneath the kelp canopy. Bryozoans were found attached to rocks, on hy-
droids, and to the red algal species Phycodrys, Odonthalia, and Phyllo-
phora. One translucent ascidian, Mogula griffithsii, was attached to
the red alga Rhodomela.
Five species of fish were collected at DS-11. These included two
species of the sucker fish Liparis, the arctic cod (Boreogadus saida),
the eelpout (Gymnelis viridis), and the four-horned sculpin (Myoxoce-
phalus quadricornis). Fish eggs were collected in August and again in
March, 1979. In March, thousands of eggs were found attached to kelp
stipes, wire flags, and anchor lines. As numerous tiny liparid like
fish were also observed, these eggs might have been laid by adult Liparis
females. The greater number of fish species collected in November is
more likely a reflection of an improved and concentrated collection effort
than an actual absence of these fish in August.
Taxonomic Discussion
In the following section the major sources used to identify the or-
ganisms are listed and some taxonomic problems relevant to this study are
discussed.
PORIFERA
Koltun, V. M. 1959b. Siliceous-horny sponges of the Northern and Far
Eastern Seas of the USSR; Order Cornacuspongida. Akademiia Nauk SSSR.
Zoologicheskii Institut. Opredeliteli po Faune SSSR 67:1-235.
DeLaubenfels, M. 1953. Sponges of the Alaskan Arctic. Smithsonian Misc.
Collections 121(6):1-22.
Choanites lutkenii was not included in Koltun's work, although it is
one of the most common species found in this study. However, DeLaubenfels
does describe it well in his paper. A sponge similar in character to the
genus Suberites was collected frequently off rocks and algae yet did not
key out. The megascleres are of one type and rounded on both ends, one
end being larger than the other. There are no microscleres present.
486

3-33
CNIDARIA
Hydrozoans
Naumov, D. V. 1960. Hydroids and Hydromedusae of the USSR. Akademiia
Nauk SSSR. Zoologicheskii Institut. Opredeliteli po Fauna SSSR.
70 p.
Calder, D. R. 1970. Thecate Hydroids from the shelf water of Northern
Canada. J. Fish. Res. Bd. Can. 27(9):1501-1547.
Calder, D. R. 1972. Some Athecate Hydroids from the shelf water of
Northern Canada. J. Fish. Res. Bd. Can. 29(3):217-288.
A frequently collected hydroid keyed out very well to Thuiaria
uschakovi in Naumov's Key. However, this species is only know from the
Western Russian Arctic and thus has been listed here as Thuiaria sp. A
single specimen of Corymorpha keys out perfectly to C. nutans in Naumov
but again, its known distribution does not include the Beaufort Sea area
so is listed as Corymorpha sp. Several specimens of what Calder calls
Tubularia regalis were collected. These specimens are very similar to
Tubularia indivisa but have distinctly ridged gonopores. These ridges
are also visible in a close-up underwater photograph when the animal was
alive.
Anthozoans
(Actinaria)
Carlgren, 0. H. 1949. A survey of the Ptychodactiaria, Corallimorpharia,
and Actinaria; with preface by T. A. Stephenson. Svenska Vetenskaps-
Akademien Handlingar, Ser. 4, 1(1).
Carlgren, 0. H. 1940. Actinaria from Alaska and Arctic Waters. J. Wash.
Acad. Sci. 30(1):21-27.
Carlgren, 0. H. 1934. Some Actinaria from Bering Sea and Arctic Waters.
J. Wash. Acad. Sci. 24:348-353.
Verrill, A. E. 1922. Alcyonaria and Actinaria. Canadian Arctic Expedi-
tion, 1913-1918. Report. Vol. 8: Mollusks, Echinoderms, Coelenterates,
etc. Pt. G. King's Printer, Ottawa. 164 p.
487

3-34
Listed above are the sources used in an attempt to identify the num-
erous actinarians collected and photographed. After a careful study of
the source descriptions and the samples we did not feel qualified to
identify any of the animals. This group needs further taxonomic study
before these organisms can be correctly identified.
(Alcyonaria)
Verrill, A. E. 1922. Alcyonaria and Actinaria. Rept. Can. Arctic Exped.,
1913-1918. Vol. 8: Mollusks, Echinoderms, Coelenterates, etc. Pt.
G. King's Printer, Ottawa. 164 p.
Scyphozoa
Mayer, A. G. 1910. Medusae of the World. Vol. III. The Scyphomedusae.
Carnegie Inst. Wash. Publ. 109:499-735.
ANNELIDA
Polychaeta
Ushakov, P. V. 1955. Polychaeta of the Far Eastern Seas of the USSR.
Azdatel 'stvo Akademiia Nauk SSSR. Moskva-Leningrad. 419 p.
Fauchauld, K. 1977. The Polychaete Worms. Definitions and Keys to the
Orders, Families and Genera. The Allan Hancock Foundation. Univ. of
Southern Calif. 188 p.
Banse, K. and Hobson, K. 1974. Benthic Errantiate Polychaetes of British
Columbia and Washington. Fish. Res. Bd. Can., Bulletin 185. 111 p.
Banse, K. and Hobson, K. Benthic Sedentariate Polychaetes of British Col-
umbia and Washington. Unpublished.
Spirorbis are very common on the rocks in this study areay. The cal-
careous tubes of several animals were dissolved in order to key them out
to Spirorbis granulatus. It is very probable that other species are repre-
sented in the boulder patch region.
488

3-35
MOLLUSCA
Polyplacophora
Yakouleva, A. M. 1952. Shell-bearing mollusks (Loricata) of the Seas of
the USSR. Izdatel 'stvo Akademic Nauk SSSR. Moskva-Leningrad.
Gastropoda
MacGinitie, N. 1959. Marine mollusca of Point Barrow, Alaska. U.S. Nat.
Mus. Proc. 109.
Keen, M. A. and Coan, E. 1974. Marine molluscan genera of Western North
America. Stanford Univ. Press.
Macintosh, R. A. 1976. A guide to the identification of some common
EaStern Bering Sea snails. Northwest Fisheries Center. NOAA. Kodiak,
Alaska.
Nora Foster from the University of Alaska's Institute of Marine Sci-
ence in Seward, determined the names Margarites vorticifera, Neptunea
borealis and Onchioiopsis borealis when shown the respective animals.
Nudibranchia
No comprehensive works covering Arctic species were found for this
group with which taxonomic identifications could be made.
Pelecypoda
Bernard, F. R. Bivalve mollusks of the Western Beaufort Sea. Unpublished.
MacGinitie, N. 1959. Marine mollusca of Point Barrow Alaska. U.S. Nat.
Mus. Proc. 109.
PYCNOGONIDA
Hedgpeth, J. W. 1963. Pycnogonida of the North American Arctic. J. Fish.
Res. Bd. Can. 20(5):1315-1348.
489

3-36
CRUSTACEA
Isopoda
Richardson, H. 1905. Monograph on the Isopods of North America. Bull.
U.S. Nat. Mus. 54:727.
Amphipoda
These identifications were made by Hal Koch and Mark Childers at
Western Washington University's Arctic Marine Laboratory.
Decapoda
Rathbun, M. J., H. Richardson, S. J. Holmes, and L. J. Cold. 1910. Har-
riman Alaska Expedition. Vol. 10. Crustacea. Smithsonian Institution
Wash. D.C. No. 1997, 337 p.
BRYOZOA
Kliuge, G. A. 1962. Bryozoa of the Northern Seas of the USSR. Sharma,
B. R. (Trans.) 1975. Smithsonian Institute, Washington, D.C. 735 p.
Osburn, R. C. 1950. Bryozoa of the Pacific Coast of America. Part 1,
Cheilostomata--Anasca. Allan Hancock Pac. Exped. 14(1):1-269.
Osburn, R. C. 1952. Bryozoa of the Pacific Coast of America. Part 2,
Cheilostomata--Ascophora. Allan Hancock Pac. Exped. 14(2):271-611.
George Meuller at the University of Alaska's Institute of Marine Sci-
ence in Seward, worked with us in identifying many of the bryozoans col-
lected.
The species listed as Flustrella sp. did not key out with the above
literature. Each colony is 9-11 cm tall and 4-5 mm in diameter. They
are dark brown, very rough, and occur in groups.
ECHINODERMATA
Asteroidea
D'yakonov, A. M. 1950. Sea Stars of the USSR Seas. Izdatel 'stvo Akad-
emii Nauk SSSR. Moskva-Leningrad.
490
3-37
Grainger, E. H. 1966. Sea Stars (Echinodermata: Asteroidea) of Arctic
North America. Fish. Res. Bd. Can., Bulletin 152. 70 p.
Two specimens of a particular sea star were collected, but identified
only to Pedicellasteridae. They were small, had a very open skeleton,
straight and crossed pedicellaria, but only two rows of tubefeet the whole
arm length.
CHORDATA
Ascidiacea
Van Name, W. G. 1945. North and South American Ascidians. Bull. Ameri-
can Museum of Natural History 84:1-476.
Berrill, N. J. 1950. The Tunicata. With an Account of the British Spe-
cies. Ray Society, London. 354 p.
VERTEBRATA
Osteichthyes
McAllister, D. E. Keys to the Species of Marine Waters of Arctic Canada.
Unpublished house key of the consulting firm LGL.
A key from the University of Alaska's Institute of Marine Science on
the species of Liparis. Unpublished.
The species Liparis herschelinus and several other species (L. bristo-
lense, L. lapteria, L. dubins) have not been adequately worked out. They
are very similar to each other with unclear taxonomic differences.
PHAEOPHYTA (brown algae) and RHODOPHYTA (red algae)
Abbot, I. A. and G. J. Hollenberg. 1976. Marine algae of California.
Stanford University Press, Stanford. 827 p.
Burrows, E. M. 1964. An experimental assessment of some of the characters
used for specific delimitation in the genus Laminaria. J. Mar. Biol.
Ass. U.K. 44:137-143, 2 pls.
491

3-38
Chihara, M. 1967. Some marine algae collected at Cape Thompson of the
Alaskan Arctic. Bull. Nat. Sci. Mus. Tokyo 10(2):184-200, 4 pls.
Collins, F. S. 1927. Marine algae from Bering Strait and Arctic Ocean
collected by the Canadian Arctic Expedition, 1913-1916. Report of
the Canadian Arctic Expedition 1913-1916. 4(B). p. 3-16.
Druehl, L. D. 1966. Taxonomy and distribution of northeast Pacific
species of Laminaria. Can. J. Bot. 46:539-547, 7 pls.
Farlow, W. G. 1886. Notes on Arctic algae; based principally on collec-
tions made at Ungava Bay by Mr. L. M. Turner. Proc. Am. Acad. Arts
and Sci. 21(2):469-477.
J6nsson, H. 1904. The marine algae of East Greenland. Medd. om Grønland
30(1):1-73.
Kjellman, F. R. 1883. The algae of the Arctic Sea. Kongliga Svenska
Vetenskaps-Akademiens Handlingar 20(5):1-349, 31 pls.
Kjellman, F. R. 1889. Om Beringhafvets Algflora. Kongliga Svenska Vet-
enskaps-Akademiens Kandlingar 23(8):1-58, 7 pls.
Lee, R. K. S. 1973. General ecology of the Canadian Arctic benthic mar-
ine algae. Arctic 26:32-43.
Mann, K. H. 1971. Relation between stipe length, envioronment, and the
taxonomic characters of Laminaria. J. Fish. Res. Bd. Can. 28(5):778-
780.
Mohr, J. L., N. J. Wilimousky, and E. Y. Dawson. 1957. An Arctic Alaskan
kelp bed. Arctic 10:45-52.
Newroth, P. R. 1971. The distribution of Phyllophora in the North Atlan-
tic and Arctic regions. Can. J. Bot. 49:1017-1024.
Newroth, P. R. and J. W. Markham. 1972. Observations on the distribution,
morphology, and life histories of some Phyllophoraceae. Proc. Int.
Seaweed Symp. 7:120-125.
Rosenvinge, L. K. 1910. On the marine algae from northeast Greenland (N.
of 76°N. Lat.) collected by the "Danmark Expedition." Medd. om Grøn-
land. 43(4):91-133.
492

3-39
Rosenvinge, L. K. 1923-24. The marine algae of Denmark. I. Rhodophy-
ceae. Kgl. Danske Vidensk. Selsk. Skr., Naturv. og Mathem. Afd., 7.
Raekke 7(3):285-487, pls. 5-7.
Widdowson, T. B. 1971. A taxonomic revision of the genus Alaria Greville.
Syesis 4:11-49.
Widdowson, T. B. 11973. The marine algae of British Columbia and northern
Washington: revised list and keys. Part I. Phaeophyceae (Brown
Algae). Syesis 6:31-96.
Widdowson, T. B. 1974. The marine algae of British Columbia and northern
Washington: revised list and keys. Part II. Rhodophyceae (Red Algae).
Syesis 7:143-186.
Wilce, R. T. 1959. The marine algae of the Labrador Peninsula and north-
west Newfoundland (ecology and distribution). National Museum of
Canada, Bulletin 158. 103 p., 11 p1s.
Wilce, R. T. 1965. Studies in the genus Laminaria. III. A revision of
the North Atlantic species of the Simplices Section of Laminaria. In:
Proceedings of the 5th Marine Biological Symposium. Ed. Tore Levring.
Göteber.
Zinova, A. D. 1953. [Determination book of the brown algae of the northern
seas of the USSR]. Leningrad and Moscow. (Original in Russian.) 223 p.
Zinova, A. D. 1955. [Determination book of red algae of the norther seas
of the USSR]. Leningrad and Moscow. (Original in Russian.) 219 p.
Listed above are the sources used in identifying the red and brown
algae collected in this study. Our appreciation to Dr. Maurice Dube of the
Department of Biology at Western Washington University who provided some
taxonomic assistance and to Dr. Robert T. Wilce of the Department of Botany
at the University of Massachusetts who confirmed several of our identifica-
tions.
Kjellman's (1883) description and illustration of Rhodomela lycopodi-
oides f. flagellaris fits our specimen closely. However, Rosenvinge (1923-
24) treats this species and two others, R. virgata and R. subfusca, as
493

3-40
forms of one species, R. subfusca. This view is presently accepted by
Dr. Wilce, an authority on Arctic algae, thus our determination, R. sub-
fusca f. lycopodioides.
Several Laminaria specimens were collected with a branched holdfast
and occasionally one or two constrictions in the frond. These speci-
mens were determined as L. saccharina by Dr. Wilce who explained that the
constrictions were probably a result of the growth habit of the plant.
From our recent observations on the growth of L. solidungla and L.
saccharina we are inclined to agree. We also have collected specimens
of both species which possessed a branched stipe that gave rise to two
fronds.
Ecology of the Stefansson Sound KelpCommunity: Preliminary Results of Winter Studies
At the close of the 1978 summer field season several in situ bio-
logical experiments were initiated at DS-11. These experiments were to
be monitored through the 1978-1979 winter and were designed to: (1) de-
termine the seasonal growth rates of Laminaria, (2) determine the amount
of organic matter these plants contribute to the Arctic environment, (3)
determine the species composition and rate of recolonization on denuded
rock surfaces, and (4) to observe patterns of development or "succession"
on denuded rock surfaces. In conjunction with this work we collected
quantitative data on algal and attached invertebrate biomass, sedimenta-
tion rates, benthic infaunal densities and biomass, and made qualitative
observations on the physical and biological environment during each
sampling period. In the following discussion the preliminary results of
the experiments and observations made by the divers are reported.
The biggest surprise of this study to date was the substantial
growth of Laminaria solidungla between November, 1978 and February, 1979.
This was unexpected since the plants were in complete darkness and had
grown very little during the previous fall when light was believed to
be available. The average growth of Laminaria from mid August to mid
November, 1978, was 1.5 cm (ranges were from 0 to 2 cm from 20 plants)
compared to an average growth of 7 to 10 cm (ranges were from 5 to 22 cm
494

3-41
from 60 plants) between mid November, 1978 and early March, 1979. Anew constriction was also produced in the frond during this period. Itis believed that the constrictions in this plant are produced once ayear, and that the area between constrictions represent a year's growth.This winter growth occurred in virtual darkness since DS-11 is charac-terized by an extremely thick and dirty ice cover which is almost im-penetrable to light. This suggests these algae either; (1) are growingfrom stored nutrient reserves, or (2) are assimilating sources of carbonin their surrounding environment, i.e., are heterotrophic. New experi-ments, initiated in May and carried through the following winter, shouldanswer this question. Finally in view of the stable nature of the com-munity, a net export of organic matter to the marine environment equalto the production of new algal biomass should be considered.
In March, 1979 the biomass of the attached plant and animal biotawas determined by denuding several 1/4 m2 quadrats using a diver operatedairlift. The kelps Laminaria solidungla and L. saccharina constituted
over 95% of the total biomass. The biomass of Laminaria, corrected to100 percent cover, was calculated at 3.287 ± .588 kg/m2 (N=4). In Table3.6 this figure is compared to the biomass of Laminaria in kelp communi-ties on the northeast and west coasts of North America and to the biomassfound in other Beaufort Sea nearshore regions.
The underice cover at DS-11 was unique in comparison to the undericefeatures seen by the divers in other locations. It was characterized bya rough and dirty layer of soft slushy ice, ranging from .5 to 2 metersin thickness (Fig. 3.9). In March, 1979 many amphipods and scalewormpolychaetes, and some Arctic cod were seen in close association with thisunderice cover. No organisms were seen associated with the common smooth,hard underice regions. The structure and appearance of this slushy icehas prompted much speculation that the formation could be a result ofanchor ice formation (for a discussion see Reimnitz and Dunton, 1979).
A comparably low amount of sediment accumulated between November andearly March, 1979 compared to the August to November period. Sedimentaccumulations averaged 1-2 mm this winter compared to 2.5 - 5 mm last fall(Fig. 3.10). Water visibility increased from less than 2 meters in Novem-ber to over 7 meters in March. Slight water currents were also observed inMarch.
495

TABLE 3.6. Comparison of the Stefansson Sound kelp community to kelp communities on the east and west
coasts of North America and to other Beaufort Sea regions.

Fig. 3.9. A photograph of the underice surface at DS-11 showing a rough
and dirty ice undersurface.
Fig. 3.10. A photograph taken at DS-11 in November showing the sediment
accumulation on the kelp and poor visibility.
497

3-45
Hydroids appear to be the first colonizers on experimental plots de-
nuded in August, 1978. They were small (to 1 cm high) and scattered on
the rock surfaces, but absent in areas of remaining Lithothamnium cover.
Lithothamnium is widespread in the community and appears to force most
algae and invertebrates into competition for small pockets of unused
rock substrate (Fig. 3.4 and 3.8).
CONCLUSIONS
The Stefansson Sound kelp community appears to be similar in many
respects to kelp communities at more temperate latitudes. It is charac-
terized by; (1) an abundant and diverse flora and fauna, (2) a high utili-
zation of the rock substrate and competition between species for space,
(3) a kelp overstory of high biomass consisting of Laminaria spp., (4) an
algal understory of several red algal species and attached invertebrate
species, and (5) an apparently productive kelp community with an unknown
export of an organic matter to the marine ecosystem.
The list of animal and plant species of the Stefansson Sound kelp com-
munity is by no means complete. New species are continually being found
as taxonomic problems are worked out and collection techniques on rock sur-
faces improve. Much remains to be learned in regard to the growth of the
algae in the spring and summer period, their means of growth, and times of
reproductivity. In the next year recolonization studies should provide
data on the ability of the community to re-establish itself following
physical disturbances at different times. Finally, it is hoped that an-
swers to questions involving the trophic structure and the overall impor-
tance (or non-importance) of this community to the Arctic ecosystem are
reached.
498

SUMMARY OF 4th QUARTER
A. Field Activities
1. Field Trip Schedule
a. February 21: Dive team arrives in Deadhorse.
b. February 22-25: Locate DS-11, cut dive hole. NARL airlift ofparcoll and field supplies on February 24. Parcoll installationcompleted on February 25. Travel by NOAA and ERA (206) helicopter.
c. February 26-27: Conduct benthic and underice sampling program forLGL (RU-467) on additional OCS contract funding. Travel by NOAAhelicopter.
d. February 28-March 1: Divers collect mysids and amphipods for DaveSchneider (RU-356) for laboratory studies. Travel by NOAA heli-copter.
e. March 2-6: Extremely cold and windy weather. No field work con-ducted.
f. March 7-8: Divers work with Dr. Erk Reimnitz (USGS RU-205) on icefeatures, and collect data on in situ benthic experiments.
g. March 9: Collect benthic and underice samples and deploy experi-mental equipment for Dr. Andrew Carey (RU-6) on contract funding.Travel by NOAA helicopter.
h. March 10-13: Divers continue benthic ecological work--collectdata on sedimentation, recolonization and growth experiments.Travel by NOAA helicopter.
i. March 14: Complete sampling for Carey (RU-6) and retrieve experi-mental equipment (on contract funding). Retrieve sampling bottlesfor Don Schell (RU-537). Release bottom current drifters forReimnitz (RU-205). Terminate dive program. Dismantle and packparcoll for NARL. Travel by NOAA helicopter.
j. March 15: Dive team departs Deadhorse for Bellingham, Washington.
2. Scientific Party
a. Assistant Investigator and Team Leader: Ken Dunton, on salary.
b. Marine Technician* and SCUBA divers:
John R. Olson, on contract*Paul D. Plesha, on contractGary Frederick Smith, on contract
3. Methods
See text of annual report.
4. Sample Localities
See text of annual report.
5. Data Collected
See text of annual report.
499

3-48
LITERATURE CITED
Broad, A. C. 1978. Environmental assessment of selected habitats in the
Beaufort Sea littoral system. Environmental Assessment of the Alaska
Continental Shelf. Quarterly Report, September, 1978. Nat. Oceanic
Atmos. Admin., Boulder, Co. 17 p.
Broad, A. C., H. Koch, D. T. Mason, G. M. Petrie, D. E. Schneider, and
R. J. Taylor. 1978. Environmental assessment of selected habitats
in the Beaufort Sea littoral system. Environmental Assessment of the
Alaskan Continental Shelf. Annual Report. Nat. Oceanic Atmos. Admin.,
Boulder, Co. 86 p.
Collins, F. S. 1927. Marine algae from Bering Strait and Arctic Ocean
collected by the Canadian Arctic Expedition, 1913-1916. Report of the
Canadian Arctic Expedition 1913-1916. 4(B). p. 3-16.
Crane,J. J. and R. T. Cooney. 1974. The nearshore benthos. In: V. Alex-
ander, et al. (eds.) Environmental Studies of an Arctic Estuarine Sys-
tem, Final Report. Univ.Alaska, Inst. Mar. Sci. Rept. R74-1:411-466.
Dunton, K. H. 1979a. A survey of the biota and physical characteristics
of the Exxon Ice Island Site in Prudhoe Bay, Alaska. Unpubl. Rept. to
Exxon, USA. April, 1979. 29 p.
Dunton, K. H. 1979b. A diving study of an Arctic kelp community in the
Beaufort Sea. Alaska Magazine 45(6): In Press. (Anticipated June,
1979.)
Feder, H. M. and D. Schamel. 1976. Shallow water benthic fauna of Prud-
hoe Bay. In: D. W. Hood and D. C. Burrell (eds.) Assessment of the
Arctic Marine Environment, Selected Topics. Univ. Alaska, Inst. Mar.
Sci. Occ. Publ. No. 4:329-359.
Kjellman, F. R. 1883. The algae of the Arctic Sea. Kongliga Svenska
Vetenskaps-Akademiens Handlinger 20(5):1-349, 31 pls.
Leffingwell, E. de K. 1919. The Canning River region, northern Alaska.
U.S. Geol. Survey Prof. Paper 109. 251 p.
500

3-49
Mann, K. H. 1972. Ecological energetics of the seaweed zone in a marine
bay on the Atlantic coast of Canada. I. Zonation and biomass of sea-
weeds. Marine Biology 12:1-10.
Mohr, J. L., N. J. Wilimousky, and E. Y. Dawson. 1957. An Arctic Alaskan
kelp bed. Arctic 10:45-52.
Reimnitz, E. and K. Dunton. 1979. Diving observations on the soft ice
layer under the fast ice at Dive Site 11 in the Stefansson Sound boul-
derpatch. In: Barnes, P. and E. Reimnitz. The Geological Environ-
ment of the Beaufort Sea Shelf and Coastal Regions. Annual Report,
April, 1979. Nat. Oceanic Atmos. Admin., Boulder, Co. Attachment D.
Reimnitz, E. and R. Ross. 1978. The Flaxman boulders in Stefansson Sound:
a survey of the boulder patch. In: Barnes, P. and E. Reimnitz. Geo-
logic Processes and Hazards of the Beaufort Sea Shelf and Coastal Re-
gions. Quarterly Report, December 1978. Nat. Oceanic Atmos. Admin.,
Boulder, Co. Attachment B. 10 p.
Reimnitz, E. and L. Toimil. 1976. Diving notes from three Beaufort Sea
sites. In: Barnes, P. and E. Reimnitz. Geologic Processes and Haz-
ards of the Beaufort Sea Shelf and Coastal Regions. Quarterly Report,
December, 1976. Nat. Oceanic Atmos. Admin., Boulder, Co. Attachment
J. 7 p.
501


Trophic Relationships of the Arctic
Shallow Water Marine Ecosystem
by
D. E. Schneider and H. Koch
Introduction
The continued investigation of the trophic relationships of the shallow
water Beaufort Sea ecosystem by RU-356 during 1978 employed two approaches.
In 1977 we collected data on the composition of fecal pellets and gut con-
tents of some of the common species. This approach was continued in 1978
to provide data on species not studied in 1977 and to provide more complete
data on species that were only briefly studied previously. The 1977 in-
vestigations also suggested that some species, particularly the amphipod
Gammarus setosus, might utilize terrestrial plant detritus that erodes into
the marine ecosystem as peat. In 1978 we conducted a series of experiments
to assess the ability of selected species to derive nutrition from peat.
Methods
Composition of Fecal Pellets and Gut Contents
The following uniform procedure was used for all of the observations
of fecal pellet composition and gut contents. A single pellet or gut con-
tents was thoroughly teased apart on a microscope slide and covered with a
cover slip. Four complete, non-overlapping traverses of the slide were
made at 400x magnification and all identifiable structures were counted.
Following this, the entire slide was examined at lOOx to note structures
not seen in the traverses.
Peat Particle Size Fractionation
Peat used in this study was collected at Brant Point in Elson Lagoon
near Barrow, Alaska. The samples were wet sieved in Millipore filtered (04 5p)
sea water through a graded series of nitex screens to provide the particle
503
4-2
size fractions used in experiments. The following screen sizes were used:
63µ, 102µ, 202µ, 425µ, and 1050µ, or 1163µ. Sieved samples were stored in
Millipore filtered seawater in a 4°C incubator under a 24 hour photoperiod
until used.
Assimilation Experiments
All of the assimilation experiments employed the following procedure.
The quantityof food ingested during the experimental feeding period was
estimated by determining the difference in dry weight between initial and
recovered food. Dry weights for initial food could not be directly deter-
mined without destroying the natural microflora associated with the food.
Instead two different procedures were used to estimate the initial amount
of food offered to each animal. In experiments where a small food particle
size was used, a fixed volume of a constantly stirred heavy suspension of
the particles was delivered to each experimental chamber with a wide bore
automatic pipette. At least 10 control samples were delivered into separ-
ate containers for immediate dry weight and ash weight analysis to provide
an estimate of the amount of food delivered to the experimental chambers.
In experiments where a coarse peat particle size was used, a small quantity
of peat (about 40-50 mg damp weight) was rolled into a ball and pressed be-
tween two sheets of Whatman No. 1 filter paper for one minute using the
two halves of a petri dish. The blotted samples were then rapidly weighed
to the nearest 0.1 mg and were placed in the experimental chambers. At
least 10 control samples were similarly prepared for direct dry weight and
ash weight analysis. The control samples were used to provide a damp to
dry weight conversion factor to allow estimates of the dry weights placed
in each chamber.
Animals that had been starved long enough to allow complete evacua-
tion of their guts were individually placed in separate experimental cham-
bers containing the initial food ration and Millipore filtered sea water.
Experiments on fine peat particle sizes were carried out in 100 ml beakers
containing about 70 ml of sea water. The chambers used for large food par-
ticle sizes were 250 ml beakers containing about 200 ml of Millipore fil-
tered seawater with a 1163µ nitex screen shelf about halfway up the beaker.
504

4-3
This arrangement allowed fecal pellets to fall through the screen to the
bottom of the beaker where they could be more easily separated from food
particles. After a known period of exposure to the food, the animals were
removed to clean Millipore filtered seawater and allowed to remain there
for 24 hours to clear their guts. Fecal pellets were removed from the
feeding and gut clearance chambers with a Pasteur pipette, transferred to
a thin strip of 121µ nitex screen. The screen and pellets were blotted on
filter paper and briefly rinsed three times with distilled water. Pellets
were then transferred to a pre-ashed and tared aluminum foil pan, dried at
60°C for at least 12 hours, and weighed to the nearest 0.01 mg on a Cahn
model DTL electrobalance. Dry pellets and pans were then ashed in a
muffle furnace at 500°C for either 2 or 24 hours and reweighed. It was
found that there was no further decrease in weight when a 2 hour ashed
sample was further ashed for 24 hours. Food remaining after the feeding
period was recovered by suction filtration (< 1/3 atmosphere) on pre-ashed
(475°C for 30 minutes) and tared 2.4 cm Whatman GF/c glass fiber filters,
rinsed twice with 2 ml of distilled water, dried for at least 12 hours at
60°C, and weighed on a Cahn model DTL electrobalance. Dry filters and
food were then ashed in a muffle furnace at 500°C for either 2 or 24 hours,
and reweighed.
Food ingested was calculated as the difference in dry weights of the
initial and recovered food. Percent organic content of initial food and
recovered fecal pellets was calculated from the ash-free weights and the
unashed dry weights. These values were then used to calculate two differ-
ent assimilation efficiencies. Gravimetric assimilation efficiency was
calculated using the relationship
[FORMULA]
where U is the percentage of assimilation, I is the dry weight ingested,
and N is the dry weight excreted as feces. This efficiency measures total
assimilation which includes both organic matter and ash. Organic assimila-
tion was calculated using Conover's (1966) equation.
[FORMULA]
505

4-4
where U' is the percentage of assimilation, and F' and E' are the ash-free
dry weight : dry weight ratios for ingested food and feces produced re-
spectively.
ATP Content of Peat and Fecal Pellets
ATP was extracted from peat samples and fecal pellets by immersion in
5 ml of sterile 0.02M Tris buffer pH 7.75 in a boiling water bath for 5
minutes. Extracts were frozen if they were not to be assayed immediately.
Assay of the ATP content of the extracts was made by measuring the light
output from a firefly luciferin-luciferase enzyme system with a liquid
scintillation counter as the photodetection device.
The enzyme preparation was made by suspending 50 mg of firefly lantern
extract (Sigma FLE-50) in 5 ml of sterile 0.02M Tris buffer pH 7.75. The
suspension was allowed to stand at room temperature for 2-3 hours, centri-
fuged in a clinical centrifuge for 10 minutes and the supernatent was de-
canted into a clean vial. ATP standards were made by dilution of a stock
solution of lOpg ATP (Sigma Na Salt) per ml of 0.02M Tris buffer pH 7.75.
Final concentrations of the standard solutions were 2 x 10⁻², 1 x 10- 2,
1 x 10-³, and 1 x 10-[superscript]4, µg ATP/0.1 ml.
Assays were carried out in liquid scintillation vials containing a
total of 2.0 ml of fluid. Each vial contained 0.1 ml of extract or stan-
dard solution, 0.1 ml of enzyme suspension, and 1.8 ml of 0.02M Tris buf-
fer pH 7.75. The enzyme suspension was added last to initiate the reac-
tion. A Nuclear Chicago model 6848 liquid scintillation counter, set in
a non-coincidence mode (Stanley and Williams, 1969) was used to detect the
light output from the reaction. Channel A was set at zero attenuation and
a 2 to 10% window was used. Upon addition of the enzyme, the vial was
rapidly capped, swirled to mix the solution, and placed on the sample ele-
vator. Counting commenced as soon as the vial reached the counting chamber
and the first 0.1 minute count was used. Standard curves were run approxi-
mately every 30 minutes while processing samples.
Specific details of individual experiments are presented in the fol-
lowing section along with the results.
506

4-5
Results and Discussion
Fecal Pellet Composition
The composition of freshly collected fecal pellets was examined using
the standardized observation procedure described in the methods section.
The mean number of items was computed for each recognizable food category.
These values were then used to calculate the percent composition of the
fecal pellets. The results for those species in which five or more pellets
were examined are presented in Figs. 4.1 to 4.8. For those species in
which fewer than five pellets were examined, the results appear in Table
4.1.
Most of the species studied ingest substantial numbers of diatoms and
at least some peat. Since many of the diatoms observed are benthic and
most of the pellets contained a high proportion of mineral grains, deposit
feeding may be important in a number of these species. A smaller propor-
tion of the species ingest crustaceans (53%) and polychaetes (32%), how-
ever most of these appear to be omnivorous because diatoms and peat are
often major dietary components. Whether those crustaceans and polychaetes
that were ingested were captured alive or as detritus is not known. Ob-
servations of mysids and many of the amphipods under laboratory feeding
situations indicate that these species will readily consume dead animal
tissue. The most striking feature of these data is that there is consid-
erable dietary overlap between the species. None of the species studied
appear to be trophic specialists. However there is some indication of dif-
ferent patterns of food selection. For instance, Mysis littoralis, Gam-
marus setosus and perhaps Haploscoloplos elongatus appear to ingest sub-
stantially more peat than the other species studied. Mysis littoralis,
Onisimus litoralis, Acanthostephia behringensis, Gammaracanthus loricatus,
and Myoxocephalus quadricornis all ingest more crustaceans than the other
species. Saduria entomon, Myoxocephalus quadricornis, and perhaps
Haploscoloplos elongatus feed heavily on polychaetes. The high proportion
of diatoms ingested indicates that primary production of the benthic micro-
algae is an important source of energy input for the arctic shallow water
marine ecosystem, at least during the summer when these pellets were
collected.
507

4-6
Fig. 4.1. Fecal pellet composition of the mysid Mysis litoralis. The
percent composition is based upon the mean number of recognizable food
items observed in 34 fecal pellets.
PD = Pennate diatomsCD = Centric diatomsDC = Diatom chainsAR = Amphipleura rutilans - a colonial benthic diatomFA = Filamentous algaeD = DinoflagellatesP = Peat including plant fibersCF = Crustacean fragmentsPS = Polychaete setaeSS = Sagitta (Chaetognath) setae
Fig. 4.1. Fecal pellet composition of the amphipod Gammarus setosus.
The percent composition is based upon the mean number of recognizable
food items observed in 24 fecal pellets. Figure labels as in Fig. 4.1.
508

509

4-8
Fig. 4.3. Fecal pellet composition of the amphipod Onisimus litoralis.
The percent composition is based upon the mean number of recognizable
food items observed in 17 fecal pellets. Figure labels as in Fig. 4.1.
Fig. 4.4. Fecal pellet composition of the amphipod Apherusa glacialis.
The percent composition is based upon the mean number of recognizable
food items observed in 19 fecal pellets. Figure labels as in Fig. 4.1.
510

511

4-10
Fig. 4.5. Fecal pellet composition of the isopod Saduria entomon. The
percent composition is based upon the mean number of recognizable food
items observed in 15 fecal pellets. Figure labels as in Fig. 4.1.
Fig. 4.6. Fecal pellet composition of the polychaete Terebellides
stroemi. The percent composition is based upon the mean number of
recognizable food items observed in 12 fecal pellets. Figure labels
as in Fig. 4.1.
512

513

4-12
Fig. 4.7. Fecal pellet composition of the caprellid Caprella sp.
The percent composition is based upon the mean number of recognizable
food items observed in 5 fecal pellets. Figure labels as in Fig. 4.1.
Fig. 4.8. Fecal pellet composition of the fish Myoxocephalus guadricor-
nis. The percent composition is based upon the mean number of recogniz-
able food items observed in 17 fecal pellets. Figure labels as in Fig.
4.1.
514

515

Table 4.1. Percent of Recognizable Food Items in Fecal Pellets. Percentagesare based upon the mean number of food items identified per pellet using thestandardized observation technique.
516

4-15
Gut Clearance Times
In animals that produce discrete fecal pellets, the quantitative col-
lection of these may often be a better index of feeding activity than
attempting to estimate the amount of food actually ingested. As we intended
to quantitatively collect fecal pellets in some of our experiments it was
necessary to determine the gut clearance times for the species used.
An experiment was set up to determine the gut clearance time for the
amphipod Gammarus setosus using freshly collected specimens. Twenty-four
G. setosus were placed individually in compartments of a plastic box im-
mediately after they were collected. Each compartment contained about 50 ml
of Millipore filtered sea water. Fecal pellet production was monitored at
30 minute intervals for 9.5 hours. After about 6.5 hours there was no sig-
nificant increase in the number of pellets produced. The mean clearance
time, calculated by averaging the times of last pellet production for each
animal, was 4.9 hours and a mean of 9.2 pellets was produced during this
period. In a later feeding experiment with G. setosus it was noted that
fecal pellets began to be released about 4.5 hours after the starved ani-
mals were presented with food. These data suggest that this species re-
quires about 4.5 to 4.9 hours to pass food completely through the gut.
The design of subsequent feeding experiments took the above information
into account.
A similar gut clearance experiment was set up using the amphipod
Onisimus litoralis. Gut clearance for this species appears to be much
slower than that for G. setosus. After 72 hours, when the experiment was
terminated, only 4 animals out of 24 appeared to have cleared their guts
and fecal pellets were still being slowly produced. It was concluded that
0. litoralis was not ideal for egestion rate studies and no further experi-
ments were planned for this species using this technique.
Sediment Feeding Experiments
Casual observations of the behavior of Gammarus setosus suggested that
this species may ingest fine silty sediments. During the period of ice
cover a layer of silt is deposited among the coarser gravel of the near-
shore sediments. As the ice begins to melt away from the shore, G.
setosus is extremely abundant in this area, often entering the interstices
517

4-16
of the gravel sediments. Animals collected with silt laden water from
this area produced large numbers of fecal pellets over a several day period.
Several experiments were designed to examine the ability of this species
to ingest sediments. Fine sediments contain large populations of diatoms
as well as adsorbed organic material.
Unfiltered sea water containing suspended sediment that had been
stirred up from the nearshore gravel was used to fill a compartmented plas-
tic box. Individual G. setosus that had been starved for 24 to 30 hours
prior to the experiment were introduced into each of the 24 compartments
of the box. The box was held in a lighted incubator at 5°C during the
experiment. Fecal pellet production was monitored at hourly intervals for
14 hours. After an initial lag of about 3-4 hours, pellet production was
nearly linear for the duration of the experiment. At 14 hours the mean ±
S.E. number of fecal pellets produced per animal was 13.0 + 1.7.
An experiment was designed to provide information on the range of
particle sizes that can be ingested by G. setosus. Silty sea water
(salinity <5%) was collected by mechanically stirring up the sediments
prior to taking the water sample. Small volumes of this water were passed
through one of the following graded series of sieves to provide a series of
solutions from which particles of different sizes had been selectively re-
moved: (a) unsieved silty water; (b) 202µ Nitex screen; (c) 121µ Nitex screen;
(d) 62µ Nitex screen; (e) 8µ Nuclepore polycarbonate membrane; and (f) 0.45µ
Millipore filter. The 8 Nuclepore membrane tended to clog so rapidly that
it was necessary to prefilter this solution through Whatman No. 5 filter
paper before passing it through the membrane. Even with this treatment it
was necessary to change the Nuclepore membrane every 75 - 100 ml, indica-
ting that particles >8µ were passed by the Whatman No. 5 filter.
Twelve G. setosus were placed individually in compartments of a plas-
tic box containing about 50 ml of the above solutions. Fecal pellet pro-
duction was recorded at hourly intervals for 11 hours. At each observa-
tion the pellets were removed to a second compartmented box. The
accumulated pellets were briefly rinsed in distilled water and dried at
60°C for 12 hours. Pellet dry weights were determined to the nearest
0.1 mg on a Cahn DTL electrobalance. The amphipods used in this experiment
were also rinsed in distilled water and dried at 60°C for 48 hours prior to
weighing.
518

4-17
Fig. 4.9 shows the cumulative dry weight of fecal pellets produced in
each sieved solution during the 11 hour feeding period. G. setosus is
apparently capable of ingesting and forming fecal pellets from particles
down to <62µ in diameter, but not those particles <8µ or the <0.45µ frac-
tions. After the experimental period, those amphipods used in the smallest
two size fraction were offered unfiltered silty water to verify that they
were capable of producing pellets. All of these animals produced number-
ous pellets except for one individual in the <8p group. An analysis of
variance was performed on the data from those treatments in which fecal
pellets were produced. None of these sievings above the 8p level resulted
in a significant effect on cumulative fecal pellet weight.
During the above experiment it became obvious that the largest indi-
viduals were producing fewer fecal pellets than the small amphipods. The
relationship between body size and fecal pellet production is presented
in Fig. 4.10 for the unfiltered and 202µ filtered treatments. A log
transformation of the data results in a better straight line fit than an
arithmetic plot, indicating that fecal pellet production on this food
source is exponentially related to body size. It is obvious that small
individuals produce a greater quantity of feces than the large animals.
This may indicate that large G. setosus are not predominantly sediment
feeders, while small individual can rely on this resource. Another fac-
tor that may be partially responsible for this relationship is the well
known effect of body size on metabolism in which the metabolic rate of
small individuals is higher on a per gram basis than that of large individ-
uals. However the slope of the metabolism--weight regression is usually
close to -0.27 whereas that of the above fecal production--weight regres-
sion is much higher; -0.67 and -1.0 for the two data sets presented.
Peat Feeding Experiments
A series of experiments was set up to assess the role of terrestrial
plant detritus (peat) in the trophic relationships of the shallow water
marine ecosystem. Information relating to the following major questions
was sought by these experiments:
1) Do animals that ingest terrestrial plant detritus derive anynutrition from this material?
519

Fig. 4.9. Fecal pellet production by Gammarus setosus fed on different
particle sizes derived from suspended sediments. The quantity shown is
the cumulative dry weight of fecal pellets produced during an 11 hour
feeding period.
520

Fig. 4.10. The relationship between fecal pellet production and body
size in Gammarus setosus fed on suspended sediment particles. The 202µ
filtered fraction contained only particles smaller than this size.
521

4-22
2. If these species derive nutrition from this detritus, are theyable to utilize the material directly or are they digesting themicroorganisms that may be the primary agents of decomposition?
3. Do the species that utilize terrestrial plant detritus prefer aparticular size fraction? In other words, is there a hierarchyof species required to utilize this material fully, some dealingwith fairly large particles and reducing them to smaller sizeswhile other species only operate on small particle sizes?
Studies conducted during the summer of 1977 suggest that the abundant
amphipod Gammarus setosus actively ingests large peat particles and in the
process breaks them down into small size pieces. None of the other spe-
cies investigated that summer even approached the ability of G. setosus
to process peat particles. For this reason, the majority of the experi-
ments were designed using this species as the test organism.
Organic content of peat size fractions. Peat enters the Arctic
Marine ecosystem primarily as a result of erosion of receding coastlines.
During this process, several stages can be recognized. First, undercut-
ting of an eroding bluff by wave action causes a slumping of surface
layers of sod and peat towards the active beach region. Further erosion
causes pieces of this surface layer to fall onto the wave swept position
of the beach. Breakup of these consolidated pieces is not immediate
though and recognizable clumps can be observed in the shallow water for
some time. Finally the wave action and currents completely disperse the
clumps and distribute the peat particles throughout the marine system.
The changes in organic content of peat as it progresses through this ero-
sional process are of some interest since the peat may serve as a potential
nutritional source.
Peat samples from three different stages in the above erosional pro-
cess were obtained near Brant Point in Elson Lagoon. A portion of each
sample was wet sieved through a graded series of nitex screens to yield
six different particle size classes. Samples of each size class were then
analyzed for organic content using the weight loss upon ignition in a
muffle furnace.
The results of these analyses are shown in Table 4.2. Shallow water
peat that has been in the marine system for some time has the lowest or-
ganic content. The peat from the clump on the beach and the eroding tundra
that has not yet entered the marine system are quite similar in organic
522

Table 4.2. Organic Content of Peat Particle Size Fractions. Derived fromseveral different sources.
523

4-24
content except for the smallest size fraction. In most cases the smaller
size fractions have a lower organic content than the larger particle
sizes. Both of these trends may be the result of biological decomposition
processes. Small sized particles in both terrestrial and the marine
ecosystem may be formed as decomposer organism utilize the detritus.
Microscopic examination of the size fractions of the shallow water peat
suggest that a high proportion of the material in the two smallest size
classes may be derived from fecal pellets of amphipods and other shallow
water marine animals. The material in the 63 < x < 10 2µ size fraction was
in clumps that teased apart in a similar manner as the amphipod fecal
pellets. The <63µ fraction contained a high proportion of material that
looked identical to a fecal pellet that had been already teased apart.
If this suggestion is correct, the lower organic content of the small
particle sizes may be the result of utilization of the less refractory
organic material by shallow water organisms. Some of the decline in
organic content after the peat enters the marine ecosystem may be the
result of leaching of organic material from the particles.
Peat particle size fraction feeding experiment. An experiment was
set up to determine the capabilities of G. setosus to feed upon and
assimilate organic material from different particle sizes of peat. The
peat used in the experiment was derived from the same sample that was
used for organic content analysis of shallow water peat presented in Table
4.2. Size fractions were also the same as used in the organic content
analysis. Eight replicate samples of each size fraction were introduced
into compartmented polystyrene boxes by pipetting 2 ml aliquots of a con-
stantly stirred heavy suspension into each compartment with a large bore
automatic pipette. Each compartment contained about 50 ml of Millipore
filtered sea water (31% salinity). The >1050µ fraction could not be
pipetted and instead 5 mg damp weight was placed in each compartment.
One G. setosus, previously starved for several days, was introduced into
each compartment. Fecal pellet production was monitored over a 10.5 hour
period and pellets were removed to another container at approximately 1
hour intervals. At the end of 10.5 hours amphipods were removed to clean
524
4-25
boxesto allow gut clearance. All fecal pellets from each animal were
pooled for dry weight and organic content determination.
Fecal pellet production was much higher when the amphipods were feed-
ing on the smallest size fraction, <63µ, than when larger particles were of-
fered (Fig. 4.11). A 1-way analysis of variance followed by a Newman-Keuls
multiple range test indicate that there is a significant effect of particle
size on fecal pellet production (p < .01) but that only the <63µ size
fraction treatment was significantly different from the others (p < .05).
Assimilation efficiencies were calculated from the organic contents of
peat and feces using Conover's (1966) equation and these values are pre-
sented in Table 4.3. Assimilation of organic matter is inversely related
to peat particle size. Substantial assimilation only occurred when G.setosa was feeding on the largest size fraction. Assimilation was still
positive but not high with the 425 < x < 1050µ fraction and became increas-ingly negative with smaller size fractions. Since the organic content of
the peat is also inversely correlated with particle size (Table 4.3) it
is possible that the high feeding rate with the smallest particle size is
a response to the decreased organic content of this fraction. If so, the
increased feeding rate is of no apparent benefit to the amphipod with
this food source since the assimilation is so negative (-40.9%). On another
food source with less refractory organic matter this behavior could have
adaptive significance. Further experiments are necessary to determine
whether feeding rates are actually related to organic content of food.
Peat assimilation experiments with Gammarus setosus. A more detailed
series of experiments was designed to investigate the ability of G. setosus
to assimilate organic material from peat and other terrestrial plant de-
tritus. The general procedures followed in all of these experiments were
those described earlier in the methods section. An estimate was made of
the initial dry weight of food presented to each animal and the final
amount of food following feeding was quantitatively collected for dry weight
analysis. The difference between these two values provided an estimate
of the dry weight of the food ingested. This value was used along with the
dry weight of fecal pellets produced to calculate the gravimetric
525

Fig. 4.11. Fecal pellet production rate by Gammarus setosus fed on
different particle sizes of peat.
526

Table 4.3. Gammarus setosus Peat Size Fraction Feeding Experiment
527

4-29
assimilation efficiency for the food used. In addition, the organic
content of both food and feces was determined so that the percent
assimilation based upon Conover's (1966) equation could be calculated.
In view of the large discrepancies between the gravimetric and
Conover's assimilation efficiencies in the experiments about to be
described, a discussion of the relative reliability of these measure-
ments seems in order. Of the two efficiencies, the gravimetric assimila-
tion is probably most prone to experimental error. To calculate this
assimilation an accurate estimate of dry weights of food ingested and feces
produced must be obtained. Unfortunately the peat could not be dried to
provide an accurate measure of the amount of food offered to each animal
without destroying the natural microflora associated with the peat. Instead
an indirect measure of the initial amount of peat had to be used. In the
case of small particle sizes, replicate aliquots were directly filtered
on tared glass fiber filters for dry weight analysis. The pipetting of
suspensions of particles cannot be absolutely precise and in some cases
the total range of weights was as much as 6-7% of the total weight delivered
to the experimental containers. Experiments with coarse fractions of peat
necessitated the use of a standard blotting technique and the determination
of a damp dry weight for the initial peat offered to each animal. Dry
weight values were estimated by using a damp dry to dry weight conversion
factor derived by directly determining the dry weight of damp-dried portions
of the same peat. The errors associated with blotting to a consistant
damp weight can be considerable even when care is taken to use a standar-
dized procedure. Finally, the quantitative collection of fecal material
can be a problem. Fecal pellets produced on small particle size fractions
of peat tend to be well formed and are easily recognizable from the food
particles. However, the pellets formed while feeding on coarse peat par-
ticles, although initially well formed, tend to fragment easily. Although
an effort was made to preserve the integrity of these pellets by letting
them fall through a screen to separate them from the food and animal, there
still may have been some loss of fecal material. A low estimate of food
production would bias the assimilation efficiency upwards.
528

4-30
The sources of experimental error associated with the Conover's
assimilation efficiency are fewer. As long as an adequate sample of foodand feces can be obtained, the primary source of error is associated with
the actual dry weighings and ashing process. There are, however, two
assumptions that are made when this equation is used. First, the foodsample taken for organic analysis must be identical in composition to the
material actually ingested. Second, it is assumed that there is no ash
assimilation and that the dry weight of ash in the feces is the same as
the ash dry weight ingested. The first assumption is probably correct for
G. setosus as long term peat feeding experiments conducted during thesummer of 1977 showed that this species would eventually ingest nearly
all of the coarse peat offered. The second assumption may not be correct.
Ash assimilation has been found to be substantial in other studies of
aquatic animals (Lasenby and Langford, 1973; Pavlyutin, 1970) and in the
present experiments the ash content of the feces was frequently lower than
the estimate of ash ingested. It should be pointed out though that the
estimate of ash ingestion by gravimetric methods is confounded by the same
errors encountered in the estimation of total food ingestion. If there
is significant ash assimilation, the estimate of organic assimilation by
Conover's equation will be low. Conover's equation therefore provides a
conservative estimate of organic assimilation. In the present study where
we are interested in determining whether animals are capable of deriving
nutrition from specific food items, use of the method of calculating assi-
milation efficiencies that is most conservative and least subject to
experimental error seems preferable. For this reason, the majority of
the conclusions will be based upon the Conover assimilation efficiencies.
Two experiments were run using small sized peat particles from shallow
marine water as food. The <63µ fraction was used in the first experiment
and the 63 < x < 102µ fraction in the second. The results of these experi-
ments are shown in Table 4.4. When the <63µ was used as food the gravi-
metric assimilation was very low. A paired sample t-test comparing the
dry weight ingested with the dry weight of the feces indicated no signi-
ficant difference (p > .05) between the means. Therefore the gravimetric
529

Table 4.4. Terrestrial Plant Detritus Feeding Experiments with Gammarus setosus.

4-32
assimilation of 3.9% should not be considered different from zero. The
organic content of the fecal pellets was found to be significantly higher
(t-test p < .05) than that of the food. This caused the assimilation
efficiency based upon Conover's (1966) equation to be negative. Similar
trends were found when the 63 < x < 102µ fraction was used, except that
the dry weight of the food ingested was significantly higher (t-test
p < .05) than the dry weight of feces produced. This indicates that
the gravimetric assimilation of 31.2% is greater than zero. However the
Conover assimilation was negative as a result of a significantly greater
percent organic (paired sample t-test p < .05) in the feces than in the
food. It is concluded from these experiments that G. setosus does not
derive any nutrition from peat particles smaller than 102µ.
Three experiments were set up using a coarse fraction of peat >1mm
particle size. The peat was collected in the shallow water of Elson Lagoon
and had been exposed to marine conditions for an undetermined amount of
time. Table 4.4 shows the results of these experiments. The gravimetric
assimilation values are widely divergent among the three experiments,
although the mean dry weights ingested are in all cases significantly higher
than the mean dry weights of all the feces (t=tests p < .05). Errors in
estimating the initial food offered and the fecal material produced are
suspected as a contributing factor to this variation. The Conover
assimilation efficiencies are surprisingly high and reasonably consistent.
Considering the refractory nature of the organic material left in the peat,
assimilation efficiencies as high as 65-75% were not anticipated. Although
peat that has been exposed to marine conditions develops a microflora of
bacteria, diatoms, and filamentous algae, microscopic examination of this
material suggests that these components comprise a very small fraction
of the peat by weight. The only other reasonable conclusion is that G.
setosus is somehow able to digest and assimilate the refractory organic
materials that comprise the terrestrial plant detritus. Other animals
that utilize cellulose and other plant structural organic compounds usually
must do so with the help of symbiotic microorganisms. The enzymes necessary
for the digestion of these materials are rare in animals. Whether this
is true in G. setosus must await further experimentation.
531

4-33
Since G. setosus can apparently utilize a coarse fraction of peat
that has been soaking in seawater for some period, its ability to utilize
plant detritus that has just entered the marine system became of interest.
Two experiments were set up to examine the assimilation of peat from an
eroding tundra bank. The peat was collected from a slumped surface slab
of tundra near Brant Point in Elson Lagoon. The material had not yet
entered the marine system but was in the process of eroding into the active
beach. The peat was sieved to retain the >1mm fraction of particles.
Two different procedures were employed in the experiments. The first
experiment used peat that had been soaked in Millipore filtered sea water
for 2 days. This procedure was employed to soften the peat and allow
clumps to be broken up without exposing the material to marine microbes.
The second experiment used peat that had been soaked in raw unfiltered
sea water for one week at 5°C in a lighted incubator. Presumably this
treatment allowed some marine microbes to develop on the peat.
The results of these experiments are presented in Table 4.4. Again
the gravimetric assimilation efficiencies are widely divergent. In the
first experiment where the peat was not presoaked in raw sea water there
is a significant difference between the mean dry weight of food ingested
and fecal pellets produced (paired sample t-test p < .05). However in
the second experiment these values are not significantly different (paired
sample t-test p > .05). This suggests that the assimilation efficiency
of -33.3% is not really different from zero. Errors in estimating the
initial dry weight of peat in this second experiment were apparent
as several of the animals showed negative ingestion but produced at least
1 mg of fecal pellets. The true gravimetric assimilation has probably
been underestimated in this case. The percent organics for food and feces
are not significantly different for either experiment (t-test p > .05).
Therefore the low values for the Conover organic assimilation efficiency
are not significantly different from zero. This indicates that G.
setosus apparently cannot derive nutrition from peat that has recently
entered the marine ecosystem. Even after the eroding tundra peat has
soaked in raw sea water for a week there is no change in the ability of
532

4-34
G. setosus to assimilate the peat. Apparently a longer residence time in
the marine system is necessary before the material can be used. Exactly
what changes take place to make the peat more easily assimilated is not
clear at this point.
As tundra surface material erodes into the marine system it is
inevitable that freshly killed vegetation will also become available as
a potential food item. It was of interest to contrast the assimilation
of this fresh material with that of the older more completely decomposed
terrestrial peat. Two experiments were set up using dried tundra vege-
tation as the food. Only the above ground leaves were used and these
were dried in the laboratory at 20°C before use. Control and experimental
portions of the dried material were weighed out and introduced into the
chambers. The control portions were allowed to soak in Millipore filtered
sea water for the same length of time as the experimental portions to
allow a correction for loss due to leaching. Two different soaking pro-
cedures were employed in the experiments. In the first experiment the
dried vegetation was placed directly into the experimental chamber without
any presoaking. In the second experiment, the dried material was soaked
in raw sea water for 10 days prior to being offered to the amphipods.
The control portions for this second experiment also underwent a 10 day
soaking in raw sea water to correct for leaching.
The results of these experiments appear in Table 4.4. Gravimetric
assimilation efficiency is high in both experiments and the mean dry weights
of ingested food and feces produced are significantly different (paired
t-test p < .05). In these experiments the estimate of the initial amount
of food offered is more reliable than in the previous experiments because
the material was dried before the portions were weighed out. The Conover
assimilation efficiencies are high for both experiments and the percent
organics for food and feces are significantly different (t-test p < .05).
There is a suggestion that the assimilation of the grass soaked in raw
sea water is lower than that of freshly immersed grass. This trend could
be the result of loss of easily assimilated organic material by leaching.
During the soaking process there was an obvious loss of some material
into the water and tiny oil droplets appeared in the chambers. Although
533

4-35
the assimilation of dried tundra grass is similar to peat from shallow
marine waters, the material being removed in each case may be quite dif-
ferent. The dried grass should still contain a high proportion of fairly
easily digested organic compounds whereas these less refractory components
should have disappeared from the peat that has soaked in the marine eco-
system for some time.
In summary, the results of the peat feeding experiments with G.
setosus indicate that this amphipod can assimilate organic matter from a
coarse particle size fraction of peat provided it has been in the marine
ecosystem for a period of time. G. setosus does not assimilate organic
matter from fine particulate fractions of marine peat nor from coarse
fractions of peat freshly eroded into the marine ecosystem. This species
can assimilate organic matter from dried fresh tundra vegetation that
has freshly entered the marine ecosystem.
Laminaria assimilation by Gammarus setosus. Fragments of the kelp.
Laminaria are frequently found in the shallow waters during the summer
months. Apparently these plants are only found growing in those areas
where boulders or cobbles provide the necessary attachment for their
holdfasts. Although these areas are not abundant along the Beaufort
Sea coast, there is enough release of material from these algal communi-
ties to provide a potential supplemental nutritional source for shallow
water organisms. An experiment was set up to examine the ability of G.
setosus to assimilate pieces of Laminaria detritus. The Laminaria pieces
were cut into equal sized small squares, damp dried by pressing between
sheets of Whatman No. 1 filter paper with a petri dish, and weighed before
placing them in the experimental chambers. Control squares were damp
dried using the same technique, weighed, fried at 60°C for at least 12
hours and reweighed to provide a dampdry to dry weight conversion for the
experimental squares. The remaining procedures were the same as described
in the Methods section for the coarse peat feeding experiments.
The results for this experiment are shown in Table 4.5. There was
good agreement between the gravimetric and Conover assimilations for this
experiment. Estimates of the initial amounts of food presented are fairly
534

Table 4.5. Laminaria detritus feeding experiment with G. setosus.

4-37
reliable due to the consistancy with which this material could be blotted
to a damp dry weight. The results indicate that G. setosus can success-
fully use drifting Laminaria pieces as food. Microscopic examination
of fecal pellets produced on this food source indicated that the contents
of most of the cells were digested.
Mysis littoralis peat feeding experiments. Mysis littoralis is a
common shallow water species that has been frequently observed in areas
rich in peat. Experiments during the summer of 1977 with mysids feeding
upon a coarse peat fraction were inconclusive. There was some indication
of a low level of feeding on these large particles, but the results were
not statistically significant. Preliminary observations with this species
indicate that a wide range of particle sizes of peat can be ingested and
fecal pellets are produced. The ability of Mysis littoralis to assimilate
fine particulate fractions of peat was investigated in three experiments.
Two experiments were run during August 1978, the third was run in February
1979 under winter conditions of temperature, salinity and photoperiod.
In the first and third experiment food ingestion and fecal pellet production
were not quantitatively estimated. Samples of food and feces were processed
for organic content analysis so that Conover's assimilation could be cal-
culated. In the second experiment food ingestion and fecal pellet produc-
tion was quantitatively measured to allow gravimetric assimilation to be
calculated.
The results of the Mysis peat assimilation experiments appear in
Table 4.6. The gravimetric assimilation for the second experiment is
low but may be considered greater than zero because the dry weight in-
gested is significantly greater than the dry weight of feces produced
(paired t-test p < .05). The percent organic for food is not significantly
different from the percent organic for feces in any of the experiments
(t-tests p > .05). This indicates that none of the Conover assimilation
efficiencies are different from zero. Although Mysis littoralis will
ingest small peat particles, it appears that they do not derive any nu-
trition from them.
536

4-38
ATP analysis of food and feces. ATP content has been used as a
measure of microbial biomass in ecological studies (Holm-Hansen and
Booth, 1966; Lopez et. al., 1977). Studies have shown that ATP does not
occur free from living cells and the ATP content of living cells is
fairly constant. The determination of ATP content per unit of biomass
for a number of diatoms and bacteria in pure culture has provided a basis
for estimating microbial biomass. A C:ATP ratio of 285:1 has been sug-
gested as an average value (Holm-Hansen, 1973) and that value is used
in this study. Several experiments were set up to measure the ATP content
of food and of fecal pellets egested after feeding on the food. The
procedure used in these experiments was identical to that used in the
assimilation experiments except that the food and fecal pellets were sub-
jected to the ATP extraction procedure described in the methods. The
eroding tundra peat had been soaked in a container of raw unfiltered sea
water in a lighted incubator at 5°C prior to use in the experiment. Tech-
nical difficulties were encountered in these experiments and only those
determinations in which 0.1 ml of extract was assayed provided reliable
results. These results are shown in Table 4.7. The three size fractions
of peat from marine waters show similar ATP levels (mean 0.00877 mg ATP/mg
dry wt) suggesting that the microbial populations are similar. In con-
trast the ATP level of the eroding tundra peat was only 23% of the mean
value for marine peats. This indicates a greatly reduced microbial popu-
lation is present on peat that has not yet aged in the marine ecosystem.
The ATP levels in fecal pellets from animals that have been ingesting peat
in these experiments is higher than the levels in food. Mysis littoralis
feeding on <63µ marine peat had about 5 times as high an ATP level as
was found in the peat, the same comparison for Gammarus setosus feeding
on >1mm eroding tundra peat indicates a 3 fold increase. In view of the
fact that neither the gravimetric nor the organic assimilation efficiencies
for the corresponding peat assimilation experiments were positive (Tables
4.4 and 4.6) the increase in ATP concentration suggests that the microbial
populations on these types of peat are not being assimilated.
537

Table 4.7. ATP Content of Peat and Fecal Pellets. An estimate of microbialliving carbon is obtained by multiplying the ATP values by 285 and convert-ing from µg to mg.
538

4-40
General Discussion
Primary production, particularly of benthic microalgae, appears to
be one of the major sources of energy input to the shallow water Arctic
marine ecosystem during the ice free period. Analysis of the composition
of fecal pellets and gut contents indicates that the majority of epibenthic
and benthic species studied feed at least in part on benthic microalgae.
Matheke and Horner (1974) found that the benthic microalgae become the
most important source of primary productivity after breakup of the shore-
fast ice and that productivity of these organisms exceeds that of the
phytoplankton by a factor of 2 and that of the ice algae by a factor of
8. The results of our fecal pellet analysis during the summer of 1977
indicate that planktonic diatoms can also be important when they are
available. The view that is emerging from these studies is that many of
the species are opportunistic feeders that make use of whatever resource
is currently abundant.
Terrestrial plant detritus in the form of peat may be an important
input of carbon for this ecosystem, especially during periods of low
primary productivity. At present our information only indicates that a
few species utilize significant quantities of peat. Gammarus setosus is
able to ingest and assimilate large quantities of coarse peat particles,
but does not derive nutrition from small sized particles. Analysis of
fecal pellets and feeding experiments conducted during the summer of 1977
indicate that Saduria entomon and Mysis litoralis may also ingest peat.
At present we only know that Mysis does not assimilate small particles of
peat. Further experiments with coarse peat fractions are necessary to de-
termine the importance of peat for these latter two species.
Our results suggest that Gammarus setosus can directly utilize the
refractory organic matter found in peat. Most studies of benthic detritus
feeding communities indicate that the animals that ingest detrital par-
ticles are actually deriving their nutrition from the microorganisms that
grow upon these particles (Hargrave, 1970, 1976; Fenchel and Harrison,
1976; Mann, 1978). Thus the entry of detrital carbon into the detritivores
is a 2-step process in these systems. Direct transfer of detrital carbon
to the detritivore would provide a more efficient energy flow (Foulds and
539

4-41
Mann, 1978). If this capability is widespread in the Arctic shallow-water
marine ecosystem, it could provide a significant increase in efficiency
in this low energy input system. Several recent studies have indicated
that direct transfer of detrital carbon to the detritivores is possible
(Kofoed, 1975; Foulds and Mann, 1978). The presence of cellulase activity
in marine invertebrates is widespread (Yokoe and Yasumasu, 1964; Elyakova,
1972) and has been reported for the genus Gammarus (Halcrow, 1971). We
plan to conduct further experiments using radioactively labelled cellulose
to more fully assess the possibility of direct transfer of detrital carbon
in the Arctic marine ecosystem. Further experiments are also needed with
meiofauna, particularly oligochaete and small polychaete worms to deter-
mine their importance in the decomposition of peat. It seems unlikely
that these small organisms could directly utilize large peat particles
and a 2-step transfer through microorganisms seems more likely.
540

4-42
LITERATURE CITED
Conover, R. J. 1966. Assimilation of organic matter by zooplankton.
Limnol. Oceanog. 11:338-345.
Elyakova, L. A. 1972. Distribution of cellulases and chitinases in
marine invertebrates. Comp. Biochem. Physiol. 43:67-70.
Fenchel, T. and Harrison, P. 1976. The significance of bacterial graz-
ing and mineral cycling for the decomposition of particulate detritus,
p. 285-299. In Anderson, J. M. and Macfadyen, A., eds. The role of
terrestrial and aquatic organisms in decomposition processes. Black-
well Sci. Publ., London.
Foulds, J. B. and K. H. Mann 1978. Cellulose digestion in Mysis steno-
lepis and its ecological implications. Limnol. Oceanog. 23:760-766.
Halcrow, K. 1971. Celluslase activity in Fammarus oceanicus Segerstrale
(Amphipoda). Crustaceana 20:121-124.
Hargrave, B. T. 1971. Cellulase activity in Gammarus oceanicus Seger-
strale (Amphipods). Crustaceana 20:121-124.
Hargrave, B. T. 1970. The utilization of benthic microflora by Hyalella
azteca (Amphipoda). J. Anim. Ecol. 39:427-437.
Hargrave, B. T. 1976. The central role of invertebrate faeces in sedi-
ment decomposition, p. 301-321. In Anderson, J. M. and Macfayden, A.,
eds. The role of terrestrial and aquatic organisms in decomposition
processes. Blackwell Sci. Publ., London.
Holm-Hansen, 0. 1973. Determination of total microbial biomass by
measurement of adenosine triphosphate. In: Estuarine Microbial Ecol-
ogy (L. H. Stevenson and R. R. Coldwell, eds.), pp. 73-89. Columbia:
University of South Carolina Press.
Holm-Hansen, 0. and R. C. Booth. 1966. The measurement of adenosine tri-
phosphate in the ocean and its ecological significance. Limnol.
Oceanog. 11:510-519.
Kofoed, L. H. 1975. The feeding biology of Hydrobia ventrosa. 2. Allo-
cation of the components of the carbon-dudget and the significance of
541

4-43
the secretion of dissolved organic material. J. Exp. Mar. Biol. Ecol.
19:243-256.
Lasenby, D. M., and R. R. Langford. 1973. Feeding and assimilation of
Mysis relicta . Limnol. Oceanogr. 18:280-285.
Lopez, G. R., J. S. Levinton and L. B. Slobodkin. 1977. The effect of
grazing by the detritivore Orchestia grillus on Spartina litter and
its associated microbial community. Oecologia 30:11-127.
Mann, K. H. 1976. Decomposition of marine macrophytes, p. 247-267.
In: J. M. Anderson and A. Macfadyen (eds.), The role of terrestrial
and aquatic organisms in decomposition processes. Blackwell.
Matheke, G. E. M. and R. Horner. 1974. Primary productivity of the
benthic microalgae in the Chukchi Sea near Barrow, Alaska. J. Fish.
Res. Board Can. 31:1779-1786.
Pavlyutin, A. P. 1970. A contribution to the method of determination of
food assimilation in aquatic animals. Zool. Zh. 49:288-293.
Stanley, P. E. and S. G. Williams. 1969. Use of the liquid scintillation
spectrometer for determining adenosine triphosphate by the luciferase
enzyme. Analyt. Biochem. 29:381-392.
Yokoe, Y., and I. Yasumasu. 1964. The distribution of cellulase in in-
vertebrates, Comp. Biochem. Physiol. 13:323-338.
542

ANNUAL REPORT
Contract #: 03-78-B01-6Research Unit #: 359Reporting Period: 1 Apr 1978-31 Mar 1979Number of Pages: 96
Beaufort Sea Plankton Studies
Rita A. Horner
31 March 1979
543

I. Summary of objectives, conclusions and implications with respect toOCS oil and gas development
The objectives of this project are to assess the winter densitydistribution of zooplankton and phytoplankton in Steffanson Sound and toanalyze samples collected during the 1978 icebreaker cruise in the westernBeaufort Sea.
Information concerning the abundance and distribution of phytoplankton
and zooplankton and primary productivity in the western Beaufort Sea in
summer (August and September) is now available. Some information will be
available concerning the winter abundance and distribution of plankton at
the end of the FY 79 winter field season. Still unavailable, however, isinformation from the spring, April through June, and including the underice
community.
The winter information is important because of the State of Alaska
regulation limiting drilling to the winter and there are indications that
some biological activity occurs in winter, i. e., spawning of Arctic cod
(Boreogadus saida Lepechin) in Russian waters (Rass 1968).
II. Introduction
A. General nature and scope of study
As primary producers and primary and secondary consumers,
phytoplankton and zooplankton are important in the Beaufort Sea ecosystem.R.U. 359 will provide information on the winter populations of phytoplankton
and zooplankton in the nearshore area of Steffanson Sound.
B. Specific objectives
The specific objectives of this project are to assess thewinter density distribution and environmental requirements of zooplanktonand phytoplankton in the nearshore areas of the Beaufort Sea in an integrated
sampling effort with other Research Units and to analyze samples collectedduring the 1978 icebreaker cruise in the Beaufort Sea.
C. Relevance to problems of petroleum development
Basic background information on standing stock, speciescomposition, community structure, distribution, and primary production of
plankton communities in the Beaufort Sea lease area in winter is generally
not known. This kind of information is necessary in order to assess damagein case of a spill. Knowledge of winter biological activity is especiallyimportant in light of the State of Alaska draft regulations that limitexploratory drilling to the winter.
544
2
III. Current state of knowledge
The literature pertaining to plankton studies in the BeaufortSea has been reviewed (English and Horner 1977) and summarized (Horner 1978).
Recent papers not previously summarized include Hsiao et al. (1977),Hsiao et al. (1978), and Hsiao (1978). Hsiao et al. (1977) determinedphytoplankton standing stock and primary production in the southern BeaufortSea during the summers of 1973, 74, and 75. They found the phytoplanktoncommunity to be dominated by diatoms in coastal waters and by flagellatesfarther offshore. Productivity and standing stock decreased with increasingdistance from shore.
Hsiao et al. (1978) studied the effects of crude oils and the oildispersant Corexit on primary production of Arctic marine phytoplankton andseaweeds. These authors found that the production rate varied with concen-trations and types of oil, method of preparation of oil-seawater mixtures,species compositon, and environmental conditions. Inhibition of productiongenerally increased with increasing oil concentration in samples with thesame species concentration. Mixtures of crude oil and Corexit were moretoxic than crude oil or Corexit alone. Production of Laminaria saccharinaand Phyllophora truncata was inhibited by all types and concentrations ofoil tested.
Hsiao (1978) studied the effects of four crude oils on the growth ofthree diatoms and one green flagellate isolated from Beaufort Sea plankton.He found the green flagellate, Chlamydomonas pulsatilla, to be the mosttolerant species, with none of the oils being lethal at any of the concen-trations, temperatures, and exposure times tested. In fact, at lowertemperatures and oil concentrations, growth was slightly stimulated. Thegrowth of diatoms, Chaetoceros septentrionalis, Navicula bahusiensis, andNitzschia delicatissima, was inhibited by all oils tested after ten days'exposure at 00 C, 5°C, and 10°C and concentration of 10 ppm. Nitzschiadelicatissima was the most sensitive of the three diatoms, followed byNavicula bahusiensis and Chaetoceros septentrionalis.
The author points out possible consequences of an oil spill in Arcticwaters, suggesting that a spill in open water could result in a shadingeffect on the phytoplankton that would inhibit growth or the persistence ofthe non-volatile, water soluble aromatic hydrocarbons that might inhibitgrowth. If a spill happened under the ice, the oil could affect the icealgae by coating it causing direct physical damage, by producing a shadingeffect, and by inhibiting growth due to the persistence of more toxicvolatile components. The composition of the phytoplankton community couldchange to one dominated by flagellates because of differential growth andsensitivity to oils and this could lead to altered zooplankton communitiesas well.
Perhaps the most important contribution of these papers is that theexperiments were performed on species that were isolated from the BeaufortSea. While the phytoplankton species are not usually dominant species inthe phytoplankton community of the western Beaufort Sea, Chaetocerosseptentrionalis and Nitzschia delicatissima are nearly always present in
545
3
the water column and Ch. septentrionalis may also be a component of theice algae community.
IV. Study area
The study area and sampling stations during the August-Septem-ber 1978 cruise of CGC Northwind are shown in Fig. 1.
The winter sampling site was in Steffanson Sound at 70°19'N, 147°34.4'W.
V. Sources, methods and rationale of data collection
Phytoplankton samples were collected with 5-l Niskin bottles.Subsamples of the water were taken for salinity, standing stock, primaryproductivity, and plant pigment determinations. Standing stock samples werepreserved with 5-10 ml of 4% formalin buffered with sodium acetate. Primaryproductivity measurements were made in 60 ml reagent bottles. Two light andone dark bottle were used for each depth. Two ml of NaH 14C03 solution wereadded to each bottle, aluminum foil was wrapped around the dark bottle andthe samples were incubated in a laboratory sink under a bank of cool whitefluorescent lights. Light levels were measured at the beginning and end ofthe incubation period with a Gossen Super Pilot photographic light meter.Low temperature was maintained by running seawater and was monitoredthroughout the incubation period. Following a 3 to 4 hr incubation period,the samples were filtered onto 25 mm HA (0.45 pm) Millipore filters, rinsedwith 5 ml filtered seawater and 5 ml 0.01 N HC1, and placed in liquidscintillation vials.
Water for plant pigment determinations was filtered through 47 mm HA(0.45 pm) Millipore filters. A few drops of a saturated MgCO 3 solutionwere added near the end of the filtration and the filter was rinsed withfiltered seawater. The filters were folded into quarters, placed in labeledglassine envelopes, and frozen.
Salinity was determined on board using a Beckman Industrial InstrumentsModel RS-7A portable induction salinometer. "Copenhagen" water was used asthe standard. Temperatures, measured with deep sea reversing thermometerswere corrected using calibration factors provided by the Coast Guard andfollowing the procedure outlined in the U.S. Naval Oceanographic OfficePubl. 607 (1968). Water transparency was measured with a Secchi disc.
Zooplankton samples were collected with bongo nets having mesh sizes of333 and 500 pm, mouth openings of 60 cm, and areas of 0.2827 m2 . A TSK model313 flowmeter (InterOcean Systems, Inc.) was mounted in the mouth of eachnet. A 45 kg rectangular weight was attached to the net frame. Tows weredouble oblique with the net lowered at ca. 40-50 m/min to a depth ca. 10 mfrom the bottom at shallow stations or to 200 m at deep stations, soaked for30 sec, and retrieved at ca. 20 m/min.
The samples were concentrated by gently swirling in a net collectioncup to remove excess water. The samples were poured into jars and preserved
546

Fig. 1. Study area and station locations, USCGC Northwind, 15 Aug to 15 Sep 1978.

5
with 37% formalin and saturated sodium acetate solution. The amount of
formalin and buffer depended on the jar size. A label containing collection
data was put in the jar, seawater added if necessary to fill the jar, andthe jar was capped for storage.
During the 1978 icebreaker cruise, stations 1-6 were collected in areas
where Alaska Department of Fish and Game personnel were hunting seals (R. U.'S
230 and 232). Stations 10-12 were collected along the Pitt Point transect(R. U. 6). Other stations were taken at locations east of Prudhoe Bay
where microbiologists (R. U.'s 29 and 190) needed samples, and at locationsto repeat stations taken in 1976 and 1977, and to fill in gaps.
VI. Results
A. CGC Northwind cruise
1. Hydrography
Hydrographic data for stations taken in the BeaufortSea are given in Table 1; vertical profiles of temperature and salinityare given in Fig. 2.
2. Phytoplankton standing stock
Phytoplankton standing stock samples have been
analyzed for eight stations (68 samples). No new organisms have occurred
in the 1978 samples, but all the diatoms are weakly silicified, to the
extent that identification is often difficult.
The number of phytoplankton cells ranged from < 2 x 10⁵ to ca. 3 x 10⁶cells per liter. As in 1976 and 1977, small Chaetoceros spp. and unidenti-
fied flagellates were the most abundant organisms.
3. Primary productivity and plant pigment concentrations
Primary productivity and plant pigment concentrations
are listed in Table 1 and vertical profiles are shown in Fig. 2. Integrated
values for carbon assimilation and chlorophyll a are given in Figs. 3 and 4.
Primary productivity ranged from 0.01 to 2.93 mg C m-³hr-¹ with inte-
grated productivity ranging from 1.25 mg C m-² at station 7 to 32.05 mg C m-²
at station 29.
Chlorophyll a ran ed from 0.01 to 6.11 mg m-³; integrated chlorophyll a
ranged from 4.63 mg m-² at station 22 to 37.35 mg m-² at station 16.
4. Zooplankton
Sixty-one categories of zooplankton have been identified
from 16 net hauls, including 27 species and 34 other categories such as
larval stages and categories where identification was made to some taxonomic
rank higher than species (Table 2). Greatest emphasis has been placed on
548

Table 1. Summary of station locations, hydrography, ice cover, chlorophyll a and phaeopigmentconcentrations, and primary productivity, USCGC Northwind, 15 Aug to 15 Sep 1978.

Table 1. (continued)

Table 1. (continued)

Table I. (continued

Table 1. (continued)

Table 1. (continued)

Table 1. (continued)
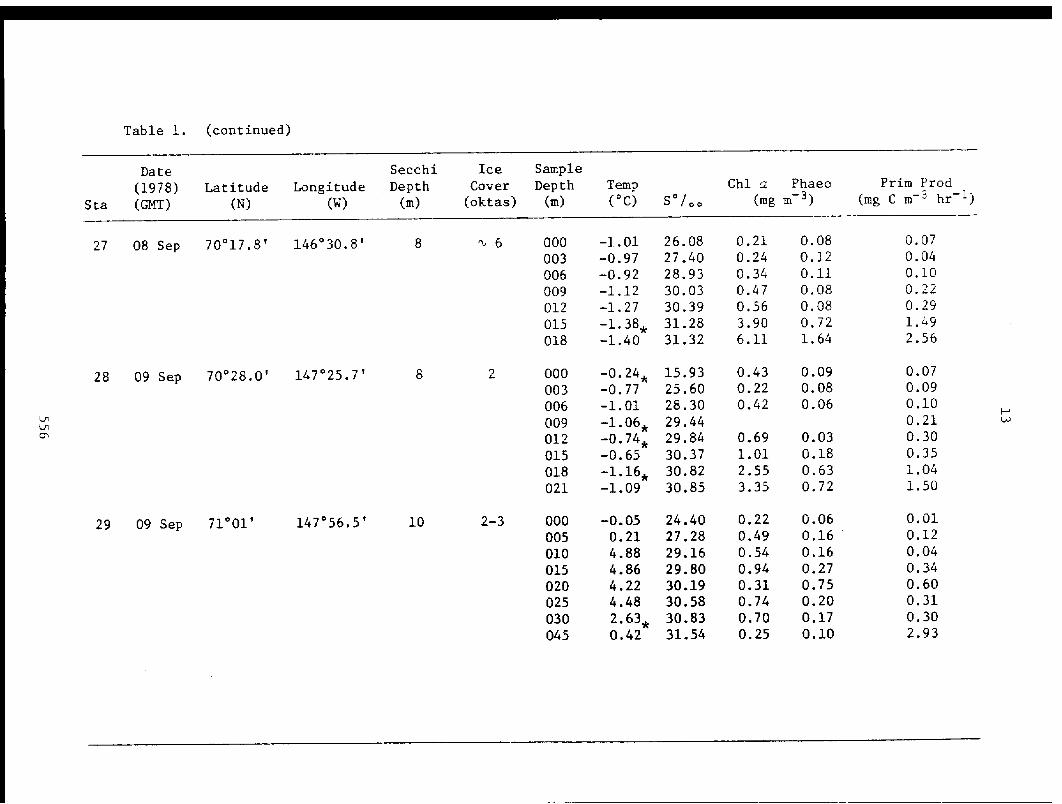
Table 1. (continued)

Table 1. (continued)

Table 1. (continued)

Fig. 2. Depth profiles of temperature-salinity and chlorophyll a- 1 4 Cassimilation in the Beaufort Sea, August-September 1978. Salinity (‰)---- ; temperature (°C)_____; [superscript]14 C assimilation (mg C m-³ hr-¹) ---- ;
chlorophyll a (mg m-³)
559

Fig. 2 (continued)
560

Fig. 2. (continued)
561

Fig. 2. (continued)
562

Fig. 2. (continued)
563

Fig. 2. (continued)
564

Fig. 2. (continued)
565
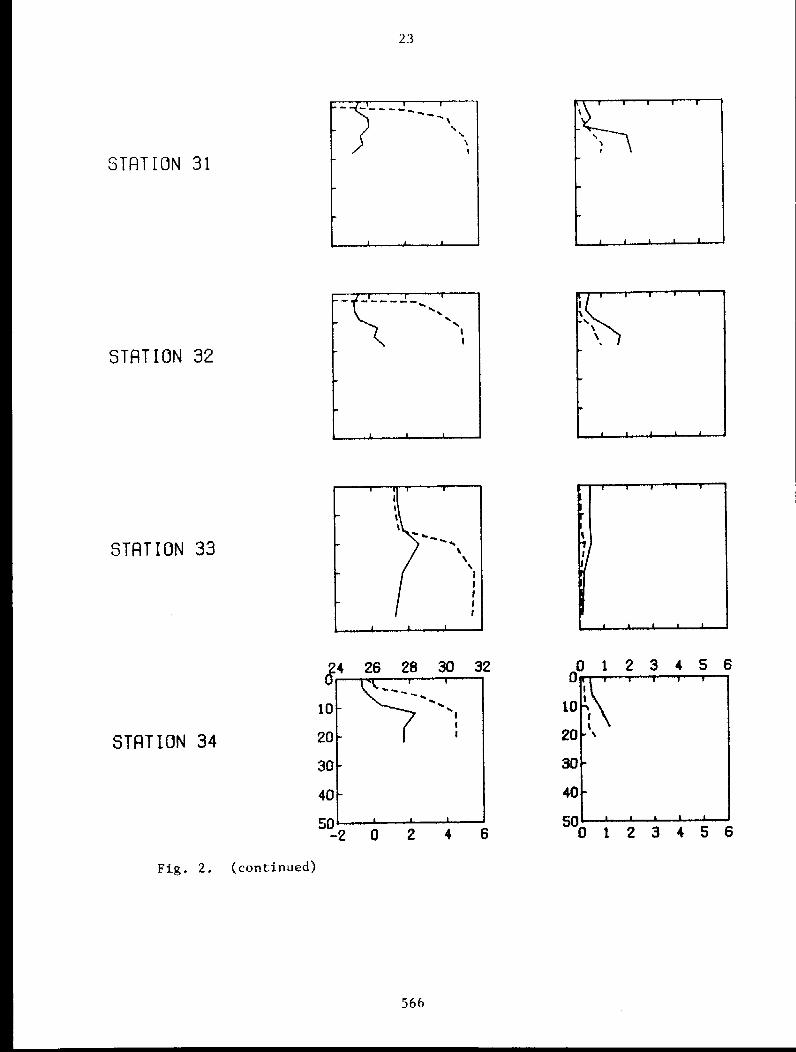
Fig. 2. (continued)
566

Fig. 2. (continued)
567

Fig. 3. Integrated 1 4C assimilation (mg C m- 2 hr- 1) for all stations in the Chukchi
and Beaufort seas, August-September 1976, 1977, 1978. [filled cirlce]=1976, [open cirlcle]=1977, [half filled circle]=1978.

Fig. 4. Integrated chlorophyll a (mg m- 2 ) for all stations in the Chukchi and Beaufortseas, August-September 1976, 1977, 1978. [filled circle]=1976, [open circle]=1977, [half filled circle]=1978.

Table 2. Abundance (number per 1000 m3) of zooplankton taxa found in net hauls from the Beaufort Sea.
All samples were collected with bongo nets, mesh size 500 µm. Where no number is present, no animals were
found.

Table 2. (continued)

Table 2. (continued)

Table 2. (continued)

Table 2. (continued)

Table 2. (continued)

Table 2. (continued)

Table 2. (continued)

35
those organisms known to be important prey species for birds and mammals.Copepods have been separated into adults and juveniles and counted; theyare not being identified to species.
Distribution and abundance of some zooplankton categories for 1976 and1977 are given in Figs. 5-56.
B. Winter sampling in Steffanson Sound
1. November 1978
a. Phytoplankton standing stock and plant pigments
Few phytoplankton cells were found in samplescollected in November 1978. Unidentified flagellates, mostly < 6 pm indiameter, were the most common organisms. A few Chaetoceros spp. sporeswere found along with a few pennate diatoms, primarily Nitzschia spp. andNavicula spp. The diatoms contained chloroplasts, but did not appear to behealthy cells.
Plant pigments are given in Table 3.
b. Zooplankton standing stock
Zooplankton standing stock is given in Table 4.Based on the total number of animals, calanoid copepods, primarily juveniles,comprised > 99.5% of the population.
2. February 1979
Because of logistic and weather problems, phytoplanktonstanding stock and plant pigment samples were collected once. Zooplanktonstanding stock samples were not collected. The phytoplankton standing stocksamples contained a few unidentified small flagellates and a few pennatediatoms. There were many small detritus particles in the sample collectednear the underside of the ice which made phytoplankton counting difficult.Not as much detritus was present in the sample collected near the sea floor.Ken Dunton (pers. comm.) indicated that the underside of the ice consistedof a thick, brashy, dirty layer in some areas near the sampling site whichprobably accounted for the detritus in the samples.
The plant pigment samples have not been analyzed.
3. March 1979
a. Phytoplankton standing stock and plant pigments
Phytoplankton samples collected 12 and 16 March havebeen enumerated. Small unidentified flagellates were the most abundantorganisms, averaging about 44,000 cells per liter. A few unidentified choano-flagellates were found along with a few diatoms. The number of individualdiatom cells and the number of diatom species increased from February toMarch with species such as Cylindrotheca closteriwn (Ehrenb.) Reimann and
578
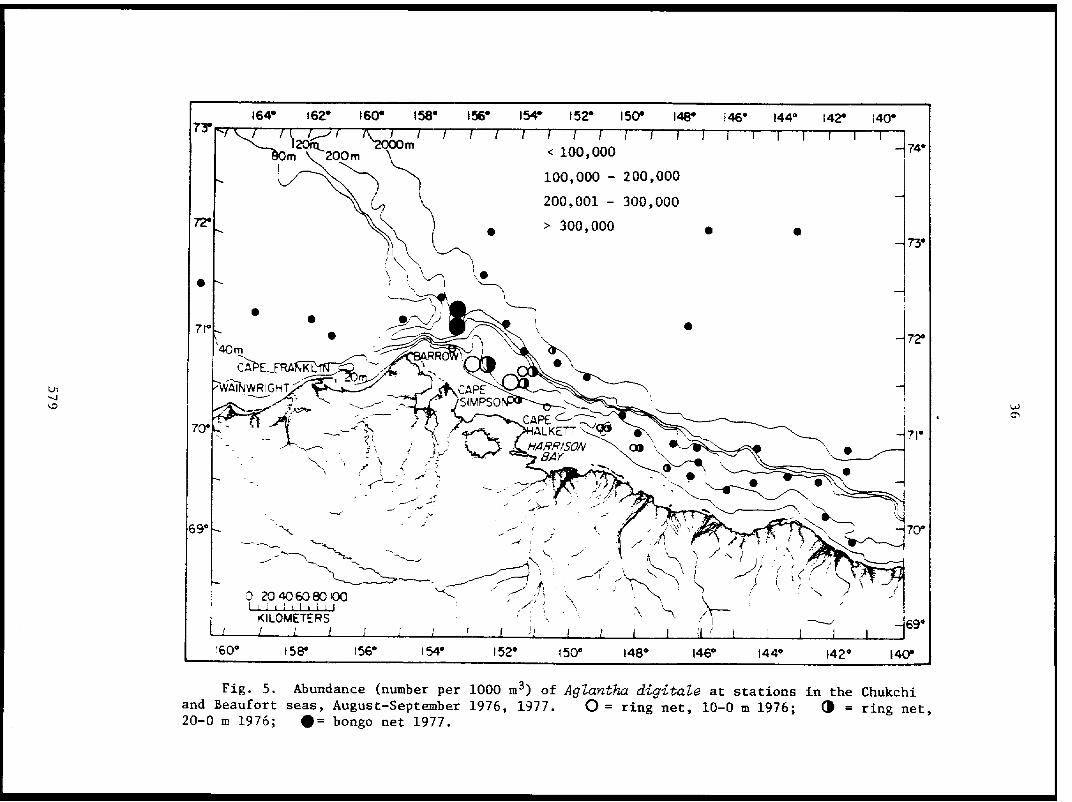
Fig. 5. Abundance (number per 1000 m3 ) of Aglantha digitale at stations in the Chukchiand Beaufort seas, August-September 1976, 1977. [open circle]=ring net, 10-0 m 1976; [half filled circle]= ring net,20-0 m 1976; [filled circle]=bongo net 1977.

Fig. 6. Abundance (number per 1000 m3) of Perigonimus spp. at stations in the Chukchi
and Beaufort seas, August-September 1976, 1977. [open circle]=ring net, 10-0 m 1976; [half filled circle]=ring net,
20-0 m 1976; [filled circle]=bongo net 1977.

Fig. 7. Abundance (number per 1000 m3) of Rathkea spp. at stations in the Chukchi andBeaufort seas, August-September 1976, 1977. [open circle]= ring net, 10-0 m 1976; [half filled cirlce]= ring net,20-0 m 1976; [filled circle]= bongo net 1977.

Fig. 8. Abundance (number per 1000 m3) of ctenophores at stations in the Chukchi and
Beaufort seas, August-September 1976, 1977. [open circle]= ring net, 10-0 m 1976; [half filled circle]= ring net,
20-0 m 1976; [filled circle]= bongo net 1977.

Fig. 9. Abundance (number per 1000 m³) of polychaetes at stations in the Chukchi andBeaufort seas, August-September 1976, 1977. [open circle]= ring net, 10-0 m 1976; [half filled circle]= ring net20-0 m 1976; [filled circle]= bongo net 1977.

Fig. 10. Abundance (number per 1000 m3) of all pteropods at stations in the Chukchi and
Beaufort seas, August-September 1976, 1977. [open circle]= ring net, 10-0 m 1976; [half filled circle]= ring net,
20-0 m 1977; [filled circle]= bongo net 1977.

Fig. 11. Abundance (number per 1000 m³) of Clione limacina at stations in the Chukchiand Beaufort seas, August-September 1976, 1977. [open circle]= ring net, 10-0 m 1976; [half filled circle]= ring net,20-0 m 1976; [filled circle]= bongo net 1977.

Fig. 12. Abundance (number per 1000 m³) of Spiratella helicina at stations in the
Chukchi and Beaufort seas, August-September 1976, 1977. [open circle]= ring net, 10-0 m 1976; [half filled circle]
= ring net, 20-0 m 1976; [filled circle] = bongo net 1977.
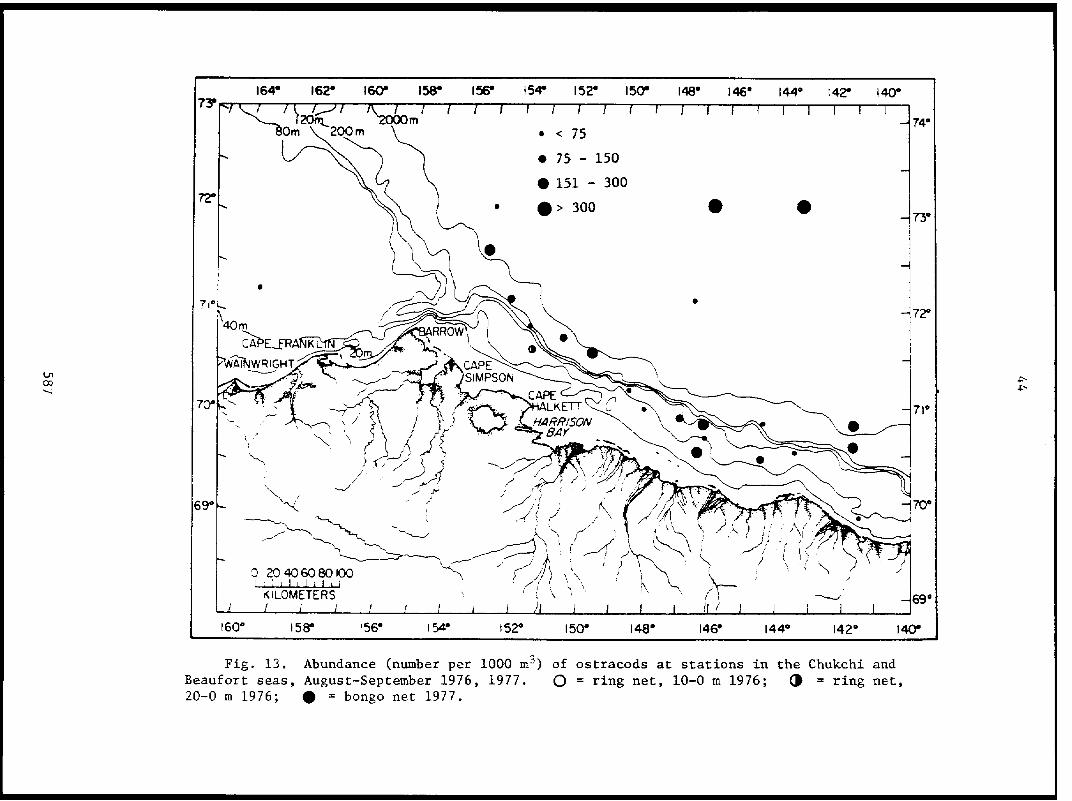
Fig. 13. Abundance (number per 1000 m³) of ostracods at stations in the Chukchi andBeaufort seas, August-September 1976, 1977. [open circle] = ring net, 10-0 m 1976; [half filled circle] = ring net,20-0 m 1976; [filled circle] = bongo net 1977.
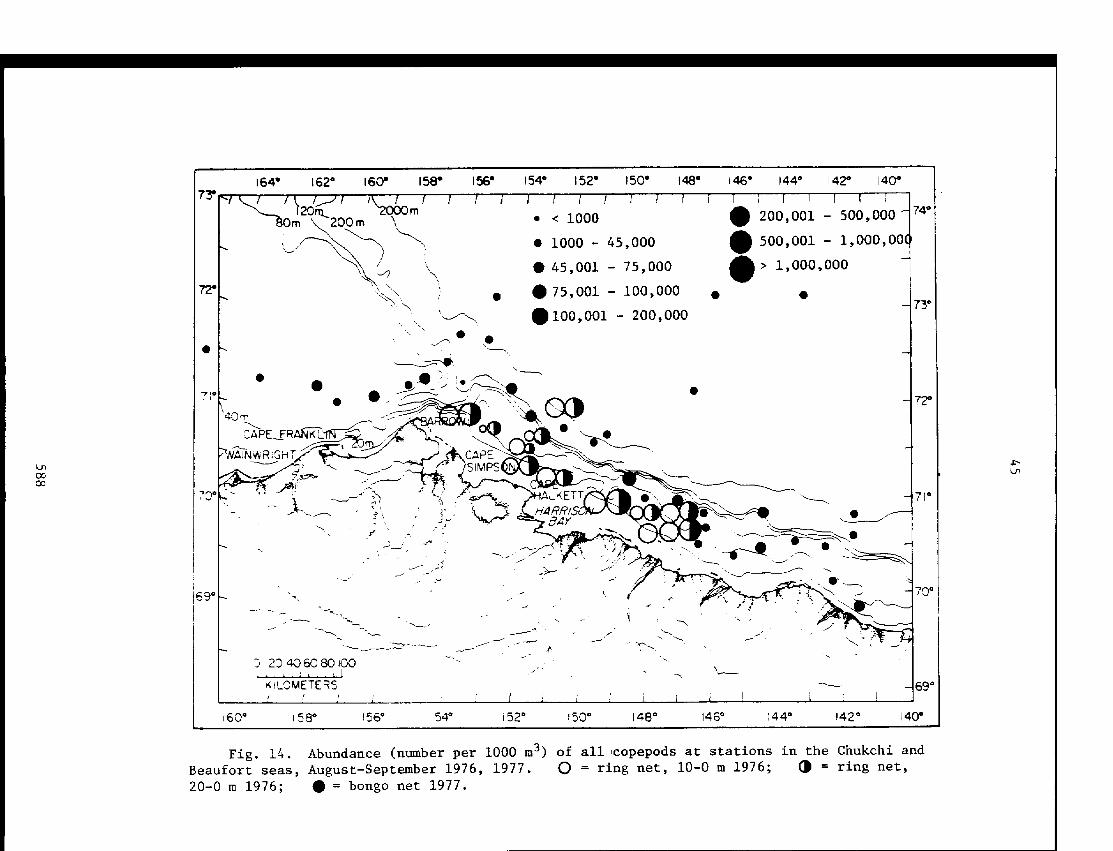
Fig. 14. Abundance (number per 1000 m³) of all :copepods at stations in the Chukchi and
Beaufort seas, August-September 1976, 1977. [open circle] = ring net, 10-0 m 1976; [half filled circle] = ring net,
20-0 m 1976; [filled circle] = bongo net 1977.

Fig. 15. Abundance (number per 1000 m³) of Acartia spp. at stations in the Chukchi andBeaufort seas, August-September 1976, 1977. [open circle]= ring net, 10-0 m 1976; [half filled circle] = ring net,20-0 m 1976; [filled circle] = bongo net 1977.

Fig. 16. Abundance (number per 1000 m³) of Calanus glacialis at stations in the Chukchiand Beaufort seas, August-September 1976, 1977. [open circle] = ring net, 10-0 m 1976; [half filled circle] = ring net,20-0 m 1976; [filled circle] = bongo net 1977.

Fig. 17. Abundance (number per 1000 m³) of Calanus hyperboreus at stations in theChukchi and Beaufort seas, August-September 1976, 1977. [open circle] = ring net, 10-0 m 1976; [half filled circle]=ring net, 20-0 m 1976; [filled circle] = bongo net 1977.
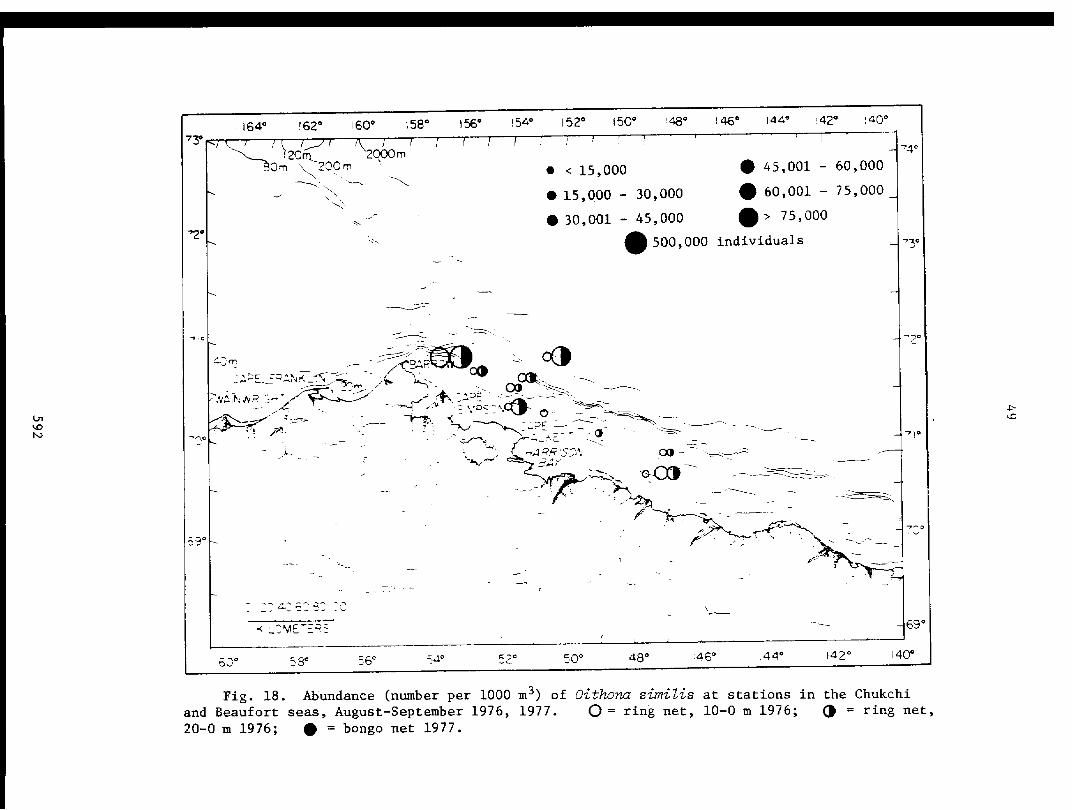
Fig. 18. Abundance (number per 1000 m³) of Oithona similis at stations in the Chukchi
and Beaufort seas, August-September 1976, 1977. [open circle]= ring net, 10-0 m 1976; [half filled circle] = ring net,
20-0 m 1976; [filled circle] = bongo net 1977.
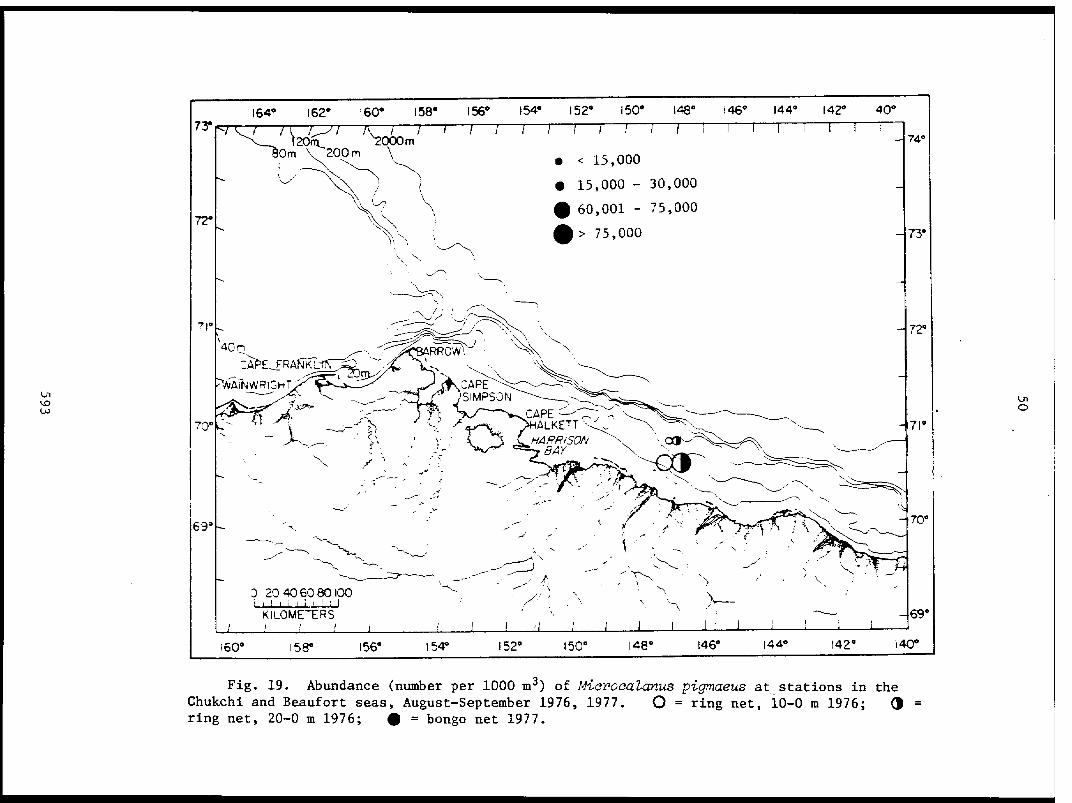
Fig. 19. Abundance (number per 1000 m³) of Microcalanus pigmaeus at stations in theChukchi and Beaufort seas, August-September 1976, 1977. [open circle] = ring net, 10-0 m 1976; [half filled circle]=ring net, 20-0 m 1976; [filled circle] = bongo net 1977.

Fig. 20. Abundance (number per 1000 m³) of Pseudocalanus spp. at stations in the Chukchiand Beaufort seas, August-September 1976, 1977. [open circle] = ring net, 10-0 m 1976; [half filled circle] = ring net,20-0 m 1976; [filled circle]= bongo net 1977.

Fig. 21. Abundance (number per 1000 m³) of barnacle larvae at stations in theChukchi and Beaufort seas, August-September 1976, 1977. [open circle] = ring net, 10 - 0 m 1976;[half filled circle] = ring net, 20 - 0 m 1976; [filled circle] = bongo net 1977.

Fig. 22. Abundance (number per 1000 m3) of barnacle nauplii at stations in the Chukchi
and Beaufort seas, August-September 1976, 1977. [open circle] = ring net, 10-0 m 1976; [half filled circle] = ring net,20-0 m 1976; [filled circle] = bongo net 1977.

Fig. 23. Abundance (number per 1000 m³) of barnacle cyprids at stations in the Chukchiand Beaufort seas, August-September 1976, 1977. [open circle] = ring net, 10-0 m 1976; [half filled circle] = ring net,20-0 m 1976; [filled circle] = bongo net 1977.

Fig. 24. Abundance (number per 1000 m³) of all mysids at station in the Chukchi and
Beaufort seas, August-September 1976, 1977. [open circle] = ring net, 10-0 m 1976; [half filled circle] = ring net,
20-0 m 1976; [filled circle] = bongo net 1977.

Fig. 25. Abundance (number per 1000 m³) of Mysis litoralis at stations in the Chukchiand Beaufort seas, August-September 1976, 1977. [open circle] = ring net, 10-0 m 1976; [half filled circle] = ringnet, 20-0 m 1976; [filled circle] = bongo net 1977.
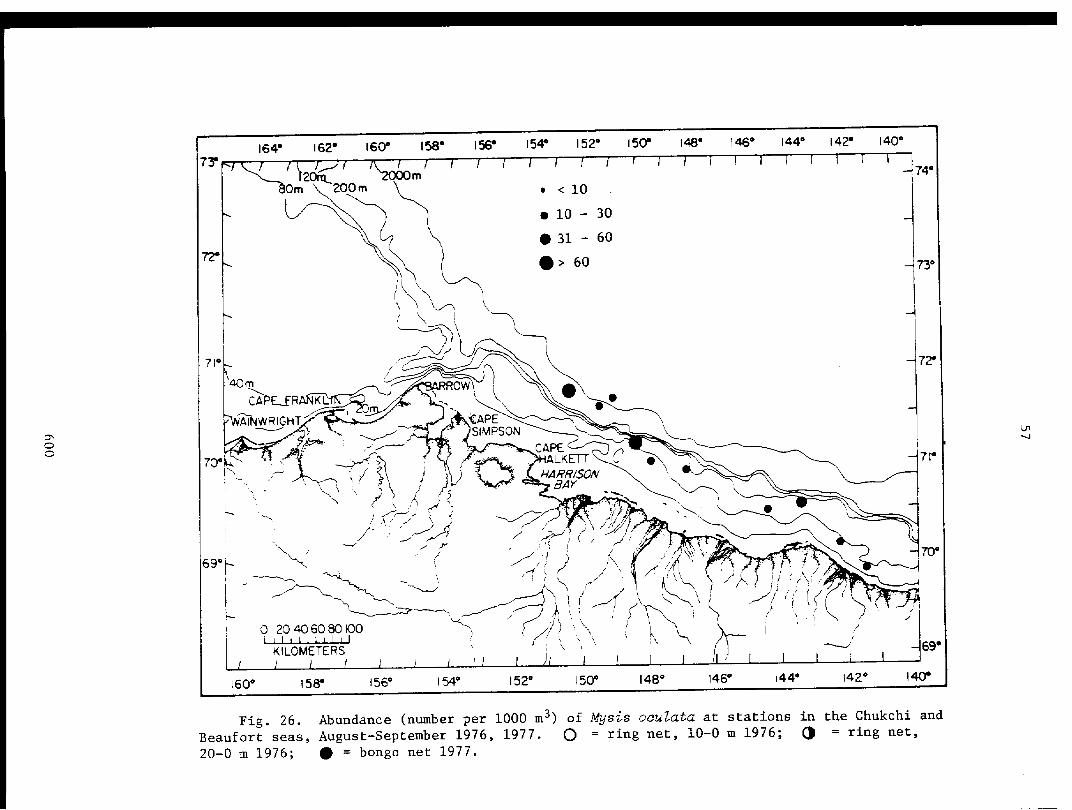
Fig. 26. Abundance (number per 1000 m³) of Mysis oculata at stations in the Chukchi and
Beaufort seas, August-September 1976, 1977. [open circle] = ring net, 10-0 m 1976; [half filled circle] = ring net,
20-0 m 1976; [filled circle] = bongo net 1977.
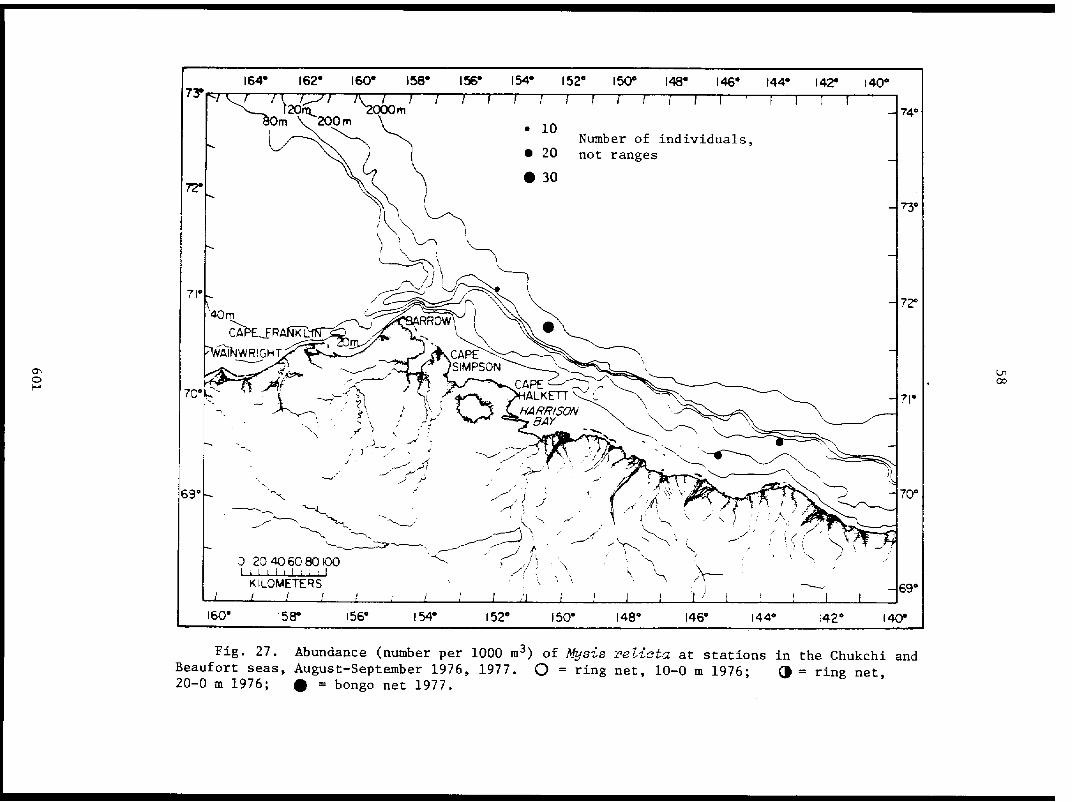
Fig. 27. Abundance (number per 1000 m³) of Mysis relicta at stations in the Chukchi andBeaufort seas, August-September 1976, 1977. [open circle] = ring net, 10-0 m 1976; [half filled circle] = ring net,20-0 m 1976; [filled circle] = bongo net 1977.

Fig. 28. Abundance (number per 1000 m3) of all gammarid amphipods at stations in the
Chukchi and Beaufort seas, August-September 1976, 1977. [open circle] = ring net, 10-0 m 1976; [half filled circle] =ring net, 20-0 m 1976; [filled circle] = bongo net 1977.

Fig. 29. Abundance (number per 1000 m³) of all hyperiid amphipods at stations in theChukchi and Beaufort seas, August-September 1976, 1977. [open circle] = ring net, 10-0 m 1976; [half filled circle] =ring net, 20-0 m 1976; [filled circle] = bongo net 1977.

Fig. 30. Abundance (number per 1000 m³) of all Parathemisto spp. at stations in the
Chukchi and Beaufort seas, August-September 1976, 1977. [open circle]= ring net, 10-0 m 1976; [half filled circle]=
ring net, 20-0 m 1976; [filled circle] = bongo net 1977.
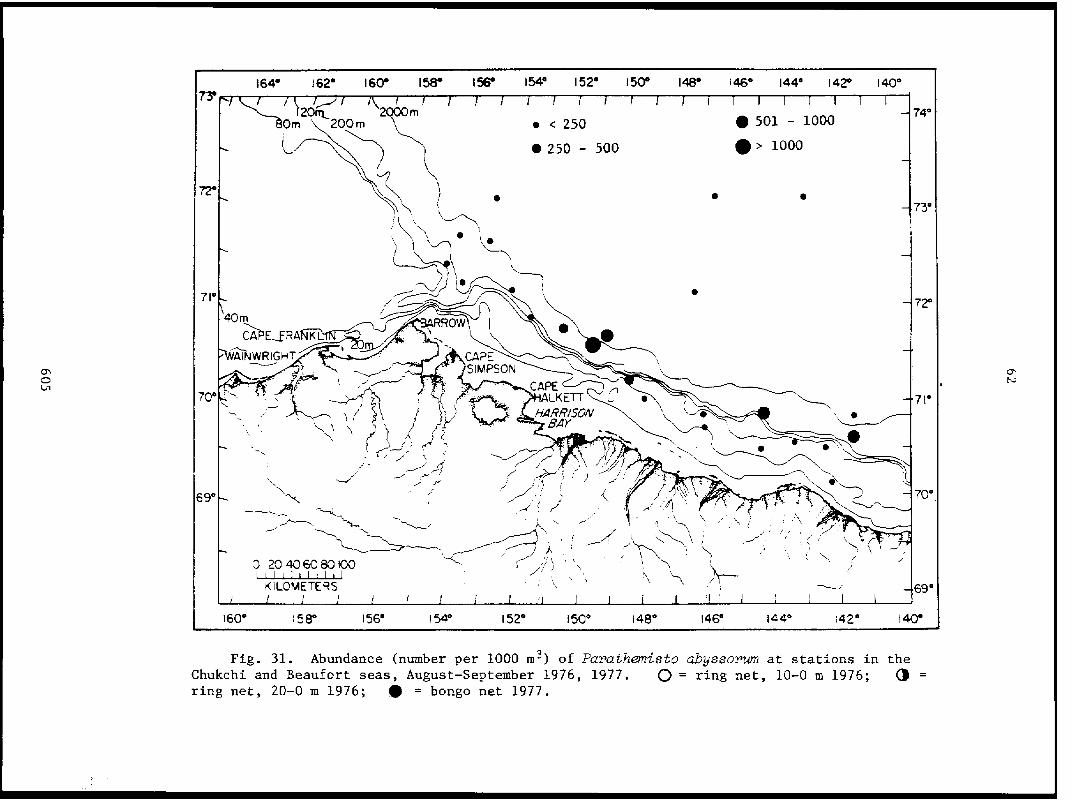
Fig. 31. Abundance (number per 1000 m³) of Parathemisto abyssorum at stations in theChukchi and Beaufort seas, August-September 1976, 1977. [open circle]= ring net, 10-0 m 1976; [half filled circle]=ring net, 20-0 m 1976; [filled circle]= bongo net 1977.

Fig. 32. Abundance (number per 1000 m³) of Parathemisto libellula at stations in theChukchi and Beaufort seas, August-September 1976, 1977. [open circle]= ring net, 10-0 m 1976; [half filled circle]=ring net, 20-0 m 1976; [filled circle]= bongo net 1977.

Fig. 33. Abundance (number per 1000 m³) of all euphausid larvae at stations in theChukchi and Beaufort seas, August-September 1976, 1977. [open circle]= ring net, 10-0 m 1976; [half filled circle]=ring net, 20-0 m 1976; [filled circle]= bongo net 1977.

Fig. 34. Abundance (number per 1000 m³) of Thysanoëssa inermis at stations in the
Chukchi and Beaufort seas, August-September 1976, 1977. [open circle]= ring net, 10-0 m 1976; [half filled circle]=ring net, 20-0 m 1976; [filled circle]= bongo net 1977.

Fig. 35. Abundance (number per 1000 m³) of Thysanoëssa longipes at stations in theChukchi and Beaufort seas, August-September 1976, 1977. [open circle]= ring net, 10-0 m 1976; [half filled circle]=ring net, 20-0 m 1976; [filled circle]= bongo net 1977.

Fig. 36. Abundance (number per 1000 m³) of Thysanoëssa raschii at stations in theChukchi and Beaufort seas, August-September 1976, 1977. [open circle]= ring net, 10-0 m 1976; [half filled circle]=ring net, 20-0 m 1976; [filled circle]= bongo net 1977.

Fig. 37. Abundance (number per 1000 m³) of all Thysanoëssa spp. (excluding larvae) atstations in the Chukchi and Beaufort seas, August-September 1976, 1977. [open circle]= ring net, 10-0 m1976; [half filled circle]= ring net 20-0 m 1976; [filled circle]= bongo net 1977.

Fig. 38. Abundance (number per 1000 m³) of anomuran larvae at stations in the Chukchi
and Beaufort seas, August-September 1976, 1977. [open circle]= ring net, 10-0 m 1976; [half filled circle]= ring net,20-0 m 1976; [filled circle]= bongo net 1977.

Fig. 39. Abundance (number per 1000 m³) of brachyuran larvae at stations in the Chukchiand Beaufort seas, August-September 1976, 1977. [open circle]= ring net, 10-0 m 1976; [half filled circle]= ring net,20-0 m 1976; [filled circle]= bongo net 1977.

Fig. 40. Abundance (number per 1000 m³) of Caridea at stations in the Chukchi and
Beaufort seas, August-September 1976, 1977. [open circle]= ring net, 10-0 m 1976; [half filled circle]= ring net,
20-0 m 1976; [filled circle]= bongo net 1977.
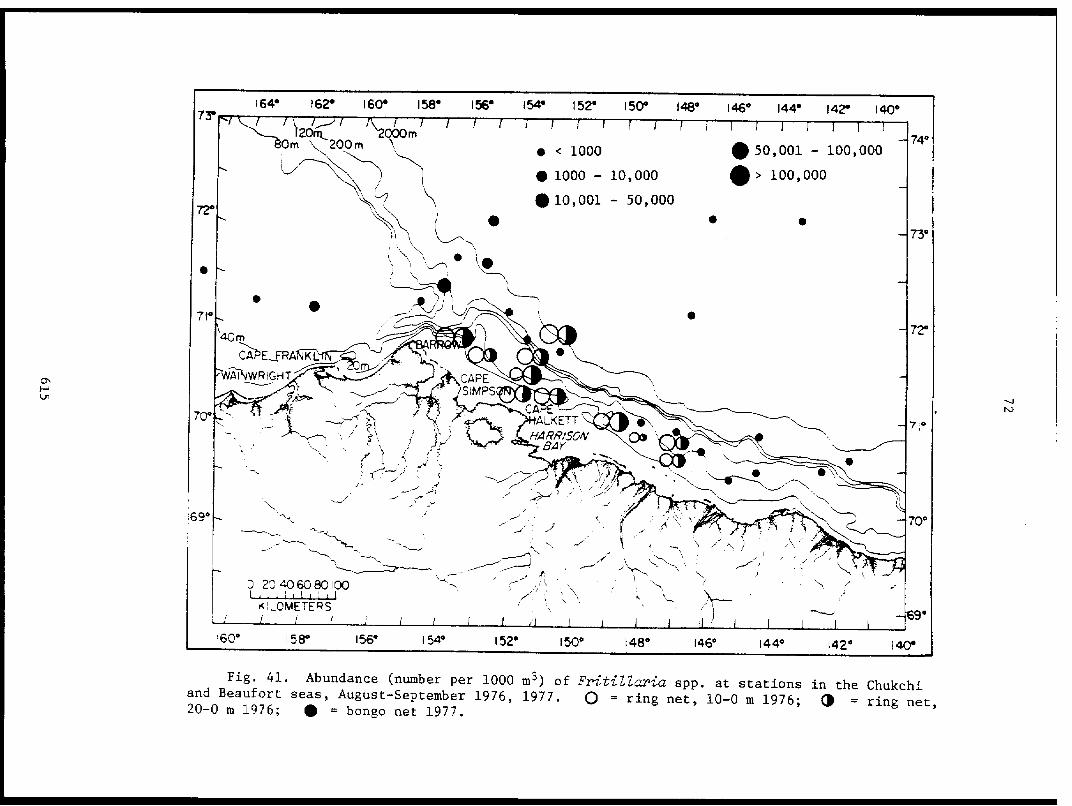
Fig. 41. Abundance (number per 1000 m³) of FritiZZaria spp. at stations in the Chukchiand Beaufort seas, August-September 1976, 1977. [open circle]= ring net, 10-0 m 1976; [half filled circle]= ring net,20-0 m 1976; [filled circle]= bongo net 1977.

Fig. 42. Abundance (number per 1000 m³) of all Oikopleura spp. at stations in the
Chukchi and Beaufort seas, August-September 1976, 1977. [open circle]= ring net,10-0 m 1976; [half filled circle]=
ring net, 20-0 m 1976; [filled circle]= bongo net 1977.

Fig. 43. Abundance (number per 1000 m³) of Oikopleura labradoriensis at stations in theChukchi and Beaufort seas, August-September 1976, 1977. [open circle]= ring net, 10-0 m 1976; [half filled circle]=ring net, 20-0 m 1976; [filled circle]= bongo net 1977.

Fig. 44. Abundance (number per 1000 m³) of Oikopleura vanhöffeni at stations in the
Chukchi and Beaufort seas, August-September 1976, 1977. [open circle]= ring net, 10-0 m 1976; [half filled circle]=
ring net, 20-0 m 1976; [filled circle]= bongo net 1977.

Fig. 45. Abundance (number per 1000 m³) of unidentified Oikopleura species at stationsin the Chukchi and Beaufort seas, August-September 1976, 1977. [open circle]= ring net, 10-0 m 1976;[half filled circle]= ring net, 20-0 m 1976; [filled circle]= bongo net 1977.

Fig. 46. Abundance (number per 1000 m³) of all chaetognaths at stations in the Chukchi
and Beaufort seas, August-September 1976, 1977. [open circle]= ring net, 10-0 m 1976; [half filled circle]= ring net,
20-0 m 1976; [filled circle]= bongo net 1977.

Fig. 47. Abundance (number per 1000 m³) of Eukrohnia hamata at stations in the Chukchiand Beaufort seas, August-September 1976, 1977. [open circle]= ring net, 10-0 m 1976; [half filled circle]= ring net,20-0 m 1976; [filled circle]= bongo net 1977.

Fig. 48. Abundance (number per 1000 m³) of Sagitta elegans at stations in the Chukchiand Beaufort seas, August-September 1976, 1977. [open circle]= ring net, 10-0 m 1976; [half filled circle]= ring net,20-0 m 1976; [filled circle]= bongo net 1977.

Fig. 49. Abundance (number per 1000 m³) of Sagitta spp. at stations in the Chukchi andBeaufort seas, August-September 1976, 1977. [open circle]= ring net, 10-0 m 1976; [half filled circle]= ring net,20-0 m 1976; [filled circle]= bongo net 1977.

Fig. 50. Abundance (number per 1000 m³) of fish eggs collected in bongo nets at stations
in the Chukchi Sea, August-September 1977.

Fig. 51. Abundance (number per 1000 m³) of all fish larvae at stations in the Chukchiand Beaufort seas, August-September 1976, 1977. [open circle]= ring net, 10-0 m 1976; [half filled circle]= ring net,20-0 m 1976; [filled circle]= bongo net 1977.

Fig. 52. Abundance (number per 1000 m³) of cottids at stations in the Chukchi and
Beaufort seas, August-September 1976, 1977. [open circle]= ring net, 10-0 m 1976; [half filled circle]= ring net,
20-0 m 1976; [filled circle]= bongo net 1977.
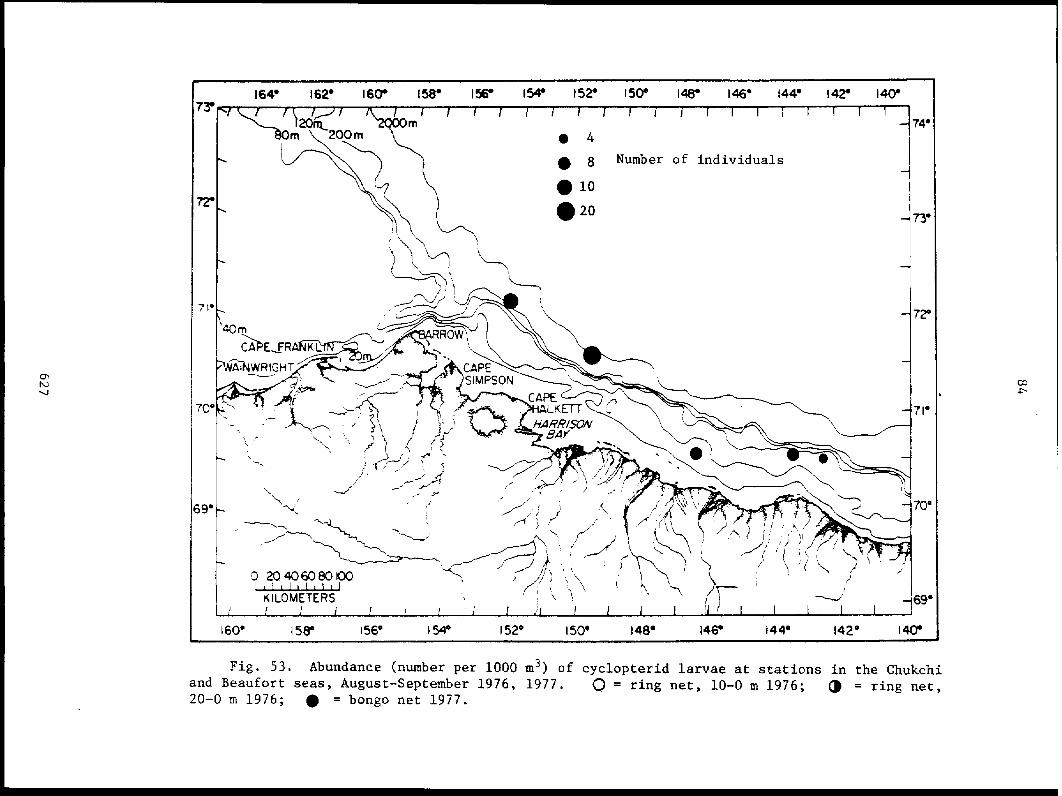
Fig. 53. Abundance (number per 1000 m³) of cyclopterid larvae at stations in the Chukchiand Beaufort seas, August-September 1976, 1977. [open circle]= ring net, 10-0 m 1976; [half filled circle]= ring net,20-0 m 1976; [filled circle]= bongo net 1977.

Fig. 54. Abundance (number per 1000 m³) of gadid larvae at stations in the Chukchi andBeaufort seas, August-September 1976, 1977. [open circle]= ring net, 10-0 m 1976; [half filled circle]= ring net,20-0 m 1976; [filled circle]= bongo net 1977.

Fig. 55. Abundance (number per 1000 m³) of Boreogadus saida at stations in the Chukchiand Beaufort seas, August-September 1976, 1977. [open circle]= ring net, 10-0 m 1976; [half filled circle]= ring net,20-0 m 1976; [filled circle]= bongo net 1977.

Fig. 56. Abundance (number per 1000 m³) of stichaeid larvae at stations in the Chukchiand Beaufort seas, August-September 1976, 1977. [open circle]= ring net, 10-0 m 1976; [half filled circle]= ring net,20-0 m 1976; [filled circle]= bongo net 1977.

Table 3. Chlorophyll a and phaeopigment concentrations, Steffanson
Sound, 8-11 Nov 1978.
631

Table 4. Abundance (number per 10003) of zooplankton taxa found in nethauls from Steffanson Sound (Boulder Patch). All samples were collectedwith a 0.75 m ring net, mesh size 308 µm. Where no number is present, noanimals were found. Tows are vertical unless otherwise noted.
632

90
Lewin and Chaetoceros wighami Brightwell that are common in the spring andsummer beginning to appear.
One ice core sample, core # 8 collected 14 March, has also beenanalyzed. The core was about 30 cm in length and about 2.5 cm in diameterand was collected from the brash ice layer near the dive hole. About 38,000cells per liter were found, including Navicula sp., Nitzschia spp., uniden-tified small pennate diatoms, and ca. 18,000 cells per liter of Thalassiosira,some of which were probably Th. antarctica Comber. The Thalassiosira cellswere difficlut to identify with certainty because of the large amount ofdetrital material associated with them.
Plant pigment samples have not been analyzed.
b. Zooplankton standing stock
Three zooplankton samples have been analyzed.Copepods, primarily juvenile calanoids, were the most abundant organisms,although cyclopoid copepods were also common. A few other organisms werepresent, including hydrozoans, polychaete larvae, isopods, amphipods, andchaetognaths (Table 5).
VII. Discussion
Phytoplankton standing stock, chlorophyll a, and primaryproductivity were considerably lower than in 1976 and 1977. Reasons forthis are unclear. Sampling in the area between Harrison and Prudhoe baysstarted about the same time, mid-August, in 1977 and 1978, and about a weeklater in 1976. Ice cover was somewhat heavier in 1976 and 1978 then in1977. The same species were present all years, although diatoms in the 1978samples were weakly silicified and Ebria tripartita (Schumann) Lemmermann,a silicoflagellate with a skeleton composed of silicon, often did not haveskeletons, suggesting low silicon concentrations. Unfortunately, no nutrientsamples were collected.
In both 1977 and 1978, highest primary productivity in the westernBeaufort Sea occurred off Prudhoe Bay between the 40 and 80 m isobaths,moving inshore between the 2C and 40 m isobaths eastward to Barter Island in1978 and to Demarcation Point in 1977 (Fig. 3).
Small species of the genus Chaetoceros, approximately 6 µm along theapical axis, Thalassiosira spp., including Th. nordenskioeldii Cleve andTh. gravida Cleve, and Nitzschia grunowii Hasle are the major diatomspresent in the 1978 samples. Small flagellates, usually < 10 µm in diameter,are also common. These species were also the most abundant in 1976 and 1977.
Species that were relatively common in 1977 that have not been seen inthe 1978 samples include the diatom Thalassiosira antarctica Comber and thesilicoflagellate Dictyocha speculum Ehrenberg. Dictyocha speculum is notusually common in nearshore waters, so perhaps its occurrence there in 1977was anomaous and its absence in 1978 represents the usual situation.
633

Table 5. Abundance (number per 1000 m3) of zooplankton taxa found innet hauls from Steffanson Sound (Boulder Patch) in March 1979. All sampleswere collected with a 0.75 m ring net, 216 pm mesh. Where no number ispresent, no animals were found. All tows were vertical.
634

92
Zooplankton standing stock and species present were similar to 1977.From preliminary comparison of the two years, it appears that more hydro-zoans were present in 1978, with Aglantha digitale being the major speciesboth years. Fewer pteropods were present in 1978. Copepods were abundantboth years. Slightly fewer crustaceans of all kinds were present in 1978,although when all the 1978 samples are analyzed, this difference may notremain. There were more appendicularians and chaetognaths, especiallySagitta elegans in 1978. About the same number of fish larvae were presentboth years.
By November, few phytoplankton cells were present in the lagoon systemand those that were present, mostly small flagellates, were probably notphotosynthetic. The chlorophyll a concentration was very low. Juvenile andadult calanoid copepods were present in large numbers, while a few mysids,amphipods, euphausids, and chaetognaths were also present.
In March more phytoplankton cells were beginning to appear, includingdiatom species that are common in the spring and summer plankton. Few cellswere present in the water samples however. The sediment-laden brashy layerof ice contained some cells, but will probably not have much of an ice algaecommunity because of the large amount of sediment that reduces light.Juvenile calanoid copepods were the most abundant animals present in thesystem. Other organisms present included hydrozoans, polychaete larvae,isopods, amphipods, and chaetognaths.
VIII. Conclusions
No new conclusions can be suggested based on the 1978 icebreakersamples collected in August and September.
Annual production for the western Beaufort Sea for 1978 has beenestimated. This estimate assumes 24 hr days in June and July, 20 hr days inAugust, and 15 hr days in September. It is also assumed that twice as muchproduction occurs in June during the spring bloom as occurs at other timesduring the summer and that no production occurs at other times of the year.Annual production was estimated to be ca. 2 g C m-2 yr- 1 . This is consider-ably lower than the 9 g C m-2 yr-1 estimated for 1976 and 14 g C m-
2 yr- 1
estimated for 1977. Low chlorophyll a concentrations and cell numbersindicate that the low production in real.
IX. Needs for further study
There are two major data gaps with regard to plankton distributionand abundance and primary productivity in the western Beaufort Sea. One isthe area between the barrier islands and the 20 m (10 ftm) isobath. R.U.'s172, 356, and 467 have, as part of their programs, studied zooplankton in-side the barrier islands. No OCSEAP project studied the phytoplanktonalthough there was some earlier work on phytoplankton and zooplankton fromthe lagoon areas (Alexander 1974; Horner et al. 1974). R.U. 359 has studiedthe phytoplankton and zooplankton in the area outside the 20 m isobath. Onereason for this data gap is the lack of an adequate sampling platform.
635

93
The second major gap now that winter studies are being done in FY79, isthe spring in all areas, although the lagoon system is the most importantfor the upcoming lease sale. The gap here is not just for zooplankton andphytoplankton data, but also for the ice algae community which is probablya major component of the ecosystem during April and May.
X. Summary of January-March quarter
A. Ship or laboratory activities
1. Ship or field trip schedule
a. Dates
1. 12-18 February 19792. 11-16 March 1979
b. No vessel
c. Aircraft - helicopters
d. NOAA or chartered
1. February - chartered Seair Bell Jet Ranger II2. March - NOAA Bell 205
2. Scientific party
Thomas Kaperak, Assistant Oceanographer
3. Methods
a. Field sampling
1. February
There was only one sampling day in Februarybecause of logistic and weather problems. The sampling hole was too smallto accomodate the 0.75 m ring net, so only water samples were collected.Samples were collected just beneath the ice, 0 m, and about 1 m above thebottom, 4 m, with a PVC water sampling bottle. A 250 ml portion waspreserved with 4% formalin buffered with sodium acetate for a phytoplanktonstanding stock sample. Another portion of the sample was drained into a4-l polyethylene bottle and returned to the shore laboratory to be filteredthrough 47 mm, 0.45 pm Millipore filters for plant pigment determinations.A few drops of saturated MgCO 3 solution were added near the end of thefiltration and the filter tower was rinsed with Millipore-filtered seawater.The filters were frozen in a dessicator for later processing.
2. March
Sampling, done on 5 days, was accomplished using
636
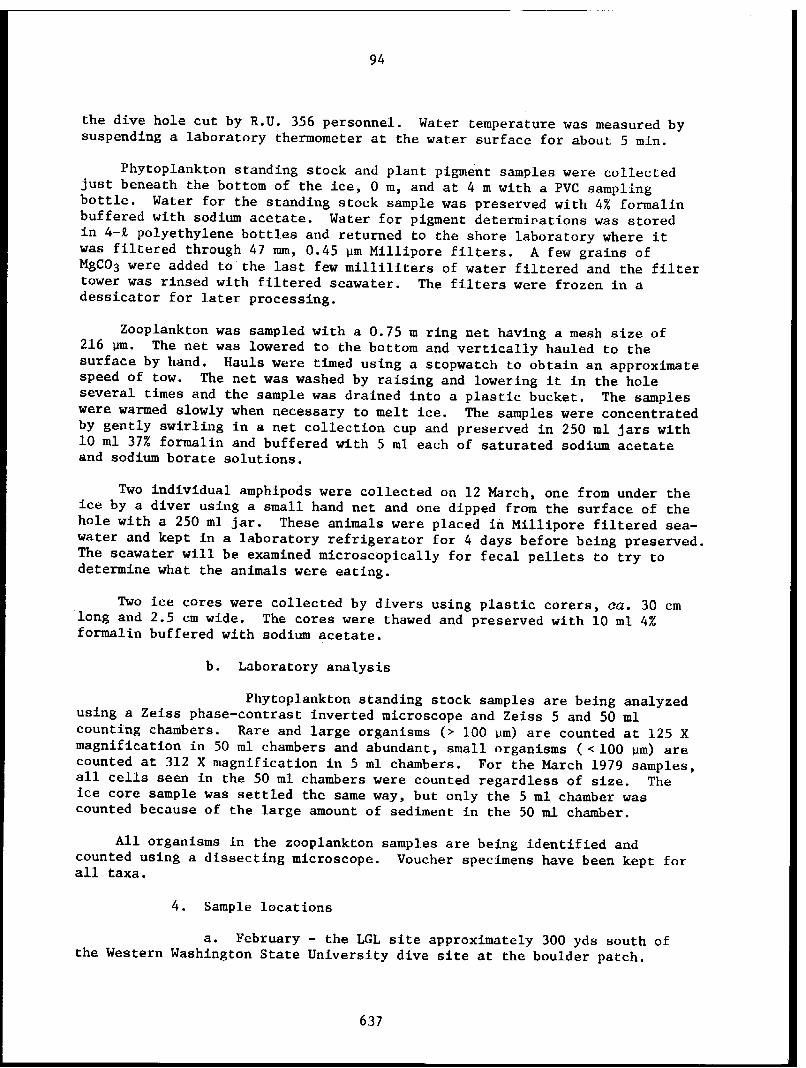
94
the dive hole cut by R.U. 356 personnel. Water temperature was measured bysuspending a laboratory thermometer at the water surface for about 5 min.
Phytoplankton standing stock and plant pigment samples were collectedjust beneath the bottom of the ice, 0 m, and at 4 m with a PVC samplingbottle. Water for the standing stock sample was preserved with 4% formalinbuffered with sodium acetate. Water for pigment determinations was storedin 4-l polyethylene bottles and returned to the shore laboratory where itwas filtered through 47 mm, 0.45 pm Millipore filters. A few grains ofMgCO 3 were added to the last few milliliters of water filtered and the filtertower was rinsed with filtered seawater. The filters were frozen in adessicator for later processing.
Zooplankton was sampled with a 0.75 m ring net having a mesh size of216 um. The net was lowered to the bottom and vertically hauled to thesurface by hand. Hauls were timed using a stopwatch to obtain an approximatespeed of tow. The net was washed by raising and lowering it in the holeseveral times and the sample was drained into a plastic bucket. The sampleswere warmed slowly when necessary to melt ice. The samples were concentratedby gently swirling in a net collection cup and preserved in 250 ml jars with10 ml 37% formalin and buffered with 5 ml each of saturated sodium acetateand sodium borate solutions.
Two individual amphipods were collected on 12 March, one from under theice by a diver using a small hand net and one dipped from the surface of thehole with a 250 ml jar. These animals were placed in Millipore filtered sea-water and kept in a laboratory refrigerator for 4 days before being preserved.The seawater will be examined microscopically for fecal pellets to try todetermine what the animals were eating.
Two ice cores were collected by divers using plastic corers, ca. 30 cmlong and 2.5 cm wide. The cores were thawed and preserved with 10 ml 4%formalin buffered with sodium acetate.
b. Laboratory analysis
Phytoplankton standing stock samples are being analyzedusing a Zeiss phase-contrast inverted microscope and Zeiss 5 and 50 mlcounting chambers. Rare and large organisms (> 100 pm) are counted at 125 Xmagnification in 50 ml chambers and abundant, small organisms (< 100 um) arecounted at 312 X magnification in 5 ml chambers. For the March 1979 samples,all cells seen in the 50 ml chambers were counted regardless of size. Theice core sample was settled the same way, but only the 5 ml chamber wascounted because of the large amount of sediment in the 50 ml chamber.
All organisms in the zooplankton samples are being identified andcounted using a dissecting microscope. Voucher specimens have been kept forall taxa.
4. Sample locations
a. February - the LGL site approximately 300 yds south ofthe Western Washington State University dive site at the boulder patch.
637

95
b. March - 70°19'N, 147°34.4'W, the Western Washingtondive site.
5. Data collected and analyzed
February MarchNo. No. No. No.Coll. Anal. Coll. Anal.
Plant pigments 2 0 10 0Phytoplankton standing stock 2 2 10 4Zooplankton standing stock
0.75 m ring net, 308 µm0.75 m ring net, 216 µm 10 3
Individual amphipods 2 0Ice cores 2 1
XI. Auxiliary material
A. References cited
Alexander, V. 1974. Primary productivity regimes of thenearshore Beaufort Sea with reference to potential roles of ice biota, pp.609-632. In J. C. Reed and J. E. Sater, eds., The Coast and Shelf of theBeaufort Sea. Arctic Institute of North America, Arlington, VA.
English, T. S., and R. Horner. 1977. Beaufort Sea plankton studies.Final report to BLM/NOAA for Contract # 03-5-022-67-TA2 # 4. 340 pp.
Horner, R. 1978. Beaufort Sea plankton studies. Annual report toBLM/NOAA for the period 1 Apr 77-31 Mar 78. 88 pp.
Horner, R., K. O. Coyle, and D. R. Redburn. 1974. Ecology of theplankton of Prudhoe Bay, Alaska. Univ. Alaska, Inst. Mar. Sci. Rep. R 74-2;Sea Grant Rep. 73-15. 78 pp.
Hsiao, S. I. 1978. Effects of crude oils on the growth of Arcticmarine phytoplankton. Environ. Pollut. 17:93-107.
Hsiao, S. I. C., M. G. Foy, and D. W. Kittle. 1977. Standing stock,community structure, species composition, distribution, and primary produc-tion of natural populations of phytoplankton in the southern Beaufort Sea.Can. J. Bot. 55:685-694.
Hsiao, S. I. C., D. W. Kittle, and M. G. Foy. 1978. Effects of crudeoil and the oil dispersant Corexit on primary production of Arctic marinephytolankton and seaweed. Environ. Pollut. 15:209-221.
638

96
Rass, T. S. 1968. Spawning and development of polar cod. Rapp.P. -v. Reun. Cons. perm. int. explor. Mer 158:135-137.
U.S. Naval Oceanographic Office. 1968. Instructional Manual forObtaining Oceanographic Data. Publ. 607, Third ed. U.S. GovernmentPrinting Office, Washington, D.C.
B. Papers in preparation or print: None
C. Oral presentations: Outside Review PanelSanta Cruz, CA.17-20 Apr 78
639*U.S. GOVERNMENT PRINTING OFFICE. 1979-0-677-096/1217


