Embed Size (px)
Citation preview
HYDROLOGICAL PROCESSESHydrol. Process. 27, 2197–2208 (2013)Published online 21 June 2013 in Wiley Online Library(wileyonlinelibrary.com) DOI: 10.1002/hyp.9852
Environmentally sustainable management of water demandsunder changing climate conditions in the Upper Ganges
Basin, India
Pratibha Sapkota,1 Luna Bharati,1* Pabitra Gurung,1 Nitin Kaushal2 and Vladimir Smakhtin31 International Water Management Institute, Jhamsikhel, Lalitpur, Nepal
2 WWF-India 172-B, Lodhi Estate, New Delhi 110003, India3 International Water Management Institute, 127, Sunil Mawatha, Pelawatte, Battaramulla, Sri Lanka
*CInsE-m
Co
Abstract:
Allocation of water to cities, industries and agriculture has been a common practice in river basin planning and management. It iswidely accepted that water also needs to be allocated for the aquatic environment, i.e. alongside the demands of other users. Thispaper describes the application of a basin planning model (Water Evaluation and Planning Model) to assess present and alternativewater management options, which include incorporation of environmental flows (EFs) in the Upper Ganges River, India.Furthermore, the impacts of projected climate changes are also considered. The paper also briefly summarizes the EF assessmentmethodology, which was conducted through a multidisciplinary, multi-stakeholder approach (Building Blocks methodology). Thisis the first time that a comprehensive EF assessment has been done in India. Results from this study show that annual water demandsfor the domestic, industrial and irrigation water use are 1375, 1029 and 6680MCM, respectively. Unmet demands, i.e. when there isnot enough water to fulfil the required demands, were a problem during December and January for the past climate and duringDecember, January and February under climate change-projected conditions. Adding EFs increased unmet demands in the samewinter months. During March–November, unmet water demands were less than 5MCM even with the addition of EFs. Reducingcrop type to less water intense crops was more effective in reducing unmet demands than decreasing the cropped area. Improvingirrigation systems through improved efficiency and water saving technologies as well as conjunctive use of surface and groundwater is also viable options. However, the most effective water management solution is from managing upstream storage structuressuch as the Tehri dam for increased dry season flows. Dry season releases from Tehri dam can be used to reduce the downstreamunmet demands, which include EFs to less than 5MCM/month. Copyright © 2013 John Wiley & Sons, Ltd.
KEY WORDS environmental flows; basin water management; Ganges Basin
Received 14 July 2012; Accepted 14 March 2013
INTRODUCTION
Increasing demands for water to fulfil the diverse societaldevelopmental needs within the domestic, agricultural,industrial and commercial sectors has led to increasingexploitation of rivers. Water allocation rules are put in placeto ensure that various parties receive a portion of developedwater supplies. Allocation of river water to cities, industriesand agriculture has been a common practice; but, now thereis an increasing recognition of the need to also allocate waterto maintain the river at an acceptable ecological state. Theterm ‘environmental flows’ (EFs) is now commonly used torefer to a flow regime designed to maintain a river in someagreed ecological condition.All components of the natural hydrological regime have a
certain ecological significance. For example, high flowswith return periods of 5–2 years ensure channelmaintenanceand riparian wetland flooding. Moderate flows occurring30–60% of the time may be critical for cycling of organicmatter from river banks and for fish migration. Low flows
orrespondence to: Luna Bharati, International Water Managementtitute, Jhamsikhel, Lalitpur, Nepalail: [email protected]
pyright © 2013 John Wiley & Sons, Ltd.
in the 70–95% exceedence range are important for fishspawning, algae control and use of the river by local people.In regulated basins, the magnitude, frequency and durationof some or all flow components are modified, and the suiteof acceptable flow limits for suchmodifications can ensure aflow regime capable of sustaining some target set of aquatichabitats and ecosystem processes. EFs can therefore be seenas a compromise between river basin development on theone hand and maintenance of river ecology on the other(Tharme, 2003; Smakhtin and Anputhas, 2006; Smakhtinand Eriyagama, 2008).This study was conducted under the living Ganga
programme, coordinated by WWF-India. In the first partof the living Ganga programme, EF assessments werecarried out under the current as well as future projectedclimate systems (O’Keeffe et al., 2012; Bharati, 2011). TheBuilding Block Methodology (BBM) was selected for EFassessments. The BBM allows the user to integrate localrequirements, for instance, in case of River Ganga, thespiritual and cultural aspects are of immense importance andthus require due consideration. In addition to the spiritual andcultural aspects, the following sub-components were identi-fied: Fluvial Geomorphology, Biodiversity, Livelihoods and

2198 P. SAPKOTA ET AL.
Water Quality. The quantified EF requirements were thenincorporated into a basin planning model Water Evaluationand Planning Model (WEAP) to look at alternativemanagement practices, which would allow for EF alloca-tions. This paper will focus on the incorporation of EF inbasin water allocation under past and future climatescenarios. Firstly, some background information on theGanges is provided followed by a summary of the EF settingprocess as well as a brief description of theWEAPmodel setup. In the Results and Discussion section, water manage-ment options with the inclusion of EF are presented underboth present and future climate scenarios.
Background: the Upper Ganges Basin
The Ganges River Basin covers 981 371 km2 and isshared by India, Nepal, China (Tibet) and Bangladesh.The River originates in Uttar Pradesh, India from theGangotri glacier, and has many tributaries including theMahakali, Gandak, Kosi and Karnali, which originate inNepal and Tibet. The Ganges River is considered sacredand revered by millions of Hindus all over the world. Thefocus of the present study was on the Upper Ganges – theupper main branch of the River. The Upper Ganges Basin(UGB) was delineated by using the 90-m SRTM digitalelevation map with Kanpur barrage as the outlet point(Figure 1). The UGB mainstream encompasses numerousdams and barrages. The main dams/barrages along theBhagirathi and Ganga River are Tehri, Bhimgoda, Naroraand Kanpur barrages. Furthermore, the main dam inthe Ramganga River is the Ramganga dam. Tehri andRamganga are the largest dams with storage capacities of3540 and 2450Mm3 and became operational in 2007 and1988, respectively (Jain et al., 2007).In the UGB, various canals, i.e. the Upper Ganga canal,
Eastern Ganga canal, Madhya Ganga canal and LowerGanga canal take off from the main branch of the river,and these canals are major sources of water for supportinglivelihoods. The Upper Ganga canal starts from the rightbank of river Ganga at Bhimgoda Barrage, and irrigatesover 2 million-ha area, whereas the Eastern Ganga canal,a kharif irrigation system, originates from the left bank ofBhimgoda Barrage and irrigates 105 000-ha area. Similarly,the Madhya Ganga canal provides irrigation to 178 000 haand the Lower Ganga canal starts from the Narora barrageand irrigates over 0.5 million ha (UP Irrigation Department,http://idup.gov.in)In more recent years, farmers have started planting high
water intensive crops such as sugarcane instead of thetraditional low intensive crops (Kaushal and Kansal, 2011).Also, cropping areas in the UGB has increased tremen-dously, and water is also withdrawn for domestic andindustrial purposes. This has put immense pressure oncanals supplying water downstream to maintain flowsduring the dry season. Decrease in river flow levels is alsoaffecting the in-stream biota as well as the river ecologicalsystem. Furthermore, the impacts of climate change (CC)will add further challenges to the management of theriver system.
Copyright © 2013 John Wiley & Sons, Ltd.
ENVIRONMENTAL FLOW ASSESSMENT
To characterize the river in its different reaches, zones weredefined, on the basis mainly of the changing gradient andconsequent geomorphological conditions, overlain by thechanging land-uses and river developments. Three locationsthat are shown in Figure 1 were then identified, Kaudiyala(EF1 representing Gangotri to Rishikesh), Kachla Ghat(EF3 representing Narora to Farrukabad) and Bithoor(EF4 representing Kannauj to Kanpur). EF assessmentwas carried out in the mentioned river stretches.For this study, the BBM was selected for the
assessment of EFs. The choice was driven by themethod’s flexibility, and applicability and reliabilityunder different levels of data and information availability.This methodology allows the user to integrate localrequirements, for instance, in the case of River Ganga, thespiritual and cultural aspects are of immense importanceand thus require due consideration. In addition to thespiritual and cultural aspects, the following sub-components were identified: Fluvial Geomorphology,Biodiversity, Livelihoods and Water Quality.Experts were then identified to design standard
investigations to relate the ecology, geomorphology,water quality and socio-economic and religious/culturalissues to particular flow requirements during differentseasons. In the BBM method, typically, specialists willchoose indicator species, processes or activities that aresensitive to flow modifications, on the assumption that, ifflow requirements for these indicators are met, then theother flow-related issues for that specialization will alsobe satisfied. For example, one or more fish species thatrequire particular depth, flow velocity or habitat condi-tions will be designated as ecological indicators,together with flow-sensitive benthic invertebrate groups,and floodplain vegetation types, which require inunda-tion at seasonal intervals. These will then be investigatedduring the field sampling process, to establish hydraulichabitat requirements, usually in terms of depth, velocity,river width and substrate type. Similarly, the geo-morphologists will determine the hydraulic conditionsrequired to maintain or rehabilitate particular channelforms, normally in terms of the flow velocities requiredto move, sort and deposit particular sediment sizes. Atthe assessment workshop, the specialist teams will usethese indicators as the basis for recommending particularflow conditions during each season, to maintain/restorethe conditions that will meet the pre-determinedenvironmental objectives for each river zone. Thewater quality group will determine the water qualityguidelines, which should be met to ensure the survivalof required biodiversity, and to allow desired activities(e.g. livestock watering) in the river. They will analysethe consequences of the different flows recommended bythe other specialist groups on water quality, to determineif these recommended flows would meet the waterquality guidelines. The socio-economic team willdetermine which groups of people are directly dependenton a healthy riverine environment for activities, such as
Hydrol. Process. 27, 2197–2208 (2013)

Figure 1. Map of the Upper Ganges River catchment showing the boundaries of the Upper Ganges Basin, location of the barrages, reservoirs,environmental flow (EF) sites and observed data points used in the study
2199BASIN WATER MANAGEMENT – CASE STUDY FROM THE UPPER GANGES BASIN
fishing, water collection, livestock watering and recre-ation, and will attempt to quantify the importance andvalue of these activities to the community. They willthen assess what effects different flow conditions willhave on these activities and how they will be affected bymodifications to the flow regime.The hydrological and hydraulics teams have a support-
ive and interpretive function in the BBM process. Thehydaulics specialists are required to provide surveyedcross-sections, or habitat simulations and hydraulicmodels, which will allow the conversion of the habitat/process requirements of other specialist teams, in terms ofdepths, velocities, widths and so on, to be converted intoflow requirements in m3/s. The hydrologists are requiredto provide the seasonal flow patterns, on which the otherspecialist teams base their high and low flow recommen-dations, to check the realism of flow recommendations inrelation to the actual flow patterns experienced in the riverand to convert the individual instantaneous flow recom-mendations of the other teams into expected annual flowpatterns during wet and dry years.
Copyright © 2013 John Wiley & Sons, Ltd.
To summarize, the BBM is based on the following steps:
1. using a stake-holder consultation process to setobjectives for the environmental condition of the river,
2. assessing a modified flow regime that will meet thoseobjectives,
3. using flow-dependent indicators (e.g. river dolphins,gharial, turtles, fish, invertebrates and floodplain plants)and non-consumptive human requirements, as well aswater quality metrics and sediment transport, to identifywater depths, velocities, river widths and substrate typesthat will provide the required habitats and conditions;such hydraulic requirements can then be converted tohydrological (flow) requirements and
4. identifying the critical components (building blocks) ofthe flow regime that govern environmental conditions(e.g. dry and wet season base flows, and different-sizedhigh flows and floods).
In the final flow setting workshop, the expert groupmembers collectively determine the final EF requirements.
Hydrol. Process. 27, 2197–2208 (2013)

2200 P. SAPKOTA ET AL.
The process for deciding on recommended flows is toachieve a consensus among all the groups on a modifiedflow regime that will be sufficient to meet the requirementsof all species, components and processes in the river duringdifferent seasons. The recommended flows are based onthe flow indicators chosen by each specialist group, i.e. theGeomorphology group concentrated on flow velocities anddepths sufficient to move, sort and deposit different sizes ofsediment, so as the maintain or restore channel size andimportant channel features (such as multiple channels andbars). The biodiversity group concentrated on the habitatcharacteristics for important flow-dependent species suchas dolphin, selected fish species, macro-invertebrates andfloodplain vegetation, in terms of the depths, flowvelocities, river widths and substrate types required fordifferent parts of their lifestyles. The livelihood groupanalysed their interview data for clues as to the depths,water quality and river width required to maintain servicessuch as ferrying. The spiritual/cultural group analysed theresults of interviews to ascertain the depths and water-quality issues that would affect the religious activities suchas bathing from ghats, washing away of ritual offerings andcremation rites. Furthermore, the spiritual aspects werefound to be not only based on a functional demand but alsomore of a subjective or emotional need based on aperception of what a mighty goddess-river ought to be like.One comment was that ‘boulders in the middle of the rivershould not be visible from the ghats.’ If the bed is visible,then it means that the river has shrunk to an unacceptablelevel, which is not the mighty river of their imagination.The assessment resulted in EF requirements for mainte-
nance flows ranging from 72% of mean annual runoff(MAR) in the upper stretches to 45% of (MAR) in the lowerstretches. Figure 2 shows the monthly EFs requirement forZone 3 (EF3 in Figure 1). The figure presents the monthlyEFs requirement for both the low-flow as well as high-flowmaintenance requirements. Maintenance flows are for‘normal’ years (70% probability), neither very wet nor verydry, when all the ecological functions and processes (fishbreeding, invertebrates emerging, floodplain wetlandsfull, sediment transported, etc.) can be expected to beworking properly. Low-flow maintenance refers todrought years. The figure also presents the naturalized
Figure 2. Recommended environmental flows (EFs) requirement formaintenance years for the Kachla Ghat (EF3 in Figure 1)
Copyright © 2013 John Wiley & Sons, Ltd.
flows as well as simulated present day flows. The EFsrecommendations were calculated as 45% of the naturalMAR during normal years. The present day flows arelower than the EFs requirements from January till June,which means that to maintain EFs, the dry season waterallocation from the other sectors has to be reduced.Because agriculture is the largest water user, the waterrequired to fulfil the environmental demands wouldprobably have to come from the agricultural sector.Further detailed information on EFs assessment in theGanges can be found in O’Keffe et al., 2012.
WATER EVALUATION AND PLANNING MODEL
In the present study, the WEAP was used to evaluatewater management in the Upper Ganga basin with theobjective of trying to increase flows to meet the EFdemands. WEAP is a basin modelling package thatoperates on the basic principle of water accounting anddetermines the allocation of water according to demandpriorities. WEAP was selected among other modelsbecause it is comprehensive, straightforward and easy-to-use (SEI, 2001). Also, WEAP can address a wide rangeof issues such as water conservation, groundwater/streamflow simulations and barrage/reservoir operations. Themain aspect of the WEAP model is a water balanceequation that includes components such as catchment-scale evaporation demands, rainfall-runoff processes,groundwater recharge and irrigation requirements. Theseare linked to the stream network and water allocationcomponents (demand sites) via the WEAP 21 interface,where a stream network keeps track of water allocationsand accounts for stream flow depletion and addition(Yates et al., 2005). All demand sites are assigned apriority between 1 and 99, where 1 is the highestpriority and 99 is the lowest. When water is limited,the model progressively restricts water allocation todemand sites with lower priority. More details of themodel are available in the work of Yates et al. (2007)and SEI (2001).
WEAP set-up for the UGB
In the current study, the UGB is divided into six sub-basins (Figure 3a). The Schematic diagram used in WEAPis shown in Figure 3b. The numerous dams, barrages andcanal systems in the UGB have also been incorporated inthe model. In the model setup, EF requirements formaintenance flows are also added. The EFs were enteredin monthly basis and were assigned higher priorities thanfor agriculture.
Defining supplies and demands
In WEAP, water supply includes river flow, precipita-tion and groundwater. In the present model setup, riverflows were obtained from a distributed hydrologicalmodel, which was set up for the study basin (Bharatiet al., 2011a,b). In the study by Bharati et al., 2011a,b,
Hydrol. Process. 27, 2197–2208 (2013)

Figure 3. (a) Schematic showing six sub-basins of Upper Ganges Basin, (b) schematic from the Water Evaluation and Planning Model showing barrages,dams, canals and water demand sites at sub-basin levels
2201BASIN WATER MANAGEMENT – CASE STUDY FROM THE UPPER GANGES BASIN
the Soil Water Assessment Tool was applied in theUGB using observed climate data from 1971 to 2005.Simulated data for flows were used because dischargedata in the Himalayan part of the basin are scarce due tolack of measurement stations. In the downstream plains,although discharge data from gauging stations exist, thesedata are not accessible to the public because of nationalsecurity laws in India. The Soil Water Assessment Toolmodel was, however, calibrated, and results were validatedwith measured flow data from Bhimgoda, Narora andKanpur barrages.Results from the water balance analysis from the model
outputs show that annual average precipitation, actual ETand net water yield of the whole basin were 1192, 416and 615mm, respectively. However, there was a largevariation in the spatial distribution of these components.Precipitation, ET and water yield were found to be higherin the forested and mountainous upper areas. In the uppersub-basins, water yield is higher than ET. However, insome of the lower sub-basins dominated by agriculture,ET values were higher than water yield. Furthermore,the mean monthly results from 1971 to 2005 show thatthere are large temporal variations in the water balancecomponents. The maximum precipitation of 338mmoccurred during August and a minimum of 7mm occurred
Copyright © 2013 John Wiley & Sons, Ltd.
in November. Similarly, water yields are also muchhigher during the monsoon months (June–September) ascompared with the dry season. ET, however, which ismore related to land cover, was found to be lowest duringthe winter months, i.e. November–January (post-riceharvest) and high from April–September. Further analysisand information on water balances can be found in thework of Bharati et al., 2011a,b.Groundwater withdrawal and storage data for each
district in Uttar Pradesh were obtained from Uttar PradeshGround Water Department website GWD (2012). Simi-larly, groundwater data for Uttarakhand was obtainedfrom the Central groundwater department website http://cgwb.gov.in/gwprofiles/Uttarakhand.htm. Thereafter,each groundwater source in each sub-basin is connectedto the irrigation demand sites via a transmission link.In the WEAP set up, the supply is gradually depleted
through demands and other natural processes. Waterdemands incorporate water requirements for domestic,irrigation, livestock and environmental uses. Threedemand sites were created in each sub-basin,representing irrigation, domestic and industrial require-ments. The domestic and industrial water demands inUGB were taken from district-level data (Table I) fromAmarasinghe et al. (2007).
Hydrol. Process. 27, 2197–2208 (2013)

Table I. Annual demand requirements from the sub-basins inUpper Ganges Basin from Amarasinghe et al. (2007)
Number Sub-basin
Demands (MCM/year)
Domestic Industries
1 Tehri dam 17 122 Haridwar 55 373 Narora 140 1034 Ramganga dam 21 145 Ramganga River outlet 391 2926 Kanpur 753 573
Table II. Major crops sown in Upper Ganges Basin from 2003 to2004 and 2007 to 2008 (presented in thousand hectares)
Major crops 2003–2004 2007–2008
Cereals Rice 1868.02 2003.65Wheat 4086.25 4084.45Sorghum 1.279 1.49Bajra 32.65 58.98Barley 84.65 66.27Maize 206.55 253.93Ragi 0.033 0.038
Pulses Bengal Gram 9.97 7.97Arahar 44.35 41.69Other Pulses 93.78 83.91
Oils Groundnut 0.41 2.25Seasum 0.42 1.25Mustard 207.81 235.85Soyabean 0.272 0.382Linseed 0.071 0.13
Others Sugarcane 1521.23 1655.54Fodder 468.45 474.31Fruits and Vegetables 524.71 559.63Cotton 3.35 2.7
Table III. Water Evaluation and Planning Model input data for
Dams/canals Features
Ramganga dam Storage capacity: 2448MUpperGanga canal Maximum diversion: 297Madya Ganga canal Maximum diversion: 122Ramganga canal Maximum diversion: 151Tehri dam Storage capacity: 3540MLowerganga canal Maximum diversion: 156
2202 P. SAPKOTA ET AL.
Copyright © 2013 John Wiley & Sons, Ltd.
Water requirements for irrigation/crop demands werecalculated with the model. Input parameters to calculateirrigational demands are irrigated area, crops, precipita-tion, monthly reference evapotranspiration (ETo) andgroundwater contribution for irrigation. The analysis yearsare based on starting from June till May. The major cropsin Upper Ganga in June 2003–May 2004 are listed inTable II. Data on irrigated area and crops (2003–2004 and2007–2008) were obtained from DACNET (2012). Cropcoefficient values were acquired from FAO, 1998. In2007–2008, more pulses, sugarcane, cotton, fruits and
the
m3
m3
m3
m3
m3
m3
vegetables were planted than in 2003–2004. Calculation ofreference ETo requires data such as temperature, humidity,wind speed and sunshine hours. Data for the stations wereobtained using New_LocClim (Local Climate Estimator;Grieser et al., 2006). LocClim is used to estimate climaticconditions for data stations where no observations areavailable. For the current study, LocClim was used toestimate data such as vapour pressure, wind speed andsunshine hours. After acquiring these data, Eto Calculatorsoftware was used to estimate reference ETo. The Etocalculator is a user friendly software developed forestimating Eto according to FAO recommendations(Smith 1992; Smith et al., 1996). For the current study,Penmann–Monteith Method was selected for ETocalculations.Demand sites namely domestic, industrial and
irrigational sites are assigned priorities. In this study,domestic demands were given the highest priorityfollowed by irrigation and industry. The input parametersfor dams and canals are shown in Table III. Simulationswere conducted over the period of 16 years, i.e. fromJanuary 1990 to December 2005.Climate data from PRECIS–CM model were used as
input to the WEAP model to estimate future conditions.PRECIS is an atmospheric and land-surface modeldeveloped at the Meteorological Office Hadley Centre,UK, for generating high resolution CC information formany regions of the world (Jones et al., 2004). PRECISdownscales data from the Hadley Center Coupled Model,version 3 (HadCM3) GCM for Special Report on EmissionScenarios A2 and B2 scenarios. More specifics aboutPRECIS and downscaling are described by Bharati et al.,2011a,b. A2 relates to high population growth with slowerper capita economic growth and technological change, andB2 relates to moderate population growth and economicdevelopment with less rapid and more diverse technolog-ical change. The time series climate data were obtained forthe period of 2071–2100 and include variables such asprecipitation and mean temperature.Results from the CC analysis show that dry and wet
season flows under CC scenario A2 are lower than thosein present climate conditions at upstream locations buthigher at downstream locations of the UGB. Flows underCC scenario B2 are systematically higher and lower thanthose under CC scenario A2 during dry and wet seasons,respectively. The dates of minimum daily discharges arehighly variable among stations and between different
dams and barrages in the Upper Ganges Basin and their sources
Data source
UP Irrigation Department, http://idup.gov.in/s/s/s
Jain et al. (2007)/s
Hydrol. Process. 27, 2197–2208 (2013)

2203BASIN WATER MANAGEMENT – CASE STUDY FROM THE UPPER GANGES BASIN
CC scenarios, whereas the dates of maximum flow aredelayed downstream as a result of the delay in the onsetof the monsoon in the lower parts of the basin. Furtherinformation on the CC analysis in the UGB can be foundin the work of Bharati et al., 2011a,b.
Analysis using WEAP
The WEAP model allows analysis of various climateand water management settings. Therefore, the model wasrun under the following settings:
• landuse from 2003 to 2004 (with cropping pattern fromJune 2003 to May 2004) with past climate data from1991 to 2005,
• landuse from 2007 to 2008 (with cropping pattern fromJune 2007 to May 2008) with past climate data from1991 to 2005,
• landuse from 2003 to 2004 (i.e. cropping pattern fromJune 2003 to May 2004) with future climate projecteddata 2071–2100 (A2 scenario),
• landuse from 2003 to 2004 (i.e. cropping pattern fromJune 2003 to May 2004) with future climate projecteddata 2071–2100 (B2 scenario),
• landuse from 2007 to 2008 (with cropping pattern fromJune 2007 to May 2008) with adding EF requirementunder past and future climate data,
• scenario with 40% less crop area,• scenario with 40% reduction in water intensive crops,• scenario with 10% reduction in water use foragriculture,
• scenario with water storage at Tehri dam and• scenario with and without groundwater throughoutthe basin.
Model validation
Simulated flows at Bhimgoda, Narora and Kanpurbarrages were validated against observed data availablefrom January 2000 to December 2005. The modelperformance was determined by calculating the coeffi-cient of determination (R2) and the Nash–SutcliffeEfficiency (NSE). R2 describes the proportion ofvariance in measured data explained by the model. R2
Table IV. Model performance statistics for t
Station Validation period Static
Bhimgoda April 2002–December 2005 R2
NSE
Narora January 2000–June 2005 R2
NSE
Kanpur June 2003–October 2003 R2
NSE
NSE, Nash–Sutcliffe Efficiency.
Copyright © 2013 John Wiley & Sons, Ltd.
ranges from 0 to 1, with higher value indicating less errorvariance. R2 values greater than 0.5 are generallyconsidered acceptable (Santhi et al., 2001). Similarly,NSE indicates how well the plot of observed versussimulated data fits the 1 : 1 line. NSE ranges between�1 and 1 where NSE that equals 1 is the ideal value.According to Sevat and Dezetter, 1991, NSE is the bestfunction for reflecting the overall fit of a hydrograph.Moriasi et al. (2007) also concluded that the modelsimulation can be referred as acceptable if NSE is greaterthan 0.5. As can be seen from Table IV, both the NSEand R2 values were above 0.7 for all the sites. Therefore,the model simulations were found to be acceptable forfurther analysis.
RESULTS AND DISCUSSION
Water demands from various sectors
Figure 4 shows mean monthly water demands from thedomestic, industrial and irrigational sectors under the2007–2008 cropping pattern in the UGB. The data havebeen aggregated for all six sub-basins. Domestic demandsand industrial demands are very low compared withirrigational water demands. The annual water demandsfor the domestic and industrial water use are 1375 and1029MCM, respectively. The average crop waterdemands in the dry season (October–May) and wetseason (June–September) were 574% and 11% higher,respectively, than the domestic demands. Similarly, theaverage crop water demands are 800% higher than theindustrial water demands during dry season and 48%higher in the wet season. Crop water demands are thehighest from June through March; however, because ofabundant rainfall from June through September,irrigational water demands from the canals decrease inthese months. During the dry season, the demand forirrigation water was 6169MCM, whereas during the wetseason, the demand was 511MCM.
Unmet demands in UGB
The total amount of domestic, industrial and irrigationalwater demands that are not met through rainfall, ground-
he Water Evaluation and Planning Model
s Value Ratings (Sevat and Dezetter, 1991)
0.82 (0.65–0.85)Very good
0.75 (0.65–0.85)Very good
0.86 (>0.85)Excellent
0.86 (>0.85)Excellent
0.72 (0.65–0.85)Very good
0.68 (0.65–0.85)Very good
Hydrol. Process. 27, 2197–2208 (2013)

0
200
400
600
800
1000
1200
Jun Jul Aug Sep Oct Nov Dec Jan Feb Mar Apr May
MC
M
Water Demands
Irrigation -Demands
Irrigation-Available
Industry
Domestic
Figure 4. Mean monthly (1991–2005) water demands in Upper Ganges Basin based on cropping pattern from June 2007 to May 2008
2204 P. SAPKOTA ET AL.
water and surface water are the unmet demands. Unmetdemands show the extent of water shortage at a monthlybasis. On the basis of the 2007–2008 cropping pattern, totalmean monthly unmet demands (i.e. for irrigation, industryand domestic sectors) in UGB with and without EFsare shown in Figure 5. With EFs, unmet demands were<5MCM from February to November. However, unmetdemands in December and January without EFs were36.2MCM and with EFs were 63.7MCM.
Effects of climate change on water demands in UGB
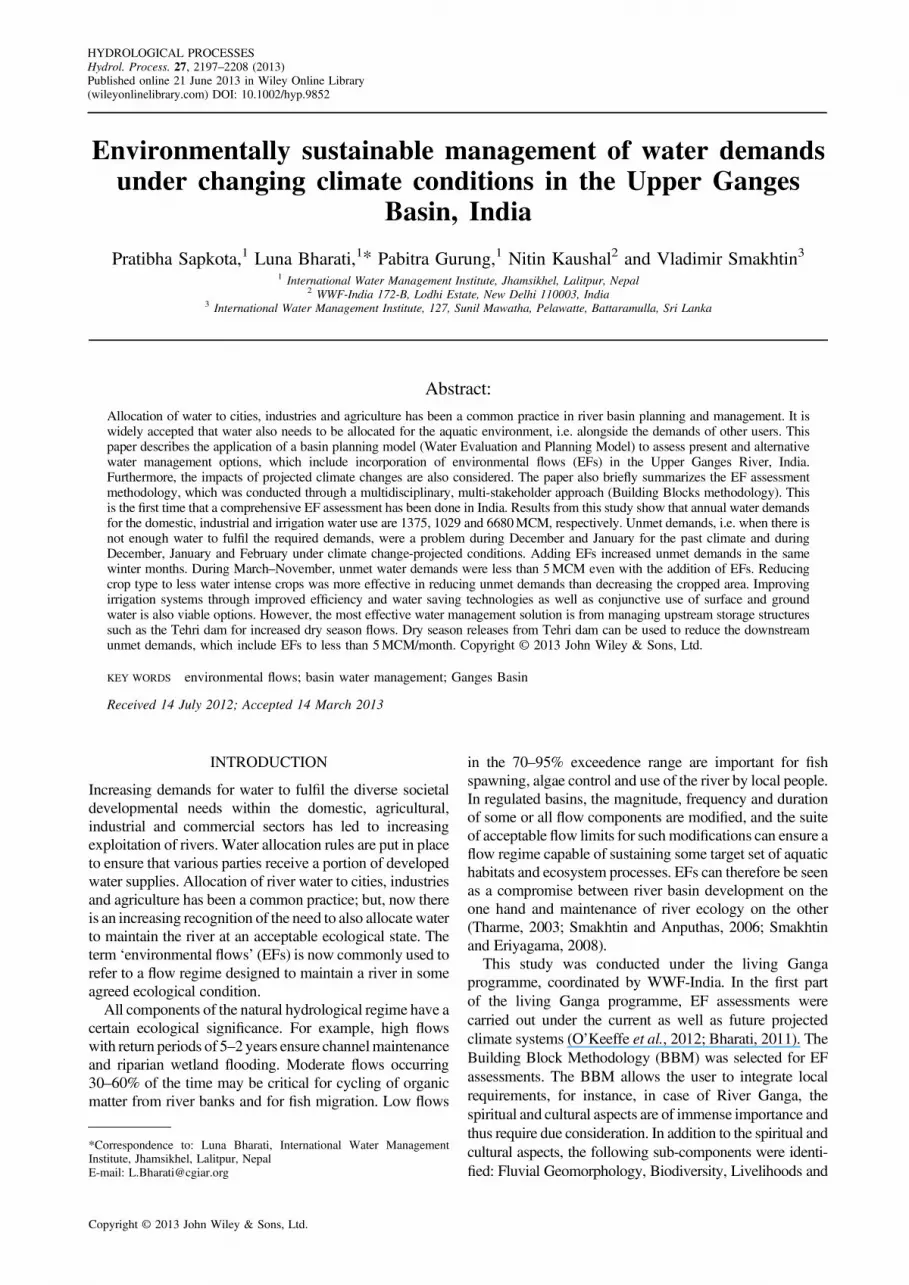
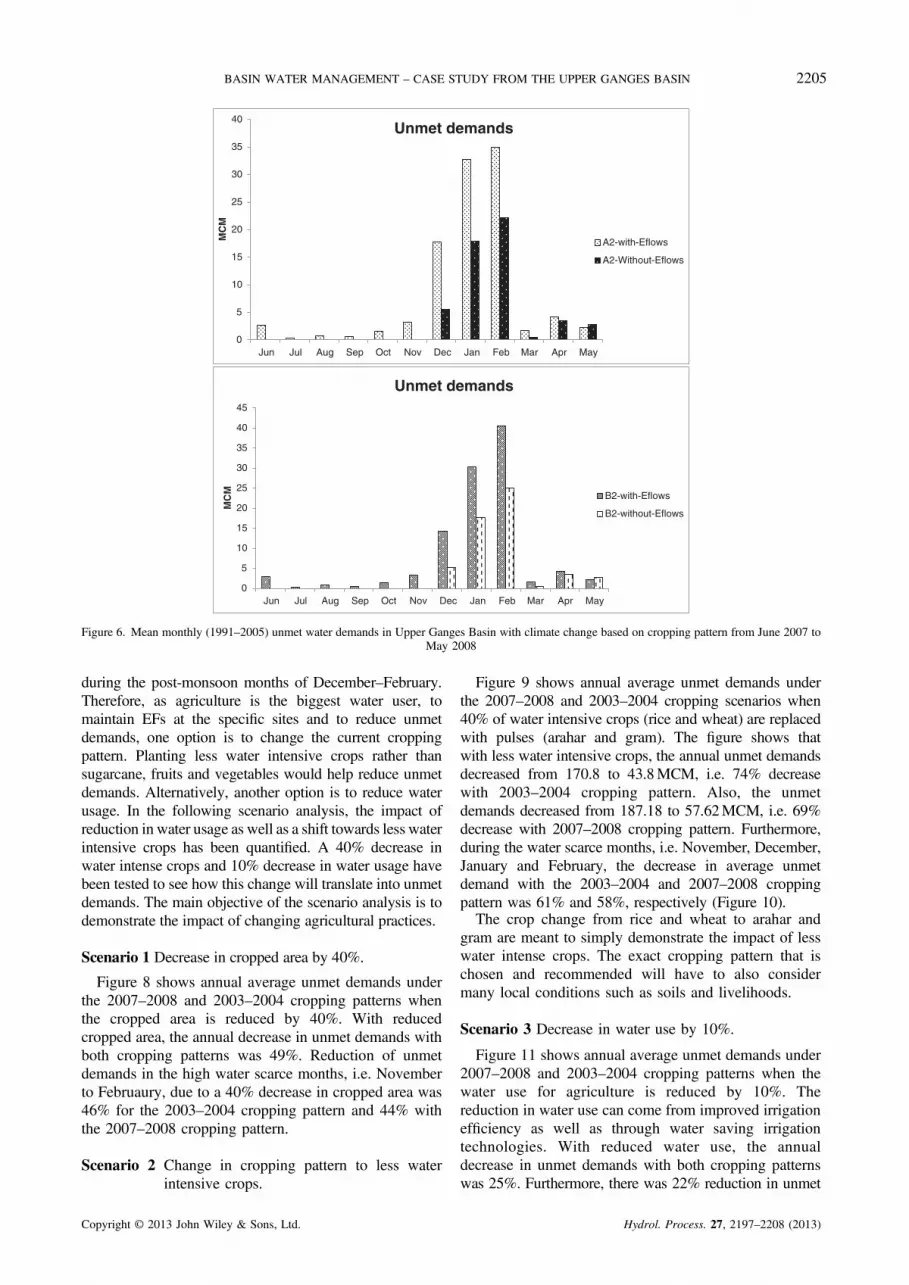
Figure 6 shows mean monthly unmet demands basedon the 2007–2008 cropping pattern, with and without EFsunder CC conditions. Under the A2 scenario with EFs,unmet demands were less than 5MCM from Marchthrough November. However, during December, Januaryand February, the unmet demands increased from 45.7 to85.4MCM, i.e. the increment was 87% higher thanwithout EFs during these months. Furthermore, no unmetdemands occurred in monsoon without EFs, and unmetdemands with EFs during these months were less than5MCM. Under the B2 scenario, the increment in unmetdemands with EFs during December, January and Februarywas 37.2MCM than without EF, i.e. 78% increase thanwithout EFs. Furthermore, no unmet demands occurred in
0
5
10
15
20
25
30
35
40
45
Jun Jul Aug Sep Oct Nov Dec Jan Feb Mar Apr May
MC
M
Unmet demands
With-Eflows
Without-Eflows
Figure 5. Mean monthly (1991–2005) unmet irrigational demand based on cropping pattern from June 2007 to May 2008
Copyright © 2013 John Wiley & Sons, Ltd. Hydrol. Process. 27, 2197–2208 (2013
the monsoon without EFs, and unmet demands with EFsduring these months were also less than 5MCM. Resultstherefore show that the problem of unmet demands ismostly during the months of December and Januaryunder the past climate and during December, January andFebruary under CC. Adding EF demands also increases theunmet demands during these same months. During allthe other months, the unmet demands are below 5MCM.Table V also summarizes the total unmet demands in theUGB in MCM with and without CC and EFs.
Effect of Land use change in unmet water demands in theUGB
Figure 7 shows mean monthly unmet agricultural waterdemands under the 2003–2004 and 2007–2008 croppingpatterns in all sub-basins. The increase in water demands ismainly due to increase in the cropping area and land usechange. The growing of less intensive crops decreasedfrom 2003 to 2007, whereas high water intensive cropssuch as sugarcane, fruits and vegetables increased in thewhole basin. The average increment in unmet demandsfrom 2003 to 2007 during dry season was 13%.
Scenario analysis with change in agricultural practices
With water allocation for EFs in the main river, the unmetdemands in the other sectors increases by more than 75%
)
0
5
10
15
20
25
30
35
40
Jun Jul Aug Sep Oct Nov Dec Jan Feb Mar Apr May
MC
M
Unmet demands
A2-with-Eflows
A2-Without-Eflows
0
5
10
15
20
25
30
35
40
45
Jun Jul Aug Sep Oct Nov Dec Jan Feb Mar Apr May
MC
M
Unmet demands
B2-with-Eflows
B2-without-Eflows
Figure 6. Mean monthly (1991–2005) unmet water demands in Upper Ganges Basin with climate change based on cropping pattern from June 2007 toMay 2008
2205BASIN WATER MANAGEMENT – CASE STUDY FROM THE UPPER GANGES BASIN
during the post-monsoon months of December–February.Therefore, as agriculture is the biggest water user, tomaintain EFs at the specific sites and to reduce unmetdemands, one option is to change the current croppingpattern. Planting less water intensive crops rather thansugarcane, fruits and vegetables would help reduce unmetdemands. Alternatively, another option is to reduce waterusage. In the following scenario analysis, the impact ofreduction in water usage as well as a shift towards less waterintensive crops has been quantified. A 40% decrease inwater intense crops and 10% decrease in water usage havebeen tested to see how this change will translate into unmetdemands. The main objective of the scenario analysis is todemonstrate the impact of changing agricultural practices.
Scenario 1 Decrease in cropped area by 40%.
Figure 8 shows annual average unmet demands underthe 2007–2008 and 2003–2004 cropping patterns whenthe cropped area is reduced by 40%. With reducedcropped area, the annual decrease in unmet demands withboth cropping patterns was 49%. Reduction of unmetdemands in the high water scarce months, i.e. Novemberto Februaury, due to a 40% decrease in cropped area was46% for the 2003–2004 cropping pattern and 44% withthe 2007–2008 cropping pattern.
Scenario 2 Change in cropping pattern to less waterintensive crops.
Copyright © 2013 John Wiley & Sons, Ltd.
Figure 9 shows annual average unmet demands underthe 2007–2008 and 2003–2004 cropping scenarios when40% of water intensive crops (rice and wheat) are replacedwith pulses (arahar and gram). The figure shows thatwith less water intensive crops, the annual unmet demandsdecreased from 170.8 to 43.8MCM, i.e. 74% decreasewith 2003–2004 cropping pattern. Also, the unmetdemands decreased from 187.18 to 57.62MCM, i.e. 69%decrease with 2007–2008 cropping pattern. Furthermore,during the water scarce months, i.e. November, December,January and February, the decrease in average unmetdemand with the 2003–2004 and 2007–2008 croppingpattern was 61% and 58%, respectively (Figure 10).The crop change from rice and wheat to arahar and
gram are meant to simply demonstrate the impact of lesswater intense crops. The exact cropping pattern that ischosen and recommended will have to also considermany local conditions such as soils and livelihoods.
Scenario 3 Decrease in water use by 10%.
Figure 11 shows annual average unmet demands under2007–2008 and 2003–2004 cropping patterns when thewater use for agriculture is reduced by 10%. Thereduction in water use can come from improved irrigationefficiency as well as through water saving irrigationtechnologies. With reduced water use, the annualdecrease in unmet demands with both cropping patternswas 25%. Furthermore, there was 22% reduction in unmet
Hydrol. Process. 27, 2197–2208 (2013)

TableV.Meanmonthly
(1991–
2005)unmetdemands
intheUpper
GangesBasin
inMCM
with
andwith
outclim
atechange
(CC)andenvironm
entalfl
ows(EFs)basedon
cropping
pattern
from
June
2007
toMay
2008
Unm
etdemands
with
outCC
June
July
August
September
October
Novem
ber
Decem
ber
January
February
March
April
May
With
EFs
2.73
0.94
1.98
1.05
2.98
5.93
20.59
43.08
4.18
2.45
3.23
3.22
With
outEFs
0.00
0.00
0.00
0.00
0.00
0.00
11.66
24.54
1.10
1.99
2.00
2.38
Unm
etdemands
with
CC
A2with
EFs
2.61
0.31
0.75
0.56
1.62
3.27
17.73
32.75
34.95
1.67
4.20
2.24
A2with
outEFs
0.05
0.00
0.00
0.00
0.00
0.00
5.56
17.92
22.17
0.49
3.45
2.85
B2with
EFs
2.90
0.31
0.75
0.49
1.34
3.26
14.26
30.26
40.55
1.65
4.18
2.24
B2with
outEFs
0.05
0.00
0.00
0.00
0.00
0.00
5.15
17.74
24.99
0.48
3.45
2.71
2206 P. SAPKOTA ET AL.
Copyright © 2013 John Wiley & Sons, Ltd.
demands in water scarce months of November, December,January and February because of 10% reduction inwater use.
Scenario 4 Water storage at Tehri dam.
Figure 12 shows the mean monthly unmet demandsbased on the 2007–2008 cropping pattern after Tehri dambecomes operational. With the increase in storagecapacity, the unmet demands reduced significantly. Thefigure further shows that with storage, the unmet demandsduring water scarce months are less than 5MCM. Thesefigures are calculated on the basis of the assumption thatthe Tehri dam is operated with the objective of fulfillingthe downstream demands. As flow releases from Tehri arenot available, it is not possible to tell if this is happening.The study analysis shows, however, that water stored atTehri dam can be used to fulfil downstream unmetdemands (including EFs) in the dry season.
Scenario 5 With and without groundwater
Figure 13 shows the mean monthly changes in unmetdemands based on the 2007–2008 cropping pattern whenthere is no access to groundwater sources and with access toground water. The figure shows that considerable amount ofgroundwater can be withdrawn to fulfil the irrigationalneeds. With additional access to groundwater sources, theaverage decrease in unmet demands in the month of Januaryand February was 92% and the decrease in unmet demandsduring December was 95%. Conjunctive use of surface andgroundwater is already being practised in the basin;therefore, before promoting additional use of groundwater,sustainability issues need to be explored through rechargeassessments. As described in the methodology section, thetotal groundwater availability figures for this study weretaken from district statistics.
CONCLUSIONS
The present study examined the effect of adding EFrequirements on water demands in the UGB under boththe past and future climate conditions. The resultsobtained from this study show that the problem of unmetdemands, i.e. not enough water for planned use, alreadyexists during the winter months of December andJanuary under the past climate and during December,January and February under CC projected data. AddingEF demand will also increase the unmet demands withinthe same winter months. During the other months, i.e.March–November, the unmet demands with and withoutEFs were under 5MCM.The need to incorporate EFs into basin water
management is a much discussed topic. In India,however, the government still generally uses minimumflows, and most often, these minimum flows are notquantified by assessing the river’s EF needs but only byallocating a standard 10% of low flows. Recently, thegovernment has also started considering sustainable flowsfor the rivers while designing water resources develop-
Hydrol. Process. 27, 2197–2208 (2013)

10
30
50
70
90
110
130
150
170
190
Jun Jul Aug Sep Oct Nov Dec Jan Feb Mar Apr May
MC
M
Unmet demands
Crops-2003-2004
Crops-2007-2008
Figure 7. Mean monthly (1991–2005) unmet agricultural water demands based on cropping pattern from June 2003 to May 2004 and from June 2007to May 2008
200300400500600700800900
100011001200
Crops-2003-2004 Crops-2007-2008
MC
M
Unmet demands
Crops
Reduced-area-40%
Figure 8. Change in annual average (1991–2005) unmet demands withreduced cropping area based on cropping pattern from June 2003 to May
2004 and June 2007 to May 2008
0.00
20.00
40.00
60.00
80.00
100.00
120.00
Crops-2003-2004 Crops-2007-2008
MC
M
Unmet demands
Crops
Less-intensive-crops-40%
Figure 10. Change in average (1991–2005) unmet demands with lessintensive crops during the water scarce months of November, December,January and February based on cropping pattern from June 2003 to May
2004 and June 2007 to May 2008
2207BASIN WATER MANAGEMENT – CASE STUDY FROM THE UPPER GANGES BASIN
ment projects, but still, this is at a case by case basis andas of now there are no standard guidelines in this regard.For instance, the state of Himachal Pradesh has mandated15% of the low flows as required flows to be maintainedin all the upcoming hydropower projects within the state,but again, there has been no rationale for using 15%.Similarly, the Ministry of Environment and Forests hascommissioned two studies for understanding EFs for theAlakananda and Bhagirathi basins. Studies on similarlines are commissioned in the North East of India, wheremassive hydropower plans are underway. The findings ofthese mentioned studies are still being debated and havenot yet been used to set guidelines.
0.00
50.00
100.00
150.00
200.00
Crops-2003-2004 Crops-2007-2008
MC
M
Unmet demands
Crops
Less-intensive-crops(40%)
Figure 9. Change in average annual (1991–2005) unmet demands withless intensive crops based on cropping pattern from June 2003–2004
and 2007–2008
Copyright © 2013 John Wiley & Sons, Ltd.
This study is the first to assess the EFs requirementstogether with current water management and allocation inthe Ganges basin. The output from the study, which showsthat EF requirements are only unmet during the wintermonths, are very relevant to water managers. As agricultureis the largest water user, scenarios with changes inagricultural practices were tested. Results showed thatreducing crop type to less water intense crops was moreeffective in reducing unmet demands than decreasing thecropped area. Furthermore, decreasing water use by only10% through better irrigation systems reduced the unmetdemands by 22%during thewater scarcemonths. Therefore,investing into water-saving technologies as well as
0.00
50.00
100.00
150.00
200.00
Crops-2003-2004 Crops-2007-2008
MC
M
Unmet demands
Crops
Reduced-water-use(10%)
Figure 11. Change in annual average (1991–2005) unmet demands withreduced water use based on cropping pattern from June 2003 to May 2004
and June 2007 to May 2008
Hydrol. Process. 27, 2197–2208 (2013)

0
1
2
3
4
5
Jun Jul Aug Sep Oct Nov Dec Jan Feb Mar Apr May
MC
M
Unmet demands
Unmet demands
Figure 12. Change in mean monthly (1991–2005) unmet demands withthe regulation of the Tehri dam to meet downstream water requirements
based on cropping pattern from June 2007 to May 2008
0
100
200
300
400
Jun Jul Aug Sep Oct Nov Dec Jan Feb Mar Apr May
MC
M
Unmet demands
Without ground water
With ground water
Figure 13. Change in mean monthly (1991–2005) unmet demands withand without groundwater use based on cropping pattern from June 2007 to
May 2008
2208 P. SAPKOTA ET AL.
Copyright © 2013 John Wiley & Sons, Ltd.
increasing irrigation efficiency could also be goodstrategies. Increased groundwater use can also be usedsuccessfully to fulfil the dry season unmet demands;however, ground water sustainability issues need to beconsidered. The most effective water managementsolution is from managing upstream storage structuressuch as the Tehri dam for increased dry season flows. Dryseason releases from Tehri dam can be used to reduce thedownstream unmet demand, which includes EFs to lessthan 5MCM/month.Themain constraint in this study (as well as in all research
carried out on water resources in the Ganges Basin) is theunavailability of historical and present discharge data in thepublic domain. This limitation severely effects EF assess-ments as well as hydrological model simulations of futurescenarios. The authorities responsible for observed hydro-logical data management and sharing should seriouslyconsider opening their archives for water research needs.The uncertainty in climate projections is another major issueassociated with studies like this one. Improvement in CCprojections as well as access to more climate data wouldcertainly enhance the accuracy of the simulations, and in theend, planning for a more sustainable future.The main focus of this study was to explore strategies
to increase flows in the river to fulfil EF requirements,and various options have been provided. Before suchrecommendations can go into actual policy, there is aneed to also assess agronomic and/or economic conse-quences of the various water-saving scenarios (reducingcultivated area, switching crops, reducing water allocationto agriculture, increasing storage and additional use of
ground water) in terms of, e.g. overall output or net farmrevenue and the marginal costs.
REFERENCES
Amarasinghe UA, Shah T, Turral H, Anand B. 2007. India’s water futuresto 2025-2050: business as usual scenario and deviations. IWMI ResearchReport 123. InternationalWaterManagement Institute: Colombo, Sri Lanka.
Bharati L, Smakhtin V, Jayakody P, Kaushal N, Gurung P. 2011a. Use ofa Distributed Catchment Model to Assess Hydrologic Modifications in theUpperGanges Basin.WITPress: In River BasinManagementVI; 177–186.
Bharati L, LacombeG, GurungP, Jayakody P,HoanhCT, SmakhtinV. 2011.The Impacts ofWater Infrastructure andClimateChange on theHydrologyof the Upper Ganges River Basin. International Water ManagementInstitute: Colombo, Sri Lanka; 36. (IWMI Research Report 142).
DACNET. 2012. Directorate of Economics and Statistics. Available at:http://eands.dacnet.nic.in. Accessed: 20 March 2012.
Food and Agriculture Organization (FAO). 1998. Crop evapotranspira-tion: guidelines for computing crop requirements. http://www.fao.org/docrep/X0490E/X0490E00.htm, accessed November 10, 2004.
Grieser J, Gommes R, Bernardi M. 2006. New LocClim – the localclimate estimator of FAO. Geophys Res Abstr 8:SRef-ID:1607–7962/gra/EGU06-A-08305
GWD. 2012. Uttar Pradesh Ground Water Department. Available at:http://gwd.up.nic.in/status3.htm. Accessed: December 18, 2011.
Jain SK, Agarwal PK, Singh VP. 2007. “Ganga Basin.” Hydrology andWater Resources of India, Water Science and Technology Library,Springer: Heidelberg, Germany; 333–418.
Jones RG, Noguer M, Hassell D, Hudson C, Wilson D, Jenkins SS, MitchellGJJFB. 2004. Generating High Resolution Climate Change Scenarios usingPRECIS.MetOfficeHadleyCentre: Exeter,UK;40.Available at: http://precis.metoffice.com/docs/PRECIS_Handbook.pdf (accessed onOctober 4, 2011)
Kaushal N, Kansal ML. 2011. Overview of water allocation practices inUttar Pradesh and Uttarakhand with a specific reference to futuredemands. SAWAS 2(2): 27–43.
Moriasi DN, Arnold JG, Van Liew MW, Bingner RL, Harmel RD,Veith TL. 2007. Model evaluation guidelines for systematic quantifi-cation of accuracy in watershed simulations. American Society ofAgricultural and Biological Engineers ISSN 0001-2351.
O’Keeffe J, Kaushal N, Bharati L, Smakhtin V. 2012. Assessment ofenvironmental flows for the Upper Ganga Basin. [Project report of theenvironmental flows assessment done under the Living Ganga Program]Fund for Nature – India (WWF-India). 161p.
O’Keffe J,KaushalN, SmakthinV,Bharati L. 2012. Summary report assessmentof environmental flows for the Upper Ganga Basin, WWF Report 2012.
Santhi C, Arnold JG, Williams JR, Dugas WA, Srinivasan R, Hauck LM.2001. Validation of the SWATmodel on a large river basin with point andnonpoint sources. Journal of theAmericanWaterResources Association37(5): 1169–1188.
SEI-Stockholm Environment Institute. 2001. WEAP: Water Evaluationand Planning System – User Guide. Stockholm Environment Institute:Boston, USA.
Sevat E, Dezetter A. 1991. Selection of calibration objective functions inthe context of rainfall-runoff modeling in a Sudanese savannah area.Hydrological Science Journal 36(4): 307–330.
Smakhtin VU, Anputhas M. 2006. An assessment of environmentalflow requirements of Indian river basins. IWMI Report no. 106,International Water Management Institute Research: Colombo, Sri Lanka.
Smakhtin V, Eriyagama N. 2008. Developing a software package forglobal desktop assessment of environmental flows. EnvironmentalModelling and Software 23(2008): 1396–1406.
Smith M. 1992. Expert Consultation on Revision of FAO Methodologiesfor Crop Water Requirements. FAO: Rome, Italy; 28–31, May 1990.
Smith M, Allen RG, Pereira LS. 1996. Revised FAO methodology forcrop water requirements. Proc Int Conf on Evapotranspiration andIrrigation Scheduling, San Antonio, Tex, USA; 133–140.
Tharme RE. 2003. A global perspective on environmental flow assessment:emerging trends in the development and application of environmental flowmethodologies for rivers. River Research and Applications 19: 397–441.
Yates D, Sieber J, Purkey D, Huber-Lee A. 2005. WEAP21 – A demandpriority and preference driven water planning model: part 1, modelcharacteristics. Water International 30: 487–500.
Yates D, Purkey D, Sieber J, Huber-Lee A, Galbraith H, West J,Herrod-Julius S. 2007. A physically based, water resource planningmodel of the Sacramento Basin, California USA. ASCE Journal ofWater-Resources Planning and Management.
Hydrol. Process. 27, 2197–2208 (2013)


