Embed Size (px)
Citation preview

ENZYMES

DEFINITION OF TERMS
Enzymes – special proteins that catalyze biochemical reactions
Apoenzyme – protein part of an enzyme; catalytically inactive
Cofactors – small, non-protein components
Coenzymes – small organic molecules, often vitamin-derived
Prosthetic group
Metal ions – K+, Mg+2, Zn+2, Mn+2 , Cu+2, Na+, Fe+2
Holoenzyme = Apoenzyme + Cofactors; catalytically
active
Substrate – the molecule acted upon y the enzyme to form a product
Active site of the enzyme – part of the enzyme consisting of a chain
of amino acids involved in catalyzing the reactions; generally
located in clefts or crevices
Allosteric site – additional site where allosteric molecules
(stimulators or inhibitors) bind and affect the activity of the active
site.
Regulatory enzyme – the enzyme that catalyzes the regulatory or
committed step of a metabolic pathway


DEFINITION OF TERMS
APOENZYME
HOLOENZYME
+
Cofactor
•Coenzyme
•Prosthetic group
•Metal ion
Protein
part
Nonprotein
part

ENZYME COFACTORS
A. Coenzyme
Enzyme
Chemical Groups
Transferred
Vitamin
Precursor
Thiamine
Pyrophosphate
(TPP)
Pyruvate dehydrogenase,
Isocitrate dehydrogenase, α-
ketoglutarate dehydrogenase,
Transketolase, α-ketoacid
dehydrogenase
Aldehydes
Thiamine
(Vit B1)
Flavin Adenine
Dinucleotide
(FAD)
Succinate dehydrogenase, α-
ketoglutarate dehydrogenase,
Pyruvate dehydrogenase, Nitric
oxide synthase
Electrons
Riboflavin
(Vit B2)
Nicotinamide
Adenine
Dinucleotide (NAD)
Lactate dehydrogenase;
Other dehydrogenases
Hydride ion
(:H-)
Nicotinic acid
(Niacin; B3)
Pyridoxal
Phosphate (PLP)
Glycogen phosphorylase,
γ-ALA synthase, Histidine
decardoxylase, Alanine
aminotransferase
Amino groups
Pyridoxine
(Vit B6)
Lipoate Pyruvate dehydrogenase
α-Ketoglutarate dehydroge-
nase
Electrons and
acyl groups
Not required in
diet
ENZYME COFACTORS
A. Coenzyme
Enzyme
Chemical Groups
Transferred
Vitamin Precursor
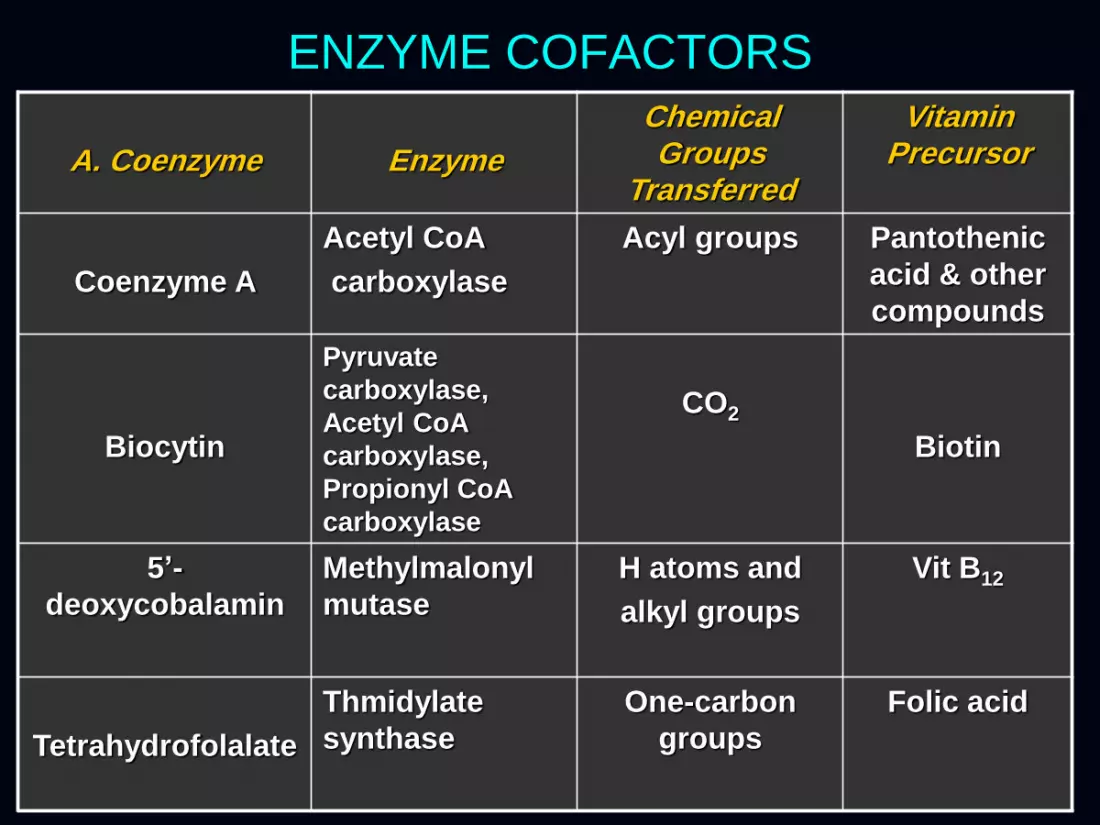
Coenzyme A
Acetyl CoA
carboxylase
Acyl groups Pantothenic
acid & other
compounds
Biocytin
Pyruvate
carboxylase,
Acetyl CoA
carboxylase,
Propionyl CoA
carboxylase
CO2
Biotin
5’-
deoxycobalamin
Methylmalonyl
mutase
H atoms and
alkyl groups
Vit B12
Tetrahydrofolalate
Thmidylate
synthase
One-carbon
groups
Folic acid

Cofactor Enzyme B. Inorganic (Metal ions
or iron- sulfur clusters)
Zn+2 Carbonic anhydrase,
Carboxypeptidase A & B
Cu+2 Cytochrome oxidase
Mn+2 Arginase, ribonucleotide reductase
Mg+2 Hexokinase, pyruvate kinase,
glucose 6-phosphatase
Ni+2 Urease
Mo Nitrate reductase
Se Glutathione peroxidase
Mn+2 Superoxide dismutase
K+ Propionyl CoA carboxylase
ENZYME COFACTORS
ENZYME COFACTORS: COENZYMES
Succinate dehydrogenase
FAD
Succinate Pyruvate
COO
|
C=O
|
CH3
S~CoA
|
C=O
|
CH3
Pyruvate dehydrogenase
CoA NAD+
NADH+
+ H Acetyl CoA
TPP
COOH
|
CH2
|
CH2
|
COOH
H -COOH
|
H – C
||
C – H
|
H -COOH FADH2
Fumarate
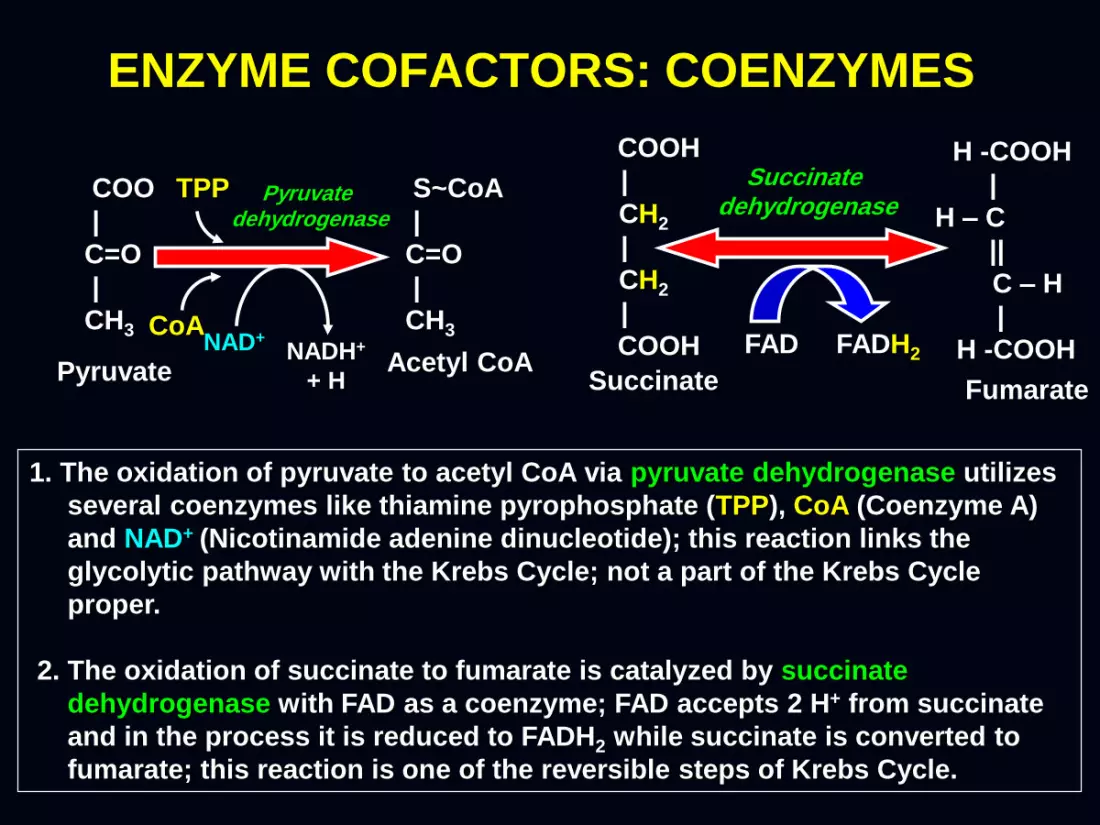
1. The oxidation of pyruvate to acetyl CoA via pyruvate dehydrogenase utilizes
several coenzymes like thiamine pyrophosphate (TPP), CoA (Coenzyme A)
and NAD+ (Nicotinamide adenine dinucleotide); this reaction links the
glycolytic pathway with the Krebs Cycle; not a part of the Krebs Cycle
proper.
2. The oxidation of succinate to fumarate is catalyzed by succinate
dehydrogenase with FAD as a coenzyme; FAD accepts 2 H+ from succinate
and in the process it is reduced to FADH2 while succinate is converted to
fumarate; this reaction is one of the reversible steps of Krebs Cycle.

ENZYME COFACTORS:COENZYMES
Glycine δ-Aminolevulenate
synthase PLP
Succinyl CoA
δ-aminolevulenic acid
Heme
(Fe protoporphyrin IX)
several reactions
Pyruvate
Histidine decarboxylase
Histamine
PLP
CO2
Histidine
Biotin-
CO2
Oxaloacetate
Pyruvate carboxylase ATP
ADP +
Pi
1. In the synthesis of heme, succinyl CoA condenses with glycine catalyzed by γ-amino-
levulinate synthase with pyridoxal phosphate (PLP) as a coenzyme; this is followed
by several enzyme-catalyzed reactions until heme is formed.
2. Histidine is decarboxylated into histamine via histidine decarboxylase, with PLP as a
coenzyme.
3. The carboxylation of pyruvate into oxaloacetate is catalyzed by pyruvate carboxylase,
with biotin as a coenzyme; biotin here is a carrier of CO2.
Other enzymes that use biotin as a coenzyme include acetyl CoA carboxylase and
propionyl CoA carboxylase, hence biotin is a carrier of activated CO2 (as HCO3-) in
carboxylation reactions.

ENZYME COFACTORS: METAL IONS
Glucose 6-phosphate
ADP
+ Pi
Carbonic anhydrase
Glucose Phosphoenolpyruvate (PEP)
ATP
Hexokinase/ Glucokinase
Mg+2
Pyruvate
Pyruvate kinase
ADP
ATP
Mg+2 K+
H2CO3
CO2
Zn+2
1. The phosphorylation of glucose into glucose 6-phosphate is catalyzed by
hexokinase or glucokinase, in the presence of ATP, and Mg+2 as a metal
cofactor; this is the 1st step of glycolysis.
2. The conversion of phosphoenolpyruvate (PEP) into pyruvate is catalyzed
by pyruvate kinase, with K+ as a cofactor metal, aside from Mg+2; this is the
last irreversible step of glycolysis.
3. The hydrolysis of CO2 into carbonic acid (H2CO3) is catalyzed by carbonic
anhydrase, with Zn+2 as a cofactor metal.
H2O

SIX MAJOR CLASSES OF ENZYMES (IUBMB*, 1964)
CLASS EXAMPLE
Oxidoreductases Dehydrogenases, Oxidases, Reductases,
Peroxidases, Catalases, Oxygenases,
Hydroxylases
Transferases Transaldolase and Transketolase; acyl, methyl
and glucosyl phosphotransferases,
Kinases, Phosphomutases, Transaminases
Hydrolases Esterases, Glycosidases, Peptidases,
Phosphatases, Thiolases, Phospholipases,
Amidases, Deaminases, Ribonucleases
Lyases Decarboxylases, Aldolases, Hydratases,
Dehydratases, Synthases, Lyases
Isomerases Epimerases, Isomerases, Mutases, Racemases
Ligases Synthetases, Carboxylases
*International Union of Biochemistry and Molecular Biology; classification is based by the reactions enzymes catalyze; each class is divided into subclasses.

SIX MAJOR CLASSES OF ENZYMES (IUBMB*, 1964)
CLASS TYPE OF REACTION CATALYZED
Oxidoreductases
Transfer of electrons (Hydride ions or H atoms)
Transferases
Group transfer reactions
Hydrolases Hydrolysis reactions (transfer of functional
groups to H2O)
Lyases Addition of groups to double bonds, or
formation of double bonds by removal of
groups
Isomerases Transfer of groups within molecules to yield
isomeric forms
Ligases Formation of C-C, C-S, C-O, and C-N bonds by
condensation reactions coupled to cleavage of
ATP or similar cofactor

OXIDOREDUCTASES: DEHYDROGENASES
Transfer of electrons and hydrogen atoms from donors
(or reductants, hence oxidized) to acceptors
(or oxidants, hence reduced).
COO-
|
HO – C – H
|
CH3
L-Lactate
COO-
|
C = O
|
CH3
Pyruvate
Lactate dehydrogenase
NAD+ NADH
+ H+
1. Lactate Dehydrogenase – catalyzes the transfer of 2 H from donor
lactate (or reductant, hence oxidized) to acceptor NAD+ (or
oxidant, hence reduced); NAD+ is reduced to NADH + H+ (NADH2).
2. Oxidation – loss of electrons
Reduction – addition of electrons
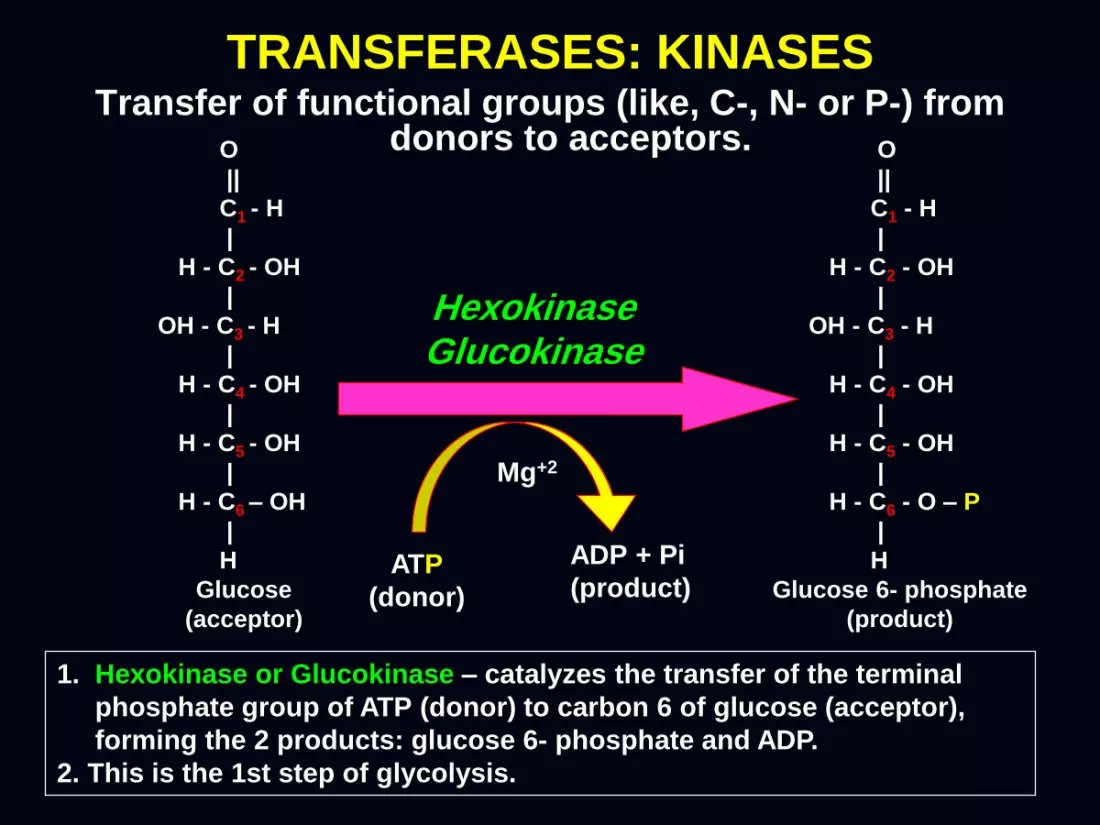
Transfer of functional groups (like, C-, N- or P-) from donors to acceptors.
ATP
(donor)
ADP + Pi
(product)
Mg+2
O
||
C1 - H
|
H - C2 - OH
|
OH - C3 - H
|
H - C4 - OH
|
H - C5 - OH
|
H - C6 – OH
|
H
Glucose
(acceptor)
O
||
C1 - H
|
H - C2 - OH
|
OH - C3 - H
|
H - C4 - OH
|
H - C5 - OH
|
H - C6 - O – P
|
H
Glucose 6- phosphate
(product)
TRANSFERASES: KINASES
Hexokinase Glucokinase
1. Hexokinase or Glucokinase – catalyzes the transfer of the terminal
phosphate group of ATP (donor) to carbon 6 of glucose (acceptor),
forming the 2 products: glucose 6- phosphate and ADP.
2. This is the 1st step of glycolysis.

TRANSFERASES: TRANSAMINASES
Transfer functional groups (like C-, N-, or P-) from donors
to acceptors; utilize 2 substrates to produce 2 products.
COO-
|
H3N – C – H
|
CH3
L-Alanine
COO- COO-
| |
C = O + H3N – C – O
| |
CH3 (CH2)2
Pyruvate |
COO-
L-Glutamate
(amino acid)
Alanine transaminase
PLP (amino acid) (keto acid)
C = O
I
(CH2)2
I
COO-
α-ketoglutarate
(keto acid)
1. Alanine transaminase (an aminotransferase) - catalyzes the transfer of an
amino group (NH3) from alanine (an amino acid donor) to α-ketoglutarate
(a keto acid acceptor) to form pyruvate (a keto acid) and glutamate (an
amino acid) respectively.
2. Here, α-ketoglutarate (a keto acid) is converted to glutamate (an amino
acid) while alanine (an amino acid) is converted to pyruvate (a keto acid).
+
substrate
substrate substrate
product
product

HYDROLASES: PHOSPHATASES Catalyze cleavage of chemical bonds by addition of
H2O, producing 2 products
Phosphate bond
O O
|| || -O – P ~ O – P ~ O- + HOH
| |
-O O-
Pyrophosphate (PPi)
O
||
2 HO – P – O-
|
-O
Phosphate 2 (Pi)
Pyrophosphatase
1. Pyrophosphatase - catalyzes the cleavage of a high-energy
phosphate bond of pyrophosphate (PPi) in the presence of
H2O, forming 2 inorganic phosphates (2 Pi).
2. The process is essentially irreversible, with the transfer of –OH
from HOH (H2O) to inorganic phosphate (Pi).
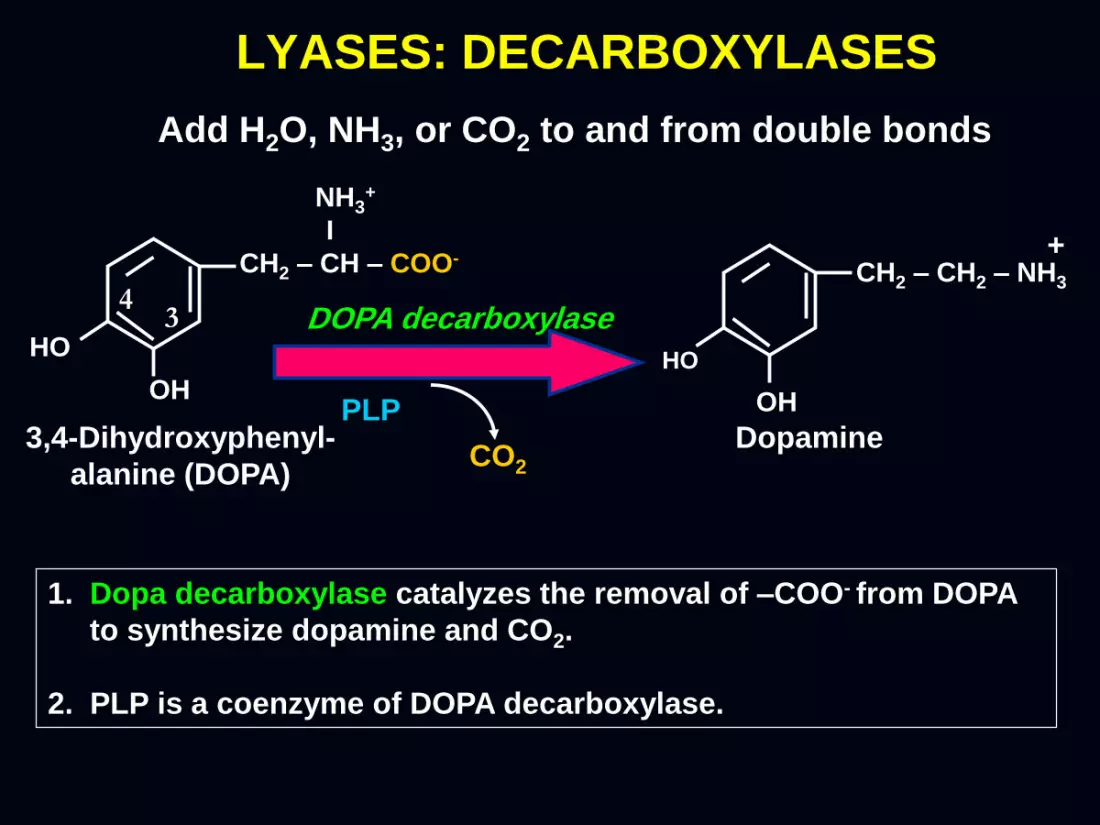
LYASES: DECARBOXYLASES
Dopamine 3,4-Dihydroxyphenyl-
alanine (DOPA)
CH2 – CH2 – NH3
OH
HO
+
DOPA decarboxylase
CO2
OH
NH3+
I
CH2 – CH – COO-
HO
4 3
PLP
Add H2O, NH3, or CO2 to and from double bonds
1. Dopa decarboxylase catalyzes the removal of –COO- from DOPA
to synthesize dopamine and CO2.
2. PLP is a coenzyme of DOPA decarboxylase.
(Aldose) (Ketose)
O
||
C1 - H
|
H - C2 - OH
|
OH - C3 - H
|
H - C4 - OH
|
H - C5 - OH
|
H - C6 - O – P
|
H
H
|
H – C1 - OH
|
C2 = O
|
OH - C3 - H
|
H - C4 - OH
|
H - C5 - OH
|
H - C6 - O – P
|
H
Phosphohexo- isomerase
Aldehyde
group
Keto
group
Glucose 6-Phosphate Fructose 6-Phosphate
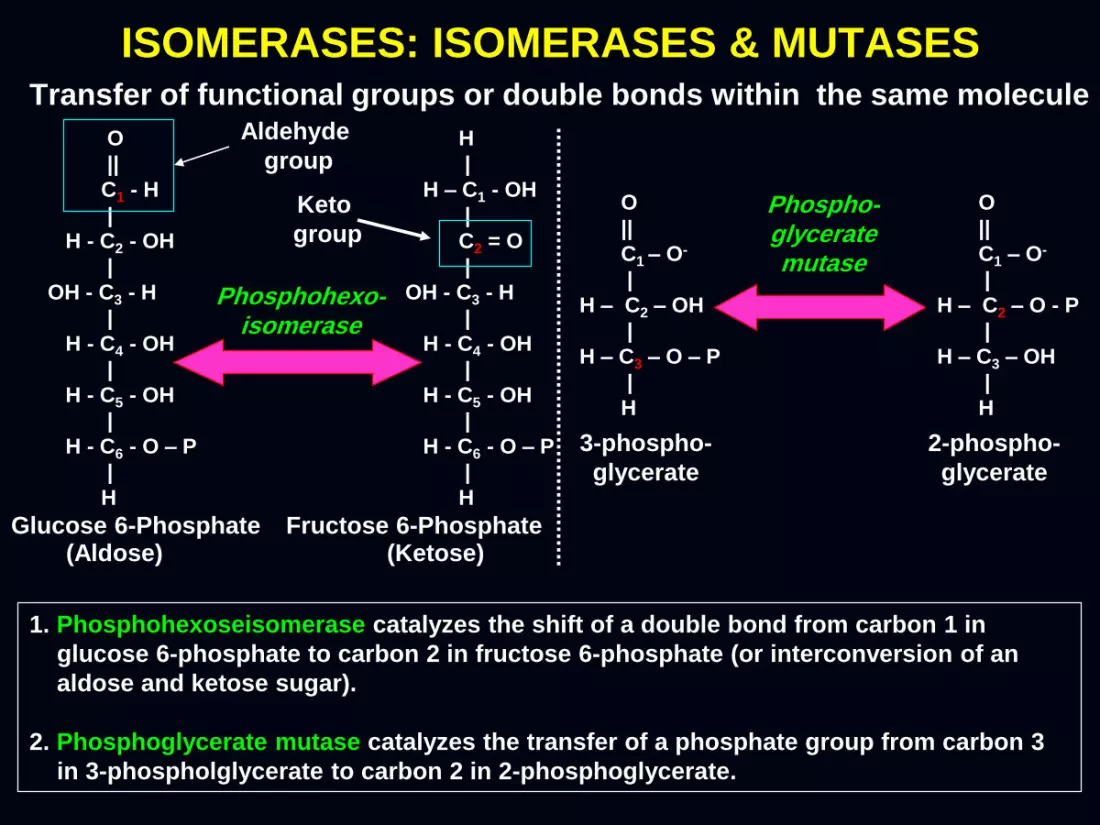
ISOMERASES: ISOMERASES & MUTASES Transfer of functional groups or double bonds within the same molecule
O
||
C1 – O-
|
H – C2 – OH
|
H – C3 – O – P
|
H
O
||
C1 – O-
|
H – C2 – O - P
|
H – C3 – OH
|
H
Phospho- glycerate mutase
3-phospho-
glycerate
2-phospho-
glycerate
1. Phosphohexoseisomerase catalyzes the shift of a double bond from carbon 1 in
glucose 6-phosphate to carbon 2 in fructose 6-phosphate (or interconversion of an
aldose and ketose sugar).
2. Phosphoglycerate mutase catalyzes the transfer of a phosphate group from carbon 3
in 3-phospholglycerate to carbon 2 in 2-phosphoglycerate.

LIGASES: SYNTHETASES & CARBOXYLASES Catalyze the ligation or joining of 2 substrates in the presence of ATP
COO-
|
H3N – C – H
| + NH4+
(CH2)2
|
C
// \
O O-
L-Glutamate
COO-
|
H3N – C – H
|
(CH2)2
|
C
// \
O NH2
L-Glutamine
Glutamine synthetase
ATP ADP
+ Pi
CH3
|
C = O
|
COO-
COO-
|
CH2
|
C = O
|
COO-
Pyruvate Oxaloacetate
Pyruvate carboxylase
ATP ADP
+ Pi
1. Glutamine synthetase - catalyzes the condensation of glutamate and NH4+
in the presence of ATP to form glutamine, ADP and Pi.
2. Pyruvate carboxylase – catalyzes the condensation of pyruvate and CO2
(from biotin) to form oxaloacetate in the presence of ATP; this is the first
step in gluconeogenesis – the synthesis of glucose form noncarbohydrate
substrates.
Biotin-CO2

CHARACTERISTICS OF ENZYMES
They are not changed by the reaction they catalyze – although they may be temporarily changed during the reaction; they are neither used up in the reaction nor do they appear as reaction products but are regenerated or recycled
They do not change or alter the equilibrium position of the reaction, so they cannot force a reaction that is not energetically favorable (non-spontaneous); equilibrium would be attained rapidly in the presence of an enzyme.
They increase reaction rates by decreasing the activation energy- or lowering the energy needed to form a complex of reactants that is competent to produce reaction products; the velocity of the reaction they catalyze is measured by the amount of product formed per unit time.
They are highly specific for the reactants or substrates they act on.
They are mostly proteins in nature although a small number of RNA-
based biological catalysts called ribozymes have been identified.

ENZYMES DECREASE THE ACTIVATION ENERGY
Reaction progress
ΔG
for the
reaction
ΔG
+
+ + (catalyzed)
ΔG
+ + (uncatalyzed)
Transition state, S
+ +
Substrates
or
Reactants
(e.g. CO2 + H2O)
En
erg
y l
eve
l
Products
(H2CO3)
1. In a chemical reaction, a substrate (or a reactant) is converted to a product via the formation of an
activated or transition state (S≠) which has a higher free energy than does either the substrate or
the product. In other words, substrates need a lot of energy to reach a transition state.
2. ΔG≠ is the activation energy or Gibbs free energy of activation which represents the difference in
free energy between the transition state and substrate.
3. In enzyme-catalyzed reactions, the ΔG≠ (or activation energy) is lowered, hence enzymes facilitate
the formation of the transition state and consequently reducing the energy needed to form the
products→ favorable formation of the products → ↑ reaction rate.

MODELS OF ENZYME-SUBSTRATE COMPLEX
Lock and Key Model Induced Fit Model
1. Lock and Key Model (Emil Fischer, 1894) - the substrate binds to a site whose shape
complements its own, like a key in a lock (or the correct piece in a 3-dimensional
jigsaw puzzle); this model is now largely historical because it does not take into
account the 3-dimensional flexibility of proteins.
2. Induced Fit Model ( Daniel E. Koshland, Jr., 1958) - the enzyme undergoes a slight
conformational change on binding to the substrate, hence enzyme forms a
complementary shape or fit after the substrate is bound; more attractive model
and replaced the earlier rigid lock and key model.

KINETICS OF ENZYME-CATALYZED
REACTIONS
E + S ES E + P k1
k-1
k2
k-2
Substrate binding Catalytic step
1. In typical enzyme-catalyzed reactions, reactant and product concentrations
are usually hundreds or thousands of times greater than the enzyme
concentration; hence, each enzyme molecule catalyzes the conversion to
product of many reactant molecules.
2. Enzyme E binds to the substrate S (substrate binding) to form an enzyme
substrate complex ES (sometimes called Michaelis complex), with rate
constant K1 (K1= the rate constant for the formation of ES).
3. The ES complex has 2 possible fates:
a. It can dissociate to E and S, with a rate constant of K-1
b. It can proceed to form product P (catalytic step), with a rate constant
of K2 (K2 = the rate constant for the conversion of P from the enzyme
E); K-2 represents the regeneration of ES from E and P.

MICHAELIS-MENTEN EQUATION
Vo = Vmax [S]
{Km + [S]}
Vo = Velocity at any time (moles/time)
Vmax = Maximal velocity (or reaction rate)
Km = Michaelis constant for the particular
enzyme under investigation
= (K-1 + K2)/K1
[S] = Substrate concentration (molar) 1. A quantitative description of kinetics of enzyme-catalyzed reactions.
2. Describes how reaction velocity varies with substrate concentration.
3. Vo (velocity at any time is = to …etc….
4. Vmax = …..
5. Km = ….
6. [S] = ….
7. Velocity of an enzyme-catalyzed reaction is too difficult to measure, hence velocity can be determined by measuring the products formed per unit time.

MICHAELIS-MENTEN SATURATION CURVE
Substrate concentration [S]
Km
Vmax
2
Vmax
Re
ac
tio
n v
elo
cit
y (
VO)
Zero order B
A
C
First order
│
│ │ │ │ │ │ │ │ │
│
│
│
│
│
1. A graphical representation of Michaelis-Menten Equation, it is a basic model for non-allosteric
enzymes, describing how reaction velocity varies with substrate conc.
2. Reaction velocity (Vo; no. of moles of product formed/ unit time) varies with substrate
concentration, hence Vo linearly increases as substrate conc. increases and begins to level off and
approaches a maximum velocity (Vmax) at higher substrate concentrations.
3. A hyperbolic curve (rectangular hyperbola) is formed since maximum is reached asymptotically.
4. At Point A where substrate conc. is less than km or {[S] < Km}, reaction velocity appears to be
proportional to the substrate concentration→ only a portion of the enzyme molecules are bound to
the substrate and the reaction is said to be first order.

MICHAELIS-MENTEN SATURATION CURVE
Substrate concentration [S]
Km
Vmax
2
Vmax
Re
ac
tio
n v
elo
cit
y (
VO)
Zero order B
A
C
First order
│
│ │ │ │ │ │ │ │ │
│
│
│
│
│
5. At Point B, exactly half of the enzyme molecules are in an ES (enzyme-substrate)
complex at any instant and the reaction velocity rate is exactly 1/2 of Vmax
{[S]=Vmax/2}; thus the Michaelis-Menten constant (Km) is substrate concentration [S]
yielding a velocity of Vmax/2 (or substrate concentration at half-maximal velocity).
6. At high substrate concentration (near Point C) when the [S] is > Km, Vo = Vmax, i.e.,
reaction velocity rate is maximal; reaction is said to be in zero order because further
increases in substrate concentration will not result to an increase in velocity since
almost all of the enzymes are bound and saturated with substrates.

1. It is the substrate concentration at which half of the active sites of
the enzyme are filled up.
2. It is an inverse measure of the affinity of the substrate for the
enzyme:
a. The lower the km, the higher is the affinity →
enzyme requires only a small amount of substrates
to become saturated, hence the lower is the substrate
concentration needed to achieve a given rate → Vmax is
reached at relatively low substrate concentration..
b. The higher the km, the lower is the affinity → enzyme requires
an increased amount of substrate to become saturated, hence
the higher is the substrate concentration needed to achieve a
given rate → Vmax can be reached only at high substrate
concentration.
SIGNIFICANCE OF KM
LINEWEAVER-BURKE DOUBLE RECIPROCAL PLOT
1
V
Intercept on Y-axis =
1
Intercept
on X-axis =
Slope = Km
Vmax
1
Vmax
-1
Km
1/S
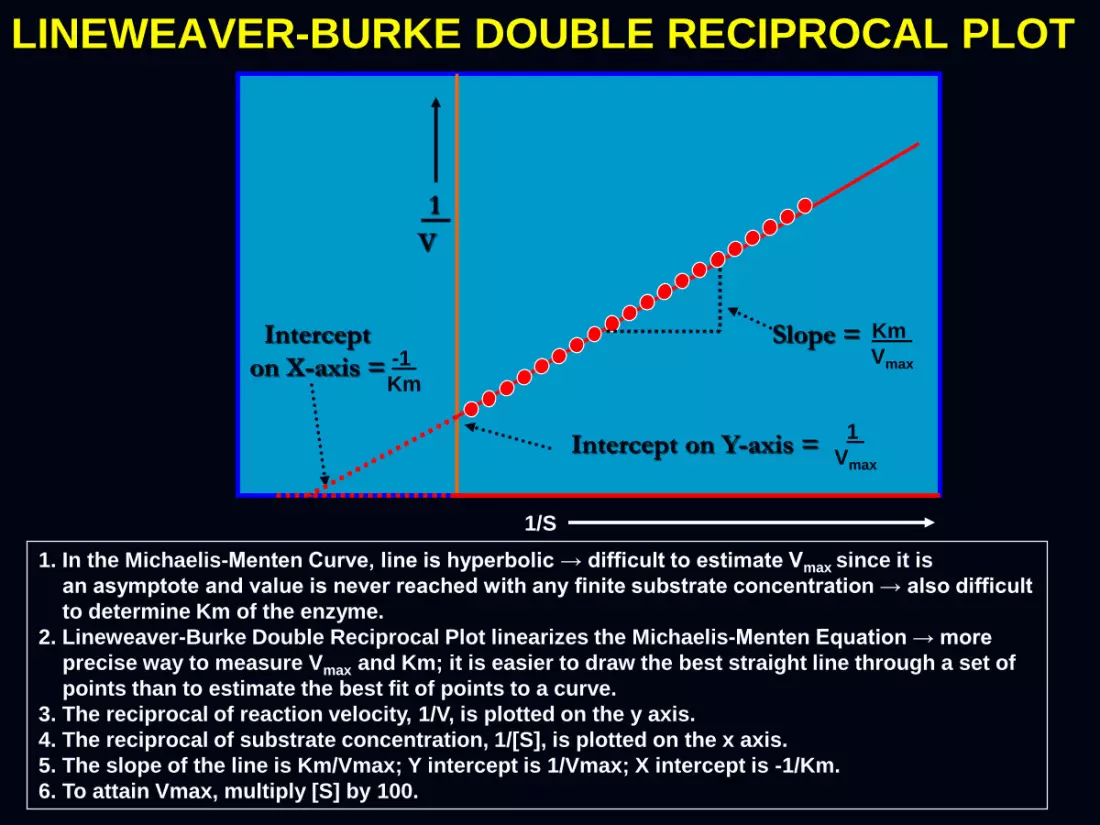
1. In the Michaelis-Menten Curve, line is hyperbolic → difficult to estimate Vmax since it is
an asymptote and value is never reached with any finite substrate concentration → also difficult
to determine Km of the enzyme.
2. Lineweaver-Burke Double Reciprocal Plot linearizes the Michaelis-Menten Equation → more
precise way to measure Vmax and Km; it is easier to draw the best straight line through a set of
points than to estimate the best fit of points to a curve.
3. The reciprocal of reaction velocity, 1/V, is plotted on the y axis.
4. The reciprocal of substrate concentration, 1/[S], is plotted on the x axis.
5. The slope of the line is Km/Vmax; Y intercept is 1/Vmax; X intercept is -1/Km.
6. To attain Vmax, multiply [S] by 100.

INHIBITION OF ENZYMATIC
REACTIONS
Reversible
a. Competitive
b. Non-competitive
c. Uncompetitive
Irreversible

REVERSIBLE INHIBITION
1. Competitive Inhibition
a. Inhibitor strongly resembles the substrate → binds to the enzyme’s
active site →substrate is prevented from binding with the enzyme.
b. Relieved by increasing the substrate concentration.
2. Noncompetitive Inhibition
a. Inhibitor binds to enzyme other than at the active site →structural
change in the enzyme’s active site → substrate cannot bind to the
enzyme no products formed.
b. Inhibition cannot be reversed by increasing substrate concentration
since inhibitor cannot be driven from the enzyme.
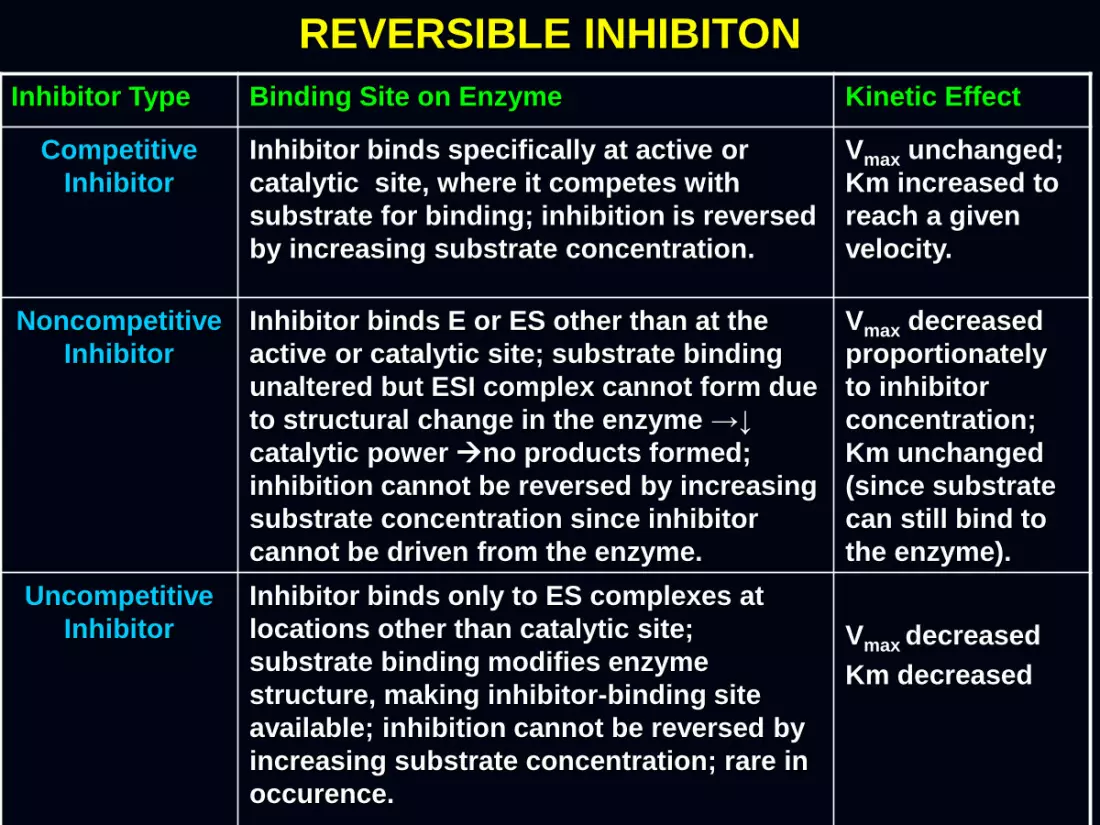
Inhibitor Type Binding Site on Enzyme Kinetic Effect
Competitive
Inhibitor
Inhibitor binds specifically at active or
catalytic site, where it competes with
substrate for binding; inhibition is reversed
by increasing substrate concentration.
Vmax unchanged;
Km increased to
reach a given
velocity.
Noncompetitive
Inhibitor
Inhibitor binds E or ES other than at the
active or catalytic site; substrate binding
unaltered but ESI complex cannot form due
to structural change in the enzyme →↓
catalytic power no products formed;
inhibition cannot be reversed by increasing
substrate concentration since inhibitor
cannot be driven from the enzyme.
Vmax decreased
proportionately
to inhibitor
concentration;
Km unchanged
(since substrate
can still bind to
the enzyme).
Uncompetitive
Inhibitor
Inhibitor binds only to ES complexes at
locations other than catalytic site;
substrate binding modifies enzyme
structure, making inhibitor-binding site
available; inhibition cannot be reversed by
increasing substrate concentration; rare in
occurence.
Vmax decreased
Km decreased
REVERSIBLE INHIBITON

LINEWEAVER-BURKE DOUBLE RECIROCAL
PLOT IN THE PRESENCE OF AN INHIBITOR
Type of
Inhibition
Vmax Km
Competitive Same ↑
Noncompetitive ↓ Same
Uncompetitive ↓ ↓
1
[S]
1
[ V ]
1
Vmax
Noncompetitive
inhibitor
Competitive
inhibitor
Uninhibited
enzyme
Uncompetitive
inhibitor
-1
Km

KINETICS FOR AN ALLOSTERIC ENZYME
1. Allosteric enzymes – consist of multiple
subunits and multiple active sites that
bind small regulatory molecules (either
positive or negative effectors) at
allosteric sites different from the
catalytic active site conformational
change to the active site.
2. Do not obey Michaelis-Menten kinetics
sigmoid curve (instead of hyperboilc
curve).
3. This curve indicates that the binding of
a substrate to one active site can affect
the properties of the other sites in the
same enzyme molecule.
4. Binding then becomes cooperative, i..,
the binding of a substrate to the active
site of the enzyme facilitates substrate
binding to the other sites, hence a
sigmoidal plot of the Vo vs. [S].

REGULATION OF ENZYME
ACTIVITY
Feedback Inhibition
Allosteric (Non-covalent)
Modification
Covalent Modification
Zymogen Activation
Induction or Repression
of Enzyme Synthesis

FEEDBACK INHIBITION Original Precursor(s)
Final Products
Enzyme 1
Enzyme 2
Enzyme 3
Enzyme 4
Enzyme 5
1
2
3
1. Substrates or precursors
are converted to final
products via a series of
enzyme-catalyzed
reactions.
2. These products then
inhibit an earlier enzyme
and thus shuts down the
whole series, preventing
the accumulation of
intermediates in the
pathway.
3. Hence, products inhibit
their own synthesis.

ALLOSTERIC MODIFICATION
Allosteric modulator (activator or inhibitor)
Binds to regulatory or allosteric site
Conformational change in the
regulatory enzyme
Effect is transmitted to the active site
Change in shape of the active site
Altered enzyme activity (↑or↓)

COVALENT MODIFICATION
Enzyme
I
OH
ATP ADP
Enzyme
I
OPO3-
H2O HPO4=
Protein kinase
Phosphoprotein phosphatase
Pyruvate dehdrogenase
kinase ATP ADP
Pyruvate
dehydrogenase
Pyruvate
dehydrogenase P
Pi H2O
Pyruvate dehdrogenase
phophatase
1. Involves either addition or removal of phosphate groups from the enzyme via protein kinases or
phosphoprotein phosphatase, with ATP as phosphate donor; some enzymes are activated via
phosphorylation; others are inactivated by dephosphorylation.
2. Pyruvate dehydrogenase catalyzes the conversion of pyruvate to acetyl CoA; a kinase catalyzes the
phosphorylation of the enzyme, making it phosphorylated and inactive.
3. On the other hand, pyruvate dehydrogenase phosphatase catalyzes the dephosphorylation of the
enzyme, making it more active; hence this enzyme is inactivated by dephosphorylation and
activated by phosphorylation.
4. In general, enzymes that catalyze biosynthetic reactions are active when dephosphorylated and
inactive when phosphorylated (ex. Glycogen synthase is active when dephosphorylated; inactive
when phosphorylated); those that catalyze degradative reactions are active when phosphorylated
and inactive when dephosphorylated.
(active) (inactive)

ZYMOGEN ACTIVATION:BLOOD COAGULATION
XIII
XIIIa
Thrombin
(IIa)
Fibrinogen (I) Soluble
Fibrin
Insoluble
Fibrin
XII XIIa
V
XI XIa
X
IX IXa
Xa X
Va
VIIa VII
Tissue
Factor (III)
Prothrombin (II)
Intrinsic Pathway Extrinsic Pathway
1. Blood coagulation represents a series of
sequential interactive events that lead to the
repair of the vascular system following
injury via the formation of a fibrin clot.
2. Upon activation, the individual clotting
factor serves as an enzyme to convert the
inactive zymogen to the succeeding
active form “a”.
3. For example: FXa converts the zymogen
Prothrombin to its active form Thrombin,
which in turn converts the inactive zymogen
Fibrinogen to its active form Fibrin (hence a
cascade).

INDUCTION OR REPRESSION
OF ENZYME SYNTHESIS
↑ Blood glucose
levels
(Well-fed state)
↑ Insulin
↑ Synthesis of
key enzymes involved
in glucose degradation
↓ Blood glucose levels
(Starvation)
↑ Glucagon
↑ Synthesis of
key enzymes involved
in glucose synthesis

FACTORS AFFECTING
ENZYME ACTIVITY
Temperature
pH
Substrate
concentration
Co-factors

EFFECT OF TEMPERATURE
Heat
inactivation
of the
enzyme
Reacti
on
velo
cit
y (
Vo)
Temperature (oC)
│ │ │ │ │ │ │ │ │ │ │ │ │ │ │ │
│
│
│
│
│
│
│
│
│
│
│
70 60 50 40 30 20 10 80
Optimum T
Increasing
enzyme
activity
1. Velocity of an enzyme-catalyzed reaction increases with increase in temperature until the optimum is
reached; optimum temperature is the temperature at which the rate of the reaction is maximal; for
most human enzymes, optimum temperature is between 40-60o C.
2. The increase in velocity before the optimum temperature is due to increased kinetic energy of the
substrate and the enzyme → more collision between enzyme and substrate → more binding.
3. Beyond optimum temperature or with further increase in temperature → ↓ velocity due to inactivation
secondary to denaturation of the enzyme, specifically destruction of the tertiary structure or unfolding
of the enzyme; plotting temperature vs. velocity, a curve slightly skewed to the right is obtained.

EFFECT OF pH
Optimum
pH
1. Before and beyond optimum pH, there is a decreasing velocity of an enzyme-
catalyzed reaction due to enzyme denaturation (because the structure of the
catalytically active site of the protein molecule depends on the ionic character of
the amino acid side chains).
2. Optimum pH refers to the pH at which the velocity of the reaction is highest.
3. Plotting pH vs. velocity, a bell-shaped curve will be obtained.

EFFECT OF CO-FACTORS:
Chlorides, Bromides, Iodides
Cofactors increase the rate of
enzyme-catalyzed reactions

EFFECT OF SUBSTRATE CONCENTRATION
Substrate concentration [S]
Vmax
Re
ac
tio
n v
elo
cit
y (
V)
1. For a given conc. of an enzyme, the velocity of a reaction ↑es as the substrate conc.
increases until maximal velocity (Vmax) is reached.
2. Thereafter, further increases in the substrate conc. will no longer increase the velocity
because all the enzymes have been saturated by the substrate.
3. Sometimes, however, the addition of excessive amounts of substrates after Vmax will
↓ reaction vel. due to the fact that there are so many substrates competing for the
active sites on the enzyme surfaces that they block the sites prevent any other
substrate molecules from occupying them drop in velocity since all of the enzymes
present is not being used.

CARDIAC ENZYMES AS MARKERS FOR
ACUTE MYOCARDIAL INFARCTION
Aspartate
aminotransferase
1. Troponin (Troponin T and Troponin I isoforms) - regulatory proteins involved in myocardial
contractility very specific and preferred markers for detecting myocardial cell injury, as in MI
therefore not present in the serum of healthy individuals.
Rises 3-6 hours after injury; peaks in 12-16 hrs; stays elevated in 5-14 days.
2. Creatine Kinase
a. Begins to rise 4-6 hours after MI; peak at 24 hrs; returns to normal in 3-5 days.
b. Isoenzymes: i. CK-MM fraction = found in skeletal muscle ii. CK-MB fraction = found in heart
muscle iii. CK-BB = found in the brain
c. May be increased in other conditions: physical exertion, postoperatively, convulsions, delirium
tremens, etc; hence not diagnostic for MI unless the CK-MB fraction is being assayed: rises in 3-
4 hours after MI; peak 12-14 hrs later and returns to normal in 2 days.

CARDIAC ENZYMES AS MARKERS FOR
ACUTE MYOCARDIAL INFARCTION
Aspartate
aminotransferase
3. Lactate Dehydrogenase
a. Peak level about 36- 40 hrs after MI and thus of diagnostic value in patients
admitted > 48 hrs after infarction.
c. Levels return to normal in 5-14 days
b. No longer used to diagnose MI found also in other tissues like liver, RBCs,
skeletal muscles, and a variety of organs.
4. Aspartate Aminotransferase, AST
a. Rise within 8 hrs after MI; peak at 24-36 hrs; returns to normal level within 3-7 days.
b. Not diagnostic for MI since the enzyme is also found in hepatocytes.

THANK YOU
AND
GOOD LUCK!


