Embed Size (px)
Citation preview
MARINE ECOLOGY PROGRESS SERIES Mar Ecol Prog Ser
Published September 17
Nitrogen budgets for the areolated grouper Epinephelus areolatus cultured under laboratory
conditions and in open-sea cages
K.M.Y.Leung8 , J. C. W.Chu,R. S .S . Wu**
Department of Biology and Chemistry, City University of Hong Kong. Tat Chee Avenue. Kowloon. Hong Kong, China
ABSTRACT: The nitrogen budget of grouper Epinephelus areolatus (Forskal) in a culture system can be represented by the mass balance equation: consumption (C) = feed input (I) - feed wastage (W) = production (P) + moi-tality (A4) + excretion (E) + faecal production (F) . A nitrogen budget was con- structed for individual groupers cultured for 1 n ~ o under laboratory conditions; and an annual nitrogen budget was also constructed for a cohort of E. areolatus cultured in an open-sea-cage farm and fed with trash fish. Consumption was determined independently both by feeding expenments as well as by summation of P, M, E and F, to provide an estirnate of the accuracy of the budget equation. In the lab- oratory budget, 27.5 % of N consunled was channelled to growth, while 64 4 % was excreted in the form of amrnonia and 8.1 % lost in faeces The N-assimilation efficiency was 91 9%, while the net N-reten- tion efficiency was 29.9%. For the annual budget constructed for the open-sea-cage farm, only 8 6 % of total N input into the farm was harvested in the form of fish production, while loss to mortality was 3.7 %. Ammonia excretion was the most important N loss (46.0%), followed by feed wastage (37 .? %) and faecal production (4.0%). 66% of total N input could be accounted for in the laboratory N budget for individual groupers, but only 48% of N input into the culture system could be accounted for in the annual nitrogen budget constructed for open-sea-cage farming. It was estimated that 87 7 % of the total N input to the farm was lost to the environment (equivalent to 321 kg N t-' of fish production). Such a value is almost 3 times as high as N loss from temperate salmonid farms
KEY WORDS: Nitrogen budget . Assimilation efficiency . Grouper
INTRODUCTION
Manne fish culture in the coastal waters of many countries has grown dramatically in recent years, and further growth is expected in the coming decade (FA0 1995, New & Csavas 1995). In open-sea-cage culture, high organic and nutnent loadings generated from feed wastage, excretion and faecal production are directly discharged into the environment (Duff 1987, Hammo 1987, Waldichuk 1987, Wu 1988, 1995, Wildish et al. 1990, Soley et al. 1994, Wu et al. 1994). Conse-
'Present address: Institute of Biomedical and Life Sciences, Graham Kerr Building, University of Glasgow, Glasgow G12 8QQ, Scotland, UK
"Addressee for correspondence. E-mail: [email protected]
quently, there has been a growing concern over the impact of marine fish farming activities on water and sediment quality of the receiving marine environment (Ackefors 1986, Gowen & Bradbury 1987, Hakanson et al. 1988, Rosenthal et al. 1988, Ackefors & Enell 1990, Wu et al. 1994, Wu 1995). Indeed, environmental con- cern has already led to a moratorium on nesv develop- ments and tighter controls in Denmark, Norway, New Zealand, Canada and Hong Kong (Duff 1987, BC Min- istry of Environment 1990).
Nitrogen is often the limiting nutrient for pnrnary pro- duction in coastal ecosystems (Dugdale 1967, Gunderson 1981, Cockcroft & McLachlan 1993). Ammonia and Urea excreted by fish can be readily taken up by phytoplank- ton, and hence may promote algal blooms. It should also be noted that fish excreta and wasted food have a N:P ratio close to 7 : l (the Redfield ratio) (Aure & Stigebrandt
0 Inter-Research 1999 Resale of full article not perrnitted
272 Mar Ecol Prog Ser
1990), and hence wouId provide well-balanced nutrients for phytoplankton growth. A number of studies have shown that excessive nitrogen caused by marine fish farming activities may lead to eutrophication and hence mortality of fish and benthos (Jones et al. 1982, Skogheim & Bremnes 1984, Phillips et al. 1985, Skjoldal & Dundas 1991). Eloranta & Palomaeki (1986) demon- strated an increase in phytoplankton biomass, chloro- phyll a, and pnmary production in response to nutrient loading from fish farms. In Hong Kong, higher levels of nutrients (arnmonia, nitnte, nitrate, inorganic phosphate) as well as phytoplankton numbers have been reported in fish culture zones (Wu 1988). In a review, Handy & Pox- ton (1993) estimated that 52 to 95 % of N input into a fish culture system will ultimately be lost into the environ- ment. Likewise, a study of the flux and mass balance of nitrogen in a rainbow trout cage farm where dry feed was used showed that 76% of the nitrogen feed input into the system was lost to the environment, and the to- tal environmental loss of nitrogen was estimated at be- tween 95 and 102 kg N t-' production (Hall et al. 1992). Such a high N loadinq generated from the marine fish culture industry has obviously become a prime environ- mental concern.
Understanding the nitrogen budget of fish and fish farms is useful in mariculture management, since information on the loading and forms of nitrogen from vanous sources could enable appropriate measures to be devised for the sustainable development of the industry. For example, the quantity and forms of nitro- gen loading generated from fish farms are essential in estimating the carrying capacity of culture waters and assessing the environmental impact; species with a low nitrogen loading may be selected for culture in areas with low flushing rates and where background levels of nitrogen are high; feed types may also be varied to reduce wastage if this is an important contnbuting fac- tor to nitrogen loading. The great majonty of existing data on N excretion and N budgets of fish, however, were derived from temperate species (mostly sal- monids) (Handy & Poxton 1993). Nitrogen utilisation and loading of non-salmonid marine species are poorly known. Furthermore, most studies of nitrogen budgets of fish have been conducted in land-based culture facilities or laboratory systems, in which artifi.cia1 feed is used (for a review, See Gowen & Bradbury 1987, Handy & Poxton 1993). So far, only a single study has been carried out in Sweden to estimate nitrogen load- ing for rainbow trout cultured in open-sea cages (Hall et al. 1992). Despite over 84% of global aquaculture production being derived from Asia, where the growth of marine fish farming is also the most rapid in the world (FA0 1995), the loading, sources, forms and fates of nitrogen generated from tropical and sub-trop- ical fish farms are virtually unknown.
It should be noted that there are fundamental differ- ences in culture species, feed types and water temper- atures between fish culture in temperate and tropi- cal/sub-tropical countries (Wu et al. 1994). First, nitrogen requirements, metabolism and excretion of tropical and sub-tropical culture species (e.g. grouper, seabream, snapper) may be very different from their temperate counterparts (mostly salmonids). Second, unlike temperate countnes (e.g. Scotland, Norway and Canada) where pellet feed is used, trash fish are fed in tropical/sub-tropical fish farms (e.g. Hong Kong, Thai- land, Japan and Singapore). Feed wastage and nutri- ent loading are expected to be much higher when trash fish are used compared with fish farms where pellet feed is used (Warrer-Hansen 1982, Chu et al. 1995). Third, a higher water temperature regime in the tropics and sub-tropics may lead to a higher metabolic rate of fish and hence higher nitrogen utilisation. The paucity of data on tropical/sub-rropicai species and culture systems, however, does not permit an accurate estimation of nitrogen loadings in open-sea-cage farms, which is common practise in this region.
The objectives of the preseni stüdy nrc: (1) to con- struct a laboratory N budget for the areolated grouper Epinephelus areolatus (Forskal), a common culture species in tropical and sub-tropical regions, under con- trolled laboratory conditions; and (2) to construct an annual N budget for the Same species cultured in open-sea cages. Despite the fact that large errors are expected to be incurred in nutrient budget studies, all reported nutnent budgets do not involve the indepen- dent measurement of individual budget items, and the errors involved hence cannot be estimated. In the pre- sent study, each budget item was measured indepen- dently, to estimate the balance of the budget, and also to shed light on the possible errors incurred in other nitrogen budgets.
MATERIALS AND METHODS
Terminology. The nitrogen budget of an individual fish or a fish farm can be represented by the following mass balance equation, in which each budget item is expressed in term of the mass of nitrogen.
where C = N consumption; P = N retained for growth; M = N loss through mortality (in case of individual fish, M = 0); E = N loss through excretion; and F = N loss through faecal production. Assimilation efficiency (K1) and nitrogen retention efficiency (K2) for individual fish can be determined using the following equations:
K, = (C- F / C ) x 100",0 (2)
Leung e t al : Nitrogen budgets for Epinephelus areolatus
K2 = [P/(C- F)] X 100 %
The nitrogen budget of a fish farm cail be represented by the equation:
C = I - W
where I = total N input into the culture system; W = N loss through feed wastage; and C = N consumption by the culture stock.
Theoretically, the nitrogen budget equation (Eq. 1) should be balanced, and consumption C can be esti- mated from the summation of P, M, E and F. Similarly, any item in the equation which is difficult to measure can be found by the difference, provided that valiies of all other budget items are knownr However, it is desir- able to determine all budget items independently, since this will provide an independent check on the balance of the budget equation. The balance of the equation can be checked by comparing the consump- tion value denved from the summation method (Cs), with actual consumption values obtained directly from feeding experiments (CF) using the following equation:
O/O balance = (Cs/CF) X 100 % (5)
Laboratory N budget for individual Epinephelus areolatus. Groupers Epinephelus areolatus obtained from a local fish farm were acclimated in continuous flow seawater (temperature: 25 ? 1°C; salinity: 30%0) for 14 d . During the acclimation period, fish were fed with minced trash fish (Sardinella spp. and Stolepho- rus spp.; water content: 69.2 * 1.5%, total N: 10.5 I
3.4 Oh) to satiation once daily. After acclimation, 8 fish (mean weight: 92.8 * 9.6 g ) were selected for the experiment. Each fish was reared individually in a 30 1 tank with continuous flow fo; 1 mo under the same conditions and hand fed with trash fish to satia- tion once daily. Great care was exercised to ensure that no feed wastage was left on the bottom of each tank, and the amount of feed supplied to each fish was recorded. Seawater flow was stopped dunng feeding, and water was siphoned fi-om each tank before and 10 to 15 min after feeding (to avoid biased estimate resulting from regurgitation, water samples were analysed for nitrite, nitrate, ammonia and total organic nitrogen, following the methods given in Strickland & Parsons (1972). Nitrogen loss in feed wastage (W) was calculated based on the in- crease in total N in each tank after feeding, and expressed as a percentage of N input. Consumption (CF) was then calculated by the difference between input (I) and feed wastage (W).
Water content of trash fish was determined by differ- ence in wet weight and dry weight, after drying the fish sample at 80°C for 48 h until constant weight was obtained. N content in the dried trash fish was then
determined using a CHN analyser (CHN-900, Model 600-800-300, LECO@ Corporation), and the amount of N in the feed was calculated and expressed as mg N g-' dry wt. Weight gain for each individual fish was determined after 1 mo. Water and N content of the grouper carcasses were determined at the end of experiment, using the Same methods described for trash fish. Production (P) was then estimated by the net gain of N in fish tissue.
Results of an earlier experiment showed that ammo- nia-N is the predominant excretory product in Epi- nephelus areolatus while TON and Urea excretion are not detectable (Leung et al. 1999). Ammonical-N excretion rate (E) (mg N kg-' d-') at 25°C was deter- mined using the method and System described in Leung et al. (1999), and total N loss to excretion was calculated for the whole period.
Faecal matter in each metabolism chamber was also collected daily, and dried, weighed and analysed for N content. Faecal N production rate (F) was calculated and expressed as mg N kg fish-' d-'. E and F for indi- vidual fish over the 1 mo expenmental period were estimated by integrating daily excretion rates and faecal production rates over time.
Field N budget for Epinephelus areolatus cultured in open-sea cages. A 1 yr field study was carned out at the fish farm of the Kat 0 Fisheries Research Sta- tion, Hong Kong, to estimate the various budget items for groupers cultured in an open-sea-cage- farm. Four hundred Epinephelus areolatus fry (10 to 14 Cm, fork length) were divided in equal number and put into 4 replicate sea cages (1.5 m X 0.75 m X
1.5 m: length X width X depth). Such a stocking den- sity is typical in Hong Kong. Fish in each replicate cage were fed to satiation daily with trash fish, and the amount of trash fish supplied to each cage recorded. Nitrogen content of trash fish was deter- mined for every month as described before, and N in feed input (I) was estimated fronl the amount of feed supplied to each cage and the nitrogen content of trash fish. Feed wastage was estimated by collecting unconsumed feed using a waste trap designed by Chu et al. (1995). This design involved suspending a polyethylene bag at the bottom of the cage. The bag tapered into a conical end at which a collecting bottle was secured. Unconsumed feed funnelled down the collecting bottle was coiiected 30 min after feeding, and was dried and weighed. Feed wastage was expressed as percentage of feed supplied. N loss to W was then estimated by multiplying the N content of the feed and percentage of feed wastage. The mean body weight of fish in each replicate cage was estimated at the beginning of the experiment and then monthly, by weighing thirty individual fish ran- domly sampled from each cage (after anaesthetising
274 Mar Ecol Prog Ser 186: 271-281, 1999
the fish in 100 pprn quinaldine for 1 to 2 rnin). Mor- tality of fish in each cage was also recorded monthly, and the biomass of survivors in each cage calculated each month. Production (P) was estimated by sum- ming the monthly increase in biomass over the 1 yr study penod:
12
Production = Z [ ( N , + N,+1)/2](Wt+l - W , ) ( 6 ) l=O
where N, and N„, are the nurnber of survivors at time t and time t + 1 , respectively; W, and W,+, are the mean body weights of fish at time t and time t + 1 , respec- tively; t is the time in rnonths ( t = 0 to 12 rno). N chan- nelled to P over the culture period was determined by rnultiplying the total biomass gain over period and the nitrogen content in the fish carcasses. Biomass loss to rnortality in each cage was estimated using the follow- ing equation:
12
Mortality = C(N, - N,„)(W, + Wt+,)/2 (7) t=O
and N loss via rnortality (M) was then calculated frorn total biomass lost to mortality and nitrogen content in the fish carcasses.
Daily postprandial nitrogen excretion rates ( A b mg N kg-' d-') of the grouper stock in the sea cages were estimated from the daily water temperature and daily feed ration, using the following multiple regres- sion equation denved for this species by Leung et al. (1999):
A, = 22.81 Temp, + 28.78Rt- 378.18 (8)
where Temp, is the water temperature at Day t (in "C); and R, is the feed ration size at Day t (in % body wt d-I). Total N loss through ammonia excretion over the 1 yr culture period (E, in mg N) from each cage was then calculated by integrating daily ammonia excretion rates over the 1 yr period.
Results of our earlier laboratory expenments showed no significant differences between faecal production rates of Epinephelus areolatus under different water temperatures (ANOVA, p > 0.05). As a result, the over- all average value of faecal N loss rate (35.16 k 9.39 mg N kg-' d-l) derived from our laboratory experirnents was used to estimate the N loss to daily faecal produc- tion (F) in the field.
Construction of laboratory and field N budgets. For the laboratory N budget, all budget items were expressed as either (I) g N fish-' d-I or (2) g N kg-' of fish production. For the annual field budget, all budget items were expressed as g N m-3 yr-I and g N kg-I production yr-I, respectively. The budget items were also expressed in terms of a percentage of the N input derived from: (1) feeding expenments and (2) summa- tion of W, P, M, E, and F.
RESULTS
Laboratory N budget of individual Epinephelus areolatus
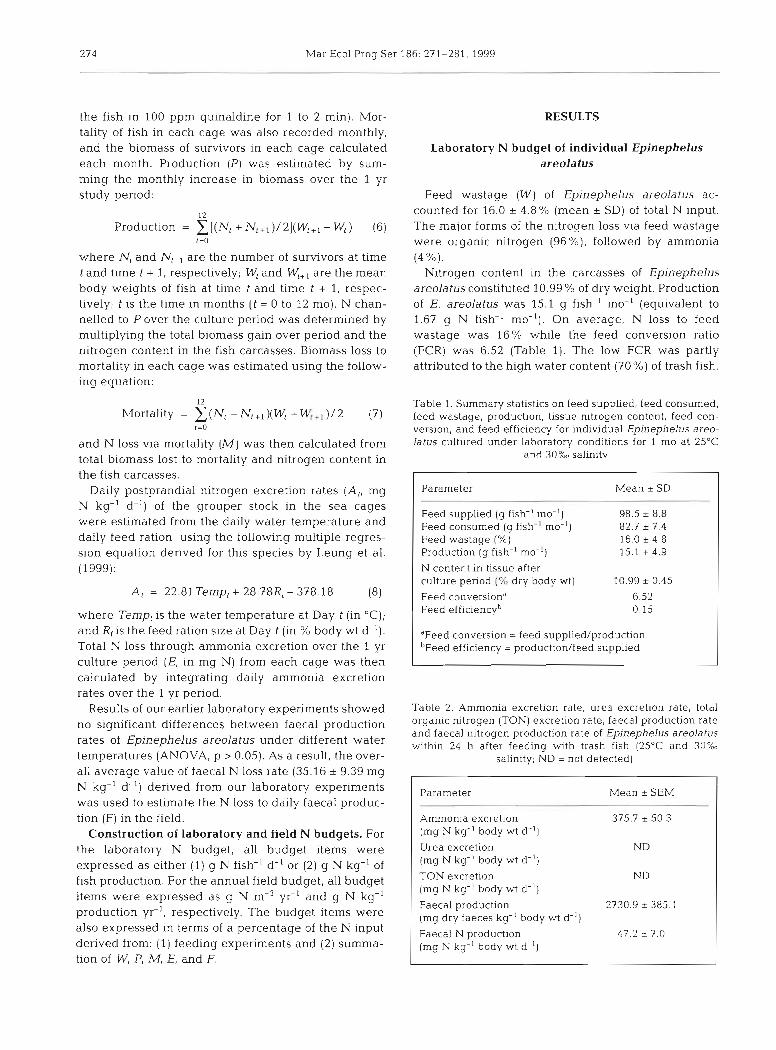
Feed wastage (W) of Eplnephelus areolatus ac- counted for 16.0 + 4 . 8 % (mean + SD) of total N input. The major forms of the nitrogen loss via feed wastage were organic nitrogen (96%), followed by ammonia (4 %).
Nitrogen content in the carcasses of Epinephelus areolatus constituted 10.99 % of dry weight. Production of E. areolatus was 15.1 g fish-' mo-' (equivalent to 1.67 g N fish-' mo-I). On average, N loss to feed wastage was 16% while the feed conversion ratio (FCR) was 6.52 (Table 1). The low FCR was partly attributed to the high water content (70 %) of trash fish.
Table 1. Summary statistics on feed supplied, feed consurned, feed wastage, production, tissue nitrogen content, feed con- Version, and feed efficiency for individual Epinephelus areo- latus cultured under laboratory conditions for 1 mo at 25°C
and 30% salinitv
Parameter Mean I SD
Feed supplied (g fish-' mo-I) 98.5 I 8.8 Feed consumed (g fish ' mo-'1 82.7 I 7.4 Feed wastage (%) 16.0 r 4.8 Production (g fish-' mo ' ) 15.1 r 4.9
N content in tissue after culture penod (% dry body wt) 10.99 r 0.45
Feed conversiond 6.52 Feed efficiencyb 0 15
T e e d conversion = feed suppiied/production b ~ e e d efficiency - production/feed supplied
Table 2. Ammonia excretion rate, Urea excretion rate, total organic nitrogen (TON) excretion rate, faecal production rate and faecal nitrogen production rate of Epinephelus areolatus within 24 h after feeding with trash fish (25°C and 30%0
salinity; ND = not detected)
Parameter Mean + SEM
Amm0ni.a excretion 375.7 * 50.3 (mg N kg-' body wt d-I)
Urea excretion ND (rng N kg-I body wt d-')
TON excretion ND (mg N kg-' body wt d-')
Faecal production 2730.9 + 385.1 (mg dry faeces kg-' body wt d-')
Faecal N production 47.2 + 7.0 (mg N kg-' body wt d-')
Leung et al.: Nitrogen budgets for Epinephelus al-eolatus
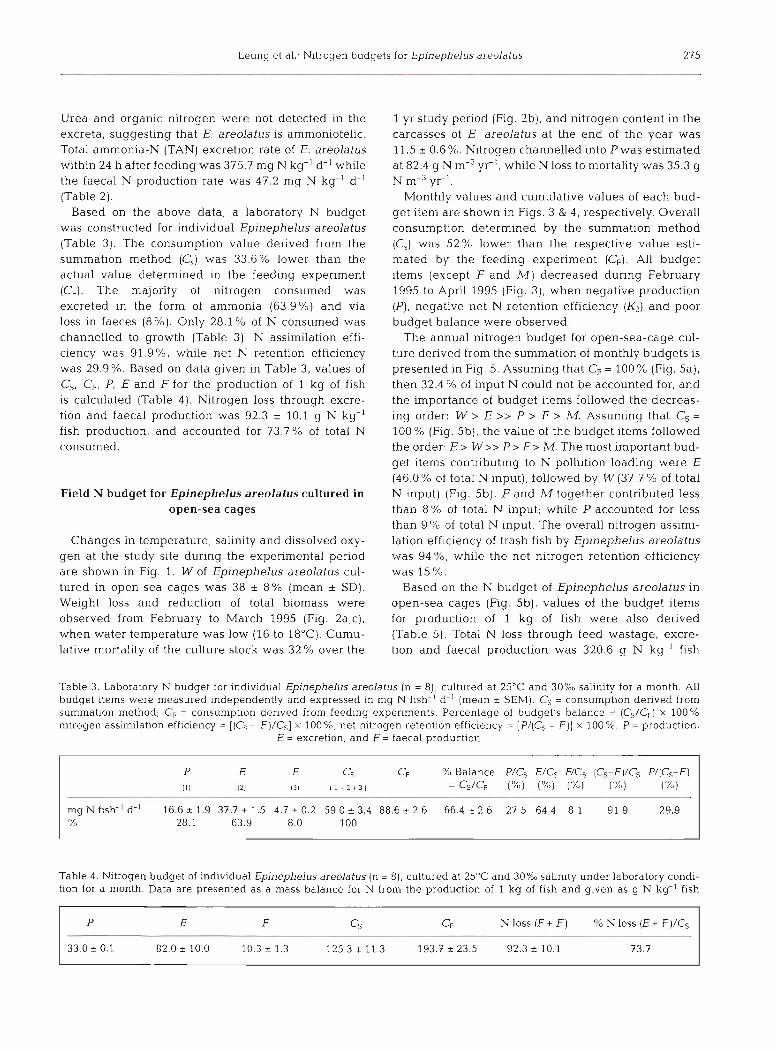
Urea and organic nitrogen were not detected in the excreta, suggesting that E. areolatus is ammoniotelic. Total ammonia-N (SAN) excretion rate of E. areolatus within 24 h after feeding was 375.7 mg N kg-' d-' while the faecal N production rate was 47.2 mg N kg-I d-' (Table 2).
Based on the above data, a laboratory N budget was constructed for individual Epinephelus areolatus (Table 3). The consumption value derived from the summation method (C,) was 33.6% lower than the actual value determined in the feeding experiment (CF). The majonty of nitrogen consumed was excreted in the form of ammonia (63.9%) and via loss in faeces (8%). Only 28.1'0 of N consumed was channelled to growth (Table 3). N assimilation effi- ciency was 91.9%, while net N retention efficiency was 29.9%. Based on data given in Table 3, values of Cs, CF, P, E and F for the production of 1 kg of fish is calculated (Table 4). Nitrogen loss through excre- tion and faecal production was 92.3 + 10.1 g N kg-' fish production, and accounted for 73.7% of total N consumed.
Field N budget for Epinephelus areolatus cultured in open-sea cages
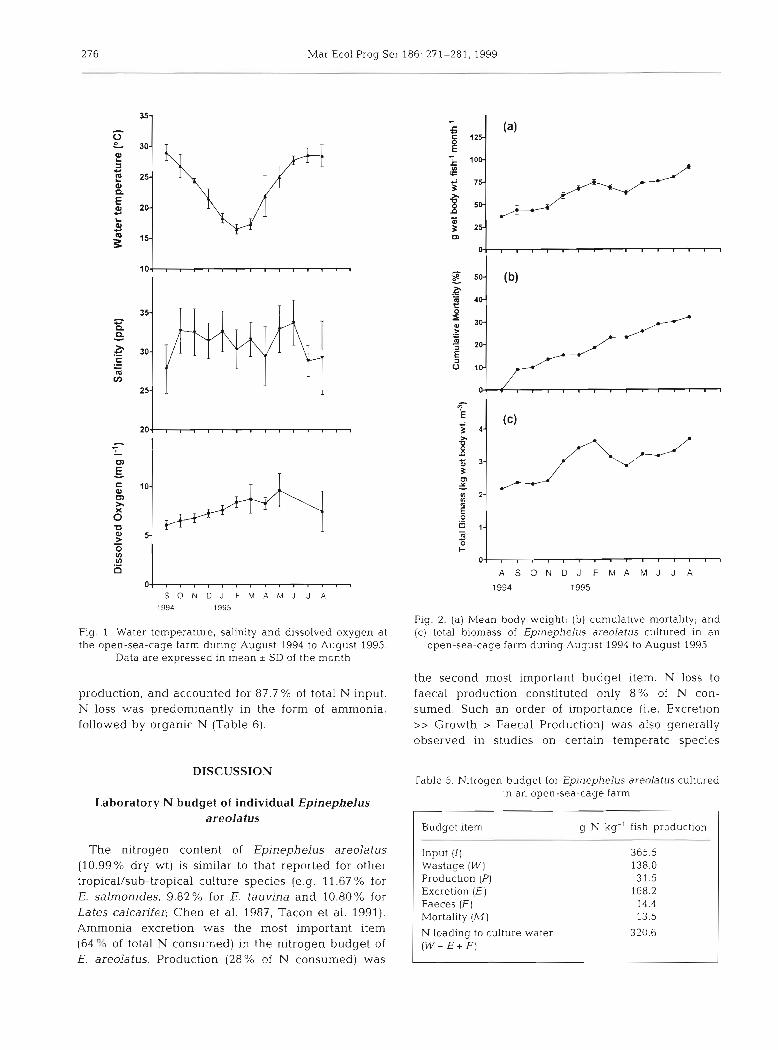
Changes in temperature, salinity and dissolved oxy- gen at the study site during the experimental period are shown in Fig. 1. W of Epinephelus areolatus cul- tured in open-sea cages was 38 + 8 % (mean + SD). Weight loss and reduction of total biomass were observed from February to March 1995 (Fig. 2a,c), when water temperature was low (16 to 18°C). Cumu- lative mortality of the culture stock was 32 % over the
1 yr study period (Fig. 2b), and nitrogen content in the carcasses of E. areolatus at the end of the year was 11.5 k 0.6 %. Nitrogen channelled into P was estimated at 82.4 g N m-3 yr-I, while N loss to mortality was 35.3 g N m-3 yr-'.
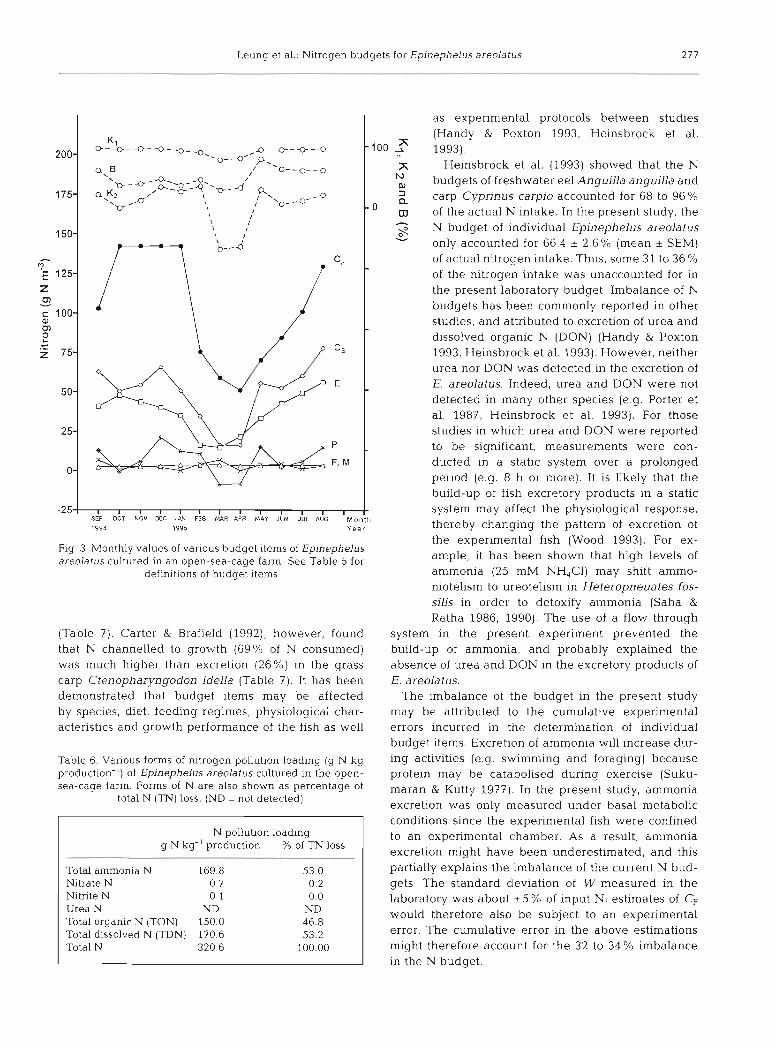
Monthly values and cumulative values of each bud- get item are shown in Figs. 3 & 4, respectively. Overall consumption determined by the summation method (C,) was 52Y0 lower than the respective value esti- mated by the feeding expenment (CF). All budget items (except F and M ) decreased during February 1995 to April 1995 (Fig. 3) , when negative production (P), negative net N retention efficiency (K2) and poor budget balance were observed.
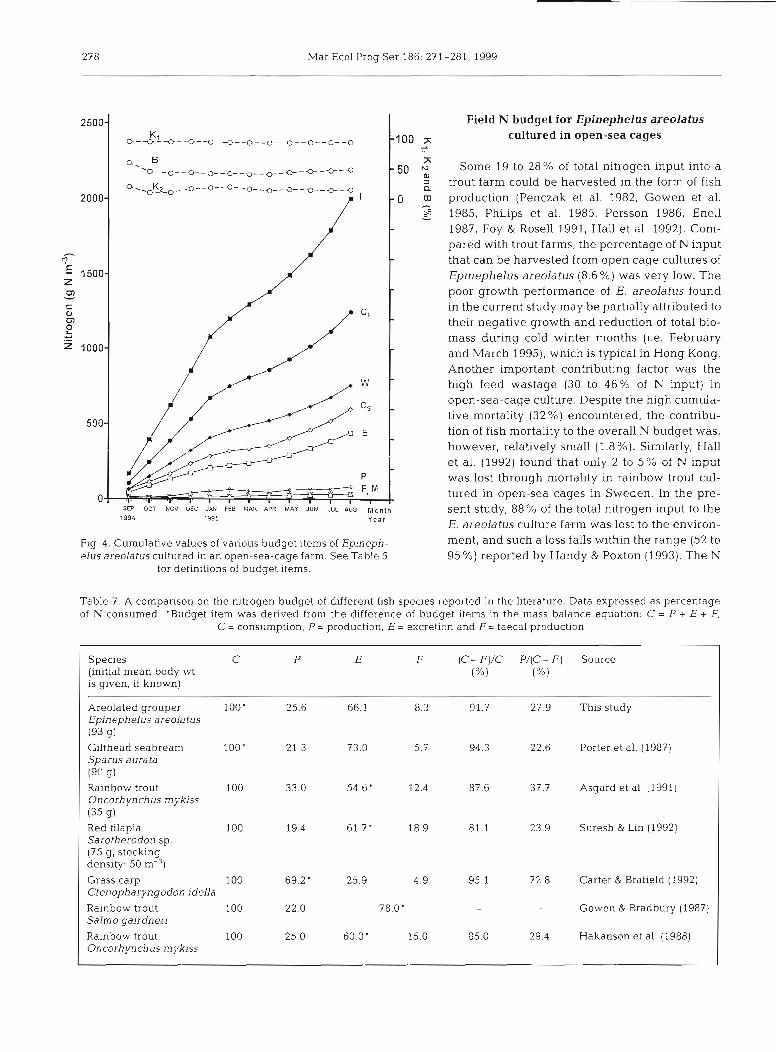
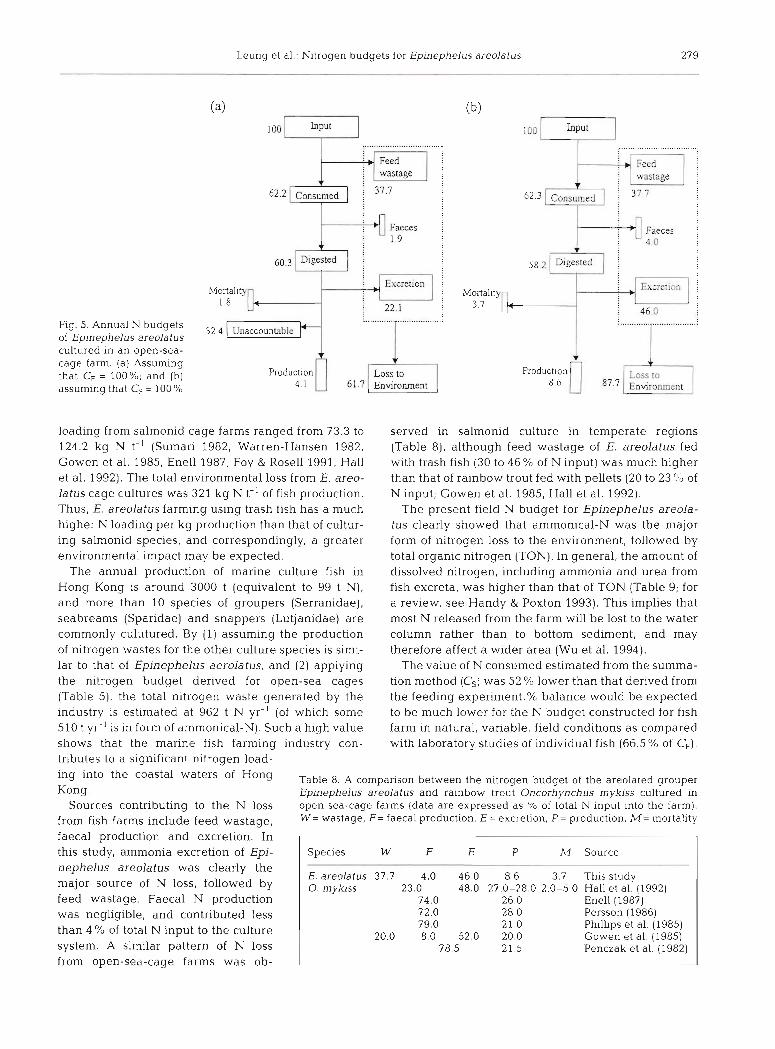
The annual nitrogen budget for open-sea-cage cul- ture derived from the summation of monthly budgets is presented in Fig. 5. Assuming that Cp = 100% (Fig. 5a), then 32.4 % of input N could not be accounted for, and the irnportance of budget items followed the decreas- ing order: W > E >> P > F > M. Assuming that Cs =
100 % (Fig. 5b), the value of the budget items followed the order: E> W>> P > F> M. The most important bud- get items contributing to N pollution loading were E (46.0% of total N input), followed by W (37.7 % of total N input) (Fig. 5b). F and M together contnbuted less than 8 % of total N input; while P accounted for less than 9 % of total N input. The overall nitrogen assimi- lation efficiency of trash fish by Eplnephelus areolatus was 94'!,", while the net nitrogen retention efficiency was 15%.
Based on the N budget of Epinephelus areolatus in open-sea cages (Fig. 5b), values of the budget items for production of 1 kg of fish were also derived (Table 5). Total N loss through feed wastage, excre- tion and faecal production was 320.6 g N kg-' fish
Table 3. Laboratory N budget for individual Epinephelus areolatus (n = 8), cultured a t 25'C and 30%0 salinity for a month. All budget items were mcasured independently and expressed in mg N fish-' d-' (mean I SEM). C s = consumption denved from summation method; C' , = consumption denved from feeding expenments. Percentage of budget's balance = ( C S / C F ) X 100% nitrogen assimilation efficiency = [ ( C s - F ) / C s ] X 100%, net nitrogen retention efficiency = [PI(Cs - F ) ] X 100%, P = production,
E = excretion, and F = faecal production
P E F Cs C F % Balance P/Cs E/& F/Cs (C,-F)/& P/(CS-F)
(11 121 131 ( l + 2 + 3 1 = c s / c F ("Lu) ( X ) (%) (%) P - P
("/.I
mg h tish-' d-' 16.6 I 1.9 37.7 I 1.5 4.7 i 0.2 59.0 i 3.4 88.6 I 2.6 66.4 + 2 6 27.5 64 4 8.1 91.9 29.9 "Lo 28.1 63.9 8.0 100
Table 4. Nitrogen budget of individual Epinephelus areolatus (n = 8), cultured at 25°C and 30%0 salinity under laboratory condi- tion for a month. Data are presented as a mass balance for N from the production of 1 kg of fish and given as g N kg-' fish
276 Mar Ecol Prog Ser 186: 271-281, 1999
S O N D J F M A M J J A
1994 1995
?ig. 1 Water temperature, salinity and dissolved oxygen at the open-sea-cage farm during August 1994 to August 1995.
Data are expressed in rnean I SD of the rnonth
production, and accounted for 87.7 % of total N input. N loss was predorninantly in the form of arnrnonia, followed by organic N (Table 6).
DISCUSSION
Laboratory N budget of individual Epinephelus areolatus
The nitrogen content of Epinephelus areolatus (10.99% dry wt) is sirnilar to that reported for other tropical/sub-tropical culture species (e.g. 11.67 % for E. salrnonides, 9.82% for E. tauvina and 10.80% for Lates calcanfer; Chen et al. 1987, Tacon et al. 1991). Ammonia excretion was the most important item (64 % of total N consumed) in the nitrogen budget of E. areolat~is. Production (28% of N consumed) was
A S O N D J F M A M J J A
Fig. 2. (a) Mean body weight; (b) curnulative mortality; and (C) total biomass of Epinephelus areolatus cultured in an
open-sea-cage farrn during August 1994 to August 1995
the second most important budget item. N loss to faecal production constituted only 8% of N con- sumed. Such an order of irnportance (i.e. Excretion >> Growth > Faecal Production) was also generally observed in studies on certain ternperate species
Tdbie 5. Nitrogen budget for Epinephelus areolatus cultured i.n an open-sea-cage farrn
I Budget itern g N kg-' fish production I Input (I) 365.5 Wastage (W) 138.0 Production (P) 31.5 Excretion (E) 168.2 Faeces (F) 14.4 Mortality (M) 13.5
N loading to culture water (W+ E + F)
Leung et al. Nitrogen budgets for Epinephelus areolatus 277
- - - -
- 2 5 ] i i 1 1 1 i , 1 1 1 1 1 1 ~ SV OCT NOV DEC JhV F E 8 MAR APR I.4AY JUN JUL AUG M o n l h 1994 1995 Y e a r
Fig 3 Monthly values of various budget items of Epinephelus areolatus cultured in an open-sea-cage farm See Table 5 for
definitions of budget items
(Table 7). Carter & Brafield (1992), however, found that N channelled to growth (69% of N consumed) was much higher than excretion (26%) in the grass carp Ctenopharyngodon idella (Table 7 ) . It has been demonstrated that budget items may be affected by species, diet, feeding regimes, physiological char- acteristics and growth performance of the fish as well
Table 6. Various forms of nitrogen pollution loading (g N kg production-') of Eplnephelus areolatus cultured in the open- sea-cage farm. Forms of N are also shown as percentage of
total N (TN) loss. (ND = not detected)
N pollution loading g N kg-' production % of TN loss
-
Total ammonia N 169 8 53 0 Nitrate N 0 7 0 2 Nitrite N 0 1 0.0 Urea N ND ND Total organic N (TON) 150.0 46.8 Total dissolved N (TDN) 170.6 53.2 Total N 320.6 100.00
as experimental protocols between studies (Handy & Poxton 1993, Heinsbrock et al. 1993).
Heinsbrock et al. (1993) showed that the N budgets of freshwater eel Anguilla anguilla and carp Cyprinus carpjo accounted for 68 to 96% of the actual N intake. In the present study, the N budget of individual Epinephelus areolatus only accounted for 66.4 t 2.6% (mean t SEM) of actual nitrogen intake. Thus, some 31 to 36% of the nitrogen intake was unaccounted for in the present laboratory budget. Imbalance of N budgets has been commonly reported in other studies, and attributed to excretion of Urea and dissolved organic N (DON) (Handy & Poxton 1993, Heinsbrock et al. 1993). However, neither Urea nor DON was detected in the excretion of E. areolatus. Indeed, Urea and DON were not detected in many other species (e.g. Porter et al. 1987, Heinsbrock et al. 1993). For those studies in which urea and DON were reported to be significant, measurements were con- ducted in a static system over a prolonged period (e.g. 8 h or more). It is likely that the build-up of fish excretory products in a static System may affect the physiological response, thereby changing the pattern of excretion of the experimental fish (Wood 1993). For ex- ample, it has been shown that high levels of ainmonia (25 mM NH,Cl) may shift ammo- niotelism to ureotelism in Heteropneuates fos- silis in order to detoxify ammonia (Saha &
Ratha 1986, 1990). The use of a flow through system in the present experiment prevented the build-up of ammonia, and probably explained the absence of Urea and DON in the excretory products of E. areolatus.
The imbalance of the budget in the present study may be attributed to the cumulative experimental errors incurred in the determination of individual budget items. Excretion of an~monia will increase dur- ing activities (e.g. swimming and foraging) because protein may be catabolised during exercise (Suku- maran & Kutty 1977). In the present study, ammonia excretion was only measured under basal metabolic conditions since the experimental fish were confined to a n experimental chamber. As a result, ammonia excretion might have been underestimated, and this partially explains the imbalance of the current N bud- gets. The standard deviation of W measured in the laboratory was about t 5 % of input N; estimates of CF would therefore also be subject to an experimental error. The cumulative error in the above estimations might therefore account for the 32 to 34 % imbalance in the N budget.
278 Mar Ecol Prog Ser 186: 271 -281. 1999
2500 Field N budget for Epinephelus areolatus
100 5 cultured in open-sea cages
50 5 Sorne 19 to 28% of total nitrogen input into a trout farm could be harvested in the form of fish
2000 0 m production (Penczak et al. 1982, Gowen et al. - S 1985, Philips et al. 1985, Persson 1986, Enell -
1987, Foy & Rose11 1991, Hall et al. 1992). Com- pared with trout farms, the percentage of N input -
1 that can be harvested from Open cage cultures of E 1500 z Epinephelus areolatus (8.6%) was very low. The m - poor growth performance of E. areolatus found C a in the current study may be partially attributed to P) their negative growth and reduction of total bio- 2 .r mass during cold winter months (i.e. February 2 1000 and March 1995), which is typical in Hong Kong.
Another important contnbuting factor was the high feed wastage (30 to 46% of N input) in open-sea-cage culture. Despite the high cumuici-
500 tive mortality (32 %) encountered, the contnbu- tion of fish mortality to the overall N budget was, however, relatively smail (1.8%). Similarly, Hall et al. (1992) iound tnat oiiiy 2 lo 5% of N input was lost through mortality in rainbow trout cul-
0 tured in open-sea cages in Sweden. In the pre- SEP OCT ~ ' O V OEC JW FEE hlm APR MAY JUN JUL AM M~~~~ sent study, 88% of the total nitrogen input to the 1994 1995 Year
E. areolatus culture farm was lost to the environ-
Fig. 4. Cumulative values of vanous budget items of Epineph- ment, and such a loss falls within the range (52 to elus areolatus cultured in an open-sea-cage farm. See Table 5 95 %) reported by Handy & Poxton (1993). The N
for definitions of budget items.
Table 7. A companson on the nitrogen budget of different fish species reported in the literature. Data expressed as percentage of N consumed 'Budget item was denved from the difference of budget items in the mass balance equation: C = P + E + F;
C = consumption, P = production, E = excretion and F= faecal production
Species C P E F (C - F)/C P/(C - F) Source (initial mean body wt (X) is given, if known)
Areolated grouper 100' 25.6 66.1 8.3 91.7 27.9 This study Epinephelus areolatus (93 gl Cilthead seabream Sparus a urata (90 g) Rainbow trout Oncorhynch us m ykiss (35 g) Red tilapia Sarotherodon sp. (75 g, stocking density: 50 m-3)
Grass carp 100 69.2 - 25.9 95.1 72.8 Carter & Brafield (1992) Ctenopharyngodon idella
Rainbow trout 100 22.0 78 0 ' - - Gowen & Bradbury (1987) Salrno gairdnen' Rainbow trout 100 25.0 60.0' 15.0 85.0 29.4 Hakanson et al. (1988) Oncorhynchus mykiss
Porter et al. (1987)
Asgard et al. (1991)
Suresh & Lin (1992)
Leung et al: Nitrogen budgets for Epinephelus areolatus 279
Fig. 5. Annual N budgets of Epinephelus areolatus cultured in an open-sea- cage farm. (a) Assuming that CF = 100%; and (b) assuming that Cs = 100%
32.4 0 Unaccouiitable
Production 4.1
V
58.2 Digested
Monality 3.7
i 46.0
Production
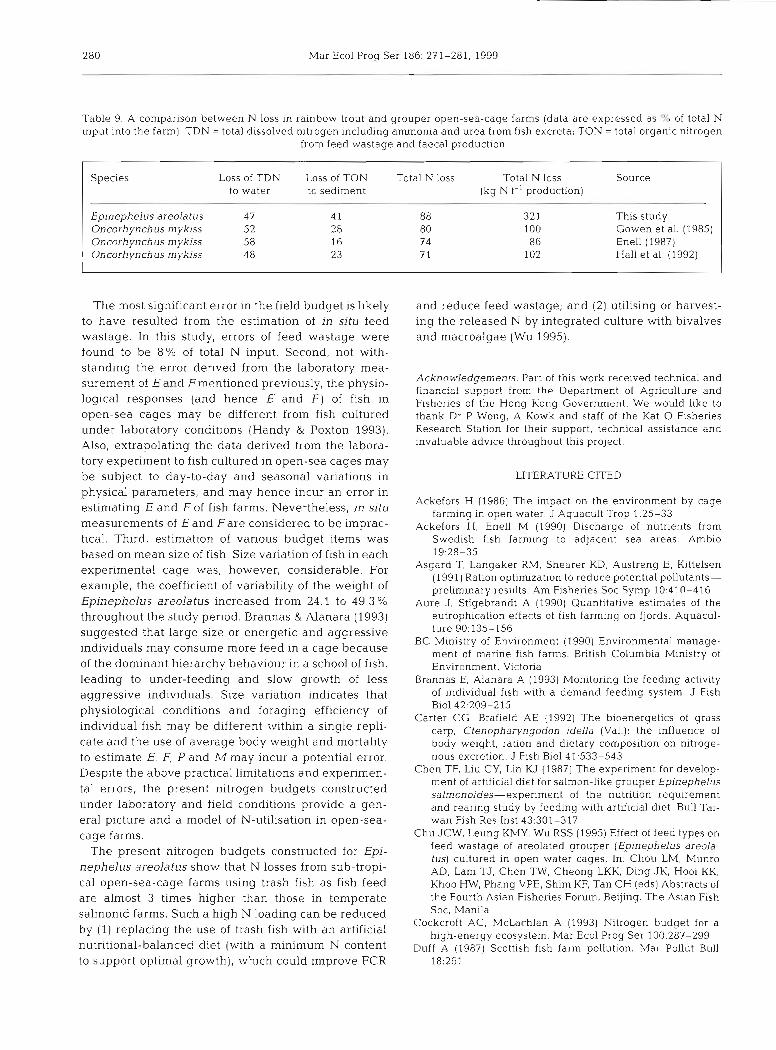
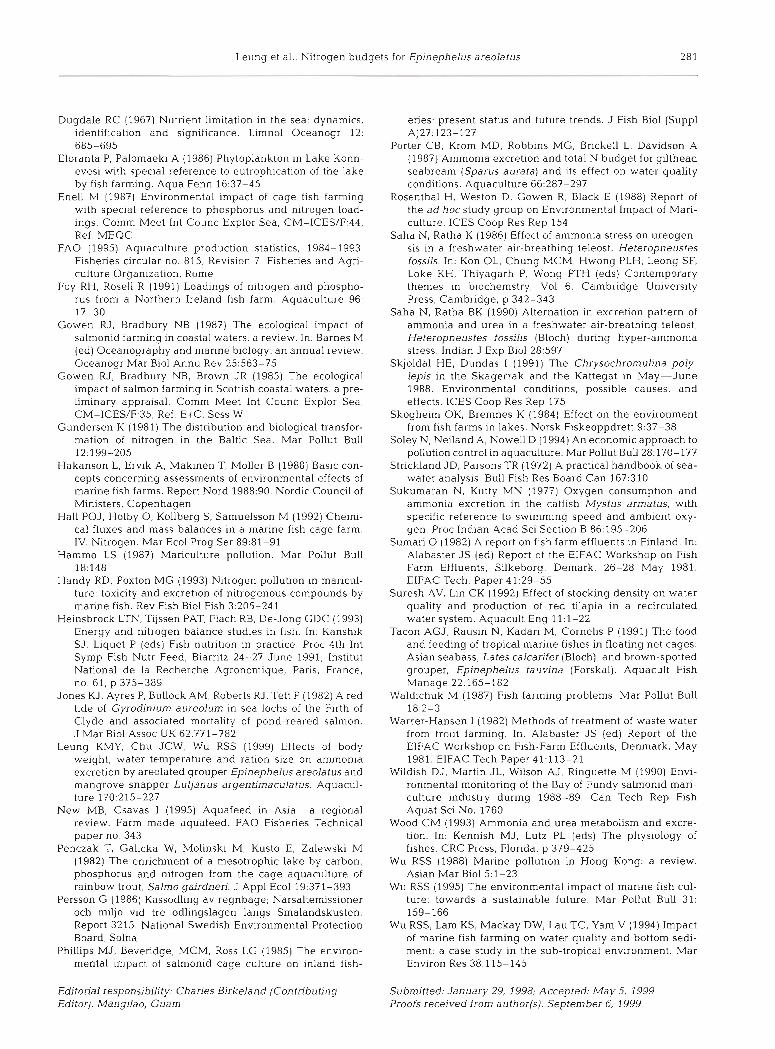
loading from salmonid cage farms ranged from 73.3 to served in salmonid culture in temperate regions 124.2 kg N t-' (Sumari 1982, Warren-Hansen 1982, (Table 8), although feed wastage of E. areolatus fed Gowen et al. 1985, Enell 1987, Foy & Rose11 1991, Hall with trash fish (30 to 46% of N input) was much higher et al. 1992). The total environmental loss from E. areo- than that of rainbow trout fed with pellets (20 to 23 of latus cage cultures was 321 kg N t-' of fish production. N input; Gowen et al. 1985, Hall et al. 1992). Thus, E. areolatus farming using trash fish has a much The present field N budget for Epinephelus areola- higher N loading per kg production than that of cultur- tus clearly showed that ammonical-N was the n~ajor ing salmonid species, and correspondingly, a greater form of nitrogen loss to the environment, followed by environmental impact may be expected. total organic nitrogen (TON). In general, the amount of
The annual production of marine culture fish in dissolved nitrogen, including ammonia and urea from Hong Kong is around 3000 t (equivalent to 99 t N), fish excreta, was higher than that of TON (Table 9; for and more than 10 species of groupers (Serranidae), a review, See Handy & Poxton 1993). This implies that seabreams (Sparidae) and snappers (Lutjanidae) are most N released from the farm will be lost to the water commonly culutured. By (1) assuming the production column rather than to bottom Sediment, and may of nitrogen wastes for the other culture species is simi- therefore affect a wider area (Wu et al. 1994). lar to that of Epinephelus aerolatus, and (2) applying The value of N consumed estimated from the summa- the nitrogen budget derived for open-sea cages tion method (Cs) was 52 % lower than that denved from (Table 5), the total nitrogen waste generated by the the feeding expenment.% balance would be expected industry is estimated at 962 t N yr-' (of which some to be much lower for the N budget constructed for fish 510 t yr-I is in form of ammonical-N). Such a high value farm in natural, variable, field conditions as compared shows that the manne fish farming industry con- with laboratory studies of individual fish (66.5 O/o of CF). tributes to a significant nitrogen load- ing into the 'Oastal waters Of Table 8. A comparison between the nitrogen budget of the areolated grouper Kong. Epinephelus areolatus and rainbow trout Oncorhynchus mykiss cultured in
Sources contributing to the N loss open-sea-cage farms (data are expressed as % of total N input into the farm). from fish farms include feed wastage, W = wastage, F = faecai production, E = excretion. P= production. M= mortality
faecal production and excretion. In this study, ammonia excretion of Epi- nephelus areolatus was clearly the major source of N loss, followed by feed wastage. Faecal N production was negligible, and contributed less than 4 % of total N input to the culture System. A similar pattern of N loss from open-sea-cage farms was ob-
Species W F E P M Source
E. areolatus 37.7 4.0 46.0 8.6 3.7 This study 0. mykiss 23.0 48.0 27.0-28.0 2.0-5.0 Hall et al. (1992)
74.0 26.0 Enell (1987) 72.0 28.0 Persson (1986) 79.0 21.0 Phillips et al. (1985)
20.0 8.0 52.0 20.0 Gowen et al (1985) 78.5 21.5 Penczak et al. (1982)
280 Mar Ecol Prog Ser 186: 231-281, 1999
Table 9. A comparison between N loss in rainbow trout and grouper open-sea-cage farms (data are expressed as % of total N input into the farrn) TDN = total dissolved nitrogen including amrnonia and Urea from fish excreta, TON = total organic nitrogen
from feed wastage and faecal production
Species Loss of TDN Loss of TON Total N loss Total N loss Source to water to sedi.ment (kg N t-' production)
Epinephelus areolatus 47 41 88 32 1 This study Oncorh ynch us rn ykiss 52 28 80 100 Gowen et al. (1985) Oncorh ynch us m ykiss 5 8 16 74 86 Ene11 (1987) Oncorhynchus mykjss 48 23 7 1 102 Hall et al. (1992)
The most significant error in the field budget is likely and reduce feed wastage; and (2) utilising or harvest- to have resulted from the estimation of in situ feed ing the released N by integrated culture with bivalves wastage. In this study, errors of feed wastage were and macroalgae (Wu 1995). found to be 8% of total N input. Second, not with- standing the error derived from the laboratory mea- surerr-ent of E and Fmantioned previously, the physio- Acknowledgements. Part of this work received technical and
financia! srppor! from the Department of Agriculture and logica1 respOnses (arid hence E arid F ) of fish in Fisheries of the Hong Kong Government. We would like to open-sea cages rnay be different from fish cultured thank Dr P Wong, A Kowk and staff of the Kat 0 Fisheries under laboratory conditions (Handy & Poxton 1993). Research Station for their support, technical assistance and
Also, extrapolating the data derived from the labora- invaluable advice thrOughOut this Project-
tory experiment to fish cultured in open-sea cages rnay be subject to day-to-day and seasonal variations in LITERATURE CITED
physical Parameters, and rnay hence incur an error in estimating E and F of fish farms. Nevertheless, in situ measurements of E and Fare considered to be imprac- tical. Third, estirnation of various budget items was based on mean size of fish. Size variation of fish in each experimental cage was, however, considerable. For example, the coefficient of variability of the weight of Epinephelus areolatus increased from 24.1 to 49.3 % throughout the study penod. Brannas & Alanara (1993) suggested that large size or energetic and aggressive individuals rnay consume more feed in a cage because of the dominant hierarchy behaviour in a school of fish, leading to under-feeding and slow growth of less aggressive individuals. Size variation indicates that physiological conditions and foraging efficiency of individual fish rnay be different within a single repli- cate and the use of average body weight and mortality to estimate E, F, P and M rnay incur a potential error. Despite the above practical limitations and expenmen- tal errors, the present nitrogen budgets constructed under laboratory and field conditions provide a gen- eral picture and a model of N-utilisation in open-sea- cage farms.
The present nitrogen budgets constructed for Epi- nephelus areolatus show that N losses from sub-tropi- cal open-sea-cage farms using trash fish as fish feed are alrnost 3 times higher than those in ternperate salmonid farms. Such a high N loading can be reduced by (1) replacing the use of trash fish with an artificial nutritional-balanced diet (with a rninimum N content to support optimal growth), which could improve FCR
Ackefors H (1986) The impact on the environment by cage farming in Open water. J Aquacult Trop 1:25-33
Ackefors H, Enell M (1990) Discharge of nutrients from Swedish fish farming to adjacent sea areas. Ambio 19:28-35
Asgard T, Langaker RM. Shearer KD, Austreng E, Kittelsen (1991) Ration optimization to reduce potential pollutants- prel~rninary results. Am Fisheries Soc Syrnp 10:410-416
Aure J. Stigebrandt A (1990) Quantitative estimates of the eutrophication effects of fish farming on fjords. Aquacul- ture 90:135-156
BC Ministry of Environment (1990) Environrnental manage- ment of marine fish farms. British Columbia Ministry of Environment, Victoria
Brannas E, ~ l a n a r a A (1993) Monitoring the feeding activity of indi.vidua1 fish with a demand feeding System. J Fish Bi01 42:209-215
Carter CG, Brafield AE (1992) The bioenergetics of grass carp, Ctenopharyngodon idella (Val.): the influence of body weight. ration and dietary composition on nitroge- nous excretion. J Fish Bio1 41:533-543
Chen TF, Liu CY, Lin KJ (1987) The experiment for develop- ment of artificial diet for salmon-like grouper Epinephelus salmonoides-experiment of the nutrition requirernent and rearing study by feeding with artificial diet. Bull Tai- wan Fish Res Inst 43:301-317
Chu JCW, Leung KMY, Wu RSS (1995) Effect of feed types on feed wastage of areolated grouper (Epinephelus areola- tus) cultured in Open water cages. In Chou LM, Munro AD, Lam TJ, Chen TW. Cheong LKK. Ding JK, Hooi KK, Khoo HW, Phang VPE, Shim KF, Tan CH (eds) Abstracts of the Fourth Asian Fisheries Forum, Beijing. The Asian Fish Soc, Manila
Cockcroft AC, McLachlan A (1993) Nitrogen budget for a high-energy ecosystem. Mar Ecol Prog Ser 100:287-299
Duff A (1987) Scottish fish farm pollution. Mar Pollut Bull 18:261
Leung et al.: Nitrogen budgets for Epinephelus areolatus 281
Dugdale RC (1967) Nutrient limitation in the sea: dynamics, identification and significance. Limnol Oceanogr 12: 685-695
Eloranta P, Palomaeki A (1986) Phytoplankton in Lake Konn- evesi with special reference to eutrophication of the lake by fish farming. Aqua Fenn 16:37-45
Enell M (1987) Environmental impact of cage fish farming with special reference to phosphorus and nitrogen load- ings. Comm Meet Int Counc Explor Sea, CM-1CES/F:44, Ref. MEQC
FA0 (1995) Aquaculture production statistics, 1984-1993. Fisheries circular no. 815, Revision 7 Fisheries and Agn- culture Organization, Rome
Foy RH, Rose11 R (1991) Loadings of nitrogen and phospho- rus from a Northern Ireland fish farn?. Aquaculture 96 17-30
Gowen RJ, Bradbury NB (1987) The ecological impact of salrnonid farming in coastal waters: a review. In: Barnes M (ed) Oceanography and marine biology: an annual review. Oceanogr Mar Biol Annu Rev 25:563-75
Gowen RJ, Bradbury NB, Brown JR (1985) The ecological impact of salmon farming in Scottish coastal waters: a pre- lirninary appraisal. Comm Meet Int Counc Explor Sea, CM-ICES/F:35, Ref. E+C, Sess W
Gundersen K (1981) The distnbution and biological transfor- mation of nitrogen in the Baltic Sea. Mar Pollut Bull 12:199-205
Hakanson L, Ervik A, Makinen T, Moller B (1988) Basic con- cepts concerning assessments of environmental effects of marine fish farms. Report Nord 1988:90. Nordic Council of Ministers, Copenhagen
Hall POJ, Holby 0, Kollberg S, Samuelsson M (1992) Chemi- cal fluxes and mass balances in a marine fish cage farm. IV. Nitrogen. Mar Ecol Prog Ser 89:81-91
Hammo LS (1987) Manculture pollution. Mar Pollut Bull 18:148
Handy RD, Poxton MG (1993) Nitrogen pollution in mancul- ture: toxicity and excretion of nitrogenous compounds by manne fish. Rev Fish Biol Fish 3:205-241
Heinsbrock LTN, Tijssen PAT. Flach RB, De-Jong GDC (1993) Energy and nitrogen balance studies in fish. In: Kanshik SJ, Liquet P (eds) Fish nutntion in practice. Proc 4th Int Symp Fish Nutr Feed, Biarritz 24-27 June 1991, Institut National de la Recherche Agronomique, Paris, France, no. 61, p 375-389
Jones KJ, Ayres P, Bullock AM. Roberts RJ, Tett P (1982) A red tide of Gyrodinium aureolum in sea lochs of the Firth of Clyde and associated mortality of pond-reared salmon. J Mar Biol Assoc UK 62371-782
Leung KMY, Chu JCW, Wu RSS (1999) Effects of body weight, water temperature and ration size on ammonia excretion by areolated grouper Epinephelus areolatus and mangrove snapper Lutjanus argentimaculatus. Aquacul- ture 170:215-227
New MB, Csavas I (1995) Aquafeed in Asia-a regional review. Farm made aquafeed. FA0 Fishenes Technical paper no. 343
Penczak T, Galicka W, Molinski M, Kusto E, Zalewski M (1982) The ennchment of a mesotrophic lake by carbon, phosphorus and nitrogen frorn the cage aquaculture of rainbow trout, Saimo gairdneri. J Appl Ecol 19:37 1-393
Persson G (1986) Kassodling av regnbage; Narsaltemissioner och miljo vid tre odlingslagen langs Smalandskusten. Report 3215. National Swedish Environmental Protection Board, Solna
Phillips MJ, Bevendge, MCM, Ross LG (1985) The environ- mental impact of salmonid cage culture on inland fish-
Editorial responsibility: Charles Birkeland (Contributing Editor), Mangilao, Guam
enes- present Status and future trends. J Fish Biol (Suppl A)27:123-127
Porter CB, Krom MD, Robbins MG, Bnckell L. Davidson A (1987) Ammonia excretion and total N budget for gilthead seabream (Sparus aurata) and its effect on water quality conditions. Aquaculture 66:287-297
Rosenthal H, Weston D, Gowen R. Black E (1988) Report of the ad hoc study group on Environmental Impact of Mari- culture. ICES Coop Res Rep 154
Saha N, Ratha K (1986) Effect of ammonia stress on ureogen- sis in a freshwater air-breathing teleost. Heteropneustes fossils. In: Kon OL, Chung MCh4, Hwong PLH, Leong SF, Loke KH, Thiyagarh P, Wong PTH (eds) Contemporary themes in biochemstry, Vol 6. Cambridge University Press, Cambridge, p 342-343
Saha N, Ratha BK (1990) Alternation in excretion pattern of ammonia and Urea in a freshwater air-breathing teleost, Heteropneustes fossilis (Bloch) dunng hyper-ammonia stress. Indian J Exp Biol 28:597
Skjoldal HE, Dundas 1 (1991) The Chrysochromulina poly- lepis in the Skagerrak and the Kattegat in May-June 1988. Environmental conditions, possible causes, and effects. ICES Coop Res Rep 175
Skogheim OK, Bremnes K (1984) Effect on the environment from fish farms in lakes. Norsk Fiskeoppdrett 9:37-38
Soley N, Neiland A, Nowell D (1994) An economic approach to pollution control in aquaculture. Mar Pollut Bull 28:170-177
Stnckland JD, Parsons TR (1972) A practical handbook of sea- water analysis. Bull Fish Res Board Can 167:310
Sukumaran N, Kutty MN (1977) Oxygen consumption and amrnonia excretion in the catfish Mystus armatus, with specific reference to swimming speed and ambient oxy- gen. Proc Indian Acad Sci Section B 86:195-206
Suman 0 (1982) A report on fish farm effluents in Finland. In: Alabaster JS (ed) Report of the EIFAC Workshop on Fish Farm Effluents, Silkeborg. Demark, 26-28 May 1981. EIFAC Tech. Paper 41:29-55
Suresh AV, Lin CK (1992) Effect of stocking density on water quality and production of red tilapia in a recirculated water system. Aquacult Eng 11:l-22
Tacon AGJ, Rausin N, Kadari M, Cornelis P (1991) The food and feeding of tropical manne fishes in floating net cages: Asian seabass, Lates calcafifer (Bloch), and brown-spotted grouper, Epinephelus tauvina (Forskal). Aquacult Fish Manage 22:165-182
Waldichuk M (1987) Fish farming problems. Mar Poliut Bull 18:2-3
Warrer-Hansen I (1982) Methods of treatment of waste water from trout farming. In: Alabaster JS (ed) Report of the EIFAC Workshop on Fish-Farm Effluents, Denmark. May 1981. EIFAC Tech Paper 41:113-21
Wildish DJ, Martin JL, Wilson AJ, Ringuette M (1990) Envi- ronmental monitoring of the Bay of Fundy salmonid man- culture industry during 1988-89. Can Tech Rep Fish Aquat Sci No. 1760
Wood CM (1993) Ammonia and Urea metabolism and excre- tion. In: Kennish MJ, Lutz PL (eds) The physiology of fishes. CRC Press, Florida, p 379-425
Wu RSS (1988) Marine pollution in Hong Kong: a review. Asian Mar Biol 5:l-23
Wu RSS (1995) The environmental impact of manne fish cul- ture: towards a sustainable future. Mar Pollut Bull 31: 159-166
Wu RSS, Lam KS, Mackay DW. Lau TC, Yam V (1994) Impact of marine fish farming on water quality and bottom sedi- ment: a case study in the sub-tropical environment. Mar Environ Res 38:115-145
Submjtted: January 29, 1998; Accepted: May 5, 1999 Proofs received from author(s). September 6, 1999


