Embed Size (px)
Citation preview
1.
UCRL 10252
University of· California
Ernest 0. Radiation
lawrence Laboratory
TWO-WEEK LOAN COPY
This is a library Circulating Copy which may be borrowed for two weeks. For a personal retention copy, call
Tech. Info. Division, Ext. 5545
SCATTERING OF NEGATIVE PIONS ON PROTONS - '
AT 310 MeV: DIFFERENTIAL AND TOTAL CROSS-SECTION AND PHASE-SHIFt ANALYSIS
Berkeley, California
DISCLAIMER
This document was prepared as an account of work sponsored by the United States Government. While this document is believed to contain correct information, neither the United States Government nor any agency thereof, nor the Regents of the University of California, nor any of their employees, makes any warranty, express or implied, or assumes any legal responsibility for the accuracy, completeness, or usefulness of any information, apparatus, product, or process disclosed, or represents that its use would not infringe privately owned rights. Reference herein to any specific commercial product, process, or service by its trade name, trademark, manufacturer, or otherwise, does not necessarily constitute or imply its endorsement, recommendation, or favoring by the United States Government or any agency thereof, or the Regents of the University of California. The views and opinions of authors expressed herein do not necessarily state or reflect those of the United States Government or any agency thereof or the Regents of the University of California.
UNIVERSITY OF CALIFORNIA
Lawrence Radiation Laboratory Berkeley, California
Contract No. W -7405-eng-48
UCRL-10252
UC-34 Physics TID-4500 (17th Ed.)
SCATTERING OF NEGATIVE PIONS ON PROTONS AT 310 MeV: DIFFERENTIAL AND TOTAL CROSS-SECTION
AND PHASE-SHIFT ANALYSIS
Hugo R. Rugge
(Ph. D. Thesis)
May 20, 1962

Printed in USA. Price $2.00. Available from the Office of Technical Services U. S. Department of Commerce Washington 25, D.C.
., y
.,-111-
SCATTERING OF NEGATIVE PIONS ON PROTONS AT 310 MeV: DIFFERENTIAL AND TOTAL CROSS-SECTION
AND PHASE-SIITFT ANALYSIS
Contents
Abstract o o , •
I. Introduction .
Il. DCS Experimental Method
A. Experimental Arrangement
I. Magnet System ' . 2 .. Pion Beam. . 3. Counters. . . . . . . 4. Electronics, .
. 5. Liquid Hydrogen Target
B. Counter Telescope
1. Design. .
. .
. .
. .
' .
. .
2. Telescope Calibration at Forward Angles
C. Experimental Procedure. • . .
I.
2.
3.
Accidentals and Background • .
Cross-Section Measurement
Simultaneous Experiment
·" 0 • .•
D. Normalization Measurement. ,
-I. Experimental Arrangement
.• . o o o 'o
2, Experimental Procedure. . .
III. DCS Results.
A. Corrections to Data
I.
2.
3.
Electron Contamination in the Scattered Pion Beam
Counter Telescope Efficiency.
Finite Target and Telescope . . . 4. Other Corrections. . • 0 • 0 0 • '·Cl 0 •
B. Normalization Corrections
v
1
5
5
7
10
13
13
15
15
15
17
17
19
21
21
22
22
26
26
33
35
35
36
-iv-
" Contents (continued)
c. Differential Cross Section •
I. Scattered Pions Counted o
20 Tar get Constant •
3. Normalization
D. Errors
IV. Total Cross Section
A. Experimental Method , . • o
I. Experimental Arrangement
2. Experimental Procedure o
B. Results and Errors
V. Phase-Shift Analysis
• Q • 0
. . .
A. Relationship of Phase Shifts to· Experimental Data
I. Scattering Amplitudes
2. Isotopic Spin
3. Notation
B. Search Program • . o o . -"" ~ ' . . . .
l. General Method •
2. PIPANAL 1CF4 .
C. Phase -Shift Investigations .
VI.
1.
2.
30
spd Investigations ...
spdf Investigations
Inelastic Scattering
Discussion of Results
Acknowledgments
Appendices
0 0 • 0
0 .o
A. Inclusion of Coulomb Scattering in Pion-Nucleon
37
37
37
39
43
45
45
47
47
51
5i
53
53
55
55
56
58
64
67
69
70
73
Scattering Amplitudes. . o • • • • • . • 74
B. Tables of Error Matrices for spd and spdf Solutions. 79
References 84
'"
'9
\.·
. ' ..
-v-
SCATTERING OF NEGATIVE PIONS ON PROTONS AT 310 MeV: DIFFERENTIAL AND TOTAL CROSS-SECTION
AND PHASE-SHIFT ANALYSIS
Hugo R, Rugge
Lawrence Radiation Laboratory University of California
Berkeley, California
May 20, 1962
ABSTRACT
The differential cross section in 'TT- -p elastic scattering at 310-
MeV incident-pion energy has been measured for 28 angles in the lab
oratory syste~.angular region 25 deg ~ elab ~ 160 deg, The reaction
was observed by counting the scattered pions emerging from a liquid
hydrogen target with a counter telescope consisting of scintillation and
Cerenkov counters. A measurement of the total cross section by atten
uation as a function of cutoff angle was also performed, using scintilla
tion counters, These data were incorporated with polarization and
other differential cross section data at this energy, and a phase shift
analysis was performed, An IBM 7090 search program was developed
for this purpose,
Analysis of all data for spd waves (up to f.= 2) has resulted in a
single acceptable solution that has I-spin 3/2 phase shifts in excellent
agreement with results of a previous 1T + -p phase shift analysis, and has
I-spin 1/2 phase shifts that are < 6 deg for the D 5/ 2 shift which is :::: 15
deg. Errors on the phase shifts vary from 0,4 through L l deg,
An extension of the analysis to spdf waves (up to f. = 3) results
in two probable solutions, and one that is rather unlikely, These, as
well as the spd solution, are discus sed, Errors on the spdf solution
are larger, ranging up to 2 deg,
. ._,
- 1-
I. INTRODUCTION
The interaction of pions and nucleons is of fundamental im
portance in nuclear physics because of the relationship of this pion
nucleon interaction to nuclear forces. It is at present believed that
nuclear forces result principally from an interchange of pions by the
nucleons in the nucleus. For this reason, the pion-nucleon inter
action has been studied for some time, for the most part by measuring
differential and total cross sections for the scattering of positive and
negative pions on protons. Although there is a reasonable amount of
data, most of it lacks completeness and accuracy at any single energy.
Therefore, it was our purpose to obtain accurate and complete rr -p
differential and total cross-section data at one energy, 310 MeV.
(In this report, energies mentioned refer to incident-pion kinetic ener
gies. )
This work was part of a continuing effort at the Lawrence Radia
tion Laboratory to obtain accurate data concerning the pion-nucleon
interaction at 310 MeV. Previously, Rogers et al. had made accurate
measurements of 25 differential cross section points for the reaction
+ + 1 1T + p _,.. 7T + p, (I. 1)
and Foote et al. had obtained recoil proton polarization data at four
angles for this same interaction. 2 These constituted the most accurate
and complete data on rr+ -p scattering ever obtained at one energy.
However, investigation of rr+ -p scattering leads only to information
about the isotopic spin 3/2 state of the pion-nucleon system.· To gain
information about the !-spin 1/2 state either of the two following rr- -p
interactions must be studied:
-2-
rr +p-rr +p (elastic scattering), ( l. 2)
or
(charge-ex:change scattering).
( 1. 3)
Because the detection of charged pCI.rticles. is considerably
easier than the detection of neutrals,. we proposed to study Reaction
( L 2), the elastic scattering of pions on protons. It was our aim to
obtain infprmation about this interaction at least as accurate as the
rr + -p data previously obtained by Rogers et al. 1
The main reason for lack of accuracy in previous measure
ments was that only low-intensity pion beams were available to exper
imenters. These low intensities resulted in low counting rates which,
of course, led to poor counting statistics and to limitations on the
number of angles at which data could be obtained. Furthermore, when
counting rates are low there is no opportunity to investigate possible
systematic errors thoroughly.
We were able to form a pion beam that contained 3XI06
in a 2.-in. -diam circle or a flux of about 5 -; 2 1.5Xl0 rr em -sec.
rr-/sec
This
was about two orders of magnitude better than had been obtained by
most previous experimenters. By scattering this beam from a
liquid hydrogen target and detecting the scattered pions with counters,
we were able to measure 28 differential cross -section points as a
function of laboratory-system (lab) angle and to obtain total cross
section data.
" 9ne of the chief purposes of obtaining experimental data is
,to be able to use it either to check theoretical preciictions or. to in-
dicate the correct theoretical approach. The usual meeting place
of theory and exper~ment,for elastic scatte·ring has been at the phase
.shifts~-·· Data obtainedfrom pion-nucleon scattering experiments
are usually analyzed in terms of partial waves. In this type of anal
ysis, scattering amplitudes are expanded in a series of terms, each
term corresponding to a definite angular momentum state of the
pion-nucleon system. States with the orbital-angular momentum
quantum number P. = 0, 1, 2, 3 • · · are referred to as s, p, d,
f · · · states. These partial-wave expansions contain parameters,
called phase shifts, that measure the magnitude of the interaction
in any given angular momentum and !-spin state, and it is the value
and energy dependence of these phase shifts that a theory must pre
dict to be successful.
For this reason, a search for the phase shifts describing the
pion-nucleon interaction at 310 MeV was initiated. Such an anal:-+ 3 ysis had already been completed by Foote for the 1T - p data,
yielding !-spin 3/2 phase shifts. We have extended this work, using
all of the 1T + data, the data contained in this report, and the recoil
proton polarization data measured by Vik. 4
In addition, charge
exchange differential cross -section data at 317 MeV measured by
Caris was also used. 5 Some 1T- -p differential cross -section and
polarization data at 307 MeV had been previously measured by
Zinov and Korenchenko, 6 and Vasilevskii and Vishnyako, 7 but
these data were insufficiently accurate for good phase-shift analysis.
One reason for the original choice of an incident pion energy
of 310 MeV was that classically, d waves are expected to become
noticeable in the interaction at about 300 MeV. The results of an
spd (up to P. = 2) phase·-shift analysis led to rather large d waves
and, therefore, the analysis was extended to include f waves.
-4-
Results and descriptions of the spd and spdf phase-shift analysis,
as well as details and results of the differential and total cross
section measurements, are contained in this report.
For convenience, throughout this report we refer to the
differential and the total cross section as DCS and TCS, respec
tively.
l'
"'
1 .••
-5-
II. DCS EXPERIMENTAL METHOD
A. Experimental Arrangement
In order to achieve the degree of accuracy desired for the DCS
measurement, an intense 310-MeV -rr beam had to be produced and
scattered from liquid hydrogen. The desired pion beam was produced
and was focused on a liquid hydrogen target by a magnet system. For
most of the experiment the pion beam striking the hydrogen tar get was
monitored by an argon-filled ioniza.tion chamber. The pions scattered
by the liquid hydrogen were detected by a counter telescope consisting
of a Cerenkov counter and two scintillation counters. During part of
the experiment, the incident pion beam was monitored by a pair of scin
tillation counters to obtain a more accurate normalization of the DCS,
The DCS was measured at a total of 28 lab angles.
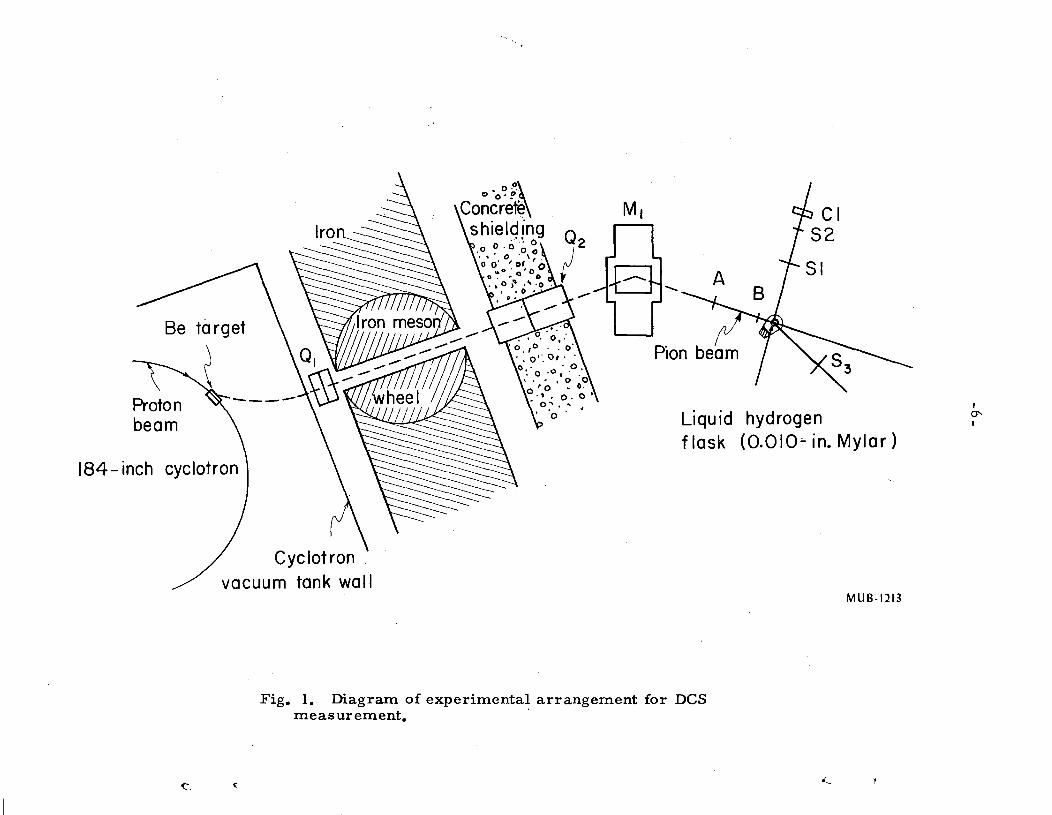
A diagram of the experimental arrangement is shown in Fig. L
1. Magnet System
Negative rr mesons were produced by inserting a beryllium target
into the 740-MeV internal proton beam of the Berkeley 184 inch synchro
cyclotron. The pions produced at 0 deg were deflected out of the cyclo
tron by its own magnetic field, and pas sed through a thin aluminum win
dow in the vacuum tank and into the 8 in. aperture of the two-section
{doublet) quadrupole magnet 01
, This quadrupole formed a parallel
beam that passed into an 8-ft-long iron collimator known as the Meson
Wheel. From theWheel the beam entered the experimental area known as
the Meson Cave, where it then impinged upon another focusing quadrupole
magnet 0 2. This magnet also had an 8 in. aperture and two sections.
Upon leaving Q 2 the beam was momentum-analyzed by a bending magnet
M 1. The angle of deflection chosen was 36 deg, to compensate for the
momentum dispersion in the pion beam intr·oduced by the cyclotron field,
The combined effect of 02
and M 1
was to focus an image of the pion
source on the liquid hydrogen target.
Proton beam
184- inch cyclotron
Cyclotron vacuum tank wall
Liquid hydrogen f I ask ( 0.0 I o~ in. Mylar)
MUB-1213
Fig. I. Diagram of experimental arrangement for DCS measurement. ·
(
I 0' I
'' ..
-7-
Current settings for the quadrupole magnets were calculated by
an IBM 6 50 program called DIPOLE. The current in the bending magnet
M1
was accurately determined by the suspended-wire technique, which
was also used to check the currents in Q2
. Fine tuning of the focusing
magnets was done with the pion beam and the beam profile counters de
scribed below,
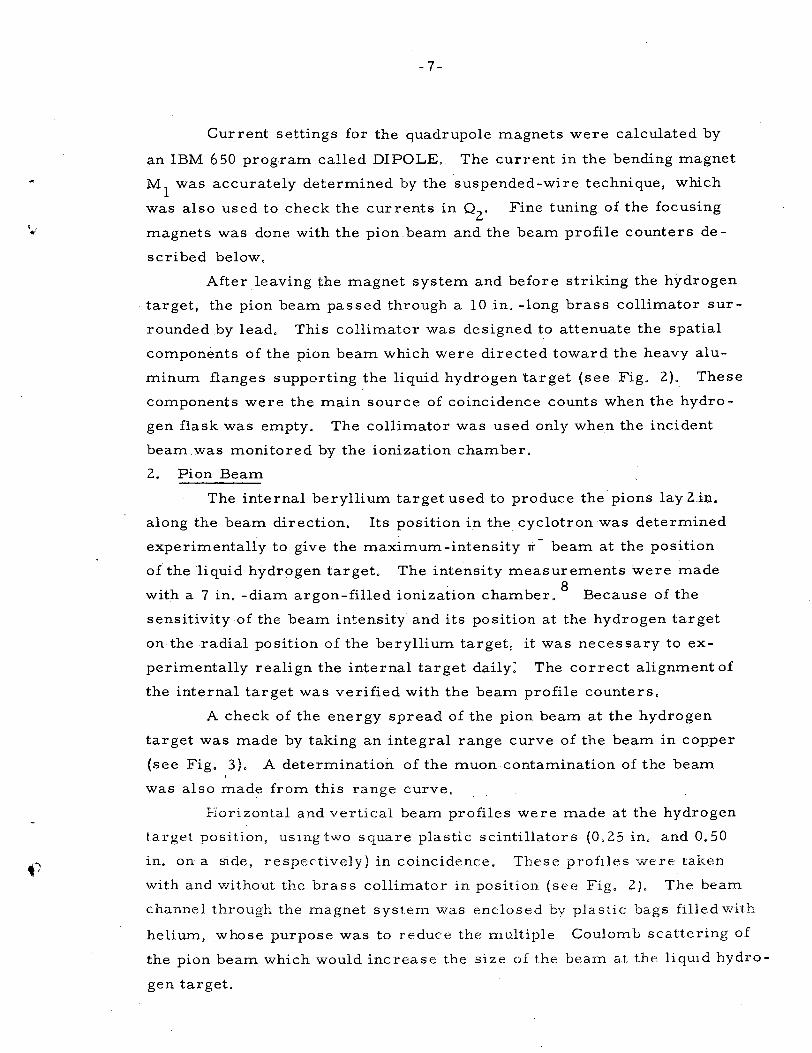
After leaving the magnet system and before striking the hydrogen
target, the pion beam passed through a 10 in. -long brass collimator sur
rounded by lead, This collimator was designed to attenuate the spatial
components of the pion beam which were directed toward the heavy alu
minum flanges supporting the liquid hydrogen target (see Fig. 2). These
components were the main source of coincidence counts when the hydro
gen flask was empty. The collimator was used only when the incident
beam was monitored by the ionization chamber,
2. Pion Beam
The internal beryllium target used to produce the pions lay Zi.n.
along the beam direction, Its position in the cyclotron was determined
experimentally to give the maximum-intensity Ti" beam at the position
of the liquid hydrogen target. The intensity measurements were made
with a 7 in, -diam argon-filled ionization chamber. 8
Because of the
sensitivity of the beam intensity and its position at the hydrogen tar get
on the radial position of the beryllium target, it was necessary to ex
perimentally realign the internal target daily; The correct alignment of
the internal target was verified with the beam profile counters,
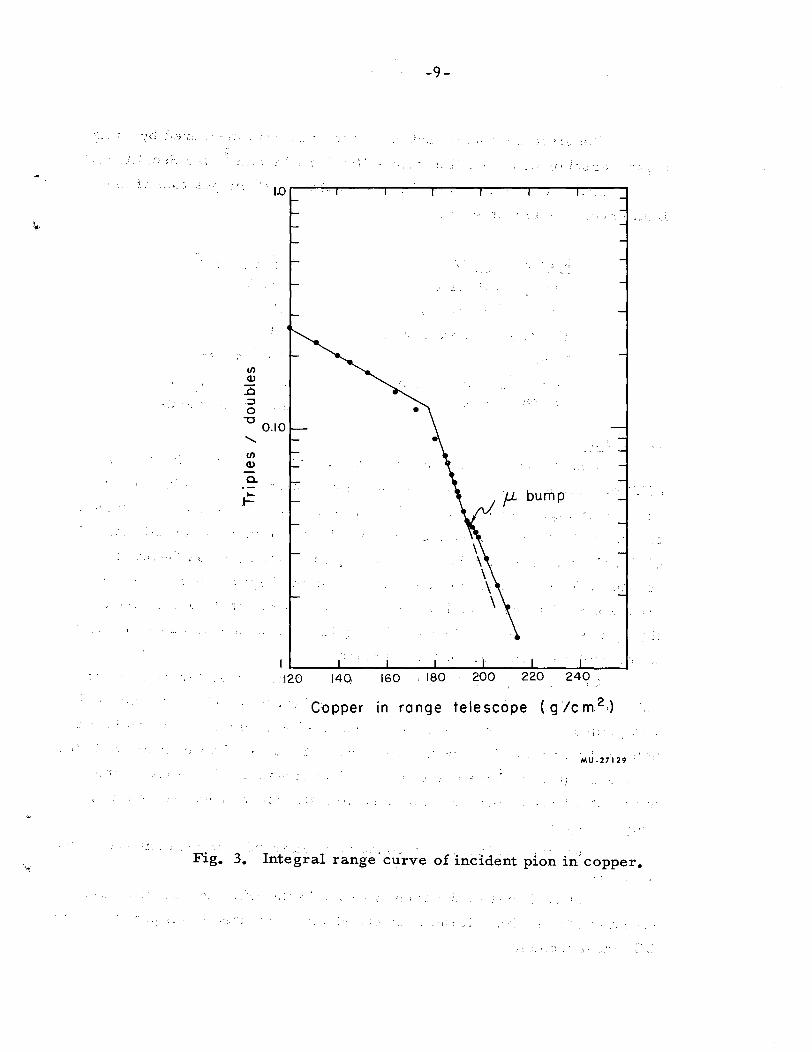
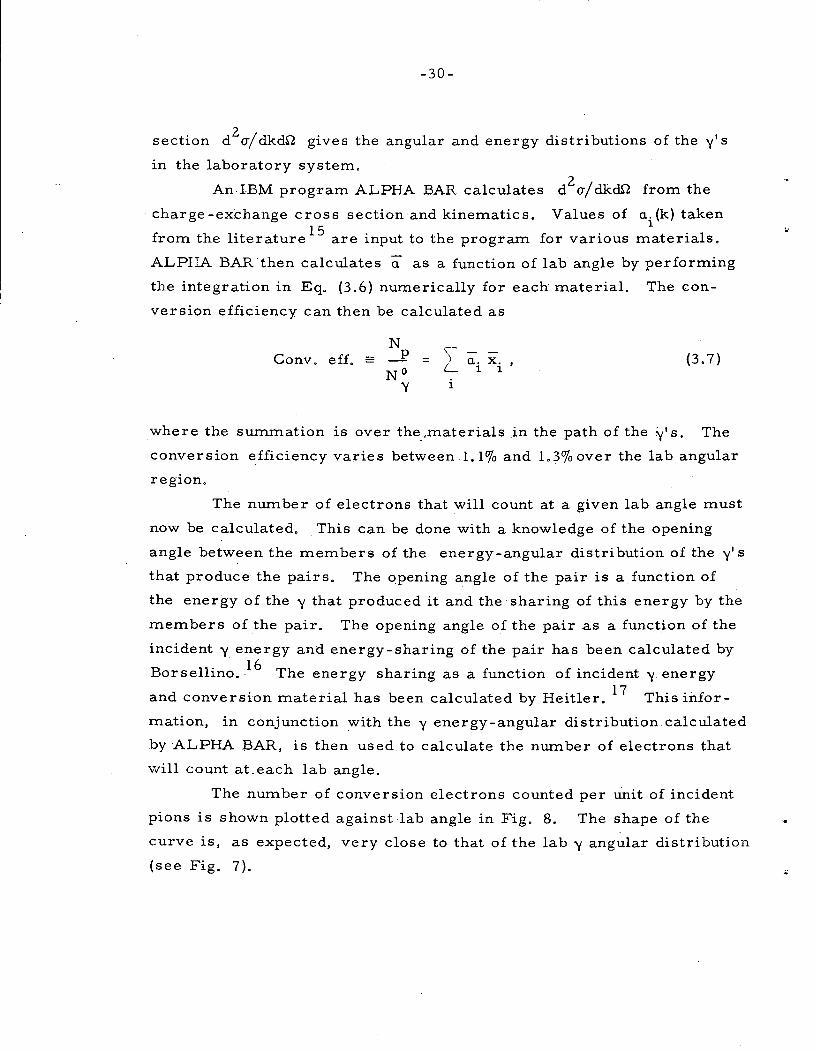
A check of the energy spread of the pion beam at the hydrogen
target was made by taking an integral range curve of the beam in copper
(see Fig. 3 ). A determination of the muon contamination of the beam
was also made from this range curve,
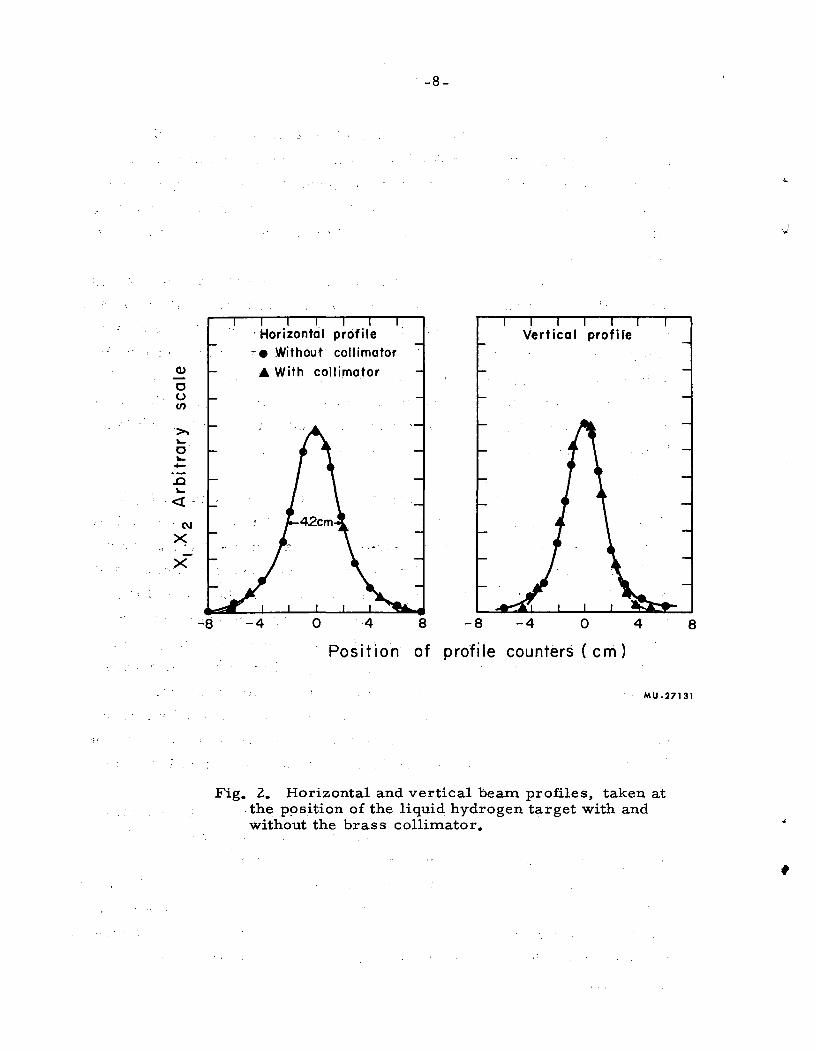
Horizontal and vertical beam profiles were made at the hydrogen
target position, using two square plastic scintillators (0, 25 in, and 0, 50
in, on a side, respectively) in coincidence, These profiles were taken
with and without the brass collimator in position (see Fig. 2). The beam
channel through the magnet system was enclosed by plastic bags filled with
helium, whose purpose was to reduce the multiple Coulomb scattering of
the pion beam which would increase the size of the beam at the liqmd hydro
gen target.
Q)
0 0 (/)
..c '-
<(
·N
><;
.X
·Horizontal profile _,. • Without collimator
6 With collimator
..;a· --4 0 4
-8-
vertical profile
8 -8 -4 0
Position of profile counters (em)
4 8
MU-27131
Fig. z. Horizontal and vertical beam profiles, takeri at . the position of the liquid hydrogen target with and without the brass collimator.
I
'"
,
:-~- . ;_ ; .
(/)
Cl.l
' (/) Cl.l
a. ....
. 1-:-
-9-
:· ' ; ·. '-~
·;' t
140, 160 180
Copper in range telescope (g/cm 2 ,)
MU-27129
Fig. 3. Integral range curve of incident pion in; copper.
-10-
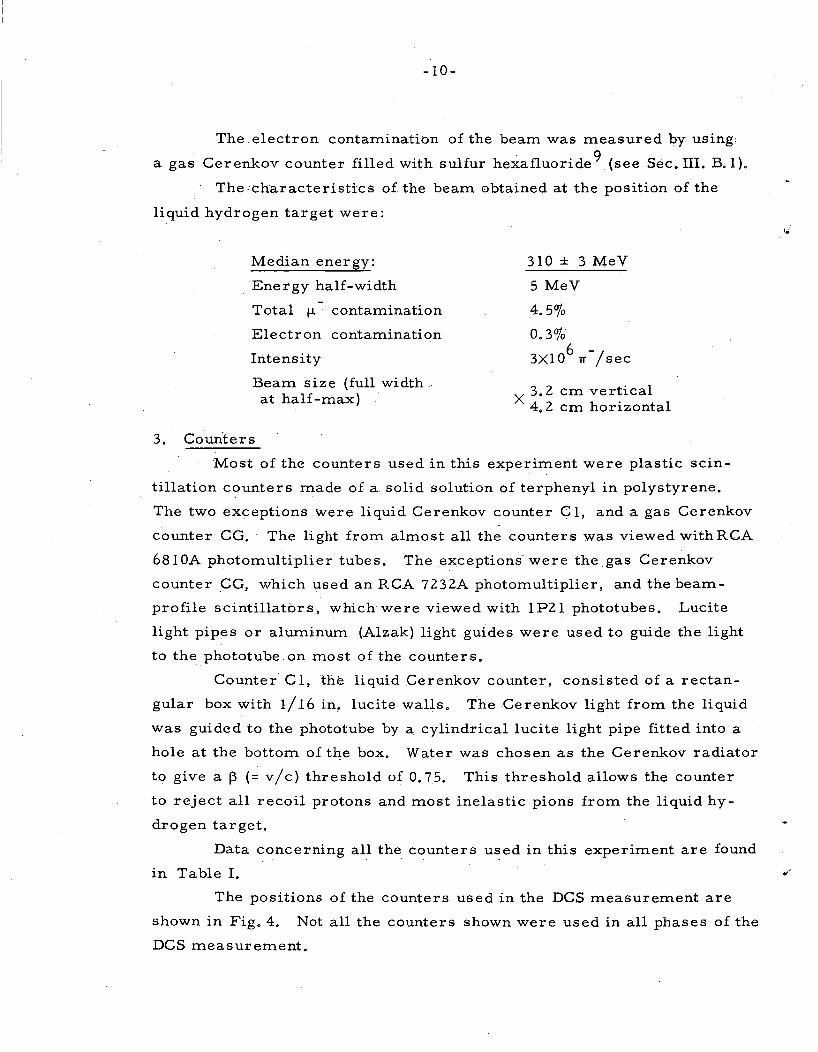
The electron contamination of the beam was measured by using
a gas Cerenkov counter filled with sulfur hexafluoride 9 (see Sec. III. B.l).
The:characteristics of the beam obtained at the position of the
liquid hydrogen target were:
Median energy:
Energy half-width
Total f-L contamination
Electron contamination
Intensity
Beam size (full width at half-max)
3. Counters
310 ± 3 MeV
5 MeV
4.5%
0.3% 6 -; 3Xl 0 1T sec
X 3. 2 em vertical 4. 2 em horizontal
Most of the counters used in this experiment were plastic scin
tillation counters made of a solid solution of terphenyl in polystyrene.
The two exceptions were liquid Cerenkov counter C 1, and a gas Cerenkov
counter CG. The light from almost all the counters .was viewed with RCA
681 OA photomultiplier tubes. The exceptions- were the gas Cerenkov
counter 9G, which used an RCA 7232A photomultiplier, and the beam
profile scintillators, which were viewed with 1 P21 phototubes. Lucite
light pipes or aluminum (Alzak) light guides were used to guide the light
to the phototube on most of the counters.
Counter Cl, the liquid Cerenkov counter, consisted of a rectan
gular box with 1/16 in. lucite walls. The Cerenkov light from the liquid
was guided to the phototube by a cylindrical lucite light pipe fitted into a
hole at the bottom of the box. Water was chosen as the Cerenkov radiator
to give a 13 (= v/c) threshold of 0. 75. This threshold allows the counter
to reject all recoil protons and most inelastic pions from the liquid hy
drogen target.
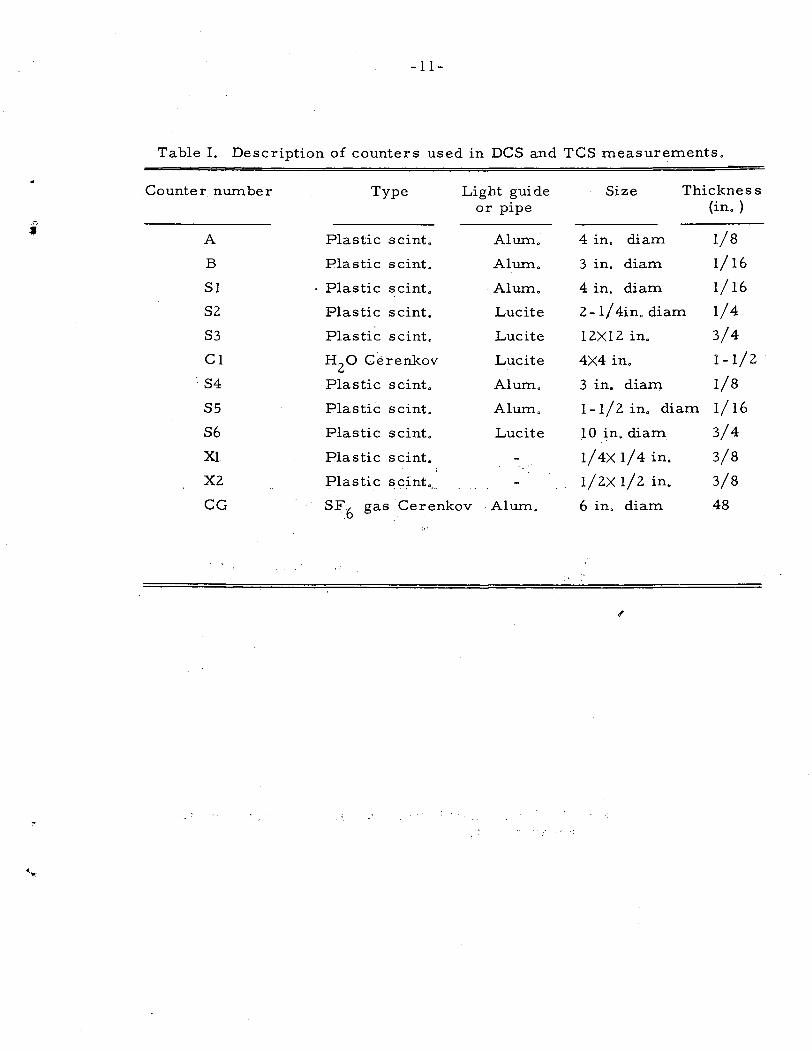
Data concerning all the counters used in this experiment are found
in Table I. "'<
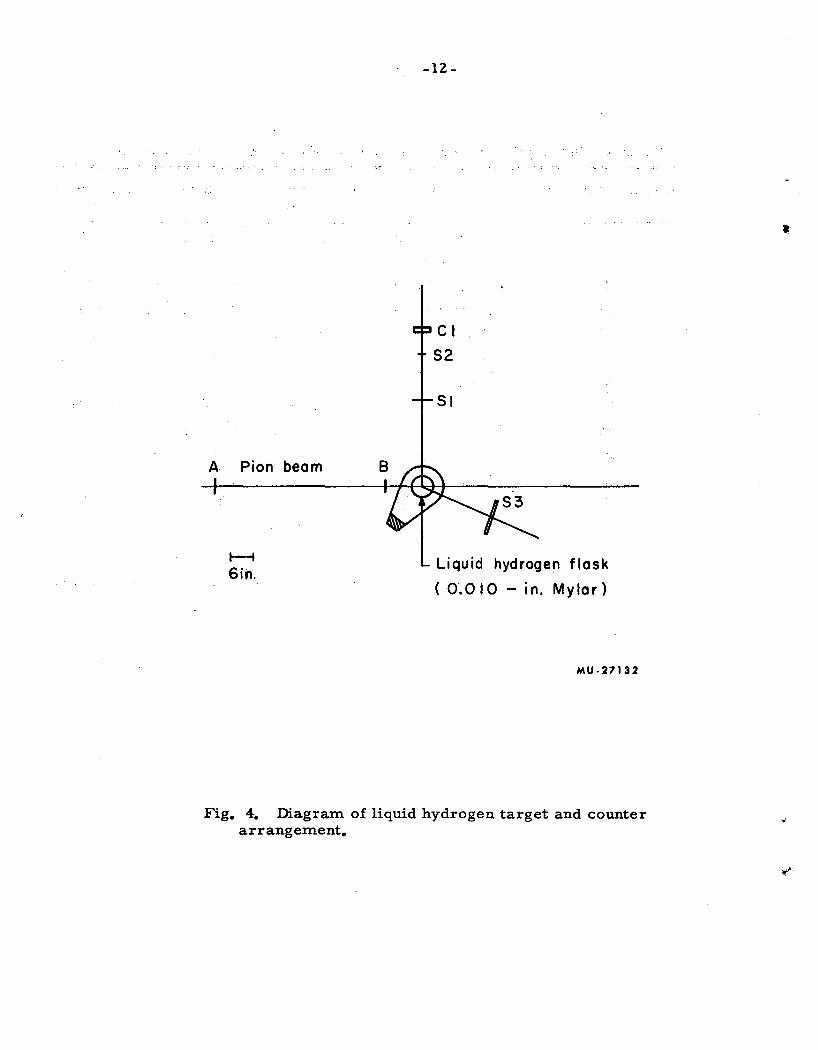
The positions of the counters used in the DCS measurement are
shown in Fig. 4. Not all the counters shown were used in all phases of the
DCS measurement.
-11-
Table I. Description of counters used in DCS and TCS measurements.
Counter number Type Light guide Size Thickness or pipe (in. )
,.-;'"",..
s A Plastic scint. Alum. 4 in. diam 1/8
B Plastic scint. Alum. 3 in, diam I/ 16
Sl Plastic scint. Alum. 4 in, diam I/ 16
S2 Plastic scint, Lucite 2-l/4in. diam I/4
S3 Plastic scint. Lucite 12Xl2 in. 3/4
CI H2o Cerenkov Lucite 4X4 in. 1-1/2
S4 Plastic scint. Alum. 3 in, diam I/8
S5 Plastic scint. Alum, 1-1/2 in. diam I/ 16
S6 Plastic scint. Lucite 10 in. diam 3/4
Xl Plastic scint. l/4X1/4in. 3/8
X2 Plastic scint ... 1/2X 1/2 in. 3/8
CG SF6
gas Cerenkov Alum. 6 in, diam 48
.•
A Pion beam
t--1 6in.
-12-
Liquid hydrogen flask
( 0.010- in. Mylar)
MU -27132
Fig. 4. Diagram of liquid hydrogen target and counter arrangement.
·,,j
-13-
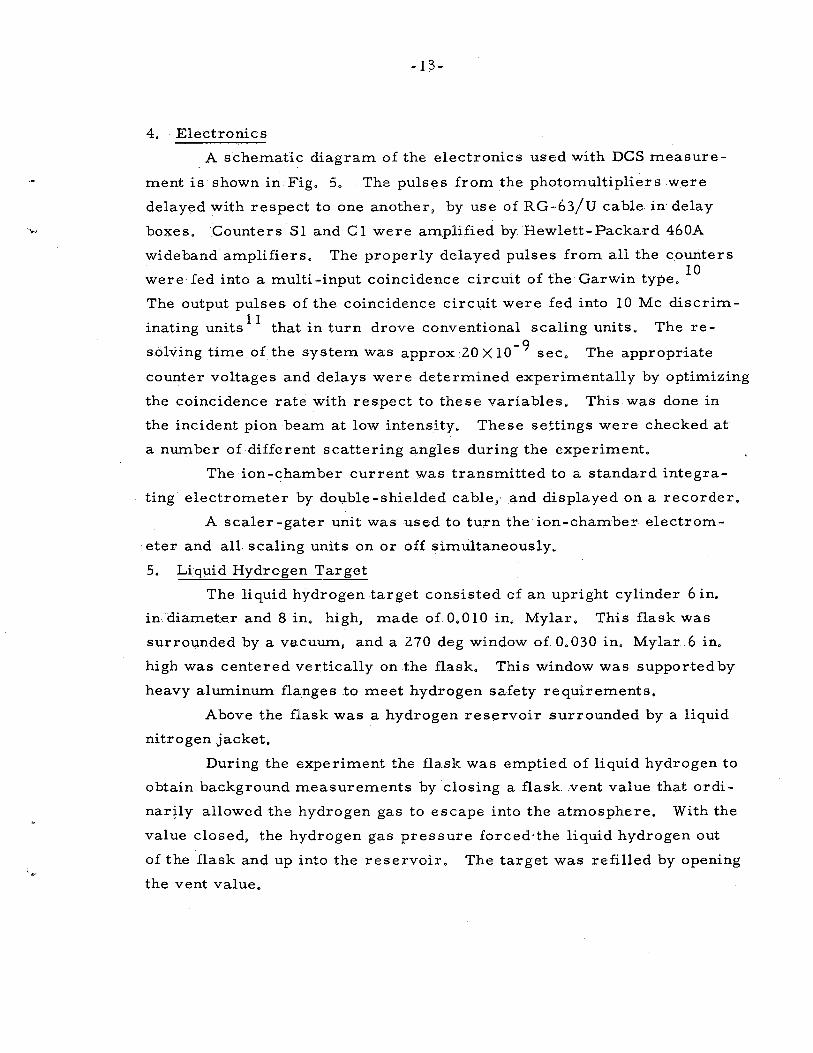
4. Electronics
A schematic diagram of the electronics used with DCS measure
ment is shown in Fig. 5. The pulses from the photomultipliers were
delayed with respect to one another, by use of RG-63/U cable in delay
boxes. Counters Sl and CI were amplified by Hewlett-Packard 460A
wide band amplifiers. The properly delayed pulses from all the counters
were fed into a multi-input coincidence circuit of the Garwin type. 10
The output pulses of the coincidence circuit were fed into 10 Me discrim
inating units 11 that in turn drove conventional scaling units. The re
solving time of the system was approx 20 X 10-9 sec. The appropriate
counter voltages and delays were determined experimentally by optimizing
the coincidence rate with respect to these variables. This was done in
the incident pion beam at low intensity. These settings were checked at
a number of different scattering angles during the experiment.
The ion-chamber current .was transmitted to a standard integra
ting electrometer by double -shielded cable,- .and displayed on a recorder.
A scaler-gater unit was used to turn the ion-chamber electrom
eter and all scaling units on or off simultaneously.
5. Liquid Hydrogen Target
The liquid hydrogen target consisted of an upright cylinder 6 in.
in-, diameter and 8 in. high, made of 0. 010 in. Mylar. This flask was
surrounded by a vacuum, and a 270 deg window of 0.030 in. Mylar 6 in,
high was centered vertically on the flask. This window was supported by
heavy aluminum flanges to meet hydrogen safety requirements.
Above the flask was a hydrogen reservoir surrounded by a liquid
nitrogen jacket.
During the experiment the flask was emptied of liquid hydrogen to
obtain background measurements by closing a flask vent value that ordi
nartJy allowed the hydrogen gas to escape into the atmosphere. With the
value closed, the hydrogen gas pressure forced·the liquid hydrogen out
of the flask and up into the reservoir. The target was refilled by opening
the vent value,
-16-
At three of these energies integral range curves were taken of
the incident beam, both to check its energy and to determine the muon
contamination of the beam. Values of muon contaminations at other
energies were interpolated from a curve of the three points obtained by
the range curve.
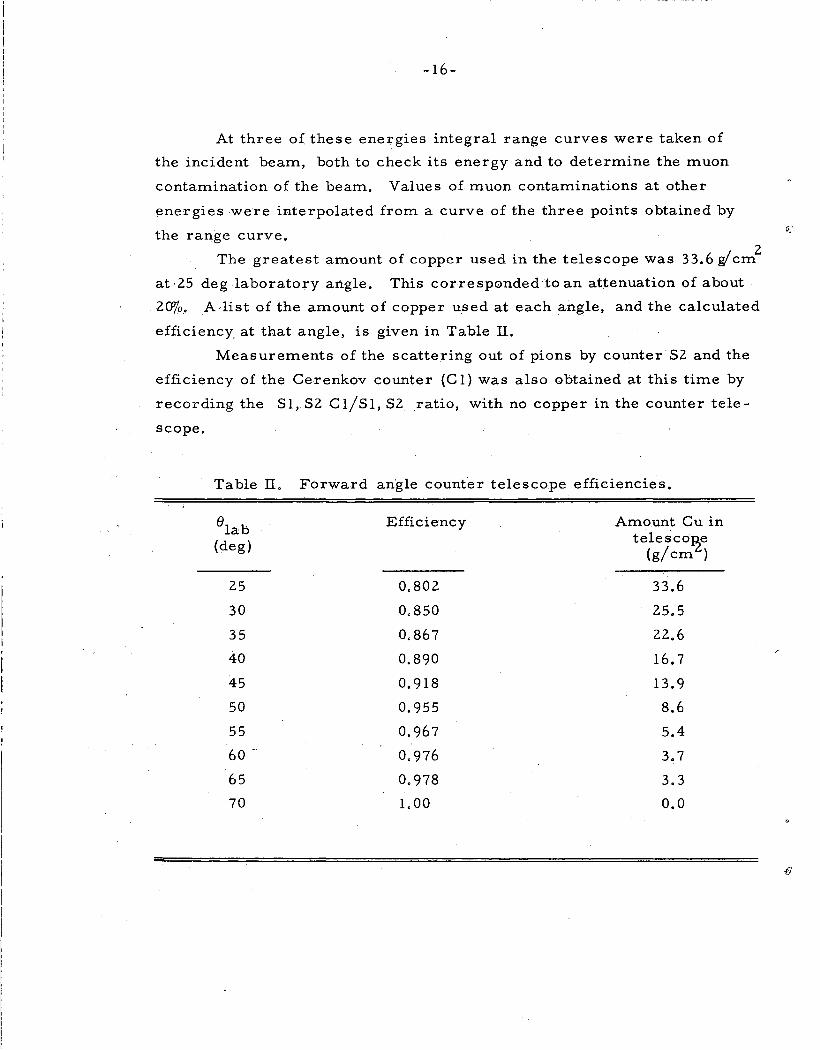
The greatest amount of copper used in the telescope was 33.6 gl cd at ·25 deg laboratory angle. This correspGnded to an attenuation of about
.Z<J'l'o. A list of the amount of copper used at each angle, and the calculated
efficiency at that angle, is given in Table II.
Measurements of the scattering out of pions by counter S2 and the
efficiency of the Cerenkov counter (C 1) was also Gbtained at this time by
recording the Sl, S2 C1/S1, S2 ratio, with no copper in the counter tele
scope.
Table II. Forward angle counter telescope efficiencies.
8lab
(de g)
25
30
35
40
45
50
55
60-
65
70
Efficiency
0.802
0,850
0,867
0.890
o. 918
0.955
0.967
0.976
0, 978
1.00
Amount Cu in telesco~e
(g/ em )
33.6
25.5
22.6
16.7
13.9
8.6
5.4
3.7
3.3
0.0
{)
-17-
C. Experimental Procedure
1.. Accidentals and Background
Accidentals in the counter telescope were measured in the usual
manner. Each counter in the telescope was delayed in turn, with respect
to the remaining counters, by 54X 10-9 sec (the time difference between
two successive cyclotron rf pulses). The accidental coincidence rate of
the telescope was found to be < 0. I o/o of the true counting rate at all angles,
and hence negligible.
The most important source of background comes from the scatter
ing of pions in the walls o.f the hydrogen-containing flask and surrounding
materiaL This background can be measured by emptying the flask of
hydrogen and measuring the target-empty rate. This rate varied over
different scattering angles from approx 25 to 50o/o of the target-full rate.
A more difficult form of background to measure. is a contamination
by electrons (the term electrons is used throughout this paper to mean
both positrons and negative electrons unless otherwise noted) in the scat
tered pion beam. These electrons result because the production of neutral
pions in the charge-exchange reactio:q. (2.1) takes place in the liquid hydro
gen. The subsequent decay of the 1T 0 produces the electrons
1T +p-+ 1T o + n; ( 2. l)
1T o ... 'Y + '(, (2.2)
or
1To ... y + e + + e . (2.3)
The electron background arises from the two decay modes of the
1T0 indicated above (2. 2, 2. 3 ). In the first (2. 2), the two gammas may
interact with the hydrogen and surrounding materials to produce electron
positron pairs. The counter telescope cannot distinguish between an elec
tron and an elastically scattered pion. In the second decay mode (2. 3 ), the
e + + e- pair is produced directly in the 1r0 decay (Dalitz pair). 12
· A detailed discussion of the magnitude of this background as a func
tion of scattering angle is found in Sec. III. A. L
-18-
It was possible to make some experimental checks on the cal
culations of electron contamination described in Sec. III. A. I. These
are described below.
The first source of background is due to the conversion of y rays
in the target and surrounding material, and is therefore proportional to
the amount of material between the scattering point and the counter tele-'
scope. Approximately Io/o of the yv s coming from the target are con
verted into pairs by this material.
The calculations on contamination were checked by increasing the
amount of converting material between the target and counter telescope. 2 .
From one to five 0,15-g/cm sheets of Cu were placed next to the target,
and the counting rates in the counter telescope obtained for each case
with the liquid hydrogen target both full and empty. Each of these copper
sheets converted roughly the same number of y' s from the charge-exchange
reaction as did the target without copper.
The "effective target thickness" of the copper as a function of scat
tering angle was computed· by IBM 704 program ALPHA BAR. The data
points with copper, as well as one without, obtained by subtracting target
empty from. target-full data, were then plotted against effective target
thickness, and a least-squares fit of a straight line was made. The dif
ference in rates between "zero target thickness'' and "one target thickness''
gave the conversion-electron contamination. A total of six angles were
checked in this way. Because this effect is relatively small, the uncer
tainty in measured values of this background owing to counting statistics
is believed larger than that obtainable from a careful calculation of this
effect. This calculation as made is described in Section III. A. I. It gives
an electron contamination for the elastically scattered pion beam of about
So/o at most angles.
Values obtained from the measurements are 1n statistical agree
ment with the calculation.
The second source of background is the Dalitz pairs. A calculation
method for this contamination is also discussed in Sec. III. A. I. No direct
measurement of the contamination was made, but a .check on the total back
ground due to charge-exchange scattering can be obtained by putting a
-19-
conjugate counter in coincidence with the counter telescope. This
counter (S3) was placed at an appropriate angle on the other side of the
. target to record the proton conjugate to the elastically scattered pions . : , ' -. '.
counted in the counter telescope. Essentially, -none of the electrons can
duplicate thi.s coincidence between the conjugate counter and counter tele
scope; hence, a comparison of rates with and without the conjugate
counter in coincidence can give the coritamination at those angles where
such a measurement can be made.
Unfortunately, the angles at which the measurements can be made
(approximately 90 to 100 deg pion lab scattering angle) are severely
limited by two considerations, If the conjugate proton counter is moved
closer to zero deg (larger pion scattering angles) it will intercept the
incident pion beam and be jammed by it. If, on the other hand, the con
jugate counter is moved to larger angles (forward pion scattering angles)
the protons will have barely enough energy to get out of the target, and
if they do, they will be badly multiply scattered. Even at the angles
measured (90 and 100 deg lab pion scattering angle) the correction that
must be· made for the multiple scattering of the protons introduced in the
value of the cross section an uncertainty larger than the statistical count
ing error of about 2o/o. For this reason, this method serves only as a
rough check on the total electron background. The values obtained above
are in agreement with the calculation described in Sec. IlL A. L
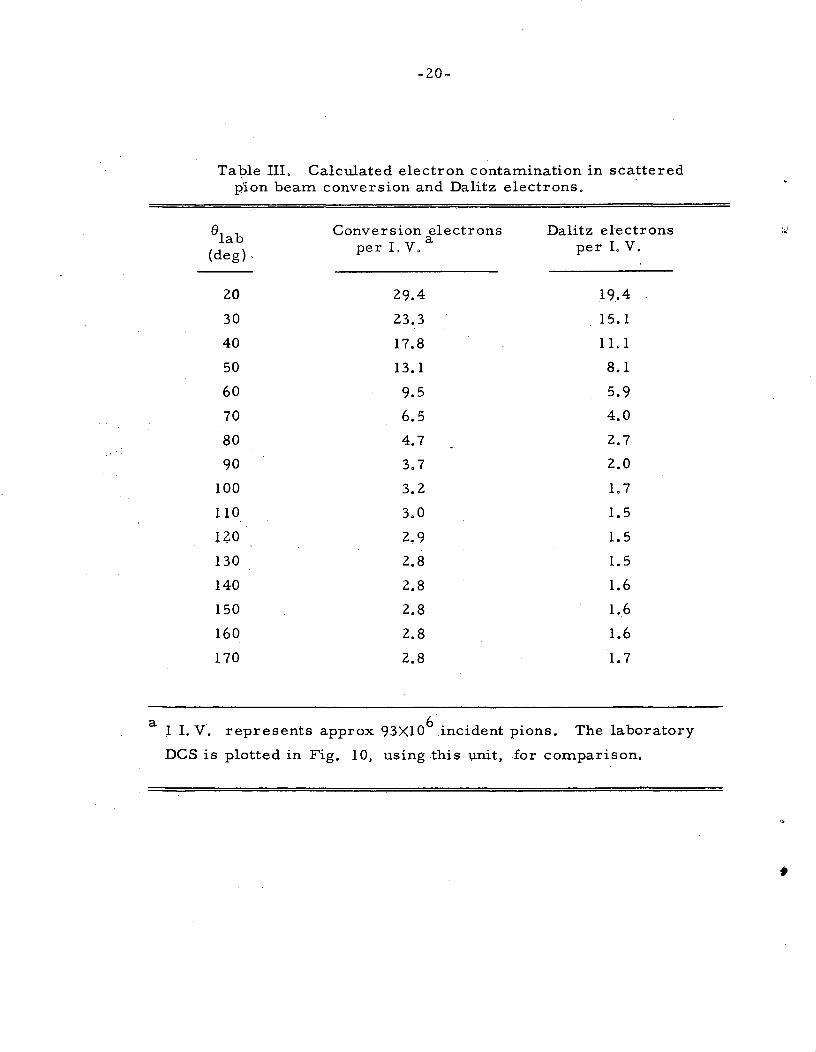
·The calculated values of the electron contamination corrections as
a function of scattering angle are given in Table III.
2. Cross -Section Measurement
Data for the' cross-section measurement were taken at 28 lab
scattering angles from 25 to 160 deg in 5--deg steps, and were taken in
cycles of hydrogen target full and empty"-. Generally speaking, several
such cycles were observed and then the counter telescope was moved to
a different angle.
The counting rates with the target full varied from approximately
30 counts/ sec at the forward pion scattering angles to approximately 1
count/ sec in the background angular region.
-20-
Table III. Calculated electron contamination in scattered pion beam conversion and Dalitz electrons.
8lab Conversion electrons Dalitz electrons
a per I. V. (deg). per LV,
20 29.4 19.4
30 23.3 15. 1
40 17.8 11.1
50 13.1 8.1
60 9.5 5.9
70 6.5 4.0
80 4.7 2.7
90 3.7 2.0
100 3.2 1.7
110 3.0 1.5
120 2.9 1.5
130 2.8 1.5
140 2.8 1.6
150 2.8 1.6
160 2.8 1.6
170 2.8 1.7
a I I. V. represents approx 93X106 incident pions. The laboratory
DCS is plotted in Fig. 10, using this unit, for comparison.
~~
..
•
'
-21-
At several angles, voltage plateaus of all counters were checked.
The accidentals mentioned previously were checked with target full and
empty and found to be negligible at all angles. Data were taken at sev
eral angles with the counter telescope at varying distances from the tar
get, thus giving a solid angle other than the "normal" one. The value of
the cross section obtained in this way was in agreement with the value
with data taken at the "normal" solid angle. Data taken ·at full beam
level were checked at lower beam levels throughout the duration of the
experiment and found to be independent of beam leveL
3. Simultaneous Experiment
While this experiment was being carried out on one s.ide of the
hydrogen target, an experiment for measuring the polarization of the
re.coil proton in the 'IT- -p scattering process was being carried out on
the side of the target. 4
In order to avoid possible changes in background
level, all data cycles were taken during periods when no changes were
being made in the polarization experiment.
Approximately halfway· through the experiment, the DCS exper
imental setup and the polarization setup were exchanged.
D. Normalization Measurement
. A pion beam of intensity greater than 106 pions/sec was necessary
to achieve the accuracy desired in the DCS measurement. Such an intense
beam cannot be counted by scintillation counters because counting losses
are prohibitive with the usual cyclotron duty cycle and present ITl}lSeC
resolving times of coincidence circuitry. Therefore the DCS data were
taken while the incident pion b_eam. was being monitored with an ionization
chamber.
It was felt, however, that is accurate measurements of the DCS
could be made at a few angles while monitoring the incident beam with
counters, this would make for a more accurate determin.ation of the over-·
all normalization of the DCS than with the ionization chamber alone.
-22-
Such a measurement became feasible with the completion of the
auxiliary dee of the Berkeley 184 inch cyclotron, which increases the
duty cycle by roughly a factor of 25 and inturn allows much higher
counting rates in beam counters with negligible counting losses.
L Experimental Arrangement
No changes were made in the beam or target during the normal
ization run. The ionization chamber was replaced by counters A and B
as shown in Fig. 4. The dimensions of the counters are given in Table I.
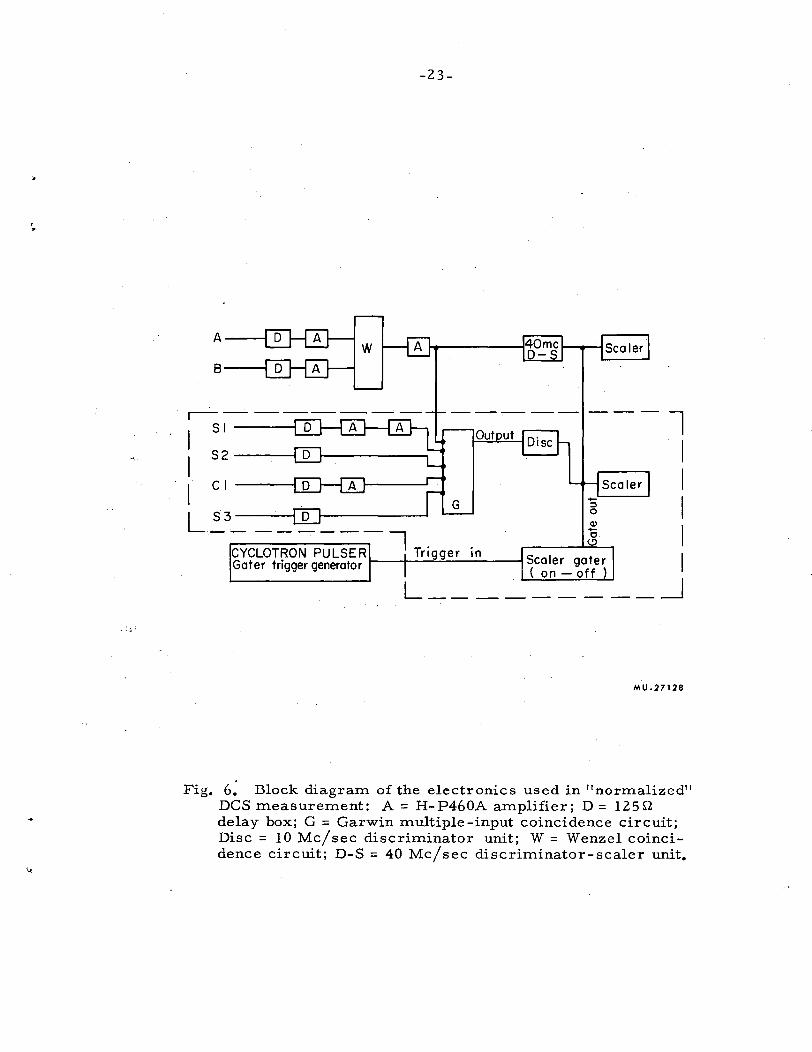
The electronics schematic is shown in Fig. 6, the block shown
within the dashed line being essentially the same as in Fig. 5. The sig
nals from counters A and B were delayed with respect to the counter
telescope and amplified. They were then fed into a Wenzel-type coin
cidence 13
with an 8Xl0- 9 sec resolving time. The output of the coinci
dence circuit was amplified and then split, half the signal driving a
40-Mc discriminator-scaler unit, and the other half being put into coin
cidence with the counter telescope in the Garwin-type coincidence cir
cuit. 10
The output of this circuit was fed into a 10-Mc discriminator
unit, ll which in turn fed uniform pulses to the 10-Mc scaler units.
2. Experimental Procedure
In the ·normal operation of the cyclotron the main pion beam ex
hibits a structure in time which reflects the accelerating characteristics
of the 184 inch cyclotron. The repetition rate of 64 accelerations per
second gives 64 groups of pions per second, each of which is composed
of fine-structure pulses having a width of about 5Xl0- 9 sec and equally
spaced at 52Xl0- 9 sec. This spacing corresponds to a final rf accel
erating frequency of 19.2 Me/ sec. The duration of the coarse groups is
about 300 IJ.Sec, and this time is equally filled with beam, thus containing 5
about 3. 6Xl 0 rf pulses per second. Since pions in the same rf pulse
cannot be resolved electronically, it is impossible to count more than
about 4Xl04
pions/sec, with counting losses < 1% with counters situated
in this beam.
However, when the cyclotron is operated with the auxiliary dee,
the 64 bunches of pions per sec can be spread out in time over a period of
8 msec each, rather than the 3001J.sec period under "normal" operation.
•
' .
'J'•
A---1
S2 ----l
Cl
-23-
---l I I
L S3 D 2 I ·- ~C~T-;O;;P~L~R~=-~-+_Ti_r-=ig'""'g'-e_r_in __ -t Scaler ga~r II
Gater trigger generator ( on- off ) L ____ · _____ _j
MU-27128
Fig. 6. Block diagram of the electronics used in ''normalized" DCS measurement: A= H-P460A amplifier; D = 125Q delay box; G = Garwin multiple-input coincidence circuit; Disc= 10 Me/sec discriminator unit; W = Wenzel coincidence circuit; D-S = 40 Me/sec discriminator-scaler unit.
-24-
However, it was found that about 40o/o of the beam in the 8-msec period
was located in a 200 -jJ.sec "spike" ~t the beginning of the period. The
remaining 60o/o of the beam was equally spaced in the remaining time
interval. It was necessary to gate the scalers off for the duration of
this spike for each of the 64 bunches of pions per sec.
With the new 11 stretched" beam we have about 8Xl0 6 rf pulses/ sec,
which will allow counting rates of about 106 pions/sec with small counting
losses, We were then able to obtain accurate measurements (2o/o to 3o/o
counting statistics) of several DCS points in a reasonable length of time,
by monitoring the beam with counters,
During the experimental run the counting rate in beam counters
was varied from about 1 to 3Xl05
pions/sec, The beam time character
istics and the scaler gating were continuously displayed on a dual-beam
oscilloscope, Periodic checks of counting losses were made by delaying
counter A with respect to counter B by 52Xl0- 9 sec, The counting losses
were always .:::; 0.1 o/o of the counting rate, Cross -section measurements
were n1ade with the counter telescope at three lab scatterihg angles of
50, 90 and 145 deg.
Ea~h cycle consisted of a target-full and target-empty run, and
a run on both a full and empty target with the beam counters delayed by -9 52Xl0 sec with respect to the counter telescope. This coincidence
rate measured the accidental rate between the telescope and beam coun
ters, A correction to the data was made for this accidental rate, which
was less than 2o/o of the normal counting rate at all angles._
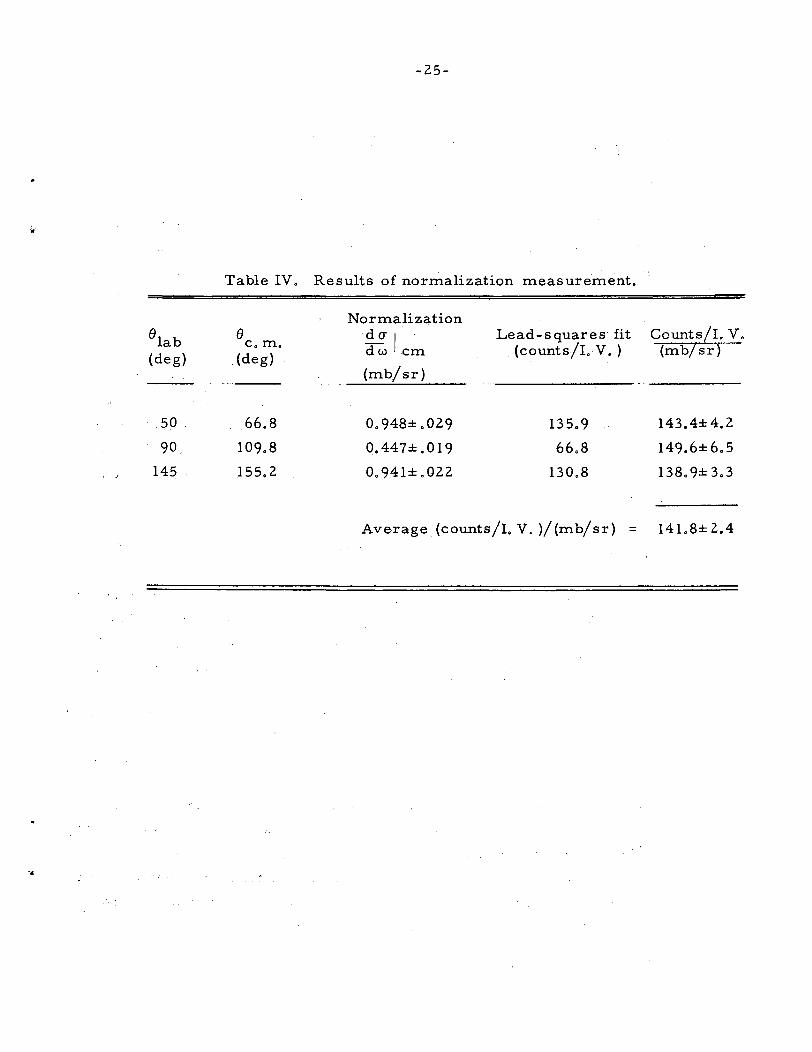
A list of cross-section data obtained in this normalization run is
given in Table IV,
-Z5-
Table IV. Results of normalization measure'ment.
Normalization 8lab e daJ Lead-squares· fit Counts I. V.
c. m. dw em (counts/I. V. ) (mb sr) (de g) (de g)
(mb/ sr)
50 ' 66.8 0.948±.0Z9 135.9 143.4± 4. z 90 109.8 0.447± .o 19 66.8 149.6±6.5
145 ' 155. z 0.941±.0ZZ 130.8 138.9±3.3
Average (counts/I. V. )/ (mb/ sr) = 141.8± Z.4
...
-26-
IlL DCS RESULTS
A. Corrections to Data
A number of corrections must be made to the raw data before a
DCS can be extracted from it. One purpose of this experiment was to
keep these corrections as small as possible, consistent with perform
ing the polarization measurements (described in Sec. IL C.3) at the
same time. A description of these corrections is given below.
1. Electron Contamination in the Scattered Pion Beam
As mentioned in Sec. II. C. 1, decay of the neutral pion produced
by charge-exchange scattering in the hydrogen target gives rise to an
electron contamination of the scattered pion beam which is counted in
the counter telescope. This contamination results from two different
decay modes of the 1r0
• This main decay mode, which occurs approx
imately 99 o/o of the time, is
lTO - '( + '( • (3. 1)
Thes~ '( 1 s produce e + + e pairs by interacting with the material
between the point of their production and the counter telescope. Either
member of this pair may count in the telescope. For convenience, the
electrons a;rising from this mode of decay are here called conversion
electrons.
A rarer decay mode of the lT 0 is the production of a Dalitz pair, 12
1r0
- '( + e + + e . (3.2)
In this case too, either member of the Dalitz pair may count in the
telescope. Again for convenience, the electrons arising from this decay
mode are called Dalitz electrons in this paper.
A calculation of these electron contaminations has been made and
the data corrected for them. The: c'alCulation for both the conversion
and Dalitz electron contaminations is described below.
-27-
a. Conversion-Electron Contamination. In order to calculate
the number of conversion electrons counting in the counter telescope
as a function of lab scattering angle, three major pieces of information
must be obtained by experiment or calculation. These are:
(a) They-ray distribution from the charge-exchange reaction at 310
MeV,
(b) The conversion efficiency for these y' s, of the material between
the scattering center and the counter telescope at all angles, and
(c) The number of those e± produced that will count in the counter tele
scope.
The information on the y distribution can be obtained from a meas
urement of the charge-exchange cross section. Such a measurement has 5
been carried out near 310 MeV by Caris at 317 MeV incident 'IT energy, 6
and by Zinov and Korenchenko at an incident energy of 307 MeV. The
t-vvo experiments 2.re essentially in agreement. The y distribution can
be obtained from the charge-·exchange DCS in a familiar way. 6
The coefficient fit used for the y distribution in the c. m. system
was that measured by Caris :5
d<r ___:t = dw
2
L 1=0
(3.3)
where the P 11 s are the Legendre polynomials, and the b' s are given by
b = 2.80 ± o. 12, 0
b1 = 2. 93 ± 0.16, and
b2 = L78 ± o. 19.
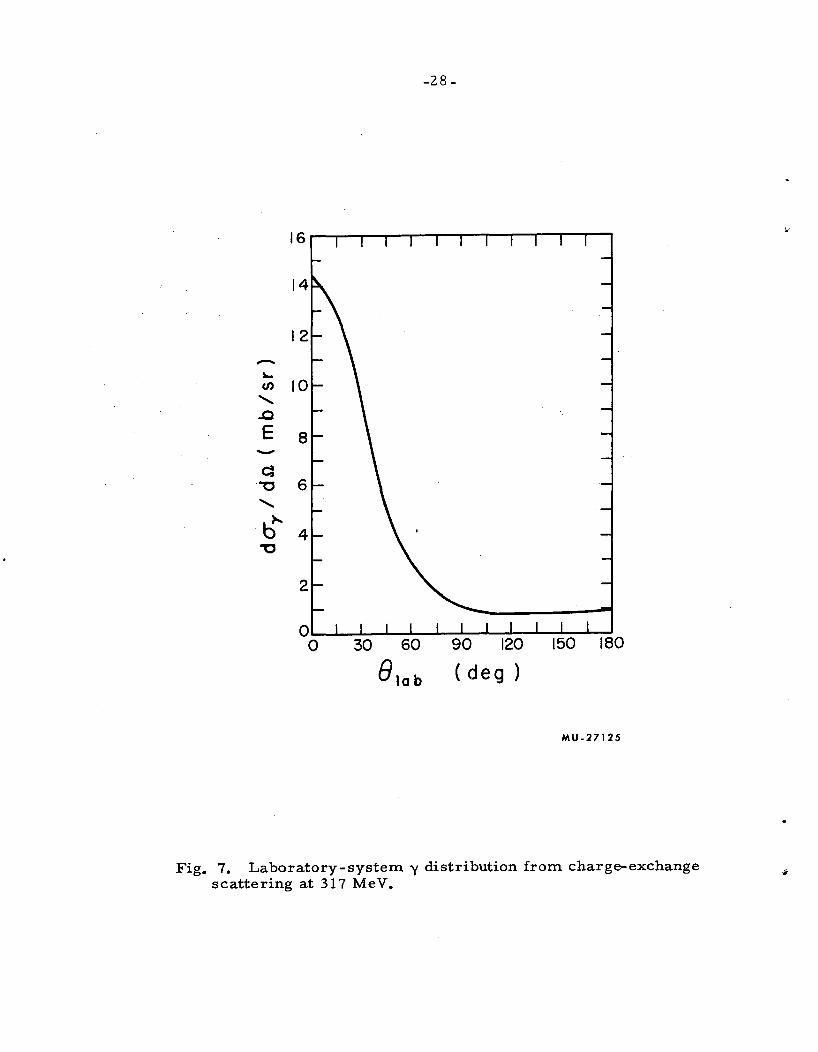
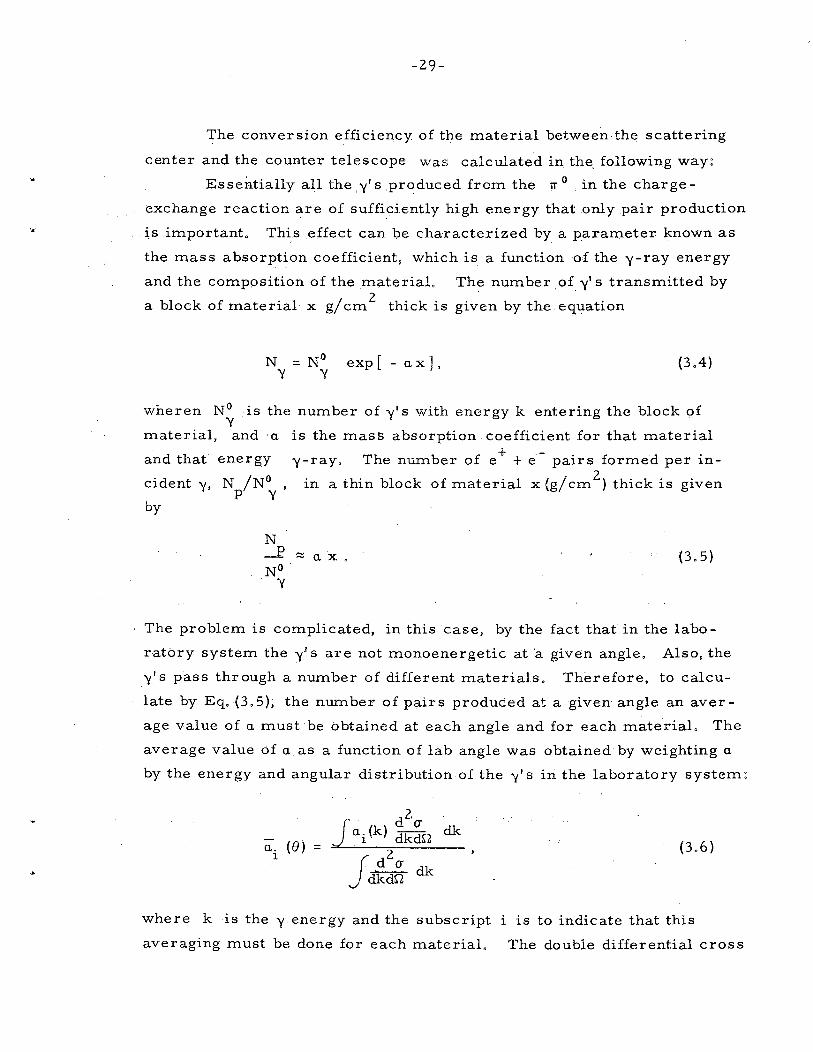
This y distribution was transformed into the laboratory system;
it is shown in Fig. 7.
-
-
30 60
Blab
-28-
90 120
( deg )
150 180
MU-27125
Fig. 7. Laboratory-system '( distribution from charge-exchange scattering at 317 MeV.
-29-
The conversion efficiency of the material between the scattering
center and the counter telescope was calculated in the. following way:
Essentially all the ,y' s produced from the rr 0 in the charge
exchange reaction are of sufficiently high energy that only pair production
is important, This effect can be characterized by a parameter known as
the mass absorption coefficient, which is a function of the y-ray energy
and the composition of the materiaL The number .of y' s transmitted by
a block of material x g/ em 2
thick is gi~en by the equation
N = N() exp [ - ax ] , y y
(3,4)
wheren N° is the number of y' s with energy k entering the block of y
material, and ·a
and that energy
cident N /N° y, p y' by
is the mass absorption coefficient for that material
y-ray, The number of e + + e- pairs formed per in
in a thin block of material x (g/ em 2
) thick is given
ax, (3,5)
The problem is complicated, in this case, by the fact that in the labo
ratbry system the y' s are not monoenergetic at ·a given angle, Also, the
y' s pass through a number of different materials, Therefore, to calcu
late by Eq, (3, 5), the number of pairs produced at a given angle an aver
age value of a must be obtained at each angle and for each materiaL The
average value of a as a function of lab angle was obtained by weighting a
by the energy and angular distribution of the y' s in the laboratory system:
dk a. (8)
1 (3,6)
where k is the y energy and the subscript i is to indicate that this
averaging must be done for each material. The double differential cross
-30-
section d2
a/dkdQ gives the angular and energy distributions of the y's
in the laboratory system.
An IBM program ALPHA BAR calculates d2 a/ dkdQ from the
charge -exchange cross section and kinematics. Values of a. (k) taken 1
from the literature 15 are input to the program for various materials.
ALPHA BAR then calculates a as a function of lab angle by performing
the integration in Eq. (3.6) numerically for each material. The con
version efficiency can then be calculated as
N ,-Conv. eff. - _p = ) a. X.
No L 1 1 (3.7)
y 1
where the summation is over the,materials in the path of the y' s. The
conversion efficiency varies between l.lo/o and 1.3% over the lab angular
region.
The number of electrons that will count at a given lab angle must
now be calculated. This can be done with a knowledge of the opening
angle between the members of the energy-angular distribution of the y' s
that produce the pairs. The opening angle of the pair is a function of
the energy of the y that produced it and the sharing of this energy by the
members of the pair. The opening angle of the pair as a function of the
incident y energy and energy-sharing of the pair has been calculated by
Borsellino. 16
The energy sharing as a function of incident y energy
and conversion material has been calculated by Heitler. 17 This infor
mation, in conjunction with the y energy-angular distribution calculated
by ALPHA BAR, is then used to calculate the number of electrons that
will count at.each lab angle.
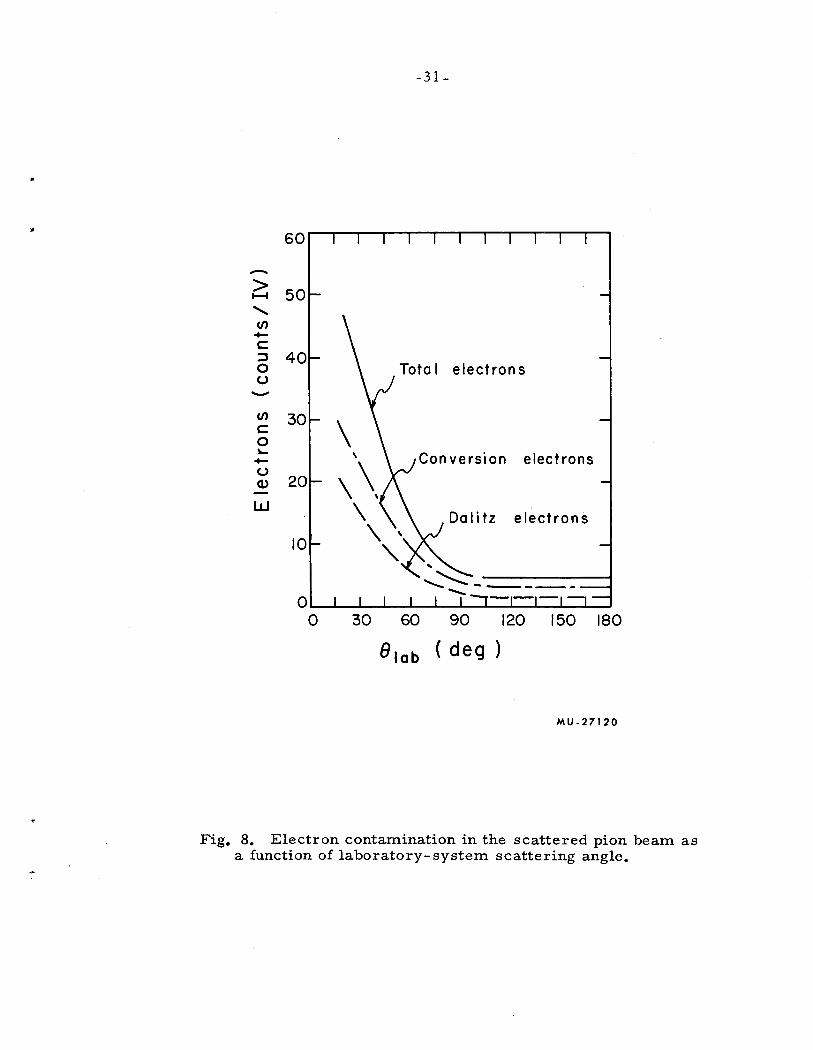
The number of conversion electrons counted per unit of incident
pions is shown plotted against lab angle in Fig. 8. The shape of the
curve is, as expected, very close to that of the lab y angular distribution
(see Fig. 7).
..
.•
..
-31-
60
-> ........ ........ (/) -c: ~ 0 Toto I electrons () -(/)
\ c: 0 ~ \ - \\, () Q)
w \ electrons \ '
" 0
0 30 60 90 120 150 180
Blab ( deg )
MU -27120
Fig. 8. Electron contamination in the scattered pion beam as a function of laboratory- system scattering angle.
-32-
b. Dalitz Electron Contamination. The calculation for the
Dalitz electrons was made in roughly the same manner as the conver
sian-electron calculation. This calculation can also be separated into
three parts:
(a) the angular distribution (lab) of the Dalitz pairs must be determined,
(b) knowledge of the branching ratio for this decay mode and the y-ray
eros s section allows a calculation of the number of e ± pairs produced,
and
(c) the fraction of the electrons that will count in the telescope must be
determined.
The angular distribution of the Dalitz pairs was assumed to be
identical to the y angular distribution. There is evidence that this is a
d . 18,19 goo assumptlon.
The brartchil}g ratio R has been accurately calculated by Josephs.18
It has also been measured by Derrick et al. 19 and the measurement is in
agreement with the theoretical value. Josephs obtained
R = 'ITo -+ Y + e + + e
'ITO-+ y + y
The differential eros s section (lab) for the pairs can then be
written as
~I pairs
do-
= -}R cit (3.8)
As in the conversion-electron case, in order to calculate the
number of Dalitz electrons that will count in the counter telescope, a
knowledge of the opening-angle distribution is needed. Once it is obtained,
a calculation of the probability of the pair contributing one or two counts
to the angular distribution can be made. The calculation is made in much
the same way as that for the conversion electron.
"
.. ,
--33-
The opening-angle distribution has been calculated by Dalitz 12
and experimentally verified by Derrick et al. 19 · After a transformation
to the laboratory system, this distribution can be used to make the de
sired calculation.
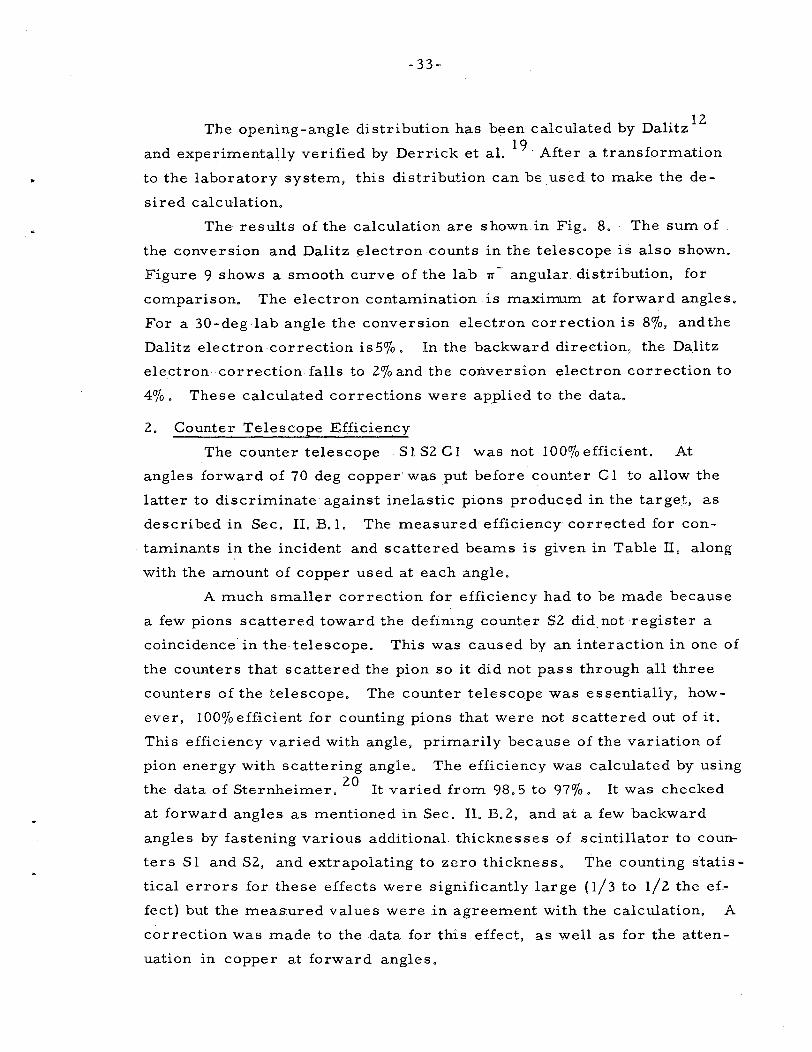
The results of the calculation are shown in Fig. 8. The sum of
the conversion and Dalitz electron counts in the telescope is also shown.
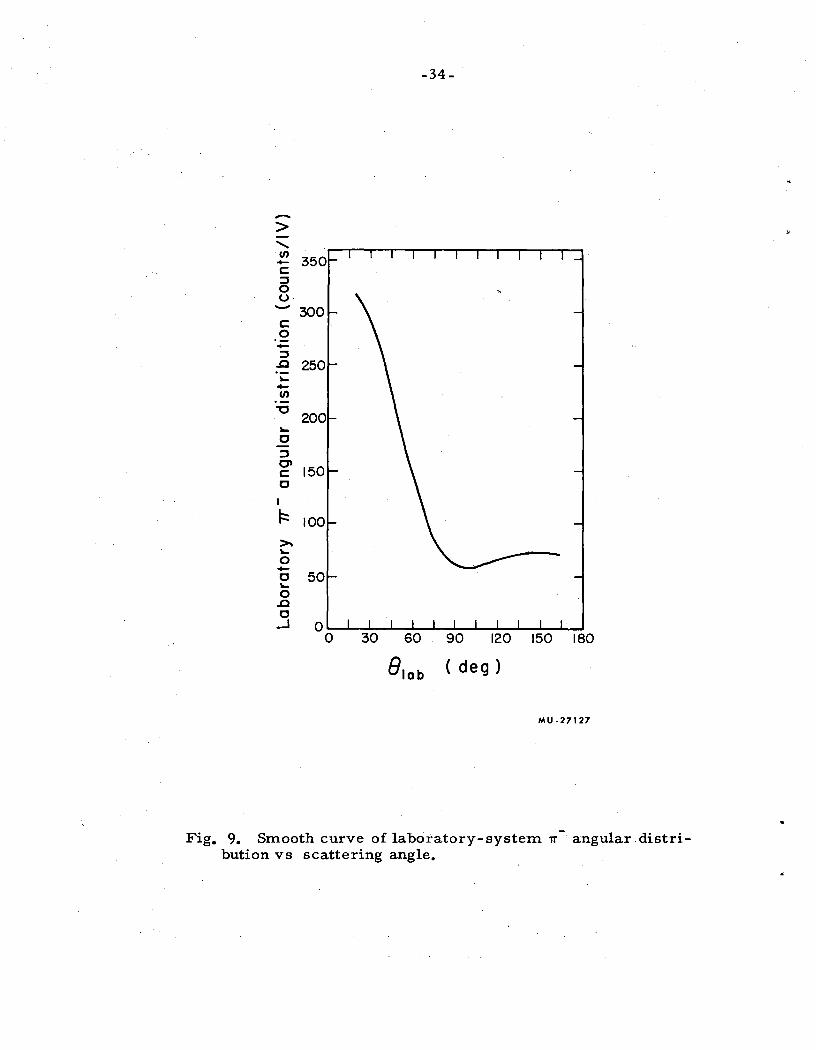
Figure 9 shows a smooth curve of the lab '11'- angular distribution, for
comparison. The electron contamination is maxirriUm at forward angles.
For a 30-deg lab angle the conversion electron correction is 8o/o, andthe
Dalitz electron correction is So/o. In the backward direction, the Dalitz
electron correction falls to 2% and the conversion electron correction to
4%. These calculated corrections were applied to the data.
2. Counter Telescope Efficiency
The counter telescope Sl S2 Cl was not 100% efficient. At
angles forward of 70 deg copper was put before counter C 1 to allow the
latter to discriminate against inelastic pions produced in the tar get, as
described in Sec. II. B.l. The measured efficiency corrected for con
taminants in the incident and scattered beams is given in Table II, along
with the amount of copper used at each angle.
A much smaller correction for efficiency had to be made because
a few pions scattered toward the defining counter S2 did. not register a
coincidence in the telescope. This was caused by an interaction in one of
the counters that scattered the pion so it did not pass through all three
counters of the telescope. The counter telescope was essentially, how
ever, 100% efficient for counting pions that were not scattered out of it.
This efficiency varied with angle, primarily because of the variation of
pion energy with scattering angle. The efficiency was calculated by using
the data of Sternheimer. 20 It varied from 98.5 to 97%. It was checked
at forward angles as mentioned in Sec. II. B.2, and at a few backward
angles by fastening various additional thicknesses of scintillator to coun:..
ters S 1 and S2, and extrapolating to zero thickness, The counting statis
tical errors for these effects were significantly large (1/3 to 1/2 the ef
fect) but the measured values were in agreement with the calculation, A
correction was made to the data for this effect, as well as for the atten
uation in copper at forward angles.
-34-
-> ........ (/) -c: :::l 0 0 - 300 c: 0
·.;::: :::l
..c ~ -(/)
"0
~
0 :::l 0\ c: 0
I
l::: >. ~
0 -0 ~
0 ..c 0
.....J 0 0 180
Blab ( deg )
MU.27127
Fig. 9. Smooth curve of laboratory-system TT- angular distribution vs scattering angle.
-35-
3. Finite Target and Telescope
A correction must be made for the fact that the target and de
fining counter are not point objects. The correction for the effective
solid angle subtended by the finite counter telescope from a finite· target
was made by considering division of the target and the defining c<;mnter
of the telescope first as made of up four and then of twelve parts, and
summing their individual contributions. The result for both cases
amounted to no more than o. 5 o/o correction at any angle.
A correction had also to be made for averaging the DCS over the
finite angular width of the counter telescope. This correction was signi
ficant only for scattering angle near 70 deg, where the curvature of the
DCS is relatively large. Even here the correction was less than lo/o.
This correction was also applied to the data.
4. Other Corrections
Several other small corrections to the data were necessary.
After the pions scatter once in the hydrogen, they have a finite chance
to undergo a second scattering before they leave the hydrogen target. If
) they undergo direct scattering in the hydrogen during the second scatter-
ing, i.e. ,
1T + p ~ 1T + p, (3.9)
a slight distortion of the angular distribution results. This gives rise
to less than 0.5o/o correction at all angles. If the pions undergo charge
exchange scattering during the second scattering, i.e. ,
1T- + p ~ 1To + n, (3.10)
they become lost and the angular distribution is lowered by a slight
amount. The correction for this effect varies' from 0. 5 to 1. 25o/o over
the angular region measured. This calculated correction has been ap
plied to the raw data.
Several other small corrections due to multiple scattering and
attenuation of the incident pion beam between the monitors and hydrogen
target were calculated and found to be less than a few tenths of 1% and
hence were neglected. The distortion of the angular distribution because
-36-
of the scattered pions decaying into muons was found to be less than
0. Zo/o, and was also neglected.
B. Normalization Corrections
Corrections to the data taken during the normaliza_tion run (Sec.
II. D. ) must also be made. Since the method of detecting the scattered
pion was no different from that used in the cross-section measurement,
all corrections that applied to the cross-section measurement (previous
section) were exactly the same for this measurement. The only correc
tion that must be made in addition is one taking into account the contam
inants in the incident beam, which consisted of electrons and muons.
The electron contamination was measured by placing a .gas Cerenkov
counter at the approximate position of the hydrogen target in line with the
beam counters A and B. This gas Cerenkov counter, described else
where, 9 was filled with sulfur hexafluoride. It had a threshold of !3=0. 99,
and since the incident pions and muons had !3' s less than this value, only
ele-Ctrorrs' were counted by this cou~t~r. It was put into coincidence with
A and B and the ratio A, B, CGI A, B measured. The electron contam
ination amounted to 0.3o/o of the incident beam.
There were two principal sources of muon contamination in the
incident beam. One was from the region of the internal beryllium target
and the other from the decay of the pions just before counter B. Only
those muons produced near the internal beryllium target with a momentum
near 430 MeV I c would be transmitted by the magnet system. Muons hav
ing the same momentum as pions have a longer range in copper, and hence
stand out as a bump on a range curve (Fig. 3). The muons visible at this
range makeup 4o/o of the incident beam. However, a calculation based on
a paper by Sternheimer21
indicated that for the geometry and absorber
used, about 1 Oo/o of the muons are scattered out of the backup counter by
multiple Coulomb scattering. Thus, this muon contamination comprised
4. 5o/o of the incident beam.
In the region between the bending magnet M 1 and the defining beam
counter B, . s.ome of the muons from the decay of the pions may register a
coincidence in A-B and hence be indistinguishable from a pion A-B coin-. .
cidence. The muons from the decay of 428 MeV I c pions are confined to a
-37-
cone of half--angle 5.3 deg with respect to the incident pion direction,
with most of the muons found near the edge of the cone. Thus, only
muons from pions that decay within a few feet of counter B have an ap
preciable probability of counting in B. The momentum of these muons
is uniformly distributed between 240 and 430 MeV/ c, and so they are
impossible to identify on a range curve. The result of this calculation
is that 2. 7o/o of the beam is made up of muons of this kind.
A small correction was also made for pions that count:in A and
Band then decay into muons before entering the liquid hydrogen target~
This effect is responsible for an 0, 8o/o contamination of the incident
beam.
Thus,. a total of 8.3o/oof the incident flux does not coqsist of
pions and was excluded from the calculated incident pion flux.
C. Differential Cross Section
1. Scattered Pions Counted
The number of scattered pions counted per incident pion was
determined for each angle by taking the raw data measured at that angle
(see Sec. II. C. 2) and subtracting the counts per incident pion with the
target empty from the counts per incident pion with the target full, for
each full-empty cycle. The value obtained at each angle was the average
rate of all cycles at that angle, weighted by the counting statistics in the
usual way. The corrections described in Sec. III. A were then applied to
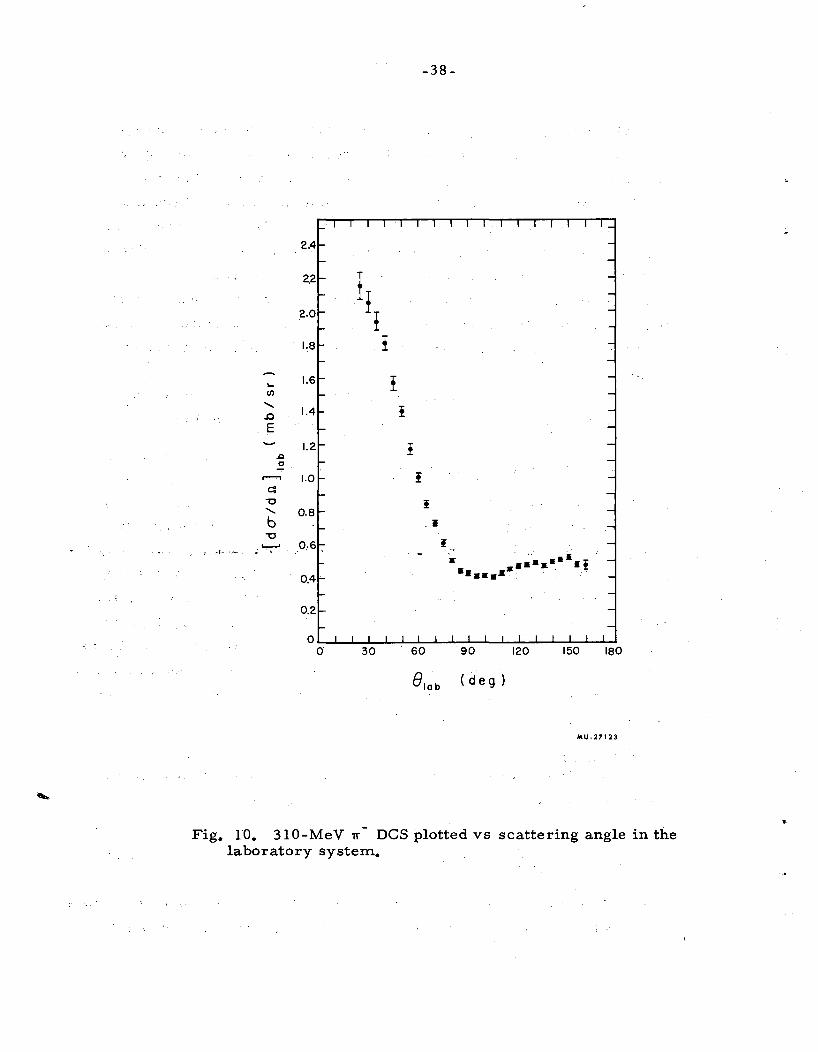
tb these data and a final lab counting rate as a function of lab angle ob-
tained. This curve is shown in Fig. 10.
2. Target Constant
The lab differential cross section is related to the average scat
tered pion per incident pion, N /N., by the equation s 1
dO'( a) ~
:::
N (8) s
N.~T' 1
(3.11)
where N. is the number of incident pions, and N is the number of pions 1 s
scattered into a counter that subtends a solid angle ~ as seen from the
.... (/)
.......
.0
E
..c 0
-38-
•• i
. . .. . K •••••• •! ........ . .
Blab (deg)
MU-27123
Fig. 10. 310-MeV 1r DCS plotted vs scattering angle in the laboratory system.
-39-
target, and lying at an angle 8 with respect to the incident pion direc
tion, The target constant, T is the effective thickness of the target
in protons/ em 2
, For hydrogen, we have
'N pL T = ---=o'"""""'_
M ' (3,12)
where No is Avogadro's number, and M is the atomic weight of hy
drogen; p is the effective density of hydrogen, and L is the effective
length of the target, The effective hydrogen density used was. taken as
the difference between target-full liquid and target-empty vapor. These
densities were obtained from the Cryogenic Data Book, 22
The liquid
density was taken as 70,2 g/ 1, the density of boiling liquid hydrogen.
It was assumed that the vapor had a temperature between those of liquid
-hydrogen and of liquid nitrogen, The vapor density chosen was 0, 9 g/ 1.
The value thus obtained for p was 69.3 g/ L The effective thickness
of the target, L, was obtained by measuring the diameter of the cylin
drical flask with a pressure 1 atmos greater inside the flask than out
side, the approximate condition under which it operated during the
experiment, This was done at room temperature and at liquid nitrogen
temperature, A linear extrapolation was made to liquid hydrogen tem
perature, This thickness was averaged with weights determined by
beam profile measurements (Fig, 3) to obtain the effective target length,
which was determined to be 14,85 em, The value of the target constant
was calculated to be 6. 16X1023
protons/ em 2
,
3, Normalization
The lab angular distribution data were transformed into the c, m.
system with the aid of a kinematics program called KINE, To obtain an
accurate normalization of the DCS, the data from the three normalization
points measured during the experiment were used (see Sec, ILD) in the
following way:
The lab differential cross sections at all three points were calcu
lated, by using Eq. (3, 11) after all corrections had been made to the
data, These cross-section points were then transformed to the c. m,
system.
-40-
A least-squares fit of a power series in cosO, (where () . em. c. m.
is the c. m. angle) was made to the 28 c. m. angular distributi~n points. This- resulted in a smooth "best fit" curve for all' center-of
mass angles. The values of the angular distribution points (in units -8 of counts per I. V. (1 I. V. is equal to 10 Coulombs of charge col-
lected from the ionization chamber) were taken from this curve at
the three angles where the normalization DCS measurement had
been made. .Comparison of the angular distribution points· and the ab
solute cross section points is made in Table IV. The average value
of the ratio (counts/!. V. )/(mb/ sr) was used to normalize the angular
distribution ..
An absolute calculation of the DCS was also made by using the
ionization chamber alone. The absolute scale of the DCS measured
with the ionization chamber had an uncertainty of about 6o/o, while the
normalization procedure described above resulted in about a 3o/o un
certainty in the absolute scale factor. The scale factor as determined
by the ionization chamber differed front that determined by the nor-. . \ .-·' ~ ,. ~'~"' ' ' . -~ .. ~ '
ma:lization procedure by 3. 5o/o.
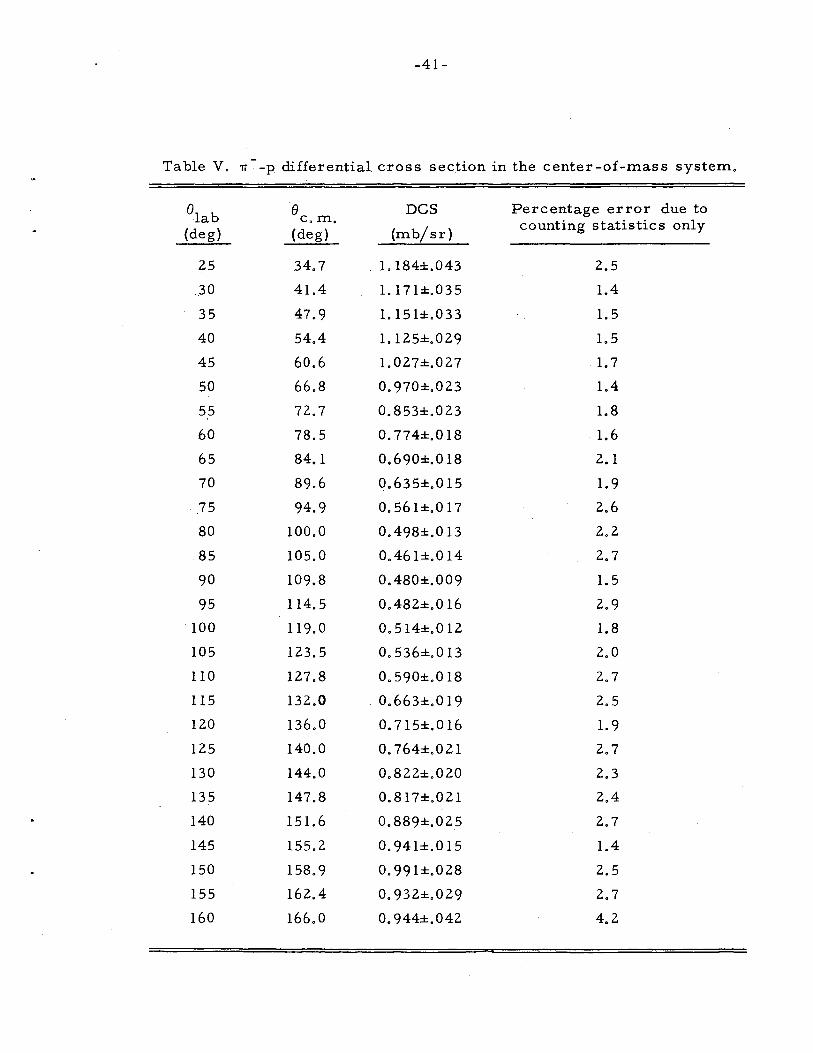
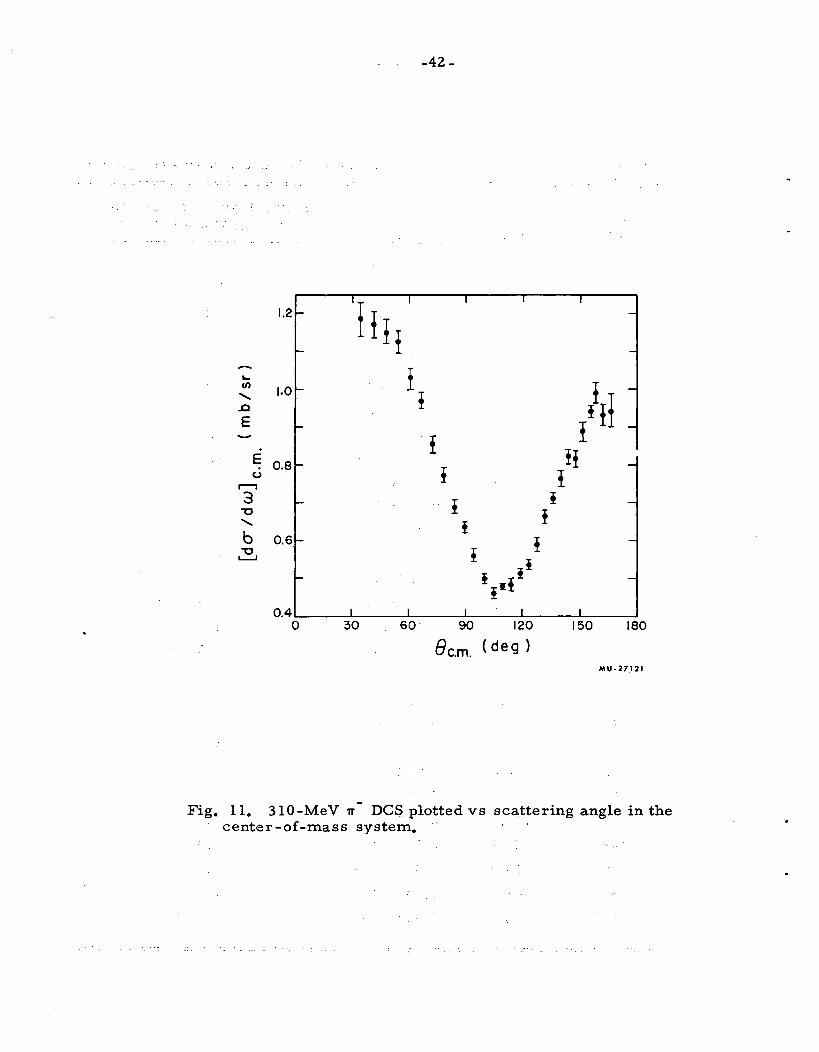
A list of the DCS vs c. m. scattering angle is given in Table
V. A graph of the data is shown in Fig. lL
-41-
Table V. rr -p differential cross section in the center-of-mass system,
e e DCS Percentage error due to lab c.m. counting statistics only
{de g) (de g) (mb/sr)
25 34.7 1. 184±.043 2.5
.30 41.4 1.171±.035 1.4
35 47.9 1. 151±.033 1.5
40 54.4 1.125±.029 1.5
45 60.6 1.027±.027 1.7
50 66.8 o. 970±.023 1.4
55 72.7 0.853±.023 1.8
60 78.5 0. 774±.0 18 1.6
65 84. 1 o. 690±,0 18 2.1
70 89.6 o. 635±.0 15 1.9
75 94.9 0.561± .• 017 2.6
80 100.0 0.498±.0 13 2.2
85 105.0 0.461±.0 14 2.7
90 109.8 0.480±.009 1.5
95 114.5 0.482±.0 16 2.9
100 119.0 o. 514±.0 12 1.8
105 123.5 o. 536±.0 13 2,0
110 127.8 0. 590±.0 18 2.7
115 132.0 0.663±.0 19 2.5
120 136.0 o. 715±.0 16 1.9
125 140.0 o. 764±.021 2.7
130 144.0 o. 822±.020 2.3
135 147.8 0.817±.021 2.4
140 151.6 0.889±.02.5 2.7
145 155.2 0.941±.015 1.4
150 158.9 o. 991±.028 2.5
155 162.4 o. 932±.029 2.7
160 166.0 o. 944±.042 4.2
-42-
I I I I I
1.2 r-
I!I! -
r- -~ f en 1.0 r-
iii -....... i ..0
E r- -i I
E ti 0.8 r- -() i 1 ~
3 I- ! i -"'0 ! ....... t b 0.6 I- ! -"'0 t 1,........1
! - ! I! -
!t: 0.4 I I I I I
0 30 60 90 120 150 180
Bc.m. ( deg } MU-27,121
Fig. 11. 310-MeV 1T DC$ plotted vs scattering angle in the center-of-mass system.
-43-
D. Errors ..
The uncertainties associated with the DCS measurements fall
into three natural catagories:
(a) counting statistics,
(b) absolute DCS scale, and
(c) corrections.
The counting statistics were determined in the usual manner,
through the formula
[
N (8)
= N: 2 I full+
N (e) s
N.2 . 1
ll/2
[empty J (3.13)
A list of the percentage error in the DCS due to counting statistics
is found in the last column of Table V. The error in the absolute eros s
section scale is due mainly to statistical counting errors on the normal
ization points ( 1. 5o/o), uncertainty in the tar get constant (a bout 2. Oo/o) be
cause of possible errors in density of hydrogen-especially the gaseous
hydrogen temperatures -and in the size of flask.
termination of the solid angle is negligible.
The error in the de-
A parameter E was introduced to express the uncertainty in the
absolute DCS scale, The data are thus presented as (do/ d w)( 1 +E),
where the most probable value of E is zero. The error on E is esti
mated to be 3%.
Errors due to various corrections to the data are the most diffi-
cult to estimate. The main uncertainty comes from the calculation of
the electron contamination in the scattered pion beam. It was estimated
that because of uncertainties in the data used and approximations made,
an error of between 15% and 20% of the magnitude of the correction should
be attached to this calculation. The uncertainties in the corrections for
telescope efficiency, finite counter and target size, etc., result in essen
tially negligible errors for most of the DCS points; however, the corrections

-44-
themselves have been included in determining the magnitude of the DCS.
The errors quoted in the DCS points in Table V are a rms com
bination of the counting statistical error and the el.ectron contamination
error.
-45-
IV. TOTAL CROSS SECTION
The total cross section c::rT for 310-MeV negatives pions on
protons was measured by attenuation. The purpose of this measure
ment was to gain further infqrmation about pion:-nucleon scattering at
310 MeV, and to use this information in a phase-shift analysis (see
Sec. V) •. The measurement also gives some information regarding the
absolute scale factor E for the differential cross section. This infor
mation is not as valuable as it might be because the sum of the reactions,
other than the one for which the DCS was measured gives about twice as
great a contribution to the total cross section as does the direct scatter
ing process. The processes that contribute to the total cross sectionare:
'IT +p-+ 'IT + p, ( 4. 1)
ir 0 + n, (4. 2)
'IT+ + 'IT + n, (4. 3)
'ITO + 'ITo+ n '
(4.4)
and
'IT -+,.o+p. (4. 5)
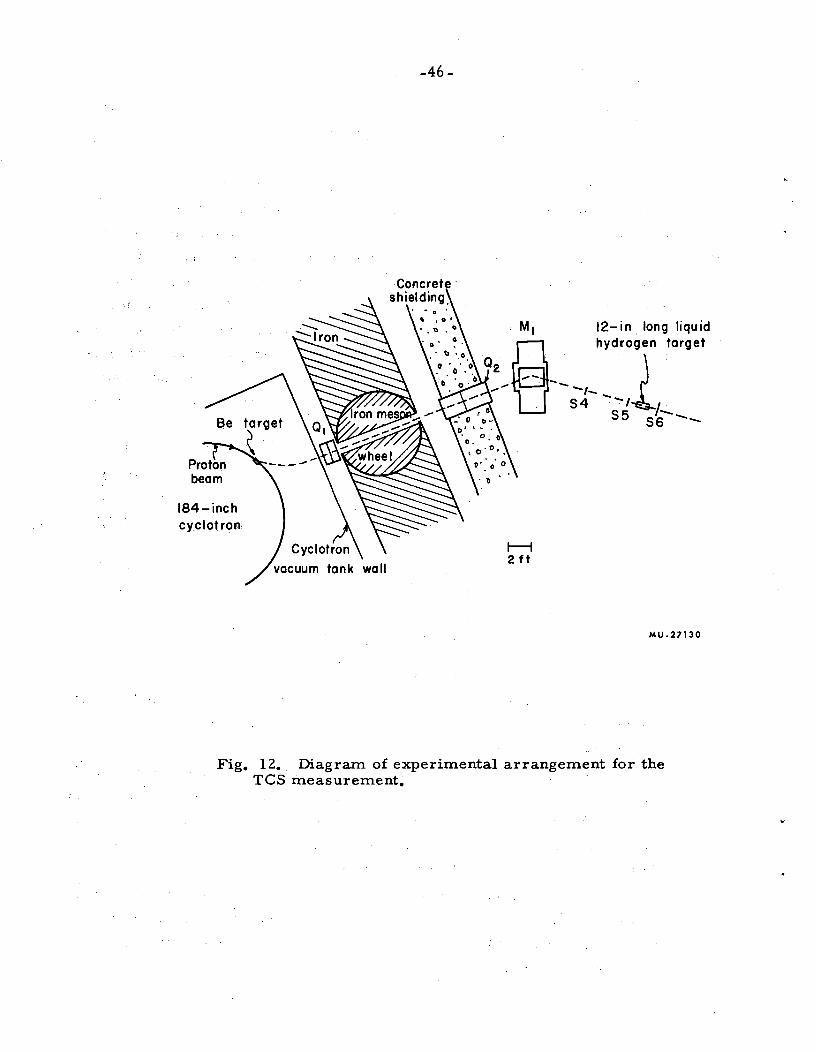
A. Experimental Method
1. Experimental Arrangement
The arrangement of the counters and hydrogen target used to meas
ure the total cross section is shown in Fig. 12. A description of the coun
ters is given in Table I.
The liquid hydrogen target used in this measurement consisted of
a 6-in. -diam Mylar flask 12 in. long, surrounded by an aluminum vacuum
jacket with Mylar windows at front and back to allow the beam to pass
through the target. The beam passed through a total of 0.075 in. of
Mylar as well as 12 in. of liquid hydrogen.
The same pion beam was used tlhroughout the experiment. During
the total cross -section measurment, the ri stretched" beam was used at
intensities of about 100 incident pions/ sec to ensure a. completely negli
gible accidental rate.
184-inch cyclotron
wall
-46-
1--1 2ft
MU-27130
Fig. 12. Diagram of experimental arrangement for the TCS measurement.
-47-
2. Experimental Procedure
Four cross -section points were measured as a function of cutoff
angle. The c. m, cutoff angle varied from 8.4 to 22.2 de g. The eros s
section was obtained by taking the ratio S4, S5, S6/S4,S5 with target full
and empty at the four cutoff angles. The expression for the total cross
section in terms of these ratios, after being corrected for muon and
electron contamination in the incident b~am, is
1 R' crT = N ..en R ' (4.6)
where R' is the S4, S5, S6/S4, S5 ratio (corrected) with target empty,
and R is the same ratio with target full. Typical ratios were
R = 0.955, and R' = 0.985. The target thickness N is in protons/cm2
.
In addition to the correction for contaminants in the main beam,
a very small correction was made in cutoff angle to take into account
the finite size of the target. All other corrections were negligible. The
· data taken at all angles were obtained with one coincidence circuit meas
uring S4, S5, S6 and the other S4, S5 for half a run; then the circuits
were switched and data taken in that fashion again for the remainder of
a run. Although the circuits tracked to better than 1 part in 1000, a
slight uncertainty was introduced into this measurement at some cutoff
angles because of the circuit's inability to track exactly.
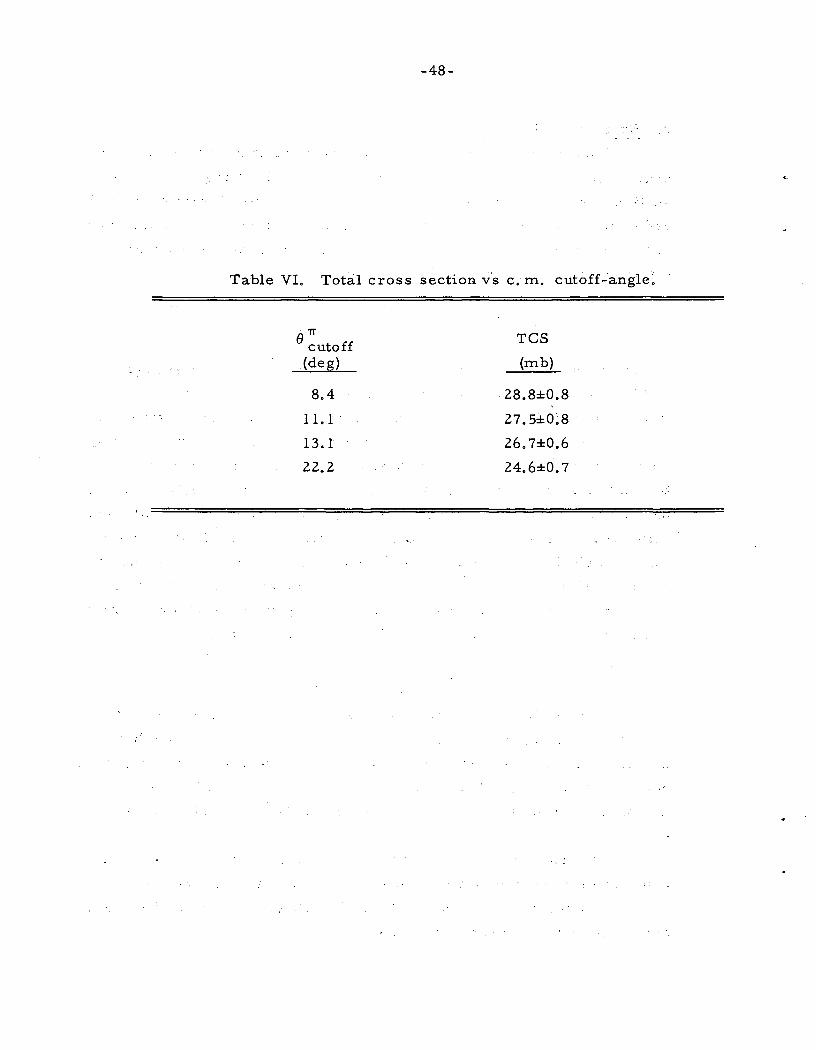
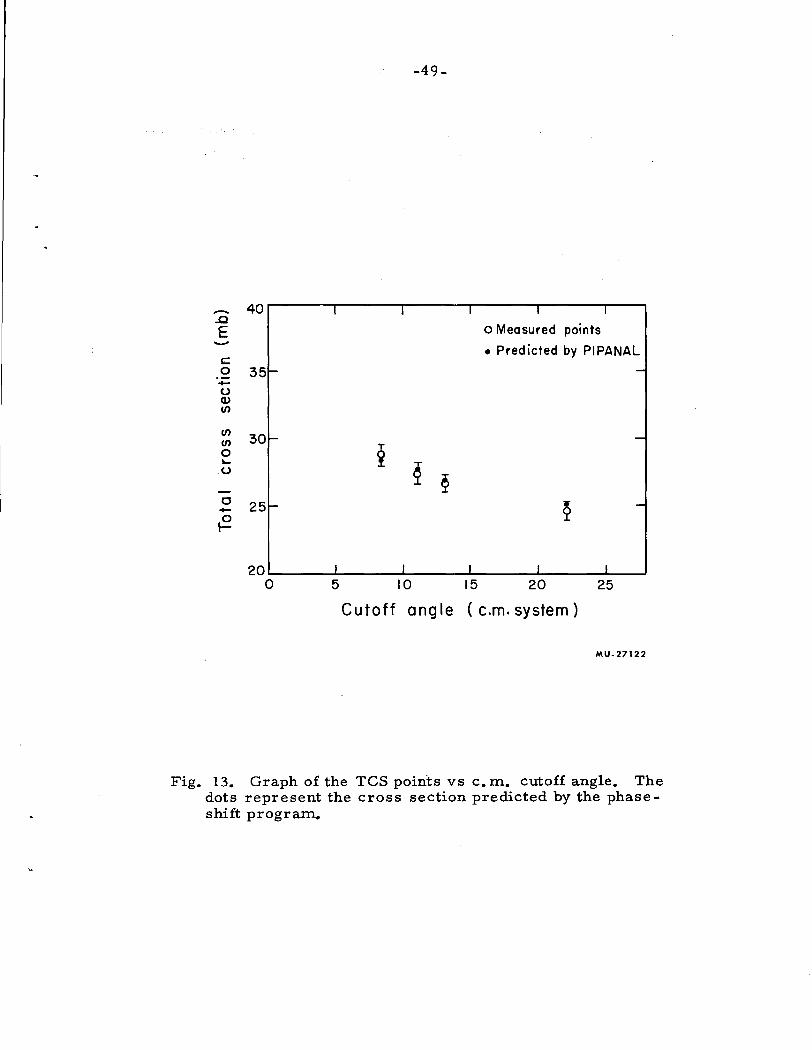
B. Results and Errors
The results of the total cross-section measurements are given
in Table VI, and plotted vs cutoff angle in Fig. 13. The errors listed
are due to counting statistics ( :::::: 1 to 2o/o), uncertainties regarding muon
contamination, target thickness, and cutoff angle (about 2o/o), and at cer
tain angles, uncertainty because of failure of the electronics to track
exactly.
Also plotted in Fig. 13 are the total cross -section points vs the
cutoff angle predicted by the phase -shift analysis when all pion.-nucleon
data at this energy are used (see Sec. V). These are seen to be in good
agreement with the measured values.
-48-
Table VI. Total cross section vs c. m. cutoff-·a:ngle:
err cutoff TCS
(de g) (mb)
8.4 28.8±0.8
11. 1 27. 5±0.8
13.1 26. 7±0.6
22.2 24.6±0. 7.
··.·."
-..c E -c 0 -u Q) (/)
(/)
(/)
0 ~
u
0 -~
-49-
4or-----~,------~~----~lr-----~~------~~~
o Measured points
• Predicted by PIPANAL
35f- -
30f- -
-
20~-----~~-----~~-----~~-----~~-----~l__j 0 5 10 15 20 25
C u toft angle ( c.m. system)
MU-27122
Fig. 13. Graph of the TCS points vs c. m. cutoff angle. The dots represent the cross section predicted by the phaseshift program.
.,.50-
By utilizing the phase-shift analysis, a total nuclear cross
section for negative pions or protons can be obtained. Our result was
27.7 ± 0.7 mb.
This value is in agreement with values obtained by other experimenters
h . 23 at t 1s energy.
-51-
V. PHASE~SHIFTANALYSIS
We completed measurements of the DCS in elastic 'IT -p scatter
ing at 310 MeV, and obtained data at 28 angles. A measurment of the
total cross section as a function of cutoff angle was also obtained.
Complementing these results, Olav T. Vik has measured the recoil pro-
. ton polarization in 'IT- -p scattering at the same energy. 4 In addition,
measurements of 'IT+ -p differential and total cross section, and polar
ization of the recoil proton, had been made previously at this energy
by Rogers et al. 1
and Foote et al., 2
respectively. All these data are
noteworthy because of the relatively high accuracy attained. Data from
all the above, as well as a measurement of the charge-exchange cross
section by J. Caris at 317 MeV, 5 were used in the phase-shift analysis.
This section· describes the relationship between experimentally measured
quantities and the phase shifts, as well as the method and results of the
search program that performed the phase-shift analysis.
A. Relationship of Phase Shifts to Experimental Data
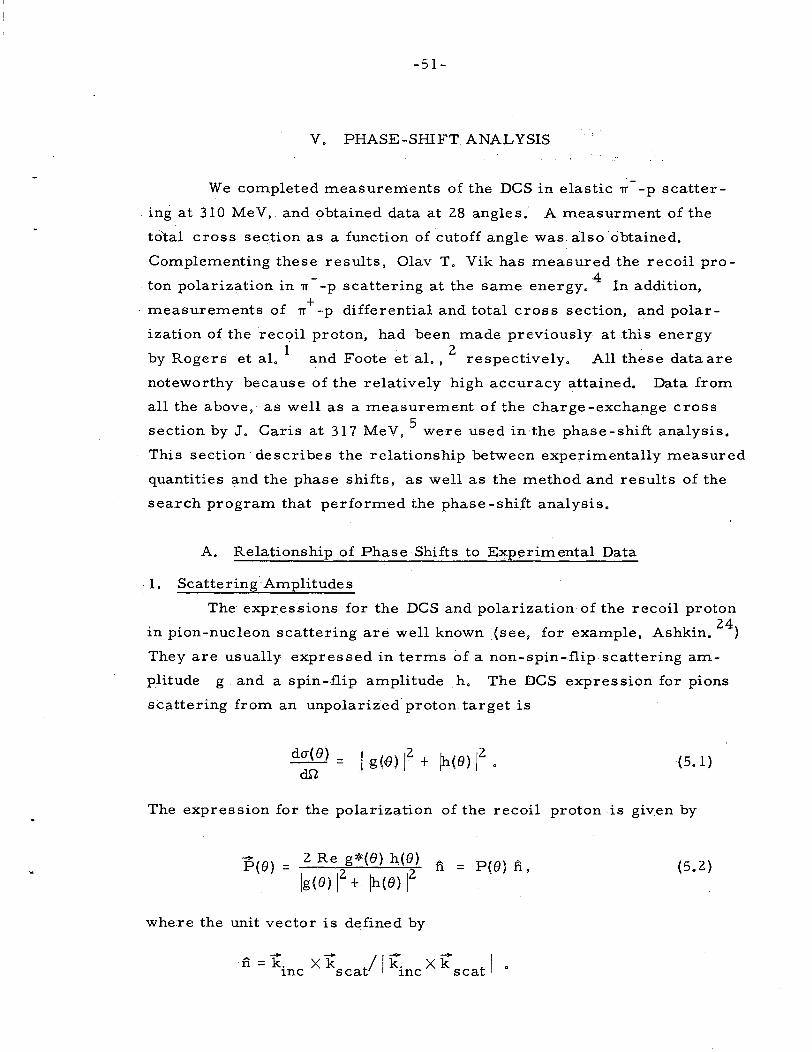
·. 1. Scattering Amplitudes
The expressions for the DCS and polarization of the recoil proton
in pion-nucleon scattering are well known (see, for example, Ashkin. 24
)
They are usually expressed in terms of a non-spin-flip scattering am
plitude g and a spin-flip amplitude h. The DCS expression for pions
scattering from an unpolarized proton target is
(5. 1)
The expression for the polarization of the recoil proton is given by
-P(e) = 2 Re g*(e) h,(e)
lg(e) 12 + ~(e) 12
n = P(e) n.,
where the unit vector is defined by
... - - /I- - I n = k. X k k. X k . 1nc scat 1nc scat
(5.2)
-52-
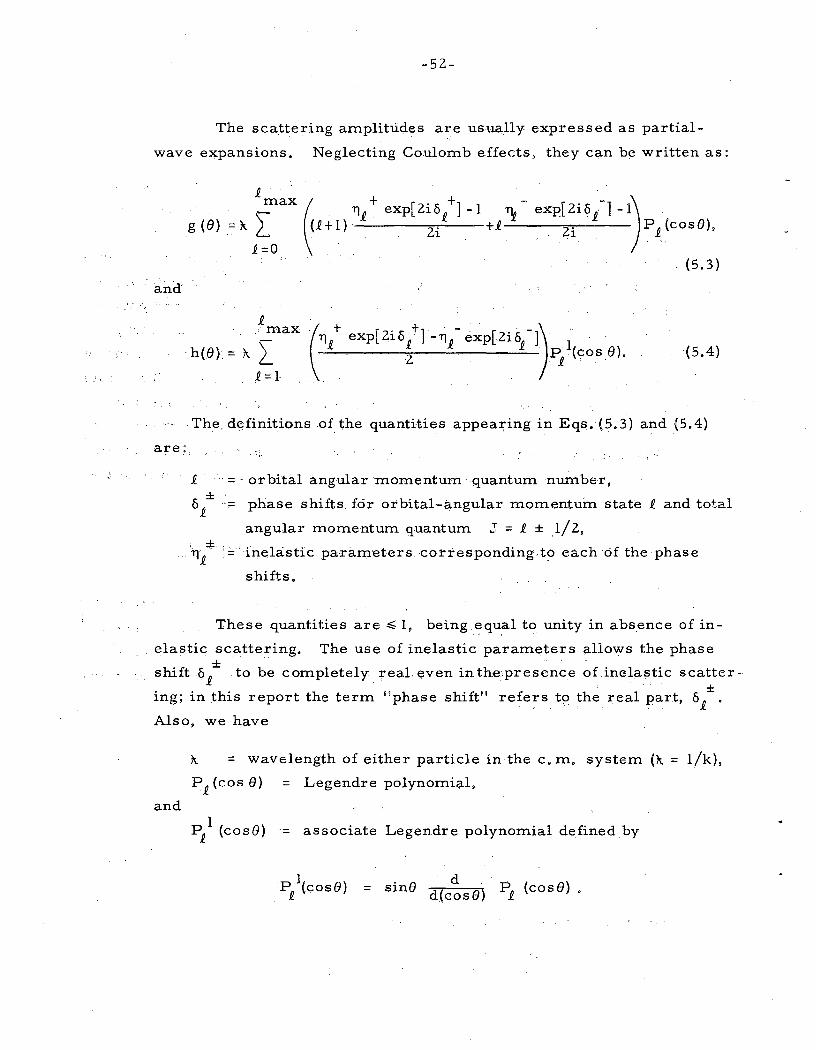
The scattering amplitudes are usually expressed as partial
wave expansions. Neglecting Coulomb effects, they can be written as:
and
are:
£ . . .
\max~ TJ£ + exp[2i6/J -1 ~- exp[2i6_e-] -1) . g(e) =)t L (£+1) Zi +£ . Zi . P 1 (cose),
£=0 . . .. . . (5.3)
£ ·max
h<e> = }t L_ (5.4)
£=1-
The definitions .of the quantities appea:r;-ing in Eqs. (5.3) and {5.4)
£ 6 ±
£
- orbital angular ·momentum· quantum number,
- phase shifts for orbital-angular momentum state £ and total
angular momentum quantum J = £ ± 1/2,
.: ~-'in-elastic pa-ra~·eters. cortespondin·g .. to each ·of the phase
shifts.
These quantities are ::::;: 1, being equal to unity in absence of in-
. elastic scattering. The use of inelastic parameters (i.llows the phase
shift 6£ ± to be completely real even in the presence of inelastic scatter-. ±
ing; in this report the term "phase shift" refers tp the real part, 6£ .
Also, we have
}t = wavelength of either particle in the c. m. system ()t = 1/k),
P1
(cos e) = Legendre polynomial,
and 1
P1
(cose) - associate Legendre polynomial defined by
1 P
1 (case) d
= sine d(cose) P1 (cose) .
-53-
The correct expressio:p. including the Coulomb corrections is
found in Appendix A,
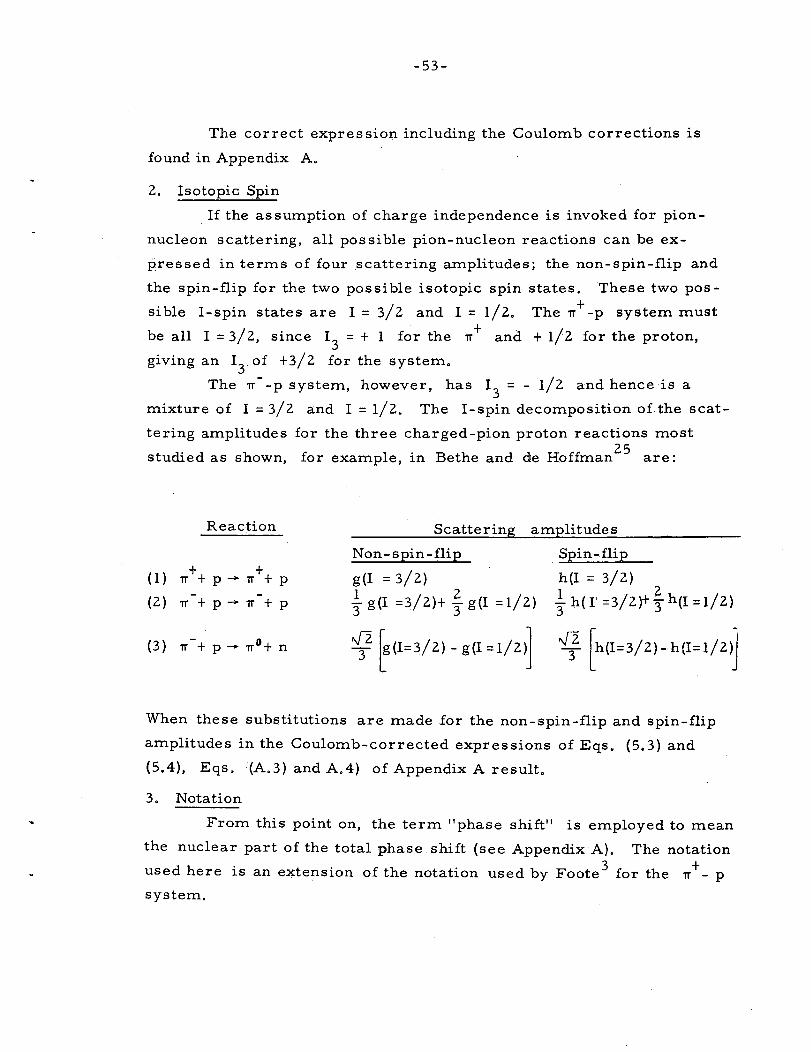
2. Isotopic Spin
If the assumption of charge independence is invoked for pion
nucleon scattering, all possible pion-nucleon reactions can be ex
pressed in terms of four scattering amplitudes; the non-spin-flip and
the spin-flip for the two possible isotopic spin states. These two pos
si ble I-spin states are I = 312 and I = 112.
be all I = 312, since I3
= + I for the 1T + and
giving an I3
of +312 for the system,
+ The 1T -p system must
+ 112 for the proton,
The 1T- -p system, however, has I3
= - 112 and hence is a
mixture of I = 312 and I = 112. The I-spin decomposition of the scat-
tering amplitudes for the three charged-pion proton reactions most
studied as shown, for example, in Bethe and de Hoffman 25
are:
(1)
(2)
(3)
Reaction
+ + 1T+p-1T+p - -1T+p-+1T+p
Scattering amplitudes
Non-spin-flip
g(I = 312)
l I 2 I 3 g(I =3 2)+ 3 g(I =I 2)
f- ~(1=3/2)- g(I = 1/2)]
. Spin-flip
h(I = 312) 2
; h(T =312)+ 3 h(I = IIZ)
.J2 [ ., 3 h(I=3I2)- h(I= II2)J
When these substitutions are made for the non-spin-flip and spin-flip
amplitudes in the Coulomb-corrected expressions of Eqs. (5.3) and
(5.4), Eqs. (A. 3) and A.4) of Appendix A result.
3. Notation
From this point on, the term "phase shift" is employed to mean
the nuclear part of the total phase shift (see Appendix A). The notation 3 + used here is an extension of the notation used by Foote for the 1T - p
system.
-54-
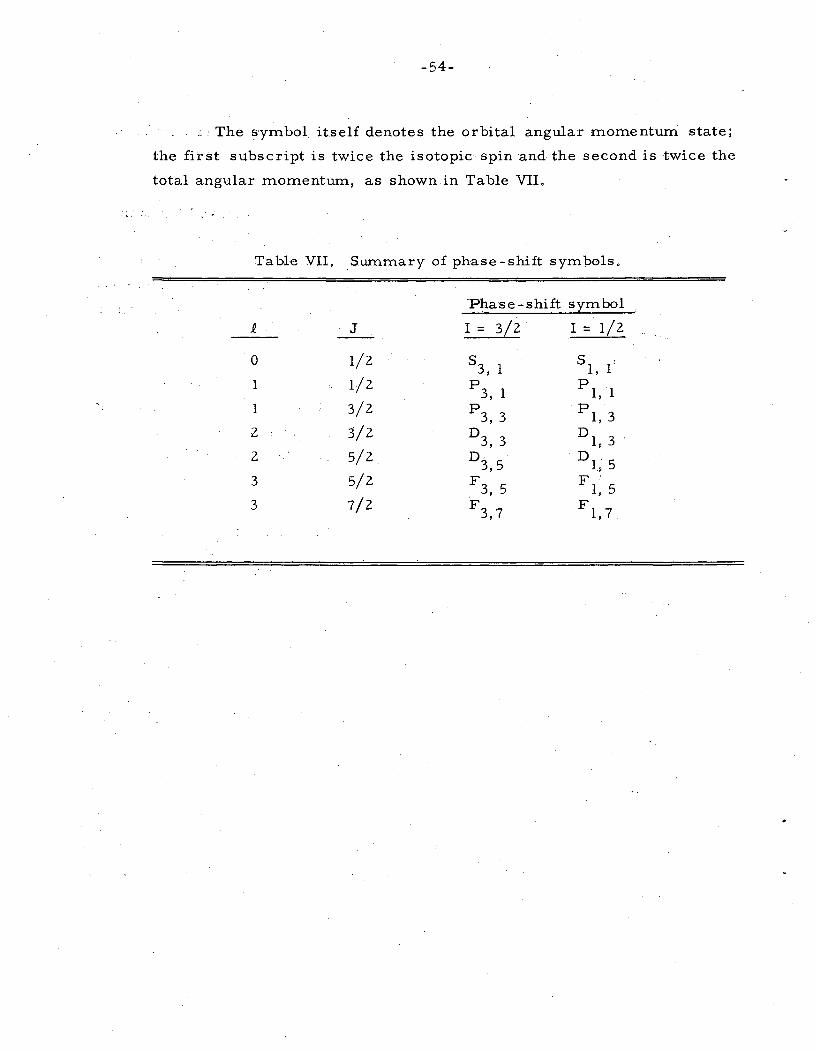
' The symbol itself denotes the orbital angular momentUm state;
the first subscript is twice the isotopic spin and the secondis twice the
total angular momentum, as shown in Table VII.
Table VII, Summary of phase-shift symbols,
·Phase-shift symbol
.£ J I = 3/2 I= 1/2
0 1/2 83, 1 si, 1
1 1/2 p3 1 p 1, 1 ' 1 3/2 p3, 3 p1 3
' z 3/2 03 3
01, 3
' 2 5/2 03,5
0 1· 5 .. 3 5/2 F3, 5 F 1: 5 3 7/2 F3 7 F 1, 7
'
-55-
B. Search Program
1. General Method
Because of their complex relationship to the experimental data,
a trial and error method must be used to search for the correct phase
shifts. Such a method is ideally suited to the use of modern high-speed
computers. An IBM 7090 program has been written to perform this
searching function, The general method of this program is outlined below.
A set of phase shifts is input to the computer. The computer is
instructed to calculate the desired experimental quantities (the equations
in Appendix A were used with this set). The calculated quantities are
then compared with the measured quantities, This comparison is made
by computing the quantity M:
Here
error
M - \ 1 1
[
X. (c) _ X. (e)] 2
- L E. 0
. 1 1
X. (e) is the experime~tal quantity 1 .
(standard deviation} in X (c) is the 1.
(5.5)
X., E. is the experimental 1 1
quantity X. as calculated by the 1
computer for a given set of phase shifts, The summation is made over
all experimental measurements,
The program searches for those values of the phase shifts which
give a relative minimum to this quantity M. This "least-square" min
imization is carried out by the grid search method, 26 in which the phase
shifts are varied by fixed amounts (size of grid) in cycles. After a rel
ative minimum has ~been fo:und for each grid size, the search continues
with a smaller grid size, Successively smaller changes are made in the
phase shifts until the smallest increment by which the shifts are varied
is reached, The values of the phase shifts thus obtained correspond to
a minimum in M, in the sense that if a change of the smallest grid incre
ment is made in any of the shifts a larger value of M is obtained than the
one calculated at the minimum,
The value of M obtained in this manner is only a relative minimum.
Also, different initial sets of phase shifts may lead to different minima,
some of which may have lower M values.
-56-
It is sometimes convenient to visualize the hype~surface that
would correspond to a depression in the hypersurface, which may be
referred to as a "hole" or "valley" on the surface, This visual repre
sentation is often used in the discussion to follow,
The uncertainty in the phase shifts was established by using the
error-matrix method, in essentiallythe manner described by Foote. 3
Additional information concerning this :rpethod can be found in the phase
shift analysis discussion by Anderson et al. 27
The program calculates the quantity G .. , 1J
G .. 1J = 1 a 2M
2 86. 86. 1 J
evaluated at the minimum,
The i and j summations extend over all phase shifts. The error ma.,-, - 1
trix G is an array of numbers obtained by inverting the matrix G,
which consists of a symmetrical array of the quantities G .. , The errors 1J
on the phase shifts are related to the elements of the trace of the error
matrix as
(~6.) 1
rms
in the obvious notation, It is useful to express the error in any function
F of the phase shifts, The rms error in F, & is; calculated from the rms
t . G- 1 . h f 1 28 error ma r1x 1n t e ormu a
2. PIPANAL ICF4
PIPANAL ICF4 is the final IBM 7090 program performing the
phase-shift search and error analysis, It is the culmination of a long
series of programs based on Foote• s original 1T + -p analysis program. 3
-57-
The gE;!neral method used by this program has been discussed in Sec.
V.B.l; and use in, its particular phase-shift investigations is thoroughly
discus sed in Sec. V. C. In this section we enumerate the quantities that
can be varied, and those experimental data that can be fitted with the pres
ent program. The notation for these variables and experimental quanti
ties is the same in all three sections.
The quantities in the program that can be varied are:
(a) The isotopic spin 3/2 and isotopic spin 1/2 phase shifts (a and 6
respectively).
(b) The isotopic spin 1/2 inelastic parameters ( 11' s); the !-spin 3/2 are
not varied from 1. 0 because of the small amount of inelastic scattering
that takes place in the ,/ -p scattering at 310 MeV.
(c) The absolute scale factors for the various DCS' s; i.e. , E 1
for lT -p - + elastic DCS, E
2 for lT -p charge -exchange DCS, and E
3 for lT p elas-
tic DCS. These scale factors take intb account possible uncertainties
in the knowledge of the absolute normalizations of the various DCS. They
serve the same function as the E (which we now call E 1
) described in
S&c'. Ill. D.
All the above parameters are varied to obtain best fits to the
experimental data put into the program. A list of the data that may be
put into PIPANAL !CF4 is as follows:
(a) Differ enti~I._c ro s ~~ e ction
Up to 30 DCS points for each of the reactions
+ - + lT -p lT -p,
-lT -p -+ lT -p,
-1r
0 -n, lT -p -may be put into the program, If the lT- -p-+ 1r 0 -n DCS is obtained by
rneasuring the y distribution, this· DCS is usually expressed in terms of
coefficients of Legendre polynomials. It is also pas si ble to insert the
data into the program. in this forrn.
-58-
·· · <{b) :Polarization ·
·· '•: · , .·· :Up to no, polarization points may be put into the program for the
:pola•rization;ef the nucleon in the three reactions listed in (a) .. ~
{c) Total cross sections. + The measured,_total cross section for one cutoff angLe for lT -p
_and lT- -p scattering can be inserted into the program. The toti=tl in
elastic cross section may also be used as data •
. In addition to printing out the value of M and the phase shifts fpr the
minimum value of M, the calculated values of any •Of the experimental
quantities may be printed for any number of angles.
G. Phase -Shift Investigations
Before the. phase- shift analysis was begun, a least-squares fit
ting program was used to fit the lT- -p DCS data. The results of this
fitting indicated that the s and p wave.s alone (i.e., partial waves up
to andincluding i. = 1) could not possibly fit the data adequately. While
spd waves gave an adequate fit to the data, the best fit was obt~ined for
spdf waves (i.e., up to i. = 3). For this reason, a phase-shift analysis
was carried out for both spd and spdf waves.
The data used for these investigations were:
(a) The data contained in this report; 28 lT- -p elastic ·ncs points,
and a total cross -section point for an 8.4 deg cutoff angle.
(b) Four recoil-proton polarization points for lT- -p scattering,
measured by 0. Vik. 4
(c) Twenty-three DCS points for lT+ -p elastic scattering at 310
MeV, and a total cross -section point, all measured by Rogers et al. 1
(d) Four recoil proton polarization points in lT + -p scattering,
measured by Foote et al. 2
(e) Coefficients 'for charge-exchange DCS measured by Caris at
317Mev. 5
A list of these data is given:in Tables VIII, IX, and X. Graphs
of the lT DCS data are given in Fig. 11.
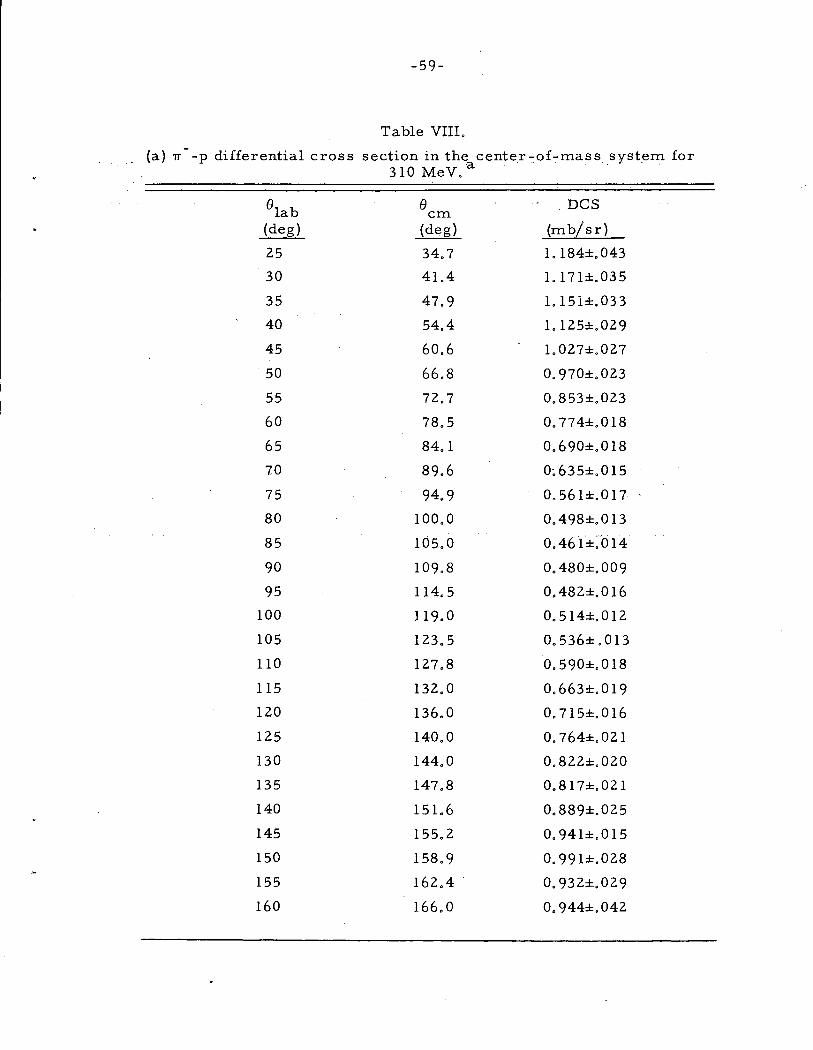
-59-
Table VIIL
(a) rr -p differential cross section in the center-of-mass system for a
310 MeV.
8lab e DCS em
(deg) (de g) (mb/sr)
25 34.7 1. 184±.043
30 41.4 1.171±.035
35 47.9 1.151±,033
40 54.4 1. 125±,029
45 60.6 1.027±.027
50 66.8 o. 970±.023
55 72.7 0.853±.023
60 78.5 0. 774±.018
65 84.1 o. 690±. 018
70 89.6 o~ 635±.0 15
75 94.9 0.561±.017
80 100.0 0.498±.0 13
85 105.0 0.461±: ci 14
90 109.8 0.480±.009
95 114.5 0.482±,016
100 119.0 0.514±,012
105 123.5 0.536±.013
110 127.8 0.590±.018
115 132.0 0.663±.019
120 136.0 o. 715±.016
125 140.0 0.764±.021
130 144.0 0. 822±. 020
135 147.8 0,817±.021
140 151.6 0.889±.025
145 155.2 0.941±.015
150 158.9 0.991±.028
155 162.4 o. 932±,029
160 166.0 o. 944±.042
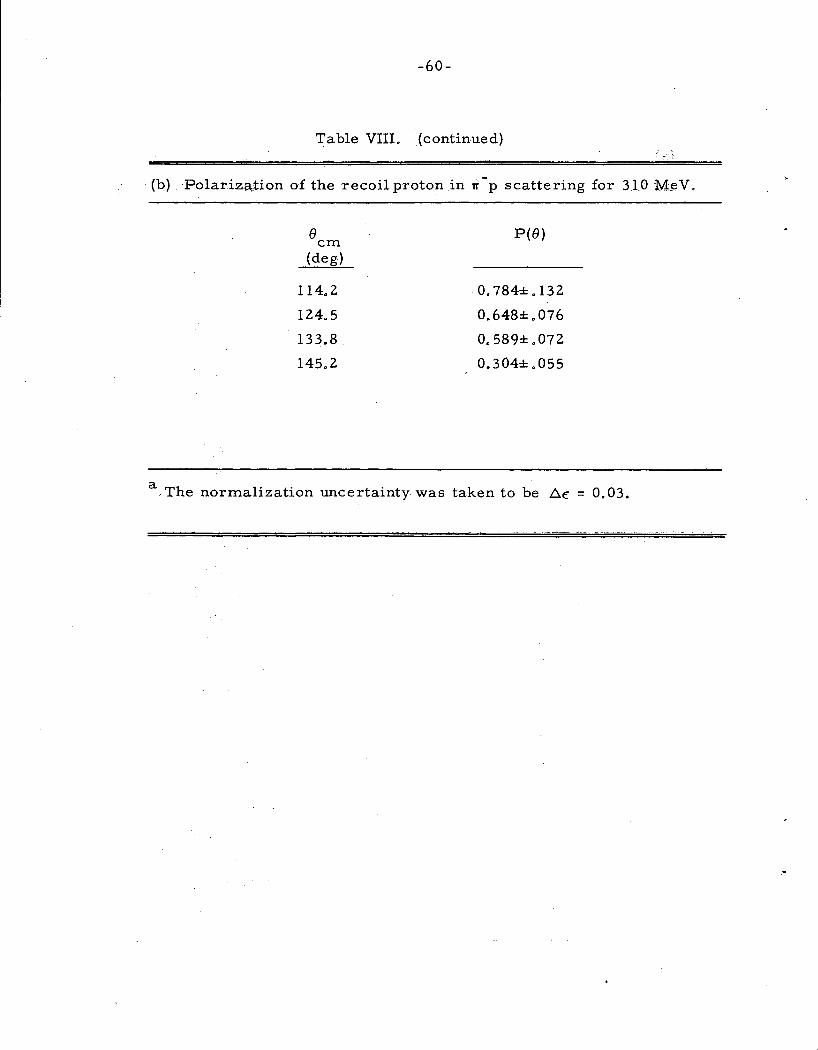
-60-
Table VIII. (continued}
(b) Polarization of the recoil proton in rr p scattering for 3t0 ·M.~V.
e em (de g)
114.2
124.5
133.8
145.2
P(8}
o. 784± .132
0.648± .076
0~589±.072
0.304± .055
a The normalization uncertainty was taken to be D.E = 0.03.
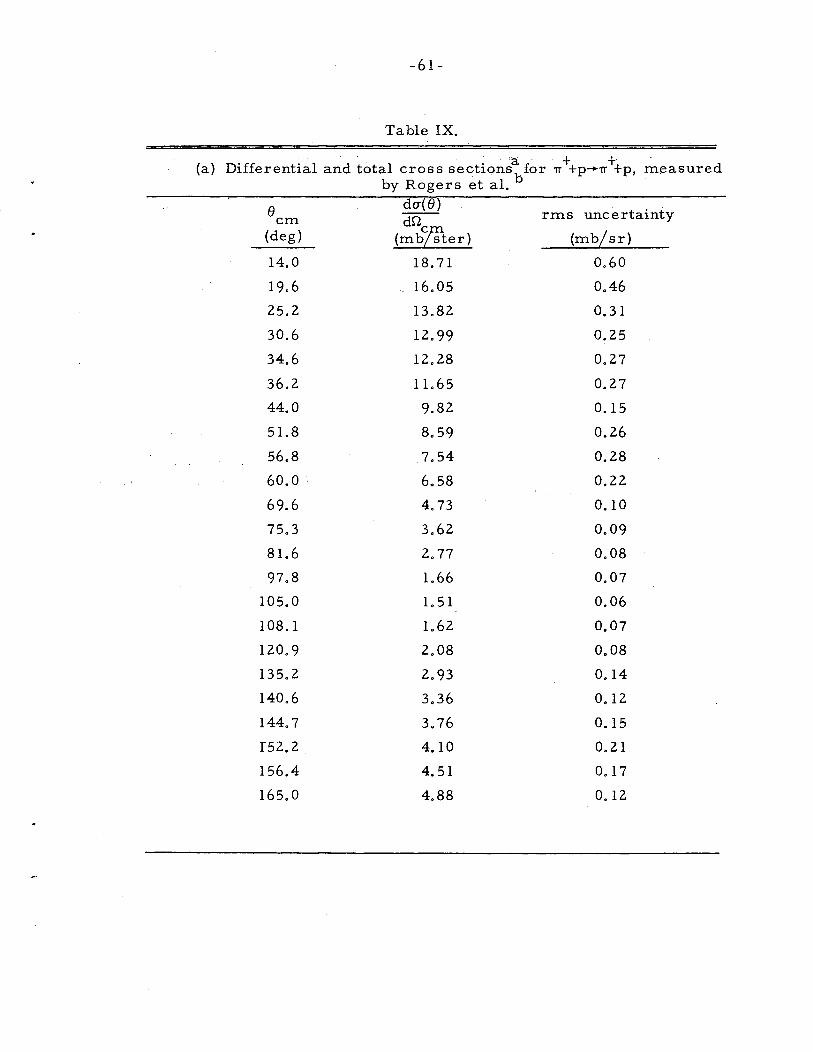
-61-
Table IX.
. ·a . + + (a) Differential and total eros s sections for ;r +p-+;r +p, measured
by Rogers et al. b
() em
(de g)
14.0
19.6
25,2
30.6
34.6
36.2
44.0
51.8
56.8
60.0 .
69.6
75.3
81.6
97.8
105.0
108.1
120.9
135.2
140.6
144.7
I52.2
156.4
165.0
da(G)
dr.lc (mbfster)
18.71
16.05
13.82
12.99
12.28
11.65
9.82
8. 59
7.54
6.58
4.73
3.62
2,77
1.66
1. 51
1.62
2.08
2. 93
3.36
3. 76
4.10
4.51
4.88
rms uncertainty
(mb/sr)
0.60
0.46
o. 31
0.25
0.27
0,27
0.15
0.26
0.28
0,22
0.10
o. 09
0,08
0,07
0.06
o. 07
0,08
o. 14
0.12
0.15
0.21
0. 17
0.12
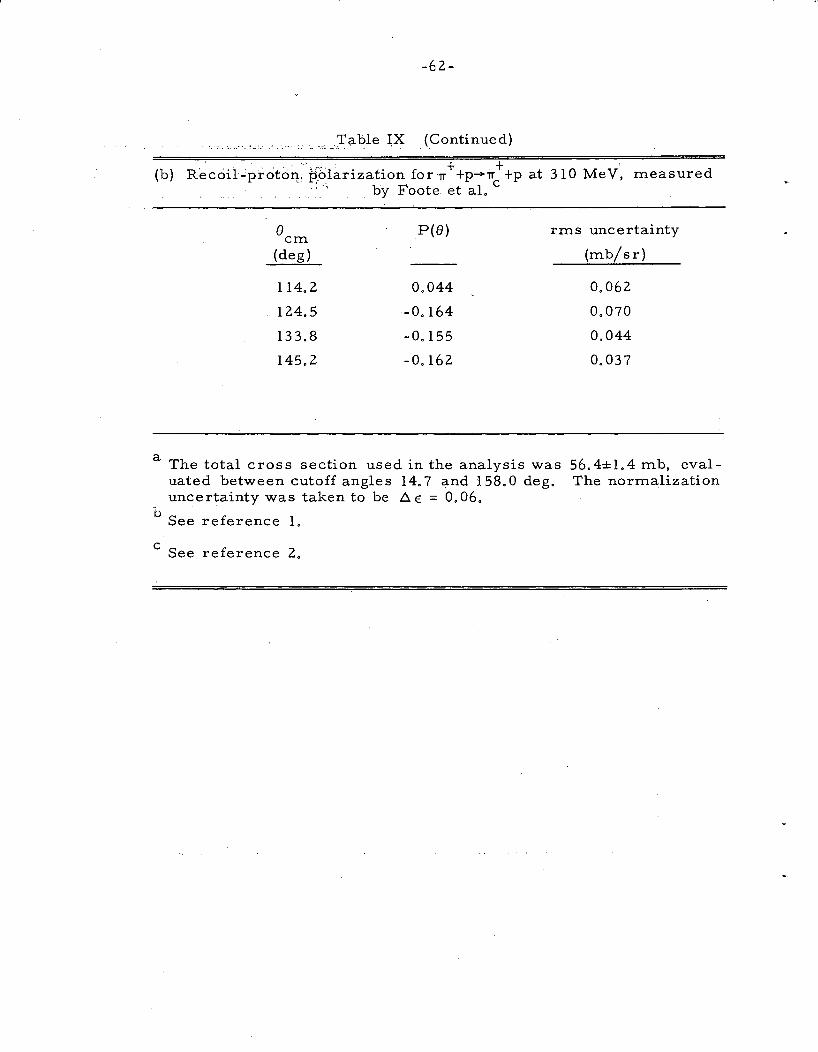
-62-
(Continued)
(b) '' ' , , .. ' "' ·>-.,v, + +
Recoil_;proto:q.i p_o_larizationforrr +p-+rrc +pat 310 MeV, measured ' by Foote et al.
e em (de g)
P(8) rms uncertainty
(mb/sr)
114.2
124.5
133.8
145.2
0.044
-0.164
-0.155
-0.162
a The total cross section used in the analysis was uated between cutoff angles 14.7 and 158.0 deg. uncertainty was taken to be /:::;.E = 0.06.
b See reference 1.
c See reference 2.
0.062
0.070
0.044
0.037
56.4±1.4 mb, evalThe normalization
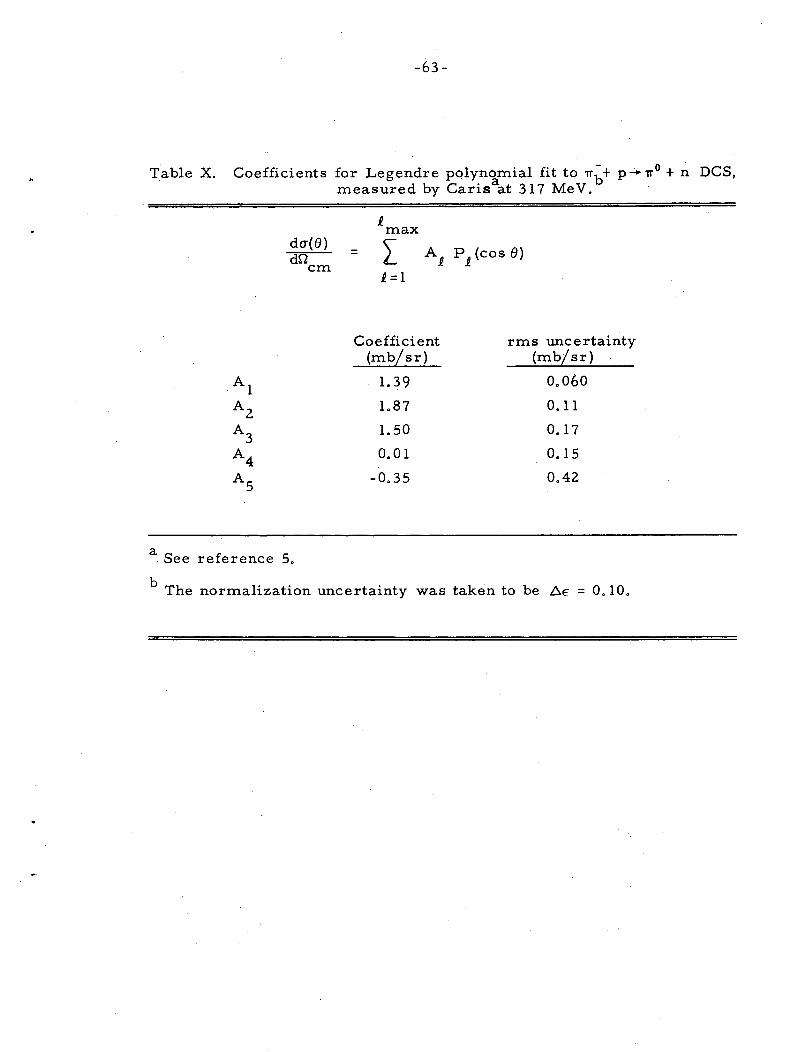
Table X.
-63-
Coefficients for Legendre polynomial fit to 1Tb + p-+ 1T 0 + n DCS, measured by Carisaat 317 MeV.
Al
Az
A3
A4
As
d<T(8) dn em
J.. max
= L J.. =1
Coefficient (mb[sr)
1.39
1.87
1. 50
o. 01
-0.35
rms uncertainty (mb[sr)
0.060
o. 11
0.17
0.15
0.42
a See reference 5.
b The normalization uncertainty was taken to be ~E = 0.10.
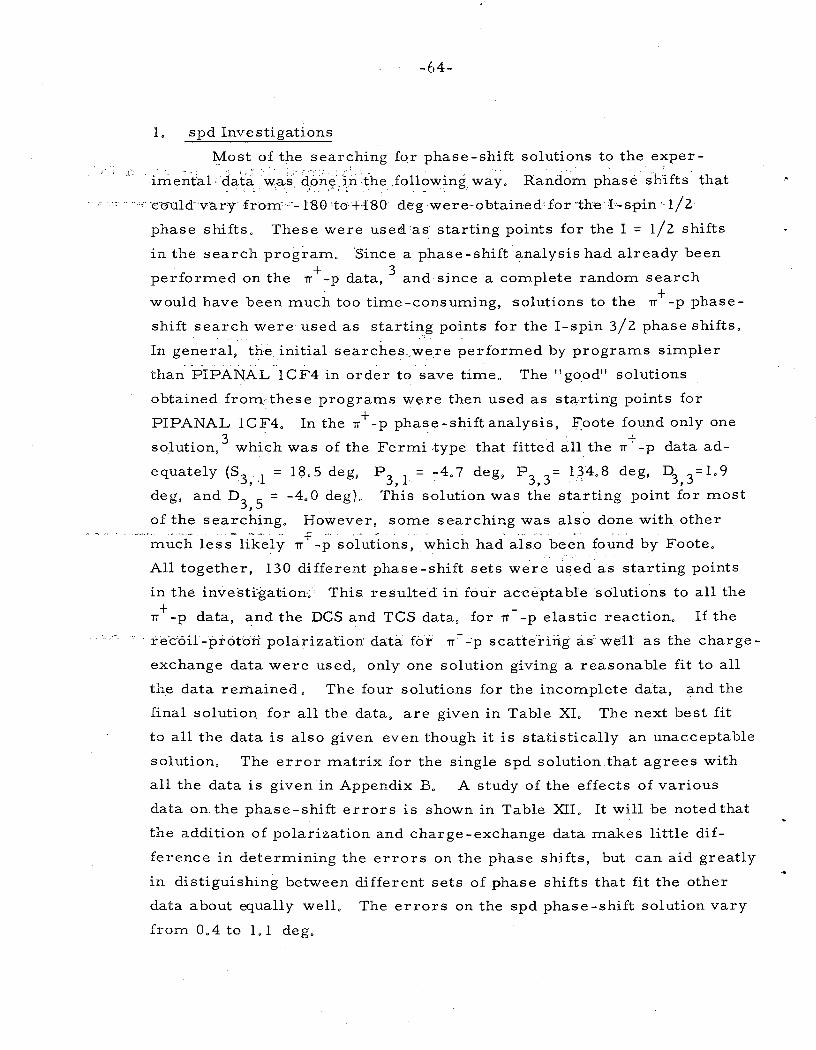
-64-
1. spd Investigations
Iyfost of the searching fa,r phase-shift solutions to the exper-
, .. irile~tal: dat'ci :-~al:( ~6ny,\n 'the Jol19wing way. Randbm phase sh,ifts- that
·- ·· ··· 'CtHlldvary from•·-·- 180 ·to+-180· deg were~obtained• for ·the l-'- spin· 1/2
phase shifts, These were used as starting points for the I= l/2 shifts
in the search program, 'Since a phase-shift analysis had already been + 3 performed on the TT -p data, and since a complete random search
+ would have been much too time -consuming, solutions to the TT -p phase-
shift search were used as starting points for the I-spin 3/2 phase shifts.
In general, the initial searches.~were performed by programs simpler
than PIPANAL lCF4 in order to save time. The "good" solutions
obtained from these programs were then used as sta,.rting points for
PIPANAL 1CF4. In the TT + -p phase-shift analysis, :foote found only one
solution, 3 whi~h was of the Fermitype that fitted all the TT + -p data ad
equately (s3 , 1 = 18.5 deg, P3
,1
= -:-4.7 deg, P3
,3
= 134.8 deg, D3 , 3 =1.9
deg, and D3
, 5
= -4.0 de g). This solution was the starting point for most
of the searching. However, some searching was also done with other ..... -- - --- -f .... , .
much less likely TT -p solutions, which had also been found by Foote.
All together, 130 different phase-shift sets we-re used'as starting points
in the investigation~ This resulted in four acceptable solutions to all the
1T + -p data, and the DCS and TCS data, for if- -p elastic reaction. If the
re'c'oil-·proto:ii' polarization daht:' fa·:r rr- ..-P s catte.rfrig as well as the charge
exchange data were used, only one solution giving a reasonable fit to all
the data remained. The four solutions for the incomplete data, and the
final solution for all the data, are given in Table XL The next best fit
to all the data is also given even though it is statistically an unacceptable
solution. The error matrix for the single spd solution that agrees with
all the data is given in Appendix B. A study of the effects of various
data on. the phase-shift errors is shown in Table XII. It will be noted that
the addition of polarization and charge -exchange data makes little dif
ference in determining the errors on the phase shifts, but can aid greatly
in distiguishing between different sets of phase shifts that fit the other
data about equally well. The errors on the spd phase-shift solution vary
from 0.4 to 1. 1 deg.
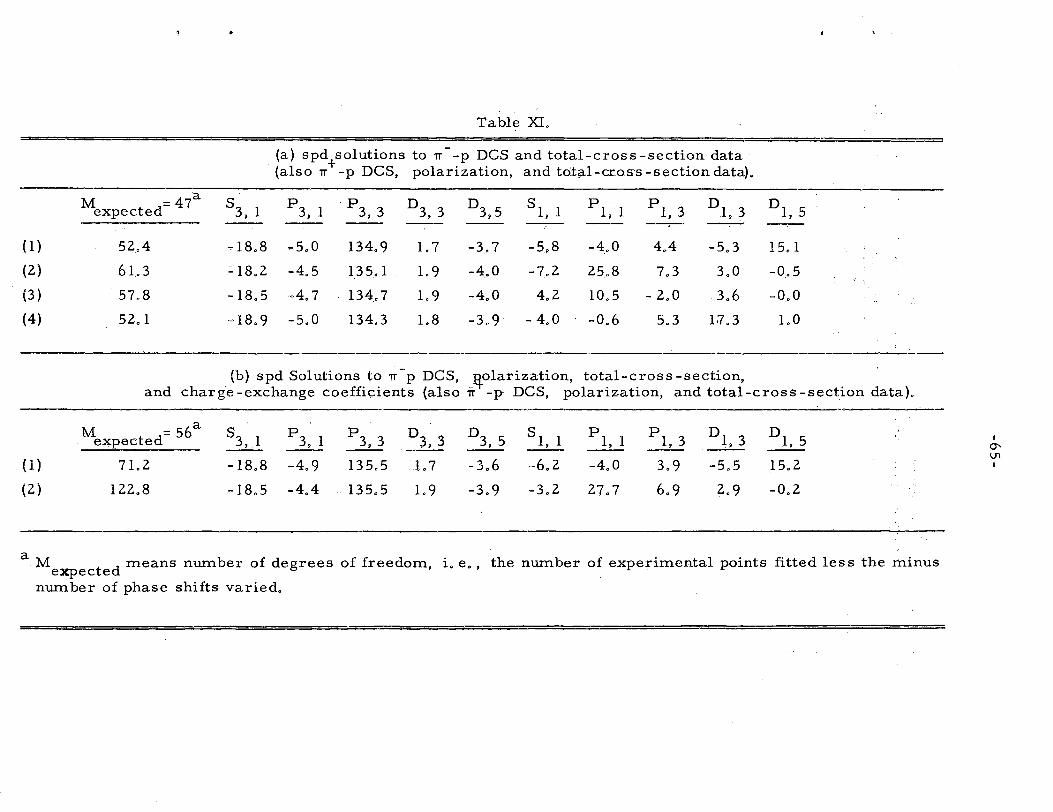
Table XL
(a} spd+solutions to 1T - -p DCS and total-cross -section data
(also 1T -p DCS, polarization, and total-cross -section data}.
M =47a expected 8
3, 1 P3, 1 . P3, 3 D3, 3 D3,5 8 1, 1 p 1, 1 pl, 3 D1, 3 D J, 5
----:--'-'
(l} 52,4 -18.8 -5.0 134.9 1.7 -3.7 -5.8 -4.0 4.4 -5.3 15. 1
(2) 61.3 :-18.2 -4.5 13 5. 1 1.9 -4.0 -7.2 25.8 7.3 3.0 -0.5
(3} 57.8 -18.5 -4.7 134.7 1.9 -4.0 4.2 10.5 - 2.0 3.6 -0.0
(4) 52. 1 -18.9 -5.0 134.3 1.8 -3.9 -4.0 -0.6 5.3 1·7 .3 1.0
(b) spd Solutions to 1T-p DCS, Jfolarization, total-cross -section, · and charge-exchange coefficients (also ir -p DCS, polarization, and total-cross-section data).
M = 56a 83,1 p3, 1 p3, 3 D3 3 D3, 5 8
1 1 p1 1 p1, 3 D1 3 Dl, 5 I expected -·-·- --'- ' -·-·- 0'
(l} 71.2 -18.8 -4.9 13 5.5 1.7 -3.6 -6.2 -4.0 3.9 -5.5 U1
15.2 I
(2) 122.8 -18.5 .. 4,4 135.5 1.9 -3.9 -3.2 27.7 6.9 2.9 -0.2
a M t d means number of degrees of freedom, i.e., the number of experimental points fitted less the minus expec e
number of phase shifts varied.
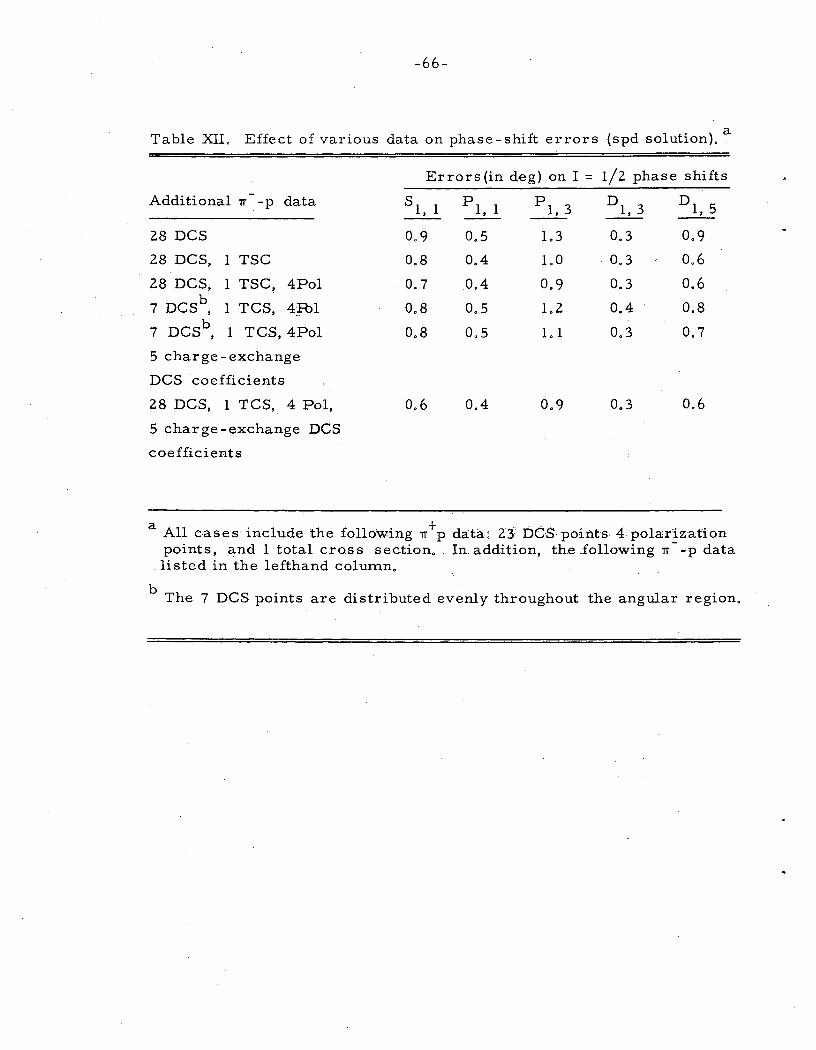
-66-
Table XIL Effect o£ various data on phase-shift errors (spd solution). a
Errors (in deg) on I = 1/2 phase shifts
Additional rr -p data s 1, 1 Pl, 1 pl, 3 Dl, 3 Dl, 5
28 DCS 0.9 0,5 1.3 0,3 0,9
28 DCS, 1 TSC 0.8 0.4 1.0 0.3 0.6
28 DCS, 1 TSC, 4Pol 0.7 0.4 0.9 0.3 0.6
7 DCSb, 1 TCS, 4-R:>l 0.8 0.5 1.2 0.4 0.8
7 DCSb '
1 TCS, 4Pol 0.8 0.5 1.1 0.3 o. 7
5 charge- exchange
DCS coefficients
28 DCS, 1 TCS, 4 Pol, 0.6 0.4 0.9 0.3 0.6
5 charge- exchange DCS
coefficients
a All cases include' the following iT+ p data: 23: bCS: points 4 polarization points, and 1 total cross section. In addition, the _following 1T- -p data listed in the lefthand column.
b The 7 DCS points are distributed evenly throughout the angular region.
-67-
2. spdf Investigations
The spdf analysis closely followed the general procedure of the
spd analysis. Again, random phase shifts were used for the input
I-spin 1/2 shifts, except fo::r the f waves, which were set equal to zero.
The initial I-spin 3/2 shifts were again chosen to be the solutions of
Foote's spdf rr + -p analysis. There were two of these solutions, called
here Fermi I and Fermi II. The 480 different initial sets of phase shifts,
approximately balanced between the two 1·-·Spin 3/2 solutions, were fed + into the computer with varying amounts of data.. When all the rr -p data
and only the ·rr- -p DCS and TCS were used, thirteen acceptable solutions
were found; but with the addition of the rr :p polarization data, the number
of acceptable solutions was reduced to six. The addition of the charge
exchange data further reduced the number of solutions to three. Finally,
two of these three solutions appear to be somewhat more likely than the
third.
The three phase-shift solutions are given in Table XIII. The
error matrices for these three solutions are found in Appendix B.
Solution I is the spdf counterpart of the only acceptable solution
of the spd analysis. It was the most frequently occurring solution,
having appeared 37 times during the random search.
Solution II exhibits the Fermi II behavior (D3
, 3
•·D3
, 5
< 0) of
Foote 1 s second solution, but soine of the shifts are rather different from
those obtained in the 1T + -p analysis. Nevertheless, the solution gives a
good fit to most of the experimental data. It should be noted that this
solution was found only by starting the initial search with Fermi I
I-spin 3/2 phase shift sets. No solutions fitting all the data were found
by starting the search fron1. Foote's Fe:rmi II solution. We can thus
conclude that Foote's Fermi II solution is not an adequate fit to all the
data.
Solution IIT gives a rather poor fit to the data. Statistical argu
ments29 indicate that an acceptable solution has less than a 2.9'l'o chance
of having an M value as high as that of solution IlL Although it is rather
unlikely, we have presented it for completeness. All other solutions ob
tained had a probability of less than 0.5o/oo£ being acceptable.
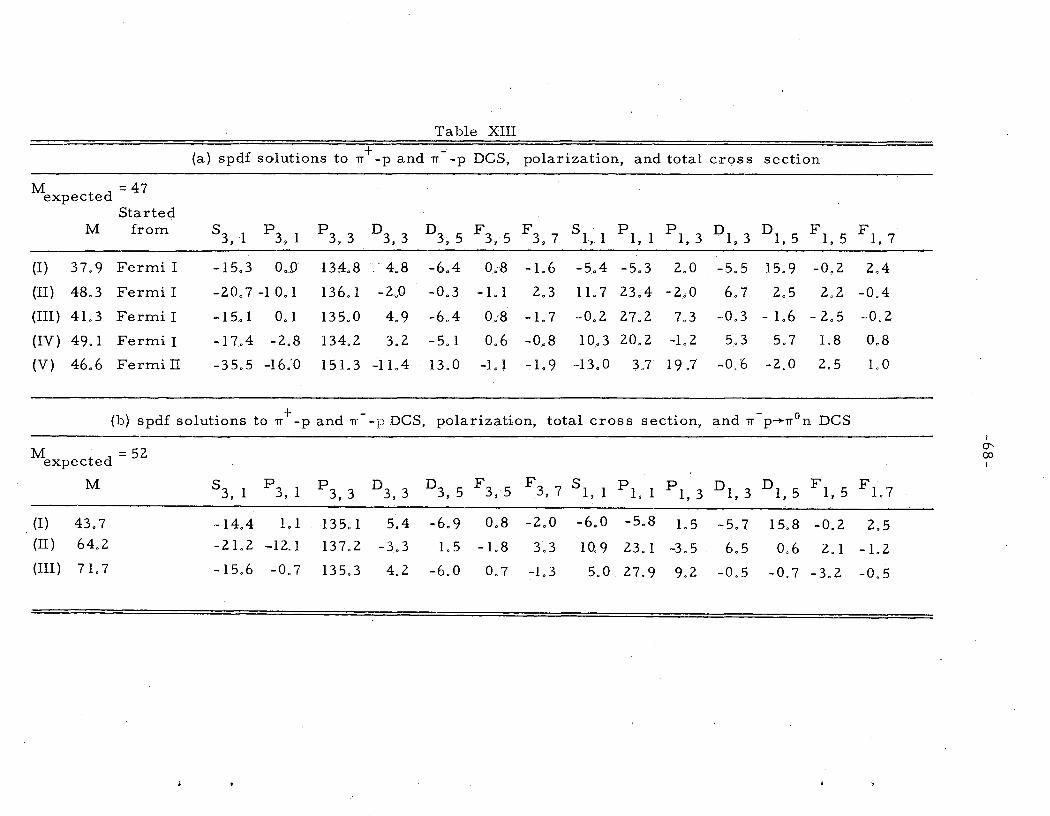
Table XIII
(a) spdf solutions to 1T + -p and 1T
- -p DCS, polarization, and total eros s section
M =47 expected Started
M from 53,1
p p3 3 D3, 3 D3 5 F3,.5 F3, 7 51. 1 p 1 1 p1, 3 D1, 3 Dl, 5 F1, 5 F I, 7 3, 1
. ' - . ' ' (I) 37.9 Fermi I -15.3 O.,D 134.8 -- '4.8 -6.4 o.-8 -1_. 6 -5.4 -5,3 2.0 -5.5 15.9 -0,2 2.4
(II) 48.3 Fermi I -20.7 -1 0. l 136.1 -2.0 -0.3 -1.1 2.3 11.7 23.4 ~2.0 6.7 2.5 2.2 -0.4
(III) 41.3 Fermi I -15 .. 1 0.1 135.0 4.9 -6.4 0.-8 -1.7 -0.2 27.2 7.3 -0.3 - 1.6 - 2. 5 -0.2
(IV) 49.1 Fermi I -17.4 -2.8 134.2 3.2 -5. 1 0.6 -0.8 10.3 20.2 -l. 2 5.3 5.7 1.8 0.8
(V) 46.6 Fermi II -3 5. 5 -16:0 151.3 -11.4 13.0 -1. l -1.9 -13.0 3 .. 7 19.7 -0,6 -2.0 2.5 1.0
(b) spdf solutions to 1T + -p and rr
- -p DCS, polarization, total cross section, and 1T- p-+TI 0 n DCS I
M =52 0' 00 expected I
M 5 3, 1 p3, 1 p3, 3 D3, 3 D3, 5 F F3,7 51, 1 P1, 1 p1, 3 D1, 3 D1 5 F 1, 5 Fl.? 3,5
' (I) 43.7 -14.4 1.1 135.1 5.4 -6.9 0.8 -2.0 -6.0 -5.8 1.5 -5.7 15.8 -0.2 2.5 (II) 64.2 -21.2 -12.1 137.2 -3.3 1.5 -1.8 3.3 10.9 23. 1 -3.5 6.5 0.6 2.1 -1.2. (III) 71.7 -15.6 -0.7 135.3 4.2 -6.0 0.7 -1.3 5.0 27.9 9.2 -0.5 -0,7 -3.2 -0.5
-69-
3. Inelastic Scattering
All the phase- shift investigations thus far mentioned in this
section were carried out as surning the inelastic eros s sections for 11" +_p
and 11" -p scattering to be identically zero. This, of course, is not the
case. However, for 11" + -p scattering,. the inelastic cross section is
about 0. 5 mb30 • 31 compared with the elastic total cross section of about
60 mb, 1 and therefore the assumption that there was no inelastic scat
tering is quite good. For 11"- -p scattering the inelastic total cross sec
tion is about 1.0mb, 32• 33 and the elastic total cross sect.ion is about
28 mb. Thus, the inelastic cross section is 3 or 4o/o of the elastic and
obviously cannot be neglected. The effect of inelastic scattering on the
I-spin l/2 phase-shift solution has been studied in the following way.
The solutions of the spd and spd£ analyses were used as starting points
for a search with PIPANAL lCF4. The I-spin 1/2 inelastic parameters
were started at l. 0, 0. 95, and 0. 90 for each solution. An appropriate
value of the I- spin l/2 part of the inelastic rr- -p total cross section was
used in the program. The result of this analysis was that only a small
. effect was noted in the phase shifts. The values of the inelastic param
eters determined by the program were all ;:: 0. 975, with more than half
of them being equal to 1.0. These values were essentially independent
of their starting point in the program. The I-spin l/2 phase shifts
themselves were not changed by more than the quoted errors on these
shifts. The conclusion of this analysis is that, at this energy, inelastic
scattering does not play an important part in the determination of the
phase shifts.
-70-
VI. DISCUSSION OF RESULTS
The basic goal of this experiment, fo obtain accurate DCS
data for 1T p scattering, has been attained. We measured 28 DCS
points· with counting statistics of about 3%. However, a phase-shift
ab.alysi·s utilizing this and other available data at 310 MeV has not been
'as satisfactory. Although a single acceptable solution was· obtained for
spd'analy.sis, all 66 pieces of information available had to he utilized
. i~ order to reje.ct all other possible solutions except this one. The ex
tensi~n of the analysis to include ··f waves was even less satisfactory.
The inclusion of even small f waves introduced one and possible two
new solutions; which differed markedly in some phase· shifts from the
spd solution. ··This may cast doubt on one of the basic· assumptions of
·the analysis, i. e. , that higher antgular momentum· states contribute
only very slightly to the interaction at a given energy, and hence may
·be· neglected; ·In the spdf analysis We have seen that although the f
waves are rather small, they have had a considerable effect, intro
ducing solutions rather different from the spd solution.
it appears that in order to choose the corre'ct solut'ion'in the
spdf analy~is, one needs more data. The major limitation of the pres
:.e~t pion_;nucfeon data at 310 MeV is the lin{ited ·ang~lar reg:lon
(114 deg ~f) ; ~ 146. deg) in which 1T--p polarization data;exist. Un-cm
'fortunately, the techniques needed to obtain data at smaller c. m. angles
are somewhat different and more complicated than those that used to
obtain the existing data .. Although such measurements are possible,
no data exist at present.
There is theoretical as well as experimental help that might
be utilized. It is hoped that a theoretical approach along the lines used
in nucleon-nucleon scattering34
will be developed, and that accurate
predictions of the higher angular momentum phase shifts can be made,
Chew et al. have used relativistic dispersion relations to make predic
tions of the I = 3/2 and 1/2 pion-nucleon d-wave phase shifts up to about
300 MeV. 35
These calculations do not contain possible pion-pion inter
action effects and so may not describe these phase shifts accurately.
-71-
Although some of the d-phase shifts in our solutions do agree with these
predictions in sign, the agreement in magnitude is· not good, and in fact
some of our solutions do not even agree in sign. It is felt that such dis
agreement should not be taken too seriously p.ntil possible tr-~ effects
can be included in the calculation.
Theoretical predictions of the real part of the forward scattering,
Re[g(O deg)], using dispe.rsion relations, have been made by Spearman + - 36 for 1r -p and 1r -p scattering. The values quoted here were for the
choice f2 = 0. 08, where f
2 is the renormalized, unrationalized, pion
nucleon coupling constant. + For 1r -p, Spearman finds
Re[g( 0 deg)] = - 0.69,
and for 1r -p,
Re[ g(O deg)] = - 0.06,
1n units of 11/f.!c, where fl. denotes the pion rest mass.
The values of the real part of the forward scattering, as calcu
lated from the spd and spdf solutions, are statistically in agreement
with the theoretical prediction listed above.
It appears that, at present, no theoretical or experimental data
exist that can resolve the ambiguities in the spdf analysis. However,
some progress has been .. made in the knowledge of the phase shifts at·
310 MeV. Previously, there was no accurate information about the
I = 1/2 phase shifts at the energy, but now a choice of three individually
accurate sets of phase shifts is available. Also, one I = 3/2 solution
found by Foote (Fermi II in his notation) 3 was discarded as unable to
fit all the data adequately. The basic difficulty brought forth by the anal-
ysis is the need fo'r very large amounts of experimental data if accurate
information about the phase shifts is desired when d, f, and higher par
tial waves become important. At 310 MeV the inelastic scattering did
not add a serious complication. However, because of the sharp in
crease in inelastic cross section with energy near 300 Mev,32
phase
shift analysis at slightly higher energies will become even more
-72-
complicated, since appreciable inelastic scattering essentially doubles
the number of parameters .that must be determined in the analysis" It
appears that because of these requirements for very large amounts of
data, the method of phase-shift analysis became less useful at these
energies than it had been at lower energies. Evenutally, more interest
may center on the experimental data themselves and less on the results
of the present method of analysis of those data. In this way, it is hoped
that the measurements described in this report will make a significant
contribution_ toward the quantitative understanding of the pion-nucleon
interaction"
-73-
ACKNOWLEDGMENTS
It is a pleasure to acknowledge the continued support of
Professor Emilio Segre and of the entire research group under his
leadership. The constant optimism and support of Professor Thomas
Ypsilantis during this experiment as well as throughout the author's
graduate. career is greatly appreciated,
To Dr. Olav T, Vik, with whom the author has worked from the
beginning of this experiment to the present, must go the greatest appre
ciation, not only for his able aid during the DCS measurements and his
careful measurements of the recoil proton polarization, but for his
never-ending willingness to discuss and clarify problems concerning
the experiment and phase -shift analysis, His almost unique ability and
willingness to work in the early morning hours alone has won the author's
eternal gratitude,
The suggestions of Dr. Norman Booth, and numerous discussions
with him and with Dr, Ernest Rogers, are gratefully acknowledged,
Thanks are due to Mr. David Jenkins for able assistance with tedious
calculations and much of the programming chores. Mrs. Patricia M.
Brown is .to be thanked for her cheerfulness, as well as her accuracy
while typing manuscript,
The excellent cooperation and assistance of the 184-inch cyclotron
crew under the leadership of Mr. James Vale, as well as the help of ac
celerator technicians, is gratefully acknowledged,
This work was done under the auspices of the U. S, Atomic Energy
Commission.
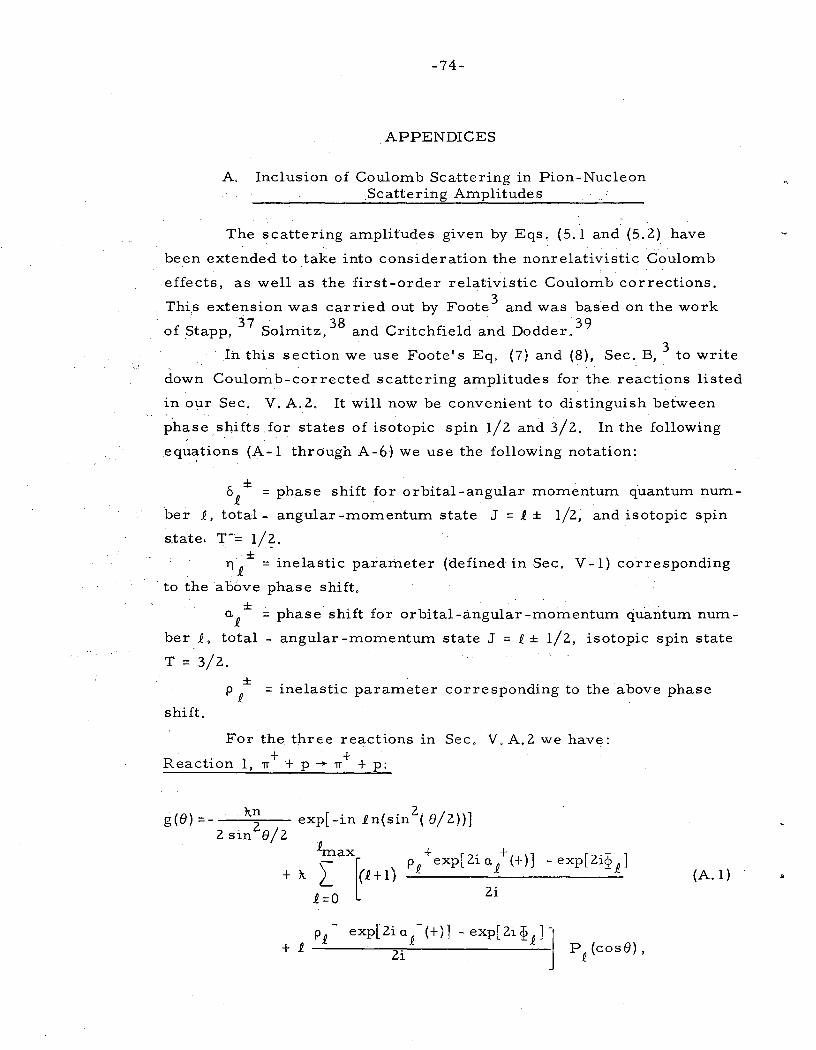
-74-
APPENDICES
A. Inclusion of Coulomb Scattering in Pion-Nucleon Scattering Amplitudes
The scattering amplitudes given by Eqs. (5. 1 and (5. 2) have
been extended to take into consideration the nonrelativistic Coulomb -·
effects, as well as the first-order relativistic Coulomb corrections.
This extension was carried out by Foote 3 and was based on the work
of Stapp, 37 Solmitz, 38 and Critchfield and Dodder. 39
Ih this section we use Foote's Eq. {7) and (8), Sec. B, 3 to write
down Coulomb-corrected scattering amplitudes for the reactions listed
in our Sec. V. A. 2. It will now be convenient to distinguish between
phase s_hifts .for states of isotopic spin 1/2 and 3/2. In the following
equations (A-1 through A-6) we use the following notation:
:1: o.e =phase shift for orbital-angular momentum quantum num-
ber £, total- angular -momentum state J = 1 ± 1/2; and isotopic spin
s.tate. T-= 1/?.
11 1
± = inelastic parameter (defined in Sec. V -1) corresponding
·to the above phase shift. ±
a1
=phase shift for orbital-angular-momentum quantum num-
ber 1, total - angular -momentum state J = £ ± 1/2, isotopic spin state
T = 3/2. ±
p 1
= inelastic parameter corresponding to the above phase
shift.
For the three reactions in Sec. V. A. 2 we have: + + Reaction 1, 1T + p-+ 1T + p:
g(8) =- · · }tn exp[ -in £n(sin 2( 8/2))] . 2 sin
2ej2
+ }t P_e +exp[2ia/(+)] -exp[2i1
1]
2i (A.1) .
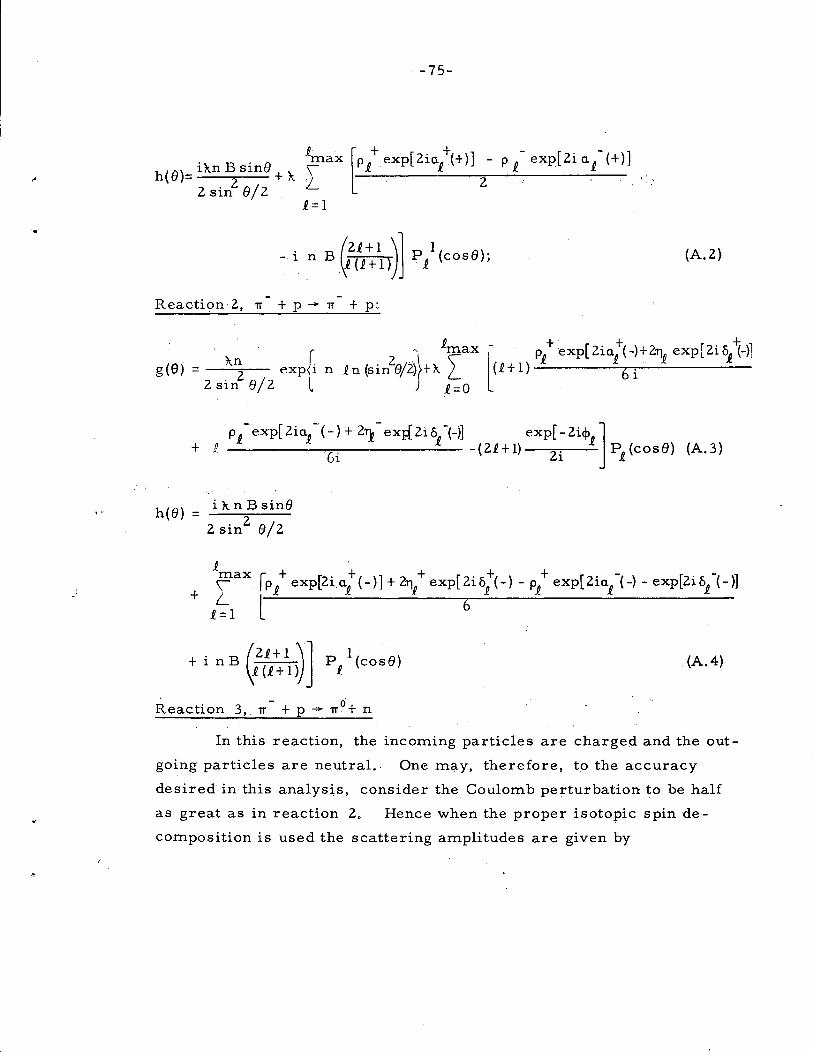
.•
, ..
)
-75-
. .,_ B . 8 .max Pn exp[2ia.n (+)] - P_ n exp 2i a1 (+} J. [ + + - [ - ] h( 8 )=11\.n sm t)t \ x. x. x., . .
2 sin2 8/2 L 2
· 1.=1
. (21+1 \] 1 -1 n BV(J.+l}) P1 (cos8);
-Reaction 2, 'IT + p -+ 'IT + p:
(A.2)
t -·~ 1
max· .l- · r/exp[2ia;(-)+21l_e exp[2io1~-)1 g (a) = }t~ exp i n £ n {sin 28/2) + }t ~ (£ + 1} ------'--,--,i,..-------
2sin 8/2 £=0 ·
p £- exp[ 2ia1- (-) + 21)- exi{ 2i o1
-(-)] exp[- 2icj>£] + p 6i -(2£+1) Zi P1 (cos8) (A.3}
h(8} =
+
i}tnBsin8
2 sin2 8/2
+ i n B (2£+ 1
\] £ (£ + 1 >)
1 P1
(cos8) (A.4}
In this reaction, the incoming particles are charged and the out
going particles are neutral.. One may, therefore, to the accuracy
desired in this analysis, consider the Coulomb perturbation to be half
as great as in reaction 2. Hence when the proper isotopic spin de
composition is used the scattering amplitudes are given by
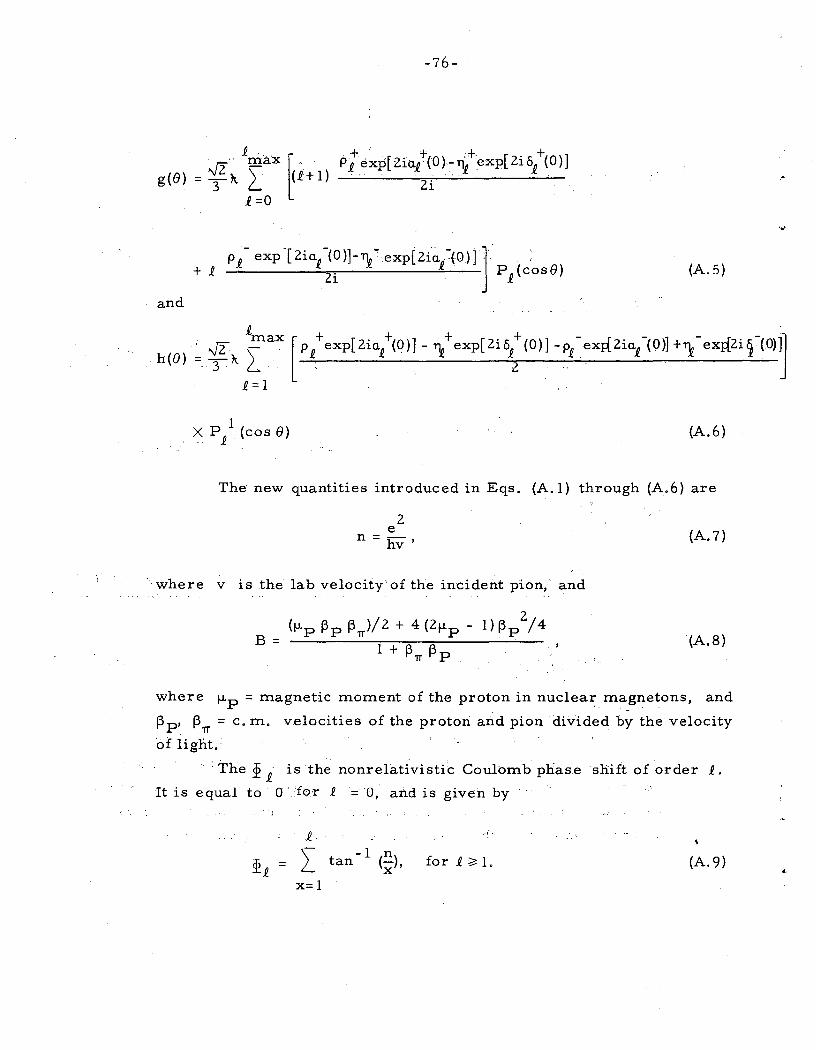
-76-
.+ [ +(.) + '[2•{:+(0)] Pg exp · ziai.? .·~ 11_e exp 1 ui .
2i .•
pi- exp T 2ia.1-(0 )]- '"' exp( 2i~1-:(0) j ]• ·.· , + i · Zi Pi(cose) (A.5)
and
£ . max [ + + + + - - ~ - ..J - ]~ _ .J2 \ pi exp[2.ia.1 (0)]- ~ exp[2i&i (0)] -pi e. xi{2ia.i (0)1 +~ exa2i~ (0)
h (e) -. T }1. L :. 2 · .
i=l .
I X: pi (cos e) (A.6)
The new quantities introduced in Eqs .. (A. I) through (A.6) are
2 e
n = hv'
· where v is the lab velocity·of the incident pion, and
. '
{A. 7)
{A.8)
where fJ.p = magnetic moment of the proton in nuclear ma_gnetons, and
f3p· f31T = c. m. velocities of the proton and pion divided by the velocity
of light.·
·. • The 2 i is the nonrelativistic Coulomb phase shift of order P..
It is equal to 0 · for .R. = 0, and is given by
.R. . '
{ ) for i ~I. ~.R. = L tan-1 n
x' {A.9)
x=l
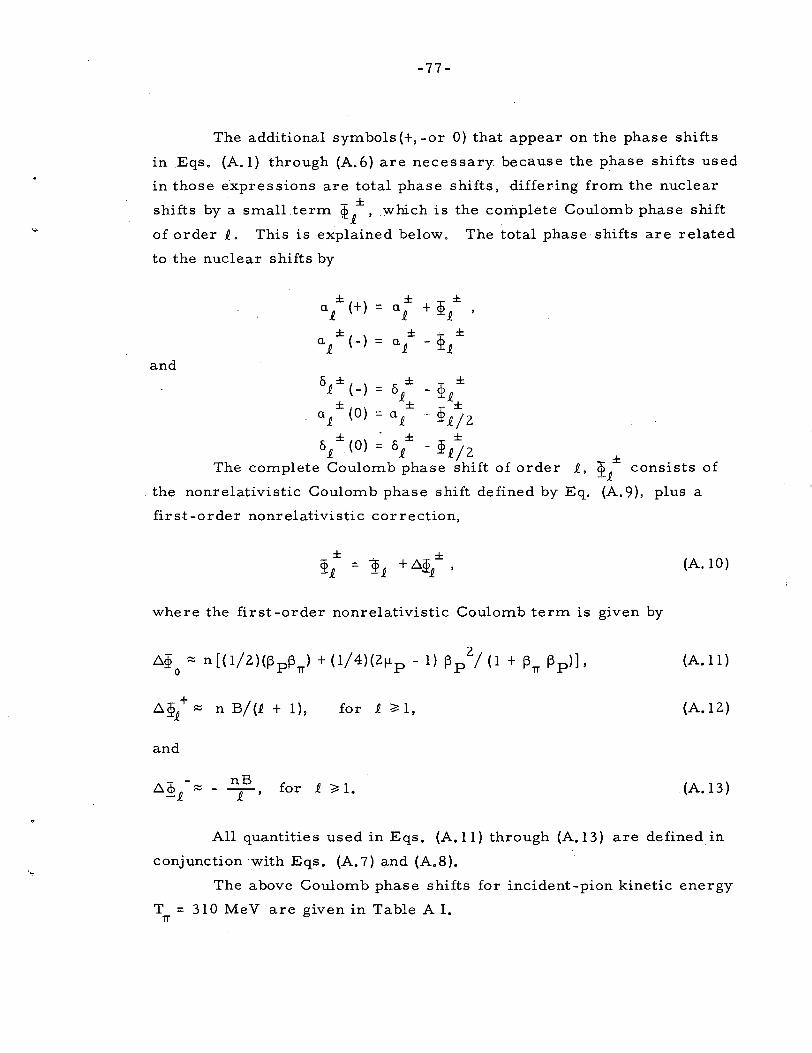
-77-
The additional symbols(+, -or 0) that appear on the phase shifts
m Eqs. (A.l) through (A.6) are necessary because the phase shifts used
in those expressions are total phase shifts, diffedng from the nuclear
shifts by a small term ~ /, which is the complete Coulomb phase shift
of order £. This is explained below. The total phase shifts are related
to the nuclear shifts by
and
± a.£ (+) =
± a (-}
.£
0.£± (-) = 6 ± - ± ± .£± - ~.£±
a 1 (0) = a 1 -· ~.£/ 2 ± . ± ±
6.£ (0) = 6.£ - ~.£/2 The complete Coulomb phase shift of order .£, P../ consists of
. the nonrelativistic Coulomb phase shift defined by Eq. (A. 9), plus a
first-order nonrelativistic correction,
(A. 10)
where the first-order nonrelativistic Coulomb term is given by
D.g?0
::::: n[(l/2}(f3pf3lT) + (l/4}(2f.Lp- 1) f3p2
/ (1 + f3lT f3p)], (A.ll)
s~/ ::::: n B/ (.£ + 1), for .£~1, (A. 12)
and
nB D. <f> - ::::: - -- for .£ ~ 1.
-.£ .£ ' (A. 13)
All quantities used in Eqs. (A.11) through (A.13) are defined in
conjunction with Eqs. (A. 7) and (A.8).
The above Coulomb phase shifts for incident-pion kinetic energy
T = 310 MeV are given in Table A I. lT
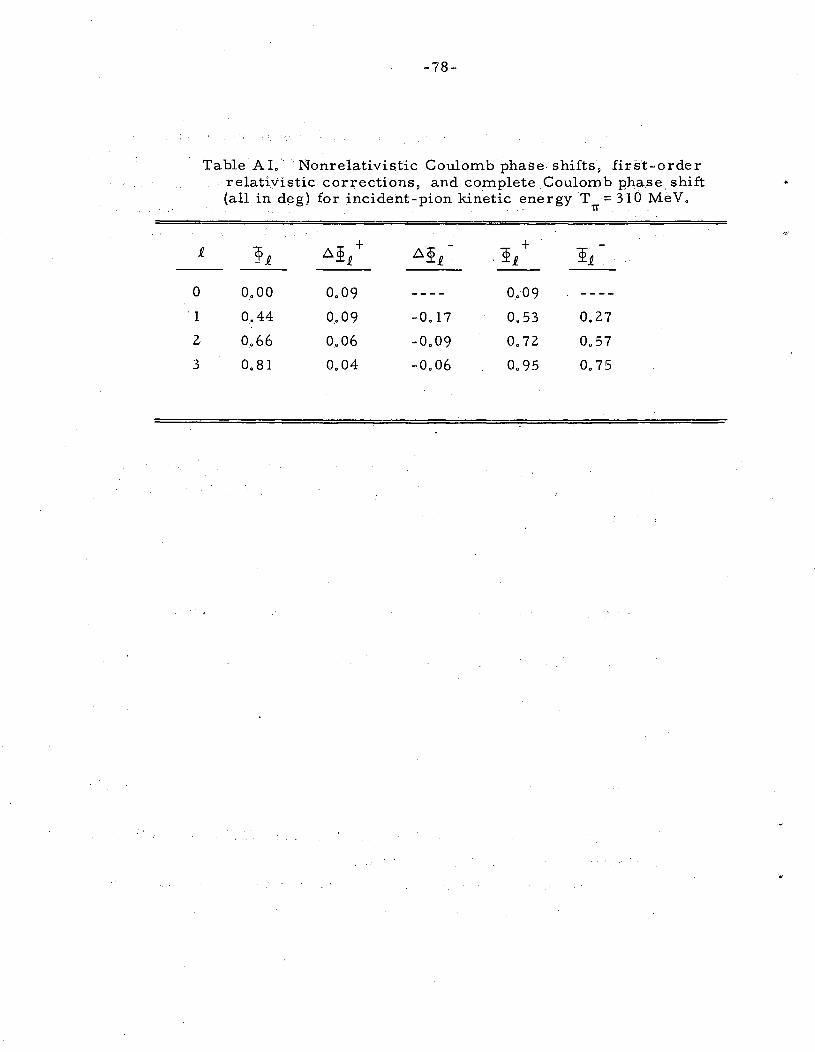
-78-
Table AI.' Nonrelativistic Coulomb phase shifts, first-order rel~tivistic corrections, and complete Coulomb phase, shift (all in deg) for incident-pion kinetic ~nergy TlT = 310 MeV.
p_ }p_ D.!p_ +
0 0.00
I 0.44
2 0.66
3 o. 81
0.09
0.09
0.06
0.04
-0.17
-0.09
-0.06
0.09
0.53
o. 72
0.95
0.27
0.57
o. 75

-79-
Appendix B. Tables of Error Matrices for spd and spdf Solutions
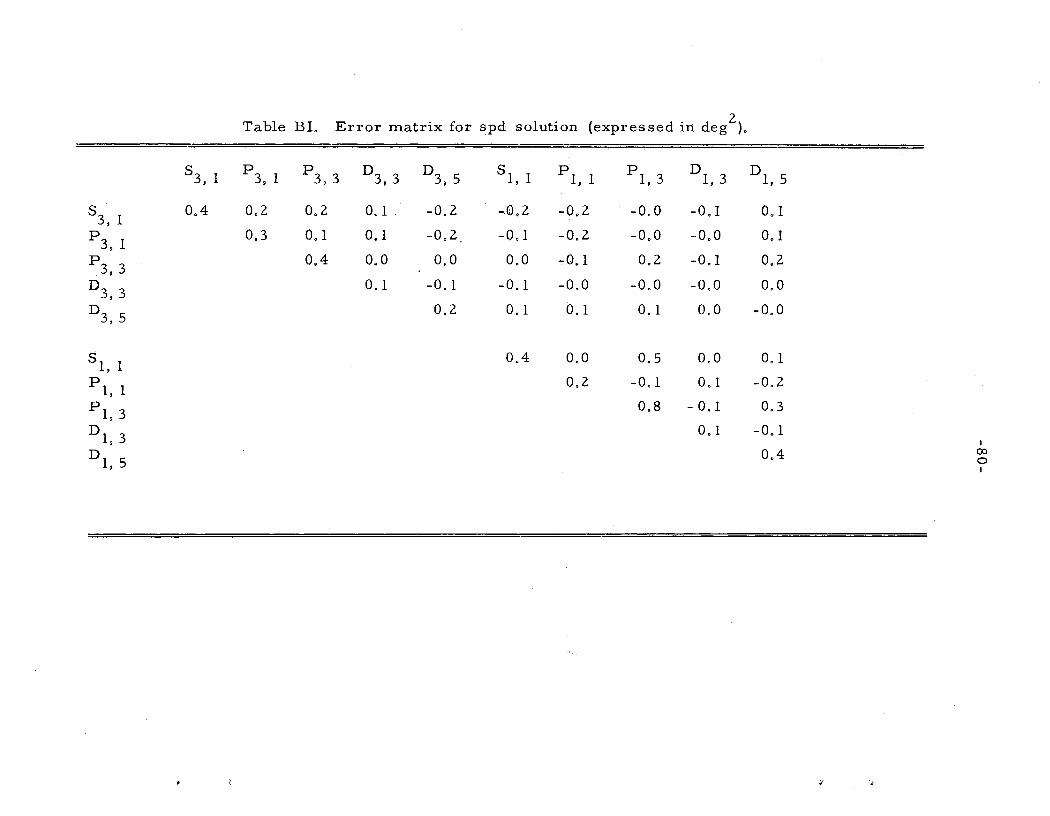
Table BI. Error matrix for spd solution (expressed in deg2
).
5 3, 1 p3, 1 p3, 3 D3, 3 D3, 5 51, 1 PI
' 1 PI, 3 D
1, 3 Dl, 5
53, 1
0.4 0.2 0.2 0.1 -0.2 -.0. 2 -0.2 -0.0 -0.1 0.1
P3, 1 0.3 0.1 0.1 -0.2 -0,1 -0.2 -0.0 -0.0 0.1
P3, 3 0.4 0.0 0,0 0.0 -0.1 0,2 -0.1 0.2
D3, 3 0. 1 -0. 1 -0. 1 -0.0 -0.0 -0.0 0.0
D3, 5 0.2 0.1 0.1 0. 1 0.0 -0.0
5 1, 1 0.4 0.0 0.5 0.0 0. 1
p 1, 1 0.2 -0.1 0.1 -0.2
p1 3 0.8 - 0.1 0.3 '
D1, 3 0.1 -0.1 I
D1, 5 0.4 (X) 0 I
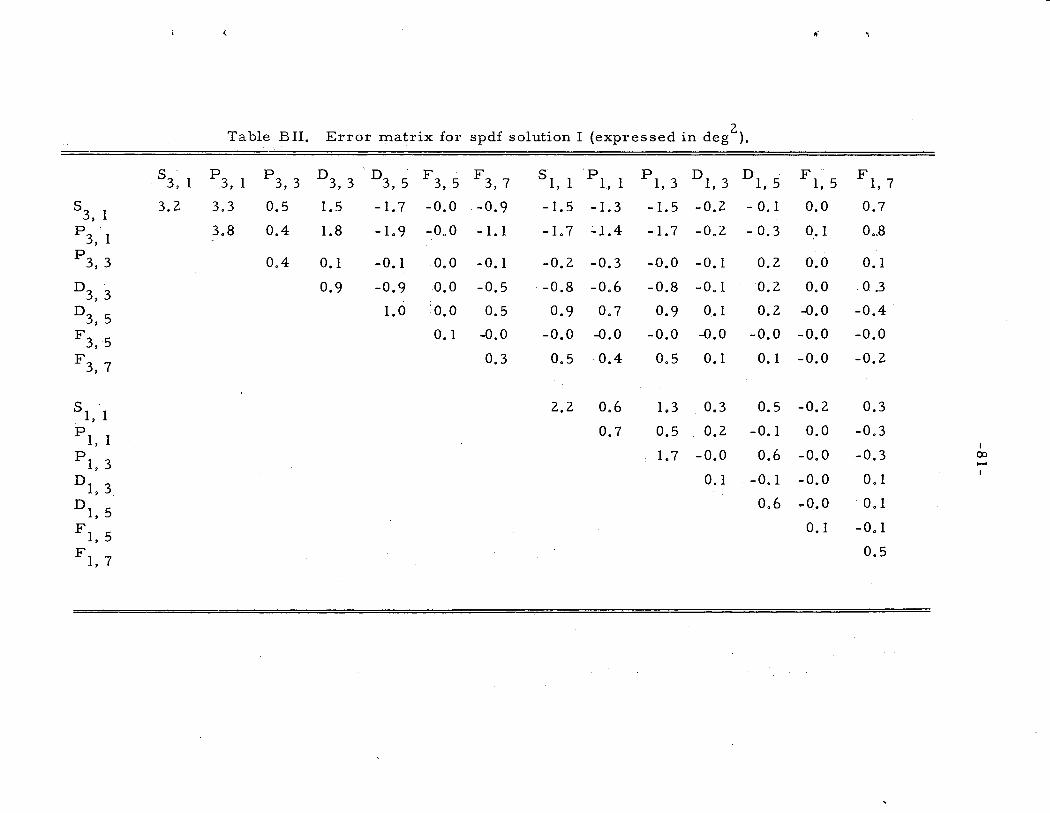
Table BII. Error matrix for spd£ solution I (expressed in deg2
).
53, 1 p3, I p3, 3 D3, 3 n3, 5 F3, 5 F3, 7 5
1 I ·pi l PI, 3 Dl, 3 Dl, 5 F ..
F I, 7 '
,, 1, 5
53, I
3.2 3.3 0.5 1.5 -1.7 -0.0 '-0. 9 -1.5 -1.3 -1.5 -0.2 - 0.1 0.0 0.7
p3, 1 3.8 0.4 1.8 -1.9 -0.0 -I. I -1.7 -l.4 -1.7 -0.2 - 0. 3 0.1 O.B
P3, 3 0.4 O.I -0. 1 0.0 -0.1 -0.2 -0.3 -0.0 -O.I 0.2 0.0 O.I
D3, 3 0.9 -0.9 o.o -0.5 -0.8 -0.6 -0.8 -0. I 0.2 0.0 0.3
D3, 5 1.0 ·o.o 0.5 0.9 0.7 0.9 0.1 0.2 -0.0 -0.4
F3, 5 0.1 -0.0 -0.0 -0.0 -0.0 -0.0 -0.0 -0.0 -0.0
F3, 7 0.3 0.5 0.4 0.5 O.I 0.1 -0.0 -0.2
5I I
2.2 0.6 1.3 0.3 0.5 -0.2 0.3 '
PI I 0.7 0.5 0.2 -0. I 0.0 -0.3 ' I
PI, 3 1.7 -0.0 0.6 -0.0 -0.3 CX> ...... I
ni, 3 O.I -O.I -0.0 0.1
D1, 5 0.6 -0.0 · 0. I
F 1, 5 O.I -O.I
FI, 7 0.5
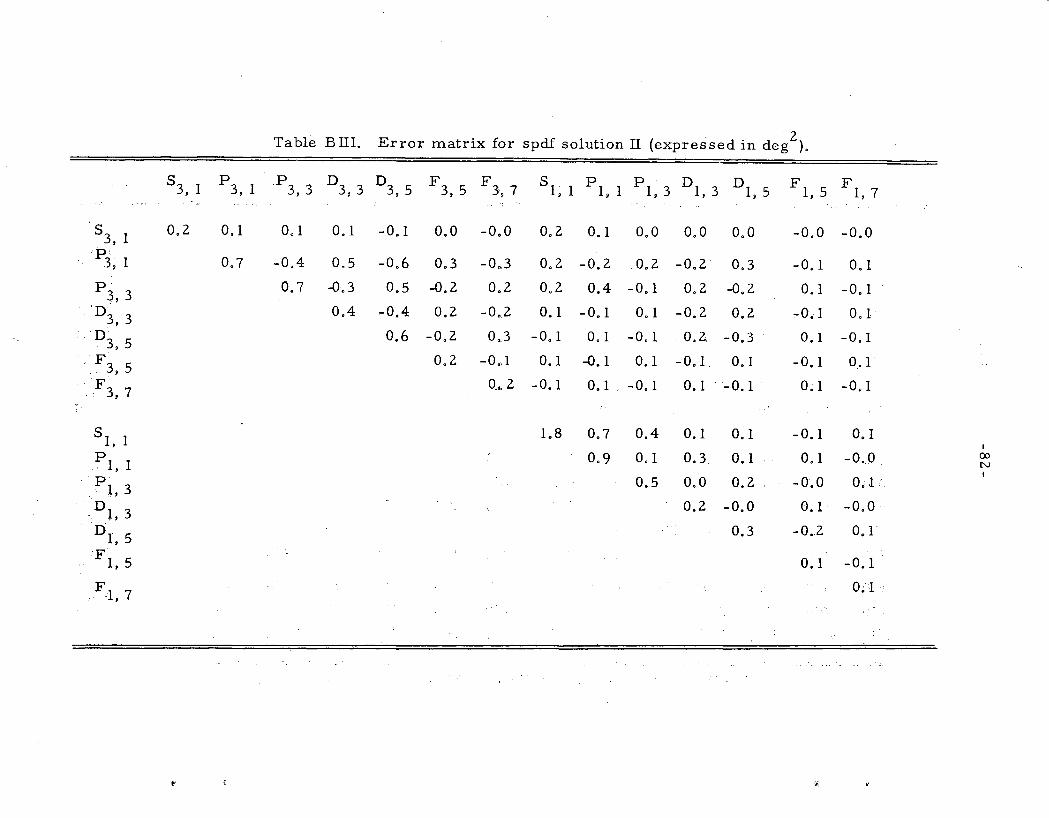
Table Bill. Error matrix for spdf solution II (expressed in deg 2 ).
53, I p3, I _p3, 3 n3, 3 D3 5 F3, 5 F3 7 5
I; I p 1 1 PI, 3 n1, 3 D1 5 F 1 5 F ' ' ' ' ' 1, 7
53, I
0.2 0.1 O.I 0.1 -0. I 0.0 -0,0 0.2 O.I 0.0 0.0 0.0 -0.0 -0.0
P' 3, I 0.7 -0.4 0.5 -0.6 0.3 -0 • .3 0.2 -0.2 0.2 -0.2 0.3 -0.1 O.I
p3 3 0.7 -0.3 0.5 -0.2 0.2 0.2 0.4 -0.1 0.2 -0.2 O.I -0. I _,
'D3, 3 0.4 -0.4 0.2 -0.2 0.1 -o. 1 0. 1 -0.2 0.2 -0. I 0.1
n3, 5 0.6 -0.2 0.3 -O.I O.I -0.1 0.2 -0.3 0.1 -0.1
F . 3, 5 0.2 -0.,1 O.I -0. 1 O.I -0. I_ 0.1 -O.I 0.1
-F ' 3, 7 0 .•. 2 -0. 1 0.1 ' -0. 1 O.I ' -0. 1 O.I -0.1
5 I, I 1.8 0.7 0.4 O.I 0.1 -O.I 0.1 I
p 0.9 O.I 0.3 0.1 0.1 -0._0 00 . I, I N
I p 0.5 0.0 0.2 -0.0 o,J. ·. I, 3
DI 3 0.2 -0.0 0.1 -0;0' ',
ni, 5 0.3 -0.2 O.T
Fl, 5 0.1 -0.1
F - -1, 7 o~--T ·
~-
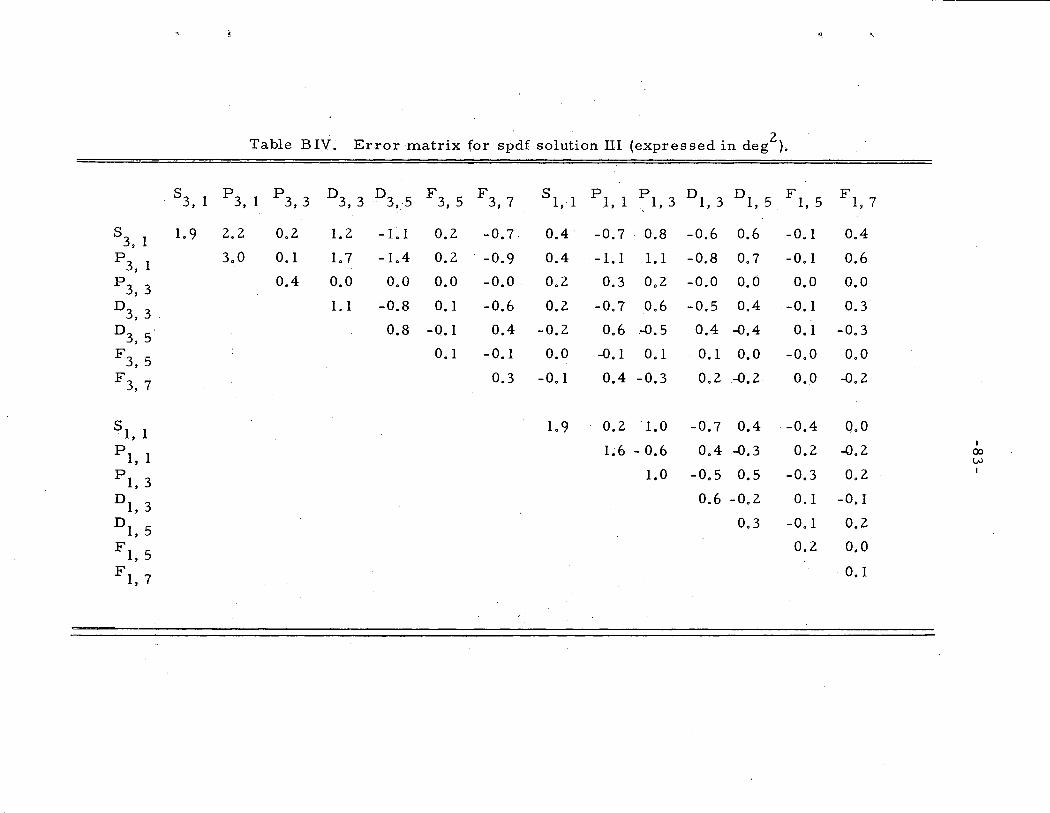
Table BIV. Error matrix for spdf solution III (expressed in deg 2 ).
· 5 3, I P3, I P3, 3 D3, 3 D3,-5 F3 5 • F3, 7 s I, I PI 1 '
PI 3 '
DI 3 '
DI, 5 FI, 5 F I, 7
53, I 1.9 2.2 0.2 1.2 -LI 0.2 -0.7 0.4 -0.7 0.8 -0.6 0.6 -O.I 0.4
p3, l 3.0 O.I 1.7 -I.4 0.2 -0.9 0.4 -I. I I. I -0.8 0.7 -O.I 0.6
P3, 3 0.4 0.0 0.0 0.0 -0.0 0.2 0.3 0.2 -0.0 0.0 o.o 0.0
D3, 3 I. I -0.8 O.I -0.6 0.2 -0.7 0.6 -0.5 0.4 -O.I 0.3
n3, 5. 0.8 -O.I 0.4 -0.2 0.6 -0.5 0.4 -0,4 O.I -0.3
F3, 5 O.I -O.I 0.0 -O.I O.I 0.1 0,0 -0.0 0.0
F3, 7 0.3 -O.I 0,4 -0.3 0.2 -0,2 0.0 -0.2
5 I, I 1.9 0,2 1.0 -0.7 0.4 -0.4 Q.O
PI I 1.6 - 0.6 0.4 -0.3 0.2 -0.2 I
00
• u.>
PI 3 1.0 -0.5 0.5 -0.3 0.2 I
' DI, 3 0.6 -0.2 O.I -O.I
DI, 5 0.3 -O.I 0.2
FI, 5 0,2 o.o
FI, 7 · 0. I
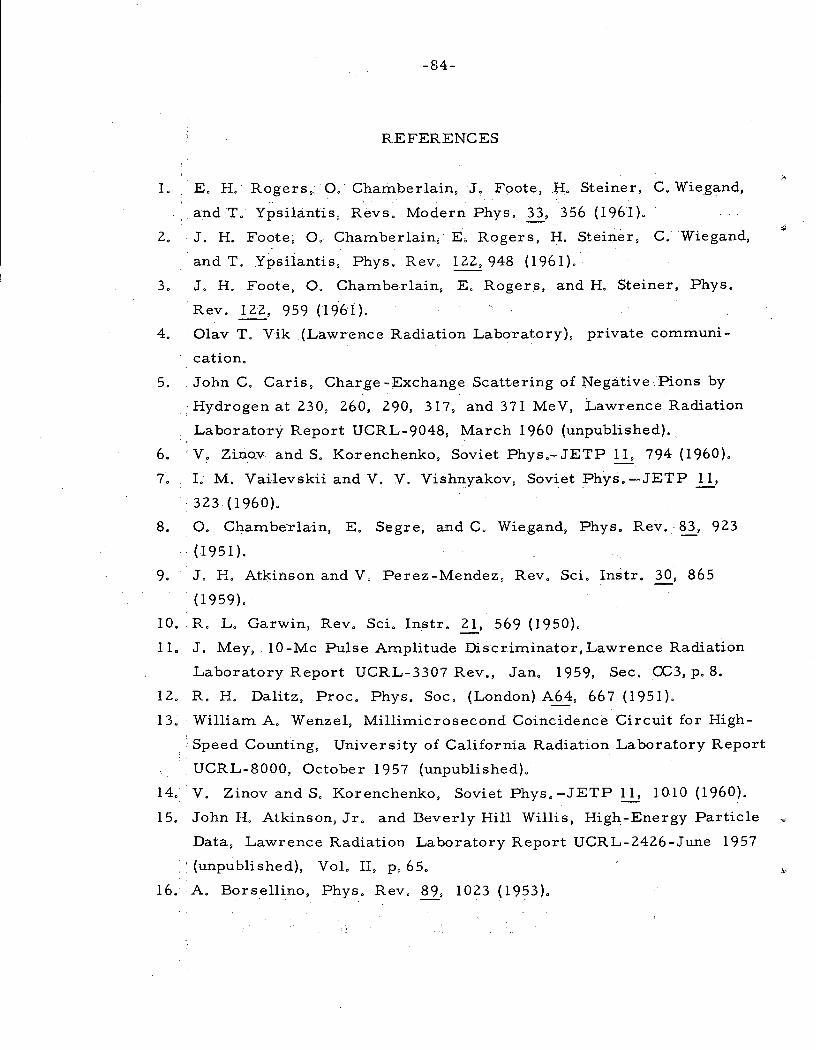
-84-
REFERENCES
I. E. H.· Rogers,o; Chamberlain, J. Foote, H. Steiner, C. Wiegand,
andT. Ypsilantis, Revs. Modern Phys. ~. 356 (1961).
2. J. H. Foote; 0, Chamberlain, E, Rogers, H. Steiner, C. Wiegand,
and T. Ypsilantis, Phys. Rev. 122,948 (1961).
3. J. H. Foote, 0. Chamberlain, E. Rogers, and H. Steiner, Phys.
·Rev. 122, 959 (1961}.
4. . Olav T. Vik (Lawrence Radiation Laboratory), private communi
cation.
5. . John C. Caris, Charge -Exchange Scattering of Negative Pions by
Hydrogen at 230, 260, 290, 3I7, and 37I MeV, Lawrence Radiation
Laboratory Report UCRL-9048, March I960 (unpublished),
6. V, Zino_v and S. Korenchenko, Soviet Phys.-JETP !..i! 794 (I 960).
7. I.- M. VailevskiiandV. V. Vishn:Yakov, SovietPhys.-JETP II,
' 323 ( 1960).
8. 0. Chamberlain, E. Begre, and C. Wiegand, Phys. Rev. 83, 923
. (1951).
9. J, H. Atkinson and V. Perez -Mendez, Rev. Sci, Instr. 30, 865
(I959).
IO. R. L. Garwin, Rev, Sci, Instr. ~. 569 (I950).
1 I. J. Mey, IO-Mc Pulse Amplitude Discriminator, Lawrence Radiation
Laboratory Report UCRL-3307 Rev., Jan. 1959, Sec. CC3, p. 8,
I2. R. H. Dalitz, Proc. Phys. Soc. (London) A64, 66 7 (195I ).
I3. William A. Wenzel, Millimicrosecond Coincidence Circuit for High-
. Speed Counting, University of California Radiation Laboratory Report
. UCRL-8000, October I957 (unpublished).
I4. V. Zinov and S. Korenchenko, Soviet Phys.-JETP Il, 1010 (I960).
15 .. John H. Atkinson, Jr. and Beverly Hill Willis, High-Energy Particle
Data, Lawrence Radiation Laboratory Report UCRL-2426-June 1957
··(unpublished), Vol. II, p. 65.
16. A. Borsellino, Phys. Rev, 89, 1023 ( 1953 ).
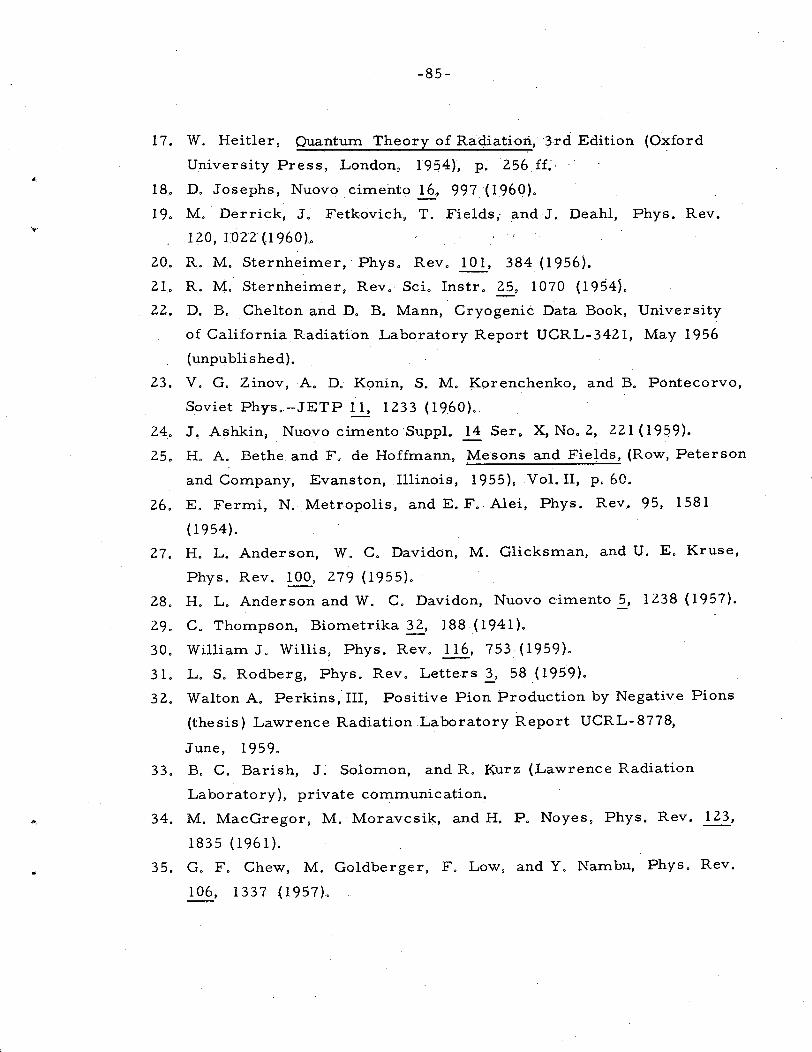
-85-
17. W. Beitler, Quantum Theory of Radiation, 3rd Edition (Oxford
University Press, London, 1954), p. 256 ff~ ·
18. D. Josephs, Nuovo cimento ~. 997 ( 1960).
19. M. Derrick, J. Fetkovich, T. Fields,. and J. Deahl, Phys. Rev.
120, I02Z(I960).
20. R. M. Sternheimer, · Phys. Rev. 101, 384 (1956).
21. R. M. Sternheimer, Rev.· Sci. Instr. ~. 1070 (1954}.
22. D. B. Chelton and D. B. Mann, Cryogenic Data Book, University
of California Radiation Laboratory Report UCRL-3421, May 1956
(unpublished).
23. V. G. Zinov, A. D. Konin, S. M. Korenchenko, and B. Pontecorvo,
Soviet Phys.-JETP ~ 1233 (1960).
24. J. Ashkin~ Nuovo cirnento Suppl. _!i Ser. X, No.2, 221 (1959).
25. H. A. Bethe and F. de Hoffmann, Mesons and Fields, (Row, Peterson
and Company, Evanston, Illinois, 1955), Vol. II, p. 60.
26. E. Fermi, N. Metropolis, and E. F. Alei, Phys. Rev, 95, 1581
( 1954).
27. H. L. Anderson, W. C. Davidon, M. Glicksman, and U. E. Kruse,
Phys. Rev. !00, 279 (1955).
28. H. L. Anderson and W. C. Davidon, Nuovo cimento 5, 1238 (1957).
29. C. Thompson, Biometrika~. 188 (1941 ).
30. William J. Willis, Phys. Rev. 116, 753 (1959).
31. L. S. · Rodberg, Phys. Rev. Letters ~-' 58 ( 195.9).
32. Walton A. Perkins, III, Positive Pion Production by Negative Pions
(thesis) Lawrence Radiation .Laboratory Report UCRL-8778,
June, 1959.
33. B. C. Barish, J; Solomon, and R. Kurz (Lawrence Radiation
Laboratory), private communication.
34. M. MacGregor, M. · Moravcsik, and H. P. Noyes, Phys. Rev. 123,
1835 (1961).
35. G. F. Chew, M. Goldberger, F. Low, andY. Nambu, Phys. Rev.
106, 1337 (1957).
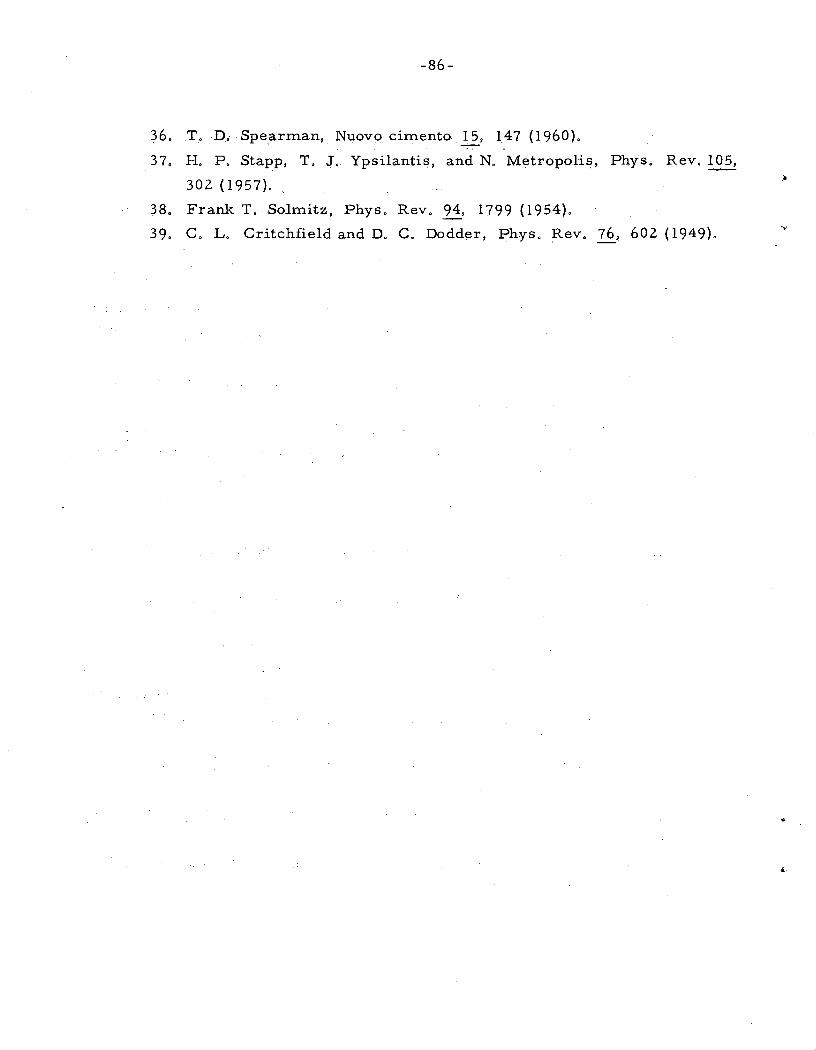
-86-
36. T. D. Spearman, Nuovq cimento _!2, 147 (1960).
37. H. P. Stapp, T. J. Ypsilantis, and N. Metropolis, Phys. Rev, 105,
302 (1957).
38. Frank T. Solmitz, Phys. Rev. 94, 1799 (195.4).
39. C. L. Critchfield and D. C. Dodder, Phys. Rev. 76, 602 (1949).
...
This report was prepared as an account of Government sponsored work. Neither the United States, nor the Comm1ss1on, nor any person acting on behalf of the Commission:
A. Makes any warranty or representation, expressed or implied, with respect to the accuracy, completeness, or usefulness of the information contained in this report, or that the use of any information, apparatus, method, or process disclosed in this report may not infringe privately owned rights; or
B. Assumes any liabilities with respect to the use of, or for damage~ resulting from the use of any infor-· mation, apparatus, method, or process disclosed in this report.
As used in the above, "person acting on behalf of the Commission" includes any employee or contractor of the Commission, or employee of such contractor, to the extent that such employee or contractor of the Commission, or employee of such contractor prepares, disseminates, or provides access to, any information pursuant to his employment or contract with the Commission, or his employment with such contractor.
"
•
f •
\
lUll l~lln
1'1111
J I