Embed Size (px)
Citation preview
CASIRJ Volume 5 Issue 12 [Year - 2014] ISSN 2319 – 9202
International Research Journal of Commerce Arts and Science http://www.casirj.com Page 153
EQUITY VALUATION USING ACCOUNTING NUMBERS
NITIKA AGGARWAL Assistant Professor,
University of Delhi
Abstract
This research primarily focuses on the valuation methodologies used to value firms with high
and low intangibles as scaled by the total assets of the firm. In doing so a structured positive
approach is applied in all chapters to explain the outcomes. Various statistical tools and
databases have also been used to support the results and give them a strong base. Chapter two
gives a brief overview of valuation literature explaining the different valuation models in
practice. Chapter three deals with an exhaustive study of a small sample of twenty-one firms and
their analyst reports. Strict investigation of the analysts‟ reports reveal that Discounted Cash
Flow (DCF) model is the most commonly used valuation model across the firms of the sample.
However, multiples-based approach has also been used frequently, but DCF supersedes as the
dominant model in most of the cases. The analysis is extended to a large sample of 1140
observations in chapter four and involves empirical study to find out the valuation technique that
gives the most approximate estimate of price. The mean valuation errors are minimal for the
harmonic mean multiple after the REVM model. This analysis proves the better prediction
capability of the REVM model over the multiples model. Further, on running a sensitivity
analysis by varying the terminal growth rates and the number of observations in the sample it is
disclosed that larger the sample, greater the prediction accuracy. In addition to all of the above
the study adds to my skill and knowledge of equity valuation along with leaving some space for
further research for a more detailed set of hypothesis.
Chapter – 1:
Introduction
The aim of this dissertation is to understand the valuation techniques used in day-to-day pricing
of equities with the help of various statistical tools. This includes the financial statement analysis
of different companies along with studying the analyst reports to understand what valuation
models are used by the analysts. Moreover, the most interesting part of the report includes a
statistical study of two valuation methods to find out the prediction capability of both the models.
CASIRJ Volume 5 Issue 12 [Year - 2014] ISSN 2319 – 9202
International Research Journal of Commerce Arts and Science http://www.casirj.com Page 154
Therefore, this report consists of three well defined chapters which explain the objective of the
study along with producing valuable results of the analysis. In the first section, I do a detailed
literature review to introduce the various estimation methods used in the valuation history. This
involves the explanation of both the direct and flows based valuation methods including their
respective advantages and disadvantages. Some empirical evidence is also provided to support
the conceptual and the implementation issues faced by each of the models. The second and the
third section are driven by the motivation to study firms with and without intangibles. In the
second section a detailed study of analysts‟ reports of twenty-one firms reveal that analysts‟
prefer to use DCF as their dominant valuation model while pricing firms with high intangibles.
However, these results are hardly generalisable because of the small number of observations in
the sample. On an empirical analysis of a larger sample of 1140 firm year observations in the
third section, it is known that REVM is a better estimator of price than compared to harmonic
mean or median P/E multiple. This conclusion is based on mean and median testing of errors
between the valuation methodologies. The mean valuation error is lowest for the REVM price
estimates followed by harmonic mean P/E multiple. Estimates by the median P/E multiple has
the highest errors proving the superiority of the other practices. A further analysis conducted on
the firms with high and low intangibles separately produce the same results placing REVM as
the most superior model. A sensitivity test by varying the terminal growth rates and reducing the
number of observations in the sample still produce similar results. The mean absolute valuation
errors are the lowest for the REVM model. Hence, it will be true to state that REVM gives the
best estimates of price for intangible rich firms when compared with the multiples-based model.
Chapter – 2:
A critical review and synthesis of Valuation Literature
2.1Overview of Valuation Literature
Literature review is a critical analysis and synthesis of the academia relating to business
valuation using accounting numbers. Value is surrendered by the investors to the firm, the firm
adds or looses value and then the value left is returned to the investors. This is the simple cycle
of any business concern. The result of any business is expressed through financial statements.
The financial statements act as lens on the business and helps in determining the value of the
firm. Value of a firm can be defined as –
Value of a firm = Value of debt + Value of equity
The equity is the most important corporate claim, and the value of equity is the area of prime
focus for financial analysis. Accounting based valuation is the process of transforming forecasts
into an estimate of value of the firm. However, the obvious question here is the need and demand
for accounting based valuation. Investors may argue that a Company‟s value can be known
merely by looking at the share price. Nevertheless, under certain situations the share price is
CASIRJ Volume 5 Issue 12 [Year - 2014] ISSN 2319 – 9202
International Research Journal of Commerce Arts and Science http://www.casirj.com Page 155
typically insufficient in delivering the correct value of the Company. One such situation is when
a Company is not listed on any exchange yet still it needs to be valued when it is being
purchased by an investor or being listed on a stock exchange. This raises a question on the
efficiency of the stock markets, which is also proven by efficient market hypothesis. Market
efficiency does not imply that all stocks are always correctly priced. Therefore, the requirement
to value a company on the basis of intrinsic valuation is still very important.
Evidences of MM research indicate that earnings are the most important explanatory variable in
the valuation equation. In later times Graham, Dodd and Cottle have taken a similar position
with respect to valuation of common stocks. Nonetheless, the usefulness of accounting numbers
and earnings being a source of useful information has always been a topic of measurement
controversies in the accounting history.
Analytical tools and rigorously developed arguments have been the base for the accounting
theorists in the past to evaluate the usefulness of accounting numbers. However, the results
obtained prove to be unworthy without proper comparison of the observed behaviour with the
predictions of the model. Ball and Brown (1967) investigated what the market expects income to
be and then the markets reactions when its expectations prove false.
As against the above claims, there are many strong evidences against the belief that earnings
have informational value two of which are - measurement errors through earnings are large and
there are other sources that give the same information more timely than earnings.But, on price
and volume analysis, it is quite evident that investors do look at the earnings announcements
instead of other variables to price stocks and change their stock holding preferences accordingly.
A study by Ball and Brown in 1967 found that economy wide effects explain close to half of the
variability in the level of a firm‟s EPS. The firm‟s financing and other policy decisions explain
the other half.
Modelling the valuation strategy of any Company involves a lot of start up hiccups. Some of
those could be the duration of earnings to be considered, forecasting of earnings or other
variables, selection of valuation model suited to the Company‟s financial data etc. Valuation can
be conducted from two perspectives – i) Equity (proprietary) view & ii) Entity (enterprise) view.
Unlike the entity perspective, equity perspective distinguishes between capitals provided by
different sources and hence often outweighs the other because of the weight age given to equity
investment. Financial theory defines firm value as the present value of expected future pay offs.
Though a firm can be valued from either perspective the basic difference lies in the present value
calculation. Under equity perspective, firm value equals the present value of expected future
dividends while present value of expected free cash flows gives firm value according to entity
perspective.
CASIRJ Volume 5 Issue 12 [Year - 2014] ISSN 2319 – 9202
International Research Journal of Commerce Arts and Science http://www.casirj.com Page 156
2.2Theoretical Framework of Equity Valuation
Identifying the correct valuation model is what makes a good analyst. This involves trading off
cost and complexity because analysts often avoid complex models that require extensive analysis
involving a lot of costs and thus may ignore important value drivers. Today in the industry there
exists, many valuation models to price a company. Some of them worth mentioning are - The
Multiples-based Valuation Model, Discounted Cash Flow Model (which is the theoretically the
most sound model), The Dividend Discount Model, The Residual Income Model and the
Residual Income Growth Model.
2.2.1Multiples-based Valuation Model
Methodology - A multiple can simply be defined as the ratio of the stock price to a particular
value driver in the financial statements. Various value drivers like earnings, book value, sales,
EBIT, EBITDA have been used for valuing equity but earnings is the most commonly used value
driver in financial history. The methodology involves the selection of a set of comparable firms
that could be either all firms, firms from the same industry, firm with similar characteristics etc.
to the target firm whose value is in question. These set of firms are used to identify measures to
calculate benchmark multiples at which the firm trades. The average or median of these
multiples is then applied to the value driver of the target firm to get the intrinsic value of the
firm.
The general method for pricing multiples can be written as:
j
j
iiiVD
PjaverageVDV
where:
iV = estimated value of firm i
iVD = value driver of firm I, where VD > 0
jP = observed price for the jth
firm
i = set of comparable firms (j = 1to n) for firm i
The success of Multiples-based valuation approach relies on some underlying assumptions:
(Young-Soo Choi, 2007)
- Comparable firms have future cash flow expectations proportional to the target firm whose
value is in question.
CASIRJ Volume 5 Issue 12 [Year - 2014] ISSN 2319 – 9202
International Research Journal of Commerce Arts and Science http://www.casirj.com Page 157
- Comparable firms face similar risks to those of the target firm
- The value driver is directly proportional to value.
Though working with these assumptions the Multiples-based approach can produce most
accurate value estimates than any other valuation methodology, but these assumptions are often
desecrated. „Comparable firms are not perfect matches to the target firm in terms of cash flowor
risks, and even the valuation history does not suggest any obvious way to select the best value
drivers.‟ (Young-Soo Choi, 2007)
Advantages & Disadvantages – The advantage to use the Multiples-based approach is that it is
the cheapest form of valuation methodology. It doesn‟t require multi year forecasts of parameters
and uses nominal information from the financial statements. Hence, the technique does not
require professional accounting knowledge. Therefore, the method leaves too much room for
“playing with mirrors.” The analysts have the freedom to obtain a valuation, as he/she desires
because of the usage of minimal information that leads to speculation. Analysts using this
methodology may at times end up misvaluing an entire sector.
Conceptual &Implementation Issues – Despite its apparent simplicity, Multiples-based
approach suffers from some conceptual and implementation issues. Conceptually this approach
faces the problem of circular reasoning since price is ascertained from price of the comparables
and hence violates the principle by involving price in the calculation. Market is assumed to be
efficient for comparable firms but not for the target firm which is also a conceptual issue.
Moreover, considering the inefficiency of the markets, the comparable firms may be mispriced
which may generate faulty valuations for the target company. In addition, fundamentally while
valuing the firm we are estimating the value that investors are willing to pay instead of the
intrinsic value of the firm.
Apart from these conceptual problems, there are some relatively complex technical hitches as
well:
1) Choice of the Value Driver – Earnings is the most commonly used value driver because it
uses accrual accounting and overcomes the timing and mismatching problems inherent in
cash flows. Current earnings are preferred over current cash flows to predict dependable
future cash flow numbers. The high correlation between earnings and stock returns (rather
than cash flows) measured over short time periods was established and demonstrated by
Dechow (1994). But, at times earnings may be negative or close to zero rendering very high
or undefined P/E multiples. Thus earnings may be a poor measure of value creation as in the
case of internet firms where earnings may be negative or zero for a long period of time. This
mean reversion in P/E ratios over time may also result due to the presence of transitory
components in earnings as concluded by Beaver and Morse (1978).
CASIRJ Volume 5 Issue 12 [Year - 2014] ISSN 2319 – 9202
International Research Journal of Commerce Arts and Science http://www.casirj.com Page 158
Moreover, various definitions of earnings (earnings before/after abnormal items, earnings
before goodwill amortisation, earnings before interest, tax and depreciation, etc.) might also
create confusion for its appropriateness to be used for valuation purposes. Analysts and
investors try to condense this impact of transitory components by using adjusted earnings
figures. But, adjusted earnings are defined differently not only across borders and databases
but also differ from firm to firm and analyst to analyst. Apart from these the mixtures of
numerator & denominator combinations in a multiple also face implementation problems.
They should be comparable in the sense that with equity value (share price) in the numerator,
the denominator should also be an equity level value driver (net income) and with sales as the
denominator, the numerator should be an entity value (debt plus equity). But, in situations
like valuing hi-tech or internet firms (where income is often negative) a fusion of value
drivers (sales with share price) sometimes makes sense.
Liu, Nissim and Thomas (2002) after examining a comprehensive list of value drivers
conclude that forward earnings explain stock prices better than historical earnings and cash
flow measures. Lev (1983) in his study examined the link between industry characteristics
and P/E multiples. Liu, Nissim and Thomas (2003) tested the performance of multiples
(value drivers – earnings, operating cash flows, sales & dividends) across different countries
and arrived at similar recommendations. Lie and Lie (2002) concluded that forecasted
earnings perform better than trailing earnings but asset value multiples yield better estimates
than sales or earnings multiples especially for financial companies because they have
substantial liquid assets that are easier to value. They also found that EBITDA performs
better than EBIT multiple except for pharmaceutical companies. While valuing IPO‟s Kim
and Ritter (1999) found that P/E multiples using earnings forecasts instead of historical
numbers improved the valuation precision sustainability considerably for older firms. Tasker
(1998) in her research on industry specific preferred multiples in acquisition valuation reveal
that banking industry is valued on book and net income multiples, software targets on
revenue while hotel, oil and real estate industries on operating cash flow multiples. However,
a possibility of other accounting numbers being highly correlated with firm value was left for
future research. Fernandez (2002) finds that because of broad dispersions in multiples the
valuations are always debatable. He also finds that PER, EBITDA and profit after tax were
more volatile parameters than equity value during 1991-1999.
2) Comparable Firms Selection – Under the approach, multiple can be computed for a single
comparable firm. It is advantageous since it is easier to identify a single firm similar to the
target firm in respect of growth and risk parameters. Multiples can also be computed for a set
of comparable firms since in a set the firm specific differences tend to cancel out leaving the
average effects only. Under such a case analysts tend to focus on firms in the same industry
that are more likely to be affected by the same broad set of factors. Nonetheless, this requires
thorough knowledge of the industry, market and firm specific parameters. Most of the firms
CASIRJ Volume 5 Issue 12 [Year - 2014] ISSN 2319 – 9202
International Research Journal of Commerce Arts and Science http://www.casirj.com Page 159
today operate in multiple industries and hence cause difficulties in identifying comparable
industry. Moreover, concerning a profitable deal, analysts tend to influence the valuations by
selecting comparables with high multiples. Alford‟s (1992) generalised results propose that
industry membership [which is similar to Liu, Nissim and Thomas (2003)] or a combination
of risk and earnings growth is effective criteria for the selection of comparable firms. Bhojraj
and Lee (2002) find that selecting firms based on profitability, growth and risk criteria offer
sharp estimate improvements over selection based on industry and size matches. Their
experimental evidence suggests analysts to focus on more salient firms within an industry
while selecting comparables.
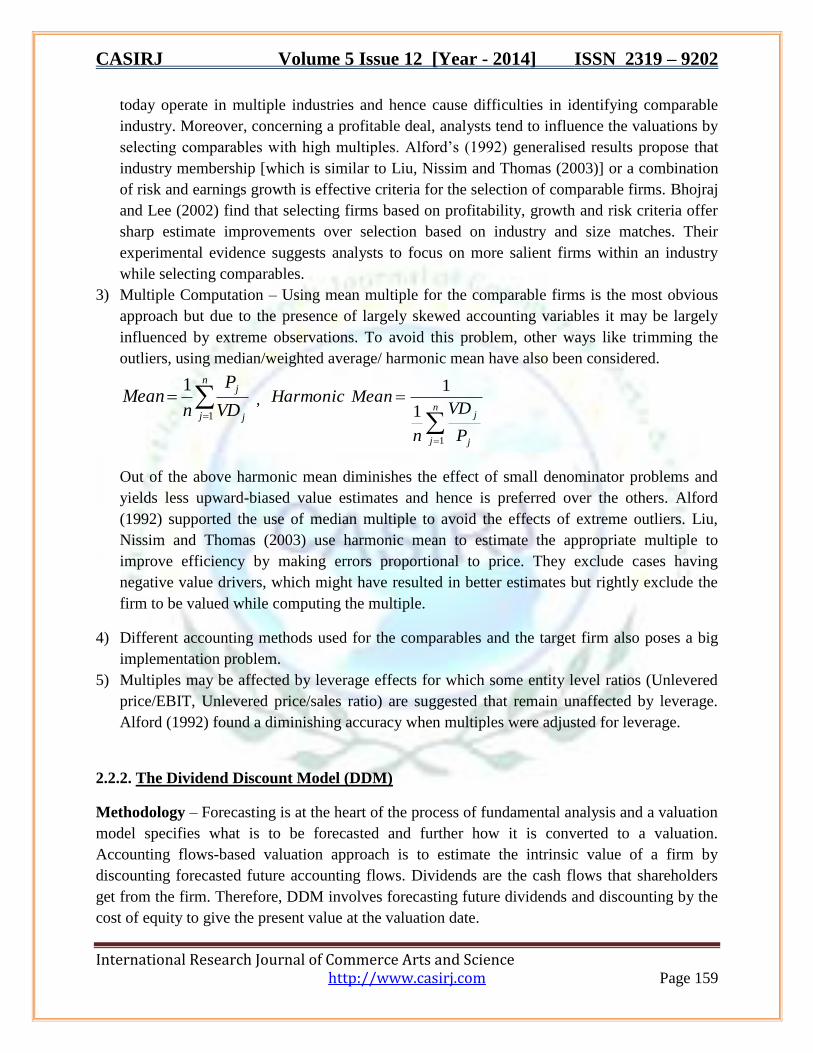
3) Multiple Computation – Using mean multiple for the comparable firms is the most obvious
approach but due to the presence of largely skewed accounting variables it may be largely
influenced by extreme observations. To avoid this problem, other ways like trimming the
outliers, using median/weighted average/ harmonic mean have also been considered.
n
j j
j
VD
P
nMean
1
1 ,
n
j j
j
P
VD
n
MeanHarmonic
1
1
1
Out of the above harmonic mean diminishes the effect of small denominator problems and
yields less upward-biased value estimates and hence is preferred over the others. Alford
(1992) supported the use of median multiple to avoid the effects of extreme outliers. Liu,
Nissim and Thomas (2003) use harmonic mean to estimate the appropriate multiple to
improve efficiency by making errors proportional to price. They exclude cases having
negative value drivers, which might have resulted in better estimates but rightly exclude the
firm to be valued while computing the multiple.
4) Different accounting methods used for the comparables and the target firm also poses a big
implementation problem.
5) Multiples may be affected by leverage effects for which some entity level ratios (Unlevered
price/EBIT, Unlevered price/sales ratio) are suggested that remain unaffected by leverage.
Alford (1992) found a diminishing accuracy when multiples were adjusted for leverage.
2.2.2. The Dividend Discount Model (DDM)
Methodology – Forecasting is at the heart of the process of fundamental analysis and a valuation
model specifies what is to be forecasted and further how it is converted to a valuation.
Accounting flows-based valuation approach is to estimate the intrinsic value of a firm by
discounting forecasted future accounting flows. Dividends are the cash flows that shareholders
get from the firm. Therefore, DDM involves forecasting future dividends and discounting by the
cost of equity to give the present value at the valuation date.
CASIRJ Volume 5 Issue 12 [Year - 2014] ISSN 2319 – 9202
International Research Journal of Commerce Arts and Science http://www.casirj.com Page 160
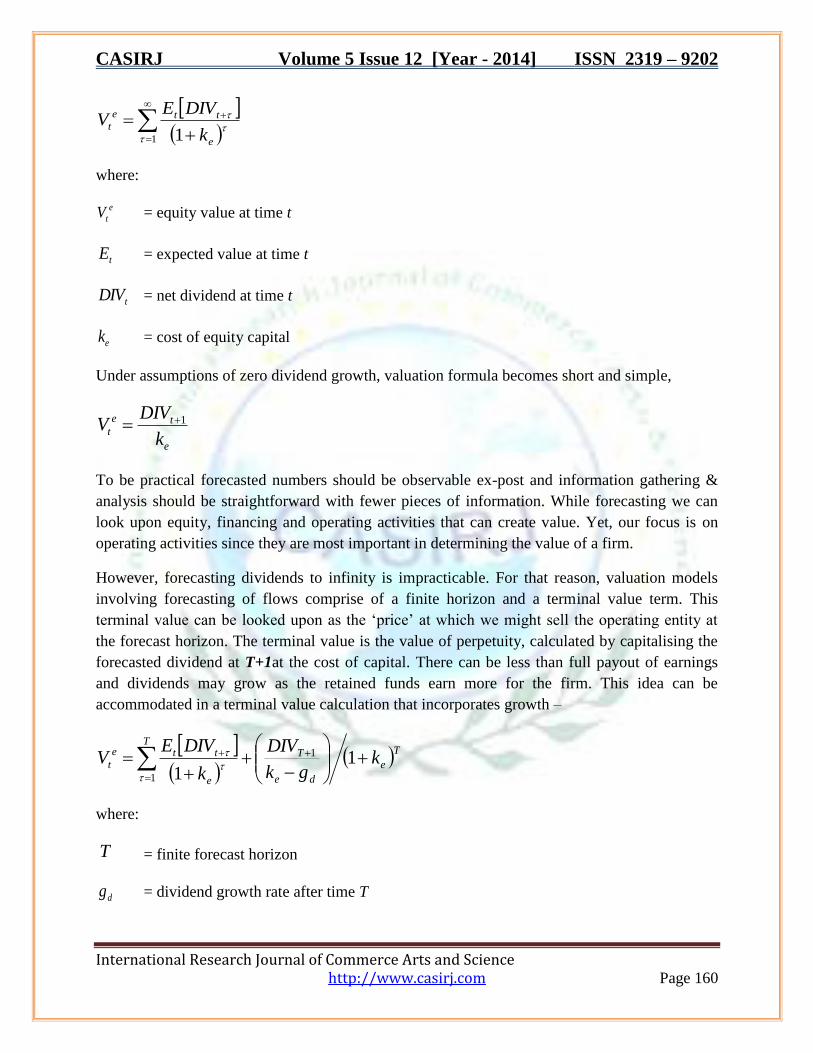
1 1
e
tte
tk
DIVEV
where:
e
tV = equity value at time t
tE = expected value at time t
tDIV = net dividend at time t
ek = cost of equity capital
Under assumptions of zero dividend growth, valuation formula becomes short and simple,
e
te
tk
DIVV 1
To be practical forecasted numbers should be observable ex-post and information gathering &
analysis should be straightforward with fewer pieces of information. While forecasting we can
look upon equity, financing and operating activities that can create value. Yet, our focus is on
operating activities since they are most important in determining the value of a firm.
However, forecasting dividends to infinity is impracticable. For that reason, valuation models
involving forecasting of flows comprise of a finite horizon and a terminal value term. This
terminal value can be looked upon as the „price‟ at which we might sell the operating entity at
the forecast horizon. The terminal value is the value of perpetuity, calculated by capitalising the
forecasted dividend at T+1at the cost of capital. There can be less than full payout of earnings
and dividends may grow as the retained funds earn more for the firm. This idea can be
accommodated in a terminal value calculation that incorporates growth –
Te
de
TT
e
tte
t kgk
DIV
k
DIVEV
11
1
1
where:
T = finite forecast horizon
dg = dividend growth rate after time T
CASIRJ Volume 5 Issue 12 [Year - 2014] ISSN 2319 – 9202
International Research Journal of Commerce Arts and Science http://www.casirj.com Page 161
If the constant growth starts in the first period, it is sometimes referred to as The Gordon growth
Model.
Advantages, Disadvantages & Implementation issues – The only advantage with the DDM is
that the concept is simple and is easy to forecast dividends in the short run considering its
stability. Nonetheless, solutions to problems like valuing a firm that may be expected to have
zero payout or a firm that has exceptionally high payout that cannot be maintained or dividend
payout coming from borrowings or stock repurchases have not been justified in valuation history.
This way dividend policy can be any arbitrary value not linked to value addition. Hence,
dividends may not always represent creation of wealth. Paying dividends is termed as a zero-
NPV activity, since any change in dividends is exactly offset by a price change in present value
terms, in a manner such that net effect is zero. This leaves us with a problem of dividend
conundrum where forecasting dividends does not give an indication of value creation. Rather,
they represent distribution of value.
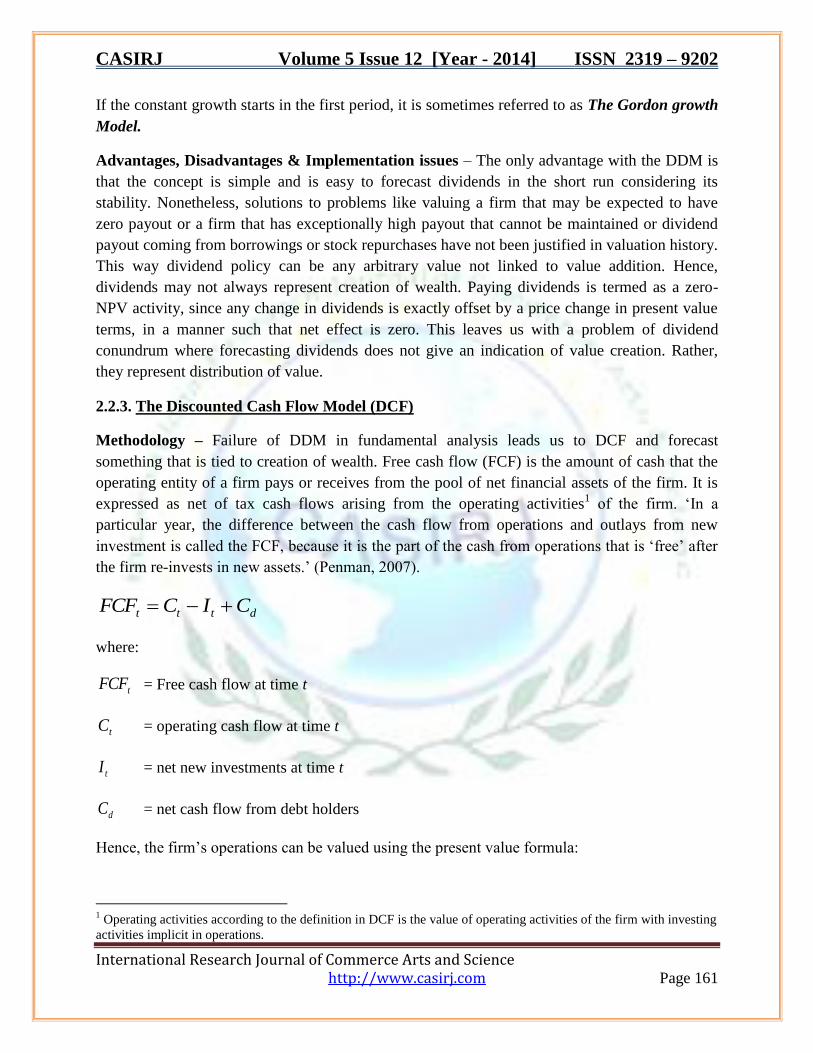
2.2.3. The Discounted Cash Flow Model (DCF)
Methodology – Failure of DDM in fundamental analysis leads us to DCF and forecast
something that is tied to creation of wealth. Free cash flow (FCF) is the amount of cash that the
operating entity of a firm pays or receives from the pool of net financial assets of the firm. It is
expressed as net of tax cash flows arising from the operating activities1 of the firm. „In a
particular year, the difference between the cash flow from operations and outlays from new
investment is called the FCF, because it is the part of the cash from operations that is „free‟ after
the firm re-invests in new assets.‟ (Penman, 2007).
dttt CICFCF
where:
tFCF = Free cash flow at time t
tC = operating cash flow at time t
tI = net new investments at time t
dC = net cash flow from debt holders
Hence, the firm‟s operations can be valued using the present value formula:
1 Operating activities according to the definition in DCF is the value of operating activities of the firm with investing
activities implicit in operations.
CASIRJ Volume 5 Issue 12 [Year - 2014] ISSN 2319 – 9202
International Research Journal of Commerce Arts and Science http://www.casirj.com Page 162
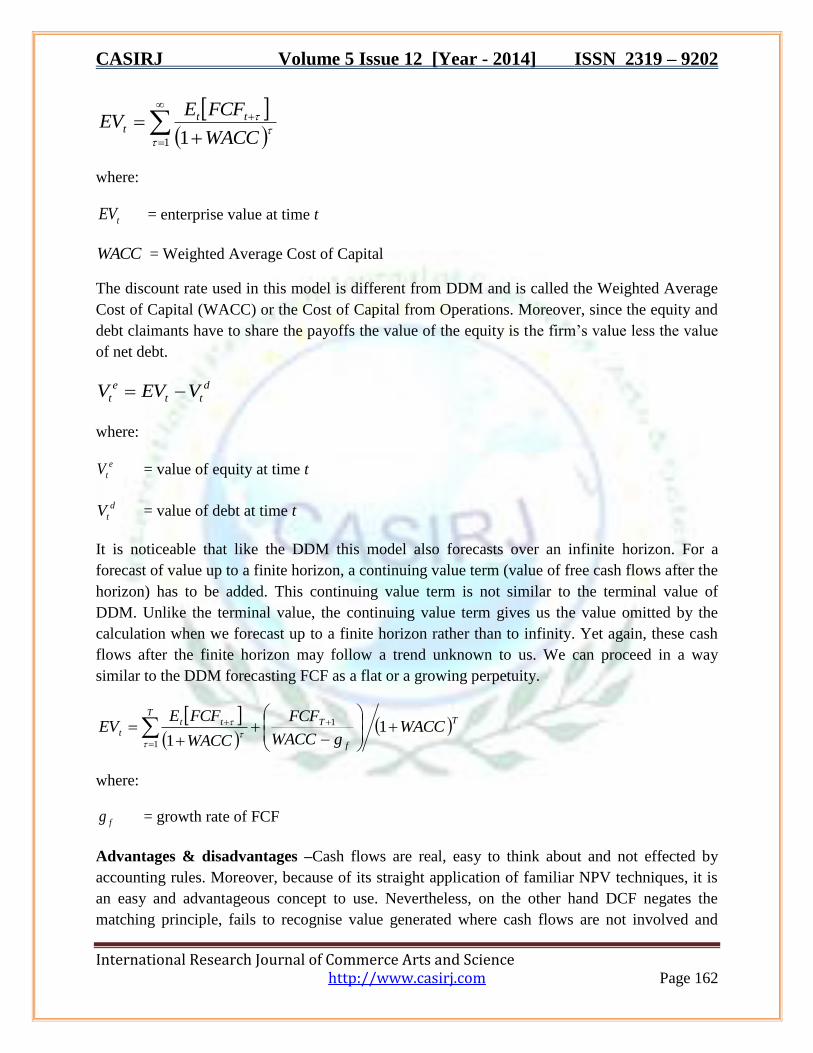
1 1
WACC
FCFEEV tt
t
where:
tEV = enterprise value at time t
WACC = Weighted Average Cost of Capital
The discount rate used in this model is different from DDM and is called the Weighted Average
Cost of Capital (WACC) or the Cost of Capital from Operations. Moreover, since the equity and
debt claimants have to share the payoffs the value of the equity is the firm‟s value less the value
of net debt.
d
tt
e
t VEVV
where:
e
tV = value of equity at time t
d
tV = value of debt at time t
It is noticeable that like the DDM this model also forecasts over an infinite horizon. For a
forecast of value up to a finite horizon, a continuing value term (value of free cash flows after the
horizon) has to be added. This continuing value term is not similar to the terminal value of
DDM. Unlike the terminal value, the continuing value term gives us the value omitted by the
calculation when we forecast up to a finite horizon rather than to infinity. Yet again, these cash
flows after the finite horizon may follow a trend unknown to us. We can proceed in a way
similar to the DDM forecasting FCF as a flat or a growing perpetuity.
T
f
TT
ttt WACC
gWACC
FCF
WACC
FCFEEV
11
1
1
where:
fg = growth rate of FCF
Advantages & disadvantages –Cash flows are real, easy to think about and not effected by
accounting rules. Moreover, because of its straight application of familiar NPV techniques, it is
an easy and advantageous concept to use. Nevertheless, on the other hand DCF negates the
matching principle, fails to recognise value generated where cash flows are not involved and
CASIRJ Volume 5 Issue 12 [Year - 2014] ISSN 2319 – 9202
International Research Journal of Commerce Arts and Science http://www.casirj.com Page 163
reduces investments (treated as a value loss) from operations, which actually adds value to the
firm. Additionally DCF demands long forecast horizons to recognise cash inflows from
investments and is not aligned with analyst‟s forecasts who estimate earnings instead of FCF that
requires further forecasting of accruals.
Implementation Issues – DCF works best when investment pattern produces constant FCF or
FCF growing at a constant rate, which is rarely observable. Apart from this, DCF application
faces two more problems. Firstly, the US-GAAP net cash figure needs to be adjusted with
interest received/paid figures using information provided in the notes to financial statements and
secondly it needs to be adjusted with the financial investments figure since it does not form a
part of FCF generated by operating entity. Demirakos, Strong and Walker‟s (2004) findings
show that analysts typically use DCF as their dominant valuation model. Copeland et al. (2000)
assert that DCF is most widely used but REVM is gaining popularity.
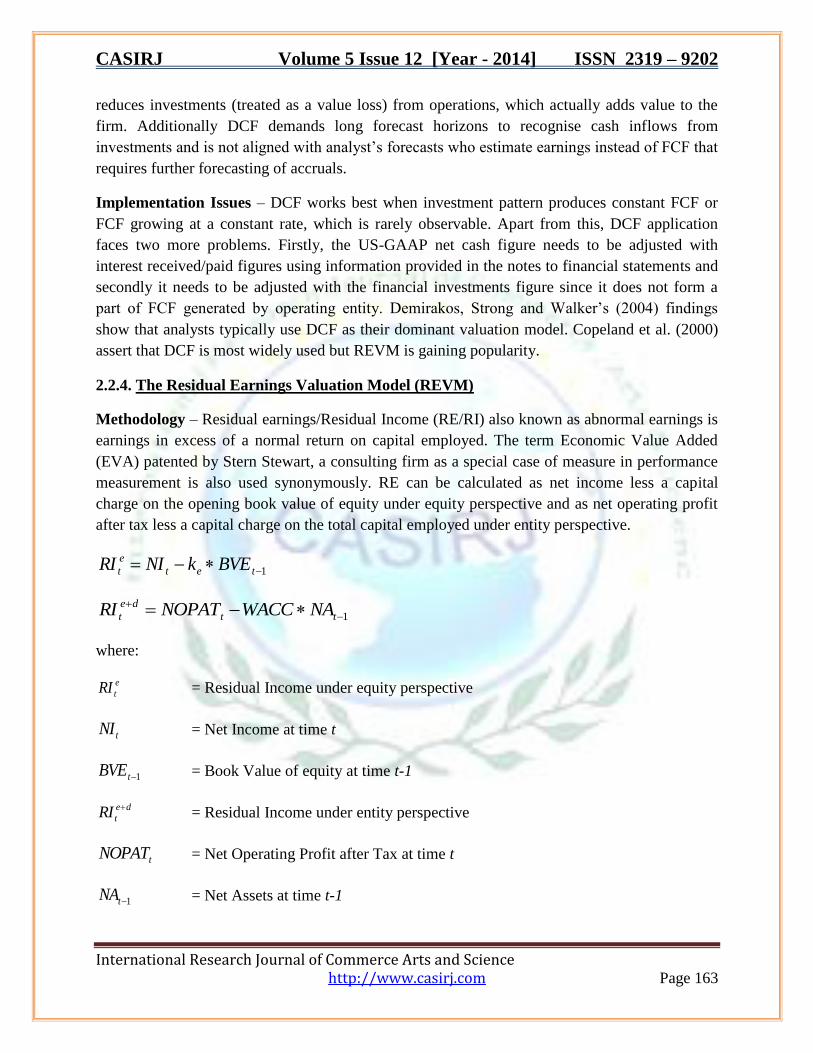
2.2.4. The Residual Earnings Valuation Model (REVM)
Methodology – Residual earnings/Residual Income (RE/RI) also known as abnormal earnings is
earnings in excess of a normal return on capital employed. The term Economic Value Added
(EVA) patented by Stern Stewart, a consulting firm as a special case of measure in performance
measurement is also used synonymously. RE can be calculated as net income less a capital
charge on the opening book value of equity under equity perspective and as net operating profit
after tax less a capital charge on the total capital employed under entity perspective.
1 tet
e
t BVEkNIRI
1
tt
de
t NAWACCNOPATRI
where:
e
tRI = Residual Income under equity perspective
tNI = Net Income at time t
1tBVE = Book Value of equity at time t-1
de
tRI = Residual Income under entity perspective
tNOPAT = Net Operating Profit after Tax at time t
1tNA = Net Assets at time t-1
CASIRJ Volume 5 Issue 12 [Year - 2014] ISSN 2319 – 9202
International Research Journal of Commerce Arts and Science http://www.casirj.com Page 164
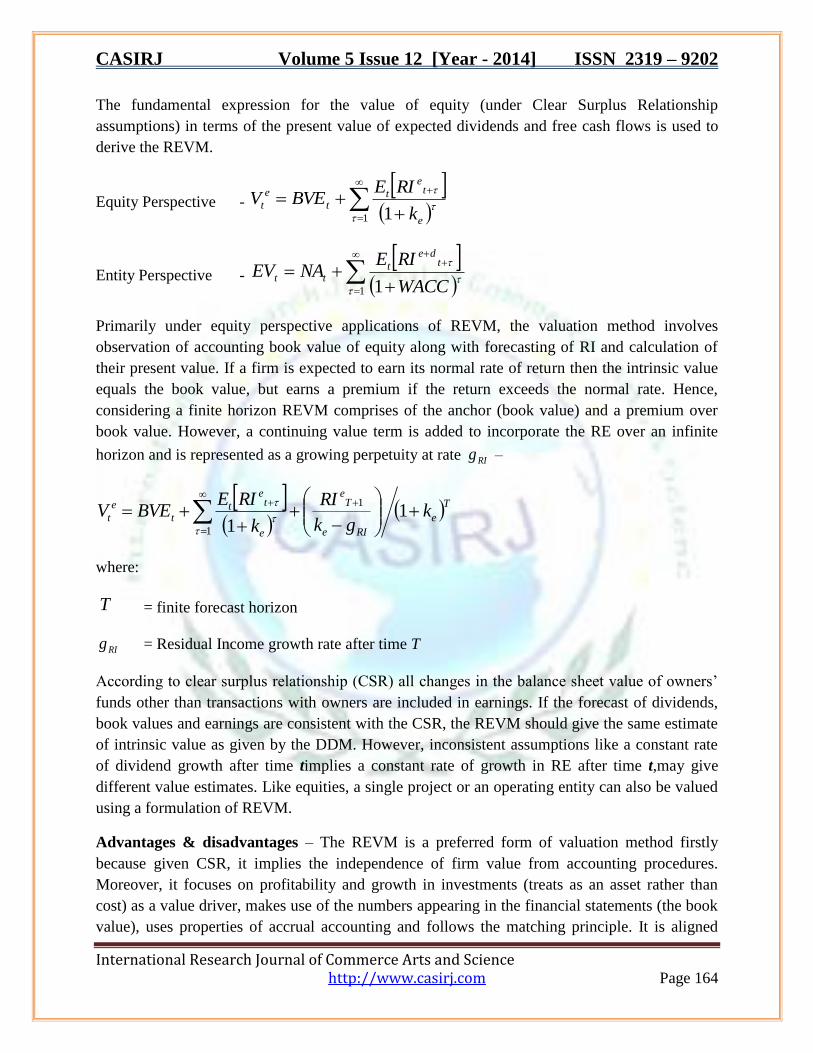
The fundamental expression for the value of equity (under Clear Surplus Relationship
assumptions) in terms of the present value of expected dividends and free cash flows is used to
derive the REVM.
Equity Perspective -
1 1
e
te
tt
e
tk
RIEBVEV
Entity Perspective -
1 1
WACC
RIENAEV
tde
ttt
Primarily under equity perspective applications of REVM, the valuation method involves
observation of accounting book value of equity along with forecasting of RI and calculation of
their present value. If a firm is expected to earn its normal rate of return then the intrinsic value
equals the book value, but earns a premium if the return exceeds the normal rate. Hence,
considering a finite horizon REVM comprises of the anchor (book value) and a premium over
book value. However, a continuing value term is added to incorporate the RE over an infinite
horizon and is represented as a growing perpetuity at rate RIg –
Te
RIe
Te
e
te
tt
e
t kgk
RI
k
RIEBVEV
11
1
1
where:
T = finite forecast horizon
RIg = Residual Income growth rate after time T
According to clear surplus relationship (CSR) all changes in the balance sheet value of owners‟
funds other than transactions with owners are included in earnings. If the forecast of dividends,
book values and earnings are consistent with the CSR, the REVM should give the same estimate
of intrinsic value as given by the DDM. However, inconsistent assumptions like a constant rate
of dividend growth after time timplies a constant rate of growth in RE after time t,may give
different value estimates. Like equities, a single project or an operating entity can also be valued
using a formulation of REVM.
Advantages & disadvantages – The REVM is a preferred form of valuation method firstly
because given CSR, it implies the independence of firm value from accounting procedures.
Moreover, it focuses on profitability and growth in investments (treats as an asset rather than
cost) as a value driver, makes use of the numbers appearing in the financial statements (the book
value), uses properties of accrual accounting and follows the matching principle. It is aligned
CASIRJ Volume 5 Issue 12 [Year - 2014] ISSN 2319 – 9202
International Research Journal of Commerce Arts and Science http://www.casirj.com Page 165
with the analyst‟s forecast of earnings rather than FCF or dividends along with its validation in
subsequent audited financial statements and can consider shorter forecast horizons as compared
to DDM and DCF. Nonetheless, people using this method require thorough understanding of
accrual accounting so that causes of concern can be identified.
Implementation issues –
1) Forecasting of RI requires forecasted future earnings that may vary in numbers and
reliability in terms of the sources used. I/B/E/S data is available for one or two year ahead
and are unsuitable for a long forecast horizon. Moreover, future book values are not available
and the analysts have to compute their own forecasts. This requires estimation of dividend
payout ratio (dpayout), which eventually complicates when earnings are negative. Solutions
to the above are trimming negative observations & introducing a sample selection bias or
replacing them by estimated long-run earnings performance. An alternative solution when
dividends are greater than earnings is to set dpayout = 1. Using the ratio (V/P) Frankel and
Lee (1998) show that REVM is a consistent estimator of cross-sectional returns (using
forecasted instead of historical earnings) particularly over longer horizons. They also found
that V/P‟s projecting power improves by incorporating errors in analysts‟ earnings forecasts
that are predictable.
2) Estimating Terminal Value (TV) – TV often forms a large proportion of the total firm
value but there is no set way for its calculation. Often varied approaches are used which
range from relatively simple to moderately complex.
3) Estimating the cost of equity capital – This estimation requires researchers to measure i)
The risk free rate ii) Beta for the firm & iii) Market risk premium. All these three measures
are difficult to estimate and have always been a subject of debate by analysts and academics.
Francis, Olsson and Oswald (2000) in their reliability study of intrinsic value estimates find that
RE value estimates are more accurate and explain greater variations in prices than DDM or DCF
value estimates. Penman and Sougiannis (1998) do a similar comparison with usage of ex-post
forecasts instead of ex-ante forecasts as the primary difference. The superior accuracy of RE and
inclusion of book value of equity as a measure of intrinsic value steer the greater dependability
of RE value estimates. In addition, there was no evidence of inferior estimates of equity value
due to different accounting practices. Lee, Myers and Swaminathan (1999), aim to develop
measures of the intrinsic value for the Dow Jones Industrial Average (DJIA) independent of its
market price. They find that V/P ratio (where V is based on a REVM) outperforms traditional
value benchmarks like B/P, E/P in terms of both tracking ability and predictive power during the
1963-1996 period and inclusion of time varying interest rates contributes primarily towards its
success.
However, Lundholm and Keefe (2001) argue that if properly implemented, DCF and REVM
yield similar value estimates and try to explain the minor errors, which cause inconsistencies.
These inconsistencies generally arise because of faulty forecasts at the start of the terminal
CASIRJ Volume 5 Issue 12 [Year - 2014] ISSN 2319 – 9202
International Research Journal of Commerce Arts and Science http://www.casirj.com Page 166
period, variations between the cost of equity and the WACC or missing cash flows in one or both
the models, which were discarded by Penman (2001). Sougiannis and Yaekura (2001) find that
analysts‟ earnings forecasts convey more information than given by current earnings, book
values and dividends at each horizon and that different valuation models are appropriate to
different firms under given conditions. They also conclude that the huge differences between
market price and observed price are due to conservative accounting and missing information in
the forecasts. Ohlson and Nauroth‟s (2005) model assumes that the PV of dividend per share
(dps) determines price without restricting the expected evolution of dps-sequence.
2.2.5. The Abnormal Earnings Growth Model (AEGM)
Methodology – Earnings, whose growth validates a high P/E ratio as well, primarily influences
the P/E ratio. An investor might be paying too much for earnings growth, but growth through
investment does not necessarily mean a value addition. Hence, a valuation model is required that
prevents investors from paying too much for earnings growth. AEGM states the relationship
between price, forward earnings and abnormal earnings growth. The AEGM anchors the
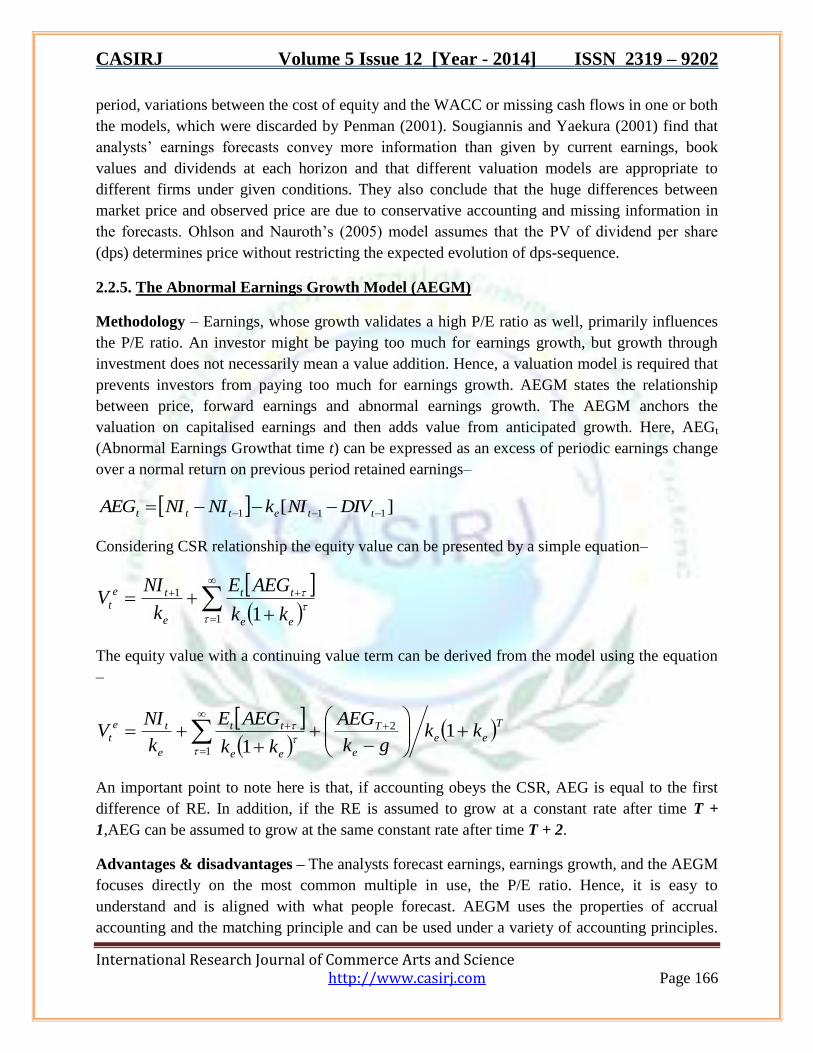
valuation on capitalised earnings and then adds value from anticipated growth. Here, AEGt
(Abnormal Earnings Growthat time t) can be expressed as an excess of periodic earnings change
over a normal return on previous period retained earnings–
][ 111 ttettt DIVNIkNINIAEG
Considering CSR relationship the equity value can be presented by a simple equation–
1
1
1
ee
tt
e
te
tkk
AEGE
k
NIV
The equity value with a continuing value term can be derived from the model using the equation
–
Tee
e
T
ee
tt
e
te
t kkgk
AEG
kk
AEGE
k
NIV
11
2
1
An important point to note here is that, if accounting obeys the CSR, AEG is equal to the first
difference of RE. In addition, if the RE is assumed to grow at a constant rate after time T +
1,AEG can be assumed to grow at the same constant rate after time T + 2.
Advantages & disadvantages – The analysts forecast earnings, earnings growth, and the AEGM
focuses directly on the most common multiple in use, the P/E ratio. Hence, it is easy to
understand and is aligned with what people forecast. AEGM uses the properties of accrual
accounting and the matching principle and can be used under a variety of accounting principles.
CASIRJ Volume 5 Issue 12 [Year - 2014] ISSN 2319 – 9202
International Research Journal of Commerce Arts and Science http://www.casirj.com Page 167
Nevertheless, AEGM is a complex model and requires a through understanding of the concept of
cum-dividend earnings along with accrual accounting. Moreover, since it does not focus on
Balance Sheet items and all values are derived from forecasts, the valuation is extremely
sensitive to the estimates. In such a case, the earnings numbers might be a suspect and may give
erroneous estimates of equity value.
Ohlson (2005) position AEGM as a better estimator than REVM because it does not rely on book
values and CSR accounting and focuses on ex-ante earnings as a better estimator of market value
than book value.
2.3 Summary
This chapter introduces the theoretical framework of equity valuation along with discussions on
empirical studies of each model by referring to research papers. Even though direct valuation
models (REVM, AEGM) have been preferred over relative valuation model, some fundamental
problems with them are, computing the value of „synergies‟ of assets being used together,
identifying value in use of a particular firm, valuing loss-making firms or firms in financial
distress etc. Lie & Lie (2002) in their study find valuation estimates to be worse for companies
with high intangibles specially the dot-coms. In addition, direct valuation approach face
complications in calculating the liquidation value and value estimates of asset based firms like
oil and gas. Although there is not much evidence in the prior research to support the comparison
of direct and relative valuation approaches, on extensive analysis with a large sample Courteau,
Kao, Keefe & Richardson (2006) found that a simple combination of the two yield better
estimates of intrinsic value than either method used in isolation.
References
Alford, A., 1992,The effect of the set of comparable firms on the accuracy of the price earnings
valuation method, Journal of Accounting Research, 30(1): 94-108.
Amir, E. and Y. Lev, 1996, Value-relevance of non-financial information: the wireless
communication industry, Journal of Accounting and Economics, 22: 3-30.
Ball, R. and P. Brown, 1968, An empirical evaluation of accounting income numbers, Journal of
Accounting Research, 6: 159-178.
Baker, R. and R. S. Ruback, 1999, Estimating Industry Multiples, Working paper, Harvard
University, 1-30.
Barker, R. 1999, The role of dividends in valuation models used by analysts’ and fund
managers,European Accounting Review, 8(2): 195-218.
Barker, R., 2001, DeterminingValue: Valuation Models and Financial Statements, Prentice Hall.
Beaver, W., 1968,The information content of annual earnings announcements, Journal of
Accounting Research, 6: 67-92.
Beaver, W. and D. Morse, 1978,What determines price-earnings ratios? Financial Analysts
Journal, July/August: 65-76.
CASIRJ Volume 5 Issue 12 [Year - 2014] ISSN 2319 – 9202
International Research Journal of Commerce Arts and Science http://www.casirj.com Page 168
Bhojraj, S. and C. Lee, 2002,Who is my peer? A valuation-based approach to theselection of
comparable firms,Journal of Accounting Research, 40: 407-439.
Bryan, S., L-S Hwang and S. Lilien, 2001, Assessment of analysts’ target prices,CPA Journal, 71(7):
47-52.
Burgstahler, D. and I.Dichev, 1997, Earnings, adaptation and firm value,Accounting Review,
(April): 187-215.
Choi, Y-S., S. Talib and S. Young, 2007, Equity Valuation Using Accounting Numbers, Lecture
Notes, Lancaster University Management School.
Claus, J. and J. Thomas, 2001, Equity Premia as Low as Three Percent? Evidence from Analysts'
Earnings Forecasts for Domestic and International Stock Markets,
The Journal of Finance, 56 (5): 1629-1666.
Cooper, I. and K. Nyborg, 2006, Consistent methods of valuing companies by DCF: Methods and
assumptions, Working paper, LondonBusinessSchool, NorwegianSchool of Economics and
Business Administration.
Courteau, L., J.L. Kao, T. O’Keefe and G. Richardson, 2006, Relative accuracy and predictive
ability of direct valuation methods, PE method and a hybrid approach, Accounting and Finance,
Forthcoming.
Damodaran, A., 1999, Research and Development Expenses: Implications for profitability
measurement and valuation, New YorkUniversity, SternSchool of business.
Dechow, P., 1994, Accounting earnings and cash flows as measures of firms performance: The
role of accounting accruals, Journal of Accounting and Economics, 18: 3-42.
Demirakos, E., N. Strong and M. Walker, 2004,What valuation models do analysts use?
Accounting Horizons, 18(4): 221-240.
Dolan Capital Management, 2001, A primer on equity valuation, Retrieved August 14, 2007,
from http://www.dolancap.com/research/primer.htm.
Fernandez, P., 2002, Valuation using multiples: How do analysts reach their conclusions?
Working Paper, IESE Business School, University of Navarra.
Foster, G., 1986,Financial statement analysis,New York: Prentice-Hall.
Francis, J., P. Olsson and D. Oswald, 2000, Comparing the accuracy and explainability of
dividend, free cash flow and abnormal earnings equity value estimates,Journal of Accounting
Research, 38(1): 45-70.
Frankel, R. and C. Lee, 1998, Accounting valuation, market expectation and cross-sectional stock
returns,Journal of Accounting and Economics, 25: 283-319.
Gleason, C., W. Johnson and H. Li, 2006, The earnings forecast accuracy, valuation model use,
and price target performance of sell-side equity analysts, Working paper, TippieCollege of
Business, University of Iowa.
Guo, R-J, B. Lev and N. Zhou, 2005, The valuation of biotech IPOs. Journal of Accounting,
Auditing and Finance, 20(4): 423-459.
Kenton, K. Yee., 2004, Forward versus trailing earnings in equity valuation,
ColumbiaBusinessSchool, Review of Accounting Studies 9 (Conferene Issue), 301-329.
CASIRJ Volume 5 Issue 12 [Year - 2014] ISSN 2319 – 9202
International Research Journal of Commerce Arts and Science http://www.casirj.com Page 169
Kim, M. and J. Ritter, 1999, Valuing IPOs, Journal of Financial Economics, 53: 409-437.
Lee, C., 1999, Accounting-based valuation: Impact on business practices and research,
Accounting Horizons, 13: 413-425.
Lee, C., J. Myers and B. Swaminathan, 1999,What is the intrinsic value of the Dow? Journal of
Finance, 54(5): 1693-1741.
Lev, B., 1983, Some economic determinants of time-series properties of earnings
Journal of Accounting and Economics, 5: 31-48.
Lev, B., 1989,On the usefulness of earnings and earnings research: Lessons anddirections from
two decades of empirical research, Journal of Accounting Research, Supplement, 27: 153-192.
Lie, E. and H. Lie, 2002, Multiples used to estimate corporate value,Financial Analysts Journal,
March/April: 44-54.
Liu, J., D. Nissim and J. Thomas, 2002, Equity valuation using multiples.Journal of Accounting
Research, 40: 135-171.
Liu, J., D. Nissim and J. Thomas, 2003, Price multiples based on forecasts and reported values of
earnings, dividends, sales and cash flows: International evidence, Working paper, University of
California at Los Angeles.
Lundholm, R. and T. O’Keefe, 2001, Reconciling value estimates from the discountedcash flow
model and the residual income model,Contemporary Accounting Research, 18(2): 311-335.
Lundholm, R. and T. O’Keefe, 2001,On comparing residual income and discounted cashflow
models of equity valuations: A response to Penman (CAR, Winter 2001), Contemporary
Accounting Research, 18(4): 692-712.
O'Hanlon, J., 2007, Financial Statement Analysis, Lecture Notes, Lancaster University
Management School.
Ohlson, J.A., 2005. On accounting-based valuation formulae,Review of Accounting Studies, 10:
323-347.
Ohlson, J.A. and B. Juettner-Nauroth, 2005, Expected EPS and EPS growth as determinants of
value,Review of Accounting Studies, 10: 349-365.
Palepu, K., P. Healy and V. Bernard, 2004,Business analysis and valuation using financial
statements; Texts and cases, 3rd Edition, South-Western College Publishing.
Penman, S., 2001, On comparing cash flow and accrual accounting models for use inequity
valuation: A response to Lundholm and O’Keefe (CAR, Summer 2001), Contemporary Accounting
Research, 18(4): 681-689.
Penman, S., 2007,Financial statement analysis and security valuation, 3rd edition,New York:
McGraw-Hill.
Penman, S. and T. Sougiannis, 1997,The dividend displacement property and thesubstitution of
anticipated earnings for dividends in equity valuation,Accounting Review, 72 (January): 1-21.
Penman, S. and T. Sougiannis, 1998, A comparison of dividend, cash flow and earnings
approaches to equity valuation,Contemporary Accounting Research, 15 (3): 343-83.
Revsine, L., D. Collins and B. Johnson, 2005, Financial Reporting & Analysis, 3rd edition, Prentice
Hall.
CASIRJ Volume 5 Issue 12 [Year - 2014] ISSN 2319 – 9202
International Research Journal of Commerce Arts and Science http://www.casirj.com Page 170
Richardson, G. and S. Tinaikar, 2004, Accounting based valuation models: What havewelearned?
Accounting and Finance, 44: 223-255.
Sougiannis, T. and T. Yaekura, 2001,The accuracy and bias of equity values inferredfrom
analysts’ earnings forecasts. Journal of Accounting, Auditing and Finance, 16(4): 331-362.
Sum of parts valuation, Retrieved August 09, 2007, from http://moneyterms.co.uk/sum-of-
parts/.
Tasker, S., 1998, Industry preferred multiples in acquisition valuation, Working paper, University
of California at Berkeley.
Trueman, B., M. Wong and X. Zhang, 2000, The Eyeballs Have It: Searching for theValue in
Internet Stocks,Journal of Accounting Research, 38(Supplement): 137-62.
Yoo, Yong. K., 2005, An empirical assessment of the Valuation Accuracy of the Abnormal
Earnings Growth Valuation Model, Working Paper, Korea University, Singapore Management
University, 1-32.


