Embed Size (px)
Citation preview
ESTIMATION OF DIETARY INGESTION INTAKE OF THORIUM FOR INHABITANTS OF HIGH BACKGROUND RADIATION AREA OF
SOUTHERN INDIA
By
SATHYAPRIYA R SREEJITH
( CHEM01201004020 )
Bhabha Atomic Research Centre
A thesis submitted to the
Board of Studies in Chemical Sciences
In partial fulfillment of requirements
for the Degree of
DOCTOR OF PHILOSOPHY
of
HOMI BHABHA NATIONAL INSTITUTE
August, 2017

i
ii
STATEMENT BY AUTHOR
This dissertation has been submitted in partial fulfillment of requirements for an
advanced degree at Homi Bhabha National Institute (HBNI) and is deposited in the
library to be made available to borrowers under rules of the HBNI.
Brief quotations from this dissertation are allowable without special permission,
provided that accurate acknowledgement of source is made. Requests for permission
for extended quotation from or reproduction of this manuscript in whole or in part
may be granted by the Competent Authority of HBNI when in his or her judgment the
proposed use of the material is in the interests of scholarship. In all other instances,
however, permission must be obtained from the author.
(Sathyapriya R Sreejith)
iii
DECLARATION
I, hereby declare that the investigation presented in the thesis has been carried out by
me. The work is original and has not been submitted earlier as a whole or in part for a
degree / diploma at this or any other Institution / University.
( Sathyapriya R Sreejith )
iv
List of Publications arising from the thesis
Journal
1. “Estimation of thorium intake due to consumption of vegetables by inhabitants
of high background radiation area by INAA”, Sathyapriya R.S., Kamesh V.,
Prabhath R.K., Madhu Nair, Acharya R., Rao, D.D.. Journal of Radioanalytical
and Nuclear Chemistry, 2012, 294 (3), 387-390.
2. “Assessment of annual intake of thorium from animal origin food consumed by
population residing in thorium rich area of Southern India” Sathyapriya R.S.,
Prabhath R K., Acharya R., Rao D.D, Journal of Radioanalytical and Nuclear
Chemistry, 2017, 312(2), 405–41.
3. “Choosing an appropriate method for measurement of 232Th in environmental
samples” Sathyapriya R S, Rao D D, Prabhath R K., Radiation Protection and
Environment; 2017, 40, 90-94.
Conference
1. “Thorium intake due to consumption of locally grown vegetables by
inhabitants of High radiation background areas using INAA”. R.S.
Sathyapriya, Suma Nair, V. Kamesh, R K Prabhath, Madhu Nair, K.D
Arunachalam, R. Acharya and S. Bhati. Proceedings of fourth International
Symposium on Nuclear Analytical Chemistry (NAC-IV). 2010, BARC,
Mumbai.
v
2. “Evaluation of natural radionuclides in dietary intake in high background
radiation area, Tamilnadu, India” Kantha Deivi Arunachalam, Sathyapriya R
Sreejith, Kamesh Visvanathan Baskaran, International Conference on
Radiation Biology:Nanotechnology, Imaging Science and Stem Cell Research
in radiation Oncology, International Conference on Radiobiology (ICRB-
2010), 2010, Chennai.
3. “Determination of low concentration Thorium in diet samples by INAA using
high flux, Dhruva research Reactor”, Sathyapriya R.S., Jagadeesan K C.,
Acharya R., Rao D.D. Proceedings of second international conference on New
frontiers in chemistry – from fundamentals to applications, New Frontiers in
Chemistry-from Fundamentals to Applications” (NFCFA 2017), 2017, BITS K
K Birla Campus, Goa.
(Sathyapriya R Sreejith )

vi
Dedicated
to
My Family
For their endless love, support
and encouragement
vii
ACKNOWLEDGEMENTS
Environmental chemistry and bio-kinetic studies became my topic of interest in the
early career in BARC, India. The quest for analysis of very low level concentration of
radionuclide in environmental and biological samples introduced me to the powerful
Neutron Activation Analysis (NAA) technique. This led me to come in contact with my
guide Dr. Raghunath Acharya, an expert in NAA and nuclear analytical techniques.
The planning cum formulation of this work was initiated with his guidance. It has
been a privilege to work in his research group and I have received firm support and
encouragement throughout. With his guidance planning, execution, experimental,
data reporting and interpretation works were done meticulously. I would like to
express my deepest gratitude to my supervisor for his unwavering support and
mentorship throughout this thesis work.
I am grateful to Dr. B. S. Tomar, Director, RC andIG, BARC and Dr. K. S.
Pradeepkumar, Associate Director, HS&EG, BARC for their guidance, constant
support and encouragement. I also thank Prof. A. Goswami (Ex-Head, RCD) and
Prof. B. S. Tomar, for being the former Chairman and present Chairman,
respectively, of my doctoral committee. Their constructive suggestions, comments and
moral help are gratefully acknowledged. I would like to thank Prof. P .K. Pujari,
Head, RCD, BARC, Prof. P. M. Ravi, Head, ESS,HPD, BARC and Dr S. Murali
(former DC member), Head, EPRS, RSSD, BARC for being the part of my doctoral
committee and for the valuable suggestions and effective mentoring which led to
successful completion of my PhD thesis work.
I would like to extend my thanks to Dr. D. D. Rao, Head, IDS, Section, RSSD for his
significant role in this project, for his constructive scientific suggestions, valuable
comments on manuscripts and my PhD thesis. I again thank Dr. S Murali for all of
the practical help during manuscript and thesis writing.
I also wish to acknowledge Dr. Kanthadeivi and Dr. Kamesh Viswanathan for the
support rendered during the field work, sample collection and processing. Without

viii
their support, sample collection would have been impossible. Also I would like to
thank Dr.vSathyanarayan, NGRI, for his help and advice in ICP-MS work. Thanks
are also due to Dr. S.V. Thakare and Mr. K.C. Jagadeesan, RPhD, BARC and ROD
personnel of Dhruva research reactor for facilitating irradiation of samples at
Dhruva research reactor. I am grateful to my colleagues Mrs. Madhu G Nair and Mr.
Prabhath K Ravi for their help and suggestions throughout.
I thank Sreejith, my dear husband, for always being there whenever I needed. His
infallible love and support has always been my strength. Thank you, Amma and Appa,
and without any doubt you both have been the pillars of support not only during this
period but throughout my life so far and longed to see this achievement come true.
Chinnaina and Pinni, my heartfelt thanks for the unconditional love and support. I
thank Babu anna, Prasanna anna, Sudarsan and Nivedita for all the support and
care. My niece Raji and nephew Varun, my alternate support system. My heartfelt
regard goes to my father-in-law and mother-in-law for their love and moral support.
Thanks are due to my lovely sister-in-law, Seetha, backbone of our family and for
always being there for my parents.
Finally, I would like to thank the almighty for giving me the strength to complete the
PhD thesis.
Sathyapriya R Sreejith
ix
Contents
Synopsis 1
List of Tables 10
List of Figures 12
1 Introduction 15
1.1 Background of Study 16
1.2 Radiation exposure to humans 16
1.3 High background radiation area of India 18
1.4 Behavior of radionuclides in the environment 18
1.5 Radioactivity in air, soil and food 20
1.6 Objective of the study 23
1.7 Significance of the study 24
2 Literature Survey 26
2.1 Radioactivity in the environment 27
2.1.1 Naturally occurring radionuclides 28
2.1.2 Man-made radionuclides 33
2.2 Geochemical properties of important elements from Th series 34
2.2.1 Radium 34
2.2.2 Thorium 35
2.3 High Background Radiation Area (HBRA) 36
2.3.1 Iran 36
2.3.2 Brazil 37
2.3.3 China 37
2.3.4 India 37
2.4 The human radiation exposure 39
2.4.1 External Exposure 39
2.4.2 Internal Exposure 40
2.5 Radionuclides in food chain 42
2.5.1 Terrestrial Pathways 43
2.5.2 Aquatic Pathway 45
2.6 Literature review on ingestion Intake of Naturally Occurring Radioactive
Material (NORM) 46
x
2.6.1 Studies worldwide for NORM ingestion intake 47
2.6.2 Ingestion Studies in India. 48
2.7 Radiation Dose to Inhabitants of HBRA from NORM 51
2.7.1 External Radiation Exposure: 51
2.7.2 Internal Radiation exposure: 52
2.8 Behavior of radionuclides in human 54
2.9 Radiation dose due to internal exposure: 56
2.10 Thorium Processing in India 58
2.11 Application of Thorium 59
2.11.1 Incandescent gas mantles 60
2.11.2 Welding Electrodes 60
2.11.3 Thorium as nuclear energy source 60
2.12 Biokinetic model of Thorium 61
2.13 Reference values and guidance level of Thorium in food and drinking water. 63
2.14 Quantification of Thorium in various matrices. 65
2.14.1 Radiometric Methods 65
2.14.2 Non Radiometric Techniques 67
2.15 Neutron Activation Analysis(NAA) 69
2.15.1 Principle 69
2.15.2 Radioactivity produced in NAA 70
2.15.3 Neutron sources 71
2.15.4 Methods for concentration calculation in NAA. 72
2.15.5 Methodologies in NAA 74
2.15.6 NAA based on the neutron energy 76
2.15.7 Sensitivity and Detection Limit in NAA. 77
2.16 Inductively Coupled Plasma Mass Spectrometry (ICP MS) 78
3 Experimental 80
3.1 Introduction 81
3.2 Description of the study area 81
3.3 Dietary sampling Methods 83
3.3.1 Market Basket Study method 84
3.3.2 Duplicate Portion Study method 85
xi
3.4 Sampling methodology 85
3.4.1 Selection of sampling location 86
3.5 Sample collection 88
3.5.1 Duplicate Portion Diet 89
3.5.2 Market Basket Sampling: 90
3.6 Sample processing: 92
3.6.1 Vegetables and fruits 92
3.6.2 Flesh food and fish 93
3.6.3 Milk 94
3.7 Instrumentation and measurements 94
3.7.1 Freeze dryer 94
3.7.2 Nuclear reactor 95
3.7.3 High resolution gamma ray spectrometry 96
3.7.4 High Resolution (HR) ICP MS 104
3.8 Experimental work on neutron activation analysis (NAA) 108
3.8.1 NAA using CIRUS reactor 108
3.8.2 NAA using Dhruva reactor 109
3.9 Experimental work using HR ICP MS 110
3.10 Calculation of daily intake and total annual effective dose 112
4 Dietary intake of Thorium using Market Basket Study (MBS) method 114
4.1 Introduction: 115
4.2 Methodology: 116
4.2 Results and discussion 121
4.2.1 Quality Control Analysis 121
4.2.2 Activity concentration in cereals 124
4.2.3 Activity concentration in pulses 125
4.2.4 Activity concentrations in green leafy vegetables 126
4.2.5 Activity concentration in other vegetables 128
4.2.6 Activity concentration in Roots and Tubers 131
4.2.7 Activity concentration in fruits 133
4.2.8 Activity concentration in fish 134
4.2.9 Activity concentration in curated fish 136
xii
4.2.10 Activity concentration in flesh food 137
4.2.11 Activity concentration in milk 139
4.2.12 Activity concentration in spices and coconut 140
4.3 Daily intake 142
4.4 Contribution of food groups to daily intake 144
4.5 Annual effective dose due to 232Th 148
5 Dietary intake of Thorium using Duplicate Portion Study (DPS) Method 151
5.1 Introduction 152
5.2 Methodology 152
5.3 Results and discussion 153
5.3.1 Ground Radiometric Survey 153
5.3.2 Outdoor Committed Effective Dose 155
5.4 Recruitment of volunteers for DPS and evaluation of age dependent annual
consumption rate 156
5.5 Activity concentration of 232Th in DPS 157
5.6 Daily intake of 232Th by the population 161
5.7 Committed effective dose from annual intake of 232Th by DPS 163
5.8 Thorium analysis using high resolution (HR) ICP MS in Water and Urine 164
5.8.1 Activity concentration of 232Th in drinking water 168
5.8.2 232Th daily urinary excretion 171
5.9 Comparison of annual effective dose from other radionuclides through external
and internal exposure pathways received by inhabitants 174
6 Conclusions and future outlook 176
6.1 Conclusions 177
6.2 Scope for future work 179
References 182
1
Synopsis
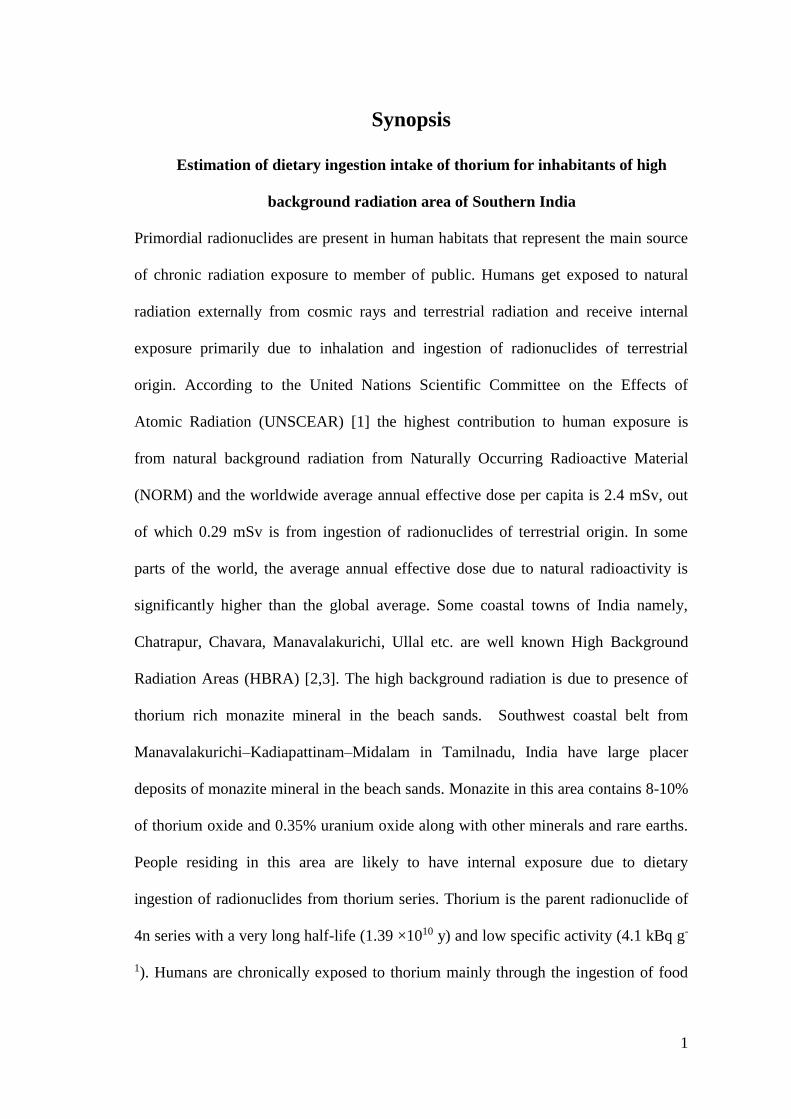
Estimation of dietary ingestion intake of thorium for inhabitants of high
background radiation area of Southern India
Primordial radionuclides are present in human habitats that represent the main source
of chronic radiation exposure to member of public. Humans get exposed to natural
radiation externally from cosmic rays and terrestrial radiation and receive internal
exposure primarily due to inhalation and ingestion of radionuclides of terrestrial
origin. According to the United Nations Scientific Committee on the Effects of
Atomic Radiation (UNSCEAR) [1] the highest contribution to human exposure is
from natural background radiation from Naturally Occurring Radioactive Material
(NORM) and the worldwide average annual effective dose per capita is 2.4 mSv, out
of which 0.29 mSv is from ingestion of radionuclides of terrestrial origin. In some
parts of the world, the average annual effective dose due to natural radioactivity is
significantly higher than the global average. Some coastal towns of India namely,
Chatrapur, Chavara, Manavalakurichi, Ullal etc. are well known High Background
Radiation Areas (HBRA) [2,3]. The high background radiation is due to presence of
thorium rich monazite mineral in the beach sands. Southwest coastal belt from
Manavalakurichi–Kadiapattinam–Midalam in Tamilnadu, India have large placer
deposits of monazite mineral in the beach sands. Monazite in this area contains 8-10%
of thorium oxide and 0.35% uranium oxide along with other minerals and rare earths.
People residing in this area are likely to have internal exposure due to dietary
ingestion of radionuclides from thorium series. Thorium is the parent radionuclide of
4n series with a very long half-life (1.39 ×10¹⁰ y) and low specific activity (4.1 kBq g-
1). Humans are chronically exposed to thorium mainly through the ingestion of food
2
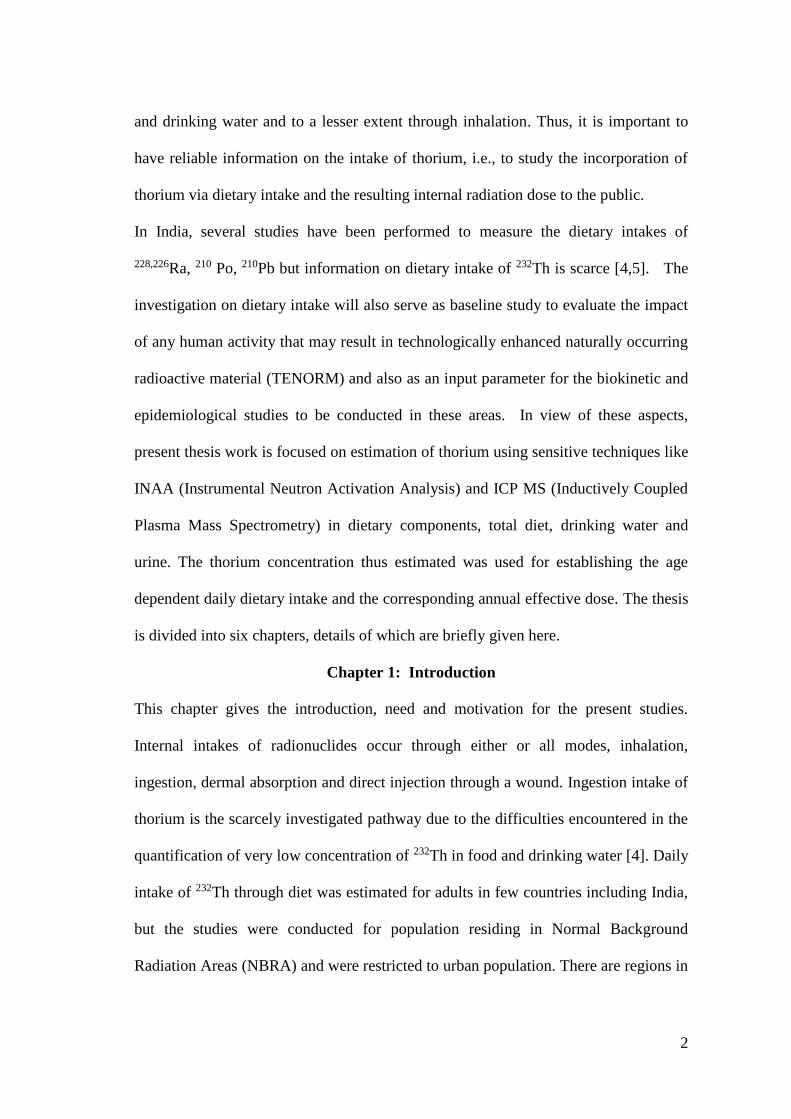
and drinking water and to a lesser extent through inhalation. Thus, it is important to
have reliable information on the intake of thorium, i.e., to study the incorporation of
thorium via dietary intake and the resulting internal radiation dose to the public.
In India, several studies have been performed to measure the dietary intakes of
228,226Ra, 210 Po, 210Pb but information on dietary intake of 232Th is scarce [4,5]. The
investigation on dietary intake will also serve as baseline study to evaluate the impact
of any human activity that may result in technologically enhanced naturally occurring
radioactive material (TENORM) and also as an input parameter for the biokinetic and
epidemiological studies to be conducted in these areas. In view of these aspects,
present thesis work is focused on estimation of thorium using sensitive techniques like
INAA (Instrumental Neutron Activation Analysis) and ICP MS (Inductively Coupled
Plasma Mass Spectrometry) in dietary components, total diet, drinking water and
urine. The thorium concentration thus estimated was used for establishing the age
dependent daily dietary intake and the corresponding annual effective dose. The thesis
is divided into six chapters, details of which are briefly given here.
Chapter 1: Introduction
This chapter gives the introduction, need and motivation for the present studies.
Internal intakes of radionuclides occur through either or all modes, inhalation,
ingestion, dermal absorption and direct injection through a wound. Ingestion intake of
thorium is the scarcely investigated pathway due to the difficulties encountered in the
quantification of very low concentration of 232Th in food and drinking water [4]. Daily
intake of 232Th through diet was estimated for adults in few countries including India,
but the studies were conducted for population residing in Normal Background
Radiation Areas (NBRA) and were restricted to urban population. There are regions in
3
India along the coastal belt of Kerala, Tamilnadu, Andhra Pradesh and Orissa where
the background radiation levels are high due to large placer deposits of monazite
mineral in the beach sand. The population residing in these areas is likely to have a
higher intake of radionuclides from thorium series from ingestion pathway compared
to normal background radiation area. Hence it is important and also essential to assess
the internal dose due to ingestion of NORM. Radionuclides (228,226Ra, 40K and 210Po)
dietary intake other than 232Th in the study area has been well investigated and
reported [5, 6]. Paucity on information on the concentration of 232Th in dietary
material, led to conduct this research.
When radionuclides are ingested through food and drinking water, it traverses through
gastrointestinal tract and part of it gets absorbed, primarily from the small intestine
and finds its way into the blood and lymphatic system and the rest is excreted in the
feces. The thorium that gets absorbed into blood is distributed and deposited in
different organs/tissues. About 70% of the thorium that enters the blood gets deposited
in bone resulting in a long term retention in the body causing internal exposure [7].
Moreover, for monitoring absorption pattern of radionuclides, reliable knowledge of
the daily intake and their metabolic behavior is essential. The results of the studies
will enable us to generate more useful information on intake of thorium which will
serve as an important input parameter for validating thorium biokinetic model and
especially the Gut Absorption Fraction, FA.
As the concentration of thorium in environmental, food and excreta mainly urine is in
very low level, highly sensitive INAA and ICP MS techniques were standardized and
used for quantification of thorium in environmental and biological samples. The
objectives of the work include, determination of 232Th concentration in various food
4
material, total diet and drinking water consumed by the inhabitants of the study area
and evaluating the daily intake and the subsequent annual effective ingestion dose to
232Th oral intake. The outcome of the research will also supplement in addressing the
possible concerns of inhabitants of HBRA where mining activities are undertaken.
Chapter 2: Literature Survey
This chapter is a review on the existing literature relevant to the present work. It
contains the concept of basic radiation exposure to human describing different types
of exposure pathways and the global exposure levels. Radionuclides can enter the
food chain via terrestrial or aquatic pathway. The dietary intake varies from region to
region and the main source being the geographic variation that results in differences in
concentration of NORM in soil and also the uptake varies for plant species. Review of
literature dealing with studies on the NORM concentration in dietary items both from
normal and HBRA is discussed. Large information is available on dietary intake and
its corresponding annual intake for uranium, radium and polonium isotopes while
scarce data is available for 232Th intake by ingestion. A brief discussion on the
chemical and physical properties of thorium, its behavior in the environment and its
industrial application is presented. The behavior of thorium in human and its
biokinetic model provided by ICRP is also discussed. Various radiometric and non-
radiometric techniques used for quantification of thorium in environmental and
biological matrices is elaborated and compared.
Chapter 3: Research Methodology and Experimental
Experimental details, sampling location (villages) and sampling collection techniques
are described in this chapter. The sampling locations were selected based on the
ground radiometric survey conducted along a 45 km costal belt of Southern
5
Tamilnadu. Market basket study (MBS) and Duplicate Portion study (DPS) methods
were used for sample collection from the study area. Samples like cereals, pulses,
vegetables, fruits, flesh food etc., were purchased from farmer’s market. Milk samples
were collected from milk vendors from the selected villages. The sample processing
and pretreatment methods adopted are elaborated for the individual food groups. The
freeze dried vegetation samples were irradiated in CIRUS reactor for one day in self-
server facility. As the reactor was decommissioned, the samples were irradiated for 7
d in tray rod facility at Dhruva. Long irradiation period of the sample caused the
samples and the packing material to melt. Hence the freeze dried samples were ashed,
packed in 25µm thick Al foil and irradiated for 2-3 d at Dhruva. 232Th in the samples
were quantified by measuring the delayed gamma–rays of energy 311.6 keV of 233Pa
daughter product of 232Th (half-life of 27.1d) using high resolution gamma ray
spectrometry with HPGe detector coupled with 8k MCA ( Multichannel Analyzer).
The accuracy of the INAA method was established using standard reference materials
(SRMs) procured from NIST (Spinach leaves, orchard leaves, Apple leaves and
Tomato leaves). The 232Th concentration was determined using relative method of
NAA and the results of Th concentration are in good agreement (within ±5% in most
of the cases). ICP MS was used for quantifying thorium in drinking water and urine.
The daily consumption (g d-1) data provided by National Nutrition Monitoring Bureau
(NNMB) for each food group was used for evaluating the daily intake using MBS
method. For DPS method, 24 h diet samples actually consumed was collected from
individual households The estimated thorium intake (Bq y-1) and the dose coefficient
factor (Sv y-1) provided by ICRP was used for assessing the internal dose received by
6
the inhabitants of the study area. For estimating the age dependent dietary intake by
the population the 24 h dietary records collected for the various age groups was used.
Results and discussion
Chapter 4: Dietary intake of thorium using MBS method
Thorium(Th) is generally present in very low concentration in diet and drinking water.
The individual food items collected from the local markets of the study area was
processed and Th concentration was determined using relative INAA. The
concentration in the samples varied from 0.3 ± 0.04 to 136.1 ± 12.6 μg kg-1fresh. The
highest concentration was found in curated fish with a mean concentration of 107.1 ±
26.1 μg kg-1fresh.Variation in 232Th concentration among different food vegetables was
large. This variation may be attributed to the difference in selective absorption by the
plants. 232Th in cereals, green leafy vegetable, milk and flesh food was high compared
to the concentration of samples obtained from an urban region in India [8]. Daily
intakes of 232Th for adult members of the population were evaluated from the
consumption of food items such as, Rice from 1.1-4.7, Pulses and legumes from 0.1 to
0.5; green leafy vegetables from 0.6 to 0.9; other vegetables from 0.1 to 1.4; roots and
tubers from 0.5 to 4.3; fruits from 0.3- 1.1; fish from 0.5 to 1.8; curated fish from 13.2
to 18.2; flesh food (meat, beef and chicken), from 0.1 to 0.3; and milk from 0.7 to 1.2
mBq d-1. Though the Th concentrations in rice were less, they contributed
significantly to the daily intake due to higher daily consumption rate. In children
below 3y, milk contributed about 32 % to the annual intake. The total annual internal
dose resulting from ingestion of 232Th in these food groups was 3.4 μSv y-1 for male
adult population.
7
Chapter 5: Dietary intake using Duplicate Portion Study Method
The breakfast, lunch, dinner and beverages, (excluding water) consumed by the people
in 24 h were collected from four villages (Putteti, Thengapattinam, Manvalakurichi
and Idindakarai). The 24 h dietary record was also collected from different age group
members in the selected households. The 232Th in the duplicate diet was estimated
using INAA. The concentration varied from 6.1 ± 0.1 to 31.3 ± 1.1 μg kg-1fresh. It was
also observed that the diet samples collected from households from village that
showed higher ground radiometric dose had slightly higher concentration of 232Th.
This can be attributed to the cooking practices and eating habits adopted by the
population. The annual intake was estimated using the concentration of 232Th and the
total quantity of the diet consumed by the individual. The annual intake for adult
population varied from 15.1 ± 1.2 to 86.8 ± 7.8 Bq y-1. Using the daily food
consumption obtained using 24 h diet record obtained for different age group; the
daily ingestion intake of thorium was evaluated for three different age groups. The
average annual effective ingestion dose to the adult using DPS was 7.7 μSv y-1.
The 232Th was estimated in drinking water using Nu Attom HR- SF-ICP MS. The
concentration in the samples ranged between 2.4 ± 0.1 and 18.3 ± 0.7 ng L-1. The
average annual effective dose of 232Th from drinking water was estimated to be 13.6
nSv y-1. It was observed that water consumption contributed to a very small part of the
annual internal dose.
Chapter 6: Conclusions and Future Outlook
1) INAA method using high flux reactor neutrons was optimized for determination
of trace concentrations of 232Th in various food items and duplicate diet from
thorium rich area of Southern India
8
2) ICP-MS method was utilized for sub-trace Th concentrations in drinking water
and urine samples from same area.
3) Methods were validated by determining Th in (certified) reference materials.
4) Age dependent average annual intake and effective ingestion dose values were
evaluated using MBS and DPS method. Major contributors to dietary 232Th
intakes in the study group were found to be marine products and the lowest
contribution was from fruits and vegetables.
5) It is observed from the study that though the intake is slightly higher compared to
another study conducted for evaluation of daily intake by an urban population, the
contribution to total annual dose to the individual is insignificant from ingestion
intake.
6) Another interesting observation is that annual effective dose evaluated using DPS
method was higher than that evaluated using MBS. This indicates that DPS is a
preferred method for realistic biokinetic studies and MBS method gives us the
indication of individual major contributor to the dose.
7) The results of this study will supplement to background data on terrestrial
radioisotopes in this region and will also provide to evaluate the gut absorption
fraction of thorium for Indian population.
8) Due to lack of adequate data on 232Th concentration in individual dietary
components from normal background areas of India, our results couldn’t be
compared. Hence it was thus important to estimate 232Th concentration in dietary
component from different normal background areas of India, which will be
treated as the base / literature value.

9
9) As the contribution to the total dose by ingestion pathway is very less, it can be
concluded that the mining activities in the study area hasn’t influenced the
ingestion dose.
10) The evaluated ingestion intake of Th from food and diet will be helpful to assess
the gut absorption fraction FA.
10
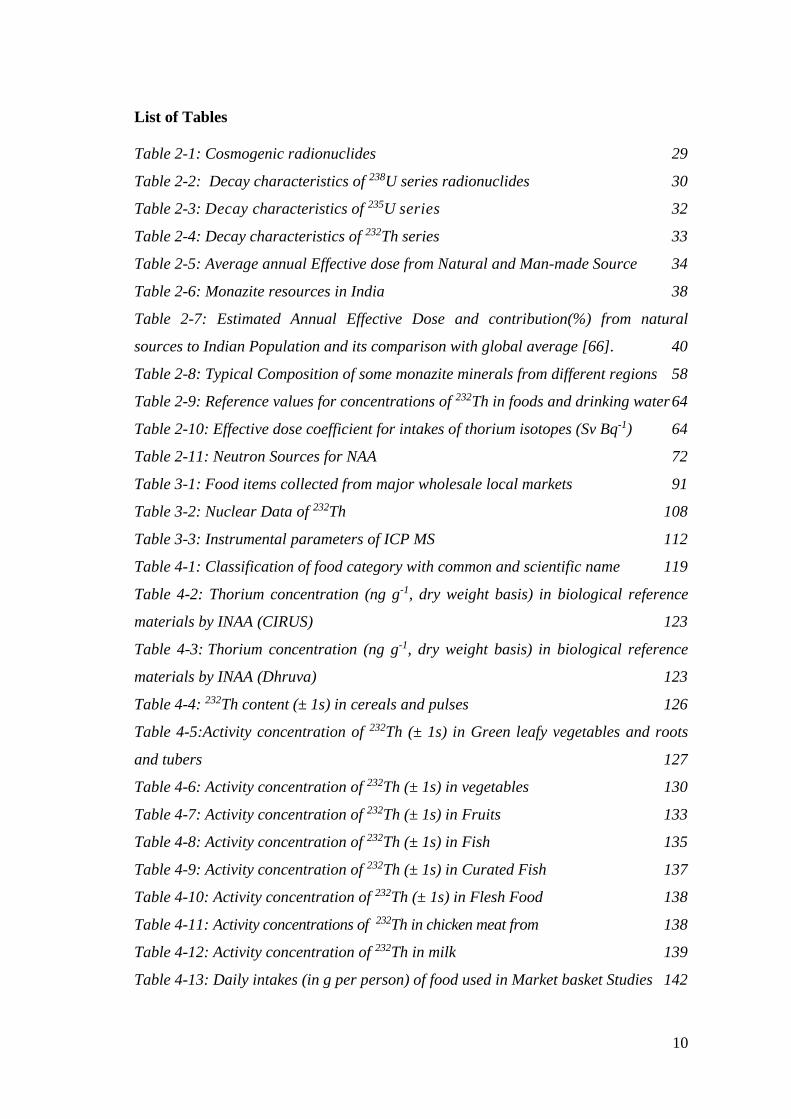
List of Tables
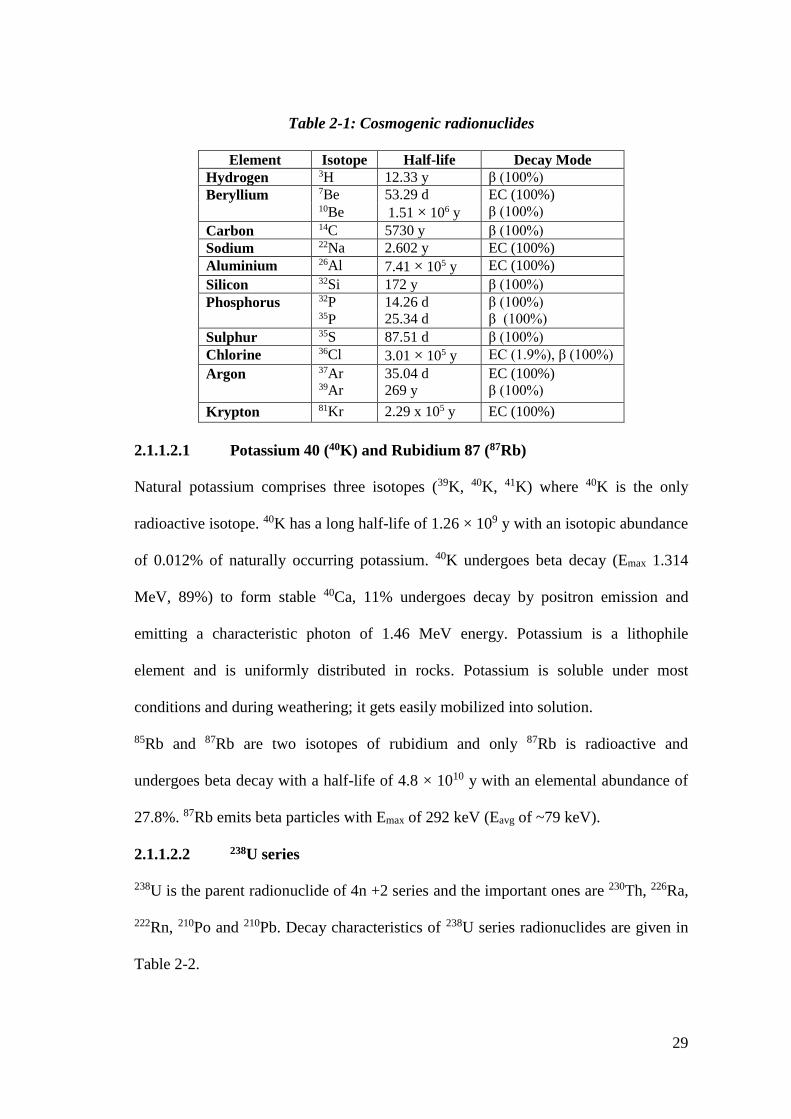
Table 2-1: Cosmogenic radionuclides 29
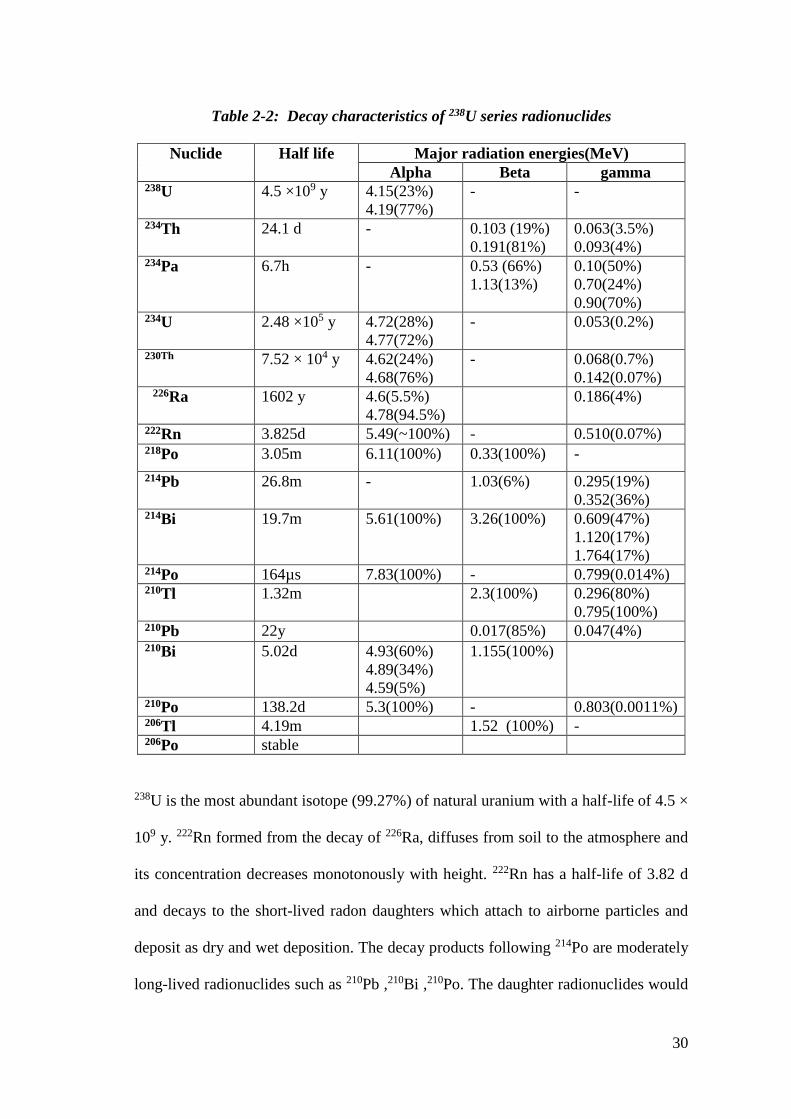
Table 2-2: Decay characteristics of 238U series radionuclides 30
Table 2-3: Decay characteristics of 235U series 32
Table 2-4: Decay characteristics of 232Th series 33
Table 2-5: Average annual Effective dose from Natural and Man-made Source 34
Table 2-6: Monazite resources in India 38
Table 2-7: Estimated Annual Effective Dose and contribution(%) from natural
sources to Indian Population and its comparison with global average [66]. 40
Table 2-8: Typical Composition of some monazite minerals from different regions 58
Table 2-9: Reference values for concentrations of 232Th in foods and drinking water 64
Table 2-10: Effective dose coefficient for intakes of thorium isotopes (Sv Bq-1) 64
Table 2-11: Neutron Sources for NAA 72
Table 3-1: Food items collected from major wholesale local markets 91
Table 3-2: Nuclear Data of 232Th 108
Table 3-3: Instrumental parameters of ICP MS 112
Table 4-1: Classification of food category with common and scientific name 119
Table 4-2: Thorium concentration (ng g-1, dry weight basis) in biological reference
materials by INAA (CIRUS) 123
Table 4-3: Thorium concentration (ng g-1, dry weight basis) in biological reference
materials by INAA (Dhruva) 123
Table 4-4: 232Th content (± 1s) in cereals and pulses 126
Table 4-5:Activity concentration of 232Th (± 1s) in Green leafy vegetables and roots
and tubers 127
Table 4-6: Activity concentration of 232Th (± 1s) in vegetables 130
Table 4-7: Activity concentration of 232Th (± 1s) in Fruits 133
Table 4-8: Activity concentration of 232Th (± 1s) in Fish 135
Table 4-9: Activity concentration of 232Th (± 1s) in Curated Fish 137
Table 4-10: Activity concentration of 232Th (± 1s) in Flesh Food 138
Table 4-11: Activity concentrations of 232Th in chicken meat from 138
Table 4-12: Activity concentration of 232Th in milk 139
Table 4-13: Daily intakes (in g per person) of food used in Market basket Studies 142
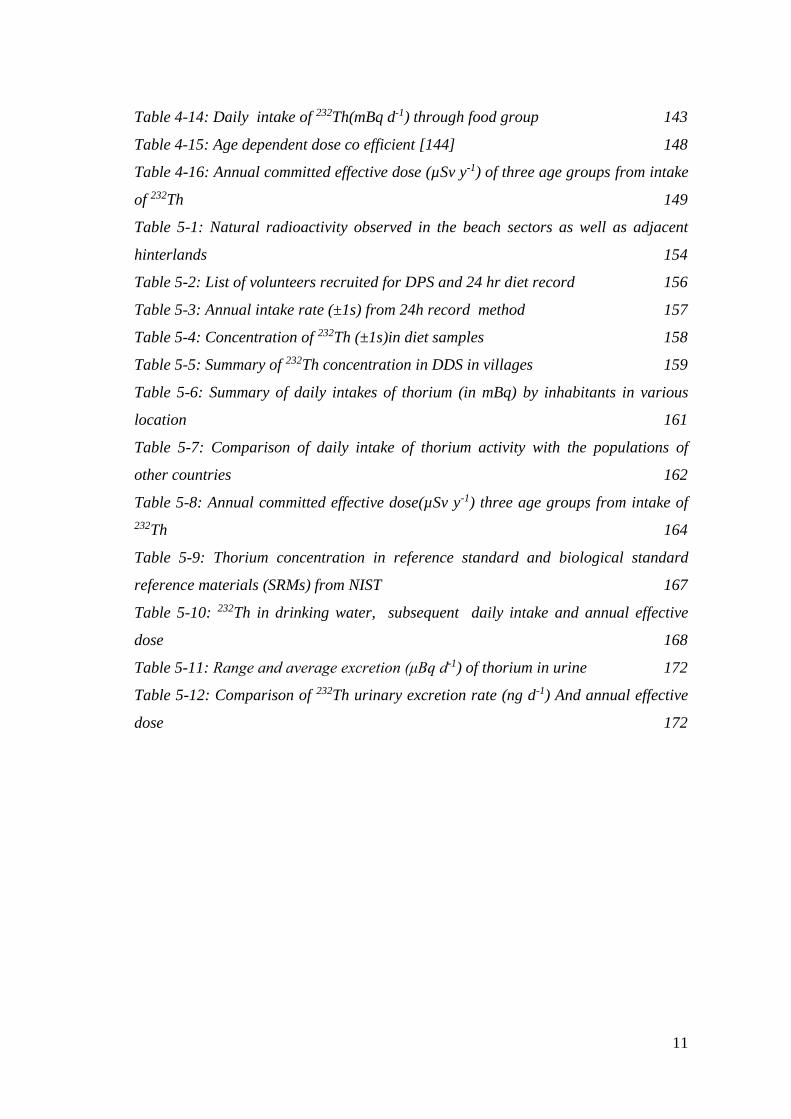
11
Table 4-14: Daily intake of 232Th(mBq d-1) through food group 143
Table 4-15: Age dependent dose co efficient [144] 148
Table 4-16: Annual committed effective dose (µSv y-1) of three age groups from intake
of 232Th 149
Table 5-1: Natural radioactivity observed in the beach sectors as well as adjacent
hinterlands 154
Table 5-2: List of volunteers recruited for DPS and 24 hr diet record 156
Table 5-3: Annual intake rate (±1s) from 24h record method 157
Table 5-4: Concentration of 232Th (±1s)in diet samples 158
Table 5-5: Summary of 232Th concentration in DDS in villages 159
Table 5-6: Summary of daily intakes of thorium (in mBq) by inhabitants in various
location 161
Table 5-7: Comparison of daily intake of thorium activity with the populations of
other countries 162
Table 5-8: Annual committed effective dose(µSv y-1) three age groups from intake of
232Th 164
Table 5-9: Thorium concentration in reference standard and biological standard
reference materials (SRMs) from NIST 167
Table 5-10: 232Th in drinking water, subsequent daily intake and annual effective
dose 168
Table 5-11: Range and average excretion (μBq d-1) of thorium in urine 172
Table 5-12: Comparison of 232Th urinary excretion rate (ng d-1) And annual effective
dose 172
12
List of Figures
Figure 2-1: Average radiation dose from natural and man-made sources 28
Figure 2-2: Human exposure pathway to radiation 41
Figure 2-3: Schematic overview of the radionuclide exposure pathways to man 43
Figure 2-4: Biokinetic model for thorium [7] 62
Figure 2-5: Schematic diagram of alpha spectrometry 65
Figure 2-6: Diagram illustrating the process of neutron capture by a 70
Figure 3-1: Methodology for dietary intake studies 81
Figure 3-2: Map of study area 82
Figure 3-3: Portable hand-held survey meter (Atomtex 1123) 87
Figure 3-4: Radiation survey spots (locations) in the study region 87
Figure 3-5: Degree of error in various stage of an analytical methodology[170]. 88
Figure 3-6 :Questionnaire and proforma for DPS 90
Figure 3-7: Farmers market at Karungal and Manavalakurichi, Tamilnadu 91
Figure 3-8: Freeze drying of samples 94
Figure 3-9: (a) Different interaction processes in HPGe detector, (b) Full energy peak
with multiple Compton events, (c) Full energy peak and multiple Compton events
with 1stand 2ndescape peaks[173] 98
Figure 3-10: Determination of resolution of detector from FWHM. 102
Figure 3-11: P type HPGe detector assembly with electronics(ORTEC). 103
Figure 3-12: Schematic diagram of an ICP- MS[174] 104
Figure 3-13: Schematic of a reverse Nier-Johnson double-focusing 106
Figure 3-14: HR-ICP-MS (ATTOM, Nu Instruments, UK) at NGRI 111
Figure 4-1: Location of Karungal Market 117
Figure 4-2: Location of Manavalakurichi Market 118
Figure 4-3: Market Basket sampling locations in the study area 120
Figure 4-4: A typical Gamma ray spectrum for vegetable sample 121
Figure 4-5: Gamma ray spectrum of irradiated reference material( SRM 1573a) 122
Figure 4-6: A typical gamma ray spectrum of a leafy vegetable(Amaranth leaves) 126
Figure 4-7: Average activity concentration in 11 important food groups 141
Figure 4-8: Contribution of different food groups to the intake 146
Figure 4-9: Contribution of 232Th dietary intakes of three food groups 147
13
Figure 5-1: Spatial mapping of absorbed dose rate 154
Figure 5-2: Summary of statistical analysis of 232Th activity in duplicate diet 159
Figure 5-3: Dendrogram of cluster analysis of 232Th concentration 159
Figure 5-4: Typical alpha spectrum of radiochemically separated Th isotopes 167
Figure 5-5: 232Th excretion in 24 h urine as funtion of age 173

14
List of Abbreviations
AMAD-Activity Median Aerodynamic Diameter
CIRUS -Canadian-Indian Reactor Uranium System
DCF-Dose Conversion Factor
DD-Duplicate Diet
DPS-Duplicate Portion Study
FWHM-Full width at Half Maximum
GPS-Geographical Positioning System
HPGe -High Purity Germanium
MBS - Market Basket Study
IAEA - International Atomic Energy Agency
ICP MS- Inductively Couples Plasma Mass Spectrometer
ICRP-International Commission for Radiological Protection
NAA-Neutron Activation Analysis
NNMB- National Nutrition Monitoring Bureau
MCA-Multichannel analyser
NORM- Naturally Occurring Radioactive Materials
NIST-National Institute of standards and Technology
HBRA-High Background Radiation Area
NBRA-Normal Background Radiation Area
REE- Rare Earth Element
SRM- Standard Reference Material
WHO-World Health Organization
UNSCEAR-United Nations Scientific Committee on the Effects of Atomic Radiation

15
Chapter 1
Introduction
16
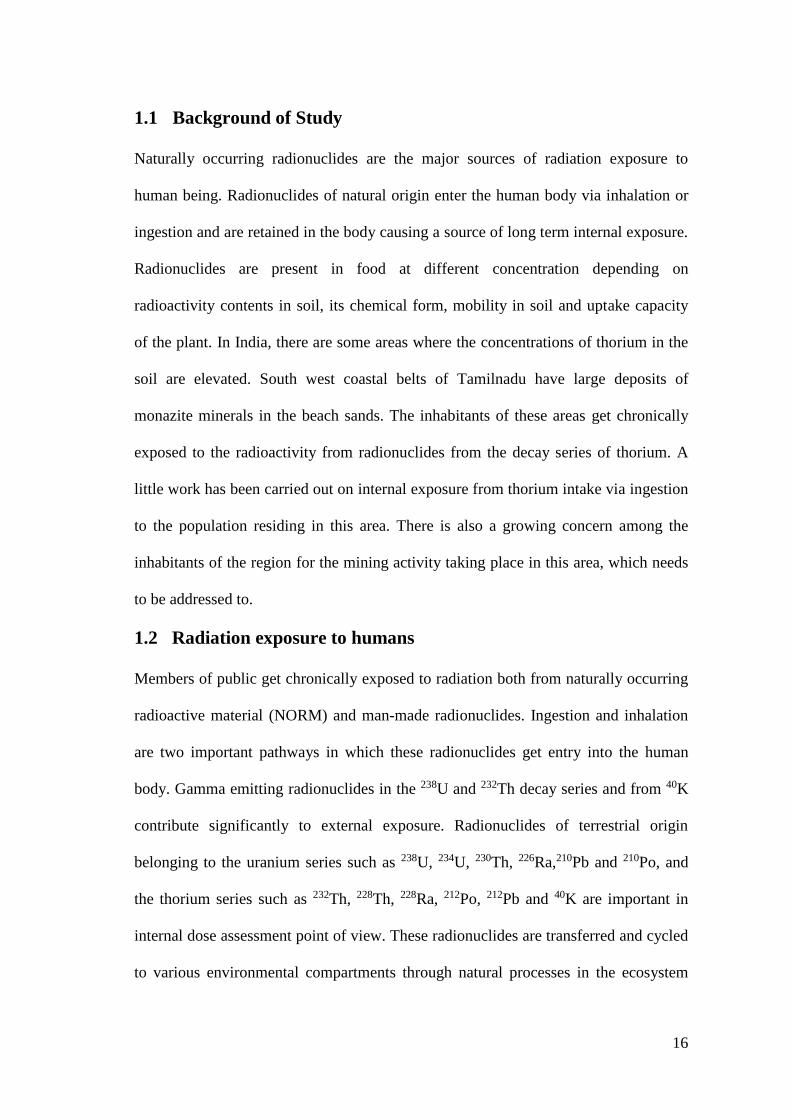
1.1 Background of Study
Naturally occurring radionuclides are the major sources of radiation exposure to
human being. Radionuclides of natural origin enter the human body via inhalation or
ingestion and are retained in the body causing a source of long term internal exposure.
Radionuclides are present in food at different concentration depending on
radioactivity contents in soil, its chemical form, mobility in soil and uptake capacity
of the plant. In India, there are some areas where the concentrations of thorium in the
soil are elevated. South west coastal belts of Tamilnadu have large deposits of
monazite minerals in the beach sands. The inhabitants of these areas get chronically
exposed to the radioactivity from radionuclides from the decay series of thorium. A
little work has been carried out on internal exposure from thorium intake via ingestion
to the population residing in this area. There is also a growing concern among the
inhabitants of the region for the mining activity taking place in this area, which needs
to be addressed to.
1.2 Radiation exposure to humans
Members of public get chronically exposed to radiation both from naturally occurring
radioactive material (NORM) and man-made radionuclides. Ingestion and inhalation
are two important pathways in which these radionuclides get entry into the human
body. Gamma emitting radionuclides in the 238U and 232Th decay series and from 40K
contribute significantly to external exposure. Radionuclides of terrestrial origin
belonging to the uranium series such as 238U, 234U, 230Th, 226Ra,210Pb and 210Po, and
the thorium series such as 232Th, 228Th, 228Ra, 212Po, 212Pb and 40K are important in
internal dose assessment point of view. These radionuclides are transferred and cycled
to various environmental compartments through natural processes in the ecosystem
17
and find their route into human food chains. According to reports of United Nations
Scientific Committee on Effects of Atomic Radiation (UNSCEAR), ingestion intake
are the major contributors to internal exposure from terrestrial radionuclides and
inhalation intake was very less [1, 9]. Hence, internal exposure needs to be evaluated
from the intake of these radionuclides in food and water for population residing in all
parts of the country covering both rural and urban regions. Thorium is the parent
radionuclide of thorium decay chain and it has higher crustal abundance than uranium.
It has many industrial application and is likely to get incorporated into human system
by means of ingestion. Once it is in the human body, thorium accumulates in lungs,
liver, and skeleton. The principal site of deposition of thorium in the body is the
skeleton (70%). Thorium also gets deposited in the liver (4%), other soft tissue (16%),
gonads (~1%) and the remaining activity (10%) is promptly excreted out in urine via
the bladder [7].
Evaluation of metabolic behavior like absorption into blood and retention in the
human body and subsequent assessment of internal dose of any radionuclide requires
detailed information of its intake by means of drinking water and dietary components.
In the study area where the background radiation levels are high due to presence of
large monazite deposits, the ingestion rate of radionuclides from thorium series and
uranium series namely 228,226Ra, 210Po, has been studied but there is no study related to
232Th ingestion intake for the inhabitants. The 232Th concentration in a few food items
like milk, banana and fish collected from the study area has been reported by other
researchers but they have used gamma ray spectrometry considering a secular
equilibrium between 232Th and its progenies. It has been observed that the use of
gamma ray spectrometry results in overestimation of ingestion intake value.
18
1.3 High background radiation area of India
Naturally occurring radionuclides like uranium (238U) and thorium (232Th) are present
universally except for a few places where they are concentrated as minerals and these
regions are called High Background Radiation Areas (HBRA). HBRA are present in
many parts of the world such as Guarapari in Brazil [10], Yangjiang in China[11], and
Ramsar in Iran[12]. The coastal towns such as Chavara, Manavalakurichi,
Bimilipattinam[13] and Chhatrapur [14] are reported to be the HBRA in India. 238U
and 232Th concentration of ∼ 0.35% and ∼ 9%, respectively, in monazite are found in
these regions. The presence of monazite deposits on the coastal areas of Kerala and
Tamil Nadu is due to the combined effect of weathering of rocks, rivers and stream
flow, morphological features of the river basins and their interaction with the sea.
Distribution of the heavy minerals in the beach sector of the study region is due to
above mentioned reasons [15].
1.4 Behavior of radionuclides in the environment
In terrestrial and aquatic ecosystems, naturally occurring radionuclides called as
naturally occurring radioactive material (NORM) are transferred from the site of
origin by air emissions, leaching, by dissolving in runoff waters, uptake by plants
from soil, transfer to animals and, finally, from the food chain to human being. The
concentration of thorium, uranium and its progeny products in natural water are
influenced by the chemical and physical characteristics of the aquifer, geological
formation involved and the oxidation states. The mobility of the radionuclides in the
environment and its uptake by the plants depend on the parameters like pH, redox
potential, ionic strength, availability of inorganic and organic ligands, presence of
microorganisms and the interaction of solved and sorbed complexes.
19
Radium is an alkaline earth element and behaves like other alkaline-earth metals. Thus
in environmental matrices, radium co-precipitates with barium to form mixed sulphate
phase. In nature, all the alkaline earths are found only in +2 oxidation state. Radium is
a water soluble and mobile element. It is easily transferred from rocks, soil or
sediments into the environment. It is often concentrated in the ground water.
Uranous (U4+) and uranyl (U6+) valence states of uranium are stable in geologic
environments. Hexavalent U compounds are more soluble than tetravalent uranium as
uranium in U6+ occurs as the uranyl ion UO22+. There is a disequilibrium between the
parent isotope and its progenies as there is a separation between the parent and the
radionuclide progenies when the rocks are exposed to weathering and water
circulation.
Thorium compounds are more stable in the +4 oxidation state in aqueous systems.
Thorium as ThO2 due to its low solubility occurs mostly as suspended particles or
sorbed onto sediments in water. Above pH 2-3, Th in +4 state (Th4+) undergoes
hydrolysis in aqueous solutions. At near neutral pH, Th gets sorbed to clay minerals
and humic acid. Thorium ions in water also forms Th(OH)4 precipitate or hydroxyl
complexes at pH above 5, which get adsorbed by particulate matter in water. Thorium
also form soluble complexes with carbonate, humic materials or other ligands in the
water [16]. Among the NORM, the order of mobility in terrestrial and aquatic
environment observed was Radium >Uranium> Thorium [16].
In an isolated equilibrium, the naturally occurring U-series or Th series radionuclides
are in secular equilibrium, but natural processes disturb this equilibrium due to the
differences in the chemical properties of the parent and the progenies. As isotopes of
U, Th and Ra has different solid – liquid distribution coefficients (Kd), the mobility in
20
different matrices and plant uptake are different and hence, there is a disequilibrium in
the environment [17]. In monazite rich soil, 232Th is expected to exist in secular
equilibrium with its daughter products. But natural processes and mining activity
often disturb the equilibrium in the soil.
In view of all above discussed factors, transfer as well as uptake of radium is more
compared to thorium and hence there is disequilibrium between the parent and the
progenies in food items.
1.5 Radioactivity in air, soil and food
Gross alpha and beta measurement are most primitive and simplest radioanalytical
procedures that are used widely for radioactivity measurements in radioecology and
environmental monitoring studies. Another radiometric technique that is often used is
gamma-ray spectrometry. 220Rn and 222Rn are two important radionuclides from
thorium and uranium series that are constantly emanating from the ground due to the
ubiquitous presence of 232Th and 238U in soil. These radionuclides can accumulate in
enclosed structure and is a main source of internal exposure via inhalation causing
considerable dose to the lungs. There are large number of reported work carried out in
this field by many investigators in different parts of the world to evaluate the dose
from radon to human from external and internal pathway [18–24].
The study area has a higher concentration of 232Th in the soil resulting in higher rate of
emanation of radon. In a work conducted by Devajayanthi, in the study area, radon
and thoron concentration in the dwelling were measured using twin cup SSNDT (LR-
115-II) detectors. The annual effective dose due to inhalation of radon and thoron
varied from 1.12 to 4.32 mSv y-1. The external radiation dose, evaluated using TLD
using CaF2 as TL phosphor, was varied from 1.23 to 4.23 mSv y-1 [25].
21
For estimating the external exposure due to outdoor occupation, it is necessary to
measure the natural radioactivity levels in the soils. There are widespread research
that has been carried out by many groups to measure the radioactivity in the soil and
sand samples in the HBRA of India [15, 26–28]. In a work carried out by
Devajayanthi et al.,226Ra, 232Th and 40K were measured in soil samples collected from
different villages in the Midalam-Manavalakurichi stretch by gamma ray spectrometry
using the peaks of 1764 keV of 214Bi, 2614.5 keV of 208Tl and 1464 keV respectively.
226Ra and 232Th in the soil varied from 18.9 to 260.5 and 534.5 to 2961 Bq kg-1
respectively [29]. The gross alpha and beta activity was also calculated. The gross
alpha activity of beach soil ranged from 8496 to 18350 Bq kg-1 [29] . In another work
carried out by Esaiselvan to measure the gross alpha activity in the soil, have reported
that the soil activity ranged from 1600 to 12000 Bq kg-1 [30].
Intake of water is an important route of internal exposure to human being. Naturally
occurring radionuclides from 232Th and 238U series in the drinking water contributes to
internal exposure. The concentration and existence of natural radionuclides in
drinking water depends on the geological environment like the aquifer rock type and
geolithology.
As the dose coefficient (Sv Bq-1) given by ICRP is different for different radionuclides,
for example the dose coefficient for adult of 238U, 226Ra, 210Po, 232Th are 4.5 × 10⁻⁸,
2.8 × 10⁻⁷, 2.1 × 10⁻⁶ and 2.3 × 10⁻⁷ Sv Bq-1 respectively, determination of
concentration of each radionuclide separately is essential for assessing the effective
dose.
Determination of radionuclides in drinking water has been carried out in many
countries in the past [31–35]. In India, works has been carried out for determination of
22
226,228Ra, 210Po, 210Pb and total uranium by many investigators [36–39]. Devajayanthi
et al., have determined the gross beta and alpha activity in the drinking water and
228Ra, 238U and 40K by gamma ray spectrometry. The radionuclides in water was pre-
concentrated with BaSO4 precipitate and counted in a ZnS (Ag) counter for gross
alpha activity in the drinking water and 232Th was determined using NaI(Tl) detector
by measuring 2.614 MeV gamma line of 208Tl. The gross alpha activity ranged from
0.07 to 0.28 Bq L-1 and 232Th activity using gamma ray spectrometry varied from 0.32
to 0.77 Bq l-1 [29]. The estimated 232Th thorium in the water was much higher than the
values reported by other workers around the world who had used alpha spectrometry,
Neutron Activation Analysis (NAA) or Inductively Coupled Plasma Mass
Spectrometry (ICP MS). The reason being, 232Th has a lesser mobility than its
progenies, so there exists a disequilibrium between the parent and the daughters.
Using gamma ray spectrometry for measuring 232Th activity in water, we are only
measuring the activity of 228Ra and not 232Th. Hence gamma ray spectrometry
measurement often results in overestimation and should not be used for quantifying
232Th in water or food material.
Another important pathway for internal intake of radionuclide by members of public is
ingestion of foodstuff. These food products are mainly of plant or animal origin. The
radionuclides can enter into the food chain both from soil and water. Hence it is
important to quantify radionuclides in dietary components consumed by the members
of public. Dietary intakes of 238,234U, 232,230,228Th, 228,226Ra ,210Pb and 210Po and 226Ra
have been evaluated by many investigators using various techniques [8, 40–45]. In a
study carried out in the southwest coastal regions of Tamilnadu, 226, 228Ra, 228Th, 40K
in typical south Indian foods such as milk, fish, rice, tapioca, banana, mango, guava,
23
tomato etc., was evaluated using gamma ray spectrometry. The concentration of 228Ra
and 228Th ranged from 0.08 to 5.42 and from 0.14 to 34.3 Bq kg-1fresh respectively [5].
210Po was also measured in the food samples and reported, whereas no comprehensive
study has been carried out on intake of 232Th for population residing in the region of
interest.
1.6 Objective of the study
The general objective of this research was to establish the ingestion intake of 232Th
and estimation of internal dose from 232Th dietary intake for population residing in the
HBRA regions of south west coast of Tamilnadu. Internal effective dose has been
calculated for other radionuclides both by inhalation and ingestion pathway but no
work has been reported upon the dietary intake of 232Th for the study group. Due to
the difficulties in estimation of 232Th in the biological matrices, information on 232Th
in dietary item and drinking water is rare worldwide and is absent in the study area.
An accurate, sensitive and reliable nuclear analytical technique known as instrumental
neutron activation analysis (INAA) and non-radiometric method ICP MS is used to
estimate the 232Th in foodstuff and water consumed by the inhabitant.
The objective of the present study is aimed:
(a) to measure 232Th in diet, dietary components and drinking water consumed by the
population; in order to have complete study on the ingestion intake and append to the
previous research carried out on ingestion intake of other radionuclides from thorium
series (228Ra and228Th) and Uranium Series (238,234U, 226Ra, 210Pb and 210Po);
(b) to provide information on the background of natural radioactivity concentration
and to contribute in this way to the creation of databases that can be used to evaluate
the impact, for instance, of mining process,
24
(c) to calculate the annual intake of the 232Th by ingestion of foodstuffs consumed by
children and adults and
(d) to estimate the annual effective dose from 232Th from ingestion pathway thereby
adding to the existing data on external, inhalation and ingestion dose from other
radionuclides from uranium and thorium decay series.
1.7 Significance of the study
For realistic dose assessment, clear understanding of biokinetic behavior of thorium is
important. The regions in the study area have large deposits of monazite and other
minerals. 232Th is the main element and there is a paucity of information on its dietary
intake by the population. The outcome of the study will serve as baseline information
for any epidemiological studies to be carried out in the study area. Sand containing
minerals (monazite, illeminite, zirconite etc.) are being mined from the region for
separation of rare earths and thorium. There is a growing concern among the
population that the mining in the region will cause health effects. The results of the
study will help to confirm that mining activities don’t contribute to any increase in the
concentration of radionuclides in the food chain.
For a large country like India, to meet the growing energy needs, it is important to
look upon solar and non-conventional renewable energy sources. In this scenario,
nuclear energy is a sustainable option and in Indian Nuclear Power Programme
(INPP), thorium has a very important role in view of large thorium reserves in the
form of monazite deposits along the coastal regions compared to the limited uranium
reserve [46]. Hence there is a growing interest in our country to use this reservoir
which will result in more mining, milling and separation activities in the country.
More workers may likely get exposed to thorium and its progenies in the following
25
years to come. Using the daily excretion in urine, it is possible to assess the extent of
exposure of subjects to thorium and the related risk provided biokinetic factors like
absorption fraction from gastrointestinal tract or respiratory tract, its distribution,
retention is available. Information on daily dietary intake is one of the important input
parameter for evaluating the absorption fraction from gastrointestinal tract. Hence,
information on daily dietary intakes of 232Th is important in the development of
realistic biokinetic model for Indian population.

26
chapter 2
Literature Survey
27
2.1 Radioactivity in the environment
Members of public get exposed to radiation from sources of natural and man-made
origin. Cosmic rays cause external exposure whereas the radionuclides of terrestrial
and cosmic origin can cause both internal and external exposure.
The radionuclides in our environment can be classified as
i) Natural radionuclides which are formed from high-energy cosmic ray particles
incident on the earth's atmosphere (cosmo-genic) and those that are part of the
natural decay chains (Thorium, Uranium) and singly occurring long lived
radionuclides like 40K and 87Rb that are omnipresent in earth crust.
ii) Man-made or anthropogenic radionuclides that are formed from modern
techniques.
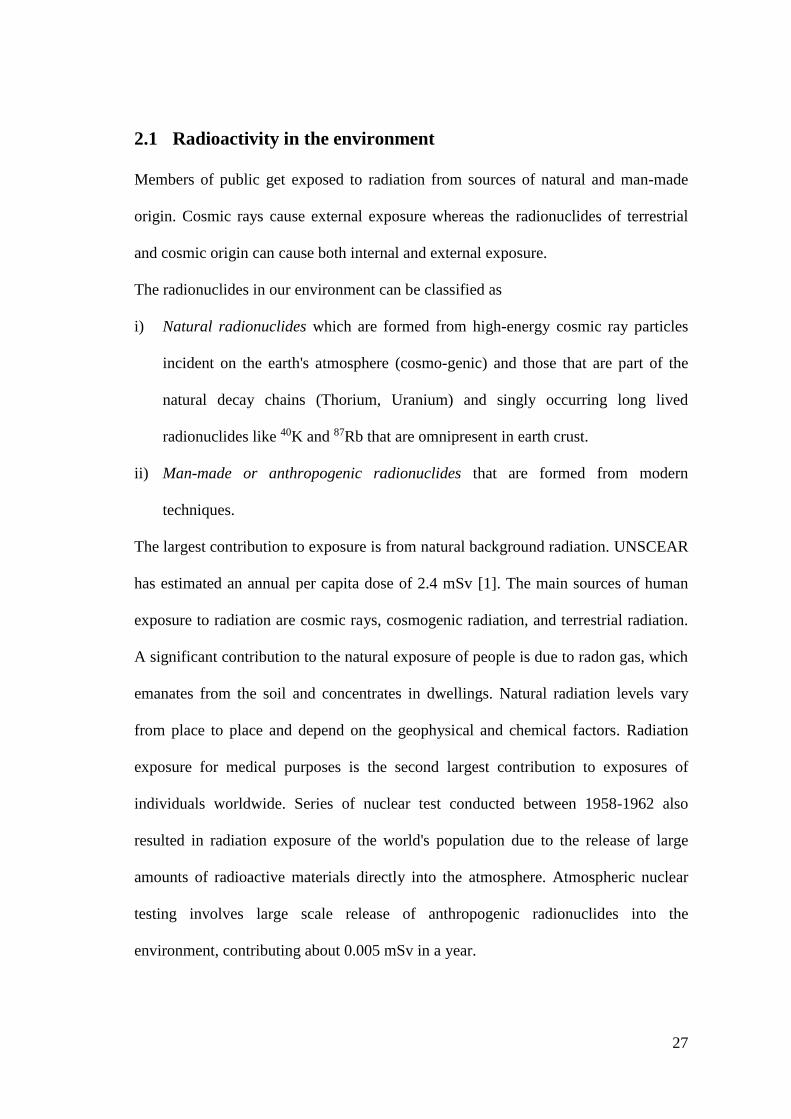
The largest contribution to exposure is from natural background radiation. UNSCEAR
has estimated an annual per capita dose of 2.4 mSv [1]. The main sources of human
exposure to radiation are cosmic rays, cosmogenic radiation, and terrestrial radiation.
A significant contribution to the natural exposure of people is due to radon gas, which
emanates from the soil and concentrates in dwellings. Natural radiation levels vary
from place to place and depend on the geophysical and chemical factors. Radiation
exposure for medical purposes is the second largest contribution to exposures of
individuals worldwide. Series of nuclear test conducted between 1958-1962 also
resulted in radiation exposure of the world's population due to the release of large
amounts of radioactive materials directly into the atmosphere. Atmospheric nuclear
testing involves large scale release of anthropogenic radionuclides into the
environment, contributing about 0.005 mSv in a year.
28
Figure 2-1: Average radiation dose from natural and man-made sources
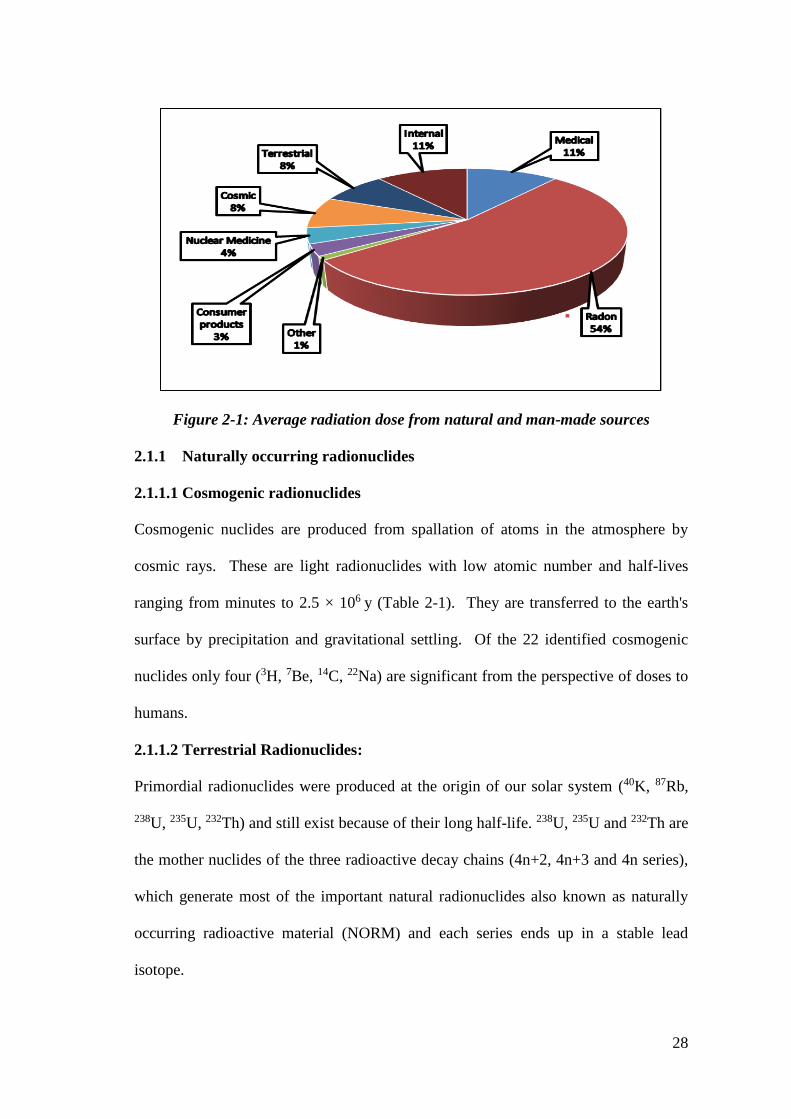
2.1.1 Naturally occurring radionuclides
2.1.1.1 Cosmogenic radionuclides
Cosmogenic nuclides are produced from spallation of atoms in the atmosphere by
cosmic rays. These are light radionuclides with low atomic number and half-lives
ranging from minutes to 2.5 × 10⁶ y (Table 2-1). They are transferred to the earth's
surface by precipitation and gravitational settling. Of the 22 identified cosmogenic
nuclides only four (3H, 7Be, 14C, 22Na) are significant from the perspective of doses to
humans.
2.1.1.2 Terrestrial Radionuclides:
Primordial radionuclides were produced at the origin of our solar system (40K, 87Rb,
238U, 235U, 232Th) and still exist because of their long half-life. 238U, 235U and 232Th are
the mother nuclides of the three radioactive decay chains (4n+2, 4n+3 and 4n series),
which generate most of the important natural radionuclides also known as naturally
occurring radioactive material (NORM) and each series ends up in a stable lead
isotope.
29
Table 2-1: Cosmogenic radionuclides
Element Isotope Half-life Decay Mode
Hydrogen 3H 12.33 y β (100%)
Beryllium 7Be 53.29 d
1.51 × 10⁶ y
EC (100%)
β (100%) 10Be
Carbon 14C 5730 y β (100%)
Sodium 22Na 2.602 y EC (100%)
Aluminium 26Al 7.41 × 10⁵ y EC (100%)
Silicon 32Si 172 y β (100%)
Phosphorus 32P 14.26 d
25.34 d
β (100%)
β (100%) 35P
Sulphur 35S 87.51 d β (100%)
Chlorine 36Cl 3.01 × 10⁵ y EC (1.9%), β (100%)
Argon 37Ar 39Ar
35.04 d
269 y
EC (100%)
β (100%)
Krypton 81Kr 2.29 x 10⁵ y EC (100%)
2.1.1.2.1 Potassium 40 (40K) and Rubidium 87 (87Rb)
Natural potassium comprises three isotopes (39K, 40K, 41K) where 40K is the only
radioactive isotope. 40K has a long half-life of 1.26 × 10⁹ y with an isotopic abundance
of 0.012% of naturally occurring potassium. 40K undergoes beta decay (Emax 1.314
MeV, 89%) to form stable 40Ca, 11% undergoes decay by positron emission and
emitting a characteristic photon of 1.46 MeV energy. Potassium is a lithophile
element and is uniformly distributed in rocks. Potassium is soluble under most
conditions and during weathering; it gets easily mobilized into solution.
85Rb and 87Rb are two isotopes of rubidium and only 87Rb is radioactive and
undergoes beta decay with a half-life of 4.8 × 10¹⁰ y with an elemental abundance of
27.8%. 87Rb emits beta particles with Emax of 292 keV (Eavg of ~79 keV).
2.1.1.2.2 238U series
238U is the parent radionuclide of 4n +2 series and the important ones are 230Th, 226Ra,
222Rn, 210Po and 210Pb. Decay characteristics of 238U series radionuclides are given in
Table 2-2.
30
Table 2-2: Decay characteristics of 238U series radionuclides
Nuclide Half life Major radiation energies(MeV)
Alpha Beta gamma 238U
4.5 ×10⁹ y 4.15(23%)
4.19(77%)
- -
234Th
24.1 d - 0.103 (19%)
0.191(81%)
0.063(3.5%)
0.093(4%) 234Pa
6.7h - 0.53 (66%)
1.13(13%)
0.10(50%)
0.70(24%)
0.90(70%) 234U
2.48 ×10⁵ y 4.72(28%)
4.77(72%)
- 0.053(0.2%)
230Th 7.52 × 10⁴ y 4.62(24%)
4.68(76%)
- 0.068(0.7%)
0.142(0.07%) 226Ra 1602 y 4.6(5.5%)
4.78(94.5%)
0.186(4%)
222Rn 3.825d 5.49(~100%) - 0.510(0.07%) 218Po 3.05m 6.11(100%) 0.33(100%) -
214Pb 26.8m - 1.03(6%) 0.295(19%)
0.352(36%) 214Bi
19.7m 5.61(100%) 3.26(100%) 0.609(47%)
1.120(17%)
1.764(17%) 214Po 164µs 7.83(100%) - 0.799(0.014%) 210Tl 1.32m 2.3(100%) 0.296(80%)
0.795(100%) 210Pb 22y 0.017(85%) 0.047(4%) 210Bi 5.02d 4.93(60%)
4.89(34%)
4.59(5%)
1.155(100%)
210Po 138.2d 5.3(100%) - 0.803(0.0011%) 206Tl 4.19m 1.52 (100%) - 206Po stable
238U is the most abundant isotope (99.27%) of natural uranium with a half-life of 4.5 ×
109 y. 222Rn formed from the decay of 226Ra, diffuses from soil to the atmosphere and
its concentration decreases monotonously with height. 222Rn has a half-life of 3.82 d
and decays to the short-lived radon daughters which attach to airborne particles and
deposit as dry and wet deposition. The decay products following 214Po are moderately
long-lived radionuclides such as 210Pb ,210Bi ,210Po. The daughter radionuclides would
31
achieve secular equilibrium in an isolated system. However, natural processes can
separate the radionuclides in decay chains because of differences in chemical and
physical properties.
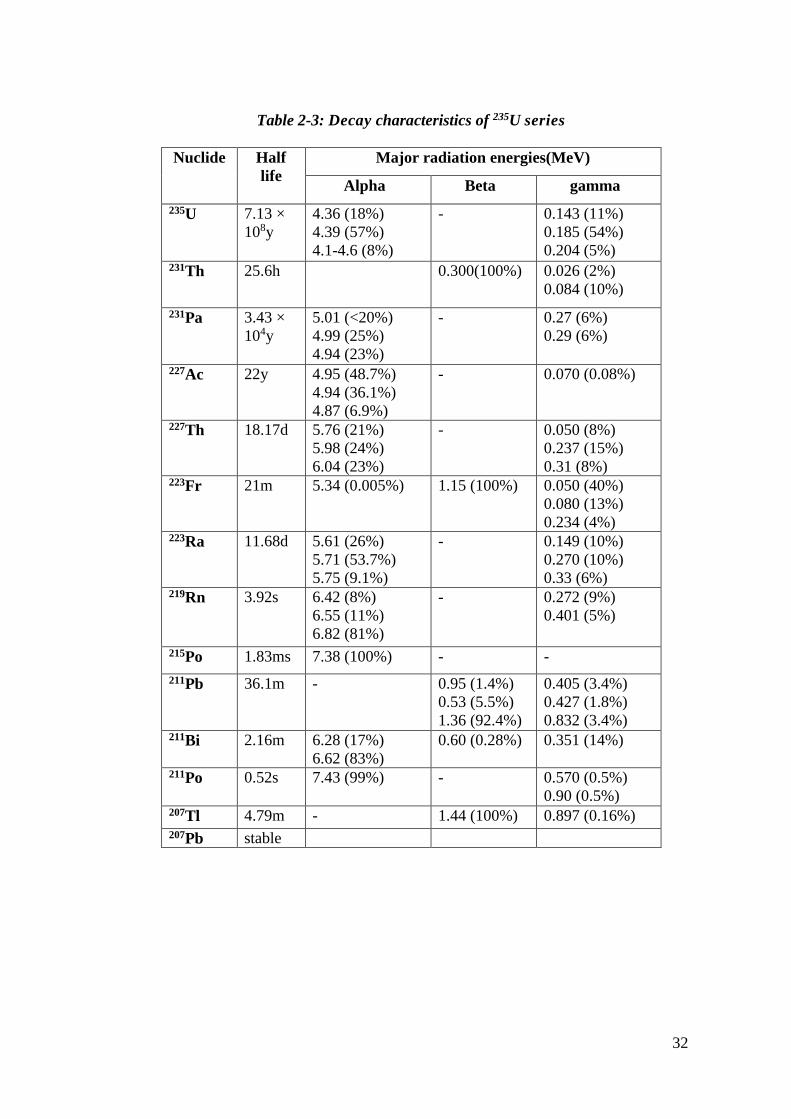
2.1.1.2.3 235U Decay Series
The series, also called the actinium series, begins with its longest lived nuclide 235U
and ends with the stable 207Pb. The actinium 4n + 3 series is summarized in Table 2-
3. 235U has a half-life of 7.1 x 10⁸ y. 235U decays to beta emitting 231Th with half-life
of 26.6 h. The subsequent daughter products 231Pa (T1/2 = 3.43 × 10⁴ y) is a long lived
alpha emitter. The other daughter nuclides are very short lived.
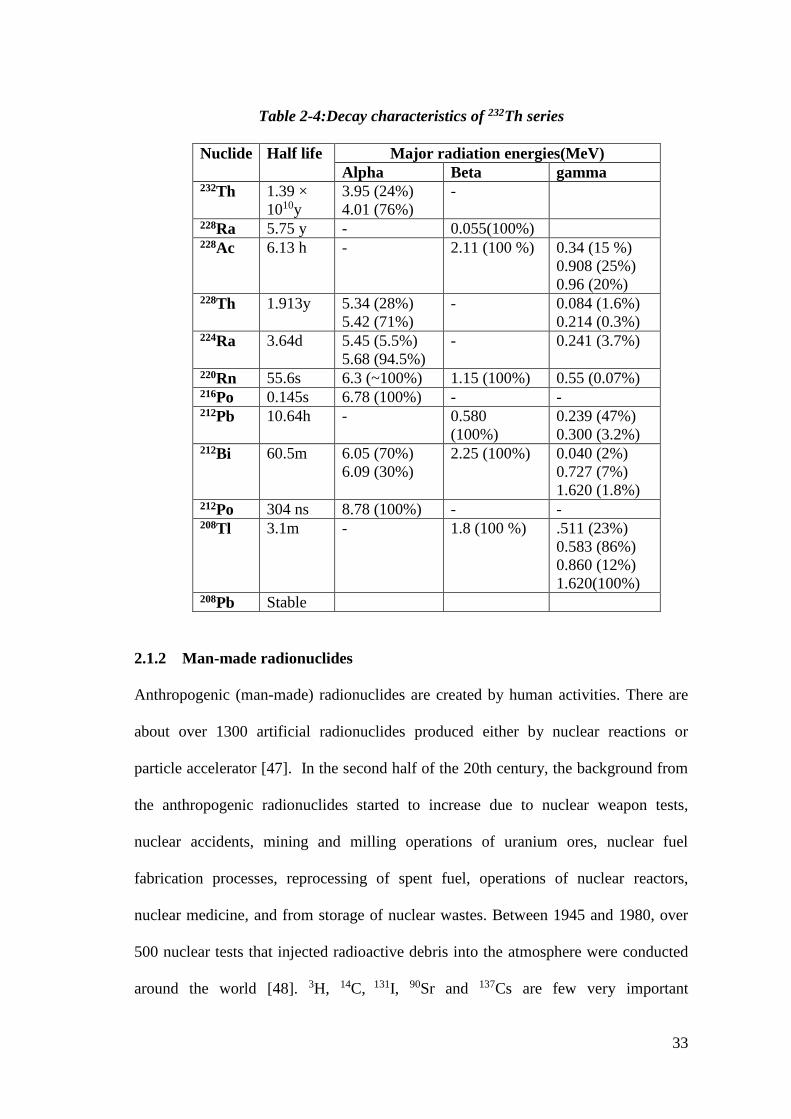
2.1.1.2.4 Thorium Series
The decay chain of 232Th includes 6 alphas and 4 beta decays, with associated gamma
de-excitation of nuclei. 232Th is the longest lived naturally occurring radionuclide with
half-life of 1.4 × 10¹⁰ y and emits alpha (4.01 and 3.95 MeV). This series has three
subseries. 228Ra subseries radionuclides include 228Ac, 228Th and 224Ra. The daughter
product, 228Ra is the longest lived intermediate in 232Th series with half-life of 5.76 y
and decays to 228Ac. 228Ac has a half-life of 6.13 h and decays with emission of beta
and gamma rays. The gamma energies of 228Ac are often used for measuring 228Ra
activity. The nuclear characteristics are given in Table 2-4. 224Ra decays to 220Rn and
heads the subsequent subseries. 220Rn and its decay products are all very short lived,
the longest half-life being that of 212Pb with half-life, 10.64 h. The daughter product
208Tl emits 2.62 MeV gamma rays that can cause significant external exposure dose if
high concentration of 228Ra is present.
32
Table 2-3: Decay characteristics of 235U series
Nuclide Half
life
Major radiation energies(MeV)
Alpha Beta gamma
235U 7.13 ×
108y
4.36 (18%)
4.39 (57%)
4.1-4.6 (8%)
- 0.143 (11%)
0.185 (54%)
0.204 (5%) 231Th 25.6h 0.300(100%) 0.026 (2%)
0.084 (10%)
231Pa 3.43 ×
104y
5.01 (<20%)
4.99 (25%)
4.94 (23%)
- 0.27 (6%)
0.29 (6%)
227Ac 22y 4.95 (48.7%)
4.94 (36.1%)
4.87 (6.9%)
- 0.070 (0.08%)
227Th 18.17d 5.76 (21%)
5.98 (24%)
6.04 (23%)
- 0.050 (8%)
0.237 (15%)
0.31 (8%) 223Fr 21m 5.34 (0.005%) 1.15 (100%) 0.050 (40%)
0.080 (13%)
0.234 (4%) 223Ra 11.68d 5.61 (26%)
5.71 (53.7%)
5.75 (9.1%)
- 0.149 (10%)
0.270 (10%)
0.33 (6%) 219Rn 3.92s 6.42 (8%)
6.55 (11%)
6.82 (81%)
- 0.272 (9%)
0.401 (5%)
215Po 1.83ms 7.38 (100%) - -
211Pb 36.1m - 0.95 (1.4%)
0.53 (5.5%)
1.36 (92.4%)
0.405 (3.4%)
0.427 (1.8%)
0.832 (3.4%) 211Bi 2.16m 6.28 (17%)
6.62 (83%)
0.60 (0.28%) 0.351 (14%)
211Po 0.52s 7.43 (99%) - 0.570 (0.5%)
0.90 (0.5%) 207Tl 4.79m - 1.44 (100%) 0.897 (0.16%) 207Pb stable
33
Table 2-4:Decay characteristics of 232Th series
Nuclide Half life Major radiation energies(MeV)
Alpha Beta gamma 232Th 1.39 ×
1010y
3.95 (24%)
4.01 (76%)
-
228Ra 5.75 y - 0.055(100%) 228Ac 6.13 h - 2.11 (100 %) 0.34 (15 %)
0.908 (25%)
0.96 (20%) 228Th 1.913y 5.34 (28%)
5.42 (71%)
- 0.084 (1.6%)
0.214 (0.3%) 224Ra 3.64d 5.45 (5.5%)
5.68 (94.5%)
- 0.241 (3.7%)
220Rn 55.6s 6.3 (~100%) 1.15 (100%) 0.55 (0.07%) 216Po 0.145s 6.78 (100%) - - 212Pb 10.64h - 0.580
(100%)
0.239 (47%)
0.300 (3.2%) 212Bi 60.5m 6.05 (70%)
6.09 (30%)
2.25 (100%) 0.040 (2%)
0.727 (7%)
1.620 (1.8%) 212Po 304 ns 8.78 (100%) - - 208Tl 3.1m - 1.8 (100 %) .511 (23%)
0.583 (86%)
0.860 (12%)
1.620(100%) 208Pb Stable
2.1.2 Man-made radionuclides
Anthropogenic (man-made) radionuclides are created by human activities. There are
about over 1300 artificial radionuclides produced either by nuclear reactions or
particle accelerator [47]. In the second half of the 20th century, the background from
the anthropogenic radionuclides started to increase due to nuclear weapon tests,
nuclear accidents, mining and milling operations of uranium ores, nuclear fuel
fabrication processes, reprocessing of spent fuel, operations of nuclear reactors,
nuclear medicine, and from storage of nuclear wastes. Between 1945 and 1980, over
500 nuclear tests that injected radioactive debris into the atmosphere were conducted
around the world [48]. 3H, 14C, 131I, 90Sr and 137Cs are few very important
34
radionuclides produced in nuclear detonations. Nuclear reactor accidents involved
release of short term single source of radioactive materials to the atmosphere. 90Sr,
134Cs, 137Cs, 85Kr, 95Zr, 239Pu, 131I, 129I etc. are few radionuclides released during
nuclear reactor accidents along with highly radioactive fuel fragments.
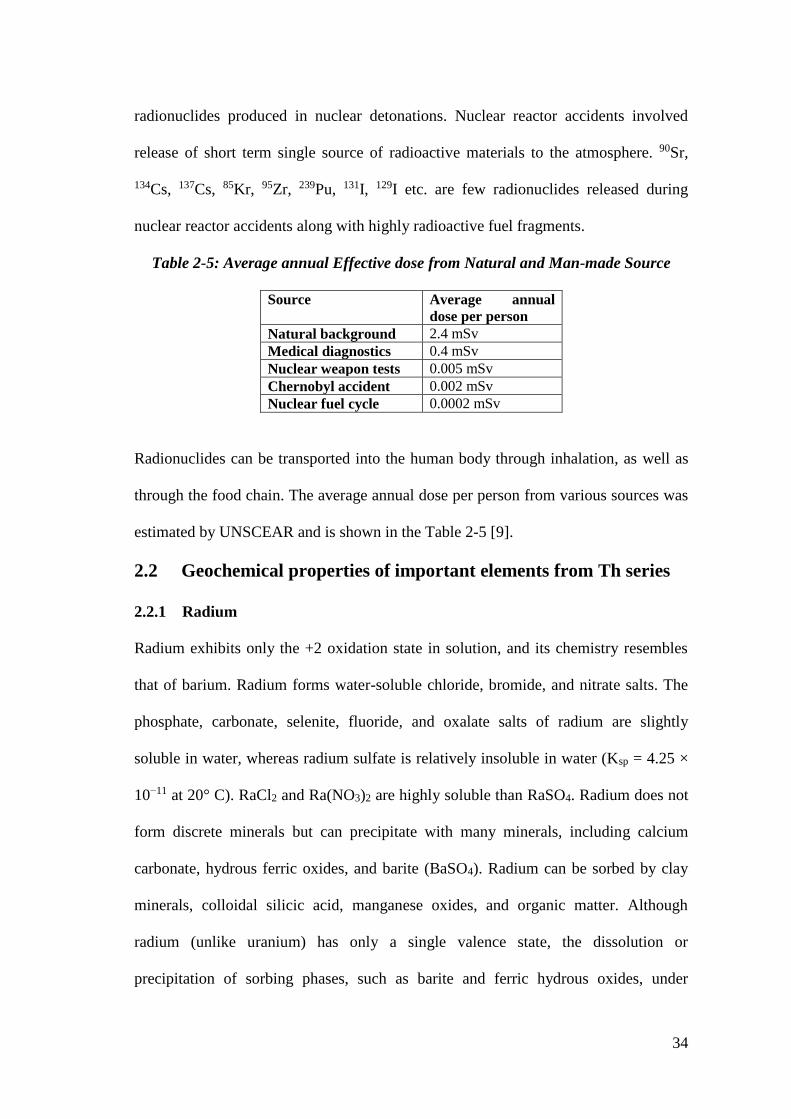
Table 2-5: Average annual Effective dose from Natural and Man-made Source
Source Average annual
dose per person
Natural background 2.4 mSv
Medical diagnostics 0.4 mSv
Nuclear weapon tests 0.005 mSv
Chernobyl accident 0.002 mSv
Nuclear fuel cycle 0.0002 mSv
Radionuclides can be transported into the human body through inhalation, as well as
through the food chain. The average annual dose per person from various sources was
estimated by UNSCEAR and is shown in the Table 2-5 [9].
2.2 Geochemical properties of important elements from Th series
2.2.1 Radium
Radium exhibits only the +2 oxidation state in solution, and its chemistry resembles
that of barium. Radium forms water-soluble chloride, bromide, and nitrate salts. The
phosphate, carbonate, selenite, fluoride, and oxalate salts of radium are slightly
soluble in water, whereas radium sulfate is relatively insoluble in water (Ksp = 4.25 ×
10−11 at 20° C). RaCl2 and Ra(NO3)2 are highly soluble than RaSO4. Radium does not
form discrete minerals but can precipitate with many minerals, including calcium
carbonate, hydrous ferric oxides, and barite (BaSO4). Radium can be sorbed by clay
minerals, colloidal silicic acid, manganese oxides, and organic matter. Although
radium (unlike uranium) has only a single valence state, the dissolution or
precipitation of sorbing phases, such as barite and ferric hydrous oxides, under
35
changing oxidation-reduction conditions can influence its mobility. Groundwater is
low in sulfate but high in ionic strength, calcium, and barium resulting in
conduciveness to the transport of radium.
2.2.2 Thorium
In nature, thorium occurs as 232Th with 100% abundance though the shorter lived
234Th (24.1 d half-life) and 230Th (7.54 × 10⁴ y half-life) in the 238U chain; 228Th (1.9 y
half-life) in the 232Th chain; and 231Th (1.06 d half-life) in the 235U chain are present.
Natural thorium has a specific activity of 4.07 MBq kg-1. Thorium is more abundant
than uranium in the earth crust. Thorium is commonly present in the +4 oxidation
state, which is mostly immobile. Though fractionation occurs for both thorium and
uranium during igneous processes, uranium is more mobile as uranium oxidizes to U6+
to form the very soluble, uranyl (UO2) 2+ ion. Thorium remains in the refractory solid
form and are hence often transported as distinct grains of various minerals. Sandstones
contain about 2 ppm Th, beach sands contain 10 ppm, and limestone has about 2 ppm.
Monazite is the common ore mineral of thorium that occurs in igneous rocks. Thorium
has the tendency to substitute with elements of similar size and charge, such as U, Zr,
Ce and other rare earth. Thorium shows a strong affinity for phosphorous, hence in
most minerals, thorium always has greater phosphate content. Like U, Th also has a
high affinity for inorganic ligands, like fluoride, phosphate, hydroxide and sulfate,
hence increasing its mobility especially at pH between 2 and 8. Th also forms organic
ligand with humic acid [49, 50].
Thorium forms highly insoluble hydrated oxide precipitate at near neutral pH and they
also co precipitate with hydrated ferric oxides. This helps in mobility or removal of
36
thorium from the minerals. The dissolution rate of thorium bearing mineral is very
low, hence thorium concentrations in natural waters are generally low [51].
2.3 High Background Radiation Area (HBRA)
There are regions around the world where the natural background radiation levels are
high with potential public annual effective dose from external and internal exposures
higher than 1 mSv y−1 dose limit set for members of public due to operation of nuclear
facilities. Accordingly, High Background Radiation Area (HBRA) is defined as “an
area or a complex of dwellings where the sum of exposures from cosmic radiation and
natural radioactivity in soil, indoor and outdoor air, water, food, etc. lead to
higher/chronic exposure situations from external and internal exposures that results in
an annual effective dose to the public above a defined level” [52]. Based on the annual
effective doses of the inhabitants, HBRA have been classified accordingly into four
levels: low, annual effective dose below 5 mSv y−1 (or about twice the global average
of 2.4 mSvy−1 reported by UNSCEAR, 2000); medium (5-20 mSv y−1), high (20-50
mSv y−1); and very high (>50 mSv y−1) [53, 54]. The geology and geochemistry of the
rocks and minerals have the greatest influence in determining where the high natural
radiation shows up.
2.3.1 Iran
In Iran, Ramsar is a well-known HBRA. The higher levels of radiation in these
regions are due enhanced concentration of 226Ra and its decay products, which were
brought to the earth's surface by hot springs. Subsurface geological activity causes the
heating up of the ground water and when this hot water passes through relatively
young and uraniferous igneous rock, radium is dissolved from the rocks into the hot
ground water. A dose of about 260 mSv y−1 is received by the population residing in
37
this area [12]. According to Sohrabi et al., absorbed dose rates in the air outdoors
ranged from 0.08 to 20 μGy h-1 and some hot spots in northern region showed higher
values up to 100 μGy h-1.[55]. He has also reported the soil concentration in the range
of 15 – 120 Bq kg-1 for 232Th, 20 – 3.8 × 10⁴ Bq kg-1 for 226Ra and 235 – 634 Bq kg-1
for 40K. Another spring, in Hormozg in south of Iran also had higher levels of
radiation. Dabbagh et al., has measured a maximum effective dose of 42 mSv y−1
around the spring and the highest activity concentration of 226Ra, 232Th and 40K in the
mineral spring was 34 Bq l-1, 2.52 Bq l-1and 11.80 Bq l-1 respectively [56].
2.3.2 Brazil
The radioactivity originated from the mountains rich in zirconites and monazites along
the coast. The coastal region in this area showed radiation dose as high as 130 μSv h-1
in few places. Guarapari, a village in Brazil, with population of about 12,000
inhabitants has high concentration of monazite in the local soil. The naturally
occurring 226Ra, 214Pb, 232Th, and 40K in beach sands ranged from 6.0 to 4100, 6.0 to
3600, 20 to 57,000 and 73 to 3000 Bq kg-1 respectively [57].
2.3.3 China
Two regions namely, Donganling and Tongyou, in Yangjiang County, are well known
HBRA in china, with more than 80,000 inhabitants. The annual effective dose is
estimated to be 6.4 mSv (640 mrem) [9, 11]. The mean of the natural radionuclides
238U, 232Th, 226Ra and 40K in soil of the well-known HBRA in China from Guangdong
province was reported to be 140, 187, 134 and 680 Bq kg-1 [58, 59].
2.3.4 India
In India, there are a monazite placer deposits along its coastal line like Ullal and
Mangalore beaches in Karnataka, Chavara, Neendakara, Vizhinjam-Kovalam, etc., in
38
Kerala, Midalam- Manavalakurichi- Muttom coastal stretch, Kalpakkam, etc., in
Tamilnadu, Bhimunipatnam, Konda- Kandivaiasa- Mukumpeta in Andhra Pradesh,
and Chhatrapur Sanaeka- sangi- Gopalpur and Puri in Orissa [60]. A typical
composition of monazite contains 3-10% of thorium oxide, less than 0.5% of uranium
oxide and 60-65% of rare earth oxide of which 20% is Cerium oxide[61]. Indian
monazite has an average Th content of about 9-10% as Oxide [62].
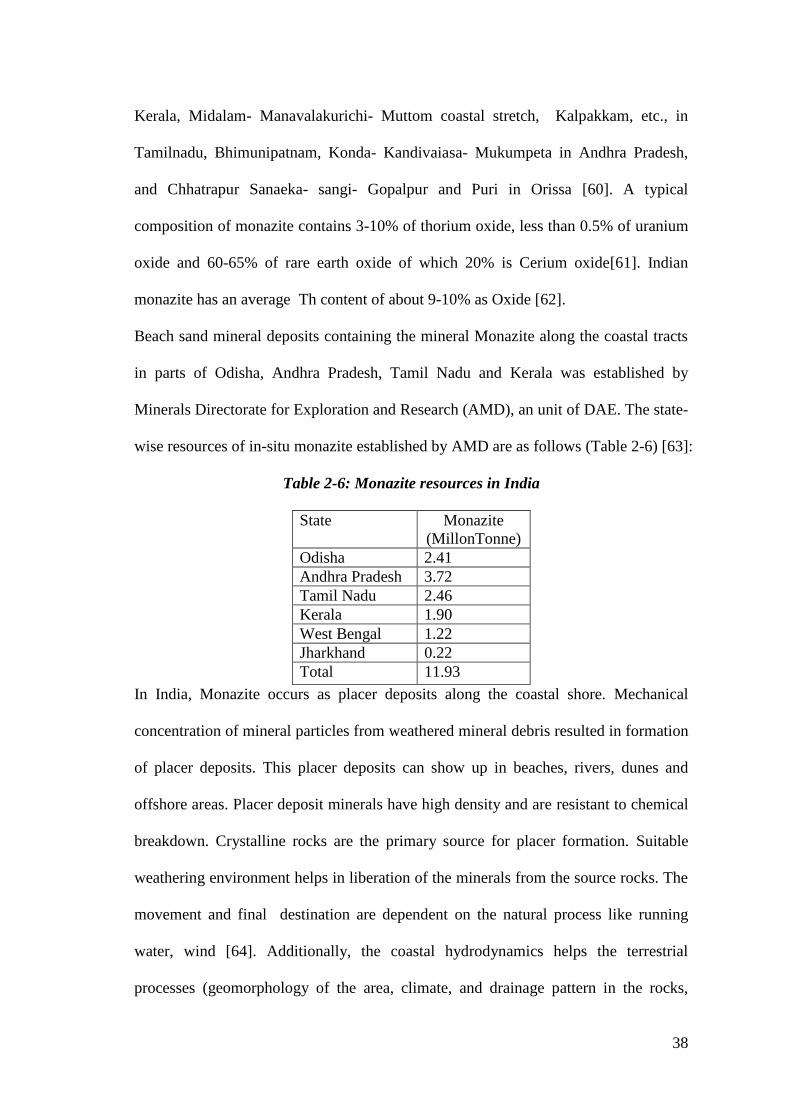
Beach sand mineral deposits containing the mineral Monazite along the coastal tracts
in parts of Odisha, Andhra Pradesh, Tamil Nadu and Kerala was established by
Minerals Directorate for Exploration and Research (AMD), an unit of DAE. The state-
wise resources of in-situ monazite established by AMD are as follows (Table 2-6) [63]:
Table 2-6: Monazite resources in India
State Monazite
(MillonTonne)
Odisha 2.41
Andhra Pradesh 3.72
Tamil Nadu 2.46
Kerala 1.90
West Bengal 1.22
Jharkhand 0.22
Total 11.93
In India, Monazite occurs as placer deposits along the coastal shore. Mechanical
concentration of mineral particles from weathered mineral debris resulted in formation
of placer deposits. This placer deposits can show up in beaches, rivers, dunes and
offshore areas. Placer deposit minerals have high density and are resistant to chemical
breakdown. Crystalline rocks are the primary source for placer formation. Suitable
weathering environment helps in liberation of the minerals from the source rocks. The
movement and final destination are dependent on the natural process like running
water, wind [64]. Additionally, the coastal hydrodynamics helps the terrestrial
processes (geomorphology of the area, climate, and drainage pattern in the rocks,
39
geotectonic) in formation of beach placer deposits. When heavy minerals gets
deposited on the beach, by means of processes like wind action in the upper part of the
beach, the minerals get eroded and further form heavy mineral rich coastal dune
deposits [65]. Beach placers forms the important source for mineral deposits like
ilmenite, rutile, zircon, monazite and garnet. India has large placer deposits along its
coast. Due to the high concentration of thorium rich monazite mineral in these regions,
epidemiological, radiobiological and dosimetry studies is important.
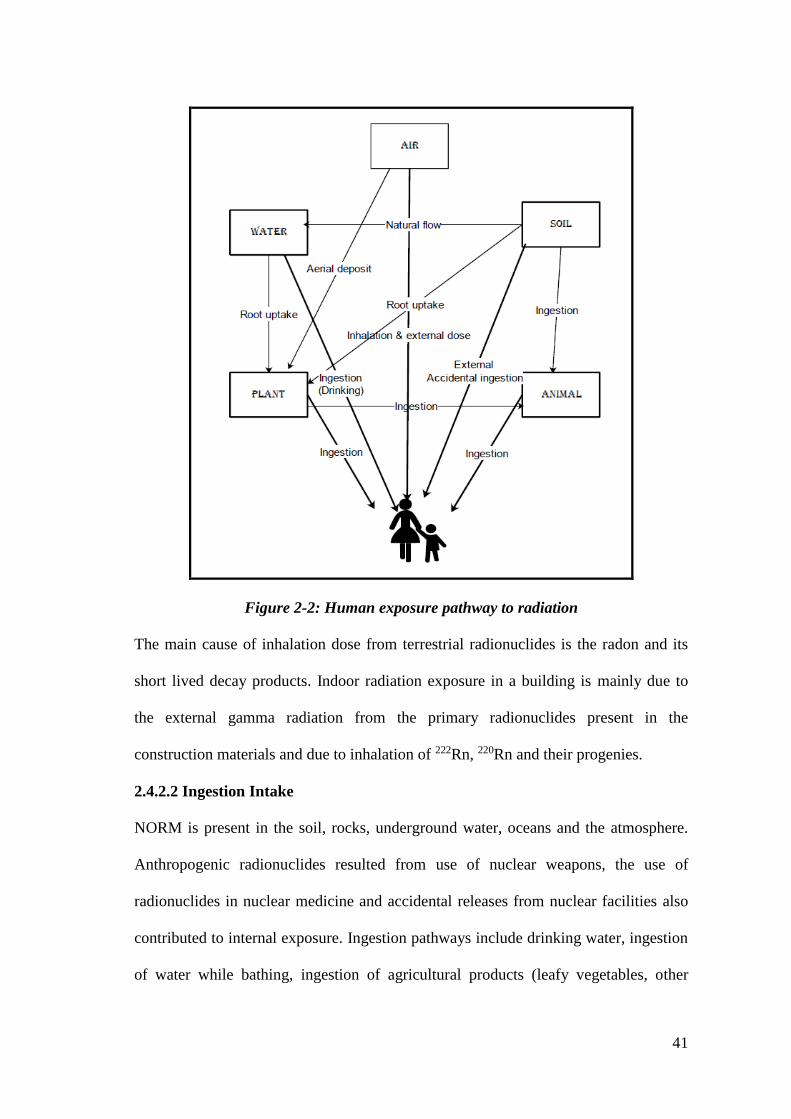
2.4 The human radiation exposure
Humans and all living beings are exposed to ionizing radiation from cosmic rays,
terrestrial radionuclides in soil, building material, air, water, food and in humans itself
(Fig 2-2). The contribution from manmade radionuclides is minuscule when compared
to natural radiation.
Exposure to radiation from natural and artificial sources are classified into two
categories (Table 2-7)
1) External exposure from extra-terrestrial radiation i.e., cosmic radiation, and
radiation of terrestrial origin and man manmade radionuclides.
2) Internal exposure involving naturally occurring radionuclides and man-made
radionuclides entering the human via inhalation and ingestion.
2.4.1 External Exposure
The external exposure is primarily from gamma radiation arising from the decay of
cosmic radiation, decay of naturally occurring and man-made radionuclides. The three
important contributors to the terrestrial radiation are 40K, radionuclides from thorium
and uranium series. Radionuclides present in the top 20 cm soil contributes maximum
to the external dose. Fig 2.2 shows the various exposure pathways.
40
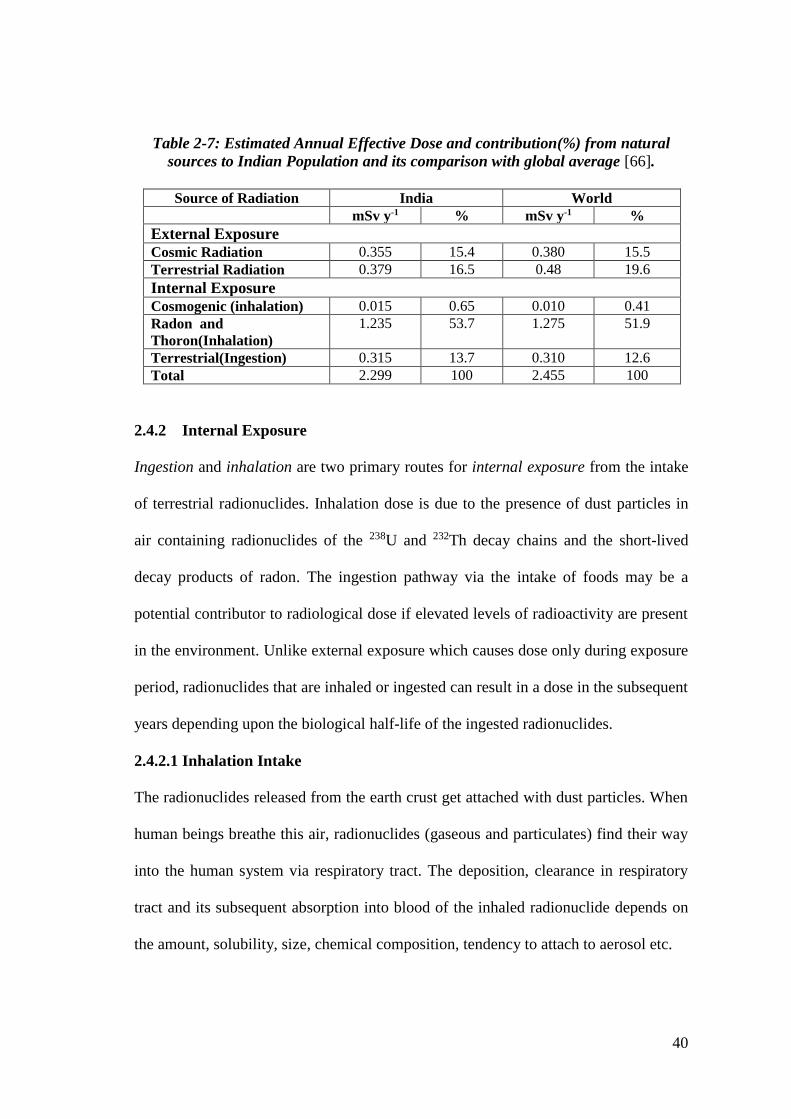
Table 2-7: Estimated Annual Effective Dose and contribution(%) from natural
sources to Indian Population and its comparison with global average [66].
Source of Radiation India World
mSv y-1 % mSv y-1 %
External Exposure
Cosmic Radiation 0.355 15.4 0.380 15.5
Terrestrial Radiation 0.379 16.5 0.48 19.6
Internal Exposure
Cosmogenic (inhalation) 0.015 0.65 0.010 0.41
Radon and
Thoron(Inhalation)
1.235 53.7 1.275 51.9
Terrestrial(Ingestion) 0.315 13.7 0.310 12.6
Total 2.299 100 2.455 100
2.4.2 Internal Exposure
Ingestion and inhalation are two primary routes for internal exposure from the intake
of terrestrial radionuclides. Inhalation dose is due to the presence of dust particles in
air containing radionuclides of the 238U and 232Th decay chains and the short-lived
decay products of radon. The ingestion pathway via the intake of foods may be a
potential contributor to radiological dose if elevated levels of radioactivity are present
in the environment. Unlike external exposure which causes dose only during exposure
period, radionuclides that are inhaled or ingested can result in a dose in the subsequent
years depending upon the biological half-life of the ingested radionuclides.
2.4.2.1 Inhalation Intake
The radionuclides released from the earth crust get attached with dust particles. When
human beings breathe this air, radionuclides (gaseous and particulates) find their way
into the human system via respiratory tract. The deposition, clearance in respiratory
tract and its subsequent absorption into blood of the inhaled radionuclide depends on
the amount, solubility, size, chemical composition, tendency to attach to aerosol etc.
41
Figure 2-2: Human exposure pathway to radiation
The main cause of inhalation dose from terrestrial radionuclides is the radon and its
short lived decay products. Indoor radiation exposure in a building is mainly due to
the external gamma radiation from the primary radionuclides present in the
construction materials and due to inhalation of 222Rn, 220Rn and their progenies.
2.4.2.2 Ingestion Intake
NORM is present in the soil, rocks, underground water, oceans and the atmosphere.
Anthropogenic radionuclides resulted from use of nuclear weapons, the use of
radionuclides in nuclear medicine and accidental releases from nuclear facilities also
contributed to internal exposure. Ingestion pathways include drinking water, ingestion
of water while bathing, ingestion of agricultural products (leafy vegetables, other
42
vegetables, meat, and milk etc.), ingestion of aquatic foods (fish and shellfish),
ingestion of water or sediment while participating in aquatic recreational activities
(swimming, boating, or shoreline use), and ingestion of soil. Ingestion of
radionuclides through food is an important route for long term internal radiation does
to various organs of the body. It is important to monitor the activity concentration of
radionuclides in food consumed by all living beings.
Many studies have been conducted to evaluate the ingestion intake dose due to intake
of NORM around the world both in normal background radiation area (NBRA) and
HBRA. Human habitats in HBRA of India are likely to get exposed to higher level of
radiation both by external and internal pathways and needs to be studied extensively.
In this work, internal exposure to human from 232Th for a group of population residing
in a HBRA of southern India via ingestion is evaluated.
2.5 Radionuclides in food chain
Radionuclide can enter food chain either through terrestrial environment or aquatic
environment. The aquatic pathway covers the radionuclides deposits in oceans, rivers
and lakes. The terrestrial pathway deals with radionuclide deposits in soil and air. The
radionuclide deposited on the plant or taken up by the plants can be consumed directly
by human or first ingested by animals and then by the ingestion of contaminated
animal products (dairy or meat). The accumulation of radionuclides by the plants
depends on many factors and even in animals, certain tissues tend to accumulate more
of selected radionuclides than others. The relevant incorporation of the radionuclides
in the milk is usually due to the ingestion of contaminated pasture. This transfer
process is often called the pasture-cow-milk exposure route.
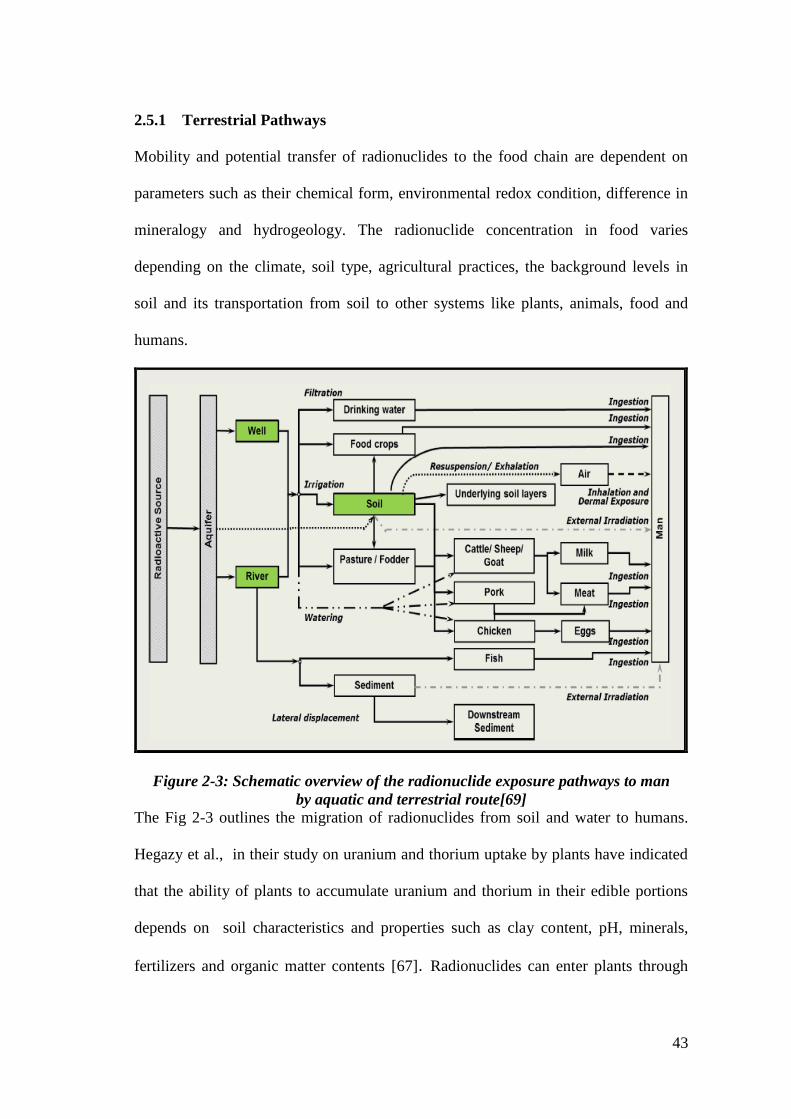
43
2.5.1 Terrestrial Pathways
Mobility and potential transfer of radionuclides to the food chain are dependent on
parameters such as their chemical form, environmental redox condition, difference in
mineralogy and hydrogeology. The radionuclide concentration in food varies
depending on the climate, soil type, agricultural practices, the background levels in
soil and its transportation from soil to other systems like plants, animals, food and
humans.
Figure 2-3: Schematic overview of the radionuclide exposure pathways to man
by aquatic and terrestrial route[69]
The Fig 2-3 outlines the migration of radionuclides from soil and water to humans.
Hegazy et al., in their study on uranium and thorium uptake by plants have indicated
that the ability of plants to accumulate uranium and thorium in their edible portions
depends on soil characteristics and properties such as clay content, pH, minerals,
fertilizers and organic matter contents [67]. Radionuclides can enter plants through
44
root uptake, atmospheric deposition or re-suspension from the soil. Foliar absorption
of radionuclides by plants that occur due to deposition of radionuclides carried by the
air or rain on the leaves is an important path of radiation exposure to man and animal.
Santos et al., have reported the presence of thorium and uranium in the aerosol
particles, returning as rain droplets to the terrestrial and aquatic grounds is an
important pathway for entry of radionuclide from grass to cow and into the milk [68].
The external contamination of plants can be transferred to the ground surface and may
enter the soil by washing from the contaminated plant or the plant parts itself. Plants
are capable of absorbing radionuclides from water or soil in the same way as other
minerals are absorbed from their roots. The ability of absorption of radionuclide from
soil is called the transfer factor (TF). TF is defined as the ratio between the activities
of a radionuclide within a plant (fresh weight) to the activity of the radionuclide in soil
(dry weight).
Several studies have been undertaken on various foodstuffs (e.g. vegetables cereals,
tubers, herbs, etc.) to evaluate the transfer factor of naturally occurring radio-nuclides
[17, 70–72]. The uptake of radionuclides by plants vary widely with plant species
resulting in varying concentrations in food products [73]. As observed by Al Masari
et al., the concentration of radionuclide in the plant material is high when the
concentration is high in the soil [74]. The accumulated radionuclides in the plant will
be consumed by either humans or animals [17, 70, 75]. NORM migrates from plants
to animals through fodder, main source of food for cows, goats and chicken [76].
When human consume meat and other animal products containing the radionuclides,
are indirectly exposed to internal radiation. A dynamic model for assessing the
transfer of radionuclides in a food-chain was developed and applied to assess the
45
radiological impact on the Loire river, where 14 nuclear power plants situated on five
different sites is operational by Ciffory et al., [77]. They have concluded that there is
an need for improving evaluation of the deposition of radionuclides in bed sediments
and subsequent external exposure and aerial contamination pathways of consumable
vegetables.
2.5.2 Aquatic Pathway
Another important pathway for entry of radionuclides into food chains is the aquatic
route. A radionuclide exists in water in a truly dissolved state or in an un-dissolved
state such as a colloid or sorbed to particulate matter. The fate and mobility of thorium
in environmental media are governed by its chemical and biological behaviors.
Thorium discharged as ThO2 into surface waters from mining, milling and processing
are mostly present as suspended particles [78]. At pH >5, soluble thorium ions in
water hydrolyses to form Th(OH)4 precipitate or hydroxy complexes which gets
adsorbed on the particulate matter in water [79]. Resuspension and mixing of this
complexes in water decides the migration of the sorbed thorium in water.
Concentration of dissolved thorium in waters may also increase due to formation of
soluble complexes with carbonate, humic materials or other ligands in the water [80].
The migration of natural radionuclide in the aquatic system involves the phenomena
of water turbulence. Radionuclides in the sediment surface is transported due to this
turbulence to a larger distance before they are lost from the water column by
sedimentation process. The radionuclides are then taken up by the aquatic microbes,
planktons, plants and animals [81].
The main route for intake of radionuclide by fish are by foraging, oral intake of water
and by accidental ingestion of sediments that has radionuclide adsorbed onto it [82].
46
Biological factors may also influence the degree of radionuclide uptake and
distribution among various tissues and organs in fish.
Poston et al, have also indicated that though foraging and drinking water are the
primary route for ingestion by fish, internal exposure can also occur through
absorption across epithelial cells of the skin [82]. Fisher et al., has observed that
certain marine organism accumulate higher concentrations of radionuclides [83].
Similar observation was reported by other workers also [45, 84]. Concentrations of
natural radionuclides in marine organism groups have been compared by Brown et al
for European aquatic environment and have indicated in the report that the highest
concentrations in marine organisms are observed for 40K and 210Po [85, 86].
Absorption from GI tract is higher for marine fish compared to fresh water fish [87].
Certain marine organisms acts as first order biological indicators of radiation pollutant,
Mussels is one such indicator [88, 89].
2.6 Literature review on ingestion Intake of Naturally Occurring
Radioactive Material (NORM)
Natural radionuclides exist universally in the environment and contribute significantly
to external and internal doses to the population. NORM like 238U, 234U, 232Th, 230Th,
228Ra, 226Ra,210Pb and 210Po are of particular importance. These radionuclides enter the
human system mainly through ingestion and contribution via inhalation is minimal [1].
So lot of work has been carried out worldwide and also in India to evaluate the annual
effective dose from intake of food and water. The ingestion intake depends on the
dietary composition and its concentrations in food. Concentration of the NORM in the
diet can be evaluated using Market Basket Study (MBS) Method or Duplicate Portion
Study (DPS) Method. In MBS method, concentration of radionuclide is estimated in
47
individual food component and its daily consumption rate obtained from National
Nutrition Survey reports available for the study group is used to evaluate the intake.
Where as in DPS method, the duplicate portion of the total diet that is consumed by
the individual is collected in actual and radionuclide concentration is estimated to
evaluate the internal dose.
2.6.1 Studies worldwide for NORM ingestion intake
There have been several studies for estimation of NORM concentrations in foodstuffs
from NBRA, such as those for 238U [45, 90–93], 226Ra [32, 41, 90, 94–101], 232Th
[90, 92, 97–99, 102], 210Pb [39, 103–105] and 210Po [37, 86, 106–109]. Cumhur
Canbazog˘lu et al., have evaluated the concentration of 226Ra, 232Th and 40K in
vegetable and fruits consumed by Turkish population using gamma spectrometry [97].
The average activity concentrations in vegetables was calculated as 0.64 ± 0.26 Bq kg-
1 for 226Ra, 0.65 ± 0.14 Bq kg-1 for 232Th, 13.98 ± 1.22 Bq kg-1 for 40K, and 0.54 ±
0.04 Bq kg-1 for 137Cs. The average activity concentrations in fruits were 1.52 ± 0.34,
0.98 ± 0.23, 18.66 ± 1.13 and 0.59 ± 0.16 Bq kg-1, respectively for 226Ra, 232Th, 40K
and 137Cs.
Extensive work has been carried out to evaluate the concentration of NORM in dietary
component collected from Poland. 238U, 234U, 232Th,230Th, 228Th, 226Ra was estimated
in food stuffs and drinking water samples collected in the Walberzych region of
Poland using alpha spectrometry. The average concentration of 238U, 234U, 232Th,230Th,
228Th, 226Ra in milk was 2.56, 3.69, 1.19,1.15, 2.64 and 9.95 mBq kg-1fresh respectively.
Daily intake with food and water for the adult population was: 238U - 17.7 ± 0.81, 234U
- 30.2 ± 1.40, 230Th - 5.86 ± 0.38, 232Th - 3.38 ± 0.29, 228Th - 11.8 ± 1.21 and 226Ra -
56.6 ± 6.2 mBq d-1 respectively [94]. In a work carried out by Fisenne et al., NORM
48
was estimated in the New York city diet, USA. They have reported that the highest
contribution to daily intake was from 226Ra [90].
In a recent study conducted by a Chinese group, the activity concentration of 238U,
228Ra, 226Ra, 40K and 137Cs in different foodstuff groups was estimated and have
reported that the highest radionuclide concentration was found in seafood, followed
by poultry, tea and freshwater product [110]. They have also observed that total
annual committed effective dose in Chinese men accounts for ~0.43 mSv, 43% higher
than the world reference value. The dose by ingestion is about two orders of
magnitude higher than that by inhalation.
Jing Chen attempted a study on dose to children from intakes of various radionuclides
(except radon) by ingestion relative to adults by considering six different age groups
(viz., 0–1, 1–2, 2–7, 7–12, 12–17, and adult >17 years) for Canadian populations
[111]. The ingestion exposure dose is mostly related to 238U and 232Th decay series as
well as 40K through drinking and eating [90, 92].
2.6.2 Ingestion Studies in India.
The concentration of radionuclide in food materials depends on various environmental
and biological factors. The geological environment and agricultural practices are
different for various region. The dietary habits are also different and vary from region
to region even within India. Hence it is important to have region specific data on the
radionuclide concentration to evaluate the ingestion intake dose. India is a big country
both in territory and with diversified population and includes quite different economic
development level, life style and food culture. In India, there are many reports that
gives the radionuclide concentration in various food samples [3, 87, 112–120].
49
Extensive work has been carried out to evaluate 210Po in various matrices. Natural
radionuclides 210Po activity in food of plant origin such as cereals, pulses, vegetables
and food of animal origin such fish, crab, prawn, chicken, egg etc. were determined in
and around Kalpakkam by Kannan et al. The 210Po activity levels in all the dietary
components (excluding milk and drinking water) ranged widely from ⩽10 to 1,22,641
mBq kg-1fresh, the minimum in vegetables and maximum in the edible portions (muscle)
of crab samples [3].
In another study conducted by Shivakumar, 210Po in cereals, pulses, animal origin
food, vegetables and spices collected from Gudalore (India) was estimated. The
activity concentration of 210Po in cereals varied from 124 to 604 mBq kg-1fresh. Raw
rice has the highest mean activity of 604 ± 61 mBq kg-1fresh in cereals. Leafy
vegetables had the highest 210Po activity concentration (662-7336 mBq kg-1fresh) and
followed by tuber vegetables (390-1269 mBq kg-1fresh) and then by other vegetables
(75-595 mBq kg-1fresh) among the plant origin food items. Among animal products fish
showed the highest 210Po activity concentration 964 mBq kg-1fresh [121]. 210Po was
estimated in the edible muscle and soft tissue of 15 different marine species (fish, crab,
prawn and bivalve) collected from Trans-Thane Creek area (Trombay) and Thane by
Misra et al, and the 210Po activity ranged from 0.18 to 10.9 mBq kg-1fresh [122]. In
another study by Prabhath et al., 210Po was evaluated in commercially available infant
food using alpha spectrometry. The 210Po concentration in the samples was in the
range of 80 to 230 mBq kg-1fresh [123].
Isotopes of radium namely 226Ra and 228Ra was also estimated in many food materials.
More data on 226Ra and 228Ra concentration in marine organism is available compared
to vegetation or fruit items. In a study conducted by Raj et al., 226Ra and 228Ra in
50
marine organism collected along the western coast of India was evaluated using
gamma ray spectrometry and 226Ra activity was found to be in the range of 0.07–0.736
Bq kg-1fresh and 228Ra in the range of 0.082–2.5 Bq kg-1
fresh.
The mean concentrations of 226Ra in duplicate diet samples collected from population
residing around uranium mining complex, Jaduguda, Jharkhand, India was estimated
using emanometric method and was found to vary from 0.06 to 0.18 Bq kg-1fresh [124].
Radium isotopes were estimated using gamma spectrometry by Patra et al., in food
samples collected from Vishakhapatnam, Andhra Pradesh. The activity concentrations
of 226Ra was 1.78 ± 0.67 Bq kg-1fresh in milk, 1.94 ± 1.20 Bq kg-1
fresh in eggs, 5.06 ±
1.35 Bq kg-1fresh in fruits and 0.79 ± 0.59 Bq kg-1
fresh in fish.
Isotopes of uranium were estimated in food and water samples by many researchers in
India. The daily intake of uranium (238U) by an urban (Mumbai) Indian adult
population was estimated by the analysis of a duplicate diet, drinking water, and air
samples using NAA by Dang et al. The uranium intake through food was 6.9 mBq d-1
[125].
Giri et al., have estimated total uranium in vegetable samples consumed by population
residing in mining area using fluorimetry technique. The concentration of uranium
ranged between 0.017–0.213 Bq kg-1fresh [109]. Extensive work for estimation of
drinking water sample is reported [116, 126–128].
Due to the difficulty in estimation of 232Th in food and biological matrices, data on
intake of 232Th is scarce. Dang et al., have estimated 232Th content in various food
material collected from Mumbai, India by NAA [8].
Daily dietary intake of two naturally occurring long-lived radionuclides, 232Th and
238U, were estimated for the adult population living in a number of Asian countries
51
and reported by Iyengar et al. The median for daily intake of 232Th ranged between 0.6
and 14.4 mBq and daily intake of 238U ranged between 6.7 and 62.5 mBq. The annual
committed effective doses to Asian population from the dietary intake of 232Th and
238U were calculated to be 0.34 and 0.20 μSv, respectively.
In another study conducted by Jha et al., in food item cultivated and consumed by
tribal population residing around the proposed uranium mine in north eastern part of
India, 232Th in leafy vegetables ranged from 26.2 to 48.8 mBq kg-1fresh, in cereals from
5.3 to 16.1 mBq kg-1fresh, in roots and tubers from 4.8 to 81.4 mBq kg-1
fresh and in other
vegetables from 1.6 to 16.9 Bq kg-1fresh [120].
In another study, 232Th concentration was evaluated in plant origin food samples
collected from Cohin, Kerala using INAA. The highest concentration was found in
roots and tubers [129]. Though data on ingestion intake of NORM is extensively
available, very little is known about ingestion intake of 232Th.
Hence it is important to focus on generating more baseline data on 232Th intake for
Indian population of various regions.
2.7 Radiation Dose to Inhabitants of HBRA from NORM
2.7.1 External Radiation Exposure:
A study on radiation exposures to the populations living in the HBRA of the
monazite-bearing region in Kerala, India was conducted by Chougoankar et al. using
thermo-luminescent dosimeters (TLD). The external radiation dose varied from 1.95
to 9.73 mSv y-1[20].
External radiation exposure and effective dose received by residents of 10 villages
belonging to Natural High Background Radiation Areas (NHBRA) of coastal regions
of Kanyakumari District, Tamilnadu in India were studied by using TLD. External
52
gamma doses were also measured inside and outside the houses using a scintillation
survey meter. The annual effective dose (external) was estimated between 1.22 to 4.73
mSv y-1 and 1.23 to 4.23 mSv y-1 using scintillometer and TLD respectively [25].
In another study conducted by Esaiselvan et al., external doses using scintillometer
and TLD (TLDs were exposed for one year, on a quarterly basis, inside the house at a
height of 3 meters and about 1 meter away from the walls) were measured. They have
reported the external exposure to vary from 1.95 to 4.45 mSv y-1 [30].
Gamma ray spectrometric measurements was carried out for the natural radioactivity
levels due to 226Ra, 232Th and 40K in beach sand samples around the coast of
Kanyakumari district by Sarojini and the annual effective dose ranged from 0.94 to
2.23 mSv y-1 [130].
2.7.2 Internal Radiation exposure:
2.7.2.1 Inhalation:
Inhalation exposure to the general public was estimated from collection and analysis
of air samples. Air sample particles were collected on glass fiber filter paper using
vacuum pump of suitable flow rate. Activity deposited on the filter paper was
measured using gamma spectrometry. Passive measurements using Solid State
Nuclear Track Detectors (SSNTD) were also used [131]. Many reports are available
for estimation of inhalation dose across the world.
The inhalation radiation doses to the population living in HBRA of Kerala, India was
investigated by Chougaonkar et al., [20]. About 200 houses from two villages in this
region were monitored for 1y. The inhalation doses due to radon, thoron and their
progenies were monitored using SSNTD (LR-115-II, CR-39) based twin-cup
dosimeters.
53
Radiation exposure and effective dose received through external and internal, via
inhalation, by residents of 10 villages belonging to HBRA of coastal regions of
Kanyakumari District, Tamilnadu in India were studied by Devajayanthi et al.,[25].
The indoor gamma radiation levels were monitored using TLDs, the indoor radon and
thoron gas concentrations were measured using twin chamber dosimeters employing
SSNTD. Gross alpha activity was estimated by collecting air samples on glass fiber
filter papers and counting in an alpha counter of known efficiency. The SSNTDs and
TLDs were exposed for 90 d and replaced with new one in the same place for every
quarter for one year. The annual effective dose equivalent due to the inhalation of
radon, thoron and progeny to the population of coastal Tamilnadu varied from 2.59 to
8.76 mSv y-1 with an arithmetic mean of 4.72 mSv y-1 [25].
2.7.2.2 Ingestion
Activity concentration of naturally occurring radionuclide was also estimated in food
samples collected from HBRA by various workers [5, 87, 116, 132–135]. The 232Th
concentration in duplicate diet collected from Chavara, Kerala was estimated by Dang
et al. using NAA and have reported a daily intake of 27.8 µg (113.2 mBq) giving an
annual intake of 40.6 Bq of 232Th and an annual committed effective dose (CED) of 16
µSv [136]. The intakes of 226Ra, 228Ra, 228Th and 40K from food samples collected
from villages in HBRA of Tamilnadu were estimated using gamma spectrometry. The
concentration of 226Ra ranged between 0.03 ± 0.02 (leafy vegetable) and 7.5 ± 0.5
(black gram dhal) Bq kg-1fresh. The concentration of 228Ra ranged from 0.08 ± 0.005
(leafy vegetable) to 5.4 ± 0.5 (tapioca) mBq kg-1fresh. The concentrations of 228Th
varied from 0.14 ± 0.04 (cucumber) to 34.3 ± 2.7 (rice) mBq kg-1fresh. Daily intakes of
these radionuclides were as follows: 226Ra, 0.001–1.87; 228Ra, 0.0023–1.26, 228Th,

54
0.01–14.09 40K, 0.46–49.39 Bq d-1 [5, 132]. In another study conducted by Kantha et
al., the 210Po in duplicate diet and individual food item was estimated using
radiochemical method followed by alpha spectrometry. The average concentration of
210Po in the food groups was 2176 mBq kg-1fresh in leafy vegetables, 55 mBq kg-1
fresh in
vegetable, 251 mBq kg-1fresh in roots and tubers, 250 mBq kg-1
fresh in fruits, 345 mBq
kg-1fresh in fish, 117 mBq kg-1
fresh in flesh food, 220 mBq kg-1fresh in milk and 290 mBq
kg-1fresh in cereals. The average concentration of 210 Po in DDS was found to be 74
mBq kg-1fresh [6].
It is interesting to note that, there is little work carried out in these regions to evaluate
232Th in the food material or duplicate diet from HBRA of south Tamilnadu. Hence
there is a need to deliberate on the internal ingestion intake of 232Th by the population
residing in this area.
2.8 Behavior of radionuclides in human
Assessment of radiation dose from internal exposure is difficult than estimating the
dose from external exposure. Internal exposure can be acute or chronic but causes
both radiological and chemical toxicity. Hence it is necessary to understand the
behavior of these radionuclides in human body. Once the radionuclide enters the body,
it gets absorbed to the blood and blood serves as the medium for distribution to the
target organs/tissue where it is either retained and recycled back to blood or
eliminated through urine or feces. Behavior of radionuclide in the human body
depends on the type of radionuclide, its decay characteristics and its chemical form
[137]. The various biological stages involved in transport of radionuclide in the body,
depends on physico-chemistry or the speciation of compounds and is described as
kinetics. Biokinetic models are multi-compartmental mathematical models used for
55
describing the movement, distribution and retention of radionuclides in the human
body. International Commission for Radiation Protection (ICRP) has given a series of
radionuclide specific models for various routes of entry (ingestion and inhalation) for
adults and children [7, 138–145]. Doses to the fetus following maternal intakes are
also evaluated and presented [146, 147]. Human respiratory tract model (HRTM)
describes the movement of inhaled radionuclides in respiratory tract and human
alimentary tract model (HATM) gives the behavior of ingested radionuclide [138, 141,
148]. Movement of ingested radionuclides through the gastrointestinal tract is
described by the transit times between the stomach, small intestine and large intestine.
The ingested radionuclide that traverses through the alimentary tract is mostly
absorbed into blood mainly from the small intestine [148]. The absorption of
radionuclides from the alimentary tract to the blood depends on the chemical
properties of the radionuclide and this absorption fraction can vary widely say as
0.1% (Th, Pu) to 99% ( Iodine) [139]. Depending on the particle size of the inhaled
particles containing radionuclides, deposition occurs in varying fraction in the nasal
passage, the bronchial and bronchiolar airways of the lung, and the alveolar region
[141]. Clearance of the deposited radionuclide from the lungs occurs by two
competing process namely particle transport and absorption to blood. Absorption to
blood is by dissolution of the particle. Radionuclide that is absorbed into the blood,
behaves differently and is described by element-specific systemic models [139, 142,
143]. These element specific models may vary from very simple models to multi-
compartmental recycling model and is provided by ICRP. The most complex models
are those of bone seeking alkaline earth and actinides elements like strontium, radium,
thorium and plutonium. Once the radionuclides are deposited on the bone surface they
56
get exchanged with or within bone mineral, and are distributed into the bone volume
by bone formation and move to bone marrow by bone resorption.
Biokinetic models for individual elements and their radioisotopes provide information
on the rate of transfer and the retention with in the body. Whereas the dosimetric
models are used to calculate the deposition of energy in all important organs/tissues
(targets) from each source region, taking account of the energies and yields of all
emissions [149].
2.9 Radiation dose due to internal exposure:
Extent of radiation effect on any tissue/organ depends on the absorption of average
energy deposited in the tissue. The primary unit of radiation absorbed dose is
expressed in terms of average absorbed energy per unit mass of tissue.
Absorbed Dose E
M
(2.1)
The unit for radiation absorbed dose in the SI system is called the gray (Gy). One gray
is an absorbed radiation dose of one joule per kilogram [150]. Unlike external
exposure dose calculation, internal dose is evaluated using indirect method. The
evaluated dose depends on physical (type of radiation, energy of the radiation and the
radiological half-life) and biological (kinetic behaviors like absorption rates, transfer
rates and retention rates in various organs and tissues) factors.
The two important assumptions made for internal dose assessments for a charge
particle are i) All the energy of the charge particle emitted by a radionuclide in an
organ/tissue is absorbed within the tissue ii) an element deposited in an organ /tissue
is uniformly distributed throughout the mass of that organ/tissue. For an organ/tissue
containing a uniformly distributed radionuclide, the amount of absorbed energy must
be equal to the amount of energy emitted. The energy absorbed per unit tissue mass
57
per transformation is called the Specific Effective Energy (SEE). The concept of
equivalent dose used by ICRP enables to compensate for the effect of different
radiation on the tissue. Derivation of equivalent dose uses radiation weighting factors
(WR) to take into account of the relative biological effectiveness (RBE) of different
radiation types in causing malignancy or genetic damage. Thus, absorbed doses (Gy in
joules/kg) to the various organs/tissues, obtained using biokinetic and dosimetric
models, are multiplied by a WR of 20 for alpha irradiation and 1 for electron and
gamma radiations to give equivalent doses (in Sievert (Sv) dose units).
50, ( ) ( )T sH T S U SEE T S (2.2)
Where H50,T(T←S) is the equivalent dose accumulated during 50 y after intake, US is
the total number of disintegrations during 50 y after intake, and SEE (T←S) is the
Specific Effective Energy absorbed per gram of target tissue from each radiation, R,
emitted from activity in the source organ.
131.6 10 ( )( )
( )
R R R
RT
Y E W AF T SSEE T S
m kg
(2.3)
Where YR is the fractional yield, per disintegration, of the radiation under
consideration, E is the average energy of radiation R, WR is the radiation weighting
factor, AF (T←S)R is the absorbed fraction from radiation R in target organ/tissue T
per transformation in source organ/tissue S, and mT is the mass of T, in kg.
Tissue doses are integrated over a 50 y period for adults and to age 70 y for children
and the resulting values are referred to as committed equivalent doses. The ICRP uses
the another concept of effective dose to evaluate the whole-body dose for internal
emitters. To estimate the whole-body effective dose, tissue weighting factors (WT) are
assigned to various tissues and organs. WT takes into account of the respective
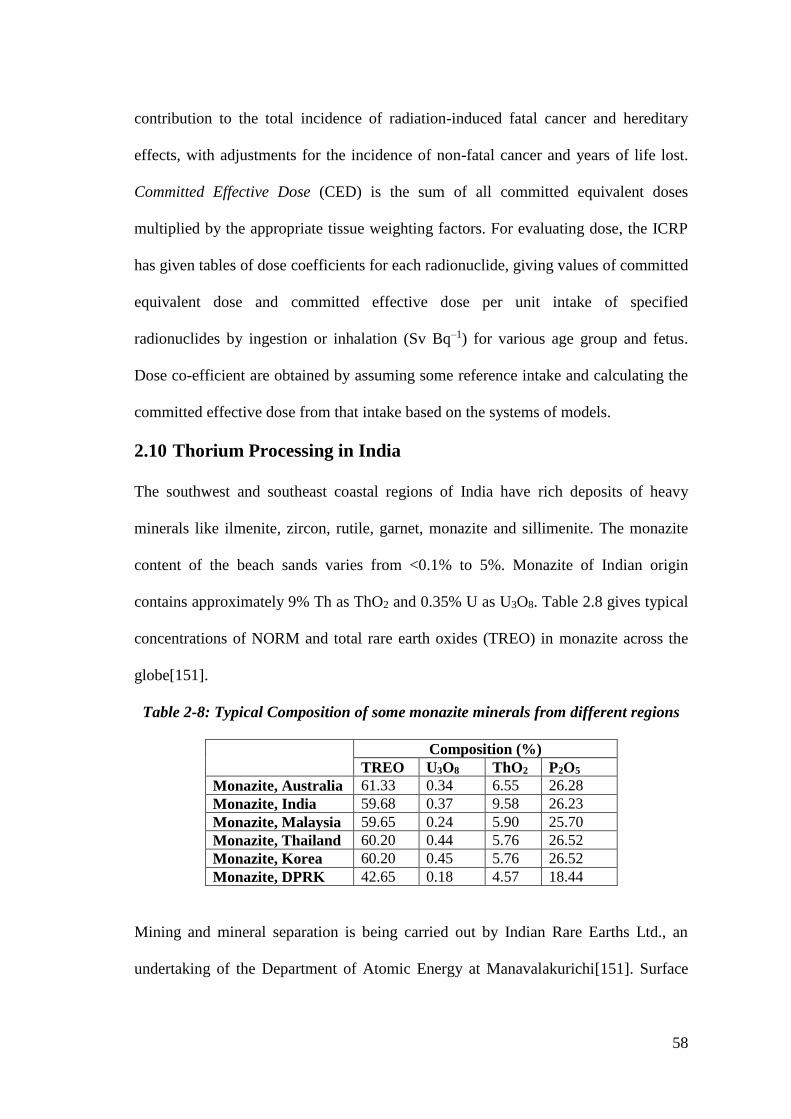
58
contribution to the total incidence of radiation-induced fatal cancer and hereditary
effects, with adjustments for the incidence of non-fatal cancer and years of life lost.
Committed Effective Dose (CED) is the sum of all committed equivalent doses
multiplied by the appropriate tissue weighting factors. For evaluating dose, the ICRP
has given tables of dose coefficients for each radionuclide, giving values of committed
equivalent dose and committed effective dose per unit intake of specified
radionuclides by ingestion or inhalation (Sv Bq–1) for various age group and fetus.
Dose co-efficient are obtained by assuming some reference intake and calculating the
committed effective dose from that intake based on the systems of models.
2.10 Thorium Processing in India
The southwest and southeast coastal regions of India have rich deposits of heavy
minerals like ilmenite, zircon, rutile, garnet, monazite and sillimenite. The monazite
content of the beach sands varies from <0.1% to 5%. Monazite of Indian origin
contains approximately 9% Th as ThO2 and 0.35% U as U3O8. Table 2.8 gives typical
concentrations of NORM and total rare earth oxides (TREO) in monazite across the
globe[151].
Table 2-8: Typical Composition of some monazite minerals from different regions
Composition (%)
TREO U3O8 ThO2 P2O5
Monazite, Australia 61.33 0.34 6.55 26.28
Monazite, India 59.68 0.37 9.58 26.23
Monazite, Malaysia 59.65 0.24 5.90 25.70
Monazite, Thailand 60.20 0.44 5.76 26.52
Monazite, Korea 60.20 0.45 5.76 26.52
Monazite, DPRK 42.65 0.18 4.57 18.44
Mining and mineral separation is being carried out by Indian Rare Earths Ltd., an
undertaking of the Department of Atomic Energy at Manavalakurichi[151]. Surface
59
mining, collection of beach washings and dredge mining are the mining methods
adopted in India. The mineral separation plant makes use of the differences in the
electrical and magnetic properties and differences in specific gravity of the constituent
minerals to separate them. The dredged sand is concentrated by slurrying in water and
passing down through spirals. The dried concentrate is passed through a series of high
tension electric separators and magnetic separators of varying intensities.
Monazite, an orthophosphate of Th and rare earth (RE) elements, is chemically
processed by reaction with caustic soda lye which results in Na3PO4, hydroxides of
thorium, uranium and REs. This reacted mass is leached with water, where Na3PO4
gets dissolved leaving behind the hydroxides. The mixed hydroxides of thorium,
uranium and REs are then treated with HCl at a controlled pH, where RE remains in
solution as rare earth chlorides and the hydroxides of Th and U and the undissolved,
unreacted sand remain in the sludge. the radium (228Ra) and Pb present in the
monazite are carried with the rare earth chloride and are removed from the product
and lead is eliminated by precipitating with BaSO4 and lead sulphide. The deactivated
and lead-free composite REs chloride is evaporated and made into flakes and
marketed. For the separation of individual REs, a solvent extraction process is
employed. The stock of thorium hydroxide is dissolved in HCl and uranium is
recovered by solvent extraction using alamine as solvent and thorium is extracted as
thorium oxalate [152].
2.11 Application of Thorium
Thorium finds a lot of industrial application like for the manufacture of gas mantles,
welding rods, thermistor, and catalysts. 232Th is also used as nuclear fuel for 233U fuel
60
based reactors. Aeronautical and aerospace thoriated alloys are used in aircraft engine
parts, but only to a limited extent.
2.11.1 Incandescent gas mantles
For over a century, the main of use of thorium is in gas mantle industry. When the
thoriated mantles are heated to a temperature of 1870-2370 oC, ThO2 in the mantle
causes incandesce[153]. The greatest incandescence is obtained with mantles that
consist of 99% ThO2 plus 1% cerium oxide after pre-burning. The heat energy
accumulates in ThO2 and then the absorbed energy is transferred to cerium oxide,
which emits strong visible light [154]. Thorium in the form of nitrates with specific
activity 2 mBq kg-1 of 232Th , is used in the production of gas mantles [155, 156].
2.11.2 Welding Electrodes
Tungsten electrode with 1- 4% thorium oxide (ThO2) are used in Tungsten Inert Gas
(TIG) welding mostly in aluminum, stainless steel, thin sheets of metal industry that
requires a very good and reliable weld. Good welding is achieved as the thoriated rod
provides high temperature plasma in a gas atmosphere, usually argon. When thorium
is added to the tungsten rods it helps to strike an arc and maintain a better arc stability,
avoiding fluctuations in the flame [153].
2.11.3 Thorium as nuclear energy source
With increase in energy demand worldwide and growing concern on emission of
greenhouse gases and their impact on climate, there is a need for clean and sustained
energy production. Especially for a large country like India with large population,
there is an inevitable requirement to meet the energy requirement. With depleting
reserves of coal and associated environmental issues, nuclear energy is a clean
alternate option for sustainable energy. Over the last 50 y, there has been increasing
61
interest in the utilization of 232Th as nuclear fuel as India has large reserves of
thorium. Currently, the highest research activity on 232Th as a nuclear energy source is
in India. All of the mined 232Th is potentially useable in a reactor, compared with the
0.7% of natural U (235U); therefore, more energy per unit mass is theoretically
available from 232Th. The isotope 232Th is not fissile but can be used in combination
with fissile 235U or 239Pu. Upon absorption of a neutron, 232Th will transmute to a new
fissile material – 233U. The potential advantages of a Th-based fuel cycle over a U-
based fuel cycle are the greater natural abundance of Th, needs no isotope separation,
superior thermo-physical and nuclear properties of ThO2 as compared to UO2, a
longer fuel cycle and higher burn up, better resistance to the proliferation of nuclear
weapons (due to formation of 233U that emits strong gamma radiation) and little Pu or
other transuranic products [46].
2.12 Biokinetic model of Thorium
The population groups who get exposed to thorium in India are 1) people living in the
monazite rich area, (2) occupational workers engaged in mining and processing of
monazite sands and production of rare-earth salts and thorium nitrate (about 2000
workers) and (3) workers in production of gas mantle, 232Th based fuel, welding rods
etc. [157]. The bone surface seeking” biokinetic model structure for thorium provided
by ICRP contains 5 main parts: blood, skeleton, liver, kidneys and other soft tissues,
with sub compartment and is presented in Fig 2-4 [7]. The model is based on data
obtained in beagle dogs and on semi-quantitative data in humans.
Blood is treated as a uniformly mixed pool. Compartment ST0 is a soft tissue pool
that includes the extracellular fluids and exchanges material with blood over a period
of hours or days. The thorium that enters the blood gets cleared with a half time of
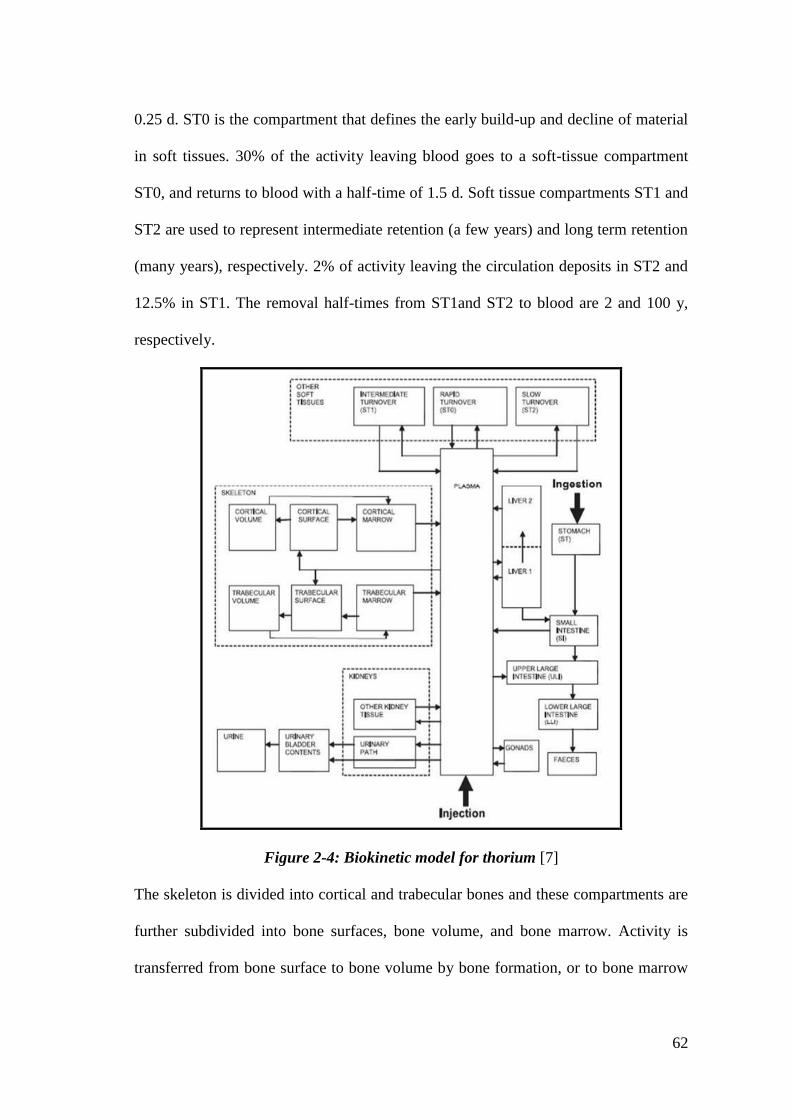
62
0.25 d. ST0 is the compartment that defines the early build-up and decline of material
in soft tissues. 30% of the activity leaving blood goes to a soft-tissue compartment
ST0, and returns to blood with a half-time of 1.5 d. Soft tissue compartments ST1 and
ST2 are used to represent intermediate retention (a few years) and long term retention
(many years), respectively. 2% of activity leaving the circulation deposits in ST2 and
12.5% in ST1. The removal half-times from ST1and ST2 to blood are 2 and 100 y,
respectively.
Figure 2-4: Biokinetic model for thorium [7]
The skeleton is divided into cortical and trabecular bones and these compartments are
further subdivided into bone surfaces, bone volume, and bone marrow. Activity is
transferred from bone surface to bone volume by bone formation, or to bone marrow
63
by bone resorption. Activity is removed from the bone marrow to blood in few months
and consequently redistributed in the same pattern as the original input to blood. 70%
for adult (80% for individuals under 15 y) of thorium leaving the circulation deposits
on bone surfaces, equally on cortical bone and on trabecular bone.
The liver is divided into 2 compartments; Liver1 and Liver2. Liver1 represents short
term retention, and Liver2 represents longer term retention (t1/2 > 1 y). 5% of activity
in the blood pool deposits in Liver1. Part of the activity that enters the liver1 is
returned to blood (25%) and part is transferred to Liver2 (50%), and the
gastrointestinal tract via biliary secretion (25%). The removal half-time from Liver2 to
blood is 9 y.
The kidneys are compartmentalised into two, thorium is removed to urine via
compartment one and another returns activity to blood. The “urinary bladder contents”
is considered as a separate pool and the activity from the blood (5.5%) that reaches
this pool is removed by urinary excretion. 3.5% deposits in renal tubules before being
released to the urinary bladder with a half-time of 15 d.
2.13 Reference values and guidance level of Thorium in food and
drinking water.
As discussed earlier, there is a large variation in the background levels of
radionuclides around the world. Scientific data on ingestion of radionuclides of natural
origin in food and drinking water was reviewed by UNSCEAR and have provided
radionuclide specific reference values for important food groups. The following table
(Table 2-9) gives the reference values of concentration of 232Th in various food group
and drinking water [1].
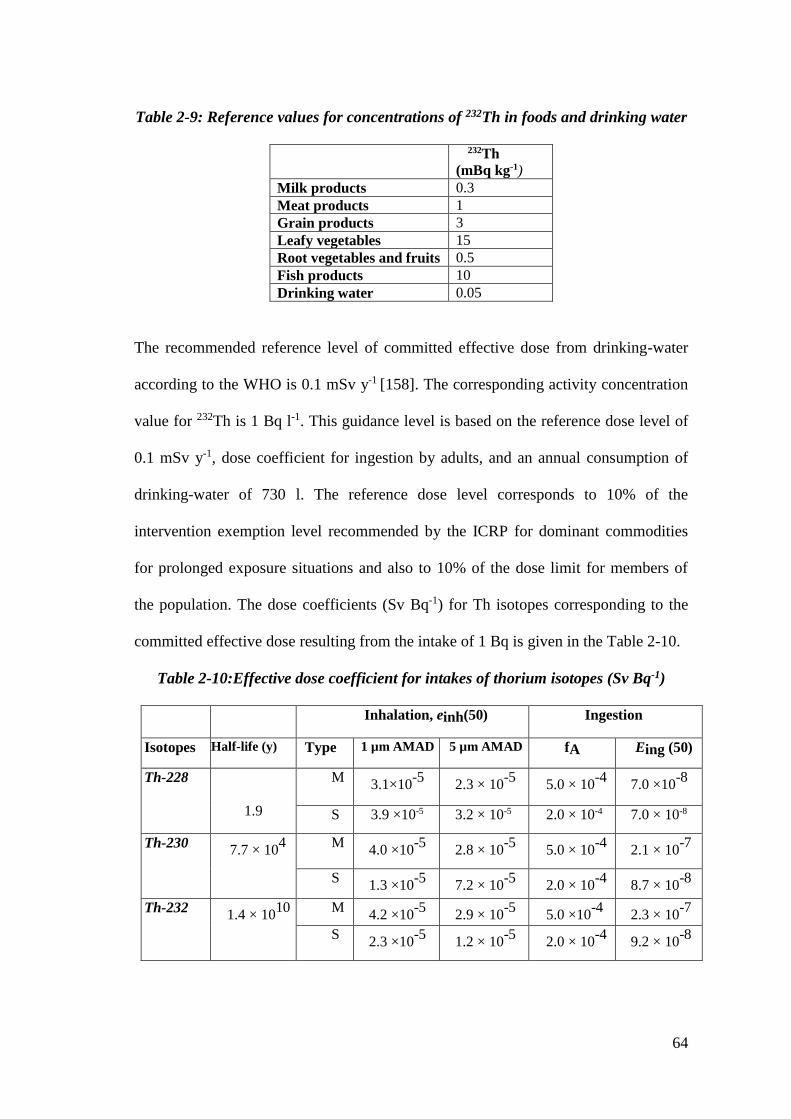
64
Table 2-9: Reference values for concentrations of 232Th in foods and drinking water
232Th
(mBq kg-1)
Milk products 0.3
Meat products 1
Grain products 3
Leafy vegetables 15
Root vegetables and fruits 0.5
Fish products 10
Drinking water 0.05
The recommended reference level of committed effective dose from drinking-water
according to the WHO is 0.1 mSv y-1 [158]. The corresponding activity concentration
value for 232Th is 1 Bq l-1. This guidance level is based on the reference dose level of
0.1 mSv y-1, dose coefficient for ingestion by adults, and an annual consumption of
drinking-water of 730 l. The reference dose level corresponds to 10% of the
intervention exemption level recommended by the ICRP for dominant commodities
for prolonged exposure situations and also to 10% of the dose limit for members of
the population. The dose coefficients (Sv Bq-1) for Th isotopes corresponding to the
committed effective dose resulting from the intake of 1 Bq is given in the Table 2-10.
Table 2-10:Effective dose coefficient for intakes of thorium isotopes (Sv Bq-1)
Inhalation, einh(50) Ingestion
Isotopes Half-life (y) Type 1 µm AMAD 5 µm AMAD fA Eing (50)
Th-228
1.9
M 3.1×10
-5 2.3 × 10
-5 5.0 × 10
-4 7.0 ×10
-8
S 3.9 ×10⁻⁵ 3.2 × 10⁻⁵ 2.0 × 10⁻⁴ 7.0 × 10⁻⁸
Th-230 7.7 × 10
4
M
4.0 ×10⁻⁵
2.8 × 10⁻⁵
5.0 × 10⁻⁴
2.1 × 10⁻⁷
S 1.3 ×10
-5 7.2 × 10
-5 2.0 × 10
-4 8.7 × 10
-8
Th-232 1.4 × 10
10
M
4.2 ×10⁻⁵
2.9 × 10⁻⁵
5.0 ×10⁻⁴
2.3 × 10⁻⁷
S
2.3 ×10⁻⁵
1.2 × 10⁻⁵
2.0 × 10⁻⁴
9.2 × 10⁻⁸
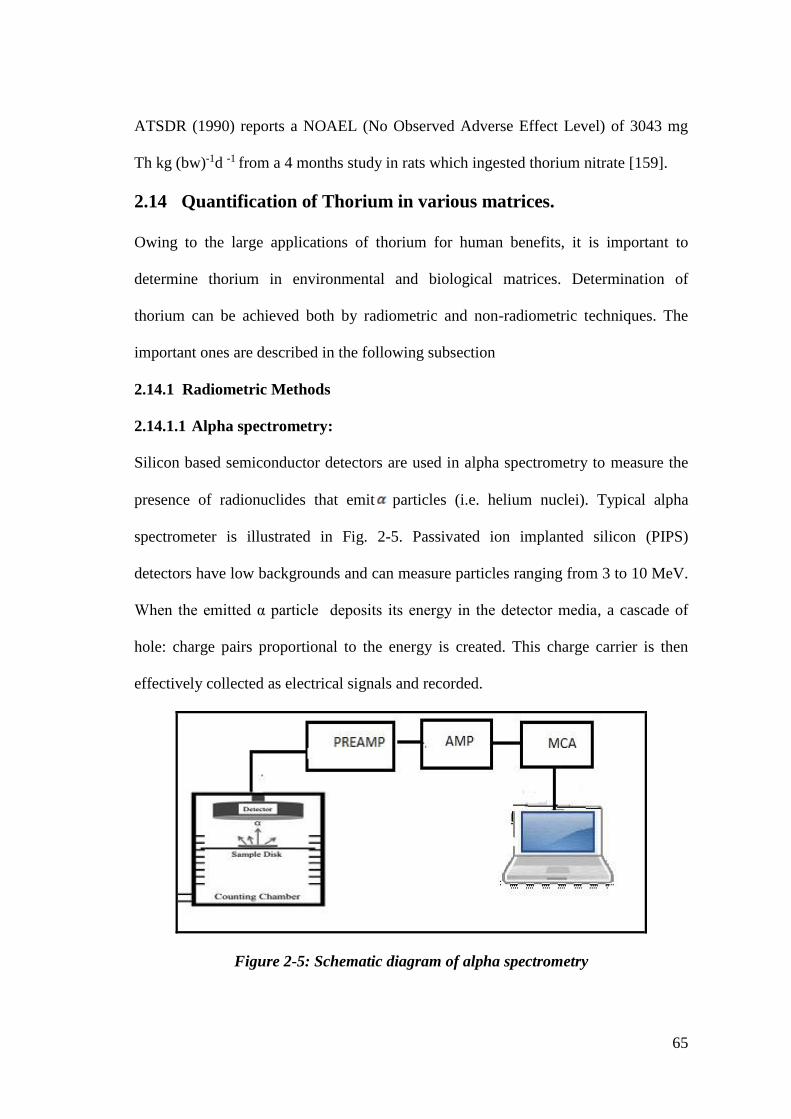
65
ATSDR (1990) reports a NOAEL (No Observed Adverse Effect Level) of 3043 mg
Th kg (bw)-1d -1 from a 4 months study in rats which ingested thorium nitrate [159].
2.14 Quantification of Thorium in various matrices.
Owing to the large applications of thorium for human benefits, it is important to
determine thorium in environmental and biological matrices. Determination of
thorium can be achieved both by radiometric and non-radiometric techniques. The
important ones are described in the following subsection
2.14.1 Radiometric Methods
2.14.1.1 Alpha spectrometry:
Silicon based semiconductor detectors are used in alpha spectrometry to measure the
presence of radionuclides that emit particles (i.e. helium nuclei). Typical alpha
spectrometer is illustrated in Fig. 2-5. Passivated ion implanted silicon (PIPS)
detectors have low backgrounds and can measure particles ranging from 3 to 10 MeV.
When the emitted α particle deposits its energy in the detector media, a cascade of
hole: charge pairs proportional to the energy is created. This charge carrier is then
effectively collected as electrical signals and recorded.
Figure 2-5: Schematic diagram of alpha spectrometry
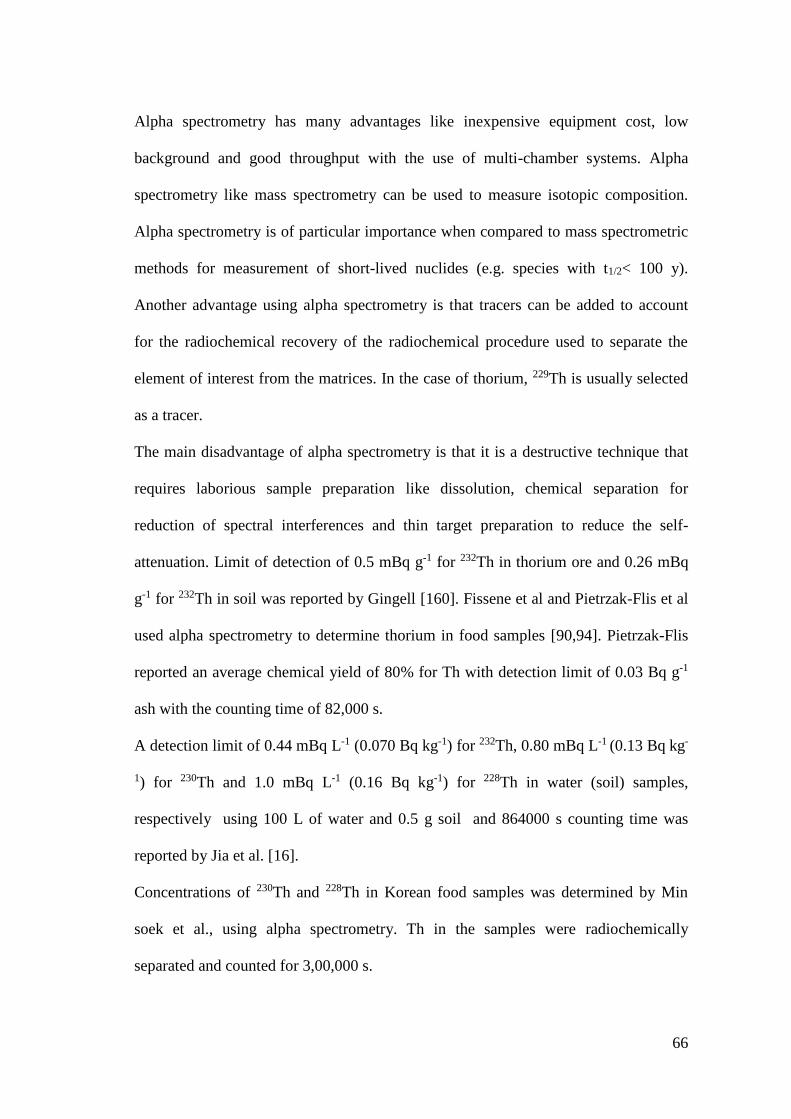
66
Alpha spectrometry has many advantages like inexpensive equipment cost, low
background and good throughput with the use of multi-chamber systems. Alpha
spectrometry like mass spectrometry can be used to measure isotopic composition.
Alpha spectrometry is of particular importance when compared to mass spectrometric
methods for measurement of short-lived nuclides (e.g. species with t1/2< 100 y).
Another advantage using alpha spectrometry is that tracers can be added to account
for the radiochemical recovery of the radiochemical procedure used to separate the
element of interest from the matrices. In the case of thorium, 229Th is usually selected
as a tracer.
The main disadvantage of alpha spectrometry is that it is a destructive technique that
requires laborious sample preparation like dissolution, chemical separation for
reduction of spectral interferences and thin target preparation to reduce the self-
attenuation. Limit of detection of 0.5 mBq g-1 for 232Th in thorium ore and 0.26 mBq
g-1 for 232Th in soil was reported by Gingell [160]. Fissene et al and Pietrzak-Flis et al
used alpha spectrometry to determine thorium in food samples [90,94]. Pietrzak-Flis
reported an average chemical yield of 80% for Th with detection limit of 0.03 Bq g-1
ash with the counting time of 82,000 s.
A detection limit of 0.44 mBq L-1 (0.070 Bq kg-1) for 232Th, 0.80 mBq L-1 (0.13 Bq kg-
1) for 230Th and 1.0 mBq L-1 (0.16 Bq kg-1) for 228Th in water (soil) samples,
respectively using 100 L of water and 0.5 g soil and 864000 s counting time was
reported by Jia et al. [16].
Concentrations of 230Th and 228Th in Korean food samples was determined by Min
soek et al., using alpha spectrometry. Th in the samples were radiochemically
separated and counted for 3,00,000 s.
67
2.14.1.2 Gamma ray Spectrometry
Gamma spectrometry is a non-destructive method for identification of gamma
emitting radionuclides. Each gamma emitting radionuclide emits gamma rays with
characteristics gamma energy between a few keV and 10 MeV which is used for
quantifying the radionuclide content in the sample. Germanium semiconductor
detectors are the most common detector used owing to good energy resolution when
compared to other detectors. High purity germanium detectors have high resolution of
2 keV, but have less absolute efficiency compared to NaI(Tl) detector. But by using a
large volume detector, this disadvantage can be overcome. When gamma rays interact
with the detector material, primary excited electron are produced which in turn excites
a cascade of secondary electrons in the process of dissipating its energy within the
detector volume. The energy of the primary electron is spent in the production of
electron hole pairs which are then collected. The numbers of electron collected will be
proportional to the energy of the primary electron hence is proportional to the energy
of the interacting photon. Gamma ray spectrometry is often used for evaluating 232Th
in the samples assuming that there is a secular equilibrium in the samples. 232Th is
determined using the gamma energies of 212Pb and 228Ac.
2.14.2 Non Radiometric Techniques
2.14.2.1 Spectrophotometric
Spectrophotometric methods are simple and inexpensive mostly used for field
measurements of total element determination. This method used the principle of
Lambert-Beer’s law described below.
A b c (2.4)
68
Where, A represents the absorbance, ε the molar absorptivity, b the optical path length
and c analyte concentration. The measured absorbance is directly proportional to the
path length and the concentration, hence by increasing the path length, magnitude in
the signal can be improved.
The main disadvantage of using spectrophotometry for determination of uranium and
thorium is the low sensitivity and selectivity of the spectrophotometric determinations.
The reagents of chlorophosphonazo and arsenazo are the most significant ones for
spectrophotometric methods for thorium, rare earths, scandium, and uranium
determination. Spectrophotometric methods used as screening tools as they are very
handy and hence enabling fast, sensitive and robust analyses.
2.14.2.2 Inductively coupled plasma–atomic emission spectrometry
Samples are analyzed as solutions with this technique. The solution is nebulized and
the aerosol is introduced into argon plasma. In the plasma, the atoms are ionized and
these ionized atoms which are in an energized state, spontaneously return to a lower
energy state, and in doing so, emit a photon. This emitted light is broken into its
constituent radiations by means of a diffraction grating and the intensities are
measured at specific wavelengths for each element. The light intensity at a specific
wavelength for each elemental line is measured either with an exit slit and
photomultiplier tube, or with a semiconductor device.
In quantitative measurements, the emitted energy is assumed to be proportional to the
concentration of the element present. The technique only allows the determination of
total thorium. Detection limits around 10–15 µg L-1 have been reported for thorium in
digested geological sample solutions. Solutions of digested samples may be analyzed
69
directly, but detection limits can be improved when thorium is separated from the
matrix before analysis [161] .
Thorium has many lines in the spectrum which can be used for quantitative analysis,
and the best one often depends upon the type of sample being analyzed. 283.231 nm,
326.267 nm and 353.959 nm are generally used[162].
2.15 Neutron Activation Analysis(NAA)
Neutron Activation Analysis (NAA) is a multi-elemental, sensitive, non-destructive
method for determining the elemental composition of a sample and finds application
in the fields of health sciences, radiation protection, environmental sciences, geology,
material science and forensic sciences. Enrico Fermi was the first to report that
radioactivity could be induced by neutron bombardment [163]. In 1936, George de
Hevesy and Hilde Levi determined dysprosium in the yttrium samples by irradiating
the sample with neutrons from Ra-Be source establishing the analytical utility of
neutron irradiation [164].
2.15.1 Principle
When a sample containing target is exposed for a period ti to a flux of neutron, a
fraction of the target atoms will capture these neutron and compound nucleus is
formed in the excited state that will very quickly de-excite within `~10-14 s
into lower configuration state of relatively stable radioactive nucleus through the
emission of one or more γ rays with characteristics energies known as prompt γ rays.
When this prompt γ rays are measured, the technique is called prompt gamma neutron
activation analysis (PGNAA).
When the product nucleus is radioactive and decays by emitting beta particle,
an isotope of another element that de-excites to ground state by emitting characteristic
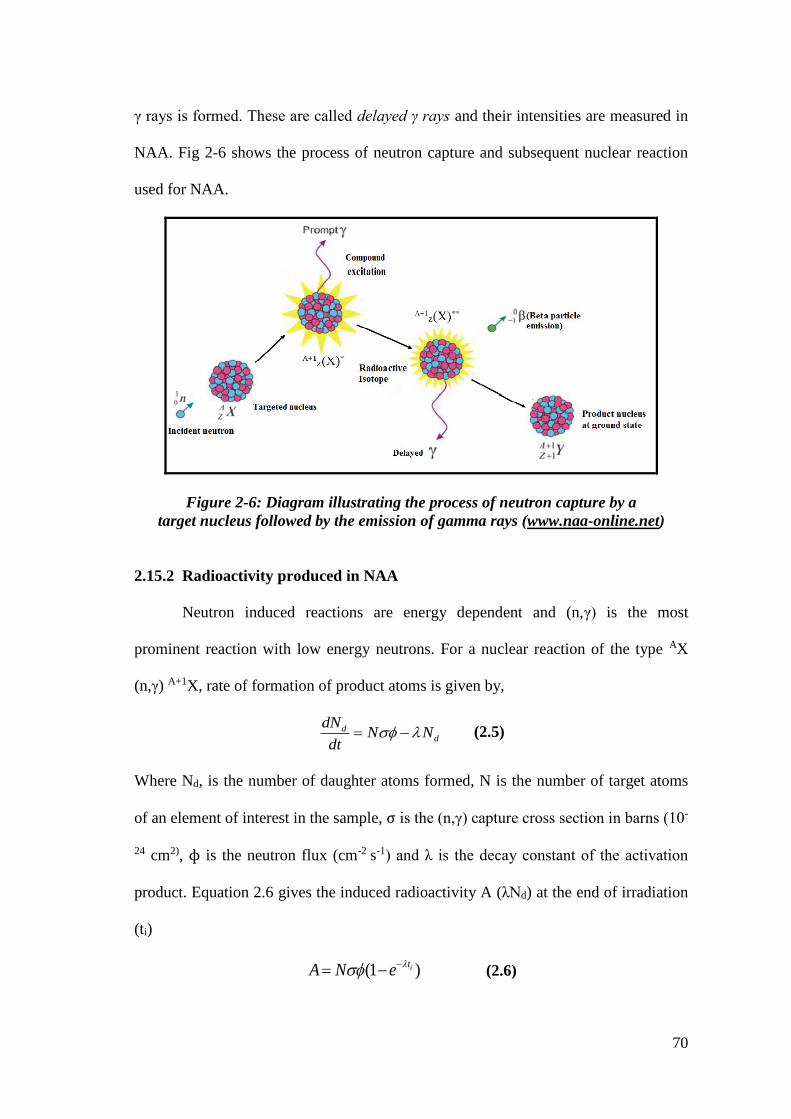
70
γ rays is formed. These are called delayed γ rays and their intensities are measured in
NAA. Fig 2-6 shows the process of neutron capture and subsequent nuclear reaction
used for NAA.
Figure 2-6: Diagram illustrating the process of neutron capture by a
target nucleus followed by the emission of gamma rays (www.naa-online.net)
2.15.2 Radioactivity produced in NAA
Neutron induced reactions are energy dependent and (n,γ) is the most
prominent reaction with low energy neutrons. For a nuclear reaction of the type AX
(n,γ) A+1X, rate of formation of product atoms is given by,
dd
dNN N
dt (2.5)
Where Nd, is the number of daughter atoms formed, N is the number of target atoms
of an element of interest in the sample, σ is the (n,γ) capture cross section in barns (10-
24 cm2), ɸ is the neutron flux (cm-2 s-1) and λ is the decay constant of the activation
product. Equation 2.6 gives the induced radioactivity A (λNd) at the end of irradiation
(ti)
(1 )itA N e
(2.6)
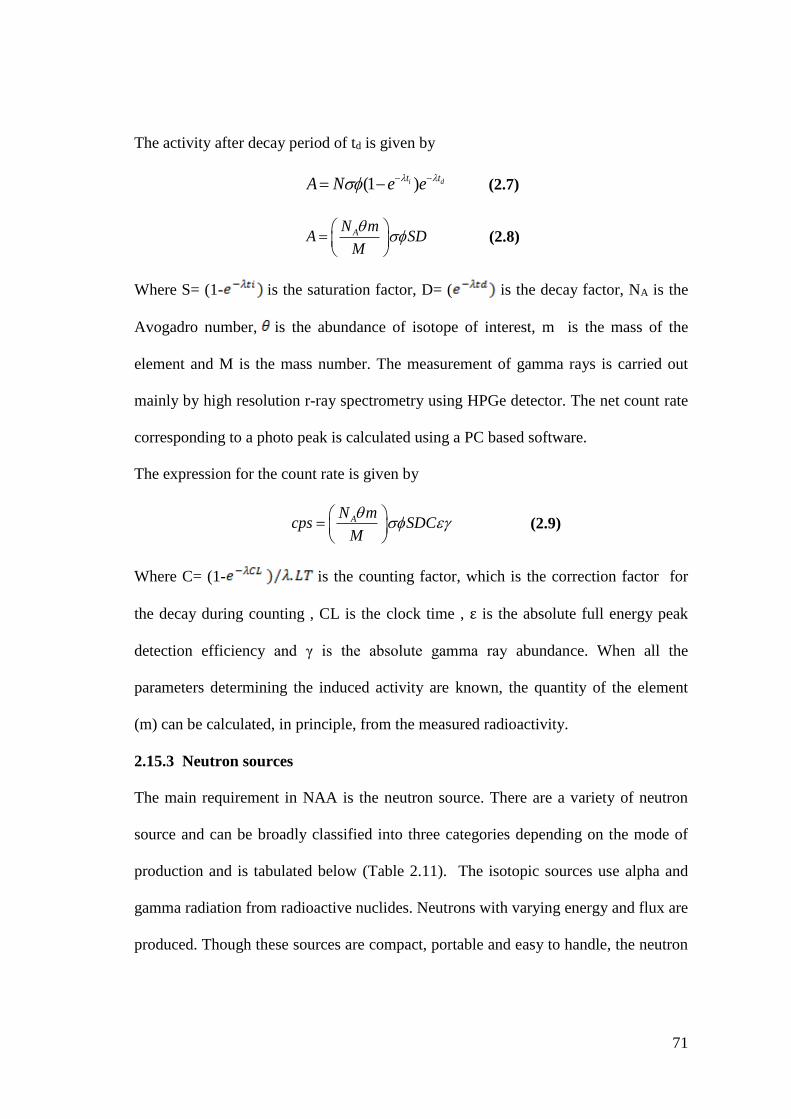
71
The activity after decay period of td is given by
(1 )i dt tA N e e
(2.7)
AN mA SD
M
(2.8)
Where S= (1- is the saturation factor, D= ( is the decay factor, NA is the
Avogadro number, is the abundance of isotope of interest, m is the mass of the
element and M is the mass number. The measurement of gamma rays is carried out
mainly by high resolution r-ray spectrometry using HPGe detector. The net count rate
corresponding to a photo peak is calculated using a PC based software.
The expression for the count rate is given by
AN mcps SDC
M
(2.9)
Where C= (1- is the counting factor, which is the correction factor for
the decay during counting , CL is the clock time , ε is the absolute full energy peak
detection efficiency and γ is the absolute gamma ray abundance. When all the
parameters determining the induced activity are known, the quantity of the element
(m) can be calculated, in principle, from the measured radioactivity.
2.15.3 Neutron sources
The main requirement in NAA is the neutron source. There are a variety of neutron
source and can be broadly classified into three categories depending on the mode of
production and is tabulated below (Table 2.11). The isotopic sources use alpha and
gamma radiation from radioactive nuclides. Neutrons with varying energy and flux are
produced. Though these sources are compact, portable and easy to handle, the neutron
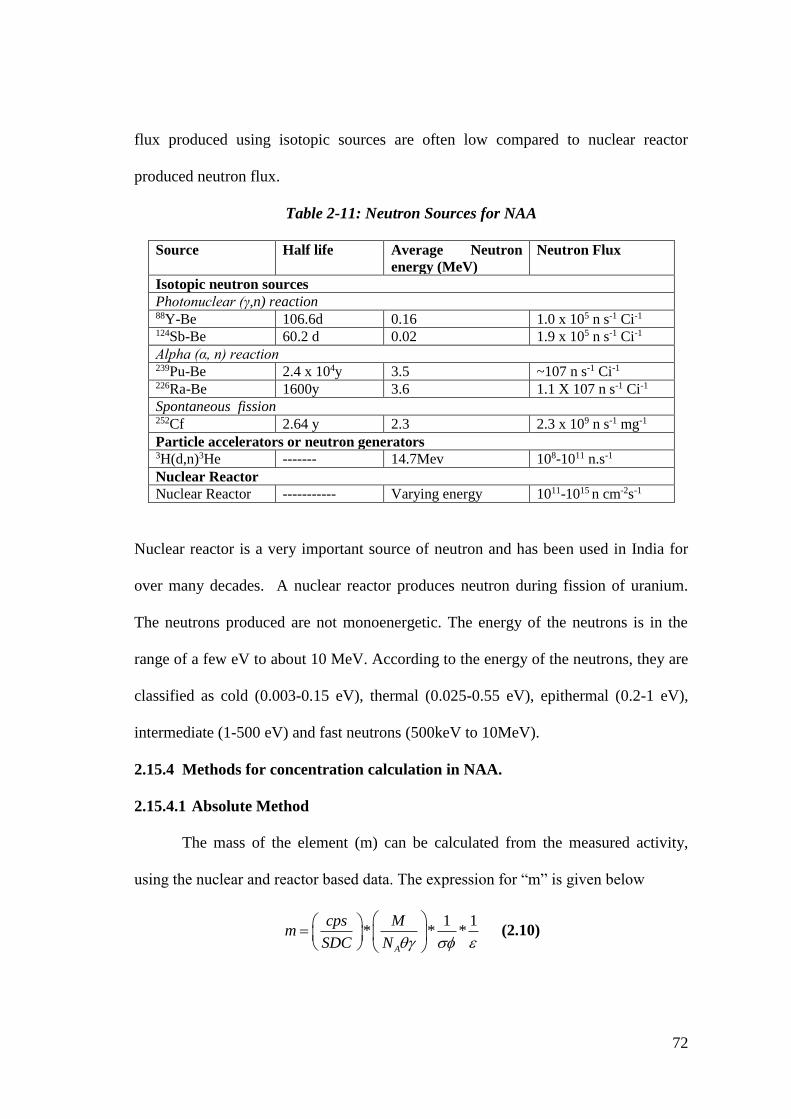
72
flux produced using isotopic sources are often low compared to nuclear reactor
produced neutron flux.
Table 2-11: Neutron Sources for NAA
Source Half life Average Neutron
energy (MeV)
Neutron Flux
Isotopic neutron sources
Photonuclear (γ,n) reaction 88Y-Be 106.6d 0.16 1.0 x 10⁵ n s-1 Ci-1 124Sb-Be 60.2 d 0.02 1.9 x 10⁵ n s-1 Ci-1
Alpha (α, n) reaction 239Pu-Be 2.4 x 10⁴y 3.5 ~107 n s-1 Ci-1 226Ra-Be 1600y 3.6 1.1 X 10⁷ n s-1 Ci-1
Spontaneous fission 252Cf 2.64 y 2.3 2.3 x 10⁹ n s-1 mg-1
Particle accelerators or neutron generators 3H(d,n)3He ------- 14.7Mev 108-1011 n.s-1
Nuclear Reactor
Nuclear Reactor ----------- Varying energy 1011-1015 n cm-2s-1
Nuclear reactor is a very important source of neutron and has been used in India for
over many decades. A nuclear reactor produces neutron during fission of uranium.
The neutrons produced are not monoenergetic. The energy of the neutrons is in the
range of a few eV to about 10 MeV. According to the energy of the neutrons, they are
classified as cold (0.003-0.15 eV), thermal (0.025-0.55 eV), epithermal (0.2-1 eV),
intermediate (1-500 eV) and fast neutrons (500keV to 10MeV).
2.15.4 Methods for concentration calculation in NAA.
2.15.4.1 Absolute Method
The mass of the element (m) can be calculated from the measured activity,
using the nuclear and reactor based data. The expression for “m” is given below
1 1* * *
A
cps Mm
SDC N
(2.10)
73
It is a direct analysis where the values of parameters from nuclear data tables,
irradiation parameters and measuring parameters are directly used for evaluating the
induced activity. The sensitivity and accuracy of absolute method depend on: nuclear
parameters of the elements such as isotope abundance (θ), cross-section (σ), gamma
intensity (γ), atomic mass (M), decay constant (λ) and half- life, the irradiation
parameters such as neutron flux (ɸ), irradiation time (ti), decaying time (td), and
counting time (tc) and measurement conditions like mass of the sample (Msam), net
peak activity (A) and detector efficiency (ε).
The disadvantage of the absolute method of analysis is the difficulties in evaluating
the absolute values of flux and cross section as these values vary with neutron energy.
Another limitation is the uncertainties associated from the nuclear parameters. These
limitations can be overcome by use of relative method described below.
2.15.4.2 Relative Method
This method is a very simple method of analysis. Here each sample is co irradiated
with a standard containing known amount of isotope of interest. The sample and
standard are counted in identical conditions with respect to the detector and compared.
sam stdsamp std
std sam
cps Dm m
cps D (2.11)
Using the mass of the element in standard, mstd and activities of the standards, cpsstd,
and sample, cpssam, mass of element in the sample, msam is calculated.
Though the relative method is simple and precise, prior knowledge of the elements
present in the sample is necessary to prepare corresponding standards in a similar
matrix as that of the sample. The multi-element standards are mostly prepared from
74
their corresponding primary standards or sometimes certified reference materials
(CRMs) of similar matrices are used in the irradiations.
2.15.5 Methodologies in NAA
NAA can be performed in a variety of ways depending on the element of interest and
the interferences present in the sample matrix. NAA can also be classified into two
major categories known as Chemical Neutron Activation Analysis (CNAA) and
Instrumental Neutron Activation Analysis (INAA).
2.15.5.1 Instrumental neutron activation analysis
INAA technique is purely instrumental, sensitive and non-destructive method where
the sample under investigation is not subjected to any physical and chemical change
(or damage).
2.15.5.2 Chemical Neutron Activation Analysis
If the major or matrix element in a sample interferes in the determination of the
element of interest, then the analysis by INAA is not reliable. Moreover, if the
concentration of the element of interest is lower, INAA cannot be employed. In such
cases, pre or post chemical separation is done in combination with NAA.
2.15.5.2.1 Pre-concentration NAA
If the element of interest is separated from their sample matrix prior to the irradiation,
then the technique is called as Pre-concentration NAA (PCNAA). It is applied for the
determination of single as well as complex sample matrices where INAA cannot be
used. Pre-concentration results in increasing the amount of element of interest per
unit mass, hence the sensitivity of the method is improved.
The pre-concentration procedure used should be simple, so that the contamination
from handling and reagents are minimum thereby reducing the background and giving
75
better detection limits. Some of the commonly used pre concentration steps are co-
precipitation, co-crystallisation, solvent extraction, ion exchange, chelating ion
exchange, adsorption, chromatographic techniques, distillation, electro deposition and
floatation.
Pre-concentration is a preferred method for analysing low concentration uranium and
thorium in water, blood and urine. Thorium and uranium present in urine and water
samples are co precipitated with calcium phosphate precipitate and further separated
using ion exchange methods to remove the interference from Br, Cl and Na.
2.15.5.2.2 Radiochemical NAA
Radiochemical neutron activation analysis (RNAA) is a technique that is used when a
desired element or elements cannot be detected or determined accurately by INAA,
due to interferences resulting from the matrix elements. It involves the decomposition
of the irradiated sample by the suitable method of separation such as chemical based
ion exchange or precipitation for separation specific elements of interest.
Radiochemical method is important when the amount of an element is very small that
the induced γ-rays activities associated with this element cannot be detected due to the
effect of background activities or activities originated from other elements. For e.g., If
two radionuclides with nearly equal half-lives emit gamma-rays of nearly same energy
during (n, γ) reaction, there is an inevitable gamma interference and the elemental
contents of the two radionuclides cannot be exactly identified or determined
quantitatively by INAA technique. In such cases, it is necessary to separate the two
interfering elements.
76
2.15.6 NAA based on the neutron energy
NAA can also be classified based on the energy of the neutron used as: Thermal
neutron activation analysis (TNAA), Epithermal neutron activation analysis (ENAA)
and Fast neutron activation analysis (FNAA) based on the energy distributions of the
neutrons in a nuclear reactor.
2.15.6.1 Thermal Neutron Activation Analysis
Thermal neutrons are produced in a research reactor within the energy range between
0 and 0.55 eV. The average energy of the thermal neutrons in a nuclear reactor is
approximately 0.025 eV. Instrumental NAA that is based only on thermal neutron
fluxes is known as Thermal Neutron Activation Analysis (TNAA). Thermal neutron
activation analysis takes the advantages of high intensity of neutron beams and large
thermal cross-section for most isotopes. The higher sensitivity is achieved with TNAA
as the neutron in thermal energy region, cross section follows 1/v law.
2.15.6.2 Epithermal Neutron Activation Analysis
Neutrons in the energy spectrum from 0.5 eV to 100 eV are known as Epithermal
neutrons. In this region the neutron flux distribution is not proportional to the inverse
of the velocity but it is proportional to inverse of the energy. The other unique
property of epithermal neutrons is their cross-section as function of energy show
strong resonance peaks phenomena. The flux and the resonance energy of this region
is more important to identify and determine chemical elements in sample of interest
whose cross-sections are very small. To get epithermal neutron flux separated from
thermal neutron flux in a reactor, a cadmium foil of 1 mm thick is inserted into one of
the irradiation channels inside the reactor. Cadmium absorbs thermal neutrons and
will allow epithermal and fast neutrons to pass through it. In general, about 2 % of the
77
reactor's total neutron flux is the epithermal neutron flux. Thus, NAA that is based on
only epithermal neutron flux is known as Epithermal Neutron Activation Analysis
(ENAA).
2.15.6.3 Fast Neutrons Activation Analysis
Fast neutron activation analysis (FNAA) is the third type of activation analysis. The
energy range of fast neutron component is above 0.5 Mev. Fast neutron consists of the
primary emission neutrons which still have much of their original energy following
fission. Fast neutrons don't induce (n,γ) reactions but instead they induce nuclear
reactions that eject one or more nuclear particles (n, p),(n, n’) and (n, 2n). This type of
technique induces particles reaction is known as fast neutron activation analysis
(FNAA). Fast neutrons with energies of several MeV's can be produced with a
neutron generator in an isotopic neutron source.
2.15.7 Sensitivity and Detection Limit in NAA.
The sensitivities for NAA are primarily dependent on the nuclear parameters and
reactor neutron fluxes. The sensitivity in NAA is defined as the count per unit mass
(cps μg-1) for a given set of irradiation conditions. The sensitivity can be improved by
irradiating samples in a high neutron flux and measuring the radioactivity with a high
efficiency detector.
The smallest amount that can be determined by NAA is governed by the minimum
activity which can be reliably measured with sufficient precision. The minimum
detectable activity of an analyte is known as its detection limit (LD). The LD in NAA
varies from pictogram to milligram depending on the nuclear properties of the isotope
of interest, background, sample matrix and pre or post chemical separations.
The Curries equation is used for the calculation of detection limit (LD) in NAA [165].
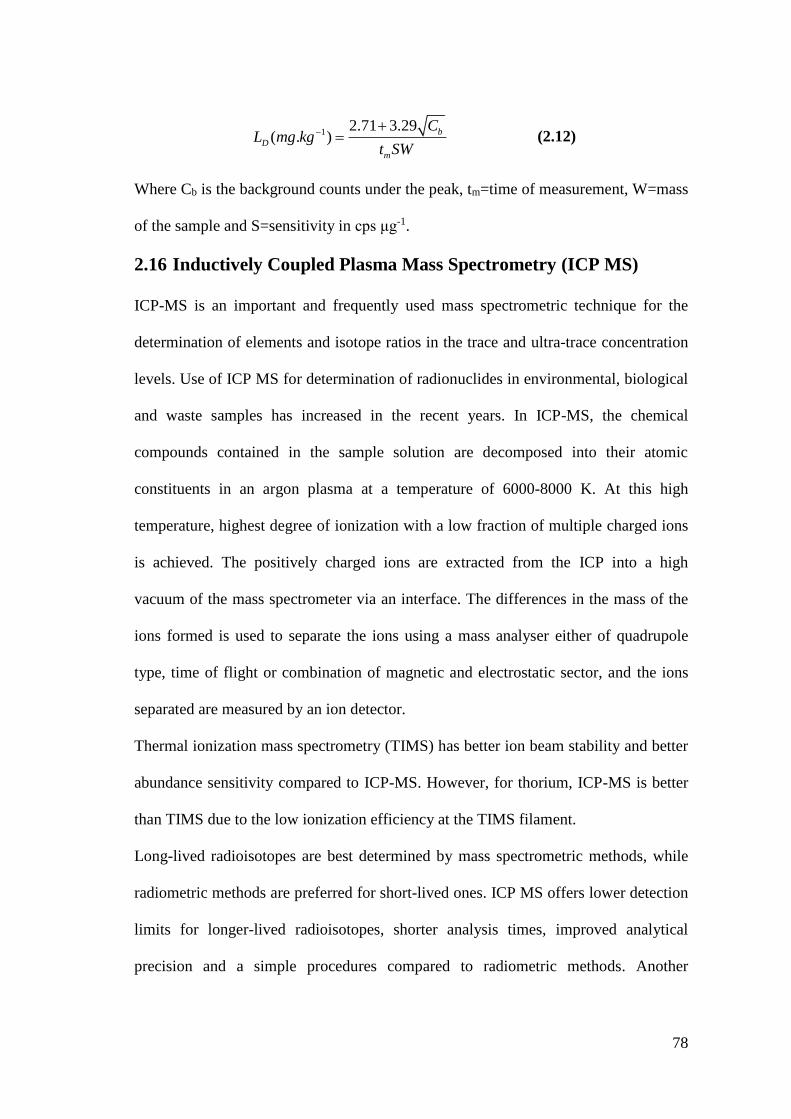
78
12.71 3.29
( . )b
D
m
CL mg kg
t SW
(2.12)
Where Cb is the background counts under the peak, tm=time of measurement, W=mass
of the sample and S=sensitivity in cps μg-1.
2.16 Inductively Coupled Plasma Mass Spectrometry (ICP MS)
ICP-MS is an important and frequently used mass spectrometric technique for the
determination of elements and isotope ratios in the trace and ultra-trace concentration
levels. Use of ICP MS for determination of radionuclides in environmental, biological
and waste samples has increased in the recent years. In ICP-MS, the chemical
compounds contained in the sample solution are decomposed into their atomic
constituents in an argon plasma at a temperature of 6000-8000 K. At this high
temperature, highest degree of ionization with a low fraction of multiple charged ions
is achieved. The positively charged ions are extracted from the ICP into a high
vacuum of the mass spectrometer via an interface. The differences in the mass of the
ions formed is used to separate the ions using a mass analyser either of quadrupole
type, time of flight or combination of magnetic and electrostatic sector, and the ions
separated are measured by an ion detector.
Thermal ionization mass spectrometry (TIMS) has better ion beam stability and better
abundance sensitivity compared to ICP-MS. However, for thorium, ICP-MS is better
than TIMS due to the low ionization efficiency at the TIMS filament.
Long-lived radioisotopes are best determined by mass spectrometric methods, while
radiometric methods are preferred for short-lived ones. ICP MS offers lower detection
limits for longer-lived radioisotopes, shorter analysis times, improved analytical
precision and a simple procedures compared to radiometric methods. Another
79
advantage of ICP MS method is the ability of determining all the actinide elements
within a minute, at ultra-trace levels (ng l-1) in liquid samples. Hence, ICP-MS has
been widely used for the determination of isotopes of uranium, thorium, plutonium,
strontium, americium, radium, lead, technetium, palladium, neptunium, curium and
iodine in environmental and waste samples.
Long-lived 238U and 232Th isotopes have low specific activity (12.3 and 4 Bq mg-1,
respectively) hence require long counting time (days–weeks) for good counting
statistics. Moreover, the radionuclide needs to be separated from the sample matrix to
obtain thin counting sources for good energy resolution. Therefore, ICP-MS provides
a rapid and sensitive technique for the determination of these elements. However
complex sample matrix can cause chocking of the sample introduction system and
also causes interferences in the plasma resulting in a suppression of analyte ionization.
Care should be taken to reduce the total dissolved solids (TDS) present in the solution
when it is analyzed. As a general rule, TDS should not exceed 0.1%. Sample
pretreatment like dilution is necessary for samples with high TDS. Sample dilution
tends to decrease the matrix effects but will also decrease the U and Th concentrations.
Viewing to the low sensitivity of alpha spectrometry, gamma spectrometry, ICP AES
and Spectrophotometer methods are not very effective for determination of Th in
biological and human materials. INAA and ICP MS are two methods that are
preferred for quantification of Th in biological and vegetation samples. Hence 232Th in
samples were analysed using INAA and ICPMS.

80
Chapter 3
Experimental
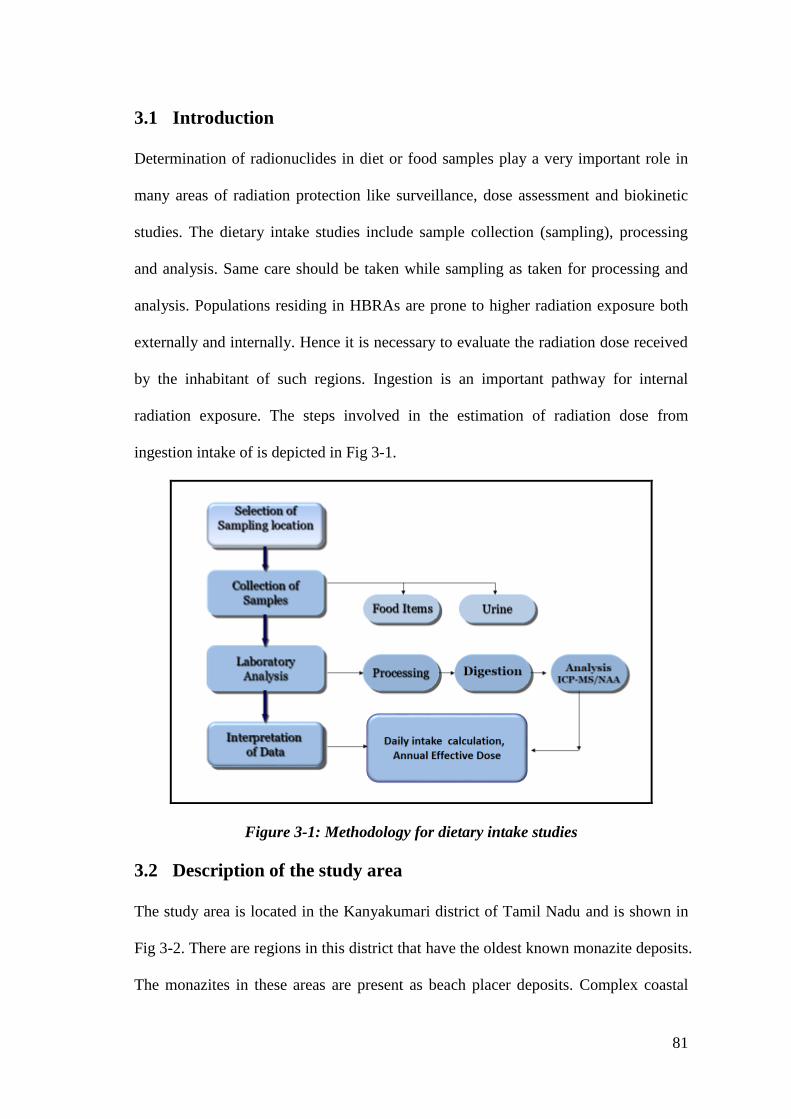
81
3.1 Introduction
Determination of radionuclides in diet or food samples play a very important role in
many areas of radiation protection like surveillance, dose assessment and biokinetic
studies. The dietary intake studies include sample collection (sampling), processing
and analysis. Same care should be taken while sampling as taken for processing and
analysis. Populations residing in HBRAs are prone to higher radiation exposure both
externally and internally. Hence it is necessary to evaluate the radiation dose received
by the inhabitant of such regions. Ingestion is an important pathway for internal
radiation exposure. The steps involved in the estimation of radiation dose from
ingestion intake of is depicted in Fig 3-1.
Figure 3-1: Methodology for dietary intake studies
3.2 Description of the study area
The study area is located in the Kanyakumari district of Tamil Nadu and is shown in
Fig 3-2. There are regions in this district that have the oldest known monazite deposits.
The monazites in these areas are present as beach placer deposits. Complex coastal
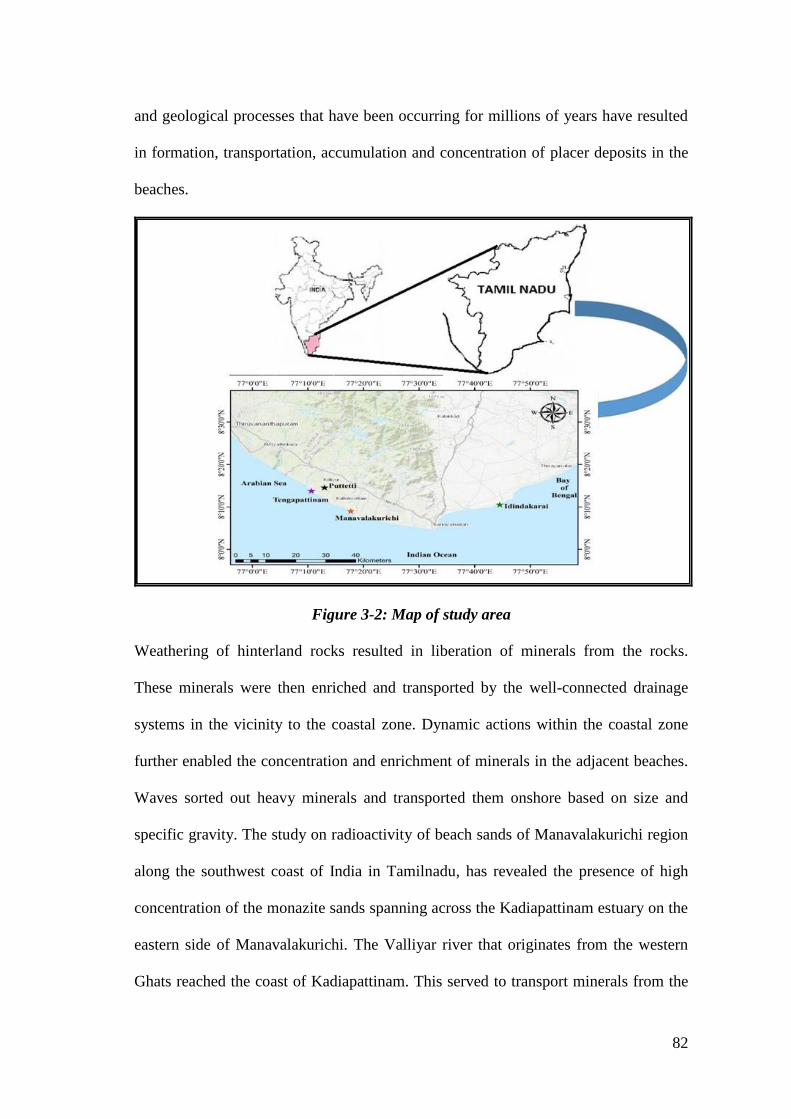
82
and geological processes that have been occurring for millions of years have resulted
in formation, transportation, accumulation and concentration of placer deposits in the
beaches.
Figure 3-2: Map of study area
Weathering of hinterland rocks resulted in liberation of minerals from the rocks.
These minerals were then enriched and transported by the well-connected drainage
systems in the vicinity to the coastal zone. Dynamic actions within the coastal zone
further enabled the concentration and enrichment of minerals in the adjacent beaches.
Waves sorted out heavy minerals and transported them onshore based on size and
specific gravity. The study on radioactivity of beach sands of Manavalakurichi region
along the southwest coast of India in Tamilnadu, has revealed the presence of high
concentration of the monazite sands spanning across the Kadiapattinam estuary on the
eastern side of Manavalakurichi. The Valliyar river that originates from the western
Ghats reached the coast of Kadiapattinam. This served to transport minerals from the
83
weathering rocks of the Western Ghats. The deposit extends to a length of about 16
km from the north of Muttom promontory to Kolachel, with an average width of 45m.
The hinterland consists of khondalite suite of Archean age composed of quartzite of
arenaceous facies, calc silicates with pockets of crystalline limestone representing
calcareous facies and quartz garnet sillimanite graphite schists and gneisses or
argillaceous facies. Charnockite intrudes into khondalites in some places. Muttom and
adjacent areas are characterized by extensive occurrence of fine sandy loam known as
Teris [166]. The total average content of heavy minerals is around 39 %. Of these,
ilmenite forms the major constituent (24%) with rutile (1.8%), leucoxene (0.9 %),
zircon (2 %), monazite (5%), sillimanite (3.5%) and garnet (5.5%). The monazite has
a total of 58% rare earth element (REE) oxides and 8% ThO2. The total reserves of
heavy minerals in the Manavalakurichi-Kolachel stretch are estimated to be about
1.6MT. The study area is located in the south west coast of Tamil Nadu, India
consisting of many villages namely Manavalakurichi, Putteti, Keezhkulam,
Thengapattinam, Midalam, Inaiyam, Kurumpanai, Kadiapattinam, Kolachel,
Mandaikadu, Muttom, Kanyakumari, Chinnamuttum, Rajakkamangalam, Manakudu,
Kovalam, Puthulam, Neendakara, Manapadu, Koodankulam and Idindakarai.
3.3 Dietary sampling Methods
Dietary radionuclide intakes are estimated by several methods [167]. The sampling
methods employed should be such that food sampling is truly representative of the
dietary consumption of the population group under study and should ensure the
exclusion of external contamination. There are different approaches while sampling
for dietary intake studies. Each approach has its own advantage and disadvantage.
World Health Organization (WHO) has provided guideline for national food
84
contamination monitoring using Duplicate Portion Study (DPS) method, Market
Basket Study (MBS) method, 24 h recall method and food records methods.
Although DPS offer the greatest degree of reality compared to other methods, market
basket studies are advantageous regarding identification of what kinds of food are
critical for radionuclide intakes.
In the present study, two methods namely MBS and DPS methods were adapted.
3.3.1 Market Basket Study method
This diet sampling procedure is based on analysis of representative food items
purchased locally and on regional food consumption statistics. The intake estimates
are then calculated by multiplying the concentration estimate in each food by the
respective consumption rate estimates. As most of the reports provided by the national
bodies on the consumption rate estimates gives region, age and gender specific data,
this method is an easy method. It is also possible to reduce the number of foods or
select only those food item that is consumed by the population of interest hence by
reducing the cost and efforts. Another advantage of this method is that the analysis of
a number of foods or food groups gives more information than the analysis of a single
composite diet sample. In India, the state specific food consumption data is provided
by National Nutrition Monitoring Bureau (NNMB). NNMB is the national body
responsible for region wise collection of food consumption data. The data given in the
report considers ethnic, age, gender and income difference. The NNMB has classified
the diet into 13 major categories. The report also gives data for different age group
and gender. The latest NNMB report for Tamil Nadu and Kerala was used for this
study [168].
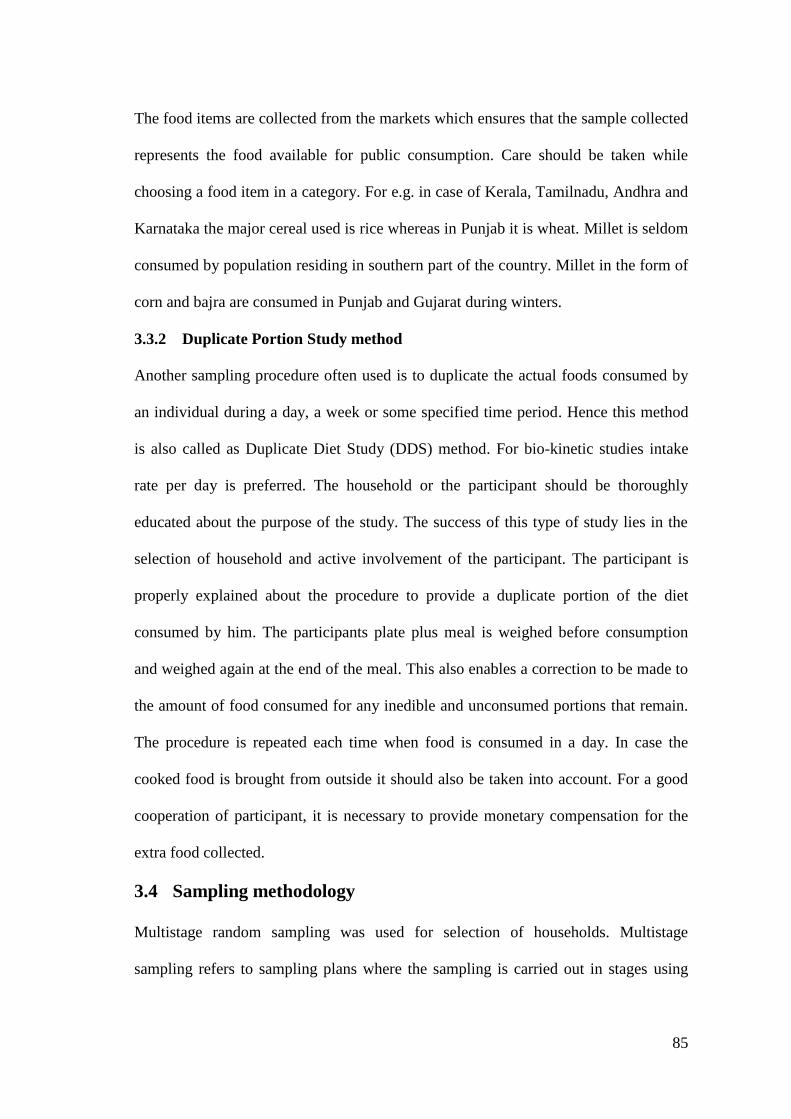
85
The food items are collected from the markets which ensures that the sample collected
represents the food available for public consumption. Care should be taken while
choosing a food item in a category. For e.g. in case of Kerala, Tamilnadu, Andhra and
Karnataka the major cereal used is rice whereas in Punjab it is wheat. Millet is seldom
consumed by population residing in southern part of the country. Millet in the form of
corn and bajra are consumed in Punjab and Gujarat during winters.
3.3.2 Duplicate Portion Study method
Another sampling procedure often used is to duplicate the actual foods consumed by
an individual during a day, a week or some specified time period. Hence this method
is also called as Duplicate Diet Study (DDS) method. For bio-kinetic studies intake
rate per day is preferred. The household or the participant should be thoroughly
educated about the purpose of the study. The success of this type of study lies in the
selection of household and active involvement of the participant. The participant is
properly explained about the procedure to provide a duplicate portion of the diet
consumed by him. The participants plate plus meal is weighed before consumption
and weighed again at the end of the meal. This also enables a correction to be made to
the amount of food consumed for any inedible and unconsumed portions that remain.
The procedure is repeated each time when food is consumed in a day. In case the
cooked food is brought from outside it should also be taken into account. For a good
cooperation of participant, it is necessary to provide monetary compensation for the
extra food collected.
3.4 Sampling methodology
Multistage random sampling was used for selection of households. Multistage
sampling refers to sampling plans where the sampling is carried out in stages using
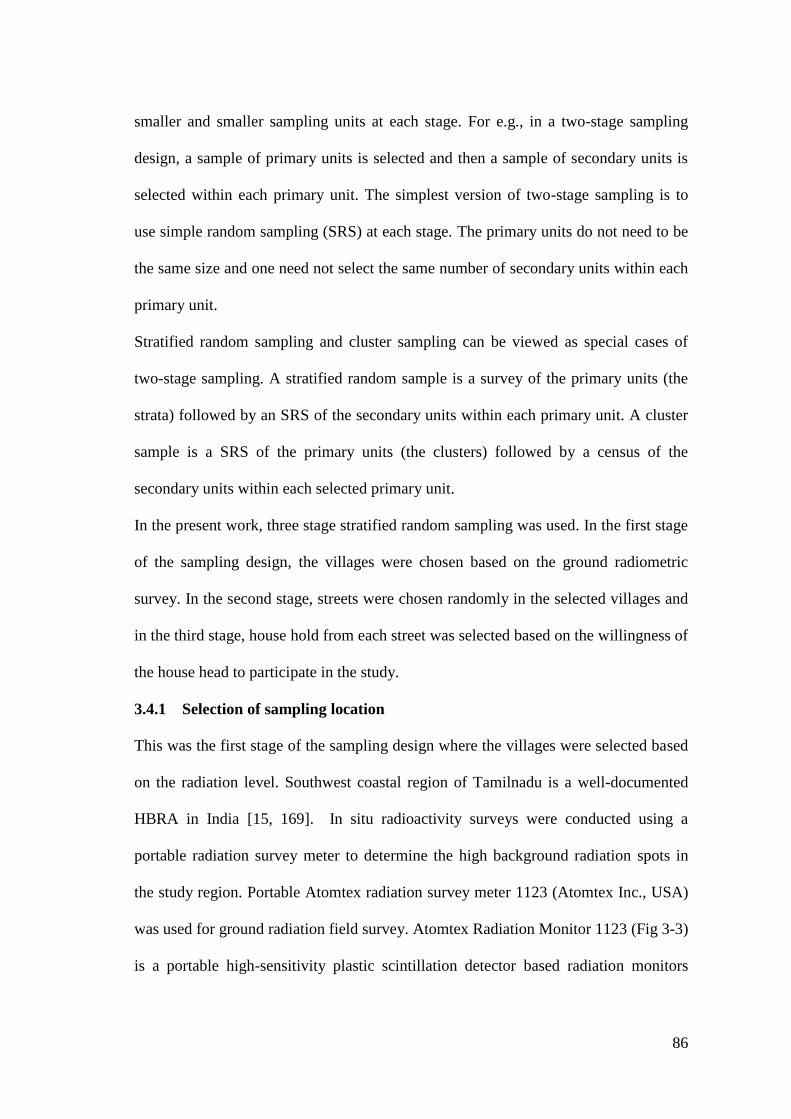
86
smaller and smaller sampling units at each stage. For e.g., in a two-stage sampling
design, a sample of primary units is selected and then a sample of secondary units is
selected within each primary unit. The simplest version of two-stage sampling is to
use simple random sampling (SRS) at each stage. The primary units do not need to be
the same size and one need not select the same number of secondary units within each
primary unit.
Stratified random sampling and cluster sampling can be viewed as special cases of
two-stage sampling. A stratified random sample is a survey of the primary units (the
strata) followed by an SRS of the secondary units within each primary unit. A cluster
sample is a SRS of the primary units (the clusters) followed by a census of the
secondary units within each selected primary unit.
In the present work, three stage stratified random sampling was used. In the first stage
of the sampling design, the villages were chosen based on the ground radiometric
survey. In the second stage, streets were chosen randomly in the selected villages and
in the third stage, house hold from each street was selected based on the willingness of
the house head to participate in the study.
3.4.1 Selection of sampling location
This was the first stage of the sampling design where the villages were selected based
on the radiation level. Southwest coastal region of Tamilnadu is a well-documented
HBRA in India [15, 169]. In situ radioactivity surveys were conducted using a
portable radiation survey meter to determine the high background radiation spots in
the study region. Portable Atomtex radiation survey meter 1123 (Atomtex Inc., USA)
was used for ground radiation field survey. Atomtex Radiation Monitor 1123 (Fig 3-3)
is a portable high-sensitivity plastic scintillation detector based radiation monitors
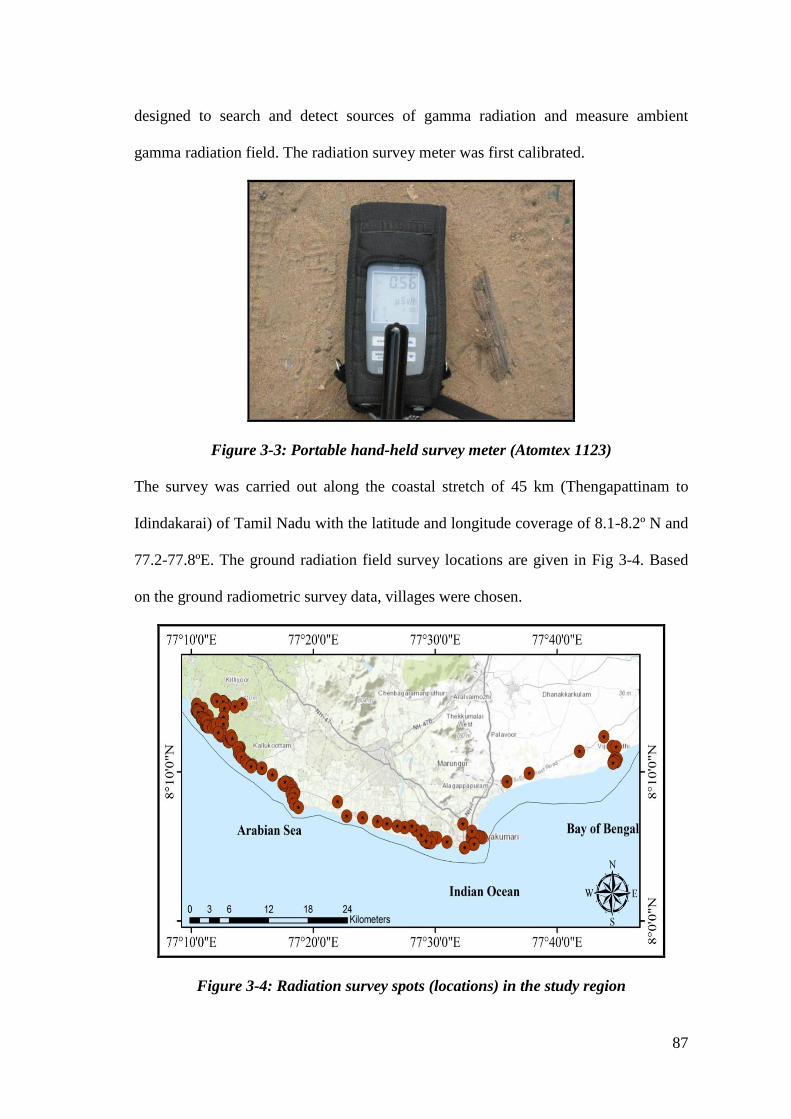
87
designed to search and detect sources of gamma radiation and measure ambient
gamma radiation field. The radiation survey meter was first calibrated.
Figure 3-3: Portable hand-held survey meter (Atomtex 1123)
The survey was carried out along the coastal stretch of 45 km (Thengapattinam to
Idindakarai) of Tamil Nadu with the latitude and longitude coverage of 8.1-8.2º N and
77.2-77.8ºE. The ground radiation field survey locations are given in Fig 3-4. Based
on the ground radiometric survey data, villages were chosen.
Figure 3-4: Radiation survey spots (locations) in the study region
88
3.4.1.1 Selection of Households for DPS
Once the villages were selected, the information on the population and the streets in
the villages were collected from the village office. The villages were divided into
blocks and information on the blocks were obtained from the village office.
Households were selected based on the willingness to participate.
3.4.1.2 Selection of sites for MBS
In the study area, there are two important wholesale farmer markets from where food
items are mostly purchased. The small retail shops also stocked items purchased from
these markets. Hence samples for this study were purchased from the two markets.
The vegetables and fruits that are cultivated in the region is also sold in one of these
markets itself.
3.5 Sample collection
Sample collection, handling and storage is a very important part in any dietary intake
study. Any error in sampling and the sample preparation of any study is considerably
higher than that in the methodology itself, as illustrated in Fig 3-5.
Figure 3-5: Degree of error in various stage of an analytical methodology[170]
The materials required for diet sampling are sample preparation equipment (e.g.,
weighing balance, volume measuring device, gloves), sample preservation equipment
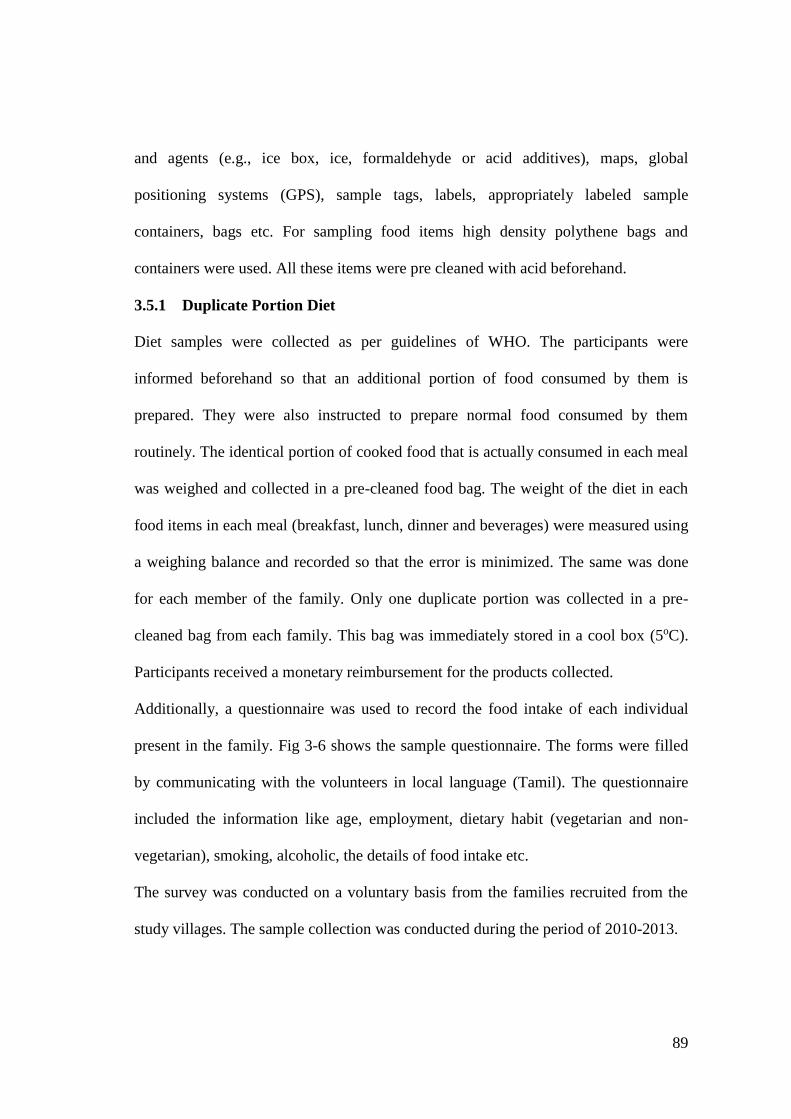
89
and agents (e.g., ice box, ice, formaldehyde or acid additives), maps, global
positioning systems (GPS), sample tags, labels, appropriately labeled sample
containers, bags etc. For sampling food items high density polythene bags and
containers were used. All these items were pre cleaned with acid beforehand.
3.5.1 Duplicate Portion Diet
Diet samples were collected as per guidelines of WHO. The participants were
informed beforehand so that an additional portion of food consumed by them is
prepared. They were also instructed to prepare normal food consumed by them
routinely. The identical portion of cooked food that is actually consumed in each meal
was weighed and collected in a pre-cleaned food bag. The weight of the diet in each
food items in each meal (breakfast, lunch, dinner and beverages) were measured using
a weighing balance and recorded so that the error is minimized. The same was done
for each member of the family. Only one duplicate portion was collected in a pre-
cleaned bag from each family. This bag was immediately stored in a cool box (5oC).
Participants received a monetary reimbursement for the products collected.
Additionally, a questionnaire was used to record the food intake of each individual
present in the family. Fig 3-6 shows the sample questionnaire. The forms were filled
by communicating with the volunteers in local language (Tamil). The questionnaire
included the information like age, employment, dietary habit (vegetarian and non-
vegetarian), smoking, alcoholic, the details of food intake etc.
The survey was conducted on a voluntary basis from the families recruited from the
study villages. The sample collection was conducted during the period of 2010-2013.
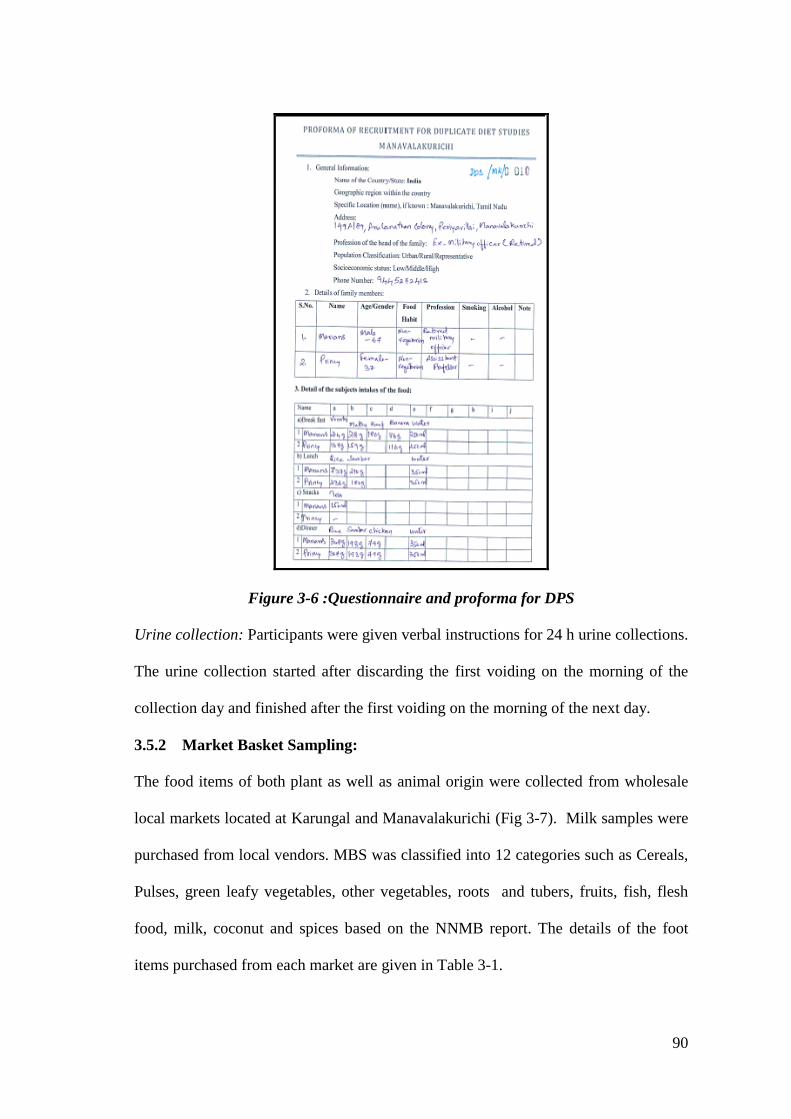
90
Figure 3-6 :Questionnaire and proforma for DPS
Urine collection: Participants were given verbal instructions for 24 h urine collections.
The urine collection started after discarding the first voiding on the morning of the
collection day and finished after the first voiding on the morning of the next day.
3.5.2 Market Basket Sampling:
The food items of both plant as well as animal origin were collected from wholesale
local markets located at Karungal and Manavalakurichi (Fig 3-7). Milk samples were
purchased from local vendors. MBS was classified into 12 categories such as Cereals,
Pulses, green leafy vegetables, other vegetables, roots and tubers, fruits, fish, flesh
food, milk, coconut and spices based on the NNMB report. The details of the foot
items purchased from each market are given in Table 3-1.
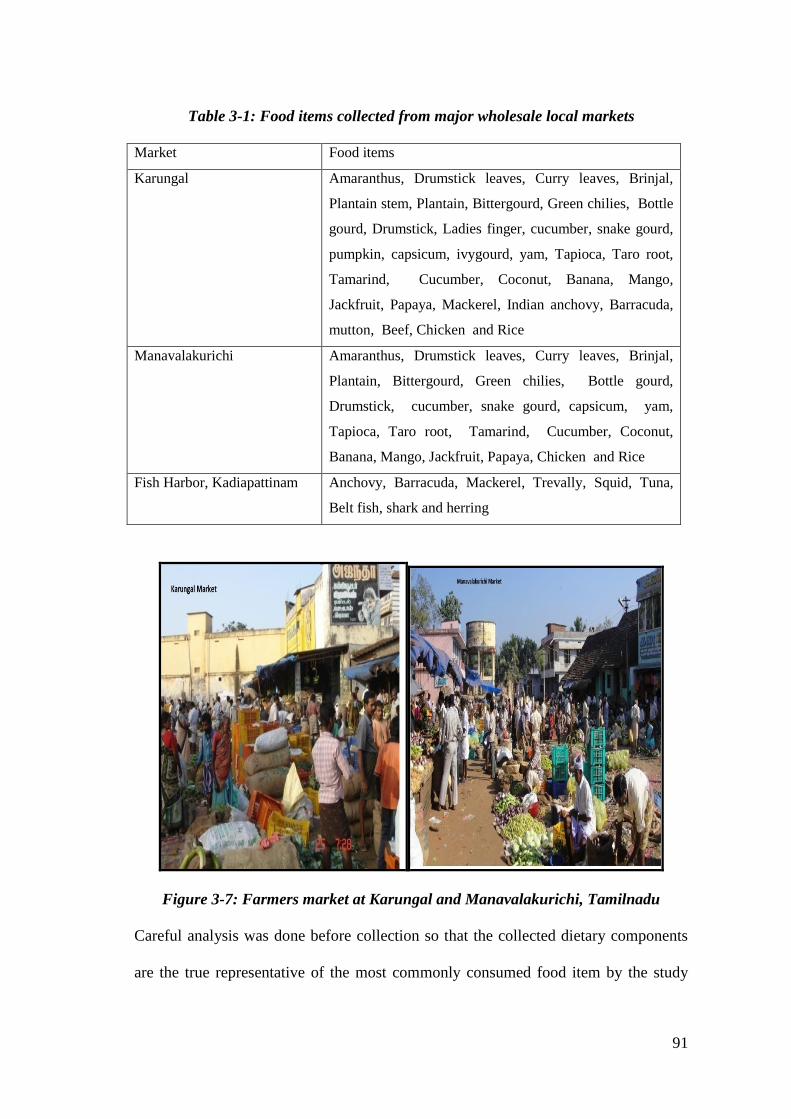
91
Table 3-1: Food items collected from major wholesale local markets
Market Food items
Karungal Amaranthus, Drumstick leaves, Curry leaves, Brinjal,
Plantain stem, Plantain, Bittergourd, Green chilies, Bottle
gourd, Drumstick, Ladies finger, cucumber, snake gourd,
pumpkin, capsicum, ivygourd, yam, Tapioca, Taro root,
Tamarind, Cucumber, Coconut, Banana, Mango,
Jackfruit, Papaya, Mackerel, Indian anchovy, Barracuda,
mutton, Beef, Chicken and Rice
Manavalakurichi Amaranthus, Drumstick leaves, Curry leaves, Brinjal,
Plantain, Bittergourd, Green chilies, Bottle gourd,
Drumstick, cucumber, snake gourd, capsicum, yam,
Tapioca, Taro root, Tamarind, Cucumber, Coconut,
Banana, Mango, Jackfruit, Papaya, Chicken and Rice
Fish Harbor, Kadiapattinam Anchovy, Barracuda, Mackerel, Trevally, Squid, Tuna,
Belt fish, shark and herring
Figure 3-7: Farmers market at Karungal and Manavalakurichi, Tamilnadu
Careful analysis was done before collection so that the collected dietary components
are the true representative of the most commonly consumed food item by the study
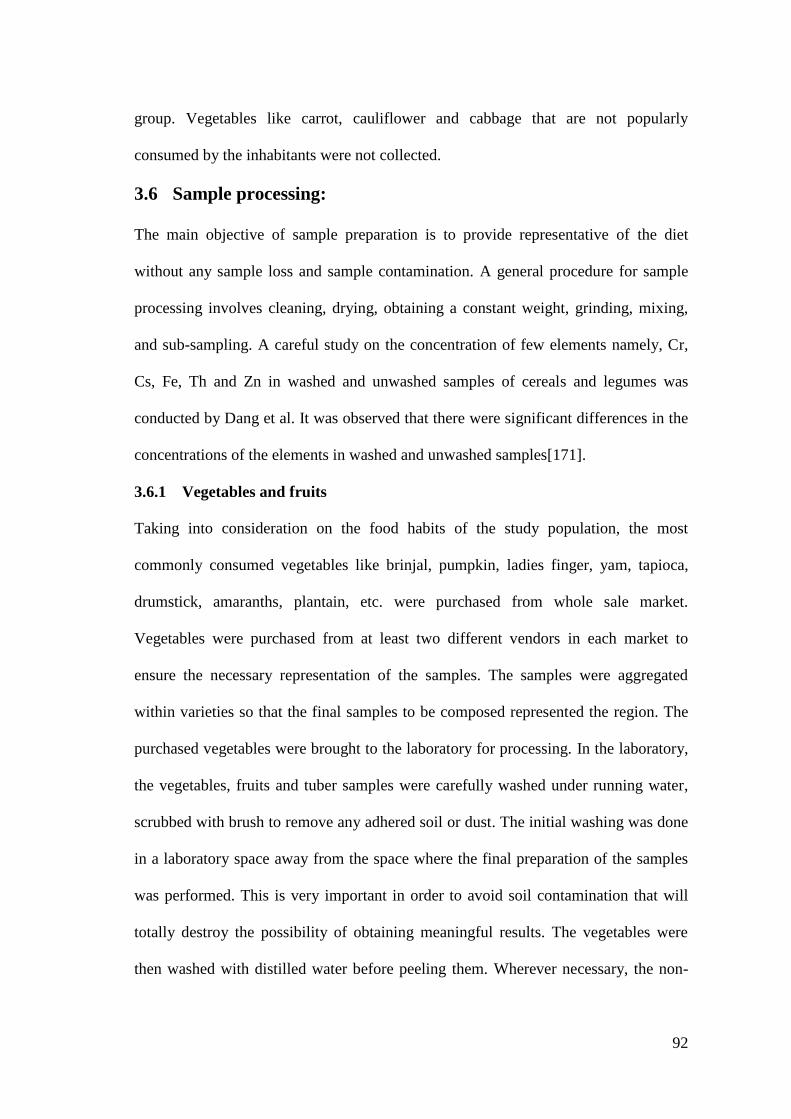
92
group. Vegetables like carrot, cauliflower and cabbage that are not popularly
consumed by the inhabitants were not collected.
3.6 Sample processing:
The main objective of sample preparation is to provide representative of the diet
without any sample loss and sample contamination. A general procedure for sample
processing involves cleaning, drying, obtaining a constant weight, grinding, mixing,
and sub-sampling. A careful study on the concentration of few elements namely, Cr,
Cs, Fe, Th and Zn in washed and unwashed samples of cereals and legumes was
conducted by Dang et al. It was observed that there were significant differences in the
concentrations of the elements in washed and unwashed samples[171].
3.6.1 Vegetables and fruits
Taking into consideration on the food habits of the study population, the most
commonly consumed vegetables like brinjal, pumpkin, ladies finger, yam, tapioca,
drumstick, amaranths, plantain, etc. were purchased from whole sale market.
Vegetables were purchased from at least two different vendors in each market to
ensure the necessary representation of the samples. The samples were aggregated
within varieties so that the final samples to be composed represented the region. The
purchased vegetables were brought to the laboratory for processing. In the laboratory,
the vegetables, fruits and tuber samples were carefully washed under running water,
scrubbed with brush to remove any adhered soil or dust. The initial washing was done
in a laboratory space away from the space where the final preparation of the samples
was performed. This is very important in order to avoid soil contamination that will
totally destroy the possibility of obtaining meaningful results. The vegetables were
then washed with distilled water before peeling them. Wherever necessary, the non-
93
edible peel was removed and cut on a cutting board into small pieces, about 1 cm3.
The cubes were mixed and transferred to a large tray and was dried in a hot air oven at
temperatures of 105 to 110o C for a few hours to obtain constant weight. The weight
of the sample was then recorded for the fresh weight. The cubes were then packed into
acid-washed tray and frozen at -20o C. In case of green leafy vegetables, non-edible
parts were removed with a knife and cut into small pieces. All the frozen vegetables
were then freeze-dried and homogenized using a food processor equipped with
titanium blades.
3.6.2 Flesh food and fish
In case of meat and beef, tenderloin and shoulder were collected. Liver of beef was
also collected. In case of chicken, the skinned chicken was collected. Two 0.5 kg flesh
samples were collected per shop. The samples were packed immediately into
polyethylene bags, coded with tags and then frozen. As the laboratory was away from
the study location, the samples were stored in an interim cold storage unit before
transportation to the lab. The samples were then transported to the laboratory in a
frozen state. Stainless-steel knives were used for cutting the meat samples. The
samples were thawed and cut into 1 cm3 pieces and freeze dried. The skin, bones and
fat were discarded and only the edible parts were utilized. For all sorts of meat
samples, only a food processor equipped with Ti blade was employed for the final
sample homogenization.
Fish samples were allowed to thaw out naturally. Samples were rinsed under a cold
running tap to remove fish scales and any extraneous particulate material. Flesh and
muscle parts were removed from bones except for Indian anchovy where only the tail
and head parts were removed and then filleted. The fillets were again rinsed to remove
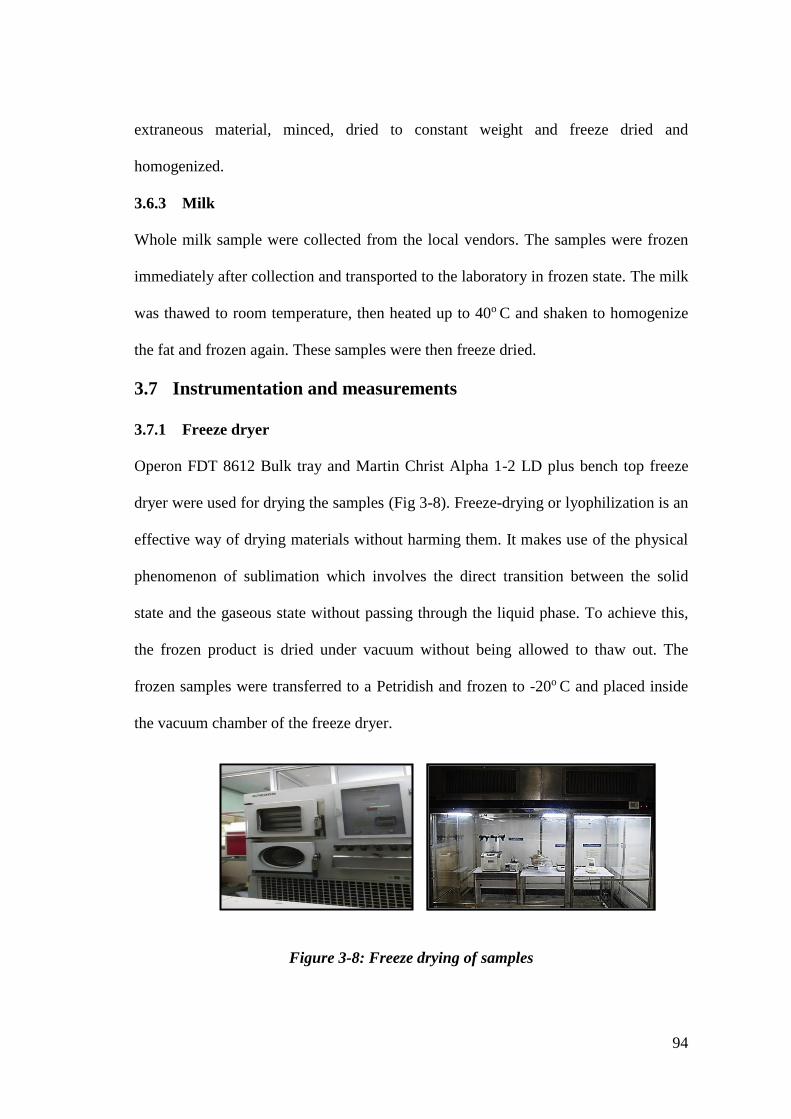
94
extraneous material, minced, dried to constant weight and freeze dried and
homogenized.
3.6.3 Milk
Whole milk sample were collected from the local vendors. The samples were frozen
immediately after collection and transported to the laboratory in frozen state. The milk
was thawed to room temperature, then heated up to 40o C and shaken to homogenize
the fat and frozen again. These samples were then freeze dried.
3.7 Instrumentation and measurements
3.7.1 Freeze dryer
Operon FDT 8612 Bulk tray and Martin Christ Alpha 1-2 LD plus bench top freeze
dryer were used for drying the samples (Fig 3-8). Freeze-drying or lyophilization is an
effective way of drying materials without harming them. It makes use of the physical
phenomenon of sublimation which involves the direct transition between the solid
state and the gaseous state without passing through the liquid phase. To achieve this,
the frozen product is dried under vacuum without being allowed to thaw out. The
frozen samples were transferred to a Petridish and frozen to -20o C and placed inside
the vacuum chamber of the freeze dryer.
Figure 3-8: Freeze drying of samples
95
3.7.2 Nuclear reactor
Nuclear reactors are broadly classified as power reactor and research reactor. Research
reactors are used for research activities and for production of various radioisotopes for
application in agriculture, food irradiation processing, health care, industry and
chemical research utilizing neutron flux. In the present study, irradiation of samples
was carried out in CIRUS and Dhruva research reactors at Bhabha Atomic Research
Centre (BARC), Trombay, Mumbai.
3.7.2.1 CIRUS reactor
The reactor was extensively used for condensed matter research, material irradiation,
fuel testing, NAA and production of radioisotopes for application in the fields of
medicine, agriculture and industry using neutron beams extracted from its core. It is a
vertical tank type reactor of 40 MW capacity fueled with metallic natural uranium,
moderated with heavy water and cooled by de-mineralized light water. Sample and
RMs were irradiated (for 8h) in self-serve position of CIRUS reactor of BARC,
Mumbai at a neutron flux of 3 ×1013 cm-2 s-1.
3.6.2.2 Dhruva reactor:
Dhruva reactor is 100 MW uranium metal fueled reactor, moderated, primary cooled
with heavy water and secondary cooled by de-mineralized light water with neutron
flux is ~1.8 × 1014 cm-2 s-1. Cadmium absorbers are used as shut off rods. Long as well
as short time irradiation facilities are available at Dhruva reactor using tray rod
position and pneumatic carrier facility (PCF), respectively. Tray rod position was used
for sample irradiations. The thermal neutron fluxes at tray rod position and PCF are of
the order of 1014 cm–2 s–1 at full power operation [70].
96
3.7.3 High resolution gamma ray spectrometry
Delayed gamma ray emitted in INAA was assayed with high resolution gamma ray
spectrometry using HPGe based detection system. Interaction of gamma rays with
matter, gamma ray detection system and its electronics is briefly discussed [172, 173].
3.7.3.1 Interaction of Gamma-rays with matter
Photoelectric absorption, Compton scattering and pair production are three important
interaction of gamma rays, though many other ways are present. These interaction
processes are shown in the Fig 3-9.
3.7.3.1.1 Photoelectric absorption (PEA)
When a gamma-ray interacts with an atom, the incident photon is absorbed by the
atom resulting in ejection of an electron from the atom. The energy of the ejected
electron (Ee-) is equal to the difference between incident energy of gamma ray (Eγ)
and the binding energy of electron (Eb), and is expressed as below:
beE E E (3.1)
The ejected electron interacts with the detector material resulting in ionization. The
vacancy created due to ionization is filled either by capture of a free electron in the
medium or by electronic rearrangement of electrons. In the process of rearrangement,
X-ray or Auger electron is released. These x-rays can further ionize the medium and
the energy is converted to electrons by the photo-electric effect resulting in conversion
of all the gamma ray energy into electron kinetic energy. This is reflected as full
energy deposition and seen as photo peak in the spectrum. The photoelectric cross-
section is given by the following equation:
3.5constant x
nZ
E
(3.2)
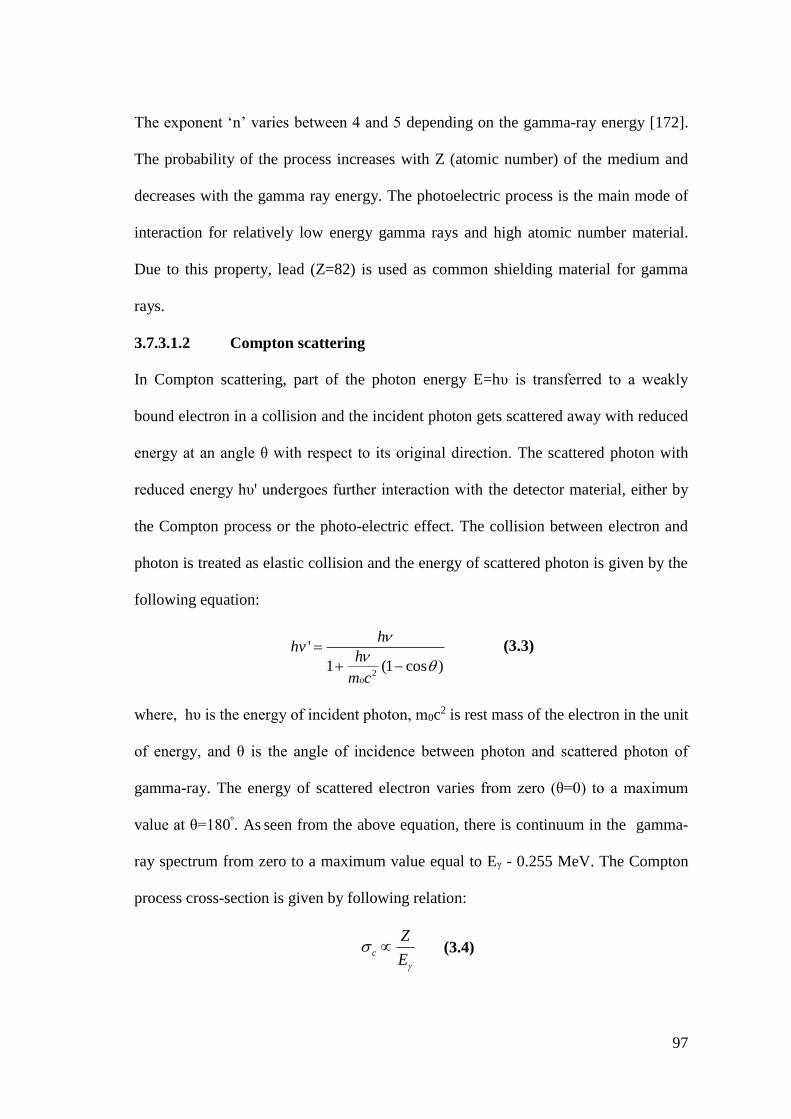
97
The exponent ‘n’ varies between 4 and 5 depending on the gamma-ray energy [172].
The probability of the process increases with Z (atomic number) of the medium and
decreases with the gamma ray energy. The photoelectric process is the main mode of
interaction for relatively low energy gamma rays and high atomic number material.
Due to this property, lead (Z=82) is used as common shielding material for gamma
rays.
3.7.3.1.2 Compton scattering
In Compton scattering, part of the photon energy E=hυ is transferred to a weakly
bound electron in a collision and the incident photon gets scattered away with reduced
energy at an angle θ with respect to its original direction. The scattered photon with
reduced energy hυ' undergoes further interaction with the detector material, either by
the Compton process or the photo-electric effect. The collision between electron and
photon is treated as elastic collision and the energy of scattered photon is given by the
following equation:
2
'
1 (1 cos )o
hhv
h
m c
(3.3)
where, hυ is the energy of incident photon, m0c2 is rest mass of the electron in the unit
of energy, and θ is the angle of incidence between photon and scattered photon of
gamma-ray. The energy of scattered electron varies from zero (θ=0) to a maximum
value at θ=180º. As seen from the above equation, there is continuum in the gamma-
ray spectrum from zero to a maximum value equal to Eγ - 0.255 MeV. The Compton
process cross-section is given by following relation:
c
Z
E
(3.4)
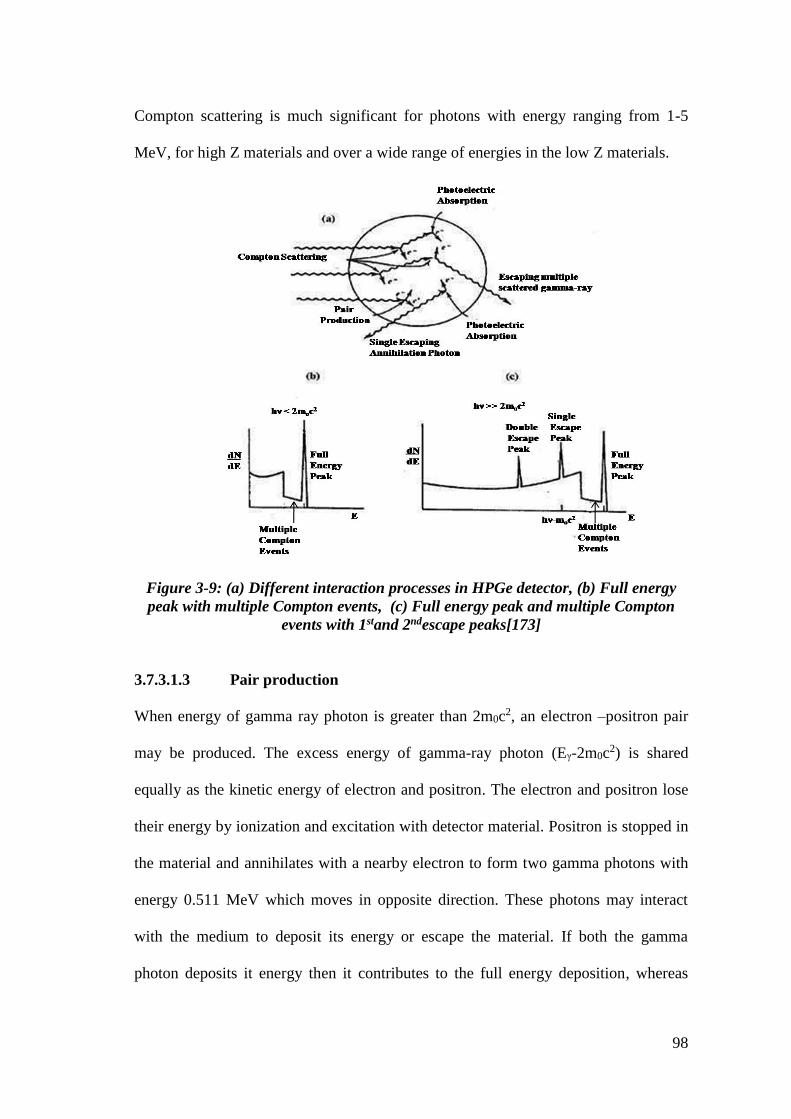
98
Compton scattering is much significant for photons with energy ranging from 1-5
MeV, for high Z materials and over a wide range of energies in the low Z materials.
Figure 3-9: (a) Different interaction processes in HPGe detector, (b) Full energy
peak with multiple Compton events, (c) Full energy peak and multiple Compton
events with 1stand 2ndescape peaks[173]
3.7.3.1.3 Pair production
When energy of gamma ray photon is greater than 2m0c2, an electron –positron pair
may be produced. The excess energy of gamma-ray photon (Eγ-2m0c2) is shared
equally as the kinetic energy of electron and positron. The electron and positron lose
their energy by ionization and excitation with detector material. Positron is stopped in
the material and annihilates with a nearby electron to form two gamma photons with
energy 0.511 MeV which moves in opposite direction. These photons may interact
with the medium to deposit its energy or escape the material. If both the gamma
photon deposits it energy then it contributes to the full energy deposition, whereas
99
when one photon escapes the material, the energy deposition is at Eγ-m0c2 and if both
the photon leaves the detector material without interaction, then the energy deposition
is at Eγ-2m0c2. The cross-section for pair production phenomena is given by the
following equation:
2 ln( 1.022)p Z E (3.5)
3.7.3.2 Gamma ray detection system
Nucleus in excited state de-excites to a lower energy state by emitting γ rays. Gamma
ray spectrometer uses this phenomenon to quantify the concentration of radionuclides
that emits γ rays. Two types of detectors are generally used for detection of γ ray
from the source: NaI(Tl) scintillation detector and high purity germanium (HPGe)
semi-conductor detector. As NaI(Tl) detector has high efficiency, and low price, it is
used in routine low-level measurements with a few well-separated gamma-ray peaks
where resolution is not of prime importance.
The HPGe detector has superior resolution and is available in larger size with higher
relative efficiency. HPGe detectors have been used in the present study and will be
discussed briefly. The high resolution γ ray spectrometer system consists of HPGe
detector, high voltage (HV) unit, amplification system, analogue to digital convertor
(ADC) and multi-channel analyzer MCA[173].
3.7.3.2.1 HPGe detector
HPGe is a semiconductor detector which replaced the Li based semiconductor devices
in the mid 1970’s. With advancements of technology, ultrapure germanium with
impurity levels as low as 109 cm-3 were developed. If low-level impurities are
acceptors, the property of the crystal is mildly p-type while if the impurities are donor
then they are n-type. Based on the shape, HPGe detectors can be classified as planar
100
or co axial. Coaxial P-type germanium detectors are used for gamma ray with energy
range from 100 keV to about 10 MeV. For X-ray spectroscopy, n-type planar
germanium detectors are used for low energy photon detection because of the thin
beryllium entrance windows. The p-type HPGe detectors used for gamma-ray
spectrometry have relative efficiency in the range of 10 % to over 150 %. Relative
efficiency is defined with respect to the efficiency of 3"x 3" NaI(Tl) detector at a
detector to source distance of 25 cm for 1332 keV gamma ray of 60Co [69]. The
resolution of an HPGe detector defined by full width at half maximum i.e., FWHM is
in the range of 1.8 to 2.1 keV at 1332 keV. The Ge crystal of HPGe detector is
attached to a liquid nitrogen dewar via Cu rod for cooling to minimize the leakage
current. A P type co axial detector with 50% relative efficiency was used in this study.
This type of detector is made with p type material with Li diffusion (n+) contact of 0.3
mm Li and 0.3µm, p+ contact created by boron ion implant.
3.7.3.2.2 High Voltage Supply
The semiconductor detectors operate in a depleted condition also called as the
sensitive region. The depletion region is created by applying electric field. The bias
supply is required for collection of the charge carrier formed in the detector sensitive
volume. A typical bias voltage of ±1500 V to ±5000 V with current capacities of 100
A is applied.
3.7.3.2.3 Preamplifier
Preamplifier is the most important part of the detector and has two main function 1)
conversion of the charge into a voltage pulse 2) serves to maximize the signal to noise
ratio. The pre amplifier also helps in matching the high impedance of the detector and
the low impedance of coaxial cables. The charge collected by the pre amp is converted
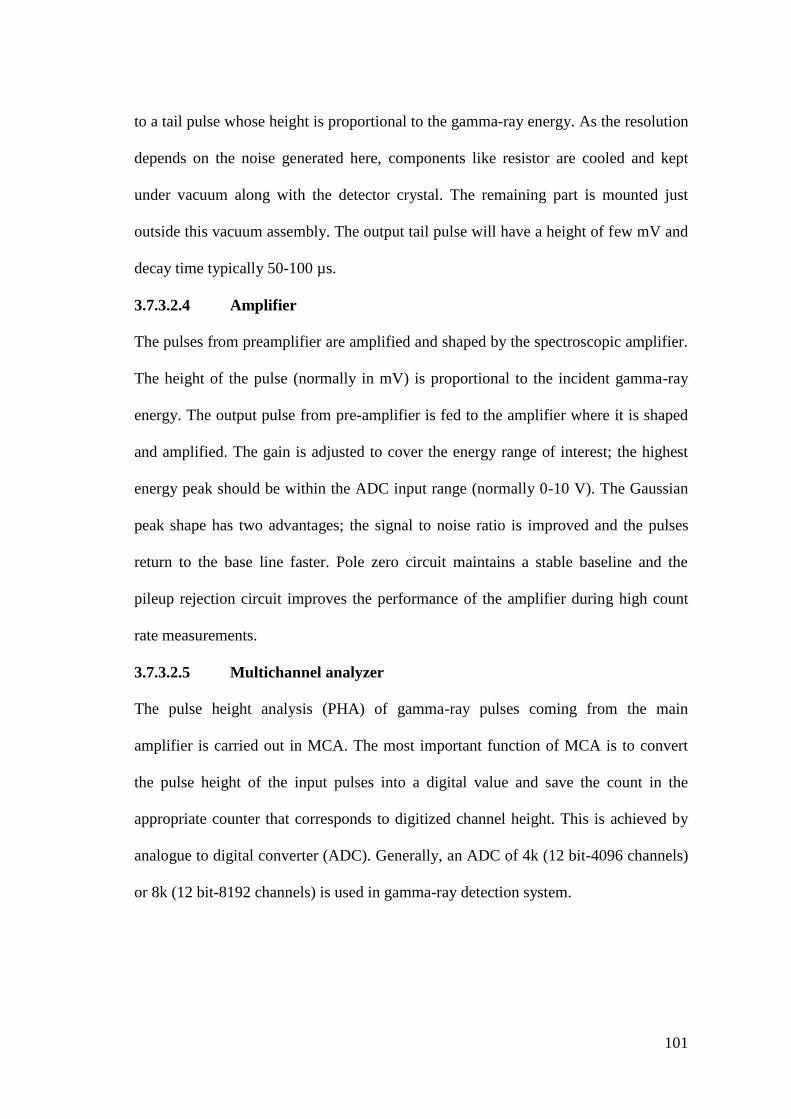
101
to a tail pulse whose height is proportional to the gamma-ray energy. As the resolution
depends on the noise generated here, components like resistor are cooled and kept
under vacuum along with the detector crystal. The remaining part is mounted just
outside this vacuum assembly. The output tail pulse will have a height of few mV and
decay time typically 50-100 µs.
3.7.3.2.4 Amplifier
The pulses from preamplifier are amplified and shaped by the spectroscopic amplifier.
The height of the pulse (normally in mV) is proportional to the incident gamma-ray
energy. The output pulse from pre-amplifier is fed to the amplifier where it is shaped
and amplified. The gain is adjusted to cover the energy range of interest; the highest
energy peak should be within the ADC input range (normally 0-10 V). The Gaussian
peak shape has two advantages; the signal to noise ratio is improved and the pulses
return to the base line faster. Pole zero circuit maintains a stable baseline and the
pileup rejection circuit improves the performance of the amplifier during high count
rate measurements.
3.7.3.2.5 Multichannel analyzer
The pulse height analysis (PHA) of gamma-ray pulses coming from the main
amplifier is carried out in MCA. The most important function of MCA is to convert
the pulse height of the input pulses into a digital value and save the count in the
appropriate counter that corresponds to digitized channel height. This is achieved by
analogue to digital converter (ADC). Generally, an ADC of 4k (12 bit-4096 channels)
or 8k (12 bit-8192 channels) is used in gamma-ray detection system.
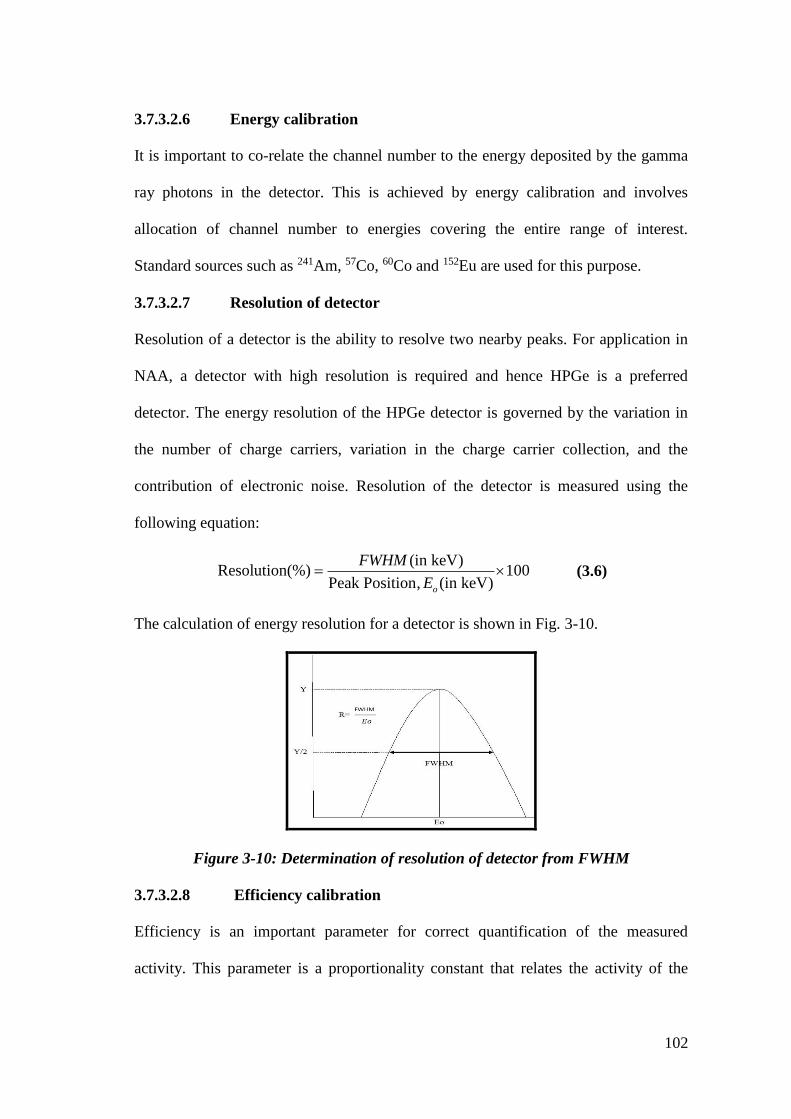
102
3.7.3.2.6 Energy calibration
It is important to co-relate the channel number to the energy deposited by the gamma
ray photons in the detector. This is achieved by energy calibration and involves
allocation of channel number to energies covering the entire range of interest.
Standard sources such as 241Am, 57Co, 60Co and 152Eu are used for this purpose.
3.7.3.2.7 Resolution of detector
Resolution of a detector is the ability to resolve two nearby peaks. For application in
NAA, a detector with high resolution is required and hence HPGe is a preferred
detector. The energy resolution of the HPGe detector is governed by the variation in
the number of charge carriers, variation in the charge carrier collection, and the
contribution of electronic noise. Resolution of the detector is measured using the
following equation:
(in keV)Resolution(%) 100
Peak Position, (in keV)o
FWHM
E (3.6)
The calculation of energy resolution for a detector is shown in Fig. 3-10.
Figure 3-10: Determination of resolution of detector from FWHM
3.7.3.2.8 Efficiency calibration
Efficiency is an important parameter for correct quantification of the measured
activity. This parameter is a proportionality constant that relates the activity of the
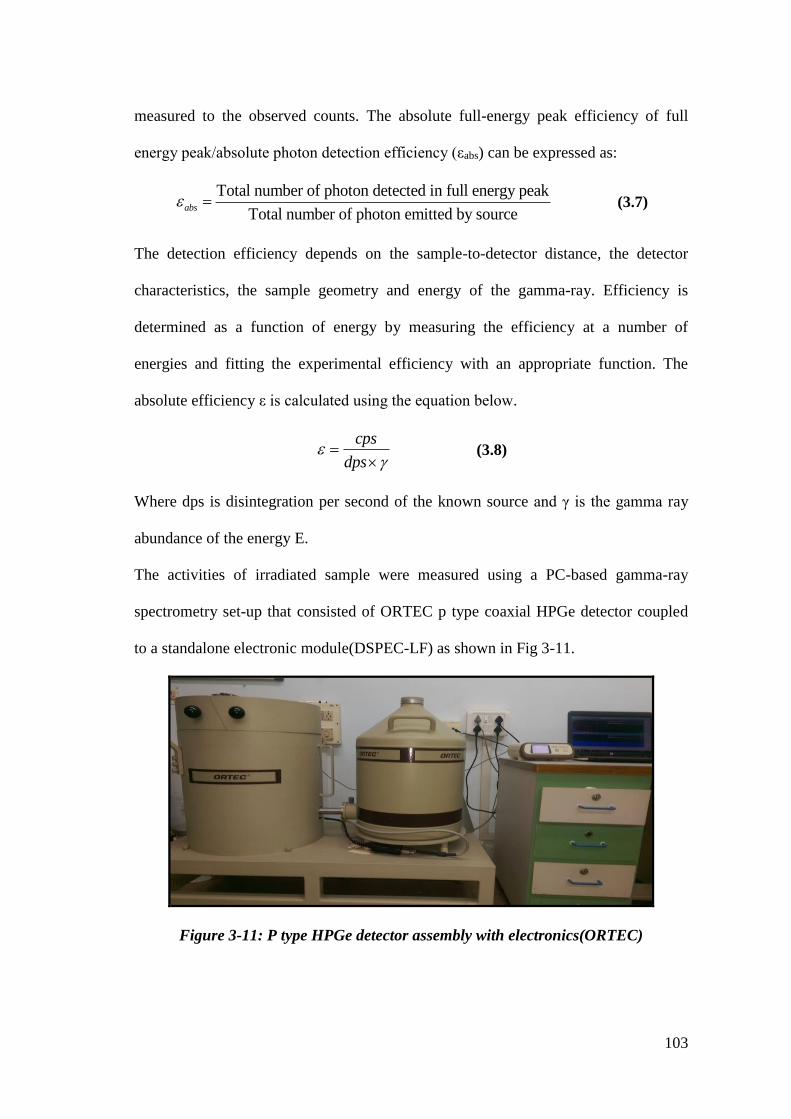
103
measured to the observed counts. The absolute full-energy peak efficiency of full
energy peak/absolute photon detection efficiency (εabs) can be expressed as:
Total number of photon detected in full energy peak
Total number of photon emitted by sourceabs (3.7)
The detection efficiency depends on the sample-to-detector distance, the detector
characteristics, the sample geometry and energy of the gamma-ray. Efficiency is
determined as a function of energy by measuring the efficiency at a number of
energies and fitting the experimental efficiency with an appropriate function. The
absolute efficiency ε is calculated using the equation below.
cps
dps
(3.8)
Where dps is disintegration per second of the known source and γ is the gamma ray
abundance of the energy E.
The activities of irradiated sample were measured using a PC-based gamma-ray
spectrometry set-up that consisted of ORTEC p type coaxial HPGe detector coupled
to a standalone electronic module(DSPEC-LF) as shown in Fig 3-11.
Figure 3-11: P type HPGe detector assembly with electronics(ORTEC)
104
For data acquisition and analysis, GammaVision-32 ver. 6 Software (ORTEC) was
used. Full peak efficiency calibration of the detector was performed by point
calibration sources of 133Ba, 137Cs, 60Co and 152Eu.
3.7.4 High Resolution (HR) ICP MS
An ICP-MS consists of the following components and the schematic diagram of an
ICP MS system is shown below (Fig 3-12).
Figure 3-12: Schematic diagram of an ICP- MS[174]
3.7.4.1 Sample introduction system
The important components of a sample introduction system are nebulizer and spray
chamber which introduces samples into the system. Liquid sample is broken into
small droplets and introduced into the argon plasma. The liquid sample is introduced
by a peristaltic pump or through self-aspiration to a nebulizer where aerosol of fine
droplets is produced which is then passed through a spray chamber. The spray
chamber separates the aerosols or the droplets according to the size. Only the small
droplets created by the nebulizer are allowed to enter the plasma and larger droplets
are discarded.
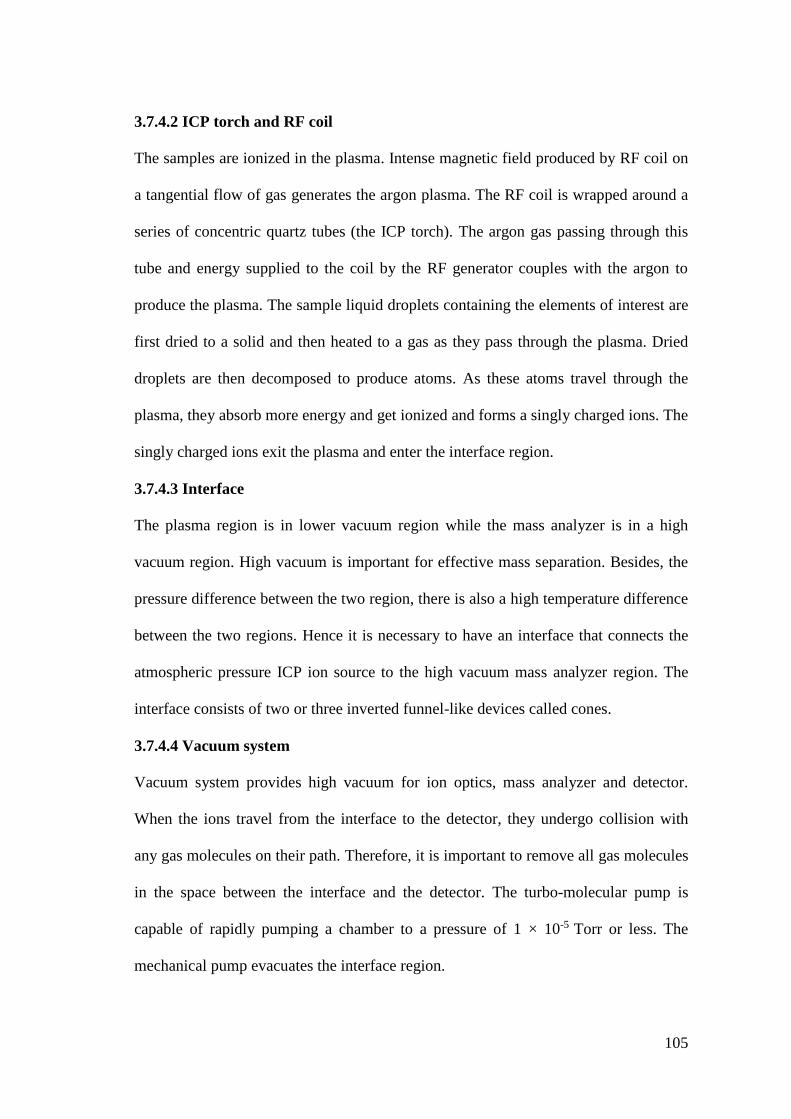
105
3.7.4.2 ICP torch and RF coil
The samples are ionized in the plasma. Intense magnetic field produced by RF coil on
a tangential flow of gas generates the argon plasma. The RF coil is wrapped around a
series of concentric quartz tubes (the ICP torch). The argon gas passing through this
tube and energy supplied to the coil by the RF generator couples with the argon to
produce the plasma. The sample liquid droplets containing the elements of interest are
first dried to a solid and then heated to a gas as they pass through the plasma. Dried
droplets are then decomposed to produce atoms. As these atoms travel through the
plasma, they absorb more energy and get ionized and forms a singly charged ions. The
singly charged ions exit the plasma and enter the interface region.
3.7.4.3 Interface
The plasma region is in lower vacuum region while the mass analyzer is in a high
vacuum region. High vacuum is important for effective mass separation. Besides, the
pressure difference between the two region, there is also a high temperature difference
between the two regions. Hence it is necessary to have an interface that connects the
atmospheric pressure ICP ion source to the high vacuum mass analyzer region. The
interface consists of two or three inverted funnel-like devices called cones.
3.7.4.4 Vacuum system
Vacuum system provides high vacuum for ion optics, mass analyzer and detector.
When the ions travel from the interface to the detector, they undergo collision with
any gas molecules on their path. Therefore, it is important to remove all gas molecules
in the space between the interface and the detector. The turbo-molecular pump is
capable of rapidly pumping a chamber to a pressure of 1 × 10⁻⁵ Torr or less. The
mechanical pump evacuates the interface region.
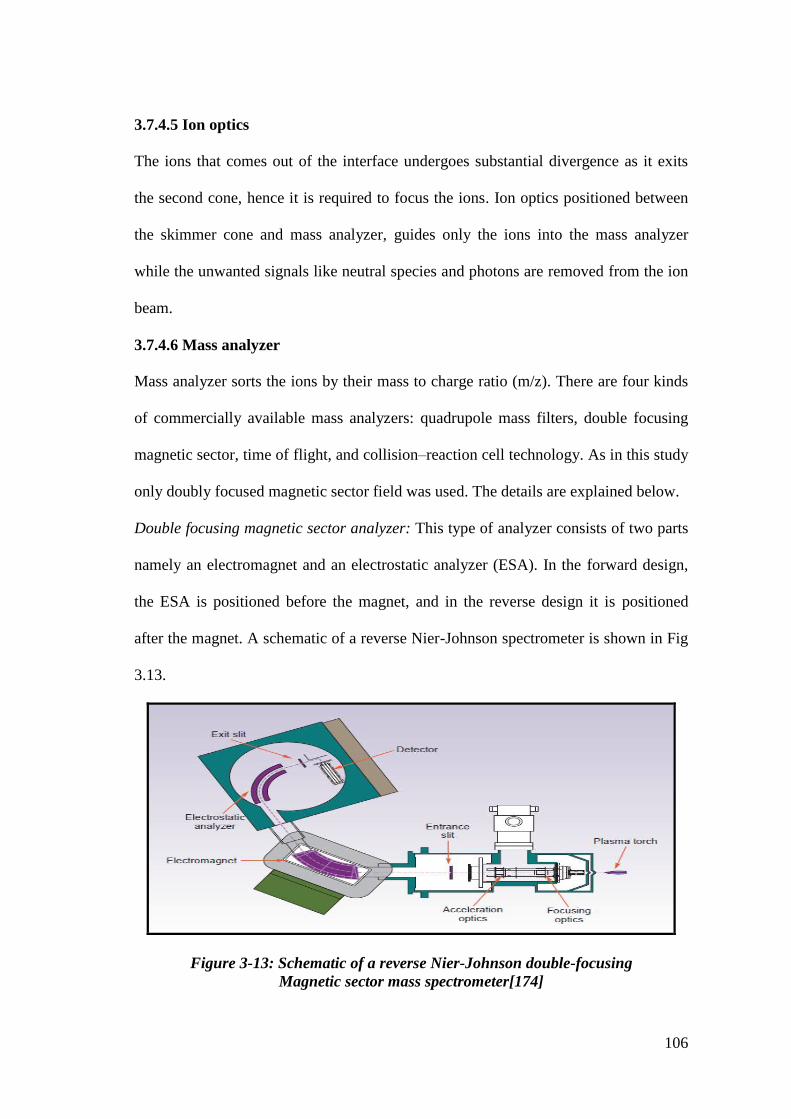
106
3.7.4.5 Ion optics
The ions that comes out of the interface undergoes substantial divergence as it exits
the second cone, hence it is required to focus the ions. Ion optics positioned between
the skimmer cone and mass analyzer, guides only the ions into the mass analyzer
while the unwanted signals like neutral species and photons are removed from the ion
beam.
3.7.4.6 Mass analyzer
Mass analyzer sorts the ions by their mass to charge ratio (m/z). There are four kinds
of commercially available mass analyzers: quadrupole mass filters, double focusing
magnetic sector, time of flight, and collision–reaction cell technology. As in this study
only doubly focused magnetic sector field was used. The details are explained below.
Double focusing magnetic sector analyzer: This type of analyzer consists of two parts
namely an electromagnet and an electrostatic analyzer (ESA). In the forward design,
the ESA is positioned before the magnet, and in the reverse design it is positioned
after the magnet. A schematic of a reverse Nier-Johnson spectrometer is shown in Fig
3.13.
Figure 3-13: Schematic of a reverse Nier-Johnson double-focusing
Magnetic sector mass spectrometer[174]
107
The magnetic field, has a mass dispersive and direction focusing and focuses all the
ions with diverging angles of motion from the entrance slit. The ESA, which is only
dispersive with respect to ion energy, then focuses the ions onto the exit slit, where the
detector is positioned. If the energy dispersion of the magnet and ESA are equal in
magnitude but opposite in direction, they will focus both ion angles (first focusing)
and ion energies (second or double focusing), when combined together. Changing the
electrical field in the opposite direction during the cycle time of the magnet, has the
effect of freezing the mass for detection. Then as soon as a certain magnetic field
strength is passed, the electric field is set to its original value and the next mass is
frozen. The voltage is varied on a per-mass basis, allowing the operator to scan only
the mass peaks of interest rather than the full mass range [175].
3.7.4.7 Detector system in ICP-MS
The ions exiting the mass spectrometer strike the active surface of the detector also
known as dynode to generate a measurable electronic signal. The dynode, releases an
electron each time an ion strikes it and an amplification process is initiated. The
electrons released from the first dynode strike a second dynode where more electrons
are released. This cascading of electrons continues until a measurable pulse is created.
By counting the pulses generated by the detector, the system counts the ions that hit
the first dynode. The detectors used in commercial instruments are capable of a wide
dynamic range using a dual mode, which includes both digital and analog modes.
3.7.4.8 Data handling and system controller
Data handling and system controller controls all aspects of instrument control and data
handling to obtain final concentration results.
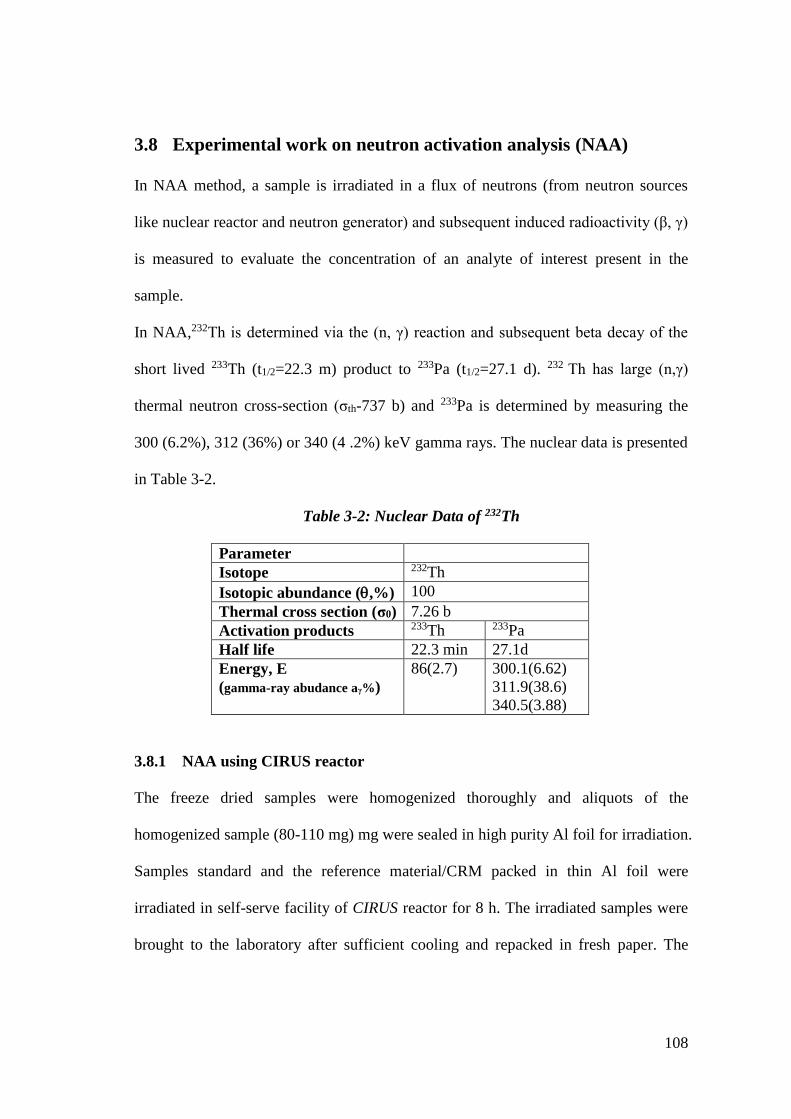
108
3.8 Experimental work on neutron activation analysis (NAA)
In NAA method, a sample is irradiated in a flux of neutrons (from neutron sources
like nuclear reactor and neutron generator) and subsequent induced radioactivity (β, γ)
is measured to evaluate the concentration of an analyte of interest present in the
sample.
In NAA,232Th is determined via the (n, γ) reaction and subsequent beta decay of the
short lived 233Th (t1/2=22.3 m) product to 233Pa (t1/2=27.1 d). 232 Th has large (n,γ)
thermal neutron cross-section (σth-737 b) and 233Pa is determined by measuring the
300 (6.2%), 312 (36%) or 340 (4 .2%) keV gamma rays. The nuclear data is presented
in Table 3-2.
Table 3-2: Nuclear Data of 232Th
Parameter
Isotope 232Th
Isotopic abundance (,%) 100
Thermal cross section (σ0) 7.26 b
Activation products 233Th 233Pa
Half life 22.3 min 27.1d
Energy, E
(gamma-ray abudance aγ%)
86(2.7) 300.1(6.62)
311.9(38.6)
340.5(3.88)
3.8.1 NAA using CIRUS reactor
The freeze dried samples were homogenized thoroughly and aliquots of the
homogenized sample (80-110 mg) mg were sealed in high purity Al foil for irradiation.
Samples standard and the reference material/CRM packed in thin Al foil were
irradiated in self-serve facility of CIRUS reactor for 8 h. The irradiated samples were
brought to the laboratory after sufficient cooling and repacked in fresh paper. The
109
sample masses of repacked samples were noted and were mounted on clean counting
plates using piece of paper below the sample to avoid contamination of the plate.
3.8.2 NAA using Dhruva reactor
Long as well as short time irradiation facilities are available at Dhruva reactor at tray
rod position and PCF respectively. The samples were irradiated for 7 d in the tray rod
position. The irradiated samples were brought to the laboratory after sufficient cooling
(30 d). As the freeze dried vegetation samples contained moisture content, the samples
and CRM along with the Al foil were melted and fused into one solid mass. The
samples were then irradiated in tray rod position for three days and still the problem
persisted for some samples. Hence the samples were ashed to remove any residual
moisture. The ashed samples were then packed in thicker Al foil and irradiated for 3 d
and this attempt was successful. The method was then optimized for irradiation with
three different certified reference methods.
The gamma ray activities of the samples were measured by a high-resolution gamma
spectrometer consisting of a 50% P-type HPGe detector. The spectrum analysis was
done using Gamma-vision software for evaluating the peak area under the energy of
interest. The concentrations of Th in the samples were determined by relative method
of INAA using the Eq.2.11.
Quality Control
For good quality assurance and measurements, standard reference material (SRM)
obtained from National Institute of Standards and Technology (NIST), USA was
analyzed. The expected sensitivity (counts µg-1) and its standard deviation (σ) were
established by replicate sample analyses of SRMs. Precision and accuracy of the
110
method was checked. The precision of the method was calculated by evaluating the
percentage relative standard deviation ( %RSD = P)
100P
(3.9)
where σ is the standard deviation of replicates and µ is the arithmetic mean.
The accuracy in terms of percentage deviation (Z) was measured by comparing the
measured value (Ameas) from the certified values (Acert) of the NIST Standard as
100meas cert
cert
A AZ
A
(3.10)
3.9 Experimental work using HR ICP MS
232Th contents in water samples were determined in 5 L of water sample using HR
ICP MS. The water was filtered and acidified with addition of conc. HNO3 and
brought to the laboratory. Urine samples (24 h) were collected from volunteers from
the study area belonging to different age groups and gender. In the laboratory, known
quantity of 229Th was spiked for tracer recovery analysis for the radiochemical
separation procedure.
Sample co-precipitation: 20 mL con. HNO3, 200 mg calcium carrier and 15ml
phosphoric acid were added to each sample (water and urine) and digested on hot
plate. The pH was adjusted to ∼9.5 with addition of concentrated ammonium
hydroxide to precipitate calcium phosphate. Samples were centrifuged at 3500 rpm
and the supernatant was discarded, the precipitate was rinsed twice with 20 ml of
water and centrifuged again at 3500 rpm. The precipitate was then dissolved in 10ml
conc. HNO3 and evaporated to dryness. The residue was then dissolved in 8M HNO3.
This column load solution was subjected to column separation.
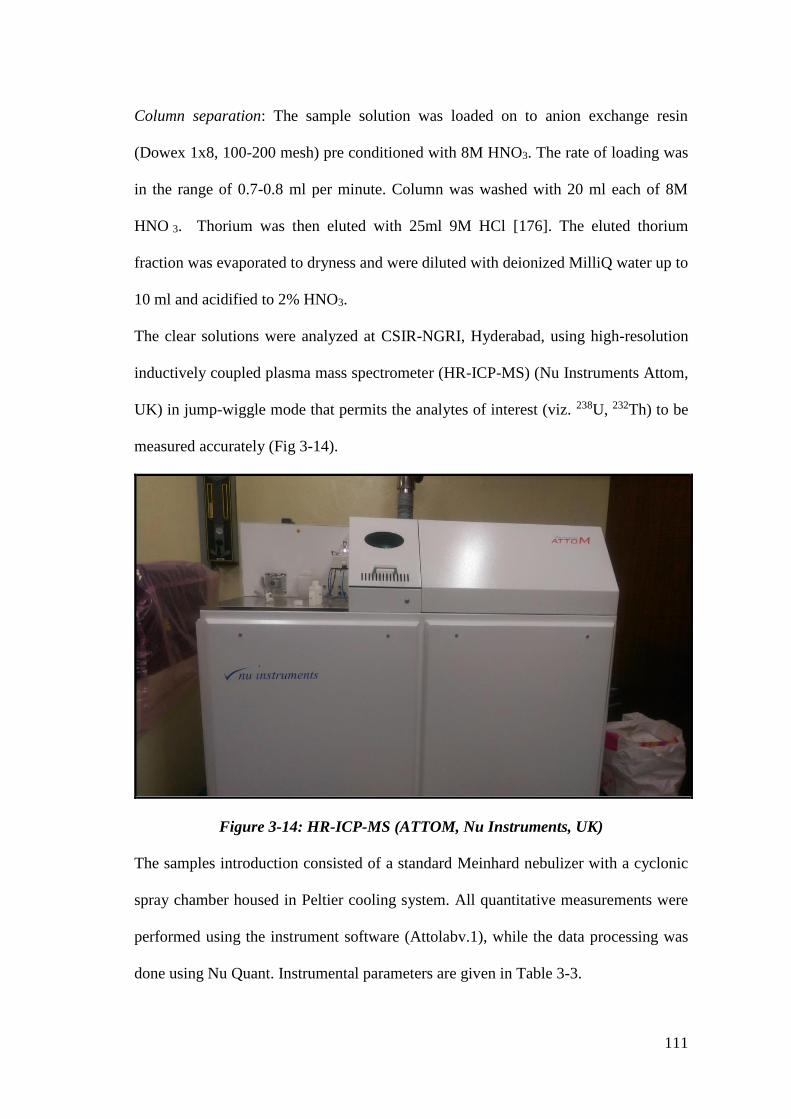
111
Column separation: The sample solution was loaded on to anion exchange resin
(Dowex 1x8, 100-200 mesh) pre conditioned with 8M HNO3. The rate of loading was
in the range of 0.7-0.8 ml per minute. Column was washed with 20 ml each of 8M
HNO 3. Thorium was then eluted with 25ml 9M HCl [176]. The eluted thorium
fraction was evaporated to dryness and were diluted with deionized MilliQ water up to
10 ml and acidified to 2% HNO3.
The clear solutions were analyzed at CSIR-NGRI, Hyderabad, using high-resolution
inductively coupled plasma mass spectrometer (HR-ICP-MS) (Nu Instruments Attom,
UK) in jump-wiggle mode that permits the analytes of interest (viz. 238U, 232Th) to be
measured accurately (Fig 3-14).
Figure 3-14: HR-ICP-MS (ATTOM, Nu Instruments, UK)
The samples introduction consisted of a standard Meinhard nebulizer with a cyclonic
spray chamber housed in Peltier cooling system. All quantitative measurements were
performed using the instrument software (Attolabv.1), while the data processing was
done using Nu Quant. Instrumental parameters are given in Table 3-3.
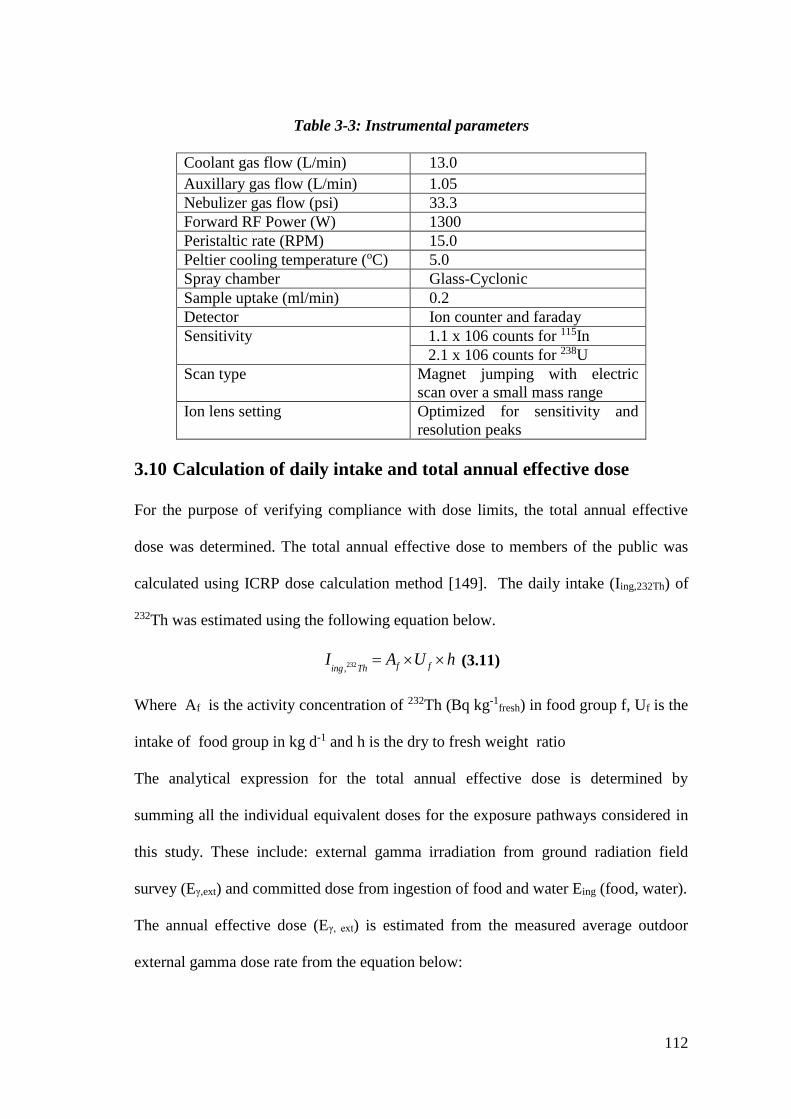
112
Table 3-3: Instrumental parameters
Coolant gas flow (L/min) 13.0
Auxillary gas flow (L/min) 1.05
Nebulizer gas flow (psi) 33.3
Forward RF Power (W) 1300
Peristaltic rate (RPM) 15.0
Peltier cooling temperature (oC) 5.0
Spray chamber Glass-Cyclonic
Sample uptake (ml/min) 0.2
Detector Ion counter and faraday
Sensitivity 1.1 x 10⁶ counts for 115In
2.1 x 10⁶ counts for 238U
Scan type Magnet jumping with electric
scan over a small mass range
Ion lens setting Optimized for sensitivity and
resolution peaks
3.10 Calculation of daily intake and total annual effective dose
For the purpose of verifying compliance with dose limits, the total annual effective
dose was determined. The total annual effective dose to members of the public was
calculated using ICRP dose calculation method [149]. The daily intake (Iing,232Th) of
232Th was estimated using the following equation below.
232, f fing ThI A U h (3.11)
Where Af is the activity concentration of 232Th (Bq kg-1fresh) in food group f, Uf is the
intake of food group in kg d-1 and h is the dry to fresh weight ratio
The analytical expression for the total annual effective dose is determined by
summing all the individual equivalent doses for the exposure pathways considered in
this study. These include: external gamma irradiation from ground radiation field
survey (Eγ,ext) and committed dose from ingestion of food and water Eing (food, water).
The annual effective dose (Eγ, ext) is estimated from the measured average outdoor
external gamma dose rate from the equation below:
113
, , expext ext extE D T F DCF (3.12)
Where Dγ,ext is the average outdoor external gamma dose rate μGyh-1, Texp is the
exposure duration per year, 8760 h (365 d), F is the outdoor occupancy factor of 0.2
and DCFext is the effective dose to absorbed dose conversion factor of 0.7 Sv Gy-1 for
environmental exposure to gamma rays.
The annual effective dose Eing (food, water) is estimated from the evaluated daily
intake of radionuclide(232Th) through food and water intake using following equation
232 232,, 365ing inging Th Th
E I DCF (3.13)
Where Iing,232Th is the daily intake of 232Th ( Bq d-1) and is the age
dependent ingestion dose coefficient in Sv Bq-1.
114
CHAPTER 4
Results and discussion
Dietary intake of Thorium using Market Basket Study
(MBS) method
115
4.1 Introduction:
The population is exposed to ionizing radiation from a number of sources, both
natural and man-made. Exposure to natural sources is described by two principal
routes namely external exposure from irradiation by radiation emitted from cosmic
rays, or radioactive decays of radionuclides of cosmogenic or terrestrial origin and
internal exposure following ingestion or inhalation of terrestrial radionuclides.
Radionuclide gets transferred through the environment by various possible pathways,
like atmospheric deposition, terrestrial pathway and aquatic pathway. Radionuclides
appear in plant either through direct atmospheric interception onto external plant
surfaces or indirectly from re-suspended material or through uptake of radionuclides
via the root system [70]. The level of terrestrial radiation varies from one geographical
location to another depending upon the variation of radionuclide in the soil which
largely depends on the local geological occurrence. Dietary intake can occur by
ingestion of vegetation into which radionuclides are incorporated via root uptake or by
atmospheric deposition on the vegetation. The animals grazing on this vegetation may
ingest this vegetation and also inadvertently ingest soil. The study area is well
investigated region for its high natural background radiation levels. The region has
high deposition of thorium rich monazite minerals in the beach soil. Due to higher
levels of radionuclides, the inhabitants of HBRAs may ingest more radionuclides
through their food and water; consequently, these individuals may have higher
ingestion levels of primordial radionuclides especially radionuclides from 232Th series
than residents from NBRAs. As the radiological and biological half-life of thorium is
high, it is important to assess the dose via ingestion of food and water.
116
Duplicate Diet Study (DDS) and Market Basket Study (MBS) are two commonly
employed methods for the study of daily dietary intake (DDI). MBS procedure is
based on analysis of representative food items purchased locally and on food
consumption statistics. MBS method helps to provide information on the contribution
by each food category and food to the radiation dose and also helps to identify
potential radioactivity carriers in case of emergency.
The main purpose of the present study was to determine the concentration in various
food categories namely cereals, pulses, vegetables, fruits, milk, fish and flesh food
like chicken and beef. The annual intake and the annual committed effective dose
were evaluated using the determined 232Th concentration.
4.2 Methodology:
The study area is situated in the state of Tamil Nadu, southern India. The area is
enclosed by latitude 8.12-8.33 o N and longitude 77.21-77.32 o E. The stretch of about
45 km of beach length from Idindakarai to Thengapattinam belonging to Kanyakumari
district was chosen for the study. The coastal areas have coconut cultivation and the
hinterlands have paddy and seasonal vegetable cultivation. NNMB, India gives the
average consumption rates for different states for different food categories [168].
Karungal farmers market and Manavalakurichi farmers market are wholesale market
from where the retail shopkeepers buy to sell in the respective small villages or blocks.
Hence samples (vegetables, fruits, meat and fish) were purchased from these
wholesale markets. The milk samples were purchased from local vendors in the
individual selected villages. Fish samples were also purchased from the fish harbor
located at Iniyam and Kadiapattinam village. Fig 4.1 shows the sampling location
(Karungal wholesale market), the locations of agricultural fields from where the
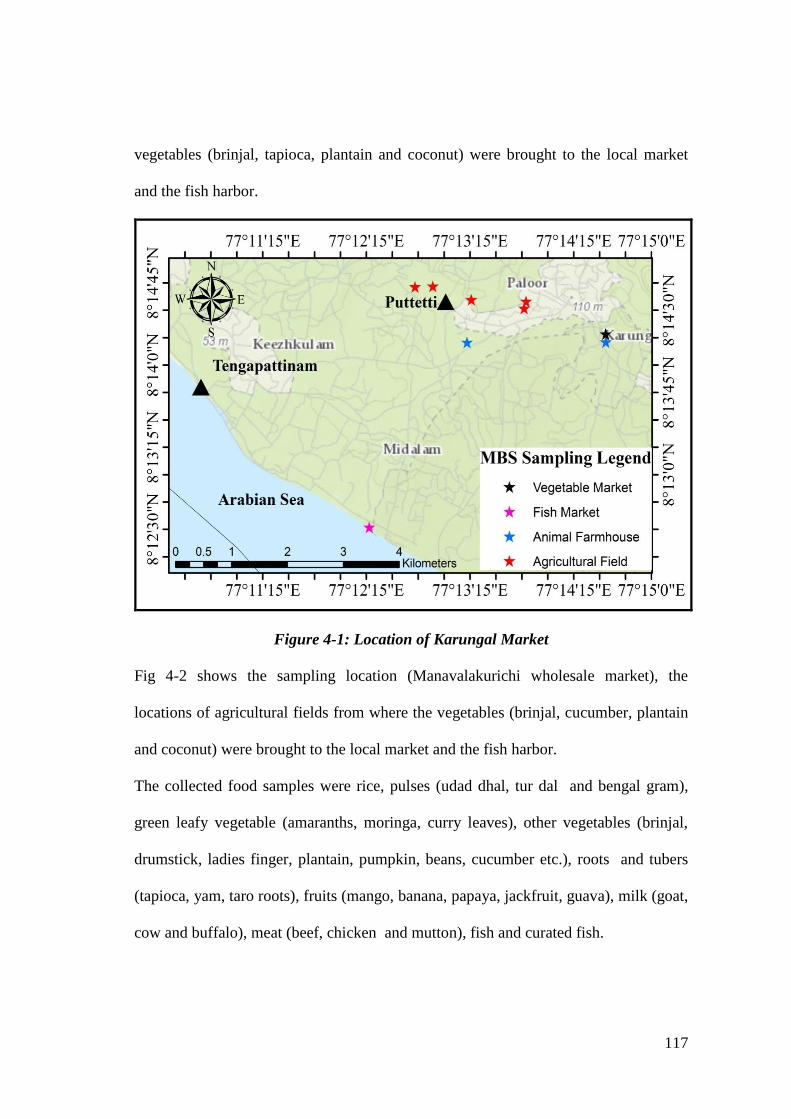
117
vegetables (brinjal, tapioca, plantain and coconut) were brought to the local market
and the fish harbor.
Figure 4-1: Location of Karungal Market
Fig 4-2 shows the sampling location (Manavalakurichi wholesale market), the
locations of agricultural fields from where the vegetables (brinjal, cucumber, plantain
and coconut) were brought to the local market and the fish harbor.
The collected food samples were rice, pulses (udad dhal, tur dal and bengal gram),
green leafy vegetable (amaranths, moringa, curry leaves), other vegetables (brinjal,
drumstick, ladies finger, plantain, pumpkin, beans, cucumber etc.), roots and tubers
(tapioca, yam, taro roots), fruits (mango, banana, papaya, jackfruit, guava), milk (goat,
cow and buffalo), meat (beef, chicken and mutton), fish and curated fish.
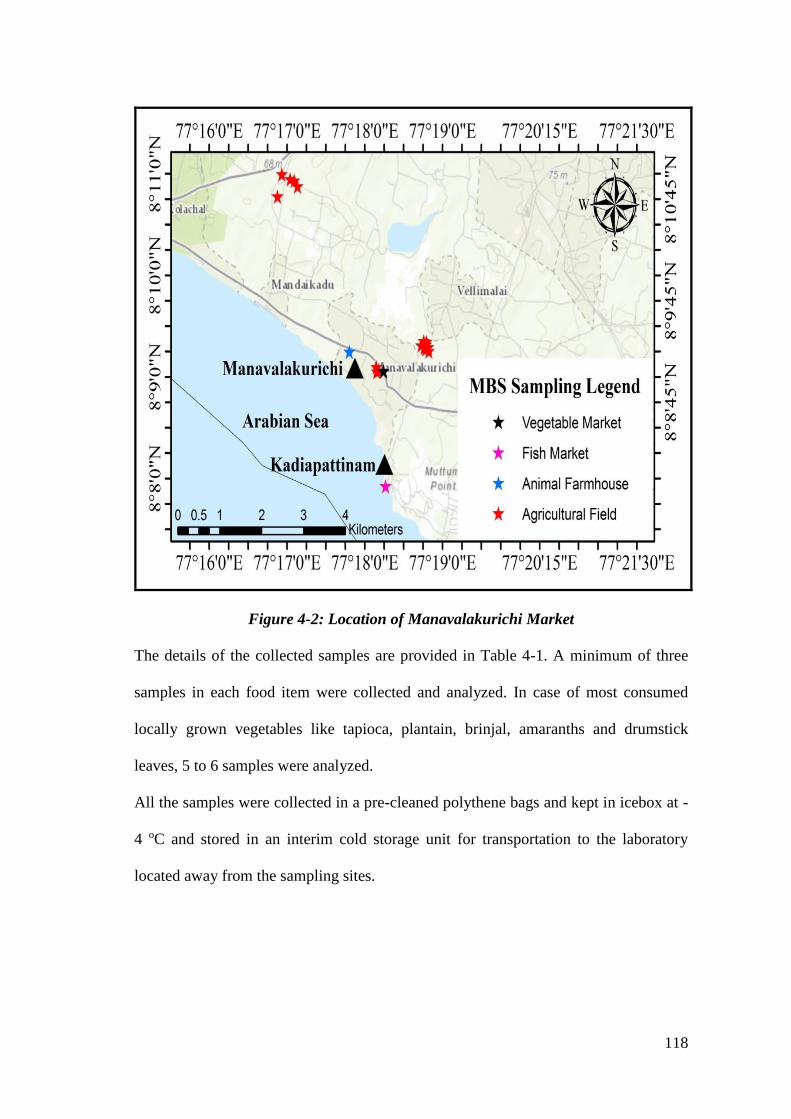
118
Figure 4-2: Location of Manavalakurichi Market
The details of the collected samples are provided in Table 4-1. A minimum of three
samples in each food item were collected and analyzed. In case of most consumed
locally grown vegetables like tapioca, plantain, brinjal, amaranths and drumstick
leaves, 5 to 6 samples were analyzed.
All the samples were collected in a pre-cleaned polythene bags and kept in icebox at -
4 oC and stored in an interim cold storage unit for transportation to the laboratory
located away from the sampling sites.
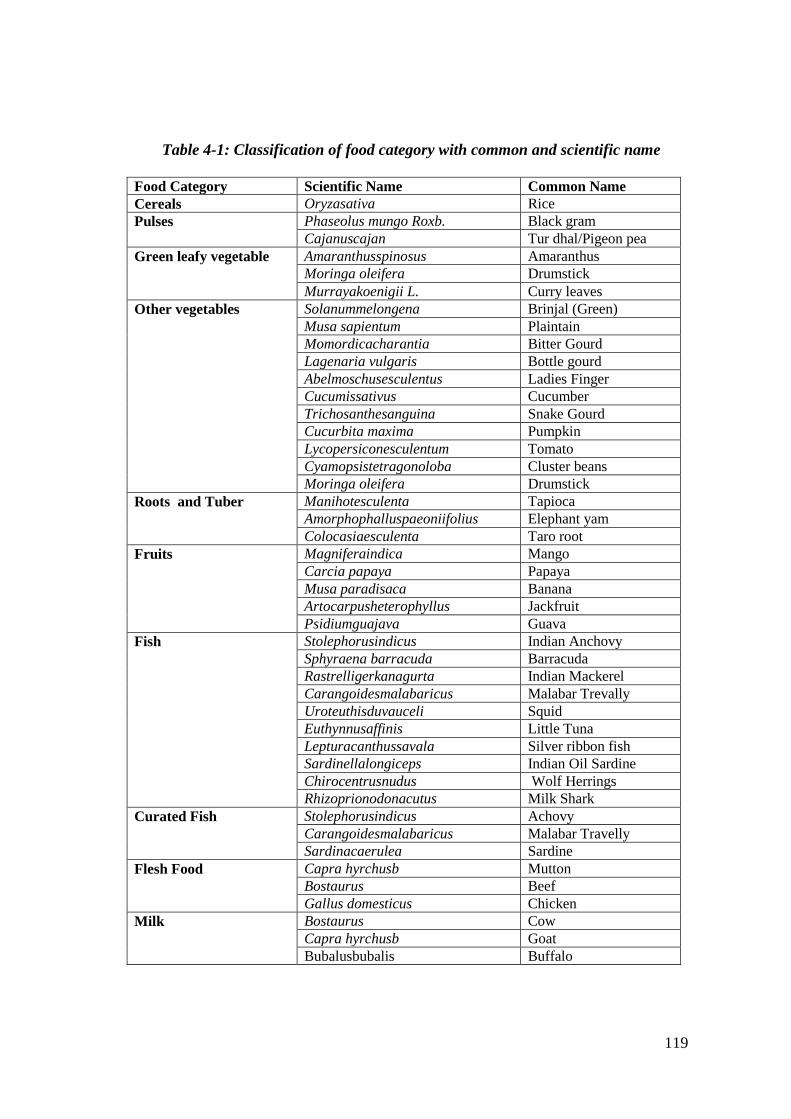
119
Table 4-1: Classification of food category with common and scientific name
Food Category Scientific Name Common Name
Cereals Oryzasativa Rice
Pulses Phaseolus mungo Roxb. Black gram
Cajanuscajan Tur dhal/Pigeon pea
Green leafy vegetable Amaranthusspinosus Amaranthus
Moringa oleifera Drumstick
Murrayakoenigii L. Curry leaves
Other vegetables Solanummelongena Brinjal (Green)
Musa sapientum Plaintain
Momordicacharantia Bitter Gourd
Lagenaria vulgaris Bottle gourd
Abelmoschusesculentus Ladies Finger
Cucumissativus Cucumber
Trichosanthesanguina Snake Gourd
Cucurbita maxima Pumpkin
Lycopersiconesculentum Tomato
Cyamopsistetragonoloba Cluster beans
Moringa oleifera Drumstick
Roots and Tuber Manihotesculenta Tapioca
Amorphophalluspaeoniifolius Elephant yam
Colocasiaesculenta Taro root
Fruits Magniferaindica Mango
Carcia papaya Papaya
Musa paradisaca Banana
Artocarpusheterophyllus Jackfruit
Psidiumguajava Guava
Fish Stolephorusindicus Indian Anchovy
Sphyraena barracuda Barracuda
Rastrelligerkanagurta Indian Mackerel
Carangoidesmalabaricus Malabar Trevally
Uroteuthisduvauceli Squid
Euthynnusaffinis Little Tuna
Lepturacanthussavala Silver ribbon fish
Sardinellalongiceps Indian Oil Sardine
Chirocentrusnudus Wolf Herrings
Rhizoprionodonacutus Milk Shark
Curated Fish Stolephorusindicus Achovy
Carangoidesmalabaricus Malabar Travelly
Sardinacaerulea Sardine
Flesh Food Capra hyrchusb Mutton
Bostaurus Beef
Gallus domesticus Chicken
Milk Bostaurus Cow
Capra hyrchusb Goat
Bubalusbubalis Buffalo
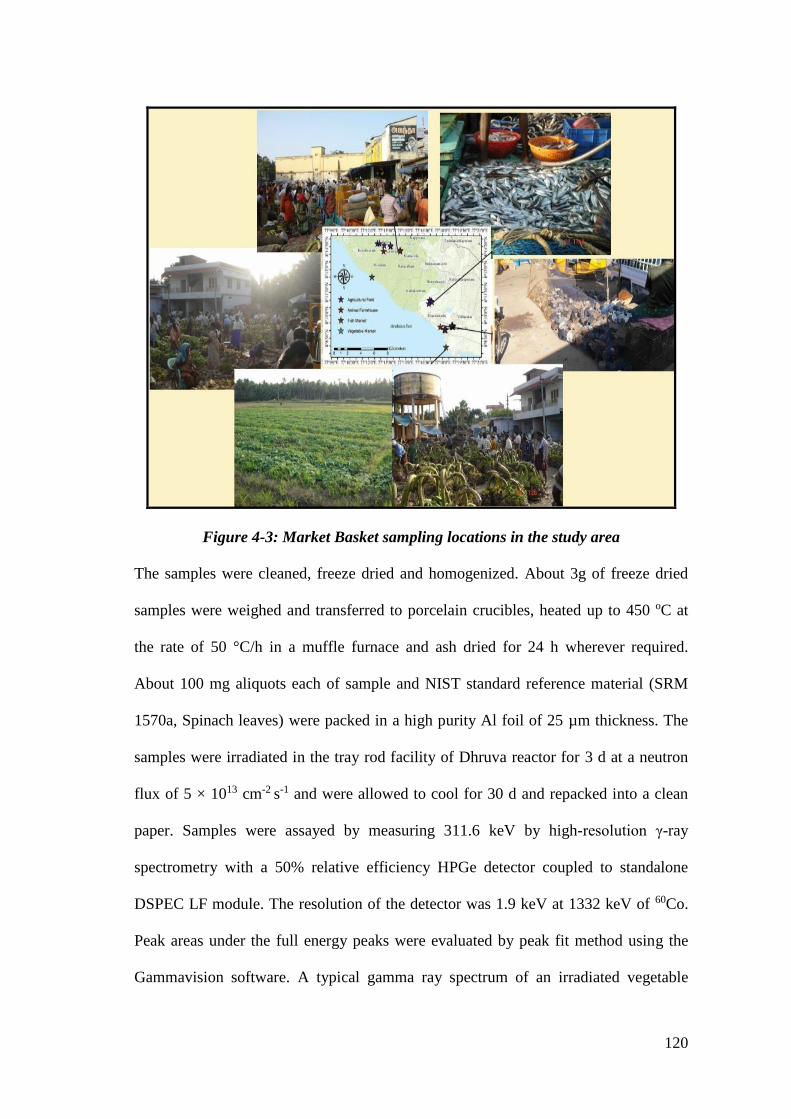
120
Figure 4-3: Market Basket sampling locations in the study area
The samples were cleaned, freeze dried and homogenized. About 3g of freeze dried
samples were weighed and transferred to porcelain crucibles, heated up to 450 oC at
the rate of 50 °C/h in a muffle furnace and ash dried for 24 h wherever required.
About 100 mg aliquots each of sample and NIST standard reference material (SRM
1570a, Spinach leaves) were packed in a high purity Al foil of 25 µm thickness. The
samples were irradiated in the tray rod facility of Dhruva reactor for 3 d at a neutron
flux of 5 × 1013 cm-2 s-1 and were allowed to cool for 30 d and repacked into a clean
paper. Samples were assayed by measuring 311.6 keV by high-resolution γ-ray
spectrometry with a 50% relative efficiency HPGe detector coupled to standalone
DSPEC LF module. The resolution of the detector was 1.9 keV at 1332 keV of 60Co.
Peak areas under the full energy peaks were evaluated by peak fit method using the
Gammavision software. A typical gamma ray spectrum of an irradiated vegetable
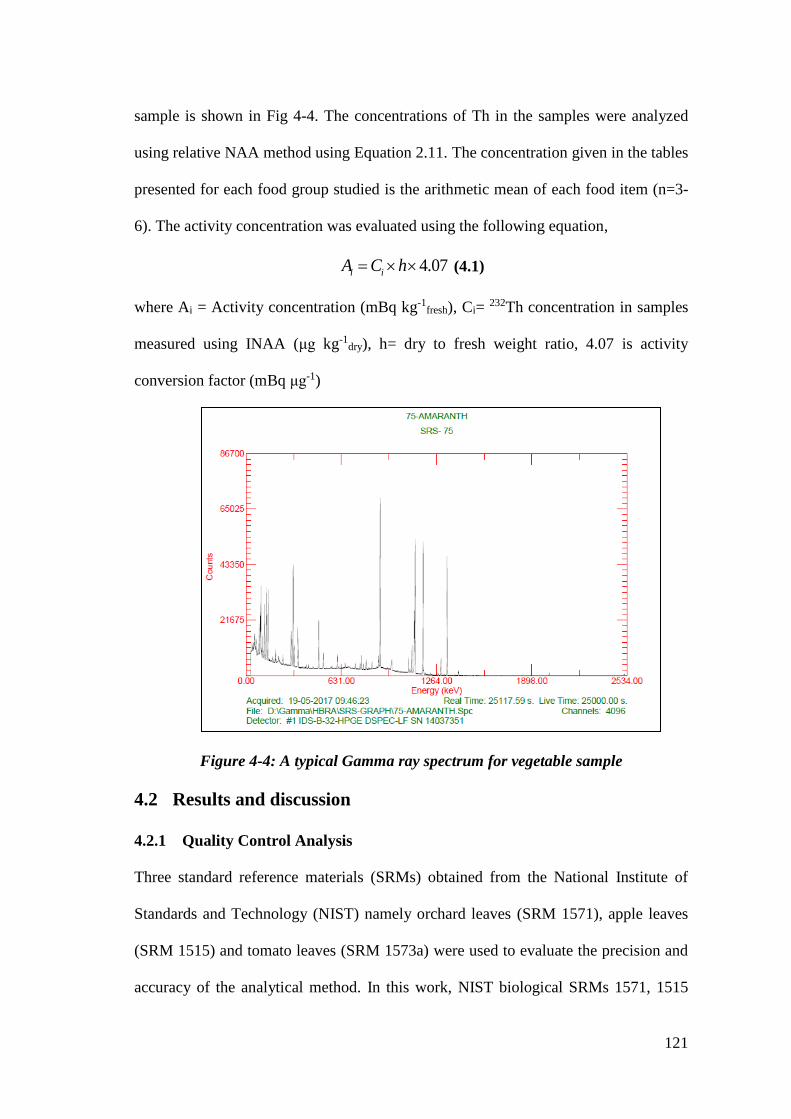
121
sample is shown in Fig 4-4. The concentrations of Th in the samples were analyzed
using relative NAA method using Equation 2.11. The concentration given in the tables
presented for each food group studied is the arithmetic mean of each food item (n=3-
6). The activity concentration was evaluated using the following equation,
4.07i iA C h (4.1)
where Ai = Activity concentration (mBq kg-1fresh), Ci= 232Th concentration in samples
measured using INAA (μg kg-1dry), h= dry to fresh weight ratio, 4.07 is activity
conversion factor (mBq μg-1)
Figure 4-4: A typical Gamma ray spectrum for vegetable sample
4.2 Results and discussion
4.2.1 Quality Control Analysis
Three standard reference materials (SRMs) obtained from the National Institute of
Standards and Technology (NIST) namely orchard leaves (SRM 1571), apple leaves
(SRM 1515) and tomato leaves (SRM 1573a) were used to evaluate the precision and
accuracy of the analytical method. In this work, NIST biological SRMs 1571, 1515
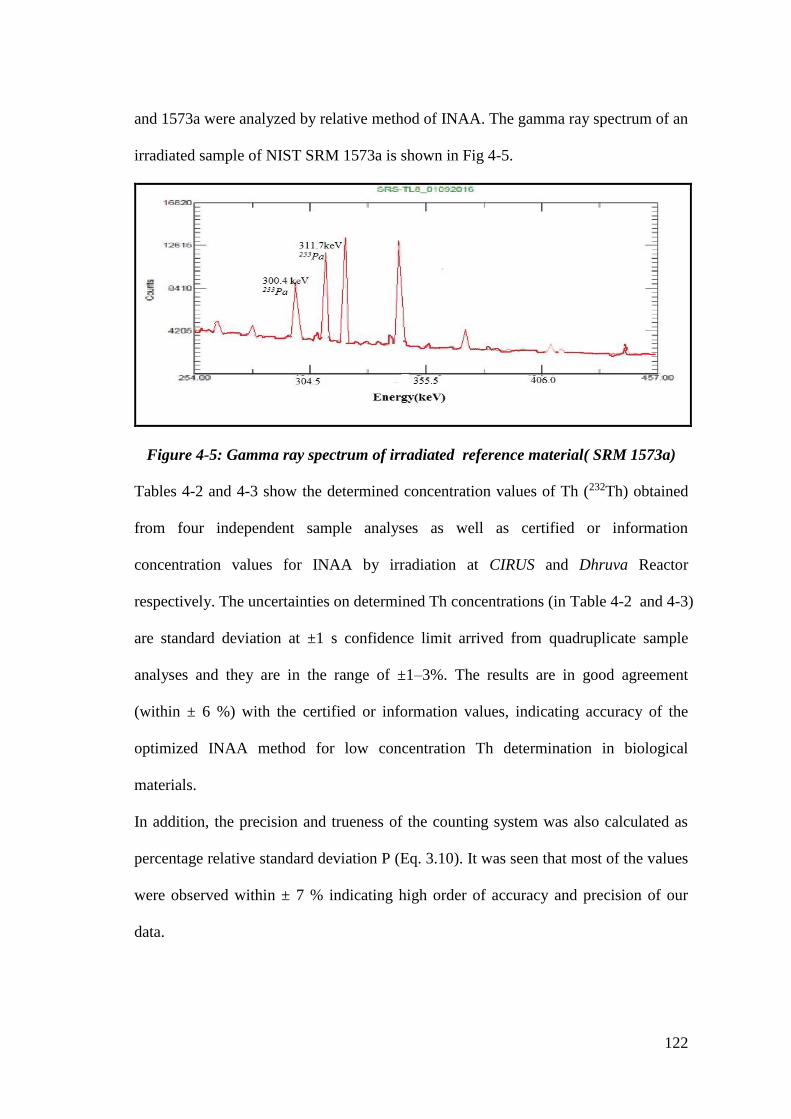
122
and 1573a were analyzed by relative method of INAA. The gamma ray spectrum of an
irradiated sample of NIST SRM 1573a is shown in Fig 4-5.
Figure 4-5: Gamma ray spectrum of irradiated reference material( SRM 1573a)
Tables 4-2 and 4-3 show the determined concentration values of Th (232Th) obtained
from four independent sample analyses as well as certified or information
concentration values for INAA by irradiation at CIRUS and Dhruva Reactor
respectively. The uncertainties on determined Th concentrations (in Table 4-2 and 4-3)
are standard deviation at ±1 s confidence limit arrived from quadruplicate sample
analyses and they are in the range of ±1–3%. The results are in good agreement
(within ± 6 %) with the certified or information values, indicating accuracy of the
optimized INAA method for low concentration Th determination in biological
materials.
In addition, the precision and trueness of the counting system was also calculated as
percentage relative standard deviation P (Eq. 3.10). It was seen that most of the values
were observed within ± 7 % indicating high order of accuracy and precision of our
data.
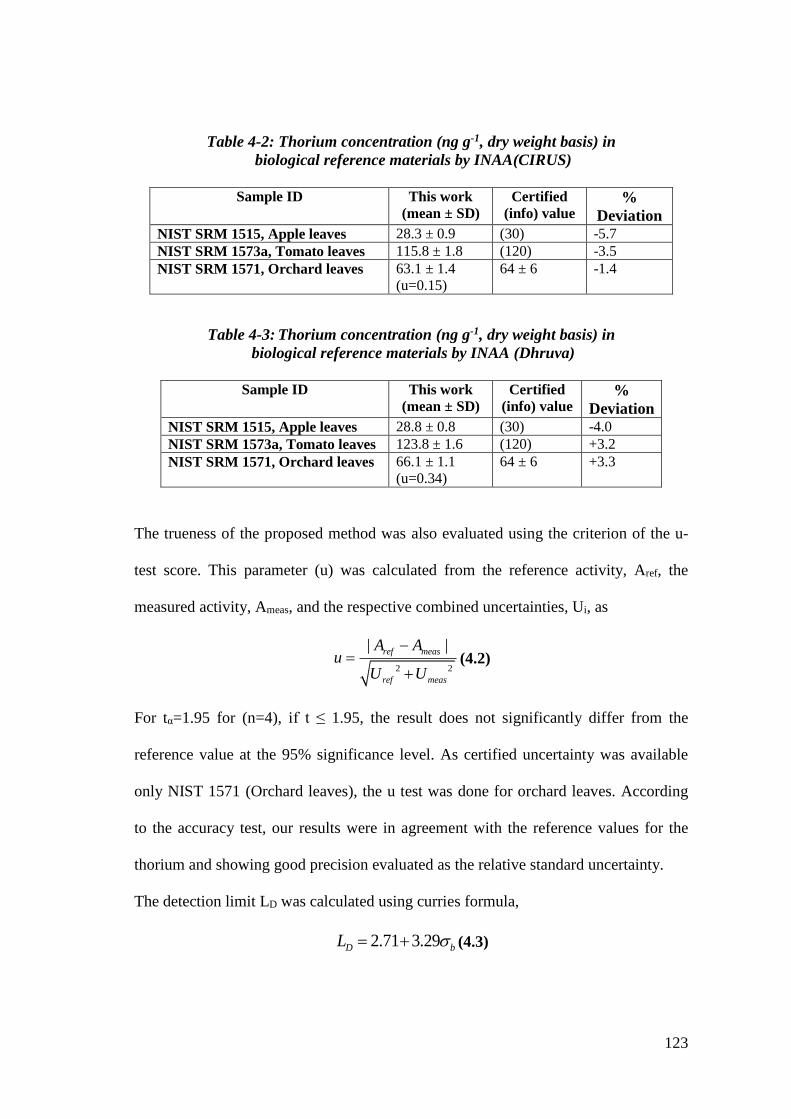
123
Table 4-2: Thorium concentration (ng g-1, dry weight basis) in
biological reference materials by INAA(CIRUS)
Sample ID This work
(mean ± SD)
Certified
(info) value %
Deviation
NIST SRM 1515, Apple leaves 28.3 ± 0.9 (30) -5.7
NIST SRM 1573a, Tomato leaves 115.8 ± 1.8 (120) -3.5
NIST SRM 1571, Orchard leaves 63.1 ± 1.4
(u=0.15)
64 ± 6 -1.4
Table 4-3: Thorium concentration (ng g-1, dry weight basis) in
biological reference materials by INAA (Dhruva)
Sample ID This work
(mean ± SD)
Certified
(info) value %
Deviation
NIST SRM 1515, Apple leaves 28.8 ± 0.8 (30) -4.0
NIST SRM 1573a, Tomato leaves 123.8 ± 1.6 (120) +3.2
NIST SRM 1571, Orchard leaves 66.1 ± 1.1
(u=0.34)
64 ± 6 +3.3
The trueness of the proposed method was also evaluated using the criterion of the u-
test score. This parameter (u) was calculated from the reference activity, Aref, the
measured activity, Ameas, and the respective combined uncertainties, Ui, as
2 2
| |ref meas
ref meas
A Au
U U
(4.2)
For tα=1.95 for (n=4), if t ≤ 1.95, the result does not significantly differ from the
reference value at the 95% significance level. As certified uncertainty was available
only NIST 1571 (Orchard leaves), the u test was done for orchard leaves. According
to the accuracy test, our results were in agreement with the reference values for the
thorium and showing good precision evaluated as the relative standard uncertainty.
The detection limit LD was calculated using curries formula,
2.71 3.29D bL (4.3)
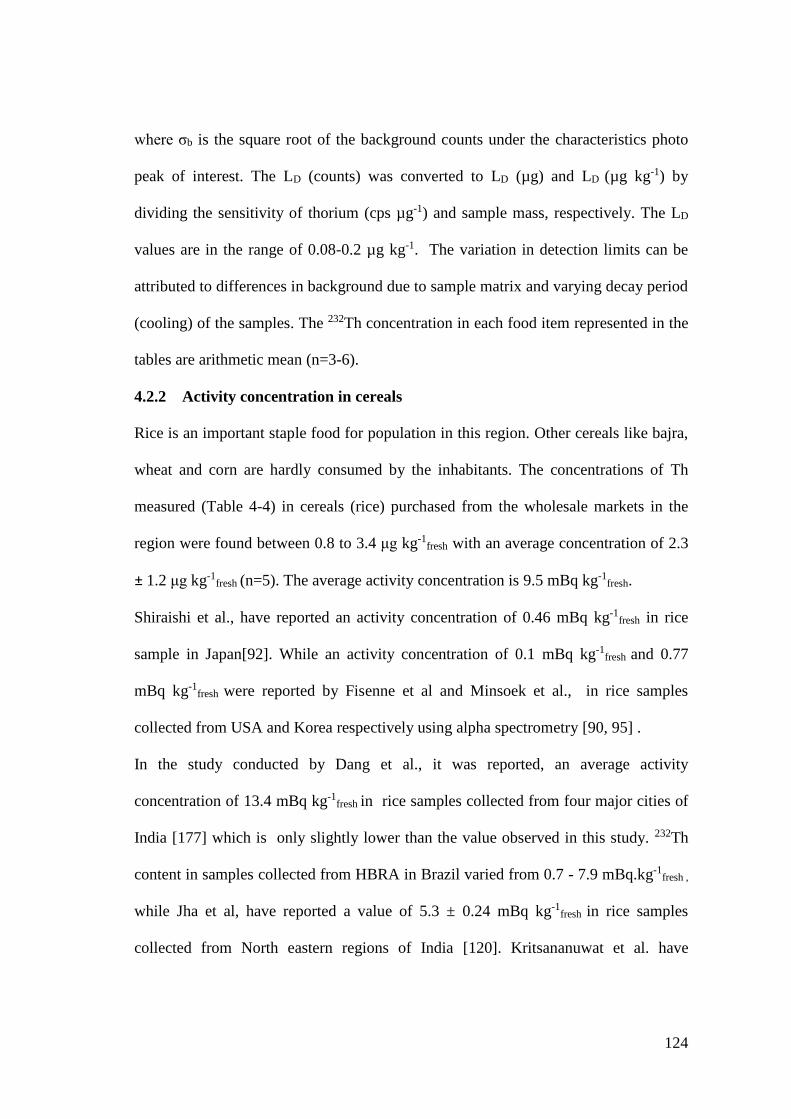
124
where σb is the square root of the background counts under the characteristics photo
peak of interest. The LD (counts) was converted to LD (µg) and LD (µg kg-1) by
dividing the sensitivity of thorium (cps µg-1) and sample mass, respectively. The LD
values are in the range of 0.08-0.2 µg kg-1. The variation in detection limits can be
attributed to differences in background due to sample matrix and varying decay period
(cooling) of the samples. The 232Th concentration in each food item represented in the
tables are arithmetic mean (n=3-6).
4.2.2 Activity concentration in cereals
Rice is an important staple food for population in this region. Other cereals like bajra,
wheat and corn are hardly consumed by the inhabitants. The concentrations of Th
measured (Table 4-4) in cereals (rice) purchased from the wholesale markets in the
region were found between 0.8 to 3.4 μg kg-1fresh with an average concentration of 2.3
± 1.2 μg kg-1fresh (n=5). The average activity concentration is 9.5 mBq kg-1
fresh.
Shiraishi et al., have reported an activity concentration of 0.46 mBq kg-1fresh in rice
sample in Japan[92]. While an activity concentration of 0.1 mBq kg-1fresh and 0.77
mBq kg-1fresh were reported by Fisenne et al and Minsoek et al., in rice samples
collected from USA and Korea respectively using alpha spectrometry [90, 95] .
In the study conducted by Dang et al., it was reported, an average activity
concentration of 13.4 mBq kg-1fresh in rice samples collected from four major cities of
India [177] which is only slightly lower than the value observed in this study. 232Th
content in samples collected from HBRA in Brazil varied from 0.7 - 7.9 mBq.kg-1fresh ,
while Jha et al, have reported a value of 5.3 ± 0.24 mBq kg-1fresh in rice samples
collected from North eastern regions of India [120]. Kritsananuwat et al. have
125
estimated 232Th content in rice grains grown in Thailand using ICP MS and reported a
concentration range of 1-11 mBq kg-1fresh [181].
The average activity levels of 232Th in rice was found to be comparable to those
reported from Brazil, north east India and Thailand but was higher compared to values
reported from Japan, USA and Korea. Many investigations on thorium content in rice
samples were carried out using gamma ray spectrometry. Activity concentrations in
samples of 1800, 6150 and 5020 mBq kg-1fresh were reported by Lenka et al., Olomo
et al and Mlwilo et al., [43, 112, 178] respectively. The concentrations in the samples
are found to be much higher than those reported using other methods like α-
spectrometry, ICP-MS or NAA.
4.2.3 Activity concentration in pulses
Table 4-4 gives the 232Th contents in pulses. Black grams and pigeon peas are two
important pulses consumed by the people in the study region on a daily basis. Pulses
are not cultivated in this region but are brought in by the traders from other parts of
the Tamilnadu State.
The concentration in black gram ranged from 5.1 to 7.1 μg kg-1fresh with an average
activity concentration of 24.7 ± 5.8 mBq kg-1fresh (n=3). The thorium content in pigeon
pea varied from 1.2 to 1.9 μg kg-1fresh with an average activity concentration of 6.3 ±
2.1 mBq kg-1fresh (n=3). The average concentration of Th in pulses was 15.5 mBq kg-
1fresh. An average concentration of 2.92 ± 0.19 mBq kg-1
fresh was reported by Shiraishi
et al, in bean products from Japan [92]. Dang et al., have reported an activity
concentration of 8.4 mBq kg-1fresh which is slightly lower than that found in the
present work [177]. The activity concentration in the pulses in this study is less than
the reported value of El-Sweify (51-87 mBq.kg-1 fresh ) who used INAA to estimate
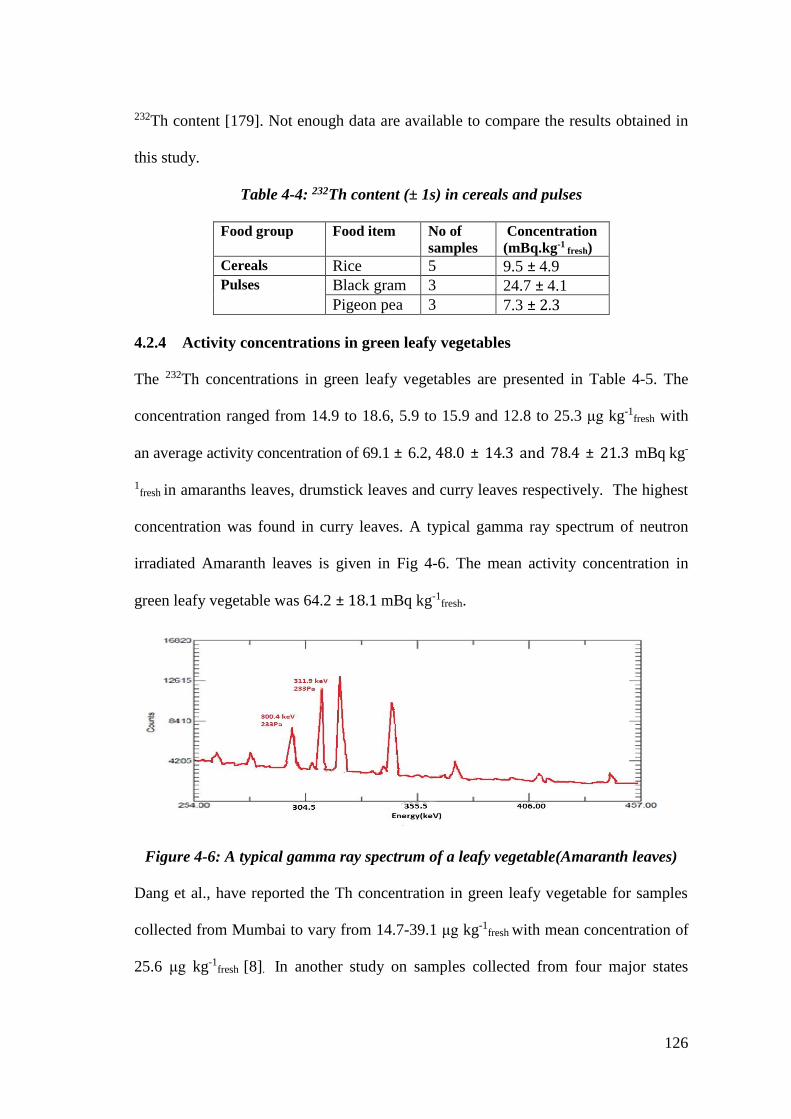
126
232Th content [179]. Not enough data are available to compare the results obtained in
this study.
Table 4-4: 232Th content (± 1s) in cereals and pulses
Food group Food item No of
samples
Concentration
(mBq.kg-1 fresh)
Cereals Rice 5 9.5 ± 4.9 Pulses Black gram 3 24.7 ± 4.1
Pigeon pea 3 7.3 ± 2.3
4.2.4 Activity concentrations in green leafy vegetables
The 232Th concentrations in green leafy vegetables are presented in Table 4-5. The
concentration ranged from 14.9 to 18.6, 5.9 to 15.9 and 12.8 to 25.3 μg kg-1fresh with
an average activity concentration of 69.1 ± 6.2, 48.0 ± 14.3 and 78.4 ± 21.3 mBq kg-
1fresh in amaranths leaves, drumstick leaves and curry leaves respectively. The highest
concentration was found in curry leaves. A typical gamma ray spectrum of neutron
irradiated Amaranth leaves is given in Fig 4-6. The mean activity concentration in
green leafy vegetable was 64.2 ± 18.1 mBq kg-1fresh.
Figure 4-6: A typical gamma ray spectrum of a leafy vegetable(Amaranth leaves)
Dang et al., have reported the Th concentration in green leafy vegetable for samples
collected from Mumbai to vary from 14.7-39.1 μg kg-1fresh with mean concentration of
25.6 μg kg-1fresh [8]. In another study on samples collected from four major states
127
(West Bengal, Kerala, Punjab and Maharashtra), the average concentration of 8.5
mBq kg-1fresh was reported [177].
The mean activity concentration was higher than the values reported from Japan (6.13
mBq kg-1fresh), Poland (1.5-5.9 mBq kg-1
fresh) and Korea (0.15-5.08 mBq kg-1fresh). In a
recent study much higher values were reported by a group of French investigators.
The investigators have reported values ranging from 5.25 to 156.9 mBq kg-1fresh for
lettuce [107]. Concentrations of 232Th in lettuces from various kitchen gardens near a
uranium mine in Portugal was studied by Carvalho et al., and they have reported a
range of 2.2 to 28.5 mBq kg-1fresh [180].
Table 4-5: Activity concentration of 232Th (± 1s) in
Green leafy vegetables and roots and tubers
Food group Food item No of
samples
232Th
(μg kg-1dry)
Dry to
wet ratio
232Th
(mBq kg-1fresh
)
Green leafy
vegetable Amaranths 5 99.8 ± 8.9 0.17 69.1 ± 6.2
Drumstick 5 63.2 ± 19.5 0.19 48 ± 14.3
Curry leaves 4 53.5 ± 14.6 0.36 78.4 ± 21.4
Roots and
Tubers Tapioca 6 71.8 ± 19.3 0.30 87.7 ± 23.6
Elephant yam 3 74.6 ± 11.4 0.21 63.8 ± 9.7
Taro root 3 63.6 ± 8.5 0.41 106.1 ± 14.2
Th concentration in curry leaves were in the range reported by Choudhary et al., (9.33
to 115 ng g-1) [181]. Activity concentrations of 232Th in leafy vegetables were
measured by Jha et al., in samples collected from a proposed mining site and the
concentration ranged from 26.5 to 48.8 mBq kg-1fresh which is comparable to results
obtained in the present study [120].
Different mechanisms have been reported for foliar uptake in plants. The results of
study by Gaelelle et al., have proposed the mechanism for uptake of heavy elements
by leaves. The particles first deposits on the leaf surface, this particles undergo
chemical transformation to a secondary element containing phase and gets
128
accumulated on the circular ledges of stomata and anticlinal cell walls of
cuticles[182]. The deposition of radionuclides is further supported by occurrence of
epicutilar wax layer on the surface of leaves [183].
Many investigators have used gamma spectrometry to analyze 232Th concentration in
leafy vegetables. 232Th was determined by the peaks of 212Pb (239 keV), 208Tl (583
keV) and 228Ac (911 keV) which are daughter products in 232Th series. They have
reported higher values, for e.g., Arogunjo et al., have reported a value of 1279 mBq
kg-1fresh in spinach samples. This is mainly due to the difference in the mobility and
transfer rate of Ra and Th by plants.
Jeambrun et al., have reported that the activity concentration of 228Ra was higher than
that of 232Th in vegetation samples with value of 228Ra/232Th ratio ranging from 4 to 8
in lettuce. Similarly, the activity concentration of 228Th was also higher than that of
232Th with a 228Th/232Th ratio ranging from 1.5 to 2.2 in lettuce [168]. This enrichment
of 228Th compared to 232Th was also demonstrated by Pietrzak-Flis et al. and was
explained by in-growth of this radionuclide following the decay of 228Ra which is
added to the direct intake of 228Th [87]. 228Ra had always higher activity
concentrations compared to 232Th due to the lower mobility of thorium.
4.2.5 Activity concentration in other vegetables
Minimum of two samples in each vegetable was analyzed except for most consumed
locally grown vegetables like tapioca, plantain, brinjal, amaranth and drumstick leaves
where 5 to 6 samples were analyzed. The estimated 232Th concentration in vegetation
sample is presented in Table 4-6. Statistical analysis of data was performed by
MiniTab 18 (Minitab Inc.). The Anderson–Darling test was applied to test the
normality of 232Th in vegetable samples. 232Th concentrations were log-normally
129
distributed and are hence presented with geometric mean and range. Vegetable that
are typically consumed were purchased from local markets. The concentration in the
samples varied from 0.17 to 7.9 μg kg-1fresh with a geometric mean activity
concentration of 4.4 mBq kg-1fresh.
232Th concentrations were in the range (0.1– 33
mBq kg-1fresh) reported in the UNSCEAR report. The lowest concentration was found
in tomato and highest in brinjal samples.
Brinjal, plantain and drumstick are locally grown. There is a large scale cultivation of
brinjal in villages in the study area. The brinjal grown in the villages in and around
Manavalakurichi is sold in the wholesale farmer’s market of Karungal and
Manavalakurichi. The activity concentration in brinjal varied from 11.7 to 34.6 mBq
kg-1fresh. Brinjal samples that were purchased for the study were all cultivated in and
around Manavalakurichi area, hence 232Th content is higher compared to other
vegetables due to the higher concentration of 232Th in the soil. It is interesting to note
that there is a large variation in the 232Th in brinjal samples. As reported by Sauve et
al., all radionuclides have a high complexing ability to bind tightly to solid surfaces
[184]. 232Th in soil is absorbed by the organic matter present in soil and renders the
232Th non available for the plants which infers that the differences in the organic
content in the soil may have resulted in different uptake of 232Th into plant and
therefore a variation in the 232Th content in brinjal.
Bolca et al. have studied the difference in the soil properties and plant species resulted
in a variability in TF for a given radionuclide [185]. Pulhani et al., have also inferred
from their study that the transfer factor of an radionuclide greatly depends on the soil
properties [71]. A detailed study of the soil characteristics needs to be carried out to
substantiate the observation.
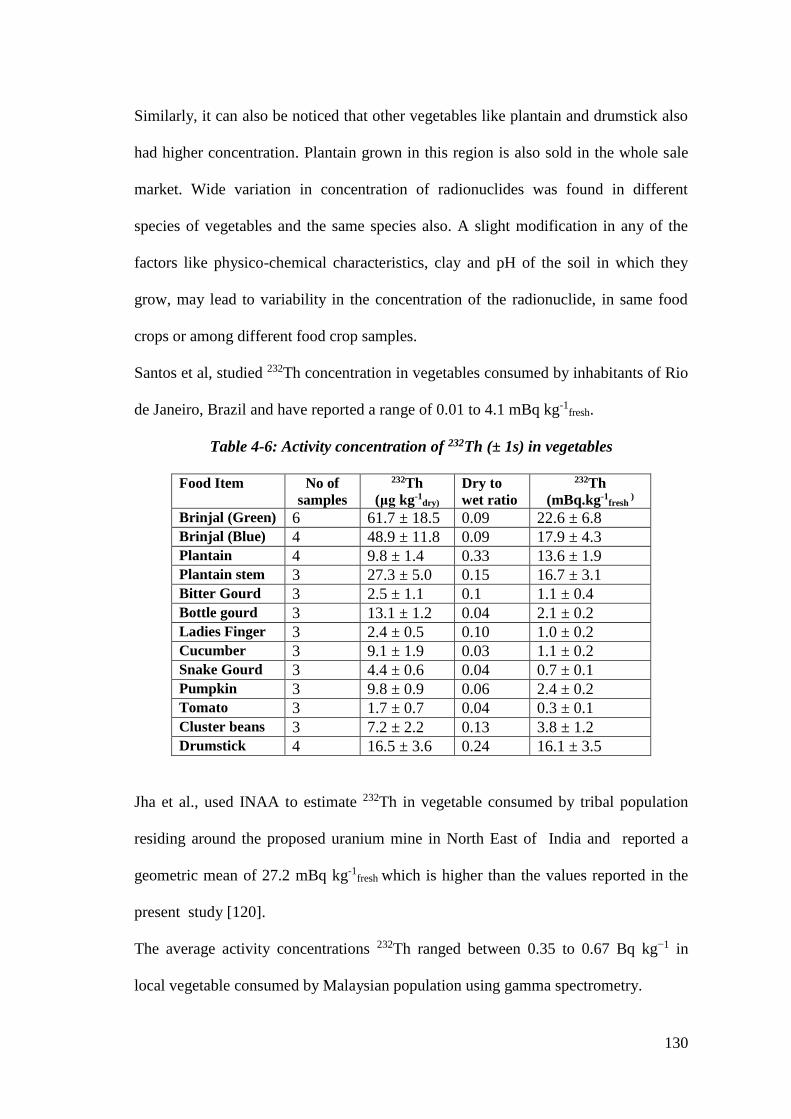
130
Similarly, it can also be noticed that other vegetables like plantain and drumstick also
had higher concentration. Plantain grown in this region is also sold in the whole sale
market. Wide variation in concentration of radionuclides was found in different
species of vegetables and the same species also. A slight modification in any of the
factors like physico-chemical characteristics, clay and pH of the soil in which they
grow, may lead to variability in the concentration of the radionuclide, in same food
crops or among different food crop samples.
Santos et al, studied 232Th concentration in vegetables consumed by inhabitants of Rio
de Janeiro, Brazil and have reported a range of 0.01 to 4.1 mBq kg-1fresh.
Table 4-6: Activity concentration of 232Th (± 1s) in vegetables
Food Item No of
samples
232Th
(μg kg-1dry)
Dry to
wet ratio
232Th
(mBq.kg-1fresh
)
Brinjal (Green) 6 61.7 ± 18.5 0.09 22.6 ± 6.8
Brinjal (Blue) 4 48.9 ± 11.8 0.09 17.9 ± 4.3
Plantain 4 9.8 ± 1.4 0.33 13.6 ± 1.9
Plantain stem 3 27.3 ± 5.0 0.15 16.7 ± 3.1
Bitter Gourd 3 2.5 ± 1.1 0.1 1.1 ± 0.4
Bottle gourd 3 13.1 ± 1.2 0.04 2.1 ± 0.2
Ladies Finger 3 2.4 ± 0.5 0.10 1.0 ± 0.2
Cucumber 3 9.1 ± 1.9 0.03 1.1 ± 0.2
Snake Gourd 3 4.4 ± 0.6 0.04 0.7 ± 0.1
Pumpkin 3 9.8 ± 0.9 0.06 2.4 ± 0.2
Tomato 3 1.7 ± 0.7 0.04 0.3 ± 0.1
Cluster beans 3 7.2 ± 2.2 0.13 3.8 ± 1.2
Drumstick 4 16.5 ± 3.6 0.24 16.1 ± 3.5
Jha et al., used INAA to estimate 232Th in vegetable consumed by tribal population
residing around the proposed uranium mine in North East of India and reported a
geometric mean of 27.2 mBq kg-1fresh which is higher than the values reported in the
present study [120].
The average activity concentrations 232Th ranged between 0.35 to 0.67 Bq kg−1 in
local vegetable consumed by Malaysian population using gamma spectrometry.
131
The activity concentration of cucumber was comparable with values reported by Flis
et al (0.75 mBq kg-1fresh ) but slightly higher than the value( 0.21 mBq kg-1
fresh )
reported by Minsoek et al [41, 95]. An activity of 0.3 mBq kg-1fresh in tomato was
reported by Flis et al., and is comparable with value (0.3 ± 0.1 mBq kg-1fresh) observed
in this study. Tomatoes available in the local markets are not cultivated in the study
area but are brought to the market from outside.
4.2.6 Activity concentration in Roots and Tubers
The 232Th content is high in tubers compared to other food samples of plant origin and
the value ranged between 15.4 – 26.9 μg kg-1fresh with an average activity
concentration of 90.9 ± 29.1 mBq kg-1fresh and is presented in Table 4-5. The highest
concentration was found in taro root (106.1 mBq kg-1fresh) and lowest concentration
was found in elephant yam. The tubers taro root and tapioca are usually thin and long
compared to yam hence can penetrate into soil with increased ability to absorb more
natural radionuclides in the soil.
The 232Th in tapioca varied from 15.9 to 26.9 μg kg-1fresh. This variation in the 232Th
content may be because of the varying time at which the tapioca was harvested. In an
investigation conducted by Asaduzzaman et al., on concentration of radionuclides in
tapioca with age, have concluded that the concentration increases with time [186].
Plants absorb radionuclides that have similar chemical behavior as the essential
nutrient. Therefore, radionuclides are transported to specific tissues based on the
function of the element in plant metabolism and which is often reflected in its higher
concentration in a particular part than others. According to Chen et al., there are
considerable differences in the uptake and trans-location of long-lived radionuclides
among different plant species [187].
132
There are many reports that support our observation that concentration of Th in roots
are much higher than in leaves and in seeds [192-193]. Shtangeeva, studied the uptake
of radionuclides by estimating the concentration in various parts of the plant and
concluded that plants grown in the radionuclide enriched soils demonstrated
significant increase in concentrations of Th and U in roots, while concentrations of the
radionuclides in upper plant parts were rather low [188].
In the soil system, radionuclides are distributed between various solid components and
soil solution. The bioavailable fraction for absorption by the plants are the soluble,
exchangeable and loosely adsorbed radionuclides found in the solid components and
soil solution. In a study conducted by Shanti et al., for estimation of radium isotopes
in food items using gamma ray spectrometry, they have also indicated that highest
concentration was observed in vegetables of root origin [132].
Shiraishi et al., have reported a concentration of 1.76 mBq.kg-1fresh in root and tubers
which is the highest among the vegetables consumed by Japanese population [92]. In
another study conducted by Kučera et al., Th content in vegetables was estimated
using INAA. The concentration of Th (274 μg kg-1dry) was highest in roots samples
[188]. Kritsananuwat et al, have also reported a higher concentration in root vegetable
(Galangal) in vegetables samples from Thailand[189]. The concentration in galanjal
was 2500 mBq kg-1fresh which is much higher than the concentration in other roots and
tubers found in this study. This may be due to the different absorption (uptake)
behaviors among various species.
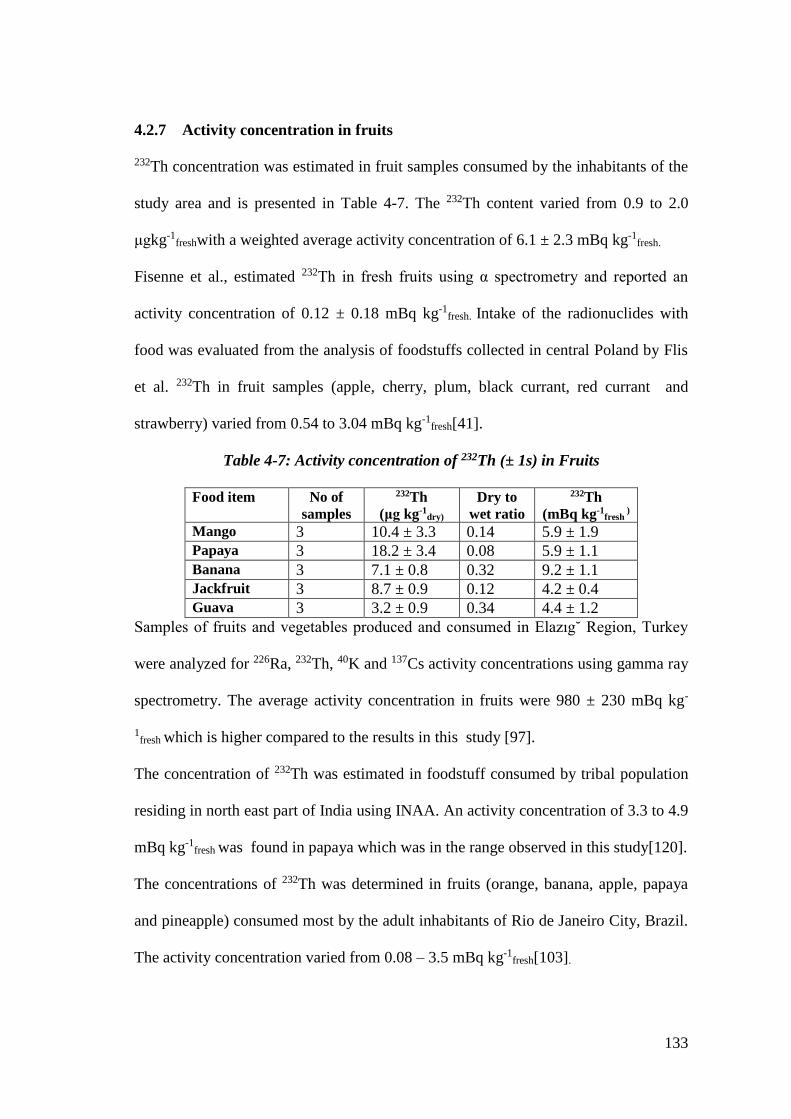
133
4.2.7 Activity concentration in fruits
232Th concentration was estimated in fruit samples consumed by the inhabitants of the
study area and is presented in Table 4-7. The 232Th content varied from 0.9 to 2.0
μgkg-1freshwith a weighted average activity concentration of 6.1 ± 2.3 mBq kg-1
fresh.
Fisenne et al., estimated 232Th in fresh fruits using α spectrometry and reported an
activity concentration of 0.12 ± 0.18 mBq kg-1fresh. Intake of the radionuclides with
food was evaluated from the analysis of foodstuffs collected in central Poland by Flis
et al. 232Th in fruit samples (apple, cherry, plum, black currant, red currant and
strawberry) varied from 0.54 to 3.04 mBq kg-1fresh[41].
Table 4-7: Activity concentration of 232Th (± 1s) in Fruits
Food item No of
samples
232Th
(μg kg-1dry)
Dry to
wet ratio
232Th
(mBq kg-1fresh
)
Mango 3 10.4 ± 3.3 0.14 5.9 ± 1.9
Papaya 3 18.2 ± 3.4 0.08 5.9 ± 1.1
Banana 3 7.1 ± 0.8 0.32 9.2 ± 1.1
Jackfruit 3 8.7 ± 0.9 0.12 4.2 ± 0.4
Guava 3 3.2 ± 0.9 0.34 4.4 ± 1.2
Samples of fruits and vegetables produced and consumed in Elazıg˘ Region, Turkey
were analyzed for 226Ra, 232Th, 40K and 137Cs activity concentrations using gamma ray
spectrometry. The average activity concentration in fruits were 980 ± 230 mBq kg-
1fresh which is higher compared to the results in this study [97].
The concentration of 232Th was estimated in foodstuff consumed by tribal population
residing in north east part of India using INAA. An activity concentration of 3.3 to 4.9
mBq kg-1fresh was found in papaya which was in the range observed in this study[120].
The concentrations of 232Th was determined in fruits (orange, banana, apple, papaya
and pineapple) consumed most by the adult inhabitants of Rio de Janeiro City, Brazil.
The activity concentration varied from 0.08 – 3.5 mBq kg-1fresh[103].
134
In another study conducted by Harb et al, 232Th was estimated in fruit samples using
gamma ray spectrometry. They have reported an activity concentration ranging from
10 to 240 mBq kg-1fresh.[98] . Similar trends were observed in studies that were
conducted using passive method like gamma ray spectrometry [190–192].
Activity concentrations of 238U, 232Th, 226Ra, 40K and 137Cs were measured in milk,
egg, fruit and fish samples collected around a proposed site for BARC facility at
Vishakhapatanam, India by Patra and co workers, and reported that the activity
concentration in the range of 100-2000 mBq kg-1fresh in fruits which is higher than
other results [193].
Thorium contents in fruits were the lowest among plant origin food stuff. Plants take
up and accumulate elements in their tissue through root and part of the element is
translocated to other plant parts. Nuclides can be deposited on the external plant
component directly from the atmosphere by wet or dry deposition, via resuspension
from soil, and via contamination from either aspersion or irrigation waters. In general,
roots serve as a natural barrier preventing the transport of many trace metals,
including radionuclides to upper plant parts. Hence concentration in fruits is less
compared to roots and shoots. Moreover, the rate of radionuclide translocations from
roots to shoots is probably species-dependent. It may be different for different species
and even different part of a plant [194].
4.2.8 Activity concentration in fish
The major occupation of the people in the study area is fishery. Fish is an integral part
of diet consumed by the population residing in this area. The fish consumed by the
population is mainly from sea. Activity concentrations in the different types of fish
purchased from the local market were determined and ranged from 3.9 to 20.8 μg kg-
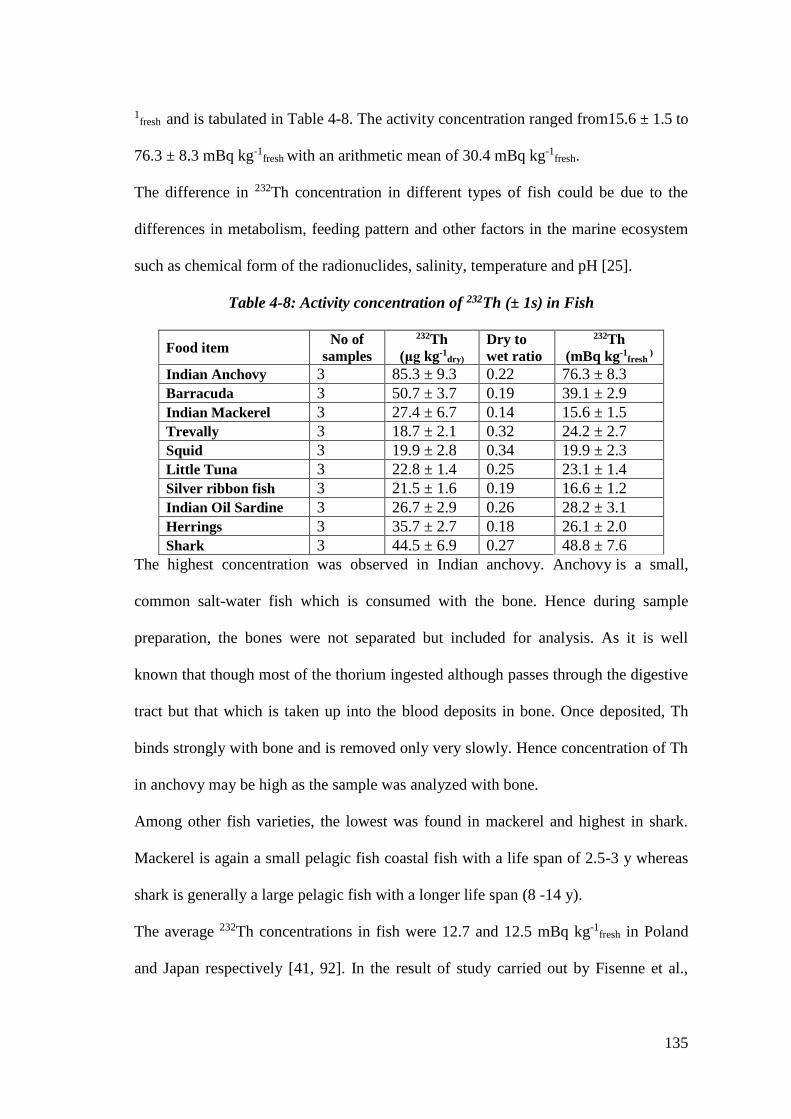
135
1fresh and is tabulated in Table 4-8. The activity concentration ranged from15.6 ± 1.5 to
76.3 ± 8.3 mBq kg-1fresh with an arithmetic mean of 30.4 mBq kg-1
fresh.
The difference in 232Th concentration in different types of fish could be due to the
differences in metabolism, feeding pattern and other factors in the marine ecosystem
such as chemical form of the radionuclides, salinity, temperature and pH [25].
Table 4-8: Activity concentration of 232Th (± 1s) in Fish
Food item No of
samples
232Th
(μg kg-1dry)
Dry to
wet ratio
232Th
(mBq kg-1fresh
)
Indian Anchovy 3 85.3 ± 9.3 0.22 76.3 ± 8.3
Barracuda 3 50.7 ± 3.7 0.19 39.1 ± 2.9
Indian Mackerel 3 27.4 ± 6.7 0.14 15.6 ± 1.5
Trevally 3 18.7 ± 2.1 0.32 24.2 ± 2.7
Squid 3 19.9 ± 2.8 0.34 19.9 ± 2.3
Little Tuna 3 22.8 ± 1.4 0.25 23.1 ± 1.4
Silver ribbon fish 3 21.5 ± 1.6 0.19 16.6 ± 1.2
Indian Oil Sardine 3 26.7 ± 2.9 0.26 28.2 ± 3.1
Herrings 3 35.7 ± 2.7 0.18 26.1 ± 2.0
Shark 3 44.5 ± 6.9 0.27 48.8 ± 7.6
The highest concentration was observed in Indian anchovy. Anchovy is a small,
common salt-water fish which is consumed with the bone. Hence during sample
preparation, the bones were not separated but included for analysis. As it is well
known that though most of the thorium ingested although passes through the digestive
tract but that which is taken up into the blood deposits in bone. Once deposited, Th
binds strongly with bone and is removed only very slowly. Hence concentration of Th
in anchovy may be high as the sample was analyzed with bone.
Among other fish varieties, the lowest was found in mackerel and highest in shark.
Mackerel is again a small pelagic fish coastal fish with a life span of 2.5-3 y whereas
shark is generally a large pelagic fish with a longer life span (8 -14 y).
The average 232Th concentrations in fish were 12.7 and 12.5 mBq kg-1fresh in Poland
and Japan respectively [41, 92]. In the result of study carried out by Fisenne et al.,
136
average concentration in fish samples from USA was 1.17 mBq kg-1fresh [91]. A study
reported average activity of 232Th in fish samples (anchovy) from Korea as 38.1 mBq
kg-1fresh [95]. The activity concentration in fish samples determined in our study is
considerably higher compared to that reported from Japan, USA, Poland. The
concentration in samples other than anchovy was comparable with the results obtained
in Korean seafood.
Conversely, the higher activity concentration was reported by many investigators. The
range of activity of 232Th in sea fish samples from the Black Sea Region of Turkey
have been reported as 120 ± 40 to 1030 ± 150 mBq kg-1fresh [174]. The average
concentrations of 232Th activity in fish samples from Nigeria have been reported as
115 Bq kg-1fresh [175]. In another study by Ademola et al., on 232Th content in marine
fish samples collected from Ondo State, Nigeria, an activity concentration of 26.2-112
Bq kg-1fresh was reported [195].
The ranges of activity concentration of 232Th in marine fish samples from the Bay of
Bengal to the off the coast of Bangladesh, have been reported as 240-2280 mBq kg-
1fresh [196]. This may be due to the 232Th content in the samples were measured using
gamma ray spectrometry.
In a study conducted by Kantha et al., for estimation of 210Po in food items procured
from the local markets in the study area, highest concentration was found in fish
products [6].
4.2.9 Activity concentration in curated fish
232Th in the dry fish was also analyzed (Table 4-9) and the average concentration in
dry fish was 435.9 ± 35.4 mBq kg-1fresh. The activity concentration ranged from 349.7
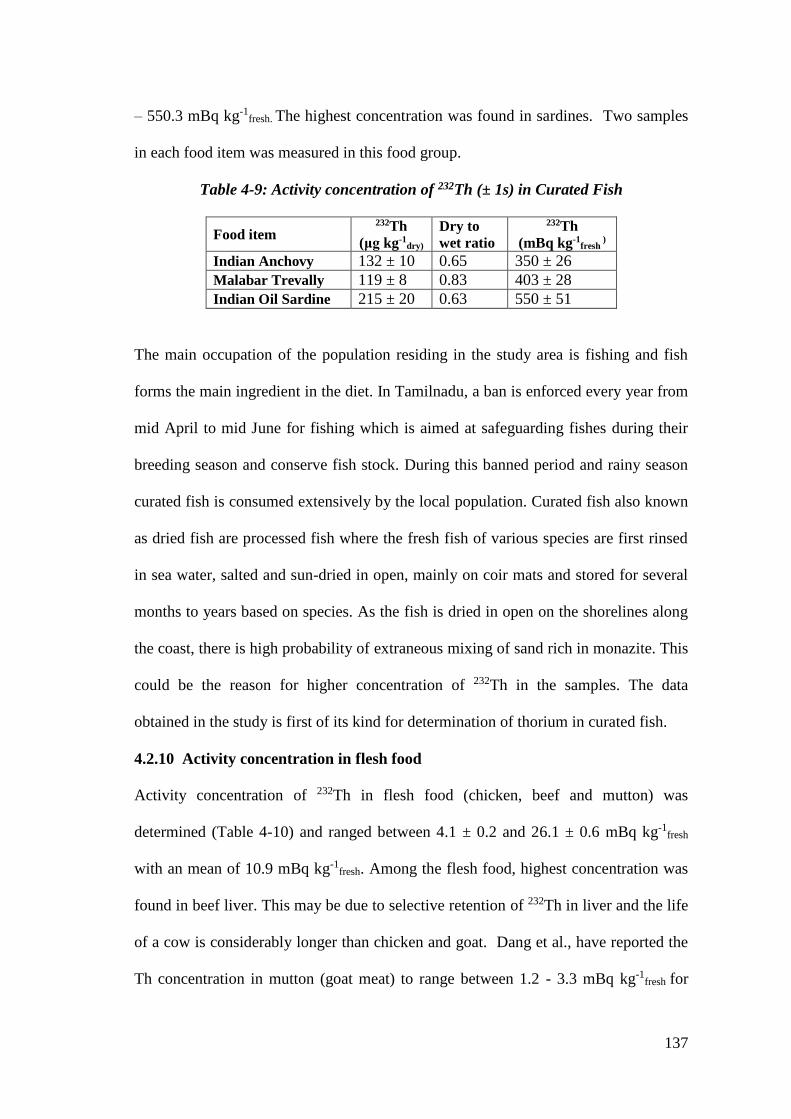
137
– 550.3 mBq kg-1fresh. The highest concentration was found in sardines. Two samples
in each food item was measured in this food group.
Table 4-9: Activity concentration of 232Th (± 1s) in Curated Fish
Food item 232Th
(μg kg-1dry)
Dry to
wet ratio
232Th
(mBq kg-1fresh
)
Indian Anchovy 132 ± 10 0.65 350 ± 26
Malabar Trevally 119 ± 8 0.83 403 ± 28
Indian Oil Sardine 215 ± 20 0.63 550 ± 51
The main occupation of the population residing in the study area is fishing and fish
forms the main ingredient in the diet. In Tamilnadu, a ban is enforced every year from
mid April to mid June for fishing which is aimed at safeguarding fishes during their
breeding season and conserve fish stock. During this banned period and rainy season
curated fish is consumed extensively by the local population. Curated fish also known
as dried fish are processed fish where the fresh fish of various species are first rinsed
in sea water, salted and sun-dried in open, mainly on coir mats and stored for several
months to years based on species. As the fish is dried in open on the shorelines along
the coast, there is high probability of extraneous mixing of sand rich in monazite. This
could be the reason for higher concentration of 232Th in the samples. The data
obtained in the study is first of its kind for determination of thorium in curated fish.
4.2.10 Activity concentration in flesh food
Activity concentration of 232Th in flesh food (chicken, beef and mutton) was
determined (Table 4-10) and ranged between 4.1 ± 0.2 and 26.1 ± 0.6 mBq kg-1fresh
with an mean of 10.9 mBq kg-1fresh. Among the flesh food, highest concentration was
found in beef liver. This may be due to selective retention of 232Th in liver and the life
of a cow is considerably longer than chicken and goat. Dang et al., have reported the
Th concentration in mutton (goat meat) to range between 1.2 - 3.3 mBq kg-1fresh for
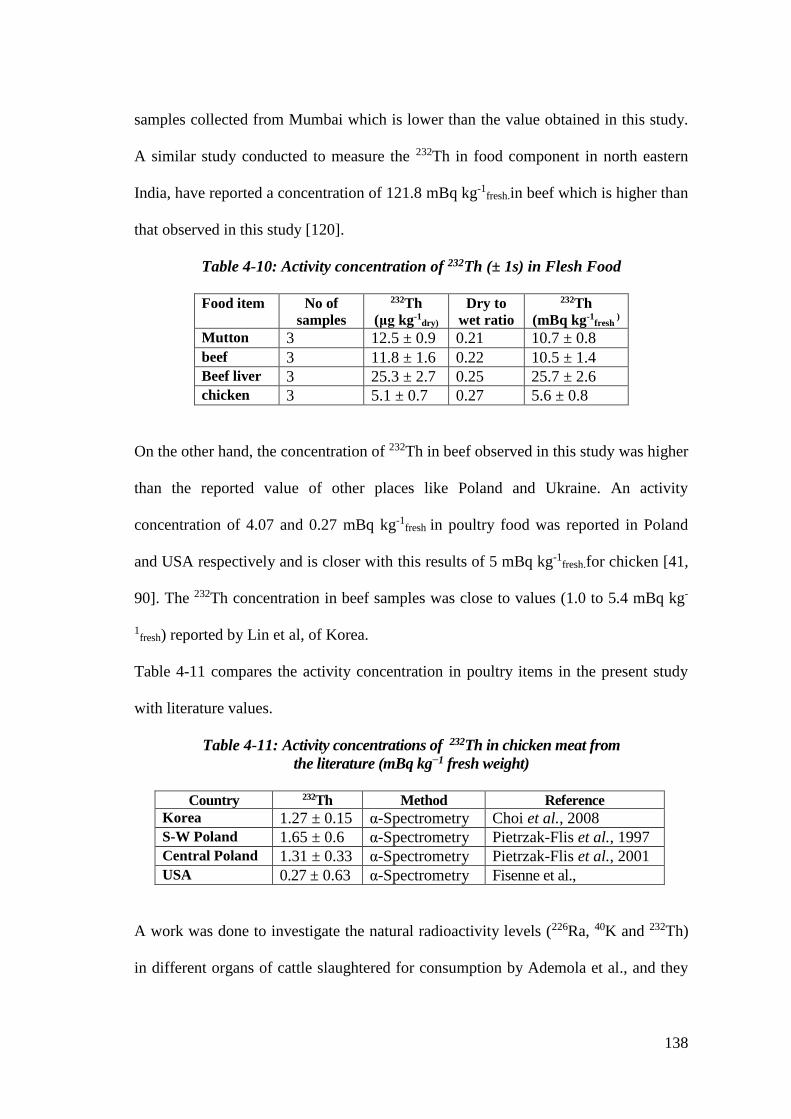
138
samples collected from Mumbai which is lower than the value obtained in this study.
A similar study conducted to measure the 232Th in food component in north eastern
India, have reported a concentration of 121.8 mBq kg-1fresh.in beef which is higher than
that observed in this study [120].
Table 4-10: Activity concentration of 232Th (± 1s) in Flesh Food
Food item No of
samples
232Th
(μg kg-1dry)
Dry to
wet ratio
232Th
(mBq kg-1fresh
)
Mutton 3 12.5 ± 0.9 0.21 10.7 ± 0.8
beef 3 11.8 ± 1.6 0.22 10.5 ± 1.4
Beef liver 3 25.3 ± 2.7 0.25 25.7 ± 2.6
chicken 3 5.1 ± 0.7 0.27 5.6 ± 0.8
On the other hand, the concentration of 232Th in beef observed in this study was higher
than the reported value of other places like Poland and Ukraine. An activity
concentration of 4.07 and 0.27 mBq kg-1fresh in poultry food was reported in Poland
and USA respectively and is closer with this results of 5 mBq kg-1fresh.for chicken [41,
90]. The 232Th concentration in beef samples was close to values (1.0 to 5.4 mBq kg-
1fresh) reported by Lin et al, of Korea.
Table 4-11 compares the activity concentration in poultry items in the present study
with literature values.
Table 4-11: Activity concentrations of 232Th in chicken meat from
the literature (mBq kg−1 fresh weight)
Country 232Th Method Reference
Korea 1.27 ± 0.15 α-Spectrometry Choi et al., 2008
S-W Poland 1.65 ± 0.6 α-Spectrometry Pietrzak-Flis et al., 1997
Central Poland 1.31 ± 0.33 α-Spectrometry Pietrzak-Flis et al., 2001
USA 0.27 ± 0.63 α-Spectrometry Fisenne et al.,
A work was done to investigate the natural radioactivity levels (226Ra, 40K and 232Th)
in different organs of cattle slaughtered for consumption by Ademola et al., and they
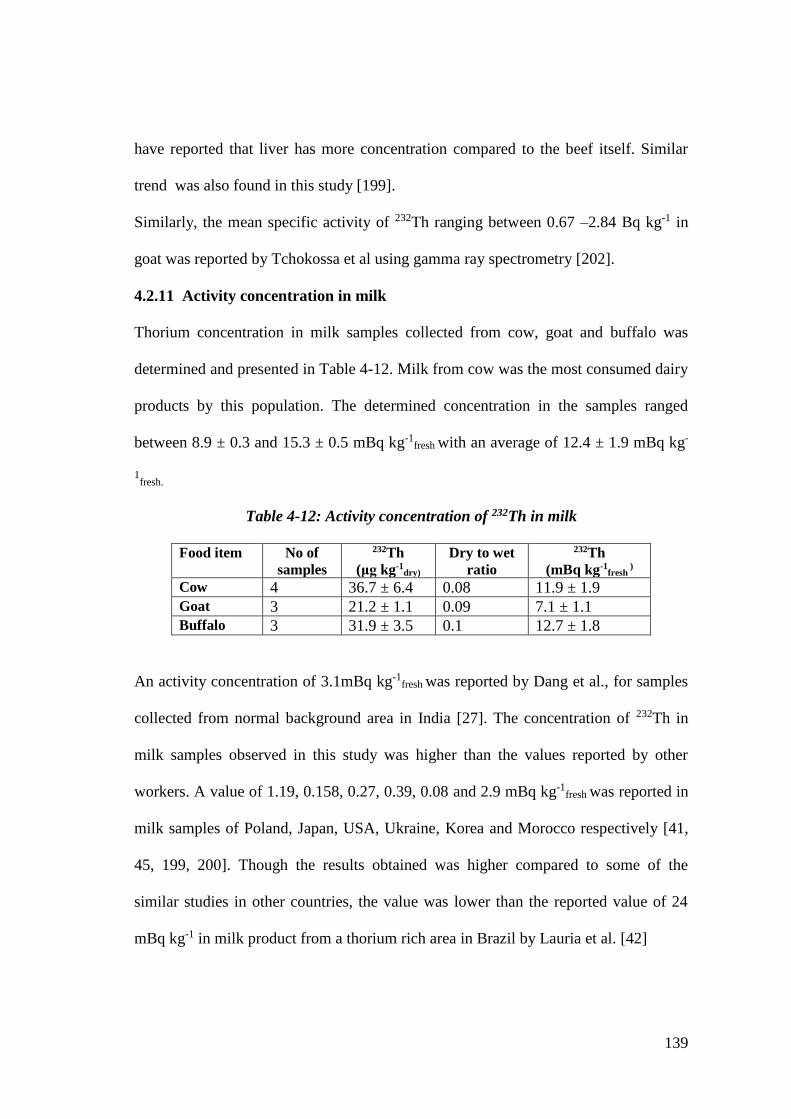
139
have reported that liver has more concentration compared to the beef itself. Similar
trend was also found in this study [199].
Similarly, the mean specific activity of 232Th ranging between 0.67 –2.84 Bq kg-1 in
goat was reported by Tchokossa et al using gamma ray spectrometry [202].
4.2.11 Activity concentration in milk
Thorium concentration in milk samples collected from cow, goat and buffalo was
determined and presented in Table 4-12. Milk from cow was the most consumed dairy
products by this population. The determined concentration in the samples ranged
between 8.9 ± 0.3 and 15.3 ± 0.5 mBq kg-1fresh with an average of 12.4 ± 1.9 mBq kg-
1fresh.
Table 4-12: Activity concentration of 232Th in milk
Food item No of
samples
232Th
(μg kg-1dry)
Dry to wet
ratio
232Th
(mBq kg-1fresh
)
Cow 4 36.7 ± 6.4 0.08 11.9 ± 1.9
Goat 3 21.2 ± 1.1 0.09 7.1 ± 1.1
Buffalo 3 31.9 ± 3.5 0.1 12.7 ± 1.8
An activity concentration of 3.1mBq kg-1fresh was reported by Dang et al., for samples
collected from normal background area in India [27]. The concentration of 232Th in
milk samples observed in this study was higher than the values reported by other
workers. A value of 1.19, 0.158, 0.27, 0.39, 0.08 and 2.9 mBq kg-1fresh was reported in
milk samples of Poland, Japan, USA, Ukraine, Korea and Morocco respectively [41,
45, 199, 200]. Though the results obtained was higher compared to some of the
similar studies in other countries, the value was lower than the reported value of 24
mBq kg-1 in milk product from a thorium rich area in Brazil by Lauria et al. [42]
140
4.2.12 Activity concentration in spices and coconut
232Th content in tamarind and green chilly which are used in the dishes prepared by
the inhabitants as spices or for seasoning. The average activity concentration in green
chilly and tamarind was 4.02 ± 1.2 and 51.2 ± 13.01 mBq kg-1fresh respectively. The
concentration in tamarind was higher because of the preservation practices by the
villagers. Tamarind is sundried in open and stored for later use. This open drying
might have resulted in extraneous contamination with monazite containing sand.
Coconut is used extensively by the population in almost all preparations. Coconut
cultivation is also carried in large parts of the region. The concentration varied from
3.2-5.0 μg kg-1fresh with an activity concentration of 16.9 mBq kg-1
fresh. There are no
data on 232Th content in coconut.
Fig 4-7 compares the activity concentration in the important food groups studied. The
activity concentration in plant origin food was in the order: roots and tubers >leafy
vegetables > vegetables > pulses > fruits. Similar trend was also observed and
reported by Kritsananuwat et al., in a study to investigate the activity concentration in
various parts of a plant [189]. Pulhani et al. have reported in wheats about uranium
decreasing trend root > shoot > husk > grains. It has also been reported in a number of
publications that concentration of U and Th in root are much higher than in leaf and
stem.
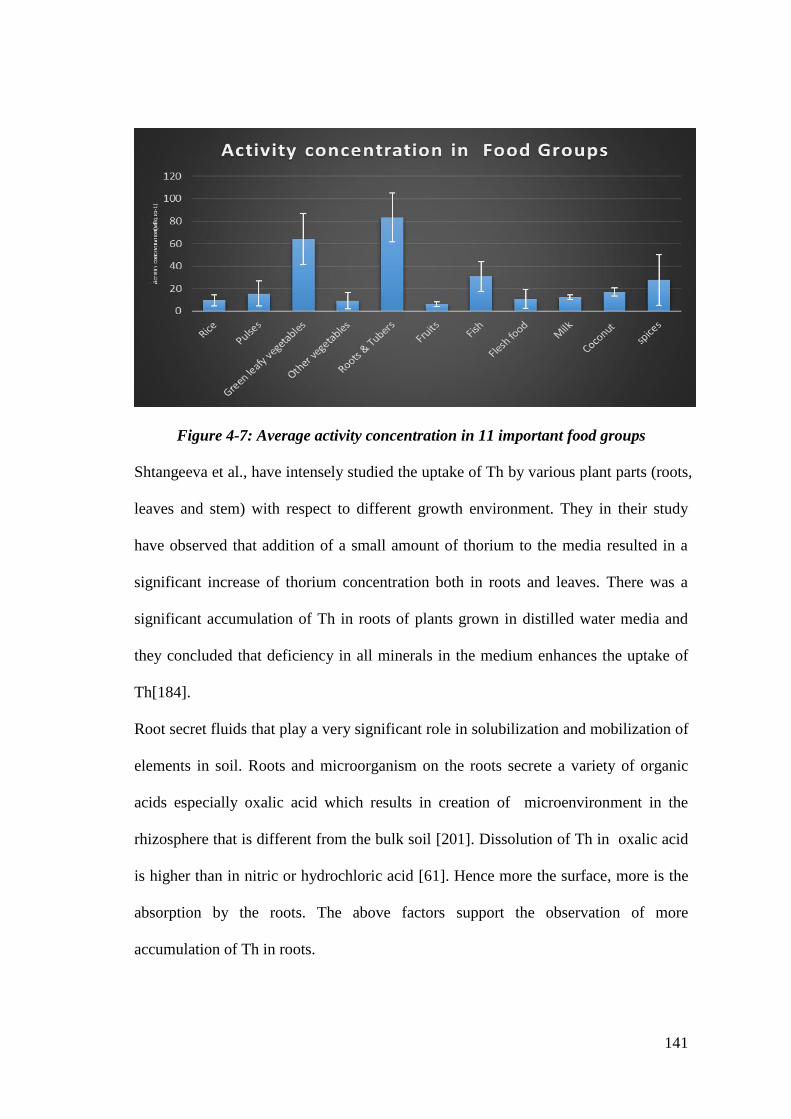
141
Figure 4-7: Average activity concentration in 11 important food groups
Shtangeeva et al., have intensely studied the uptake of Th by various plant parts (roots,
leaves and stem) with respect to different growth environment. They in their study
have observed that addition of a small amount of thorium to the media resulted in a
significant increase of thorium concentration both in roots and leaves. There was a
significant accumulation of Th in roots of plants grown in distilled water media and
they concluded that deficiency in all minerals in the medium enhances the uptake of
Th[184].
Root secret fluids that play a very significant role in solubilization and mobilization of
elements in soil. Roots and microorganism on the roots secrete a variety of organic
acids especially oxalic acid which results in creation of microenvironment in the
rhizosphere that is different from the bulk soil [201]. Dissolution of Th in oxalic acid
is higher than in nitric or hydrochloric acid [61]. Hence more the surface, more is the
absorption by the roots. The above factors support the observation of more
accumulation of Th in roots.
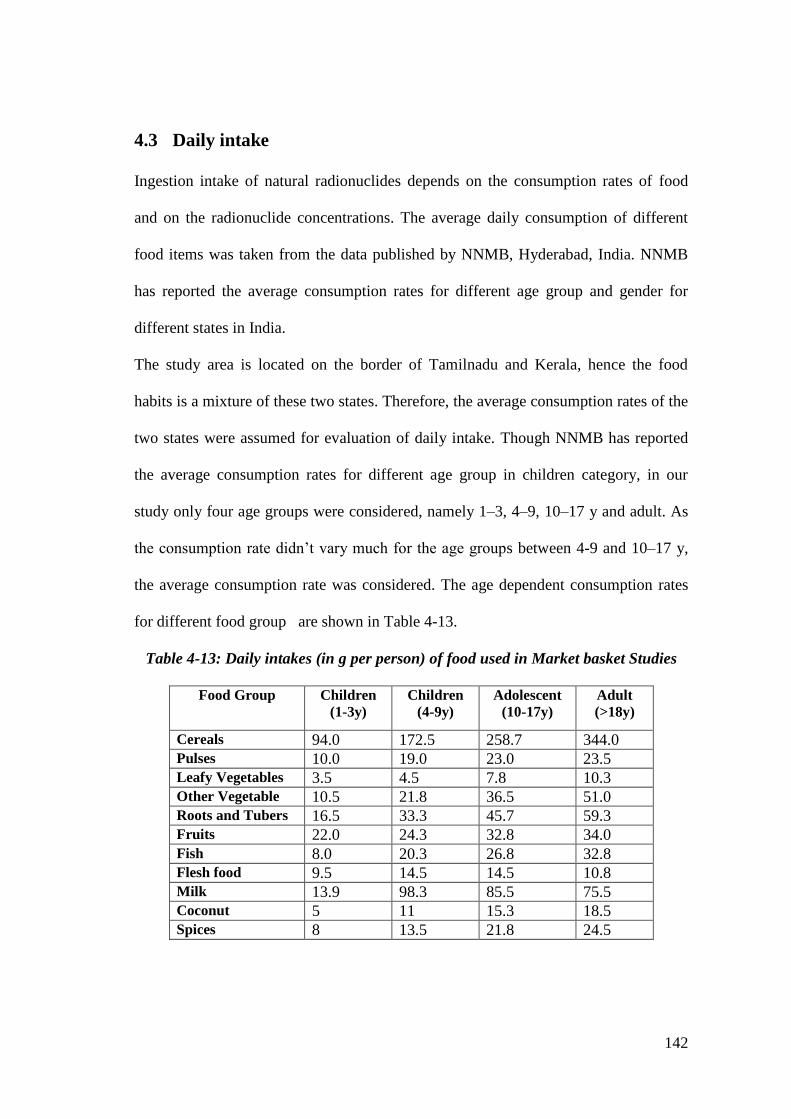
142
4.3 Daily intake
Ingestion intake of natural radionuclides depends on the consumption rates of food
and on the radionuclide concentrations. The average daily consumption of different
food items was taken from the data published by NNMB, Hyderabad, India. NNMB
has reported the average consumption rates for different age group and gender for
different states in India.
The study area is located on the border of Tamilnadu and Kerala, hence the food
habits is a mixture of these two states. Therefore, the average consumption rates of the
two states were assumed for evaluation of daily intake. Though NNMB has reported
the average consumption rates for different age group in children category, in our
study only four age groups were considered, namely 1–3, 4–9, 10–17 y and adult. As
the consumption rate didn’t vary much for the age groups between 4-9 and 10–17 y,
the average consumption rate was considered. The age dependent consumption rates
for different food group are shown in Table 4-13.
Table 4-13: Daily intakes (in g per person) of food used in Market basket Studies
Food Group Children
(1-3y)
Children
(4-9y)
Adolescent
(10-17y)
Adult
(>18y)
Cereals 94.0 172.5 258.7 344.0
Pulses 10.0 19.0 23.0 23.5
Leafy Vegetables 3.5 4.5 7.8 10.3
Other Vegetable 10.5 21.8 36.5 51.0
Roots and Tubers 16.5 33.3 45.7 59.3
Fruits 22.0 24.3 32.8 34.0
Fish 8.0 20.3 26.8 32.8
Flesh food 9.5 14.5 14.5 10.8
Milk 13.9 98.3 85.5 75.5
Coconut 5 11 15.3 18.5
Spices 8 13.5 21.8 24.5
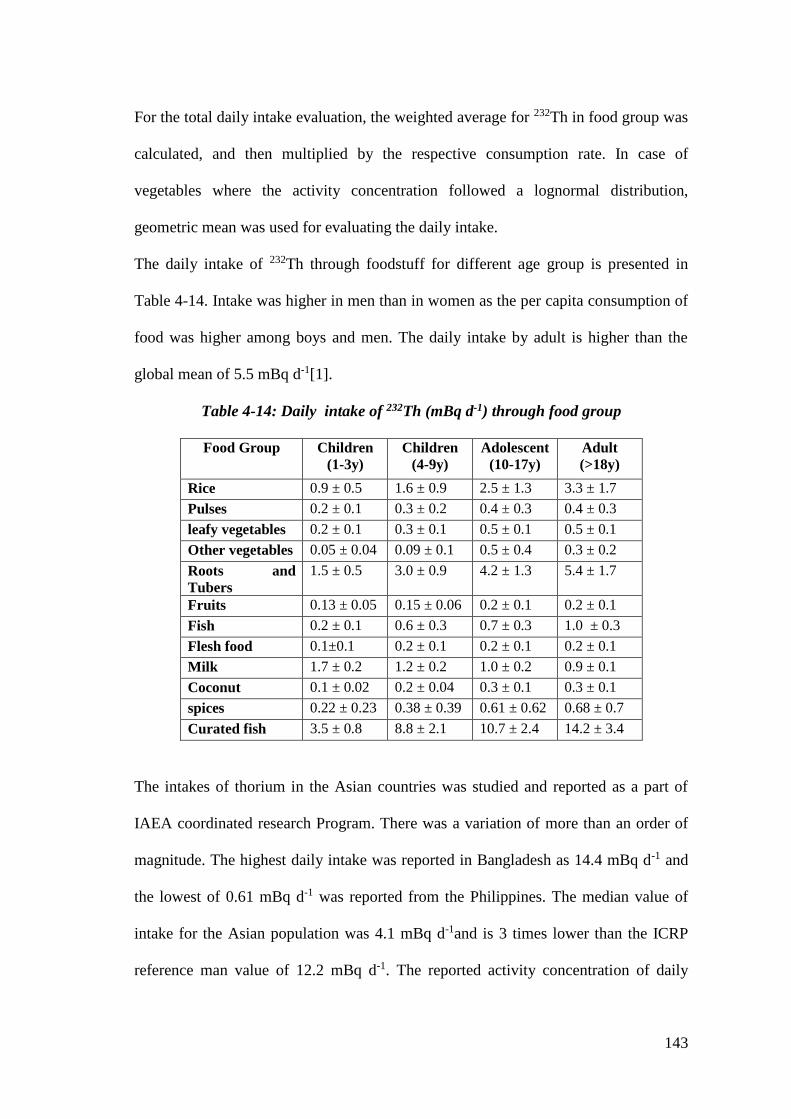
143
For the total daily intake evaluation, the weighted average for 232Th in food group was
calculated, and then multiplied by the respective consumption rate. In case of
vegetables where the activity concentration followed a lognormal distribution,
geometric mean was used for evaluating the daily intake.
The daily intake of 232Th through foodstuff for different age group is presented in
Table 4-14. Intake was higher in men than in women as the per capita consumption of
food was higher among boys and men. The daily intake by adult is higher than the
global mean of 5.5 mBq d-1[1].
Table 4-14: Daily intake of 232Th (mBq d-1) through food group
Food Group Children
(1-3y)
Children
(4-9y)
Adolescent
(10-17y)
Adult
(>18y)
Rice 0.9 ± 0.5 1.6 ± 0.9 2.5 ± 1.3 3.3 ± 1.7
Pulses 0.2 ± 0.1 0.3 ± 0.2 0.4 ± 0.3 0.4 ± 0.3
leafy vegetables 0.2 ± 0.1 0.3 ± 0.1 0.5 ± 0.1 0.5 ± 0.1
Other vegetables 0.05 ± 0.04 0.09 ± 0.1 0.5 ± 0.4 0.3 ± 0.2
Roots and
Tubers
1.5 ± 0.5 3.0 ± 0.9 4.2 ± 1.3 5.4 ± 1.7
Fruits 0.13 ± 0.05 0.15 ± 0.06 0.2 ± 0.1 0.2 ± 0.1
Fish 0.2 ± 0.1 0.6 ± 0.3 0.7 ± 0.3 1.0 ± 0.3
Flesh food 0.1±0.1 0.2 ± 0.1 0.2 ± 0.1 0.2 ± 0.1
Milk 1.7 ± 0.2 1.2 ± 0.2 1.0 ± 0.2 0.9 ± 0.1
Coconut 0.1 ± 0.02 0.2 ± 0.04 0.3 ± 0.1 0.3 ± 0.1
spices 0.22 ± 0.23 0.38 ± 0.39 0.61 ± 0.62 0.68 ± 0.7
Curated fish 3.5 ± 0.8 8.8 ± 2.1 10.7 ± 2.4 14.2 ± 3.4
The intakes of thorium in the Asian countries was studied and reported as a part of
IAEA coordinated research Program. There was a variation of more than an order of
magnitude. The highest daily intake was reported in Bangladesh as 14.4 mBq d-1 and
the lowest of 0.61 mBq d-1 was reported from the Philippines. The median value of
intake for the Asian population was 4.1 mBq d-1and is 3 times lower than the ICRP
reference man value of 12.2 mBq d-1. The reported activity concentration of daily
144
intake was evaluated in samples from natural background radiation area and it was
found lower than the evaluated daily intake in this study.
The daily intake of thorium reported for New York residents (belonging to Caucasian
population) was also 4.1 mBq d-1 which is similar to the median Asian intake value.
Another group of workers in Japan estimated the daily intake of 2.8 mBq d-1 thorium
for Japanese population, and it was based on market basket study of 18 food
categories.
Total intake of 232Th by the population residing at the Domiasiat, India was 3.4 μg d−1
(14 mBq d−1) which is lower compared to the intake of 27.4 mBq d−1evaluated in this
study [121]. The average per capita intake of thorium in food is reported as 1.3 μg
d−1(5.3 mBq d−1) [90] and 1.5 μg d−1(6.1mBq d-1) in japan[199]. The total daily
intake from 232Th measured in a study from Korean foods based on MBS method was
evaluated as 1.2 mBq d-1. The average daily intake of 232Th by the Buena inhabitants
(an established HBRA in Brazil) was estimated using MBS to be 26 mBq d-1 which is
comparable to the values observed in this study [42]. Similarly a higher intake of 20.4
mBq d-1 was observed in another HBRA of China[202].
4.4 Contribution of food groups to daily intake
Contribution of the food groups (except for curated fish) to the 232Th intake for
different age group is presented in Fig 4-8. Three foods namely milk, rice and roots
and tubers were the biggest contributor in children between age 1 to 9y.
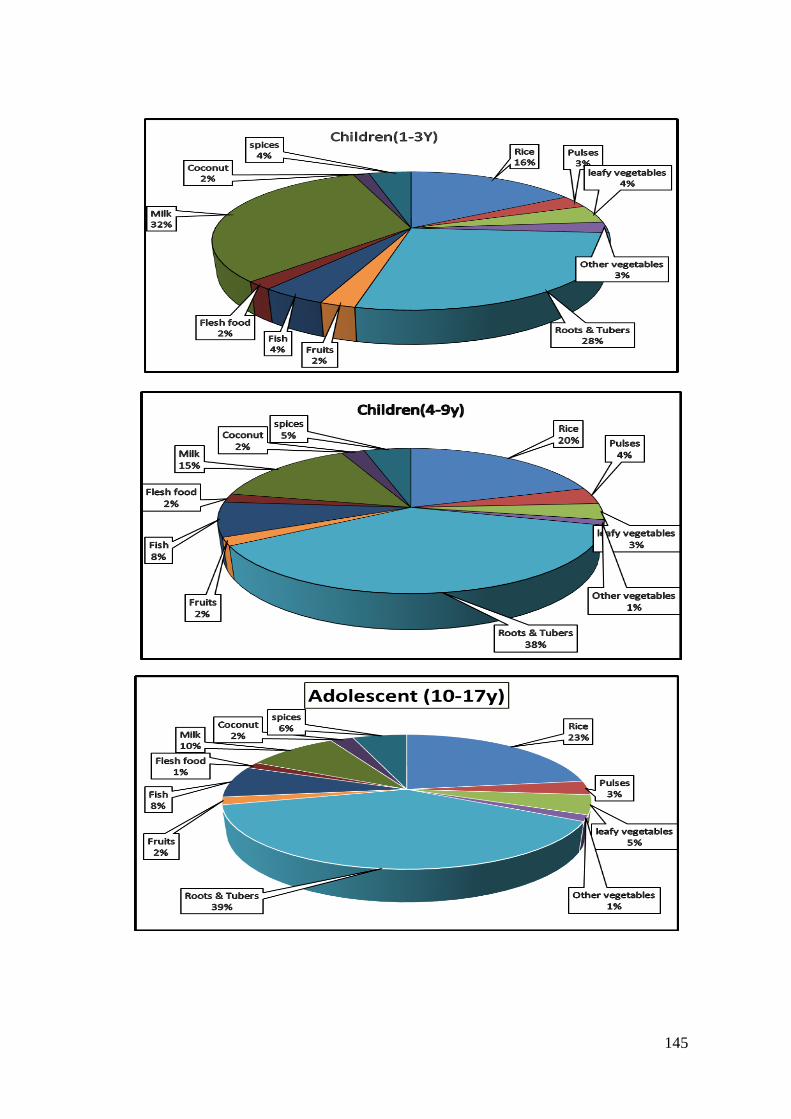
145
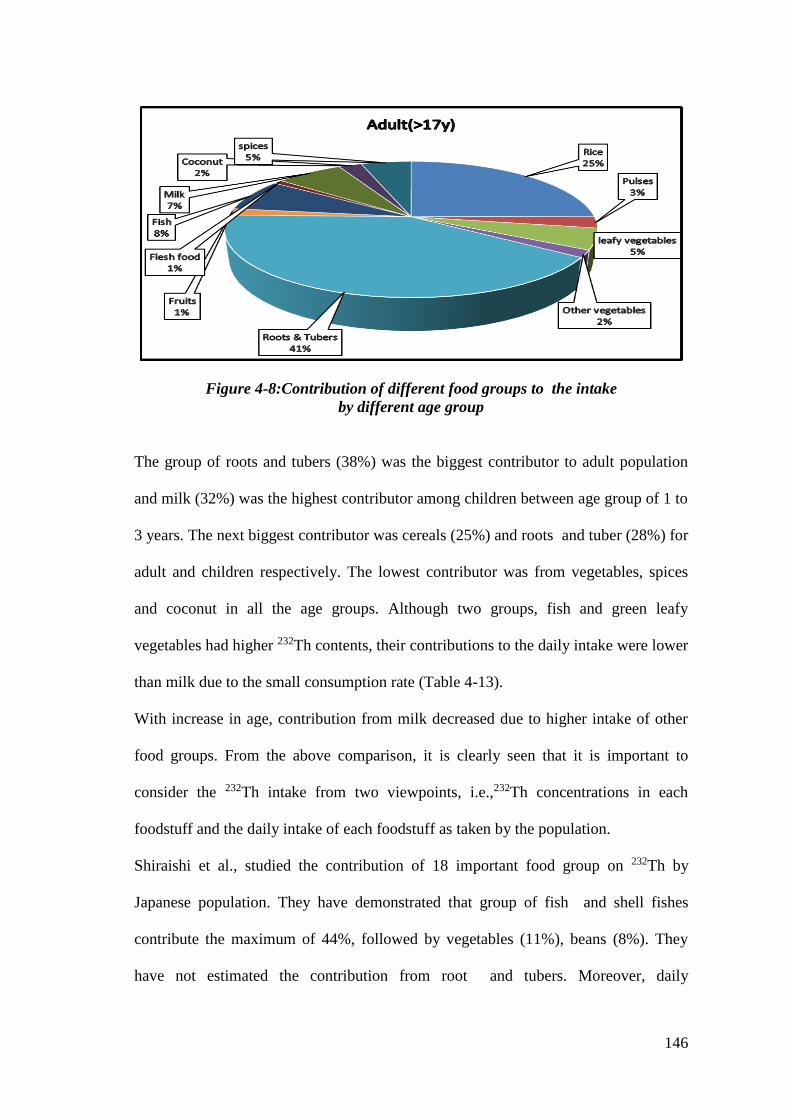
146
Figure 4-8:Contribution of different food groups to the intake
by different age group
The group of roots and tubers (38%) was the biggest contributor to adult population
and milk (32%) was the highest contributor among children between age group of 1 to
3 years. The next biggest contributor was cereals (25%) and roots and tuber (28%) for
adult and children respectively. The lowest contributor was from vegetables, spices
and coconut in all the age groups. Although two groups, fish and green leafy
vegetables had higher 232Th contents, their contributions to the daily intake were lower
than milk due to the small consumption rate (Table 4-13).
With increase in age, contribution from milk decreased due to higher intake of other
food groups. From the above comparison, it is clearly seen that it is important to
consider the 232Th intake from two viewpoints, i.e.,232Th concentrations in each
foodstuff and the daily intake of each foodstuff as taken by the population.
Shiraishi et al., studied the contribution of 18 important food group on 232Th by
Japanese population. They have demonstrated that group of fish and shell fishes
contribute the maximum of 44%, followed by vegetables (11%), beans (8%). They
have not estimated the contribution from root and tubers. Moreover, daily
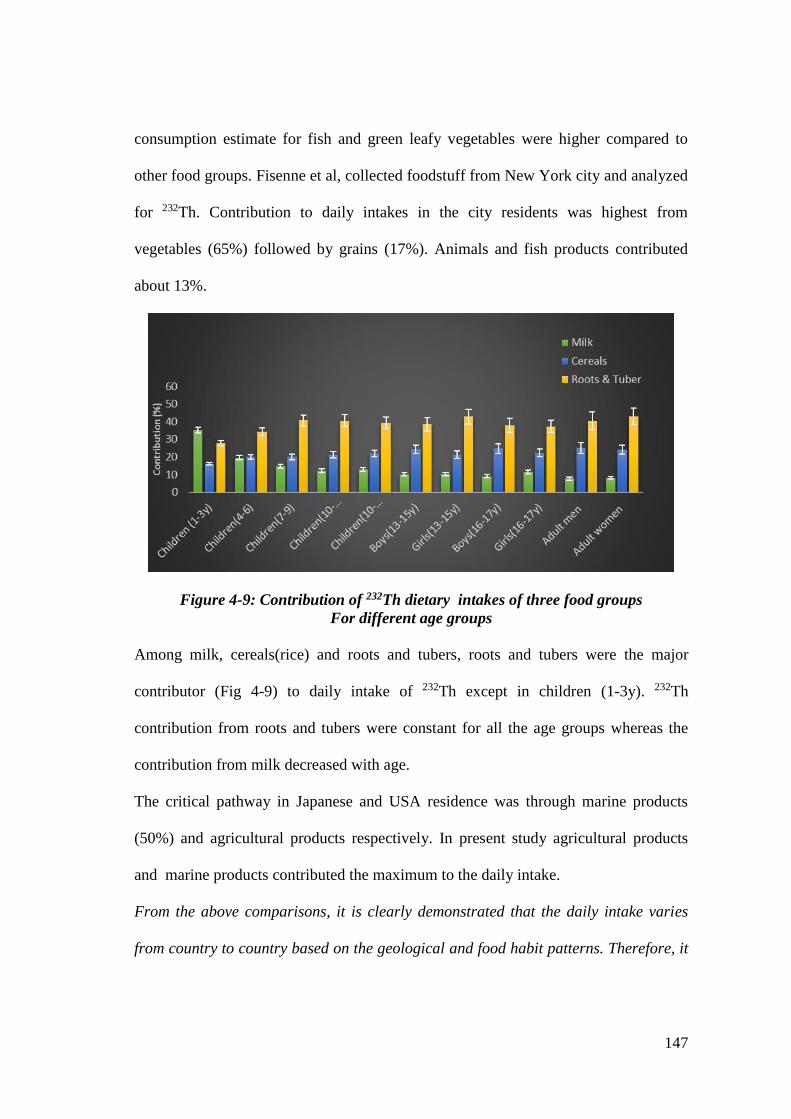
147
consumption estimate for fish and green leafy vegetables were higher compared to
other food groups. Fisenne et al, collected foodstuff from New York city and analyzed
for 232Th. Contribution to daily intakes in the city residents was highest from
vegetables (65%) followed by grains (17%). Animals and fish products contributed
about 13%.
Figure 4-9: Contribution of 232Th dietary intakes of three food groups
For different age groups
Among milk, cereals(rice) and roots and tubers, roots and tubers were the major
contributor (Fig 4-9) to daily intake of 232Th except in children (1-3y). 232Th
contribution from roots and tubers were constant for all the age groups whereas the
contribution from milk decreased with age.
The critical pathway in Japanese and USA residence was through marine products
(50%) and agricultural products respectively. In present study agricultural products
and marine products contributed the maximum to the daily intake.
From the above comparisons, it is clearly demonstrated that the daily intake varies
from country to country based on the geological and food habit patterns. Therefore, it
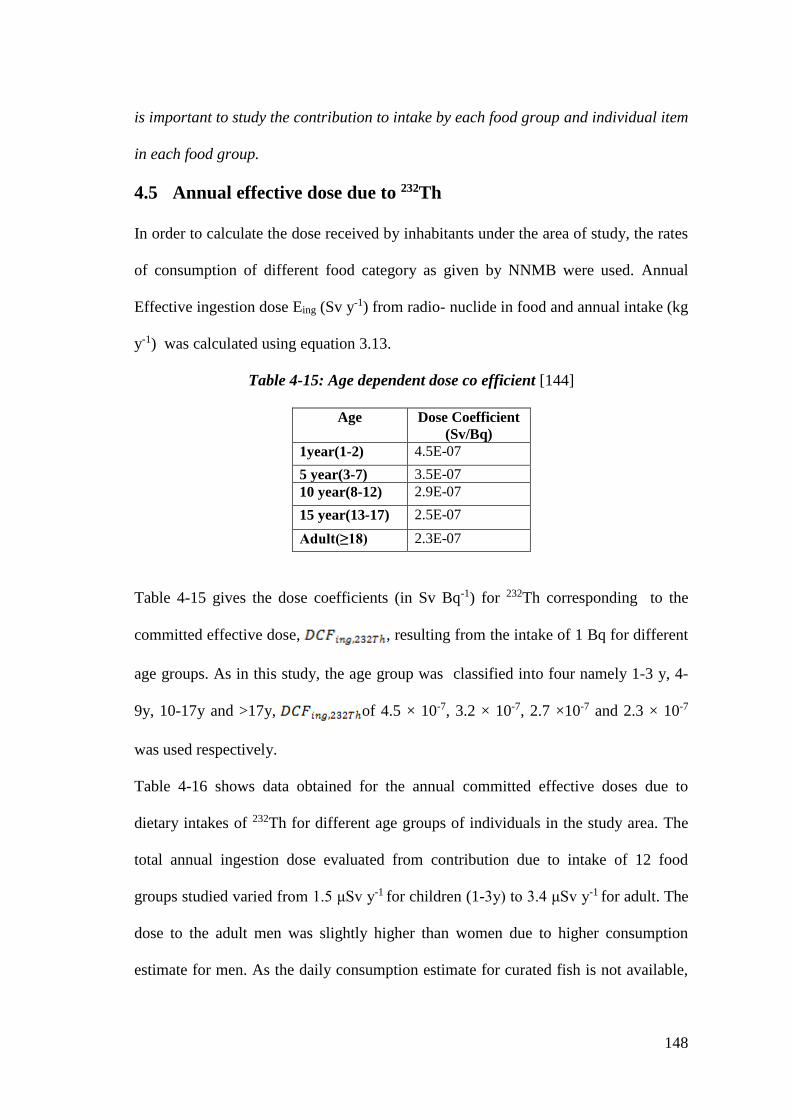
148
is important to study the contribution to intake by each food group and individual item
in each food group.
4.5 Annual effective dose due to 232Th
In order to calculate the dose received by inhabitants under the area of study, the rates
of consumption of different food category as given by NNMB were used. Annual
Effective ingestion dose Eing (Sv y-1) from radio- nuclide in food and annual intake (kg
y-1) was calculated using equation 3.13.
Table 4-15: Age dependent dose co efficient [144]
Age Dose Coefficient
(Sv/Bq)
1year(1-2) 4.5E-07
5 year(3-7) 3.5E-07
10 year(8-12) 2.9E-07
15 year(13-17) 2.5E-07
Adult(≥18) 2.3E-07
Table 4-15 gives the dose coefficients (in Sv Bq-1) for 232Th corresponding to the
committed effective dose, , resulting from the intake of 1 Bq for different
age groups. As in this study, the age group was classified into four namely 1-3 y, 4-
9y, 10-17y and >17y, of 4.5 × 10⁻⁷, 3.2 × 10⁻⁷, 2.7 ×10⁻⁷ and 2.3 × 10⁻⁷
was used respectively.
Table 4-16 shows data obtained for the annual committed effective doses due to
dietary intakes of 232Th for different age groups of individuals in the study area. The
total annual ingestion dose evaluated from contribution due to intake of 12 food
groups studied varied from 1.5 μSv y-1 for children (1-3y) to 3.4 μSv y-1 for adult. The
dose to the adult men was slightly higher than women due to higher consumption
estimate for men. As the daily consumption estimate for curated fish is not available,
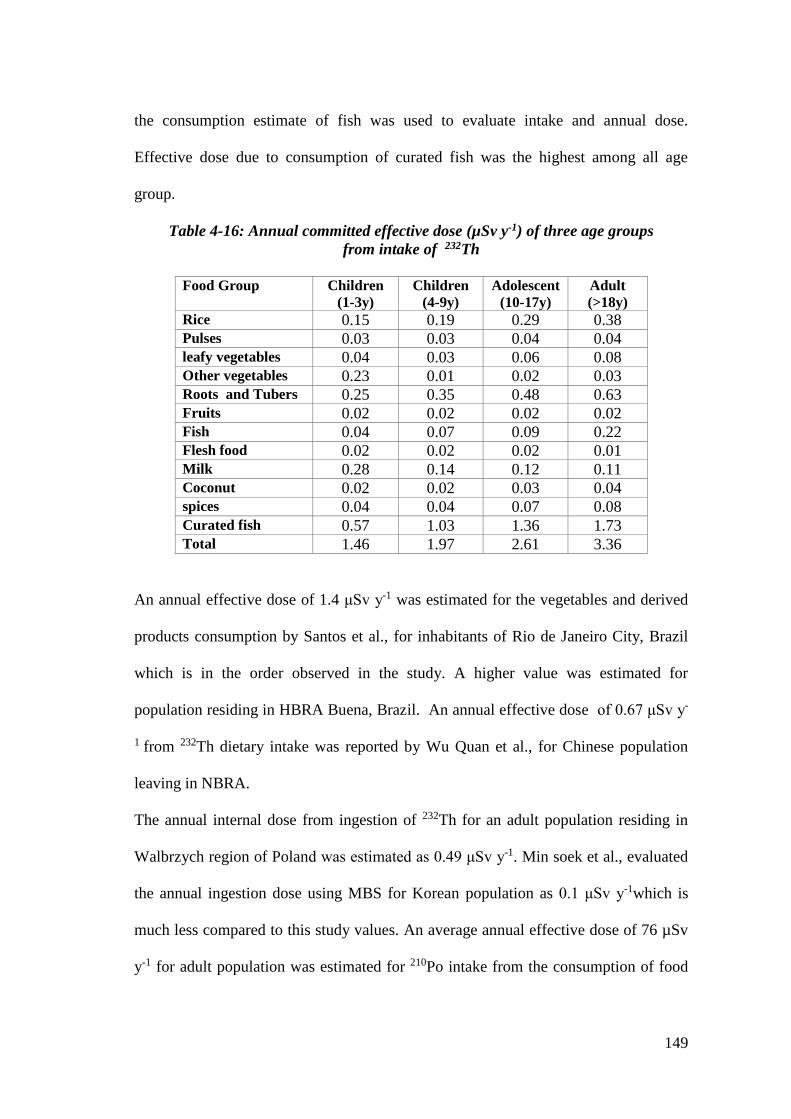
149
the consumption estimate of fish was used to evaluate intake and annual dose.
Effective dose due to consumption of curated fish was the highest among all age
group.
Table 4-16: Annual committed effective dose (µSv y-1) of three age groups
from intake of 232Th
Food Group Children
(1-3y)
Children
(4-9y)
Adolescent
(10-17y)
Adult
(>18y)
Rice 0.15 0.19 0.29 0.38 Pulses 0.03 0.03 0.04 0.04 leafy vegetables 0.04 0.03 0.06 0.08 Other vegetables 0.23 0.01 0.02 0.03 Roots and Tubers 0.25 0.35 0.48 0.63 Fruits 0.02 0.02 0.02 0.02 Fish 0.04 0.07 0.09 0.22 Flesh food 0.02 0.02 0.02 0.01 Milk 0.28 0.14 0.12 0.11 Coconut 0.02 0.02 0.03 0.04 spices 0.04 0.04 0.07 0.08 Curated fish 0.57 1.03 1.36 1.73 Total 1.46 1.97 2.61 3.36
An annual effective dose of 1.4 μSv y-1 was estimated for the vegetables and derived
products consumption by Santos et al., for inhabitants of Rio de Janeiro City, Brazil
which is in the order observed in the study. A higher value was estimated for
population residing in HBRA Buena, Brazil. An annual effective dose of 0.67 μSv y-
1 from 232Th dietary intake was reported by Wu Quan et al., for Chinese population
leaving in NBRA.
The annual internal dose from ingestion of 232Th for an adult population residing in
Walbrzych region of Poland was estimated as 0.49 μSv y-1. Min soek et al., evaluated
the annual ingestion dose using MBS for Korean population as 0.1 μSv y-1which is
much less compared to this study values. An average annual effective dose of 76 µSv
y-1 for adult population was estimated for 210Po intake from the consumption of food
150
items in this study and is an order higher compared to the average dose (3.4 µSv y-1)
evaluated for 232Th intake [6]. Using recommended dose conversion coefficient for
226Ra, 228Ra, 228Th, 40K of 0.23, 0.8, 0.072 and 0.0062 mSv Bq-1 respectively, Shanthi
et al., have evaluated total annual internal dose from intake of south Indian food as
0.201, 0.659, 0.475 and 0.460 mSv y-1 [5]. Compared to the dose received from the
other radionuclides using MBS, the dose received from 232Th is less.
MBS is a suitable method for identifying the contribution from each food groups and
hence it is a beneficial method for classifying the critical pathway in case of accidental
increase in a radionuclide in soil or atmosphere. Furthermore, food items in food
groups that significantly contributed to total intake and the individual food item
having high content of the nuclides should be analyzed in detail to find individual
critical foods in the food chain.
151
Chapter 5
Dietary intake of Thorium
using Duplicate Portion Study
(DPS) Method
152
5.1 Introduction
Information on daily intake of 232Th is important for estimating the metabolic factors
of uptake and deposition of the radionuclide in the human body. The incorporated
thorium is retained in skeleton, liver and other tissues resulting in internal radiation
dose. As the consumption of food is usually the most important route by which natural
radionuclides can enter the human body, an assessment of radionuclide levels in
different food and diets is therefore important to estimate the intake of these
radionuclides by human. In India, natural radioactivity has been measured in some
specific food products but there are a few data for total diet especially in the study
area. Dietary exposure assessment is a tool to estimate the internal exposure via
ingestion. Duplicate Portion Study (DPS) and Market Basket Study (MBS) are two
commonly employed methods for the study of daily dietary intake. The DPS is a
direct method where the intake is evaluated by analyzing the 24 h diet sample
collected from individuals in a population sub group. Instrumental Neutron Activation
Analysis (INAA) is a very sensitive and reliable method for estimating the absolute
concentration of Th ( 232Th) in environmental and biological matrices.
5.2 Methodology
Preliminary work was carried out by ground radiometric survey to determine the high
background radiation spots in the study region. Based on the radiometric survey
duplicate diet samples were collected from volunteers from four villages namely
Putteti, Manavalakurichi, Thengapattinam and Idindakarai. The samples were
collected in a pre-cleaned polythene bags and stored in icebox at -40C for
transportation to the analytical laboratory. The frozen diet was thawed and
homogenized and then wet weight was recorded. The homogenized samples were
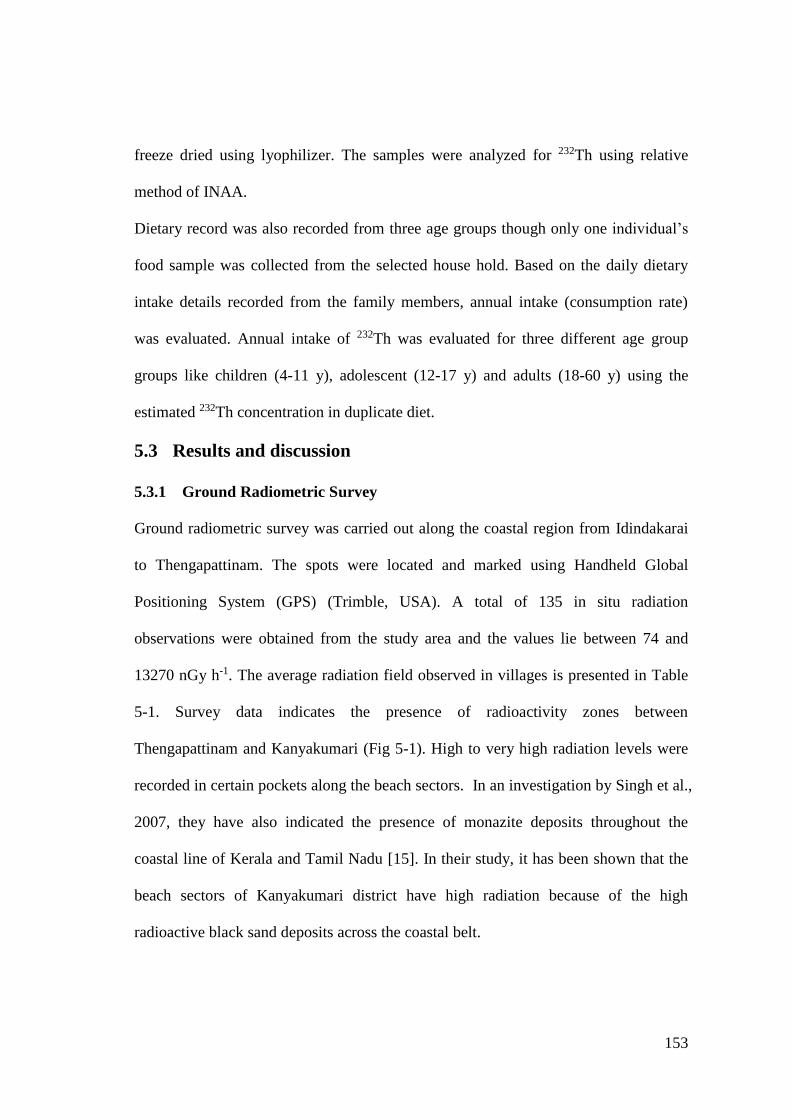
153
freeze dried using lyophilizer. The samples were analyzed for 232Th using relative
method of INAA.
Dietary record was also recorded from three age groups though only one individual’s
food sample was collected from the selected house hold. Based on the daily dietary
intake details recorded from the family members, annual intake (consumption rate)
was evaluated. Annual intake of 232Th was evaluated for three different age group
groups like children (4-11 y), adolescent (12-17 y) and adults (18-60 y) using the
estimated 232Th concentration in duplicate diet.
5.3 Results and discussion
5.3.1 Ground Radiometric Survey
Ground radiometric survey was carried out along the coastal region from Idindakarai
to Thengapattinam. The spots were located and marked using Handheld Global
Positioning System (GPS) (Trimble, USA). A total of 135 in situ radiation
observations were obtained from the study area and the values lie between 74 and
13270 nGy h-1. The average radiation field observed in villages is presented in Table
5-1. Survey data indicates the presence of radioactivity zones between
Thengapattinam and Kanyakumari (Fig 5-1). High to very high radiation levels were
recorded in certain pockets along the beach sectors. In an investigation by Singh et al.,
2007, they have also indicated the presence of monazite deposits throughout the
coastal line of Kerala and Tamil Nadu [15]. In their study, it has been shown that the
beach sectors of Kanyakumari district have high radiation because of the high
radioactive black sand deposits across the coastal belt.
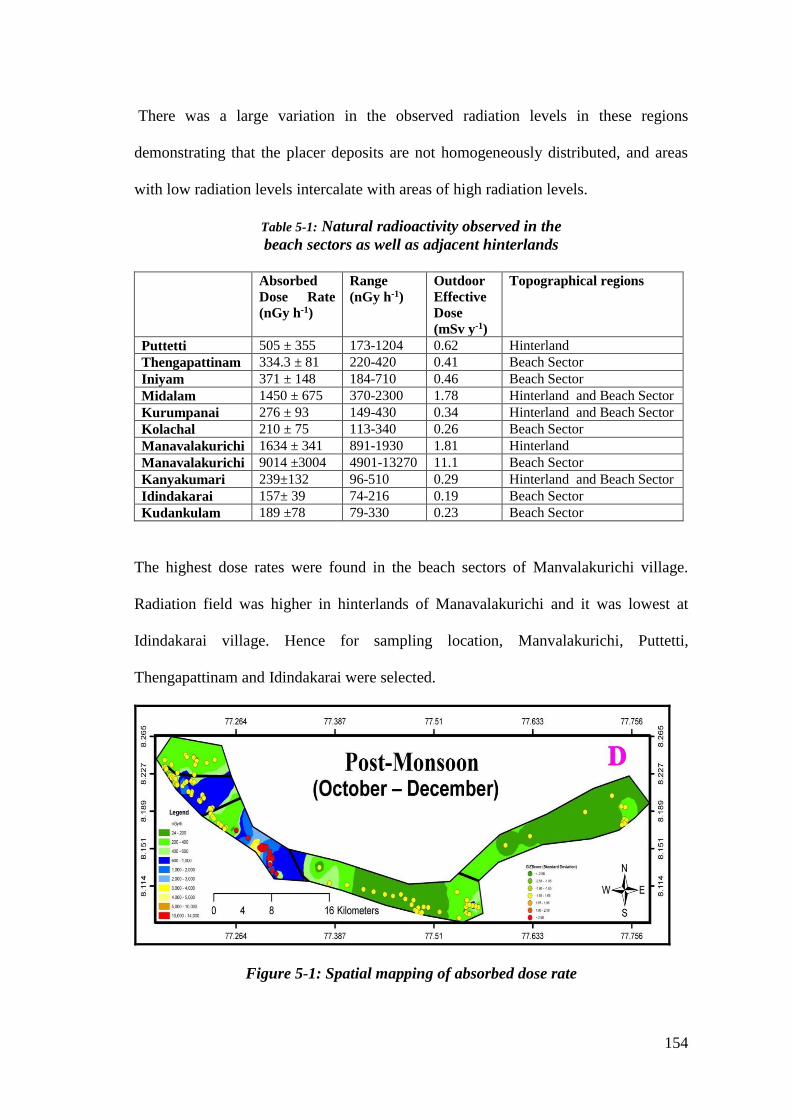
154
There was a large variation in the observed radiation levels in these regions
demonstrating that the placer deposits are not homogeneously distributed, and areas
with low radiation levels intercalate with areas of high radiation levels.
Table 5-1: Natural radioactivity observed in the
beach sectors as well as adjacent hinterlands
Absorbed
Dose Rate
(nGy h-1)
Range
(nGy h-1)
Outdoor
Effective
Dose
(mSv y-1)
Topographical regions
Puttetti 505 ± 355 173-1204 0.62 Hinterland
Thengapattinam 334.3 ± 81 220-420 0.41 Beach Sector
Iniyam 371 ± 148 184-710 0.46 Beach Sector
Midalam 1450 ± 675 370-2300 1.78 Hinterland and Beach Sector
Kurumpanai 276 ± 93 149-430 0.34 Hinterland and Beach Sector
Kolachal 210 ± 75 113-340 0.26 Beach Sector
Manavalakurichi 1634 ± 341 891-1930 1.81 Hinterland
Manavalakurichi 9014 ±3004 4901-13270 11.1 Beach Sector
Kanyakumari 239±132 96-510 0.29 Hinterland and Beach Sector
Idindakarai 157± 39 74-216 0.19 Beach Sector
Kudankulam 189 ±78 79-330 0.23 Beach Sector
The highest dose rates were found in the beach sectors of Manvalakurichi village.
Radiation field was higher in hinterlands of Manavalakurichi and it was lowest at
Idindakarai village. Hence for sampling location, Manvalakurichi, Puttetti,
Thengapattinam and Idindakarai were selected.
Figure 5-1: Spatial mapping of absorbed dose rate
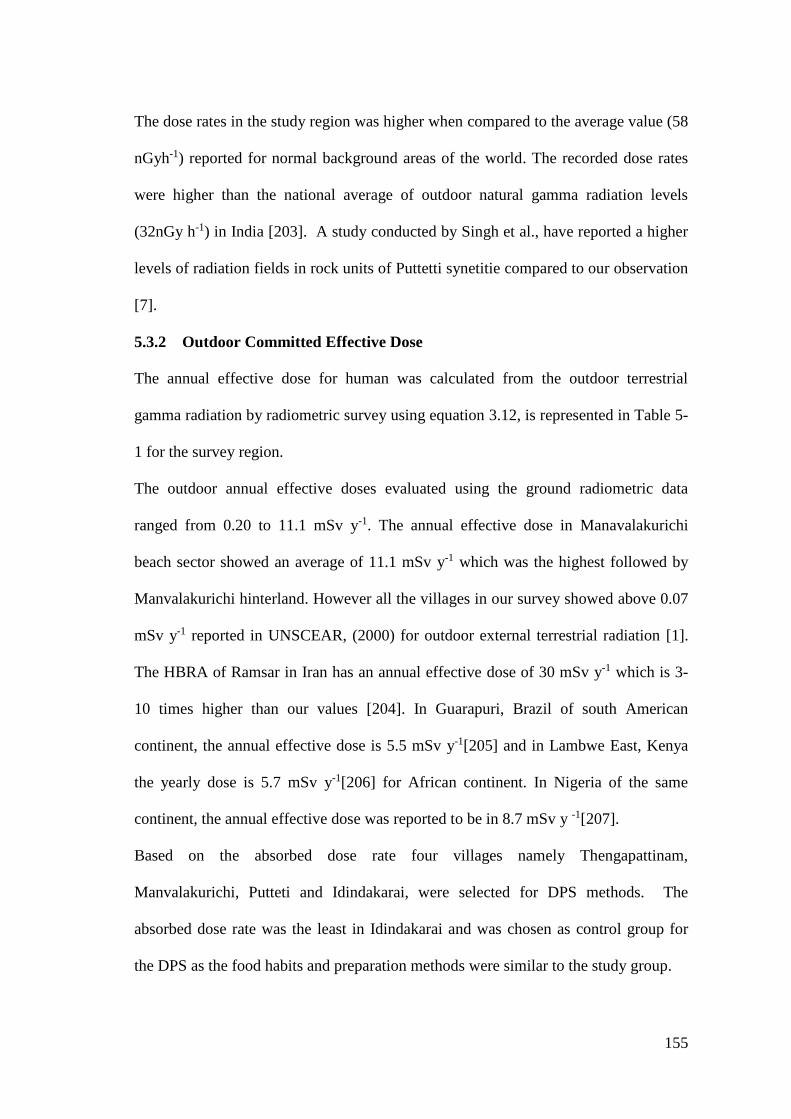
155
The dose rates in the study region was higher when compared to the average value (58
nGyh-1) reported for normal background areas of the world. The recorded dose rates
were higher than the national average of outdoor natural gamma radiation levels
(32nGy h-1) in India [203]. A study conducted by Singh et al., have reported a higher
levels of radiation fields in rock units of Puttetti synetitie compared to our observation
[7].
5.3.2 Outdoor Committed Effective Dose
The annual effective dose for human was calculated from the outdoor terrestrial
gamma radiation by radiometric survey using equation 3.12, is represented in Table 5-
1 for the survey region.
The outdoor annual effective doses evaluated using the ground radiometric data
ranged from 0.20 to 11.1 mSv y-1. The annual effective dose in Manavalakurichi
beach sector showed an average of 11.1 mSv y-1 which was the highest followed by
Manvalakurichi hinterland. However all the villages in our survey showed above 0.07
mSv y-1 reported in UNSCEAR, (2000) for outdoor external terrestrial radiation [1].
The HBRA of Ramsar in Iran has an annual effective dose of 30 mSv y-1 which is 3-
10 times higher than our values [204]. In Guarapuri, Brazil of south American
continent, the annual effective dose is 5.5 mSv y-1[205] and in Lambwe East, Kenya
the yearly dose is 5.7 mSv y-1[206] for African continent. In Nigeria of the same
continent, the annual effective dose was reported to be in 8.7 mSv y -1[207].
Based on the absorbed dose rate four villages namely Thengapattinam,
Manvalakurichi, Putteti and Idindakarai, were selected for DPS methods. The
absorbed dose rate was the least in Idindakarai and was chosen as control group for
the DPS as the food habits and preparation methods were similar to the study group.
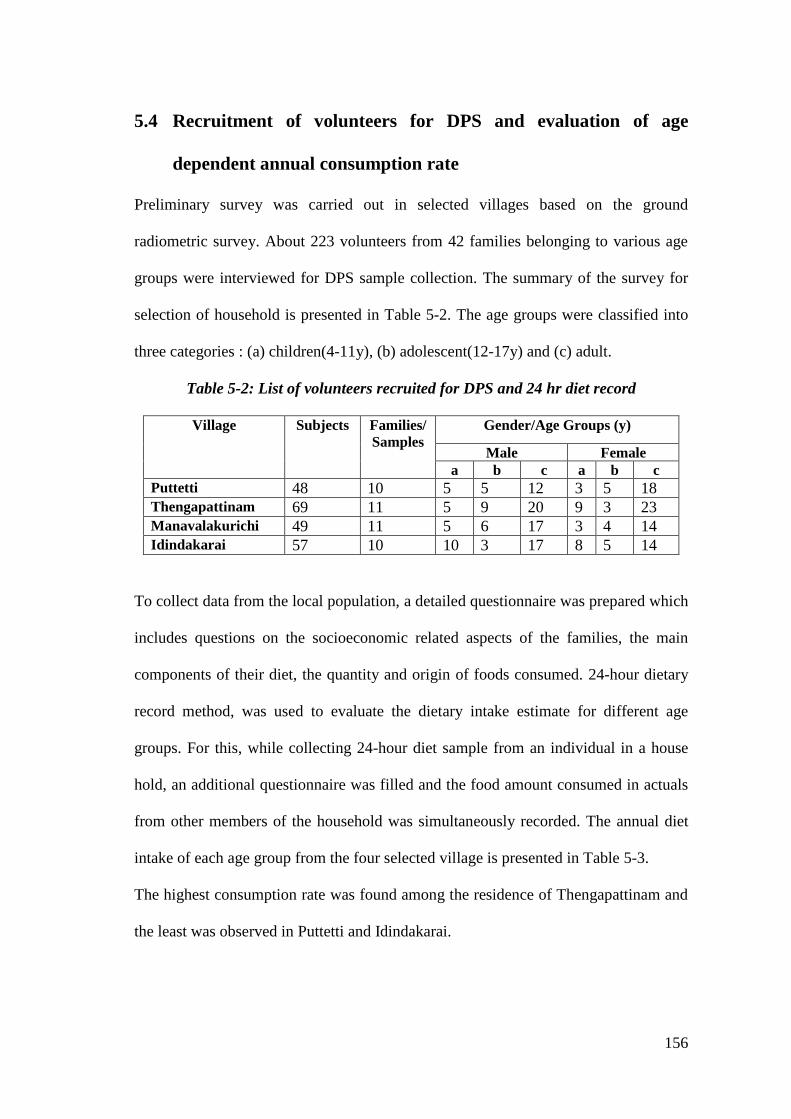
156
5.4 Recruitment of volunteers for DPS and evaluation of age
dependent annual consumption rate
Preliminary survey was carried out in selected villages based on the ground
radiometric survey. About 223 volunteers from 42 families belonging to various age
groups were interviewed for DPS sample collection. The summary of the survey for
selection of household is presented in Table 5-2. The age groups were classified into
three categories : (a) children(4-11y), (b) adolescent(12-17y) and (c) adult.
Table 5-2: List of volunteers recruited for DPS and 24 hr diet record
Village
Subjects
Families/
Samples
Gender/Age Groups (y)
Male Female
a b c a b c
Puttetti 48 10 5 5 12 3 5 18
Thengapattinam 69 11 5 9 20 9 3 23
Manavalakurichi 49 11 5 6 17 3 4 14
Idindakarai 57 10 10 3 17 8 5 14
To collect data from the local population, a detailed questionnaire was prepared which
includes questions on the socioeconomic related aspects of the families, the main
components of their diet, the quantity and origin of foods consumed. 24-hour dietary
record method, was used to evaluate the dietary intake estimate for different age
groups. For this, while collecting 24-hour diet sample from an individual in a house
hold, an additional questionnaire was filled and the food amount consumed in actuals
from other members of the household was simultaneously recorded. The annual diet
intake of each age group from the four selected village is presented in Table 5-3.
The highest consumption rate was found among the residence of Thengapattinam and
the least was observed in Puttetti and Idindakarai.
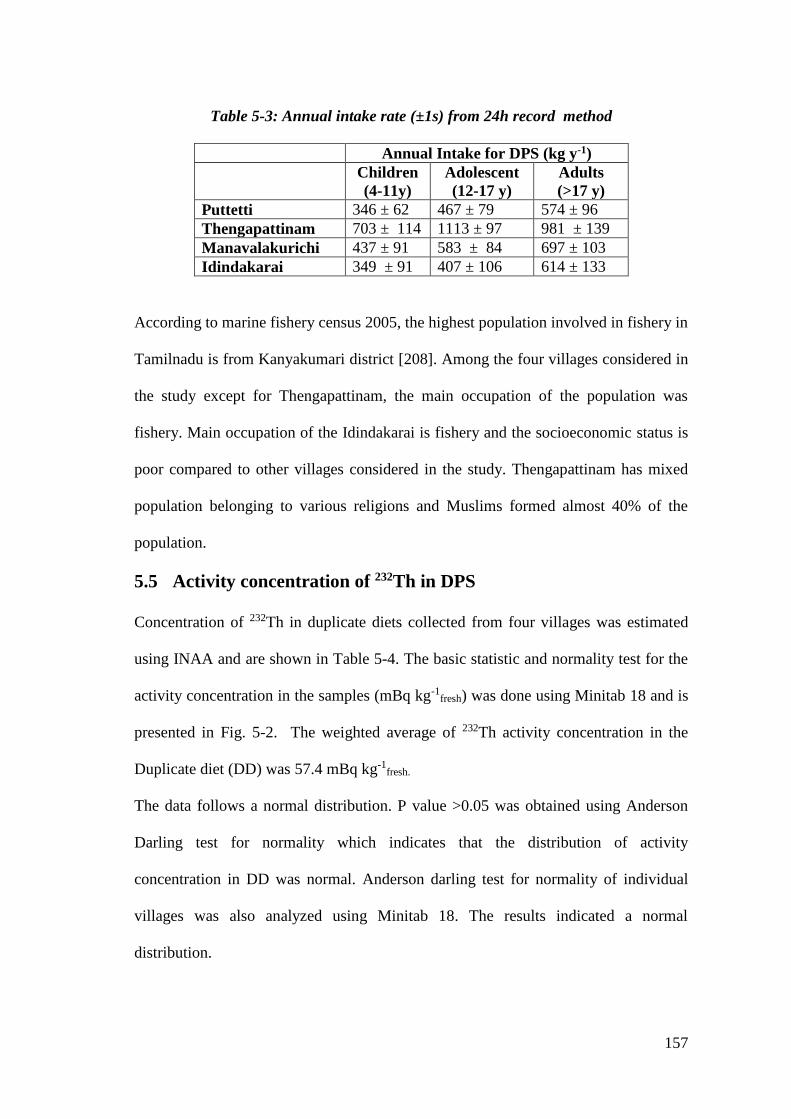
157
Table 5-3: Annual intake rate (±1s) from 24h record method
Annual Intake for DPS (kg y-1)
Children
(4-11y)
Adolescent
(12-17 y)
Adults
(>17 y)
Puttetti 346 ± 62 467 ± 79 574 ± 96
Thengapattinam 703 ± 114 1113 ± 97 981 ± 139
Manavalakurichi 437 ± 91 583 ± 84 697 ± 103
Idindakarai 349 ± 91 407 ± 106 614 ± 133
According to marine fishery census 2005, the highest population involved in fishery in
Tamilnadu is from Kanyakumari district [208]. Among the four villages considered in
the study except for Thengapattinam, the main occupation of the population was
fishery. Main occupation of the Idindakarai is fishery and the socioeconomic status is
poor compared to other villages considered in the study. Thengapattinam has mixed
population belonging to various religions and Muslims formed almost 40% of the
population.
5.5 Activity concentration of 232Th in DPS
Concentration of 232Th in duplicate diets collected from four villages was estimated
using INAA and are shown in Table 5-4. The basic statistic and normality test for the
activity concentration in the samples (mBq kg-1fresh) was done using Minitab 18 and is
presented in Fig. 5-2. The weighted average of 232Th activity concentration in the
Duplicate diet (DD) was 57.4 mBq kg-1fresh.
The data follows a normal distribution. P value >0.05 was obtained using Anderson
Darling test for normality which indicates that the distribution of activity
concentration in DD was normal. Anderson darling test for normality of individual
villages was also analyzed using Minitab 18. The results indicated a normal
distribution.
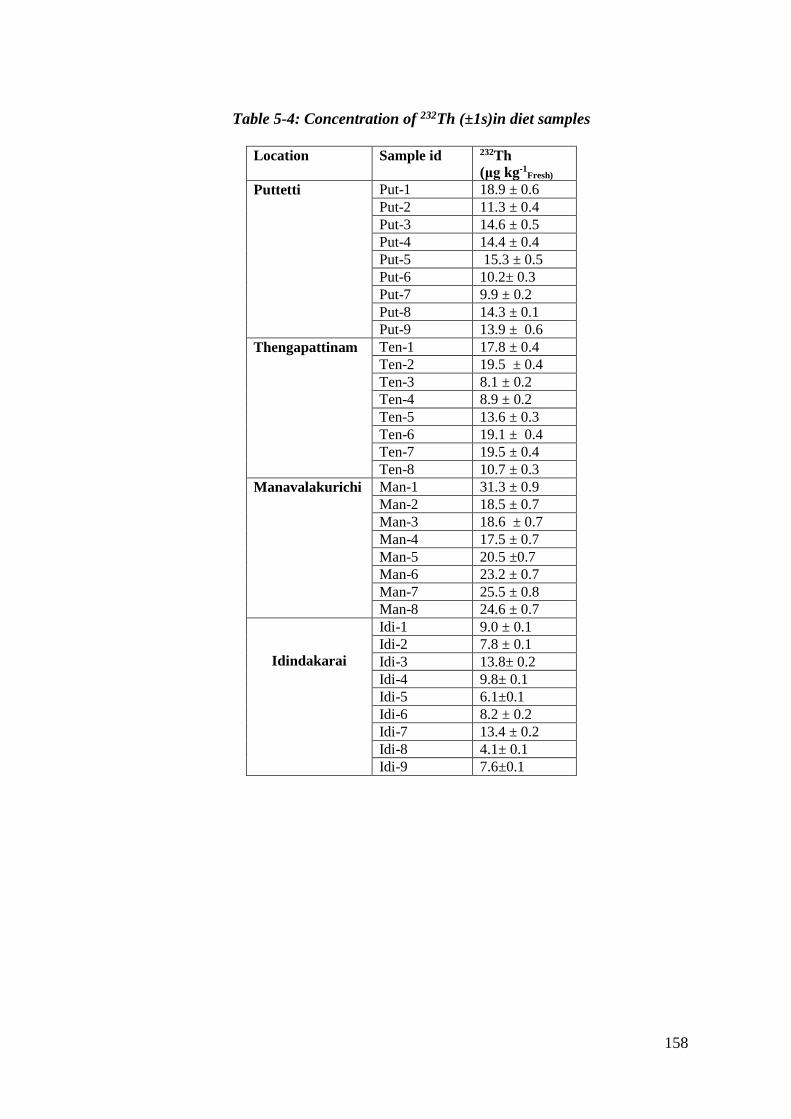
158
Table 5-4: Concentration of 232Th (±1s)in diet samples
Location Sample id 232Th
(μg kg-1Fresh)
Puttetti
Put-1 18.9 ± 0.6
Put-2 11.3 ± 0.4
Put-3 14.6 ± 0.5
Put-4 14.4 ± 0.4
Put-5 15.3 ± 0.5
Put-6 10.2± 0.3
Put-7 9.9 ± 0.2
Put-8 14.3 ± 0.1
Put-9 13.9 ± 0.6
Thengapattinam Ten-1 17.8 ± 0.4
Ten-2 19.5 ± 0.4
Ten-3 8.1 ± 0.2
Ten-4 8.9 ± 0.2
Ten-5 13.6 ± 0.3
Ten-6 19.1 ± 0.4
Ten-7 19.5 ± 0.4
Ten-8 10.7 ± 0.3
Manavalakurichi Man-1 31.3 ± 0.9
Man-2 18.5 ± 0.7
Man-3 18.6 ± 0.7
Man-4 17.5 ± 0.7
Man-5 20.5 ±0.7
Man-6 23.2 ± 0.7
Man-7 25.5 ± 0.8
Man-8 24.6 ± 0.7
Idindakarai
Idi-1 9.0 ± 0.1
Idi-2 7.8 ± 0.1
Idi-3 13.8± 0.2
Idi-4 9.8± 0.1
Idi-5 6.1±0.1
Idi-6 8.2 ± 0.2
Idi-7 13.4 ± 0.2
Idi-8 4.1± 0.1
Idi-9 7.6±0.1
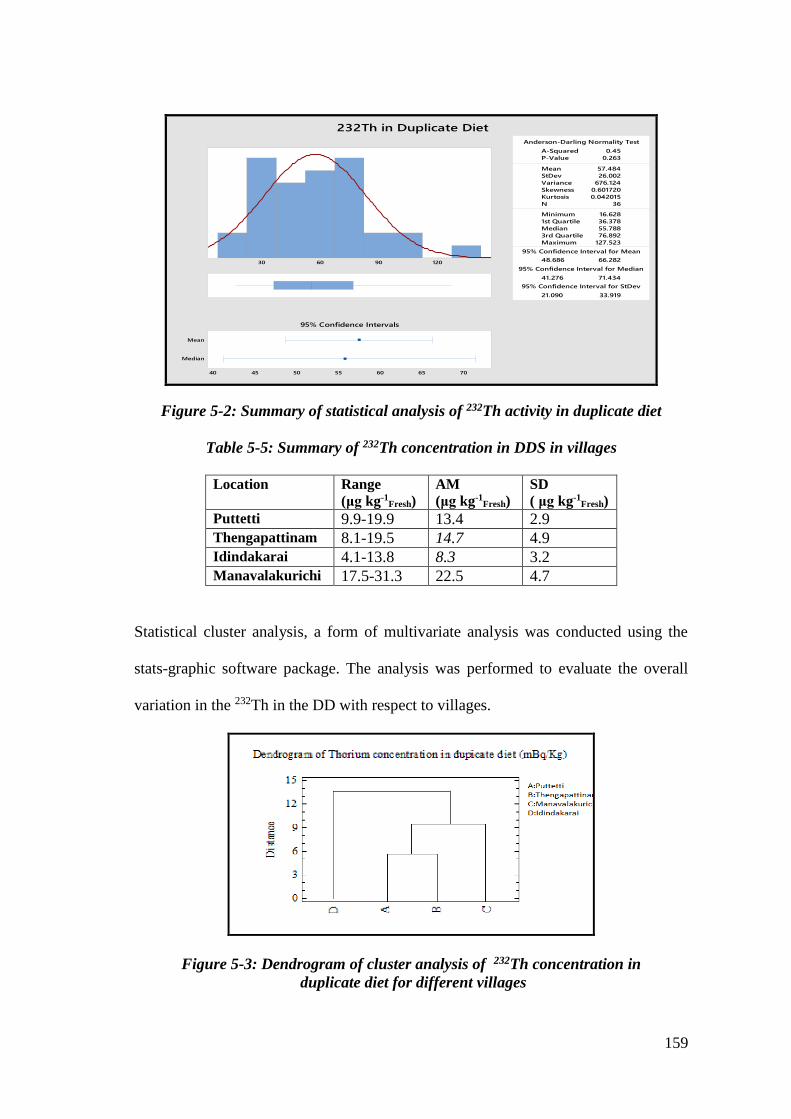
159
1st Quartile 36.378
Median 55.788
3rd Quartile 76.892
Maximum 127.523
48.686 66.282
41.276 71.434
21.090 33.919
A-Squared 0.45
P-Value 0.263
Mean 57.484
StDev 26.002
Variance 676.124
Skewness 0.601720
Kurtosis 0.042015
N 36
Minimum 16.628
Anderson-Darling Normality Test
95% Confidence Interval for Mean
95% Confidence Interval for Median
95% Confidence Interval for StDev
120906030
Median
Mean
70656055504540
95% Confidence Intervals
232Th in Duplicate Diet
Figure 5-2: Summary of statistical analysis of 232Th activity in duplicate diet
Table 5-5: Summary of 232Th concentration in DDS in villages
Location Range
(μg kg-1Fresh)
AM
(μg kg-1Fresh)
SD
( μg kg-1Fresh)
Puttetti 9.9-19.9 13.4 2.9
Thengapattinam 8.1-19.5 14.7 4.9
Idindakarai 4.1-13.8 8.3 3.2
Manavalakurichi 17.5-31.3 22.5 4.7
Statistical cluster analysis, a form of multivariate analysis was conducted using the
stats-graphic software package. The analysis was performed to evaluate the overall
variation in the 232Th in the DD with respect to villages.
Figure 5-3: Dendrogram of cluster analysis of 232Th concentration in
duplicate diet for different villages
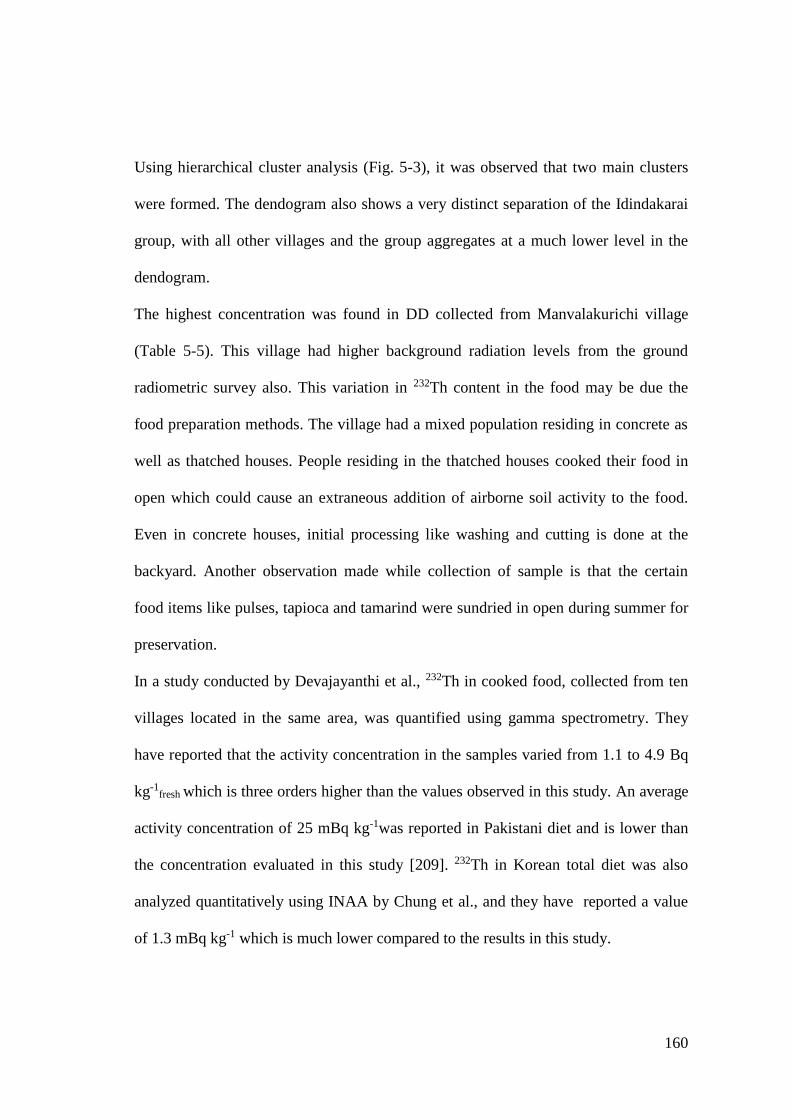
160
Using hierarchical cluster analysis (Fig. 5-3), it was observed that two main clusters
were formed. The dendogram also shows a very distinct separation of the Idindakarai
group, with all other villages and the group aggregates at a much lower level in the
dendogram.
The highest concentration was found in DD collected from Manvalakurichi village
(Table 5-5). This village had higher background radiation levels from the ground
radiometric survey also. This variation in 232Th content in the food may be due the
food preparation methods. The village had a mixed population residing in concrete as
well as thatched houses. People residing in the thatched houses cooked their food in
open which could cause an extraneous addition of airborne soil activity to the food.
Even in concrete houses, initial processing like washing and cutting is done at the
backyard. Another observation made while collection of sample is that the certain
food items like pulses, tapioca and tamarind were sundried in open during summer for
preservation.
In a study conducted by Devajayanthi et al., 232Th in cooked food, collected from ten
villages located in the same area, was quantified using gamma spectrometry. They
have reported that the activity concentration in the samples varied from 1.1 to 4.9 Bq
kg-1fresh which is three orders higher than the values observed in this study. An average
activity concentration of 25 mBq kg-1was reported in Pakistani diet and is lower than
the concentration evaluated in this study [209]. 232Th in Korean total diet was also
analyzed quantitatively using INAA by Chung et al., and they have reported a value
of 1.3 mBq kg-1 which is much lower compared to the results in this study.
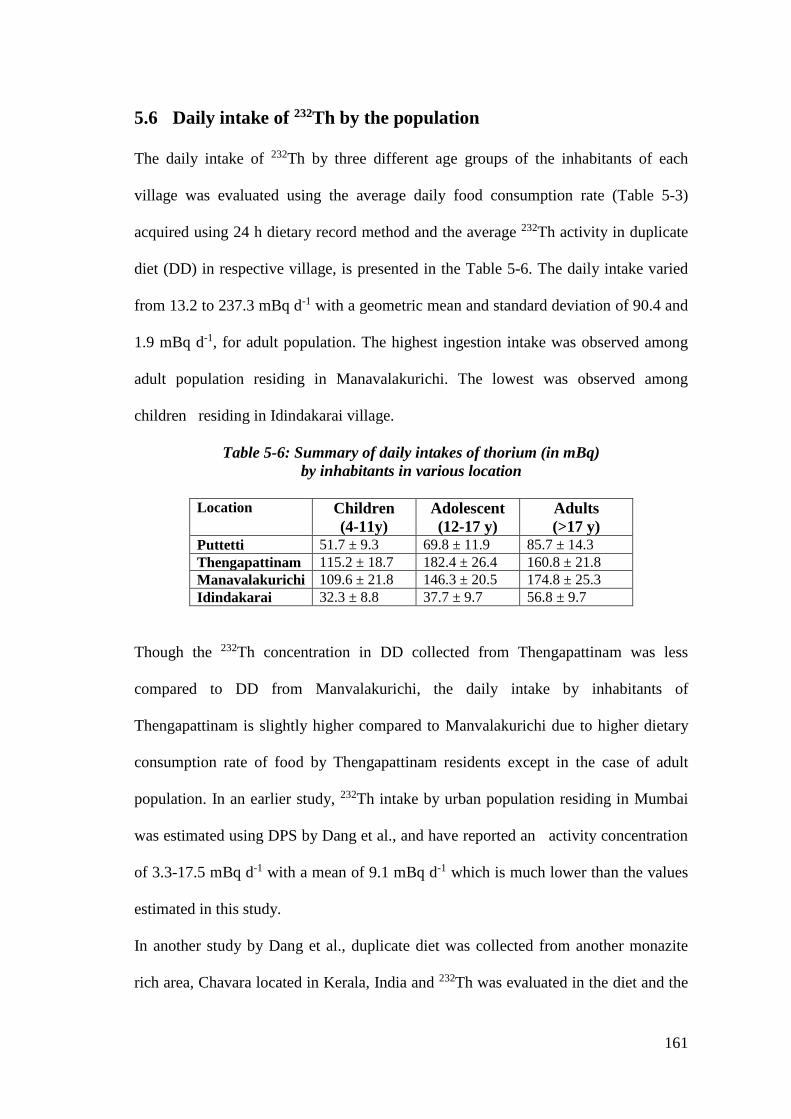
161
5.6 Daily intake of 232Th by the population
The daily intake of 232Th by three different age groups of the inhabitants of each
village was evaluated using the average daily food consumption rate (Table 5-3)
acquired using 24 h dietary record method and the average 232Th activity in duplicate
diet (DD) in respective village, is presented in the Table 5-6. The daily intake varied
from 13.2 to 237.3 mBq d-1 with a geometric mean and standard deviation of 90.4 and
1.9 mBq d-1, for adult population. The highest ingestion intake was observed among
adult population residing in Manavalakurichi. The lowest was observed among
children residing in Idindakarai village.
Table 5-6: Summary of daily intakes of thorium (in mBq)
by inhabitants in various location
Location Children
(4-11y)
Adolescent
(12-17 y)
Adults
(>17 y)
Puttetti 51.7 ± 9.3 69.8 ± 11.9 85.7 ± 14.3
Thengapattinam 115.2 ± 18.7 182.4 ± 26.4 160.8 ± 21.8
Manavalakurichi 109.6 ± 21.8 146.3 ± 20.5 174.8 ± 25.3
Idindakarai 32.3 ± 8.8 37.7 ± 9.7 56.8 ± 9.7
Though the 232Th concentration in DD collected from Thengapattinam was less
compared to DD from Manvalakurichi, the daily intake by inhabitants of
Thengapattinam is slightly higher compared to Manvalakurichi due to higher dietary
consumption rate of food by Thengapattinam residents except in the case of adult
population. In an earlier study, 232Th intake by urban population residing in Mumbai
was estimated using DPS by Dang et al., and have reported an activity concentration
of 3.3-17.5 mBq d-1 with a mean of 9.1 mBq d-1 which is much lower than the values
estimated in this study.
In another study by Dang et al., duplicate diet was collected from another monazite
rich area, Chavara located in Kerala, India and 232Th was evaluated in the diet and the
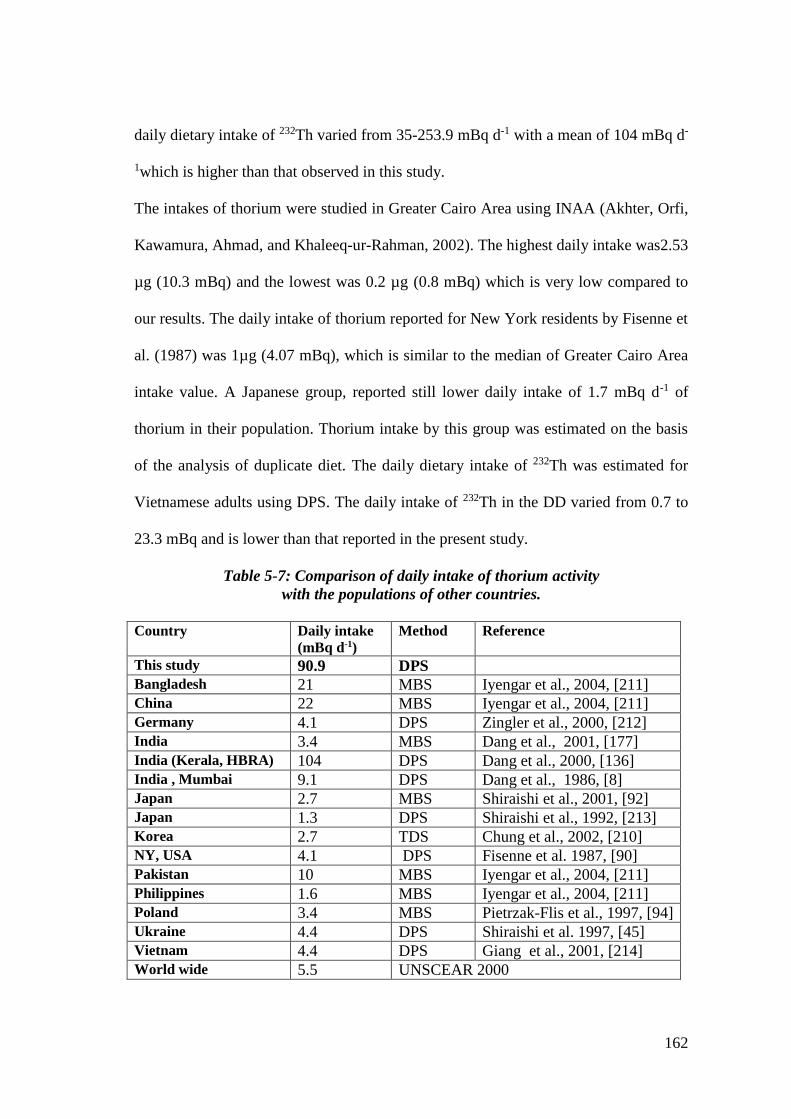
162
daily dietary intake of 232Th varied from 35-253.9 mBq d-1 with a mean of 104 mBq d-
1which is higher than that observed in this study.
The intakes of thorium were studied in Greater Cairo Area using INAA (Akhter, Orfi,
Kawamura, Ahmad, and Khaleeq-ur-Rahman, 2002). The highest daily intake was2.53
µg (10.3 mBq) and the lowest was 0.2 µg (0.8 mBq) which is very low compared to
our results. The daily intake of thorium reported for New York residents by Fisenne et
al. (1987) was 1µg (4.07 mBq), which is similar to the median of Greater Cairo Area
intake value. A Japanese group, reported still lower daily intake of 1.7 mBq d-1 of
thorium in their population. Thorium intake by this group was estimated on the basis
of the analysis of duplicate diet. The daily dietary intake of 232Th was estimated for
Vietnamese adults using DPS. The daily intake of 232Th in the DD varied from 0.7 to
23.3 mBq and is lower than that reported in the present study.
Table 5-7: Comparison of daily intake of thorium activity
with the populations of other countries.
Country Daily intake
(mBq d-1)
Method Reference
This study 90.9 DPS
Bangladesh 21 MBS Iyengar et al., 2004, [211]
China 22 MBS Iyengar et al., 2004, [211]
Germany 4.1 DPS Zingler et al., 2000, [212]
India 3.4 MBS Dang et al., 2001, [177]
India (Kerala, HBRA) 104 DPS Dang et al., 2000, [136]
India , Mumbai 9.1 DPS Dang et al., 1986, [8]
Japan 2.7 MBS Shiraishi et al., 2001, [92]
Japan 1.3 DPS Shiraishi et al., 1992, [213]
Korea 2.7 TDS Chung et al., 2002, [210]
NY, USA 4.1 DPS Fisenne et al. 1987, [90]
Pakistan 10 MBS Iyengar et al., 2004, [211]
Philippines 1.6 MBS Iyengar et al., 2004, [211]
Poland 3.4 MBS Pietrzak-Flis et al., 1997, [94]
Ukraine 4.4 DPS Shiraishi et al. 1997, [45]
Vietnam 4.4 DPS Giang et al., 2001, [214]
World wide 5.5 UNSCEAR 2000
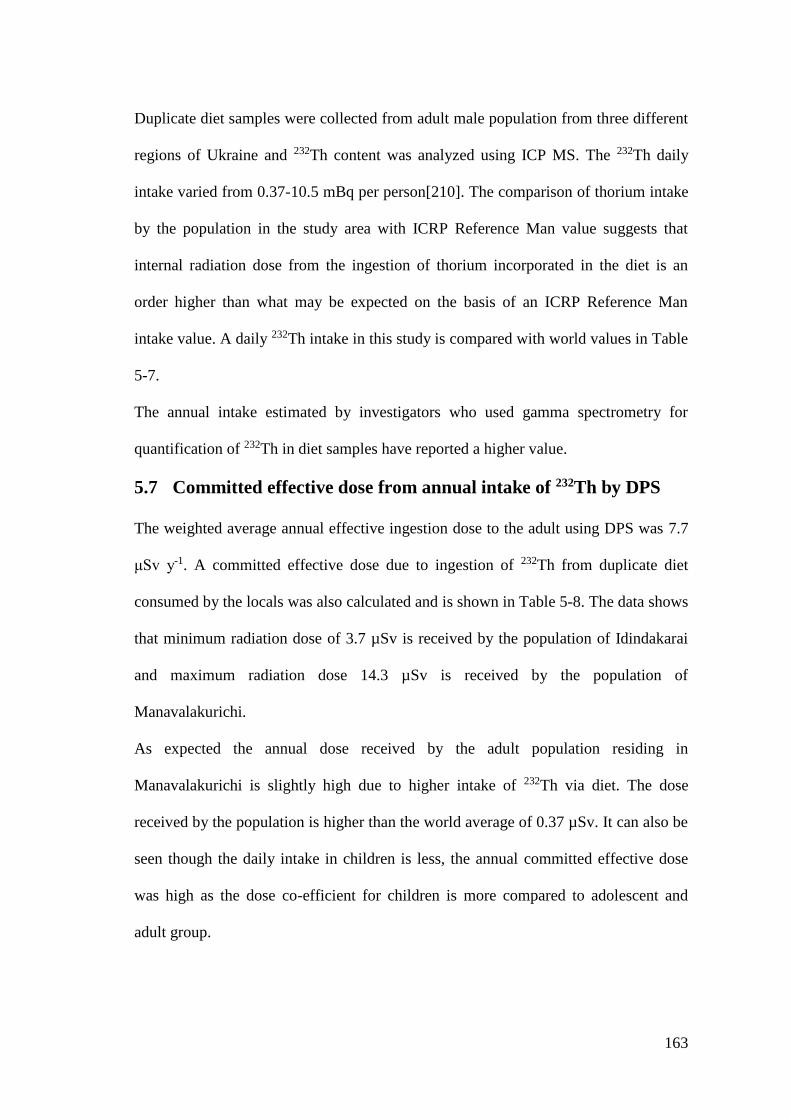
163
Duplicate diet samples were collected from adult male population from three different
regions of Ukraine and 232Th content was analyzed using ICP MS. The 232Th daily
intake varied from 0.37-10.5 mBq per person[210]. The comparison of thorium intake
by the population in the study area with ICRP Reference Man value suggests that
internal radiation dose from the ingestion of thorium incorporated in the diet is an
order higher than what may be expected on the basis of an ICRP Reference Man
intake value. A daily 232Th intake in this study is compared with world values in Table
5-7.
The annual intake estimated by investigators who used gamma spectrometry for
quantification of 232Th in diet samples have reported a higher value.
5.7 Committed effective dose from annual intake of 232Th by DPS
The weighted average annual effective ingestion dose to the adult using DPS was 7.7
μSv y-1. A committed effective dose due to ingestion of 232Th from duplicate diet
consumed by the locals was also calculated and is shown in Table 5-8. The data shows
that minimum radiation dose of 3.7 µSv is received by the population of Idindakarai
and maximum radiation dose 14.3 µSv is received by the population of
Manavalakurichi.
As expected the annual dose received by the adult population residing in
Manavalakurichi is slightly high due to higher intake of 232Th via diet. The dose
received by the population is higher than the world average of 0.37 µSv. It can also be
seen though the daily intake in children is less, the annual committed effective dose
was high as the dose co-efficient for children is more compared to adolescent and
adult group.
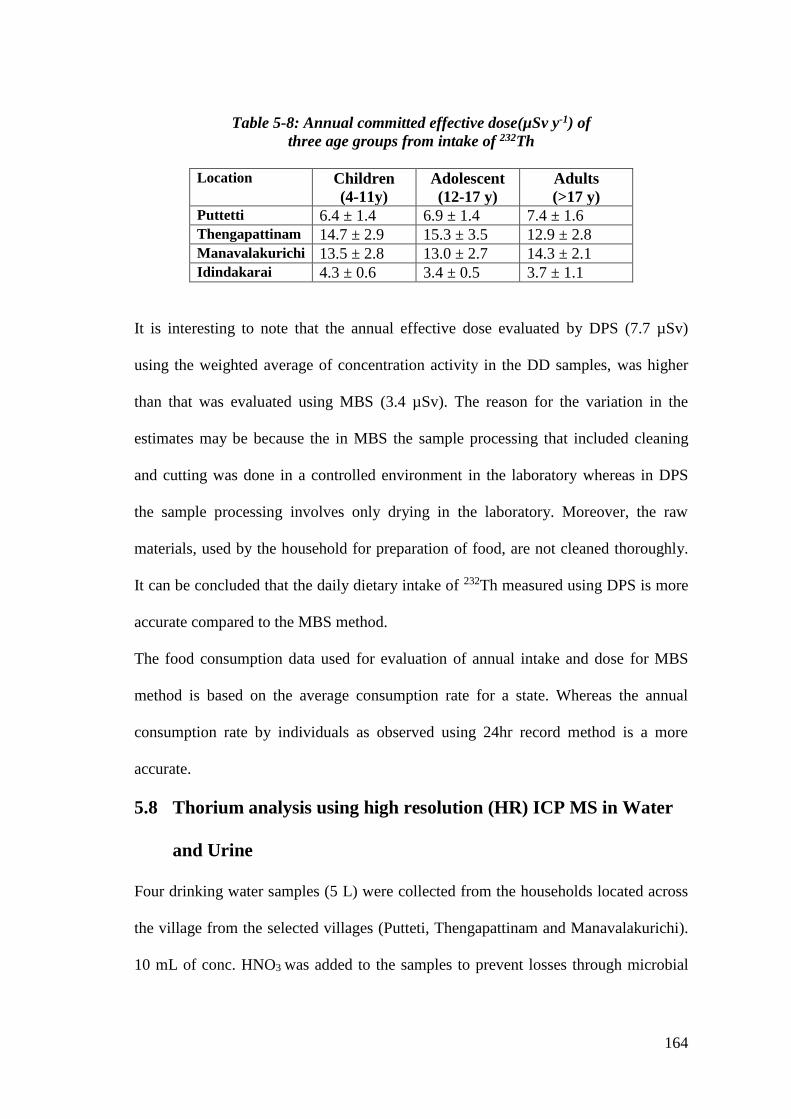
164
Table 5-8: Annual committed effective dose(µSv y-1) of
three age groups from intake of 232Th
Location Children
(4-11y)
Adolescent
(12-17 y)
Adults
(>17 y)
Puttetti 6.4 ± 1.4 6.9 ± 1.4 7.4 ± 1.6
Thengapattinam 14.7 ± 2.9 15.3 ± 3.5 12.9 ± 2.8
Manavalakurichi 13.5 ± 2.8 13.0 ± 2.7 14.3 ± 2.1
Idindakarai 4.3 ± 0.6 3.4 ± 0.5 3.7 ± 1.1
It is interesting to note that the annual effective dose evaluated by DPS (7.7 µSv)
using the weighted average of concentration activity in the DD samples, was higher
than that was evaluated using MBS (3.4 µSv). The reason for the variation in the
estimates may be because the in MBS the sample processing that included cleaning
and cutting was done in a controlled environment in the laboratory whereas in DPS
the sample processing involves only drying in the laboratory. Moreover, the raw
materials, used by the household for preparation of food, are not cleaned thoroughly.
It can be concluded that the daily dietary intake of 232Th measured using DPS is more
accurate compared to the MBS method.
The food consumption data used for evaluation of annual intake and dose for MBS
method is based on the average consumption rate for a state. Whereas the annual
consumption rate by individuals as observed using 24hr record method is a more
accurate.
5.8 Thorium analysis using high resolution (HR) ICP MS in Water
and Urine
Four drinking water samples (5 L) were collected from the households located across
the village from the selected villages (Putteti, Thengapattinam and Manavalakurichi).
10 mL of conc. HNO3 was added to the samples to prevent losses through microbial
165
activity and adsorption on the vessel walls. In case of urine, samples were collected
from healthy individual volunteers belonging to two different villages in the study
area, namely Putteti and Manavalakurichi. Care was taken not to include volunteers
who had any history of previous occupational exposure. Volunteers were asked to
collect total urine for 24 h under normal living habits in pre cleaned polyethylene
bottles. 10 mL of conc. HNO3 was added to the samples to avoid losses through
microbial activity and adsorption on the vessel walls. The samples were spiked with
229Th tracer. Thorium in the sample was co-precipitated with calcium phosphate
precipitate. 232Th was separated using an ion exchange procedure. The separated
thorium was analyzed using HR ICP-MS. The radiochemical recovery of the
procedure was determined using alpha spectrometry of 229Th.
For quality control, trace Th determination was carried out using NIST SRMs: liquid
Th reference standard (3159), spinach leaves (1570a) and orchard leaves (1571).
Standard solution of thorium (10 ppm stock) was procured from SPEX Co. Ltd., USA,
from which sub-solutions with concentrations 1, 10, 20, 30, 40 and 50 µg kg-1 were
prepared for calibrating the instrument.
A sector field (SF) ICP MS, model Nu attom, manufactured by Nu instrument, UK
was used to measure 232Th in the samples. The sample eluent was diluted with
deionized MilliQ water up to 10 mL and acidified to 2% HNO3. Prior to analysis, the
instrument was optimized separately for 232Th using 1 µg kg-1 solution, for nebulizer
gas flow, flow rate, sensitivity, peak width, etc., and was allowed to stabilize. The
samples were analyzed with sufficient washings in between to negate the memory of
previous sample, and to obtain stable thorium peak representing the sample.
Intensities in the form of counts per second (cps) were acquired for each sample which
166
were further treated with calibration plots for quantification by automated in-built
processing software NuQuant®.
The detection limit LD was determined according to the equation
3 b
DLslope
(5.1)
where σb represents the standard deviation of 10 blank measurements (cps) and slope
is an equipment factor that relates the measured intensity of the ion to the element
concentration in the solution. The detection limit was 0.006 ng L−1 for Th.
Because the response of the mass spectrometer in counts per second is directly
proportional to the concentration of a given element in a sample, it is relatively easy to
calibrate the system using the external standards of differing concentrations. Any
sample entered into the mass spectrometer under exactly the same conditions will
return a count rate, which can be converted directly to concentration for each element
from a calibration curve.
Thorium concentrations were quantified from interpolating the intensities (cps)
obtained for the samples on the calibration graphs using linear equation y = mx + c,
where x is the concentration of thorium in µg kg-1, y is the intensity, m is the slope
and c is the intercept. Instrument was calibrated using 1, 10, 20, 30, 40 and 50 µg kg-1
Th solution prepared from stock solution., and a coefficient of correlation R2 = 0.997
was obtained. The robustness of the calibration graph was validated using NIST
SRMs and repeated analysis of 10 ng mL-1 of Th solution.
As there was no matrix matching reference material, precision and accuracy were
calculated by repeated analysis of 10 µg kg-1 of the standard solution prepared from
NIST reference standard solution and also using NIST SRMs.
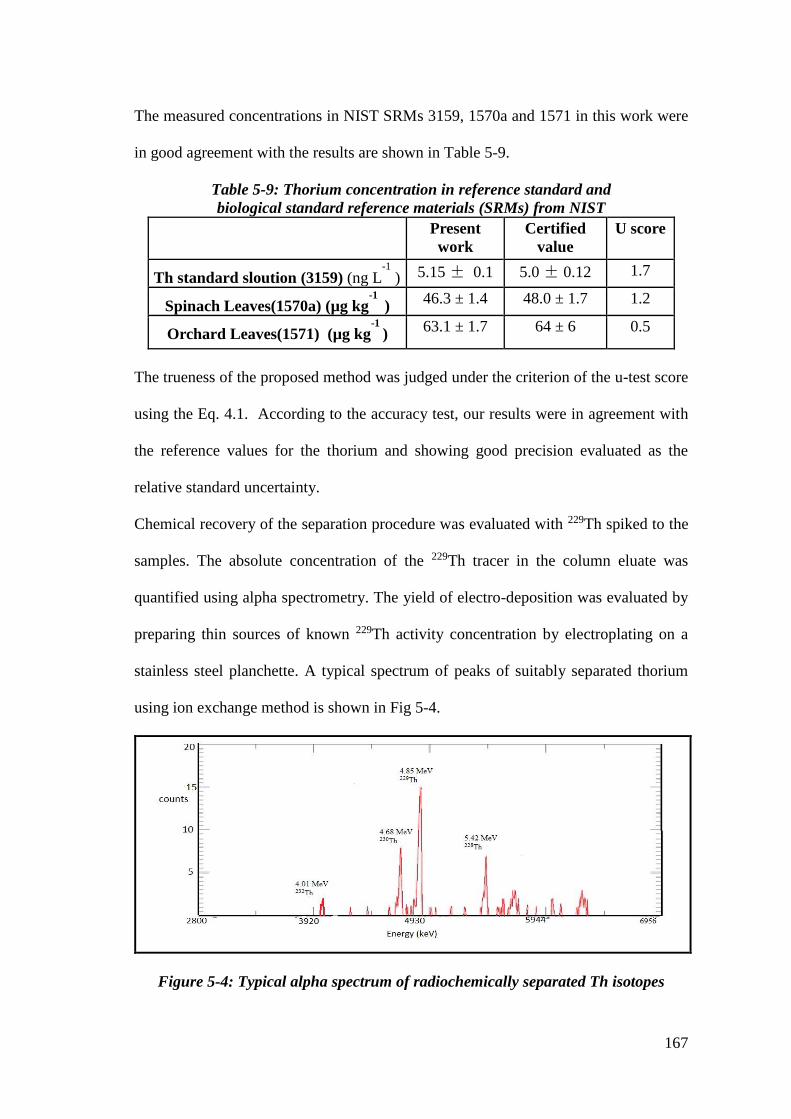
167
The measured concentrations in NIST SRMs 3159, 1570a and 1571 in this work were
in good agreement with the results are shown in Table 5-9.
Table 5-9: Thorium concentration in reference standard and
biological standard reference materials (SRMs) from NIST
Present
work Certified
value U score
Th standard sloution (3159) (ng L-1
) 5.15 ± 0.1 5.0 ± 0.12 1.7
Spinach Leaves(1570a) (µg kg-1
) 46.3 ± 1.4 48.0 ± 1.7 1.2
Orchard Leaves(1571) (µg kg-1
) 63.1 ± 1.7 64 ± 6 0.5
The trueness of the proposed method was judged under the criterion of the u-test score
using the Eq. 4.1. According to the accuracy test, our results were in agreement with
the reference values for the thorium and showing good precision evaluated as the
relative standard uncertainty.
Chemical recovery of the separation procedure was evaluated with 229Th spiked to the
samples. The absolute concentration of the 229Th tracer in the column eluate was
quantified using alpha spectrometry. The yield of electro-deposition was evaluated by
preparing thin sources of known 229Th activity concentration by electroplating on a
stainless steel planchette. A typical spectrum of peaks of suitably separated thorium
using ion exchange method is shown in Fig 5-4.
Figure 5-4: Typical alpha spectrum of radiochemically separated Th isotopes
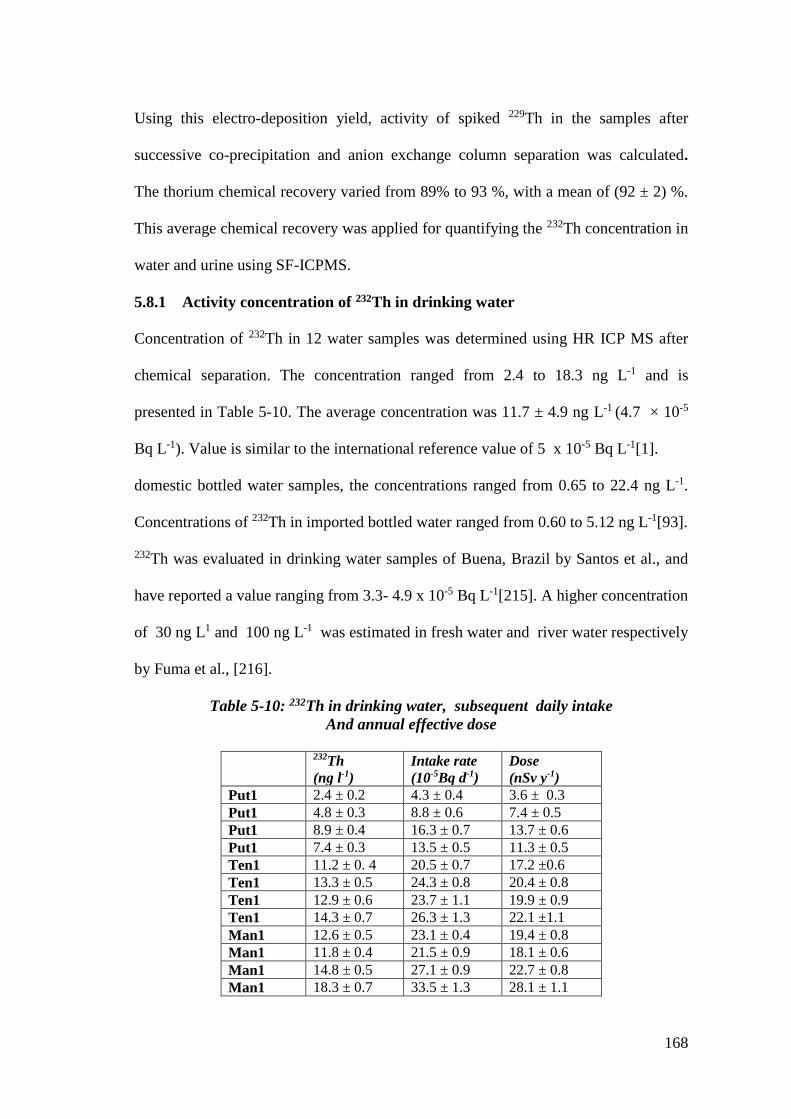
168
Using this electro-deposition yield, activity of spiked 229Th in the samples after
successive co-precipitation and anion exchange column separation was calculated.
The thorium chemical recovery varied from 89% to 93 %, with a mean of (92 ± 2) %.
This average chemical recovery was applied for quantifying the 232Th concentration in
water and urine using SF-ICPMS.
5.8.1 Activity concentration of 232Th in drinking water
Concentration of 232Th in 12 water samples was determined using HR ICP MS after
chemical separation. The concentration ranged from 2.4 to 18.3 ng L-1 and is
presented in Table 5-10. The average concentration was 11.7 ± 4.9 ng L-1 (4.7 × 10⁻⁵
Bq L-1). Value is similar to the international reference value of 5 x 10⁻⁵ Bq L-1[1].
domestic bottled water samples, the concentrations ranged from 0.65 to 22.4 ng L-1.
Concentrations of 232Th in imported bottled water ranged from 0.60 to 5.12 ng L-1[93].
232Th was evaluated in drinking water samples of Buena, Brazil by Santos et al., and
have reported a value ranging from 3.3- 4.9 x 10⁻⁵ Bq L-1[215]. A higher concentration
of 30 ng L1 and 100 ng L-1 was estimated in fresh water and river water respectively
by Fuma et al., [216].
Table 5-10: 232Th in drinking water, subsequent daily intake
And annual effective dose
232Th
(ng l-1)
Intake rate
(10-5Bq d-1)
Dose
(nSv y-1)
Put1 2.4 ± 0.2 4.3 ± 0.4 3.6 ± 0.3
Put1 4.8 ± 0.3 8.8 ± 0.6 7.4 ± 0.5
Put1 8.9 ± 0.4 16.3 ± 0.7 13.7 ± 0.6
Put1 7.4 ± 0.3 13.5 ± 0.5 11.3 ± 0.5
Ten1 11.2 ± 0. 4 20.5 ± 0.7 17.2 ±0.6
Ten1 13.3 ± 0.5 24.3 ± 0.8 20.4 ± 0.8
Ten1 12.9 ± 0.6 23.7 ± 1.1 19.9 ± 0.9
Ten1 14.3 ± 0.7 26.3 ± 1.3 22.1 ±1.1
Man1 12.6 ± 0.5 23.1 ± 0.4 19.4 ± 0.8
Man1 11.8 ± 0.4 21.5 ± 0.9 18.1 ± 0.6
Man1 14.8 ± 0.5 27.1 ± 0.9 22.7 ± 0.8
Man1 18.3 ± 0.7 33.5 ± 1.3 28.1 ± 1.1
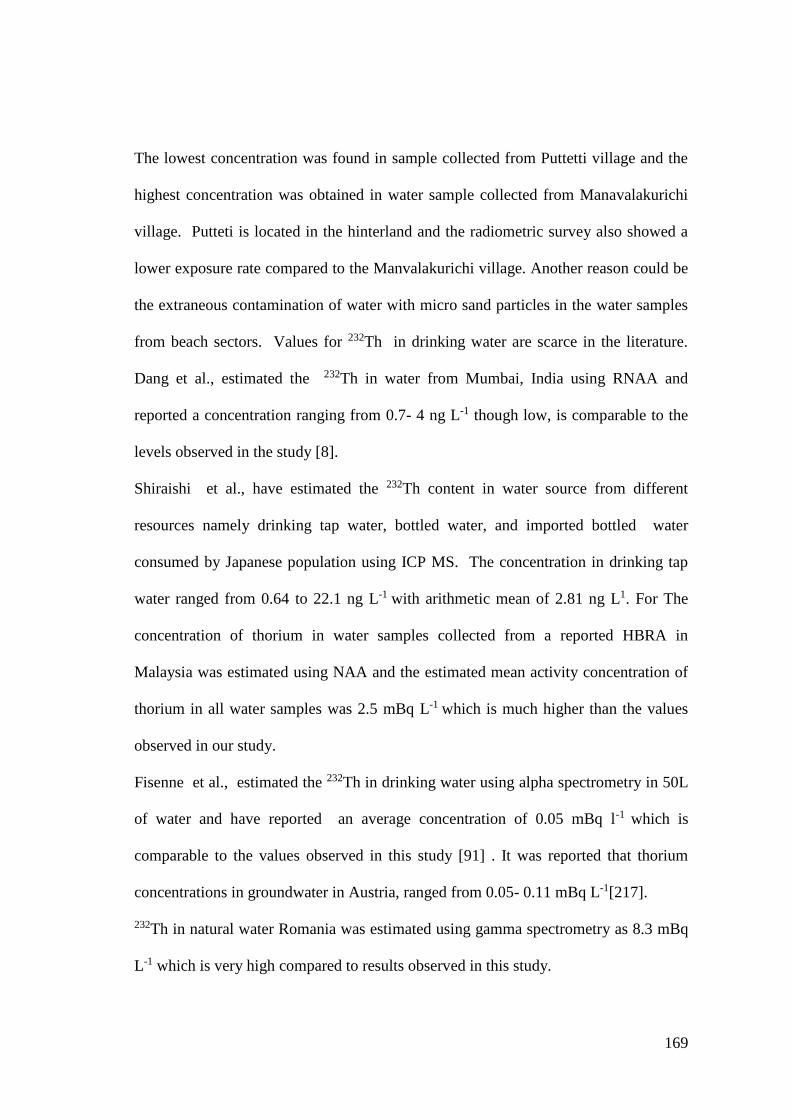
169
The lowest concentration was found in sample collected from Puttetti village and the
highest concentration was obtained in water sample collected from Manavalakurichi
village. Putteti is located in the hinterland and the radiometric survey also showed a
lower exposure rate compared to the Manvalakurichi village. Another reason could be
the extraneous contamination of water with micro sand particles in the water samples
from beach sectors. Values for 232Th in drinking water are scarce in the literature.
Dang et al., estimated the 232Th in water from Mumbai, India using RNAA and
reported a concentration ranging from 0.7- 4 ng L-1 though low, is comparable to the
levels observed in the study [8].
Shiraishi et al., have estimated the 232Th content in water source from different
resources namely drinking tap water, bottled water, and imported bottled water
consumed by Japanese population using ICP MS. The concentration in drinking tap
water ranged from 0.64 to 22.1 ng L-1 with arithmetic mean of 2.81 ng L1. For The
concentration of thorium in water samples collected from a reported HBRA in
Malaysia was estimated using NAA and the estimated mean activity concentration of
thorium in all water samples was 2.5 mBq L-1 which is much higher than the values
observed in our study.
Fisenne et al., estimated the 232Th in drinking water using alpha spectrometry in 50L
of water and have reported an average concentration of 0.05 mBq l-1 which is
comparable to the values observed in this study [91] . It was reported that thorium
concentrations in groundwater in Austria, ranged from 0.05- 0.11 mBq L-1[217].
232Th in natural water Romania was estimated using gamma spectrometry as 8.3 mBq
L-1 which is very high compared to results observed in this study.
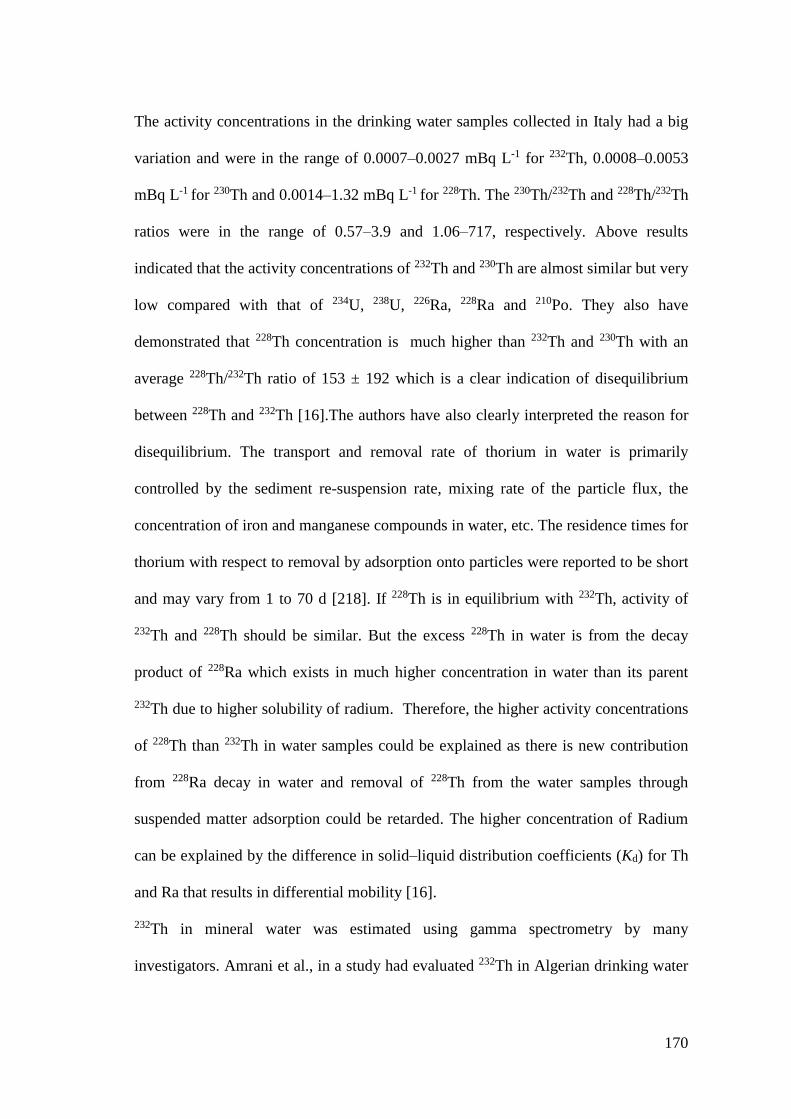
170
The activity concentrations in the drinking water samples collected in Italy had a big
variation and were in the range of 0.0007–0.0027 mBq L-1 for 232Th, 0.0008–0.0053
mBq L-1 for 230Th and 0.0014–1.32 mBq L-1 for 228Th. The 230Th/232Th and 228Th/232Th
ratios were in the range of 0.57–3.9 and 1.06–717, respectively. Above results
indicated that the activity concentrations of 232Th and 230Th are almost similar but very
low compared with that of 234U, 238U, 226Ra, 228Ra and 210Po. They also have
demonstrated that 228Th concentration is much higher than 232Th and 230Th with an
average 228Th/232Th ratio of 153 ± 192 which is a clear indication of disequilibrium
between 228Th and 232Th [16].The authors have also clearly interpreted the reason for
disequilibrium. The transport and removal rate of thorium in water is primarily
controlled by the sediment re-suspension rate, mixing rate of the particle flux, the
concentration of iron and manganese compounds in water, etc. The residence times for
thorium with respect to removal by adsorption onto particles were reported to be short
and may vary from 1 to 70 d [218]. If 228Th is in equilibrium with 232Th, activity of
232Th and 228Th should be similar. But the excess 228Th in water is from the decay
product of 228Ra which exists in much higher concentration in water than its parent
232Th due to higher solubility of radium. Therefore, the higher activity concentrations
of 228Th than 232Th in water samples could be explained as there is new contribution
from 228Ra decay in water and removal of 228Th from the water samples through
suspended matter adsorption could be retarded. The higher concentration of Radium
can be explained by the difference in solid–liquid distribution coefficients (Kd) for Th
and Ra that results in differential mobility [16].
232Th in mineral water was estimated using gamma spectrometry by many
investigators. Amrani et al., in a study had evaluated 232Th in Algerian drinking water
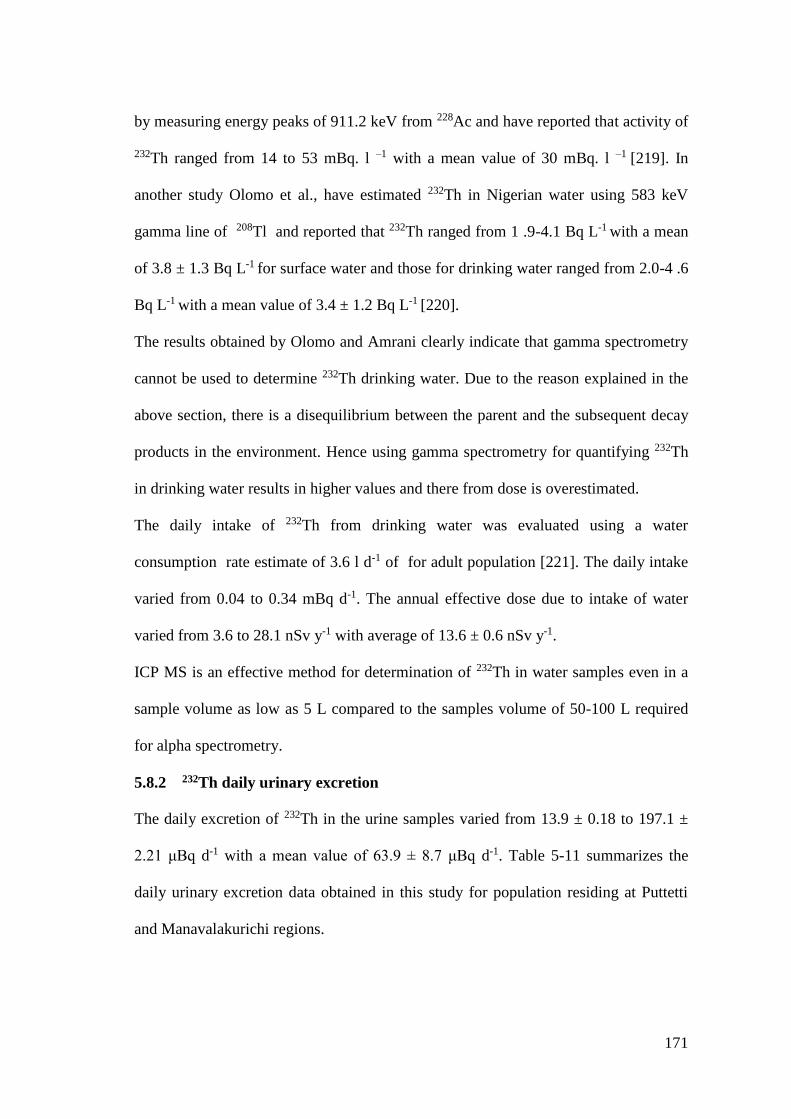
171
by measuring energy peaks of 911.2 keV from 228Ac and have reported that activity of
232Th ranged from 14 to 53 mBq. l –1 with a mean value of 30 mBq. l –1 [219]. In
another study Olomo et al., have estimated 232Th in Nigerian water using 583 keV
gamma line of 208Tl and reported that 232Th ranged from 1 .9-4.1 Bq L-1 with a mean
of 3.8 ± 1.3 Bq L-1 for surface water and those for drinking water ranged from 2.0-4 .6
Bq L-1 with a mean value of 3.4 ± 1.2 Bq L-1 [220].
The results obtained by Olomo and Amrani clearly indicate that gamma spectrometry
cannot be used to determine 232Th drinking water. Due to the reason explained in the
above section, there is a disequilibrium between the parent and the subsequent decay
products in the environment. Hence using gamma spectrometry for quantifying 232Th
in drinking water results in higher values and there from dose is overestimated.
The daily intake of 232Th from drinking water was evaluated using a water
consumption rate estimate of 3.6 l d-1 of for adult population [221]. The daily intake
varied from 0.04 to 0.34 mBq d-1. The annual effective dose due to intake of water
varied from 3.6 to 28.1 nSv y-1 with average of 13.6 ± 0.6 nSv y-1.
ICP MS is an effective method for determination of 232Th in water samples even in a
sample volume as low as 5 L compared to the samples volume of 50-100 L required
for alpha spectrometry.
5.8.2 232Th daily urinary excretion
The daily excretion of 232Th in the urine samples varied from 13.9 ± 0.18 to 197.1 ±
2.21 μBq d-1 with a mean value of 63.9 ± 8.7 μBq d-1. Table 5-11 summarizes the
daily urinary excretion data obtained in this study for population residing at Puttetti
and Manavalakurichi regions.
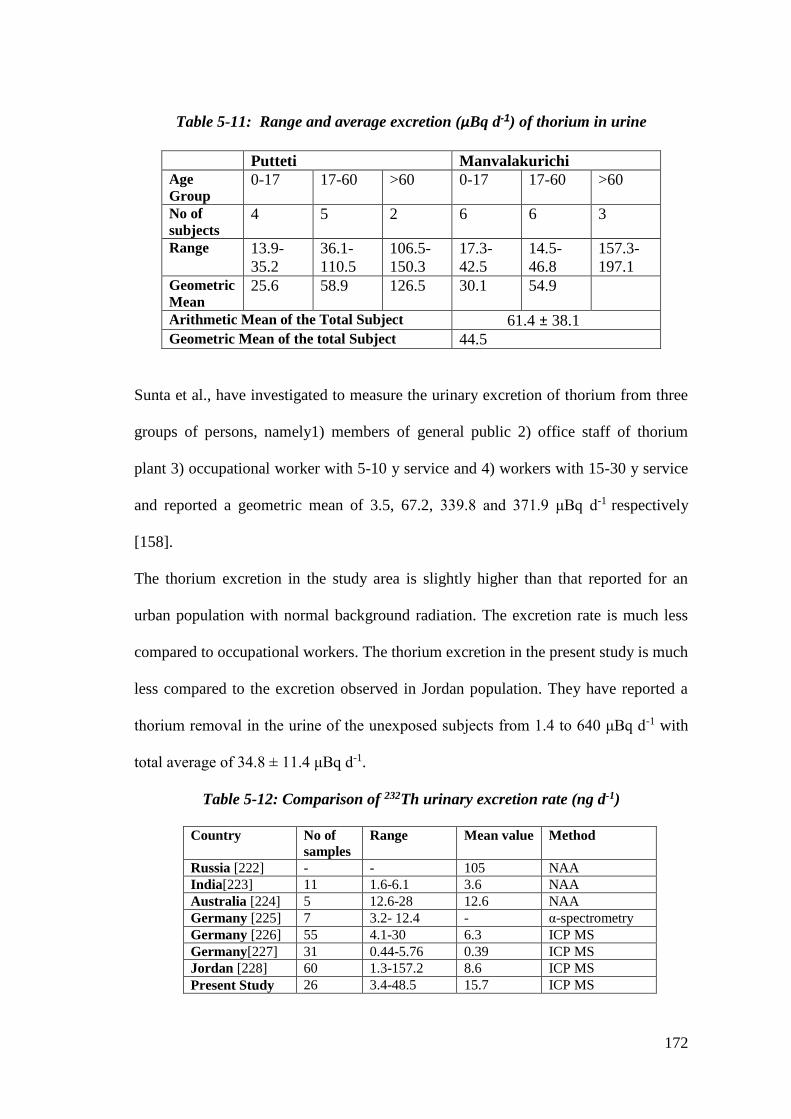
172
Table 5-11: Range and average excretion (μBq d-1) of thorium in urine
Putteti Manvalakurichi
Age
Group 0-17 17-60 >60 0-17 17-60 >60
No of
subjects 4 5 2 6 6 3
Range 13.9-
35.2
36.1-
110.5
106.5-
150.3
17.3-
42.5
14.5-
46.8
157.3-
197.1
Geometric
Mean 25.6 58.9 126.5 30.1 54.9
Arithmetic Mean of the Total Subject 61.4 ± 38.1 Geometric Mean of the total Subject 44.5
Sunta et al., have investigated to measure the urinary excretion of thorium from three
groups of persons, namely1) members of general public 2) office staff of thorium
plant 3) occupational worker with 5-10 y service and 4) workers with 15-30 y service
and reported a geometric mean of 3.5, 67.2, 339.8 and 371.9 μBq d-1 respectively
[158].
The thorium excretion in the study area is slightly higher than that reported for an
urban population with normal background radiation. The excretion rate is much less
compared to occupational workers. The thorium excretion in the present study is much
less compared to the excretion observed in Jordan population. They have reported a
thorium removal in the urine of the unexposed subjects from 1.4 to 640 μBq d-1 with
total average of 34.8 ± 11.4 μBq d-1.
Table 5-12: Comparison of 232Th urinary excretion rate (ng d-1)
Country No of
samples
Range Mean value Method
Russia [222] - - 105 NAA
India[223] 11 1.6-6.1 3.6 NAA
Australia [224] 5 12.6-28 12.6 NAA
Germany [225] 7 3.2- 12.4 - α-spectrometry
Germany [226] 55 4.1-30 6.3 ICP MS
Germany[227] 31 0.44-5.76 0.39 ICP MS
Jordan [228] 60 1.3-157.2 8.6 ICP MS
Present Study 26 3.4-48.5 15.7 ICP MS
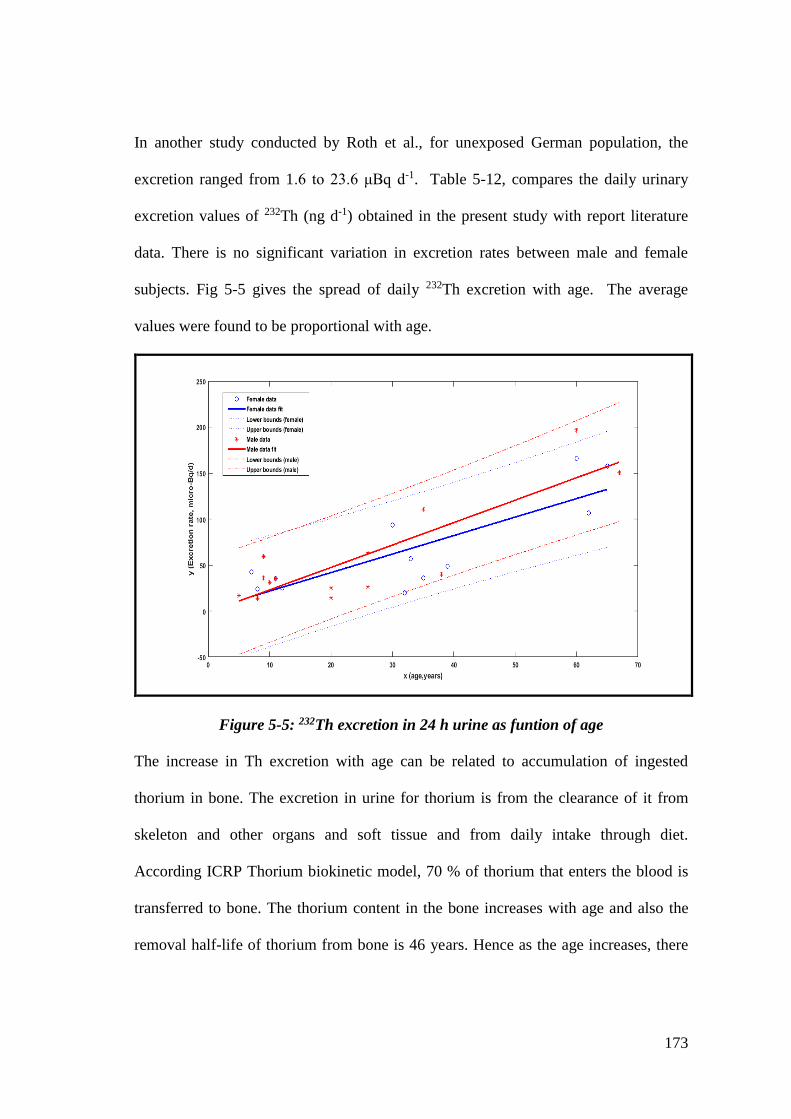
173
In another study conducted by Roth et al., for unexposed German population, the
excretion ranged from 1.6 to 23.6 μBq d-1. Table 5-12, compares the daily urinary
excretion values of 232Th (ng d-1) obtained in the present study with report literature
data. There is no significant variation in excretion rates between male and female
subjects. Fig 5-5 gives the spread of daily 232Th excretion with age. The average
values were found to be proportional with age.
Figure 5-5: 232Th excretion in 24 h urine as funtion of age
The increase in Th excretion with age can be related to accumulation of ingested
thorium in bone. The excretion in urine for thorium is from the clearance of it from
skeleton and other organs and soft tissue and from daily intake through diet.
According ICRP Thorium biokinetic model, 70 % of thorium that enters the blood is
transferred to bone. The thorium content in the bone increases with age and also the
removal half-life of thorium from bone is 46 years. Hence as the age increases, there
174
is a steady removal of the accumulated thorium from bone into blood and hence more
excretion.
There is an inter-individual variation of urinary thorium excretion at higher ages. As
the individuals belong to the same study area, there is no geographical difference that
can contribute to the variation. Instead the variation can be due to the change in
dietary habits and differences in individual metabolism.
5.9 Comparison of annual effective dose from other radionuclides
through external and internal exposure pathways received by
inhabitants
The annual effective dose equivalent due to the inhalation of radon, thoron and
progeny to the population of coastal Tamilnadu was calculated by Devajayanthi et al.
and reported that the dose level varied from 2.59 to 8.76 mSv y-1 with an arithmetic
mean of 4.72 mSv y-1[25]. The authors have also evaluated the external dose due to
gamma exposure using TLD and have reported a dose ranging from 1.2-4.8 mSv y-1.
The exposure rate was measured using scintillometer by another group of researchers
and showed radiation field ranging from 0.40 to 19.00 µGy h-1. They have reported a
similar external dose ranging from 1.2 to 5.8 mSv y-1. The total dose (the internal:
inhalation and external) estimated for the villagers residing in the NHBRAS, ranged
from 4.47 to 8.38 mSv y-1 [30]. Sarojini et al., have studied the concentration of 226Ra,
228Ra and 232Th in soil using gamma spectrometry and evaluated the external dose
using the concentration of radionuclides in the soil. The annual effective dose ranged
from 0.94 to 2.23 mSv y-1 [130]. High volume air Sampler with Whatmann 2000
special grade glass fibre micro-filter paper was used to collect particulates in the
175
ambient air of sampling station and were analyzed in a nuclear counter for gross alpha
concentration in the air by Mini et al., and reported a dose of 0.07-0.8 mSv y-1 [229].
Lunch (food) samples were collected by Devajayanthi et al., and analyzed by means
of gamma ray spectrometry to measure the activity concentration of 228Ra, 40K, 228Th
and 238U. The daily intake of 228Ra, 40K, 226Ra and 238U activity ranged from 1.34 to
2.98 Bq kg–1fresh, 27.7 to 88.7 Bq kg–1
fresh, 5.4 to 11.3 Bq kg–1fresh and 2.05 to 4.94 Bq
kg–1fresh, respectively. Considering a daily consumption rate of 958 g d-1, the authors
have evaluated the annual effective dose received by the individuals to range from
between 0.79 and 1.73 mSv y-1 [133].
210Po was also estimated in diet samples collected in this study area and the mean
activity was found to vary from 74 to 38 mBq kg -1fresh. The ingestion dose estimated
for three different age groups for adults, adolescents and children in this region was
52, 53 and 109 μSv y-1, respectively which is higher compared to the ingestion dose
from 232Th intake [6]. 7.7, 7.5 and 6.7 μSv y -1 annual effective dose was evaluated
due to 232Th intake for adults, adolescents and children respectively using an average
food consumption rate of 585, 451 and 335 kg y-1 for adults, adolescents and children
in this study.
Total dose received by the population residing in the study area both by external and
internal (ingestion and inhalation) pathways, estimated using the data available in the
literature from all NORMs, varied from 4.6 to 12.1 mSv y-1. Though the ingestion
dose from 232Th evaluated in this study was higher compared to that reported by other
regions of India, the contribution to the total dose is insignificant compared to total
dose received by an individual from different sources.

176
Chapter 6
Conclusions and future outlook
177
6.1 Conclusions
The main objective of this thesis work was to evaluate the ingestion intake of 232Th
and assessment of annual committed effective dose received by population residing in
a naturally high background radiation area (HBRA) of Tamilnadu, India. Food
materials and total diet (duplicate diet) samples were collected using standard
protocols, stored for analysis by INAA method for low level Th (232Th) concentration
determination. INAA method using high flux reactor neutrons from CIRUS/Dhruva
research reactor and high resolution gamma-ray spectrometry was optimized for ultra-
trace (ng or below) determination of thorium in biological/food matrices utilizing
daughter product of 233Th: 233Pa (half-life 27. 7 d, 312 keV gamma-ray). Method has
been validated using synthetic samples as well as SRMs from NIST. As there is
difficulty in irradiation of liquid samples for INAA, ICP-MS method was utilized for
sub-trace Th concentrations in drinking water and urine samples from same area. Age
dependent average annual intake and effective ingestion dose values were evaluated
using both Market Basket Study (MBS) and Duplicate Portion Study (DPS) methods.
Major contributors to dietary 232Th intakes in the study group were found to be marine
products and the lowest contribution was from obtained from fruits. It was observed
that though the intake is slightly higher compared to another study conducted for
evaluation of daily intake by an urban population, the contribution to total annual dose
to the individual is insignificant from ingestion intake.
The activity concentration in dietary components in MBS was estimated using INAA
and the concentration ranged from 0.2 to 550.3 mBq kg-1fresh. The highest was found
in curated fish and the lowest in tomato. Vegetables (brinjal, plantain and drumstick)
that were grown locally had higher concentration than those that were brought into the
178
market from other regions. Roots and tubers had the highest concentration in plant
origin food items followed by green leafy vegetables. Where as in animal origin food
items, concentration in the marine food is the highest. The highest contributor to daily
intake was from curated fish, roots and tubers and rice in case of adult population.
Whereas in children belonging to age group of 1-3 y, milk was found to be the highest
contributor for Th. The total annual ingestion dose from 232Th using MBS for adult
was 3.4 μSv y-1.
The radiation field survey demonstrated that the external radiation levels were higher
along the beach sector compared to the hinterland. As established by previous works,
the monazite is not present uniformly along the shore but occur in pockets. The
highest external radiation dose was evaluated as 11.7 mSv y-1 in Manavalakurichi
beach sector.
232Th in duplicate diet (DD) was estimated from 24h diet samples collected from the
selected villages. The concentration varied from 16.6 to 127.5 mBq kg-1fresh with a
median of 60.33 mBq kg-1fresh. The highest concentration was found in DD of
Manavalakurichi. The daily intake of 232Th for adult population varied from 13 to 240
mBq d-1. Annual effective dose from ingestion of 232Th evaluated for adult men using
DPS method was 7.7 μSv y-1.
232Th in consumable water samples collected from households in the study area was
measured using ICP-MS. The concentration ranged from 2.4 to 18.3 ng L-1. The dose
received by adult population considering a daily water consumption estimate of 3.6 L
varied from 3.6 to 28.1 nSv y-1 with average of 13.6 ± 0.6 nSv y-1.
Another interesting observation is that annual effective dose evaluated using DPS
method was higher than that evaluated using MBS. This indicates that DPS is a
179
preferred method for realistic biokinetic studies and MBS method gives us the
indication of individual major contributor to the dose.
The results of this study will supplement to background data on terrestrial
radioisotopes in this region and will also provide to evaluate the gut absorption
fraction of thorium for Indian population. The evaluated ingestion intake of Th from
food and diet will be helpful to assess the gut absorption fraction FA. Due to lack of
adequate data on 232Th concentration in individual dietary components from normal
background areas of India, our results couldn’t be compared. Hence it was thus
important to estimate 232Th concentration in dietary component from different normal
background areas of India, which will be treated as the base or control values. As the
contribution to the total dose by ingestion pathway is very less, it can be concluded
that the mining activities in the study area may not have influenced the ingestion dose.
Within the framework of the thesis work, it was demonstrated that INAA and ICP MS
are powerful analytical methods of choice for the determination of Th (232Th) at very
low concentrations. The application of separation and co-precipitation techniques have
shown to be adequate in order to access the extremely low concentration of 232Th in
drinking water and urine.
6.2 Scope for future work
Low level thorium determination using INAA and high resolution gamma-ray
spectrometry is still a challenge and application of Compton suppressed anti-
coincidence gamma-ray spectrometry is recommended for ultra-trace Th
determination using high neutron flux irradiation of sample. Samples (food/diet)
should be dried, ashed (so no moisture content) and then irradiation in high neutron
flux for even 7 h for determining low concentrations of Th without any chemical
180
dissolution/separation. The study should aim at determining ingestion dose by
calculating FA from quantified 232Th concentration, which was objective of the thesis
when it was conceived. In this study, 232Th in water and urine was measured by
destructive method using ICP MS. Method can be standardised for determination of
232Th in these matrix directly without any chemical separation using dilute and shot
procedure, thereby reducing sample analysis time. The activity of other radionuclides
mainly polonium, radium and 222Rn needs to be measured in the underground drinking
water and in tap water given by the municipality water supply as there are no reported
detailed study. The 232Th soil content in the study area is high and it was also observed
that 232Th in locally grown vegetables was higher, hence it is necessary to initiate
studies on the factors influencing the transfer factor for uptake of plants. The
important contribution to 232Th ingestion dose to the inhabitants is from consumption
of curated fish. As no information is available for consumption rate of curated fish,
consumption rate of fish was used to evaluate the annual dose from ingestion. Hence it
is necessary to determine the consumption rate of curated fish. Activity concentration
of NORM is not available in curated fish which needs to be addressed to. The
external and internal doses can be reduced by removing the monazite content present
in the soil by mineral separation; which can be confirmed by estimation of NORM in
food and water samples periodically to study the influence of mining in this region to
build confidence among the residence. To have complete idea about dose due to
inhalation, estimation of concentration of 232Th in the air is necessary because air is
least studied in Indian scenario. In order to have the idea about the effective 232Th in
the body at any time, it is necessary to know the intake as well as loss through
excretion (urine and fecal samples). In this way the contribution to total dose from
181
232Th via inhalation can also be evaluated. The 232Th ingestion data are also important
from biokinetic point of view, in which inhabitants in the study area are chronically
exposed to enhanced natural radiation hence serve a suitable group for study of
behaviour of NORM in human body. The daily excretion rate of 232Th via faeces can
be used to assess the gut absorption fraction FA with the dietary intake data generated
in this study. Further body burden and organ retention fraction are necessary to be
evaluated by quantifying 232Th contents in various organ/tissue from accidental
cadavers (inhabitant of this region) and the intake data from this study. Thorium
ingestion data and related studies would be important input for our future
departmental program towards thorium utilization in nuclear technology.
182
References
183
References
1. UNSCEAR(United Nations Scientific Committee on the Effects of Atomic
Radiation) (2000) Sources and Effect of Ionizing Radiation. Newyork USA.
2. Ramachandran T V., Mishra UC (1989) Measurement of natural radioactivity
levels in Indian foodstuffs by gamma spectrometry. Int J Radiat Appl
Instrumentation Part 40:723–726.
3. Kannan V, Iyengar MA., Ramesh R (2001) Dose estimates to the public from
210Po ingestion via dietary sources at Kalpakkam (India). Appl Radiat Isot
54:663–674. doi: 10.1016/S0969-8043(00)00301-8.
4. Paul AC (1993) Natural high background radiation areas in India-unique
features and regulatory aspects. Radiat Prot Environ 26:439–445.
5. Shanthi G, Kumaran JTT, Raj GAG, Maniyan CG (2010) Natural radionuclides
in the South Indian foods and their annual dose. Nucl Instruments Methods
Phys Res Sect A Accel Spectrometers, Detect Assoc Equip 619:436–440. doi:
10.1016/j.nima.2009.10.068
6. Arunachalam KD, Baskaran KV, Rao DD, et al (2014) Ingestion of Polonium
((210)Po) via dietary sources in high background radiation areas of south India.
Int J Radiat Biol 90:867–875.
7. ICRP International Commission on Radiological Protection (1995) Age-
dependent doses to members of the public from intakes of radionuclides: Part 3.
Ingestion dose coefficients. ICRP Publ. 69. Ann. ICRP, 25(1).
8. Dang HS, Jaiswal DD, Sunta CM (1986) Daily intake of thorium by an Indian
Urban population. Sci Total Environ 57:73–77.
9. UNSCEAR(United Nations Scientific Committee on the Effects of Atomic
184
Radiation) (2008) Sources and effects of ionizing radiation. Newyork USA
10. Little MP, Wakeford R, Tawn EJ, et al (2009) Risks associated with low doses
and low dose rates of ionizing radiation: why linearity may be (almost) the best
we can do. Radiology 251:6–12. doi: 10.1148/radiol.2511081686
11. High Background Radiation Research Group C (1980) Health survey in high
background radiation areas in China. Science (80- ) 209:877–880.
12. Ghiassi-nejad M, Mortazavi SMJ, Cameron JR, et al (2002) Very high
background radiation areas of Ramsar, Iran: preliminary biological studies.
Health Phys 82:87–93. doi: 10.1097/00004032-200201000-00011
13. Paul AC, Pillai PMB, Haridasan PP, et al (1998) Population Exposure to
Airborne Thorium at the High Natural Radiation Areas in India. J Environ
Radioact 40:251–259.
14. Mohanty AK, Sengupta D, Das SK, Saha SK (2004) Natural radioactivity and
radiation exposure in the high background area at Chhatrapur beach placer
deposit of Orissa , India. J Environ Radioact 75:15–33. doi:
10.1016/j.jenvrad.2003.09.004
15. Singh HN, Shanker D, Neelakandan VN, Singh VP (2007) Distribution patterns
of natural radioactivity and delineation of anomalous radioactive zones using in
situ radiation observations in Southern Tamil Nadu , India. J Hazard Mater
141:264–272. doi: 10.1016/j.jhazmat.2006.06.118
16. Jia G, Torri G, Ocone R, et al (2008) Determination of thorium isotopes in
mineral and environmental water and soil samples by α-spectrometry and the
fate of thorium in water. Appl Radiat Isot 66:1478–1487. doi:
10.1016/j.apradiso.2008.03.015
185
17. Mitchell N, Pérez-Sánchez D, Thorne MC (2013) A review of the behaviour of
U-238 series radionuclides in soils and plants. J Radiol Prot 33:17–48. doi:
10.1088/0952-4746/33/2/R17
18. Narayana Y, Somashekarappa HM, Karunakara N, et al (1998) Seasonal
variation of indoor radon levels in coastal Karnataka on the southwest coast of
India. Radiat Meas 29:19–25.
19. Jose RM, Byju S Ben, Anilkumar S, Chougaonkar MP (2015) External Gamma
Dose Levels In The Soil Samples of HBRAs of Kerala and Tamil Nadu , India.
Int J Fundam Phys Sci 5:54–57. doi: 10.14331/ijfps.2015.330086
20. Chougaonkar MP, Eappen KP, Ramachandran T V, et al (2004) Profiles of
doses to the population living in the high background radiation areas in Kerala,
India. J Environ Radioact 71:275–297. doi: 10.1016/S0265-931X(03)00174-7
21. Reddy BS, Reddy MS, Reddy CG, et al (2003) Airborne radioactivity levels in
dwellings of Khammam district, Andhra Pradesh, India. Radiat Meas 36:503–
506. doi: 10.1016/S1350-4487(03)00190-2
22. Ramachandan T V, Sathish LA (2011) Nationwide indoor 222 Rn and 220 Rn
map for India: a review. J Environ Radioact 102:975–986. doi:
10.1016/j.jenvrad.2011.06.009
23. Iimoto T, Kosako T, Sugiura N (2001) Measurements of summer radon and its
progeny concentrations along with environmental gamma dose rates in Taiwan.
J Environ Radioact 57:57–66.
24. El-Hussein A, Ahmed AA, Mohammed A (1998) Radiation Tract from Dose to
the Human Respiratory Inhalation of Radon-222 and its Progeny. Appl Radiat
Isot 49:783–790.
186
25. Jayanthi DD, Maniyan CG, Perumal S (2011) Assessment of indoor radiation
dose received by the residents of natural high background radiation areas of
coastal villages of Kanyakumari district, Tamil Nadu, India. Radiat Phys Chem
80:782–785. doi: 10.1016/j.radphyschem.2011.03.011
26. kannan V, Rajan M.P., Iyengar M.A.R RR (2002) Distribution of natural and
anthropogenic radionuclides in soil and beach sand samples of Kalpakkam
(India) using hyper pure germanium (HPGe) gamma ray spectrometry. Appl
Radiat Isot 57:10–119.
27. Ramasamy V, Sundarrajan M, Paramasivam K, Suresh G (2015) Spatial and
depth wise characterization of radionuclides and minerals in various beach
sediments from high background radiation area, Kerala, India. Appl Radiat Isot
95:159–168. doi: 10.1016/j.apradiso.2014.10.023
28. Lakshmi KS, Selvasekarapandian S, Khanna D, Meenakshisundaram V (2005)
Primordial radionuclides concentrations in the beach sands of East Coast region
of Tamilnadu, India. Int Congr Ser 1276:323–324. doi:
10.1016/j.ics.2004.10.022
29. Deva Jayanthi D (2014) An analysis of the radiation status of the natural high
background radiation area of coastal tamil nadu by estimating the radioactivity
of various substances using techniques related to direct and passive
measurements. Ph D Thesis. doi: 10.4103/0972-0464.111402
30. Kanthasamy E, Raj AG (2013) Assessment of radioactivity and estimation of
Effective Radiation Dose received by villagers residing at Natural HIgh
Background Radiation Areas of Tamilnadu. Int J Innov Res Sci Eng Technol
2:2243–2247.
187
31. Gharbi F, Baccouche S, Abdelli W, et al (2010) Uranium isotopes in Tunisian
bottled mineral waters. J Environ Radioact 101:589–590. doi:
10.1016/j.jenvrad.2010.03.001
32. Desideri D, Meli MA, Feduzi L, et al (2007) 238U, 234U, 226Ra, 210Po
concentrations of bottled mineral waters in Italy and their dose contribution. J
Environ Radioact 94:86–97. doi: 10.1016/j.jenvrad.2007.01.005
33. Bonotto DM, Bueno TO (2008) The natural radioactivity in Guarani aquifer
groundwater, Brazil. Appl Radiat Isot 66:1507–1522. doi:
10.1016/j.apradiso.2008.03.008
34. Wallner G, Wagner R, Katzlberger C (2008) Natural radionuclides in Austrian
mineral water and their sequential measurement by fast methods. J Environ
Radioact 99:1090–1094. doi: 10.1016/j.jenvrad.2007.12.021
35. Rožmarić M, Rogić M, Benedik L, Štrok M (2012) Natural radionuclides in
bottled drinking waters produced in Croatia and their contribution to radiation
dose. Sci Total Environ 437:53–60. doi: 10.1016/j.scitotenv.2012.07.018
36. Mohapatra S, Sahoo SK, Dubey JS, et al (2015) Characterization of uranium
and its progenies in drinking water and assessment of dose to public around a
NHBRA, Odisha, India. J Radioanal Nucl Chem 303:601–613. doi:
10.1007/s10967-014-3353-1
37. Rajashekara KM, Narayana Y, Narasimha SA, et al (2011) Effective doses due
to intake of radiotoxic radionuclides 226Ra, 210Po and 210Pb through drinking
water of coastal Karnataka. J Radioanal Nucl Chem 290:137–140. doi:
10.1007/s10967-011-1159-y
38. Rana BK, Tripathi RM, Sahoo SK, et al (2010) Assessment of natural uranium
188
and 226Ra concentration in ground water around the uranium mine at
Narwapahar, Jharkhand, India and its radiological significance. J Radioanal
Nucl Chem 285:711–717. doi: 10.1007/s10967-010-0608-3
39. Umadevi AG, Balakrishnan D, Abraham JP, et al (2011) An Assessment of
Ingestion Dose due to the Intake of 210Po and 210 Pb through Drinking Water of
Eloor , Ernakulam District , Kerala , India. J Chem Eng 5:903–908.
40. Pietrzak-Flis Z, Chrzanowski E, Dembinska S (1997) Intake of 226Ra, 210Pb and
210Po with food in Poland. Sci Total Environ 203:157–165. doi:
10.1016/S0048-9697(97)00144-7
41. Pietrzak-Flis Z, Rosiak L, Suplinska MM, et al (2001) Daily intakes of 238U,
234U, 232Th, 230Th, 228Th and 226Ra in the adult population of central Poland. Sci
Total Environ 273:163–169. doi: 10.1016/S0048-9697(00)00849-4
42. Da Costa Lauria D, Rochedo ERR, Godoy MLDP, et al (2012) Naturally
occurring radionuclides in food and drinking water from a thorium-rich area.
Radiat Environ Biophys 51:367–374. doi: 10.1007/s00411-012-0428-7
43. Olomo JB (1990) The natural radioactivity in some Nigerian foodstuffs.
299:666–669.
44. Arogunjo AM, Höllriegl V, Giussani A, et al (2009) Uranium and thorium in
soils, mineral sands, water and food samples in a tin mining area in Nigeria
with elevated activity. J Environ Radioact 100:232–240. doi:
10.1016/j.jenvrad.2008.12.004
45. Shiraishi K, Tagami K, Ban-nai T, Yamamoto M, Muramatsu Y, Los IP,
Phedosenko GV, Korzun VN, Tsigankov NY SI (1997) Daily intakes of 134Cs,
137Cs, 40K, 232Th, and 238U in Ukrainian adult males. Health Phys 73:814.
189
46. Vijayan PK, Shivakumar V, Basu S, Sinha RK (2016) Role of thorium in the
Indian nuclear power programme. Prog Nucl Energy 1–10. doi:
10.1016/j.pnucene.2017.02.005
47. L’Annunziata MF (2012) Handbook of Radioactivity Analysis, Third.
Academic Press
48. Beck H L and Bennett B G (2002) Historical overview of atmospheric nuclear
weapons testing and estimates of fallout in the continental United States. Health
Phys 82:591–608.
49. Langmuir D, Herman JS (1980) The mobility of thorium in natural waters at
low temperatures. Geochim Cosmochim Acta 44:1753–1766. doi:
10.1016/0016-7037(80)90226-4
50. Xu D, Wang XK, Chen CL, et al (2006) Influence of soil humic acid and fulvic
acid on sorption of thorium(IV) on MX-80 bentonite. Radiochim Acta 94:429–
434. doi: 10.1524/ract.2006.94.8.429
51. Syed HS (1999) Comparison studies adsorption of thorium and uranium on
pure clay minerals and local Malaysian soil sediments Adsorption experiments.
J Radioanal Nucl Chem 241:11–14.
52. Sohrabi M (2013) World high background natural radiation areas: Need to
protect public from radiation exposure. Radiat Meas 50:166–171. doi:
10.1016/j.radmeas.2012.03.011
53. Sohrabi M (1998) The state-of-the-art on worldwide studies in some
environments with elevated naturally occurring radioactive materials (NORM).
Appl Radiat Isot 49:169–188. doi: 10.1016/S0969-8043(97)00238-8
54. ICRP (2007) The 2007 Recommendations of the International Commission on
190
Radiological Protection. Int. Comm. Radiol. Prot. ICRP Publi:
55. Sohrabi M, Esmaili A. (2002) New public dose assessment of elevated natural
radiation areas of Ramsar (Iran) for epidemiological studies. Int Congr Ser
1225:15–24. doi: 10.1016/S0531-5131(01)00528-3
56. Dabbagh R, Ghafourian H, Baghvand A, et al (2006) Discovery of the second
highest level of radioactive mineral spring in Iran. J Radioanal Nucl Chem
269:91–94.
57. Vasconcelos DC, Reis PAL, Pereira C, et al (2013) Modelling Natural
Radioactivity in Sand Beaches of Guarapari, Espírito Santo State, Brazil. World
J Nucl Sci Technol 3:65–71. doi: 10.4236/wjnst.2013.32011
58. Wang Z (2002) Natural radiation environment in China. Int Congr Ser
1225:39–46.
59. Song G, Chen D, Tang Z, et al (2012) Natural radioactivity levels in topsoil
from the Pearl River Delta Zone, Guangdong, China. J Environ Radioact
103:48–53. doi: 10.1016/j.jenvrad.2011.06.014
60. M.A. Ali, S. Krishnan DCB (2001) Beach and inland heavy mineral sand
investigations and deposits in India-an overview. Explor Res Department:1–21.
61. Katz JJ, Seaborg GT, Morss LR (1986) The chemistry of Actinide Elements.
62. Paul AC, Velayudhan T, Pillai PMB, et al (1994) Radiation exposure at the
high background area at Manavalakurichi - The changing trends. J Environ
Radioact 22:243–250. doi: 10.1016/0265-931X(94)90084-1
63. Aadri V, Tonmit T, Vishwas K (2016) Innovation in Exploration of Monazite
Mineral in order to extract Thorium. In: Int. Semin. Miner. Process. Technol.
Innov. Miner. Process. Pune, India, pp 68–74
191
64. LC EK and N (1968) Economic placer deposits of the continental shelf. Tech.
Bull. Econ. Comm. Asia Far East
65. Kudrass HR (2000) Marine placer deposits and sea-level changes. CRC press ,
Taylors and Francis Group
66. T. V. Ramachandran, K. P. Eappen , R.N.Nair YSM and VDP (2005)
Background radiation exposure levels: Indian scenario. Int Congr Ser 1276:5–6.
67. Hegazy AK, Afifi SY, Alatar AA, et al (2013) Soil characteristics influence the
radionuclide uptake of different plant species. Chem Ecol 29:255–269. doi:
10.1080/02757540.2012.744827
68. P. L. Santos, R. C. Gouvea, I. R. Dutra and VAG (1990) Accumulation of
210Po in foodstuffs cultivated in farms around the Brazilian mining and milling
facilities on Poços de Caldas plateau. J Environ Radioact 11:141–149.
69. Grupa J.B., Hart J., Meeussen H.C.L., Rosca-Bocancea E. SL (2017) Report on
migration and uptake of radionuclides in the biosphere. OPERA-PU-SCK631
andNRG7232
70. Vandenhove H, Olyslaegers G, Sanzharova N, et al (2009) Proposal for new
best estimates of the soil-to-plant transfer factor of U, Th, Ra, Pb and Po. J
Environ Radioact 100:721–732. doi: 10.1016/j.jenvrad.2008.10.014
71. Pulhani VA, Dafauti S, Hegde AG, et al (2005) Uptake and distribution of
natural radioactivity in wheat plants from soil. J Environ Radioact 79:331–346.
doi: 10.1016/j.jenvrad.2004.08.007
72. Perez-Sanchez D, Thorne MC (2014) An investigation into the upward
transport of uranium-series radionuclides in soils and uptake by plants. J Radiol
Prot 34:545–573. doi: 10.1088/0952-4746/34/3/545
192
73. Abrahams PW (2002) Soils: their implications to human health. Sci Total
Environ 291:1–32.
74. Al-Masri MS, Al-Akel B, Nashawani A, et al (2008) Transfer of 40K, 238U,
210Pb, and 210Po from soil to plant in various locations in south of Syria. J
Environ Radioact 99:322–331. doi: 10.1016/j.jenvrad.2007.08.021
75. Hall EJ, Astor M, Bedford J, et al (1988) Basic radiobiology. Am J Clin Oncol
11:220–252. doi: 10.1097/00000421-198806000-00003
76. Linsalata P (1994) Uranium and Thorium Decay Series Radionuclides in
Human and Animal Foodchains—A Review. J Environ Qual 3:633– 642.
77. Ciffroy P, Siclet F, Damois C, et al (2005) A dynamic model for assessing
radiological consequences of routine releases in the Loire river:
Parameterisation and uncertainty/sensitivity analysis. J Environ Radioact 83:9–
48. doi: 10.1016/j.jenvrad.2005.02.007
78. Platford RF, Joshi SR (1989) Radionuclide partitioning across great lakes
natural interfaces. Environ Geol Water Sci 14:183–186. doi:
10.1007/BF01705129
79. Hunter KA, Hawke DJ, Lee Kwee Choo (1988) Equilibrium adsorption of
thorium by metal oxides in marine electrolytes. Geochim Cosmochim Acta
52:627–636. doi: 10.1016/0016-7037(88)90324-9
80. LaFlamme BD, Murray JW (1987) interaction: The effect of carbonate
alkalinity on adsorbed thorium. Geochim Cosmochim Acta 51:243–250. doi:
10.1016/0016-7037(87)90235-3
81. Santchi PH, Honeyman BD (1989) Radionuclides in aquatic environment.
Radiat Phys Chem 34:213–240.
193
82. Poston TM, Klopfer DC (1986) A Literature Review of the Concentration
Ratios of Selected Radionuclides in Freshwater and Marine Fish. US DOE,
Pacific Northwest Lab.
83. N. S. Fisher, S. W. Fowler, F. Boisson, J. Carroll, K. Rissanen, B. Salbu TG,
Sazykina and K-LS (1999) Radionuclide Bioconcentration Factors and
Sediment Partition Coefficients in Arctic Seas Subject to Contamination from
Dumped Nuclear Wastes. Environ Sci Technol 33:1979–1982.
84. Tagami K, Uchida S (2013) Marine and freshwater concentration ratios ( CR
wo-water ): review of Japanese data. J Environ Radioact 126:420–426.
85. JE Brown,S R Jones, R Saxen HT and JV (2004) Radiation doses to aquatic
organisms from natural radionuclides. J Radiol Prot 24:A63–A77. doi:
10.1088/0952-4746/24/4A/004
86. Gjelsvik R, Brown J (2009) Po-210 and other radionuclides in terrestrialand
freshwater environments.
87. Khan MF, Wesley SG, Rajan MP (2014) Polonium-210 in marine mussels
( bivalve molluscs ) inhabiting the southern coast of India. J Environ Radioact
138:410–416.
88. Phillips DJH (1980) Quantitative aquatic biological indicators. Applied Science
Publishers.
89. Alam MN, Chowdhury MI, Kamal M, et al (1999) Radionuclide concentrations
in mussels collected from the southern coast of Bangladesh. J Environ Radioat
47:201–212.
90. Fisenne, Isabel M.; Perry, Pamela M.; Decker, Karin M.; Keller HW (1987)
The Daily Intake of 234,235,238U, 228,230,232Th and 226,228Ra by New York City
194
Residents. Health Phys 53:357–363.
91. Yu KN, Mao SY, Young ECM, Stokes MJ (1997) A study of radioactivities in
six types of fish consumed in Hong Kong. Appl Radiat Isot 48:515–519. doi:
10.1016/S0969-8043(96)00283-7
92. Shiraishi K, Tagami K, Muramastu Y, Yamamoto M (2000) Contributions of
18 food categories to intakes of 232Th and 238U in Japan. Health Phys 78:28–36.
93. Shiraishi K, Igarashi Y, Yamamoto M, et al (1994) Concentrations of thorium
and uranium in freshwater samples collected in the former USSR. J Radioanal
Nucl Chem Artic 185:157–165. doi: 10.1007/BF02042962
94. Pietrzak-Flis Z, Suplinska MM, Rosiak L (1997) The dietary intake of 238U,
234U, 230Th, 232Th, 228Th and 226Ra from food and drinking water by inhabitants
of the Waibrzych region. J Radioanal Nucl Chem 222:189–193.
95. Choi MS, Lin XJ, Lee SA, et al (2008) Daily intakes of naturally occurring
radioisotopes in typical Korean foods. J Environ Radioact 99:1319–1323. doi:
10.1016/j.jenvrad.2008.04.003
96. Tuo F, Zhang Q, Zhou Q, et al (2016) Measurement of 238U, 228Ra, 226Ra, 40K
and 137Cs in foodstuffs samples collected from coastal areas of China. Appl
Radiat Isot 111:40–44. doi: 10.1016/j.apradiso.2016.02.013
97. Canbazoǧlu C, Doǧru M (2013) A preliminary study on 226Ra, 232Th, 40K and
137Cs activity concentrations in vegetables and fruits frequently consumed by
inhabitants of ElazIǧ Region, Turkey. J Radioanal Nucl Chem 295:1245–1249.
doi: 10.1007/s10967-012-1995-4
98. Harb S (2007) Measurement of the radioactivity of 238U, 226Ra, 210Pb, 228Th,
232Th, 228Ra, 137Cs and 40K in tea using gamma-spectrometry. J Radioanal Nucl
195
Chem 274:63–66. doi: 10.1007/s10967-006-6901-5
99. Rosa MML, Taddei MHT, Cheberle LT V., et al (2015) Determination of 234U,
235U, 238U, 228Th, 230Th, 232Th, 226Ra, 228Ra, and 210Pb in foods from Brazilian
Total Diet. J Radioanal Nucl Chem 306:695–700. doi: 10.1007/s10967-015-
4262-7
100. Al-Ghamdi AH (2014) Activity Concentrations and Mean Annual Effective
Dose of Spices Food Consumed by Inhabitants of Saudi Arabia. J Am Sci J Am
Sci 1010:164–168.
101. Yu KN, Mao SY (1999) Assessment of radionuclide contents in food in Hong
Kong. Health Phys 77:686–696.
102. Ramli AT, Hussein AWMA, Wood AK (2005) Environmental 238U and 232Th
concentration measurements in an area of high level natural background
radiation at Palong, Johor, Malaysia. J Environ Radioact 80:287–304. doi:
10.1016/j.jenvrad.2004.06.008
103. Santos EE, Lauria DC, Amaral ECS, Rochedo ER (2002) Daily ingestion of 232
Th, 238 U, 226 Ra, 228 Ra and 210 Pb in vegetables by inhabitants of Rio de
Janeiro City. J Environ Radioact 62:75–86.
104. Carvalho FP (2011) Polonium ( 210 Po ) and lead ( 210 Pb ) in marine
organisms and their transfer in marine food chains. J Environ Radioact
102:462–472. doi: 10.1016/j.jenvrad.2010.10.011
105. Wesley SG, Khan MF (2011) Radionuclides in south Indian seafoods: A
special focus on major contributing species. Radioprot C EDP Sci 46:151–159.
doi: 10.1051/radiopro/20116969s
106. Thomas PA, Fisenne I, Chorney D, et al (2001) Human absorption and
196
retention of polonium-210 from caribou meat. Radiat Prot Dosimetry 97:241–
250.
107. Jeambrun M, Pourcelot AL, Mercat C, et al (2012) Potential sources affecting
the activity concentrations of and some decay products in lettuce and wheat
samples Environmental impact. J Environ Monit 14:2902–2912. doi:
10.1039/c2em30434a/07/2017
108. Meli MA, Desideri D, Roselli C, Feduzi L (2014) Assessment of 210Po in
Italian diet. Food Chem 155:87–90. doi: 10.1016/j.foodchem.2014.01.049
109. Giri S, Singh G, Jha VN, Tripathi RM (2010) Ingestion of U(nat), 226Ra, 230Th
and 210Po in vegetables by adult inhabitants of Bagjata uranium mining area,
Jharkhand, India. Radioprotection 45:183–199. doi: 10.1051/radiopro/2010001
110. Quan W, Hongda Z, Tiqiang F, Qingfen L (2008) Re-estimation of internal
dose from natural radionuclides for Chinese adult men. Radiat Prot Dosimetry
130:434–441. doi: 10.1093/rpd/ncn066
111. Chen J (2010) Doses to children from intakes by ingestion. Radiat Prot
Dosimetry 142:46–50. doi: 10.1093/rpd/ncq198
112. Lenka P, Sahoo SK, Mohapatra S, et al (2013) Ingestion dose from 238 u , 232
Th , 226 Ra , 40 k and 137 Cs in cereals , pulses and drinking water to adult
population in a high background radiation area ,odisha, India. Radiat Prot
Dosimetry 153:328–333.
113. Jaison TJ, Patra AK, Verma PC, Hegde AG (2010) Assessment of gamma
emitting radionuclides in the aquatic ecosystem of Kakrapar Atomic Power
Station and evaluation of radiological doses to aquatic plants. J Radioanal Nucl
Chem 285:573–578. doi: 10.1007/s10967-010-0558-9
197
114. Narayana Y, Radhakrishna AP, Somashekarappa HM, et al (1995) Distribution
of some natural and artificial radionuclides in the environment of coastal
Karnataka of south India. J Environ Radioact 28:113–139. doi: 10.1016/0265-
931X(94)00054-Z
115. Rani LM, Jeevanram RK, Kannan V, Govindaraju M (2014) Estimation of
Polonium-210 activity in marine and terrestrial samples and computation of
ingestion dose to the public in and around Kanyakumari coast , India. J Radiat
Res Appl Sci 7:207–213. doi: 10.1016/j.jrras.2014.02.006
116. Duggal V, Rani A, Balaram V (2016) Assessment of age-dependent radiation
dose due to intake of uranium and thorium in drinking water from Sikar district,
Rajasthan, India. Radiat Prot Dosimetry 171:257–261. doi:
10.1093/rpd/ncw070
117. Raj SS, Madhuparna D, Hemalatha P, et al (2016) 226Ra and 228Ra in
consumable marine organisms from different coastal regions of India. J
Radioanal Nucl Chem 308:371–373. doi: 10.1007/s10967-015-4556-9
118. Karunakara N, Avadhani DN, Mahesh HM, et al (2000) Distribution and
enrichment of Po in the environment of Kaiga in South India. J Environ
Radioact 51:349–362.
119. Karunakara N, Rao C, Ujwal P, et al (2013) Soil to rice transfer factors for
226Ra, 228Ra, 210Pb, 40K and 137Cs: a study on rice grown in India. J Environ
Radioact 118:80–92. doi: 10.1016/j.jenvrad.2012.11.002
120. Jha SK, Gothankar S, Iongwai PS, et al (2012) Intake of 238U and 232Th through
the consumption of foodstuffs by tribal populations practicing slash and burn
agriculture in an extremely high rainfall area. J Environ Radioact 103:1–6. doi:
198
10.1016/j.jenvrad.2011.08.015
121. Sivakumar R (2014) An assessment of the 210 Po ingestion dose due to the
consumption of agricultural, marine, fresh water and forest foodstuffs in
Gudalore (India). J Environ Radioact 137:96–104. doi:
10.1016/j.jenvrad.2014.06.019
122. Mishra S, Bhalke S, Pandit GG, Puranik VD (2009) Estimation of 210 Po and its
risk to human beings due to consumption of marine species at Mumbai, India.
Chemosphere 76:402–406.
123. Prabhath RK, Sathyapriya R s, Nair MG, et al (2015) Determination of 210 Po
concentration in commercially available infant formulae and assessment of
daily ingestion dose. J Radiat Res Appl Sci 8:470–476. doi:
10.1016/j.jrras.2015.05.002
124. Tripathi RM, Sahoo SK, Jha VN, et al (2011) Radiation Dose to Memebrs of
Public Residing around Uranium mining complex, Jaduguda, Jharkhand, India.
Radiat Prot Dosimtery 147:565–572. doi: 10.1093/rpd/ncq496
125. Dang HS, Pullat VR, Jaiswal DD, et al (1990) Daily intake of Uranium by an
urban indian population. J Radioanal Nucl Chem 138:67–72.
126. Bansal V, Tyagi RK, Prasad R (1988) Determination of uranium concentration
in domestic water samples by fission track method. J Radioanal Nucl Chem
Artic 125:439–443. doi: 10.1007/BF02041701
127. Patra AC, Mohapatra S, Sahoo SK, et al (2013) Age-dependent dose and health
risk due to intake of uranium in drinking water from Jaduguda, India. Radiat
Prot Dosimetry 155:210–216. doi: 10.1093/rpd/ncs328
128. Rana BK, Tripathi RM, Sahoo SK, et al (2010) Assessment of natural uranium
199
and 226 Ra concentration in ground water around the uranium mine at
Narwapahar, Jharkhand, India and its radiological significance. J Radioanal
Nucl Chem 285:711–717. doi: 10.1007/s10967-010-0608-3
129. Sathyapriya RS, Raj SS, Nair MG, et al (2010) Estimation of Thorium Content
in Vegetables and Fruits Consumed by Population of Cochin. In: NSRP-18. pp
393–394
130. Sarojini V (2014) Baseline Assessment of dose due to Natural Radionuclides in
soils of coastal regions of Kanyakumari district in Tamil Nadu, India. J Environ
Sci Toxicol Food Technol 8:1–4.
131. Ramachandran TV, Lalit BY, Mishra UC (1986) Measurement of radon and
thoron present in the environment using nuclear track etch detector technique.
Int J Radiat Appl Instrumentation 11:245–249. doi: 10.1016/1359-
0189(86)90041-5
132. Shanthi G, Maniyan CG, Raj GAG, Kumaran JTT (2009) Radioactivity in food
crops from high- background radiation area in southwest India. Curr Sci
97:1331–1335.
133. Jayanthi DD, Maniyan CG, Perumal S (2014) Measurement of activity
concentration of radionuclides and the committed annual effective dose due to
the consumption of typical South Indian meal. Int J Low Radiat 9:181. doi:
10.1504/IJLR.2014.060909
134. Kanthasamy E, Raj AG (2013) Assessment of Radioactivity and Estimation of
Effective Radiation Dose Received By Villagers Residing At Natural High
Background Areas of. Int J Innov Res Sci Eng Technol 2:2243–2247.
135. Saroja PM, Immanuel G, Raj GAG, Selvan KE (2012) Studies on radionuclides
200
228 Ra , 238 U , 228 Th and 40 K in selected seaweeds of coastal Tamil Nadu ,
India Author Details. J Environ Biol 33:909–915.
136. Dang HS, Jaiswal DD, Pullat VR, Mishra UC (2000) Studies on intake and
body fluid concentrations of thorium for subjects working and living in thorium
rich environment. J Radioanal Nucl Chem 243:513–516.
137. Ansoborlo E, Bion L, Doizi D, et al (2007) Current and future radionuclide
speciation studies in biological media. Radiat Prot Dosimtery 127:97–102. doi:
10.1093/rpd/ncm258
138. ICRP International Commission on Radiological Protection (1979) Limits for
intakes of radionuclides by workers. ICRP Publ. 30, Part 1. Ann ICRP, 2(3/4).
139. ICRP International Commission on Radiological Protection (1990) Age-
dependent Doses to Members of the Public from Intake of Radionuclides - Part
1. ICRP Publ. 56. Ann. ICRP, 20(2).
140. ICRP International Commission on Radiological Protection (1991) 1990
recommendations of the International Commission on Radiological Protection.
ICRP Publ. 60. Ann ICRP, 21(1–3).
141. ICRP International Commission on Radiological Protection (1994) Human
respiratory tract model for radiological protection. ICRP Publ. 66. Ann ICRP,
24(1–3).
142. ICRP International Commission on Radiological Protection (1993) Age-
dependent doses to members of the public from intakes of radionuclides: Part 2.
Ingestion dose coefficients. ICRP Publ. 67. Ann ICRP, 23(3/4).
143. ICRP International Commission on Radiological Protection (1994) Dose
coefficients for intakes of radionuclides by workers. ICRP Publ. 68. Ann ICRP,
201
24(4).
144. ICRP International Commission on Radiological Protection (1995) Age-
dependent doses Coefficients, members of the public from intakes of
radionuclides: Part 4. Inhalation dose. ICRP Publ. 71. Ann ICRP, 25(3–4).
145. ICRP International Commission on Radiological Protection (2012) ICRP
Statement on Tissue Reactions and Early and Late Effects of Radiation in
Normal Tissues and Organs – Threshold Doses for Tissue Reactions in a
Radiation Protection Context. Ann ICRP 41(1-2). doi:
10.1016/j.icrp.2012.02.001
146. ICRP International Commission on Radiological Protection (2001) Doses to the
embryo and fetus from intakes of radionuclides by the mother. ICRP Publ. 88.
Ann ICRP, 31(1–3).
147. ICRP International Commission on Radiological Protection (2004) Doses to
Infants from Ingestion of Radionuclides in Mothers’ Milk. ICRP Publ. 95 Ann.
ICRP 34
148. ICRP International Commission on Radiological Protection (2006) Human
Alimentary Tract Model for Radiological Protection. ICRP Publ. 100 Ann.
ICRP 36
149. Dudley Goodhead OBE (2004) Report on Committee Examining Radiation
Risks of Internal Emitters (CERRIE). doi: 10.1088/0952-4746/22/2/604
150. Cember H, Johnson TE (2009) Introduction to Health physics, 4th editio.
McGraw-Hill
151. Pillai PMB (2007) Naturally occuring radioactive marterial (NORM) in the
extraction and processing of rare earths. Nat Occur Radioact Mater (NORM V)
202
Proc Fifth Int Symp Nat Occur Radioact Mater Seville, v:197–221.
152. Haridasan P.P. PPMBTRM (2010) Operational Radiation Protection associated
with Thorium Processing in India. Nat Occur Radioact Mater (NORM VI)
Proceeding:119–126.
153. Herranz M., Legarda F., Núñez-Lagos R., Pérez Marín C. SM (8AD) Thorium
applications in Spain. Nat Occur Radioact Mater (NORM V) Proceeding:59–60.
154. Jackson D, Lambers B, Gray J, et al (2000) Comparisons between radioactive
and non-radioactive gas lantern mantles Proposal for a method of certification
of natural radioactivity in building materials Comparisons between radioactive
and non-radioactive gas lantern mantles. J Radiol Prot 20:423–431.
155. Sadagopan G., Nambi K.S.V., Venkataraman G., Shukla V.K. KS (1997)
Estimation of thorium in gas mantles to ascertain regulatory compliance. Radiat
Prot Dosimetry 71:53–56.
156. Agarwal S.P, Gaur P.K., Geeta S., Murthy B.K.S. KD (1993) Radiation safety
in Gas Mantle Industry. Bull Radiat Prot 16:17–21.
157. Sunta, C. M. dang H.S., Jaiswal D.D., Sharma R.C., Mehta D.J. NPPVJ (1989)
External and Internal Dosimtery of persons exposed to thorium and aplication
of Neutron Activation Analysis to study its Biokinetic Behavious. Nucl
Instruments Methods Phys Res 280:449–458.
158. World Health Organization (WHO) (2004) Guidelines for Drinking-water
Quality Volume 1 Recommendations. 3 rd ed:
159. Agency for Toxic Substances and Disease Registry (ATSDR). (1990)
Toxicological profile for thorium. USEPA
160. Gingell T (2001) Thorium isotopic analysis by alpha spectrometry. Radiat Prot
203
Dosimetry 97:109–116.
161. White MA, Howe AM, Rosen P, Holmes L (2001) Current research activity in
the measurements of thorium and the identification of future research needs.
Radiat Prot Dosimetry 97:101–104.
162. Holmes L (2001) Determination of thorium by ICP-MS and ICP-OES. Radiat
Prot Dosimetry 97:117–122.
163. Fermi Enrico (1934) Radioactivity Induced by neutron Bombardment. Nature
133:757.
164. Hevesy George LH (1935) Artificial Radioactivity of Dysprosium and other
Rare Earth Elements. Nature 136:103.
165. Currie L a. (1968) Limits for qualitative detection and quantitative
determination. Application to radiochemistry. Anal Chem 40:586–593. doi:
10.1021/ac60259a007
166. Gujar A.R. Nagender Nath BR (1988) Marine Minerals: The Indian perspective.
Mar Min 7:317–350.
167. Organization WWH (1979) Guidelines for establishing or strenghthening
national food contamination monitoring programmes. WHO/HCS/FCM/78.1
168. National Nutrition Monitoring Bureau (2012) Diet and Nutritional Status of
Rural Population, Prevalence of Hypertension and Diabetes among Adults and
Infant and Young Child Feeding Practices -Report of Third Repeat Survey.
NNMB Tech. Rep. No. 26
169. Miyazaki ’ T, Kagami ’ H, Shuto2 K, Morikiyo3 T (1997) Geochronological
and Geochemical Characterization of Some Alkaline Plutons from Tamil Nadu,
South India: Implications for the Pan-African Orogeny. Gondwana Res 1:154.
204
170. MARLAP (2004) Multi-Agency Radiological Analytical Protocols Manual,
NUREG-1576.
171. Dang, H S, Jaiswal, D D, Pullar, V R, Parameshwaran M (2002) The estimation
of daily dietary intake and organ content of some selected trace elements of
importance in radiation protection and ntrition in Indian populatin for
application if the dsata to the study of their biokinetics,. Final Rep. from India
IAEA Proj. "Reference Asian Man Phsase II
172. Evans RD (1982) The Atomic Nucleus. Krieger, Newyork USA
173. F knoll G (1989) Radiation detection and measurement, 2nd ed. John Wiley
and Sons, Newyork USA
174. Thomas R (2013) Practical guide to ICP-MS : a tutorial for beginners, third.
CRC press , Taylors and Francis Group
175. Thomas R (2001) A Beginner’s Guide to ICP-MS. Spectroscopy 16:
176. Glover SE, Filby RH, Clark SB (1998) Determination of isotopic thorium in
biological samples by combined alpha-spectrometry and neutron activation
analysis. J Radioanal Nucl Chem 234:201–208.
177. Dang HS, Jaiswal DD, Nair S (2001) Daily dietary intake of trace elements of
radiological and nutritional importance by the adult Indian population. J
Radioanal Nucl Chem 249:95–101.
178. Mlwilo NA, Mohammed NK, Spyrou NM (2007) Radioactivity levels of staple
foodstuffs and dose estimates for most of the Tanzanian population. J Radiol
Prot 27:471–480. doi: 10.1088/0952-4746/27/4/008
179. F. H. El-Sweify, E. Metwally, H. Abdel-Khalik (2007) Simultaneous multi-
element analysis of some edible pulses using neutron activation analysis. J
205
Radioanal Nucl Chem 273:491–496.
180. Carvalho FP, Oliveira M, Lopes I (2007) Radionuclides from past uranium
mining in rivers of Portugal. J Environ Radioact 98:298–314. doi:
10.1016/j.jenvrad.2007.05.007
181. Choudhury RP, Garg AN (2007) Variation in essential, trace and toxic
elemental contents in Murraya koenigii – A spice and medicinal herb from
different Indian states. Food Chem 104:1454–1463. doi:
10.1016/j.foodchem.2007.02.013
182. Gaelle U, Sophie S, Geraldine Sarret, et al (2010) Foliar Lead Uptake by
Lettuce Exposed to Atmospheric Fallouts. Environ Sci Technol 44:1036–1042.
doi: 10.1021/es902190u
183. Nishikiori T, Watanabe M, Koshikawa MK, et al (2015) Uptake and
translocation of radiocesium in cedar leaves following the Fukushima nuclear
accident. Sci Total Environ 502:611–616. doi: 10.1016/j.scitotenv.2014.09.063
184. Shtangeeva I, Ayrault S (2004) Phytoextraction of Thorium from soil and water
media. Water, Air Soil Pollut 154:19–54.
185. Bolca M, Saç MM, Çokuysal B, et al (2007) Radioactivity in soils and various
foodstuffs from the Gediz River Basin of Turkey. Radiat Meas 42:263–270. doi:
10.1016/j.radmeas.2006.12.001
186. Asaduzzaman K, Khandaker MU, Amin YM, et al (2014) Soil-to-root
vegetable transfer factors for 226Ra, 232Th, 40K, and 88Y in Malaysia. J
Environ Radioact 135:120–127. doi: 10.1016/j.jenvrad.2014.04.009
187. Chen SB, Zhu YG, Hu QH (2005) Soil to plant transfer of Th on a uranium
mining-impacted soil from southeastern China. J Environ Radioact 82:223–236.
206
doi: 10.1016/j.jenvrad.2005.01.009
188. Kučera J, Mizera J, Řanda Z, Vávrová M (2007) Pollution of agricultural crops
with lanthanides, thorium and uranium studied by instrumental and
radiochemical neutron activation analysis. J Radioanal Nucl Chem 271:581–
587. doi: 10.1007/s10967-007-0310-2
189. R. Kritsananuwat • S. K. Sahoo • H. Arae •, M. Fukushi (2015) Distribution of
238U and 232Th in selected soil and plant samples as well as soil to plant
transfer factors around Southern Thailand. J Radioanal Nucl Chem 303:2571–
2577. doi: 10.1007/s10967-014-3779-5
190. Harb S (2015) Natural Radioactivity Concentration and Fruits, Effective Dose
in Selected Vegetables and Fruits. J Nucl Part Phys 5:70–73.
191. Abojassim AA, Hady HN, Mohammed ZB (2016) Natural radioactivity levels
in some vegetables and fruits commonly used in Najaf Governorate , Iraq
Níveis de radioatividade natural em alguns vegetais e frutas comumente
comercializadas na província de Najaf , Iraque Natural radioactivity levels in
some. J Bioenergy Food Sci 3:113–123. doi: 10.18067/jbfs.v3i3.108
192. Syarbaini, A W, Iskandar D (2017) Natural Radioactivity in Some Food Crops
from Bangka-Belitung Islands, Indonesia. Atom Indones 40:27–32.
193. Patra AC, Mohapatra S, Sahoo S K., et al (2014) Assessment of ingestion dose
due to radioactivity in selected food matrices and water near Vizag, India. J
Radioanal Nucl Chem 300:903–910. doi: 10.1007/s10967-014-3097-y
194. Shtangeeva I (2008) Uptake of uranium and thorium by native and cultivated
plants. J Environ Radioact 101:458–463. doi: 10.1016/j.jenvrad.2008.06.004
195. Ademola JA (2010) Radiological Analysis of 40K, 226Ra and 232Th in Fish,
207
Crustacean and Sediment Samples from Fresh and Marine Water in Oil
Exploration Area of Ondo State, Nigeria. African J Biomed Res 13:99–106.
196. Alam MN, Chowdhury MI, Kamal M, Ghose S (1995) Radioactivity in marine
fish of the Bay of Bengal. Appl Radiat Isot 46:363–364. doi: 10.1016/0969-
8043(95)00013-4
197. Ademola JA (2014) Estimation of Annual Effective Dose Due to Ingestion of
Natural Radionuclides in Cattle in Tin Mining Area of Jos Plateau, Nigeria. Nat
Sci 6:255–261. doi: 10.4236/ns.2014.65029
198. Tchokossa P, Olomo JB, Balogun FA, Adesanmi CA (2013) Assessment of
Radioactivity Contents of Food in the Oil and Gas Producing Areas in Delta
State, Nigeria. Int J Sci Technol 3:245–250.
199. Shiraishi, Kunio; Tagami, Keiko; Muramastu, Yasuyuki; Yamamoto M (2000)
Contributions of 18 Food Categories to Intakes of 232Th and... : Health Physics.
Health Phys 78:28–36.
200. Misdaq MA, Bourzik W (2004) Evaluation of annual committed effective doses
to members of the public in Morocco due to 238U and 232Th in various food
materials. J Radiol Prot 24:391–399. doi: Doi 10.1088/0952-4746/24/4/003\rPii
S0952-4746(04)88881-5
201. Piimpel T, Parkinar KM (2001) Bioremediation techniques for metal-
containing waste waters using metabolically active micro-organisms. Appl.
Microbiol. 48:
202. Hongda Z (1997) Intakes of food and internal doses by ingestion in two high
radiation areas of China. High levels of natural radiation. Int Congr Ser II36,
Excerpta Medica 1136:149–154.
208
203. Nambi KSV, Bapat VN, David M, et al (1987) Country-wide Environmental
Radiation Monitoring Using Thermoluminescence Dosemeters. Radiat Prot
Dosimetry 18:31–38. doi: 10.1093/oxfordjournals.rpd.a079881
204. T. Allahverdi Pourfallah, A. Shabestani Monfared, H. Babapour M, Shahidi
(2013) Annual Effective Dose of High Level Natural Radiation Areas of
Ramsar. In: World Congr. Med. Phys. Biomed. Eng. p 1241–1244.
205. Veiga R, Sanches N, Anjos RM, et al (2006) Measurement of natural
radioactivity in Brazilian beach sands. Radiat Meas 41:189–196. doi:
10.1016/j.radmeas.2005.05.001
206. Achola SO, Patel JP, Mustapha AO, Angeyo HK (2012) Natural Radioactivity
and external dose in the High Background Radiation Area of Lambwe East,
Southwestern Kenya. Radiat Prot Dosimtery 152:423–428. doi:
10.1093/rpd/ncs047
207. Ajayi OS (2002) Evaluation of Absorbed Dose Rate and Annual Effective Dose
Equivalaent due to terrestrial Gamma Radiation in Rocks in a part of
southwestern Nigeria. Radiat Prot Dosimetry 98:441–444.
208. Institue CMFR (2005) Marine Fisheries Census 2005. Department of animal
Husbandry , Dairying and Fisheries, Krishi Bhavan,New Delhi.
209. Akhter P, Orfi SD, Kawamura H, et al (2002) Intercomparison of INAA and
ICP-MS results for thorium determination in Pakistani diet. J Environ Radioact
62:123–127. doi: 10.1016/S0265-931X(01)00155-2
210. Chung Y, Moon J-H, Kim Su, Park K (2000) Evaluation of Daily Intake of
238U and 232Th in a korean Mixed Diet Sample using RNAA. J Korean Nucl
Soc 32:477–484.
209
211. Iyengar GV, Kawamura H, Dang HS, et al (2004) Estimation of internal
radiation dose to the adult Asian population from the dietary intakes of two
long-lived radionuclides. J Environ Radioact 77:221–232.
212. Zingler J, Hille R (2000) Thorium from natural sources. New perspectives for
incorporation monitoring? In: 10th Int. Congr. Int. Radiat. Prot. Assoc. (IRPA
10) P-3a-143.
213. Shiraishi K, Igarashi Y, Masuda K, et al (1992) Daily intake of 232Th and 238U
in Japanese males. Health Phys 63:187–191.
214. Giang N, Shiraishi K, Sinh NM, et al (2001) Estimation of dietary 232Th, 238U,
cesium, and strontium intakes in Vietnamese people from different
geographical regions. Health Phys 80:605–11.
215. Santos EE, Lauria DC, Amaral ECS, Rochedo ER (2002) Daily ingestion of
232Th, 238U, 226Ra, 228Ra and 210Pb in vegetables by inhabitants of Rio de
Janeiro City. J Environ Radioact 62:75–86.
216. Shiraishi K, Igarashi Y, Yamamoto M, et al (1994) Concentrations of Thorium
and Uranium in Freshwater samples collected in the former USSR. J Radioanal
Nucl Chem 185:157–165.
217. Harmsen K, Haan D (1980) Occurence and behavious of Uranium and thorium
in soil and water. Sci Netherl J Agric 28:40–62.
218. Cochran J. (1984) The fates of uranium and thorium decay series nuclides in
the estuarine environment. Estuary Filter 179–220.
219. Amrani D (2002) Natural radioactivity in Algerian bottled mineral waters. J
Radioanal Nucl Chem 252:597–600.
220. J .B. Olomo, M.K. Akinloye FAB 1 (1994) Distribution of gamma-emitting
210
natural radionuclides in soils and water around nuclear research establishments,
Ile-Ife, Nigeria. Nucl Instruments Methods Phys Res A 353:553–557.
221. IAEA(International Atomic Energy Agency) (1998) Compilation of anatomical,
physiological and metabolic characteristics for a Reference Asian Man. IAEA-
tecdoc-1005.
222. Picer M strohal P (1968) Determination of thorium and uranium in biological
matrices. Anal Chim Acta 40:131–136.
223. Dang, H. S.; Jaiswal, D. D.; Sunta, C. M.; Soman SD (1989) A Sensitive
Method for the Determination of Th in Body Fluids. Health Phys 57:393–396.
224. Hewson, G. S.; Fardy JJ (1993) Thorium Metabolism and Bioassay of Mineral
Sands Workers. Health Phys 64:147–156.
225. Riedel W (1998) Thorium urinary excretion by gas mantle workers. Radiat Prot
Dosimetry 79:119–123.
226. Roth P, Werner E, Wendler I, Schramel P (1997) Variation of natural 232Th
excretion in non-exposed persons. J Radioanal Nucl Chem 226:285–287.
227. Roth P, Hollriegl V, Li WB, et al (2005) Validating an important aspect of the
new ICRP biokinetic model of thorium. Health Phys 88:223–228.
228. Al-Jundi J, Werner E, Roth P, et al (2004) Thorium and uranium contents in
human urine: Influence of age and residential area. J Environ Radioact 71:61–
70. doi: 10.1016/S0265-931X(03)00141-3
229. Mini K, Manujunatha BM, Sreekumar K (2014) Estimation of Radioactivity
Exposure Hazard in Environmental Matrices Due to Monazite in Placer
Deposits of Southwest Coast of Tamilnadu , India. 4:431–434.


