Embed Size (px)
Citation preview

14 Uranium and ThoriumAccumulation in CultivatedPlants
IRINA SHTANGEEVA
Chemical Department, St. Petersburg University, St. Petersburg 199034, Russia
1 INTRODUCTION: URANIUM AND THORIUMIN THE ENVIRONMENT
The transfer of artificial radionuclides along terrestrial food chains has been studiedextensively over the last 30 years, with understandable emphasis on cesium-137 since1986. Naturally occurring radionuclides have not been studied to the same extent.However, in recent years the interest in assessment of the impacts of these radioactiveelements on arable soils, soil microbiota, edible plants, and humans has been increas-ing constantly. Many investigations have been carried out in different countries,especially in those where concentrations of naturally occurring radionuclides insoils are particularly high [Vera Tome et al., 2002; Termizi Rampli et al., 2005;Chen et al., 2005].
There are two main sources of radiation arising from the decay of naturally occur-ring radioactive elements. These are cosmic and terrestrial radiation. Besides, 200years of industrialization has produced and redistributed increasing amounts of radio-active matter via release of additional radiation through mining (especially uranium),coal combustion, cement production, street construction, and other human activities.
The most common terrestrial radioisotopes are uranium-238, thorium-232, andpotassium-40. In this chapter, we will discuss the biogeochemical behavior of twoof them: thorium and uranium. Uranium and thorium are major energy sources,which drive the evolution of the Earth and the planets. Both of these radionuclidesare components of the biosphere, and thus they occur naturally in all soils and plants.
Trace Elements as Contaminants and Nutrients: Consequences in Ecosystems andHuman Health, Edited by M. N. V. PrasadCopyright # 2008 John Wiley & Sons, Inc.
295

Uranium (U) is a naturally occurring radioactive element with atomic number 92.It has the highest atomic weight among the naturally occurring radioactive elements.U is commonly found in very small amounts in rocks, soil, water, plants, and animals(including humans). This metal is weakly radioactive and contributes to low levels ofnatural background radiation in the environment. U has three isotopes, 238U, 235U,and 234U. Although uranium is present in the environment at low concentrations, itis even more abundant than such metals as cadmium, mercury, and lead. Uraniumhad only limited use prior to 1939. However, after the development of the atomicbomb, it was mined extensively.
Thorium (Th) is surprisingly abundant in the Earth’s crust, being almost threetimes more abundant than uranium. Thorium is found in small amounts in mostrocks and soils. Thorium occurs in several minerals, the most common being therare earth–thorium–phosphate mineral, monazite, which contains up to 12% ofthorium oxide. Granitile contains up to 80 mg/kg of Th. In the environment,thorium exists in various combinations with other minerals, such as silica. It is com-monly accepted that most Th compounds found in the environment do not dissolveeasily in water and do not evaporate from soil or water into the air.
The important characteristic of each radioactive element is its half-life. The half-life of a radionuclide is time period during which one-half of the initial number ofatoms undergoes decay to the daughter product. Uranium and thorium isotopeshave extremely long half-lives that range from 4,468,000,000 years for 238U to13,900,000,000 years for 232Th.
U and Th have big cation radii and small electronegativities and ionization potentials(U4þ: 9.7 nm, 1.4, 6.08 eV, respectively; Th4þ: 11.4 nm, 1.0, 6.95 eV, respectively).Therefore, in this respect, their ions are similar to Kþ, Naþ, and the ions of rare earthelements (REE) [Yingjun, 1984]. They are usually enriched in rocks that are alsorich with K, Na, and REE [Bao and Zhang, 1998]. Because of a high valence state,both U and Th can rather easily combine with other elements or ionic groups to formcomplexes. The complexes of U and Th are smaller in density, and thus they caneasier migrate in the environment. Soil U and Th adsorption and complexation pro-cesses apparently influence the uptake of these metals by plants growing in the soils.
2 URANIUM AND THORIUM IN SOIL
In general, soils and plants contain all naturally occurring radioactive elements withhalf-lives comparable to the age of the Earth, although their concentrations in plantsmay be rather low. The biogeochemistry of U and Th in the environment is of majorenvironmental concern [Airey and Ivanovich, 1986; Buck et al., 1996]. Fundamentalknowledge of biogeochemical cycles of these metals and processes involved in theirenvironmental migration are also of practical importance for power generation, watersupply, agriculture, sewage disposal, and environmental protection and remediation.All previous experimental results demonstrated that distribution of U and Th in soil ishighly variable. For example, activity concentrations of 238U in soil can vary byaround three orders of magnitude depending on various factors [Ewers et al.,
296 URANIUM AND THORIUM ACCUMULATION IN CULTIVATED PLANTS

2003]. Therefore, an assessment of the radionuclide distributions in the environment(first of all, in the soil–plant system) may be rather complicated.
Although there are numerous reports in literature on biogeochemistry of bothelements [Sheppard and Eveden, 1988; Mazor, 1992; Mortvedt, 1994; Voigt et al.,2000; Yoshida et al., 2000; Edmands et al., 2001; Vera Tome et al., 2002; Ehlkenand Kirchner, 2002; Rodrigues et al., 2002; Vera Tome et al., 2003; Thiry et al.,2005; Tsuruta, 2006; Galindo et al., 2007], the number of publications on uraniumprevails. This is not surprising because uranium is an important element fornuclear production. Over 16% of the world’s electricity is generated from uraniumin nuclear reactors and this consumption amounts to be 65,434 tons of uraniumper year [Hore-Lacy, 2003]. The published data on the fate and transport ofthorium in the environment are more limited. However, recently the biogeochemistryof thorium has generated more interest to environmental scientists [Higgy and Pimpl,1998; Zararsiz et al., 1997; Morton et al., 2001; Sar and D’Souza, 2002; Mortonet al., 2002; Larson et al., 2005; Hollriegl et al., 2007].
Thorium is widely distributed in the environment. Th is a typical lithophilicelement, and its geochemical behavior is very similar to that of rare earth elements(especially cerium), zirconium, hafnium, and uranium [Huist, 1997]. The geochem-istry of Th is simplified by the existence of just one valence state, þ4. Since Th insolution is a highly charged cation, it undergoes extensive interaction with waterand many anions to form complex compounds [Wright, 1999].
Uranium exists naturally in the Earth crust at mean content of 2.5 mg/kg. Thebehavior of U in soils is mostly influenced by physicochemical processes (speciationin soil solution and binding with mineral/organic particles) and biological processes(interactions with soil microorganisms, root exudates). Uranium is present in thesoil primarily (80–90%) in the þ6 oxidation state as the uranyl (UO2
2þ) cation[Shahandeh and Hossner, 2002]. U(VI) is the most mobile form of U. It exists insolution predominantly as UO2
2þ and as soluble carbonate complexes, (UO2)2
CO3(OH)32, UO2CO3
0, UO2(CO3)222, UO2(CO3)3
42, and possibly (UO2)3(CO3)662
[Duff and Amrhein, 1996]. Within the pH range of 4.0 and 7.5 and in the absenceof dissolved inorganic ligands (carbonate, fluoride, sulfate, and phosphate), thehydroxyl species UO2OHþ, UO2(OH)2
0, and (UO2)2(OH)2þ dominate U(VI) specia-tion [Meinrath et al., 1996]. Uranium in soil and in water forms complexes withsulfate and phosphate as well as with carbonate and hydroxide. These complexesmay increase the total solubility of U.
The variety of the molecular forms in which uranium is present in the environmentprovides the ability of the uranium atom to form complex connections. Uranium inthe uranyl form can be absorbed in the organism, for example, with phosphate or car-bonate complexes [Schott et al., 2006]. All these different forms have different bio-logical activities and, thus, also different toxicities.
2.1 Soil Characteristics Affecting Uranium and Thorium Plant Uptake
The study of U and Th transfer from soil to edible vegetation through root uptake isvery important, especially considering accumulation of these radionuclides in the
2 URANIUM AND THORIUM IN SOIL 297

food chains. An understanding of the mobility of U and Th in soils and their transferto different plants requires a detailed knowledge of U and Th interactions with soilcomposed of abiotic and biotic components. Despite numerous studies on U andTh content in vegetation, there is little information related to the rate of theiruptake and storage by different plant species, especially in field conditions.
Concentrations of Th and U in soil (one of the main factors affecting plant uptakeof the radionuclides) differ significantly depending on soil type, parent rocks, climate,relief, vegetation season (if we say about rhizosphere soil), and many other reasons.Typical concentration range of Th in soils is 2–12 mg/kg with an average valueof 6 mg/kg [Kabata-Pendias and Pendias, 2000]. The worldwide mean U concen-tration in noncontaminated soils ranges from 0.4 to 6.0 mg/kg [Shacklette andBoerngen, 1984]. In general, distribution of natural radionuclides in backgroundsoils follows Gaussian distribution (Fig. 1). However, in contaminated soils ahighly heterogeneous distribution of these metals may be observed (Fig. 2).
Among other factors, radionuclide uptake by plants depends on soil characteristics[Pulhani et al., 2000]. Table 1 illustrates mean concentrations of U and Th in differentsoils. Concentrations of Th and U in natural soils may differ, for instance, dependingon the soil particle size. As was reported [Frindik and Vollmer, 1999], in the rangebelow 150 mm, total alpha activities of soil particles have been found to increase con-tinuously with decreasing particle size. The activity increase was due to the growingshare of uranium in this fine-particle range. Thorium isotopes demonstrated even ahigher contribution to the activity compared to uranium isotopes.
Certain differences in bioavailability of radionuclides among soils may or may notbe based on just quantitative properties of the soils [Sheppard and Evenden, 1992].
Figure 1. Distribution of Th in background soil.
298 URANIUM AND THORIUM ACCUMULATION IN CULTIVATED PLANTS

Figure 2. Distribution of Th in soil taken from a contaminated area.
TABLE 1. Mean Concentrations of U and Th in Different Soils Takenfrom Background Areas
Type of Soil U (mg/kg) Th (mg/kg) Source
Podzolic 0.12 4.8 Tynybekov and Hamby [1999]Gray forest soil 0.12 6.0 Tynybekov and Hamby [1999]Wetland soil 0.4 8.9 Knox et al. [2006]Red soil 0.35 2.6 Tynybekov and Hamby [1999]Sandy soil 0.6 5.8 Bednar et al. [2004]Limed sand 0.6 Sheppard and Evenden [1992]Chernozem 0.93 5.2 Tynybekov and Hamby [1999]Ophiolitic soil 1.0 2.4 Tzortis and Tsertos [2005]Loam 2.1 Sheppard and Evenden [1992]Loam 2.2 5.7 Shtangeeva et al. [2005]Sandy loam 2.2 9.6 Shtangeeva et al. [2006]Coral sand soil 3.0 Robison et al. [2005]Alluvial soil 3.7 5.7 Pulhani et al. [2000]Acid sand 4.1 Sheppard and Evenden [1992]Orthic ferralsols 4.9 14.9 Termizi Ramli et al. [2005]Calcerous 7.6 Orvini et al. [2000]Silt 8.5 Chaosheng [2002]Silt mud 11.7 Chaosheng [2002]Mud 13.4 Chaosheng [2002]Agricultural soil 5.8 Miljevic et al. [2001]
2 URANIUM AND THORIUM IN SOIL 299

Unfortunately, a large part of the available literature refers to the studies either in soilsof high background areas or pot experiments with spiked radioactivity in nutrient sol-ution. The experiments using nutrient solutions as a growth medium give onlyapproximate estimates of the processes occurring in the complex soil solutionunder ordinary conditions and do not reflect the real situation existing in a field.
The basic premise of many radioecological assessments is the assumption that thetransfer of radionuclides from soil to plants and hence animals derived food productsis a positive linear relationship for a given set of ecological/agricultural conditions[Beresford and Wright, 2005]. Numerous publications have reported such a linearrelationship between total radionuclide concentration in the hydroponic solutionand total amount of the radionuclide in the plant roots, even no matter what is thepH of the growth medium [Ebbs et al., 1998; Shtangeeva and Ayrault, 2004;Laroche et al., 2005; Blanco Rodrıguez et al., 2006].
However, plant radionuclide concentrations are not so often linearly related to soilradionuclide concentrations [Diebold and McGrath, 1985; Sheppard and Sheppard,1985; Sheppard and Evenden, 1988; Sheppard et al., 1989]. Nonlinearity can com-plicate the measurement of bioavailability, because each plant and soil combinationmay have a unique curvilinear relationship. We may assume that it would be hardlypossible to use experimental results of greenhouse tests conducted with plants grownin various nutrient solutions to predict uptake and translocation of metals by plantsgrown in soil. Soil and liquid media are absolutely different systems, and mechanismsof metal uptake by plants growing in nutrient solutions and in soils may be ratherdifferent. As was shown, uranium uptake by soil-grown plants is not related tosimple bioavailability parameters, and only complex models considering severalsoil characteristics can help to predict uranium uptake [Vandenhove et al., 2007].It is not surprising that nutrition of plants growing in hydroponic solution may bedifferent compared with that in soil. In liquid media, trace metals, including U andTh, are already present in bioavailable forms. In soil, many factors will affect mobi-lity of these metals and, thus, their availability to plants. In particular, soil type cangreatly affect the sorption and subsequent desorption of metals. As an example, wecan compare here uptake and translocation of radionuclides by plants grown in soiland in a hydroponic medium. Ramaswami et al. [2001] reported results of exper-iments performed simultaneously in hydroponics and in two soils (a sandy-loamsoil and an organic-rich soil). They found that efficiency of uranium extractiondecreased sharply from hydroponic to sandy and, especially, organic soil, indicatingthat soil organic matter sequestered uranium, rendering it largely unavailable for plantuptake. These results indicate that detailed description of site-specific soils must bedone to screen plants for radionuclide extraction capability.
2.2 Effects of Soil Amendments
The data on plant uptake of radionuclides under natural field conditions, especiallyfrom background areas, are scarce. The soil properties such as pH, clay minerals,Ca, K, organic matter contents, and fertilizer application can strongly affect the reten-tion, uptake, and distribution of radionuclides in plants. As a result, it may be ratherdifficult to predict the rates of uptake of radionuclide in a particular site.
300 URANIUM AND THORIUM ACCUMULATION IN CULTIVATED PLANTS

Uranium and thorium concentrations are often higher in phosphate-richsoils. Application of certain fertilizers with higher concentrations of theseradionuclides—for example, common mineral fertilizer super phosphate—can poten-tially result in accumulation of U and Th in food crops grown in the amended soils.Fertilizers can contain elevated levels of the uranium series, the thorium series andpotassium-40 [Akhtar and Tufail, 2007]. The enormous utilization of phosphaterock and super phosphate derived from it has the potential of being an importantfactor in the soil contamination with these radionuclides. Both rock phosphate andsuper phosphate contain substantial levels of natural uranium, amounting to hundredsof ppm. It was shown [Hamamo et al., 1995] that whereas the uranium series in phos-phate rock is nearly in equilibrium, in super phosphate the 226Ra and its progeny aredepleted by 60–70%. This is a result of the chemical processing of the rock phos-phate. On the other hand, the super phosphate is much more soluble and may beexpected to release radionuclides to the environment more rapidly thanrock phosphate.
Cooper et al. [1995] published results of field trials on application of RMD(bauxite mining residues termed “red mud” combined with gypsum) to sandy loamsoils. They found that such a soil treatment resulted in a linear increase in concen-trations of radionuclides of uranium and thorium series in the soil. It is interestingthat tests with application of super phosphate to these soils did not show suchsignificant increase of radionuclide levels in the soils as was observed by theauthors with RMG.
3 RADIONUCLIDES IN PLANTS
In general, accumulation of radionuclides in plants depends upon many factors,including plant species, tissue type (e.g., leaf versus fruit), soil–water–plant relation-ships, soil type, and the amount and chemical form of the radionuclide in the soil.Until now for many soil–crop combinations, only a few datasets could be found.The radionuclide concentrations in plants vary significantly with type of crop andthe part(s) harvested. A method describing the radionuclide accumulation in aplant is called concentration ratio (CR). CR is the ratio of radionuclide concentrationin a plant to concentration of the radionuclide in soil. The CR can vary throughoutseveral orders of magnitude. Published data indicates that under ordinary conditions,concentrations of radionuclides found in plant tissues are quite low compared withthose in soil. For example, CR values reported by Mortvedt [1994] ranged from0.00148 to 0.00006.
We will not cite here concentrations of U and Th in various cultivated plantspecies. Unfortunately, reported values differ significantly. We may assume thatnatural difference in the uptake of radionuclides by plant is not the only reason forsuch a situation. Certain contribution may also be provided by significant differencesin the methodologies of plant sampling and preparation of the plant material forelemental analysis as well as quite expectable differences in accuracy of variousanalytical techniques used for determination of very low Th and U concentrations
3 RADIONUCLIDES IN PLANTS 301

in the plants. Here we will just consider some of main factors affecting U and Thuptake and transport in a plant.
3.1 Accumulation of Uranium and Thorium in Plant Roots
It has been reported in numerous publications that concentrations of U and Th in rootsare much higher than in leaves and in seeds [Shtangeeva, 1993; Pulhani et al., 2000;Shtangeeva and Ayrault, 2004; Chang et al., 2005]. Typical distribution of U and Thin roots and leaves of wheat grown in Podzolic soil is demonstrated in Fig. 3.
In general, roots serve as a natural barrier preventing the transport of many tracemetals, including radionuclides to upper plant parts. Moreover, the rate of radio-nuclide translocations from roots to shoots is probably species-dependent. It maybe different for different species and even cultivars. For example, Shahandeh andHossner [2002] reported that U concentration in roots of different plants collectedfrom the same site was 30–50 times higher than U concentration in shoots.Among other plant species tested by the authors, sunflower and Indian mustardhad the highest root U concentrations, and wheat and ryegrass had the lowest U con-centrations in roots.
Uptake of U and Th is likely to be influenced by the type of the plant roots. It wasreported [Sheppard et al., 1985; Apps et al., 1988] that U content in root samples wasconsistently higher for fine roots than for bigger roots. For each root diameter class,the root barks (including periderm and living phloem) were shown to contributegreatly to the U accumulation in roots. Since the adhering soil particles may beeasily washed from the roots, incomplete removal of substrate from the rootsurface hardly could explain the high concentration of U in the root bark, whichaccounted for 19–60% of the average soil concentration. But some doubt remains
Figure 3. Mean concentrations of U and Th in roots and leaves of wheat.
302 URANIUM AND THORIUM ACCUMULATION IN CULTIVATED PLANTS

on the form and exact localization of U in the root tissues. Mineral precipitates(autunite, Ca(UO2-PO4)2 �10H2O) have been found in the tips of plant roots [Joneset al., 1990]. It is probable that a major part of U is simply sorbed on the outerroot tissues. A striking fission track image of the U distribution in root samples oftrees on abandoned tailings showed that U was concentrated outside the vascularcambium forming a uranium-rich sheath [Apps et al., 1988]. This surface accumu-lation could result from the formation of sparingly soluble carbonates or hydroxy-carbonates as suggested by Truby [1995] for other metals.
It is clear that uptake of U and Th by plants depends significantly on the plantspecies. We will demonstrate this in the example of two plants—rye and wheat—grown simultaneously under the same conditions in soil where were added smallamounts of U and/or Th.
3.2 Differences in U and Th Uptake by Different Plant Species (in theexample of wheat Triticum aestivum and Rye Secale cereale)
Five-day-old germinated seedlings of wheat (Triticum aestivum L.) and rye (Secalecereale L.) were transferred to large ceramic pots filled with soil. Before sowing,soil in the pots was watered with 500 ml of four different water solutions: control(ordinary water); Th(NO3)4; (UO2)(NO3)2; mixture of nitrates of U and Th (concen-trations of U and Th in the solutions were 50 mg/l). Plants and soil (from the rootsurface) were collected three times: within 3, 7, and 11 days after sowing.
Tables 2 and 3 present mean concentrations of elements in roots and leaves of ryeand wheat. Although rye is botanically related to wheat (both belong to the tribeHordeae), these two plants differ markedly in concentrations of many elements. Inmost cases, wheat has higher amounts of elements than rye. This is typical bothfor roots and for leaves of the plants. The only exception is Na; its concentrationin the rye leaves is statistically significantly higher than in the leaves of wheat. Inroots of rye and wheat, concentration of Na is very similar.
Concentrations of many elements (As, Co, Eu, Fe, Na, Sc, Ta, U, and Zn) in roots ofboth these plants are statistically significantly higher than in leaves. This indicates thatroots prevent penetration of large amounts of different elements to upper plant parts.Plants have evolved highly specific mechanisms to take up, translocate, and storevarious elements. The uptake mechanism is selective; plants preferentially acquiresome elements over others. For example, concentrations of essential plant nutrientssuch as K (and Rb, a chemical analogue of K) and Sr in leaves of rye and wheat arehigher than in roots. This means plants use the mechanism of active transport ofthese elements from roots to leaves. It was a bit strange, however, that concentrationof Sb in leaves of rye and wheat was higher than in roots. Sb is not an essentialplant nutrient; at the moment, however, we have no explanation of this fact.
After adding U and Th to soil, concentration (total amount) of these radionuclidesin the soil increased significantly. As compared to control, U concentrationwas 6 times higher after treatment with U and 3 times higher after treatment withUþTh. Soil Th concentration was 5 times higher after treatment with Th and 3times higher after treatment with UþTh. We did not observe leaching of these
3 RADIONUCLIDES IN PLANTS 303

TA
BL
E2.
Mea
nC
once
ntra
tion
sof
Ele
men
ts(m
g/kg
)in
Rye
Ele
men
t
Con
trol
þU
þT
hUþ
Th
Roo
tsL
eave
sR
oots
Lea
ves
Roo
tsL
eave
sR
oots
Lea
ves
As
0.43
+0.
11,
0.4
0.57
+0.
06,
0.4
0.45
+0.
23,
0.4
0.46
+0.
14,
0.4
Au
0.09
+0.
02a
0.19
+0.
110.
12+
0.03
0.16
+0.
100.
16+
0.12
0.13
+0.
120.
14+
0.02
b0.
19+
0.07
Ba
25.3+
3.0c
35.1+
0.5
20.5+
7.4
28.8+
12.2
33.9+
8.0
34.9+
8.9
18.8+
2.0b
38.0+
8.5
Br
18.9+
18.2
c4.
84+
1.58
7.12
+1.
843.
15+
0.31
14.9+
10.4
3.56
+0.
4312
.5+
10.7
3.33
+1.
19C
a(%
)0.
49+
0.03
c0.
78+
0.24
0.56
+0.
270.
84+
0.27
0.43
+0.
050.
78+
0.20
0.46
+0.
130.
72+
0.33
Ce
1.71
+0.
491.
72+
0.37
,5
1.82
+0.
702.
21+
1.69
2.10
+0.
823.
01+
1.99
1.60
+0.
63C
o0.
31+
0.01
a,c
0.08
+0.
01a
0.45
+0.
06b
0.09
+0.
010.
42+
0.09
0.10
+0.
010.
37+
0.08
0.08
+0.
04C
r8.
66+
2.23
6.16
+0.
6322
.0+
16.7
6.88
+1.
6312
.8+
8.5
6.16
+1.
2315
.3+
8.4
5.76
+2.
11C
s1.
50+
1.08
1.43
+0.
910.
96+
0.10
1.26
+0.
833.
09+
1.76
0.53
+0.
131.
27+
0.65
2.07
+1.
66E
u0.
08+
0.02
a,c
0.03
+0.
01a
0.12
+0.
01b
0.03
+0.
020.
13+
0.10
0.03
+0.
030.
35+
0.42
0.03
+0.
01Fe
610+
109a
,c31
7+
8685
5+
160
319+
8877
9+
1430
4+
2962
8+
179
287+
122
Hf
1.16
+0.
400.
94+
0.19
a1.
70+
0.49
1.08
+0.
351.
62+
1.05
0.90
+0.
291.
38+
0.04
0.94
+0.
41K
(%)
1.92
+0.
78c
5.09
+2.
162.
45+
1.16
5.63
+2.
892.
13+
0.69
5.75
+1.
722.
00+
0.97
5.68
+1.
75L
a0.
59+
0.05
0.72
+0.
17a
,1
0.77
+0.
210.
79+
0.61
0.82
+0.
260.
35+
0.23
0.67
+0.
22
304

Lu
0.02
+0.
01a,c
0.05
+0.
010.
05+
0.01
b0.
05+
0.02
0.04
+0.
030.
04+
0.02
0.04
+0.
01b
0.04
+0.
01N
a(%
)0.
83+
0.21
c0.
13+
0.02
a0.
82+
0.03
0.13
+0.
011.
04+
0.36
0.12
+0.
010.
94+
0.32
0.13
+0.
03R
b22
.3+
3.6c
36.4+
14.0
25.6+
6.63
38.4+
17.8
23.7+
4.6
38.3+
10.4
19.6+
6.4
36.9+
8.9
Sb
0.73
+0.
05c
1.83
+0.
97a
1.20
+0.
572.
08+
1.69
1.94
+1.
313.
01+
3.27
0.84
+0.
424.
44+
3.13
Sc
0.11
+0.
03a,c
0.03
+0.
01a
0.17
+0.
060.
04+
0.01
0.15
+0.
010.
03+
0.01
0.12
+0.
030.
03+
0.01
Sm
0.07
+0.
02a
0.08
+0.
02a
0.99
+0.
38b
0.11
+0.
030.
13+
0.02
b0.
09+
0.03
0.60
+0.
350.
07+
0.03
Sr
,25
16.6+
5.7
,36
60.5+
42.8
,21
80.2+
55.3
,21
124+
7T
a0.
06+
0.03
,0.
050.
14+
0.09
,0.
050.
09+
0.03
,0.
050.
08+
0.03
,0.
05T
h0.
21+
0.02
a0.
18+
0.01
0.32
+0.
06b
0.19
+0.
069.
56+
2.30
b0.
22+
0.06
5.68
+2.
67b
0.27
+0.
09U
0.77
+0.
37,
0.40
34.2+
13.8
b0.
35+
0.05
1.26
+0.
100.
42+
0.08
17.5+
12.3
0.45
+0.
23Y
b0.
12+
0.05
0.18
+0.
03a
0.20
+0.
070.
21+
0.08
0.19
+0.
100.
19+
0.06
0.14
+0.
040.
20+
0.09
Zn
171+
63c
68.2+
8.6
179+
4665
.8+
3.1
181+
5471
.4+
15.4
148+
5171
.9+
12.3
aD
iffe
renc
esbe
twee
nry
ean
dw
heat
are
stat
istic
ally
sign
ifica
nt(P
,0.
05).
bD
iffe
renc
esbe
twee
nco
ntro
lan
ddi
ffer
ent
trea
tmen
tsar
est
atis
tical
lysi
gnifi
cant
(P,
0.05
).c D
iffe
renc
esbe
twee
nro
ots
and
leav
esof
cont
rol
plan
tsar
est
atis
tical
lysi
gnifi
cant
(P,
0.05
).
305

TA
BL
E3.
Mea
nC
once
ntra
tion
sof
Ele
men
ts(m
g/kg
)in
Whe
at
Ele
men
t
Con
trol
þU
þT
hUþ
Th
Roo
tsL
eave
sR
oots
Lea
ves
Roo
tsL
eave
sR
oots
Lea
ves
As
0.86
+0.
09,
0.4
0.75
+0.
26,
0.4
0.71
+0.
15,
0.4
0.45
+0.
07,
0.4
Au
0.31
+0.
030.
21+
0.16
0.19
+0.
100.
17+
0.09
0.20
+0.
070.
28+
0.11
0.29
+0.
130.
20+
0.15
Ba
27.3+
3.2
32.7+
15.1
19.7+
3.9
30.7+
9.8
29.6+
16.9
32.3+
19.6
32.2+
15.8
33.5+
13.3
Br
18.7+
6.5a
7.52
+1.
9910
.5+
5.5
5.98
+1.
4624
.6+
20.0
5.92
+1.
7718
.6+
13.0
5.51
+1.
77C
a(%
)0.
66+
0.37
0.82
+0.
220.
70+
0.04
0.88
+0.
260.
91+
0.17
0.85
+0.
510.
79+
.022
0.88
+0.
40C
e2.
30+
1.17
2.42
+0.
673.
01+
2.63
2.42
+0.
782.
03+
0.66
3.23
+0.
423.
84+
1.67
2.24
+0.
39C
o0.
47+
0.01
a0.
14+
0.04
0.43
+0.
040.
13+
0.02
0.51
+0.
020.
13+
0.02
0.41
+0.
040.
14+
0.02
Cr
29.9+
23.0
a9.
56+
2.68
15.8+
0.4
8.67
+2.
4222
.7+
10.5
10.9+
2.9
25.7+
19.8
8.47
+1.
01C
s1.
23+
0.93
1.53
+1.
090.
82+
0.35
1.63
+1.
341.
73+
0.21
0.91
+0.
071.
98+
1.50
1.22
+0.
39E
u0.
15+
0.01
a0.
05+
0.01
0.17
+0.
050.
04+
0.01
0.21
+0.
080.
07+
0.06
0.14
+0.
010.
04+
0.01
Fe97
8+
9a40
9+
120
625+
209
364+
8791
5+
304
429+
101
614+
63b
355+
66H
f2.
06+
0.52
1.66
+0.
401.
85+
0.40
1.59
+0.
472.
87+
1.45
1.96
+0.
593.
37+
2.68
1.37
+0.
18K
(%)
2.19
+0.
75a
6.23
+0.
342.
80+
0.98
6.47
+2.
193.
23+
1.02
6.63
+1.
353.
24+
1.22
7.39
+2.
32L
a0.
94+
0.20
1.22
+0.
240.
95+
0.05
1.11
+0.
240.
95+
0.30
1.39
+0.
600.
44+
0.59
1.09
+0.
18
306

Lu
0.05
+0.
010.
08+
0.03
0.09
+0.
030.
08+
0.02
0.08
+0.
040.
10+
0.03
0.09
+0.
070.
07+
0.01
Na
(%)
0.80
+0.
14a
0.06
+0.
010.
54+
0.13
0.06
+0.
010.
91+
0.42
0.06
+0.
010.
83+
0.15
0.05
+0.
01R
b28
.8+
3.5a
40.1+
3.7
30.6+
11.1
40.8+
18.8
37.2+
12.4
40.3+
10.1
33.9+
14.5
45.9+
13.8
Sb
0.82
+0.
45a
4.13
+0.
620.
85+
0.34
4.64
+3.
501.
99+
1.29
2.68
+2.
181.
51+
0.48
1.17
+0.
60S
c0.
20+
0.01
a0.
05+
0.01
0.13
+0.
050.
04+
0.01
0.18
+0.
080.
08+
0.03
0.11
+0.
050.
04+
0.01
Sm
0.14
+0.
020.
15+
0.02
0.76
+0.
10b
0.15
+0.
030.
16+
0.05
0.19
+0.
060.
56+
0.28
0.13
+0.
01S
r,
4015
.0+
5.0
,32
27.6+
15.2
,19
28.9+
12.1
,25
24.7+
10.0
Ta
0.10
+0.
01,
0.05
0.09
+0.
02,
0.05
0.13
+0.
06,
0.05
0.14
+0.
10,
0.05
Th
0.32
+0.
040.
28+
0.09
0.26
+0.
040.
24+
0.09
8.59
+3.
90b
0.79
+0.
469.
92+
12.1
0.32
+0.
04U
0.91
+0.
04a
0.25
+0.
1023
.2+
3.9b
0.32
+0.
131.
06+
0.47
0.32
+0.
1311
.6+
2.9b
0.21
+0.
06Y
b0.
25+
0.07
0.35
+0.
070.
37+
0.30
0.30
+0.
090.
29+
0.15
0.44
+0.
130.
39+
0.38
0.29
+0.
06Z
n17
0+
2a87
.6+
11.9
195+
8783
.2+
8.8
163+
1782
.3+
4.3
147+
5076
.9+
0.8
aD
iffe
renc
esbe
twee
nro
ots
and
leav
esof
cont
rol
plan
tsar
est
atis
tical
lysi
gnifi
cant
(P,
0.05
).bD
iffe
renc
esbe
twee
nco
ntro
lan
ddi
ffer
ent
trea
tmen
tsar
est
atis
tical
lysi
gnifi
cant
(P,
0.05
).
307

metals to deeper soil layers. Concentrations of Th and U in the soil from the bottomof all pots were approximately the same, regardless of the treatments.
Rye and wheat grown in the radionuclide-enriched soils demonstrated significantincrease in concentrations of Th and especially U in roots. After addition of mixtureof U and Th to soil, concentrations of these metals in the plant roots were alsoincreased. However, this increase was not so marked as it was in the case where Uor Th was added to soil as a single element, probably because of competitionbetween these metals during uptake process. It is significant that concentrations ofU and Th in leaves remained unchanged. This means that transfer of these radio-nuclides from soil to leaves via root uptake was minimal.
Figure 4 shows distribution of U in control soil, in soil where was added U and inroots of rye and wheat grown in the soils. In roots of both plants grown in clean
Figure 4. Concentration of U in control and U-contaminated soils and in roots of rye andwheat grown in the soils.
308 URANIUM AND THORIUM ACCUMULATION IN CULTIVATED PLANTS

(control) soil, concentration of U was lower than U content in the soil. However, inroots of the plants grown in U-enriched soil, U concentration was much higher thanthat in roots of the control plants, and it was higher than U content in the rhizospheresoil. Another situation was observed in the plants grown in Th-enriched soil (Fig. 5).In this case, Th concentration in roots was always lower than that in soil. This indi-cates that Th is less available to plant uptake than U.
Figure 6 shows ratios of U and Th concentrations in roots of wheat and rye to con-centrations of these elements in the soil where the plants were grown. The ratios arehigher for U than for Th for all the treatments and for both plant species. It wasreported that mobility of uranium in soil is higher than thorium mobility, regardlessof the soil type [Titaeva, 1992; Morton et al., 2001]. Th4þ is readily soluble, but at thesame time it may be quickly adsorbed or precipitated as hydrolysate. It was suggested[Bednar et al., 2004] that Th could migrate in soil differently than U: either as a nega-tively charged particle or as anionic complex with organic matter. Since soil metal
Figure 5. Concentration of Th in control and Th-contaminated soils and in roots of rye andwheat grown in the soils.
3 RADIONUCLIDES IN PLANTS 309

mobility correlates with availability of the metal to plant, we can expect certaindifferences in the bioavailability of U and Th.
U[root]/U[soil] ratios in the experiments with U and UþTh are higher than 1. Onemight expect that such a significant uptake of U by plants could result in a decrease ofU concentration in the rhizosphere soil. As an example, Fig. 7 illustrates dynamics ofU in the soil where rye was grown (control, after adding U, and after adding UþTh).With time, soil U concentration slightly decreased in the experiment with mixture ofU and Th and decreased rather significantly in the experiment where only U wasadded to soil. Such a decrease of soil U concentration resulted from uptake of Uby the plant roots. The decrease was lower in the experiment with UþTh becauseplants could uptake less U than was observed in the experiment with U alone.
Rye could uptake more U than wheat. This was typical for all treatments (U, Th,and UþTh). As a result, there was no such a significant decrease of U content in therhizosphere soil of wheat as we observed in the rhizospere soil of rye. The ratios of
Figure 6. Ratios of U and Th concentrations in roots of rye and wheat grown in control andcontaminated soils to U and Th concentrations in the control soil and in the soil where U or Th(single) and UþTh (mixture) were added.
310 URANIUM AND THORIUM ACCUMULATION IN CULTIVATED PLANTS

radionuclide concentrations in roots of the plants grown in contaminated soil to thosein roots of the control plants were �45 (rye) and �26 (wheat). Despite such asignificant increase of U and Th concentrations in the plants, U content in the con-taminated soils decreased only two times. Soil Th concentration remainedunchanged. Moreover, U was not transferred from roots to leaves; therefore, it wasnot actually removed from the contaminated soil.
Main conclusions from these observations are the following: (1) Biomass of theyoung seedlings was probably too small to remove large amounts of radionuclidesfrom the contaminated soil; (2) due to higher mobility of U in soil and, as a result,higher level of bioavailability of this metal to plants, U may be more easilyremoved from soil than Th; and (3) rye can uptake more U than wheat, and thus itmay be a promising plant species for U phytoextraction from contaminated soils.
3.3 Effects of U and Th Bioaccumulation on Distributionof Other Elements in Rye and Wheat
Bioaccumulation of any metal in a plant can result in certain variations in concen-trations of some other elements in the plant. In our experiments, roots of wheatsuffered less than roots of rye. Compared to control, in roots of wheat grown inU-contaminated soil, concentration of Sm was statistically significantly higher, andin roots of wheat grown in soil where were added UþTh, concentration of Fe waslower (P , 0.01). In roots of rye, more variations in element concentrations wereobserved after the treatment of soil with U. In this case, concentrations of Co, Eu,Lu, Sm, and Th were statistically significantly higher than those in roots of thecontrol plants. Concentration of Sm in roots of rye grown in Th-enriched soil washigher (P , 0.05) than Sm content in roots of the control plants. In roots of ryegrown in the soil treated with UþTh, concentrations of Au and Lu increased andBa content decreased. Elemental composition of leaves of rye and wheat seedlings
Figure 7. Dynamics of U in control soil and in soil where U and UþTh were added.
3 RADIONUCLIDES IN PLANTS 311
remained rather stable for all the treatments (as we remember, there was no increaseof U and Th concentrations in leaves of the plants grown in contaminated soils).
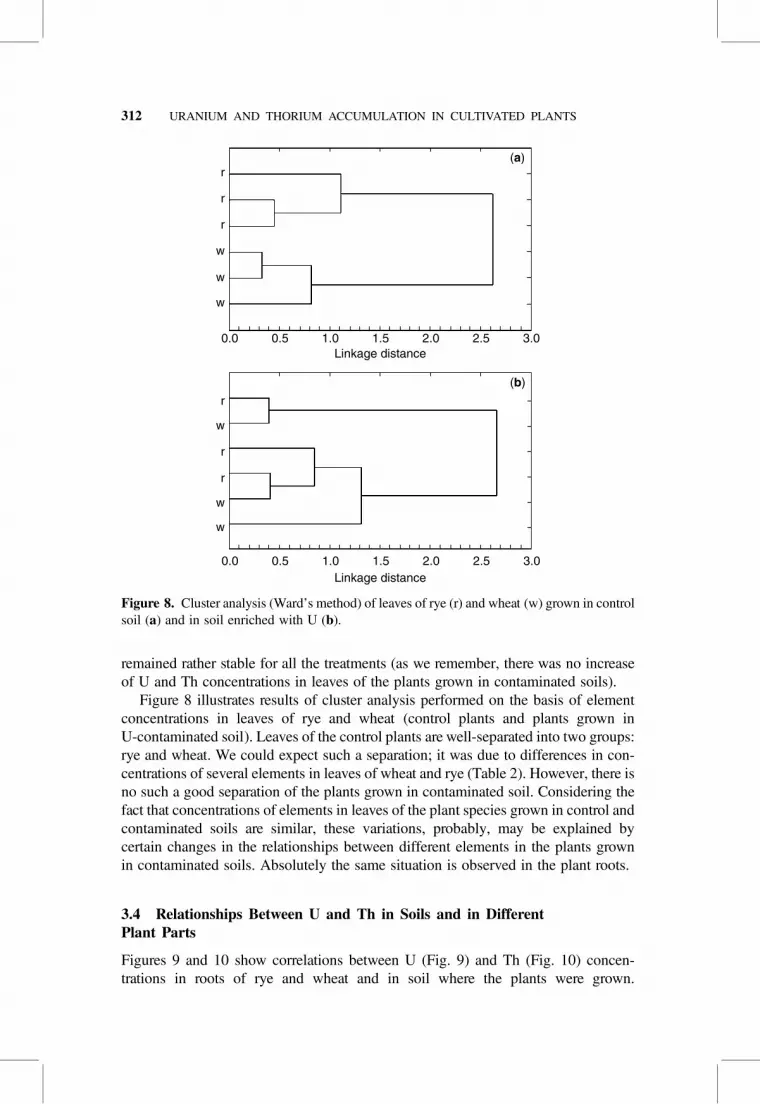
Figure 8 illustrates results of cluster analysis performed on the basis of elementconcentrations in leaves of rye and wheat (control plants and plants grown inU-contaminated soil). Leaves of the control plants are well-separated into two groups:rye and wheat. We could expect such a separation; it was due to differences in con-centrations of several elements in leaves of wheat and rye (Table 2). However, there isno such a good separation of the plants grown in contaminated soil. Considering thefact that concentrations of elements in leaves of the plant species grown in control andcontaminated soils are similar, these variations, probably, may be explained bycertain changes in the relationships between different elements in the plants grownin contaminated soils. Absolutely the same situation is observed in the plant roots.
3.4 Relationships Between U and Th in Soils and in DifferentPlant Parts
Figures 9 and 10 show correlations between U (Fig. 9) and Th (Fig. 10) concen-trations in roots of rye and wheat and in soil where the plants were grown.
Figure 8. Cluster analysis (Ward’s method) of leaves of rye (r) and wheat (w) grown in controlsoil (a) and in soil enriched with U (b).
312 URANIUM AND THORIUM ACCUMULATION IN CULTIVATED PLANTS
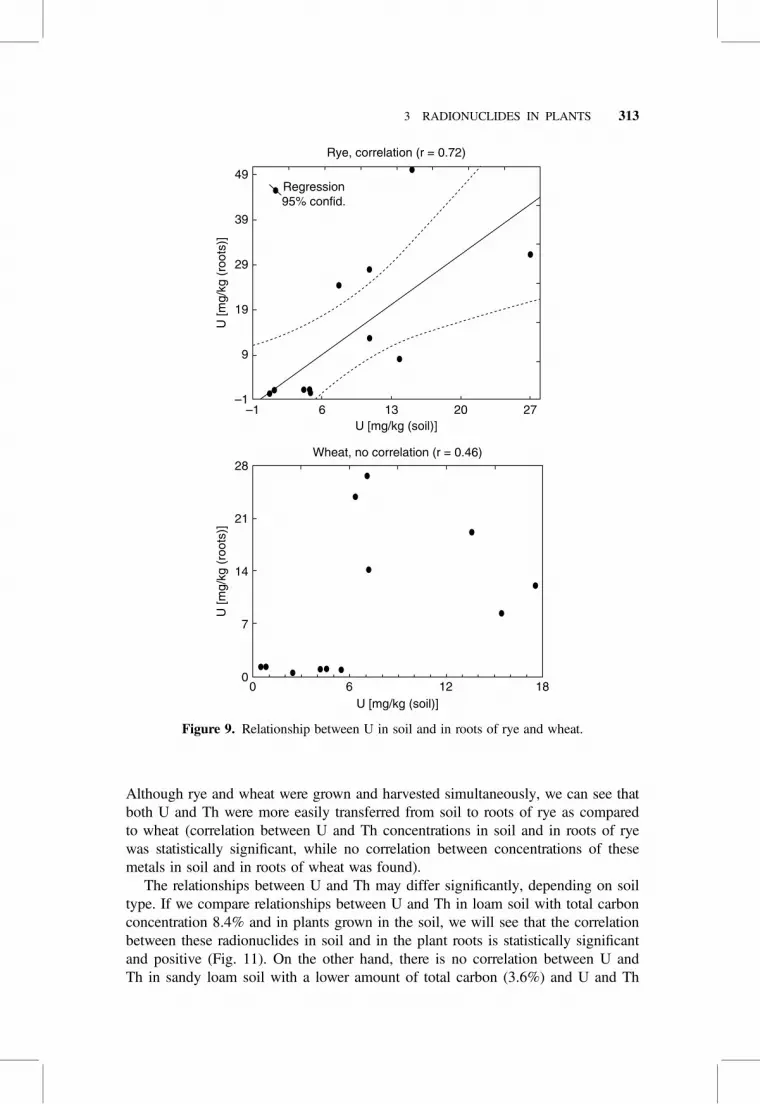
Although rye and wheat were grown and harvested simultaneously, we can see thatboth U and Th were more easily transferred from soil to roots of rye as comparedto wheat (correlation between U and Th concentrations in soil and in roots of ryewas statistically significant, while no correlation between concentrations of thesemetals in soil and in roots of wheat was found).
The relationships between U and Th may differ significantly, depending on soiltype. If we compare relationships between U and Th in loam soil with total carbonconcentration 8.4% and in plants grown in the soil, we will see that the correlationbetween these radionuclides in soil and in the plant roots is statistically significantand positive (Fig. 11). On the other hand, there is no correlation between U andTh in sandy loam soil with a lower amount of total carbon (3.6%) and U and Th
Figure 9. Relationship between U in soil and in roots of rye and wheat.
3 RADIONUCLIDES IN PLANTS 313

in roots of rye and wheat grown in the soil (Fig. 12). It is interesting that there is alsono correlation between U and Th in leaves of the plants grown in both soils (Fig. 13).
U and Th have similar chemical properties. But we may assume that behavior ofthese metals in soil and in plants (more exactly, in different plant parts) may be ratherdifferent, thus suggesting that there are additional factors influencing biochemistry ofthese metals in soil and in plants.
3.5 Phytotoxicity of U and Th
Little is known about phytotoxicity of thorium and uranium. The chemical toxicity ofactinides may be similar to that of other metals. However, the ionizing radiationassociated with radioactive decay can result in additional toxic effects on a plant.
Figure 10. Relationship between Th in soil and in roots of rye and wheat.
314 URANIUM AND THORIUM ACCUMULATION IN CULTIVATED PLANTS

Natural concentrations of U and Th in plants hardly can pose any problem for thevegetation [Bowen, 1966]. The effects may certainly be significant when the radio-nuclide concentration exceeds micromolar levels in the biomass. In this case thehigher Th and U concentrations can affect certain biochemical and physiologicalprocesses in the plants.
A review of the literature on the toxicological effects of U (and Th, Pu, etc.) gen-erally leads back to reviews on metal toxicity and chemistry [Paquet et al., 1998].There are many contradictory publications in the literature on phytotoxicity ofnatural radionuclides to plants [Sheppard and Evenden, 1992]. It was reported thatthe same concentration of a radionuclide may be harmful in one soil but may haveno impact in another soil [Marquenie, 1985]. The toxicity effects may be rather differ-ent for different plant species. In fact, the effects are actually species-dependent.
Figure 11. Relationship between U and Th in loam soil and in roots of the plants grown inthe soil.
3 RADIONUCLIDES IN PLANTS 315

Figure 12. Relationship between U and Th in sandy loam soil and in roots of rye and wheatgrown in the soil.
Figure 13. Relationship between U and Th in the plant leaves.
316 URANIUM AND THORIUM ACCUMULATION IN CULTIVATED PLANTS

For example, Gulati et al. [1980] reported that the highest yield of wheat was obtained at3.0 mg U per kilogram of soil and that tomato yield decreased continuously when the Ulevel in the soil was increased from 1 to 6 mg/kg. Levels as low as 5 mg U per kilogramof soil, well within the normal background range, have been cited as toxic, whereasother studies reported no toxicity at levels 100- to 1000-fold higher. The authorsalso studied the effects of irrigation on uptake of U. It was found that U uptake bycrops increased significantly with increase in quantity of applied water. Thus, it maybe possible to regulate the plant uptake of U by controlling application of water.
We may assume (and will try to show this in more detail below) that U and Th,similarly to other trace metals, may be both toxic and—within certain concentrationrange—favorable for plants and humans. These effects depend on various factors.
To assess the impacts of U and Th on soil biota, plant nutrition, and some physio-logical characteristics of plants, the following field experiment was carried out. Foursmall (1 m � 1.5 m) plots were used for the trial. The soil was classified as FerricPodzol [FAO UNESCO, 1988] with a loam texture. Plants (couch-grass and plantain)were watered with solutions of Th(NO3)4 (test 1), (UO2)(NO3)2 (test 2), and a mixtureof nitrates of U and Th (test 3). Concentrations of U and Th in the solutions were 60mg/kg. Each site was watered with 1 liter of the solution. The control (test 4) plantswere watered with the same amount of ordinary water. After two days, the plants andsoil from the root surface were collected during the day (from 6:00 to 22:00, everyfour hours). The plant samples were washed carefully just after sampling whilethey keep turgor to remove dust and the smallest particles of soil from the surfaceof leaves and especially from roots.
The mean concentrations of elements in soils and in different parts of couch-grass and plantain are shown in Tables 4–6. Concentrations of U and Th in controlplants were low. The treatments significantly affected radionuclide concentrationsin soils and in plants. As we expected, concentrations of U and Th in the rhizospheresoil of the plants treated with U, Th, and UþTh were higher than in the control soil.
The treatments also affected concentrations of some other elements in the soils. Themost significant variations were observed as a result of Th treatment. It isinteresting that variations of element concentrations in soil were well-correlatedwith variations of the element concentrations in couch-grass. For example, contentof Zn in the rhizosphere soil of U- and UþTh-treated plants decreased, and concen-trations of Zn in roots of couch-grass grown in the soil treated with U and Th increased.Thus, we assume that U and Th treatments could transfer Zn to more mobile form andstimulate uptake of Zn by couch-grass. A decrease of soil Rb content (after treatmentwith Th) was followed by an increase of Rb concentration in couch-grass roots. Wealso observed a significant increase of K concentration both in roots and in leavesof couch-grass resulted from the treatment with Th. Interestingly, there was no suchan effect of Th on K content in plantain (Fig. 14). We hardly could expect a statisticallysignificant decrease of the total amount of K in soil since the amount of K taken byroots of couch-grass was relatively small (considering the differences between thebiomass of roots and the mass of soil). Nevertheless, taking into account that Rb isa chemical analogue of K, we may suggest that Th treatment stimulated transferof certain part of soil K to a more bioavailable form. This means that thorium
3 RADIONUCLIDES IN PLANTS 317

could provide favorable effects on the plant nutrition, thereby stimulating uptake ofpotassium, which is an essential plant nutrient.
Couch-grass and plantain belong to two different orders: Graminaceae andPlantaginaceae, respectively. Comparison of plants grown in control plots showedthat concentrations of K and Ca (and its chemical analogue Sr) in roots of couch-grass were higher than those in roots of plantain, and concentrations of Na and Znwere significantly lower (P , 0.05). Concentrations of K, Ca, Sr, and Ba in leavesof couch-grass were also higher (P , 0.05) than those in leaves of plantain.
Cluster analysis of the plant samples performed on the basis of element concen-trations in roots and leaves of the plants treated with the radionuclides showed thatroots of couch-grass treated with U, Th, and UþTh formed separated groups(Fig. 15a). Roots of the plants treated with Th and UþTh were closer to each otherand well-separated from roots of the plants treated with U. Such a tendency wasalso observed in the leaf samples of couch-grass (Fig. 15b). We may assume thatthis resulted from more significant effects of U on the plant as compared to theeffects of Th. Besides, simultaneous addition of U and Th could reduce the effects,
TABLE 4. Mean Concentrations of Elements (mg/kg) in Soil
Element Control þU þTh UþTh
Na (%) 1.2+0.1 1.2+ 0.1 1.2+ 0.1 1.1+ 0.1K (%) 2.4+0.4 2.5+ 0.2 2.4+ 0.4 2.2+ 0.4Ca (%) 1.1+0.2 1.0+ 0.2 0.9+ 0.3 1.1+ 0.4Sc 8.1+0.7 8.1+ 0.8 7.0+ 0.7a 7.2+ 1.2Cr 53+5 52+ 8 50+ 8 49+ 7Fe (%) 2.4+0.2 2.3+ 0.3 2.1+ 0.2a 2.2+ 0.4Co 8.8+0.6 9.0+ 0.9 8.0+ 0.7a 8.2+ 1.5Zn 135+20 106+ 21a 136+ 19 114+ 18a
As 2.8+0.3 2.8+ 0.5 2.9+ 0.5 2.7+ 0.7Br 5.0+0.5 5.2+ 1.2 6.1+ 0.6a 5.1+ 1.2Rb 111+9 115+ 8 99+ 9a 104+ 12Sr 125+55 143+ 60 152+ 63 124+ 37Sb 1.1+0.4 1.0+ 0.6 1.1+ 0.3 0.8+ 0.1a
Cs 2.8+0.2 2.7+ 0.3 2.1+ 0.4a 2.4+ 0.6Ba 604+83 617+ 56 585+ 42 573+ 38La 32+3 32+ 5 30+ 3 40+ 20Sm 5.1+0.5 5.2+ 0.8 4.7+ 0.5 5.6+ 1.8Eu 1.1+0.2 1.0+ 0.1 1.0+ 0.1 1.0+ 0.1Yb 2.0+0.5 2.0+ 0.2 1.8+ 0.3 1.9+ 0.3Lu 0.4+0.1 0.39+ 0.05 0.35+ 0.05 0.38+ 0.07Hf 5.7+1.7 7.1+ 2.0 6.2+ 2.5 6.0+ 1.9Ta 0.6+0.2 0.7+ 0.2 0.6+ 0.1 0.7+ 0.3Th 9.6+3.1 8.5+ 1.7 28+ 20a 19+ 8a
U 2.2+0.3 25+ 21a 2.2+ 0.4 12+ 7a
aDifferences between control and treated with U, Th, and UþTh samples are statistically significantat P , 0.05.
318 URANIUM AND THORIUM ACCUMULATION IN CULTIVATED PLANTS

TA
BL
E5.
Mea
nC
once
ntra
tion
sof
Ele
men
ts(m
g/kg
)in
Roo
tsan
dL
eave
sof
Whe
at-G
rass
Ele
men
t
Con
trol
þU
þT
hUþ
Th
Roo
tsL
eave
sR
oots
Lea
ves
Roo
tsL
eave
sR
oots
Lea
ves
Na
2460
+39
061
2+
194
1820
+20
0a55
0+
152
2050
+37
051
4+
6527
50+
350
614+
442
K(%
)1.
1+
0.4
2.8+
0.7
1.3+
0.2
3.0+
0.2
2.3+
0.3a
4.0+
0.4a
1.2+
0.4
3.6+
0.03
Ca
(%)
0.42
+0.
100.
47+
0.06
0.40
+0.
120.
54+
0.08
0.39
+0.
100.
40+
0.06
0.38
+0.
140.
48+
0.09
Sc
0.34
+0.
010.
06+
0.01
0.52
+0.
15a
0.06
+0.
020.
37+
0.16
0.04
+0.
01a
0.23
+0.
110.
06+
0.01
Cr
8.0+
2.3
3.5+
0.6
7.4+
2.1
4.2+
1.0
9.9+
2.8
3.1+
0.8
9.1+
5.7
2.8+
0.3
Fe17
00+
237
307+
2819
00+
430
332+
8013
30+
450
226+
46a
965+
313a
313+
49C
o0.
96+
0.27
0.19
+0.
071.
4+
0.3a
0.19
+0.
060.
78+
0.25
0.08
+0.
02a
0.76
+0.
230.
13+
0.03
Zn
80+
1049
+3
103+
13a
49+
810
1+
17a
50+
878
+17
58+
12B
r3.
8+
0.9
1.4+
1.3
4,1+
0.9
1.3+
0.4
5.0+
1.2
1.1+
0.6
18+
301.
2+
0.6
Rb
4.4+
0.8
4.1+
2.4
5.7+
1.4
2.9+
0.9
6.7+
1.0a
2.9+
0.4
4.2+
1.3
4.7+
0.9
Sr
16+
211
+4
10+
111
+4
13+
613
+3
13+
317
+11
Sb
0.42
+0.
110.
15+
0.02
0.26
+0.
06a
0.25
+0.
080.
31+
0.08
0.16
+0.
030.
80+
0.69
0.19
+0.
06C
s0.
67+
0.30
0.09
+0.
020.
37+
0.19
0.11
+0.
080.
47+
0.15
0.08
+0.
020.
41+
0.25
0.07
+0.
02B
a30
+11
14+
341
+12
14+
533
+13
22+
6a21
+8
12+
1L
a1.
7+
0.2
0.59
+0.
143.
1+
1.9
0.54
+0.
141.
5+
0.7
0.48
+0.
092.
4+
0.9
0.43
+0.
07S
m0.
27+
0.06
0.07
+0.
010.
35+
0.08
0.05
+0.
02a
0.23
+0.
100.
07+
0.02
0.30
+0.
120.
06+
0.01
a
Eub
220+
108
20+
570
+23
a20
+7
160+
106
20+
380
+28
a20
+7
Yb
0.18
+0.
080.
08+
0.02
0.14
+0.
060.
12+
0.03
0.12
+0.
070.
09+
0.02
0.10
+0.
050.
08+
0.02
Lub
40+
1620
+6
10+
11a
30+
730
+11
20+
430
+5
20+
3H
f0.
60+
0.04
0.53
+0.
100.
57+
0.06
0.61
+0.
130.
80+
0.47
0.52
+0.
140.
67+
0.16
0.38
+0.
06a
Ta
0.09
+0.
030.
03+
0.01
0.05
+0.
020.
02+
0.01
0.07
+0.
020.
03+
0.01
0.05
+0.
020.
02+
0.01
Th
0.43
+0.
040.
14+
0.01
0.8+
0.4
0.19
+0.
0513
+6a
8.2+
7.8a
1.8+
0.8a
8.2+
3.8a
U0.
16+
0.19
0.14
+0.
0816
2+
96a
29+
11a
0.31
+0.
200.
13+
0.06
3.2+
2.7a
4.9+
1.7a
aD
iffe
renc
esbe
twee
nco
ntro
lan
dtr
eate
dw
ithU
,T
h,an
dUþ
Th
plan
tsar
est
atis
tical
lysi
gnifi
cant
atP
,0.
05.
bC
once
ntra
tions
ofth
eel
emen
tsar
esh
own
inm
g/kg
.
319

TA
BL
E6.
Mea
nC
once
ntra
tion
sof
Ele
men
ts(m
g/kg
)in
Roo
tsan
dL
eave
sof
Pla
ntai
n
Ele
men
t
Con
trol
þU
þT
hUþ
Th
Roo
tsL
eave
sR
oots
Lea
ves
Roo
tsL
eave
sR
oots
Lea
ves
Na
1300
+22
095
3+
475
1670
+25
0a53
5+
233
1220
+22
058
2+
191
1630
+57
048
8+
255
K(%
)5.
4+
0.6
4.0+
0.6
6.1+
0.6
3.6+
0.6
5.9+
0.4
3.8+
0.5
6.3+
1.3
3.5+
1.3
Ca
(%)
0.66
+0.
101.
6+
0.2
0.60
+0.
091.
7+
0.3
0.67
+0.
042.
2+
0.6
0.66
+0.
031.
9+
0.4
Sc
0.36
+0.
080.
13+
0.07
0.24
+0.
090.
09+
0.02
0.30
+0.
070.
08+
0.04
0.35
+0.
120.
11+
0.02
Cr
5.8+
1.2
5.3+
0.9
7.7+
3.4
5.0+
0.7
5.6+
1.4
4.7+
0.5
9.5+
3.6
5.0+
2.4
Fe18
70+
840
562+
239
1140
+27
043
6+
5210
30+
210
397+
135
1170
+34
047
4+
93C
o0.
77+
0.10
0.39
+0.
130.
65+
0.11
0.21
+0.
04a
1.1+
0.4
0.38
+0.
140.
87+
0.22
0.28
+0.
11Z
n48
+5
49+
360
+14
55+
772
+26
61+
10a
54+
260
+6a
Br
4.3+
3.1
4.6+
6.1
1.9+
0.3
1.3+
0.4
2.4+
1.3
2.2+
0.7
2.4+
1.1
1.2+
0.4
Rb
6.7+
2.8
3.9+
2.3
4.9+
0.9
2.8+
0.7
6.6+
0.8
3.3+
0.6
9.1+
2.4
4.4+
1.3
Sr
42+
740
+8
67+
17a
42+
758
+15
58+
1947
+19
59+
16a
Sb
0.23
+0.
040.
26+
0.05
0.24
+0.
050.
29+
0.23
0.22
+0.
030.
57+
0.80
0.38
+0.
160.
22+
0.04
Cs
0.26
+0.
060.
09+
0.07
0.20
+0.
080.
06+
0.02
0.27
+0.
140.
09+
0.01
0.42
+0.
240.
07+
0.01
Ba
56+
1851
+9
51+
2256
+6
85+
2369
+34
51+
435
+25
La
1.6+
0.3
1.1+
0.5
1.2+
0.3
0.99
+0.
251.
5+
0.3
1.0+
0.3
1.6+
0.4
0.95
+0.
40S
m0.
20+
0.07
0.15
+0.
070.
15+
0.05
0.12
+0.
030.
20+
0.04
0.21
+0.
150.
22+
0.07
0.13
+0.
05E
ub60
+14
30+
719
+18
30+
380
+28
30+
422
+19
30+
1Y
b0.
06+
0.02
0.14
+0.
060.
07+
0.02
0.14
+0.
050.
10+
0.04
0.12
+0.
060.
20+
0.11
a0.
09+
0.07
Lub
20+
240
+18
20+
1240
+8
20+
830
+8
40+
2040
+20
Hf
0.56
+0.
210.
76+
0.15
0.63
+0.
110.
82+
0.14
0.59
+0.
160.
70+
0.11
0.81
+0.
120.
80+
0.44
Ta
0.04
+0.
010.
04+
0.02
0.06
+0.
030.
04+
0.01
0.08
+0.
090.
03+
0.01
0.07
+0.
02a
0.07
+0.
07T
h0.
38+
0.08
0.25
+0.
130.
27+
0.09
0.27
+0.
154.
4+
7.9
159+
193
3.2+
4.5
44+
33a
U0.
11+
0.08
0.09
+0.
0135
+30
a8.
6+
7.7a
0.22
+0.
150.
68+
0.74
5.8+
10.8
23+
17a
aD
iffe
renc
esbe
twee
nco
ntro
lan
dtr
eate
dw
ithU
,T
h,an
dUþ
Th
plan
tsar
est
atis
tical
lysi
gnifi
cant
atP
,0.
05.
bC
once
ntra
tions
ofth
eel
emen
tsar
esh
own
inm
g/kg
.
320

probably owing to competition between these two metals during uptake process. Inplantain, the differences between different treatments were not so clear (Fig. 16).
Comparison of the data presented in Tables 5 and 6 shows that couch-grass prob-ably is more affected by the treatments than plantain. At least the number of statisti-cally significant variations in macro- and micronutrient concentrations in roots andleaves of couch-grass resulted from the treatments was higher than that in plantain.It seems likely that plantain was more tolerant to the treatments than couch-grass.
3.6 Effects of U and Th on Leaf Chlorophyll Contentand the Rhizosphere Microorganisms
As was reported, some physiological characteristics of plants, including such animportant parameter as leaf chlorophyll content, may be negatively affected by radio-nuclides [Aery and Jain, 1997; Jain and Aery, 1997]. In our experiment, after the
Figure 14. Potassium concentration in roots and leaves of couch-grass and plantain grown incontrol soils and in soils enriched with Th and U.
3 RADIONUCLIDES IN PLANTS 321

treatments with U and Th, concentration of chlorophyll in leaves decreased comparedto that in leaves of the control plants (Fig. 17). The decrease was most significant inthe plants treated with U (the analyses were performed only for plantain). One mech-anism of U toxicity may relate to the disruption of the first step in glycolysis by uranyldisplacing Mg in the enzyme hexokinase [Van Horn and Huang, 2006]. It is knownthat Mg is an important component of chlorophyll molecule [Nikiteshen, 2003].
Microbial biomass that represents the soil fraction responsible for the energy andnutrient cycling can influence significantly the plant nutrition and the yield of theplants. Microorganisms appear to be very sensitive and predictive tools in soilhealth monitoring. It was reported that microorganisms play an important role inregulating the mobility of U in soil [Ticknor, 1994; Fowle et al., 2000; Franciset al., 2004; Ohnuki et al., 2005]. It is known that microorganisms produce intosoil extracellular compounds abundant with proteins [Wright and Upadhyaya,1996]. Measurements of the amounts of the rhizosphere proteins are supposed to
Figure 15. Cluster analysis (Ward’s method) of element concentrations in roots (a) and leaves(b) of couch-grass. U, T, and M: The plants were treated with U, Th, and mixture of U and Th,respectively.
322 URANIUM AND THORIUM ACCUMULATION IN CULTIVATED PLANTS

Figure 16. Cluster analysis (Ward’s method) of element concentrations in roots (a) and leaves(b) of plantain. U, T, and M: The plants were treated with U, Th, and mixture of U and Th,respectively.
Figure 17. Chlorophyll content in leaves of plantain grown in control soil and in soil enrichedwith Th and U.
3 RADIONUCLIDES IN PLANTS 323

be accurate indirect method to assess soil microbial biomass because of a relativelyhigh protein content in the microbial cells [Baatn, 1998]. Our results showed thattotal amount of proteins in the rhizosphere of the plants treated with U and Thincreased (Fig. 18). This indicates that addition of U and Th to soil can enhancegrowth of the rhizosphere microorganisms. Furthermore, it was found that thehigher the amount of proteins observed in the rhizosphere of plantain, the higherthe amount of U taken by the plant roots and translocated to leaves. On the otherhand, there was no such correlation registered for couch-grass.
In most previous experiments the negative effects of radionuclides on plant nutri-tion and growth of soil microorganisms were observed. We may assume that thisinconsistence between published materials and our experimental results might beexplained by the following reasons:
† The plants could release into the rhizosphere-specific organic compounds thatmight stimulate the microbial growth.
Figure 18. Total amount of proteins in the rhizosphere soil of plantain and couch-grass.
324 URANIUM AND THORIUM ACCUMULATION IN CULTIVATED PLANTS

† As a result of U poisoning, part of the microorganisms usually presented in therhizosphere died due to the induced stress to the microbes. In this situation therate of reproduction of the microorganisms, which is normally suppressed in therhizosphere soil, might increase.
Based on the results of this experiment, we cannot say for a sure whether U and Thactually contributed significantly to the variations or part of the variations was pro-vided by the nitrate component of the U and Th compounds. However, we can con-clude that both Th and U treatments induced significant changes in plant nutrition andphysiological activity of the plants and soil biota. Numerous studies describinguptake of metals by plants often completely ignore the impact of soil microbes onthe process of the metal uptake. Meanwhile, soil microorganisms may be effectivemediators of mobilization and immobilization of the metals in the rhizosphere. Therole of bacteria in the rhizosphere chemistry is particularly interesting. The root-colo-nizing bacteria excrete their own exudates into the surrounding soil. These organiccompounds can catalyze specific oxidation–reduction reactions that will changemobility of certain metals [Wielinga et al., 1999]. The microorganisms are able tofacilitate movement of the metals that would otherwise be unavailable to the plants[Domelly and Fletcher, 1994]. In some cases the bacteria are perhaps more proficientthan root exudates at solubilization and absorbing of some metals and radionuclides[Jackson, 1993].
Although now a lot of data are available both on ion uptake by different plantspecies and on attraction of radionuclides to bacterial cell walls, the system “soil–bacteria–plant” as a network is not fully understood. Besides, the rhizosphere colo-nization is specific to certain plant species. We may suggest that more informationmay be obtained if we use microbial pretreatment of seeds instead of additionof microorganisms to soil. Such an inoculation of seeds with microorganisms maybe more effective for enhancement of metal bioavailability than microbiological treat-ment of soil. Seed germination is an important stage of the plant growth, and it mayhave a crucial significance for further life of the plant.
Figure 19 illustrates uptake and translocation of U and Th by wheat seedlingsinfected with a culture of phosphate-mobilizing bacteria Cellulomonas sp.32SPBTI. It is important that not only uptake of Th and U by the plant roots wasincreased after the seed treatment with Cellulomonas, but also these metals weremore easily translocated from roots to leaves. This indicates that exudates ofCellulomonas could assist in transferring U and Th to more available to plants forms.
3.7 Temporal Variations of U and Th in Plants
It is well known that element concentrations in the plant tissues can vary with time,for example, during the vegetation season [Savari and Lockwood, 1991; Myung andThornton, 1997; Otero and Macias, 2002]. Meanwhile, we can also expect certainvariations in the plant element concentrations over shorter time (days or evenhours). This assumption is based on the circadian rhythms of the plant development[Carter et al., 1991; Behrenfeld et al., 2004]. There are publications reporting that
3 RADIONUCLIDES IN PLANTS 325

uptake of K by plants is regulated by light [Becker et al., 1989; Kim et al., 1992; Suhet al., 2000] and the circadian clock [Kim et al., 1993]. We may assume that not onlyconcentration of K, but also concentrations of other elements in plants, are controlledby light and the biological clock, and these variations are species-specific.
Figure 20 shows diurnal dynamics of U and Th concentrations in leaves of couch-grass grown in soil enriched with U and Th. During the day the leaf U and Th con-centrations changed significantly. These variations were regular and very similar forboth these radionuclides. There was a clear maximum at 14:00 that might beexplained by the highest soil temperature at this time (Fig. 21).
As is seen from Fig. 22a, concentration of U in roots and leaves of couch-grassgrown in U-rich soil was also the highest at 14:00. However, the highest U concen-tration in roots and leaves of plantain grown in the same plot was registered 4 hr later,at 6:00 (Fig. 22b). Thus, the short-term variations in U concentration in plantaincould not be explained by the changes in soil temperature. But, as was mentioned
Figure 19. Th and U in roots and leaves of wheat seedlings noninfected and infected withbacteria.
326 URANIUM AND THORIUM ACCUMULATION IN CULTIVATED PLANTS

above, diurnal dynamics of U concentration in roots and leaves of plantain was wellcorrelated with total amount of proteins in the rhizosphere of this plant.
It has been reported [Walter and Schurr, 2005] that, in spite of certain interspeciesdifferences, diurnal changes in the plant growth rate are generally larger than thechanges in mean growth rate of the plant from day to day. This shows that processescontrolling the plant growth variations within 24 hr are stronger than processes actingon a day-to-day scale. Thus, such big variations in root and leaf element concen-trations may result from the significant short-term changes in the rates of the plantgrowth. Different plants have different sensitivity to temperature and photoperiod.
Figure 20. Dynamics of U and Th concentrations in leaves of couch-grass grown in soilenriched with U and Th.
Figure 21. Diurnal dynamics of soil temperature.
3 RADIONUCLIDES IN PLANTS 327

Therefore, the differences in diurnal dynamics of radionuclide concentrations inplantain and couch-grass may be expected.
3.8 Effects of Thorium on a Plant During Initial Stages of the Plant Growth
The seedling stage is considered to be crucial for overall further life of the plant [Bajjiet al., 2002]. To assess the effects of radionuclides on seed germination, plant nutri-tion, and development during initial stages of the plant growth, the following exper-iment has been carried out.
Seeds of wheat Triticum vulgare (vill) Horst were divided into two groups andgerminated for 6 days on a moist filter paper at room temperature. Thorium nitratewas added to the medium where one group of seeds was germinated (concentrationof Th in the solution was 20 ng/ml), and the second group served as a control.
Figure 22. Dynamics of U concentrations in leaves and roots of couch-grass (a) and plantain(b) grown in U-rich soil.
328 URANIUM AND THORIUM ACCUMULATION IN CULTIVATED PLANTS

The same volume of water ( just water in the first case and water supplemented withTh in the second case) was added to both germination media. No more water wasadded during the 6-day germination. After germination, a portion of seedlingsfrom both groups was taken for elemental analysis, and rest of the seedlings weretransferred to pots filled with soil. The wheat seedlings were then grown in a naturallyilluminated greenhouse. After 7 days the plants were harvested. The soil samplesfrom the surface of the plant roots (rhizosphere soil) were taken simultaneouslywith the plants.
Transfer of the control 6-day-old seedlings after germination to soil favored theuptake of different elements by roots and their translocation from roots to otherplant parts (Tables 7 and 8). Compared to the 6-day-old seedlings (before their trans-fer to soil), concentrations of all elements, except Na, Sc, Zn, and Br in leaves and Ca,Sc, Br, Rb, and Au in roots in the plants grown in soil for next 7 days, were signifi-cantly higher.
Germination of seeds in Th-supplemented medium resulted in a significantincrease of Th content in all parts of the 6-day-old wheat seedlings (Table 7).Transfer of the seedlings germinated in Th-supplemented medium to soil and theseedling growth in the soil for 7 days led to a significant decrease of Th concentrationin roots and in leaves (Table 8). In particular, in leaves Th content decreased up to thelevel found in the control plants. However, concentration of Th in seeds did notchange and was comparable to Th content found in the 6-day-old seedlings justafter the end of germination in the Th-enriched medium. This might be a result ofa strong absorption/adsorption of Th in the very beginning of germination on thesurface of the seeds. In the control plants grown in soil, the highest concentrationof Th was observed in roots, and the lowest Th content was found in leaves. Theaccumulation of Th in wheat seedlings was associated with variations in uptake ofother elements. Although Th concentration in leaves was more stable, the moststrongly affected part of the plants was the leaf. In leaves of the plants germinatedin Th-amended medium and then grown in soil, concentrations of Na and Rb werehigher (P , 0.05), and concentrations of Ca, Fe, and La were lower (P , 0.05)than those in the control plants. The effects of Th treatment on concentrations ofother elements in seeds and in roots were not so significant as in leaves. Seeds androots of the plants germinated in Th medium and subsequently grown in soil had sig-nificantly lower (P , 0.05) Ca than did seeds and roots of the control plants.
Thus, the first and the most important reaction of the young wheat seedlings on thegermination in Th enriched medium was a decrease of Ca in all parts of the seedlings.Calcium is a cell wall structure component, and it is also an effective regulator ofvarious processes in the plant cells [Frausto da Silva and Williams, 1993]. Cell mem-branes are usually less permeable for calcium, and its concentration is fairly constantin plants [Evans et al., 1991]. The decrease of Ca may have harmful consequences toa plant.
The variations in uptake of main mineral nutrients such as potassium, calcium, andsodium may provide valuable information on the toxic effects of thorium. In particu-lar, the Kþ/Naþ ratio is an important characteristic of physiological state of a plant[Santa-Maria and Epstein, 2001]. Table 9 shows the K/Na ratio in leaves, seeds, and
3 RADIONUCLIDES IN PLANTS 329

TA
BL
E7.
Mea
nC
once
ntra
tion
s(m
g/kg
)of
Ele
men
tsin
Roo
ts,L
eave
s,an
dSe
eds
of6-
Day
-Old
Whe
atSe
edlin
gsG
erm
inat
edin
Ord
inar
yC
ondi
tion
s(1
)an
dA
fter
Add
itio
nof
Th
toth
eG
erm
inat
ion
Med
ium
(2)
Ele
men
t
Roo
tsL
eave
sS
eeds
12
12
12
Na
(%)
0.38
+0.
040.
45+
0.05
0.02
5+
0.00
40.
037+
0.00
60.
0036
+0.
0007
0.00
61+
0.00
10K
(%)
0.63
+0.
040.
78+
0.02
1.9+
0.1
1.7+
0.1
0.10
+0.
010.
11+
0.01
Ca
(%)
0.15
+0.
02,
0.12
0.05
8+
0.00
4,
0.12
0.06
7+
0.00
70.
28+
0.09
Sc
0.18
+0.
030.
09+
0.02
0.15
+0.
020.
06+
0.4
0.00
5+
0.00
20.
03+
0.01
Cr
0.88
+0.
081.
4+
0.5
0.52
+0.
04,
0.4
,0.
4,
0.4
Fe25
1+
1823
9+
2315
0+
1514
9+
1744
.8+
7.3
48.4+
11.0
Co
0.10
+0.
030.
11+
0.04
0.04
+0.
020.
03+
0.02
0.03
+0.
030.
04+
0.02
Zn
25.9+
3.7
36.2+
4.1
52.2+
8.3
55.6+
7.5
23.9+
3.9
58.9+
15.0
Br
12.4+
6.0
19.8+
7.1
9.3+
2.6
21.1+
9.5
0.54
+0.
101.
8+
0.25
Rb
5.2+
1.1
4.7+
1.2
6.8+
2.0
6.5+
1.6
0.44
+0.
091.
1+
0.5
Sr
11.2+
4.3
,8.
0,
8.0
,8.
09.
0+
3.2
13.0+
4.2
Sb
0.10
+0.
080.
68+
0.09
0.04
+0.
030.
33+
0.25
0.00
9+
0.00
80.
02+
0.02
Cs
,0.
008
0.51
+0.
40,
0.00
80.
24+
0.18
,0.
008
,0.
008
Ba
,3.
0,
3.0
,3.
0,
3.0
3.3+
1.0
13.0+
2.5
Au
0.00
8+
0.00
40.
02+
0.01
0.00
5+
0.00
50.
008+
0.00
40.
001+
0.00
10.
001+
0.00
1T
h,
0.02
2.4+
1.3
,0.
020.
17+
0.04
,0.
021.
6+
0.6
330

TA
BL
E8.
Mea
nC
once
ntra
tion
sof
Ele
men
ts(m
g/kg
)in
13-D
ayO
ldSe
edlin
gs
Ele
men
t
Roo
tsL
eave
sS
eeds
12
12
12
Na
(%)
0.65
+0.
14a,b
0.64
+0.
110.
03+
0.01
0.06
+0.
01d
0.06
+0.
030.
07+
0.05
K(%
)1.
26+
0.41
a,b
0.95
+0.
154.
9+
0.4c
5.7+
2.3
0.35
+0.
030.
25+
0.34
Ca
(%)
0.19
+0.
090.
12+
0.03
d0.
18+
0.02
0.13
+0.
03d
0.22
+0.
050.
12+
0.05
d
Sc
0.10
+0.
070.
12+
0.07
0.03
+0.
030.
01+
0.01
0.03
+0.
020.
27+
0.17
Cr
2.33
+1.
00b
1.3+
0.2
1.0+
0.3
0.85
+0.
190.
55+
0.25
0.49
+0.
25Fe
614+
262b
308+
3322
5+
2815
5+
22d
166+
7014
6+
25C
o0.
88+
0.12
a,b
0.95
+0.
100.
08+
0.02
0.11
+0.
050.
14+
0.06
0.25
+0.
08Z
n14
6+
8a,b
140+
1557
+6c
55.0+
3.7
70.1+
3.1
53.9+
30.9
Br
20.1+
9.4b
20.4+
6.2
8.6+
4.0
14.1+
5.9
7.5+
5.2
6.2+
1.4
Rb
8.1+
2.4a
6.5+
0.6
23.3+
1.7c
26.8+
0.3d
2.6+
0.8
2.2+
1.2
Sr
31.2+
6.0a
28.4+
6.9
13.6+
7.8
17.4+
14.5
21.0+
16.6
,8.
0A
g0.
24+
0.11
0.20
+0.
090.
11+
0.05
0.07
0+
0.00
30.
070+
0.00
50.
27+
0.18
Sb
0.27
+0.
12b
0.33
+0.
320.
08+
0.06
0.22
+0.
160.
05+
0.02
0.07
+0.
06C
s0.
12+
0.09
0.20
+0.
280.
03+
0.01
c0.
12+
0.15
0.01
1+
0.00
4,
0.00
8B
a17
.9+
4.7
9.7+
2.9
17.1+
5.1
20.7+
6.8
14.2+
3.6
18.0+
17.3
La
0.30
+0.
240.
19+
0.17
0.07
+0.
050.
01+
0.02
d0.
09+
0.07
0.05
+0.
04S
m0.
04+
0.03
33.7+
58.3
0.01
0+
0.00
2,
0.01
0.01
3+
0.00
50.
02+
0.01
Au
0.02
+0.
01b
0.02
+0.
010.
010+
0.00
60.
010+
0.00
40.
004+
0.00
10.
007+
0.00
2T
h0.
09+
0.04
0.87
+0.
19d
,0.
02,
0.02
0.03
+0.
022.
0+
1.7a
1,C
ontr
ol,
2,T
hw
asad
ded
toso
il;3,
the
seed
lings
wer
ege
rmin
ated
inT
h-am
ende
dm
ediu
man
dth
engr
own
inso
ils.
a–
c Dif
fere
nces
betw
een
root
san
dle
aves
(a),
root
san
dse
eds
(b),
and
leav
esan
dse
eds
(c )w
ere
stat
istic
ally
sign
ifica
ntat
P,
0.05
.dD
iffe
renc
esbe
twee
nco
ntro
lan
dtr
eatm
ents
with
Th
for
part
icul
arpl
ant
part
sw
ere
stat
istic
ally
sign
ifica
ntat
P,
0.05
.
331

roots of both control seedlings and seedlings germinated in the presence of Th.Potassium was preferentially accumulated in all parts of the plants. The K/Na ratio inleaves was much higher than in seeds and in roots because of the higher K contentand lower concentration of Na in the leaves. These results are consistent with the pre-viously published data [Mahmood, 1998; Schachtman and Liu, 1999]. As wasmentioned above, leaves of the seedlings germinated in the presence of Th showedhigher Na values that consequently decreased significantly the K/Na ratio in the leaves.
This raises the question of whether the sodium influx is toxic to the plants. Theearlier studies [Marschner, 1995; Chartzoulakis et al., 2002] pointed out that theincreasing concentration of Na in a plant could result in a decrease of the leaf area,the shoot dry weight, the leaf length, and the leaf width. In contrast, we did notobserve any significant variation in the leaf biomass when the seedlings were germi-nated in the presence of thorium. However, it is necessary to note that in our exper-iment the growth time was rather short, and this does not exclude the possibility ofcertain physiological changes at the further stages of the plant development.
To obtain a more detailed estimate of the effects of the treatments on the wheatseedlings, we also performed principal component analysis of the plant samples(Fig. 23). For the calculations we used Varimax normalized rotation of our data.Two first PCs explained 49% of the total variance of the system. The first factor(PC1) was responsible for separation of leaves, seeds, and roots into three differentgroups. Leaves were far separated from roots and seeds, while groups of seeds androots were located closer to each other. A highly correlated group of elements Cr,Fe, Na, Au, Zn, Sm, Co, and Br was the dominant factor in the first PC.Comparison of the data on control wheat seedlings (Table 8) revealed significantdifferences between concentrations of these elements (except Sm) and also K andSb in roots and in seeds. Concentrations of all these elements in roots were signifi-cantly higher than in seeds. However, differences between seeds and leaves werenot so great as those between seeds and roots. Zn concentration was statistically sig-nificant lower and concentrations of alkaline elements (K, Rb, and Cs) were muchhigher in leaves than in seeds. Lastly, concentration of Sr was lower, while Na, K,Co, and Zn contents were higher in roots as compared with those in leaves.
It is known that, in spite of even careful washing of plants after sampling, theproblem of possible contamination of plants by dust and soil still exists. This is par-ticularly important for root samples. It has been reported on the example of suchelements like Sc and REE that surface contamination of the plant roots may representa serious problem for elemental analysis of the plant samples [Schleppi et al., 2000].
TABLE 9. Ratios of K/Na in Different Parts of WheatSeedlings Grown in Soil for Seven Days
Leaves Seeds Roots
1 2 1 2 1 2
151 96 5.9 3.8 1.9 1.5
1—Control; 2—Th was added to germination medium.
332 URANIUM AND THORIUM ACCUMULATION IN CULTIVATED PLANTS

Therefore, it would appear reasonable that in the case of contamination of roots bysoil, one might also expect higher concentrations of the listed above elements inthe root samples. However, we did not observe increased concentrations of Sc andREE in roots as compared to those in leaves and in seeds. Thus, we can concludethat the possible effect of contamination of plant roots was negligible.
As seen in Fig. 23, inside each group of root and seed samples, control plantsand plants germinated in Th-enriched medium formed their own groups. Thesecond PC (PC2) was responsible for the separation. Th had a significant negativeloading value in the PC2; K and Na demonstrated a high positive correlation withthe second PC. We may suggest that thorium, probably, has affected the behaviorof these two plant nutrients at the early stage of the plant growth. Interestingly,there was not a good separation between leaves of the plants germinated in controland contaminated with Th media.
4 POTENTIAL HEALTH EFFECTS OF EXPOSURE TO U AND TH
The search for acute and chronic health effects from uranium exposure dates to 1824when Christian Gmelin published a report on the effects of uranyl nitrate, chloride,and sulfate on dogs and rabbits [Hodge et al., 1973]. Early studies of humans wereconducted from about 1860 to the early 1900s. During that time, uranium was admi-nistered as a therapeutic agent for diabetes because it had been shown to increaseglucose excretion [Hodge et al., 1973].
People always experience exposure to a certain amount of U and Th from food, air,soil, and water, because they are naturally present in all these components. Food, suchas root vegetables, and water will provide us with small amounts of natural U and Th
Figure 23. Score plot of the first and second principal components. l, s, and r: leaves, seeds,and roots, respectively. 1 (leaves), 2 (seeds), and 3 (roots) of the control plants; 4 (leaves),5 (seeds), and 6 (roots) of the plants germinated in Th-enriched medium and then grown in soil.
4 POTENTIAL HEALTH EFFECTS OF EXPOSURE TO U AND TH 333

and we will breathe minimal concentrations of these radionuclides with air. Peoplethat live near hazardous waste sites or near mines or have to eat crops grown on con-taminated soil, and people that work in the phosphate industry may experience ahigher exposure than other people.
Two potential ingestion exposure routes may be considered: inadvertent ingestionof soil and ingestion of radionuclides incorporated in the food chain. It is possible thatradionuclides deposited on the ground or on the surface of plants may be incorporatedinto the edible portion of the plant and consumed directly by humans.
Published data on the effects of U and Th on human health is rather contradictory.There is no data available on long-term effects of ingestion of these radionuclides onhumans. The information on the possible health effects of U and Th intake reliesmainly on the experiments with animals that have digestive systems similar to thatof humans (e.g., rats, dogs, pigs, and monkeys). However, it is clear that direct trans-fer of the experimental findings based on the experiments with animals to humans ishardly possible.
Uranium and thorium may present both chemical and radiological hazards.Unfortunately, it is difficult to divide the chemical and radiological componentsand to assess the exact contribution of each hazard to the harmful effects. Untilnow we have insufficient data on chemical toxicity of uranium and thorium. Thereis no data available on long-term effects of ingestion of these radionuclides onhumans; all information available came from intermediate-term studies on animals.
Today, an extensive literature has evolved which traces the health effects of naturaland enriched uranium. The main routes of natural uranium into the human body areby inhalation and ingestion. A very small percentage of the inhaled uranium isretained by the lymph nodes for a long time, and another small fraction is solubilizedand goes to the blood, where most is subsequently excreted. A fraction of the bloodcontent is deposited in the kidneys, liver, other organs, and the skeleton.
Extensive information is available about the occupational exposure of workers inthe uranium industry. No increase in overall deaths has been observed in several epi-demiological studies of workers exposed to uranium. Because natural uranium pro-duces very little radioactivity, the health effects from exposure of humans touranium are usually attributed to the chemical properties of uranium. Based on thestudies with experimental animals, the most likely adverse health effect on humansfrom ingesting large amounts of uranium is on the kidneys. Studies of humansexposed to abnormally high levels of uranium in drinking water (averaging 100–600 mg/liter) for many years suggest that there may be minor damage to kidneytissue. The effects are a very mild decrease in the kidney’s ability to hold onto proteins,sugar, and other compounds. However, this damage does not cause major effects onkidney function and is reversible after the exposure to uranium stops. There are nospecific symptoms after long-term consumption of drinking water containing highlevels of uranium. Studies of workers with occupational exposure to uranium havenot shown any evidence of serious kidney disease or other health effects [http://www.epa.gov/safewater/index.html, 2004]. Only limited evidences suggest thateven chronic exposure to natural uranium in food or water, except presumably at extra-ordinary concentrations, is associated with morbidity of man or animal.
334 URANIUM AND THORIUM ACCUMULATION IN CULTIVATED PLANTS

The following conclusions may be made from the available scientific literature[McDiarmid and Keogh, 1998]:
† Although any increase in radiation to the human body can be calculated to beharmful from extrapolation from higher levels, there are no peer-reviewed pub-lished reports of detectable increases of cancer or other negative health effectsfrom radiation exposure to inhaled or ingested natural uranium at levels farexceeding those typical for background areas. This is mainly because thebody is very effective at eliminating ingested and inhaled natural uranium.The mass of uranium needed for significant internal exposure is virtuallyimpossible to obtain.
† External radiation takes the primary form of alpha radiation, but there are alsobeta and gamma radiation. Alpha radiation is not capable of penetrating clothand would therefore have no negative health effect. Beta and gamma radiation,which can have negative health effects, have been measured at levels belowthose expected to be of concern.
† Large variations in exposure to natural uranium in the normal environment havenot been associated with negative health effects.
† Exposure to uranium in large doses can cause changes in renal function and, atvery high levels, result in renal failure. However, in spite of these findings, noincreased morbidity or frequency of end-stage renal disease has been observedin relatively large occupational populations chronically exposed to naturaluranium at concentrations above normal level.
Compared to uranium, relatively less information is available on health effects ofthorium. The available data are rather contradictory. Animal studies have shown thatbreathing thorium dust may result in lung damage. Other studies in animals suggestthat drinking massive amounts of thorium can cause death from metal poisoning. Thepresence of large amounts of thorium in the environment could result in exposure tomore hazardous radioactive decay products of thorium, such as radium and thoron.We can say that we know very little about specific exposure levels of thorium thatresult in harmful effects on people or animals. High levels of exposure have beenshown to cause death in animals associated only with thorium.
Najem and Voyce [1990] performed a case–control study of 112 householdsresiding in the vicinity of a thorium waste disposal site and found a higher prevalenceof birth defects and liver diseases among the exposed group than among the unex-posed group. However, the numbers were quite small and the confidence intervalswere wide, so that no definite conclusions can be drawn from the data.
Chen et al. [2004] reported results of a 20-year study carried out at Baiyun OboRare-Earth Iron Mine in China. The ore contained 0.04% of ThO2 and 10% ofSiO2. The purpose of this study was to investigate possible health effects in dust-exposed miners following long-term exposure to thorium-containing dusts andthoron progeny. An epidemiological study showed that the lung cancer mortalityof the dust-exposed miners was significantly (P , 0.005) higher than that of the
4 POTENTIAL HEALTH EFFECTS OF EXPOSURE TO U AND TH 335

non-exposed group. It was suggested that this might result from the long-termexposure to thorium-containing dusts (carcinogens are ThO2 and SiO2) and thoronprogeny. However, from this research we cannot conclude for sure about the exactcontribution of thorium to the phenomenon.
Another study of thorium workers [Terry and Hewson, 1995] showed that breath-ing thorium dust might cause an increased chance of developing lung disease andcancer of the lung or pancreas many years after being exposed. Changes in thegenetic material of body cells have also been shown to occur in workers who breathedthorium dust. Liver diseases and effects on the blood have been found in peopleinjected with thorium in order to take special X-rays. Many types of cancer havealso been shown to occur in these people many years after thorium was injectedinto their bodies. Since thorium is radioactive and may be stored in bone for along time, bone cancer is also a potential concern for people exposed to thorium.
Finally, the risks associated with radionuclides in foods are considered to be insig-nificant or de minimis. We may assume that in certain situations, U and Th mayprovide even positive effects for humans as we observed in the example of certainimprovements in the plant nutrition resulting from the radionuclide treatments. Weshould remember that without the warmth of radiation, life would not have evolvedin the first place.
REFERENCES
Aery NC, Jain GS. 1997. Effect of uranyl nitrate on seed germination and early seedling growthof Triticum aestivum. Biologia 52:115–119.
Airey PL, Ivanovich M. 1986. Geochemical analogues of highlevel radioactive waste reposi-tories. Chem Geol 55:203–213.
Akhtar N, Tufail M. 2007. Natural radioactivity intake into wheat grown on fertilized farms intwo districts of Pakistan. Radiat Protect Dosim 123:103–112.
Apps MJ, Duke MJM, Stephens-Newsham LG. 1988. A study of radionuclides in vegetationon abandoned uranium tailings. J Radioanal Nucl Chem 123:133–147.
Baatn MN. 1998. Growth rates of bacterial communities in soils varying pH: A comparison ofthymidine and leucine incorporation techniques relatively high protein content in microbialcells. Microbial Ecol. 36:316–327.
Bajji M, Kinet J-M, Luts S. 2002. Osmotic and ionic effects of NaCl on germination, earlyseedling growth, and ion content of Atriplex halimus (Chenopodiaceae). Can J Bot80:297–304.
Bao X, Zhang A. 1998. Geochemistry of U and Th and its influence on the origin andEvolution of the Earth’s crust and the biological evolution. Acta Petrol. Mineralogica17:160–172.
Becker D, Moshelion M, Czempinski K, Moran N, Lowen CZ, Satter RL. 1989. Light-promoted changes in apoplastic Kþ activity in the Samanea saman pulvinus, monitoredwith liquid membrane microelectrodes. Planta 179:421–427.
Bednar AJ, Gent DB, Gilmore JR, Sturgis TC, Larson SL. 2004. Mechanisms of thoriummigration in a semiarid soil. J Environ Qual 33:2070–2077.
336 URANIUM AND THORIUM ACCUMULATION IN CULTIVATED PLANTS

Behrenfeld MJ, Prasil O, Babin M, Bruyant F. 2004. In search of a physiological basis forcovariations in light-limited and light-saturated photosynthesis. J Phycol 40:4–25.
Beresford NA, Wright SM. 2005. Non-linearity in radiocaesium soil to plant transfer: Fact orfiction? Radioprotection 40(suppl 1):67–72.
Blanco Rodrıguez P, Vera Tome F, Perez Fernandez M, Lozano JC. 2006. Linearity assump-tion in soil-to-plant transfer factors of natural uranium and radium in Helianthus annuus L.Sci Tot Environ 361:1–7.
Bowen HJM. 1966. The biogeochemistry of the elements. In: Bowen HJM, editor. TraceElements in Biochemistry. New York: Academic Press, pp. 173–210.
Buck EC, Brown NR, Dietz NL. 1996. Contaminant uranium phases and leaching at theFernald site in Ohio. Environ Sci Technol 30:81–88.
Carter PJ, Nimmo HG, Fewson CA, Wilkins MB. 1991. Circadian rhythms in the activity of aplant protein kinase. EMBO J 10:2063–2068.
Chang P, Kim K-W, Yoshida S, Kim S-Y. 2005. Uranium accumulation of crop plantsenhanced by citric acid. Environ Geochem Health 27:529–538.
Chaosheng Z. 2002. Grain size effect on multi-element concentrations in sediments fromintertidal flats of Bohai Bay, China. Appl Geochem 17:59–68.
Chartzoulakis K, Loupassaki M, Bertaki M, Androulakis I. 2002. Effects of NaCl salinity ongrowth, ion content and CO2 assimilation rate of six olive cultivars. Sci Horti 96:235–247.
Chen SB, Zhu YG, Hu QH. 2005. Soil to plant transfer of 238U, 226Ra and 232Th on a uraniummining-impacted soil from southeastern China. J Environ Radioactivity 82:223–236.
Chen XA, Cheng YE, Xiao H, Feng G, Deng YH, Feng ZL, Chen L, Han XM, Yang YJ, DongZH, Zheng R. 2004. Health effects following long-term exposure to thorium dusts:A twenty-year follow-up study in China. Radioprotection 39:525–533.
Cooper MB, Clarke PC, Robertson W, McPharlin IR, Jeffrey RC. 1995. An investigation ofradionuclide uptake into food crops grown in soils treated with bauxite mining residues.J Radioanal Nucl Chem 194:379–387.
Diebold FE, McGrath S. 1985. Investigation of Artemisia tridentata as a biogeochemicaluranium indicator. J Geochem Explor 23:1–12.
Domelly PK, Fletcher JS. 1994. Potential use of mycorrhizal fungi as bioremediation agents.In: Anderson TA, Coats JR, editors. Bioremediation through Rhizosphere Technology.Washington, DC: American Chemical Society, pp. 93–99.
Duff MC, Amrhein C. 1996. Uranium(VI) adsorption on goethite and soil in carbonate sol-utions. J Soil Sci Soc Am 60:1393–1400.
Ebbs SD, Brady DJ, Kochian LV. 1998. Role of uranium speciation in the uptake and transl-ocation of uranium by plants. J Exp Bot 49:1183–1190.
Edmands JD, Brabander DJ, Coleman DS. 2001. Uptake and mobility of uranium in blackoaks: Implications for biomonitoring depleted uranium-contaminated groundwater.Chemosphere 44:789–795.
Ehlken S, Kirchner G. 2002. Environmental processes affecting plant root uptake of radioactivetrace elements and variability of transfer factor data: A review. J Environ Radioactivity58:97–112.
Evans DE, Briars SA, Williams LE. 1991. Active calcium transport by plant cells membranes.J Exp Bot 42:285–303.
REFERENCES 337
Ewers LW, Ham GJ, Wilkins BT. 2003. Review of the transfer of naturally occurringradionuclides to terrestrial plants and domestic animals. National Radiological ProtectionBoard Report, NRPB-W49, Chilton, pp. 1–64.
FAO-UNESCO. 1988. Soil Map of the World, Revised Legend. World Soil Resource Report60, Rome.
Fowle DA, Fein JB, Martin AM. 2000. Experimental study of uranyl adsorption onto Bacillussubtilis. Environ Sci Technol 34:3737–3741.
Francis AJ, Gillow JB, Dodge CJ, Harris R, Beveridge TJ, Papenguth HW. 2004. Uraniumassociation with halophilic and non-halophilic bacteria and archaea. Radiochim Acta92:481–488.
Frausto da Silva JJR, Williams RJP. 1993. The Biological Chemistry of the Elements. TheInorganic Chemistry of Life. Oxford: Clarendon Press.
Frindik O, Vollmer S. 1999. Particle-size dependent distribution of thorium and uraniumisotopes in soil. J. Radioanal Nucl Chem 241:291–296.
Galindo C, Mougin L, Fakhi S, Nourreddine A, Lamghari A, Hannache H. 2007. Distributionof naturally occurring radionuclides (U, Th) in Timahdit black shale (Morocco). J EnvironRadioactivity 92:41–54.
Gulati KL, Oswal MC, Nagpaul KK. 1980. Assimilation of uranium by wheat and tomatoplants. Plant Soil 55:55–59.
Hamamo H, Landsberger S, Harbottle G, Panno S. 1995. Studies of radioactivity and heavymetals in phosphate fertilizer. J Radioanal Nucl Chem 194:331–336.
Higgy RH, Pimpl M. 1998. Natural and man-made radioactivity in soils and plants around theresearch reactor of Inshass. Appl Rad Isot 49:1709–1712.
Hodge HC, Stannard JN, Hursh JB. 1973. Handbook of Experimental Pharmacology. Berlin:Springer-Verlag.
Hore-Lacy I. 2003. Nuclear Electricity, seventh edition. Melbourne: Uranium InformationCentre Ltd.
Hollriegl V, Greiter M, Giussani A, Gerstmann U, Michalke B, Roth P, Oeh U. 2007.Observation of changes in urinary excretion of thorium in humans following ingestion ofa therapeutic soil. J Environ Radioactivity 95:149–160.
http://www.epa.gov/safewater/index.html, 2004.
Huist W. 1997. Thorium. Gmelin Handbook of Inorganic and Organometallic Chemistry,Supplement v. B1, eighth edition. Berlin: Springer-Verlag.
Jackson WR. 1993. Humic, fulvic, and microbial balance: Organic soil conditioning, anagricultural text and reference book. Evergreen, CO: Jackson Research Center.
Jain GS, Aery NC. 1997. Effect of uranium additions on certain biochemical constituents anduranium accumulation in wheat. Biologia 52:599–604.
Jones KC, Lepp NM, Obbard JP. 1990. Other metals and metalloids. In: Alloway BJ, editor.Heavy Metals in Soils. Glasgow: Blackie, pp. 280–321.
Kabata-Pendias A, Pendias H. 2000. Trace Elements in Soil and Plants, third edition. BocaRaton, FL: CRC Press.
Kim HY, Cote GG, Crain RC. 1992. Effects of light on the membrane potential of protoplastsfrom Samanea saman pulvini. Involvement of the H-ATPase and K channels. Plant Physiol99:1532–1539.
338 URANIUM AND THORIUM ACCUMULATION IN CULTIVATED PLANTS

Kim HY, Cote GG, Crain RC. 1993. Potassium channels in Samanea saman protoplastscontrolled by phytochrome and the biological clock. Science 260:960–962.
Laroche L, Henner P, Camilleri V, Morello M, Garnier-Laplace J. 2005. Root uptake ofuranium by a higher plant model (Phaseolus vulgaris)—Bioavailability from soil solution.Radioprotection 40(suppl 1):33–39.
Larson SL, Bednar AJ, Ballard JH, Shettlemore MG, Gent DB, Christodoulatos C, Manis R,Morgan GC, Fields MP. 2005. Characterization of a military training site containing232thorium. Chemosphere 59:1015–1022.
Mahmood K. 1998. Effects of salinity, external Kþ/Naþ ratio and soil moisture on growth andion content of Sesbania rostrata. Biol Plant 41:297–302.
Marquenie JM. 1985. Bioavailability of micropollutants. Environ Technol Lett. 6:351–358.
Marschner H. 1995. Mineral Nutrition of Higher Plants. London: Academic Press.
Mazor E. 1992. Uranium in plants of Southern Sinai. J Arid Environ 22:363–368.
McDiarmid MA, Keogh JP. 1998. The Depleted Uranium Follow-Up Program. Baltimore: VAMedical Center, AFRRI Special Publication. 98-3:29–31.
Meinrath G, Kato Y, Kimura T, Yoshida Z. 1996. Solid–aqueous phase equilibria ofuranium(VI) under ambient conditions. Radiochim. Acta 75:159–167.
Miljevic NR, Markovic MM, Todorovic DJ, Cvijovic MR, Goloboeanin DD, Orlic MP,Vevelinovic DS, Bioeanin RN. 2001. Uranium content in the soil of the FederalRepublic of Yugoslavia after NATO Intervention. Arch Oncol 9:245–249.
Morton LS, Evans CV, Harbottle G, Estes GO. 2001. Pedogenic fractionation and bioavailabil-ity of uranium and thorium in naturally radioactive spodosols. J Soil Sci Soc Am65:1197–1203.
Morton LS, Evans CV, Estes GO. 2002. Natural uranium and thorium distributions in podzo-lized soils and native blueberry. J Environ Qual 31:155–162.
Mortvedt JJ. 1994. Plant and soil relationships of uranium and thorium decay seriesradionuclides—A review. J Environ Qual 23:643–650.
Myung CJ, Thornton I. 1997. Environmental contamination and seasonal variation of metals insoils, plants and waters in the paddy fields around a Pb–Zn mine in Korea. Sci Tot Environ198:105–121.
Najem GR, Voyce LK. 1990. Health effects of a thorium waste disposal site. Am J PublicHealth 80:478–480.
Nikiteshen VI. 2003. Ecologo-agrochemical Basis of Balanced Application of Fertilisers.Moscow: Nauka (in Russian).
Ohnuki T, Yoshida T, Ozaki T, Samadfam M, Kozai N, Yubuta K, Mitsugashira T, Kasama T,Francis AJ. 2005. Interactions of uranium with bacteria and kaolinite clay. Chem Geol220:237–243.
Orvini E, Speziali M, Salvini A, Herborg C. 2000. Rare earth element determination inenvironmental matrices by INAA. Microchem J 67:97–104.
Otero XL, Macias F. 2002. Variation with Depth and Season in Metal Sulfides in Salt MarshSoils. Biogeochemistry 61:247–268 .
Paquet F, Ramounet B, Metivier H, Taylor DM. 1998. The bioinorganic chemistry of Np, Puand Am in mammalian liver. J Alloys Compounds 271–273:85–88.
REFERENCES 339

Pulhani V, Kayasth S, More AK, Mishra UC. 2000. Determination of traces of uranium andthorium in environmental martices by neurton activation analysis. J Radioanal NuclChem 243:625–629.
Ramaswami A, Carr P, Burkhardt M. 2001. Plant-uptake of uranium: Hydroponic and soilsystem studies. Int J Phytorem 3:189–201.
Robison WL, Hamilton TF, Martinelli RE, Kehl SR, Lindman TR. 2005. Concentration ofberyillim (Be) and depleted uranium (DU) in marine fauna and sediment samples fromIlleginni and Boggerik Islands at Kwajalein Atoll. Report of the US Department ofEnergy, UCRL-TR-210057, pp. 1–18.
Rodrigues PB, Vera Tome F, Lozano JC. 2002. About the assumption of linearity in soil-to-plant transfer factors for uranium and thorium isotopes and 226Ra. Sci Tot Environ284:167–175.
Santa-Maria GE, Epstein E. 2001. Potassium/sodium selectivity in wheat and the amphiploidcross wheat X Lophopyrum elongatum. Plant Sci 160:523–534.
Sar P, D’Souza SF. 2002. Biosorption of thorium (IV) by a Pseudomonas biomass. BiotechnolLett 24:239–243.
Savari A, Lockwood APM, Sheder M. 1991. Effects of season and size (age) on heavy metalconcentrations of the common cockle (Cerastoderma edule (L.)) from Southampton water.J Moll Stud 57:45–57.
Schachtman DP, Liu W. 1999. Molecular pieces to the puzzle of the interaction betweenpotassium and sodium uptake in plants. Trends Plant Sci 4:281–287.
Schleppi P, Tobler L, Bucher JB, Wyttenbach A. 2000. Multivariate interpretation of the foliarchemical composition of Norway spruce (Picea abies). Plant Soil 219:251–262.
Schott A, Brand RA, Kaiser J, Schmidt D. 2006. Depleted uranium (DU)—chemo- andradiotoxicity. In: Merkel J, Hasche-Berger A, editors. Uranium in the Environment.Mining Impact and Consequences. Berlin: Springer, pp. 165–174.
Shacklette HT, Boerngen JG. 1984. Element concentrations in soils and other surficialmaterials of the conterminous United States. US Geol Surv Prof Paper 1270:1–105.
Shahandeh H, Hossner LR. 2002. Role of soil properties in phytoaccumulation of uranium.Water Air Soil Pollut 141:165–180.
Sheppard MI, Sheppard SC. 1985. The plant concentration ratio concept as applied to naturalU. Health Phys 48:494–500.
Sheppard MI, Thibault DH, Sheppard SC. 1985. Concentrations and concentration ratios of U,As and Co in Scots pine grown in a waste-site soil and an experimentally contaminated soil.Water Air Soil Pollut 26:85–94.
Sheppard SC, Evenden WG. 1988. The assumption of linearity in soil and plant concentrationratios: An experimental evaluation. J Environ Radioactivity 7:221–247.
Sheppard SC, Evenden WG. 1992. Bioavailability indices for uranium: Effect of concentrationin eleven soils. Arch Environ Contain Toxicol 23:117–124.
Sheppard SC, Evenden WG, Pollock RW. 1989. Uptake of natural radionuclides by field andgarden crops. Can J Soil Sci 69:751–767.
Shtangeeva IV. 1993. Chemical element distribution in soils and some species of plants.In: Frontasieva M, editor. Activation Analysis in Environmental Protection. Dubna:JINR, pp. 340–351.
340 URANIUM AND THORIUM ACCUMULATION IN CULTIVATED PLANTS

Shtangeeva I, Ayrault S. 2004. Phytoextraction of thorium from soil and water media. WaterAir Soil Pollut 154:19–35.
Shtangeeva I, Ayrault S, Jain J. 2005. Thorium uptake by wheat at different stages of plantgrowth. J Environ Radioactivity 81:283–293.
Shtangeeva I, Lin X, Tuerler A, Rudneva E, Surin V, Henkelmann R. 2006. Thorium anduranium uptake and bioaccumulation by wheat-grass and plantain. Forest SnowLandscape Res 80:181–190.
Suh S, Moran N, Lee Y. 2000. Blue light activates depolarization-dependent K channels inflexor cells from Samanea saman motor organs via two mechanisms. Plant Physiol123:833–843.
Termizi Ramli A, Wahab A, Hussein MA, Khalik Wood A. 2005. Environmental 238U and232Th concentration measurements in an area of high level natural background radiationat Palong, Johor, Malaysia. J Environ Radioactivity 80:287–304.
Terry KW, Hewson GS. 1995. Thorium lung burdens of mineral sands workers. Health Phys69:233–242.
Thiry Y, Schmidt P, Van Hees M, Wannijn J, Van Bree P, Rufyikiri G, Vandenhove H. 2005.Uranium distribution and cycling in Scots pine (Pinus sylvestris L.) growing on arevegetated U-mining heap. J Environ Radioactivity 81:201–219.
Ticknor KV. 1994. Uranium sorption on geological materials. Radiochim Acta 64:229–236.
Titaeva NA. 1992. Nuclear Geochemistry. Moskow: MGU (in Russian).
Truby P. 1995. Distribution patterns of heavy metals in forest trees on contaminated sites inGermany. Angew Bot 69:135–139.
Tsuruta T. 2006. Bioaccumulation of uranium and thorium from the solution containing bothelements using various microorganisms. J Alloys Compounds 408–412:1312–1315.
Tynybekov AK, Hamby DM. 1999. A screening assasment of external radiation levels on theshore of lake Issyk-Kul in the Kyrgyz Republic. Health Phys 77:427–430.
Tzortzis M, Tsertos H. 2005. Natural radioelement concentration in the Troodos OphioliteComplex of Cyprus. J Geochem Expl 85:47–54.
Vandenhove H, Van Hees M, Wannijn J, Wouters K, Wang L. 2007. Can we predict uraniumbioavailability based on soil parameters? Part 2: Soil solution uranium concentration is not agood bioavailability index. Environ Pollut 145:577–586.
Van Horn JD, Huang H. 2006. Uranium(VI) bio-coordination chemistry from biochemical,solution and protein structural data. Coord Chemi Revi 250:765–775.
Vera Tome F, Rodrigues PB, Lozano JC. 2002. Distribution and mobilization of U, Th and226Ra in the plant-soil compartments of a mineralized uranium area in South-west Spain.J Environ Radioactivity 59:223–243.
Vera Tome F, Rodrigues PB, Lozano JC. 2003. Soil-to-plant transfer factors for natural radio-nuclides and stable elements in a Mediterranean area. J Environ Radioactivity 65:161–175.
Voigt G, Scott EM, Bunzl K, Dixon P, Sheppard SC, Whicker WF. 2000. Radionuclides in theenvironment: Radiological quantities and sampling designs. Radiat Protection Dosimetry92:55–57.
Walter A, Schurr U. 2005. Dynamics of leaf and root growth: Endogenous control versusenvironmental impact. Ann Bot 95:891–900.
Wielinga B, Lucy JK, Moore JN, Gannon JE. 1999. Microbial and geochemical characteriz-ation of fluvially deposited sulfidic mine tailing. Appl Environ Microbiol 65:1548–1585.
REFERENCES 341

Wright SF, Upadhyaya A. 1996. Extraction of an abundant and unusual protein from soil andcomparison with hyphal protein of arbuscular mycorrhizal fungi. Soil Sci 161:575–586.
Wright RJ. 1999. Thorium. In: Fairbridge RW, editor. Encyclopaedia of Geochemistry andEnvironmental Sciences. New York: Van Nostrand, pp. 1183–1189.
Yingjun L. 1984. Element Geochemistry. Beijing: Science Press.
Yoshida S, Muramatsu Y, Tagami K, Uchida S, Ban-nai T, Yonehara H, Sahoo S. 2000.Concentrations of uranium and 235U/238U ratios in soil and plant samples collectedaround the uranium conversion building in the JCO campus. J Environ Radioactivity50:161–172.
Zararsiz A, Kizmar R, Arikan P. 1997. Field study on thorium uptake by plants within andaround of a thorium ore deposit. J Radioanal Nucl Chem 222:257–262.
342 URANIUM AND THORIUM ACCUMULATION IN CULTIVATED PLANTS
![[Regularities of lateral distribution of uranium and thorium decay series radionuclides in the anthropogenically changed soils from the area of radium production waste storage]](https://img.pdfslide.net/doc/110x75/6352cdf659ba51b6cb0219ad/regularities-of-lateral-distribution-of-uranium-and-thorium-decay-series-radionuclides.jpg)


