Embed Size (px)
Citation preview

Accepted Manuscript
Estimation of hydrocarbon biodegradation rates in marine environments: A criticalreview of the Q10 approach
Andrea Bagi, Daniela M. Pampanin, Odd Gunnar Brakstad, Roald Kommedal
PII: S0141-1136(13)00084-6
DOI: 10.1016/j.marenvres.2013.05.005
Reference: MERE 3746
To appear in: Marine Environmental Research
Received Date: 22 March 2013
Revised Date: 8 May 2013
Accepted Date: 11 May 2013
Please cite this article as: Bagi, A., Pampanin, D.M., Brakstad, O.G., Kommedal, R., Estimation ofhydrocarbon biodegradation rates in marine environments: A critical review of the Q10 approach, Marine
Environmental Research (2013), doi: 10.1016/j.marenvres.2013.05.005.
This is a PDF file of an unedited manuscript that has been accepted for publication. As a service toour customers we are providing this early version of the manuscript. The manuscript will undergocopyediting, typesetting, and review of the resulting proof before it is published in its final form. Pleasenote that during the production process errors may be discovered which could affect the content, and alllegal disclaimers that apply to the journal pertain.

MANUSCRIP
T
ACCEPTED
ACCEPTED MANUSCRIPT
1
Estimation of hydrocarbon biodegradation rates in marine environments: 1 A critical review of the Q10 approach 2
Andrea Bagia, Daniela M. Pampaninb, Odd Gunnar Brakstadc, Roald Kommedala 3
a University of Stavanger, Faculty of Science and Technology, Department of Mathematics and Natural Science, 4 Kristine Bonnevies vei 22, N-4036, Stavanger, Norway, email: [email protected], [email protected] 5
b International Research Institute of Stavanger (IRIS), Mekjarvik 12, N-4070, Randaberg, Norway, email: 6 [email protected] 7
c SINTEF, Materials and Chemistry; Department of Environmental Technology, Brattørkaia 17 C, N-7010, 8 Trondheim, Norway, email: [email protected] 9
Corresponding author: 10
Andrea Bagi 11 Faculty of Science and Technology 12 Department of Mathematics and Natural Science 13 University of Stavanger 14 Kristine Bonnevies vei 22 15 N-4036 Stavanger 16 Norway 17 Email: [email protected] 18 Tel.: +47-518-3185219

MANUSCRIP
T
ACCEPTED
ACCEPTED MANUSCRIPT
2
20 Abstract 21
Offshore oil & gas industry is moving exploration and production activities into Arctic and deep 22 water regions. Governmental regulations require environmental impact assessments before 23 operations to evaluate the possible effects of accidental oil releases. These are often performed 24 by numerical fate models, like the Oil Spill Contingency and Response (OSCAR) model, which 25 has become an industry standard in Norway. In this model, biodegradation rates are adjusted to 26 local conditions by temperature compensation according to a Q10 approach. Q10 is the multiplier 27 by which rates of enzymatic reactions increase at a 10 °C temperature rise. Herein, this Q10 28 approach implemented in the OSCAR model is investigated based on published data and novel 29 obtained results. Overall, biodegradation rate predictions calculated by temperature 30 compensation are found to be questionable, and choosing one universal Q10 value is considered 31 not feasible. The high variation in Q10 values is herein attributed to indirect effects of 32 temperature. 33
Keywords 34
biodegradation; Q10 value; crude oil; temperature compensation; environmental risk assessment; 35 OSCAR model 36
Abbreviations 37
BOD Biological Oxygen Demand 38
EIF Environmental Impact Factor 39
HC Hydrocarbon 40
ITOPF International Tanker Owners Pollution Federation 41
NRC National Research Council 42
OSCAR Oil Spill Contingency and Response43

MANUSCRIP
T
ACCEPTED
ACCEPTED MANUSCRIPT
3
44
1. Introduction 45 Offshore petroleum resources in temperate and shallow water regions are being depleted, and the 46 oil and gas industry is moving exploration and production activities into frontier regions, like the 47 Arctic and the deep sea environments. Before opening up for oil production international and 48 national regulations require industrial developers to conduct assessments of environmental 49 impacts to evaluate the possible effects of accidental and operational oil releases (Thérivel and 50 Minas, 2002). A key methodological approach is simulation of discharge scenarios using 51 numerical fate models (French-McCay, 2011; Reed et al., 1995; Sebastião and Soares, 1995; 52 Zhong and You, 2011). 53
In the North Atlantic regions, these models have earned a central role in environmental risk 54 management and contingency planning (Daling and Strøm, 1999; Ly et al., 2004). They are used 55 for evaluation of fate and estimation of the effect of crude oil in marine environments by 56 simulating physico-chemical and biological weathering processes (Reed et al., 1999). Models 57 have been designed to be generic, i.e. applicable in different regions, while reflecting local 58 environmental conditions. Marine meteorology data (e.g. wind, wave, currents etc.) can be 59 obtained from online databases and used as input for these fate models, ensuring that physico-60 chemical processes (e.g. evaporation, dispersion, dissolution etc.) are adapted to local conditions 61 (Berry et al., 2012; Guo and Wang, 2009; Hackett et al., 2009; Liu et al., 2011). However, 62 information (databases or on-site measurements) about biodegradation in different regions is not 63 available. 64
The Oil Spill Contingency and Response (OSCAR) model (described in detail by Brakstad and 65 Faksness (2000) and Reed et al. (2000)) is a three-dimensional dynamic tool, and is currently the 66 most widely used model in the North Atlantic region. The OSCAR model includes a number of 67 parameters like description of site-specific physical environments and physical-chemical fate 68 processes. The model also includes a description of biodegradation of 25 pseudo-oil component 69 groups. Biodegradation rates for water-soluble fractions, dispersed oil in the water column, and 70 for sedimented oil are used to calculate overall biodegradation (Reed et al., 2000). Due to the 71 lack of locally relevant biological data, biodegradation rates are adjusted to local conditions by 72 temperature compensation (Mark Reed, SINTEF, personal communication). Accurate estimation 73 of biodegradation rates is important since this is the only process that completely eliminates oil 74 compounds from the environment, unlike evaporation, which removes volatile HC from the 75 water phase, transferring pollution into the atmosphere (Atlas, 1981; Brakstad et al., 2009; Head 76 et al., 2006; Zobell et al., 1943). Oil fate estimations of the OSCAR model were found to be very 77 sensitive to changes in biodegradation rates (Brakstad et al., 2003). A sensitivity analysis study, 78 performed by the model developers, showed that PNEC values and biodegradation rates were the 79 parameters of major importance, explaining 40% and 25% of the magnitude of EIF peak 80 (environmental impact factor peak, i.e. model output), respectively, when the effect of non-81
MANUSCRIP
T
ACCEPTED
ACCEPTED MANUSCRIPT
4
compositional variables was assessed. Hence, accurate biodegradation rate estimations are 82 essential for computation of reliable model output. Since local rate estimations in the OSCAR 83 model are computed using temperature compensation, overall model output is affected by the 84 implementation of this approach. 85
In the following two sections, first the effect of temperature on HC biodegradation in the marine 86 environment is shortly reviewed, to understand the origin of temperature compensation 87 approaches, and then the temperature compensation approach implemented in the OSCAR model 88 is introduced. 89
1.1 Temperature effect on hydrocarbon biodegradation 90 Temperature is a major factor influencing all aspects of life, also the metabolic activity of 91 microorganisms (Price and Sowers, 2004). The influence of temperature on biodegradation of 92 HCs has been reported over the last 70 years (Atlas and Bartha, 1972; Atlas, 1981; Zobell, et al., 93 1943; Zobell, 1946, 1963; Brakstad, 2008). It has been extensively studied through temperature 94 controlled experiments where seawater samples are exposed to HCs at several incubation 95 temperatures, biodegradation rates are determined and the effect of temperature is expressed as 96 Q10 values (Coulon et al., 2007; Delille et al., 2009; Garrett et al., 2003; Gibbs et al., 1975; Gibbs 97 and Davis, 1976; Minas and Gunkel, 1995; Mulkins-Phillips and Stewart, 1974; Venosa and 98 Holder, 2007). By definition, these values are the multipliers by which rates of enzymatic 99 reactions increase at a 10 °C temperature rise. Crude oil biodegradation is most often interpreted 100 as a pseudo first order process according to: 101
(1) 102
Where S is the substrate concentration (mg L-1), t is time (day), and k1 is the pseudo first order 103 rate coefficient (day-1). The k1 values determined from biodegradation measurements are then 104 used for Q10 calculations as: 105
T
1
10T
110 k
kQ
+
= (2) 106
Where is the pseudo first order degradation rate coefficient at temperature T (°C), and 107 is the rate coefficient at 10 degrees higher temperature. The Q10 approach implies using Equation 108 2 to calculate k1 value at a certain temperature based on k1 measured at a different temperature. 109 Following the work of Gibbs et al. (1975), a Q10 of 2.7 became a generally accepted value for 110 temperature compensation of biodegradation rates over the last decades (Stewart et al., 1993). 111 Nowadays, it appears that a Q10 of 2 or a range of 2-3 is the most widely accepted rule of thumb 112 for calculating biodegradation rates from one temperature to another (Brakstad et al., 2009; 113 NRC, 2003). In groundwater, which is a completely different system compared to seawater, also 114 a Q10 of 2.0 has been used for temperature compensation of HC biodegradation rates (Van 115
MANUSCRIP
T
ACCEPTED
ACCEPTED MANUSCRIPT
5
Stempvoort and Biggar, 2008). This indicates that despite differences between the two 116 environments, (e.g. constant temperature, no light and higher amount of nutrient) authors still use 117 the same rule of thumb. 118
1.2. Temperature compensation of hydrocarbon biodegradation 119 The OSCAR model simulates biodegradation for 25 selected oil pseudo-component groups, 120 separated on the bases of boiling point characteristics, by using a database of first-order 121 biodegradation rate coefficients (k1) (Reed et al., 2000). The same database is used in 122 geographically and climatically different areas. It is well known that HC biodegradation depends 123 on several environmental factors other than temperature, that vary considerably among marine 124 environments, e.g. nutrient concentration, salinity, and type of oil degraders (Leahy and Colwell, 125 1990). In general, a few keystone genera are typically identified in oil exposed marine 126 environments, such as Alkanivorax and Cycloclasticus (Head et al. 2006, Yakimov et al. 2007). 127 However, quantitative data describing biodegradation rate of these bacteria are usually not 128 reported, hence it is yet unclear to what extent the geographical origin of these HC degraders can 129 affect observed biodegradation rates. Due to lack of established quantitative relationship between 130 degradation rates and these factors (e.g. nutrients and type of degraders), mathematical 131 formulation is not implemented in the OSCAR model. The relationship between temperature and 132 biodegradation rate has been established (Equation 2) and implemented in the OSCAR model as 133 follows. Location specific biodegradation rate coefficients are calculated by the OSCAR model 134 from the database of reference k1 values based on the temperature difference between the 135 incubation temperature where reference k1 values were measured and the ambient temperature of 136 the environment where the OSCAR model is applied, according to: 137
138 (3) 139
Where k1 is the temperature compensated rate coefficient, is the coefficient measured in 140 laboratory tests, Tw is the ambient water temperature and Tref is the incubation temperature where 141 the biodegradation rates were originally determined (Brakstad and Faksness, 2000). This 142 temperature compensation approach is derived from the Q10 concept, and the constant 0.03 in 143 Equation 3 represents the Q10=2 rule of thumb. The OSCAR model is applied in several different 144
areas using the same set of values and the same Q10 assuming that microbial communities 145 have the same temperature response and the same biodegradation capacity at a given (reference) 146 temperature. If a microbial community has a different temperature response (i.e. Q10 ≠ 2 and 147 consequently the constant in Equation 3 ≠ 0.03) or exhibits different biodegradation rate at the 148 reference temperature, the Q10 approach becomes futile, leading to erroneous rate predictions. 149 For example, in case the Q10 value is found to be 3.0 instead of 2.0 (i.e. replacing 0.03 in 150 Equation 2 with 0.048), k1 values would now be overestimated using the current approach with 151 12 and 41% at 10 and 0 °C ambient temperatures, respectively, assuming 20 °C as reference 152 temperature. 153

MANUSCRIP
T
ACCEPTED
ACCEPTED MANUSCRIPT
6
Prokaryotic communities of the oceans are diverse, dynamically changing and adapted to local 154 conditions (Baltar et al., 2010; Hewson et al., 2006; Fuhrman et al., 2008; Kirchman, 2008; 155 Martiny et al., 2006; Ruiz-González et al., 2012), hence expecting uniform biodegradation 156 capacity and temperature response is questionable. Degradation efficiency of two different 157 Antarctic HC degrading isolates has been found to differ at the tested two incubation 158 temperatures during the first two weeks of the experiment, showing that bacteria from the same 159 environment can exhibit different biodegradation characteristics (Michaud et al., 2004). 160 Degradation profile and capacity of cosmopolitan HC degrader, Cycloclasticus, was shown to 161 vary with geographical origin, though, the genetic bases for PAH degradation in the two 162 Cycloclasticus strains appeared to be very similar (Geiselbrecht et al., 1998). Further studies of 163 several housekeeping genes are necessary to confirm their phylogenetic and metabolic similarity 164 (Staley, 2010). Due to the lack of relevant studies, a key bottle-neck in predicting HC 165 degradation rates in marine environments is the lack of quantitative information on inherent 166 biodegradation capacity (rate) of geographically and climatically distinct marine microbial 167 communities. In connection with the universal temperature response, an additional problem is 168 that warm and cold adapted bacteria have been shown to exhibit distinct temperature sensitivity, 169 yet displaying similar metabolic activity at ambient temperatures of their environment (Arnosti et 170 al., 1998; Robador et al., 2009). This implies, that physiological adaptations to ambient 171 conditions allow cold adapted bacteria to exhibit similar metabolic rates in their environment 172 (e.g. polar waters) to those exhibited by warm-adapted bacteria in their environment (e.g. 173 temperate waters). Hence, both assumptions underlying the Q10 approach are debatable. 174 Naphthalene biodegradation rate coefficients of temperate and arctic seawater were found to be 175 similar at in situ temperatures of 7.0 and 1.4 °C, respectively, under non-nutrient limiting 176 conditions (Bagi et al., in press). This implies that ambient temperature may not be the major 177 factor determining inherent biodegradation capacity. Consequently, using temperature 178 compensation to estimate biodegradation rate appears to be debatable. 179
The main objective of this review paper was to study the foundation and suitability of the 180 temperature compensation approach based on the Q10 = 2 rule of thumb. Published data and 181 novel results obtained in a laboratory experiment were analyzed to better understand 182 experimental and environmental factors influencing observed temperature responses of marine 183 microbial communities exposed to petroleum hydrocarbons. The reported experiment has been 184 carried out in order to provide additional Q10 values to the already existing set of data and to test 185 the suitability of the OxiTop®-C system for studying temperature response of crude oil 186 biodegradation. 187
2. Literature survey 188 A dataset of Q10 values was constructed from literature by collecting published oil 189 biodegradation rates and calculating Q10 values. Data were selected from biodegradation studies 190 carried out at various incubation temperatures with mixed culture inocula or natural microbial 191

MANUSCRIP
T
ACCEPTED
ACCEPTED MANUSCRIPT
7
communities from seawater, and sufficient quantitative data was reported for the calculation of 192 degradation rates. Experimental regimes were various and nutrient conditions also differed 193 among the biodegradation studies. The focus of this literature assessment was to gather 194 information about temperature response of naturally occurring microbial communities in 195 seawater when exposed to crude oil (in one case diesel oil). Therefore, temperature manipulation 196 experiments with pure cultures were excluded. Also, experiments performed in other 197 environmental media, such as soil, were not considered. Reported oil concentrations were 198 converted to a consistent unit (gC m-3) using the following conversion factors: 0.85 gC goil-1 and 199 0.7 gC gBOD-1 (biological oxygen demand) (Stewart et al., 1993). Independently of the type of 200 crude oil, a density of 0.8 g mL-1 was used, unless specific values were reported (ITOPF, 2002). 201 All biodegradation rates were calculated assuming pseudo first order kinetics (Stewart et al., 202 1993). From data reported by Brakstad and Bonaunet (2006), the degradation rate of hexadecane 203 instead of crude oil was calculated due to lack of data. The Q10 values were determined either as 204 the ratio of degradation rates measured at incubation temperatures at ten degrees difference, or 205 from Arrhenius plots (Brauer et al., 2009; Robador et al., 2009). In the latter case, the logarithm 206 of biodegradation rates were plotted against 1000/temperature (K) and Ea was determined from 207 the slope of the Arrhenius curves. Ea was then converted into Q10 according to: 208
⋅
+⋅⋅=10
)10(10
TTR
Ea
eQ (4) 209
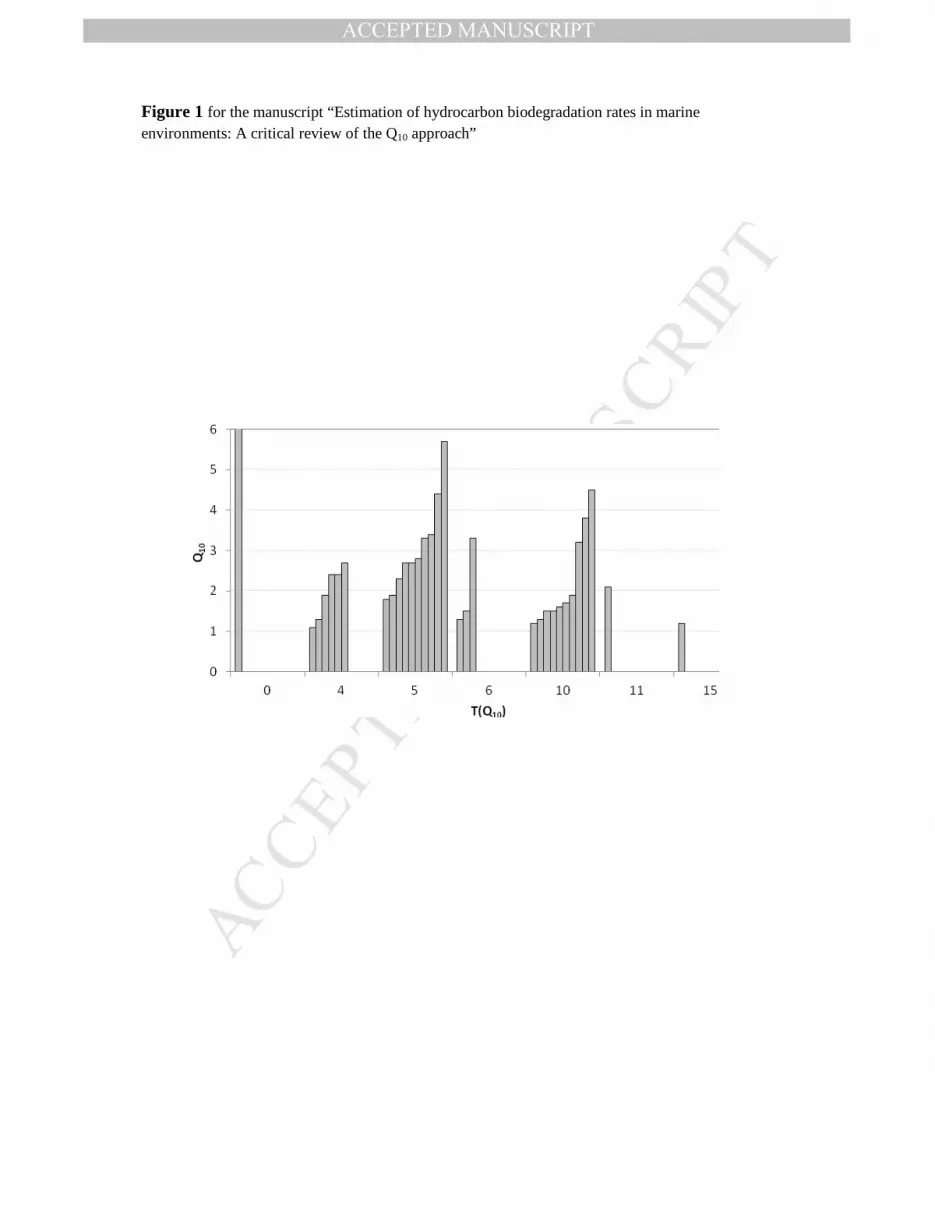
2.1. Literature survey: Dataset 210 A total of 32 Q10 values were calculated (Table 1). The values ranged from 1.1 to 16.2 with an 211 average of 2.8. The frequency distribution of Q10 ranges across the reviewed studies showed that 212 the highest occurrence of obtained Q10 values was around 2.5. Q10 values higher than 2.0 were 213 determined in 53% and Q10 values higher than 3.0 were found in 28% of the cases (Figure 1). 214 The reviewed studies varied considerably in several parameters, e.g. location, pollution history of 215 the sampling sites, type of inoculum, type of oil, season, and measurement method used. For this 216 reason statistical analysis was not performed. However, the following hypotheses were 217 formulated: a) crude oil type does modify observed temperature response as shown by Atlas 218 (1975), b) incubation temperature range can be an influencing parameter as Q10 values appeared 219 to be higher at low temperatures (Atlas and Bartha, 1972; Deppe et al., 2005; Gibbs and Davis, 220 1976). Moreover, the effect of season on temperature response was either not observed as shown 221 by close to identical Q10 values with winter and summer seawater (Minas and Gunkel, 1995) or 222 was inconclusive (Atlas and Bartha, 1972). It is well known that seasonal variation of biotic and 223 abiotic factors induces temporal changes in bacterial community composition (Sapp et al. 2007, 224 Gilbert et al., 2012; Sintes et al., 2013). Seasonal effects in terms of HC biodegradation are, 225 however, not sufficiently investigated. This particular area can be an interesting subject for 226 further research. Measurement method also influenced the Q10, as for example gravimetric and 227 respirometric analysis of the same biodegradation experiment resulted in different values (Atlas 228 and Bartha, 1972). It is difficult to conclude to what extent measurement methodology affects 229

MANUSCRIP
T
ACCEPTED
ACCEPTED MANUSCRIPT
8
observed Q10 values due to limited number of studies that carried out tests under identical 230 conditions measuring biodegradation with two different methods. In general, literature 231 concerning temperature response of crude oil biodegradation in seawater is scarce. A new 232 experimental approach using static respirometry was therefore tested to establish a procedure that 233 could be standardized and applied to create comparable datasets over different conditions (e.g. 234 using different crude oil types, temperature ranges, and seawater from different regions or 235 different seasons). 236
3. Experimental data: Materials and methods 237 The OxiTop®-C static respirometry measurement system was used to study the effect of 238 temperature on crude oil (Tyrihans; light, paraffinic crude oil, density of 0.825 g cm-3) 239 biodegradation in seawater. To assess the effect of temperature on acclimated and enriched 240 microbial communities, test flasks were spiked with additional substrate in the most active 241 degradation phase. The measuring principle and application of the OxiTop®-C system has been 242 previously described (Kuokkanen et al., 2004). Seawater samples were collected from Byfjorden 243 (North: 58° 57' 48'' East: 5° 43' 8'', Randaberg, Norway, 80 m depth) without filtration (March, 244 2012, water temperature: 7.7 °C). Prior to distribution into test flasks (500 ml), seawater samples 245 were aerated for 5 min with sterile-filtered air. Flasks were then filled with seawater (375 ml) 246 and inorganic nutrients, vitamins and amino acids were added to ensure non-nutrient-limiting 247 conditions, as described by Bagi et al. (in press). Briefly, inorganic nutrients (16.2 mg L-1 248 K2HPO4, 0.8 mg L-1 KH2PO4, 42.0 mg L-1 NaNO3, 0.05 mg L-1 FeCl3, 2.5 mg L-1 CaCl2 and 1.5 249 mg L-1 MgSO4), trace minerals, amino acids (10µl L-1 RPMI 1640 amino acids solution 50x, 250 Sigma) and vitamins (10 µL L-1 of a stock solution with 20 mg L-1 myoinositol, 0.1 mg L-1 251 thiamine-hydrochloride, 0.1 mg L-1 pyridoxine-hydrochloride, 1.0 mg L-1 nicotinic acid, 0.5 mg 252 L-1 glycine, 0.01 mg L-1 biotin and 0.1 mg L-1 folic acid) were added to each flask, including 253 blank and negative control. Incubation temperatures were 0.5, 5, 10, and 15 °C. Nine flasks were 254 prepared for each incubation temperature: 5 with crude oil (100 mg L-1), 2 with sodium-benzoate 255 (30 mg L-1) (positive control), 1 without additional carbon (blank) and 1 with oil (100 mg L-1) 256 and sodium-azide (1 g L-1) to diminish bacterial activity (negative control). Finally, a carbon-257 dioxide trap was fixed in each flask. Bottles were then capped with OxiTop®-C heads and 258 placed in temperature controlled incubator cabinets (first exposure). Magnetic stirring ensured 259 mixing. In order to avoid oxygen depletion of the system prior to spiking, test flasks were opened 260 and spiked with crude oil (second exposure) as soon as oxygen consumption reached 261 approximately 50 % of the measuring limit of the closed system (89 mg O2 L
-1), i.e. approx. 45 262 mg O2 L
-1 (on day 8, 12, 28 at 15, 10 and 5 °C, respectively). Seawater incubated at 0.5 °C has 263 been spiked when oxygen consumption reached 15 mg O2 L
-1 (day 43) due to time constrains. At 264 the same time positive controls were spiked with sodium-benzoate (Na-benzoate). The same 265 concentrations of each substrate were added as during the first exposure. Oxygen consumption 266 curves were used to determine lag times (tlag) and maximum oxygen consumption rate (rmax). The 267 most active phase of degradation was selected to determine rmax values. A linear trend line was 268

MANUSCRIP
T
ACCEPTED
ACCEPTED MANUSCRIPT
9
fitted and the slope was defined as rmax both for sodium-benzoate and crude oil. Lag times were 269 defined as the time where oxygen consumption began to increase exponentially. This was 270 determined by log-transforming the original curves and searching for the start of the linear part 271 of this transformed curve. Q10 values were determined from the ratios of rmax and tlag at ten 272 degrees temperature difference according to the traditional approach described in Equation 2. 273
3.1. Experimental data: Results and Discussion 274 According to the original experimental design, sodium-benzoate served as a positive control. 275 However, it was later decided that oxygen consumption curves obtained with this substrate are 276 also to be evaluated. We found it interesting to compare temperature response of these two 277 carbon sources as one of them (crude oil) is characterized by low solubility and decreasing 278 bioavailability at lower temperatures, while the other (sodium-benzoate) is characterized by high 279 water solubility and equal bioavailability at all the tested temperatures. 280
Lag time was selected as an alternative parameter for assessing temperature effect besides 281 oxygen consumption rate. Lag period prior to exponential increase in oxygen consumption is 282 inversely proportional to the rate of acclimation (metabolic rate) and the number of bacteria 283 participating, the two major factors that also determine maximum oxygen consumption rate 284 during the most active period of degradation (under non-nutrient limiting conditions). Based on 285 this, Q10 ratios calculated from lag times could also provide useful information about the 286 temperature response of the biodegradation process. 287
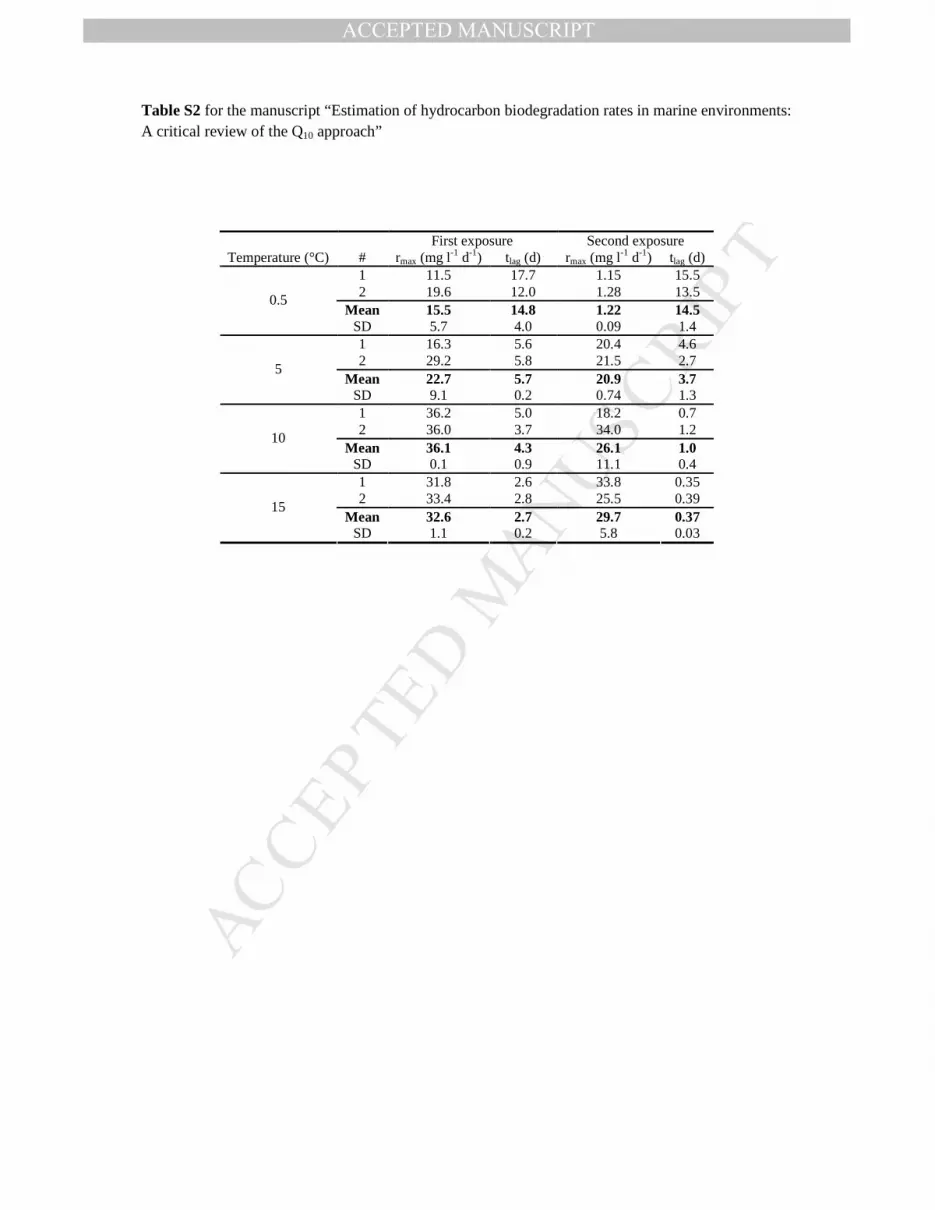
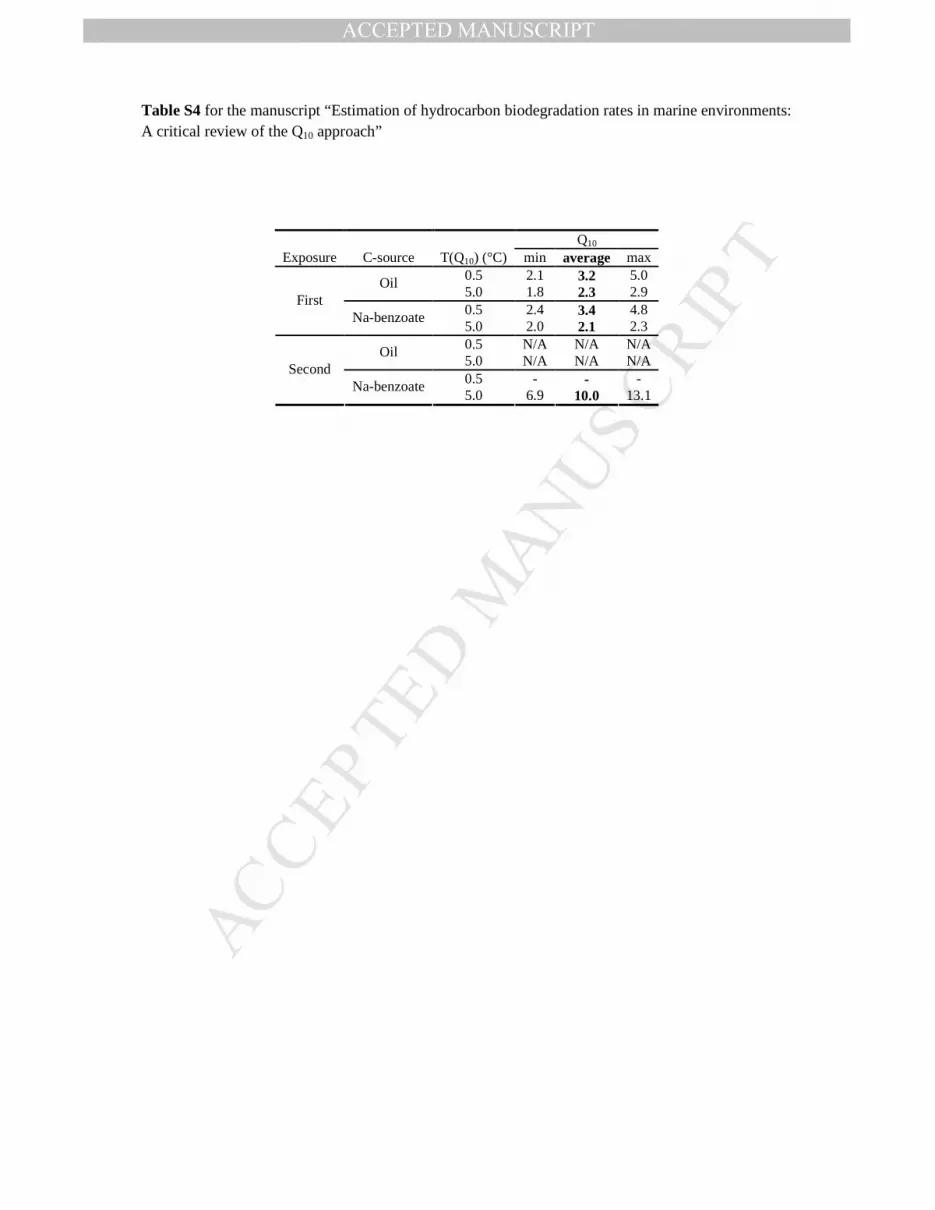
During the first exposure, both derived parameters were affected by temperature in case of both 288 substrates (Table S1 and S2). Lag times increased at decreasing temperatures (Figure 2). As 289 observed earlier, the further below ambient temperature the incubation occurs, the longer the 290 acclimation takes (Atlas and Bartha, 1972). In this study, tlag values were similar for both the test 291 substrate (crude oil) and the positive control (sodium-benzoate), which implies similar initial 292 biomass able to degrade the given substrate and similar metabolic rate. The tlag of crude oil was 293 below that of sodium-benzoate at 15 °C, whereas the opposite was observed at 0.5 °C. Maximum 294 oxygen consumption rates (rmax) increased at elevated incubation temperatures, except the rmax of 295 Na-benzoate, which showed a maximum at 10 °C during the first exposure (Figure 2). According 296 to Q10 values determined from rmax values, sodium-benzoate showed significantly lesser 297 temperature response compared to crude oil (Figure 3). Q10 appeared to be higher at 0.5 °C, 298 compared to 5 °C in agreement with that observed from literature survey data. However, this 299 difference between the two temperatures in the reported experiment is not significant. Ratios of 300 lag times were calculated in order to study whether Q10 values based on this parameter of 301 biodegradation curves show similar results to that of Q10 values calculated from rmax (Table S3 302 and S4). Indeed it can be seen that Q10 values were on average similar to those determined from 303 rmax values, however, only at 5 °C. Q10 values from tlag were similar for the two substrates, in 304 contrast to that observed in Q10 values from rmax. 305

MANUSCRIP
T
ACCEPTED
ACCEPTED MANUSCRIPT
10
During the second exposure, no lag periods were observed in case of crude oil spiked test flasks 306 as the cultures were amended with fresh carbon source while still actively growing. In case of 307 sodium-benzoate, enrichment cultures were spiked in the endogenous respiration phase, hence, 308 lag periods were observed. Both parameters (rmax and tlag) varied according to temperature and in 309 contrast to expectations, temperature responses were higher during the second exposure (Table 310 S1 and S2). However, this was probably the result of a bias in Q10 values due to the differences 311 in the amount of biomass present at the 4 different incubation temperatures at the time of 312 spiking. Clearly, when temperature response of acclimated and adapted cultures is of interest, 313 equal initial bacterial numbers (biomass) need to be ensured at each temperature. 314
4. Variability of Q10 values 315 A key question that constrains accuracy of temperature compensation based biodegradation rate 316 predictions is how temperature influences crude oil biodegradation. As introduced earlier, the 317 Q10 approach is accepted describing this relationship, and a Q10 of 2 is implemented in the 318 OSCAR model. However, the literature data gathered herein does not corroborate the choice of 319 Q10=2. The average Q10 determined from literature survey was almost 40% higher than this rule 320 of thumb and a large variation was shown among the calculated 32 Q10 values. Also, the Q10 321 values determined during the reported laboratory experiment are not in agreement with the rule 322 of thumb. Due to the variation in observed Q10 values, establishing a better range of Q10 values 323 as rule of thumb would be controversial and ambitious. In fact, the proposed universal 324 temperature dependence theory (UTD), which suggests that Ea values for all metabolic activities 325 range between 57.9 and 67.5 kJ mol-1 (Q10 values between 2.3 and 2.7), is still under debate 326 (Brown et al., 2004; Clarke, 2004). This range cannot be chosen as a best estimate for an 327 alternative rule of thumb for crude oil biodegradation based on data presented herein as only 6 of 328 the 32 different Q10 values (19%) determined during the literature survey fell within this 329 proposed range. 330
Instead of evoking an alternative Q10 range, possible reasons underlying the variability in Q10 331 values obtained from temperature controlled experiments are discussed in the following sections. 332 These factors influencing observed Q10 values must be understood in order to be able to critically 333 revise the temperature compensation approach and to identify research gaps that need to be filled 334 prior to improving the current or developing a new approach. 335
4.1. Effect of bioavailability on Q10 value 336 It has been observed that temperature affects the physico-chemical state of oil (Margesin and 337 Schinner, 1999). Toxicity and bioavailability of oil is determined by its composition, ambient 338 temperature and also other factors (e.g. presence of dispersants) (Atlas, 1975). Some oils are 339 more available for microbial degradation at low temperatures than others, as exemplified by low 340 pour points (Brakstad and Bonaunet, 2006). The appearance and bioavailability of oils at 341 different temperatures varies significantly, resulting from different composition and pour points 342 of different oil types (ITOPF, 2002). Bioavailability influences degradation rate and its 343

MANUSCRIP
T
ACCEPTED
ACCEPTED MANUSCRIPT
11
temperature dependence will also be reflected in the measured Q10 values. Therefore temperature 344 response of different crude oils has to be described by different Q10 values. This effect of 345 temperature on toxicity and bioavailability was possibly the reason for observed high Q10 values 346 by Atlas and Bartha (1972), Atlas (1975) and Brakstad and Bonaunet (2006), and also in the 347 reported laboratory experiment. Sweden crude oil used by Atlas and Bartha (1972) and Atlas 348 (1975) is known to contain a toxic volatile fraction. Limited evaporation of this fraction could 349 have resulted in toxic effects and consequently in lower biodegradation rates at low temperature. 350 The extremely high Q10 value observed by Brakstad and Bonaunet (2006) was determined using 351 Statfjord crude oil, which has a pour point of 3 °C. Hence, at the incubation temperature of 0 °C 352 the oil was in solid state, which significantly limited its bioavailability. In the reported laboratory 353 experiment, biodegradation of crude oil was limited, whereas biodegradation of Na-benzoate was 354 not limited due to physico-chemical restrictions at low temperatures. While Na-benzoate was 355 completely dissolved at all incubation temperatures (i.e. available for microbial uptake), crude 356 oil had decreased solubility and increased viscosity at the lower temperatures. Therefore 357 physico-chemical constrains only limited the availability for microbial uptake and utilization in 358 case of crude oil (Harms et al., 2010). This difference between the test and the control compound 359 could have been the reason of observed differences in Q10 values determined from rmax of the two 360 substrates. at the beginning of the exposure at all temperatures. On the other hand, crude oil had 361 decreased solubility and increased viscosity at low temperatures, limiting microbial uptake and 362 utilization (Harms et al., 2010). The influence of low solubility of hydrophobic compounds on 363 their biodegradation rates has recently been reported by Yassine et al. (2013). It appears that the 364 effect of temperature on physico-chemical properties of oil caused substrate limitation at cold 365 temperatures during the reported experiments. Initial biomass was not the limiting factor 366 responsible for reduced biodegradation of oil at low temperatures, as lag times preceding Na-367 benzoate and oil degradation were similar at all temperatures, indicating that the number of 368 bacteria consuming the tested compounds was on the same order of magnitude. Summarising, 369 temperature dependence of bioavailability implies that properties of the substrate influence the 370 Q10 value. Consequently, the temperature compensation using the same Q10 value for different 371 oils is not realistic. 372
4.2. Effect of temperature on Q10 value 373 It has been previously reported that the Q10 value varies with incubation temperature (Chablain et 374 al., 1997; Li and Dickie, 1987, Pietikäinen et al., 2005, Ratkowsky et al., 1983; Sand-Jensen et 375 al., 2007; Tarpgaard et al., 2006). In fact, Q10 values were higher at low temperatures in several 376 of the reviewed studies and also in the reported laboratory experiment. Herein, three hypotheses 377 are suggested to explain this effect. First, there is an inherent temperature dependence of the Q10 378 value which predicts that Q10 will increase at low temperatures (Equation 4). However, the 379 difference between Q10 values determined at 0.5 and 5 °C in the reported laboratory experiment 380 cannot be explained by this inherent relationship. Similarly, the difference between Q10 values 381 calculated at 5 °C and 10 °C from Atlas and Bartha (1972) is greater than expected from the 382 inherent increase of Q10. On the other hand, these differences could be explained by deviation 383

MANUSCRIP
T
ACCEPTED
ACCEPTED MANUSCRIPT
12
from the Arrhenius model below 5 °C observed by several authors (Pietikäinen et al., 2005, 384 Ratkowsky et al., 1983, Sand-Jensen et al., 2007). Second, in the case of crude oil 385 biodegradation, the physico-chemical changes that oil undergoes towards its pour point could 386 cause the increase in the Q10 value due to limited substrate bioavailability. However, a similar 387 increase in Q10 value was observed for Na-benzoate in the reported laboratory experiment. 388 Hence, substrate limitation is not likely to be the main reason for temperature influencing Q10 389 value. A third hypothesis could be that the initial number of bacteria participating in the 390 degradation is affected by temperature, implying that the low number of hydrocarbon degraders 391 present in seawater might be further reduced by exposure to non-ambient (cold) temperatures. 392 Besides biodegradation activity and substrate concentration, biodegradation rate also depends on 393 the number of active bacteria possessing the degrading enzymes (Valentine et al., 2012; Yassine 394 et al., 2013). According to the Monod growth model, substrate consumption rates (i.e. HC 395 degradation rate) can be expressed as: 396
(5) 397
Where Y is the yield coefficient, µmax is the maximum growth rate (day-1), Ks is the half-398 saturation coefficient (mg L-1), S is the substrate concentration (mg L-1) and X is the biomass 399 concentration (mg L-1). Temperate sea waters are thought to be dominated by mesophilic 400 bacteria, which have a minimum growth temperature of around 5 °C, and also inhabited by cold-401 adapted bacteria (psychrophilic and psychrotolerant), which grow below 5 °C (Morita, 1975). At 402 the incubation temperature of 0.5 °C, cold-adapted species would be expected to grow and 403 become dominant in temperate sea water (Brakstad and Bonaunet, 2006). If these cold-adapted 404 species are in low abundance, then biomass limitation could be the reason for Q10 values being 405 higher than expected below 5 °C. This can be more clearly seen if one expresses the k1 values 406 from Equation 5, taking into account the assumptions that the first order interpretation of the 407 Monod model requires, i.e. substrate concentration is much lower than the half-saturation 408 coefficient (S<<Ks) and biomass is constant (dX/dt=0): 409
(6) 410
Biomass (X) clearly influences the pseudo first order rate coefficient. In fact, number of active 411 bacteria was shown to influence degradation rate of alkanes (Yassine et al., 2013). Though 412 pseudo first order interpretation of crude oil biodegradation assumes that biomass does not 413 increase while HCs are consumed, this is generally not the case. Number of degrading bacteria 414 increases several orders of magnitude during HC biodegradation (Valentine et al., 2012). Hence, 415 the assumption underlying the pseudo first order interpretation of crude oil biodegradation is 416 erroneous. More importantly, when Q10 values are calculated from k1, the influence of biomass 417 on biodegradation rate is taken into account causing observed Q10 values to vary. In other words, 418 what appears to be the effect of temperature can be in reality the result of the influence of 419

MANUSCRIP
T
ACCEPTED
ACCEPTED MANUSCRIPT
13
biomass. It is important to note that in natural ecosystems hydrocarbon degrading bacteria are 420 organic parts of an ecological network. This network consists of the traditional food chain and 421 the microbial loop, which is at the base of the chain (Azam et al., 1983). Within the context of 422 the microbial loop, there are several mechanisms that control the abundance (X) and growth rate 423 of bacteria (µmax), and through that influencing biodegradation processes (McGenity et al., 2012). 424 Biomass is affected by grazing pressure, competition and viral lysis, which can be specific for 425 bacteria types. Therefore, differences in these factors are also indirectly reflected in observed Q10 426 values. Moreover, pseudo first order rate coefficients and biodegradation in general depends on 427 specific metabolic activity (e.g. µmax), which can be distinct for cold and warm adapted bacteria, 428 and also a function of nutrient availability. 429
5. Conclusions and remarks 430 An intriguing question is; to what extent does the influence of temperature on biodegradation 431 rates determined in laboratory experiments reflect the effect of temperature on biodegradation in 432 natural systems of geographically and climatically different areas? As an overall result of the 433 present review, biodegradation rate predictions calculated by temperature compensation 434 approach are uncertain. Large variation of Q10 values have been found in the reviewed studies, 435 therefore alternative Q10 range or value has not been recommended as a replacement for the 436 current rule of thumb. Instead, characteristics of the substrate (e.g. different crude oil types) and 437 other experimental factors were discussed in relation to their influence on observed Q10 values. 438 Considering non-nutrient limiting conditions, indirect effects of temperature, such as its 439 influence on substrate bioavailability and number and metabolic activity of active bacteria have 440 been proposed to be reflected in Q10 values. Consequently, it is concluded that Q10 values 441 measured in temperature controlled studies do not describe intrinsic temperature sensitivity of oil 442 biodegradation (i.e. sensitivity of the metabolic processes involved in biodegradation). That can 443 only be determined after removing the contribution of the proposed additional factors. Future 444 research needs to focus on discovering these contributions by systematic testing of each 445 parameter. It is important to highlight that metabolic activity, determined by the bacterial 446 community composition, is a key parameter. Replacing the temperature compensation approach 447 would require developing coupled physical-metabolic-ecological models in order to be able to 448 describe the complex microbial ecosystems established around marine oil biodegradation. Until 449 such a better approach is developed, adequate biodegradation rate predictions based on 450 temperature compensation depend on the existence of a common inherent biodegradation rate, 451 characteristic to all marine microbial communities at the same temperature. Hence, most 452 importantly, there is a need for studies assessing and comparing biodegradation rates of distinct 453 marine microbial communities under well-defined conditions, i.e. using the same methodology, 454 oil types and controlling concentrations of nutrients and amount and composition of biomass. 455

MANUSCRIP
T
ACCEPTED
ACCEPTED MANUSCRIPT
14
Acknowledgements 456 Financial support from Total E&P Norway is gratefully acknowledged. Mark Reed (SINTEF. 457 Trondheim) is acknowledged for his advices regarding the OSCAR model. Particular thanks go 458 to Emily Lyng (International Research Institute of Stavanger) for revising the manuscript. 459
Figure legends 460
Fig. 1. Visualization of the 32 Q10 values calculated from published biodegradation rates of 461 petroleum hydrocarbons as a function of the temperature where Q10 value was calculated 462 (T(Q10)). (Each column represents one Q10 value from Table 1.) Note that the maximum on the y 463 axis has been set to 6.0 and the Q10 value calculated at 0 °C was 16.2 (top of the column not 464 shown). 465
Fig. 2. Lag time values (left) and maximum oxygen consumption rates (right) measured in 466 seawater samples exposed to crude oil (Oil I.) and sodium-benzoate (Na-benzoate I.) at four 467 different incubation temperatures. Grey=oil and no fill=sodium-benzoate. (Only results from the 468 first exposure (I.) are shown.) 469
Fig. 3. Q10 values calculated from maximum oxygen consumption rates (rmax) and lag times 470 (tlag) at 0.5 and 5.0 °C (T(Q10)) for crude oil (Oil) and sodium-benzoate (Na-benzoate) from the 471 first exposure. Error bars show the range between minimum and maximum values of Q10. 472 Dotted=oil rmax, darker grey=sodium-benzoate rmax, dashed=oil tlag and lighter greay=sodium-473 benzoate tlag. 474
Table legends (for Tables to be included in the main text) 475
Table 1 Details of the surveyed studies: type of oil used, concentration of the oil (C0), inoculum, 476 season, measurement method, temperature where Q10 was calculated (T(Q10)), Q10 value and 477 reference. Letter code for methods: G=gravimetry, R=respirometry, GC=gas chromatography, 478 B=bacterial number, and letter code for season: W=winter, Su=summer, A=autumn, Sp=spring 479
Table legends (for Tables to be included as Supplementary material) 480
Table S1 Maximum oxygen consumption rate (rmax) and lag time (tlag) values derived from 481 oxygen consumption raw data of crude oil biodegradation 482
Table S2 Maximum oxygen consumption rate (rmax) and lag time (tlag) values derived from 483 oxygen consumption raw data of sodium-benzoate biodegradation 484
Table S3 Q10 values (minimum=min, average, and maximum=max) calculated from maximum 485 oxygen consumption rates for the first and second exposures, for the two carbon sources (crude 486 oil and sodium-benzoate) at 0.5 and 5.0 °C temperature (T(Q10)). 487

MANUSCRIP
T
ACCEPTED
ACCEPTED MANUSCRIPT
15
Table S4 Q10 values (minimum=min, average, and maximum=max) calculated from lag times 488 for the first and second exposures, for the two carbon sources (crude oil and sodium-benzoate) at 489 0.5 and 5.0 °C temperature (T(Q10)). 490
References 491
Atlas, R.M., Bartha, R., 1972. Biodegradation of petroleum in seawater at low temperatures. 492 Canadian Journal of Microbiology 18, 1851-1855. 493
Atlas, R.M., 1975. Effects of temperature and crude oil composition on petroleum 494 biodegradation. Applied Microbiology 30, 396-403. 495
Atlas, R.M., 1981. Microbial degradation of petroleum hydrocarbons: an environmental 496 perspective. Microbiological Reviews 45, 180-209. 497
Arnosti, C., Jørgensen, B.B., Sagemann, J., Thamdrup, B., 1998. Temperature dependence of 498 microbial degradation of organic matter in marine sediments: polysaccharide hydrolysis, oxygen 499 consumption, and sulfate reduction. Marine Ecology Progress Series, 165, 59-70. 500
Azam, F., Fenchel, T., Field, J.G., Gray, J.S., Meyer, L.A., Thingstad, F., 1983. The ecological 501 role of water column microbes in the sea. Marine Ecology Progress Series 10, 257-263. 502
Bagi, A., Pampanin, D.M., Lanzén, A., Bilstad, T., Kommedal, R., 2013. Naphthalene 503 biodegradation in temperate and arctic marine microcosms. Biodegradation, in press. 504
Baltar, F., Arístegui, J., Gasol, J.M., Lekunberri, I., Herndl, G.J., 2010. Mesoscale eddies: 505 hotspots of prokaryotic activity and differential community structure in the ocean. The ISME 506 Journal 4, 975-988. 507
Berry, A., Dabrowski, T., Lyons, K., 2012. The oil spill model OILTRANS and its application to 508 the Celtic Sea. Marine Pollution Bulletin 64, 2489–2501. 509
Brakstad, O.G., Faksness, L.-G., 2000. Biodegradation of water-accomodated fractions and 510 dispersed oil in the seawater column. Sociecty of Petroleum Engineers. Conference Paper 61466-511 MS. ISBN: 978-1-55563-913-6, doi: 10.2118/61466-MS 512
Brakstad, F., Ditlevsen, M.K., Reed, M., 2003. Sensitivity study of the EIF-calculations in 513 DREAM 2.0. ERMS Report STF66 F03014, no. 1. URL: 514 http://www.sintef.no/Projectweb/ERMS/Reports Last accessed: 12. 03. 2013. 515
Brakstad, O.G., Bonaunet, K., 2006. Biodegradation of petroleum hydrocarbons in seawater at 516 low temperatures (0–5 degrees C) and bacterial communities associated with degradation. 517 Biodegradation 17, 71-82. 518

MANUSCRIP
T
ACCEPTED
ACCEPTED MANUSCRIPT
16
Brakstad, O.G., 2008. Natural and stimulated biodegradation of petroleum in cold marine 519 environments, in: Margesin, R., Schinner, F., Marx, J.-C., Gerday, C. (Eds.), Psychrophiles: from 520 biodiversity to biotechnology. Springer-Verlag, Berlin Heidelberg, pp. 389-407. 521
Brakstad, O.G., Booth, A.M., Faksness, L.-G., 2009. Microbial degradation of petroleum 522 compounds in cold marine water and ice, in: Bej, A.K., Aislabie, J., Atlas, R.M. (Eds.), Polar 523 Microbiology: The ecology, biodiversity and bioremediation potential of microorganisms in 524 extremely cold environments. CRC Press, pp. 231–253. 525
Brauer, V.S., de Jonge, V.N., Buma, A.G.J., Weissing, F.J., 2009. Does universal temperature 526 dependence apply to communities? An experimental test using natural marine plankton 527 assemblages. Oikos 118, 1102-1108. 528
Brown, J.H., Gillooly, J.F., Allen, A.P., Savage, V.M., West, G.B., 2004. Toward a metabolic 529 theory of ecology. Ecology 85, 1771-1789. 530
Clarke, A., 2004. Is there a Universal Temperature Dependence of metabolism? Functional 531 Ecology 18, 252-256. 532
Chablain, P.A., Philippe, G., Groboillot, A., Truffaut, N., Guespin-Michel, J.F., 1997. Isolation 533 of a soil psychrotrophic toluene-degrading Pseudomonas strain: influence of temperature on the 534 growth characteristics on different substrates. Research in Microbiology 148, 153-161. 535
Coulon, F., McKew, B.A., Osborn, A.M., McGenity, T.J., Timmis, K.N., 2007. Effects of 536 temperature and biostimulation on oil-degrading microbial communities in temperate estuarine 537 waters. Environmental Microbiology 9, 177-186. 538
Daling, P.S., Strøm, T., 1999. Weathering of oils at sea: Model/Field data comparisons. Spill 539 Science & Technology Bulletin 5, 63-74. 540
Delille, D., Pelletier, E., Rodríguez-Blanco, A., Ghiglione, J.-F., 2009. Effects of nutrient and 541 temperature on degradation of petroleum hydrocarbons in sub-Antarctic coastal seawater. Polar 542 Biology 32, 1521-1528. 543
Deppe, U., Richnow, H.-H., Michaelis, W., Antranikian, G., 2005. Degradation of crude oil by 544 an arctic microbial consortium. Extremophiles 9, 461-470. 545
French-McCay, D.P., 2011. Oil Spill Modeling for Ecological Risk and Natural Resource 546 Damage Assessment. Paper 415, Proceedings of the 2011 International Oil Spill Conference, 547 American Petroleum Institute, Washington, D.C., May 2011 548
Fuhrman, J.A., Steele, J.A., Hewson, Schwalbach, M.S., Brown, M.V., I., Green, J.L., Brown, 549 J.H., 2008. A latitudinal diversity gradient in planktonic marine bacteria. Proceedings of the 550 National Academy of Sciences 105, 7774–7778. 551
MANUSCRIP
T
ACCEPTED
ACCEPTED MANUSCRIPT
17
Garrett, R.M., Rothenburger, S.J., Prince, R.C., 2003. Biodegradation of fuel oil under laboratory 552 and Arctic marine conditions. Spill Science and Technology Bulletin 8, 279-302. 553
Geiselbrecht, A.D., Hedlund, B.P., Tichi, M.A., Staley, J.T., 1998. Isolation of marine polycyclic 554 aromatic hydrocarbon (PAH)-degrading Cycloclasticus strains from the Gulf of Mexico and 555 comparison of their PAH degradation ability with that of Puget Sound Cycloclasticus strains. 556 Applied and Environmental Microbiology 64, 4703-4710. 557
Gibbs, C.F., Davis, S.J., 1976. The rate of microbial degradation of oil in a beach gravel column. 558 Microbial Ecology 3, 55-64. 559
Gibbs, C.F., Pugh, K.B., Andrews, A.R., 1975. Quantitative studies on marine biodegradation of 560 oil II. Effect of temperature. Proceedings of the Royal Society London B 188, 83-94. 561
Gilbert, J.A., Steele, J.A., Caporaso, J.G., Steinbrück, L., Reeder, J., Temperton, B., Huse, S., 562 McHardy, A.C., Knight, R., Joint, I., Somerfield, P., Fuhrman, J.A., Field, D., 2012. Defining 563 seasonal marine microbial community dynamics. The ISME Jornal 6:2, 298-308, doi: 564 10.1038/ismej.2011.107. 565
Guo, W.J., Wang, Y.X., 2009. A numerical oil spill model based on a hybrid method. Marine 566 Pollution Bulletin 58, 726–734. 567
Hackett, B., Comerma, E., Daniel, P., Ichikawa, H., 2009. Marine oil pollution prediction. 568 Oceanography, 22 (3), 168-175. 569
Harms, H., Smith, K. E. C., Wick, L. Y. (2010) Microoganism-Hydrophobic compound 570 interactions, in: Timmis, K. N. (Ed.) Handbook of hydrocarbon and lipid microbiology. 571 Springer-Verlag, Berlin, Heidelberg, pp. 1480-1490. 572
Head, I.M., Jones, D.M., Röling, W.F.M., 2006. Marine microorganisms make a meal of oil. 573 Nature Reviews Microbiology, 4, 173-182. 574
Hewson, I., Steele, J.A., Capone, D.G., Fuhrman, J.A., 2006. Temporal and spatial scales of 575 variation in bacterioplankton assemblages of oligotrophic surface waters. Marine Ecology 576 Progress Series 311, 67-77. 577
ITOPF: International Tanker Owners Pollution Federation Limited, 2002. Fate of marine oil 578 spills. Technical Information Paper No. 2 579
Kirchman, D.L, 2008. Microbial ecology of the oceans, second ed. John Wiley & Sons 580
Kuokkanen, T., Vähäoja, P., Välimäki, I., Lauhanen, R., 2004. Suitability of the respirometric 581 BOD oxitop method for determining the biodegradability of oils in ground water using forestry 582 hydraulic oils as model compounds. International Journal of Environmental Analytical 583 Chemistry 84, 677–689. 584

MANUSCRIP
T
ACCEPTED
ACCEPTED MANUSCRIPT
18
Leahy, J.G., Colwell, R.R., 1990. Microbial degradation of hydrocarbons in the environment. 585 Microbiological Reviews 54, 305-315. 586
Li, W.K.W., Dickie, P.M., 1987. Temperature characteristics of photosynthetic and heterotrophic 587 activities: seasonal variations in temperate microbial plankton. Appl Environ Microbiol 53, 588 2282–2295. 589
Liu, Y., Weisberg, R.H., Hu, C., Zheng, L., 2011. Combining numerical ocean circulation 590 models with satellite observations in a trajectory forecast system: a rapid response to the 591 Deepwater Horizon oil spill. In Proceedings SPIE 8030, Ocean Sensing and Monitoring III, 592 80300K (May 04, 2011), doi:10.1117/12.887983. 593
Ly, J.M., Hansen, O., Bratfoss, B., Johansen, Ø., Singsaas, I., 2004. Assessing the level of 594 Norwegian governmental preparedness using scenarios and model tools in an environmental risk 595 based approach. Interspill 2004, Presentation no. 430 596
Martiny, J.B.H., Bohannan, B.J.M., Brown, J.H., Colwell, R.K., Fuhrman, J.A., Green, J.L., 597 Horner-Devine, M.C., Kane, M., Krumins, J.A., Kuske, C.R., Morin, P.J., Naeem, S., Øvreås, L., 598 Reysenbach, A.-L., Smith, V.H., Staley, J.T., 2006. Microbial biogeography: putting 599 microorganisms on the map. Nature Reviews Microbiology 4, 102-112. 600
Margesin, R., Schinner, F., 1999. Biological decontamination of oil spills in cold environments. 601 Journal of Chemical Technology and Biotechnology 74, 381-389. 602
McGenity, T.J., Folwell, B.D., McKew, B.A., Sanni, G.O., 2012. Marine crude-oil 603 biodegradation: a central role for interspecies interactions. Aquatic Biosystems 8, 10. 604
Michaud, L., Giudice, A. L., Saitta, M., De Domenico, M., Bruni, V., 2004. The biodegradation 605 efficiency on diesel oil by two psychrotrophic Antarctic marine bacteria during a two-month-606 long experiment. Marine Pollution Bulletin 49, 405-409. 607
Minas, W., Gunkel, W., 1995. Oil pollution in the North Sea-a microbiological point of view. 608 Helgoländer Meeresuntersuchungen 49, 143-158. 609
Morita, R.Y., 1975. Psychrophilic bacteria. Bacteriological reviews 39, 144-167. 610
Mulkins-Phillips, G.J. and Stewart, J.E., 1974. Effect of environmental parameters on bacterial 611 degradation of Bunker C oil, crude oils, and hydrocarbons. Applied Microbiology 28, 915-922. 612
National Research Council (NRC), 2003. Oil in the Sea III: Inputs, Fates and Effects, National 613 Academy Press, Washington, D.C., USA. 614
Pietikäinen J., Pettersson M., Bååth E., 2005. Comparison of temperature effects on soil 615 respiration and bacterial and fungal growth rates. FEMS Microbiology Ecology 52, 49-58. 616

MANUSCRIP
T
ACCEPTED
ACCEPTED MANUSCRIPT
19
Price, P.B., Sowers, T., 2004. Temperature dependence of metabolic rates for microbial growth, 617 maintenance, and survival. Proceedings of the National Academy of Sciences 101, 4631–4636. 618
Ratkowsky, D.A., Lowry, R.K., McMeekin, T.A., Stokes, A.N., Chandler, R.E., 1983. Model for 619 bacterial culture growth rate throughout the entire biokinetic temperature range. Journal of 620 Bacteriolgy 154, 1222-1226. 621
Reed, M., Aamo, O.M., Daling, P.S., 1995. Quantitative analysis of alternate oil spill response 622 strategies using OSCAR. Spill Science and Technology, Pergamon Press 2, 67-74. 623
Reed, M., Johansen, Ø., Brandvik, P.J., Daling, P., Lewis, A., Fiocco, R., Mackay, D., Prentki, 624 R., 1999. Oil spill modeling towards the close of the 20th century: overview of the state of the 625 art. Spill Science and Technology Bulletin 5, 3-16. 626
Reed, M., Singsaas, I., Daling, P., Faksness, L.-G., Brakstad, O.G., Hetland, B.A., Hokstad, J.N., 627 2000. Modeling the water-accomodated fraction in OSCAR2000. Proceedings 2000, 628 International Oil Spill Conference, pp. 1083-1091. 629
Robador, A., Brüchert, V., Jørgensen, B.B., 2009. The impact of temperature change on the 630 activity and community composition of sulfate-reducing bacteria in arctic versus temperate 631 marine sediments. Environmental Microbiology 11, 1692-1703. 632
Ruiz-González, C., Lefort, T., Galí, M., Sala, M.M., Sommaruga, 627 R., Simó, R., Gasol, J.M., 633 2012. Seasonal patterns in the sunlight sensitivity of bacterioplankton from Mediterranean 634 surface coastal waters. FEMS Microbiology Ecology 79, 661–674. 635
Sand-Jensen, K., Pedersen, N.L., Søndergaard, M., 2007. Bacterial metabolism in small 636 temperate streams under contemporary and future climates. Freshwater Biology 52, 2340-2353. 637
Sapp, M., Wichels, A., Wiltshire, K. H., Gerdts, G., 2007. Bacterial community dynamics during 638 the winter–spring transition in the North Sea. FEMS Microbiology Ecology 59:3, 622–637. 639
Sebastião, P., Soares, C.G., 1995. Modeling the fate of oil spills at sea. Spill Science and 640 Technology Bulletin 2, 121-131. 641
Sintes, E., Witte, H., Stodderegger, K., Steiner, P., Herndl, G.J., 2013. Temporal dynamics in the 642 free-living bacterial community composition in the coastal North Sea. FEMS Microbiology 643 Ecology 83:2, 413-424. 644
Staley, J.T., 2010. Cycloclasticus: A Genus of Marine Polycyclic Aromatic Hydrocarbon 645 Degrading Bacteria. in: Timmis, K.N. (ed) Handbook of Hydrocarbon and Lipid Microbiology, 646 Springer, Berlin , Heidelberg, ISBN: 978-3-540-77584-3, p. 1782-1785. 647
Stewart, P.S., Tedaldi, D.J., Lewis, A.R., Goldman, E., 1993. Biodegradation rates of crude oil in 648 seawater. Water Environment Research 65, 845-848. 649
MANUSCRIP
T
ACCEPTED
ACCEPTED MANUSCRIPT
20
Tarpgaard, I.H., Boetius, A. and Finster, K., 2006. Desulfobacter psychrotolerans sp. nov., a new 650 psychrotolerant sulfate-reducing bacterium and descriptions of its physiological response to 651 temperature changes. Antonie van Leeuwenhoek 89, 109-124. 652
Thérivel, R., Minas, P., 2002. Ensuring effective sustainability appraisal, Impact Assessment and 653 Project Appraisal, 20:2, 81-91 654
Valentine, D.L., Mezić, I., Maćešić, S., Črnjarić-Žic, N., Ivić, S., Hogan, P.J., Fonoberov, V.A., 655 Loire, S., 2012. Dynamic autoinoculation and the microbial ecology of a deep water hydrocarbon 656 irruption. Proceedings of the National Academy of Sciences Early Edition, doi: 657 10.1073/pnas.1108820109. 658
Van Stempvoort, D., Biggar, K., 2008. Potential for bioremediation of petroleum hydrocarbons 659 in groundwater under cold climate conditions: A review. Cold Regions Science and Technology 660 53, 16-41. 661
Venosa, A.D., Holder, E.L., 2007. Biodegradability of dispersed crude oil at two different 662 temperatures. Marine Pollution Bulletin 54, 545-553. 663
Yakimov, M.M., Timmis, K.N. and Golyshin, P.N., 2007. Obligate oil-degrading marine 664 bacteria. Current Opinion in Biotechnology 18:3, 257-266. 665
Yassine, M.H., Suidan, M.T., Venosa, A.D., 2013. Microbial kinetic model for the degradation 666 of poorly soluble organic materials. Water Research 47, 1585-95. 667
ZoBell, C.E., Grant, C.W., Haas, H.F., 1943. Marine microorganisms which oxidize petroleum 668 hydrocarbons. Bulletin of the American Association of Petroleum Geologists 27, 1175-1193. 669
Zobell, C.E., 1946. Action of microörganisms on hydrocarbons. Bacteriology Reviews 10, 1-49. 670
Zobell, C.E., 1963. The occurrence, effects, and fate of oil polluting the sea. Air Water Pollution 671 7, 173-197. 672
Zhong, Z., You, F., 2011. Oil spill response planning with consideration of physicochemical 673 evolution of the oil slick: A multiobjective optimization approach. Computers and Chemical 674 Engineering 35, 1614– 1630. 675

MANUSCRIP
T
ACCEPTED
ACCEPTED MANUSCRIPT
Highlights for the submitted mini-review entitled: Estimation of hydrocarbon biodegradation rates in marine environments: A critical review of the Q10 approach
• The Q10 approach for estimating biodegradation rates is discussed
• High variation in Q10 values is attributed to indirect effects of temperature • Bioavailability and bacteria number influences Q10 in temperature controlled tests • Choosing one universal Q10 is neither feasible nor anticipated • Temperature compensation based biodegradation rate predictions are questionable

MANUSCRIP
T
ACCEPTED
ACCEPTED MANUSCRIPT
Oil typeC0
Inoculum Season MethodT(Q10)
Q10 Reference(gC/m3) (⁰C)
Bunker C crude 850
enrichment culture #1
Winter G
5 2.8Mulkins-Phillips and Stewart,
1974enrichment culture #2 5 3.4
enrichment culture #3 5 2.7
Sweden crude 6800 fresh seawater
Autumn
R 5 >2.7
Atlas and Bartha, 1972
10 3.8R
G 5 5.7
G 10 1.5
Winter
R 5 3.3
10 3.2R
G 5 2.3
G 10 1.2
Kuwait crude 340 fresh seawater N/A R 4 2.7 Gibbs, 1974
Solvent mix
8500 fresh seawater N/A G 10
1.9
Atlas, 1975
Sweden crude 4.5
South Louisiana 1.5
Lagomedio 1.7
Prudhoe Bay 1.3
Mirando Humble 1.6
Kuwait residues 4590beach gravel and fresh
seawaterN/A R
6 3.3Gibbs and Davis, 1976
11 2.1
Bunker C crude 17 fresh seawaterSummer
R4 2.4
Minas and Gunkel, 1995Winter 4 2.4
weathered Alaska North
slope8500 enrichment culture N/A
GC 6 1.3Garrett et al., 2003
G 6 1.5
crude oil from North Sea field 680 enrichment culture N/A B5 4.4
Deppe et al., 200515 1.2
Statfjord crude 0.786 acclimated seawater Winter GC 0 16.2 Brakstad and Bonaunet, 2006
Prudhoe Bay crude 19 enrichment culture N/AGC alkanes 5 1.8
Venosa et al., 2007GC PAHs 5 1.9
weathered Forties crude 765 fresh estuary water Winter GC 4 1.9 Coulon et al., 2007
crude oil 680 fresh seawater Spring GC
4 1.1Delille et al., 2009
diesel oil 4 1.3
Table 1 for the manuscript: “Estimation of hydrocarbon biodegradation rates in marine environments: A critical review of the Q10 approach”
MANUSCRIP
T
ACCEPTED
ACCEPTED MANUSCRIPT
Figure 1 for the manuscript “Estimation of hydrocarbon biodegradation rates in marine environments: A critical review of the Q10 approach”

MANUSCRIP
T
ACCEPTED
ACCEPTED MANUSCRIPT
Figure 2 for the manuscript “Estimation of hydrocarbon biodegradation rates in marine environments: A critical review of the Q10 approach”

MANUSCRIP
T
ACCEPTED
ACCEPTED MANUSCRIPT
Figure 3 for the manuscript “Estimation of hydrocarbon biodegradation rates in marine environments: A critical review of the Q10 approach”

MANUSCRIP
T
ACCEPTED
ACCEPTED MANUSCRIPT
Table S1 for the manuscript “Estimation of hydrocarbon biodegradation rates in marine environments: A critical review of the Q10 approach”
First exposure Second exposure Temperature (°C) # rmax (mg l-1 d-1) tlag (d) rmax (mg l-1 d-1) tlag (d)
1 0.78 12.2 0.92 0.0 2 1.2 15.5 0.95 0.0 3 1.6 12.0 1.6 0.0 4 1.3 9.5 1.6 0.0 5 0.63 14.6 1.6 0.0
Mean 1.1 12.7 1.3 0.0
0.5
SD 0.39 2.4 0.37 0.0 1 2.9 7.9 8.6 0.0 2 3.2 8.0 7.3 0.0 3 2.7 7.4 8.0 0.0 4 3.4 8.5 6.9 0.0 5 3.1 6.3 6.4 0.0
Mean 3.1 7.6 7.4 0.0
5
SD 0.28 0.8 0.87 0.0 1 6.2 3.1 22.8 0.0 2 7.0 4.4 12.9 0.0 3 7.2 4.5 13.1 0.0 4 7.2 3.9 12.5 0.0 5 - - - -
Mean 6.9 4.0 15.3 0.0
10
SD 0.48 0.6 5.0 0.0 1 9.9 3.4 30.9 0.0 2 7.4 3.4 21.8 0.0 3 7.2 3.2 26.7 0.0 4 10.6 3.0 25.5 0.0 5 10.0 3.3 24.1 0.0
Mean 9.0 3.3 25.8 0.0
15
SD 1.6 0.2 3.4 0.0
MANUSCRIP
T
ACCEPTED
ACCEPTED MANUSCRIPT
Table S2 for the manuscript “Estimation of hydrocarbon biodegradation rates in marine environments: A critical review of the Q10 approach”
First exposure Second exposure Temperature (°C) # rmax (mg l-1 d-1) tlag (d) rmax (mg l-1 d-1) tlag (d)
1 11.5 17.7 1.15 15.5 2 19.6 12.0 1.28 13.5
Mean 15.5 14.8 1.22 14.5 0.5
SD 5.7 4.0 0.09 1.4 1 16.3 5.6 20.4 4.6 2 29.2 5.8 21.5 2.7
Mean 22.7 5.7 20.9 3.7 5
SD 9.1 0.2 0.74 1.3 1 36.2 5.0 18.2 0.7 2 36.0 3.7 34.0 1.2
Mean 36.1 4.3 26.1 1.0 10
SD 0.1 0.9 11.1 0.4 1 31.8 2.6 33.8 0.35 2 33.4 2.8 25.5 0.39
Mean 32.6 2.7 29.7 0.37 15
SD 1.1 0.2 5.8 0.03

MANUSCRIP
T
ACCEPTED
ACCEPTED MANUSCRIPT
Table S3 for the manuscript “Estimation of hydrocarbon biodegradation rates in marine environments: A critical review of the Q10 approach”
Q10 Exposure C-source T(Q10) (°C) min average max
0.5 3.9 6.3 11.5 Oil 5.0 2.1 2.9 4.0 0.5 1.8 2.3 3.1
First Na-benzoate
5.0 1.1 1.4 2.1 0.5 7.8 11.8 24.9 Oil 5.0 2.5 3.5 4.8 0.5 - - -
Second Na-benzoate
5.0 1.2 1.4 1.7
MANUSCRIP
T
ACCEPTED
ACCEPTED MANUSCRIPT
Table S4 for the manuscript “Estimation of hydrocarbon biodegradation rates in marine environments: A critical review of the Q10 approach”
Q10 Exposure C-source T(Q10) (°C) min average max
0.5 2.1 3.2 5.0 Oil 5.0 1.8 2.3 2.9 0.5 2.4 3.4 4.8
First Na-benzoate
5.0 2.0 2.1 2.3 0.5 N/A N/A N/A Oil 5.0 N/A N/A N/A 0.5 - - -
Second Na-benzoate
5.0 6.9 10.0 13.1


