Embed Size (px)
Citation preview
TECHNIQUES FOR MOLECULAR ANALYSIS
ESTs, cDNAmicroarrays, and gene expression profiling: toolsfor dissecting plant physiology and development
Rob Alba1, Zhangjun Fei1, Paxton Payton1,†, Yang Liu1, Shanna L. Moore1,‡, Paul Debbie1, Jonathan Cohn2, Mark D’Ascenzo1,
Jeffrey S. Gordon1, Jocelyn K. C. Rose2, Gregory Martin1,3, Steven D. Tanksley4, Mondher Bouzayen5, Molly M. Jahn4 and
Jim Giovannoni1,6,*
1Boyce Thompson Institute for Plant Research, Cornell University Campus, Ithaca, NY, USA,2Department of Plant Biology, Cornell University, Ithaca, NY, USA,3Department of Plant Pathology, Cornell University, Ithaca, NY, USA,4Department of Plant Breeding, Cornell University, Ithaca, NY, USA,5Institut National de la Recherche Agronomique/Institut National Polytechnique-Ecole Nationale Superieure Agronomique,
Tolouse, France, and6USDA-ARS Plant, Soil, and Nutrition Laboratory, Ithaca, NY, USA
Received 16 March 2004; revised 23 June 2004; accepted 24 June 2004.*For correspondence (fax þ607 254 2958; e-mail [email protected]).†Present address: USDA-ARS Cropping Systems Research Laboratory, Lubbock, TX, USA.‡Present address: Department of Plant Breeding, Cornell University, Ithaca, NY, USA.
Summary
Gene expression profiling holds tremendous promise for dissecting the regulatory mechanisms and
transcriptional networks that underlie biological processes. Here we provide details of approaches used by
others and ourselves for gene expression profiling in plants with emphasis on cDNA microarrays and
discussion of both experimental design and downstream analysis. We focus on methods and techniques
emphasizing fabrication of cDNA microarrays, fluorescent labeling, cDNA hybridization, experimental design,
and data processing. We include specific examples that demonstrate how this technology can be used to
further our understanding of plant physiology and development (specifically fruit development and ripening)
and for comparative genomics by comparing transcriptome activity in tomato and pepper fruit.
Keywords: expressed sequence tags, expression profiling, transcriptome, digital expression analysis,
genomics.
Introduction
Typical approaches to gene identification and functional
characterization have and continue to involve protein char-
acterization, peptide sequence determination, and identifi-
cation of the corresponding DNA sequence. More recently,
expressed sequence tags (ESTs), microarrays, large-scale
gene expression (transcriptome) profiling, and associated
informatics technologies are rapidly becoming common-
place in the plant sciences. These ‘genomic’ approaches
typically take advantage of technologies for characterizing
large numbers of nucleic acid sequences, bioinformatics,
and the expanding collection of nucleic acid sequence data
from diverse taxa. ‘Systems biology’ attempts to combine
large-scale DNA sequence, gene expression, protein, meta-
bolite, genotype, and/or phenotype data to develop a com-
prehensive understanding of biological process (see special
issue of Plant Physiology 132, 2003 for numerous articles).
Combination of these approaches also makes it possible to
extract more meaningful functional information as new DNA
sequence data are generated (see Rose et al., this issue).
While the potential of this technology is enormous, the
utility of large-scale expression data is not always well
understood, nor are the limitations in analysis and
ª 2004 Blackwell Publishing Ltd 697
The Plant Journal (2004) 39, 697–714 doi: 10.1111/j.1365-313X.2004.02178.x
interpretation. Comprehensive transcriptome analysis
should make it possible to identify and dissect complex
genetic networks that underlie processes critical to physiol-
ogy, development, and response. For example, gene regu-
latory networks have been inferred using microarray data
obtained from a variety of organisms (Hashimoto et al.,
2004; de Hoon et al., 2003; Shmulevich et al., 2003), and it is
also possible to correlate these genetic networks with
metabolic processes (de la Fuente et al., 2002; Mendes,
2001). Gene networks are also being dissected in plants for
processes ranging from seed filling to cold tolerance (Fowler
and Thomashow, 2002; Ruuska et al., 2002). Further charac-
terization of gene networks in plants will help us to
understand the molecular basis of plant processes and
identify new targets for manipulating biochemical, physio-
logical, and developmental processes in crop species.
Nevertheless, a comprehensive characterization of the tran-
scriptome is not a prerequisite for studying every biological
question and the value of such an approach can only be
weighed in light of a clearer understanding of the possibil-
ities and caveats of transcriptome profiling. Here we provide
insights into transcriptome profiling based on cDNA
sequences as this technology presently represents one of
the more accessible avenues for developing comprehensive
gene expression data.
Expressed sequence tags: tools for gene discovery and
expression analysis
Expressed sequence tags are created by sequencing the 5¢and/or 3¢ ends of randomly isolated gene transcripts that
have been converted into cDNA (Adams et al., 1991). Despite
the fact that a typical EST represents only a portion
(approximately 200–900 nucleotides) of a coding sequence,
en masse this partial sequence data is of substantial utility.
For example, EST collections are a relatively quick and
inexpensive route for discovering new genes (Bourdon
et al., 2002; Rogaev et al., 1995), confirm coding regions in
genomic sequence (Adams et al., 1991), create opportunities
to elucidate phylogenetic relationships (Nishiyama et al.,
2003), facilitate the construction of genome maps (Paterson
et al., 2000), can sometimes be interpreted directly for tran-
scriptome activity (Ewing et al., 1999; Ogihara et al., 2003;
Ronning et al., 2003), and provide the basis for development
of expression arrays also known as DNA chips (Chen et al.,
1998; DeRisi et al., 1996; Shalon et al., 1996; Shena et al.,
1995). In addition, high-throughput technology and EST
sequencing projects can result in identification of significant
portions of an organism’s gene content and thus can serve
as a foundation for initiating genome sequencing projects
(van der Hoeven et al., 2002). Currently there are nearly
20 million ESTs in the NCBI public collection, more than
4 million of which derive from plants (http://www.ncbi.nlm.
nih.gov/dbEST/). With many large-scale EST sequencing
projects in progress and new projects being initiated, the
number of ESTs in the public domain will continue to
increase in the coming years. The sheer volume of this
sequence data has and will continue to require new com-
puter-based tools for systematic collection, organization,
storage, access, analysis, and visualization of this data. Not
surprisingly, despite the relative youth of this field, an
impressive diversity of bioinformatics resources exists for
these purposes. Table 1 lists a portion of these resources; a
more comprehensive review can be found in Vision and
McLysaght (2003).
As sequence and annotation data continue to accumulate,
public databases for genomic analysis will become
increasingly valuable to the plant science community. The
Arabidopsis Information Resource (TAIR; http://www.
arabidopsis.org/home.html), the Salk Institute Genomic
Analysis Laboratory (SIGnAL; http://signal.salk.edu/), the
Solanaceae Genomics Network (SGN; http://sgn.
cornell.edu/), and GRAMENE (http://www.gramene.org/)
serve well as examples of these on-line resources. In addition
to a variety of analysis tools and a wealth of microarray data,
TAIR contains sequence data for the entire Arabidopsis
genome that is easily accessible via query and FTP tools. All
120 Mb of this sequence data can also be obtained from the
SIGnAL database, as can sequence data for more than
11 000 full-length cDNA sequences, and more than 10 000
publicly available (full-length) ORF clones. SIGnAL also
curates a mapped collection of more than 300 000 sequenced
indexed T-DNA insertion mutants, most of which are pub-
licly available through the Arabidopsis Biological Resource
Center (ARBC; http://www.biosci.ohio-state.edu/�plantbio/
Facilities/abrc/abrchome.htm). SGN is dedicated to the bio-
logy of Solanaceae species, including tomato, potato,
tobacco, eggplant, pepper, and petunia. This database
contains curated sequence data derived from nearly
300 000 ESTs, extensive mapping data for the tomato
genome, in addition to mapping data for the genomes of
potato and eggplant. GRAMENE is a curated, open-source
database dedicated to the biology of grasses, including rice,
maize, Sorghum, barley, and wheat. The primary objective
of GRAMENE is to facilitate cross-species homology rela-
tionships (via comparative genome analysis) among mono-
cotyledonous species. In addition to sequence and mapping
data, GRAMENE also contains a variety of analysis tools, an
extensive Ontology database, a QTL database, and a data-
base for mutant genes in rice.
With databases such as these, and advances in computa-
tional molecular biology and biostatistics, it is possible to
mine and analyze large EST datasets efficiently and exhaust-
ively (i.e. digital expression profiling; Ewing et al., 1999;
Ogihara et al., 2003; Ronning et al., 2003). Particularly
important is the fact that this type of data mining can be
used to corroborate and extend upon expression data
obtained from microarray experiments. Using such a
698 Rob Alba et al.
ª Blackwell Publishing Ltd, The Plant Journal, (2004), 39, 697–714
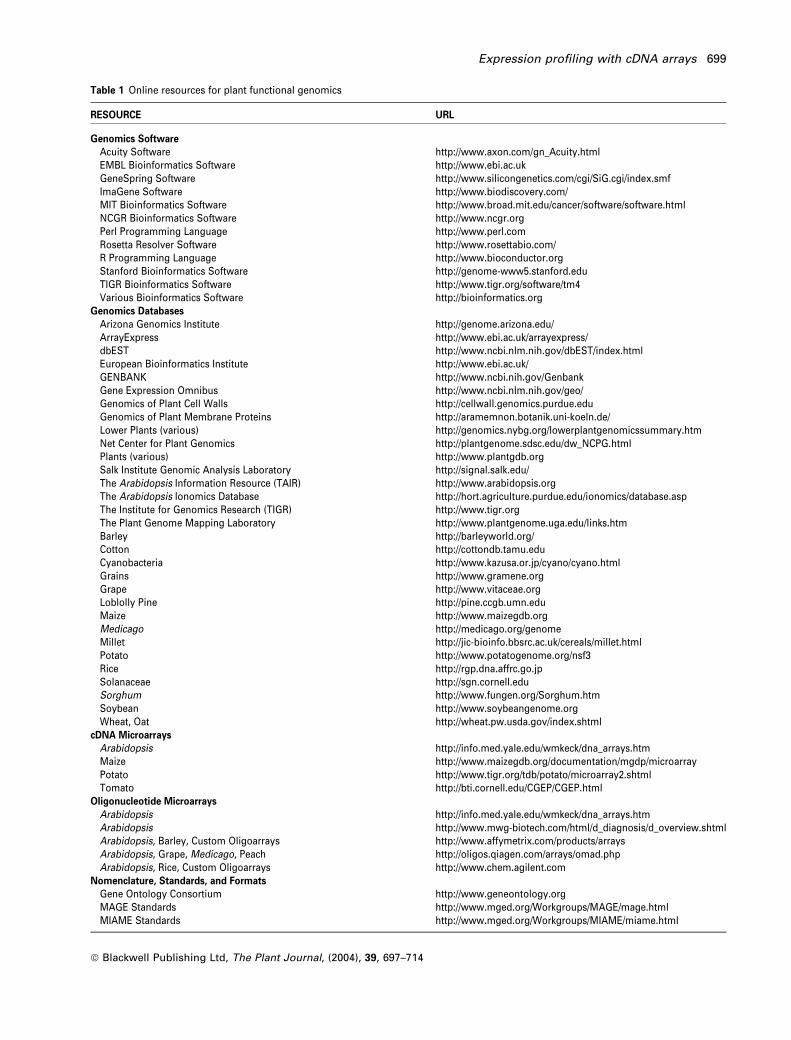
Table 1 Online resources for plant functional genomics
RESOURCE URL
Genomics Software
Acuity Software http://www.axon.com/gn_Acuity.htmlEMBL Bioinformatics Software http://www.ebi.ac.ukGeneSpring Software http://www.silicongenetics.com/cgi/SiG.cgi/index.smfImaGene Software http://www.biodiscovery.com/MIT Bioinformatics Software http://www.broad.mit.edu/cancer/software/software.htmlNCGR Bioinformatics Software http://www.ncgr.orgPerl Programming Language http://www.perl.comRosetta Resolver Software http://www.rosettabio.com/R Programming Language http://www.bioconductor.orgStanford Bioinformatics Software http://genome-www5.stanford.eduTIGR Bioinformatics Software http://www.tigr.org/software/tm4Various Bioinformatics Software http://bioinformatics.org
Genomics Databases
Arizona Genomics Institute http://genome.arizona.edu/ArrayExpress http://www.ebi.ac.uk/arrayexpress/dbEST http://www.ncbi.nlm.nih.gov/dbEST/index.htmlEuropean Bioinformatics Institute http://www.ebi.ac.uk/GENBANK http://www.ncbi.nih.gov/GenbankGene Expression Omnibus http://www.ncbi.nlm.nih.gov/geo/Genomics of Plant Cell Walls http://cellwall.genomics.purdue.eduGenomics of Plant Membrane Proteins http://aramemnon.botanik.uni-koeln.de/Lower Plants (various) http://genomics.nybg.org/lowerplantgenomicssummary.htmNet Center for Plant Genomics http://plantgenome.sdsc.edu/dw_NCPG.htmlPlants (various) http://www.plantgdb.orgSalk Institute Genomic Analysis Laboratory http://signal.salk.edu/The Arabidopsis Information Resource (TAIR) http://www.arabidopsis.orgThe Arabidopsis Ionomics Database http://hort.agriculture.purdue.edu/ionomics/database.aspThe Institute for Genomics Research (TIGR) http://www.tigr.orgThe Plant Genome Mapping Laboratory http://www.plantgenome.uga.edu/links.htmBarley http://barleyworld.org/Cotton http://cottondb.tamu.eduCyanobacteria http://www.kazusa.or.jp/cyano/cyano.htmlGrains http://www.gramene.orgGrape http://www.vitaceae.orgLoblolly Pine http://pine.ccgb.umn.eduMaize http://www.maizegdb.orgMedicago http://medicago.org/genomeMillet http://jic-bioinfo.bbsrc.ac.uk/cereals/millet.htmlPotato http://www.potatogenome.org/nsf3Rice http://rgp.dna.affrc.go.jpSolanaceae http://sgn.cornell.eduSorghum http://www.fungen.org/Sorghum.htmSoybean http://www.soybeangenome.orgWheat, Oat http://wheat.pw.usda.gov/index.shtml
cDNA Microarrays
Arabidopsis http://info.med.yale.edu/wmkeck/dna_arrays.htmMaize http://www.maizegdb.org/documentation/mgdp/microarrayPotato http://www.tigr.org/tdb/potato/microarray2.shtmlTomato http://bti.cornell.edu/CGEP/CGEP.html
Oligonucleotide Microarrays
Arabidopsis http://info.med.yale.edu/wmkeck/dna_arrays.htmArabidopsis http://www.mwg-biotech.com/html/d_diagnosis/d_overview.shtmlArabidopsis, Barley, Custom Oligoarrays http://www.affymetrix.com/products/arraysArabidopsis, Grape, Medicago, Peach http://oligos.qiagen.com/arrays/omad.phpArabidopsis, Rice, Custom Oligoarrays http://www.chem.agilent.com
Nomenclature, Standards, and Formats
Gene Ontology Consortium http://www.geneontology.orgMAGE Standards http://www.mged.org/Workgroups/MAGE/mage.htmlMIAME Standards http://www.mged.org/Workgroups/MIAME/miame.html
Expression profiling with cDNA arrays 699
ª Blackwell Publishing Ltd, The Plant Journal, (2004), 39, 697–714
strategy we have analyzed a tomato EST dataset represent-
ing 152 635 ESTS to gain insights into statistically significant
changes in differential expression among diverse plant
tissues representing a range of developmental programs
and biological responses (Fei et al., 2004). A website
presenting this data and a number of online analysis tools
can be viewed at http://ted.bti.cornell.edu/.
By clustering genes according to their relative abundance
in the various EST libraries, expression patterns of genes
across various tissues were generated and genes with
similar patterns were grouped. In addition, tissues them-
selves were clustered for relatedness based on relative gene
expression as a means of validating the integrity of the EST
data as representative of relative gene expression. EST
collections from other species (e.g. Arabidopsis) were also
characterized to facilitate cross-species comparisons where
possible (http://ted.bti.cornell.edu/). With the rapid expan-
sion of available EST data (e.g. http://www.arabidopsis.org;
http://www.gramene.org; http://www.medicago.org; http://
www.sgn.cornell.edu; http://www.tigr.org), opportunities
for digital analysis of gene expression will continue to
expand.
Expressed sequence tag collections also have limitations
when being used for genomic analysis from the perspec-
tives of accurate representation of genome content, gene
sequence, and as windows into transcriptome activity. The
fact that ESTs reflect actively transcribed genes makes it
difficult to use EST sequencing alone as a means of
capturing the majority of an organism’s gene content.
Additionally, and of great importance, is the fact that a
fraction of this sequence data is erroneous. Some of these
sequence errors derive from the imperfect nature of the
enzymes used to generate cDNA libraries and sequence data
(Bebenek et al., 1989; Echols and Goodman, 1991; Roberts
et al., 1989). At present these sequence errors cannot be
completely avoided, but multiple sequence reads through
the same gene makes it possible to minimize this type of
artifact. EST collections, even when not normalized or
subtracted, are not perfectly representative of the mRNA
populations they originate from. For example, low-abun-
dance transcripts are unlikely to be represented fully in all
EST collections. Misrepresentation can also originate from
transcripts with atypical sequence features (e.g. extremely
long transcripts, RNA secondary structures) that impair
reverse transcription and/or subsequent cDNA cloning. A
third source of error in EST collections can originate during
processing of sequence data. This type of sequence error
derives from the imperfect technology and algorithms used
for base calling, sequence annotation, and contig assembly.
Finally, EST sequence data are also prone to human errors
during storage, handling, replication, and management of
EST collections. Consequently, re-sequencing ESTs of inter-
est is an important means of validation prior to further
characterization. Despite these limitations, it has been
shown that EST databases can be a valid and reliable source
of gene expression data (Ewing et al., 1999; Ogihara et al.,
2003; Ronning et al., 2003).
Gene expression profiling
A variety of methods have been developed for quantifying
mRNA abundance in plant tissues. Although the established
and reliable method of RNA gel-blot analysis can be quite
sensitive and allows for the accurate quantification of spe-
cific transcripts (Hauser et al., 1997), this method is not
readily adapted to genome-scale analysis. Differential dis-
play (Liang and Pardee, 1992; Welsh et al., 1992) uses low-
stringency PCR, a combinatorial primer set, and gel elec-
trophoresis to amplify and visualize larger populations of
cDNAs representing mRNA populations of interest. Differ-
ential display has important advantages when compared
with scale-limited approaches such as RNA-blot analysis
(e.g. minimal mRNA is required, parallel profiling of mRNA
populations is feasible), yet this technique suffers from
output that is not quantitative and positives are often diffi-
cult to clone and confirm (Debouck, 1995; Ding and Cantor,
2004). More recently the principles of AFLP� have been ap-
plied to cDNA templates (i.e. cDNA-AFLP; Bachem et al.,
1996, 1998) and this approach has been used to identify
differentially expressed genes involved in a variety of plant
processes (Bachem et al., 2001; Dellaqi et al., 2000; Durrant
et al., 2000; Qin et al., 2000). This technique offers several
advantages over more traditional approaches. Of particular
importance is the fact that poorly characterized genomes
can be investigated in a high-throughput manner. Because
the stringency of cDNA-AFLP PCR reactions is quite high
(which is not the case with differential display) the fidelity of
the cDNA-AFLP system allows much greater confidence in
acquired data and differences in the intensities of amplified
products can be informative (Bachem et al., 1996). In addi-
tion, this technique allows a wide variety of tissue types,
developmental stages, or time points to be compared con-
currently. As with the other profiling methods described
here, the sensitivity of cDNA-AFLP is only limited by the
ability of cDNA libraries to capture low-abundance tran-
scripts. Sequencing of cDNA libraries is a more direct and
comprehensive approach to gene expression profiling
(Adams et al., 1991; Okubo et al., 1992), but this method
requires substantial resources for cloning and sequencing,
and is less sensitive to low-abundance transcripts as
mentioned above. Serial analysis of gene expression (i.e.
SAGE; Velculescu et al., 1995) is an elegant technique that
combines differential display and cDNA sequencing
approaches, and it has the advantage of being quantita-
tive. Unfortunately, SAGE is laborious, requires an exten-
sive foundation of sequence information, and suffers from
some of the same concerns regarding low-abundance
transcripts.
700 Rob Alba et al.
ª Blackwell Publishing Ltd, The Plant Journal, (2004), 39, 697–714
Microarrays take advantage of existing EST collections
and genome sequence data (and are thus limited by the
availability of the same), robotic instrumentation for mini-
aturization, and fluorescent dyes for simultaneously detect-
ing nucleic acid abundance in RNA populations derived from
multiple samples. Populations of fluorescent cDNA targets
(following the definition of target and probe adopted in the
The Chipping Forecast, 1999) representing the mRNA pop-
ulations of interest are queried via hybridization with a large
number of probes that have been immobilized on a suitable
substrate (Chen et al., 1998; DeRisi et al., 1996; Shalon et al.,
1996; Shena et al., 1995). The arrays themselves are com-
posed of collections of DNA sequences (typically PCR
products, cDNAs, or oligonucleotides) that have been prin-
ted as a microscopic grid of catalogued features by a high-
fidelity robotic system. This technique for gene expression
profiling has important advantages when compared with
RNA-blot analysis, cDNA sequencing, differential display,
AFLP analysis, and SAGE. Most importantly, it can measure
tens-of-thousands of different mRNA transcripts in parallel,
it is semi-quantitative, and it is sensitive to low-abundance
transcripts that are represented on a given array. This last
point is worth emphasizing in that microarrays are inher-
ently limited to their contained sequences, while so-called
‘open architecture’ systems such as differential display and
SAGE can capture information for any sequence that is
expressed at a level sufficiently above the level of detection.
In those instances where complete genome sequence is
available, microarrays make it possible to monitor the
expression of an entire genome in a single experiment (Gill
et al., 2002; Jiang et al., 2001; Wang et al., 2003). Despite this
potential, predominant uses of microarrays facilitate analy-
sis of significant, yet limited, subsets of the target genome.
When used for time-course analyses, analyses of transcrip-
tome alterations caused by genetic lesions, or comparison
of transcript accumulation in similar tissues from closely
related species (Figure 1), the potential of microarrays for
gene expression profiling is not only enormous, but is also
just beginning to be realized.
Microarray technology
Two different types of microarrays have become common-
place: cDNA microarrays and oligonucleotide microarrays.
Both have notable and distinct advantages. For example,
cDNA arrays can be prepared directly from existing cDNA
libraries, a large number of which are in the public domain.
Thus, fabrication of cDNA arrays is only dependent upon
availability of ordered clone collections, and appropriate
arraying and scanning instrumentation (Clark et al., 1999;
Drmanac and Drmanac, 1999; Eisen and Brown, 1999). Once
a set of corresponding PCR products has been generated,
arrays can be created in multiple versions containing the
entire set of available sequences or subsets of sequences
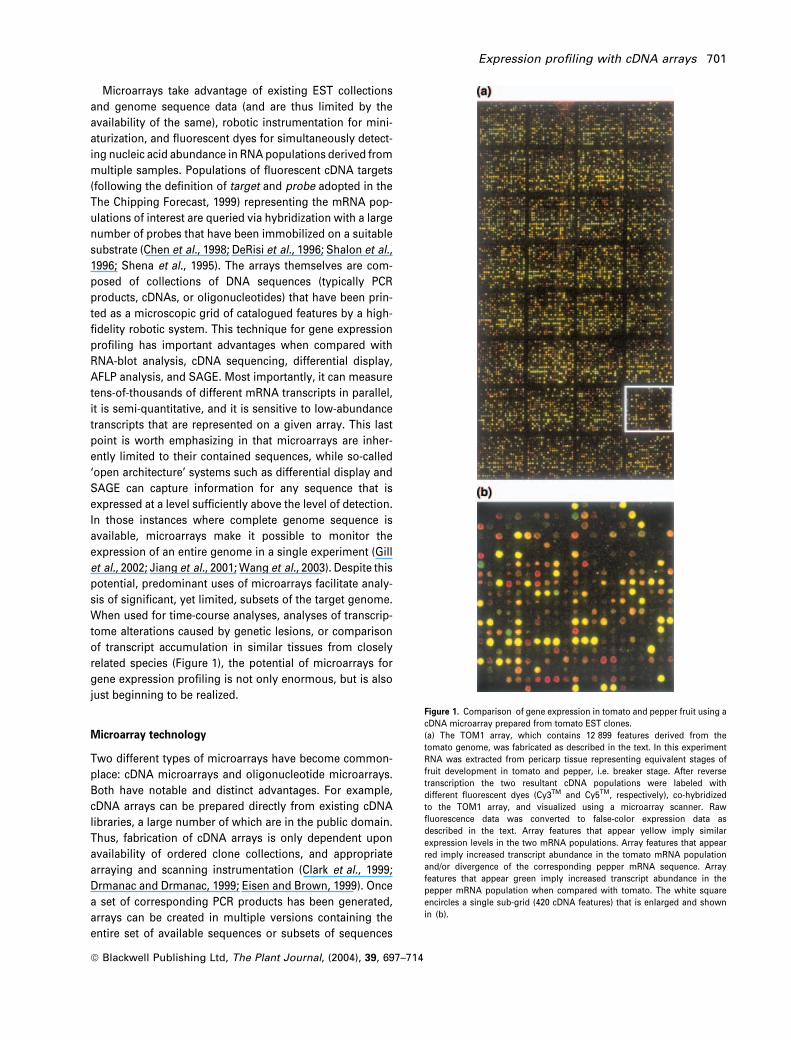
Figure 1. Comparison of gene expression in tomato and pepper fruit using a
cDNA microarray prepared from tomato EST clones.
(a) The TOM1 array, which contains 12 899 features derived from the
tomato genome, was fabricated as described in the text. In this experiment
RNA was extracted from pericarp tissue representing equivalent stages of
fruit development in tomato and pepper, i.e. breaker stage. After reverse
transcription the two resultant cDNA populations were labeled with
different fluorescent dyes (Cy3TM and Cy5TM, respectively), co-hybridized
to the TOM1 array, and visualized using a microarray scanner. Raw
fluorescence data was converted to false-color expression data as
described in the text. Array features that appear yellow imply similar
expression levels in the two mRNA populations. Array features that appear
red imply increased transcript abundance in the tomato mRNA population
and/or divergence of the corresponding pepper mRNA sequence. Array
features that appear green imply increased transcript abundance in the
pepper mRNA population when compared with tomato. The white square
encircles a single sub-grid (420 cDNA features) that is enlarged and shown
in (b).
Expression profiling with cDNA arrays 701
ª Blackwell Publishing Ltd, The Plant Journal, (2004), 39, 697–714
resulting in smaller ‘boutique’ arrays suitable for specific
research applications (e.g. regulatory-, pathway-, stage- or
response-specific arrays; Jiao et al., 2003). Smaller ‘bou-
tique’ arrays are also useful for reducing a statistical prob-
lem of scale (i.e. large numbers of features and low number
of replications common in microarray experiments). Here, a
large array might be used to identify differentially expressed
genes of interest, which could then be re-arrayed as a
smaller array and used in subsequent experiments. One
benefit of this approach is that it can free up resources that
can be used to increase experimental replication and there-
by increase precision. Another advantage of cDNA arrays is
that they can be used in ‘two-color’ co-hybridization experi-
ments that allow direct comparisons of transcript abun-
dance in two mRNA populations of interest. Although this
strategy generates comparative expression ratios instead of
measuring absolute expression levels, it is effective for
comparative expression profiling and reduces experimental
variation that arises in microarray data collected from
different chips (Aharoni and Vorst, 2001).
Like cDNA arrays, oligonucleotides can be printed using
robotic instrumentation and (once appropriate oligonucleo-
tides have been synthesized) sub-arrays for specific research
applications can be fabricated easily. The main limitations in
development of oligonucleotide arrays are the costs asso-
ciated with sequence selection and oligonucleotide synthe-
sis. As these costs continue to decline oligo-based arrays are
likely to become more predominant in the near future
because they offer a number of important advantages over
cDNA arrays. One such advantage is the fact that oligo-
based arrays can be fabricated using microfluidic technol-
ogy, which utilizes light to direct the synthesis of short
oligonucleotides onto a suitable matrix (i.e. photolithogra-
phy; Fodor et al., 1991, 1993; Pease et al., 1994). Photoli-
thography is particularly useful because it allows for the
fabrication of extremely high-density arrays (>300 000 ele-
ments/1.28 cm2, Lipshutz et al., 1999). Another important
advantage is that the probes in an oligonucleotide array are
designed to represent unique gene sequences such that
cross-hybridization between related gene sequences
(e.g. genes belonging to a gene family or genes with
common functional domains) is minimized to a degree
dependent upon the completeness of available sequence
information. Cross-hybridization between homologous se-
quences continues to be problematic when using cDNA
arrays. Furthermore, the array elements in an oligonucleo-
tide array are typically designed to have uniform length,
uniform melting temperatures, and to be of uniform con-
centrations, which can significantly reduce experimental
variation and thereby increase statistical power and preci-
sion. Thus, oligonucleotide arrays should be considered
seriously when initiating new microarray projects and we
direct the reader towards the works of Aharoni and Vorst
(2001), Bolstad et al. (2003), Kane et al. (2000), Kuo et al.
(2002), Lockhart et al. (1996), Wodicka et al. (1997), Yuen
et al. (2002), and Mah et al. (2004). The primary dis-
advantage of oligo-based arrays is that oligonucleotide sets
can be very expensive because of the extensive sequence
data and computational input required for designing
gene-specific oligonucleotide probes. Currently, a single
oligonucleotide chip is often three to five times more
expensive than the cost of a single cDNA chip (‘printed’
cDNA arrays typically cost between $100 and $200 per chip).
A common limitation of all array approaches is the
requirement of significant RNA for the preparation of
fluorescently labeled targets. For this and other reasons,
methods for generating sufficient signal from extremely
small RNA populations (e.g. single cells) have and will
continue to be investigated (Brandt et al., 2002; Chen et al.,
1998; Feldmann et al., 2002; Luo et al., 1999; Marshall and
Hodgson, 1998; Nakazono et al., 2003; Phillips and Eber-
wine, 1996; Thorp, 1998).
Fabrication of the tomato TOM1 microarray
In addition to the descriptions below, the protocols we use
regularly for these purposes are presented in a step-by-step
fashion in the PROTOCOL section of the Tomato Expression
Database (http://ted.bti.cornell.edu/microarray/interface/
protocol.html).
The EST libraries utilized for fabrication of our TOM1
cDNA microarray have been described previously (van der
Hoeven et al., 2002). A total of 12 899 EST clones represent-
ing 8500 independent tomato genes were inoculated into
384-well plates containing LB (containing 100 lg ml1 amp-
icilin) and incubated for 24 h at 37�C followed by 12-h
incubation at 22�C. The resultant cultures were used to
inoculate duplicate PCR reactions, which contained 10 mM
Tris (pH 9.2), 25 mM KCl, 3.5 mM MgCl2, 0.5 mM dATP,
0.5 mM dGTP, 0.5 mM dCTP, 0.5 mM dUTP, 0.04 ul Taq
polymerase, 200 nM T3 primer, and 200 nM T7 primer.
Inoculation was achieved using a sterile 384-pin replicator
(catalog no. 250393; Nalge Nunc Inc., NY, USA) and the
inoculation transfer step was preformed twice such that
approximately 2 ll of each culture was transferred to each
corresponding PCR reaction. PCR reactions were incubated
at 95�C for 2 min, followed by 39 amplification cycles (94�Cfor 20 sec, then 52�C for 20 sec, then 72�C for 1.5 min), and
then incubated at 72�C for 10 min. Products from duplicate
15 ul PCR reactions were combined and transferred to 384-
well filter plates (catalog no. S384PCR10; Millipore Inc.,
Billerica, MA, USA) using a Genesis RSP 200 Liquid Handler
(TECAN Inc., San Jose, NC, USA). Salts, primers, free
nucleotides, and other contaminates originating from the
inoculate were removed via vacuum filtration (12–15 mbar
for 5 min). PCR products were subsequently extracted from
the filter matrix in 20 ll of H2O and transferred to 384-well
spotting plates (catalog no. X6003; Genetix Inc., Boston, MA,
702 Rob Alba et al.
ª Blackwell Publishing Ltd, The Plant Journal, (2004), 39, 697–714
USA) using the liquid handler. Purified products were then
dehydrated under vacuum, re-suspended in 12 ll of spotting
buffer (3 · SSC, 1.5 M betaine), and printed onto glass slides
coated with c-amino-propyl-silane (25.3 · 75.5 mm, Ultra-
GAPS; Corning Inc., Corning, NY, USA) using a MicroGrid
Pro arrayer (BioRobotics Inc., Boston, MA, USA) with 32
MicroSpot2500 printing pins. Temperature and humidity
inside the arrayer were maintained at 18–21�C and 35–45%
RH, respectively. Dwell time, spots per visit, pin wash time,
and pin dry time were set at 1 sec, 27 spots, 7 sec, and
10 sec, respectively. cDNA was fixed to the modified glass
slides by treatment with 300 mJ of UV irradiation followed
by a 2-h incubation at 85�C. Array fabrication was completed
with a 2-min wash in 0.2% SDS, three rinses in Milli-Q� water
(Millipore Inc.), and a final rinse in 90% EtOH. EtOH was
removed immediately via centrifugation (2 min at 500 rpm)
and resulting microarrays were stored in a dust-free plexi-
glass chamber (approximately 21�C, 0% RH).
Experimental design
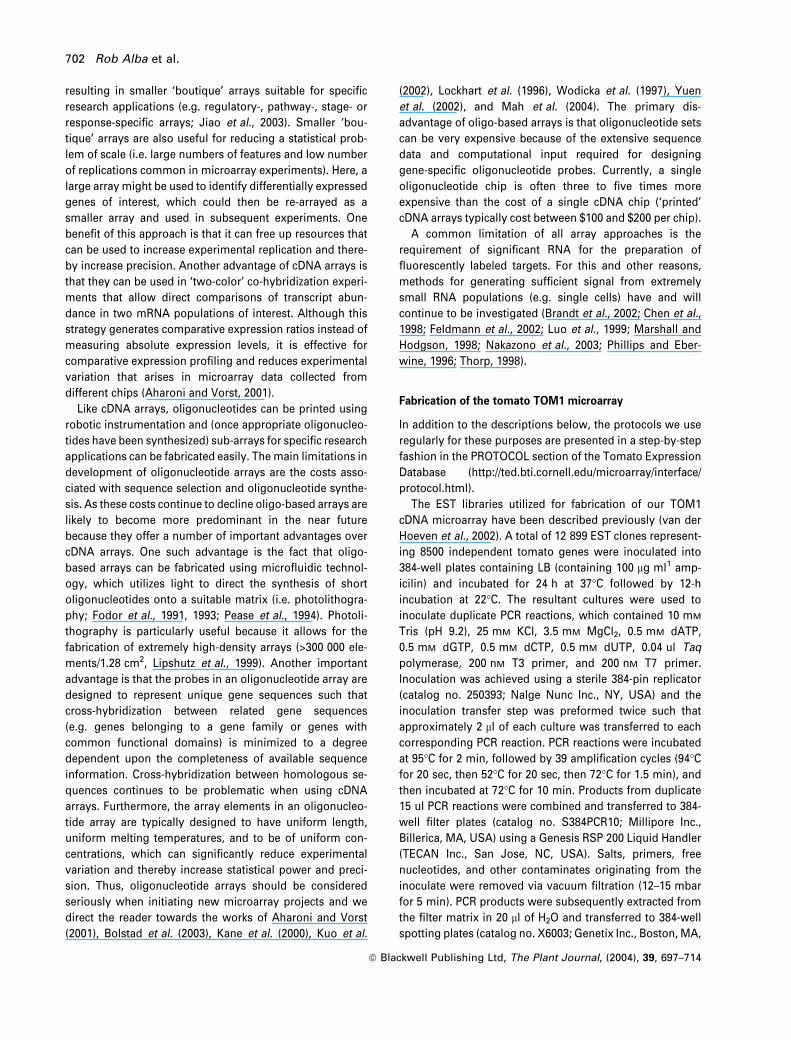
Figure 2(a) is a schematic overview for expression profiling
using cDNA microarrays. A variety of experimental designs
are possible for microarray analysis, most of which have
been discussed in detail (Churchill, 2002; Dobbin and Simon,
2002; Dobbin et al., 2003; Kerr and Churchill, 2001; Yang and
Speed, 2002a). For profiling gene expression during time-
course studies or analyses of developmental transitions we
have found the direct-sequential linear design and the
direct-sequential loop design (Kerr and Churchill, 2001; Yang
and Speed, 2002a) to be well suited for this purpose. For
example, because expression profiles obtained with these
designs derive from pair-wise comparisons of adjacent time
points, direct comparison of expression differences between
time points is possible. Such comparisons can only be made
indirectly when designs utilizing a common reference are
employed (Figure 2b), which may make subtle differences
from one time point to another difficult to detect. Equally
important, the direct-sequential loop design increases pre-
cision for some of the pair-wise comparisons in the time
course, which reduces the mean variance for data
collected in this way (Yang and Speed, 2003). More recently,
experimental designs for microarray analyses have begun to
incorporate interspecies comparisons using arrays that
originate from one of the genomes being investigated
(Dong et al., 2001; Horvath et al., 2003; Ventelon-Debout
et al., 2003; S. Moore and J. Giovannoni, BTI, Ithaca, NY,
USA, unpublished data). Toward this objective, comparison
of closely related species is most informative because arti-
facts stemming from sequence divergence are minimized.
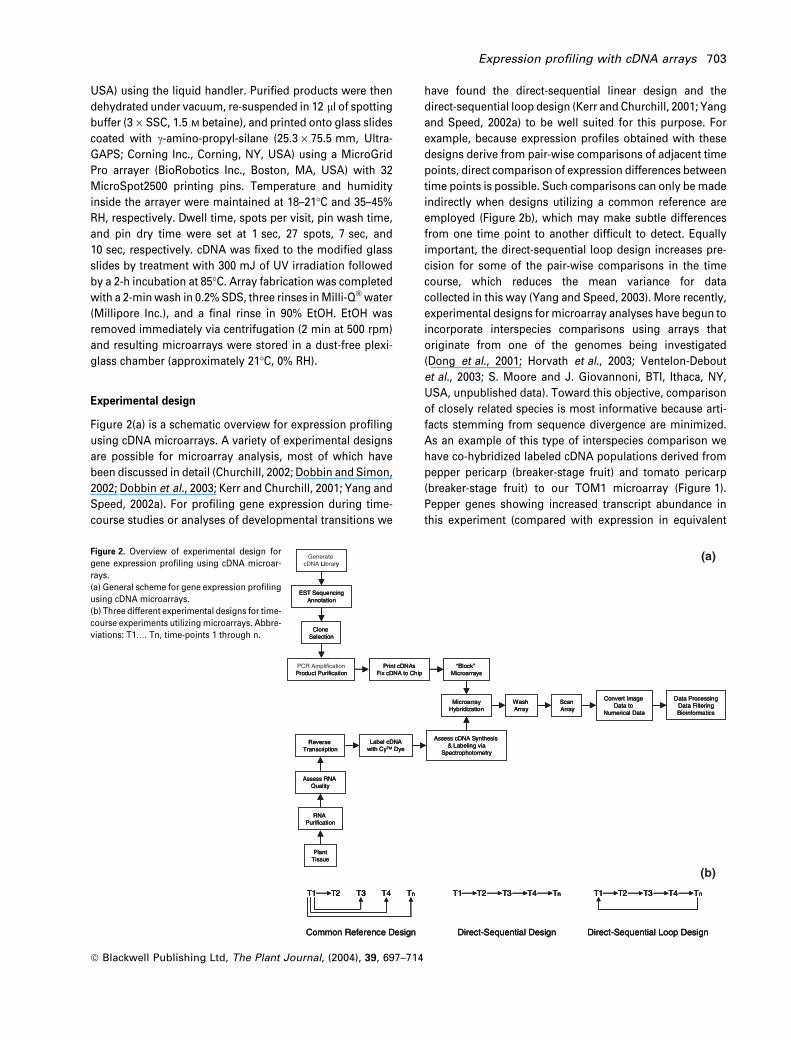
As an example of this type of interspecies comparison we
have co-hybridized labeled cDNA populations derived from
pepper pericarp (breaker-stage fruit) and tomato pericarp
(breaker-stage fruit) to our TOM1 microarray (Figure 1).
Pepper genes showing increased transcript abundance in
this experiment (compared with expression in equivalent
Figure 2. Overview of experimental design for
gene expression profiling using cDNA microar-
rays.
(a) General scheme for gene expression profiling
using cDNA microarrays.
(b) Three different experimental designs for time-
course experiments utilizing microarrays. Abbre-
viations: T1…. Tn, time-points 1 through n.
Expression profiling with cDNA arrays 703
ª Blackwell Publishing Ltd, The Plant Journal, (2004), 39, 697–714
tomato tissue) are of particular interest because this result
cannot be explained by differential hybridization because of
sequence divergence (Table 2).
Verification of microarray data can be accomplished in a
variety of ways, including RNA-blot analysis, RT PCR, real-
time PCR, and/or comparison with EST expression databas-
es (e.g. http://ted.bti.cornell.edu/). The latter being the only
approach that has potential for genome-scale verification.
As an example of this approach we have used the tomato
expression database to corroborate some of the results
summarized in Figure 1 and Table 2. The comparative
profiling experiment described above identifies a number
of genes that have been previously shown to be highly
expressed in tomato pericarp during ripening, including
genes encoding ACC oxidase1, pectin esterase, polygalac-
turonase 2A, pectate lyase, histidine decarboxylase, and acid
invertase. EST data in the Tomato Expression Database
(http://ted.bti.cornell.edu) again confirms that all six of these
genes are abundant in breaker-stage pericarp tissue (esti-
mated 0.17–1.33% of breaker mRNA based on digital
expression data). In addition, 26 genes were identified that
(i) are highly expressed in the breaker-stage library of the
Tomato Expression Database (i.e. represented by greater
than 25 ESTs corresponding to >0.17% of the mRNA from
this tissue) and (ii) exist on the TOM1 microarray. Twenty-
four of these 26 genes (92%) sorted into the top 50% of
fluorescent signal intensities when assayed using the TOM1
microarray (data not shown). The continued expansion of
EST collections will only increase the feasibility of this
approach for large-scale verification of transcriptome data.
Differential expression of genes identified via comparat-
ive expression profiling can also be used in conjunction with
large-scale proteome analysis (Rose et al., this issue) to
dissect regulatory processes. Comparisons that combine
expression and proteome profiling should allow one to
distinguish transcriptional versus post-transcriptional regu-
lation. To date, however, the potential for using comparative
genomics/proteomics for this type of molecular analysis in
plants remains largely untapped.
Sufficient replication is an important issue in meaningful
transcriptome profiling and decisions in this regard should
be based on (i) the extent of biological and technical
variation in one’s experimental system, (ii) the experimen-
tal question, (iii) desired resolution, (iv) available
resources, (v) available time, and (vi) opportunities for
downstream validation. In most cases biological replica-
tion is superior to technical replication, and technical
replication is far better than none (Callow et al., 2000;
Churchill, 2002; Kerr et al., 2000a; Lee et al., 2000). Con-
sistent with the proposal of Lee et al. (2000), for time-
course experiments we suggest a minimum of three to
four biological replicates for each time point with a dye-
swap technical replicate for each biological replicate
(Cochran and Cox, 1992; Kerr et al., 2000a). This approach
minimizes dye-specific artifacts and makes statistical ana-
lyses possible (the same is true for proteome analysis –
see Rose et al., this issue). Dye-swap replicates, which
involve repeating the hybridization conditions with dye
reversal in the second hybridization, are useful for redu-
cing systematic dye bias (Tseng et al., 2001; Yang et al.,
2001). Presumably this dye bias derives from differences in
mean brightness and background noise, dye-specific
incorporation efficiency, different extinction coefficients,
differences in quantum fluorescence yield, and other
physical properties of the dyes (e.g. molecular size,
sensitivity to light and heat, relative half-life). For experi-
ments comparing only two or three different samples (e.g.
wild-type versus mutant), we suggest a minimum of three
to six biological replicates to make statistical analysis
possible while minimizing resource depletion. Dye-swap
replicates should be used in this situation as well. It is also
important to point out that we are not implying that the
‘law of diminishing returns’ has firmly set in after three to
six replicates. In some cases, particularly scenarios where
more precision is required or greater systemic variance
has been documented, greater replication (i.e. more than
three to six replicates) is likely to be worth the additional
resource investment. Thus, three to six replicates should
be considered only as an initial guideline during experi-
mental design. Although biological replication is most
desirable, in some cases such replication is not possible. In
these instances, consistent with the hypothesis of Peng
et al. (2003), we continue to presume that a single RNA
extraction from a homogenous pool of replicate tissue is
superior to a single RNA extraction from an individual
tissue sample. This being said it is important to point out
Table 2 Comparative expression profiling used to identify loci thatare expressed differently in similar tissues from closely relatedspecies
10·b 5·c
Loci expressed in tomato pericarpa 2364 3596Loci expressed in pepper pericarpa 2370 3680Loci expressed in both speciesd 2023 2973
P < 0.001e P < 0.01e
Loci with different expression levelsf 188 974Loci with increased expression in pepper 95 550Loci with decreased expression in pepper 93 424
aOuter pericarp tissue from breaker-stage fruit.bAll loci with normalized fluorescence signal greater than 10-foldbackground.cAll loci with normalized fluorescence signal greater than fivefoldbackground.dThe subset of loci that are expressed in both tomato and pepperpericarp (breaker-stage fruit).et-Test with FDR correction for multiple testing (Benjamini andHochberg, 1995).fLoci were identified with the GeneSpring� software (v6.1, Silicon-Genetics).
704 Rob Alba et al.
ª Blackwell Publishing Ltd, The Plant Journal, (2004), 39, 697–714
that direct comparisons to test this hypothesis have not
been reported in the literature. It should also be noted that
replicate measurements from a pool of tissue only pro-
vides information about variability stemming from meas-
urement error, and provides no information about
variability that stems from population heterogeneity.
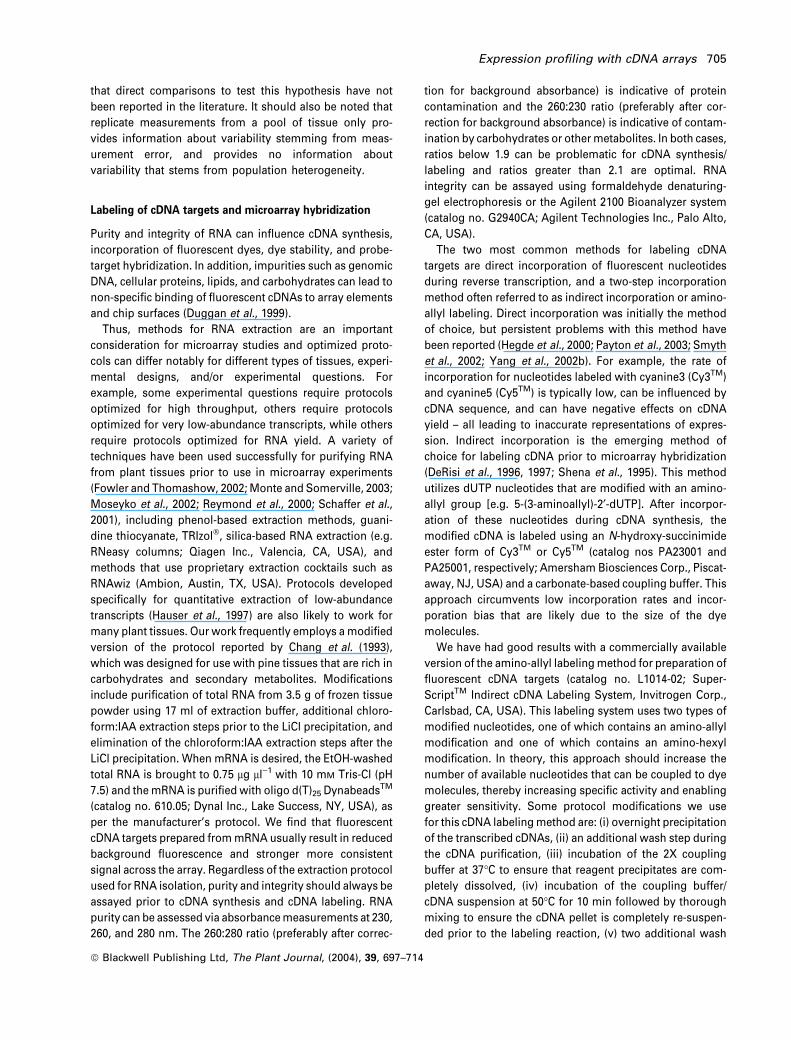
Labeling of cDNA targets and microarray hybridization
Purity and integrity of RNA can influence cDNA synthesis,
incorporation of fluorescent dyes, dye stability, and probe-
target hybridization. In addition, impurities such as genomic
DNA, cellular proteins, lipids, and carbohydrates can lead to
non-specific binding of fluorescent cDNAs to array elements
and chip surfaces (Duggan et al., 1999).
Thus, methods for RNA extraction are an important
consideration for microarray studies and optimized proto-
cols can differ notably for different types of tissues, experi-
mental designs, and/or experimental questions. For
example, some experimental questions require protocols
optimized for high throughput, others require protocols
optimized for very low-abundance transcripts, while others
require protocols optimized for RNA yield. A variety of
techniques have been used successfully for purifying RNA
from plant tissues prior to use in microarray experiments
(Fowler and Thomashow, 2002; Monte and Somerville, 2003;
Moseyko et al., 2002; Reymond et al., 2000; Schaffer et al.,
2001), including phenol-based extraction methods, guani-
dine thiocyanate, TRIzol�, silica-based RNA extraction (e.g.
RNeasy columns; Qiagen Inc., Valencia, CA, USA), and
methods that use proprietary extraction cocktails such as
RNAwiz (Ambion, Austin, TX, USA). Protocols developed
specifically for quantitative extraction of low-abundance
transcripts (Hauser et al., 1997) are also likely to work for
many plant tissues. Our work frequently employs a modified
version of the protocol reported by Chang et al. (1993),
which was designed for use with pine tissues that are rich in
carbohydrates and secondary metabolites. Modifications
include purification of total RNA from 3.5 g of frozen tissue
powder using 17 ml of extraction buffer, additional chloro-
form:IAA extraction steps prior to the LiCl precipitation, and
elimination of the chloroform:IAA extraction steps after the
LiCl precipitation. When mRNA is desired, the EtOH-washed
total RNA is brought to 0.75 lg ll)1 with 10 mM Tris-Cl (pH
7.5) and the mRNA is purified with oligo d(T)25 DynabeadsTM
(catalog no. 610.05; Dynal Inc., Lake Success, NY, USA), as
per the manufacturer’s protocol. We find that fluorescent
cDNA targets prepared from mRNA usually result in reduced
background fluorescence and stronger more consistent
signal across the array. Regardless of the extraction protocol
used for RNA isolation, purity and integrity should always be
assayed prior to cDNA synthesis and cDNA labeling. RNA
purity can be assessed via absorbance measurements at 230,
260, and 280 nm. The 260:280 ratio (preferably after correc-
tion for background absorbance) is indicative of protein
contamination and the 260:230 ratio (preferably after cor-
rection for background absorbance) is indicative of contam-
ination by carbohydrates or other metabolites. In both cases,
ratios below 1.9 can be problematic for cDNA synthesis/
labeling and ratios greater than 2.1 are optimal. RNA
integrity can be assayed using formaldehyde denaturing-
gel electrophoresis or the Agilent 2100 Bioanalyzer system
(catalog no. G2940CA; Agilent Technologies Inc., Palo Alto,
CA, USA).
The two most common methods for labeling cDNA
targets are direct incorporation of fluorescent nucleotides
during reverse transcription, and a two-step incorporation
method often referred to as indirect incorporation or amino-
allyl labeling. Direct incorporation was initially the method
of choice, but persistent problems with this method have
been reported (Hegde et al., 2000; Payton et al., 2003; Smyth
et al., 2002; Yang et al., 2002b). For example, the rate of
incorporation for nucleotides labeled with cyanine3 (Cy3TM)
and cyanine5 (Cy5TM) is typically low, can be influenced by
cDNA sequence, and can have negative effects on cDNA
yield – all leading to inaccurate representations of expres-
sion. Indirect incorporation is the emerging method of
choice for labeling cDNA prior to microarray hybridization
(DeRisi et al., 1996, 1997; Shena et al., 1995). This method
utilizes dUTP nucleotides that are modified with an amino-
allyl group [e.g. 5-(3-aminoallyl)-2¢-dUTP]. After incorpor-
ation of these nucleotides during cDNA synthesis, the
modified cDNA is labeled using an N-hydroxy-succinimide
ester form of Cy3TM or Cy5TM (catalog nos PA23001 and
PA25001, respectively; Amersham Biosciences Corp., Piscat-
away, NJ, USA) and a carbonate-based coupling buffer. This
approach circumvents low incorporation rates and incor-
poration bias that are likely due to the size of the dye
molecules.
We have had good results with a commercially available
version of the amino-allyl labeling method for preparation of
fluorescent cDNA targets (catalog no. L1014-02; Super-
ScriptTM Indirect cDNA Labeling System, Invitrogen Corp.,
Carlsbad, CA, USA). This labeling system uses two types of
modified nucleotides, one of which contains an amino-allyl
modification and one of which contains an amino-hexyl
modification. In theory, this approach should increase the
number of available nucleotides that can be coupled to dye
molecules, thereby increasing specific activity and enabling
greater sensitivity. Some protocol modifications we use
for this cDNA labeling method are: (i) overnight precipitation
of the transcribed cDNAs, (ii) an additional wash step during
the cDNA purification, (iii) incubation of the 2X coupling
buffer at 37�C to ensure that reagent precipitates are com-
pletely dissolved, (iv) incubation of the coupling buffer/
cDNA suspension at 50�C for 10 min followed by thorough
mixing to ensure the cDNA pellet is completely re-suspen-
ded prior to the labeling reaction, (v) two additional wash
Expression profiling with cDNA arrays 705
ª Blackwell Publishing Ltd, The Plant Journal, (2004), 39, 697–714
steps during purification of the labeled cDNA, and (vi)
elution of labeled cDNA with 63 ll of nuclease-free H2O.
Success of the cDNA synthesis and dye labeling reactions
should always be assessed spectrophotometrically. Fre-
quency of incorporation should also be calculated (fre-
quency of incorporation ¼ pmol cDNA/pmol coupled dye).
We have found that optimal fluorescent targets contain
>2500 pmol of cDNA per reaction, >125 pmol of incorpor-
ated dye per reaction, and <40 nucleotides/dye molecule.
Assuming the cDNA synthesis and labeling reactions
are successful, 50 pmol of Cy3TM (coupled to cDNA) is
combined with an equivalent quantity of Cy5TM (50 pmol
of Cy5TM coupled to cDNA) and evaporated to dryness in a
roto-evaporator set to 45�C. The combined dried cDNA
targets are then suspended in 70 ll of hybridization
solution. For arrays printed on Corning’s UltraGAPSTM
chips, we have found that Corning’s Universal Hybridiza-
tion Solution (catalog no. 40090; Corning Inc.) results in
high fluorescence intensity that is consistent across the
array and low background fluorescence. After re-suspen-
sion in 70 ll of hybridization solution, the labeled cDNA is
incubated at 95�C for 5 min, and 65 ll is applied to an
array that has been pre-hybridized for 45 min (43�C) in
5 · SSC containing 0.1% SDS and 1% BSA (Hegde et al.,
2000), and covered with a clean glass LifterSlip (50 mm,
catalog no. 22X50I-2-4711; Erie Scientific, Portsmouth, NH,
USA). Hybridization is conducted in Corning hybridization
chambers (catalog no. 2551; Corning Inc.), at 43�C, for 12–
16 h in the absence of light. Three post-hybridization
washes are conducted in Coplin jars, including a wash in
55 ml of 1 · SSC/0.2% SDS (43�C, 10 min), followed by a
wash in 55 ml of 0.1 · SSC/0.2% SDS (22�C, 10 min),
followed by a wash in 55 ml of 0.1 · SSC (22�C, 10 min).
Immediately after the final wash step the arrays are dried
via centrifugation (440 g for 1 min) and stored in the dark
until scanning.
Acquisition, transformation, and processing of microarray
data
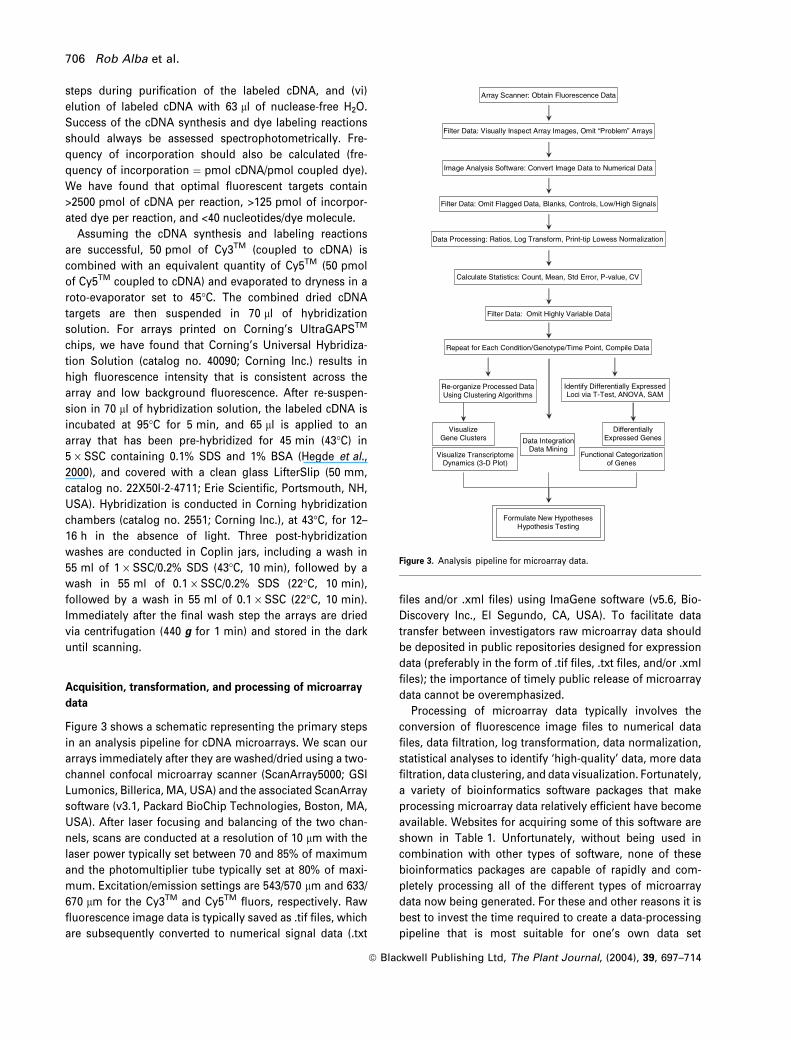
Figure 3 shows a schematic representing the primary steps
in an analysis pipeline for cDNA microarrays. We scan our
arrays immediately after they are washed/dried using a two-
channel confocal microarray scanner (ScanArray5000; GSI
Lumonics, Billerica, MA, USA) and the associated ScanArray
software (v3.1, Packard BioChip Technologies, Boston, MA,
USA). After laser focusing and balancing of the two chan-
nels, scans are conducted at a resolution of 10 lm with the
laser power typically set between 70 and 85% of maximum
and the photomultiplier tube typically set at 80% of maxi-
mum. Excitation/emission settings are 543/570 lm and 633/
670 lm for the Cy3TM and Cy5TM fluors, respectively. Raw
fluorescence image data is typically saved as .tif files, which
are subsequently converted to numerical signal data (.txt
files and/or .xml files) using ImaGene software (v5.6, Bio-
Discovery Inc., El Segundo, CA, USA). To facilitate data
transfer between investigators raw microarray data should
be deposited in public repositories designed for expression
data (preferably in the form of .tif files, .txt files, and/or .xml
files); the importance of timely public release of microarray
data cannot be overemphasized.
Processing of microarray data typically involves the
conversion of fluorescence image files to numerical data
files, data filtration, log transformation, data normalization,
statistical analyses to identify ‘high-quality’ data, more data
filtration, data clustering, and data visualization. Fortunately,
a variety of bioinformatics software packages that make
processing microarray data relatively efficient have become
available. Websites for acquiring some of this software are
shown in Table 1. Unfortunately, without being used in
combination with other types of software, none of these
bioinformatics packages are capable of rapidly and com-
pletely processing all of the different types of microarray
data now being generated. For these and other reasons it is
best to invest the time required to create a data-processing
pipeline that is most suitable for one’s own data set
Filter Data: Visually Inspect Array Images, Omit “Problem” Arrays
Filter Data: Omit Flagged Data, Blanks, Controls, Low/High Signals
Calculate Statistics: Count, Mean, Std Error, P-value, CV
Filter Data: Omit Highly Variable Data
Repeat for Each Condition/Genotype/Time Point, Compile Data
Array Scanner: Obtain Fluorescence Data
Image Analysis Software: Convert Image Data to Numerical Data
Re-organize Processed Data Using Clustering Algorithms
Identify Differentially ExpressedLoci via T-Test, ANOVA, SAM
Differentially Expressed Genes
Data Processing: Ratios, Log Transform, Print-tip Lowess Normalization
Functional Categorizationof Genes
Data Integration Data Mining
Visualize TranscriptomeDynamics (3-D Plot)
Visualize Gene Clusters
Formulate New Hypotheses Hypothesis Testing
Figure 3. Analysis pipeline for microarray data.
706 Rob Alba et al.
ª Blackwell Publishing Ltd, The Plant Journal, (2004), 39, 697–714
structure, data volume, and monetary limitations. The
software we use for acquiring, transforming,
processing, clustering and analyzing microarray data
includes ImaGeneTM, (BioDiscovery Inc.), GeneSpringTM
(SiliconGenetics, Redwood City, CA, USA), GEPAS (Herr-
ero et al., 2003a,b;), GEDA (Lyons-Weiler et al., 2003), SAM
(Tusher et al., 2001), KNNimpute (Troyanskaya et al., 2001),
MATLABTM (The Mathworks Inc., Natick, MA, USA), ExcelTM
(Microsoft Inc., Redmond, WA, USA), and Perl (http://
www.perl.com). The backbone of our bioinformatics pipe-
line includes a high-speed workstation with a 2.2 GHz
processor and 2 GB of RAM.
Numerical signal data can be obtained from fluorescence
images using ImaGeneTM software (v5.6, BioDiscovery Inc.).
Similar to the strategy of Hegde et al. (2000), expression
fluorescence values with median signal less than the sum of
the local background mean plus two standard deviations are
deemed indistinguishable from background and flagged.
We require a minimum of three non-flagged replicate
hybridization signals or the EST is scored as lacking suffi-
cient data. For downstream analysis it is sometimes neces-
sary or desirable to estimate missing expression values, but
due caution should be applied in these cases. When
necessary, the KNNimpute algorithm is a logical approach
for estimating missing expression values (Troyanskaya
et al., 2001), but only if the missing values are a small
proportion of the existing values in the data series being
considered.
Data transformation and normalization make it possible to
differentiate between real (biological) variations in gene
expression and experimental error. We have investigated
five data transformations including log2, loge, 1/x, cube-root,
and the linlog transformation of Cui et al. (2002), with and
without local area background corrections, and have found
the log transformations to be most reliable for our experi-
mental design (data not shown).
Consistent with Rocke and Durbin (2001), we observe that
local area background corrections add additional variance to
microarray data, in a non-linear fashion. This is particularly
problematic for genes expressed at low levels and for this
reason local area background corrections are not employed
in our analyses.
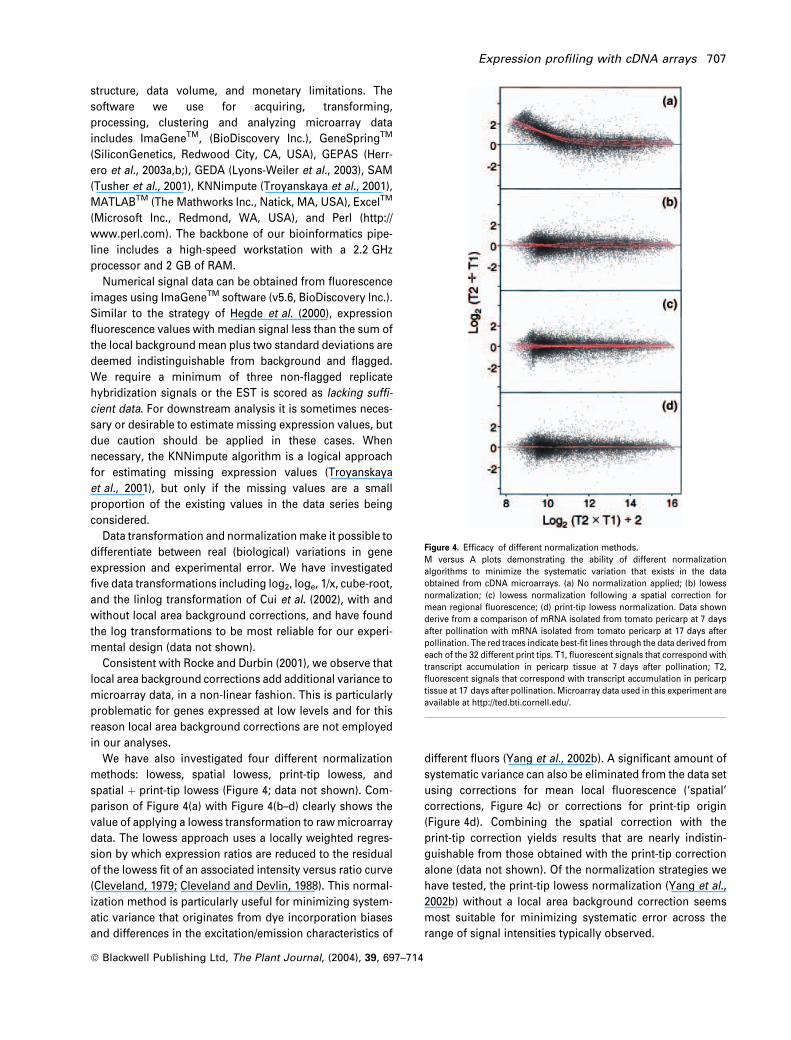
We have also investigated four different normalization
methods: lowess, spatial lowess, print-tip lowess, and
spatial þ print-tip lowess (Figure 4; data not shown). Com-
parison of Figure 4(a) with Figure 4(b–d) clearly shows the
value of applying a lowess transformation to raw microarray
data. The lowess approach uses a locally weighted regres-
sion by which expression ratios are reduced to the residual
of the lowess fit of an associated intensity versus ratio curve
(Cleveland, 1979; Cleveland and Devlin, 1988). This normal-
ization method is particularly useful for minimizing system-
atic variance that originates from dye incorporation biases
and differences in the excitation/emission characteristics of
different fluors (Yang et al., 2002b). A significant amount of
systematic variance can also be eliminated from the data set
using corrections for mean local fluorescence (‘spatial’
corrections, Figure 4c) or corrections for print-tip origin
(Figure 4d). Combining the spatial correction with the
print-tip correction yields results that are nearly indistin-
guishable from those obtained with the print-tip correction
alone (data not shown). Of the normalization strategies we
have tested, the print-tip lowess normalization (Yang et al.,
2002b) without a local area background correction seems
most suitable for minimizing systematic error across the
range of signal intensities typically observed.
Figure 4. Efficacy of different normalization methods.
M versus A plots demonstrating the ability of different normalization
algorithms to minimize the systematic variation that exists in the data
obtained from cDNA microarrays. (a) No normalization applied; (b) lowess
normalization; (c) lowess normalization following a spatial correction for
mean regional fluorescence; (d) print-tip lowess normalization. Data shown
derive from a comparison of mRNA isolated from tomato pericarp at 7 days
after pollination with mRNA isolated from tomato pericarp at 17 days after
pollination. The red traces indicate best-fit lines through the data derived from
each of the 32 different print tips. T1, fluorescent signals that correspond with
transcript accumulation in pericarp tissue at 7 days after pollination; T2,
fluorescent signals that correspond with transcript accumulation in pericarp
tissue at 17 days after pollination. Microarray data used in this experiment are
available at http://ted.bti.cornell.edu/.
Expression profiling with cDNA arrays 707
ª Blackwell Publishing Ltd, The Plant Journal, (2004), 39, 697–714
Despite recent advances in microarray technology,
increased ability to identify and eliminate systematic vari-
ance from microarray data, and the rapid development of
bioinformatic tools, it is important to note that data obtained
from cDNA microarrays have limitations. cDNA microarrays
and expression profiling can be extremely informative but
the data obtained with these tools should continue to be
analyzed with caution because expression artifacts are not
uncommon. Particularly disconcerting is the observation
that different EST clones that originate from the same gene
(i.e. pseudo-replicates) do not always yield the same
expression profiles although they exist on the same array.
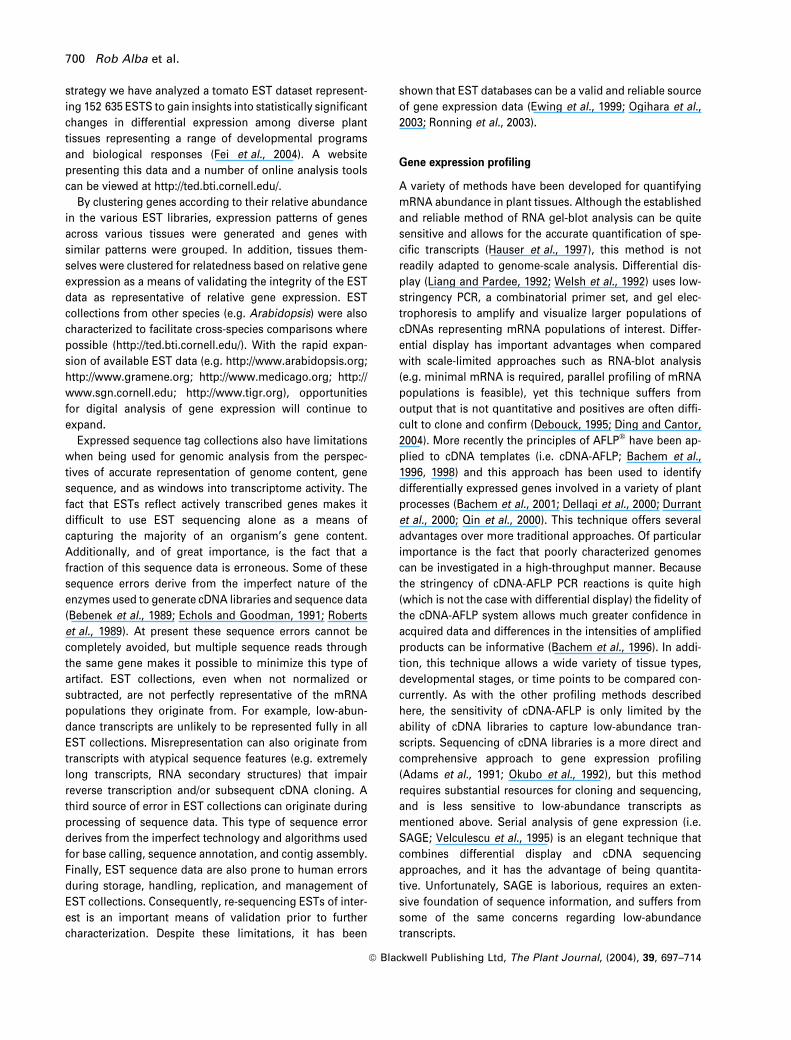
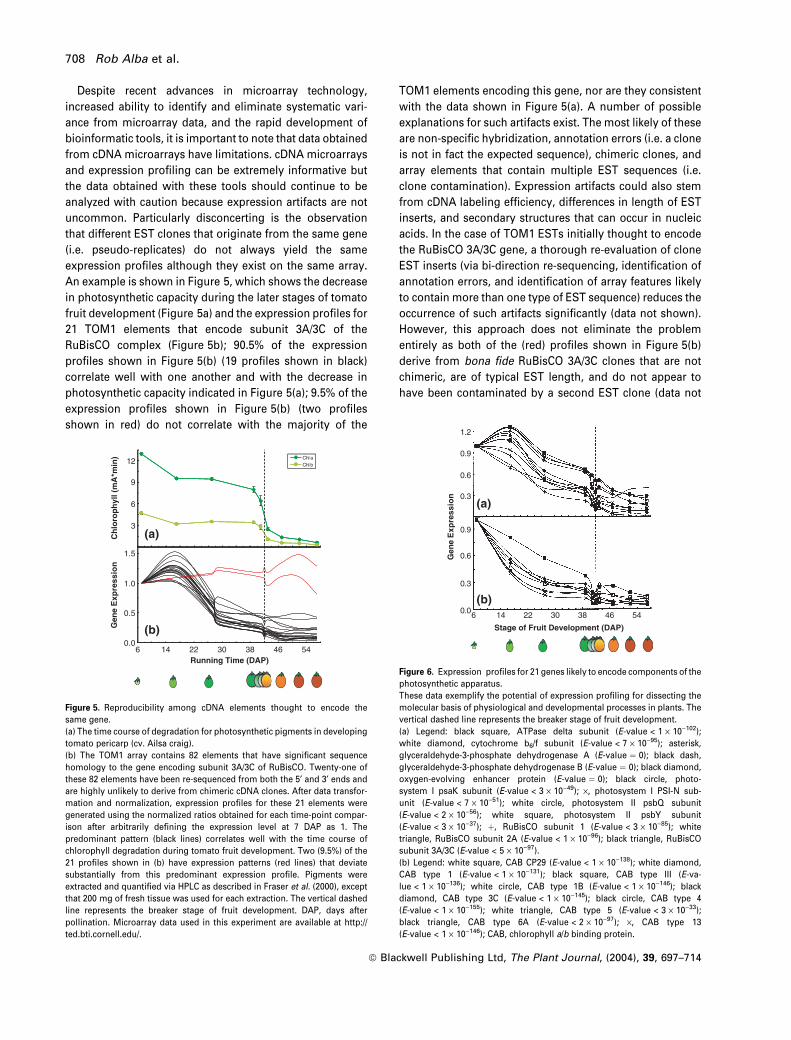
An example is shown in Figure 5, which shows the decrease
in photosynthetic capacity during the later stages of tomato
fruit development (Figure 5a) and the expression profiles for
21 TOM1 elements that encode subunit 3A/3C of the
RuBisCO complex (Figure 5b); 90.5% of the expression
profiles shown in Figure 5(b) (19 profiles shown in black)
correlate well with one another and with the decrease in
photosynthetic capacity indicated in Figure 5(a); 9.5% of the
expression profiles shown in Figure 5(b) (two profiles
shown in red) do not correlate with the majority of the
TOM1 elements encoding this gene, nor are they consistent
with the data shown in Figure 5(a). A number of possible
explanations for such artifacts exist. The most likely of these
are non-specific hybridization, annotation errors (i.e. a clone
is not in fact the expected sequence), chimeric clones, and
array elements that contain multiple EST sequences (i.e.
clone contamination). Expression artifacts could also stem
from cDNA labeling efficiency, differences in length of EST
inserts, and secondary structures that can occur in nucleic
acids. In the case of TOM1 ESTs initially thought to encode
the RuBisCO 3A/3C gene, a thorough re-evaluation of clone
EST inserts (via bi-direction re-sequencing, identification of
annotation errors, and identification of array features likely
to contain more than one type of EST sequence) reduces the
occurrence of such artifacts significantly (data not shown).
However, this approach does not eliminate the problem
entirely as both of the (red) profiles shown in Figure 5(b)
derive from bona fide RuBisCO 3A/3C clones that are not
chimeric, are of typical EST length, and do not appear to
have been contaminated by a second EST clone (data not
1.0
Chl aChl b
0.0
6
9
12
Ch
loro
ph
yll (
mA
*min
)
0.5
1.5
3(a)
(b)Gen
e E
xpre
ssio
n
6 14 22 30 38 46 54Running Time (DAP)
Figure 5. Reproducibility among cDNA elements thought to encode the
same gene.
(a) The time course of degradation for photosynthetic pigments in developing
tomato pericarp (cv. Ailsa craig).
(b) The TOM1 array contains 82 elements that have significant sequence
homology to the gene encoding subunit 3A/3C of RuBisCO. Twenty-one of
these 82 elements have been re-sequenced from both the 5¢ and 3¢ ends and
are highly unlikely to derive from chimeric cDNA clones. After data transfor-
mation and normalization, expression profiles for these 21 elements were
generated using the normalized ratios obtained for each time-point compar-
ison after arbitrarily defining the expression level at 7 DAP as 1. The
predominant pattern (black lines) correlates well with the time course of
chlorophyll degradation during tomato fruit development. Two (9.5%) of the
21 profiles shown in (b) have expression patterns (red lines) that deviate
substantially from this predominant expression profile. Pigments were
extracted and quantified via HPLC as described in Fraser et al. (2000), except
that 200 mg of fresh tissue was used for each extraction. The vertical dashed
line represents the breaker stage of fruit development. DAP, days after
pollination. Microarray data used in this experiment are available at http://
ted.bti.cornell.edu/.
1.2
0.9
0.6
0.3
0.9
0.6
0.3
0.0
Gen
e E
xpre
ssio
n
6 14 22 30 38 46 54
Stage of Fruit Development (DAP)
(a)
(b)
Figure 6. Expression profiles for 21 genes likely to encode components of the
photosynthetic apparatus.
These data exemplify the potential of expression profiling for dissecting the
molecular basis of physiological and developmental processes in plants. The
vertical dashed line represents the breaker stage of fruit development.
(a) Legend: black square, ATPase delta subunit (E-value < 1 · 10)102);
white diamond, cytochrome b6/f subunit (E-value < 7 · 10)95); asterisk,
glyceraldehyde-3-phosphate dehydrogenase A (E-value ¼ 0); black dash,
glyceraldehyde-3-phosphate dehydrogenase B (E-value ¼ 0); black diamond,
oxygen-evolving enhancer protein (E-value ¼ 0); black circle, photo-
system I psaK subunit (E-value < 3 · 10)49); ·, photosystem I PSI-N sub-
unit (E-value < 7 · 10)51); white circle, photosystem II psbQ subunit
(E-value < 2 · 10)56); white square, photosystem II psbY subunit
(E-value < 3 · 10)37); þ, RuBisCO subunit 1 (E-value < 3 · 10)85); white
triangle, RuBisCO subunit 2A (E-value < 1 · 10)96); black triangle, RuBisCO
subunit 3A/3C (E-value < 5 · 10)97).
(b) Legend: white square, CAB CP29 (E-value < 1 · 10)138); white diamond,
CAB type 1 (E-value < 1 · 10)131); black square, CAB type III (E-va-
lue < 1 · 10)136); white circle, CAB type 1B (E-value < 1 · 10)146); black
diamond, CAB type 3C (E-value < 1 · 10)145); black circle, CAB type 4
(E-value < 1 · 10)155); white triangle, CAB type 5 (E-value < 3 · 10)33);
black triangle, CAB type 6A (E-value < 2 · 10)97); ·, CAB type 13
(E-value < 1 · 10)146); CAB, chlorophyll a/b binding protein.
708 Rob Alba et al.
ª Blackwell Publishing Ltd, The Plant Journal, (2004), 39, 697–714
shown). Although problematic, microarray profiling artifacts
do not prohibit one from extracting biologically relevant
expression data from experiments that utilize cDNA
microarrays. For example, Figure 6 clearly demonstrates
decreased accumulation of transcripts encoding 21 different
proteins involved in photosynthesis, as would be expected
in pericarp tissue during tomato fruit development. Data
such as these are consistent with the hypothesis that
physiological processes such as photosynthesis are regula-
ted, at least in part, via coordinated gene expression.
Regardless, until artifacts such as those shown in Figure 5(b)
can be completely eliminated, data of this sort should be
interpreted with appropriate caution and corroborating
evidence should be obtained when possible.
Hybridization replicates increase the accuracy of meas-
urement in microarray studies (Dobbin et al., 2003; Lee
et al., 2000). Despite this fact, accuracy of measurement in
these studies cannot be maximized by simply increasing
experimental replication because microarray analyses have
a variety of systematic variance components and yield data
with magnitude-dependent signal variation. Equally prob-
lematic are the facts that these experiments involve an
extremely large number of variables and yield data that
often do not fit a normal distribution. Some of these
statistical issues can and should be addressed via data
transformation, data processing (e.g. normalization), and
data filtering. For example, microarray data should always
be log transformed [e.g. log2(sig1/sig2)] because this trans-
formation makes variation in signal ratios more independent
of signal magnitude, reduces distribution skew, and pro-
vides a more realistic sense of data variability. A log2
transformation is often used because it converts the expres-
sion values to an intuitive linear scale that represents
twofold differences. Data filtration can be accomplished in
a small variety of ways, but as a minimum should include
the omission of data from entire arrays that clearly did not
yield reliable fluorescence signals and the omission of
fluorescence signals that are ‘flagged’ by image analysis
software.
Identification of differentially expressed genes is con-
founded by the statistical issues that arise in microarray
studies. One issue is that of multiple testing, which comes
about because individual microarray hybridizations com-
prise thousands to tens-of-thousands of different hypothesis
tests. Multiple testing on this type of scale leads to extremely
large numbers of false positives if traditionally accepted
confidence intervals are used (e.g. P < 0.05). For example,
500 false positives are expected when P < 0.05 is used with
an array containing 10 000 different features. Circumventing
the issue of multiple testing can be accomplished in different
ways, depending on the experimental question and one’s
long-term research objectives. One way to reduce this
problem is to produce and use sub-arrays (see above
Microarray technology) containing only those probes that
correspond to genes of interest and genes thought to be
differentially expressed. A more conservative approach to
multiple testing is to use a statistical correction that controls
the family-wise error rate, which is the probability of
accumulating one or more false positives in an experiment
that involves multiple testing (Bonferroni, 1937; Hochberg,
1988; Holm, 1979; Westfall and Young, 1993). An alternative
and less conservative correction for multiple testing is based
on false discovery rate (FDR; Benjamini and Hochberg, 1995;
Benjamini and Yekutieli, 2001; Storey, 2002). FDR statistics
provide an estimate of how many false positives exist
among all the genes initially defined as being differentially
expressed and thereby allow one to establish a criterion for
differential expression based on the number of acceptable
false positives. A variety of statistical tests for differential
expression exist and specific choices should be based on
assumptions about the data being analyzed. If a sufficient
number of replicates exist and expression values fit a normal
distribution, then standard t-tests (with correction for mul-
tiple testing) can be used. Statistical approaches utilizing
ANOVA have also been developed for microarray analyses
(Wolfinger et al., 2001), including models that do not
assume a normal distribution (Kerr and Churchill, 2001; Kerr
et al., 2000b). Non-parametric tests such as the Mann–
Whitney U-test or Wilcoxon’s signed rank test can be used
when necessary, but these tests are often not sufficiently
sensitive to detect small differences in expression. For a
thorough coverage of statistical tests for differential expres-
sion we refer readers to Kerr et al. (2000a), Dudoit et al.
(2002), Nadon and Shoemaker (2002), Cui and Churchill
(2003), and Dobbin et al. (2003).
A variety of approaches exist for the visualization of
microarray data. The most common is a table that con-
veys information about differentially expressed genes.
Typically these tables include some type of clone identifier
(e.g. GenBank number, EST number, array element number),
signal intensities, an expression ratio value, a confidence
statistic (e.g. P-value), annotation based on sequence
homology, and an E-value reflecting the extent of sequence
homology (although the latter is often unfortunately omitted
in many reports). When possible, microarray data should be
visualized using some type of graphical format. This
approach is useful because it allows one to visualize gene
expression as a function of time, space, tissue, and/or
genotype, which is difficult to accomplish with a simple
table (Figure 6). Furthermore, via the application of cluster-
ing algorithms, graphical visualization allows one to assess
the extent of coordinated gene expression in different
biological processes, visualize the transcriptome on a
genomic scale, and identify large groups of genes that have
similar expression profiles. We, and others (Dewey and
Galas, 2001; Kim et al., 2001; Werner-Washburne et al.,
2002), have also found it useful to treat clustered expression
profile data as a three-dimensional data set (e.g. X ¼ gene
Expression profiling with cDNA arrays 709
ª Blackwell Publishing Ltd, The Plant Journal, (2004), 39, 697–714
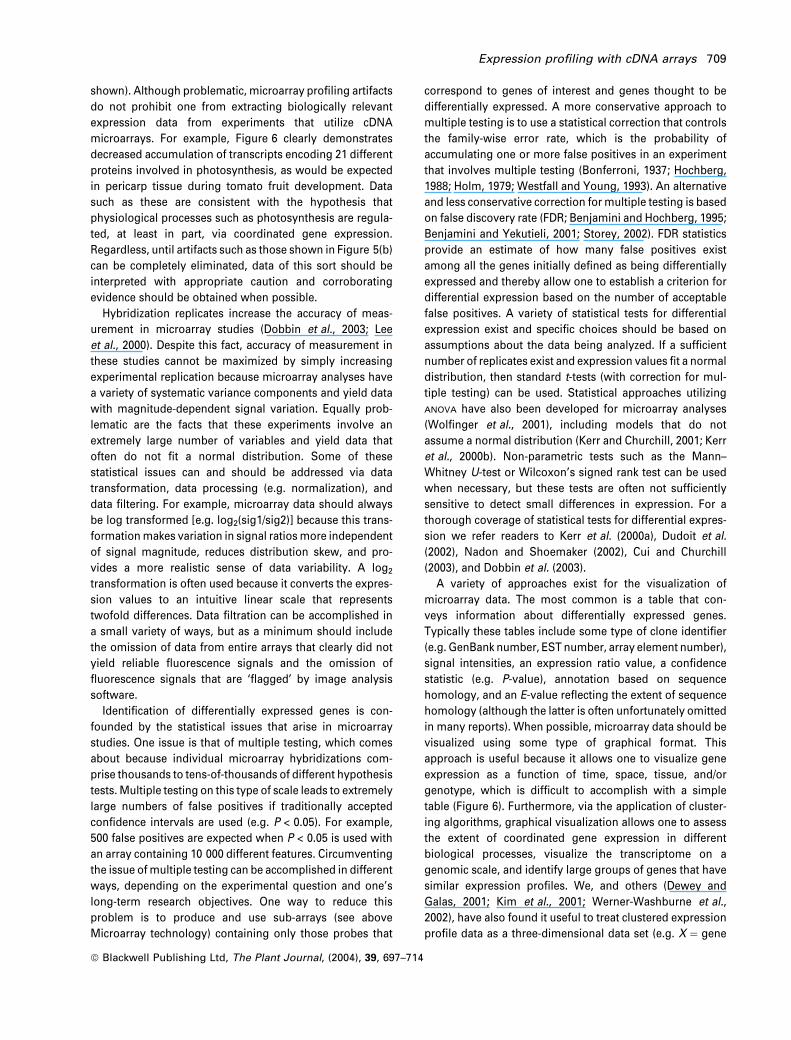
number, Y ¼ expression level, and Z ¼ time), which can
then be funneled through software that allows one to
generate high-resolution topology maps (e.g. MATLABTM;
VxInsight�, VisWave LLC, Albuquerque, NM). As an example
of this approach, publicly available data (Chu et al., 1998;
http://cmgm.stanford.edu/pbrown/sporulation/) from a
time-course study of yeast (Sacchcromyces ceraviseae)
sporulation has been rendered in this way (Figure 7). This
approach is an excellent way to visualize transcriptomes
during developmental transitions because it provides a
highly intuitive view of transcriptome dynamics.
Conclusions
In addition to that described above, the protocols we use
regularly for our work with cDNA microarrays are presented
in a step-by-step fashion in the PROTOCOL section of the
Tomato Expression Database (http://ted.bti.cornell.edu/
microarray/interface/protocol.html). These labeling and
analysis protocols should also be viable for use on oligo-
nucleotide-based arrays.
Gene expression profiling holds tremendous promise for
dissecting transcriptional networks and regulatory circuits,
although inherent limitations should be considered to
minimize overinterpretation of resulting data. Microarray
technology is currently being used to investigate a variety
of different physiological and developmental processes in
plant species, via a variety of different profiling techniques.
Some examples include responses to different stresses
(Desikan et al., 2001; Fowler and Thomashow, 2002),
environmental conditions (Ma et al., 2001; Paul et al.,
2004; Schaffer et al., 2001; Tepperman et al., 2001), path-
ogens and symbionts (Fedorova et al., 2002; Maleck et al.,
2000; Puthoff et al., 2003; Reymond et al., 2000), and
various developmental processes (Adams-Phillips et al.,
2003; Aharoni et al., 2000; Devlin et al., 2003; Jiao et al.,
2003; Moseyko et al., 2002). Studies such as these are
generating an overwhelming amount of microarray data,
the vast majority of which has yet to be analyzed
sufficiently or integrated with our existing knowledge
base. Efficient analysis and integration will undoubtedly
require standardization of nomenclature and standards for
experiment documentation and data formats (such as the
systems put forth by the Gene Ontology Consortium and
the MGED Society). Furthermore, untimely deposition of
microarray data sets in public databases may influence our
ability to successfully incorporate microarray data into our
existing knowledge base. Analysis and integration of these
data will also require further improvement of genomics
technologies and those associated with metabolomic and
proteomic analyses (Rose et al., this issue), novel bioin-
formatic approaches, and extensive inter-disciplinary col-
laborations between biologists, chemists, physicists,
computer scientists, and statisticians.
Acknowledgements
We are indebted to Ruth White and Xuemei Tang for theirexcellent technical assistance. We thank Cornelius Barry, andJulia Vrebalov for their insights throughout the progress of thework described here. We also express our gratitude to the PatBrown laboratory for making their yeast sporulation data avail-able to the public. This work was supported by grants from theNational Science Foundation (DBI-0116076 and DBI-0211875), theInstitut National de la Recherche Agronomique, Binational Agri-cultural Research and Development Fund (IS-3333-02), and theInitiative for Future Agriculture and Food Systems (2001-52100-11347).
Running Time (Hours)
GeneNum
ber
Running Time (Hours)Gene Number
Rel
ativ
e g
ene
exp
ress
ion
(L
og
2)
Running Time (Hours)
GeneNum
ber
Running Time (Hours)Gene NumberRunning Time (Hours)Gene Number
(a)
(b)
Figure 7. 3-D representation of transcriptional dynamics in yeast during
sporulation.
The data shown represent the expression of the entire yeast genome during a
12-h period. Microarray data obtained and processed by Chu et al. (1998) was
down-loaded from http://cmgm.stanford.edu/pbrown/sporulation/. The proc-
essed data was then re-organized into a single metacluster using the
self-organizing tree algorithm in the Gene Expression Pattern Analysis Suite
(GEPAS, v1.1; http://gepas.bioinfo.cnio.es). The metacluster data was
then funneled through MATLABTM to generate the 3-D image
shown (X-axis ¼ gene number, Y-axis ¼ relative expression level, and
Z-axis ¼ time). (a) Relative expression of genes that are primarily upregulated
(orange and red coloration) during the process of yeast sporulation. (b)
Relative expression of genes that are primarily downregulated (aqua and blue
coloration) during the process of yeast sporulation. The order of genes shown
on the X-axis is identical for (a) and (b), such that the gene shown at position 1
in (a) is the same gene shown at position 1 in (b).
710 Rob Alba et al.
ª Blackwell Publishing Ltd, The Plant Journal, (2004), 39, 697–714
References
Adams, M., Kelley, J., Gocayne, J. et al. (1991) Complementary DNAsequencing: expressed sequence tags and human genomeproject. Science, 252, 1651–1656.
Adams-Phillips, L., Alba, R., Moore, S., Fei, Z., Barry, C. and Gio-
vannoni, J. (2003) Genomics of ethylene signal transduction intomato. In Biology and Biotechnology of the Plant HormoneEthylene (Vendrel, M., ed.). New York: Kluwer Academic Pub-lishers, pp. 131–136.
Aharoni, A. and Vorst, O. (2001) DNA microarrays for functionalplant genomics. Plant Mol. Biol. 48, 99–118.
Aharoni, A., Keizer, L., Bouwmeester, H. et al. (2000) Identificationof the SAAT gene involved in strawberry flavour biogenesis byuse of DNA microarrays. Plant Cell, 12, 647–662.
Bachem, C., van der Hoeven, R., de Bruijn, S., Vreugdenhil, D.,
Zabeau, M. and Visser, R. (1996) Visualisation of differential geneexpression using a novel method of RNA finger-printing based onAFLP: analysis of gene expression during potato tuber develop-ment. Plant J. 9, 745–753.
Bachem, C., Oomen, R. and Visser, R. (1998) Transcript imagingwith cDNA-AFLP: a step-by-step protocol. Plant Mol. Biol. Rep. 16,157–173.
Bachem, C., Horvath, B., Trindade, L., Claassens, M., Davelaar, E.,
Jordi, W. and Visser, R. (2001) A potato tuber-expressedmRNA with homology to steroid dehydrogenases affectsgibberellin levels and plant development. Plant J. 25, 595–604.
Bebenek, K., Abbotts, J., Roberts, J., Wilson, S. and Kunkel, T.
(1989) Specificity and mechanism of error-prone replication byhuman immunodeficiency virus-I reverse transcriptase. J. Biol.Chem. 264, 16948–16956.
Benjamini, Y. and Hochberg, Y. (1995) Controlling the false discov-ery rate: a practical and powerful approach to multiple testing.J. R. Stat. Soc. 57, 289–300.
Benjamini, Y. and Yekutieli, D. (2001) The control of the false dis-covery rate in multiple testing under dependency. Ann. Stat. 29,1165–1168.
Bolstad, B., Irizarry, R., Astrand, M. and Speed, T. (2003) A com-parison of normalization methods for high density oligonucleo-tide array data based on bias and variance. Bioinformatics, 19,185–193.
Bonferroni, C. (1937) Statistic theory of classes and calculation ofprobabilities. In Volume in Honor of Riccardo della Volta. Flor-ence: University of Florence, pp. 1–62.
Bourdon, V., Naef, F., Rao, P., Reuter, V., Mok, S., Bosl, G., Koul, S.,
Murty, V., Kucherlapati, R. and Chaganti, R. (2002) Genomic andexpression analysis of the 12p11-p12 amplicon using EST arraysidentifies two novel amplified and over expressed genes. CancerRes. 62, 6218–6223.
Brandt, S., Kloska, S., Altmann, T. and Kehr, J. (2002) Using arrayhybridization to monitor gene expression at the single cell level.J. Exp. Bot. 53, 2315–2323.
Callow, M., Dudoit, S., Gong, E., Speed, T. and Rubin, E. (2000)Microarray expression profiling identifies genes withaltered expression in HDL-deficient mice. Genome Res. 10,2022–2029.
Chang, S., Puryear, J. and Cairney, J. (1993) A simple and efficientmethod for isolating RNA from pine trees. Plant Mol. Biol. Rep. 11,113–116.
Chen, J., Wu, R., Yang, P.-C. et al. (1998) Profiling expression pat-terns and isolating differentially expressed genes by cDNAmicroarray system with colorimetry detection. Genomics, 51,313–324.
Chu, S., DeRisi, J., Eisen, M., Mulholland, J., Botstein, D., Brown, P.
and Herskowitz, I. (1998) The transcriptional program of sporu-lation in budding yeast. Science, 282, 699–705.
Churchill, G. (2002) Fundamentals of experimental design for cDNAmicroarrays. Nat. Genet. 32 (Suppl. 2), 490–495.
Clark, M., Panopoulou, G., Cahill, D., Bussow, K. and Lehrach, H.
(1999) Construction and analysis of arrayed cDNA libraries.Methods Enzymol. 303, 205–233.
Cleveland, W. (1979) Robust locally weighted regression andsmoothing scatter plots. J. Am. Stat. Assoc. 74, 829–836.
Cleveland, W. and Devlin, S. (1988) Locally-weighted regression: anapproach to regression analysis by local fitting. J. Am. Stat.As soc. 83, 596–610.
Cochran, W. and Cox, G. (1992) Experimental Designs, 2nd edn.New York: Wiley & Sons Inc., pp. 95–182.
Cui, X. and Churchill, G. (2003) Statistical tests for differentialexpression in cDNA microarray experiments. Genome Biol. 4,210–219.
Cui, X., Kerr, K. and Churchill, G. (2002) Transformations for cDNAmicroarray data. Stat. Apps. Gen. Mol. Biol. 2, 1–20.
Debouck, C. (1995) Differential display or differential dismay? Curr.Opin. Biotech. 6, 597–599.
Dellaqi, A., Birch, P., Heilbronn, J., Lyon, G. and Toth, I. (2000)cDNA-AFLP analysis of differential gene expression in the prok-aryotic plant pathogen Erwinia carotovora. Microbiology, 146,165–171.
DeRisi, J., Penland, L., Brown, P., Bittner, M., Meltzer, P., Ray, M.,
Chen, Y., Su, Y. and Trent, J. (1996) Use of a cDNA microarray toanalyze gene expression patterns in human cancer. Nat. Genet.14, 457–460.
DeRisi, J., Iyer, V. and Brown, P. (1997) Exploring the metabolic andgenetic control of gene expression on a genomic scale. Science,278, 680–686.
Desikan, R., Mackerness, S., Hancock, J. and Neill, S. (2001) Regu-lation of the Arabidopsis transcriptome by oxidative stress. PlantPhysiol. 127, 159–172.
Devlin, P., Yanovsky, M. and Kay, S. (2003) A genomic analysis ofthe shade avoidance response in Arabidopsis. Plant Physiol. 133,1617–1629.
Dewey, T. and Galas, D. (2001) Dynamic models of gene expressionand classification. Funct. Integr. Genomics, 1, 269–278.
Ding, C. and Cantor, C. (2004) Quantitative analysis of nucleicacids – the last few years of progress. J. Biochem. Mol. Biol. 37,1–10.
Dobbin, K. and Simon, R. (2002) Comparison of microarray designsfor class comparison and class discovery. Bioinformatics, 18,1438–1445.
Dobbin, K., Shih, J. and Simon, R. (2003) Questions and answers ondesign of dual-label microarrays for identifying differentiallyexpressed genes. J. Natl Cancer Inst. 95, 1362–1369.
Dong, Y., Glasner, J., Blattner, F. and Triplett, E. (2001) Genomicinterspecies microarray hybridization: Rapid discovery of threethousand genes in the maize endophyte, Klebsiella pneumoniae342, by microarray hybridization with Escherichia coli K-12 openreading frames. Appl. Environ. Microbiol. 67, 1911–1921.
Drmanac, R. and Drmanac, S. (1999) cDNA screening by arrayhybridization. Methods Enzymol. 303, 165–178.
Dudoit, S., Yang, Y., Speed, T. and Callow, M. (2002) Statisticalmethods for identifying differentially expressed genes in repli-cated cDNA microarray experiments. Statistica Sinica, 12, 111–139.
Duggan, D., Bittner, M., Chen, Y., Meltzer, P. and Trent, J. (1999)Expression profiling using cDNA microarrays. Nat. Genet. 21,10–14.
Expression profiling with cDNA arrays 711
ª Blackwell Publishing Ltd, The Plant Journal, (2004), 39, 697–714
Durrant, W., Rowland, O., Piedras, P., Hammond-Kosack, K. and
Jones, J. (2000) cDNA-AFLP reveals a striking overlap in race-specific resistance and wound response gene expression profiles.Plant Cell, 12, 963–977.
Echols, H. and Goodman, M. (1991) Fidelity mechanisms in DNAreplication. Annu. Rev. Biochem. 60, 477–511.
Eisen, M. and Brown, P. (1999) DNA arrays for analysis of geneexpression. Methods Enzymol. 303, 179–205.
Ewing, R., Kahla, A., Poirot, O., Lopez, F., Audic, S. and Claverie, J.
(1999) Large-scale statistical analyses of rice ESTs revealcorrelated patterns of gene expression. Genome Res. 9,950–959.
Fedorova, M., van de Mortel, J., Matsumoto, P., Cho, J., Town, C.,
VandenBosch, K., Gantt, S. and Vance, C. (2002) Genome-wideidentification of nodule-specific transcripts in the model legumeMedicago truncatula. Plant Physiol. 130, 519–537.
Fei, Z., Tang, X., Alba, R., White, J., Ronning, C., Martin, G.,
Tanksley, S. and Giovannoni, J. (2004) Comprehensive EST ana-lysis of tomato and comparative genomics of fruit ripening.Plant J., doi: 10.1111/j.1365-313X.2004.02188.
Feldmann, A., Costouros, N., Wang, E., Qian, M., Marincola, F.,
Alexander, H. and Libutti, S. (2002) Advantages of mRNA ampli-fication for microarray analysis. Biotechniques, 33, 906–914.
Fodor, S., Read, J., Pirrung, M., Stryer, L., Lu, A. and Solas, D. (1991)Light-directed, spatially addressable parallel chemical synthesis.Science, 251, 767–773.
Fodor, S., Rava, R., Huang, X., Pease, A., Holmes, C. and Adams, C.
(1993) Multiplexed biochemical assays with biological chips.Science, 364, 555–556.
Fowler, S. and Thomashow, M. (2002) Arabidopsis transcriptomeprofiling indicates that multiple regulatory pathways are activa-ted during cold acclimation in addition to the CBF cold responsepathway. Plant Cell, 14, 1675–1690.
Fraser, P., Pinto, M., Holloway, D. and Bramley, P. (2000) Applicationof high-performance liquid chromatography with photodiodearray detection to the metabolic profiling of plant isoprenoids.Plant J. 24, 551–558.
de la Fuente, A., Brazhnik, P. and Mendes, P. (2002) Linking thegenes: inferring quantitative gene networks from microarraydata. Trends Genet. 18, 395–398.
Gill, R., Katsoulakis, E., Schmitt, W., Taroncher-Oldenburg, G.,
Misra, J. and Stephanopoulos, G. (2002) Genome-widedynamic transcriptional profiling of the light-to-dark transitionin Synechocystis sp. strain PCC 6803. J. Bacteriol. 184, 3671–3681.
Hashimoto, R., Kim, S., Shmulevich, I., Zhang, W., Bittner, M. and
Dougherty, E. (2004) Growing genetic regulatory networks fromseed genes. Bioinformatics, 20, 1241–1247.
Hauser, B., Pratt, L. and Cordonnier-Prat, M.-M. (1997) Absolutequantification of five phytochrome transcripts in seedlings andmature plants of tomato (Solanum lycopersicum L.). Planta, 201,379–387.
Hegde, P., Qi, R., Abernathy, K., Gay, C., Dharap, S., Gaspard, R.,
Earle-Hughes, J., Snesrud, E., Lee, N. and Quackenbush, J. (2000)A concise guide to cDNA microarray analysis. Biotechniques, 29,548–562.
Herrero, J., Al-Shahrour, F., Dıaz-Uriarte, R., Mateos, A, Vaquerizas,
J., Santoyo, J. and Dopazo, J. (2003a) GEPAS, a web-basedresource for microarray gene expression data analysis. NucleicAcids Res. 31, 3461–3467.
Herrero, J., Dıaz-Uriarte, R. and Dopazo, J. (2003b) Gene expressiondata preprocessing. Bioinformatics, 19, 655–656.
Hochberg, Y. (1988) A sharper Bonferroni procedure for multipletests of significance. Biometrika, 75, 800–803.
van der Hoeven, R., Ronning, C., Giovannoni, J., Martin, G. and
Tanksley, S. (2002) Deductions about the number, organizationand evolution of genes in the tomato genome based on analysisof a large EST collection and selective genomic sequencing. PlantCell, 14, 1441–1456.
Holm, S. (1979) A simple sequentially rejective multiple test proce-dure. Scand. J. Stat. 6, 65–70.
de Hoon, M., Imoto, S., Kobayashi, K., Ogasawara, N. and Miyano,
S. (2003) Inferring gene regulatory networks from time-orderedgene expression data of Bacillus subtilis using differential equa-tions. Pac. Sym. Biocomp. 8, 17–28.
Horvath, D., Schaffer, R., West, M. and Wisman, E. (2003) Arabid-opsis microarrays identify conserved and differentially expressedgenes involved in shoot growth and development from distantlyrelated plant species. Plant J. 34, 125–134.
Jiang, M., Ryu, J., Kiraly, M., Duke, K., Reinke, V. and Kim, S. (2001)Genome-wide analysis of developmental and sex-regulated geneexpression profiles in Caenorhabditis elegans. Proc. Natl Acad.Sci. USA, 98, 218–223.
Jiao, Y., Yang, H.,Ma, L. et al. (2003) A genome-wide analysis of blue-light regulation of Arabidopsis transcription factor gene expres-sion during seedling development. Plant Physiol. 133, 1480–1493.
Kane, M., Jatkoe, T., Stumpf, C., Lu, J., Thomas, J. and Madore, S.
(2000) Assessment of the sensitivity and specificity of oligonu-cleotide (50mer) microarrays. Nucleic Acids Res. 28, 4552–4557.
Kerr, M. and Churchill, G. (2001) Experimental design for geneexpression microarrays. Biostatistics, 2, 183–201.
Kerr, M., Afshari, C., Bennett, L., Bushel, P., Martinez, J., Walker, N.
and Churchill, G. (2000a) Statistical analysis of gene expressionmicroarray experiment with replication. Statistica Sinica, 12,2003–2118.
Kerr, M., Martin, M. and Churchill, G. (2000b) Analysis of variancefor gene expression microarray data. J. Comp. Biol. 7, 819–837.
Kim, S., Lund, J., Kiraly, M., Duke, K., Jiang, M., Stuart, J., Eizinger,
A., Wylie, B. and Davidson, G. (2001) A gene expression map forCaenorhabditis elegans. Science, 293, 2087–2092.
Kuo, W., Jenssen, T., Butte, A., Ohno-Machado, L. and Kohane, I.
(2002) Analysis of matched mRNA measurements from two dif-ferent microarray technologies. Bioinformatics, 18, 405–412.
Lee, M.-L., Kuo, F., Whitmore, G. and Sklar, J. (2000) Importance ofreplication in microarray gene expression studies: statisticalmethods and evidence from repetitive cDNA hybridizations. Proc.Natl Acad. Sci. USA, 97, 9834–9839.
Liang, P. and Pardee, A. (1992) Differential display of eukaryoticmessenger RNA by means of the polymerase chain reaction.Science, 257, 967–971.
Lipshutz, R., Fodor, S., Gingeras, T. and Lockhart, D. (1999)High density synthetic oligonucleotide arrays. Nat. Genet. 21,20–24.
Lockhart, D., Dong, H., Byrne, M. et al. (1996) Expression monitoringby hybridization to high-density oligonucleotide arrays. NatureBiotech. 14, 1675–1680.
Luo, L., Salunga, R., Guo, H. et al. (1999) Gene expression profiles oflaser-captured adjacent neuronal subtypes. Nat. Med. 5, 117–122.
Lyons-Weiler, J., Patel, S. and Bhattacharya, S. (2003). GEDA (GeneExpression Data Analzyer) http://bioinformatics.upmc.edu/GE2/GEDA.html.
Ma, L., Jinming, L., Qu, L., Hager, J., Chen, Z., Zhao, H. and Deng, X.
(2001) Light control of Arabidopsis development entails coordi-nated regulation of genome expression and cellular pathways.Plant Cell, 13, 2589–2607.
Mah, N., Thelin, A., Lu, T. et al. (2004) A comparison of oligonu-cleotide and cDNA-based microarray systems. Physiol. Genom-ics, 16, 361–370.
712 Rob Alba et al.
ª Blackwell Publishing Ltd, The Plant Journal, (2004), 39, 697–714
Maleck, K., Levine, A., Eulgem, T., Morgan, A., Schmid, J., Lawton,
K., Dangl, J. and Dietrich, R. (2000) The transcriptome of Ara-bidopsis thaliana during systemic acquired resistance. Nat.Genet. 26, 403–410.
Marshall, A. and Hodgson, J. (1998) DNA chips: an array of possi-bilities. Nature Biotech. 16, 27–31.
Mendes, P. (2001) Modeling large scale biological systems fromfunctional genomic data: parameter estimation. In Foundations ofSystems Biology (Kitano, H., ed.), Boston: MIT Press, pp. 163–186.
Monte, D. and Somerville, S. (2003) Isolation of total RNA from planttissue using TRIzol�. In DNA Microarrays – A Molecular CloningManual (Bowtell, D. and Sambrook, J., eds). New York: ColdSpring Harbor Laboratory Press, pp. 120–123.
Moseyko, N., Zhu, T., Chang, H.-S., Wang, X. and Feldman, L. (2002)Transcription profiling of the early gravitropic responses in Ara-bidopsis using high-density oligonucleotide probe microarrays.Plant Physiol. 130, 720–728.
Nadon, R. and Shoemaker, J. (2002) Statistical issues with mic-roarrays: processing and analysis. Trends Genet. 18, 265–271.
Nakazono, M., Qiu, F., Borsuk, L. and Schnable, P. (2003) Laser-capture microdissection, a tool for the global analysis of geneexpression in specific plant cell types: identification of genesexpressed differentially in epidermal cells or vascular tissues ofmaize. Plant Cell, 15, 583–596.
Nishiyama, T., Fujita, T., Shin-I, T. et al. (2003) Comparativegenomics of Physcomitrella patens gametophytic transcriptomeand Arabidopsis thaliana: implication for land plant evolution.Proc. Natl Acad. Sci. USA, 100, 8007–8012.
Ogihara, Y., Mochida, K., Nemoto, Y., Murai, K., Yamazaki, Y., Shin-
I, T. and Kohara, Y. (2003) Correlated clustering and virtual displayof gene expression patterns in the wheat life cycle by large-scalestatistical analyses of expressed sequence tags. Plant J. 33, 1001–1011.
Okubo, K., Hori, N., Matoba, R., Niiyam, T., Fukushima, A., Kojima,
Y. and Matsubara, K. (1992) Large scale cDNA sequencing foranalysis of quantitative and qualitative aspects of gene expres-sion. Nat. Genet. 2, 173–179.
Paterson, A., Bowers, J., Burow, M. et al. (2000) Comparativegenomics of plant chromosomes. Plant Cell, 12, 1523–1540.
Paul, A.-L., Schuerger, A., Popp, M., Richards, J., Manak, M. and
Ferl, R. (2004) Hypobaric biology: Arabidopsis gene expression atlow atmospheric pressure. Plant Physiol. 134, 215–223.
Payton, P., Alba, R. and Moore, S. (2003) Gene expression profiling.In Handbook of Plant Biotechnology (Christou, P. and Klee, H.,eds). New York: John Wiley & Sons Ltd.
Pease, A., Solas, D., Sullivan, E., Cronin, M., Holmes, C. and Fodor,
S. (1994) Light-directed oligonucleotide arrays for rapid DNAsequence analysis. Proc. Natl Acad. Sci. USA, 91, 5022–5026.
Peng, X., Wood, C., Blalock, E., Chen, K.-C., Landfield, P. and
Stromberg, A. (2003) Statistical implications of pooling RNAsamples for microarray experiments. BMC Bioinformatics, 4,26–35.
Phillips, J. and Eberwine, J. (1996) Antisense RNA amplifications: alinear amplification method for analyzing the mRNA populationfrom single living cells. Methods, 10, 283–288.
Puthoff, D., Nettleton, D., Rodermel, S. and Baum, T. (2003) Ara-bidopsis gene expression changes during cyst nematode para-sitism revealed by statistical analyses of microarray expressionprofiles. Plant J. 33, 911–921.
Qin, L., Overmars, H., Helder, J., Popeijus, H., van der Voort, J.,
Groenink, W., van Koert, P., Schots, A., Bakker, J. and Smant, G.
(2000) An efficient cDNA-AFLP-based strategy for the identifica-tion of putative pathogenicity factors from the potato cyst
nematode Globodera rostochiensis. Mol. Plant Microbe Interact.13, 830–836.
Reymond, P., Weber, H., Damond, M. and Farmer, E. (2000) Differ-ential gene expression in response to mechanical wounding andinsect feeding in Arabidopsis. Plant Cell, 12, 707–719.
Roberts, J., Preston, B., Johnston, L., Soni, A., Loeb, L. and Kunkel,
T. (1989) Fidelity of two retroviral reverse transcriptases duringDNA-dependent DNA synthesis in vitro. Mol. Cell. Biol. 9, 469–476.
Rocke, D. and Durbin, B. (2001) A model for measurement error forgene expression arrays. J. Comput. Biol. 8, 557–569.
Rogaev, E., Sherrington, R., Rogaeva, E. et al. (1995) Familial Alz-heimer’s disease in kindreds with missense mutations in a geneon chromosome 1 related to Alzheimer’s disease type 3 gene.Nature, 376, 775–778.
Ronning, C., Stegalkina, S., Ascenzi, R. et al. (2003) Comparativeanalyses of potato expressed sequence tag libraries. Plant Phys-iol. 131, 419–429.
Ruuska, S., Girke, T., Benning, C. and Ohlrogge, J. (2002) Contra-puntal networks of gene expression during Arabidopsis seedfilling. Plant Cell, 14, 1191–1206.
Schaffer, R., Landgraf, J., Accerbi, M., Simon, V., Larson, M. and
Wisman, E. (2001) Microarray analysis of diurnal and circadian-regulated genes in Arabidopsis. Plant Cell, 13, 113–123.
Shalon, D., Smith, S. and Brown, P. (1996) A DNA microarray sys-tem for analyzing complex DNA samples using two-color fluor-escent probe hybridization. Genome Res. 6, 639–645.
Schena, M., Shalon, D., Davis, R. and Brown, P. (1995) Quantitativemonitoring of gene expression patterns with a complimentaryDNA microarray. Science, 270, 467–470.
Shmulevich, I., Gluhovsky, I., Hashimoto, R., Dougherty, E. and
Zhang, W. (2003) Steady-state analysis of genetic regulatorynetworks modeled by probabilistic Boolean networks. Comp.Funct. Gen. 4, 601–608.
Smyth, G., Yang, Y. and Speed, T. (2002) Statistical issues in cDNAmicroarray data analysis. In Functional Genomics – Methods andProtocols (Brownstein, M. and Khodursky, A., eds). Methods inMolecular Biology Series. New Jersey: Humana Press, pp. 111–136.
Storey, J. (2002) A direct approach to false discover rates. J. R. Stat.Soc. B, 64, 479–498.
Tepperman, J., Zhu, T., Chang, H., Wang, X. and Quail, P. (2001)Multiple transcription-factor genes are early targets of phyto-chrome A signaling. Proc. Natl Acad. Sci. USA, 98, 9437–9442.
The Chipping Forecast (1999) Nat. Genet. (Suppl.) 21, 1.Thorp, H. (1998) Cutting out the middleman: DNA biosensors base
on electrochemical oxidation. Trends Biotech. 16, 117–121.Troyanskaya, O., Cantor, M., Sherlock, G., Brown, P., Hastie, T.,
Tibshirani, R., Botstein, D. and Altman, R. (2001) Missing valueestimation methods for DNA microarrays. Bioinformatics, 17,520–525.
Tseng, G., Oh, M., Rohlin, L., Liao, J. and Wong, W. (2001) Issues incDNA microarray analysis: quality filtering, channel normaliza-tion, models of variations and assessment of gene effects.Nucleic Acids Res. 29, 2549–2557.
Tusher, V., Tibshirani, R. and Chu, C. (2001) Significance analysis ofmicroarrays applied to ionizing radiation response. Proc. NatlAcad. Sci. USA, 98, 5116–5121.
Velculescu, V., Zhang, L., Vogelstein, B. and Kinzler, K. (1995) Serialanalysis of gene expression. Science, 270, 484–487.
Ventelon-Debout, M., Nguyen, T., Wissocq, A., Berger, C., Laudie,
M., Piegu, B., Cooke, R., Ghesquiere, A., Delseny, M. and Brugi-
dou, C. (2003) Analysis of the transcriptional response to Rice
Expression profiling with cDNA arrays 713
ª Blackwell Publishing Ltd, The Plant Journal, (2004), 39, 697–714
Yellow Mottle Virus infection in Oryza sativa indica and japonicacultivars. Mol. Genet. Gen. 270, 253–262.
Vision, T. and McLysaght, A. (2003) Computational tools andresources in plant genome informatics. In Handbook of PlantBiotechnology (Christou, P. and Klee, H., eds). New York: Wiley &Sons Ltd, pp. 201–228.
Wang, R., Okamoto, M., Xing, X. and Crawford, N. (2003) Microarrayanalysis of the nitrate response in Arabidopsis roots and shootsreveals over 1,000 rapidly responding genes and new linkages toglucose, trehalose-6-phosphate, iron, and sulfate metabolism.Plant Physiol. 132, 556–567.
Welsh, J., Chada, K., Dalal, S., Cheng, R., Ralph, D. and McClelland,
M. (1992) Arbitrarily primed PCR fingerprinting of RNA. NucleiAcids Res. 20, 4965–4970.
Werner-Washburne,M.,Wylie, B., Boyack, K., Fuge, E., Galbraith, J.,
Fleharty, M., Weber, J. and Davidson, S. (2002) Concurrent ana-lysis of multiple genome-scale datasets. Genome Res. 12, 1564–1573.
Westfall, P. and Young, S. (1993) On adjusting p-values for multi-plicity. Biometrics, 49, 941–944.
Wodicka, L., Dong, H., Mittmann, M., Ho, M.-H. and Lockhart, D.
(1997) Genome-wide expression monitoring in Saccharomycescerevisiae. Nature Biotech. 15, 1359–1367.
Wolfinger, R., Gibson, G., Wolfinger, E., Bennett, L., Hamadeh, H.,
Bushel, P., Afshari, C. and Paules, R. (2001) Assessing gene sig-nificance from cDNA microarray expression data via mixedmodels. J. Comput. Biol. 8, 625–637.
Yang, Y. and Speed, T. (2002a) Design issues for cDNA microarrayexperiments. Nat. Rev. Genet. 3, 579–588.
Yang, Y. and Speed, T. (2003) Design of microarray expressionexperiments. In DNA Microarrays – A Molecular Cloning Manual(Bowtell, D. and Sambrook, J., eds). New York: Cold SpringHarbor Laboratory Press, pp. 517–518.
Yang, Y., Dudoit, S., Luu, P. and Speed, T. (2001) Normalization forcDNA microarrays. Microarrays: optical technologies and infor-matics. SPIE, 4266, 141–152.
Yang, Y., Dudoit, S., Luu, P., Lin, D., Peng, V., Ngai, J. and Speed, T.
(2002b) Normalization for cDNA microarray data: a robust com-posite method addressing single and multiple slide systematicvariation. Nucleic Acids Res. 30, e15.
Yuen, T., Wurmbach, E., Pfeffer, R., Ebersole, B. and Sealfon, S.
(2002) Accuracy and calibration of commercial oligonucleotideand custom cDNA microarrays. Nucleic Acids Res. 30, e48.
714 Rob Alba et al.
ª Blackwell Publishing Ltd, The Plant Journal, (2004), 39, 697–714


![[Dissecting aortic aneurysm simulating an acute myocardial infarct]](https://img.pdfslide.net/doc/110x75/63558f23922cbb7c550ca86c/dissecting-aortic-aneurysm-simulating-an-acute-myocardial-infarct.jpg)

