Embed Size (px)
Citation preview
Ana Rita Freitas Colaço Transporte transmembranar de cloreto por
Squaramides: estudo in silico
Transmembrane transport of chloride by
Squaramides: in silico study
Universidade de Aveiro
2012/2013 Secção Autónoma de Ciências da Saúde

Ana Rita Freitas Colaço Transporte transmembranar de cloreto por
Squaramides: estudo in silico
Transmembrane transport of chloride by
Squaramides: in silico study
Dissertação apresentada à Universidade de Aveiro para
cumprimento dos requisitos necessários à obtenção do grau de
Mestre em Biomedicina Molecular, realizada sob a orientação
científica do Doutor Vítor Manuel Sousa Félix, Professor Associado
com Agregação do Departamento de Química da Universidade de
Aveiro.
Os estudos apresentados nesta dissertação foram realizados com
recursos computacionais adquiridos ao abrigo do Programa
Operacional Factores de Competitividade (COMPETE) e a Fundos
Nacionais da Fundação para a Ciência e a Tecnologia (FCT) sob o
projeto PTDC/QUI-QUI/101022/2008.
Universidade de Aveiro
2012/2013 Secção Autónoma de Ciências da Saúde


Dedico este trabalho aos meus pais,
sem eles não teria conseguido.

o júri
presidente Professora Doutora Odete Abreu Beirão da Cruz e Silva
Professora auxiliar com agregação da Universidade de Aveiro
Professor Doutor Vítor Manuel Sousa Félix
Professor associado com agregação da Universidade de Aveiro
Doutor Paulo Jorge Ferreira de Matos Costa
Equiparado a investigador auxiliar da Unidade de Investigação de Química
Orgânica, Produtos Naturais e Agroalimentares da Universidade de Aveiro

agradecimentos Ao Professor Vítor Félix, pelo apoio, orientação e disponibilidade que sempre
demonstrou durante este período. Por me ter proporcionado esta experiência
enriquecedora e ter partilhado os seus conhecimentos.
À Professora Odeteda Cruz e Silva, directora do Mestrado em Biomedicina
Molecular, pelo apoio à minha formação académica.
Aos colegas do Grupo de Moledação Molecular, Igor, Paulo e Sílvia, pelos
momentos de descontração e pelo companheirismo. Por me acolherem tão bem e
fazerem sentir parte do grupo. Um obrigado especial ao Igor, sem os seus
conselhos e paciência não teria “sobrevivido”.
Aos meus pais e a toda a minha família, sem o seu apoio e sacrifício não teria
chegado aqui. Tudo o que sou devo-lhes a eles.
Às amigas de “viagem”, Rita Ribeiro, Cindy, Sónia e Inês. Obrigada por todos os
momentos bons e menos bons, por me conhecerem tão bem e estarem sempre lá
para o que der e vier.
Às amigas que, apesar da distância, nunca me deixaram e sempre me apoiaram,
Li e Sandra.

palavras-chave Fibrose quística, simulações de dinâmica molecular, transporte transmembranar
de cloreto, squaramides, GAFF, parametrização, POPC
resumo O transporte de aniões através de membranas celulares é essencial para o
funcionamento da célula e a sua regulação depende de canais transmembranares.
O mau funcionamento destes canais leva a canalopatias, designadamente o dano
dos canais de cloreto associado à fibrose quística. Estas doenças têm motivado os
químicos supramoleculares para o desenvolvimento de novos transportadores
sintéticos de cloreto visando uma potencial aplicação em terapias de substituição
de canais. Neste contexto, esta dissertação reporta um estudo in silico em que se
avalia a capacidade de cinco squaramides (amidas quadrangular planas)
assistirem o transporte de cloreto através de uma bicamada de POPC. De facto,
estudos experimentais anteriores demonstraram que estas pequenas moléculas
são capazes de mediar o efluxo de cloreto de vesículas de POPC com maior
eficiência do que os seus análogos tioureias e ureias, actuando como
transportadores móveis através de um mecanismo de permuta de aniões.
Esta investigação teórica foi realizada com base em cálculos quânticos e
simulações de dinâmica molecular num modelo de membrana POPC. As
simulações foram precedidas pelo desenvolvimento de parâmetros específicos
para as ligações e ângulos da unidade central da squaramide, sendo que o resto
das moléculas descritas com parâmetros de defeito do GAFF. Os fosfolipídos
foram descritos com parâmetros do campo de forças LIPID11. A difusão passiva
dos complexos de cloreto foi investigada colocando cada um dos receptores em
diferentes posições de partida: na fase aquosa e no meio da bicamada de POPC.
Em ambos os casos, os receptores moveram-se em direcção à interface da
membrana tendo-se posicionado abaixo das cabeças dos lípidos. No primeiro
caso, o cloreto foi libertado ainda na fase aquosa antes do receptor chegar à
interface. Enquanto que no segundo caso a libertação do cloreto ocorreu
concomitantemente com a aproximação do receptor à interface. Durante o tempo
de simulação os receptores interactuaram principalmente com as cabeças dos
lípidos via ligações de hidrogénio N-H···O.

keywords Cystic fibrosis, molecular dynamics simulations, chloride transmembrane
transport, squaramides, GAFF, parameterization, POPC
abstract The anion transport across cellular membranes is essential to the cell functioning
and its regulation depends on transmembrane channels. The malfunction of ion
channels leads to channelopathies. In particularly, the impairment of chloride ion
channels is associated with cystic fibrosis. These diseases have motivated the
supramolecular chemists for the development of new chloride synthetic
transporters with potential use in channel replacement therapies. In this context,
this thesis reports an in silico study performed to evaluate the ability of five
squaramides to assist the chloride transport across a POPC bilayer. Indeed,
earlier experimental studies have shown that these small molecules were able to
mediate the chloride efflux across POPC vesicles more efficiently than their
analogous thioureas and ureas, as mobile-carriers using an anion-exchange
mechanism.
This theoretical investigation was carried out by a combination of quantum
calculations and Molecular Dynamics simulations in a POPC membrane model.
The MD simulations were preceded by the development of specific bond term
parameters for the squaramide moiety using the crystal data from an extensive
series of squaramides. The remaining parts of these molecules were described
with GAFF default parameters. The phospholipids were described with
parameters taken from LIPID11. The passive diffusion of chloride complexes was
investigated by placing each receptor in two different starting positions: in the
water slab and in the bilayer core of the POPC membrane model. In both cases
the receptor moved towards the water/lipid interface and accommodated
themselves below the lipid head groups. In the first case, the chloride release
occurred in the water slab before the receptor reaches the water/lipid interface.
By contrast, in the second case the chloride is released concomitantly with the
receptor approach to the interface. The squaramides interact with phospholipid
head groups mainly via N-H···O hydrogen bonds as analyzed along the thesis.

publicações e comunicações durante a realização desta dissertação, foram elaborados os
científicas seguintes trabalhos científicos:
Artigos científicos
Marques, I., Colaço, A. R., Costa, P. J., Busschaert, N., Gale, P. A. and Félix, V. Tris-Thiourea Tripodal-based Molecules as Chloride Transmembrane Transporters: Insights from Molecular Dynamics Simulations, 2013, (submitted).
Pósteres científicos
Colaço, A. R., Marques, I. and Félix, V., Transmembrane transport of chloride by Squaramides: an in silico study, Encontro de Jovens Investigadores de Biologia Computacional Estrutural (EJIBCE 2013), Porto, 2013.
I. Marques, Costa, P.J., Colaço, A.R., Félix V., Tris-Thiourea Tripodal-based Molecules as Chloride Transmembrane Transporters: Insights from Molecular Dynamics Simulations, Encontro de Jovens Investigadores de Biologia Computacional Estrutural (EJIBCE 2013), Porto, 2013.

Transmembrane transport of chloride by Squaramides: in silico study
University of Aveiro – Masters in Molecular Biomedicine i
Index
Figures Index .............................................................................................................................................................. iii
Tables Index ............................................................................................................................................................. xiii
Abbreviations .......................................................................................................................................................... xvii
1. Introduction ........................................................................................................................................................ 1
1.1. Biological membranes and channelopathies ................................................................................ 1
Biological membranes: overview ............................................................................................ 1 1.1.1.
Membrane proteins ...................................................................................................................... 3 1.1.2.
Transport of small molecules across the lipid membrane ............................................ 5 1.1.3.
Channelopathies ............................................................................................................................. 8 1.1.4.
1.2. Synthetic anion transporters ........................................................................................................... 10
General considerations ............................................................................................................. 10 1.2.1.
Development of synthetic anionophores .......................................................................... 10 1.2.2.
1.3. Squaramides as anion receptors .................................................................................................... 16
Applications .................................................................................................................................. 19 1.3.1.
1.4. Molecular dynamics simulations of biomembrane systems ............................................... 21
Molecular modelling studies .................................................................................................. 21 1.4.1.
MD simulations of membrane models ................................................................................ 24 1.4.2.
1.5. Objectives ................................................................................................................................................ 30
2. Force filed parameterization of the squaramide receptors .......................................................... 31
2.1. Parameterization of the squaramide moiety ............................................................................. 31
2.2. Conformational analyses ................................................................................................................... 52
Conformational analysis of the free receptors ................................................................ 52 2.2.1.
Conformational analysis of chloride associations ......................................................... 57 2.2.2.
3. Chloride transport across a phospholipid bilayer with squaramide receptors .................... 59
3.1. Pure membranes .................................................................................................................................. 60
3.2. Membranes and squaramide receptors....................................................................................... 68
MD Simulations of the receptors starting from the water phase ............................ 69 3.2.1.
MD Simulations of the receptors starting from within the membrane ................. 87 3.2.2.
4. Conclusions ................................................................................................................................................... 105
5. Future work .................................................................................................................................................. 107
6. References ..................................................................................................................................................... 109
7. Appendix 1 ..................................................................................................................................................... 119

Transmembrane transport of chloride by Squaramides: in silico study
University of Aveiro – Masters in Molecular Biomedicine iii
Figures Index
Figure 1 – Schematic representation of an animal cell with the cellular membrane enclosing
the intracellular organelles, also surrounded by biomembranes, responsible for maintaining
the specific composition of cytosol and organelles’ mediums. ................................................................ 1
Figure 2 – Phospholipid distribution across the membrane bilayer. The two leaflets do not
have the same composition. Image adapted from reference (4). ............................................................ 3
Figure 3 – Schematic representation of the membrane proteins. In blue integral protein
(transmembrane protein), in green lipid-anchored proteins, in red cytosolic peripheral
protein, in pink and orange exoplasmic peripheral. proteins. In the cytosolic face, peripheral
proteins interact with cytoskeleton filaments (green filaments). .......................................................... 4
Figure 4 – Schematic representation of the glycosylphosphatidylinositol (GPI) anchor. ............. 4
Figure 5 – Schematic representation of the mechanisms by which synthetic ionophores
operate. ........................................................................................................................................................................ 11
Figure 6 – Schematic representation of HCl co-transport by prodigiosin molecule as a mobile
carrier.(18) ................................................................................................................................................................. 11
Figure 7 – Terabutylamide calix[4]arene showing chloride transmembrane transport activity
in 1,3-alternate (left) and cone (right) conformations. ............................................................................. 12
Figure 8 – Examples of dipyrrole (a and b) and polypyrrole (c) molecules from Sessler´s et al
studies. (30-33) ........................................................................................................................................................ 13
Figure 9 – Amidopyrroles derivatives with chloride transmembrane transport activity
incorporating and imizadole (a) and pyridine groups (b).(34) ............................................................ 13
Figure 10 – Bis-indolylurea (a) (36) and bisurea (b) (37) transporters developed by Gale and
co-workers. ................................................................................................................................................................ 13
Figure 11 – Functionalization of the cholic acid (left) with different binding and transport
groups (right).(42, 43) .......................................................................................................................................... 14
Figure 12 – Schematic representation of the relay mechanism. ........................................................... 15
Figure 13 – Phospholipid derivative with an ionophore with a relatively high affinity for Cl−
(4-nitrophenylurea group) appended. ............................................................................................................ 15
Figure 14 – Schematic representation of a squaric acid molecule....................................................... 16
Transmembrane transport of chloride by Squaramides: in silico study
iv University of Aveiro – Masters in Molecular Biomedicine
Figure 15 – Squaramides can form up to four hydrogen bonds (two acceptor and two donor).
......................................................................................................................................................................................... 16
Figure 16 – Schematic representation of anti/anti (a), syn/syn (b) and syn/anti (c)
conformations of a squaramide. ........................................................................................................................ 17
Figure 17 – Crystal structure of squaramide S01 (EWOCAV) organized in a chain, according to
their anti/anti conformation, showing a head-to-tail packing (left) and π-stacking interactions
between phenyl groups (right). Image adapted from CSD with Pymol software. .......................... 17
Figure 18 – Crystal structure of the chloride complex with p-dinitrophenyl squaramide (CSD
Refcode MUYYOV). Oxygen, carbon, nitrogen and hydrogen atoms are in red, wheat, blue and
white, respectively. Chloride anion is in green and hydrogen bonds are drawn as black
dashes. .......................................................................................................................................................................... 18
Figure 19 – MP2 optimized squaramides, bond lengths (Å) in the ring tend to equalization as
more hydrogen bonds are established, up to the four possible ones. I – none hydrogen bond;
II – two acceptor hydrogen bonds; III – two donor hydrogen bonds; IV – four hydrogen bonds.
Image adapted from Quiñonero et al.(56) ..................................................................................................... 19
Figure 20 – Schematic representation of the valve-like mechanism from Muthyala et al.(71) 20
Figure 21 – Lennard-Jones potential curve. .................................................................................................. 23
Figure 22 –The four types of phospholipids commonly used in MD simulations as membrane
models: 1, 2-dioleoyl-sn-glycero-3-phosphocholine (DOPC), 1-palmitoyl-2-oleoyl-sn-glycero-
3-phosphocholine (POPC), 1, 2-dimyristoyl-sn-glycero-3-phosphocholine (DMPC), and 1, 2-
dipalmitoyl-sn-3-phosphocholine (DPPC). .................................................................................................... 25
Figure 23 – Snapshots taken from the MD simulation illustrating the passive diffusion of a
bisurea transporter along the lipid bilayer.(37) ......................................................................................... 28
Figure 24 – Snapshots taken from the MD simulation illustrating the internalization process
of bis-indolylurea transporter, into the POPC phospholipid bilayer.(36) ........................................ 29
Figure 25 – Schematic representation of the squaramide motif used in the CSD search (left)
and of the squaramide moiety with the GAFF default atom-types (right). ....................................... 31
Figure 26 – Squaramides compounds whose single crystal X-ray diffraction structures were
deposited with CSD ................................................................................................................................................. 34
Figure 27 – Squaramides compounds whose single crystal X-ray diffraction structures were
deposited with CSD (continuation). ................................................................................................................. 35
Transmembrane transport of chloride by Squaramides: in silico study
University of Aveiro – Masters in Molecular Biomedicine v
Figure 28 – Schematic representation of squaramide moiety with the atom types: in black the
default GAFF atom types; in red the new atom types created for the specific parameterization.
......................................................................................................................................................................................... 39
Figure 29 – Squaramide series from the collaboration project with Prof. Phil A. Gale’s group.
......................................................................................................................................................................................... 41
Figure 30 – Squaramide series from the collaboration project with Prof. Phil A. Gale’s group
(continuation). .......................................................................................................................................................... 42
Figure 31 – Diagram for the receptor preparation before conformational analyses and MD
simulations. ................................................................................................................................................................ 43
Figure 32 – DFT optimized structures (B3LYP/6-311+G** level) of S30 organized in dimer (a
and b) or trimmer (c, d and e) structures. Carbon, oxygen, nitrogen and hydrogen atoms are
represented in wheat, red, blue and white, respectively. Black dashes represent hydrogen
bonds between monomers. ................................................................................................................................. 48
Figure 33 – Diagram for conformational analysis of the free squaramides. .................................... 53
Figure 34 –Atomic numbering adopted for S01-S20................................................................................. 53
Figure 35 – Molecular mechanics structures a- anti/anti (a), syn/syn (b) and syn/anti (c)
conformations of S01. ............................................................................................................................................ 56
Figure 36 – Lowest energy conformations found in conformational analysis of chloride
associations with S01, S09, S10, S19 and S20. Carbon, oxygen, nitrogen, hydrogen, chloride
and fluorine atoms are represented in wheat, red, blue, white, green and cyan, respectively.
Chloride anion is represented as a green sphere and the hydrogen bonds are represented as
black dashed lines. .................................................................................................................................................. 58
Figure 37 – Evolution of the area per lipid in the MD simulation of membrane model II (red
line) in comparison with reference values from Kučerka (117) (green line) and Félix (118)
(blue line). .................................................................................................................................................................. 63
Figure 38 – Evolution of bilayer thickness in the 50ns of MD simulation time (red line) in in
comparison with experimental values from Kučerka (117) (green line) and Félix (118) (blue
line). .............................................................................................................................................................................. 63
Figure 39 – Computed order parameters, |SCD|, for the palmitoyl and oleyl chains for the last
20 ns of imulation time of model II. The |SCD| calculated values are in red and in green for the
sn-1 and sn-2 chains, respectively. The error bars shown correspond to the standard
Transmembrane transport of chloride by Squaramides: in silico study
vi University of Aveiro – Masters in Molecular Biomedicine
deviation. In plot a the experimental values for the sn-1 chain were obtained from reference
(132) (brown) and (133) (orange), while the values for sn-2 chain were taken from reference
(134) (magenta) and (133) (blue). In plot b, the reference values for |SCD| were obtained from
LIPID11 paper (84) (sn-1 chain in orange and sn-2 chain in brown) and from Félix et al. paper
(118) (sn-1 chain in blue and sn-2 chain in magenta). ............................................................................. 64
Figure 40 – Electron density profiles of the pure membrane model II for the last 20 ns of MD
simulation with full system profile plotted in black, water in blue, phospholipids in green and
phosphorus in dark yellow. The z=0 Å corresponds to the core of the POPC bilayer. In plot a,
the X-ray scattering of the POPC bilayer profile at 303 K is shown as a magenta line (117). In
plot b, the full system density profile for the pure membrane simulated by Félix et al is shown
as a red line.(118) .................................................................................................................................................... 66
Figure 41 - Snapshots of system A, taken at different simulation times (0, 50 and 100 ns),
showing the diffusion of S01. Images show the different positions of the receptor in the
membrane. The receptor is drawn in a space filling model with carbon atoms in wheat,
oxygen atoms in red, nitrogen atoms in blue and hydrogen atoms in white. The chloride ion
and the phosphorus atoms are represented as green and orange spheres, scaled to 0.7 vdW
radius, respectively. In POPC lipids, carbon, nitrogen and oxygen atoms are drawn as grey,
blue and red lines, respectively, while C-H hydrogen atoms have been omitted for clarity. .... 70
Figure 42 – Snapshots of system B showing S09 diffusion towards the membrane. Fluorine
atoms and sodium ion are drawn as cyan and magenta spheres, respectively. Remaining
details as given in Figure 41. ............................................................................................................................... 70
Figure 43 - Snapshots of system C showing S10 diffusion towards the membrane. Fluorine
atoms and sodium ion are drawn as cyan and magenta spheres, respectively. Remaining
details as given in Figure 41. ............................................................................................................................... 71
Figure 44 - Snapshots of system D showing S19 diffusion towards the membrane. Fluorine
and chloride atoms are drawn as cyan and green spheres, respectively. Remaining details as
given in Figure 41. ................................................................................................................................................... 71
Figure 45 - Snapshots of system E showing S20 diffusion towards the membrane. The sodium
ion is drawn as a magenta sphere. Remaining details as given in Figure 41. .................................. 71
Figure 46 - Evolution of the receptor and chloride relative positions to the water/lipid
interface (z=0 Å). In green is represented the chloride ion, in red the centre of mass of the
oxygen atoms from the receptor, in blue the centre of mass of the nitrogen atoms, in magenta
Transmembrane transport of chloride by Squaramides: in silico study
University of Aveiro – Masters in Molecular Biomedicine vii
and cyan are represented the phenyl groups (A, B and C); a phenyl group and an aliphatic
chain (D) or an aliphatic chain and a butyl group (E), respectively. Data was smoothed using
Bézier curves. ............................................................................................................................................................ 73
Figure 47 – Variation of the number of water molecules within the solvation shell defined by
a cut-off of 3.5Å from receptors S01 (A), S09 (B), S10 (C), S19 (D) and S20 (E). Data was
smoothed using Bézier curves. .......................................................................................................................... 75
Figure 48 – Average number of hydrogen bonds vs the relative position of the centre of mass
of each receptor. The following colour scheme was used for the hydrogen bonds established
between the receptor and water molecules (red), chloride ion (green), POPC head groups
(blue), ester groups from POPC sn-1 chains (magenta) and sn-2 chains (cyan). ........................... 76
Figure 49 – Schematic representation of the sqauaramide’s core. The atoms involved in the
dihedral angles analysis are identified in red. ............................................................................................. 77
Figure 50 – Frequency histograms showing the distribution of the two C=C-N-C torsion angles
values of S01, S09 and S10 in systems A, B and C, before the interaction with the water/lipid
interface (pre interaction) and after (post interaction). ........................................................................... 78
Figure 51 – Frequency histograms showing the distribution of the two C=C-N-C torsion angles
values of S19 and S20 in systems D and E, before the interaction with the water/lipid
interface (pre interaction) and after (post interaction). ........................................................................... 79
Figure 52 – Evolution of area per lipid through the course of the MD simulation time is
represented in red. The reference value from Félix et al (118) is plotted as a blue line. ........... 81
Figure 53 – Evolution of the bilayer thickness (red line) through the MD simulation of
systems A-E. Comparison with theoretical values from membrane model I simulation (64.9 Å
in blue). ........................................................................................................................................................................ 82
Figure 54 – Electron density profiles of the membrane systems A-E, estimated for the last 40
ns of MD simulation. The receptor is plotted as a red line and scaled 5 times. The full system
is plotted in black, the water in blue, the phospholipids in green and the phosphorus in dark
yellow. z= 0 Å corresponds to the core of the POPC bilayer. Reference profile from membrane
model is represented in magenta. ..................................................................................................................... 84
Figure 55 – Computed |SCD| for palmitoyl and oleyl chains for 40 ns of sampling of simulations
A, B and D; for the last 15 ns of sampling of system C and for the last 10ns of system E. The
|SCD| values calculated for the sn-1 chain are shown in red, while the values for the sn-2 chain
are shown in green. The error bars associated with these results correspond to the standard
Transmembrane transport of chloride by Squaramides: in silico study
viii University of Aveiro – Masters in Molecular Biomedicine
deviation. The computed |SCD| values from reference model I are presented in blue (sn-1
chain), and magenta (sn-2 chain). ..................................................................................................................... 85
Figure 56 – Snapshots of system F, taken at different simulation times (0, 50 and 100 ns),
showing the diffusion of S01. Images show the different positions of the receptor in the
membrane. The receptor is drawn in a space filling model with carbon atoms in wheat,
oxygen atoms in red, nitrogen atoms in blue and hydrogen atoms in white. The chloride and
sodium ions, as well as the phosphorus atoms from the bilayer are represented as green,
magenta and orange spheres, scaled to 0.7 vdW radius, respectively. In POPC lipids, carbon,
nitrogen and oxygen atoms are drawn as grey, blue and red lines, respectively, while C-H
hydrogen atoms have been omitted for clarity............................................................................................ 88
Figure 57 - Snapshots of system G, illustrating the diffusion process of S09. Fluorine atoms
are drawn as cyan spheres. Remaining details as given in Figure 56. ................................................ 88
Figure 58 - Snapshots of system H, illustrating the diffusion process of S10. Fluorine atoms
are drawn as cyan spheres. Remaining details as given in Figure 56. ................................................ 89
Figure 59 - Snapshots of system I, illustrating the diffusion process of S19. Fluorine atoms are
drawn as cyan spheres. Remaining details as given in Figure 56. ....................................................... 89
Figure 60 - Snapshots of system J, illustrating the diffusion process of S20. Remaining details
as given in Figure 56............................................................................................................................................... 89
Figure 61 - Evolution of the receptor and chloride relative positions to the water/lipid
interface (z = 0 Å). In green is represented the chloride ion, in red the centre of mass of the
oxygen atoms from the receptor, in blue the centre of mass of the nitrogen atoms, in magenta
and cyan are represented the phenyl groups (F, G and H); a phenyl group and an aliphatic
chain (I) or an aliphatic chain and a butyl group (J), respectively. Data was smoothed using
Bézier curves. ............................................................................................................................................................ 90
Figure 62 - Variation of the number of water molecules within the solvation shell defined by a
cut-off of 3.5Å from receptors S01 (F), S09 (G), S10 (H), S19 (I) and S20 (J). Data was
smoothed using Bèzier curves. ........................................................................................................................... 92
Figure 63 - Average number of hydrogen bonds vs the relative position of the centre of mass
of each receptor. The following colour scheme was used for the hydrogen bonds established
between the receptor and water molecules (red), chloride ion (green), POPC head groups
(blue), ester groups from POPC sn-1 chains (magenta) and sn-2 chains (cyan). ........................... 94
Transmembrane transport of chloride by Squaramides: in silico study
University of Aveiro – Masters in Molecular Biomedicine ix
Figure 64 - Frequency histograms showing the distribution of the two C=C-N-C torsion angles
values of S01-S20 in simulations F-J, in the last 40ns of simulation time......................................... 96
Figure 65 - Evolution of area per lipid through the course of the MD simulation time is
represented in red. The reference value from the simulation of membrane model II is plotted
as a blue line. ............................................................................................................................................................. 98
Figure 66 - Evolution of the bilayer thickness (red line) through the MD simulation of systems
A-E. The reference value from the simulation of membrane model II is plotted as a blue line.
......................................................................................................................................................................................... 99
Figure 67 - Electron density profiles of the membrane systems F-J, estimated for the last 40 ns
of MD simulation. The receptor is plotted as a red line and scaled 5 times. The full system is
plotted in black, the water in blue, the phospholipids in green and the phosphorus in dark
yellow. z =0 Å corresponds to the core of the POPC bilayer. System profile from membrane
model II simulation is represented in magenta........................................................................................ 101
Figure 68 – Computed |SCD| for palmitoyl and oleyl chains for 40 ns of sampling of simulations
F-J. The |SCD| values calculated for the sn-1 chain are shown in red, while the values for the sn-
2 chain are shown in green. The error bars associated with these results correspond to the
standard deviation. The computed |SCD| values from membrane model II simulation are
presented in blue (sn-1 chain), and brown (sn-2 chain). ...................................................................... 103
Figure 69 – Snapshots of system A, taken at different simulation times (0ns, 50ns and 100ns),
showing the diffusion of S01. Images show the initial and final positions of the receptor in the
membrane. The receptor is drawn as a space filing model with carbon atoms in wheat, oxygen
atoms in red, nitrogen atoms in blue and hydrogen atoms in white. The chloride and sodium
ions, as well as the phosphorus atoms from the bilayer are represented as green, magenta
and orange spheres, respectively, and scaled to 0.7 vdW radius. In POPC lipids, carbon atoms
are drawn as grey lines and C-H hydrogen atoms have been omitted. ........................................... 119
Figure 70 – Snapshots of system B showing S09 diffusion towards the membrane. Fluorine
atoms are drawn as cyan spheres. Remaining details as given in Figure 69. ............................... 119
Figure 71 – Snapshots of system C showing S10 diffusion towards the membrane. Fluorine
atoms are drawn as cyan spheres. Remaining details as given in Figure 69. ............................... 120
Figure 72 – Snapshots of system D showing S19 diffusion towards the membrane. Fluorine
atoms are drawn as cyan spheres. Remaining details as given in Figure 69. ............................... 120
Transmembrane transport of chloride by Squaramides: in silico study
x University of Aveiro – Masters in Molecular Biomedicine
Figure 73 – Snapshots of system E showing S20 diffusion towards the membrane. Remaining
details as given in Figure 69. ............................................................................................................................ 120
Figure 74 – Evolution of the receptor and chloride relative positions to the water/lipid
interface (z = 0 Å). In green is represented the chloride ion, in red the centre of mass of the
oxygen atoms from the receptor, in blue the centre of mass of the nitrogen atoms, in magenta
and cyan are represented the phenyl groups (A, B and C); a phenyl group and an aliphatic
chain (D) or an aliphatic chain and a butyl group (E), respectively. Data was smoothed using
Bézier curves. ......................................................................................................................................................... 121
Figure 75 – Variation of the number of water molecules within the solvation shell defined by
a cut-off of 3.5 Å from receptors S01 (A), S09 (B), S10 (C), S19 (D) and S20 (E). Data was
smoothed using Bèzier curves. ........................................................................................................................ 122
Figure 76 – Average number of hydrogen bonds vs the relative position of the centre of mass
of each receptor. The following colour scheme was used for the hydrogen bonds established
between the receptor and water molecules (red), chloride ion (green), POPC head groups
(blue), ester groups from POPC sn-1 chains (magenta) and sn-2 chains (cyan). ........................ 123
Figure 77 – Frequency histograms showing the distribution of the two C=C-N-C torsion angles
values of S01, S09 and S10 in systems A, B and C, before the interaction with the water/lipid
interface (pre interaction) and after (post interaction). ........................................................................ 124
Figure 78 – Frequency histograms showing the distribution of the two C=C-N-C torsion angles
values of S19 and S20 in systems D and E, before the interaction with the water/lipid
interface (pre interaction) and after (post interaction). ........................................................................ 125
Figure 79 – Evolution of area per lipid through the course of the MD simulation time is
represented in red. The reference value from Félix et al (118) is plotted as a blue line. ........ 126
Figure 80 – Evolution of the bilayer thickness (red line) through the MD simulation of
systems A-E. Comparison with theoretical values from membrane model I simulation (64.9 Å
in blue). ..................................................................................................................................................................... 127
Figure 81 – Electron density profiles of the membrane systems A-E, estimated for the last 40
ns of simulations A, B and D; for the last 15 ns of sampling of system C and for the last 10ns of
system E. The receptor is plotted as a red line and scaled 5 times. The full system is plotted in
black, the water in blue, the phospholipids in green and the phosphorus in dark yellow. z= 0 Å
corresponds to the core of the POPC bilayer. Reference profile from membrane model is
represented in magenta. .................................................................................................................................... 128
Transmembrane transport of chloride by Squaramides: in silico study
University of Aveiro – Masters in Molecular Biomedicine xi
Figure 82 – Computed |SCD| for palmitoyl and oleyl chains for 40 ns of sampling of simulations
A, B and D; for 15 ns of sampling of system C and for 10ns of system E. The |SCD| values
calculated for the sn-1 chain are shown in red, while the values for the sn-2 chain are shown
in green. The error bars associated with these results correspond to the standard deviation.
The computed |SCD| values from reference model I are presented in blue (sn-1 chain), and
magenta (sn-2 chain). ......................................................................................................................................... 129
Figure 83 – Snapshots of system F, taken at different simulation times (0, 50 and 100 ns),
showing the diffusion of S01. Images show the different positions of the receptor in the
membrane. The receptor is drawn in a space filling model with carbon atoms in wheat,
oxygen atoms in red, nitrogen atoms in blue and hydrogen atoms in white. The chloride and
sodium ions, as well as the phosphorus atoms from the bilayer are represented as green,
magenta and orange spheres, scaled to 0.7 vdW radius, respectively. In POPC lipids, carbon,
nitrogen and oxygen atoms are drawn as grey, blue and red lines, respectively, while C-H
hydrogen atoms have been omitted for clarity. ....................................................................................... 130
Figure 84 – Snapshots of system G, illustrating the diffusion process of S09. Fluorine atoms
are drawn as cyan spheres. Remaining details as given in Figure 83. ............................................ 130
Figure 85 – Snapshots of system H, illustrating the diffusion process of S10. Fluorine atoms
are drawn as cyan spheres. Remaining details as given in Figure 83. ............................................ 131
Figure 86 – Snapshots of system I, illustrating the diffusion process of S19. Fluorine and
chloride atoms are drawn as cyan and green spheres. Remaining details as given in Figure 83.
...................................................................................................................................................................................... 131
Figure 87 – Snapshots of system J, illustrating the diffusion process of S20. Remaining details
as given in Figure 83. .......................................................................................................................................... 131
Figure 88 – Evolution of the receptor and chloride relative positions to the water/lipid
interface (z = 0 Å). In green is represented the chloride ion, in red the centre of mass of the
oxygen atoms from the receptor, in blue the centre of mass of the nitrogen atoms, in magenta
and cyan are represented the phenyl groups (F, G and H); a phenyl group and an aliphatic
chain (I) or an aliphatic chain and a butyl group (J), respectively. Data was smoothed using
Bézier curves. ......................................................................................................................................................... 132
Figure 89 – Variation of the number of water molecules within the solvation shell defined by
a cut-off of 3.5Å from receptors S01 (F), S09 (G), S10 (H), S19 (I) and S20 (J). Data was
smoothed using Bèzier curves. ....................................................................................................................... 133
Transmembrane transport of chloride by Squaramides: in silico study
xii University of Aveiro – Masters in Molecular Biomedicine
Figure 90 – Average number of hydrogen bonds vs the relative position of the centre of mass
of each receptor. The following colour scheme was used for the hydrogen bonds established
between the receptor and water molecules (red), chloride ion (green), POPC head groups
(blue), ester groups from POPC sn-1 chains (magenta) and sn-2 chains (cyan). ........................ 134
Figure 91 – Frequency histograms showing the distribution of the two C=C-N-C torsion angles
values of S01-S20 in simulations F-J, in the last 40ns of simulation time. ..................................... 135
Figure 92 – Evolution of area per lipid through the course of the MD simulation time is
represented in red. The reference value from the simulation of membrane model II is plotted
as a blue line. .......................................................................................................................................................... 136
Figure 93 – Evolution of the bilayer thickness (red line) through the MD simulation of
systems A-E. The reference value from the simulation of membrane model II is plotted as a
blue line. ................................................................................................................................................................... 137
Figure 94 – Electron density profiles of the membrane systems F-J, estimated for the last 40
ns of MD simulation. The receptor is plotted as a red line and scaled 5 times. The full system
is plotted in black, the water in blue, the phospholipids in green and the phosphorus in dark
yellow. z =0 Å corresponds to the core of the POPC bilayer. System profile from membrane
model II simulation is represented in magenta. ....................................................................................... 138
Figure 95 – Computed |SCD| for palmitoyl and oleyl chains for 40 ns of sampling of simulations
F-J. The |SCD| values calculated for the sn-1 chain are shown in red, while the values for the sn-
2 chain are shown in green. The error bars associated with these results correspond to the
standard deviation. The computed |SCD| values from membrane model II simulation are
presented in blue (sn-1 chain), and brown (sn-2 chain). ...................................................................... 139
Transmembrane transport of chloride by Squaramides: in silico study
University of Aveiro – Masters in Molecular Biomedicine xiii
Tables Index
Table 1 – Differences between the two classes of natural ion transporters, carrier proteins
and ion channels. ........................................................................................................................................................ 5
Table 2 – Summary of the transport mechanisms of small molecules and ions across the lipid
membrane. .................................................................................................................................................................... 6
Table 3 – Functional units that compose an ion channel............................................................................ 7
Table 4 – Ion channel functions. ........................................................................................................................... 7
Table 5 – Classes of CF gene mutations associated with cystic fibrosis. .............................................. 9
Table 6 – Force Field types currently used and phospholipids tested. .............................................. 26
Table 7 – Crystal structures deposited with Cambridge Structural Data Base with their CSD
Refcodes and references. ...................................................................................................................................... 32
Table 8 – Bond lengths (Å) in the squaramide moiety in the crystal structures deposited with
CSD. ............................................................................................................................................................................... 32
Table 9 – Bond angles (°) in the squaramide moiety in the crystal structures deposited with
CSD. ............................................................................................................................................................................... 33
Table 10 – Bond lengths (Å) of MM optimized squaramides using AM1-BCC charges and GAFF
default parameters.................................................................................................................................................. 37
Table 11 – Bond lengths (Å) of MM optimized squaramides using RESP charges and GAFF
default parameters. ................................................................................................................................................. 38
Table 12 – Parameters to estimate the bond stretching force constants in GAFF for bonds
involving C/C, C/N and C/O atom pairs. (109) ............................................................................................ 39
Table 13 – Parameters to estimate the bond angle bending force constants in GAFF.(109) .... 40
Table 14 – Force field parameters for the bond lengths of the squaramide moiety. ................... 40
Table 15 – Force field parameters for the bond angles of the squaramide moiety. ..................... 40
Table 16 – Comparison between the average bond lengths (Å) from X-ray structures and MM
optimized structures with GAFF default parameters and AM1-BCC and RESP charges. ............ 44
Table 17 – Bond lengths (Å) of the selected squaramides optimized at the B3LYP/6-31G*
level. .............................................................................................................................................................................. 45
Transmembrane transport of chloride by Squaramides: in silico study
xiv University of Aveiro – Masters in Molecular Biomedicine
Table 18 – Bond lengths (Å) of the selected squaramides optimized at the B3LYP/6-311+G**.
......................................................................................................................................................................................... 46
Table 19 – Bond lengths (Å) of the selected squaramides optimized at the MP2/6-31G* level.
......................................................................................................................................................................................... 47
Table 20 – Comparison between the bond lengths (Å) from MM optimizations with GAFF
default parameters and quantum optimizations at B3LYP/6-31G*, B3LYP/6-311+G** and
MP2/6-31G*. .............................................................................................................................................................. 48
Table 21 – – Bond lengths (Å) for S30 arranged in dimer or trimmer assembles optimized at
B3LYP/6-311+G**. .................................................................................................................................................. 49
Table 22 – Bond lengths (Å) of the MM optimized squaramides using AM1-BCC charges and x-
ray parameters. ........................................................................................................................................................ 50
Table 23 – Bond lengths (Å) of the MM optimized squaramides using RESP charges and x-ray
parameters ................................................................................................................................................................. 50
Table 24 – RMSD calculated for structures optimized with AM1-BCC charges. ............................. 51
Table 25 – RMSD calculated for structures optimized with RESP charges. ..................................... 51
Table 26 – Atom types and RESP charges for S01. ..................................................................................... 54
Table 27 – Atom types and RESP charges for S09. ..................................................................................... 54
Table 28 – Atom types and RESP charges for S10. ..................................................................................... 54
Table 29 – Atom types and RESP charges for S19. ..................................................................................... 55
Table 30 – Atom types and RESP charges for S20. ..................................................................................... 55
Table 31 – Relative molecular mechanics energies (kcal/mol) for syn/syn, syn/anti and
anti/anti conformations of S01-S20. ................................................................................................................ 56
Table 32 – RMSD values calculated between anti/anti conformations of S01-S20. ..................... 57
Table 33 – Number and dimensions of N-H···Cl- hydrogen bonds found in lowest energy
conformations of receptor chloride associations. ...................................................................................... 58
Table 34 – Summary of simulation conditions used to simulate pure membrane models. ....... 60
Table 35 – Comparison between the structural parameters for the MD simulations of pure
membrane model II and of reference data. ................................................................................................... 67
Transmembrane transport of chloride by Squaramides: in silico study
University of Aveiro – Masters in Molecular Biomedicine xv
Table 36 – Summary of the simulation conditions of the membrane systems with receptors
S01, S09, S10, S19 and S20. ................................................................................................................................. 68
Table 37 – Relative distance (Å) between the receptors and the closest water/lipid interface
for systems A-E for the last 40ns of simulation time. ............................................................................... 72
Table 38 – Summarized information of receptor hydration of systems A-E, in the last 40ns of
simulation time. ....................................................................................................................................................... 74
Table 39 – Summarized results of area per lipid (Å2) parameter for systems A-E, over 40ns of
sampling time............................................................................................................................................................ 80
Table 40 – Summarized results of bilayer thickness parameter for systems A-E, over 40ns of
sampling time............................................................................................................................................................ 83
Table 41 –Comparison between the parameters for the MD simulations of systems A to E. ... 86
Table 42 – Relative distance (Å) of the receptors to the water/lipid interface for systems F-J,
for the last 40ns of simulation time. ................................................................................................................ 91
Table 43 – Summarized information of receptor’s hydration of systems F-J, in the last 40ns of
simulation time. ....................................................................................................................................................... 93
Table 44 – Summarized results of area per lipid (Å2) parameter for systems F-J, over 40ns of
sampling time............................................................................................................................................................ 97
Table 45 – Summarized results of bilayer thickness parameter for systems A-E, over 40ns of
sampling time......................................................................................................................................................... 100
Table 46 - Comparison between biophysical parameters for the phospholipid bilayer systems
F-J. ............................................................................................................................................................................... 104

Transmembrane transport of chloride by Squaramides: in silico study
University of Aveiro – Masters in Molecular Biomedicine xvii
Abbreviations
Item Definition
AIDS Acquired ImmunoDeficiency Syndrome
AM1-BCC semi-empirical Austin Model 1 Bond Charge Corrections
AMBER Assisted Model Building and Energy Refinement
AMP Adenosine MonoPhosphate
AQP AQuaPorine
ATP Adenosine TriPhosphate
cAMP cyclic Adenosine MonoPhosphate
CF Cystic Fibrosis
CFTR Cystic Fibrosis Transmembrane conductance Regulator
CHARMM Chemistry at HARvard Molecular Mechanics
CSD Cambridge Structural Database
CUDA Compute Unified Device Architecture
CyPLOS Cyclic Phosphate-Linked OligosaccharideS
DFT Density Functional Theory
DLPC 1,2-didodecanoyl-sn-glycero-3-phosphocholine
DMPC 1,2-dimyristoyl-sn-glycero-3-phosphocholine
DNA DeoxyriboNucleic Acid
DOPC 1,2-dioleoyl-sn-glycero-3-phosphocholine
DPPC 1,2-dihexadecanoyl-sn-glycero-3-phosphocholine
EC50 Half maximal effective concentration
ENaC Epithelial sodium (Na+) Channel
ER Endoplasmic Reticulum
ESP ElectroStatic Potential
frcmod file AMBER force field modification file
GABA Gamma-Amino Butyric Acid
GAFF General AMBER Force Field
GlyR Glycine Receptor
GPI GlycosylPhosphatidylInositol
GROMACS GROningen MAchine for Chemical Simulations
GROMOS GROningen MOlecular Simulation
Transmembrane transport of chloride by Squaramides: in silico study
xviii University of Aveiro – Masters in Molecular Biomedicine
Item Definition
LMOD Low-MODe
MARTINI MARrink Toolkit INItiative
MD Molecular Dynamics
MM Molecular Mechanics
MOL2 file Tripos mol2 molecule model file
NPT Isothermal–isobaric ensemble
NVT Canonical ensemble
OPLS Optimized Potentials for Liquid Simulations
ORCC Outwardly-Rectifying Chloride Channel
PAA PhosphonoAcetic Acid
PC PhosphatildylCholine
PDB file Protein Data Bank file
PE PhosphatidylEthanolamine
PES Potential Energy Surface
PFA PhosphonoFormic Acid
PKA Protein Kinase A
PKC Protein Kinase C
PME Particle Mesh Ewald
PMF Potential Mean Force
POPC 1-palmitoyl-2-oleoyl-sn-glycero-3-phosphocholine
POPE 1-palmitoyl-2-oleoyl-sn-glycero-3-phosphoethanolamine
POPG 1-palmitoyl-2-oleoyl-sn-glycero-3-phospho-rac-(1-glycerol)
PS PhosphatidylSerine
PyMOL Python-enhanced MOLecular graphics tool
REMD Replica-Exchange Molecular Dynamics
RESP Restrained ElectroStatic Potential
RMSD Root-Mean-Square Deviation
RNA RiboNucleic Acid
|SCD| Deuterium order parameter
SCMTR Synthetic Chloride Membrane TRansporter
SM SphingoMyelin
sn-1 Stereospecific number 1
sn-2 Stereospecific number 2
Transmembrane transport of chloride by Squaramides: in silico study
University of Aveiro – Masters in Molecular Biomedicine xix
Item Definition
sn-3 Stereospecific number 3
SPC Single Point Charge
TIP3P Transferable Intermolecular Potential 3 Point

Transmembrane transport of chloride by Squaramides: in silico study
University of Aveiro – Masters in Molecular Biomedicine 1
1. Introduction
1.1. Biological membranes and channelopathies
Biological membranes: overview 1.1.1.
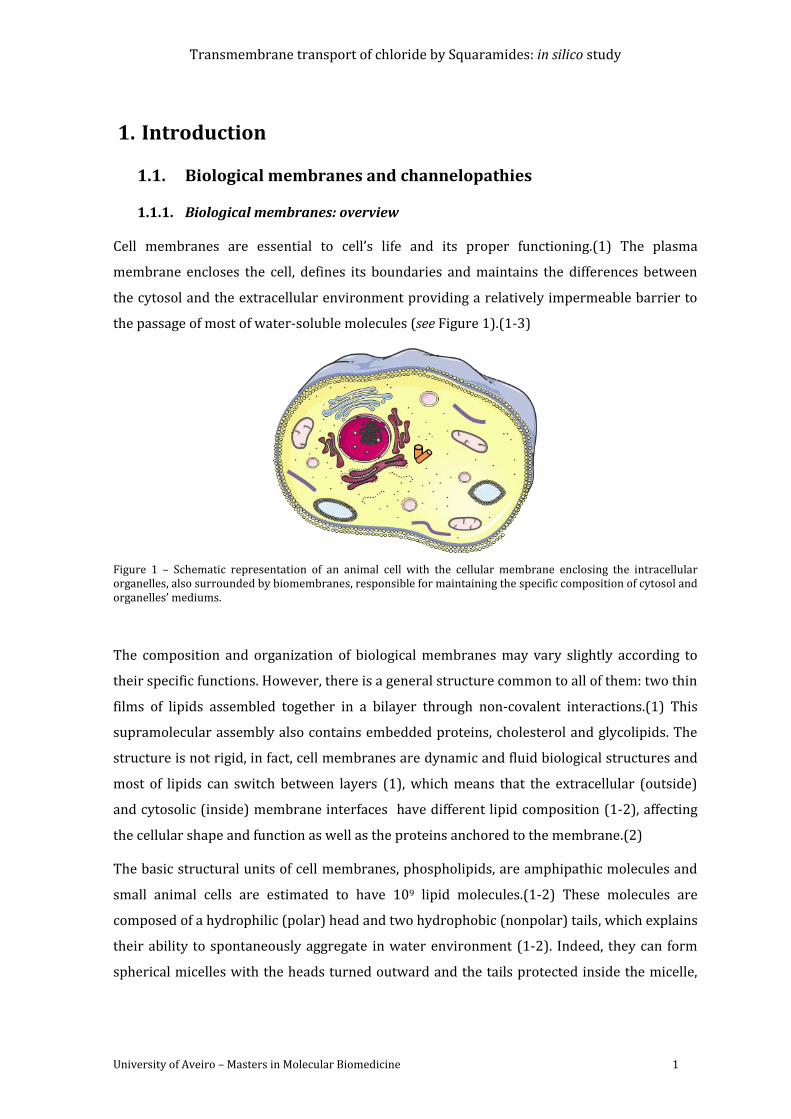
Cell membranes are essential to cell’s life and its proper functioning.(1) The plasma
membrane encloses the cell, defines its boundaries and maintains the differences between
the cytosol and the extracellular environment providing a relatively impermeable barrier to
the passage of most of water-soluble molecules (see Figure 1).(1-3)
Figure 1 – Schematic representation of an animal cell with the cellular membrane enclosing the intracellular organelles, also surrounded by biomembranes, responsible for maintaining the specific composition of cytosol and organelles’ mediums.
The composition and organization of biological membranes may vary slightly according to
their specific functions. However, there is a general structure common to all of them: two thin
films of lipids assembled together in a bilayer through non-covalent interactions.(1) This
supramolecular assembly also contains embedded proteins, cholesterol and glycolipids. The
structure is not rigid, in fact, cell membranes are dynamic and fluid biological structures and
most of lipids can switch between layers (1), which means that the extracellular (outside)
and cytosolic (inside) membrane interfaces have different lipid composition (1-2), affecting
the cellular shape and function as well as the proteins anchored to the membrane.(2)
The basic structural units of cell membranes, phospholipids, are amphipathic molecules and
small animal cells are estimated to have 109 lipid molecules.(1-2) These molecules are
composed of a hydrophilic (polar) head and two hydrophobic (nonpolar) tails, which explains
their ability to spontaneously aggregate in water environment (1-2). Indeed, they can form
spherical micelles with the heads turned outward and the tails protected inside the micelle,
Transmembrane transport of chloride by Squaramides: in silico study
2 University of Aveiro – Masters in Molecular Biomedicine
or they can form “sheet-like” phospholipid bilayers with the tails between the hydrophilic
head groups (1). In eukaryotic cell membranes there are four major phospholipids,
phosphatildylcholine (PC), sphingomyelin (SM), phosphatidylserine (PS) and
phosphatidylethanolamine (PE) as sketched in Figure 2.(1-2) PS is the only one with a
negative charge while the other three are electrically neutral at physiological pH. Inositol
phospholipids are present in small quantities in spite of their important functional role in cell
signalling.(1)
One of the most important characteristics of a lipid bilayer is its fluidity, for example, some
enzymatic activities can stop when the bilayer viscosity increases beyond a threshold
level.(1) The fluidity of the membrane depends on its composition and temperature.(2)
Shorter hydrocarbon tails reduce the phase transition temperature from liquid to crystalline
state1, the tendency of tails to interact with each other and the formation of C-C double bonds,
avoiding the kinks that make them more difficult to pack together.(1-2)
Eucaryotic cell membranes contain large amounts of cholesterol to enhance their permeable
properties. The cholesterol is a rigid steroid molecule with a rigid skeleton and hydroxyl
group which interacts with polar phospholipids head groups by hydrogen (1-2), leading to a
decrease of the mobility of the phospholipids. The lipid bilayer becomes less deformable and
the permeability of the membrane to small water-soluble molecules decreases. However, at
high concentrations, as in eukaryotic cells, cholesterol prevents the aggregation and
crystallization of the hydrocarbon chains, inhibiting phase transitions.(1)
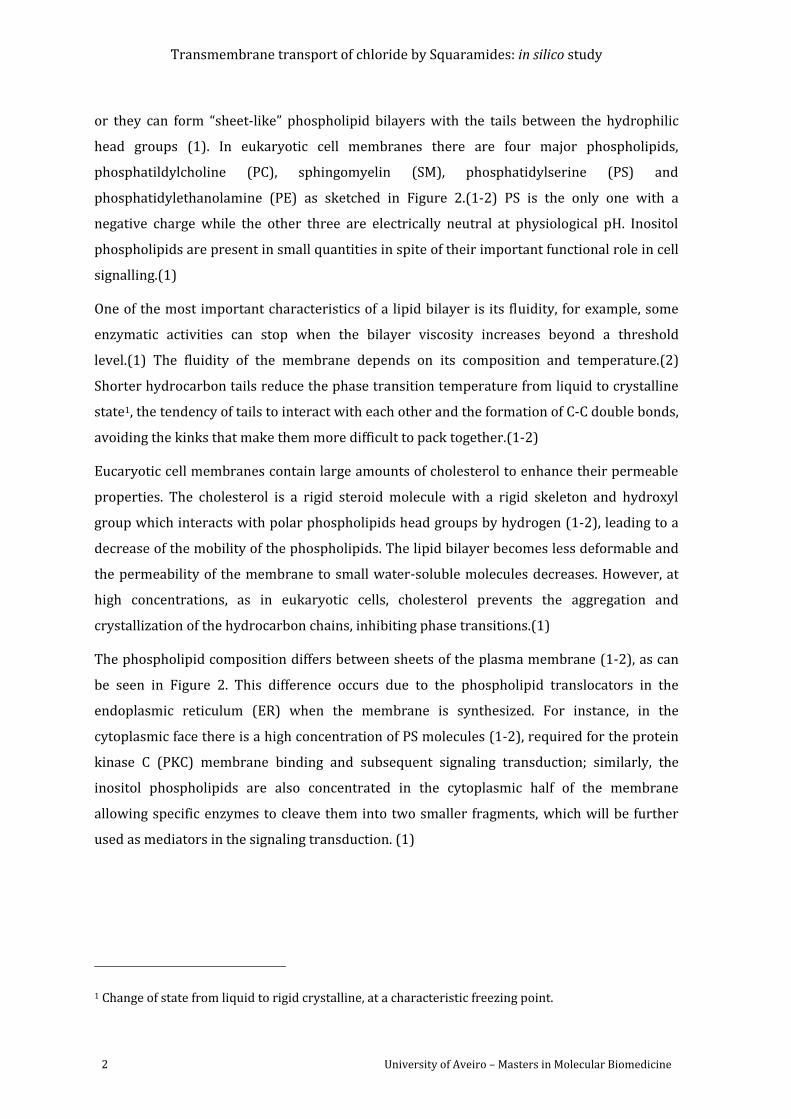
The phospholipid composition differs between sheets of the plasma membrane (1-2), as can
be seen in Figure 2. This difference occurs due to the phospholipid translocators in the
endoplasmic reticulum (ER) when the membrane is synthesized. For instance, in the
cytoplasmic face there is a high concentration of PS molecules (1-2), required for the protein
kinase C (PKC) membrane binding and subsequent signaling transduction; similarly, the
inositol phospholipids are also concentrated in the cytoplasmic half of the membrane
allowing specific enzymes to cleave them into two smaller fragments, which will be further
used as mediators in the signaling transduction. (1)
1 Change of state from liquid to rigid crystalline, at a characteristic freezing point.
Transmembrane transport of chloride by Squaramides: in silico study
University of Aveiro – Masters in Molecular Biomedicine 3
Figure 2 – Phospholipid distribution across the membrane bilayer. The two leaflets do not have the same composition. Image adapted from reference (4).
Glycolipids are located only in the extracellular face of the plasma membrane mediating the
interactions of the cell with the surrounding environment. These molecules are generated by
the addition of sugars to lipid molecules in the Golgi apparatus, showing also an asymmetrical
distribution across the membrane.(1)
Membrane proteins 1.1.2.
As mentioned above, the proteins are essential components of biological lipid bilayers being
responsible for most of the membrane’s specific functions. They are spread across the
membrane and their functions and locations within the plasma membrane are highly
variable.(1-2) These proteins can operate alone or associated with other relevant biological
molecules such as other proteins and intracellular messengers. Furthermore, it is also
common to find membrane proteins associated with oligosaccharides in the plasma
membrane. These complexes create an exterior surface with the carbohydrates forming a cell
coat (or glycocalyx).(1)
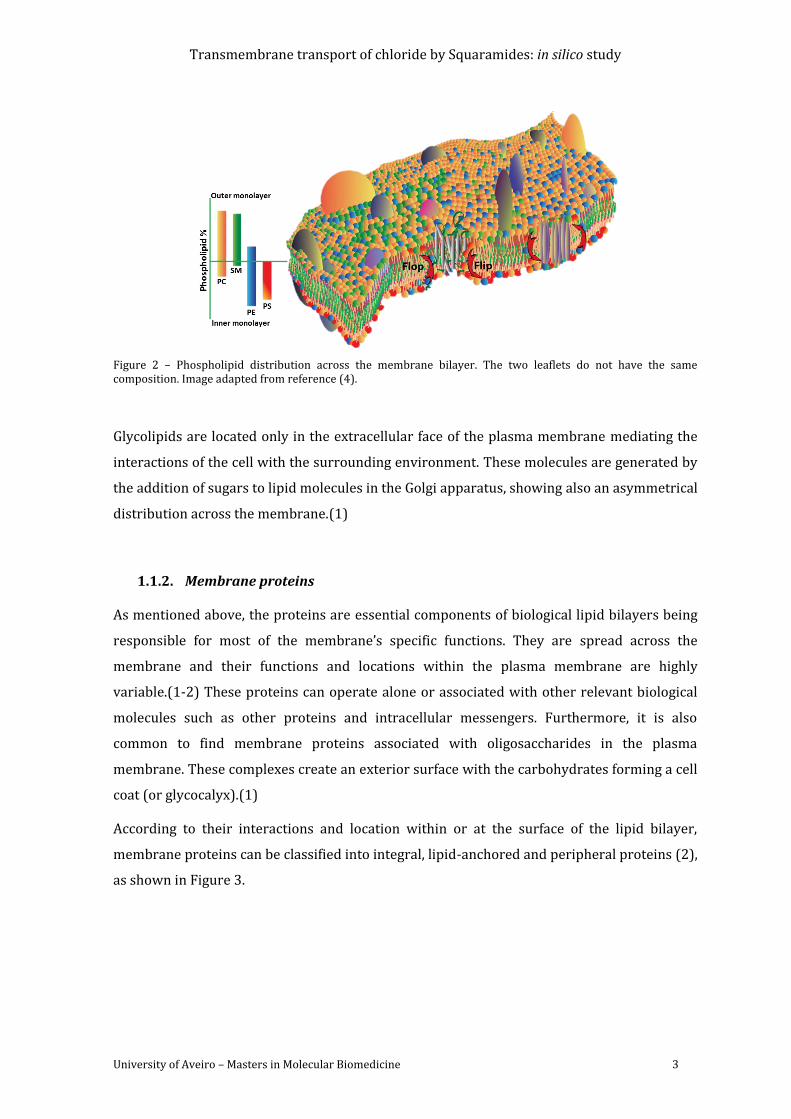
According to their interactions and location within or at the surface of the lipid bilayer,
membrane proteins can be classified into integral, lipid-anchored and peripheral proteins (2),
as shown in Figure 3.
Transmembrane transport of chloride by Squaramides: in silico study
4 University of Aveiro – Masters in Molecular Biomedicine
Figure 3 – Schematic representation of the membrane proteins. In blue integral protein (transmembrane protein), in green lipid-anchored proteins, in red cytosolic peripheral protein, in pink and orange exoplasmic peripheral. proteins. In the cytosolic face, peripheral proteins interact with cytoskeleton filaments (green filaments).
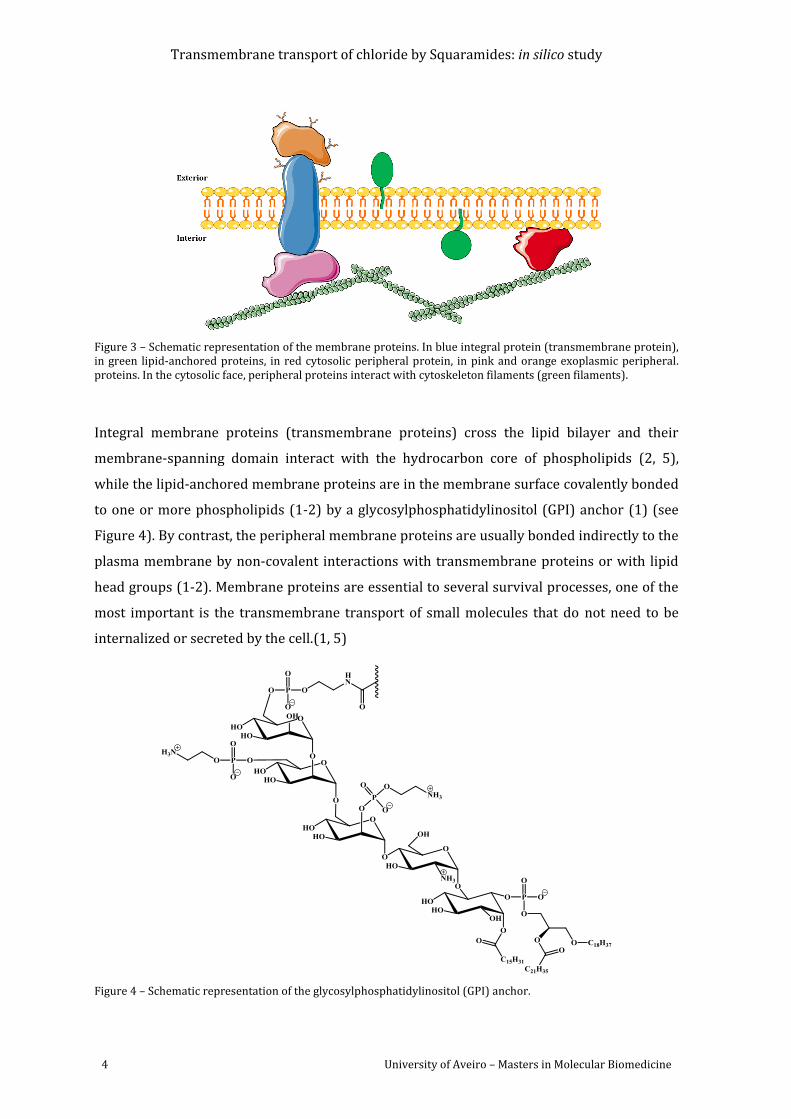
Integral membrane proteins (transmembrane proteins) cross the lipid bilayer and their
membrane-spanning domain interact with the hydrocarbon core of phospholipids (2, 5),
while the lipid-anchored membrane proteins are in the membrane surface covalently bonded
to one or more phospholipids (1-2) by a glycosylphosphatidylinositol (GPI) anchor (1) (see
Figure 4). By contrast, the peripheral membrane proteins are usually bonded indirectly to the
plasma membrane by non-covalent interactions with transmembrane proteins or with lipid
head groups (1-2). Membrane proteins are essential to several survival processes, one of the
most important is the transmembrane transport of small molecules that do not need to be
internalized or secreted by the cell.(1, 5)
Figure 4 – Schematic representation of the glycosylphosphatidylinositol (GPI) anchor.
Transmembrane transport of chloride by Squaramides: in silico study
University of Aveiro – Masters in Molecular Biomedicine 5
Transport of small molecules across the lipid membrane 1.1.3.
Unlike large biological molecules, small molecules are transported through the membrane by
passive transport2 or active transport3.(5)
The passive transport of molecules across the membrane can occur via simple diffusion or
facilitated diffusion without the energy spending, while the active movement has necessarily
an energy cost. Indeed, some molecules move spontaneously and according to the
concentration and the electrochemical gradients (Simple Diffusion), while the
transmembrane transport of other molecules and ions may require the assistance of proteins,
which is the case of facilitated diffusion and active transport.(5)
In facilitated diffusion, small neutral or ionic species bind to integral proteins on one side of
the membrane and are released on the other side (carrier proteins) or they may move
through channel-like structures that expand across the entire phospholipid bilayer (ion
channels). This is a uniport system in which only a single type of species is transported
accordingly to its concentration gradient.(5)
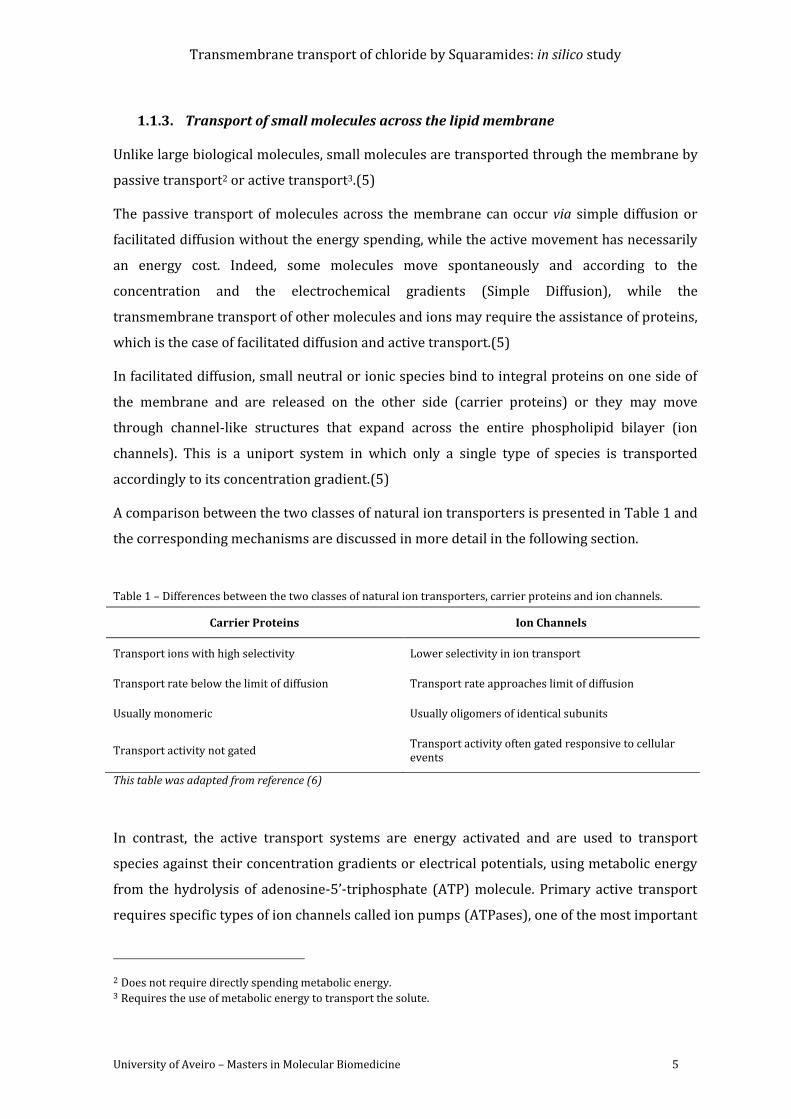
A comparison between the two classes of natural ion transporters is presented in Table 1 and
the corresponding mechanisms are discussed in more detail in the following section.
Table 1 – Differences between the two classes of natural ion transporters, carrier proteins and ion channels.
Carrier Proteins Ion Channels
Transport ions with high selectivity Lower selectivity in ion transport
Transport rate below the limit of diffusion Transport rate approaches limit of diffusion
Usually monomeric Usually oligomers of identical subunits
Transport activity not gated Transport activity often gated responsive to cellular events
This table was adapted from reference (6)
In contrast, the active transport systems are energy activated and are used to transport
species against their concentration gradients or electrical potentials, using metabolic energy
from the hydrolysis of adenosine-5’-triphosphate (ATP) molecule. Primary active transport
requires specific types of ion channels called ion pumps (ATPases), one of the most important
2 Does not require directly spending metabolic energy. 3 Requires the use of metabolic energy to transport the solute.
Transmembrane transport of chloride by Squaramides: in silico study
6 University of Aveiro – Masters in Molecular Biomedicine
of them is the sodium-potassium pump (Na+/K+ -ATPases) that yields potential energy
further used in secondary active transport. The secondary active transport requires the
assistance of co-transporters, being energy dependent of Na+/K+ -ATPases and only carrying
certain types of molecules (glucose and aminoacids). Secondary transport systems are also
liable to saturation and competitive inhibition and can operate using a symport (solute moves
in the same direction of the sodium ion) or antiport (solute and sodium ion move in opposite
directions) mechanism.
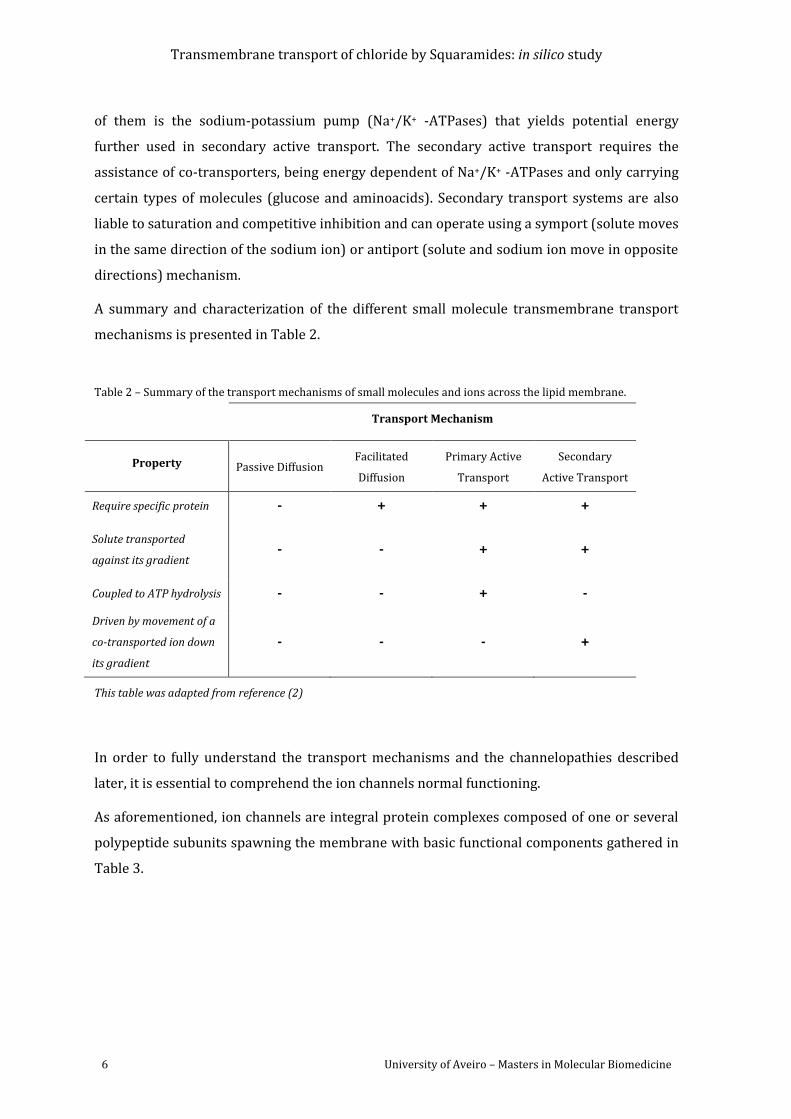
A summary and characterization of the different small molecule transmembrane transport
mechanisms is presented in Table 2.
Table 2 – Summary of the transport mechanisms of small molecules and ions across the lipid membrane.
Transport Mechanism
Property Passive Diffusion Facilitated
Diffusion
Primary Active
Transport
Secondary
Active Transport
Require specific protein - + + +
Solute transported
against its gradient - - + +
Coupled to ATP hydrolysis - - + -
Driven by movement of a
co-transported ion down
its gradient
- - - +
This table was adapted from reference (2)
In order to fully understand the transport mechanisms and the channelopathies described
later, it is essential to comprehend the ion channels normal functioning.
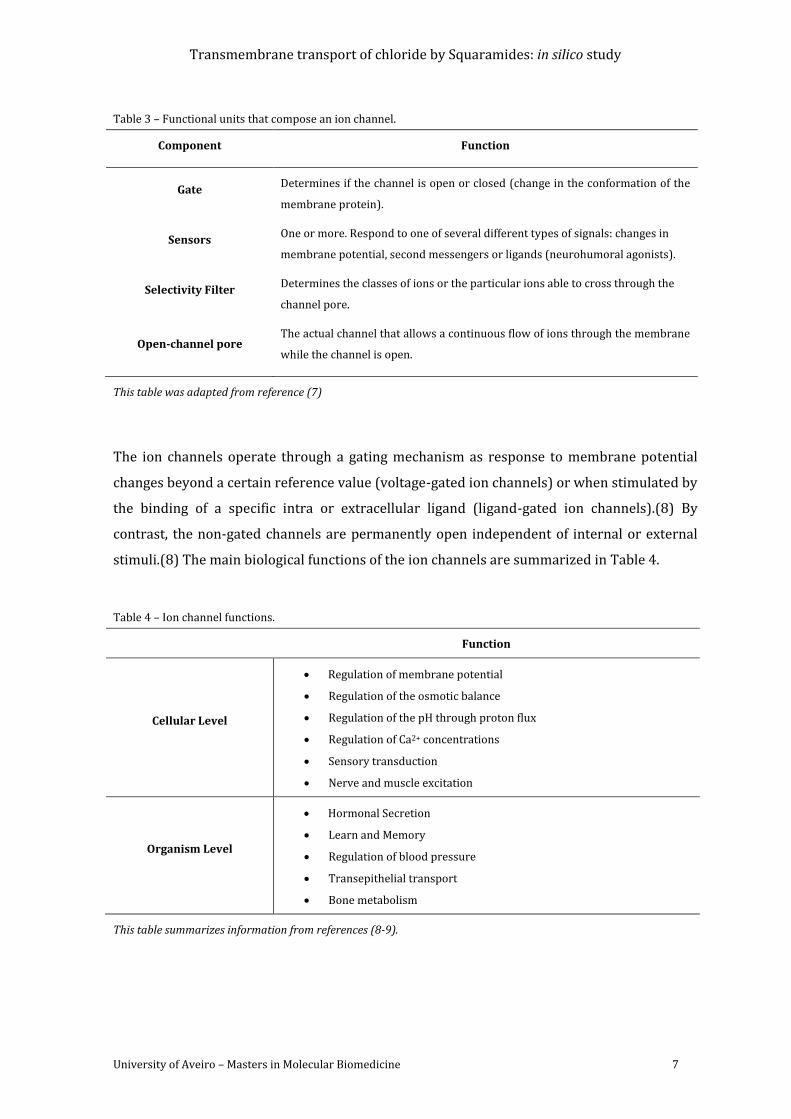
As aforementioned, ion channels are integral protein complexes composed of one or several
polypeptide subunits spawning the membrane with basic functional components gathered in
Table 3.
Transmembrane transport of chloride by Squaramides: in silico study
University of Aveiro – Masters in Molecular Biomedicine 7
Table 3 – Functional units that compose an ion channel.
Component Function
Gate Determines if the channel is open or closed (change in the conformation of the
membrane protein).
Sensors One or more. Respond to one of several different types of signals: changes in
membrane potential, second messengers or ligands (neurohumoral agonists).
Selectivity Filter Determines the classes of ions or the particular ions able to cross through the
channel pore.
Open-channel pore The actual channel that allows a continuous flow of ions through the membrane
while the channel is open.
This table was adapted from reference (7)
The ion channels operate through a gating mechanism as response to membrane potential
changes beyond a certain reference value (voltage-gated ion channels) or when stimulated by
the binding of a specific intra or extracellular ligand (ligand-gated ion channels).(8) By
contrast, the non-gated channels are permanently open independent of internal or external
stimuli.(8) The main biological functions of the ion channels are summarized in Table 4.
Table 4 – Ion channel functions.
Function
Cellular Level
Regulation of membrane potential
Regulation of the osmotic balance
Regulation of the pH through proton flux
Regulation of Ca2+ concentrations
Sensory transduction
Nerve and muscle excitation
Organism Level
Hormonal Secretion
Learn and Memory
Regulation of blood pressure
Transepithelial transport
Bone metabolism
This table summarizes information from references (8-9).
Transmembrane transport of chloride by Squaramides: in silico study
8 University of Aveiro – Masters in Molecular Biomedicine
The malfunction of ion channels is the cause of many human diseases, commonly called as
channelopathies, which have motivated, along the last decade, an increasing interest in the
research and development of drugs to treat specific mutations in ion channels (10), as well as
drug-like molecules for channel replacement therapies.(11-12)
Channelopathies 1.1.4.
Channelopathies can arise through mutations in the promoter or in the coding region of an
ion channel gene or through mutations in the genes encoding regulatory molecules of the
channel activity or defects in the pathways responsible for their production.(9) These
disorders were initially reported as skeletal muscle excitability disorders and then as
disorders of the brain and peripheral nervous system.(8-9) There are three common features
between channelopathies of the brain and channelopathies of skeletal muscle: symptoms are
intercalated with normal function, most of these diseases are inherited as autosomal
dominant traits and there is just one organ involved.(8) Autoantibodies and toxins or venoms
to ion channels and their proteins are also responsible for some channelopathies.(9)
Overall, channelopathies have been identified with malfunction of voltage-gated ion channels
(Na+, K+, Ca2+ and Cl-), fast ligand-gated channels (nicotinic acetylcholine receptor, glycine
receptor and GABA receptor), intracellular channels and intercellular channels (conexins).(8)
Channelopathies Associated with Chloride Transport
The chloride anion is one of the most abundant and common ions in the human body and is a
critical chemical entity for the metabolism, digestion and maintenance of acid-base balance.
Thus, the chloride channels are important for the control of membrane excitability,
transepithelial transport and regulation of cell volume and intracellular pH.(9) These
chloride channels can be gathered into three families, voltage-gated chloride channels, cystic
fibrosis transmembrane conductance regulator (CFTR) and ligand-gated Cl- channels opened
by GABA and glycine.(9)
Mutations in different families of chloride channels produce different channelopathies. For
instance, mutations in the gene encoding the skeletal muscle voltage-gated chloride channels
cause two forms of myotonia, congenital and generalized (9), while mutations in genes
encoding GABAA receptors (a type of ligand-gated chloride channels) have been associated
Transmembrane transport of chloride by Squaramides: in silico study
University of Aveiro – Masters in Molecular Biomedicine 9
with inherited epilepsy.(13) Furthermore, CFTR mutations alter the selectivity and
conductance of the channel causing cystic fibrosis (CF), one of the most common severe
human diseases, with an incidence ratio of one in 3268 births in Brittany (France), between
2005 and 2009.(14) This disease is characterized by a thick mucus secretion that blocks the
smaller airways and secretory ducts and promotes infection, inflammation and destruction of
the tissues.(9) There have been identified more than 400 mutations in the CF gene but only a
small amount of them have been characterized until now and those can be grouped into
different classes as summarized in Table 5.
Table 5 – Classes of CF gene mutations associated with cystic fibrosis.
Class Consequence
I Premature truncation of the protein because of splice-site abnormalities (deletions, insertions,
non-sense mutations).
II Alteration of the correct trafficking of the protein leads to dramatic loss of CFTR expression at
the cell surface.
III Regulation of the channel is defective.
IV Channels with altered conduction properties.
This table summarizes the information on pages 218-222 from reference (9)
The CFTR channel is chloride selective and its activation depends on protein kinase A (PKA)
and existence of intracellular complex MgATP.(9) Besides chloride channel activity, CFTR
regulates an outwardly-rectifying chloride channel (ORCC) and an epithelial sodium channel
(ENaC) (9). In cystic fibrosis, neither ORCC nor ENaC are regulated which lead to a reduction
in epithelial Cl- permeability and an enhanced Na+ permeability.(9)
A clever approach to cystic fibrosis treatment would be to replace the mutated chloride
channels for synthetic ion transporters that could mimic the natural chloride efflux
mechanisms. In the subsequent section, a brief overview of the assisted anion
transmembrane transport is presented using selected synthetic transporters reported in the
literature along the last decade.
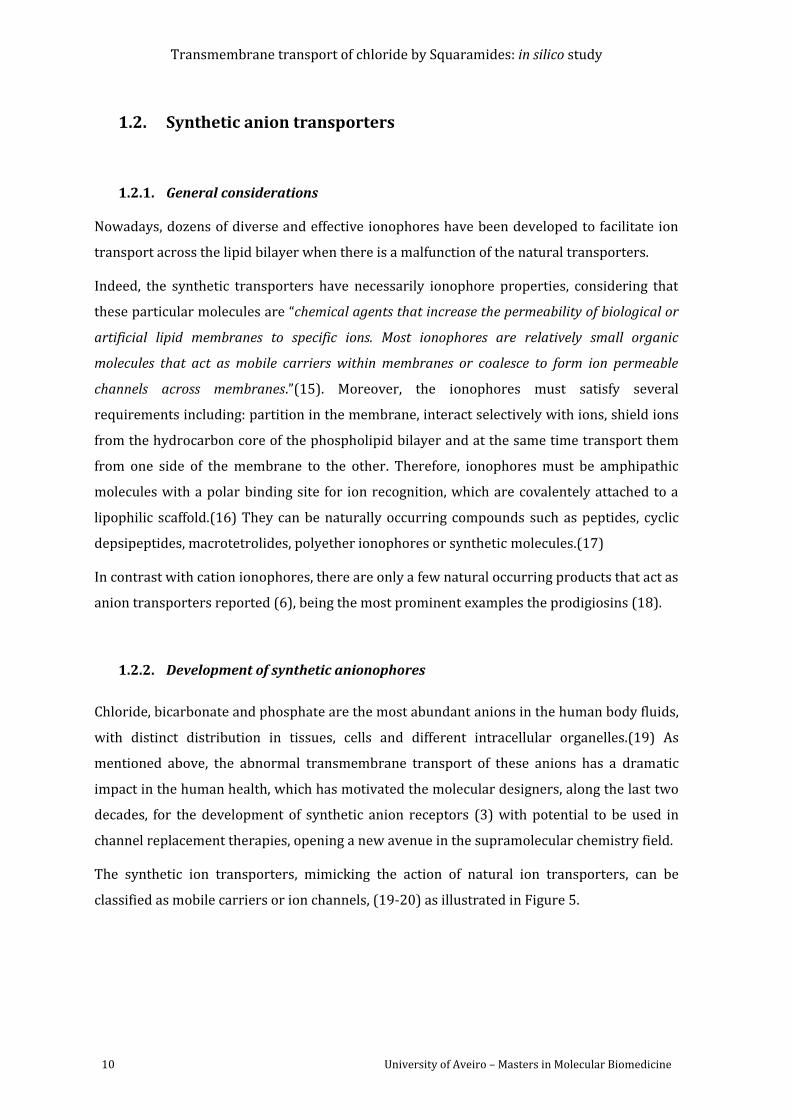
Transmembrane transport of chloride by Squaramides: in silico study
10 University of Aveiro – Masters in Molecular Biomedicine
1.2. Synthetic anion transporters
General considerations 1.2.1.
Nowadays, dozens of diverse and effective ionophores have been developed to facilitate ion
transport across the lipid bilayer when there is a malfunction of the natural transporters.
Indeed, the synthetic transporters have necessarily ionophore properties, considering that
these particular molecules are “chemical agents that increase the permeability of biological or
artificial lipid membranes to specific ions. Most ionophores are relatively small organic
molecules that act as mobile carriers within membranes or coalesce to form ion permeable
channels across membranes.”(15). Moreover, the ionophores must satisfy several
requirements including: partition in the membrane, interact selectively with ions, shield ions
from the hydrocarbon core of the phospholipid bilayer and at the same time transport them
from one side of the membrane to the other. Therefore, ionophores must be amphipathic
molecules with a polar binding site for ion recognition, which are covalentely attached to a
lipophilic scaffold.(16) They can be naturally occurring compounds such as peptides, cyclic
depsipeptides, macrotetrolides, polyether ionophores or synthetic molecules.(17)
In contrast with cation ionophores, there are only a few natural occurring products that act as
anion transporters reported (6), being the most prominent examples the prodigiosins (18).
Development of synthetic anionophores 1.2.2.
Chloride, bicarbonate and phosphate are the most abundant anions in the human body fluids,
with distinct distribution in tissues, cells and different intracellular organelles.(19) As
mentioned above, the abnormal transmembrane transport of these anions has a dramatic
impact in the human health, which has motivated the molecular designers, along the last two
decades, for the development of synthetic anion receptors (3) with potential to be used in
channel replacement therapies, opening a new avenue in the supramolecular chemistry field.
The synthetic ion transporters, mimicking the action of natural ion transporters, can be
classified as mobile carriers or ion channels, (19-20) as illustrated in Figure 5.
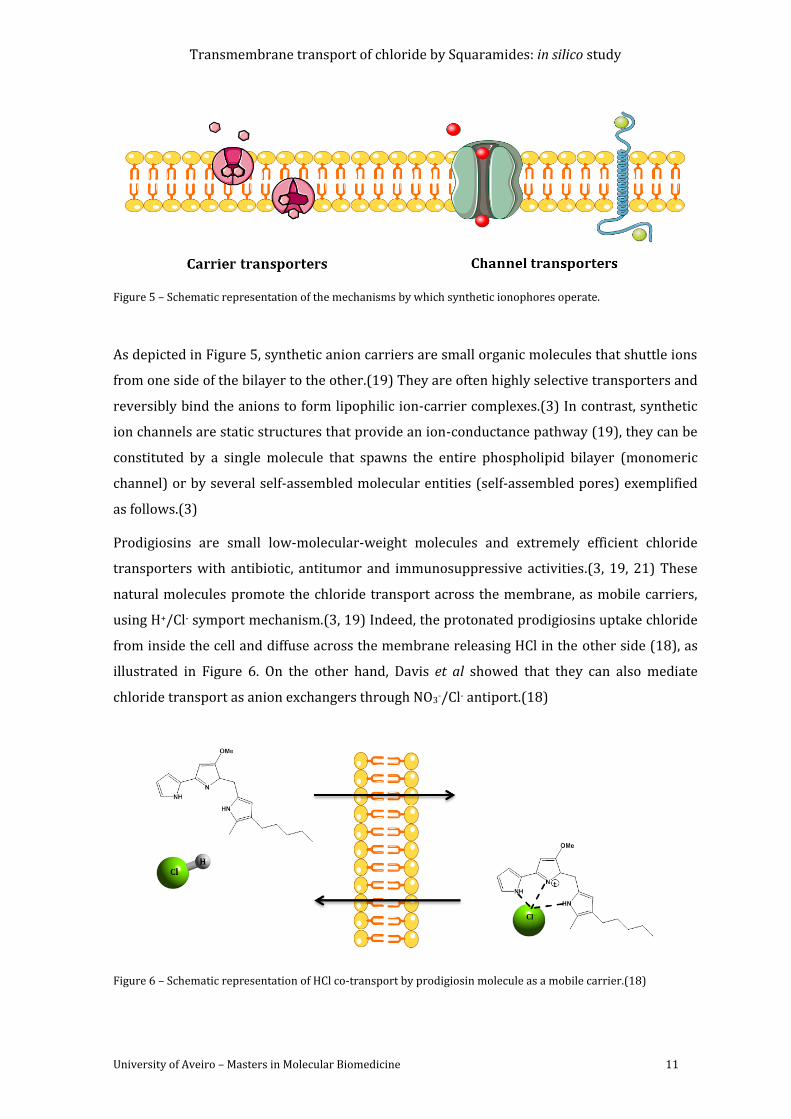
Transmembrane transport of chloride by Squaramides: in silico study
University of Aveiro – Masters in Molecular Biomedicine 11
Figure 5 – Schematic representation of the mechanisms by which synthetic ionophores operate.
As depicted in Figure 5, synthetic anion carriers are small organic molecules that shuttle ions
from one side of the bilayer to the other.(19) They are often highly selective transporters and
reversibly bind the anions to form lipophilic ion-carrier complexes.(3) In contrast, synthetic
ion channels are static structures that provide an ion-conductance pathway (19), they can be
constituted by a single molecule that spawns the entire phospholipid bilayer (monomeric
channel) or by several self-assembled molecular entities (self-assembled pores) exemplified
as follows.(3)
Prodigiosins are small low-molecular-weight molecules and extremely efficient chloride
transporters with antibiotic, antitumor and immunosuppressive activities.(3, 19, 21) These
natural molecules promote the chloride transport across the membrane, as mobile carriers,
using H+/Cl- symport mechanism.(3, 19) Indeed, the protonated prodigiosins uptake chloride
from inside the cell and diffuse across the membrane releasing HCl in the other side (18), as
illustrated in Figure 6. On the other hand, Davis et al showed that they can also mediate
chloride transport as anion exchangers through NO3-/Cl- antiport.(18)
Figure 6 – Schematic representation of HCl co-transport by prodigiosin molecule as a mobile carrier.(18)
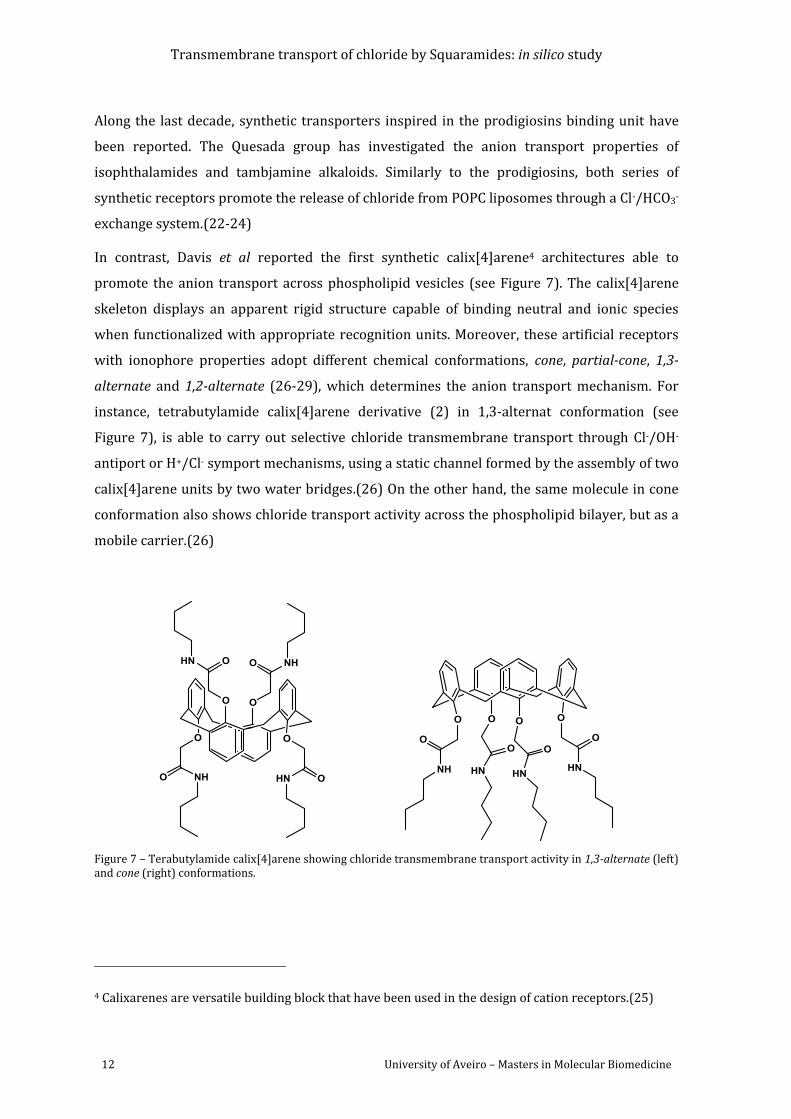
Transmembrane transport of chloride by Squaramides: in silico study
12 University of Aveiro – Masters in Molecular Biomedicine
Along the last decade, synthetic transporters inspired in the prodigiosins binding unit have
been reported. The Quesada group has investigated the anion transport properties of
isophthalamides and tambjamine alkaloids. Similarly to the prodigiosins, both series of
synthetic receptors promote the release of chloride from POPC liposomes through a Cl-/HCO3-
exchange system.(22-24)
In contrast, Davis et al reported the first synthetic calix[4]arene4 architectures able to
promote the anion transport across phospholipid vesicles (see Figure 7). The calix[4]arene
skeleton displays an apparent rigid structure capable of binding neutral and ionic species
when functionalized with appropriate recognition units. Moreover, these artificial receptors
with ionophore properties adopt different chemical conformations, cone, partial-cone, 1,3-
alternate and 1,2-alternate (26-29), which determines the anion transport mechanism. For
instance, tetrabutylamide calix[4]arene derivative (2) in 1,3-alternat conformation (see
Figure 7), is able to carry out selective chloride transmembrane transport through Cl-/OH-
antiport or H+/Cl- symport mechanisms, using a static channel formed by the assembly of two
calix[4]arene units by two water bridges.(26) On the other hand, the same molecule in cone
conformation also shows chloride transport activity across the phospholipid bilayer, but as a
mobile carrier.(26)
Figure 7 – Terabutylamide calix[4]arene showing chloride transmembrane transport activity in 1,3-alternate (left) and cone (right) conformations.
4 Calixarenes are versatile building block that have been used in the design of cation receptors.(25)
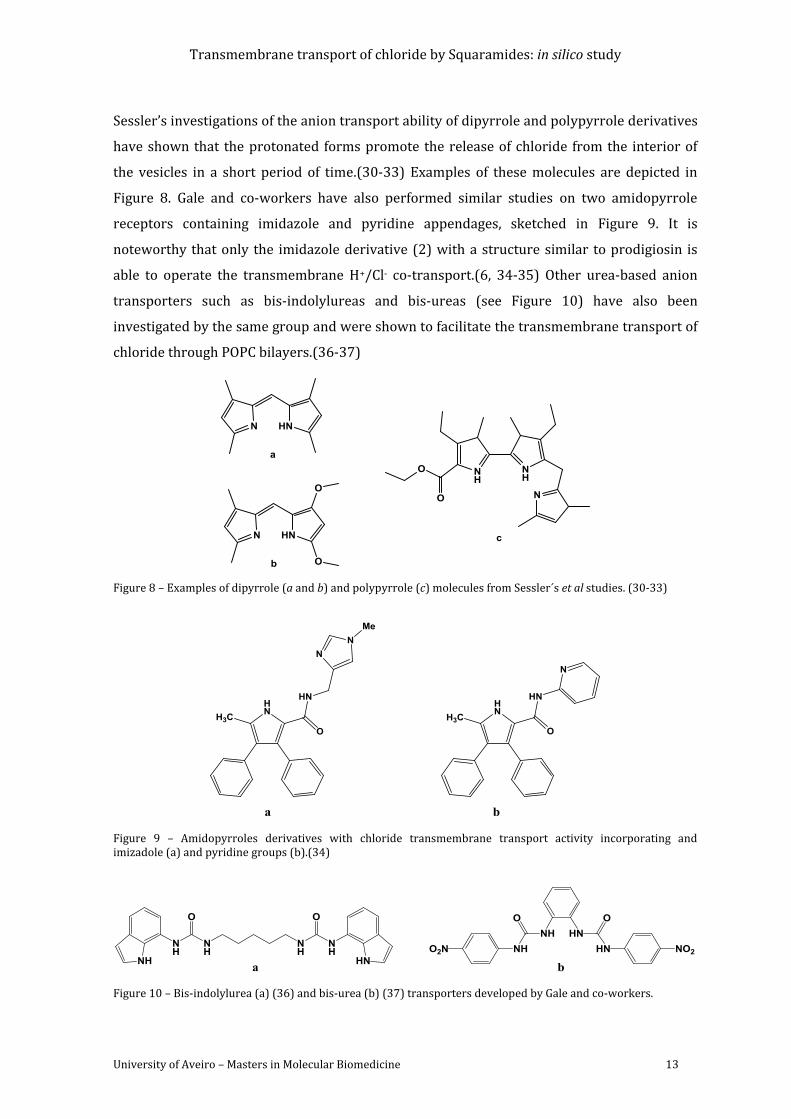
Transmembrane transport of chloride by Squaramides: in silico study
University of Aveiro – Masters in Molecular Biomedicine 13
Sessler’s investigations of the anion transport ability of dipyrrole and polypyrrole derivatives
have shown that the protonated forms promote the release of chloride from the interior of
the vesicles in a short period of time.(30-33) Examples of these molecules are depicted in
Figure 8. Gale and co-workers have also performed similar studies on two amidopyrrole
receptors containing imidazole and pyridine appendages, sketched in Figure 9. It is
noteworthy that only the imidazole derivative (2) with a structure similar to prodigiosin is
able to operate the transmembrane H+/Cl- co-transport.(6, 34-35) Other urea-based anion
transporters such as bis-indolylureas and bis-ureas (see Figure 10) have also been
investigated by the same group and were shown to facilitate the transmembrane transport of
chloride through POPC bilayers.(36-37)
Figure 8 – Examples of dipyrrole (a and b) and polypyrrole (c) molecules from Sessler´s et al studies. (30-33)
Figure 9 – Amidopyrroles derivatives with chloride transmembrane transport activity incorporating and imizadole (a) and pyridine groups (b).(34)
Figure 10 – Bis-indolylurea (a) (36) and bis-urea (b) (37) transporters developed by Gale and co-workers.
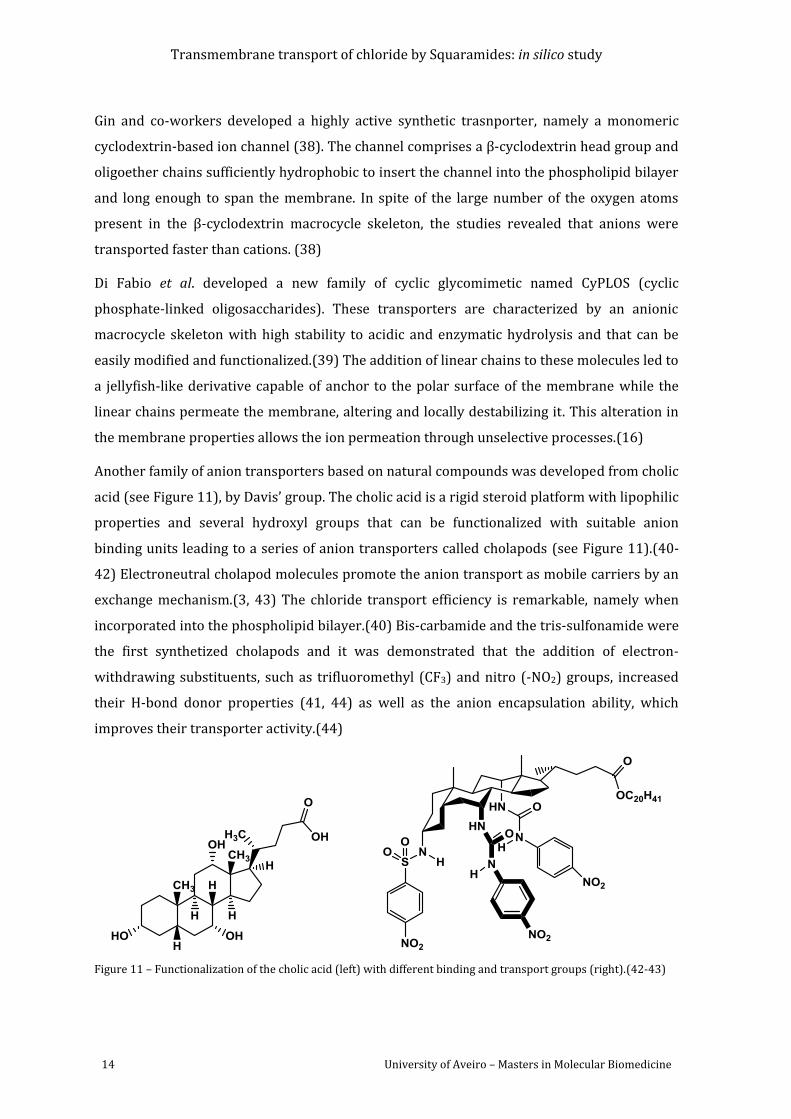
Transmembrane transport of chloride by Squaramides: in silico study
14 University of Aveiro – Masters in Molecular Biomedicine
Gin and co-workers developed a highly active synthetic trasnporter, namely a monomeric
cyclodextrin-based ion channel (38). The channel comprises a β-cyclodextrin head group and
oligoether chains sufficiently hydrophobic to insert the channel into the phospholipid bilayer
and long enough to span the membrane. In spite of the large number of the oxygen atoms
present in the β-cyclodextrin macrocycle skeleton, the studies revealed that anions were
transported faster than cations. (38)
Di Fabio et al. developed a new family of cyclic glycomimetic named CyPLOS (cyclic
phosphate-linked oligosaccharides). These transporters are characterized by an anionic
macrocycle skeleton with high stability to acidic and enzymatic hydrolysis and that can be
easily modified and functionalized.(39) The addition of linear chains to these molecules led to
a jellyfish-like derivative capable of anchor to the polar surface of the membrane while the
linear chains permeate the membrane, altering and locally destabilizing it. This alteration in
the membrane properties allows the ion permeation through unselective processes.(16)
Another family of anion transporters based on natural compounds was developed from cholic
acid (see Figure 11), by Davis’ group. The cholic acid is a rigid steroid platform with lipophilic
properties and several hydroxyl groups that can be functionalized with suitable anion
binding units leading to a series of anion transporters called cholapods (see Figure 11).(40-
42) Electroneutral cholapod molecules promote the anion transport as mobile carriers by an
exchange mechanism.(3, 43) The chloride transport efficiency is remarkable, namely when
incorporated into the phospholipid bilayer.(40) Bis-carbamide and the tris-sulfonamide were
the first synthetized cholapods and it was demonstrated that the addition of electron-
withdrawing substituents, such as trifluoromethyl (CF3) and nitro (-NO2) groups, increased
their H-bond donor properties (41, 44) as well as the anion encapsulation ability, which
improves their transporter activity.(44)
Figure 11 – Functionalization of the cholic acid (left) with different binding and transport groups (right).(42-43)
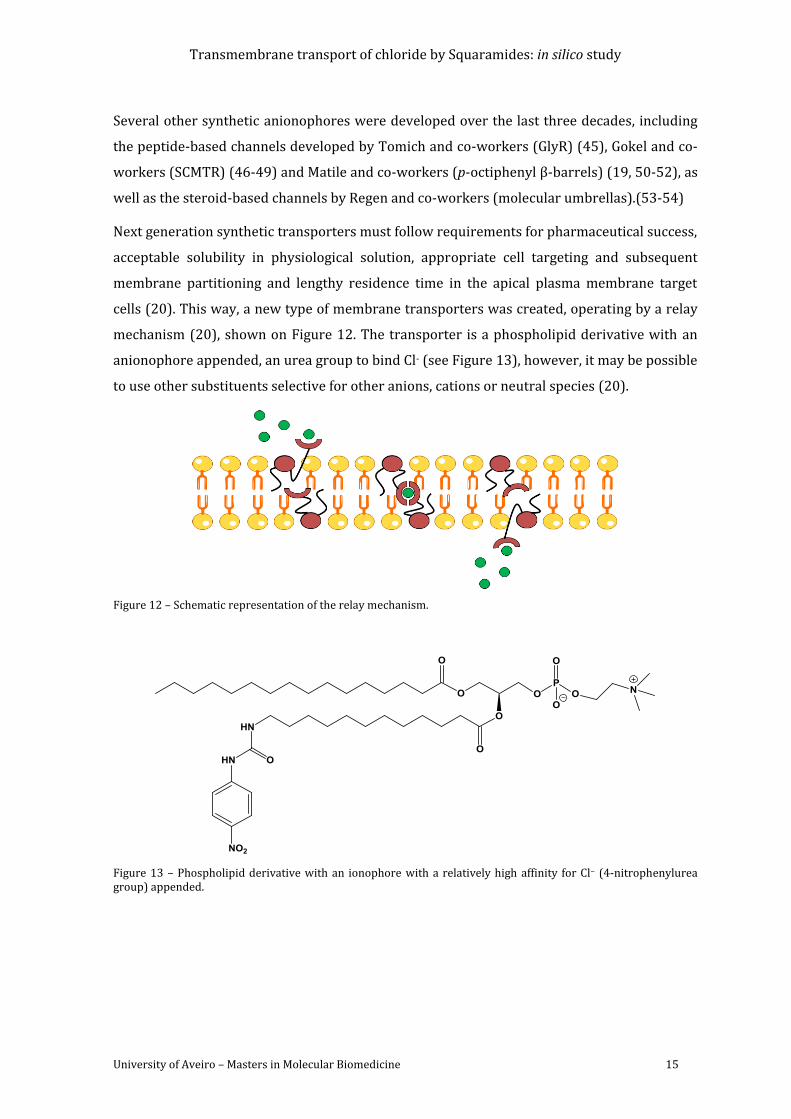
Transmembrane transport of chloride by Squaramides: in silico study
University of Aveiro – Masters in Molecular Biomedicine 15
Several other synthetic anionophores were developed over the last three decades, including
the peptide-based channels developed by Tomich and co-workers (GlyR) (45), Gokel and co-
workers (SCMTR) (46-49) and Matile and co-workers (p-octiphenyl β-barrels) (19, 50-52), as
well as the steroid-based channels by Regen and co-workers (molecular umbrellas).(53-54)
Next generation synthetic transporters must follow requirements for pharmaceutical success,
acceptable solubility in physiological solution, appropriate cell targeting and subsequent
membrane partitioning and lengthy residence time in the apical plasma membrane target
cells (20). This way, a new type of membrane transporters was created, operating by a relay
mechanism (20), shown on Figure 12. The transporter is a phospholipid derivative with an
anionophore appended, an urea group to bind Cl- (see Figure 13), however, it may be possible
to use other substituents selective for other anions, cations or neutral species (20).
Figure 12 – Schematic representation of the relay mechanism.
Figure 13 – Phospholipid derivative with an ionophore with a relatively high affinity for Cl− (4-nitrophenylurea group) appended.
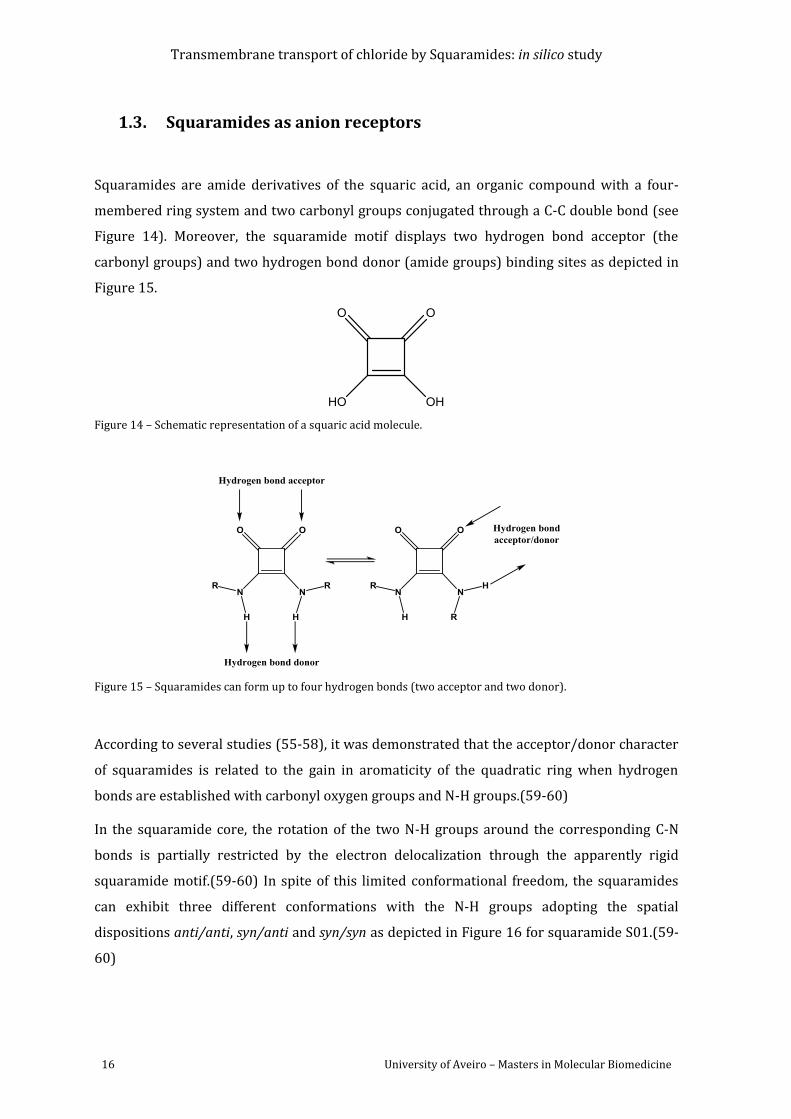
Transmembrane transport of chloride by Squaramides: in silico study
16 University of Aveiro – Masters in Molecular Biomedicine
1.3. Squaramides as anion receptors
Squaramides are amide derivatives of the squaric acid, an organic compound with a four-
membered ring system and two carbonyl groups conjugated through a C-C double bond (see
Figure 14). Moreover, the squaramide motif displays two hydrogen bond acceptor (the
carbonyl groups) and two hydrogen bond donor (amide groups) binding sites as depicted in
Figure 15.
Figure 14 – Schematic representation of a squaric acid molecule.
Figure 15 – Squaramides can form up to four hydrogen bonds (two acceptor and two donor).
According to several studies (55-58), it was demonstrated that the acceptor/donor character
of squaramides is related to the gain in aromaticity of the quadratic ring when hydrogen
bonds are established with carbonyl oxygen groups and N-H groups.(59-60)
In the squaramide core, the rotation of the two N-H groups around the corresponding C-N
bonds is partially restricted by the electron delocalization through the apparently rigid
squaramide motif.(59-60) In spite of this limited conformational freedom, the squaramides
can exhibit three different conformations with the N-H groups adopting the spatial
dispositions anti/anti, syn/anti and syn/syn as depicted in Figure 16 for squaramide S01.(59-
60)
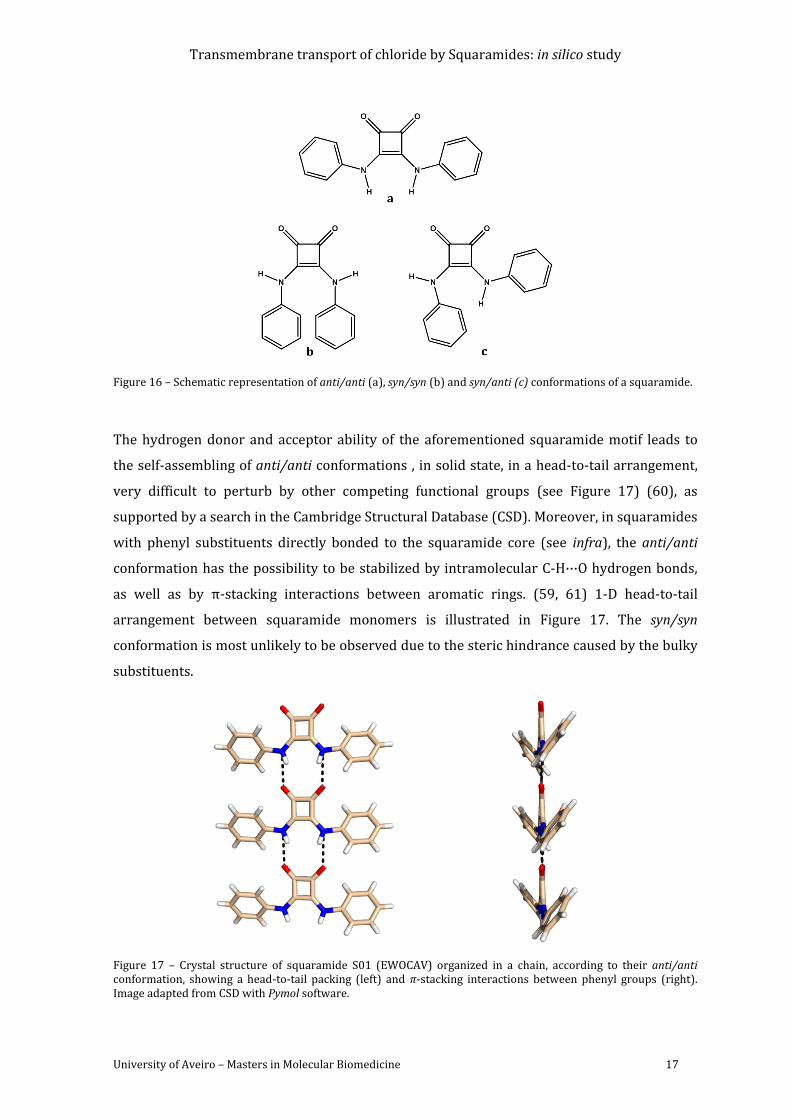
Transmembrane transport of chloride by Squaramides: in silico study
University of Aveiro – Masters in Molecular Biomedicine 17
Figure 16 – Schematic representation of anti/anti (a), syn/syn (b) and syn/anti (c) conformations of a squaramide.
The hydrogen donor and acceptor ability of the aforementioned squaramide motif leads to
the self-assembling of anti/anti conformations , in solid state, in a head-to-tail arrangement,
very difficult to perturb by other competing functional groups (see Figure 17) (60), as
supported by a search in the Cambridge Structural Database (CSD). Moreover, in squaramides
with phenyl substituents directly bonded to the squaramide core (see infra), the anti/anti
conformation has the possibility to be stabilized by intramolecular C-H···O hydrogen bonds,
as well as by π-stacking interactions between aromatic rings. (59, 61) 1-D head-to-tail
arrangement between squaramide monomers is illustrated in Figure 17. The syn/syn
conformation is most unlikely to be observed due to the steric hindrance caused by the bulky
substituents.
Figure 17 – Crystal structure of squaramide S01 (EWOCAV) organized in a chain, according to their anti/anti conformation, showing a head-to-tail packing (left) and π-stacking interactions between phenyl groups (right). Image adapted from CSD with Pymol software.
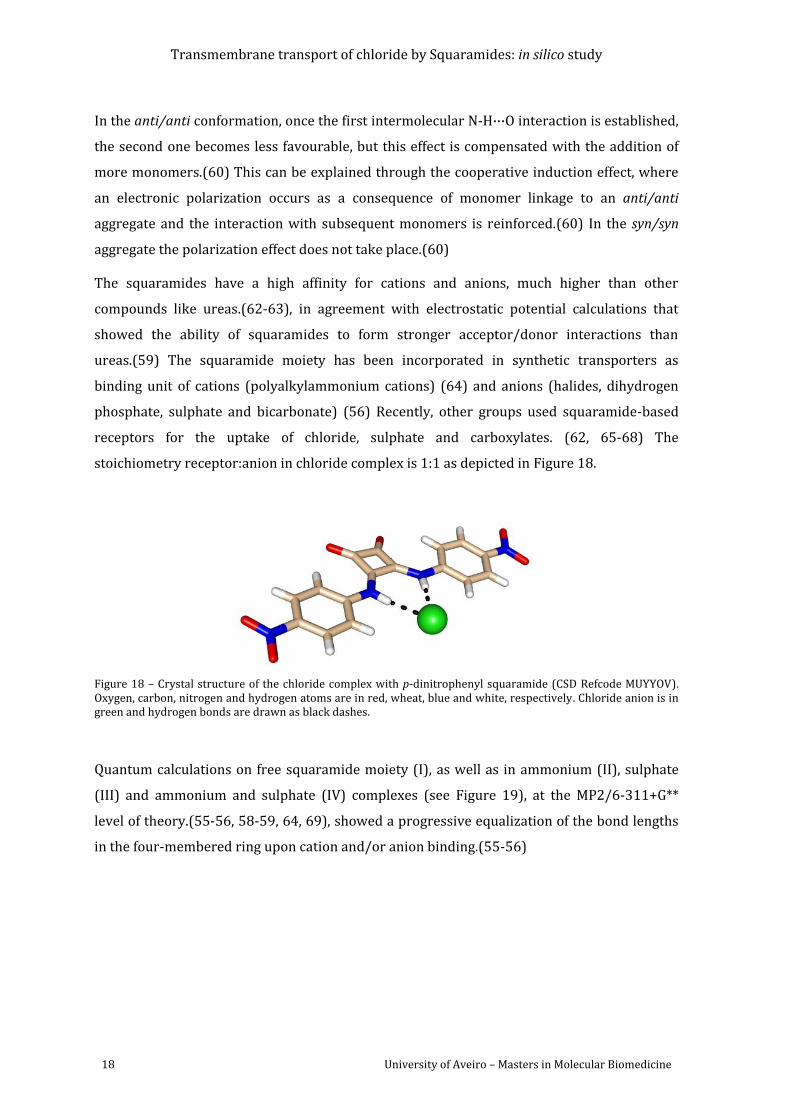
Transmembrane transport of chloride by Squaramides: in silico study
18 University of Aveiro – Masters in Molecular Biomedicine
In the anti/anti conformation, once the first intermolecular N-H···O interaction is established,
the second one becomes less favourable, but this effect is compensated with the addition of
more monomers.(60) This can be explained through the cooperative induction effect, where
an electronic polarization occurs as a consequence of monomer linkage to an anti/anti
aggregate and the interaction with subsequent monomers is reinforced.(60) In the syn/syn
aggregate the polarization effect does not take place.(60)
The squaramides have a high affinity for cations and anions, much higher than other
compounds like ureas.(62-63), in agreement with electrostatic potential calculations that
showed the ability of squaramides to form stronger acceptor/donor interactions than
ureas.(59) The squaramide moiety has been incorporated in synthetic transporters as
binding unit of cations (polyalkylammonium cations) (64) and anions (halides, dihydrogen
phosphate, sulphate and bicarbonate) (56) Recently, other groups used squaramide-based
receptors for the uptake of chloride, sulphate and carboxylates. (62, 65-68) The
stoichiometry receptor:anion in chloride complex is 1:1 as depicted in Figure 18.
Figure 18 – Crystal structure of the chloride complex with p-dinitrophenyl squaramide (CSD Refcode MUYYOV). Oxygen, carbon, nitrogen and hydrogen atoms are in red, wheat, blue and white, respectively. Chloride anion is in green and hydrogen bonds are drawn as black dashes.
Quantum calculations on free squaramide moiety (I), as well as in ammonium (II), sulphate
(III) and ammonium and sulphate (IV) complexes (see Figure 19), at the MP2/6-311+G**
level of theory.(55-56, 58-59, 64, 69), showed a progressive equalization of the bond lengths
in the four-membered ring upon cation and/or anion binding.(55-56)
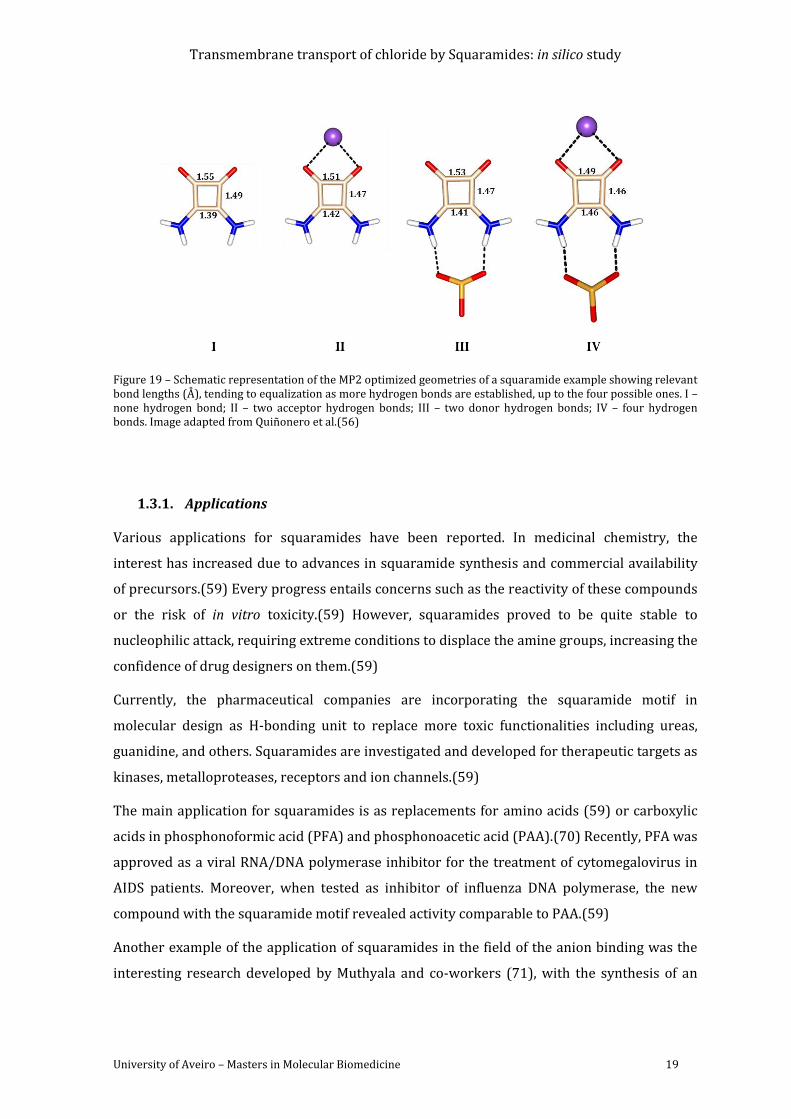
Transmembrane transport of chloride by Squaramides: in silico study
University of Aveiro – Masters in Molecular Biomedicine 19
Figure 19 – Schematic representation of the MP2 optimized geometries of a squaramide example showing relevant bond lengths (Å), tending to equalization as more hydrogen bonds are established, up to the four possible ones. I – none hydrogen bond; II – two acceptor hydrogen bonds; III – two donor hydrogen bonds; IV – four hydrogen bonds. Image adapted from Quiñonero et al.(56)
Applications 1.3.1.
Various applications for squaramides have been reported. In medicinal chemistry, the
interest has increased due to advances in squaramide synthesis and commercial availability
of precursors.(59) Every progress entails concerns such as the reactivity of these compounds
or the risk of in vitro toxicity.(59) However, squaramides proved to be quite stable to
nucleophilic attack, requiring extreme conditions to displace the amine groups, increasing the
confidence of drug designers on them.(59)
Currently, the pharmaceutical companies are incorporating the squaramide motif in
molecular design as H-bonding unit to replace more toxic functionalities including ureas,
guanidine, and others. Squaramides are investigated and developed for therapeutic targets as
kinases, metalloproteases, receptors and ion channels.(59)
The main application for squaramides is as replacements for amino acids (59) or carboxylic
acids in phosphonoformic acid (PFA) and phosphonoacetic acid (PAA).(70) Recently, PFA was
approved as a viral RNA/DNA polymerase inhibitor for the treatment of cytomegalovirus in
AIDS patients. Moreover, when tested as inhibitor of influenza DNA polymerase, the new
compound with the squaramide motif revealed activity comparable to PAA.(59)
Another example of the application of squaramides in the field of the anion binding was the
interesting research developed by Muthyala and co-workers (71), with the synthesis of an
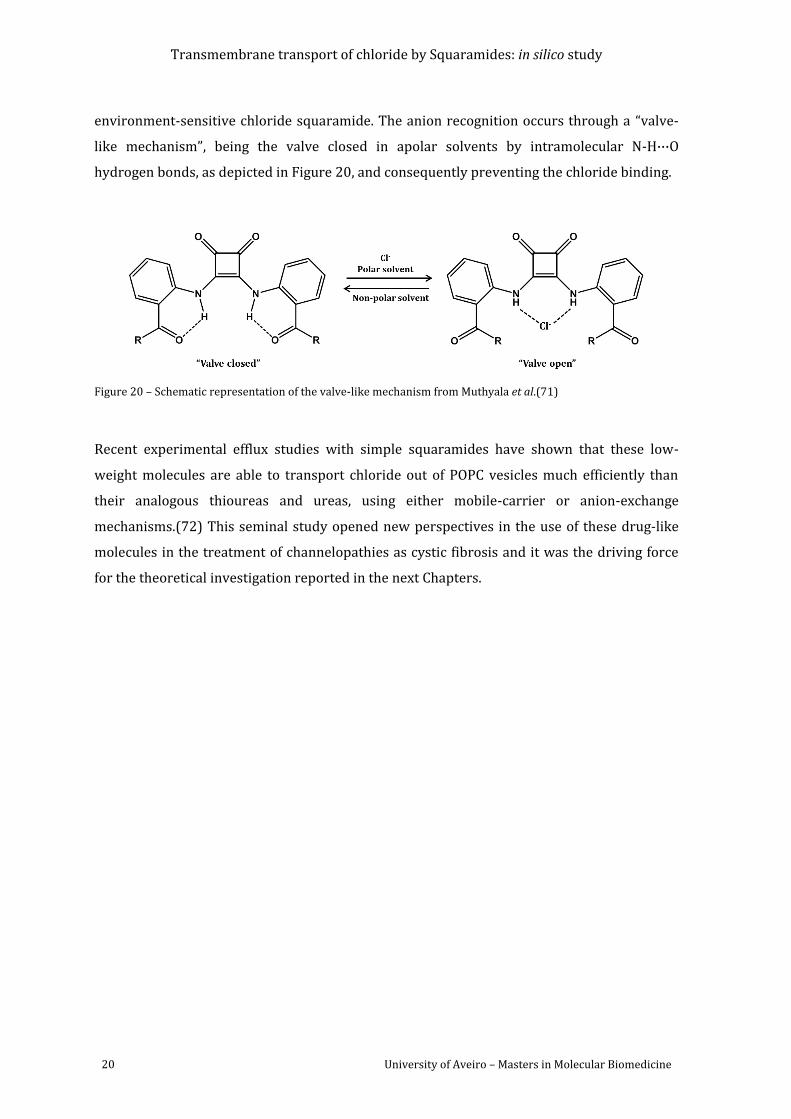
Transmembrane transport of chloride by Squaramides: in silico study
20 University of Aveiro – Masters in Molecular Biomedicine
environment-sensitive chloride squaramide. The anion recognition occurs through a “valve-
like mechanism”, being the valve closed in apolar solvents by intramolecular N-H···O
hydrogen bonds, as depicted in Figure 20, and consequently preventing the chloride binding.
Figure 20 – Schematic representation of the valve-like mechanism from Muthyala et al.(71)
Recent experimental efflux studies with simple squaramides have shown that these low-
weight molecules are able to transport chloride out of POPC vesicles much efficiently than
their analogous thioureas and ureas, using either mobile-carrier or anion-exchange
mechanisms.(72) This seminal study opened new perspectives in the use of these drug-like
molecules in the treatment of channelopathies as cystic fibrosis and it was the driving force
for the theoretical investigation reported in the next Chapters.
Transmembrane transport of chloride by Squaramides: in silico study
University of Aveiro – Masters in Molecular Biomedicine 21
1.4. Molecular dynamics simulations of biomembrane systems
The Molecular Dynamics (MD) simulation is powerful tool to study the diffusion and
interaction of artificial receptors with phospholipid bilayers as reported along this thesis.(73)
Thus, in the subsequent subsections a brief description of the fundamentals of molecular
mechanics and molecular dynamics simulations is presented.
Molecular modelling studies 1.4.1.
The total energy of a chemical system is given as the sum of the potential and kinetic energies
(see Eq. 1).
Eq. 1
The kinetic energy derives from the motion of the body and represents the work needed to
accelerate it (see Eq. 2)
Eq. 2
where m is the object’s mass and v its velocity.
The potential energy, on the other hand, is determined by the position and arrangement of
the particles. When the chemical behavior is manly determined by the nucleus positions the
potential energy is the molecular mechanics energy. In other words, the system can be
described using the formulism of classical mechanics or Newtonian mechanics.(74)
Molecular Mechanics (MM) energy can be decomposed into several components called force
potentials as given by the Eq. 3 and Eq. 4
Eq. 3
Eq. 4
The bond stretching, angle bending and torsional angles terms of Eq. 4 correspond to the
bonded terms, while the electrostatic and van der Waals interactions terms represent the
non-bonded terms.(75)
Transmembrane transport of chloride by Squaramides: in silico study
22 University of Aveiro – Masters in Molecular Biomedicine
Potential energy for bond stretching increases when bonds are compressed or stretched and
it can be described by Hooke´s law for a spring as given in Eq. 5.
( )
( )
Eq. 5
where k is the force constant for the spring, l is the actual bond length and l0 is the
equilibrium bond length.(74)
Angle bending energies are modeled by polynomial expansions and increase as the angles are
bent from their normal position as given by Eq. 6.
( )
( )
[ ( ) ( ) ( )
] Eq. 6
where is the actual valence angle and 0 is the natural valence angle.(74)
Torsion energies result from intramolecular rotations and these energies increase as the
distance between 1-4 atoms decreases. The torsion potential is an expansion of a periodic
cosine function given by Eq. 7 and takes into account all 1-4 bond relationships.(76)
( ) ∑
[ ( )] Eq. 7
where is the torsion angle and Vn is the ‘barrier’ height that gives a qualitative indication of
the relative barriers to rotation. n is the multiplicity and γ is the phase factor.(76)
Whereas the force constants for the bond and angles terms are usually obtained through an
empirical equation as exemplified for general Amber force field (GAFF) in Chapter 2 (see Eq.
10 and Eq. 11), the force constants for torsion angles are determined via quantum
calculations.
Electrostatic interactions are accounted by atomic point charges and bond dipole moments.
The energy is calculated according to Coulomb’s law and considering all the dipole-dipole
moments in the molecule. For a pair of atoms the electrostatic energy is given by the Eq.
8.(76)
Eq. 8
where q is the atomic charge of each atom, ε is the dielectric constant and r is the distance
between the atoms involved.
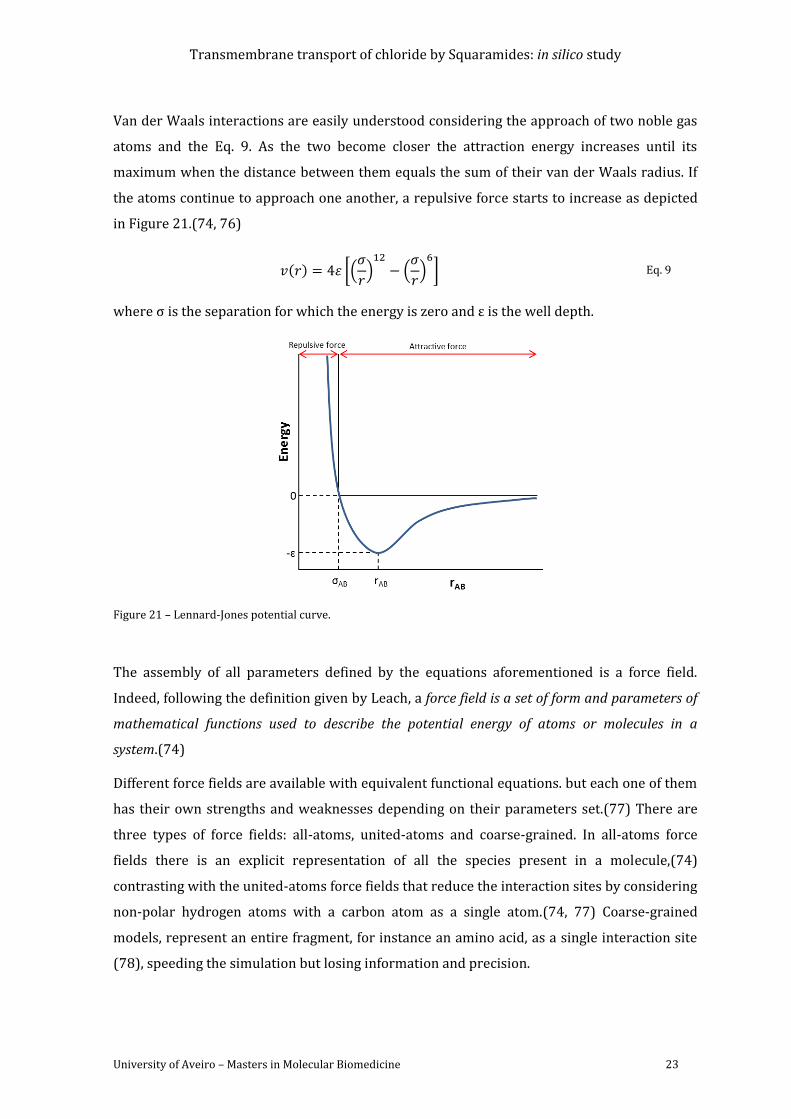
Transmembrane transport of chloride by Squaramides: in silico study
University of Aveiro – Masters in Molecular Biomedicine 23
Van der Waals interactions are easily understood considering the approach of two noble gas
atoms and the Eq. 9. As the two become closer the attraction energy increases until its
maximum when the distance between them equals the sum of their van der Waals radius. If
the atoms continue to approach one another, a repulsive force starts to increase as depicted
in Figure 21.(74, 76)
where σ is the separation for which the energy is zero and ε is the well depth.
Figure 21 – Lennard-Jones potential curve.
The assembly of all parameters defined by the equations aforementioned is a force field.
Indeed, following the definition given by Leach, a force field is a set of form and parameters of
mathematical functions used to describe the potential energy of atoms or molecules in a
system.(74)
Different force fields are available with equivalent functional equations. but each one of them
has their own strengths and weaknesses depending on their parameters set.(77) There are
three types of force fields: all-atoms, united-atoms and coarse-grained. In all-atoms force
fields there is an explicit representation of all the species present in a molecule,(74)
contrasting with the united-atoms force fields that reduce the interaction sites by considering
non-polar hydrogen atoms with a carbon atom as a single atom.(74, 77) Coarse-grained
models, represent an entire fragment, for instance an amino acid, as a single interaction site
(78), speeding the simulation but losing information and precision.
( ) [(
)
(
)
] Eq. 9
Transmembrane transport of chloride by Squaramides: in silico study
24 University of Aveiro – Masters in Molecular Biomedicine
Molecular Mechanics can be applied to predict the local minima on molecular potential
energy surface (PES), however MM does not account of zero-point vibrations and the
calculations refer to molecules at 0 K (75). Therefore, computational chemists seek for
techniques capable of accurately reproduce molecular behaviour while allowing to “watch”
the time development of collections of atoms and molecules. (75) Molecular Dynamics (MD)
is one of the methods that can be used for this purpose (76). MD is a deterministic method,
associated with Newton’s second law, meaning that the state of the system at any future time
can be predicted from its current state, (74, 76), resulting in a phase space trajectory. (76) It
is important to refer that phase space trajectories cannot cross one another but they can be
periodic, assembling repeatedly in space, these are called periodic boundary conditions
(PBC). (76)
Periodic boundary conditions (PBC) are a set of boundary conditions used to simulate a large
system by modeling only a small part, a unit cell or simulation box, i.e., when an object passes
through one face of the unit cell it reappears on the opposite face with the same velocity and
properties.(74) PBC requires unit cells with certain characteristics, the shape is extremely
important. It must tile perfectly as a three-dimensional crystal so it cannot be spherical; the
most common box shapes used in MD simulations are the cubical and rectangular prism or
the truncated octahedron. Each system can have infinite tiled copies of its unit cell (images),
however, during the simulation time only the properties of a single unit cell need to be
recorded and are then applied to the images.(74)
The first MD simulations were performed by Alder et al. in 1957 (79) using hard-sphere
potential, a very simple model in which the particles move in straight lines at constant
velocity between collisions and there is no force between particles until they collide (74). In
contrast, in Lennard-Jones model the force between two atoms or molecules changes
continuously with their separation.(74)
In summary, the equations introduced along this sub section are the basis of MM and MD
simulations of molecular systems, such as proteins, lipids, and the phospholipid bilayers
studied in this work.
MD simulations of membrane models 1.4.2.
Currently, MD simulations of phospholipid bilayers are used to investigate pure species or
mixed composition bilayers, lipid rafts and cellular processes.(74) Four types of
phospholipids are commonly used in simulated membrane models, DOPC, POPC, DMPC and
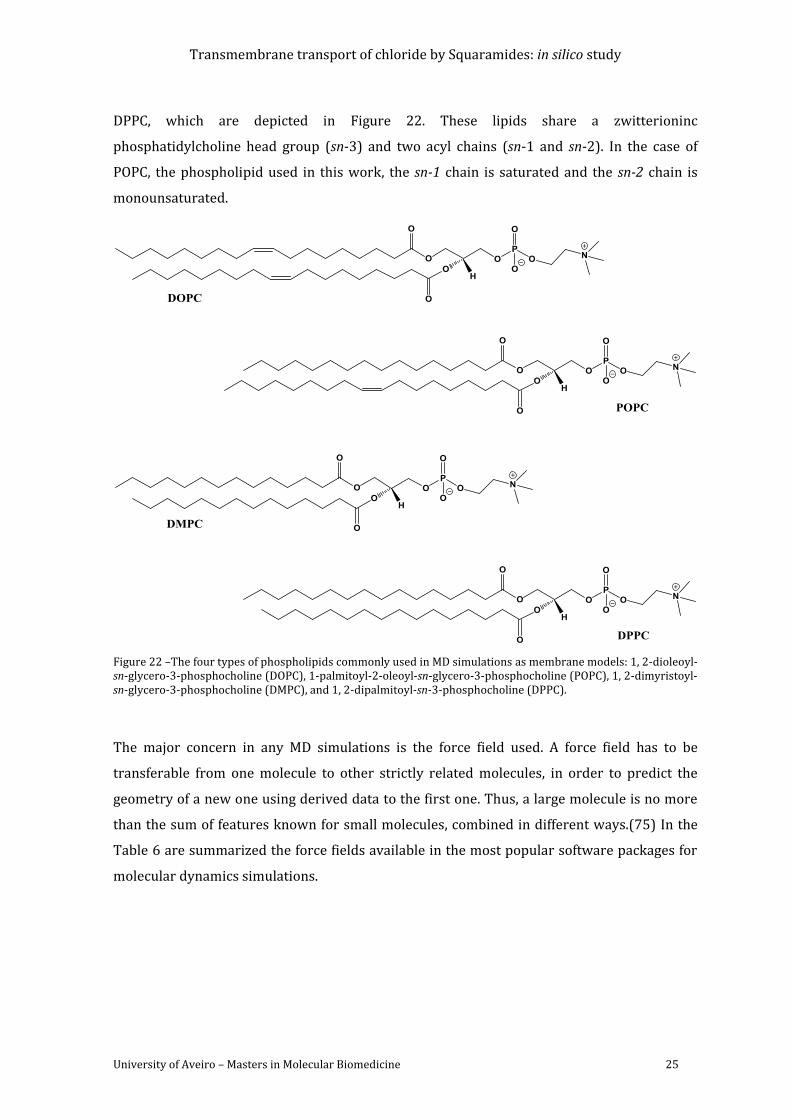
Transmembrane transport of chloride by Squaramides: in silico study
University of Aveiro – Masters in Molecular Biomedicine 25
DPPC, which are depicted in Figure 22. These lipids share a zwitterioninc
phosphatidylcholine head group (sn-3) and two acyl chains (sn-1 and sn-2). In the case of
POPC, the phospholipid used in this work, the sn-1 chain is saturated and the sn-2 chain is
monounsaturated.
Figure 22 –The four types of phospholipids commonly used in MD simulations as membrane models: 1, 2-dioleoyl-sn-glycero-3-phosphocholine (DOPC), 1-palmitoyl-2-oleoyl-sn-glycero-3-phosphocholine (POPC), 1, 2-dimyristoyl-sn-glycero-3-phosphocholine (DMPC), and 1, 2-dipalmitoyl-sn-3-phosphocholine (DPPC).
The major concern in any MD simulations is the force field used. A force field has to be
transferable from one molecule to other strictly related molecules, in order to predict the
geometry of a new one using derived data to the first one. Thus, a large molecule is no more
than the sum of features known for small molecules, combined in different ways.(75) In the
Table 6 are summarized the force fields available in the most popular software packages for
molecular dynamics simulations.
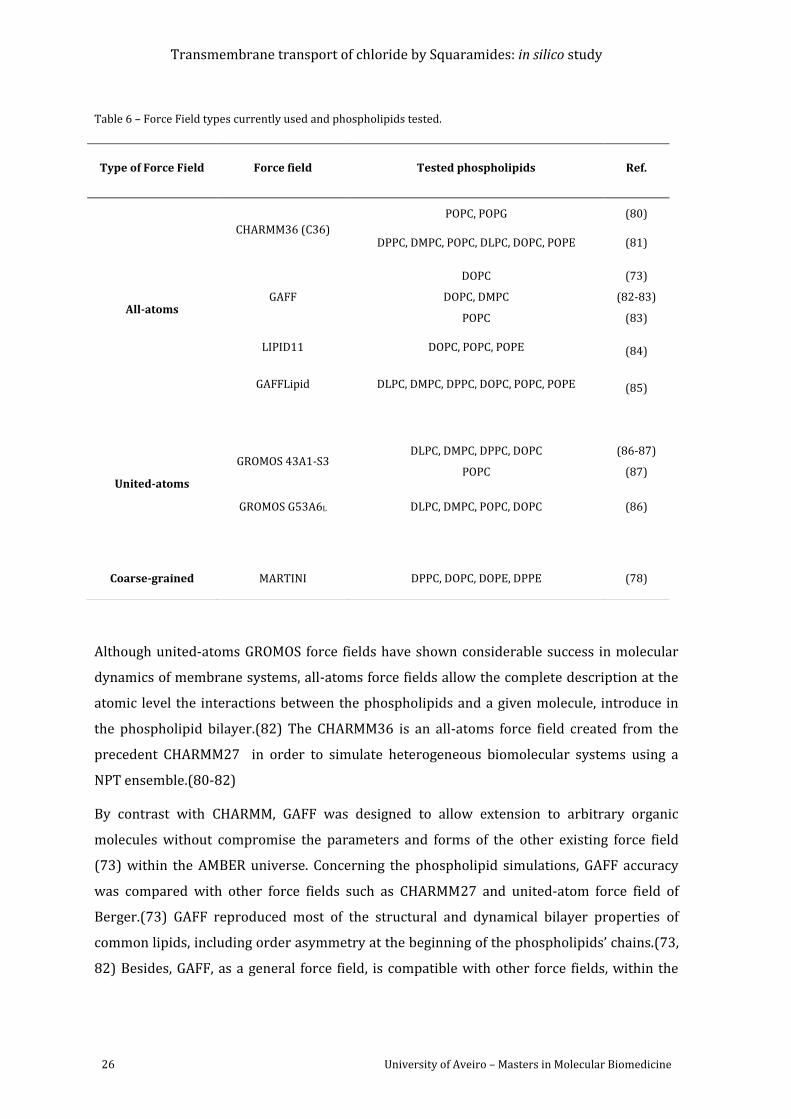
Transmembrane transport of chloride by Squaramides: in silico study
26 University of Aveiro – Masters in Molecular Biomedicine
Table 6 – Force Field types currently used and phospholipids tested.
Although united-atoms GROMOS force fields have shown considerable success in molecular
dynamics of membrane systems, all-atoms force fields allow the complete description at the
atomic level the interactions between the phospholipids and a given molecule, introduce in
the phospholipid bilayer.(82) The CHARMM36 is an all-atoms force field created from the
precedent CHARMM27 in order to simulate heterogeneous biomolecular systems using a
NPT ensemble.(80-82)
By contrast with CHARMM, GAFF was designed to allow extension to arbitrary organic
molecules without compromise the parameters and forms of the other existing force field
(73) within the AMBER universe. Concerning the phospholipid simulations, GAFF accuracy
was compared with other force fields such as CHARMM27 and united-atom force field of
Berger.(73) GAFF reproduced most of the structural and dynamical bilayer properties of
common lipids, including order asymmetry at the beginning of the phospholipids’ chains.(73,
82) Besides, GAFF, as a general force field, is compatible with other force fields, within the
Type of Force Field Force field Tested phospholipids Ref.
All-atoms
CHARMM36 (C36)
POPC, POPG
DPPC, DMPC, POPC, DLPC, DOPC, POPE
(80)
(81)
GAFF
DOPC
DOPC, DMPC
POPC
(73)
(82-83)
(83)
LIPID11 DOPC, POPC, POPE (84)
GAFFLipid DLPC, DMPC, DPPC, DOPC, POPC, POPE (85)
United-atoms
GROMOS 43A1-S3 DLPC, DMPC, DPPC, DOPC
POPC
(86-87)
(87)
GROMOS G53A6L DLPC, DMPC, POPC, DOPC (86)
Coarse-grained MARTINI DPPC, DOPC, DOPE, DPPE (78)
Transmembrane transport of chloride by Squaramides: in silico study
University of Aveiro – Masters in Molecular Biomedicine 27
AMBER software package, such as for nucleic acids and proteins (ff12SB) (10) and
carbohydrates (GLYCAM).(88)
In 2007, Jójárt and Martinek tested the original GAFF in a fully hydrated POPC membrane
bilayer composed of 128 POPC molecules and 2985 TIP3P water molecules (83). The
simulations were performed in a tensionless NPT ensemble and in an NPγT ensemble with
surface tension of 60 mNm-1 per bilayer. In the first case the results obtained showed a high
compression of the membrane resulting in low areas per lipid and high order parameters,
comparing to experimental values. However when a surface tension was applied together
with an NPT ensemble, an excellent agreement between the values of these parameters and
the experimental ones was obtained.(83) Thus, GAFF/TIP3P combination proved to be a good
model to use for aqueous membrane bilayer simulations with an acceptable accuracy for
biomolecular modelling.(83)
New AMBER compatible force fields for lipids were recently published (2012): Lipid11 (84)
and GAFFLipid (85).The second force field was created by Gould and co-workers from the
GAFF development of specific parameterization for DLPC, DMPC, DPPC, DOPC, POPC and
POPE, which includes different atomic charges for the common fragments between these
lipids. This force filed has as the main advantage of performing simulations of a lipid bilayer
with no superficial tension (tensionless force field).(85) However, the use of GAFFLipid force
field is limited to the six neutral phospholipids. By contrast the LIPID11 force field was
developed to be a flexible and modular framework, in order to be used with other AMBER
force fields.(84) This force field is different from GAFFLipid because it uses a “plug and play”
approach; charge model and atom typing and naming were developed to head groups and
tails separately, allowing phospholipids to be built out of simple residue-like building blocks
heads and tails. This approach can be applied to an extensive range of fatty acid tails and head
groups combinations. The great disadvantage is the need for artificial surface tension term,
an artifact that cannot be circumvented.
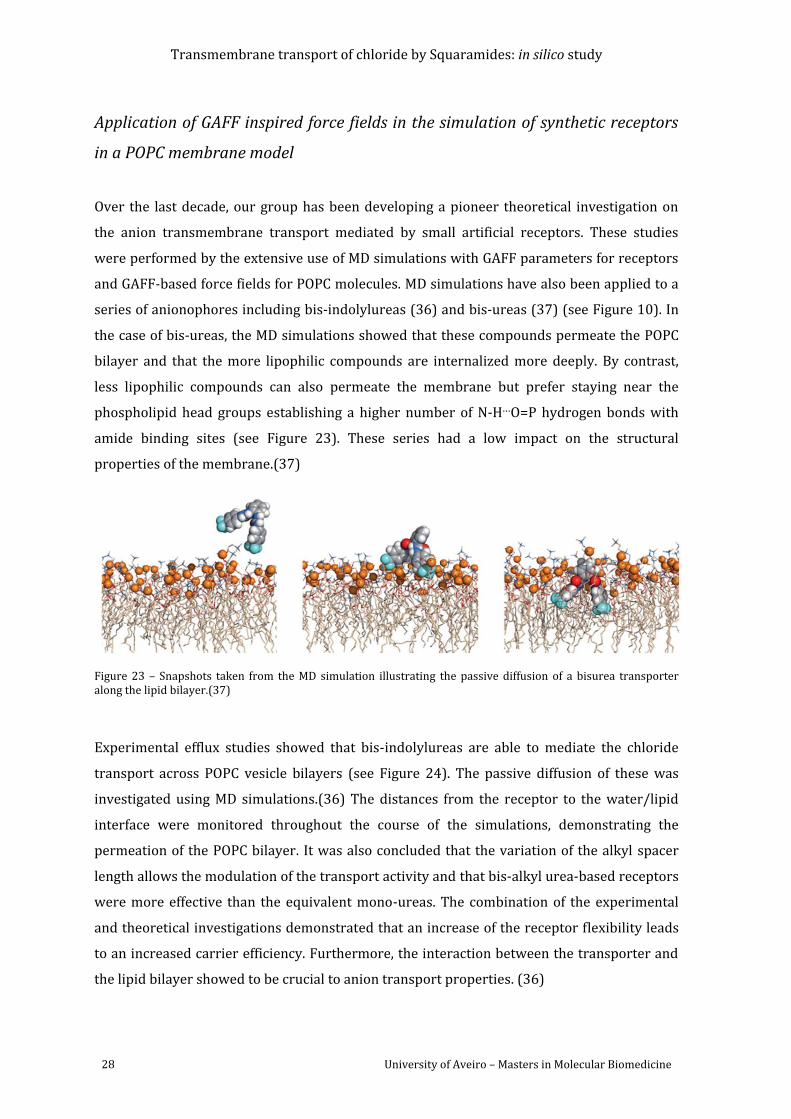
Transmembrane transport of chloride by Squaramides: in silico study
28 University of Aveiro – Masters in Molecular Biomedicine
Application of GAFF inspired force fields in the simulation of synthetic receptors
in a POPC membrane model
Over the last decade, our group has been developing a pioneer theoretical investigation on
the anion transmembrane transport mediated by small artificial receptors. These studies
were performed by the extensive use of MD simulations with GAFF parameters for receptors
and GAFF-based force fields for POPC molecules. MD simulations have also been applied to a
series of anionophores including bis-indolylureas (36) and bis-ureas (37) (see Figure 10). In
the case of bis-ureas, the MD simulations showed that these compounds permeate the POPC
bilayer and that the more lipophilic compounds are internalized more deeply. By contrast,
less lipophilic compounds can also permeate the membrane but prefer staying near the
phospholipid head groups establishing a higher number of N-H···O=P hydrogen bonds with
amide binding sites (see Figure 23). These series had a low impact on the structural
properties of the membrane.(37)
Figure 23 – Snapshots taken from the MD simulation illustrating the passive diffusion of a bisurea transporter along the lipid bilayer.(37)
Experimental efflux studies showed that bis-indolylureas are able to mediate the chloride
transport across POPC vesicle bilayers (see Figure 24). The passive diffusion of these was
investigated using MD simulations.(36) The distances from the receptor to the water/lipid
interface were monitored throughout the course of the simulations, demonstrating the
permeation of the POPC bilayer. It was also concluded that the variation of the alkyl spacer
length allows the modulation of the transport activity and that bis-alkyl urea-based receptors
were more effective than the equivalent mono-ureas. The combination of the experimental
and theoretical investigations demonstrated that an increase of the receptor flexibility leads
to an increased carrier efficiency. Furthermore, the interaction between the transporter and
the lipid bilayer showed to be crucial to anion transport properties. (36)
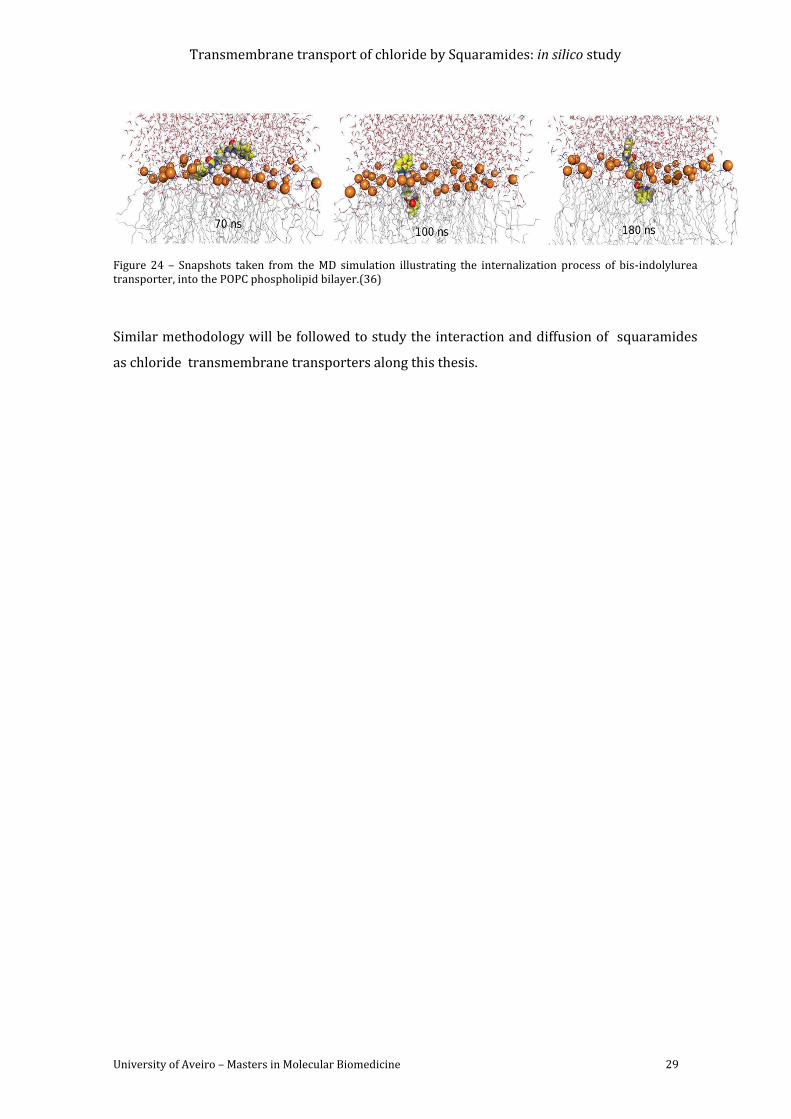
Transmembrane transport of chloride by Squaramides: in silico study
University of Aveiro – Masters in Molecular Biomedicine 29
Figure 24 – Snapshots taken from the MD simulation illustrating the internalization process of bis-indolylurea transporter, into the POPC phospholipid bilayer.(36)
Similar methodology will be followed to study the interaction and diffusion of squaramides
as chloride transmembrane transporters along this thesis.
Transmembrane transport of chloride by Squaramides: in silico study
30 University of Aveiro – Masters in Molecular Biomedicine
1.5. Objectives
The study and development of new synthetic anion transporters is a matter of great
importance for the treatment of channelopathies such as cystic fibrosis, which is commonly
associated with a deficient chloride transmembrane transport. Thus, this thesis aims to
investigate the diffusion and the interaction of squaramides with a POPC bilayer membrane
model by the extensive use of molecular dynamics simulations. The structural findings
obtained will give the first valuable insights to understand the transmembrane transport of
chloride by the squaramides. This main objective will be accomplished through the following
sub-objectives:
Evaluate the recognition of squaramides for chloride anion, using gas-phase
molecular simulation methods.
Evaluate the structural properties of two different POPC pure membrane models
using the Molecular Dynamics simulation methodology, in comparison with the
published experimental and computational data.
Carry out MD simulations with the chloride complexes positioned in water slabs or
within the phospholipid bilayer core
Evaluate the impact of squaramide receptors in the structural properties of the POPC
phospholipid bilayer.
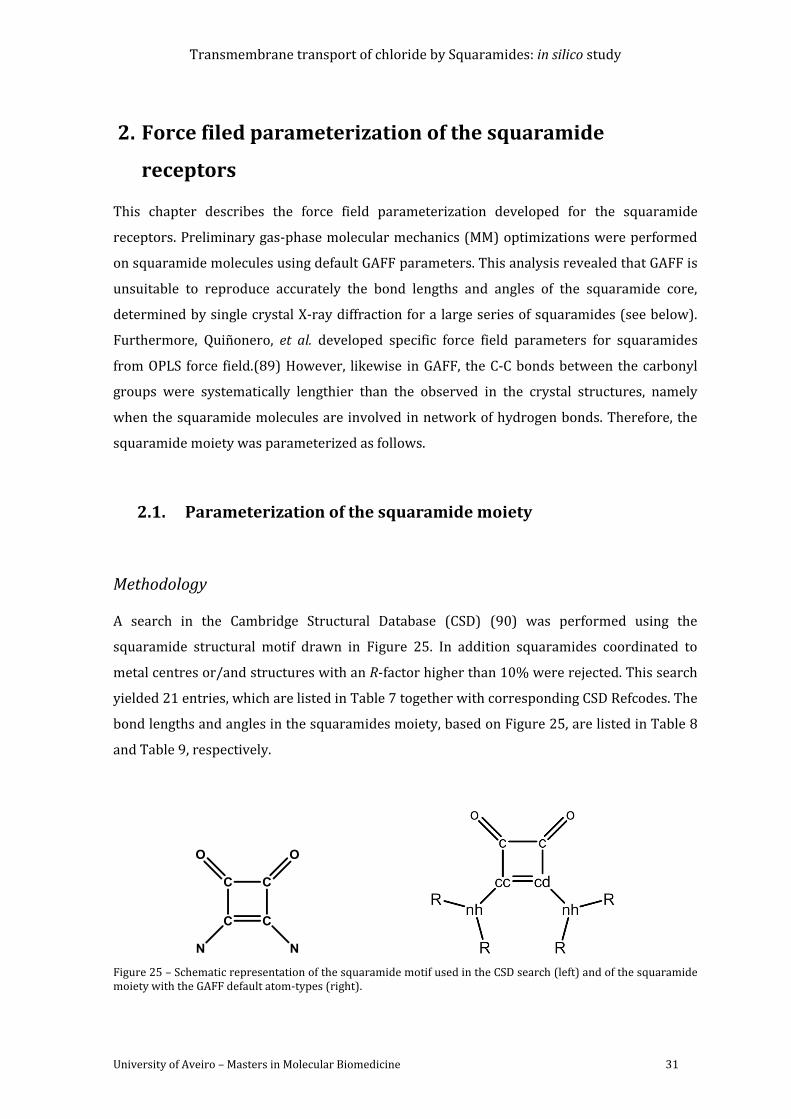
Transmembrane transport of chloride by Squaramides: in silico study
University of Aveiro – Masters in Molecular Biomedicine 31
2. Force filed parameterization of the squaramide
receptors
This chapter describes the force field parameterization developed for the squaramide
receptors. Preliminary gas-phase molecular mechanics (MM) optimizations were performed
on squaramide molecules using default GAFF parameters. This analysis revealed that GAFF is
unsuitable to reproduce accurately the bond lengths and angles of the squaramide core,
determined by single crystal X-ray diffraction for a large series of squaramides (see below).
Furthermore, Quiñonero, et al. developed specific force field parameters for squaramides
from OPLS force field.(89) However, likewise in GAFF, the C-C bonds between the carbonyl
groups were systematically lengthier than the observed in the crystal structures, namely
when the squaramide molecules are involved in network of hydrogen bonds. Therefore, the
squaramide moiety was parameterized as follows.
2.1. Parameterization of the squaramide moiety
Methodology
A search in the Cambridge Structural Database (CSD) (90) was performed using the
squaramide structural motif drawn in Figure 25. In addition squaramides coordinated to
metal centres or/and structures with an R-factor higher than 10% were rejected. This search
yielded 21 entries, which are listed in Table 7 together with corresponding CSD Refcodes. The
bond lengths and angles in the squaramides moiety, based on Figure 25, are listed in Table 8
and Table 9, respectively.
Figure 25 – Schematic representation of the squaramide motif used in the CSD search (left) and of the squaramide moiety with the GAFF default atom-types (right).
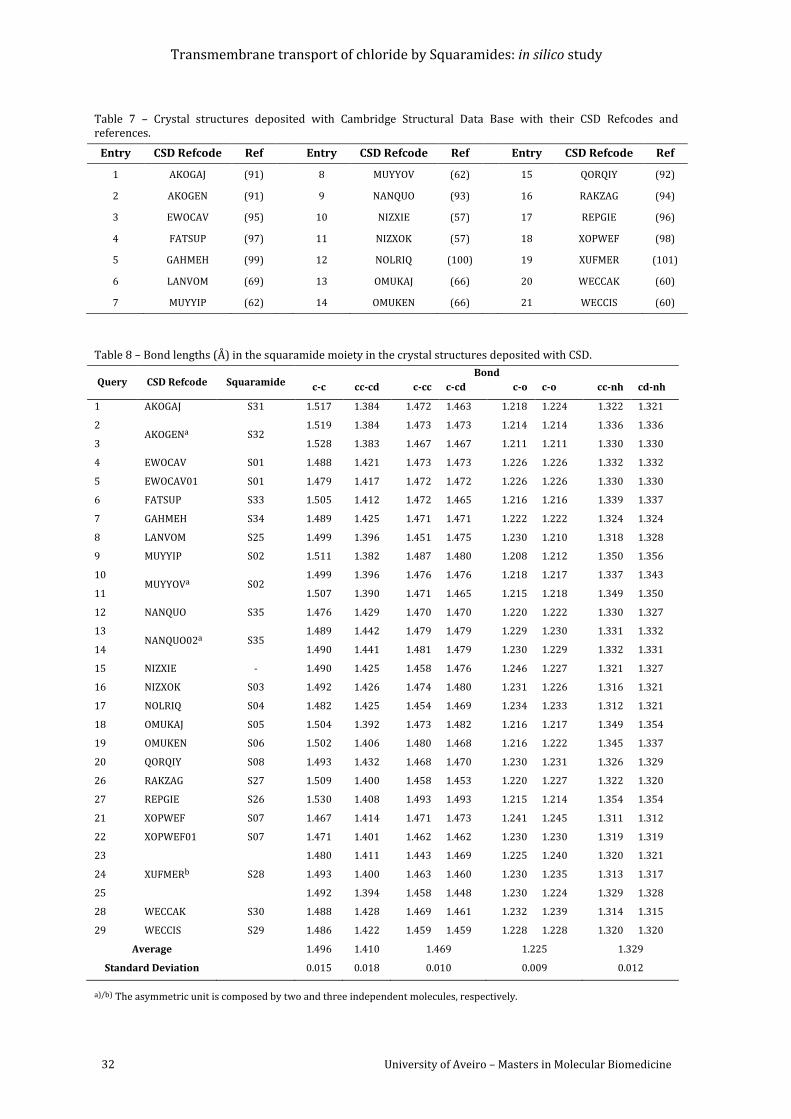
Transmembrane transport of chloride by Squaramides: in silico study
32 University of Aveiro – Masters in Molecular Biomedicine
Table 7 – Crystal structures deposited with Cambridge Structural Data Base with their CSD Refcodes and references.
Entry CSD Refcode Ref Entry CSD Refcode Ref Entry CSD Refcode Ref
1 AKOGAJ (91) 8 MUYYOV (62) 15 QORQIY (92)
2 AKOGEN (91) 9 NANQUO (93) 16 RAKZAG (94)
3 EWOCAV (95) 10 NIZXIE (57) 17 REPGIE (96)
4 FATSUP (97) 11 NIZXOK (57) 18 XOPWEF (98)
5 GAHMEH (99) 12 NOLRIQ (100) 19 XUFMER (101)
6 LANVOM (69) 13 OMUKAJ (66) 20 WECCAK (60)
7 MUYYIP (62) 14 OMUKEN (66) 21 WECCIS (60)
Table 8 – Bond lengths (Å) in the squaramide moiety in the crystal structures deposited with CSD.
Query CSD Refcode Squaramide Bond
c-c cc-cd c-cc c-cd c-o c-o cc-nh cd-nh
1 AKOGAJ S31 1.517 1.384 1.472 1.463 1.218 1.224 1.322 1.321
2 AKOGENa S32
1.519 1.384 1.473 1.473 1.214 1.214 1.336 1.336
3 1.528 1.383 1.467 1.467 1.211 1.211 1.330 1.330
4 EWOCAV S01 1.488 1.421 1.473 1.473 1.226 1.226 1.332 1.332
5 EWOCAV01 S01 1.479 1.417 1.472 1.472 1.226 1.226 1.330 1.330
6 FATSUP S33 1.505 1.412 1.472 1.465 1.216 1.216 1.339 1.337
7 GAHMEH S34 1.489 1.425 1.471 1.471 1.222 1.222 1.324 1.324
8 LANVOM S25 1.499 1.396 1.451 1.475 1.230 1.210 1.318 1.328
9 MUYYIP S02 1.511 1.382 1.487 1.480 1.208 1.212 1.350 1.356
10 MUYYOVa S02
1.499 1.396 1.476 1.476 1.218 1.217 1.337 1.343
11 1.507 1.390 1.471 1.465 1.215 1.218 1.349 1.350
12 NANQUO S35 1.476 1.429 1.470 1.470 1.220 1.222 1.330 1.327
13 NANQUO02a S35
1.489 1.442 1.479 1.479 1.229 1.230 1.331 1.332
14 1.490 1.441 1.481 1.479 1.230 1.229 1.332 1.331
15 NIZXIE - 1.490 1.425 1.458 1.476 1.246 1.227 1.321 1.327
16 NIZXOK S03 1.492 1.426 1.474 1.480 1.231 1.226 1.316 1.321
17 NOLRIQ S04 1.482 1.425 1.454 1.469 1.234 1.233 1.312 1.321
18 OMUKAJ S05 1.504 1.392 1.473 1.482 1.216 1.217 1.349 1.354
19 OMUKEN S06 1.502 1.406 1.480 1.468 1.216 1.222 1.345 1.337
20 QORQIY S08 1.493 1.432 1.468 1.470 1.230 1.231 1.326 1.329
26 RAKZAG S27 1.509 1.400 1.458 1.453 1.220 1.227 1.322 1.320
27 REPGIE S26 1.530 1.408 1.493 1.493 1.215 1.214 1.354 1.354
21 XOPWEF S07 1.467 1.414 1.471 1.473 1.241 1.245 1.311 1.312
22 XOPWEF01 S07 1.471 1.401 1.462 1.462 1.230 1.230 1.319 1.319
23
XUFMERb S28
1.480 1.411 1.443 1.469 1.225 1.240 1.320 1.321
24 1.493 1.400 1.463 1.460 1.230 1.235 1.313 1.317
25 1.492 1.394 1.458 1.448 1.230 1.224 1.329 1.328
28 WECCAK S30 1.488 1.428 1.469 1.461 1.232 1.239 1.314 1.315
29 WECCIS S29 1.486 1.422 1.459 1.459 1.228 1.228 1.320 1.320
Average 1.496 1.410 1.469 1.225 1.329
Standard Deviation 0.015 0.018 0.010 0.009 0.012
a)/b) The asymmetric unit is composed by two and three independent molecules, respectively.
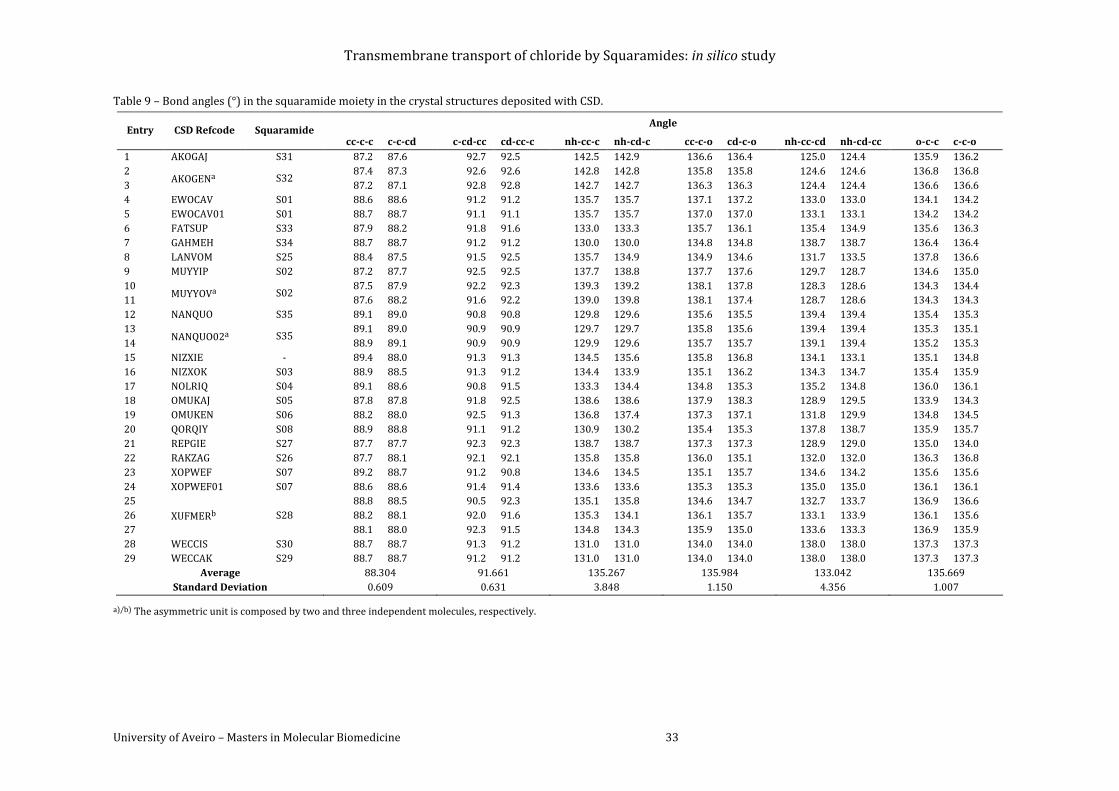
Transmembrane transport of chloride by Squaramides: in silico study
University of Aveiro – Masters in Molecular Biomedicine 33
Table 9 – Bond angles (°) in the squaramide moiety in the crystal structures deposited with CSD.
Entry CSD Refcode Squaramide Angle
cc-c-c c-c-cd c-cd-cc cd-cc-c nh-cc-c nh-cd-c cc-c-o cd-c-o nh-cc-cd nh-cd-cc o-c-c c-c-o
1 AKOGAJ S31 87.2 87.6 92.7 92.5 142.5 142.9 136.6 136.4 125.0 124.4 135.9 136.2
2 AKOGENa S32
87.4 87.3 92.6 92.6 142.8 142.8 135.8 135.8 124.6 124.6 136.8 136.8
3 87.2 87.1 92.8 92.8 142.7 142.7 136.3 136.3 124.4 124.4 136.6 136.6
4 EWOCAV S01 88.6 88.6 91.2 91.2 135.7 135.7 137.1 137.2 133.0 133.0 134.1 134.2
5 EWOCAV01 S01 88.7 88.7 91.1 91.1 135.7 135.7 137.0 137.0 133.1 133.1 134.2 134.2
6 FATSUP S33 87.9 88.2 91.8 91.6 133.0 133.3 135.7 136.1 135.4 134.9 135.6 136.3
7 GAHMEH S34 88.7 88.7 91.2 91.2 130.0 130.0 134.8 134.8 138.7 138.7 136.4 136.4
8 LANVOM S25 88.4 87.5 91.5 92.5 135.7 134.9 134.9 134.6 131.7 133.5 137.8 136.6
9 MUYYIP S02 87.2 87.7 92.5 92.5 137.7 138.8 137.7 137.6 129.7 128.7 134.6 135.0
10 MUYYOVa S02
87.5 87.9 92.2 92.3 139.3 139.2 138.1 137.8 128.3 128.6 134.3 134.4
11 87.6 88.2 91.6 92.2 139.0 139.8 138.1 137.4 128.7 128.6 134.3 134.3
12 NANQUO S35 89.1 89.0 90.8 90.8 129.8 129.6 135.6 135.5 139.4 139.4 135.4 135.3
13 NANQUO02a S35
89.1 89.0 90.9 90.9 129.7 129.7 135.8 135.6 139.4 139.4 135.3 135.1
14 88.9 89.1 90.9 90.9 129.9 129.6 135.7 135.7 139.1 139.4 135.2 135.3
15 NIZXIE - 89.4 88.0 91.3 91.3 134.5 135.6 135.8 136.8 134.1 133.1 135.1 134.8
16 NIZXOK S03 88.9 88.5 91.3 91.2 134.4 133.9 135.1 136.2 134.3 134.7 135.4 135.9
17 NOLRIQ S04 89.1 88.6 90.8 91.5 133.3 134.4 134.8 135.3 135.2 134.8 136.0 136.1
18 OMUKAJ S05 87.8 87.8 91.8 92.5 138.6 138.6 137.9 138.3 128.9 129.5 133.9 134.3
19 OMUKEN S06 88.2 88.0 92.5 91.3 136.8 137.4 137.3 137.1 131.8 129.9 134.8 134.5
20 QORQIY S08 88.9 88.8 91.1 91.2 130.9 130.2 135.4 135.3 137.8 138.7 135.9 135.7
21 REPGIE S27 87.7 87.7 92.3 92.3 138.7 138.7 137.3 137.3 128.9 129.0 135.0 134.0
22 RAKZAG S26 87.7 88.1 92.1 92.1 135.8 135.8 136.0 135.1 132.0 132.0 136.3 136.8
23 XOPWEF S07 89.2 88.7 91.2 90.8 134.6 134.5 135.1 135.7 134.6 134.2 135.6 135.6
24 XOPWEF01 S07 88.6 88.6 91.4 91.4 133.6 133.6 135.3 135.3 135.0 135.0 136.1 136.1
25
XUFMERb S28
88.8 88.5 90.5 92.3 135.1 135.8 134.6 134.7 132.7 133.7 136.9 136.6
26 88.2 88.1 92.0 91.6 135.3 134.1 136.1 135.7 133.1 133.9 136.1 135.6
27 88.1 88.0 92.3 91.5 134.8 134.3 135.9 135.0 133.6 133.3 136.9 135.9
28 WECCIS S30 88.7 88.7 91.3 91.2 131.0 131.0 134.0 134.0 138.0 138.0 137.3 137.3
29 WECCAK S29 88.7 88.7 91.2 91.2 131.0 131.0 134.0 134.0 138.0 138.0 137.3 137.3
Average 88.304 91.661 135.267 135.984 133.042 135.669
Standard Deviation 0.609 0.631 3.848 1.150 4.356 1.007
a)/b) The asymmetric unit is composed by two and three independent molecules, respectively.
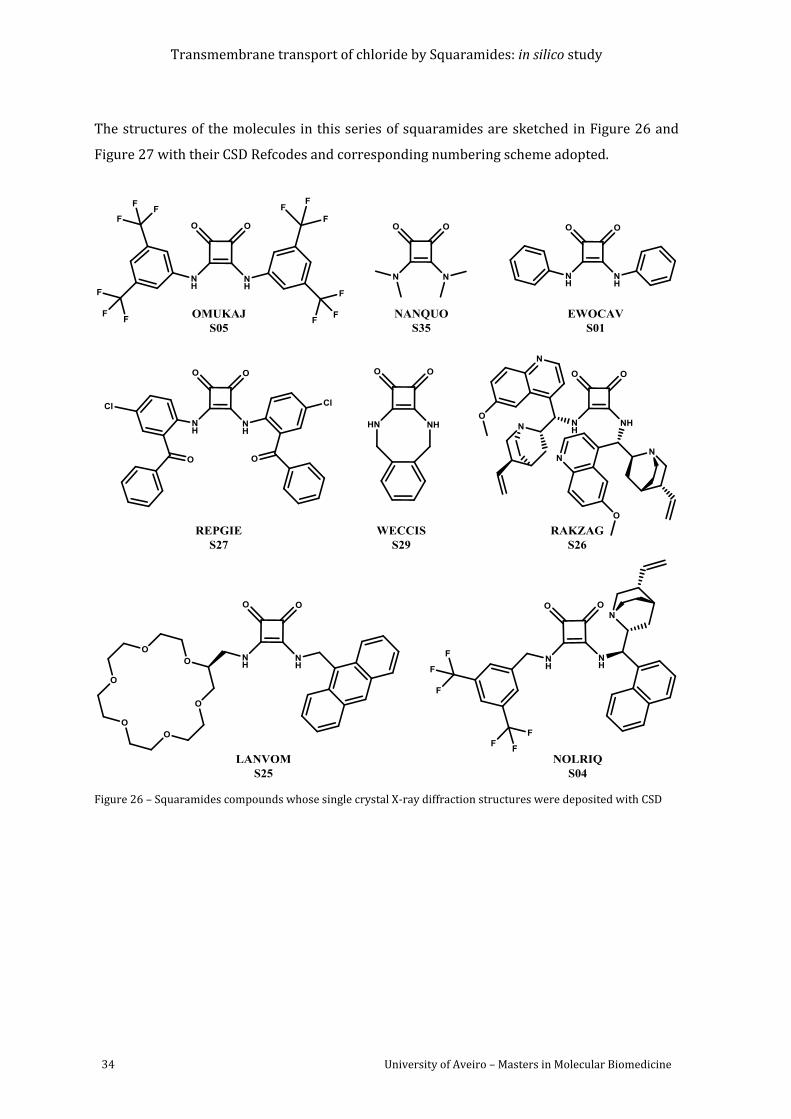
Transmembrane transport of chloride by Squaramides: in silico study
34 University of Aveiro – Masters in Molecular Biomedicine
The structures of the molecules in this series of squaramides are sketched in Figure 26 and
Figure 27 with their CSD Refcodes and corresponding numbering scheme adopted.
Figure 26 – Squaramides compounds whose single crystal X-ray diffraction structures were deposited with CSD
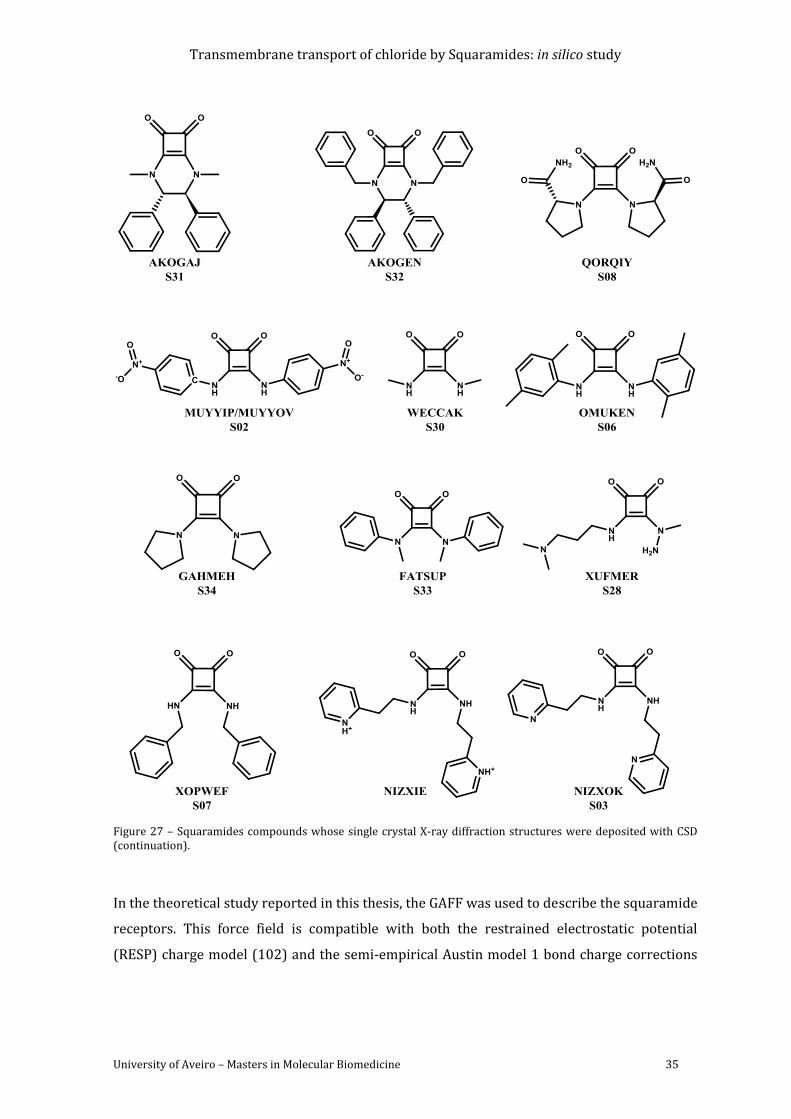
Transmembrane transport of chloride by Squaramides: in silico study
University of Aveiro – Masters in Molecular Biomedicine 35
Figure 27 – Squaramides compounds whose single crystal X-ray diffraction structures were deposited with CSD (continuation).
In the theoretical study reported in this thesis, the GAFF was used to describe the squaramide
receptors. This force field is compatible with both the restrained electrostatic potential
(RESP) charge model (102) and the semi-empirical Austin model 1 bond charge corrections
Transmembrane transport of chloride by Squaramides: in silico study
36 University of Aveiro – Masters in Molecular Biomedicine
(AM1-BCC) atomic charges.(103-104) Therefore, both charge models were used in the
development of the specific force field parameters for the squaramide moiety.
To obtain the AM1-BCC atomic charges, the Protein Database (pdb) file of each selected
receptor was directly used as input file in the antechamber package, as implemented in
Ambertools13 (105) to generate a Tripos MOL2 molecule model (mol2) file with the atomic
coordinates, AM1-BCC atomic charges and GAFF atom types, assigned according to
intramolecular connectivities. The AM1-BCC charges were calculated from structures
optimized with the SQM package.(106)
The RESP charges, in agreement with the GAFF paper methodology, were calculated with the
squaramide molecule previously optimized at the HF/6-31G* level using Gaussian 09.(107)
Subsequently, the electrostatic potential was obtained through a single point calculation at
the same theory level using four concentric layers for each atom and six density points in
each layer (Gaussian 09 internal options: Pop=MK IOp(6/33=2, 6/41=4, 6/42=6)). The atomic
charges were then calculated for a single molecular conformation by two successive RESP
fittings, leading to a mol2 file containing the atomic coordinates, RESP charges and atom
types.
Afterwards, a force field modification (frcmod) file was created for each molecule, with the
missing force field parameters, using the parmchk program within Ambertools13.(105) The
GAFF and frcmod parameter files (read in this order), and the mol2 file (with AM1-BCC or
RESP atomic charges) were loaded into tLEaP and a topology and coordinate files were
generated for each squaramide molecule. The structures of 18 squaramides were energy
minimized by MM with the default parameters from GAFF and with the two charge models.
The bond lengths are listed in Table 10 and Table 11.
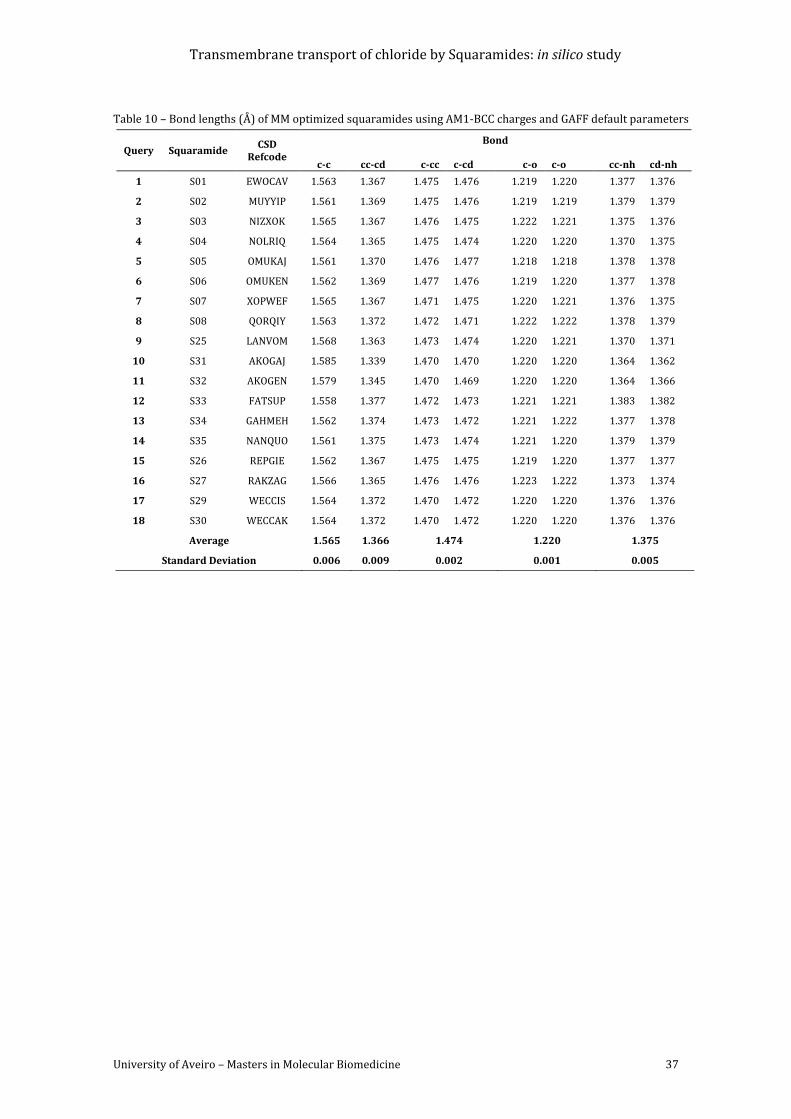
Transmembrane transport of chloride by Squaramides: in silico study
University of Aveiro – Masters in Molecular Biomedicine 37
Table 10 – Bond lengths (Å) of MM optimized squaramides using AM1-BCC charges and GAFF default parameters
Query Squaramide CSD
Refcode
Bond
c-c cc-cd c-cc c-cd c-o c-o cc-nh cd-nh
1 S01 EWOCAV 1.563 1.367 1.475 1.476 1.219 1.220 1.377 1.376
2 S02 MUYYIP 1.561 1.369 1.475 1.476 1.219 1.219 1.379 1.379
3 S03 NIZXOK 1.565 1.367 1.476 1.475 1.222 1.221 1.375 1.376
4 S04 NOLRIQ 1.564 1.365 1.475 1.474 1.220 1.220 1.370 1.375
5 S05 OMUKAJ 1.561 1.370 1.476 1.477 1.218 1.218 1.378 1.378
6 S06 OMUKEN 1.562 1.369 1.477 1.476 1.219 1.220 1.377 1.378
7 S07 XOPWEF 1.565 1.367 1.471 1.475 1.220 1.221 1.376 1.375
8 S08 QORQIY 1.563 1.372 1.472 1.471 1.222 1.222 1.378 1.379
9 S25 LANVOM 1.568 1.363 1.473 1.474 1.220 1.221 1.370 1.371
10 S31 AKOGAJ 1.585 1.339 1.470 1.470 1.220 1.220 1.364 1.362
11 S32 AKOGEN 1.579 1.345 1.470 1.469 1.220 1.220 1.364 1.366
12 S33 FATSUP 1.558 1.377 1.472 1.473 1.221 1.221 1.383 1.382
13 S34 GAHMEH 1.562 1.374 1.473 1.472 1.221 1.222 1.377 1.378
14 S35 NANQUO 1.561 1.375 1.473 1.474 1.221 1.220 1.379 1.379
15 S26 REPGIE 1.562 1.367 1.475 1.475 1.219 1.220 1.377 1.377
16 S27 RAKZAG 1.566 1.365 1.476 1.476 1.223 1.222 1.373 1.374
17 S29 WECCIS 1.564 1.372 1.470 1.472 1.220 1.220 1.376 1.376
18 S30 WECCAK 1.564 1.372 1.470 1.472 1.220 1.220 1.376 1.376
Average 1.565 1.366 1.474 1.220 1.375
Standard Deviation 0.006 0.009 0.002 0.001 0.005
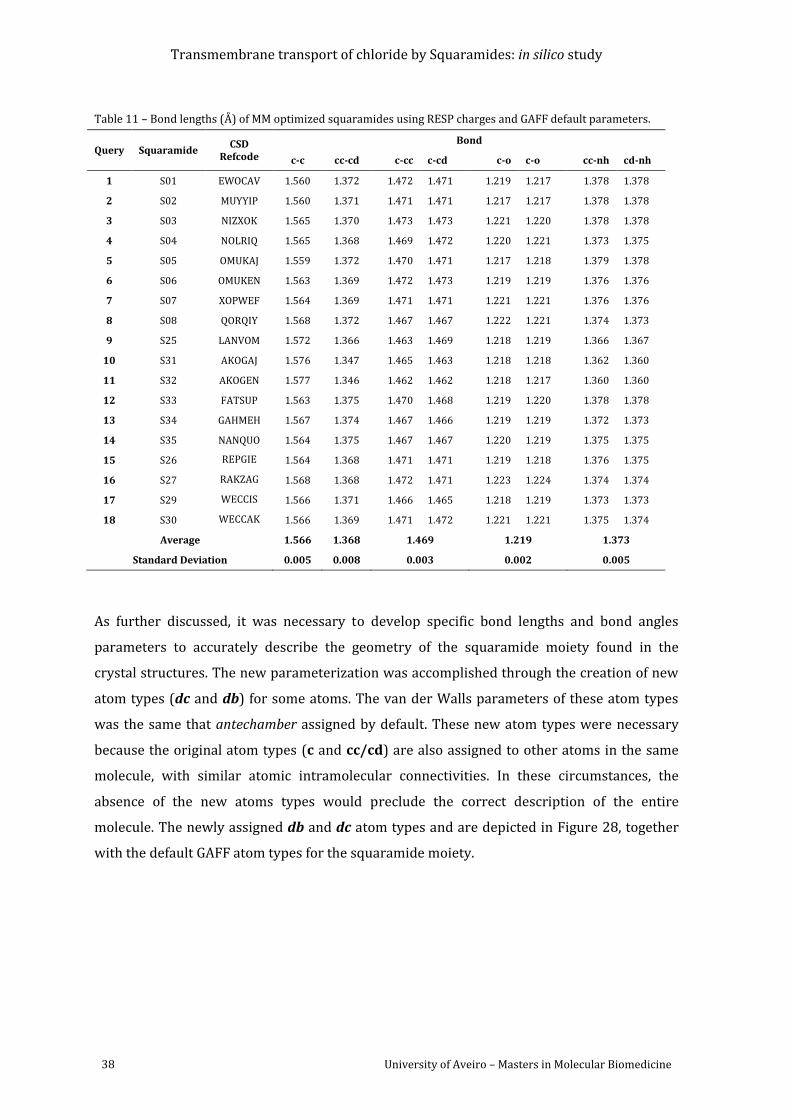
Transmembrane transport of chloride by Squaramides: in silico study
38 University of Aveiro – Masters in Molecular Biomedicine
Table 11 – Bond lengths (Å) of MM optimized squaramides using RESP charges and GAFF default parameters.
Query Squaramide CSD
Refcode
Bond
c-c cc-cd c-cc c-cd c-o c-o cc-nh cd-nh
1 S01 EWOCAV 1.560 1.372 1.472 1.471 1.219 1.217 1.378 1.378
2 S02 MUYYIP 1.560 1.371 1.471 1.471 1.217 1.217 1.378 1.378
3 S03 NIZXOK 1.565 1.370 1.473 1.473 1.221 1.220 1.378 1.378
4 S04 NOLRIQ 1.565 1.368 1.469 1.472 1.220 1.221 1.373 1.375
5 S05 OMUKAJ 1.559 1.372 1.470 1.471 1.217 1.218 1.379 1.378
6 S06 OMUKEN 1.563 1.369 1.472 1.473 1.219 1.219 1.376 1.376
7 S07 XOPWEF 1.564 1.369 1.471 1.471 1.221 1.221 1.376 1.376
8 S08 QORQIY 1.568 1.372 1.467 1.467 1.222 1.221 1.374 1.373
9 S25 LANVOM 1.572 1.366 1.463 1.469 1.218 1.219 1.366 1.367
10 S31 AKOGAJ 1.576 1.347 1.465 1.463 1.218 1.218 1.362 1.360
11 S32 AKOGEN 1.577 1.346 1.462 1.462 1.218 1.217 1.360 1.360
12 S33 FATSUP 1.563 1.375 1.470 1.468 1.219 1.220 1.378 1.378
13 S34 GAHMEH 1.567 1.374 1.467 1.466 1.219 1.219 1.372 1.373
14 S35 NANQUO 1.564 1.375 1.467 1.467 1.220 1.219 1.375 1.375
15 S26 REPGIE 1.564 1.368 1.471 1.471 1.219 1.218 1.376 1.375
16 S27 RAKZAG 1.568 1.368 1.472 1.471 1.223 1.224 1.374 1.374
17 S29 WECCIS 1.566 1.371 1.466 1.465 1.218 1.219 1.373 1.373
18 S30 WECCAK 1.566 1.369 1.471 1.472 1.221 1.221 1.375 1.374
Average 1.566 1.368 1.469 1.219 1.373
Standard Deviation 0.005 0.008 0.003 0.002 0.005
As further discussed, it was necessary to develop specific bond lengths and bond angles
parameters to accurately describe the geometry of the squaramide moiety found in the
crystal structures. The new parameterization was accomplished through the creation of new
atom types (dc and db) for some atoms. The van der Walls parameters of these atom types
was the same that antechamber assigned by default. These new atom types were necessary
because the original atom types (c and cc/cd) are also assigned to other atoms in the same
molecule, with similar atomic intramolecular connectivities. In these circumstances, the
absence of the new atoms types would preclude the correct description of the entire
molecule. The newly assigned db and dc atom types and are depicted in Figure 28, together
with the default GAFF atom types for the squaramide moiety.
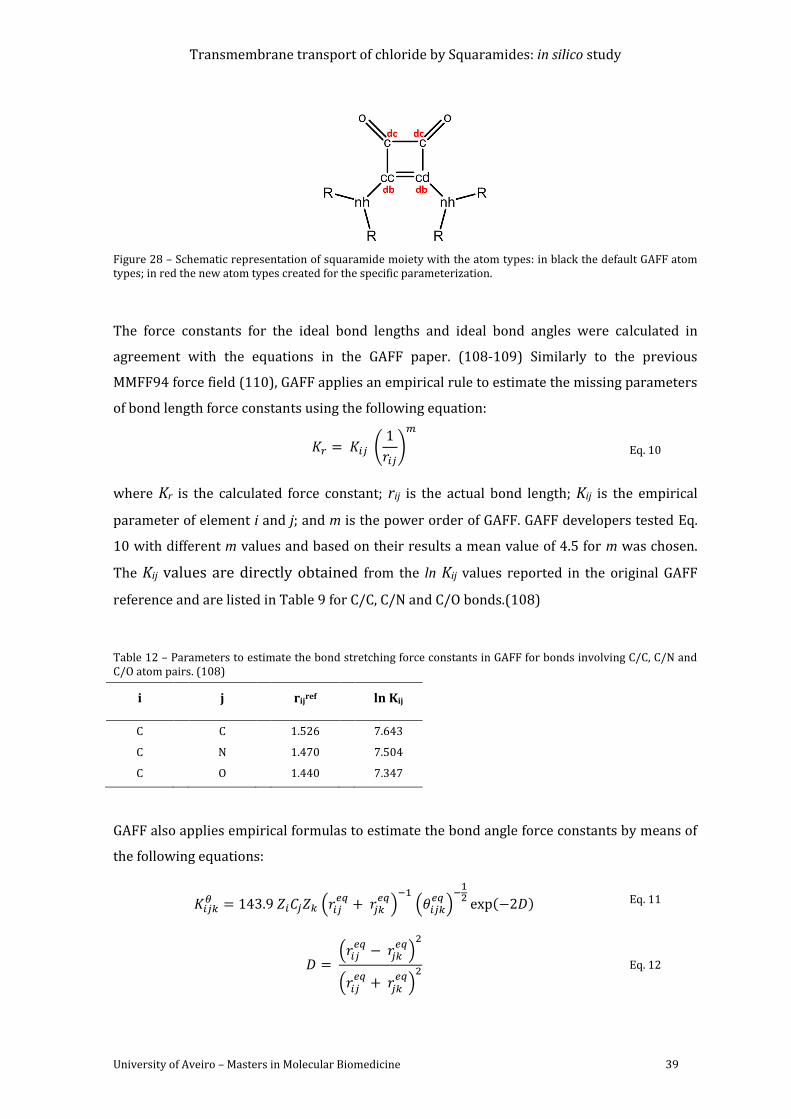
Transmembrane transport of chloride by Squaramides: in silico study
University of Aveiro – Masters in Molecular Biomedicine 39
Figure 28 – Schematic representation of squaramide moiety with the atom types: in black the default GAFF atom types; in red the new atom types created for the specific parameterization.
The force constants for the ideal bond lengths and ideal bond angles were calculated in
agreement with the equations in the GAFF paper. (108-109) Similarly to the previous
MMFF94 force field (110), GAFF applies an empirical rule to estimate the missing parameters
of bond length force constants using the following equation:
(
)
Eq. 10
where Kr is the calculated force constant; rij is the actual bond length; Kij is the empirical
parameter of element i and j; and m is the power order of GAFF. GAFF developers tested Eq.
10 with different m values and based on their results a mean value of 4.5 for m was chosen.
The Kij values are directly obtained from the ln Kij values reported in the original GAFF
reference and are listed in Table 9 for C/C, C/N and C/O bonds.(108)
Table 12 – Parameters to estimate the bond stretching force constants in GAFF for bonds involving C/C, C/N and C/O atom pairs. (108)
i j rijref ln Kij
C C 1.526 7.643
C N 1.470 7.504
C O 1.440 7.347
GAFF also applies empirical formulas to estimate the bond angle force constants by means of
the following equations:
(
)
(
)
( ) Eq. 11
(
)
(
) Eq. 12
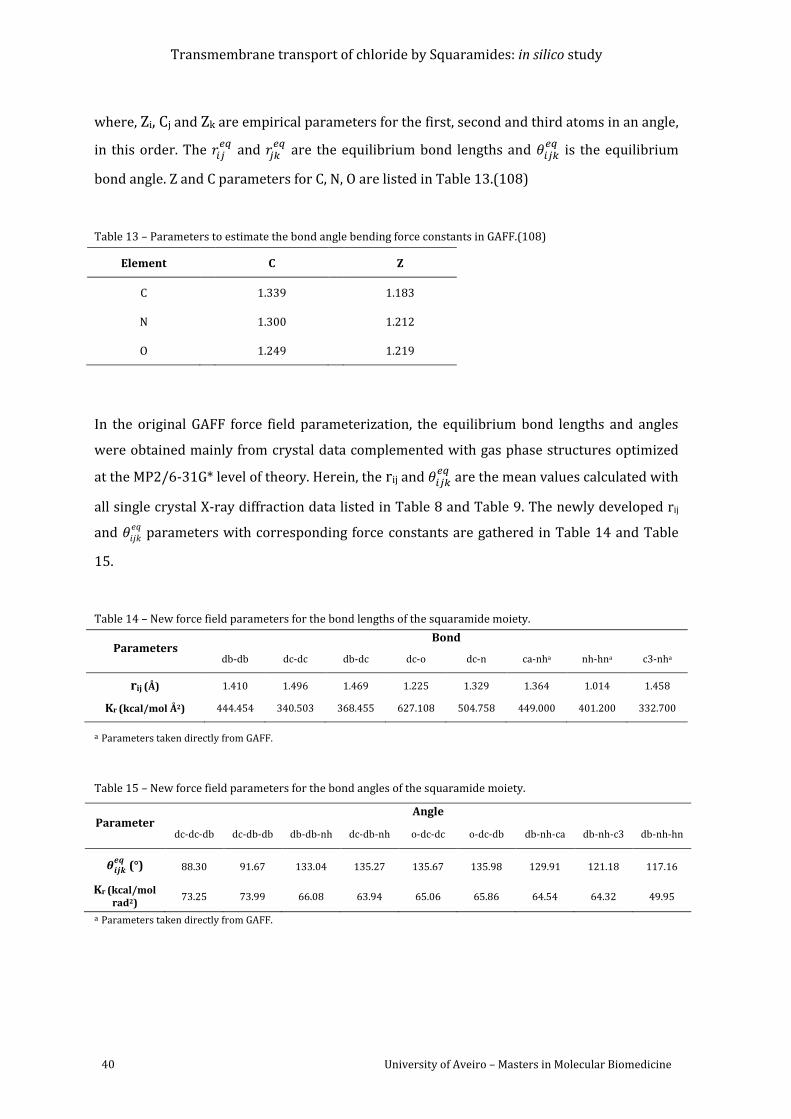
Transmembrane transport of chloride by Squaramides: in silico study
40 University of Aveiro – Masters in Molecular Biomedicine
where, Zi, Cj and Zk are empirical parameters for the first, second and third atoms in an angle,
in this order. The
and
are the equilibrium bond lengths and
is the equilibrium
bond angle. Z and C parameters for C, N, O are listed in Table 13.(108)
Table 13 – Parameters to estimate the bond angle bending force constants in GAFF.(108)
Element C Z
C 1.339 1.183
N 1.300 1.212
O 1.249 1.219
In the original GAFF force field parameterization, the equilibrium bond lengths and angles
were obtained mainly from crystal data complemented with gas phase structures optimized
at the MP2/6-31G* level of theory. Herein, the rij and
are the mean values calculated with
all single crystal X-ray diffraction data listed in Table 8 and Table 9. The newly developed rij
and
parameters with corresponding force constants are gathered in Table 14 and Table
15.
Table 14 – New force field parameters for the bond lengths of the squaramide moiety.
Parameters Bond
db-db dc-dc db-dc dc-o dc-n ca-nha nh-hna c3-nha
rij (Å) 1.410 1.496 1.469 1.225 1.329 1.364 1.014 1.458
Kr (kcal/mol Å2) 444.454 340.503 368.455 627.108 504.758 449.000 401.200 332.700
a Parameters taken directly from GAFF.
Table 15 – New force field parameters for the bond angles of the squaramide moiety.
Parameter Angle
dc-dc-db dc-db-db db-db-nh dc-db-nh o-dc-dc o-dc-db db-nh-ca db-nh-c3 db-nh-hn
(°) 88.30 91.67 133.04 135.27 135.67 135.98 129.91 121.18 117.16
Kr (kcal/mol rad2)
73.25 73.99 66.08 63.94 65.06 65.86 64.54 64.32 49.95
a Parameters taken directly from GAFF.
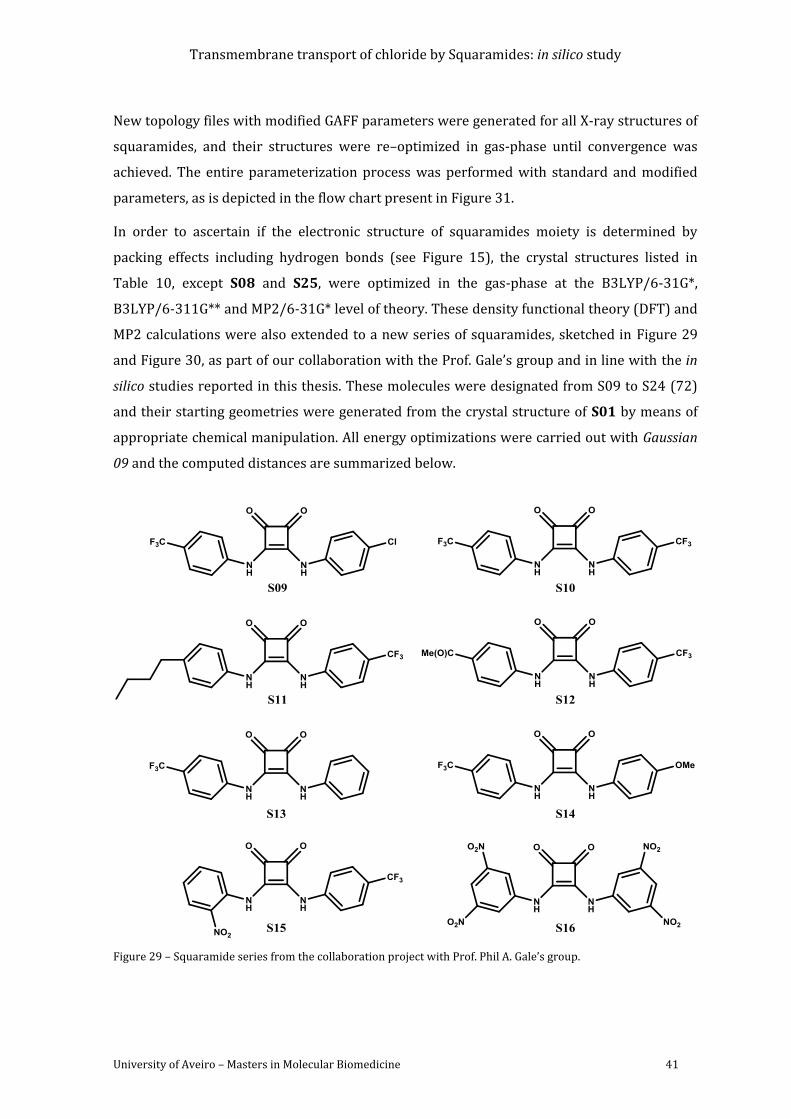
Transmembrane transport of chloride by Squaramides: in silico study
University of Aveiro – Masters in Molecular Biomedicine 41
New topology files with modified GAFF parameters were generated for all X-ray structures of
squaramides, and their structures were re–optimized in gas-phase until convergence was
achieved. The entire parameterization process was performed with standard and modified
parameters, as is depicted in the flow chart present in Figure 31.
In order to ascertain if the electronic structure of squaramides moiety is determined by
packing effects including hydrogen bonds (see Figure 15), the crystal structures listed in
Table 10, except S08 and S25, were optimized in the gas-phase at the B3LYP/6-31G*,
B3LYP/6-311G** and MP2/6-31G* level of theory. These density functional theory (DFT) and
MP2 calculations were also extended to a new series of squaramides, sketched in Figure 29
and Figure 30, as part of our collaboration with the Prof. Gale’s group and in line with the in
silico studies reported in this thesis. These molecules were designated from S09 to S24 (72)
and their starting geometries were generated from the crystal structure of S01 by means of
appropriate chemical manipulation. All energy optimizations were carried out with Gaussian
09 and the computed distances are summarized below.
Figure 29 – Squaramide series from the collaboration project with Prof. Phil A. Gale’s group.
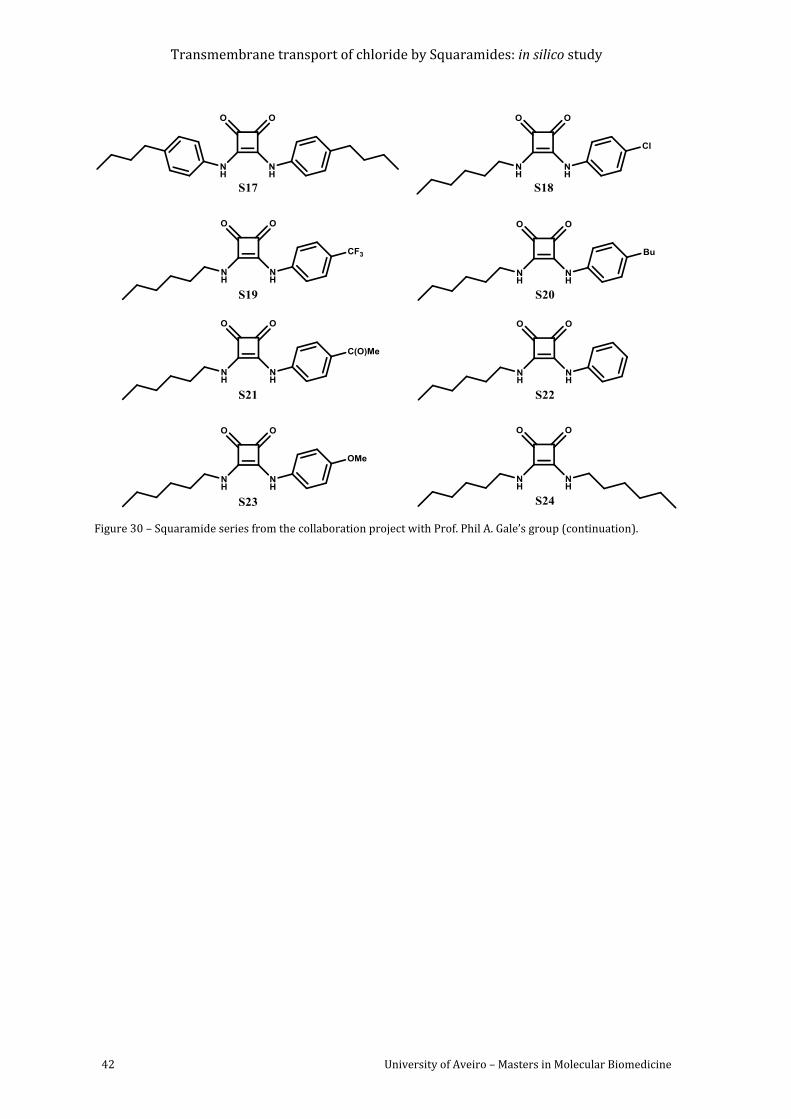
Transmembrane transport of chloride by Squaramides: in silico study
42 University of Aveiro – Masters in Molecular Biomedicine
Figure 30 – Squaramide series from the collaboration project with Prof. Phil A. Gale’s group (continuation).
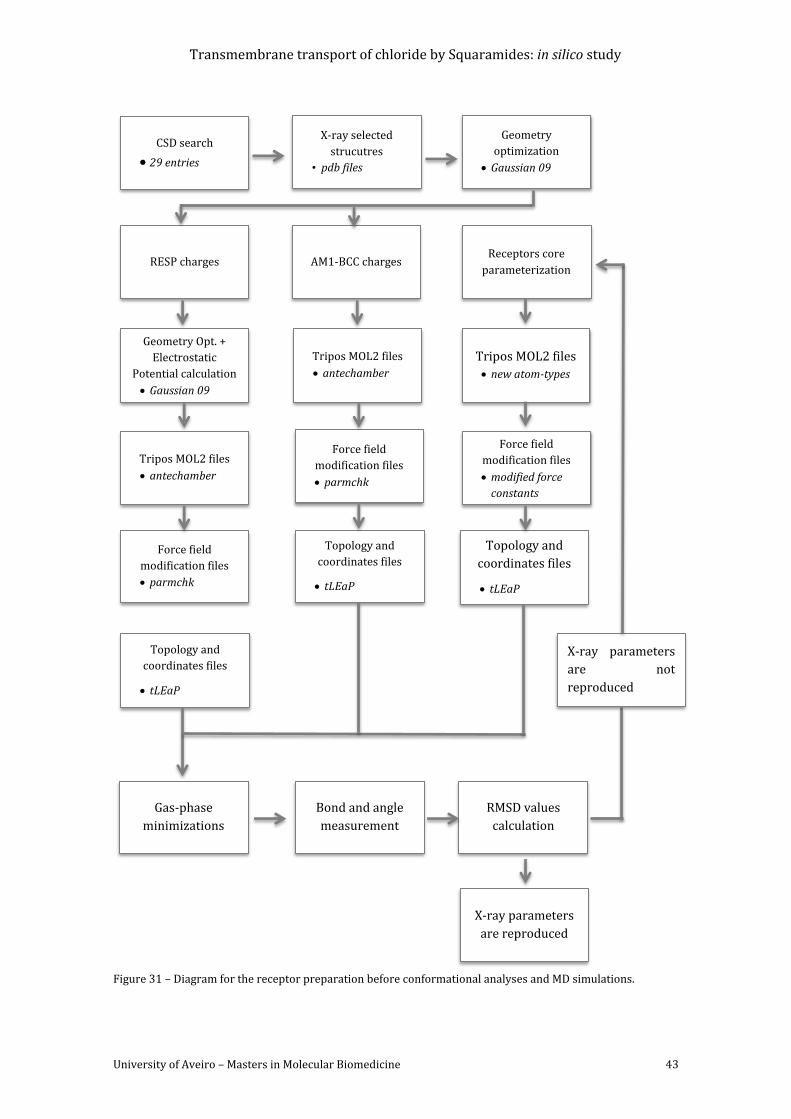
Transmembrane transport of chloride by Squaramides: in silico study
University of Aveiro – Masters in Molecular Biomedicine 43
Figure 31 – Diagram for the receptor preparation before conformational analyses and MD simulations.
CSD search
29 entries
X-ray selected
strucutres
• pdb files
RESP charges AM1-BCC charges
Tripos MOL2 files
antechamber
Geometry Opt. +
Electrostatic
Potential calculation
Gaussian 09
Force field
modification files
parmchk
Tripos MOL2 files
antechamber
Topology and
coordinates files
tLEaP
Force field
modification files
parmchk
Topology and
coordinates files
tLEaP
Geometry
optimization
Gaussian 09
Receptors core
parameterization
Tripos MOL2 files
new atom-types
Force field
modification files
modified force
constants
Topology and
coordinates files
tLEaP
Gas-phase
minimizations
Bond and angle
measurement
RMSD values
calculation
X-ray parameters
are not
reproduced
X-ray parameters
are reproduced
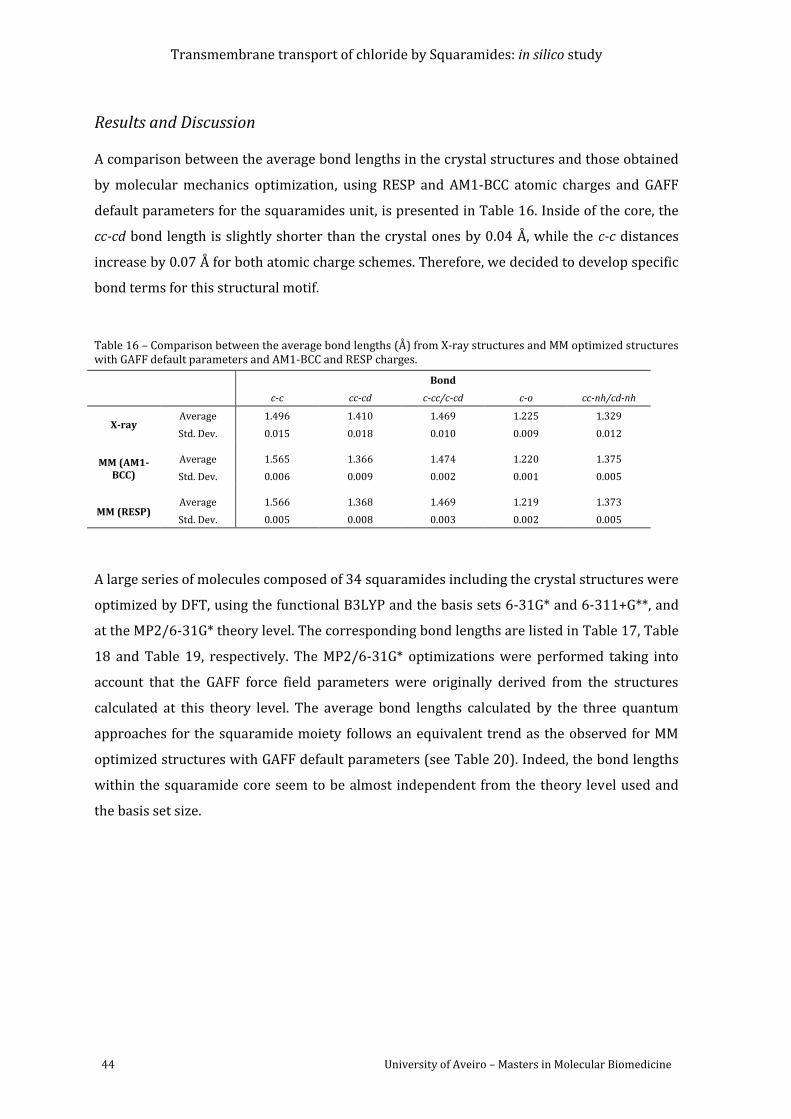
Transmembrane transport of chloride by Squaramides: in silico study
44 University of Aveiro – Masters in Molecular Biomedicine
Results and Discussion
A comparison between the average bond lengths in the crystal structures and those obtained
by molecular mechanics optimization, using RESP and AM1-BCC atomic charges and GAFF
default parameters for the squaramides unit, is presented in Table 16. Inside of the core, the
cc-cd bond length is slightly shorter than the crystal ones by 0.04 Å, while the c-c distances
increase by 0.07 Å for both atomic charge schemes. Therefore, we decided to develop specific
bond terms for this structural motif.
Table 16 – Comparison between the average bond lengths (Å) from X-ray structures and MM optimized structures with GAFF default parameters and AM1-BCC and RESP charges.
Bond
c-c cc-cd c-cc/c-cd c-o cc-nh/cd-nh
X-ray Average 1.496 1.410 1.469 1.225 1.329
Std. Dev. 0.015 0.018 0.010 0.009 0.012
MM (AM1-BCC)
Average 1.565 1.366 1.474 1.220 1.375
Std. Dev. 0.006 0.009 0.002 0.001 0.005
MM (RESP) Average 1.566 1.368 1.469 1.219 1.373
Std. Dev. 0.005 0.008 0.003 0.002 0.005
A large series of molecules composed of 34 squaramides including the crystal structures were
optimized by DFT, using the functional B3LYP and the basis sets 6-31G* and 6-311+G**, and
at the MP2/6-31G* theory level. The corresponding bond lengths are listed in Table 17, Table
18 and Table 19, respectively. The MP2/6-31G* optimizations were performed taking into
account that the GAFF force field parameters were originally derived from the structures
calculated at this theory level. The average bond lengths calculated by the three quantum
approaches for the squaramide moiety follows an equivalent trend as the observed for MM
optimized structures with GAFF default parameters (see Table 20). Indeed, the bond lengths
within the squaramide core seem to be almost independent from the theory level used and
the basis set size.
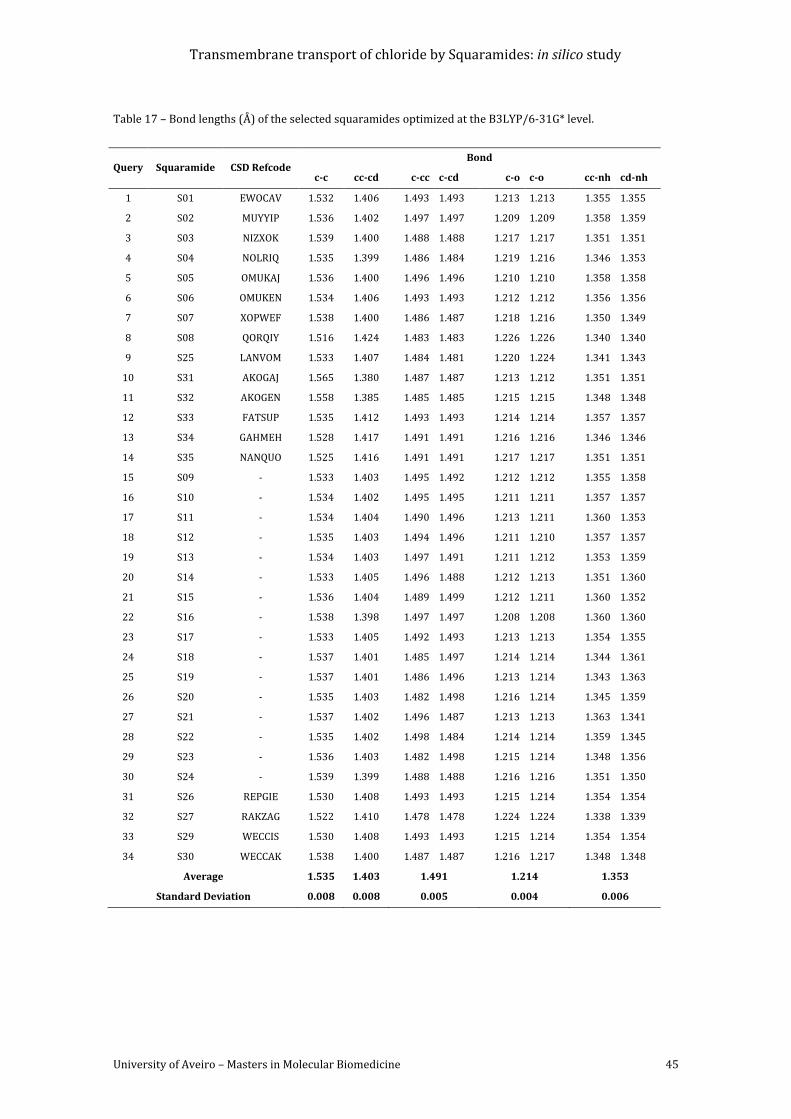
Transmembrane transport of chloride by Squaramides: in silico study
University of Aveiro – Masters in Molecular Biomedicine 45
Table 17 – Bond lengths (Å) of the selected squaramides optimized at the B3LYP/6-31G* level.
Query Squaramide CSD Refcode Bond
c-c cc-cd c-cc c-cd c-o c-o cc-nh cd-nh
1 S01 EWOCAV 1.532 1.406 1.493 1.493 1.213 1.213 1.355 1.355
2 S02 MUYYIP 1.536 1.402 1.497 1.497 1.209 1.209 1.358 1.359
3 S03 NIZXOK 1.539 1.400 1.488 1.488 1.217 1.217 1.351 1.351
4 S04 NOLRIQ 1.535 1.399 1.486 1.484 1.219 1.216 1.346 1.353
5 S05 OMUKAJ 1.536 1.400 1.496 1.496 1.210 1.210 1.358 1.358
6 S06 OMUKEN 1.534 1.406 1.493 1.493 1.212 1.212 1.356 1.356
7 S07 XOPWEF 1.538 1.400 1.486 1.487 1.218 1.216 1.350 1.349
8 S08 QORQIY 1.516 1.424 1.483 1.483 1.226 1.226 1.340 1.340
9 S25 LANVOM 1.533 1.407 1.484 1.481 1.220 1.224 1.341 1.343
10 S31 AKOGAJ 1.565 1.380 1.487 1.487 1.213 1.212 1.351 1.351
11 S32 AKOGEN 1.558 1.385 1.485 1.485 1.215 1.215 1.348 1.348
12 S33 FATSUP 1.535 1.412 1.493 1.493 1.214 1.214 1.357 1.357
13 S34 GAHMEH 1.528 1.417 1.491 1.491 1.216 1.216 1.346 1.346
14 S35 NANQUO 1.525 1.416 1.491 1.491 1.217 1.217 1.351 1.351
15 S09 - 1.533 1.403 1.495 1.492 1.212 1.212 1.355 1.358
16 S10 - 1.534 1.402 1.495 1.495 1.211 1.211 1.357 1.357
17 S11 - 1.534 1.404 1.490 1.496 1.213 1.211 1.360 1.353
18 S12 - 1.535 1.403 1.494 1.496 1.211 1.210 1.357 1.357
19 S13 - 1.534 1.403 1.497 1.491 1.211 1.212 1.353 1.359
20 S14 - 1.533 1.405 1.496 1.488 1.212 1.213 1.351 1.360
21 S15 - 1.536 1.404 1.489 1.499 1.212 1.211 1.360 1.352
22 S16 - 1.538 1.398 1.497 1.497 1.208 1.208 1.360 1.360
23 S17 - 1.533 1.405 1.492 1.493 1.213 1.213 1.354 1.355
24 S18 - 1.537 1.401 1.485 1.497 1.214 1.214 1.344 1.361
25 S19 - 1.537 1.401 1.486 1.496 1.213 1.214 1.343 1.363
26 S20 - 1.535 1.403 1.482 1.498 1.216 1.214 1.345 1.359
27 S21 - 1.537 1.402 1.496 1.487 1.213 1.213 1.363 1.341
28 S22 - 1.535 1.402 1.498 1.484 1.214 1.214 1.359 1.345
29 S23 - 1.536 1.403 1.482 1.498 1.215 1.214 1.348 1.356
30 S24 - 1.539 1.399 1.488 1.488 1.216 1.216 1.351 1.350
31 S26 REPGIE 1.530 1.408 1.493 1.493 1.215 1.214 1.354 1.354
32 S27 RAKZAG 1.522 1.410 1.478 1.478 1.224 1.224 1.338 1.339
33 S29 WECCIS 1.530 1.408 1.493 1.493 1.215 1.214 1.354 1.354
34 S30 WECCAK 1.538 1.400 1.487 1.487 1.216 1.217 1.348 1.348
Average 1.535 1.403 1.491 1.214 1.353
Standard Deviation 0.008 0.008 0.005 0.004 0.006
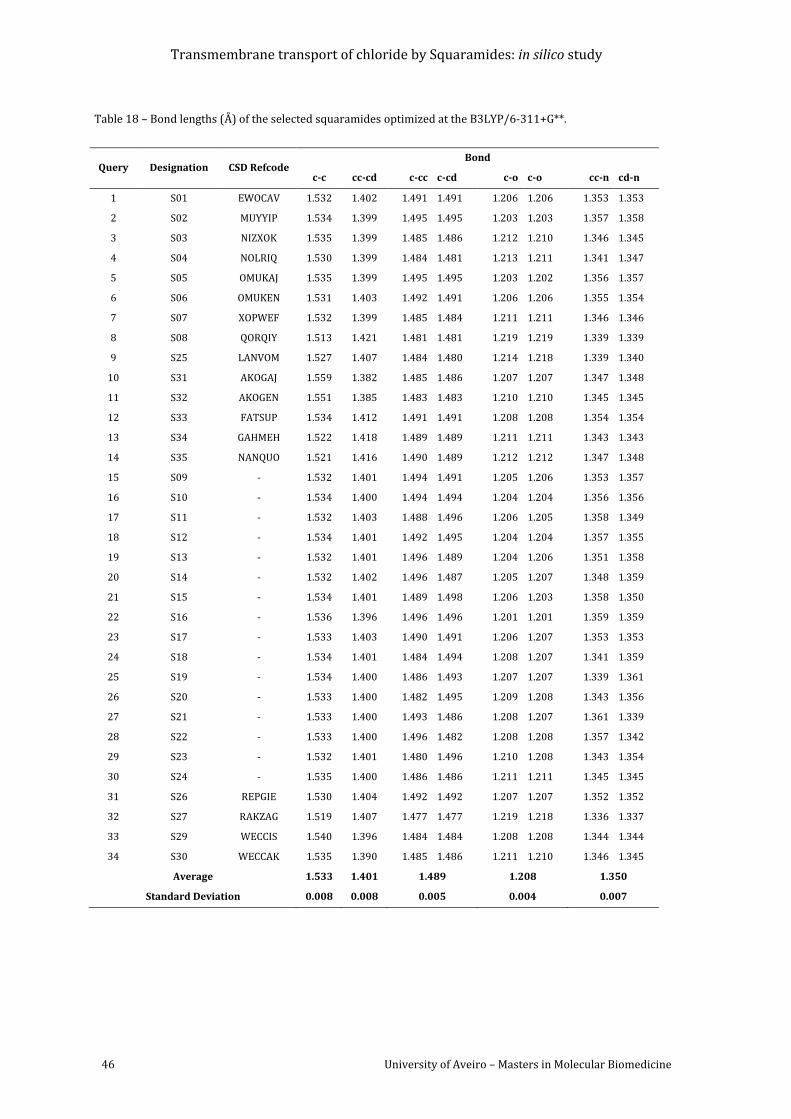
Transmembrane transport of chloride by Squaramides: in silico study
46 University of Aveiro – Masters in Molecular Biomedicine
Table 18 – Bond lengths (Å) of the selected squaramides optimized at the B3LYP/6-311+G**.
Query Designation CSD Refcode Bond
c-c cc-cd c-cc c-cd c-o c-o cc-n cd-n
1 S01 EWOCAV 1.532 1.402 1.491 1.491 1.206 1.206 1.353 1.353
2 S02 MUYYIP 1.534 1.399 1.495 1.495 1.203 1.203 1.357 1.358
3 S03 NIZXOK 1.535 1.399 1.485 1.486 1.212 1.210 1.346 1.345
4 S04 NOLRIQ 1.530 1.399 1.484 1.481 1.213 1.211 1.341 1.347
5 S05 OMUKAJ 1.535 1.399 1.495 1.495 1.203 1.202 1.356 1.357
6 S06 OMUKEN 1.531 1.403 1.492 1.491 1.206 1.206 1.355 1.354
7 S07 XOPWEF 1.532 1.399 1.485 1.484 1.211 1.211 1.346 1.346
8 S08 QORQIY 1.513 1.421 1.481 1.481 1.219 1.219 1.339 1.339
9 S25 LANVOM 1.527 1.407 1.484 1.480 1.214 1.218 1.339 1.340
10 S31 AKOGAJ 1.559 1.382 1.485 1.486 1.207 1.207 1.347 1.348
11 S32 AKOGEN 1.551 1.385 1.483 1.483 1.210 1.210 1.345 1.345
12 S33 FATSUP 1.534 1.412 1.491 1.491 1.208 1.208 1.354 1.354
13 S34 GAHMEH 1.522 1.418 1.489 1.489 1.211 1.211 1.343 1.343
14 S35 NANQUO 1.521 1.416 1.490 1.489 1.212 1.212 1.347 1.348
15 S09 - 1.532 1.401 1.494 1.491 1.205 1.206 1.353 1.357
16 S10 - 1.534 1.400 1.494 1.494 1.204 1.204 1.356 1.356
17 S11 - 1.532 1.403 1.488 1.496 1.206 1.205 1.358 1.349
18 S12 - 1.534 1.401 1.492 1.495 1.204 1.204 1.357 1.355
19 S13 - 1.532 1.401 1.496 1.489 1.204 1.206 1.351 1.358
20 S14 - 1.532 1.402 1.496 1.487 1.205 1.207 1.348 1.359
21 S15 - 1.534 1.401 1.489 1.498 1.206 1.203 1.358 1.350
22 S16 - 1.536 1.396 1.496 1.496 1.201 1.201 1.359 1.359
23 S17 - 1.533 1.403 1.490 1.491 1.206 1.207 1.353 1.353
24 S18 - 1.534 1.401 1.484 1.494 1.208 1.207 1.341 1.359
25 S19 - 1.534 1.400 1.486 1.493 1.207 1.207 1.339 1.361
26 S20 - 1.533 1.400 1.482 1.495 1.209 1.208 1.343 1.356
27 S21 - 1.533 1.400 1.493 1.486 1.208 1.207 1.361 1.339
28 S22 - 1.533 1.400 1.496 1.482 1.208 1.208 1.357 1.342
29 S23 - 1.532 1.401 1.480 1.496 1.210 1.208 1.343 1.354
30 S24 - 1.535 1.400 1.486 1.486 1.211 1.211 1.345 1.345
31 S26 REPGIE 1.530 1.404 1.492 1.492 1.207 1.207 1.352 1.352
32 S27 RAKZAG 1.519 1.407 1.477 1.477 1.219 1.218 1.336 1.337
33 S29 WECCIS 1.540 1.396 1.484 1.484 1.208 1.208 1.344 1.344
34 S30 WECCAK 1.535 1.390 1.485 1.486 1.211 1.210 1.346 1.345
Average 1.533 1.401 1.489 1.208 1.350
Standard Deviation 0.008 0.008 0.005 0.004 0.007
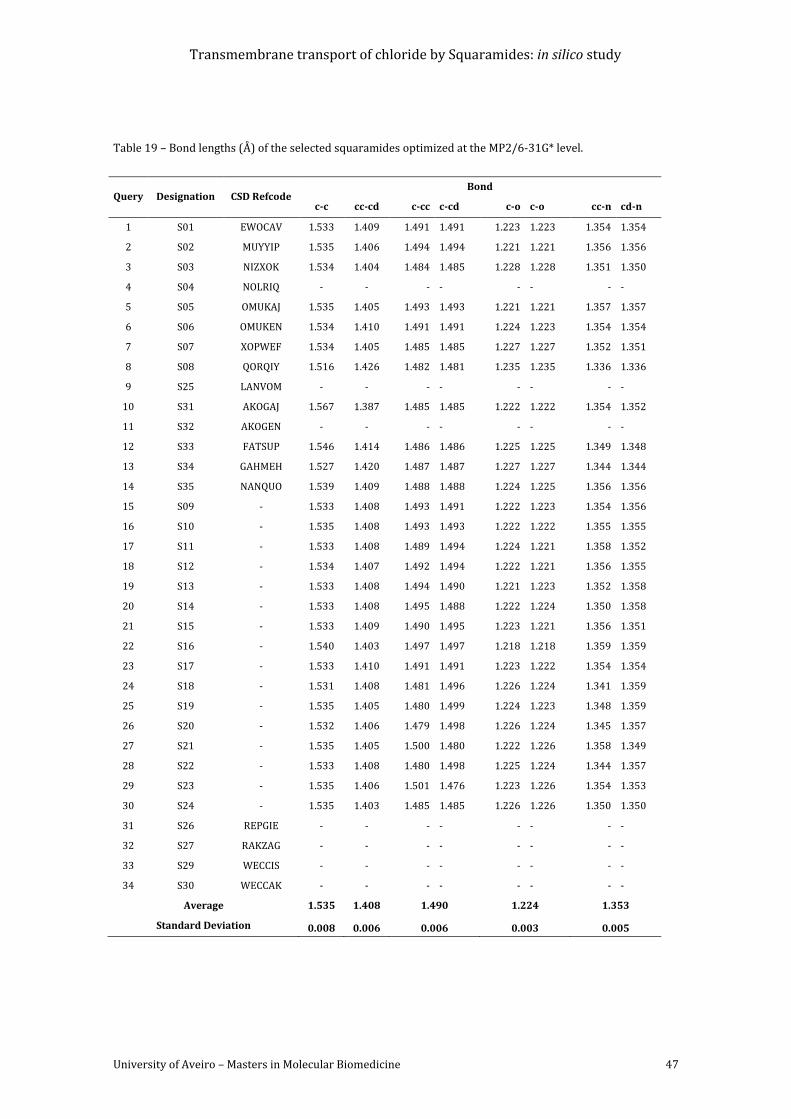
Transmembrane transport of chloride by Squaramides: in silico study
University of Aveiro – Masters in Molecular Biomedicine 47
Table 19 – Bond lengths (Å) of the selected squaramides optimized at the MP2/6-31G* level.
Query Designation CSD Refcode Bond
c-c cc-cd c-cc c-cd c-o c-o cc-n cd-n
1 S01 EWOCAV 1.533 1.409 1.491 1.491 1.223 1.223 1.354 1.354
2 S02 MUYYIP 1.535 1.406 1.494 1.494 1.221 1.221 1.356 1.356
3 S03 NIZXOK 1.534 1.404 1.484 1.485 1.228 1.228 1.351 1.350
4 S04 NOLRIQ - - - - - - - -
5 S05 OMUKAJ 1.535 1.405 1.493 1.493 1.221 1.221 1.357 1.357
6 S06 OMUKEN 1.534 1.410 1.491 1.491 1.224 1.223 1.354 1.354
7 S07 XOPWEF 1.534 1.405 1.485 1.485 1.227 1.227 1.352 1.351
8 S08 QORQIY 1.516 1.426 1.482 1.481 1.235 1.235 1.336 1.336
9 S25 LANVOM - - - - - - - -
10 S31 AKOGAJ 1.567 1.387 1.485 1.485 1.222 1.222 1.354 1.352
11 S32 AKOGEN - - - - - - - -
12 S33 FATSUP 1.546 1.414 1.486 1.486 1.225 1.225 1.349 1.348
13 S34 GAHMEH 1.527 1.420 1.487 1.487 1.227 1.227 1.344 1.344
14 S35 NANQUO 1.539 1.409 1.488 1.488 1.224 1.225 1.356 1.356
15 S09 - 1.533 1.408 1.493 1.491 1.222 1.223 1.354 1.356
16 S10 - 1.535 1.408 1.493 1.493 1.222 1.222 1.355 1.355
17 S11 - 1.533 1.408 1.489 1.494 1.224 1.221 1.358 1.352
18 S12 - 1.534 1.407 1.492 1.494 1.222 1.221 1.356 1.355
19 S13 - 1.533 1.408 1.494 1.490 1.221 1.223 1.352 1.358
20 S14 - 1.533 1.408 1.495 1.488 1.222 1.224 1.350 1.358
21 S15 - 1.533 1.409 1.490 1.495 1.223 1.221 1.356 1.351
22 S16 - 1.540 1.403 1.497 1.497 1.218 1.218 1.359 1.359
23 S17 - 1.533 1.410 1.491 1.491 1.223 1.222 1.354 1.354
24 S18 - 1.531 1.408 1.481 1.496 1.226 1.224 1.341 1.359
25 S19 - 1.535 1.405 1.480 1.499 1.224 1.223 1.348 1.359
26 S20 - 1.532 1.406 1.479 1.498 1.226 1.224 1.345 1.357
27 S21 - 1.535 1.405 1.500 1.480 1.222 1.226 1.358 1.349
28 S22 - 1.533 1.408 1.480 1.498 1.225 1.224 1.344 1.357
29 S23 - 1.535 1.406 1.501 1.476 1.223 1.226 1.354 1.353
30 S24 - 1.535 1.403 1.485 1.485 1.226 1.226 1.350 1.350
31 S26 REPGIE - - - - - - - -
32 S27 RAKZAG - - - - - - - -
33 S29 WECCIS - - - - - - - -
34 S30 WECCAK - - - - - - - -
Average 1.535 1.408 1.490 1.224 1.353
Standard Deviation 0.008 0.006 0.006 0.003 0.005
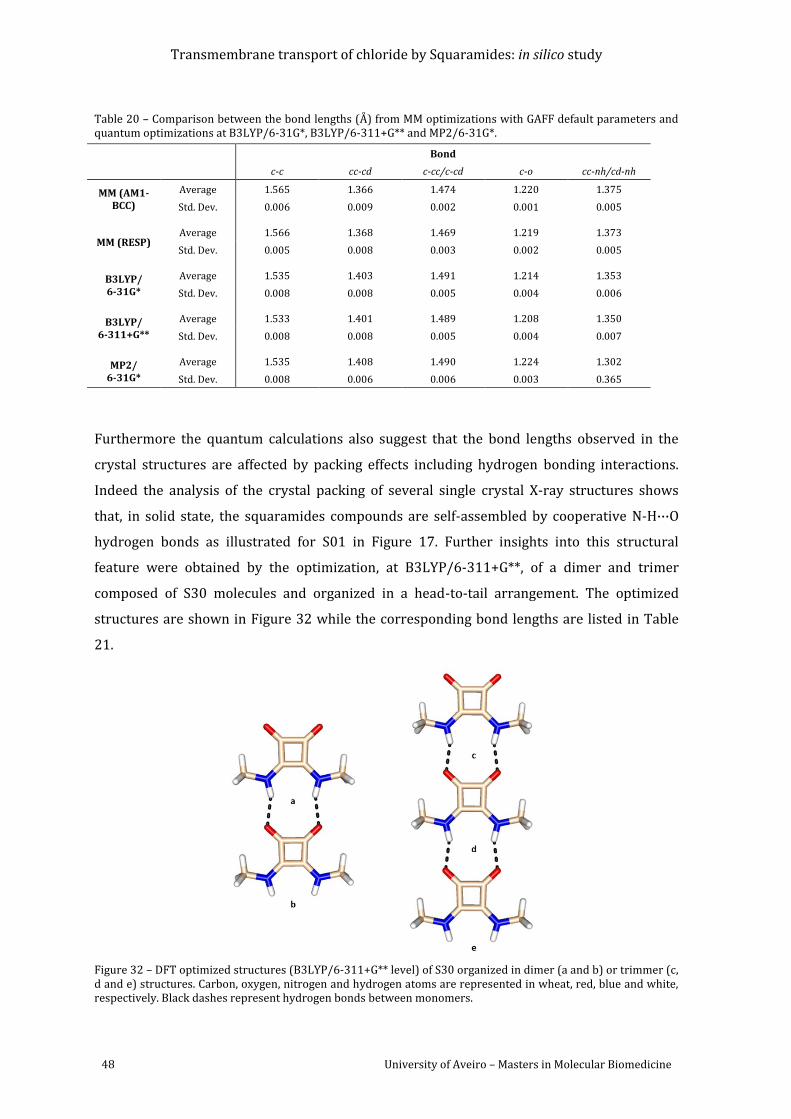
Transmembrane transport of chloride by Squaramides: in silico study
48 University of Aveiro – Masters in Molecular Biomedicine
Table 20 – Comparison between the bond lengths (Å) from MM optimizations with GAFF default parameters and quantum optimizations at B3LYP/6-31G*, B3LYP/6-311+G** and MP2/6-31G*.
Bond
c-c cc-cd c-cc/c-cd c-o cc-nh/cd-nh
MM (AM1-BCC)
Average 1.565 1.366 1.474 1.220 1.375
Std. Dev. 0.006 0.009 0.002 0.001 0.005
MM (RESP) Average 1.566 1.368 1.469 1.219 1.373
Std. Dev. 0.005 0.008 0.003 0.002 0.005
B3LYP/ 6-31G*
Average 1.535 1.403 1.491 1.214 1.353
Std. Dev. 0.008 0.008 0.005 0.004 0.006
B3LYP/ 6-311+G**
Average 1.533 1.401 1.489 1.208 1.350
Std. Dev. 0.008 0.008 0.005 0.004 0.007
MP2/ 6-31G*
Average 1.535 1.408 1.490 1.224 1.302
Std. Dev. 0.008 0.006 0.006 0.003 0.365
Furthermore the quantum calculations also suggest that the bond lengths observed in the
crystal structures are affected by packing effects including hydrogen bonding interactions.
Indeed the analysis of the crystal packing of several single crystal X-ray structures shows
that, in solid state, the squaramides compounds are self-assembled by cooperative N-H···O
hydrogen bonds as illustrated for S01 in Figure 17. Further insights into this structural
feature were obtained by the optimization, at B3LYP/6-311+G**, of a dimer and trimer
composed of S30 molecules and organized in a head-to-tail arrangement. The optimized
structures are shown in Figure 32 while the corresponding bond lengths are listed in Table
21.
Figure 32 – DFT optimized structures (B3LYP/6-311+G** level) of S30 organized in dimer (a and b) or trimmer (c, d and e) structures. Carbon, oxygen, nitrogen and hydrogen atoms are represented in wheat, red, blue and white, respectively. Black dashes represent hydrogen bonds between monomers.
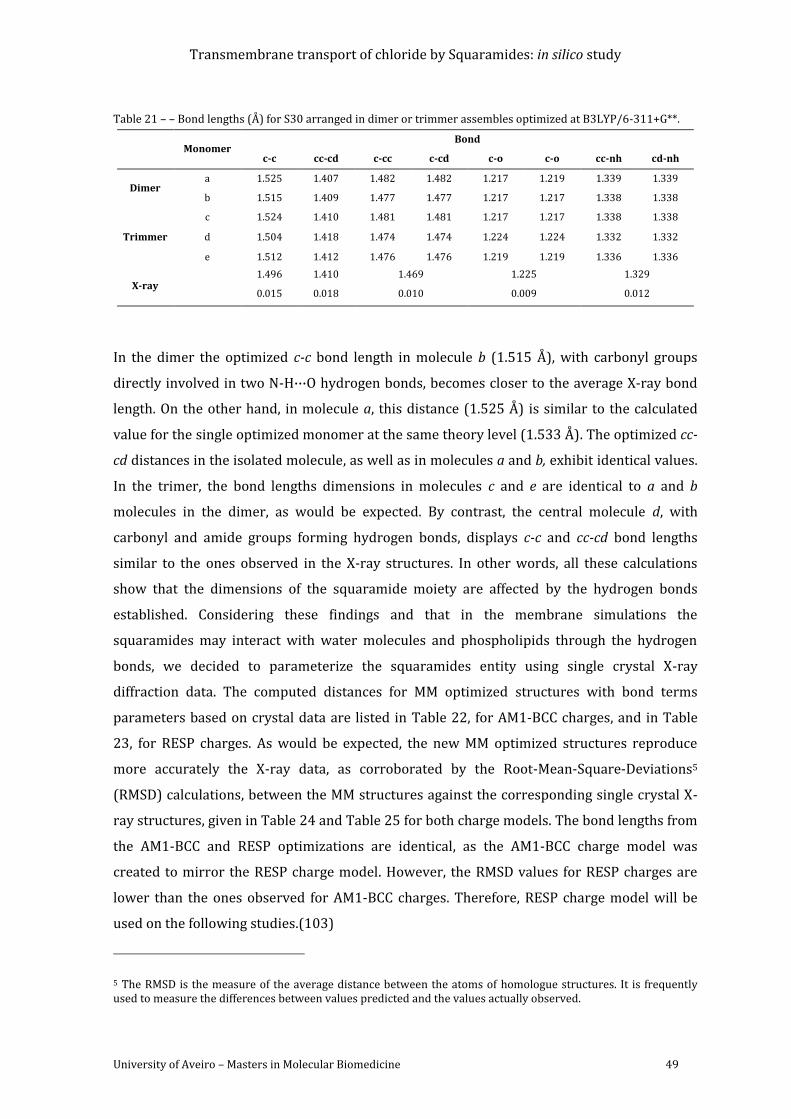
Transmembrane transport of chloride by Squaramides: in silico study
University of Aveiro – Masters in Molecular Biomedicine 49
Table 21 – – Bond lengths (Å) for S30 arranged in dimer or trimmer assembles optimized at B3LYP/6-311+G**.
Monomer Bond
c-c cc-cd c-cc c-cd c-o c-o cc-nh cd-nh
Dimer a 1.525 1.407 1.482 1.482 1.217 1.219 1.339 1.339
b 1.515 1.409 1.477 1.477 1.217 1.217 1.338 1.338
Trimmer
c 1.524 1.410 1.481 1.481 1.217 1.217 1.338 1.338
d 1.504 1.418 1.474 1.474 1.224 1.224 1.332 1.332
e 1.512 1.412 1.476 1.476 1.219 1.219 1.336 1.336
X-ray 1.496 1.410 1.469 1.225 1.329
0.015 0.018 0.010 0.009 0.012
In the dimer the optimized c-c bond length in molecule b (1.515 Å), with carbonyl groups
directly involved in two N-H···O hydrogen bonds, becomes closer to the average X-ray bond
length. On the other hand, in molecule a, this distance (1.525 Å) is similar to the calculated
value for the single optimized monomer at the same theory level (1.533 Å). The optimized cc-
cd distances in the isolated molecule, as well as in molecules a and b, exhibit identical values.
In the trimer, the bond lengths dimensions in molecules c and e are identical to a and b
molecules in the dimer, as would be expected. By contrast, the central molecule d, with
carbonyl and amide groups forming hydrogen bonds, displays c-c and cc-cd bond lengths
similar to the ones observed in the X-ray structures. In other words, all these calculations
show that the dimensions of the squaramide moiety are affected by the hydrogen bonds
established. Considering these findings and that in the membrane simulations the
squaramides may interact with water molecules and phospholipids through the hydrogen
bonds, we decided to parameterize the squaramides entity using single crystal X-ray
diffraction data. The computed distances for MM optimized structures with bond terms
parameters based on crystal data are listed in Table 22, for AM1-BCC charges, and in Table
23, for RESP charges. As would be expected, the new MM optimized structures reproduce
more accurately the X-ray data, as corroborated by the Root-Mean-Square-Deviations5
(RMSD) calculations, between the MM structures against the corresponding single crystal X-
ray structures, given in Table 24 and Table 25 for both charge models. The bond lengths from
the AM1-BCC and RESP optimizations are identical, as the AM1-BCC charge model was
created to mirror the RESP charge model. However, the RMSD values for RESP charges are
lower than the ones observed for AM1-BCC charges. Therefore, RESP charge model will be
used on the following studies.(103)
5 The RMSD is the measure of the average distance between the atoms of homologue structures. It is frequently used to measure the differences between values predicted and the values actually observed.
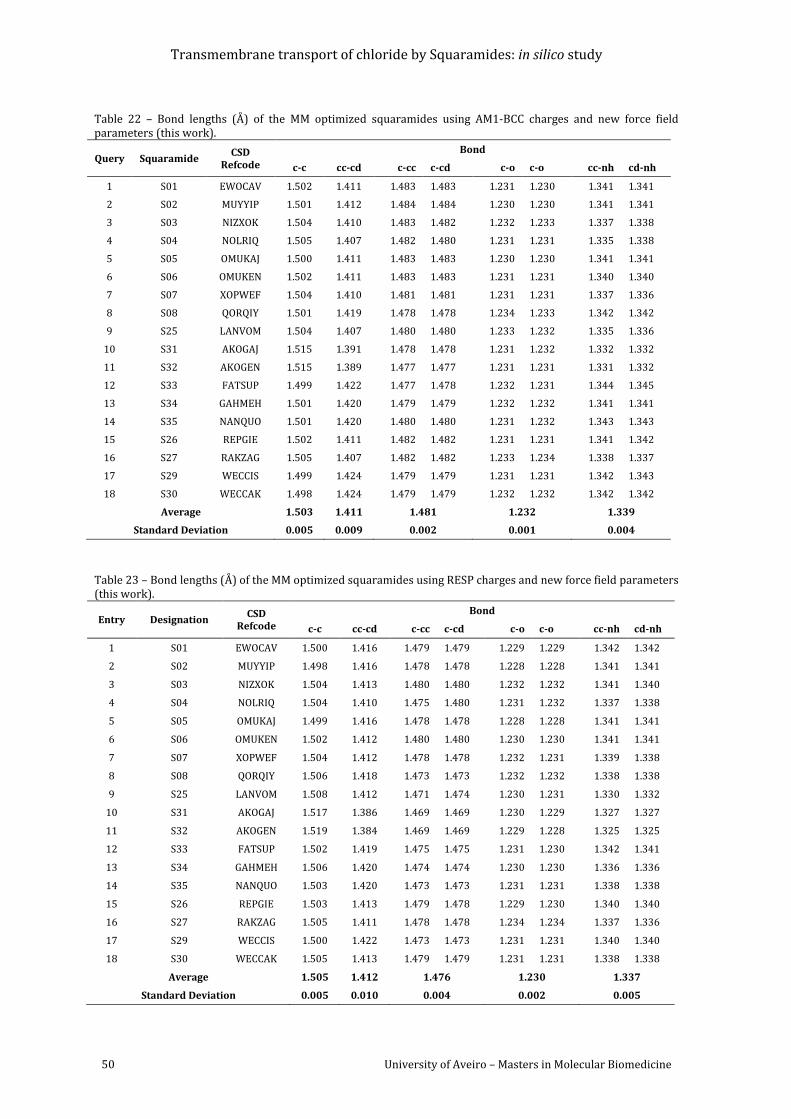
Transmembrane transport of chloride by Squaramides: in silico study
50 University of Aveiro – Masters in Molecular Biomedicine
Table 22 – Bond lengths (Å) of the MM optimized squaramides using AM1-BCC charges and new force field parameters (this work).
Query Squaramide CSD
Refcode
Bond
c-c cc-cd c-cc c-cd c-o c-o cc-nh cd-nh
1 S01 EWOCAV 1.502 1.411 1.483 1.483 1.231 1.230 1.341 1.341
2 S02 MUYYIP 1.501 1.412 1.484 1.484 1.230 1.230 1.341 1.341
3 S03 NIZXOK 1.504 1.410 1.483 1.482 1.232 1.233 1.337 1.338
4 S04 NOLRIQ 1.505 1.407 1.482 1.480 1.231 1.231 1.335 1.338
5 S05 OMUKAJ 1.500 1.411 1.483 1.483 1.230 1.230 1.341 1.341
6 S06 OMUKEN 1.502 1.411 1.483 1.483 1.231 1.231 1.340 1.340
7 S07 XOPWEF 1.504 1.410 1.481 1.481 1.231 1.231 1.337 1.336
8 S08 QORQIY 1.501 1.419 1.478 1.478 1.234 1.233 1.342 1.342
9 S25 LANVOM 1.504 1.407 1.480 1.480 1.233 1.232 1.335 1.336
10 S31 AKOGAJ 1.515 1.391 1.478 1.478 1.231 1.232 1.332 1.332
11 S32 AKOGEN 1.515 1.389 1.477 1.477 1.231 1.231 1.331 1.332
12 S33 FATSUP 1.499 1.422 1.477 1.478 1.232 1.231 1.344 1.345
13 S34 GAHMEH 1.501 1.420 1.479 1.479 1.232 1.232 1.341 1.341
14 S35 NANQUO 1.501 1.420 1.480 1.480 1.231 1.232 1.343 1.343
15 S26 REPGIE 1.502 1.411 1.482 1.482 1.231 1.231 1.341 1.342
16 S27 RAKZAG 1.505 1.407 1.482 1.482 1.233 1.234 1.338 1.337
17 S29 WECCIS 1.499 1.424 1.479 1.479 1.231 1.231 1.342 1.343
18 S30 WECCAK 1.498 1.424 1.479 1.479 1.232 1.232 1.342 1.342
Average 1.503 1.411 1.481 1.232 1.339
Standard Deviation 0.005 0.009 0.002 0.001 0.004
Table 23 – Bond lengths (Å) of the MM optimized squaramides using RESP charges and new force field parameters (this work).
Entry Designation CSD
Refcode
Bond
c-c cc-cd c-cc c-cd c-o c-o cc-nh cd-nh
1 S01 EWOCAV 1.500 1.416 1.479 1.479 1.229 1.229 1.342 1.342
2 S02 MUYYIP 1.498 1.416 1.478 1.478 1.228 1.228 1.341 1.341
3 S03 NIZXOK 1.504 1.413 1.480 1.480 1.232 1.232 1.341 1.340
4 S04 NOLRIQ 1.504 1.410 1.475 1.480 1.231 1.232 1.337 1.338
5 S05 OMUKAJ 1.499 1.416 1.478 1.478 1.228 1.228 1.341 1.341
6 S06 OMUKEN 1.502 1.412 1.480 1.480 1.230 1.230 1.341 1.341
7 S07 XOPWEF 1.504 1.412 1.478 1.478 1.232 1.231 1.339 1.338
8 S08 QORQIY 1.506 1.418 1.473 1.473 1.232 1.232 1.338 1.338
9 S25 LANVOM 1.508 1.412 1.471 1.474 1.230 1.231 1.330 1.332
10 S31 AKOGAJ 1.517 1.386 1.469 1.469 1.230 1.229 1.327 1.327
11 S32 AKOGEN 1.519 1.384 1.469 1.469 1.229 1.228 1.325 1.325
12 S33 FATSUP 1.502 1.419 1.475 1.475 1.231 1.230 1.342 1.341
13 S34 GAHMEH 1.506 1.420 1.474 1.474 1.230 1.230 1.336 1.336
14 S35 NANQUO 1.503 1.420 1.473 1.473 1.231 1.231 1.338 1.338
15 S26 REPGIE 1.503 1.413 1.479 1.478 1.229 1.230 1.340 1.340
16 S27 RAKZAG 1.505 1.411 1.478 1.478 1.234 1.234 1.337 1.336
17 S29 WECCIS 1.500 1.422 1.473 1.473 1.231 1.231 1.340 1.340
18 S30 WECCAK 1.505 1.413 1.479 1.479 1.231 1.231 1.338 1.338
Average 1.505 1.412 1.476 1.230 1.337
Standard Deviation 0.005 0.010 0.004 0.002 0.005
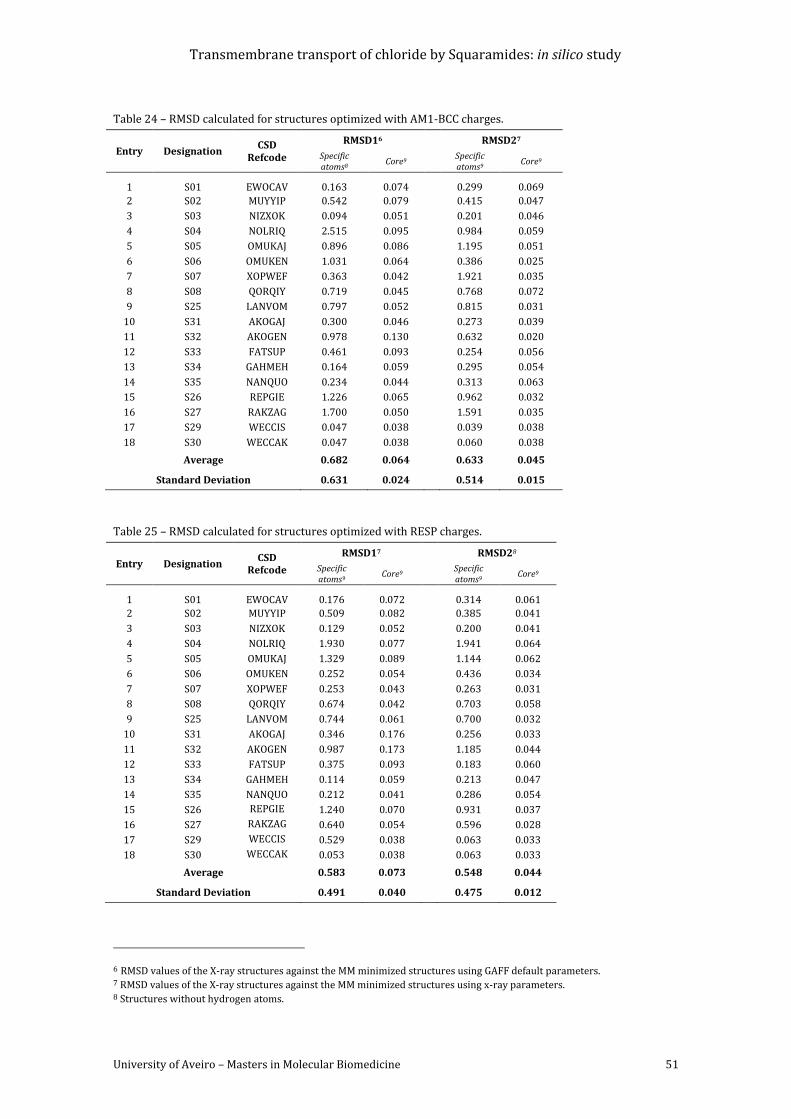
Transmembrane transport of chloride by Squaramides: in silico study
University of Aveiro – Masters in Molecular Biomedicine 51
Table 24 – RMSD calculated for structures optimized with AM1-BCC charges.
Entry Designation CSD
Refcode
RMSD16
RMSD27
Specific atoms8
Core9
Specific atoms9
Core9
1 S01 EWOCAV 0.163 0.074
0.299 0.069
2 S02 MUYYIP 0.542 0.079
0.415 0.047
3 S03 NIZXOK 0.094 0.051
0.201 0.046
4 S04 NOLRIQ 2.515 0.095
0.984 0.059
5 S05 OMUKAJ 0.896 0.086
1.195 0.051
6 S06 OMUKEN 1.031 0.064
0.386 0.025
7 S07 XOPWEF 0.363 0.042
1.921 0.035
8 S08 QORQIY 0.719 0.045
0.768 0.072
9 S25 LANVOM 0.797 0.052
0.815 0.031
10 S31 AKOGAJ 0.300 0.046
0.273 0.039
11 S32 AKOGEN 0.978 0.130
0.632 0.020
12 S33 FATSUP 0.461 0.093
0.254 0.056
13 S34 GAHMEH 0.164 0.059
0.295 0.054
14 S35 NANQUO 0.234 0.044
0.313 0.063
15 S26 REPGIE 1.226 0.065
0.962 0.032
16 S27 RAKZAG 1.700 0.050
1.591 0.035
17 S29 WECCIS 0.047 0.038
0.039 0.038
18 S30 WECCAK 0.047 0.038
0.060 0.038
Average 0.682 0.064
0.633 0.045
Standard Deviation 0.631 0.024
0.514 0.015
Table 25 – RMSD calculated for structures optimized with RESP charges.
Entry Designation CSD
Refcode
RMSD17
RMSD28
Specific atoms9
Core9
Specific atoms9
Core9
1 S01 EWOCAV 0.176 0.072
0.314 0.061
2 S02 MUYYIP 0.509 0.082
0.385 0.041
3 S03 NIZXOK 0.129 0.052
0.200 0.041
4 S04 NOLRIQ 1.930 0.077
1.941 0.064
5 S05 OMUKAJ 1.329 0.089
1.144 0.062
6 S06 OMUKEN 0.252 0.054
0.436 0.034
7 S07 XOPWEF 0.253 0.043
0.263 0.031
8 S08 QORQIY 0.674 0.042
0.703 0.058
9 S25 LANVOM 0.744 0.061
0.700 0.032
10 S31 AKOGAJ 0.346 0.176
0.256 0.033
11 S32 AKOGEN 0.987 0.173
1.185 0.044
12 S33 FATSUP 0.375 0.093
0.183 0.060
13 S34 GAHMEH 0.114 0.059
0.213 0.047
14 S35 NANQUO 0.212 0.041
0.286 0.054
15 S26 REPGIE 1.240 0.070
0.931 0.037
16 S27 RAKZAG 0.640 0.054
0.596 0.028
17 S29 WECCIS 0.529 0.038
0.063 0.033
18 S30 WECCAK 0.053 0.038
0.063 0.033
Average 0.583 0.073
0.548 0.044
Standard Deviation 0.491 0.040
0.475 0.012
6 RMSD values of the X-ray structures against the MM minimized structures using GAFF default parameters. 7 RMSD values of the X-ray structures against the MM minimized structures using x-ray parameters. 8 Structures without hydrogen atoms.
Transmembrane transport of chloride by Squaramides: in silico study
52 University of Aveiro – Masters in Molecular Biomedicine
2.2. Conformational analyses
Conformational analysis of the free receptors 2.2.1.
The theoretical studies performed in a POPC bilayer with squaramides S01, S09, S10, S19 and
S20 reported in Chapter 3 were preceded by conformational analyses of the free squaramides
as well as of their chloride complexes, as follows.
Methodology
RESP charges were initially calculated for the five squaramides with single conformation as
previously mentioned. Subsequently, in order to obtain RESP charges less dependent on
molecular conformation or orientation, S01, S09, S10 S19 and S20 were subjected to a
conformational analysis using Low-MODe (LMOD) optimization method with exception of
S10. The LMOD conformational search procedure is based on small perturbations of the
systems in order to explore its conformational space and directly calculates the modes, using
them to improve Monte Carlo sampling. The LMOD procedure employs the XMIN algorithm
for energy relaxation and minimization: the initial molecular structure energy is minimized,
the system is continuously perturbed and the new minimum-energy conformations are saved
in a conflib file.(111-114)
The conformational analysis of S10 was carried out via MD quenched run, in the gas phase, at
1000 K for 1 ns and using a 1 fs time step. This high temperature allowed a stochastic search
of the conformational space and surmount of the energetic barriers. Frames were saved every
0.1 ps leading to a trajectory file composed of 10000 structures, which were further full MM
minimized until the convergence criteria of 0.0001 kcal/mol was attained.
Subsequently, the 10000 frames were sorted by energy and four anti/anti conformations
with different torsion angles were selected for S09, S10, S19 and S20. For S01 just three
conformations with substantially different torsion angles centred at C-N bonds were found.
Only anti/anti conformations were selected taking into account that this is the conformation
required for the anion recognition as evident from the crystal structures of anion squaramide
complexes deposited with CSD (see Figure 15).(90) These conformations were then selected
for HF/6-31G* optimizations followed by Electrostatic Potential calculations. Using the
espgen tool (105), the individual electrostatic potential (ESP) for the individual
conformations of each squaramide was extracted from the corresponding Gaussian 09 output
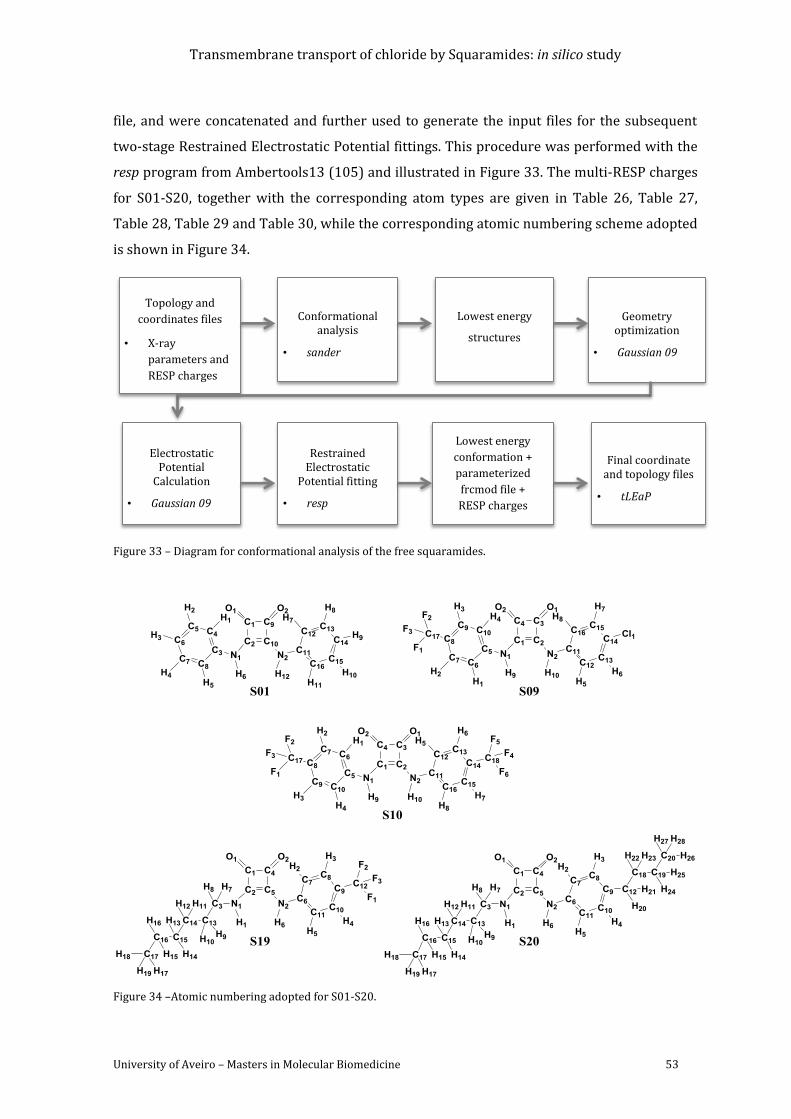
Transmembrane transport of chloride by Squaramides: in silico study
University of Aveiro – Masters in Molecular Biomedicine 53
file, and were concatenated and further used to generate the input files for the subsequent
two-stage Restrained Electrostatic Potential fittings. This procedure was performed with the
resp program from Ambertools13 (105) and illustrated in Figure 33. The multi-RESP charges
for S01-S20, together with the corresponding atom types are given in Table 26, Table 27,
Table 28, Table 29 and Table 30, while the corresponding atomic numbering scheme adopted
is shown in Figure 34.
Figure 33 – Diagram for conformational analysis of the free squaramides.
Figure 34 –Atomic numbering adopted for S01-S20.
Topology and
coordinates files
• X-ray
parameters and
RESP charges
Conformational analysis
• sander
Lowest energy
structures
Geometry optimization
• Gaussian 09
Electrostatic Potential
Calculation
• Gaussian 09
Restrained Electrostatic
Potential fitting
• resp
Lowest energy
conformation +
parameterized
frcmod file +
RESP charges
Final coordinate and topology files
• tLEaP
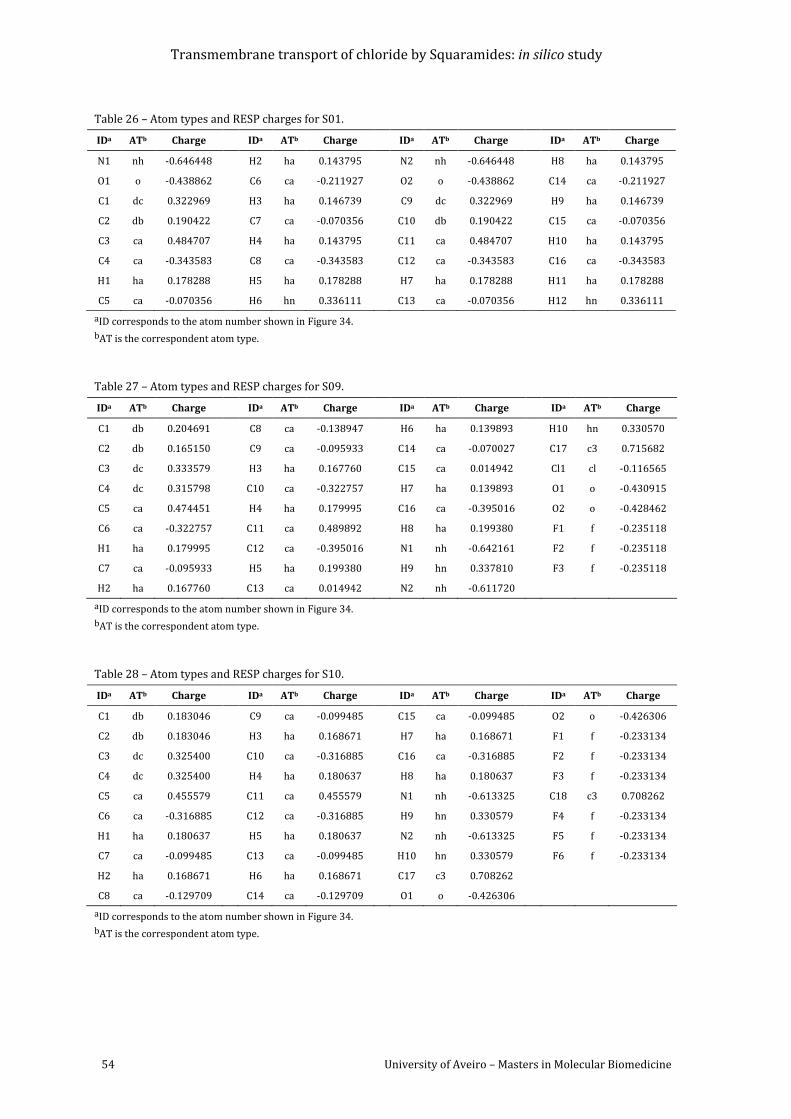
Transmembrane transport of chloride by Squaramides: in silico study
54 University of Aveiro – Masters in Molecular Biomedicine
Table 26 – Atom types and RESP charges for S01.
IDa ATb Charge
IDa ATb Charge IDa ATb Charge IDa ATb Charge
N1 nh -0.646448
H2 ha 0.143795 N2 nh -0.646448 H8 ha 0.143795
O1 o -0.438862
C6 ca -0.211927 O2 o -0.438862 C14 ca -0.211927
C1 dc 0.322969
H3 ha 0.146739 C9 dc 0.322969 H9 ha 0.146739
C2 db 0.190422
C7 ca -0.070356 C10 db 0.190422 C15 ca -0.070356
C3 ca 0.484707
H4 ha 0.143795 C11 ca 0.484707 H10 ha 0.143795
C4 ca -0.343583
C8 ca -0.343583 C12 ca -0.343583 C16 ca -0.343583
H1 ha 0.178288
H5 ha 0.178288 H7 ha 0.178288 H11 ha 0.178288
C5 ca -0.070356
H6 hn 0.336111 C13 ca -0.070356 H12 hn 0.336111
aID corresponds to the atom number shown in Figure 34.
bAT is the correspondent atom type.
Table 27 – Atom types and RESP charges for S09.
IDa ATb Charge
IDa ATb Charge
IDa ATb Charge IDa ATb Charge
C1 db 0.204691
C8 ca -0.138947
H6 ha 0.139893 H10 hn 0.330570
C2 db 0.165150
C9 ca -0.095933
C14 ca -0.070027 C17 c3 0.715682
C3 dc 0.333579
H3 ha 0.167760
C15 ca 0.014942 Cl1 cl -0.116565
C4 dc 0.315798
C10 ca -0.322757
H7 ha 0.139893 O1 o -0.430915
C5 ca 0.474451
H4 ha 0.179995
C16 ca -0.395016 O2 o -0.428462
C6 ca -0.322757
C11 ca 0.489892
H8 ha 0.199380 F1 f -0.235118
H1 ha 0.179995
C12 ca -0.395016
N1 nh -0.642161 F2 f -0.235118
C7 ca -0.095933
H5 ha 0.199380
H9 hn 0.337810 F3 f -0.235118
H2 ha 0.167760
C13 ca 0.014942
N2 nh -0.611720
aID corresponds to the atom number shown in Figure 34.
bAT is the correspondent atom type.
Table 28 – Atom types and RESP charges for S10.
IDa ATb Charge
IDa ATb Charge
IDa ATb Charge IDa ATb Charge
C1 db 0.183046
C9 ca -0.099485
C15 ca -0.099485 O2 o -0.426306
C2 db 0.183046
H3 ha 0.168671
H7 ha 0.168671 F1 f -0.233134
C3 dc 0.325400
C10 ca -0.316885
C16 ca -0.316885 F2 f -0.233134
C4 dc 0.325400
H4 ha 0.180637
H8 ha 0.180637 F3 f -0.233134
C5 ca 0.455579
C11 ca 0.455579
N1 nh -0.613325 C18 c3 0.708262
C6 ca -0.316885
C12 ca -0.316885
H9 hn 0.330579 F4 f -0.233134
H1 ha 0.180637
H5 ha 0.180637
N2 nh -0.613325 F5 f -0.233134
C7 ca -0.099485
C13 ca -0.099485
H10 hn 0.330579 F6 f -0.233134
H2 ha 0.168671
H6 ha 0.168671
C17 c3 0.708262
C8 ca -0.129709
C14 ca -0.129709
O1 o -0.426306
aID corresponds to the atom number shown in Figure 34.
bAT is the correspondent atom type.
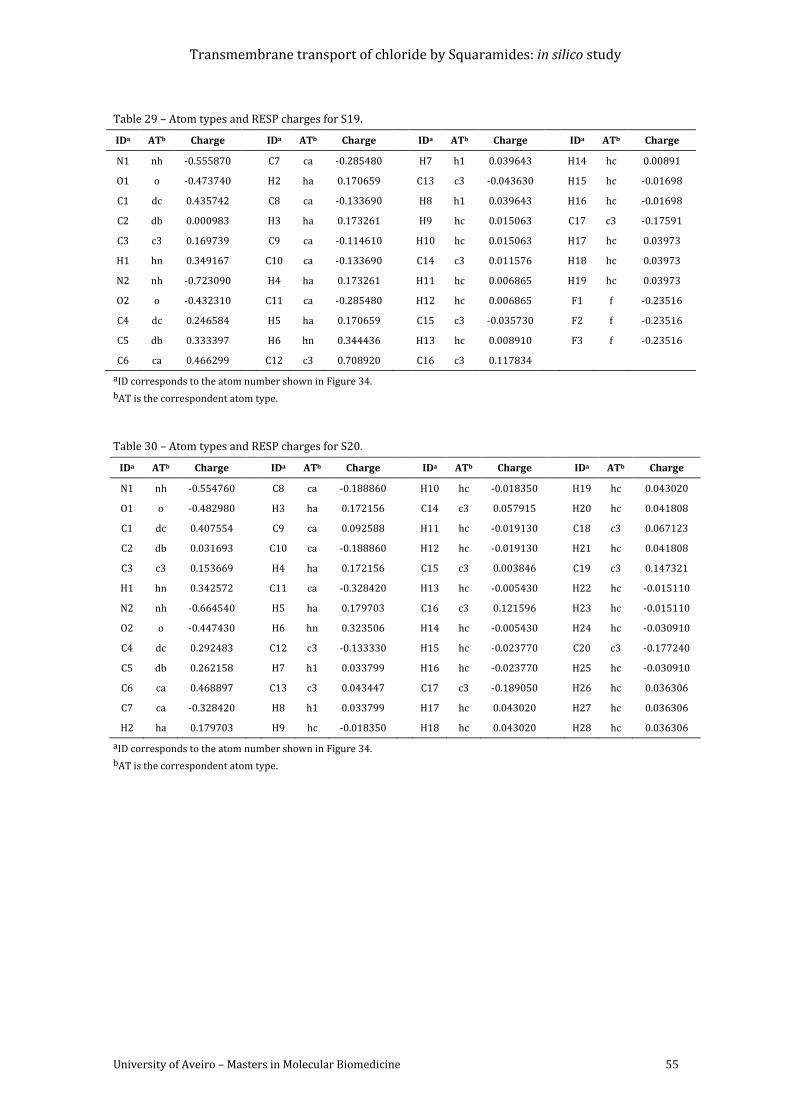
Transmembrane transport of chloride by Squaramides: in silico study
University of Aveiro – Masters in Molecular Biomedicine 55
Table 29 – Atom types and RESP charges for S19.
IDa ATb Charge
IDa ATb Charge
IDa ATb Charge IDa ATb Charge
N1 nh -0.555870
C7 ca -0.285480
H7 h1 0.039643 H14 hc 0.00891
O1 o -0.473740
H2 ha 0.170659
C13 c3 -0.043630 H15 hc -0.01698
C1 dc 0.435742
C8 ca -0.133690
H8 h1 0.039643 H16 hc -0.01698
C2 db 0.000983
H3 ha 0.173261
H9 hc 0.015063 C17 c3 -0.17591
C3 c3 0.169739
C9 ca -0.114610
H10 hc 0.015063 H17 hc 0.03973
H1 hn 0.349167
C10 ca -0.133690
C14 c3 0.011576 H18 hc 0.03973
N2 nh -0.723090
H4 ha 0.173261
H11 hc 0.006865 H19 hc 0.03973
O2 o -0.432310
C11 ca -0.285480
H12 hc 0.006865 F1 f -0.23516
C4 dc 0.246584
H5 ha 0.170659
C15 c3 -0.035730 F2 f -0.23516
C5 db 0.333397
H6 hn 0.344436
H13 hc 0.008910 F3 f -0.23516
C6 ca 0.466299
C12 c3 0.708920
C16 c3 0.117834
aID corresponds to the atom number shown in Figure 34.
bAT is the correspondent atom type.
Table 30 – Atom types and RESP charges for S20.
IDa ATb Charge
IDa ATb Charge
IDa ATb Charge
IDa ATb Charge
N1 nh -0.554760
C8 ca -0.188860
H10 hc -0.018350
H19 hc 0.043020
O1 o -0.482980
H3 ha 0.172156
C14 c3 0.057915
H20 hc 0.041808
C1 dc 0.407554
C9 ca 0.092588
H11 hc -0.019130
C18 c3 0.067123
C2 db 0.031693
C10 ca -0.188860
H12 hc -0.019130
H21 hc 0.041808
C3 c3 0.153669
H4 ha 0.172156
C15 c3 0.003846
C19 c3 0.147321
H1 hn 0.342572
C11 ca -0.328420
H13 hc -0.005430
H22 hc -0.015110
N2 nh -0.664540
H5 ha 0.179703
C16 c3 0.121596
H23 hc -0.015110
O2 o -0.447430
H6 hn 0.323506
H14 hc -0.005430
H24 hc -0.030910
C4 dc 0.292483
C12 c3 -0.133330
H15 hc -0.023770
C20 c3 -0.177240
C5 db 0.262158
H7 h1 0.033799
H16 hc -0.023770
H25 hc -0.030910
C6 ca 0.468897
C13 c3 0.043447
C17 c3 -0.189050
H26 hc 0.036306
C7 ca -0.328420
H8 h1 0.033799
H17 hc 0.043020
H27 hc 0.036306
H2 ha 0.179703
H9 hc -0.018350
H18 hc 0.043020
H28 hc 0.036306
aID corresponds to the atom number shown in Figure 34.
bAT is the correspondent atom type.
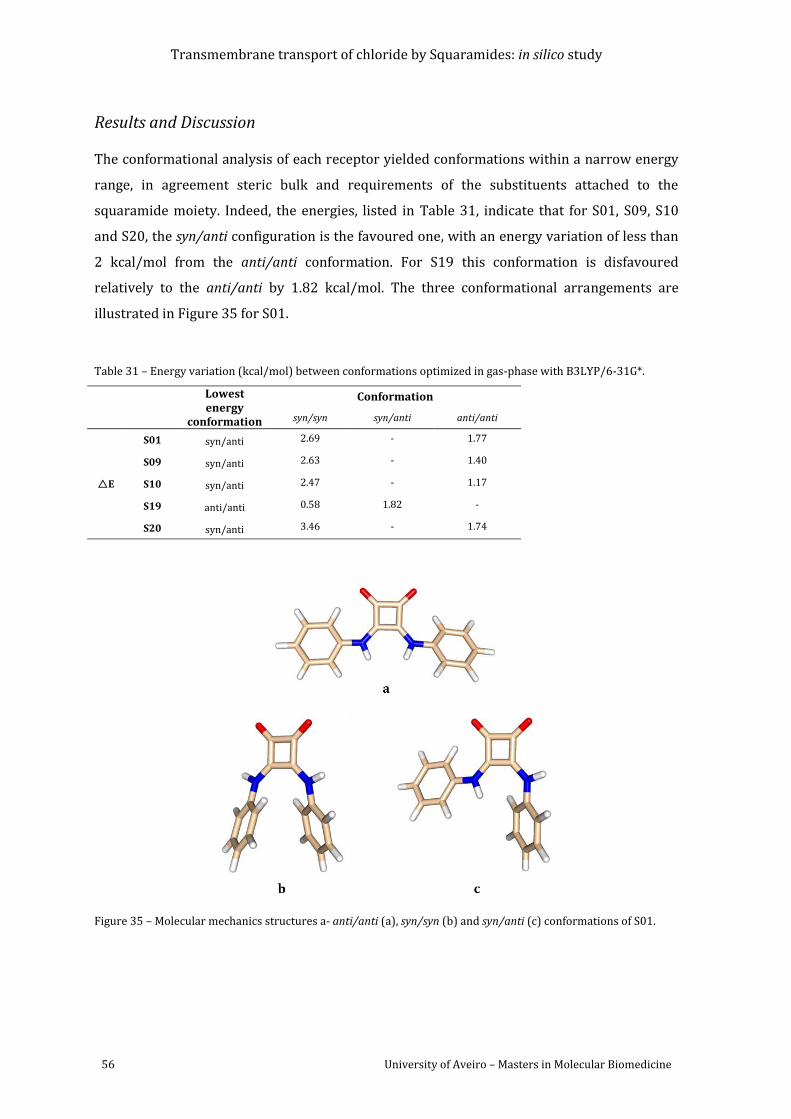
Transmembrane transport of chloride by Squaramides: in silico study
56 University of Aveiro – Masters in Molecular Biomedicine
Results and Discussion
The conformational analysis of each receptor yielded conformations within a narrow energy
range, in agreement steric bulk and requirements of the substituents attached to the
squaramide moiety. Indeed, the energies, listed in Table 31, indicate that for S01, S09, S10
and S20, the syn/anti configuration is the favoured one, with an energy variation of less than
2 kcal/mol from the anti/anti conformation. For S19 this conformation is disfavoured
relatively to the anti/anti by 1.82 kcal/mol. The three conformational arrangements are
illustrated in Figure 35 for S01.
Table 31 – Energy variation (kcal/mol) between conformations optimized in gas-phase with B3LYP/6-31G*.
Lowest energy
conformation
Conformation
syn/syn syn/anti anti/anti
E
S01 syn/anti 2.69 - 1.77
S09 syn/anti 2.63 - 1.40
S10 syn/anti 2.47 - 1.17
S19 anti/anti 0.58 1.82 -
S20 syn/anti 3.46 - 1.74
Figure 35 – Molecular mechanics structures a- anti/anti (a), syn/syn (b) and syn/anti (c) conformations of S01.
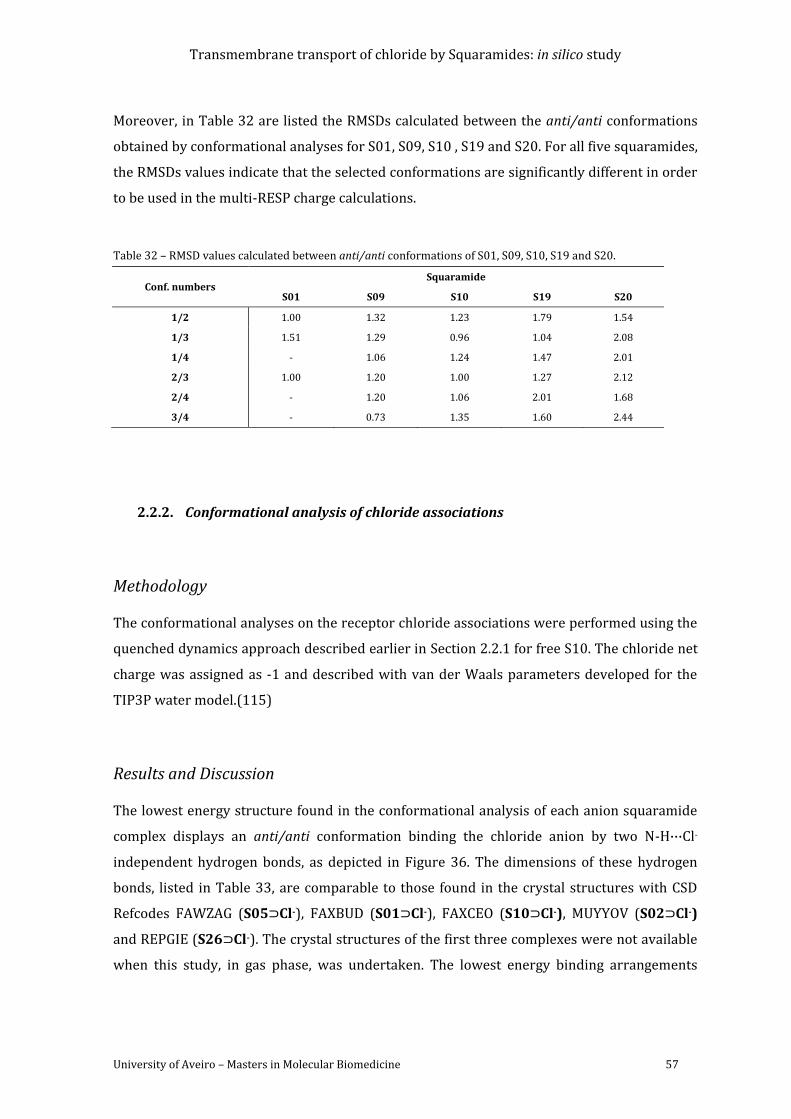
Transmembrane transport of chloride by Squaramides: in silico study
University of Aveiro – Masters in Molecular Biomedicine 57
Moreover, in Table 32 are listed the RMSDs calculated between the anti/anti conformations
obtained by conformational analyses for S01, S09, S10 , S19 and S20. For all five squaramides,
the RMSDs values indicate that the selected conformations are significantly different in order
to be used in the multi-RESP charge calculations.
Table 32 – RMSD values calculated between anti/anti conformations of S01, S09, S10, S19 and S20.
Conf. numbers Squaramide
S01 S09 S10 S19 S20
1/2 1.00 1.32 1.23 1.79 1.54
1/3 1.51 1.29 0.96 1.04 2.08
1/4 - 1.06 1.24 1.47 2.01
2/3 1.00 1.20 1.00 1.27 2.12
2/4 - 1.20 1.06 2.01 1.68
3/4 - 0.73 1.35 1.60 2.44
Conformational analysis of chloride associations 2.2.2.
Methodology
The conformational analyses on the receptor chloride associations were performed using the
quenched dynamics approach described earlier in Section 2.2.1 for free S10. The chloride net
charge was assigned as -1 and described with van der Waals parameters developed for the
TIP3P water model.(115)
Results and Discussion
The lowest energy structure found in the conformational analysis of each anion squaramide
complex displays an anti/anti conformation binding the chloride anion by two N-H···Cl-
independent hydrogen bonds, as depicted in Figure 36. The dimensions of these hydrogen
bonds, listed in Table 33, are comparable to those found in the crystal structures with CSD
Refcodes FAWZAG (S05⊃Cl-), FAXBUD (S01⊃Cl-), FAXCEO (S10⊃Cl-), MUYYOV (S02⊃Cl-)
and REPGIE (S26⊃Cl-). The crystal structures of the first three complexes were not available
when this study, in gas phase, was undertaken. The lowest energy binding arrangements
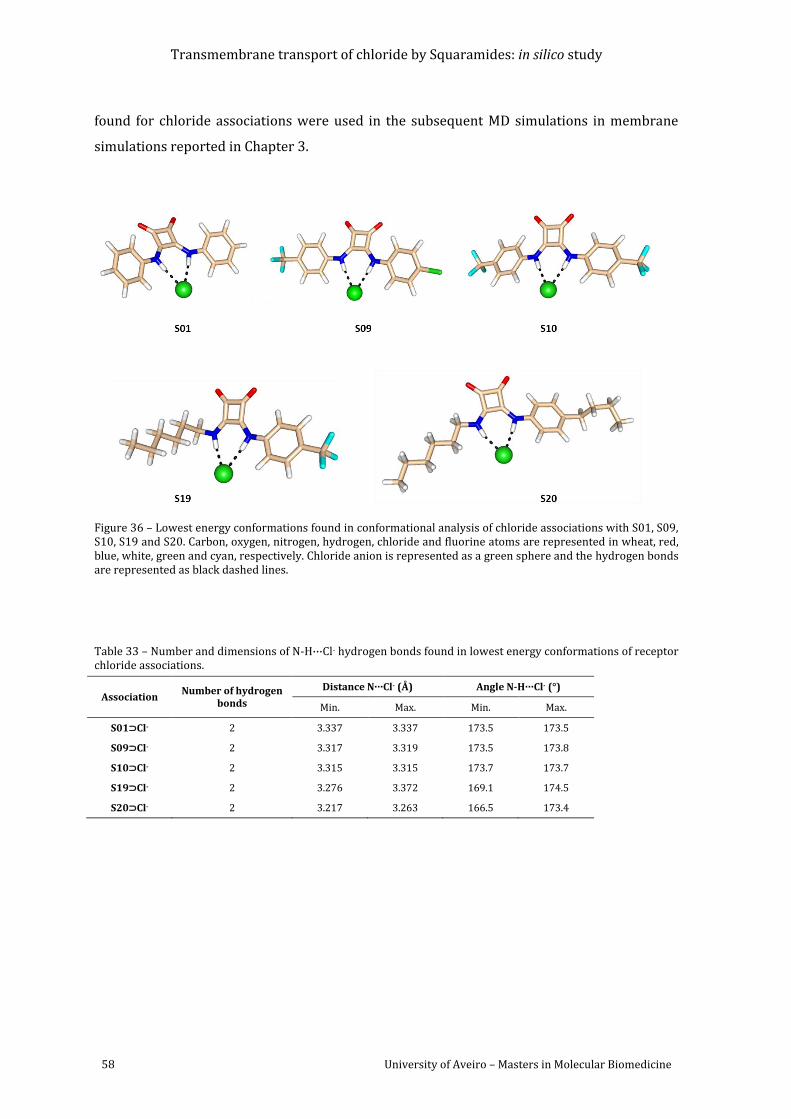
Transmembrane transport of chloride by Squaramides: in silico study
58 University of Aveiro – Masters in Molecular Biomedicine
found for chloride associations were used in the subsequent MD simulations in membrane
simulations reported in Chapter 3.
Figure 36 – Lowest energy conformations found in conformational analysis of chloride associations with S01, S09, S10, S19 and S20. Carbon, oxygen, nitrogen, hydrogen, chloride and fluorine atoms are represented in wheat, red, blue, white, green and cyan, respectively. Chloride anion is represented as a green sphere and the hydrogen bonds are represented as black dashed lines.
Table 33 – Number and dimensions of N-H···Cl- hydrogen bonds found in lowest energy conformations of receptor chloride associations.
Association Number of hydrogen
bonds
Distance N···Cl- (Å) Angle N-H···Cl- (°)
Min. Max. Min. Max.
S01⊃Cl- 2 3.337 3.337 173.5 173.5
S09⊃Cl- 2 3.317 3.319 173.5 173.8
S10⊃Cl- 2 3.315 3.315 173.7 173.7
S19⊃Cl- 2 3.276 3.372 169.1 174.5
S20⊃Cl- 2 3.217 3.263 166.5 173.4
Transmembrane transport of chloride by Squaramides: in silico study
University of Aveiro – Masters in Molecular Biomedicine 59
3. Chloride transport across a phospholipid bilayer with
squaramide receptors
In this chapter we report the molecular dynamics study on the chloride transmembrane
transport mediated by squaramide receptors S01, S09, S10, S19, S20 (see Figure 36, Chapter
2). The bilayer models used in this study are composed of POPC phospholipids (see Figure 22,
Chapter 1) in agreement with the experimental studies described in Chapter 1.(72)
Over the last few years, significant theoretical studies on pure POPC membranes with specific
force field parameterization of phospholipids have been reported. Klauda and co-workers
simulated pure bilayers of six lipids (DMPC, DOPC, POPE, DPPC, DLPC and POPC) with the
CHARMM36 all-atom force field. Each membrane consisted of 72 lipids and approximately
2232 water molecules (81). Another example is the work developed by Poger et al. (86), a
study on fully hydrated pure membranes of DLPC, DMPC, DOPC and POPC. The G53A6L force
field, used in this study, proved to properly reproduce the structure and hydration of bilayers
formed by 128 lipid molecules and 5120 (SPC) water molecules.(86)
A notorious attempt to simulate lipid membranes using GAFF together with AMBER software
package was reported by Rosso and co-workers in 2008 (82). They simulated DMPC and
DOPC membranes composed of 72 lipids and 2449 to 2935 water molecules. Although they
were able to reproduce several structural and dynamic experimental properties of the lipids,
often, the area per lipid values were underestimated in comparison to the experimental data.
This was associated with the need of a defined surface tension when using GAFF.(82)
In the present work, the experimental reference data were obtained from Kučerka group’s
results.(116) The results presented in this work will also be compared with findings from
Félix and co-workers.(117)
This chapter is organized in sections as follows: in the first part, the simulation performed in
a pure membrane model is described and the results are compared with literature. The
second part reports and discusses the structural and dynamic results from the simulations
with squaramide receptors in membrane models. This second part also analyses how the
permeation and interaction of these receptors affect the membrane properties when they are
initially positioned within the hydrophobic core of the bilayer or in the aqueous phase of the
system.
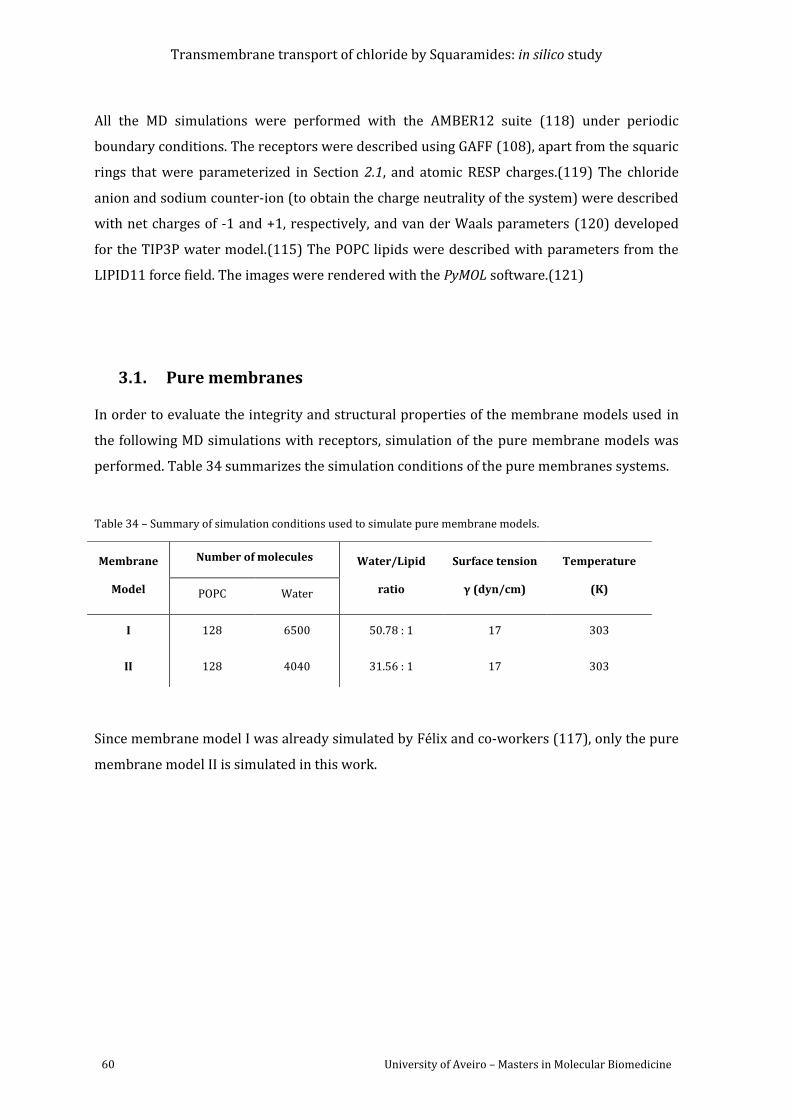
Transmembrane transport of chloride by Squaramides: in silico study
60 University of Aveiro – Masters in Molecular Biomedicine
All the MD simulations were performed with the AMBER12 suite (118) under periodic
boundary conditions. The receptors were described using GAFF (108), apart from the squaric
rings that were parameterized in Section 2.1, and atomic RESP charges.(119) The chloride
anion and sodium counter-ion (to obtain the charge neutrality of the system) were described
with net charges of -1 and +1, respectively, and van der Waals parameters (120) developed
for the TIP3P water model.(115) The POPC lipids were described with parameters from the
LIPID11 force field. The images were rendered with the PyMOL software.(121)
3.1. Pure membranes
In order to evaluate the integrity and structural properties of the membrane models used in
the following MD simulations with receptors, simulation of the pure membrane models was
performed. Table 34 summarizes the simulation conditions of the pure membranes systems.
Table 34 – Summary of simulation conditions used to simulate pure membrane models.
Since membrane model I was already simulated by Félix and co-workers (117), only the pure
membrane model II is simulated in this work.
Membrane
Model
Number of molecules Water/Lipid
ratio
Surface tension
γ (dyn/cm)
Temperature
(K) POPC Water
I 128 6500 50.78 : 1 17 303
II 128 4040 31.56 : 1 17 303
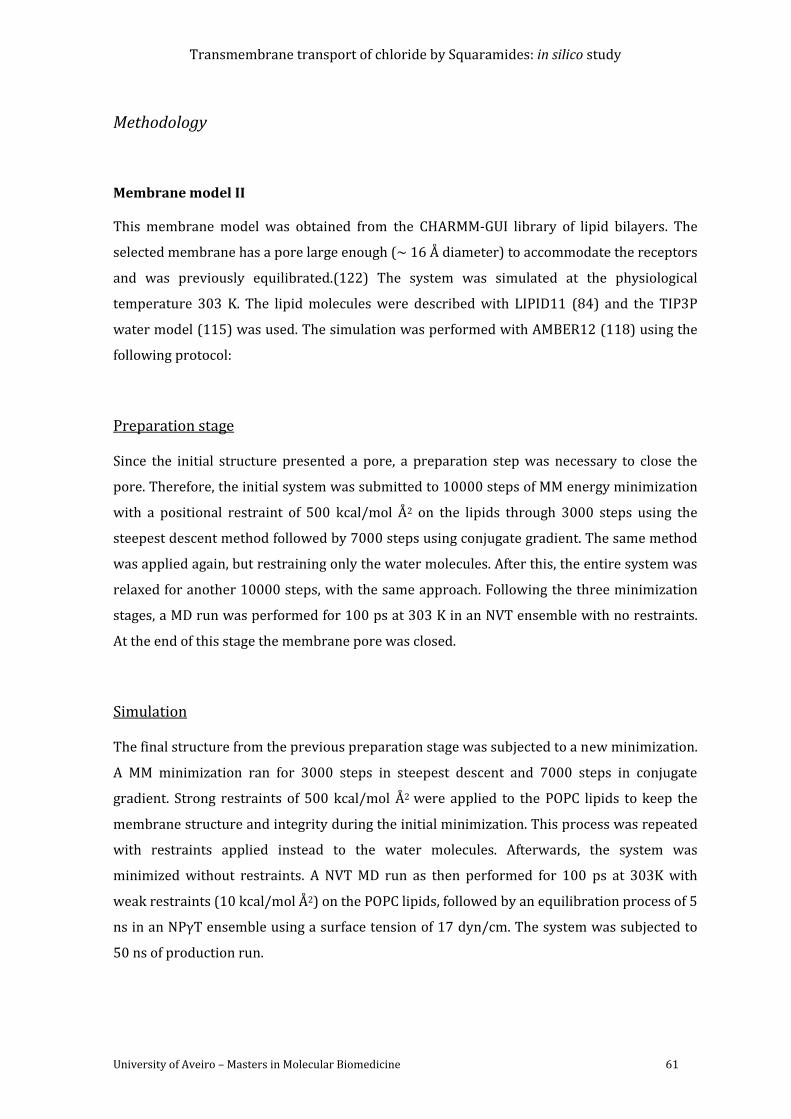
Transmembrane transport of chloride by Squaramides: in silico study
University of Aveiro – Masters in Molecular Biomedicine 61
Methodology
Membrane model II
This membrane model was obtained from the CHARMM-GUI library of lipid bilayers. The
selected membrane has a pore large enough (~ 16 Å diameter) to accommodate the receptors
and was previously equilibrated.(122) The system was simulated at the physiological
temperature 303 K. The lipid molecules were described with LIPID11 (84) and the TIP3P
water model (115) was used. The simulation was performed with AMBER12 (118) using the
following protocol:
Preparation stage
Since the initial structure presented a pore, a preparation step was necessary to close the
pore. Therefore, the initial system was submitted to 10000 steps of MM energy minimization
with a positional restraint of 500 kcal/mol Å2 on the lipids through 3000 steps using the
steepest descent method followed by 7000 steps using conjugate gradient. The same method
was applied again, but restraining only the water molecules. After this, the entire system was
relaxed for another 10000 steps, with the same approach. Following the three minimization
stages, a MD run was performed for 100 ps at 303 K in an NVT ensemble with no restraints.
At the end of this stage the membrane pore was closed.
Simulation
The final structure from the previous preparation stage was subjected to a new minimization.
A MM minimization ran for 3000 steps in steepest descent and 7000 steps in conjugate
gradient. Strong restraints of 500 kcal/mol Å2 were applied to the POPC lipids to keep the
membrane structure and integrity during the initial minimization. This process was repeated
with restraints applied instead to the water molecules. Afterwards, the system was
minimized without restraints. A NVT MD run as then performed for 100 ps at 303K with
weak restraints (10 kcal/mol Å2) on the POPC lipids, followed by an equilibration process of 5
ns in an NPγT ensemble using a surface tension of 17 dyn/cm. The system was subjected to
50 ns of production run.
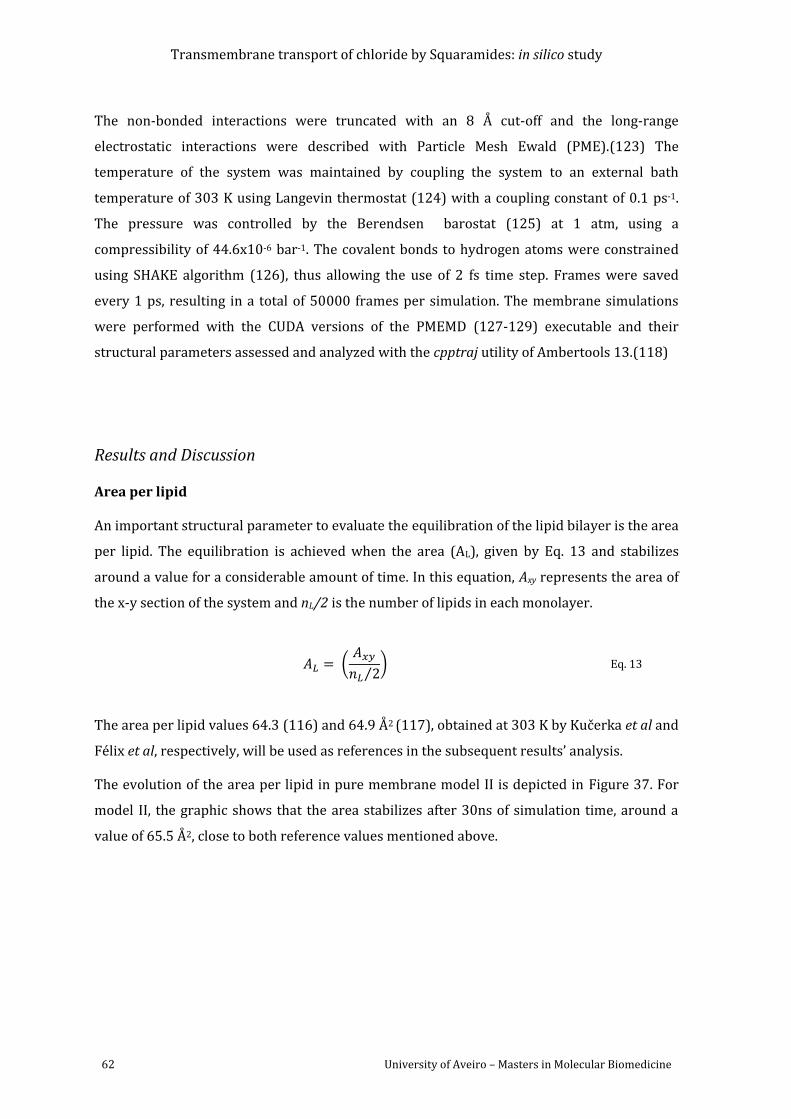
Transmembrane transport of chloride by Squaramides: in silico study
62 University of Aveiro – Masters in Molecular Biomedicine
The non-bonded interactions were truncated with an 8 Å cut-off and the long-range
electrostatic interactions were described with Particle Mesh Ewald (PME).(123) The
temperature of the system was maintained by coupling the system to an external bath
temperature of 303 K using Langevin thermostat (124) with a coupling constant of 0.1 ps-1.
The pressure was controlled by the Berendsen barostat (125) at 1 atm, using a
compressibility of 44.6x10⁻⁶ bar-1. The covalent bonds to hydrogen atoms were constrained
using SHAKE algorithm (126), thus allowing the use of 2 fs time step. Frames were saved
every 1 ps, resulting in a total of 50000 frames per simulation. The membrane simulations
were performed with the CUDA versions of the PMEMD (127-129) executable and their
structural parameters assessed and analyzed with the cpptraj utility of Ambertools 13.(118)
Results and Discussion
Area per lipid
An important structural parameter to evaluate the equilibration of the lipid bilayer is the area
per lipid. The equilibration is achieved when the area (AL), given by Eq. 13 and stabilizes
around a value for a considerable amount of time. In this equation, Axy represents the area of
the x-y section of the system and nL/2 is the number of lipids in each monolayer.
(
⁄) Eq. 13
The area per lipid values 64.3 (116) and 64.9 Å2 (117), obtained at 303 K by Kučerka et al and
Félix et al, respectively, will be used as references in the subsequent results’ analysis.
The evolution of the area per lipid in pure membrane model II is depicted in Figure 37. For
model II, the graphic shows that the area stabilizes after 30ns of simulation time, around a
value of 65.5 Å2, close to both reference values mentioned above.
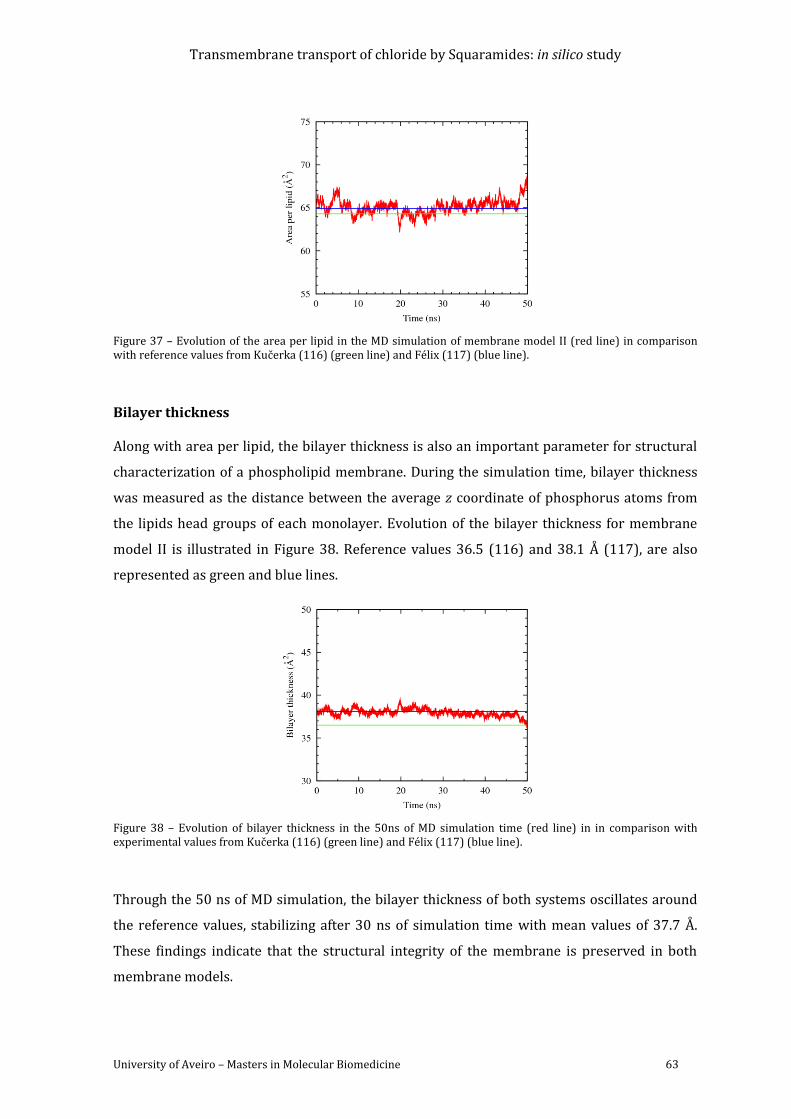
Transmembrane transport of chloride by Squaramides: in silico study
University of Aveiro – Masters in Molecular Biomedicine 63
Figure 37 – Evolution of the area per lipid in the MD simulation of membrane model II (red line) in comparison with reference values from Kučerka (116) (green line) and Félix (117) (blue line).
Bilayer thickness
Along with area per lipid, the bilayer thickness is also an important parameter for structural
characterization of a phospholipid membrane. During the simulation time, bilayer thickness
was measured as the distance between the average z coordinate of phosphorus atoms from
the lipids head groups of each monolayer. Evolution of the bilayer thickness for membrane
model II is illustrated in Figure 38. Reference values 36.5 (116) and 38.1 Å (117), are also
represented as green and blue lines.
Figure 38 – Evolution of bilayer thickness in the 50ns of MD simulation time (red line) in in comparison with experimental values from Kučerka (116) (green line) and Félix (117) (blue line).
Through the 50 ns of MD simulation, the bilayer thickness of both systems oscillates around
the reference values, stabilizing after 30 ns of simulation time with mean values of 37.7 Å.
These findings indicate that the structural integrity of the membrane is preserved in both
membrane models.
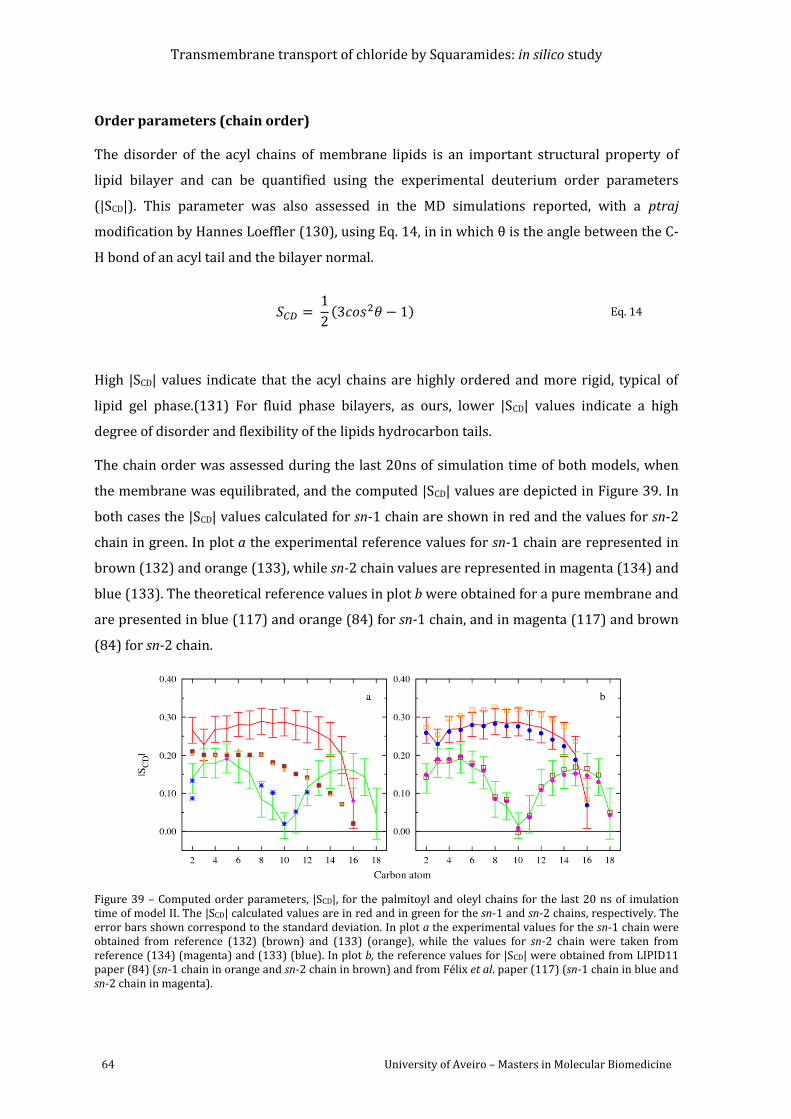
Transmembrane transport of chloride by Squaramides: in silico study
64 University of Aveiro – Masters in Molecular Biomedicine
Order parameters (chain order)
The disorder of the acyl chains of membrane lipids is an important structural property of
lipid bilayer and can be quantified using the experimental deuterium order parameters
(|SCD|). This parameter was also assessed in the MD simulations reported, with a ptraj
modification by Hannes Loeffler (130), using Eq. 14, in in which θ is the angle between the C-
H bond of an acyl tail and the bilayer normal.
( ) Eq. 14
High |SCD| values indicate that the acyl chains are highly ordered and more rigid, typical of
lipid gel phase.(131) For fluid phase bilayers, as ours, lower |SCD| values indicate a high
degree of disorder and flexibility of the lipids hydrocarbon tails.
The chain order was assessed during the last 20ns of simulation time of both models, when
the membrane was equilibrated, and the computed |SCD| values are depicted in Figure 39. In
both cases the |SCD| values calculated for sn-1 chain are shown in red and the values for sn-2
chain in green. In plot a the experimental reference values for sn-1 chain are represented in
brown (132) and orange (133), while sn-2 chain values are represented in magenta (134) and
blue (133). The theoretical reference values in plot b were obtained for a pure membrane and
are presented in blue (117) and orange (84) for sn-1 chain, and in magenta (117) and brown
(84) for sn-2 chain.
Figure 39 – Computed order parameters, |SCD|, for the palmitoyl and oleyl chains for the last 20 ns of imulation time of model II. The |SCD| calculated values are in red and in green for the sn-1 and sn-2 chains, respectively. The error bars shown correspond to the standard deviation. In plot a the experimental values for the sn-1 chain were obtained from reference (132) (brown) and (133) (orange), while the values for sn-2 chain were taken from reference (134) (magenta) and (133) (blue). In plot b, the reference values for |SCD| were obtained from LIPID11 paper (84) (sn-1 chain in orange and sn-2 chain in brown) and from Félix et al. paper (117) (sn-1 chain in blue and sn-2 chain in magenta).
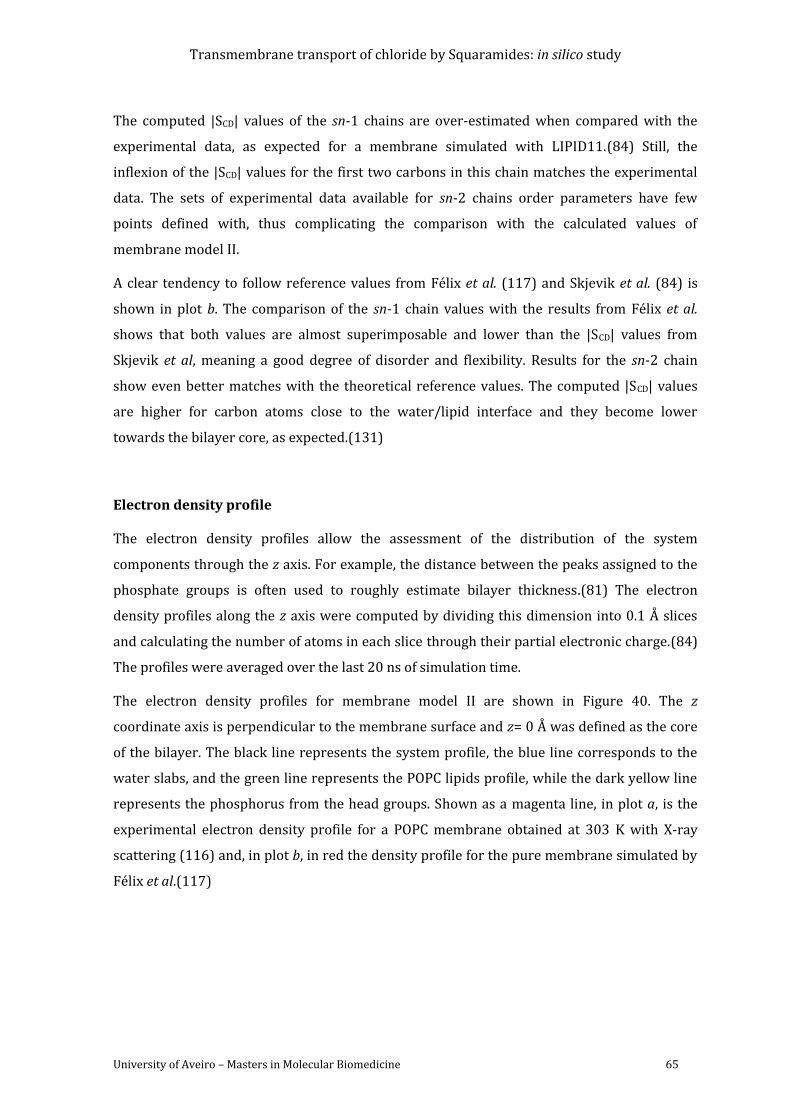
Transmembrane transport of chloride by Squaramides: in silico study
University of Aveiro – Masters in Molecular Biomedicine 65
The computed |SCD| values of the sn-1 chains are over-estimated when compared with the
experimental data, as expected for a membrane simulated with LIPID11.(84) Still, the
inflexion of the |SCD| values for the first two carbons in this chain matches the experimental
data. The sets of experimental data available for sn-2 chains order parameters have few
points defined with, thus complicating the comparison with the calculated values of
membrane model II.
A clear tendency to follow reference values from Félix et al. (117) and Skjevik et al. (84) is
shown in plot b. The comparison of the sn-1 chain values with the results from Félix et al.
shows that both values are almost superimposable and lower than the |SCD| values from
Skjevik et al, meaning a good degree of disorder and flexibility. Results for the sn-2 chain
show even better matches with the theoretical reference values. The computed |SCD| values
are higher for carbon atoms close to the water/lipid interface and they become lower
towards the bilayer core, as expected.(131)
Electron density profile
The electron density profiles allow the assessment of the distribution of the system
components through the z axis. For example, the distance between the peaks assigned to the
phosphate groups is often used to roughly estimate bilayer thickness.(81) The electron
density profiles along the z axis were computed by dividing this dimension into 0.1 Å slices
and calculating the number of atoms in each slice through their partial electronic charge.(84)
The profiles were averaged over the last 20 ns of simulation time.
The electron density profiles for membrane model II are shown in Figure 40. The z
coordinate axis is perpendicular to the membrane surface and z= 0 Å was defined as the core
of the bilayer. The black line represents the system profile, the blue line corresponds to the
water slabs, and the green line represents the POPC lipids profile, while the dark yellow line
represents the phosphorus from the head groups. Shown as a magenta line, in plot a, is the
experimental electron density profile for a POPC membrane obtained at 303 K with X-ray
scattering (116) and, in plot b, in red the density profile for the pure membrane simulated by
Félix et al.(117)
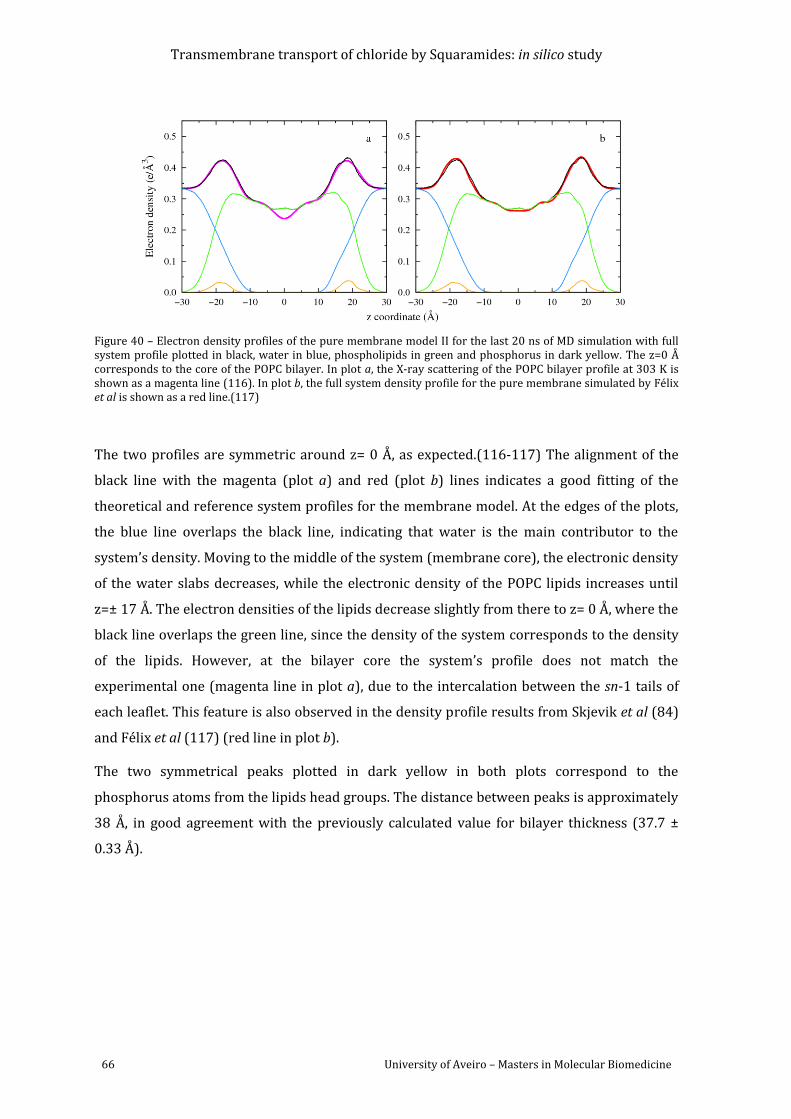
Transmembrane transport of chloride by Squaramides: in silico study
66 University of Aveiro – Masters in Molecular Biomedicine
Figure 40 – Electron density profiles of the pure membrane model II for the last 20 ns of MD simulation with full system profile plotted in black, water in blue, phospholipids in green and phosphorus in dark yellow. The z=0 Å corresponds to the core of the POPC bilayer. In plot a, the X-ray scattering of the POPC bilayer profile at 303 K is shown as a magenta line (116). In plot b, the full system density profile for the pure membrane simulated by Félix et al is shown as a red line.(117)
The two profiles are symmetric around z= 0 Å, as expected.(116-117) The alignment of the
black line with the magenta (plot a) and red (plot b) lines indicates a good fitting of the
theoretical and reference system profiles for the membrane model. At the edges of the plots,
the blue line overlaps the black line, indicating that water is the main contributor to the
system’s density. Moving to the middle of the system (membrane core), the electronic density
of the water slabs decreases, while the electronic density of the POPC lipids increases until
z=± 17 Å. The electron densities of the lipids decrease slightly from there to z= 0 Å, where the
black line overlaps the green line, since the density of the system corresponds to the density
of the lipids. However, at the bilayer core the system’s profile does not match the
experimental one (magenta line in plot a), due to the intercalation between the sn-1 tails of
each leaflet. This feature is also observed in the density profile results from Skjevik et al (84)
and Félix et al (117) (red line in plot b).
The two symmetrical peaks plotted in dark yellow in both plots correspond to the
phosphorus atoms from the lipids head groups. The distance between peaks is approximately
38 Å, in good agreement with the previously calculated value for bilayer thickness (37.7 ±
0.33 Å).
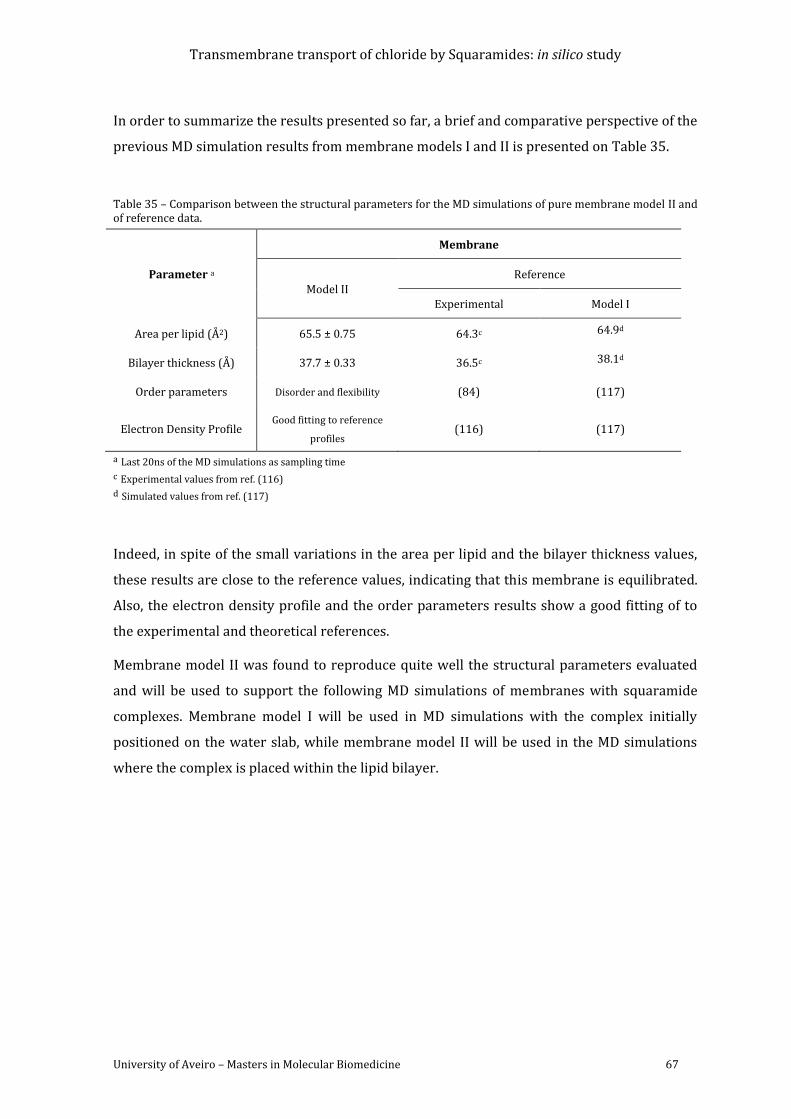
Transmembrane transport of chloride by Squaramides: in silico study
University of Aveiro – Masters in Molecular Biomedicine 67
In order to summarize the results presented so far, a brief and comparative perspective of the
previous MD simulation results from membrane models I and II is presented on Table 35.
Table 35 – Comparison between the structural parameters for the MD simulations of pure membrane model II and of reference data.
Parameter a
Membrane
Model II Reference
Experimental Model I
Area per lipid (Å2) 65.5 ± 0.75 64.3c 64.9d
Bilayer thickness (Å) 37.7 ± 0.33 36.5c 38.1d
Order parameters Disorder and flexibility (84) (117)
Electron Density Profile Good fitting to reference
profiles (116) (117)
a Last 20ns of the MD simulations as sampling time
c Experimental values from ref. (116)
d Simulated values from ref. (117)
Indeed, in spite of the small variations in the area per lipid and the bilayer thickness values,
these results are close to the reference values, indicating that this membrane is equilibrated.
Also, the electron density profile and the order parameters results show a good fitting of to
the experimental and theoretical references.
Membrane model II was found to reproduce quite well the structural parameters evaluated
and will be used to support the following MD simulations of membranes with squaramide
complexes. Membrane model I will be used in MD simulations with the complex initially
positioned on the water slab, while membrane model II will be used in the MD simulations
where the complex is placed within the lipid bilayer.
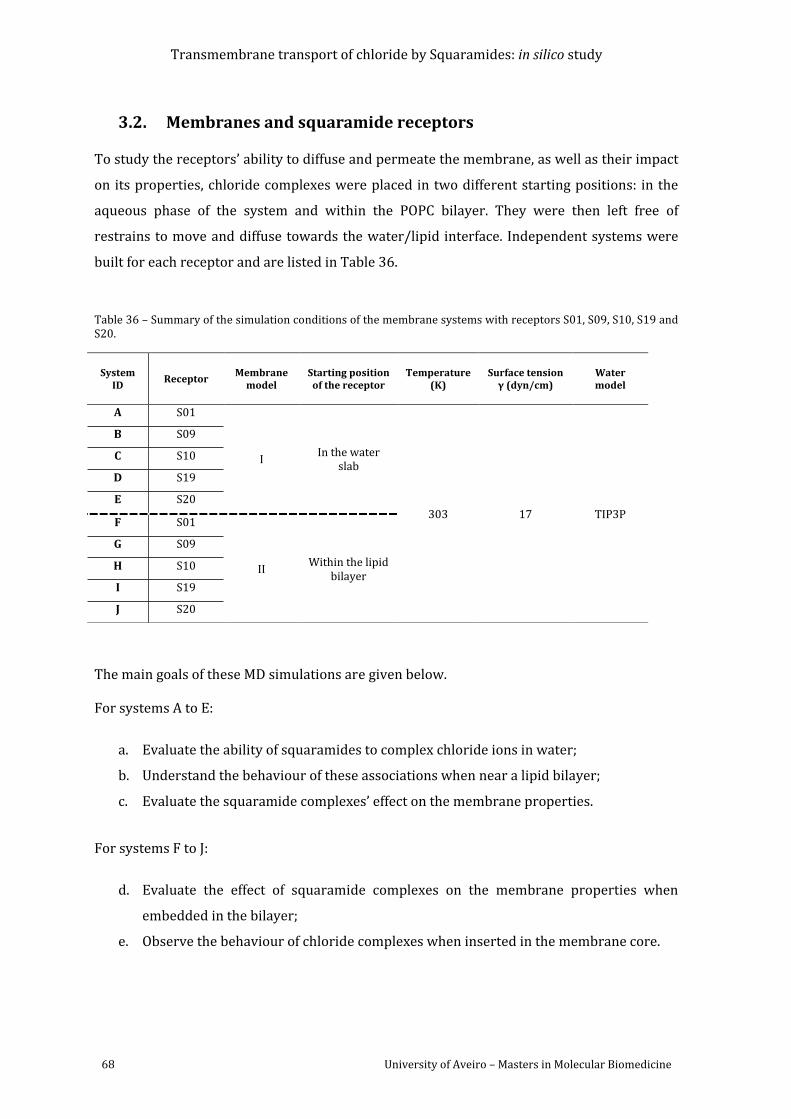
Transmembrane transport of chloride by Squaramides: in silico study
68 University of Aveiro – Masters in Molecular Biomedicine
3.2. Membranes and squaramide receptors
To study the receptors’ ability to diffuse and permeate the membrane, as well as their impact
on its properties, chloride complexes were placed in two different starting positions: in the
aqueous phase of the system and within the POPC bilayer. They were then left free of
restrains to move and diffuse towards the water/lipid interface. Independent systems were
built for each receptor and are listed in Table 36.
Table 36 – Summary of the simulation conditions of the membrane systems with receptors S01, S09, S10, S19 and S20.
The main goals of these MD simulations are given below.
For systems A to E:
a. Evaluate the ability of squaramides to complex chloride ions in water;
b. Understand the behaviour of these associations when near a lipid bilayer;
c. Evaluate the squaramide complexes’ effect on the membrane properties.
For systems F to J:
d. Evaluate the effect of squaramide complexes on the membrane properties when
embedded in the bilayer;
e. Observe the behaviour of chloride complexes when inserted in the membrane core.
System ID
Receptor Membrane
model Starting position of the receptor
Temperature (K)
Surface tension γ (dyn/cm)
Water model
A S01
I In the water
slab
303 17 TIP3P
B S09
C S10
D S19
E S20
F S01
II Within the lipid
bilayer
G S09
H S10
I S19
J S20
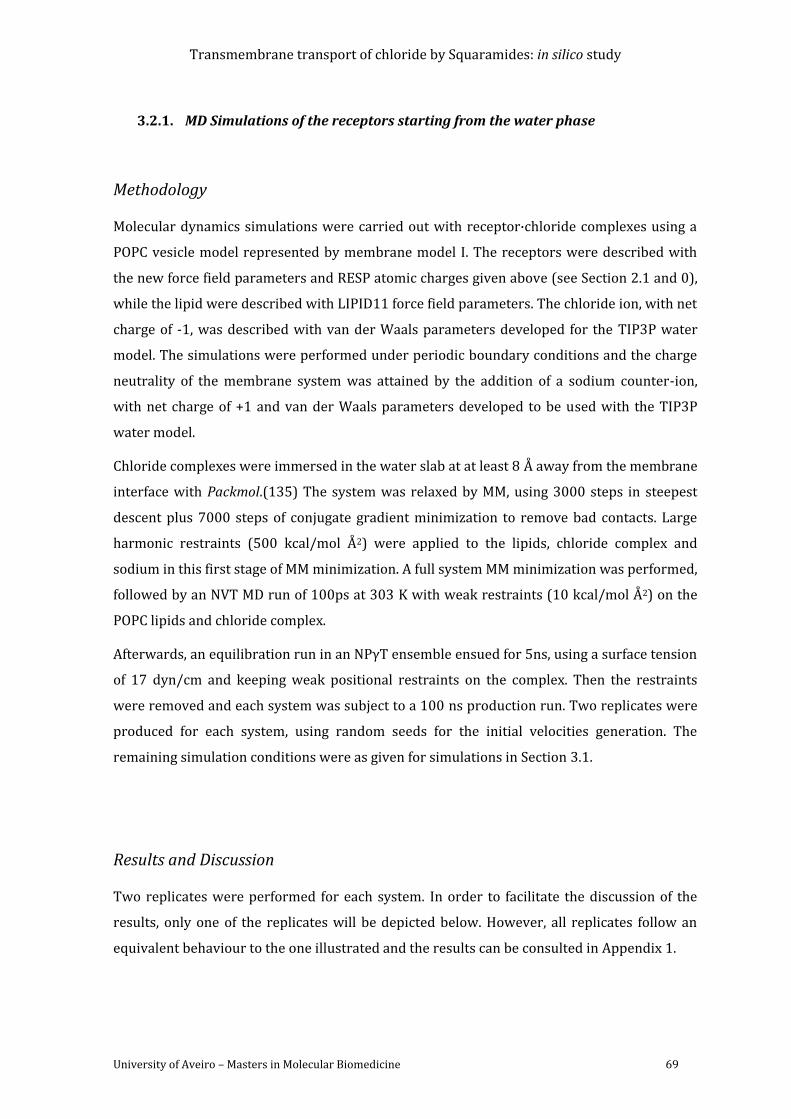
Transmembrane transport of chloride by Squaramides: in silico study
University of Aveiro – Masters in Molecular Biomedicine 69
MD Simulations of the receptors starting from the water phase 3.2.1.
Methodology
Molecular dynamics simulations were carried out with receptor·chloride complexes using a
POPC vesicle model represented by membrane model I. The receptors were described with
the new force field parameters and RESP atomic charges given above (see Section 2.1 and 0),
while the lipid were described with LIPID11 force field parameters. The chloride ion, with net
charge of -1, was described with van der Waals parameters developed for the TIP3P water
model. The simulations were performed under periodic boundary conditions and the charge
neutrality of the membrane system was attained by the addition of a sodium counter-ion,
with net charge of +1 and van der Waals parameters developed to be used with the TIP3P
water model.
Chloride complexes were immersed in the water slab at at least 8 Å away from the membrane
interface with Packmol.(135) The system was relaxed by MM, using 3000 steps in steepest
descent plus 7000 steps of conjugate gradient minimization to remove bad contacts. Large
harmonic restraints (500 kcal/mol Å2) were applied to the lipids, chloride complex and
sodium in this first stage of MM minimization. A full system MM minimization was performed,
followed by an NVT MD run of 100ps at 303 K with weak restraints (10 kcal/mol Å2) on the
POPC lipids and chloride complex.
Afterwards, an equilibration run in an NPγT ensemble ensued for 5ns, using a surface tension
of 17 dyn/cm and keeping weak positional restraints on the complex. Then the restraints
were removed and each system was subject to a 100 ns production run. Two replicates were
produced for each system, using random seeds for the initial velocities generation. The
remaining simulation conditions were as given for simulations in Section 3.1.
Results and Discussion
Two replicates were performed for each system. In order to facilitate the discussion of the
results, only one of the replicates will be depicted below. However, all replicates follow an
equivalent behaviour to the one illustrated and the results can be consulted in Appendix 1.
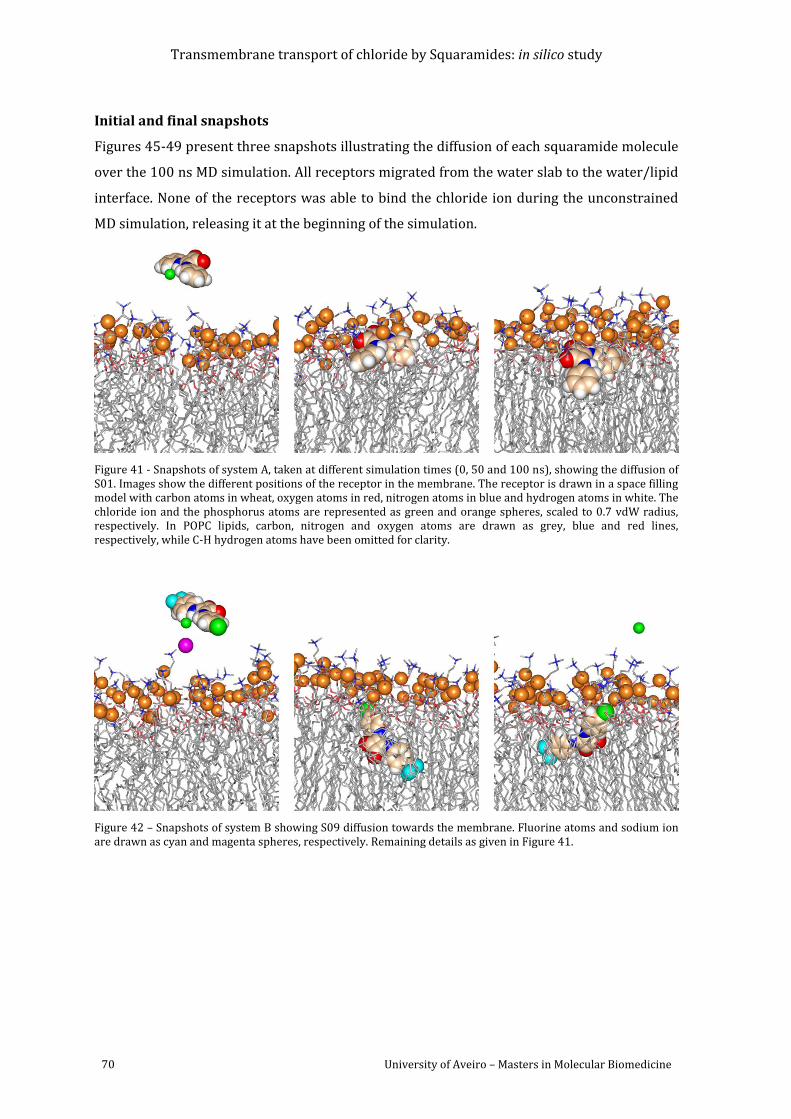
Transmembrane transport of chloride by Squaramides: in silico study
70 University of Aveiro – Masters in Molecular Biomedicine
Initial and final snapshots
Figures 45-49 present three snapshots illustrating the diffusion of each squaramide molecule
over the 100 ns MD simulation. All receptors migrated from the water slab to the water/lipid
interface. None of the receptors was able to bind the chloride ion during the unconstrained
MD simulation, releasing it at the beginning of the simulation.
Figure 41 - Snapshots of system A, taken at different simulation times (0, 50 and 100 ns), showing the diffusion of S01. Images show the different positions of the receptor in the membrane. The receptor is drawn in a space filling model with carbon atoms in wheat, oxygen atoms in red, nitrogen atoms in blue and hydrogen atoms in white. The chloride ion and the phosphorus atoms are represented as green and orange spheres, scaled to 0.7 vdW radius, respectively. In POPC lipids, carbon, nitrogen and oxygen atoms are drawn as grey, blue and red lines, respectively, while C-H hydrogen atoms have been omitted for clarity.
Figure 42 – Snapshots of system B showing S09 diffusion towards the membrane. Fluorine atoms and sodium ion are drawn as cyan and magenta spheres, respectively. Remaining details as given in Figure 41.
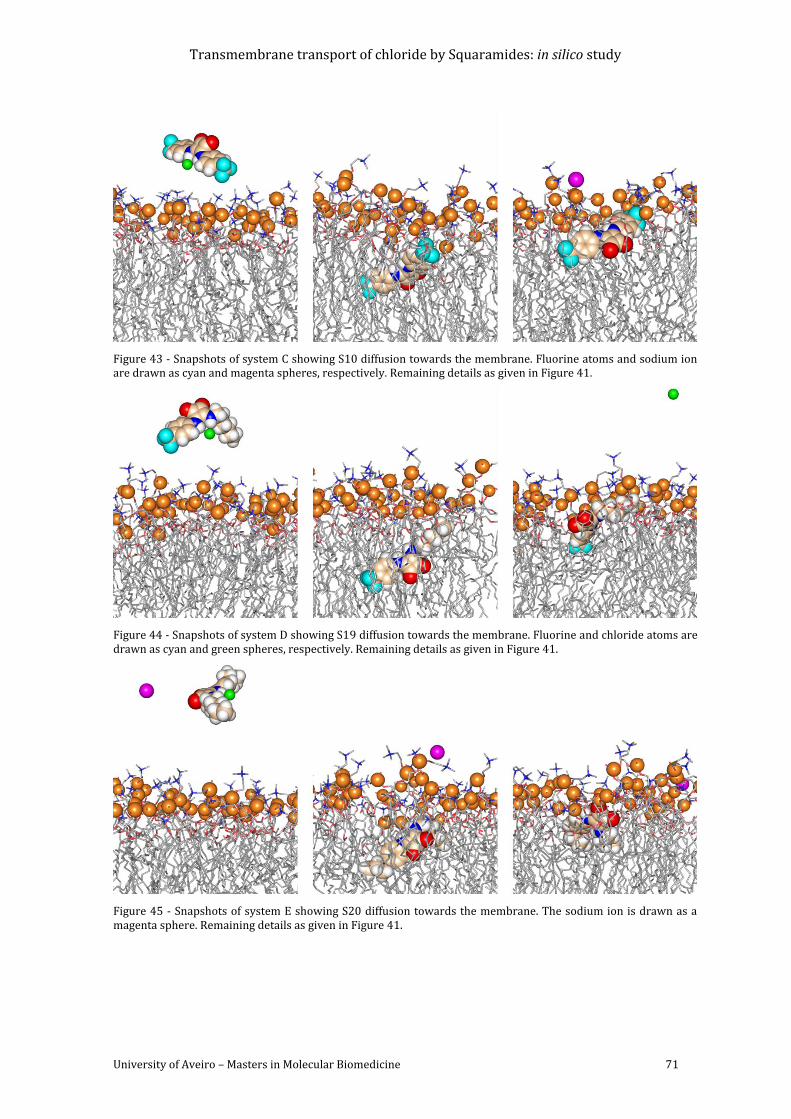
Transmembrane transport of chloride by Squaramides: in silico study
University of Aveiro – Masters in Molecular Biomedicine 71
Figure 43 - Snapshots of system C showing S10 diffusion towards the membrane. Fluorine atoms and sodium ion are drawn as cyan and magenta spheres, respectively. Remaining details as given in Figure 41.
Figure 44 - Snapshots of system D showing S19 diffusion towards the membrane. Fluorine and chloride atoms are drawn as cyan and green spheres, respectively. Remaining details as given in Figure 41.
Figure 45 - Snapshots of system E showing S20 diffusion towards the membrane. The sodium ion is drawn as a magenta sphere. Remaining details as given in Figure 41.
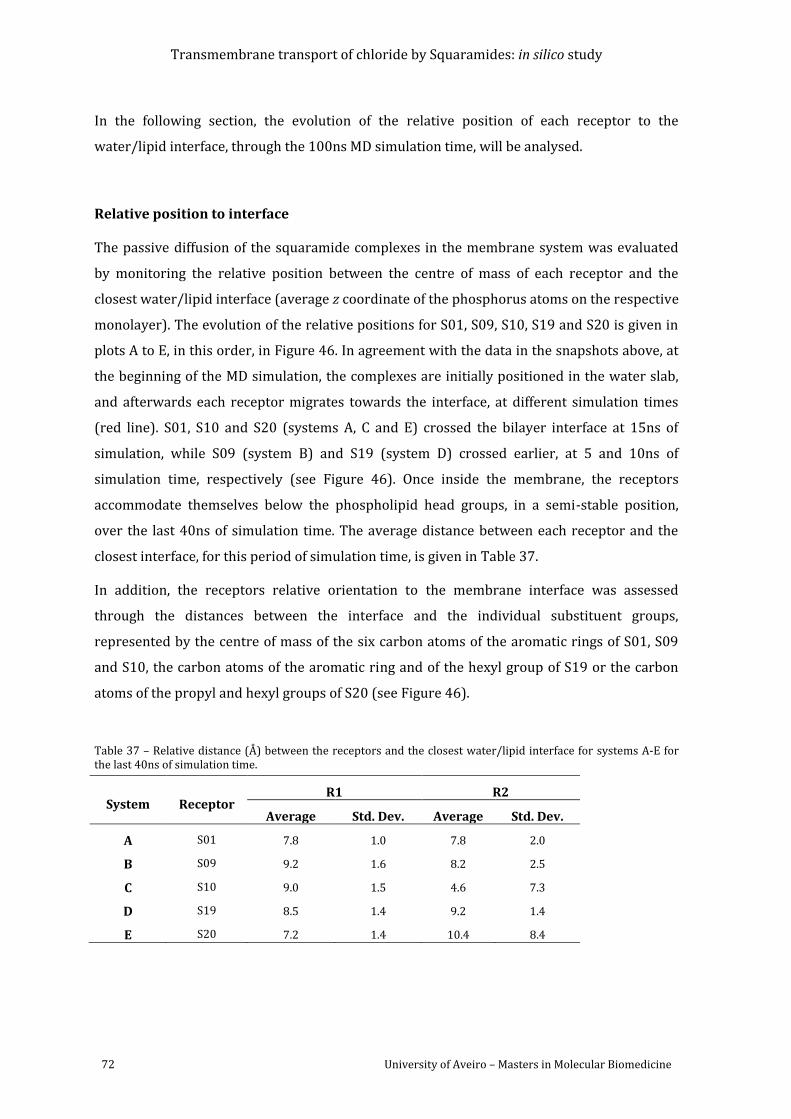
Transmembrane transport of chloride by Squaramides: in silico study
72 University of Aveiro – Masters in Molecular Biomedicine
In the following section, the evolution of the relative position of each receptor to the
water/lipid interface, through the 100ns MD simulation time, will be analysed.
Relative position to interface
The passive diffusion of the squaramide complexes in the membrane system was evaluated
by monitoring the relative position between the centre of mass of each receptor and the
closest water/lipid interface (average z coordinate of the phosphorus atoms on the respective
monolayer). The evolution of the relative positions for S01, S09, S10, S19 and S20 is given in
plots A to E, in this order, in Figure 46. In agreement with the data in the snapshots above, at
the beginning of the MD simulation, the complexes are initially positioned in the water slab,
and afterwards each receptor migrates towards the interface, at different simulation times
(red line). S01, S10 and S20 (systems A, C and E) crossed the bilayer interface at 15ns of
simulation, while S09 (system B) and S19 (system D) crossed earlier, at 5 and 10ns of
simulation time, respectively (see Figure 46). Once inside the membrane, the receptors
accommodate themselves below the phospholipid head groups, in a semi-stable position,
over the last 40ns of simulation time. The average distance between each receptor and the
closest interface, for this period of simulation time, is given in Table 37.
In addition, the receptors relative orientation to the membrane interface was assessed
through the distances between the interface and the individual substituent groups,
represented by the centre of mass of the six carbon atoms of the aromatic rings of S01, S09
and S10, the carbon atoms of the aromatic ring and of the hexyl group of S19 or the carbon
atoms of the propyl and hexyl groups of S20 (see Figure 46).
Table 37 – Relative distance (Å) between the receptors and the closest water/lipid interface for systems A-E for the last 40ns of simulation time.
System Receptor R1 R2
Average Std. Dev. Average Std. Dev.
A S01 7.8 1.0 7.8 2.0
B S09 9.2 1.6 8.2 2.5
C S10 9.0 1.5 4.6 7.3
D S19 8.5 1.4 9.2 1.4
E S20 7.2 1.4 10.4 8.4
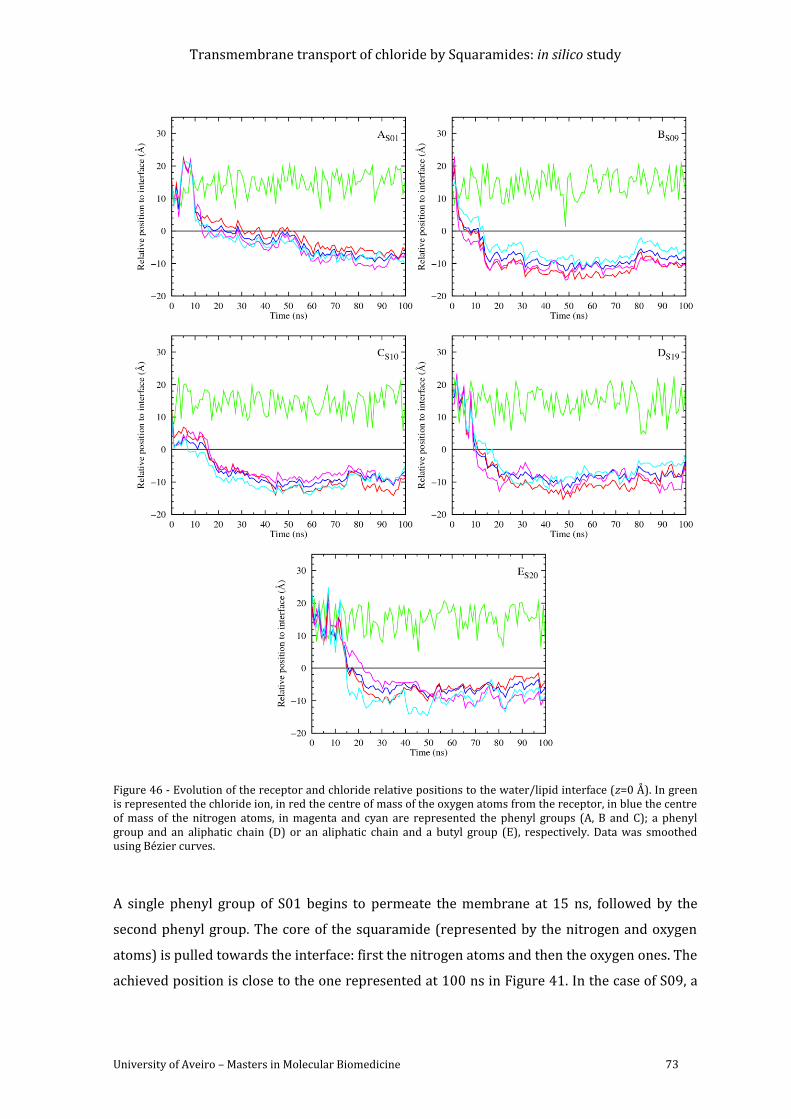
Transmembrane transport of chloride by Squaramides: in silico study
University of Aveiro – Masters in Molecular Biomedicine 73
Figure 46 - Evolution of the receptor and chloride relative positions to the water/lipid interface (z=0 Å). In green is represented the chloride ion, in red the centre of mass of the oxygen atoms from the receptor, in blue the centre of mass of the nitrogen atoms, in magenta and cyan are represented the phenyl groups (A, B and C); a phenyl group and an aliphatic chain (D) or an aliphatic chain and a butyl group (E), respectively. Data was smoothed using Bézier curves.
A single phenyl group of S01 begins to permeate the membrane at 15 ns, followed by the
second phenyl group. The core of the squaramide (represented by the nitrogen and oxygen
atoms) is pulled towards the interface: first the nitrogen atoms and then the oxygen ones. The
achieved position is close to the one represented at 100 ns in Figure 41. In the case of S09, a
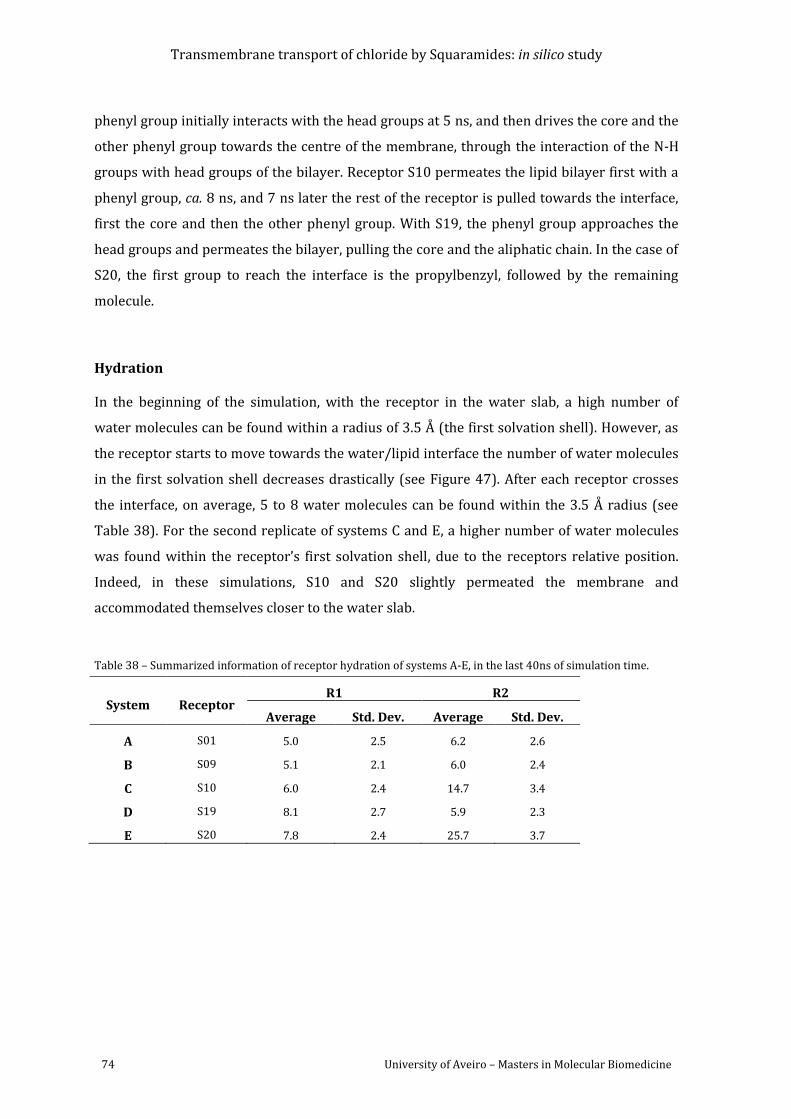
Transmembrane transport of chloride by Squaramides: in silico study
74 University of Aveiro – Masters in Molecular Biomedicine
phenyl group initially interacts with the head groups at 5 ns, and then drives the core and the
other phenyl group towards the centre of the membrane, through the interaction of the N-H
groups with head groups of the bilayer. Receptor S10 permeates the lipid bilayer first with a
phenyl group, ca. 8 ns, and 7 ns later the rest of the receptor is pulled towards the interface,
first the core and then the other phenyl group. With S19, the phenyl group approaches the
head groups and permeates the bilayer, pulling the core and the aliphatic chain. In the case of
S20, the first group to reach the interface is the propylbenzyl, followed by the remaining
molecule.
Hydration
In the beginning of the simulation, with the receptor in the water slab, a high number of
water molecules can be found within a radius of 3.5 Å (the first solvation shell). However, as
the receptor starts to move towards the water/lipid interface the number of water molecules
in the first solvation shell decreases drastically (see Figure 47). After each receptor crosses
the interface, on average, 5 to 8 water molecules can be found within the 3.5 Å radius (see
Table 38). For the second replicate of systems C and E, a higher number of water molecules
was found within the receptor’s first solvation shell, due to the receptors relative position.
Indeed, in these simulations, S10 and S20 slightly permeated the membrane and
accommodated themselves closer to the water slab.
Table 38 – Summarized information of receptor hydration of systems A-E, in the last 40ns of simulation time.
System Receptor R1 R2
Average Std. Dev. Average Std. Dev.
A S01 5.0 2.5 6.2 2.6
B S09 5.1 2.1 6.0 2.4
C S10 6.0 2.4 14.7 3.4
D S19 8.1 2.7 5.9 2.3
E S20 7.8 2.4 25.7 3.7
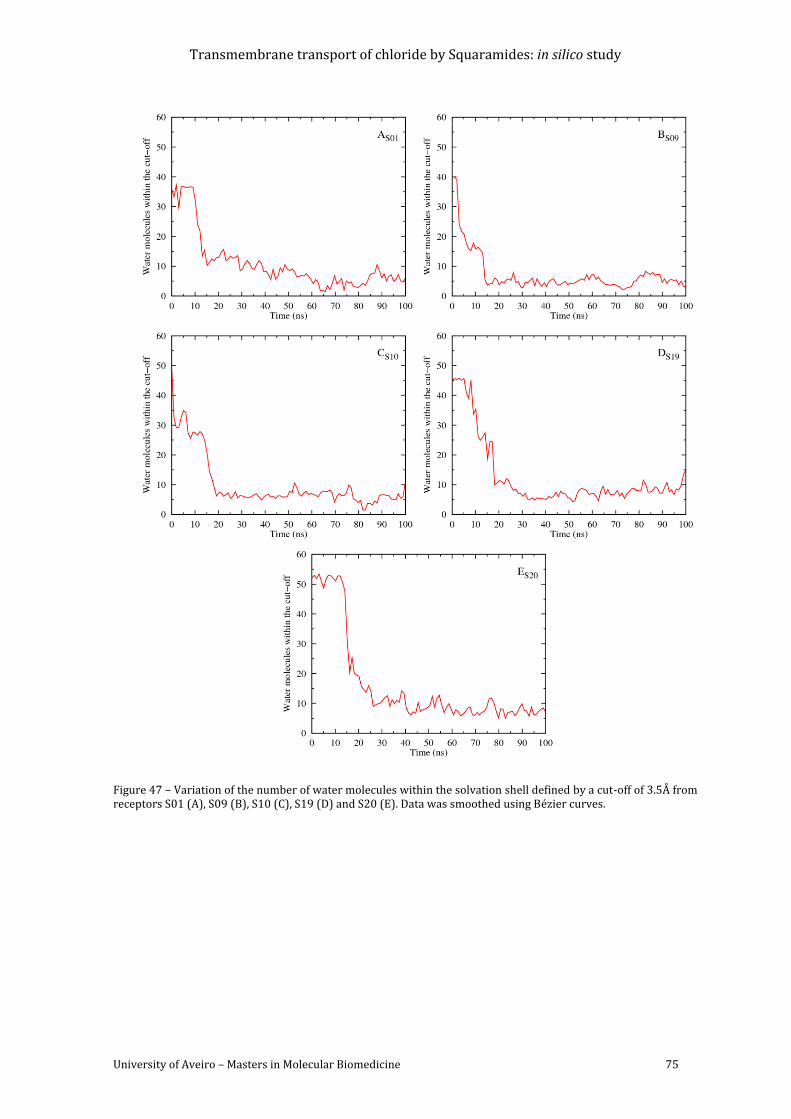
Transmembrane transport of chloride by Squaramides: in silico study
University of Aveiro – Masters in Molecular Biomedicine 75
Figure 47 – Variation of the number of water molecules within the solvation shell defined by a cut-off of 3.5Å from receptors S01 (A), S09 (B), S10 (C), S19 (D) and S20 (E). Data was smoothed using Bézier curves.
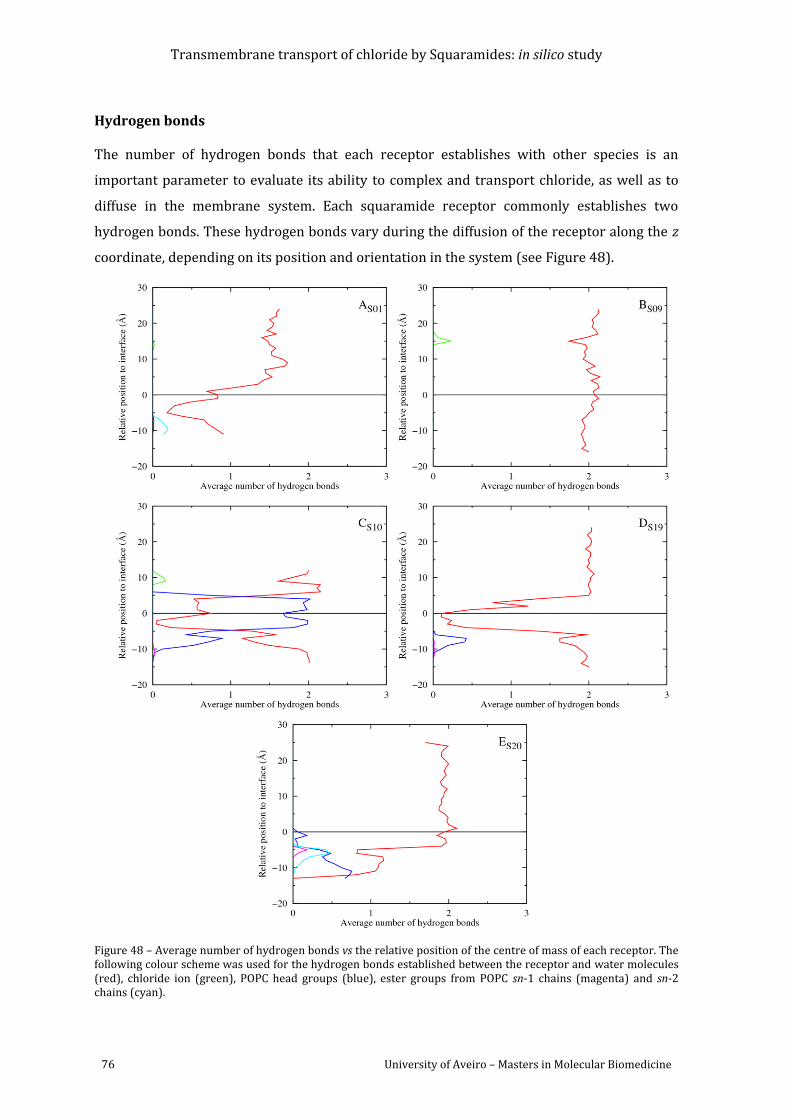
Transmembrane transport of chloride by Squaramides: in silico study
76 University of Aveiro – Masters in Molecular Biomedicine
Hydrogen bonds
The number of hydrogen bonds that each receptor establishes with other species is an
important parameter to evaluate its ability to complex and transport chloride, as well as to
diffuse in the membrane system. Each squaramide receptor commonly establishes two
hydrogen bonds. These hydrogen bonds vary during the diffusion of the receptor along the z
coordinate, depending on its position and orientation in the system (see Figure 48).
Figure 48 – Average number of hydrogen bonds vs the relative position of the centre of mass of each receptor. The following colour scheme was used for the hydrogen bonds established between the receptor and water molecules (red), chloride ion (green), POPC head groups (blue), ester groups from POPC sn-1 chains (magenta) and sn-2 chains (cyan).
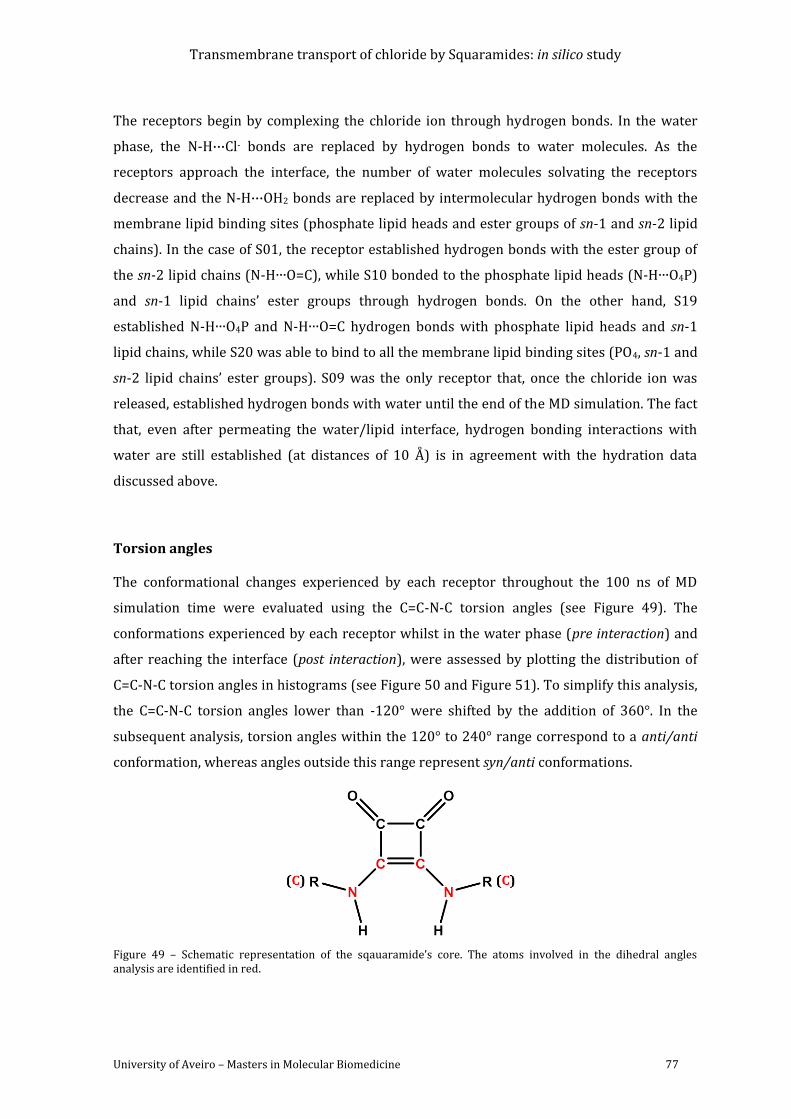
Transmembrane transport of chloride by Squaramides: in silico study
University of Aveiro – Masters in Molecular Biomedicine 77
The receptors begin by complexing the chloride ion through hydrogen bonds. In the water
phase, the N-H···Cl- bonds are replaced by hydrogen bonds to water molecules. As the
receptors approach the interface, the number of water molecules solvating the receptors
decrease and the N-H···OH2 bonds are replaced by intermolecular hydrogen bonds with the
membrane lipid binding sites (phosphate lipid heads and ester groups of sn-1 and sn-2 lipid
chains). In the case of S01, the receptor established hydrogen bonds with the ester group of
the sn-2 lipid chains (N-H∙∙∙O=C), while S10 bonded to the phosphate lipid heads (N-H∙∙∙O4P)
and sn-1 lipid chains’ ester groups through hydrogen bonds. On the other hand, S19
established N-H∙∙∙O4P and N-H∙∙∙O=C hydrogen bonds with phosphate lipid heads and sn-1
lipid chains, while S20 was able to bind to all the membrane lipid binding sites (PO4, sn-1 and
sn-2 lipid chains’ ester groups). S09 was the only receptor that, once the chloride ion was
released, established hydrogen bonds with water until the end of the MD simulation. The fact
that, even after permeating the water/lipid interface, hydrogen bonding interactions with
water are still established (at distances of 10 Å) is in agreement with the hydration data
discussed above.
Torsion angles
The conformational changes experienced by each receptor throughout the 100 ns of MD
simulation time were evaluated using the C=C-N-C torsion angles (see Figure 49). The
conformations experienced by each receptor whilst in the water phase (pre interaction) and
after reaching the interface (post interaction), were assessed by plotting the distribution of
C=C-N-C torsion angles in histograms (see Figure 50 and Figure 51). To simplify this analysis,
the C=C-N-C torsion angles lower than -120° were shifted by the addition of 360°. In the
subsequent analysis, torsion angles within the 120° to 240° range correspond to a anti/anti
conformation, whereas angles outside this range represent syn/anti conformations.
Figure 49 – Schematic representation of the sqauaramide’s core. The atoms involved in the dihedral angles analysis are identified in red.
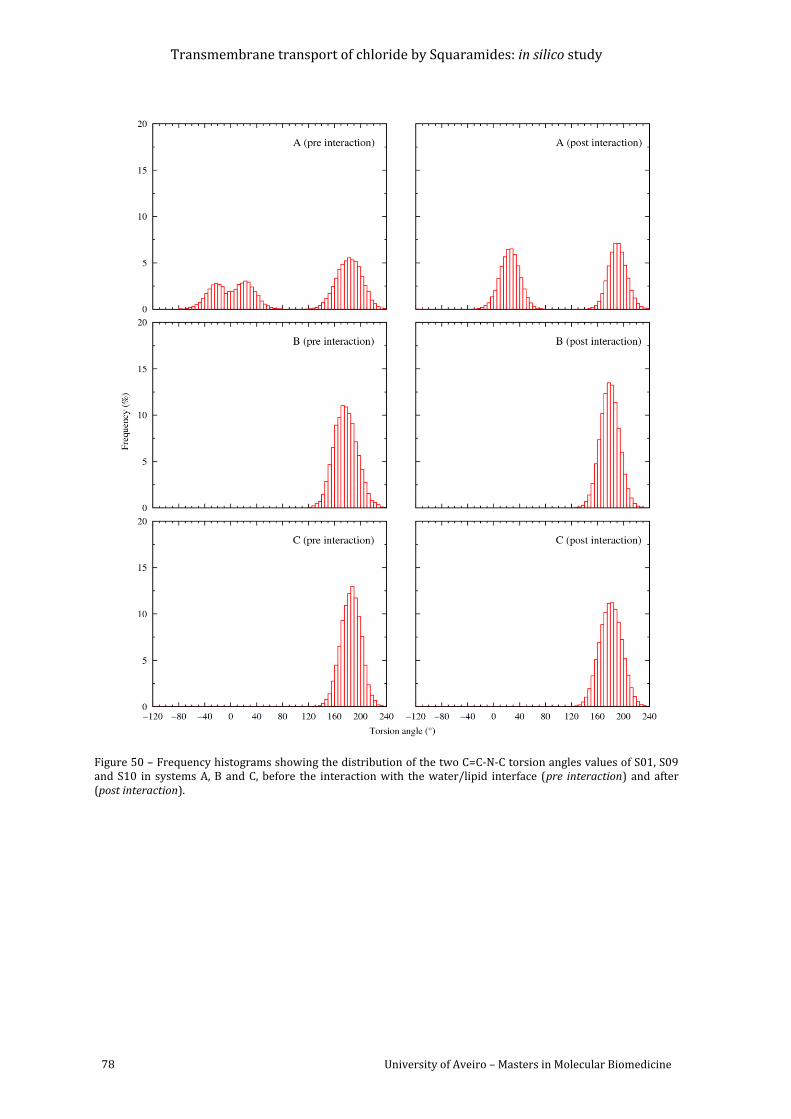
Transmembrane transport of chloride by Squaramides: in silico study
78 University of Aveiro – Masters in Molecular Biomedicine
Figure 50 – Frequency histograms showing the distribution of the two C=C-N-C torsion angles values of S01, S09 and S10 in systems A, B and C, before the interaction with the water/lipid interface (pre interaction) and after (post interaction).
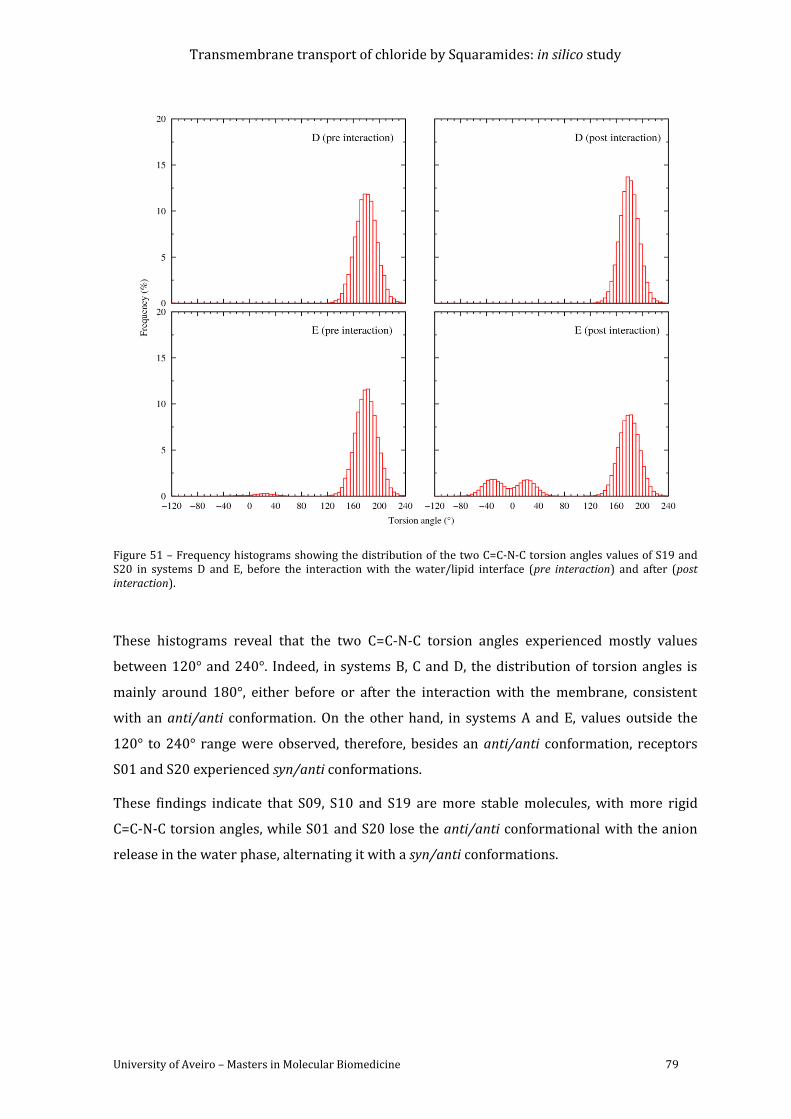
Transmembrane transport of chloride by Squaramides: in silico study
University of Aveiro – Masters in Molecular Biomedicine 79
Figure 51 – Frequency histograms showing the distribution of the two C=C-N-C torsion angles values of S19 and S20 in systems D and E, before the interaction with the water/lipid interface (pre interaction) and after (post interaction).
These histograms reveal that the two C=C-N-C torsion angles experienced mostly values
between 120° and 240°. Indeed, in systems B, C and D, the distribution of torsion angles is
mainly around 180°, either before or after the interaction with the membrane, consistent
with an anti/anti conformation. On the other hand, in systems A and E, values outside the
120° to 240° range were observed, therefore, besides an anti/anti conformation, receptors
S01 and S20 experienced syn/anti conformations.
These findings indicate that S09, S10 and S19 are more stable molecules, with more rigid
C=C-N-C torsion angles, while S01 and S20 lose the anti/anti conformational with the anion
release in the water phase, alternating it with a syn/anti conformations.
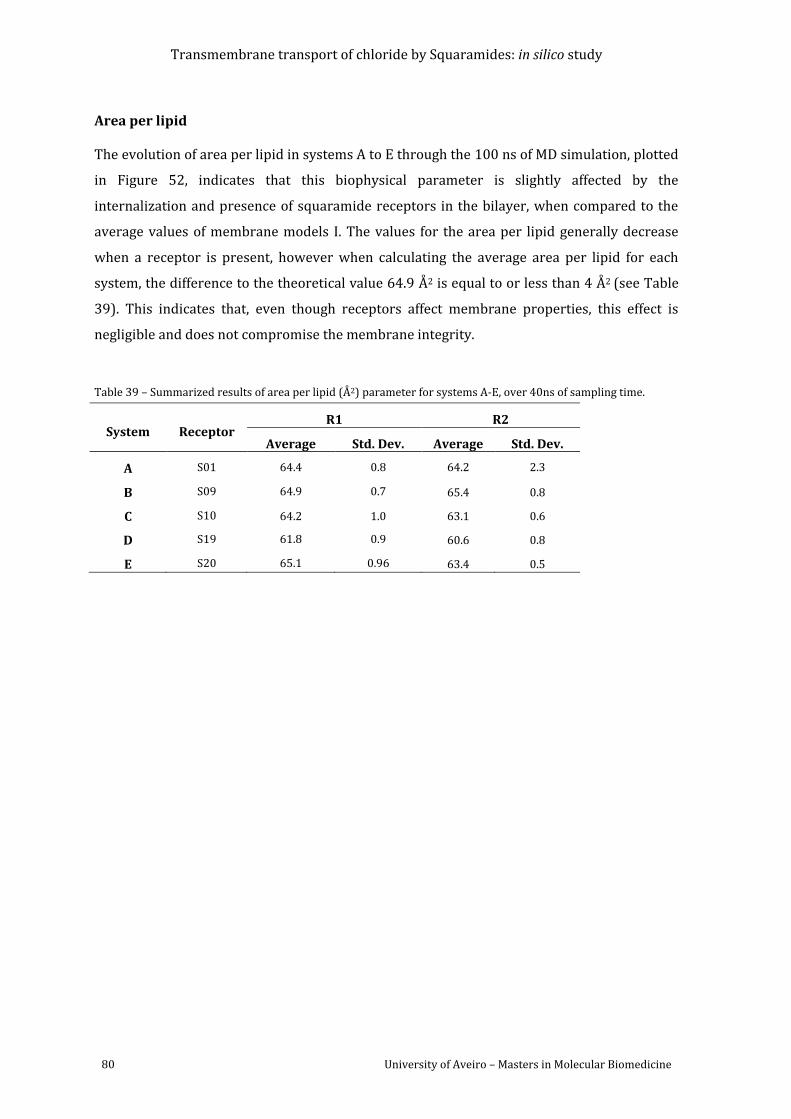
Transmembrane transport of chloride by Squaramides: in silico study
80 University of Aveiro – Masters in Molecular Biomedicine
Area per lipid
The evolution of area per lipid in systems A to E through the 100 ns of MD simulation, plotted
in Figure 52, indicates that this biophysical parameter is slightly affected by the
internalization and presence of squaramide receptors in the bilayer, when compared to the
average values of membrane models I. The values for the area per lipid generally decrease
when a receptor is present, however when calculating the average area per lipid for each
system, the difference to the theoretical value 64.9 Å2 is equal to or less than 4 Å2 (see Table
39). This indicates that, even though receptors affect membrane properties, this effect is
negligible and does not compromise the membrane integrity.
Table 39 – Summarized results of area per lipid (Å2) parameter for systems A-E, over 40ns of sampling time.
System Receptor R1 R2
Average Std. Dev. Average Std. Dev.
A S01 64.4 0.8 64.2 2.3
B S09 64.9 0.7 65.4 0.8
C S10 64.2 1.0 63.1 0.6
D S19 61.8 0.9 60.6 0.8
E S20 65.1 0.96 63.4 0.5
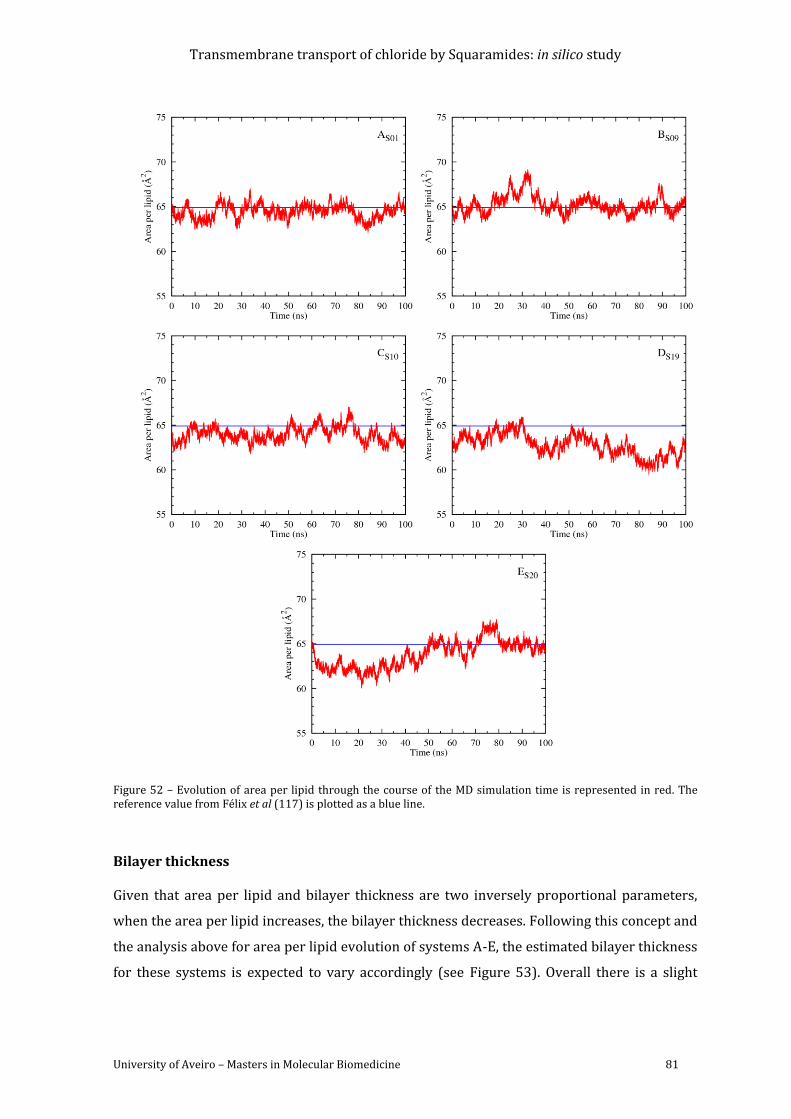
Transmembrane transport of chloride by Squaramides: in silico study
University of Aveiro – Masters in Molecular Biomedicine 81
Figure 52 – Evolution of area per lipid through the course of the MD simulation time is represented in red. The reference value from Félix et al (117) is plotted as a blue line.
Bilayer thickness
Given that area per lipid and bilayer thickness are two inversely proportional parameters,
when the area per lipid increases, the bilayer thickness decreases. Following this concept and
the analysis above for area per lipid evolution of systems A-E, the estimated bilayer thickness
for these systems is expected to vary accordingly (see Figure 53). Overall there is a slight
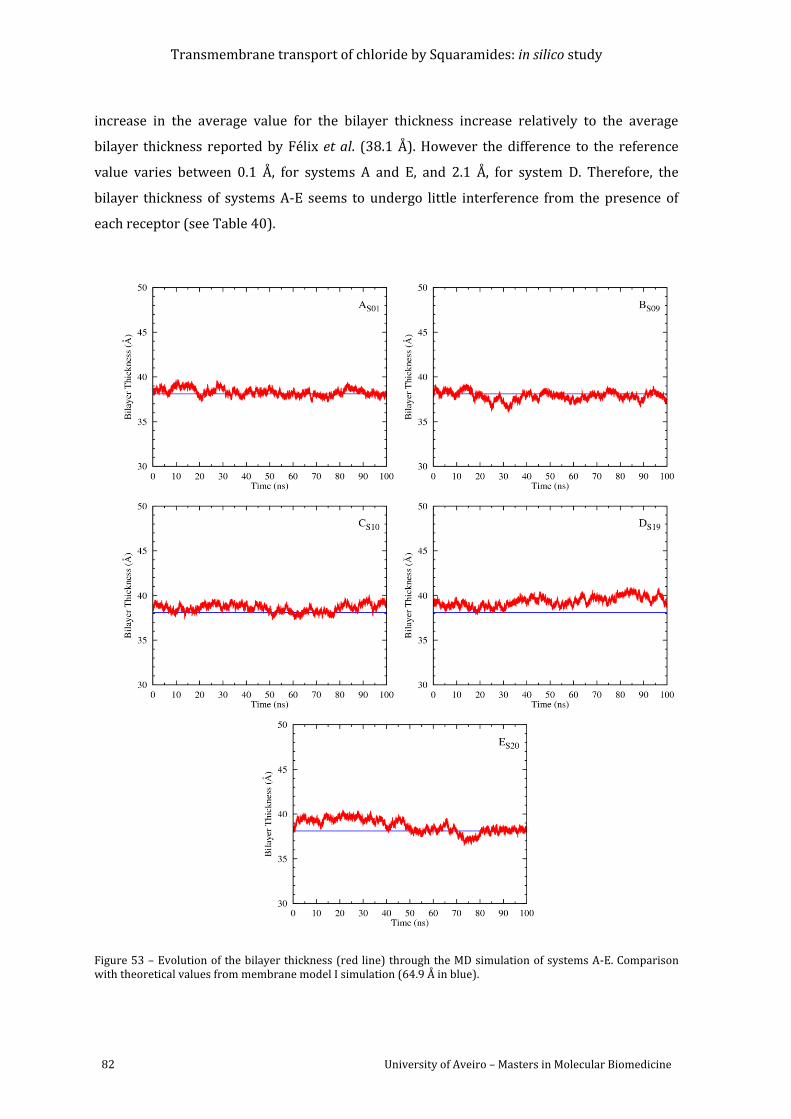
Transmembrane transport of chloride by Squaramides: in silico study
82 University of Aveiro – Masters in Molecular Biomedicine
increase in the average value for the bilayer thickness increase relatively to the average
bilayer thickness reported by Félix et al. (38.1 Å). However the difference to the reference
value varies between 0.1 Å, for systems A and E, and 2.1 Å, for system D. Therefore, the
bilayer thickness of systems A-E seems to undergo little interference from the presence of
each receptor (see Table 40).
Figure 53 – Evolution of the bilayer thickness (red line) through the MD simulation of systems A-E. Comparison with theoretical values from membrane model I simulation (64.9 Å in blue).
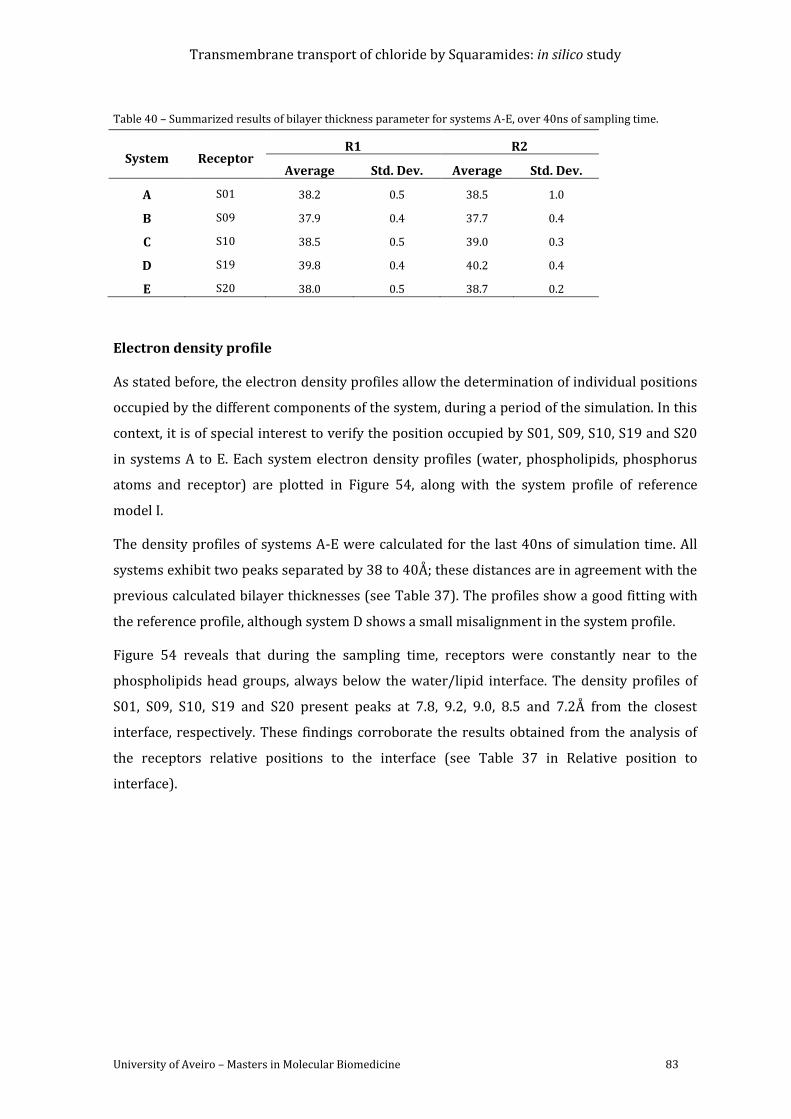
Transmembrane transport of chloride by Squaramides: in silico study
University of Aveiro – Masters in Molecular Biomedicine 83
Table 40 – Summarized results of bilayer thickness parameter for systems A-E, over 40ns of sampling time.
System Receptor R1 R2
Average Std. Dev. Average Std. Dev.
A S01 38.2 0.5 38.5 1.0
B S09 37.9 0.4 37.7 0.4
C S10 38.5 0.5 39.0 0.3
D S19 39.8 0.4 40.2 0.4
E S20 38.0 0.5 38.7 0.2
Electron density profile
As stated before, the electron density profiles allow the determination of individual positions
occupied by the different components of the system, during a period of the simulation. In this
context, it is of special interest to verify the position occupied by S01, S09, S10, S19 and S20
in systems A to E. Each system electron density profiles (water, phospholipids, phosphorus
atoms and receptor) are plotted in Figure 54, along with the system profile of reference
model I.
The density profiles of systems A-E were calculated for the last 40ns of simulation time. All
systems exhibit two peaks separated by 38 to 40Å; these distances are in agreement with the
previous calculated bilayer thicknesses (see Table 37). The profiles show a good fitting with
the reference profile, although system D shows a small misalignment in the system profile.
Figure 54 reveals that during the sampling time, receptors were constantly near to the
phospholipids head groups, always below the water/lipid interface. The density profiles of
S01, S09, S10, S19 and S20 present peaks at 7.8, 9.2, 9.0, 8.5 and 7.2Å from the closest
interface, respectively. These findings corroborate the results obtained from the analysis of
the receptors relative positions to the interface (see Table 37 in Relative position to
interface).
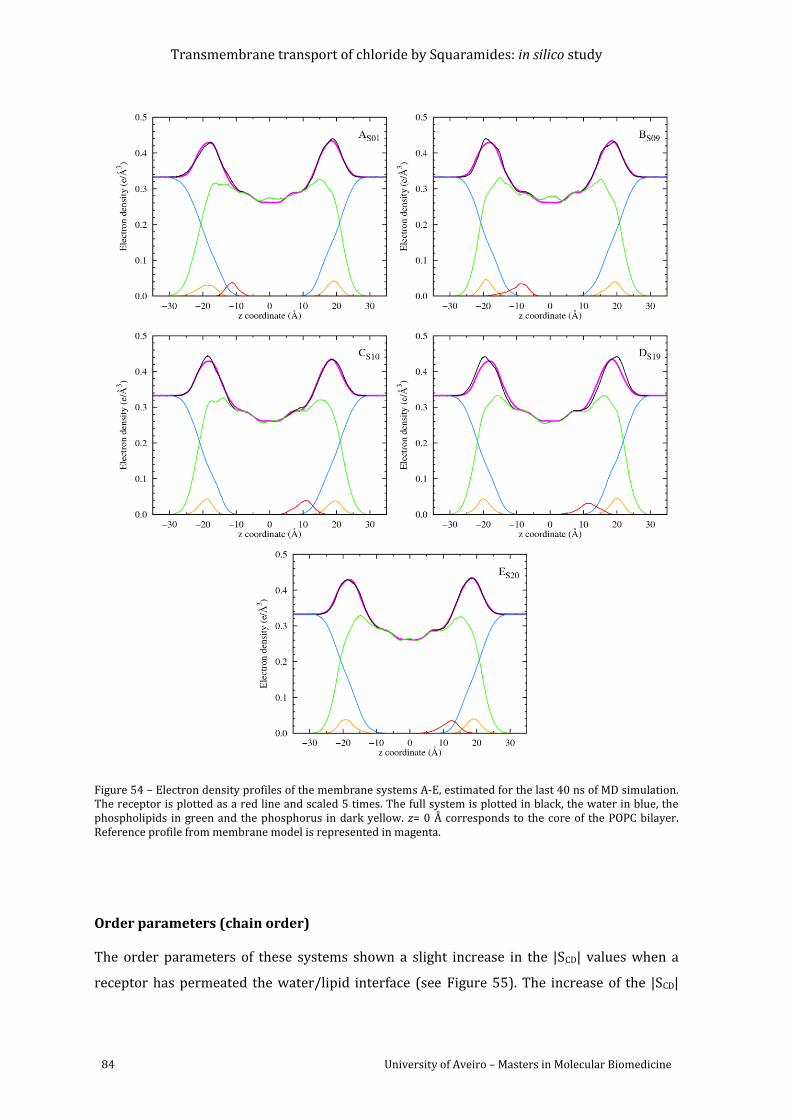
Transmembrane transport of chloride by Squaramides: in silico study
84 University of Aveiro – Masters in Molecular Biomedicine
Figure 54 – Electron density profiles of the membrane systems A-E, estimated for the last 40 ns of MD simulation. The receptor is plotted as a red line and scaled 5 times. The full system is plotted in black, the water in blue, the phospholipids in green and the phosphorus in dark yellow. z= 0 Å corresponds to the core of the POPC bilayer. Reference profile from membrane model is represented in magenta.
Order parameters (chain order)
The order parameters of these systems shown a slight increase in the |SCD| values when a
receptor has permeated the water/lipid interface (see Figure 55). The increase of the |SCD|
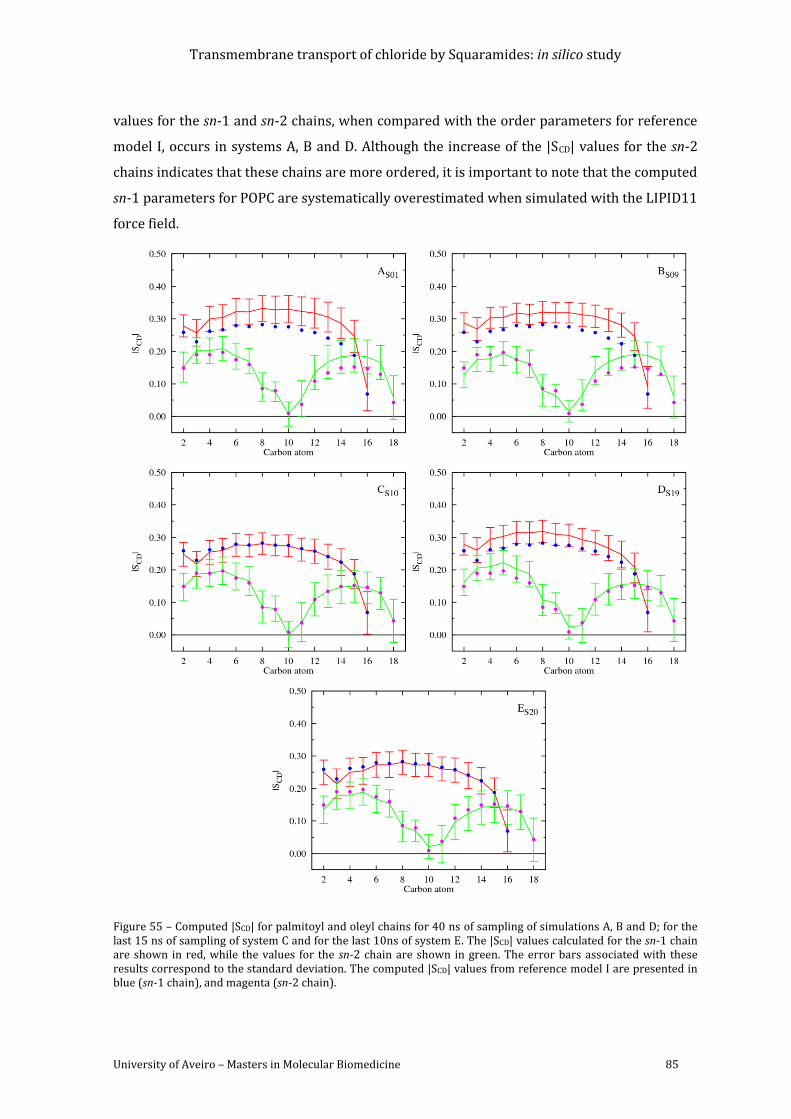
Transmembrane transport of chloride by Squaramides: in silico study
University of Aveiro – Masters in Molecular Biomedicine 85
values for the sn-1 and sn-2 chains, when compared with the order parameters for reference
model I, occurs in systems A, B and D. Although the increase of the |SCD| values for the sn-2
chains indicates that these chains are more ordered, it is important to note that the computed
sn-1 parameters for POPC are systematically overestimated when simulated with the LIPID11
force field.
Figure 55 – Computed |SCD| for palmitoyl and oleyl chains for 40 ns of sampling of simulations A, B and D; for the last 15 ns of sampling of system C and for the last 10ns of system E. The |SCD| values calculated for the sn-1 chain are shown in red, while the values for the sn-2 chain are shown in green. The error bars associated with these results correspond to the standard deviation. The computed |SCD| values from reference model I are presented in blue (sn-1 chain), and magenta (sn-2 chain).
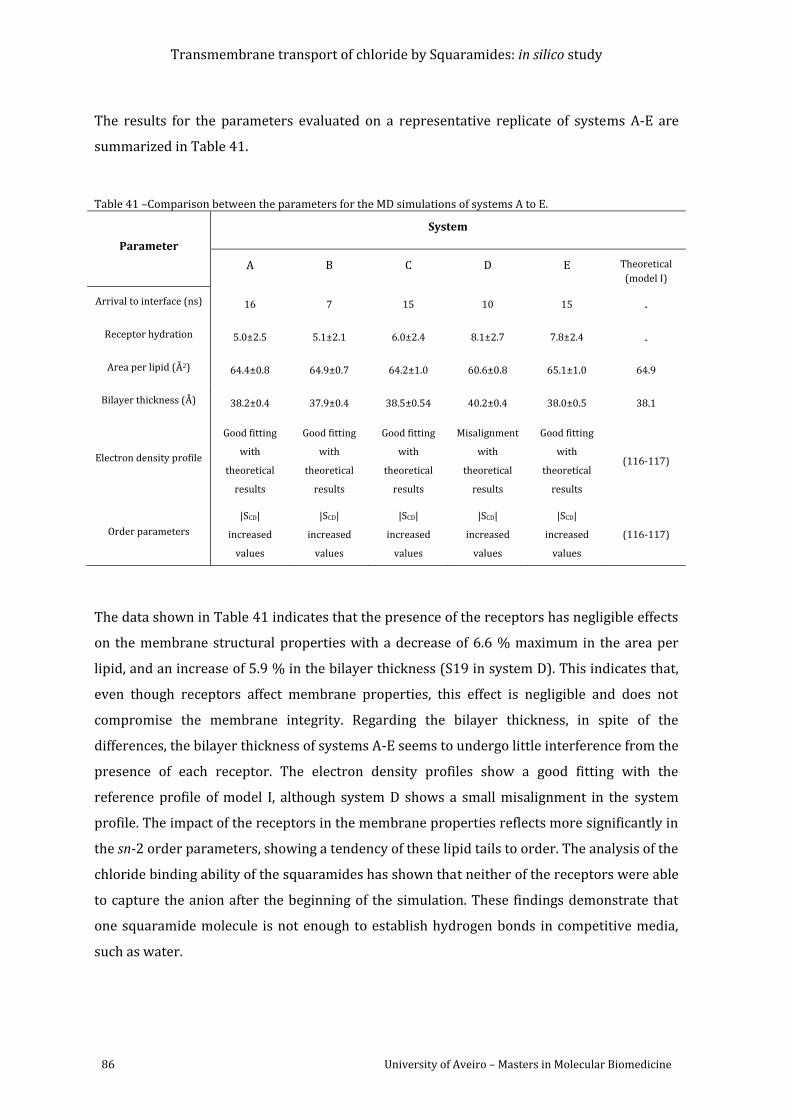
Transmembrane transport of chloride by Squaramides: in silico study
86 University of Aveiro – Masters in Molecular Biomedicine
The results for the parameters evaluated on a representative replicate of systems A-E are
summarized in Table 41.
Table 41 –Comparison between the parameters for the MD simulations of systems A to E.
Parameter
System
A B C D E Theoretical
(model I)
Arrival to interface (ns) 16 7 15 10 15 -
Receptor hydration 5.0±2.5 5.1±2.1 6.0±2.4 8.1±2.7 7.8±2.4 -
Area per lipid (Å2) 64.4±0.8 64.9±0.7 64.2±1.0 60.6±0.8 65.1±1.0 64.9
Bilayer thickness (Å) 38.2±0.4 37.9±0.4 38.5±0.54 40.2±0.4 38.0±0.5 38.1
Electron density profile
Good fitting
with
theoretical
results
Good fitting
with
theoretical
results
Good fitting
with
theoretical
results
Misalignment
with
theoretical
results
Good fitting
with
theoretical
results
(116-117)
Order parameters
|SCD|
increased
values
|SCD|
increased
values
|SCD|
increased
values
|SCD|
increased
values
|SCD|
increased
values
(116-117)
The data shown in Table 41 indicates that the presence of the receptors has negligible effects
on the membrane structural properties with a decrease of 6.6 % maximum in the area per
lipid, and an increase of 5.9 % in the bilayer thickness (S19 in system D). This indicates that,
even though receptors affect membrane properties, this effect is negligible and does not
compromise the membrane integrity. Regarding the bilayer thickness, in spite of the
differences, the bilayer thickness of systems A-E seems to undergo little interference from the
presence of each receptor. The electron density profiles show a good fitting with the
reference profile of model I, although system D shows a small misalignment in the system
profile. The impact of the receptors in the membrane properties reflects more significantly in
the sn-2 order parameters, showing a tendency of these lipid tails to order. The analysis of the
chloride binding ability of the squaramides has shown that neither of the receptors were able
to capture the anion after the beginning of the simulation. These findings demonstrate that
one squaramide molecule is not enough to establish hydrogen bonds in competitive media,
such as water.
Transmembrane transport of chloride by Squaramides: in silico study
University of Aveiro – Masters in Molecular Biomedicine 87
MD Simulations of the receptors starting from within the membrane 3.2.2.
Methodology
To simulate the systems F to J, membrane model II was used to place each chloride
association within the bilayer pore, using Packmol. Topology and coordinate files were
created using tLEaP. Systems F to J underwent a subsequent preparation stage followed by a
final multi-step simulation stage. The methodology used is similar to the one previously
described for pure membrane model II (see Section 3.1), with the exception for the applied
restraints.
In the preparation stage, restraints were applied to the POPC lipids, chloride complex and
sodium ion (500 kcal/mol Å2), while the water molecules, chloride complex and sodium ion
were restrained in the following minimization step (500 kcal/molÅ2). Restrains were
removed and the full system was minimized. During the NVT MD run, at 303 K, weak
restraints of 10 kcal/mol Å2 were applied to the chloride association to maintain the complex
relative position. At the end of this stage the pore was closed.
The preparation stage is followed by a multi-stage simulation, in which the system is equally
minimized and heated under the same simulation conditions as the systems A-E. This is
followed by an equilibration run of 5 ns in an NPγT ensemble, using a surface tension of 17
dyn/cm and weak restraints (5 kcal/mol Å2) on the chloride association complex. The
restraints were then removed and the system was subjected to 100 ns of production run. Two
replicates were performed with the CUDA versions of the PMEMD executable.
Results and Discussion
Initial and final snapshots
As for the simulations with the receptors in the water phase, two replictaes were also
performed for simulations with the receptors within the bilayer core. All replicates follow an
equivalent behaviour to the ones illustrated and the results can be consulted in Appendix 1.
Figures 60-64 present three snapshots illustrating the different positions of each chloride
complex over the 100ns of MD simulation. Complexes were placed within the bilayer core. All
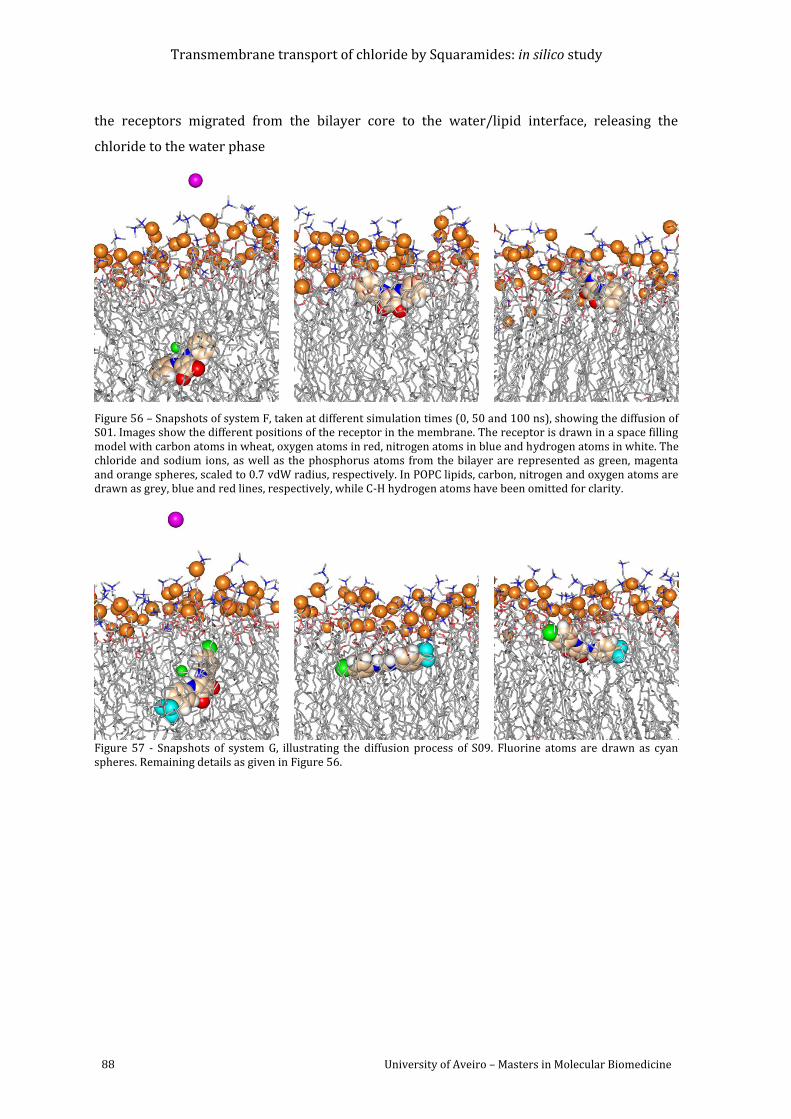
Transmembrane transport of chloride by Squaramides: in silico study
88 University of Aveiro – Masters in Molecular Biomedicine
the receptors migrated from the bilayer core to the water/lipid interface, releasing the
chloride to the water phase
Figure 56 – Snapshots of system F, taken at different simulation times (0, 50 and 100 ns), showing the diffusion of S01. Images show the different positions of the receptor in the membrane. The receptor is drawn in a space filling model with carbon atoms in wheat, oxygen atoms in red, nitrogen atoms in blue and hydrogen atoms in white. The chloride and sodium ions, as well as the phosphorus atoms from the bilayer are represented as green, magenta and orange spheres, scaled to 0.7 vdW radius, respectively. In POPC lipids, carbon, nitrogen and oxygen atoms are drawn as grey, blue and red lines, respectively, while C-H hydrogen atoms have been omitted for clarity.
Figure 57 - Snapshots of system G, illustrating the diffusion process of S09. Fluorine atoms are drawn as cyan spheres. Remaining details as given in Figure 56.
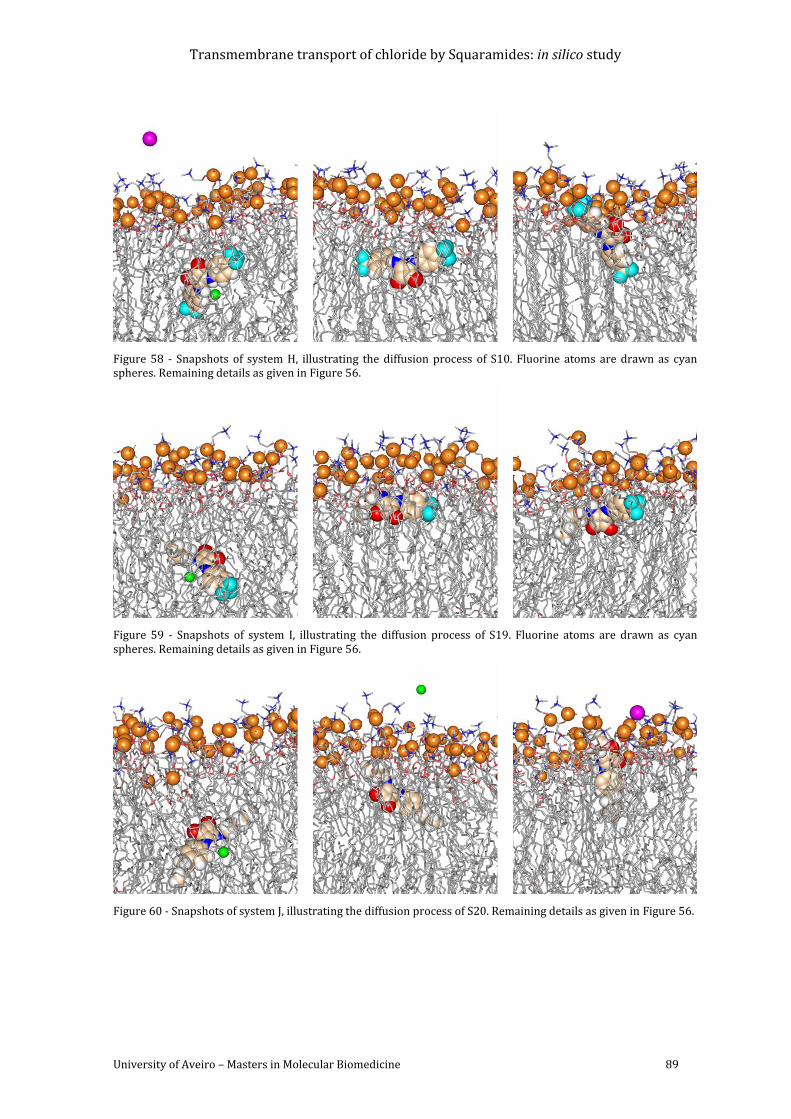
Transmembrane transport of chloride by Squaramides: in silico study
University of Aveiro – Masters in Molecular Biomedicine 89
Figure 58 - Snapshots of system H, illustrating the diffusion process of S10. Fluorine atoms are drawn as cyan spheres. Remaining details as given in Figure 56.
Figure 59 - Snapshots of system I, illustrating the diffusion process of S19. Fluorine atoms are drawn as cyan spheres. Remaining details as given in Figure 56.
Figure 60 - Snapshots of system J, illustrating the diffusion process of S20. Remaining details as given in Figure 56.
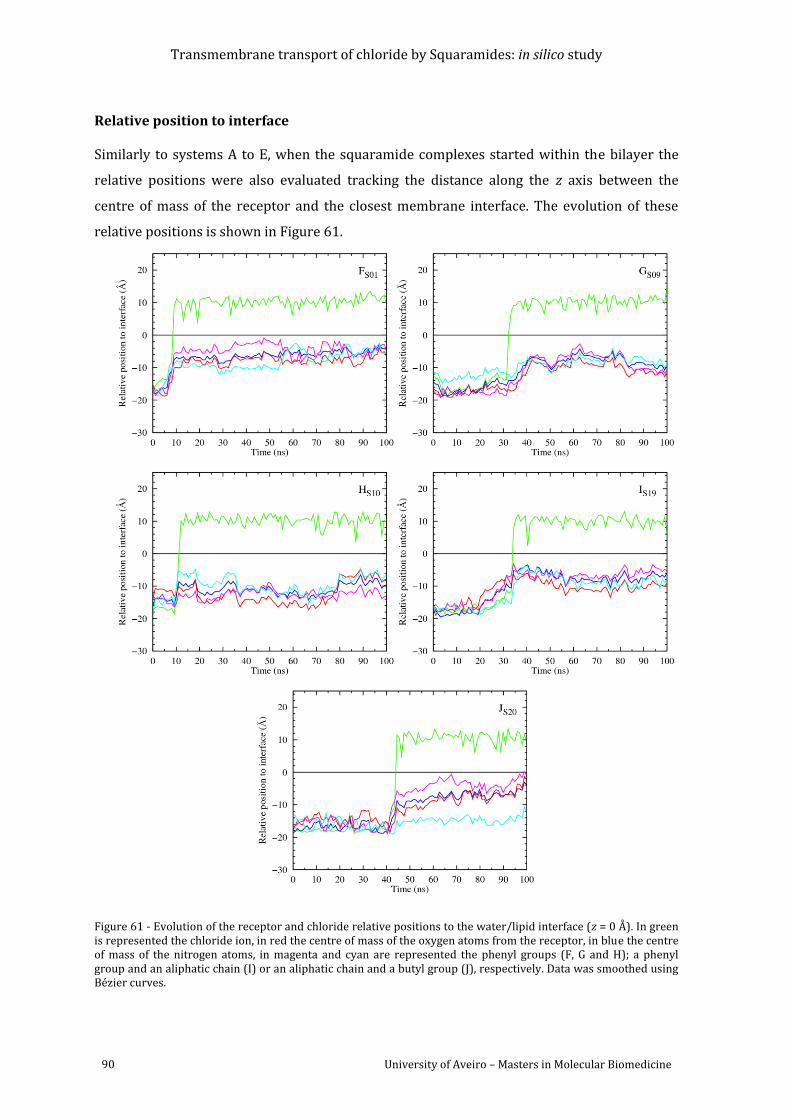
Transmembrane transport of chloride by Squaramides: in silico study
90 University of Aveiro – Masters in Molecular Biomedicine
Relative position to interface
Similarly to systems A to E, when the squaramide complexes started within the bilayer the
relative positions were also evaluated tracking the distance along the z axis between the
centre of mass of the receptor and the closest membrane interface. The evolution of these
relative positions is shown in Figure 61.
Figure 61 - Evolution of the receptor and chloride relative positions to the water/lipid interface (z = 0 Å). In green is represented the chloride ion, in red the centre of mass of the oxygen atoms from the receptor, in blue the centre of mass of the nitrogen atoms, in magenta and cyan are represented the phenyl groups (F, G and H); a phenyl group and an aliphatic chain (I) or an aliphatic chain and a butyl group (J), respectively. Data was smoothed using Bézier curves.
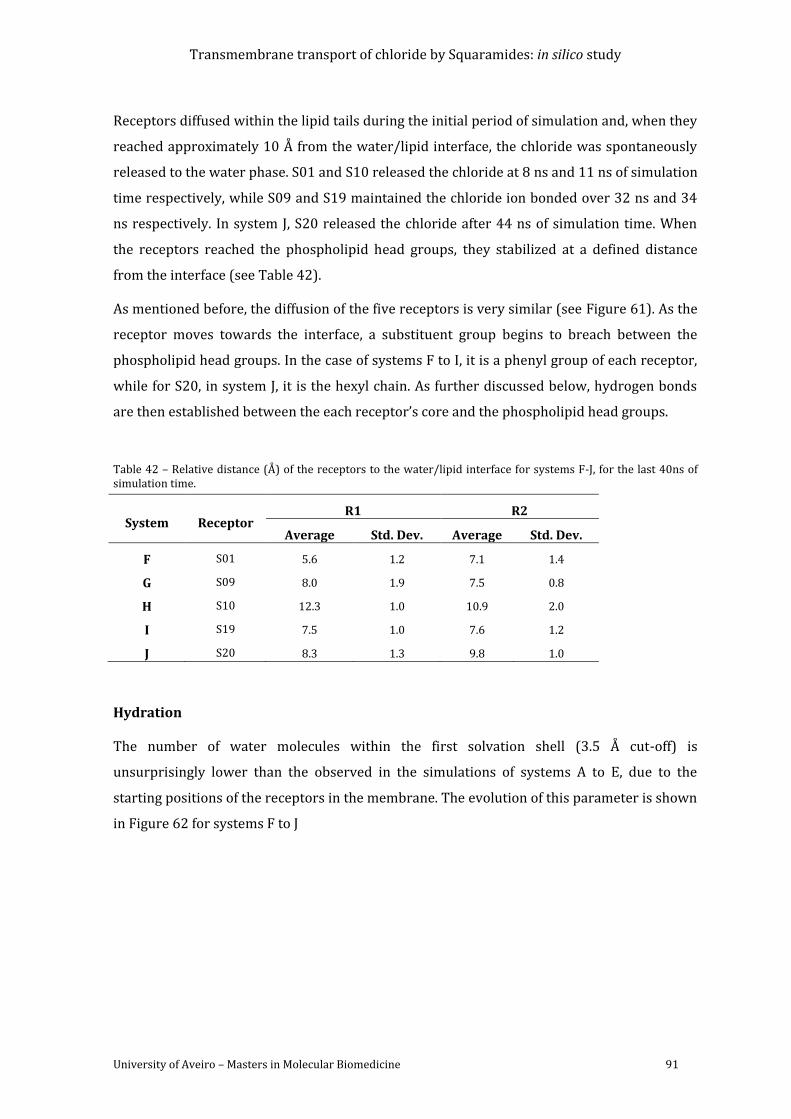
Transmembrane transport of chloride by Squaramides: in silico study
University of Aveiro – Masters in Molecular Biomedicine 91
Receptors diffused within the lipid tails during the initial period of simulation and, when they
reached approximately 10 Å from the water/lipid interface, the chloride was spontaneously
released to the water phase. S01 and S10 released the chloride at 8 ns and 11 ns of simulation
time respectively, while S09 and S19 maintained the chloride ion bonded over 32 ns and 34
ns respectively. In system J, S20 released the chloride after 44 ns of simulation time. When
the receptors reached the phospholipid head groups, they stabilized at a defined distance
from the interface (see Table 42).
As mentioned before, the diffusion of the five receptors is very similar (see Figure 61). As the
receptor moves towards the interface, a substituent group begins to breach between the
phospholipid head groups. In the case of systems F to I, it is a phenyl group of each receptor,
while for S20, in system J, it is the hexyl chain. As further discussed below, hydrogen bonds
are then established between the each receptor’s core and the phospholipid head groups.
Table 42 – Relative distance (Å) of the receptors to the water/lipid interface for systems F-J, for the last 40ns of simulation time.
System Receptor R1 R2
Average Std. Dev. Average Std. Dev.
F S01 5.6 1.2 7.1 1.4
G S09 8.0 1.9 7.5 0.8
H S10 12.3 1.0 10.9 2.0
I S19 7.5 1.0 7.6 1.2
J S20 8.3 1.3 9.8 1.0
Hydration
The number of water molecules within the first solvation shell (3.5 Å cut-off) is
unsurprisingly lower than the observed in the simulations of systems A to E, due to the
starting positions of the receptors in the membrane. The evolution of this parameter is shown
in Figure 62 for systems F to J
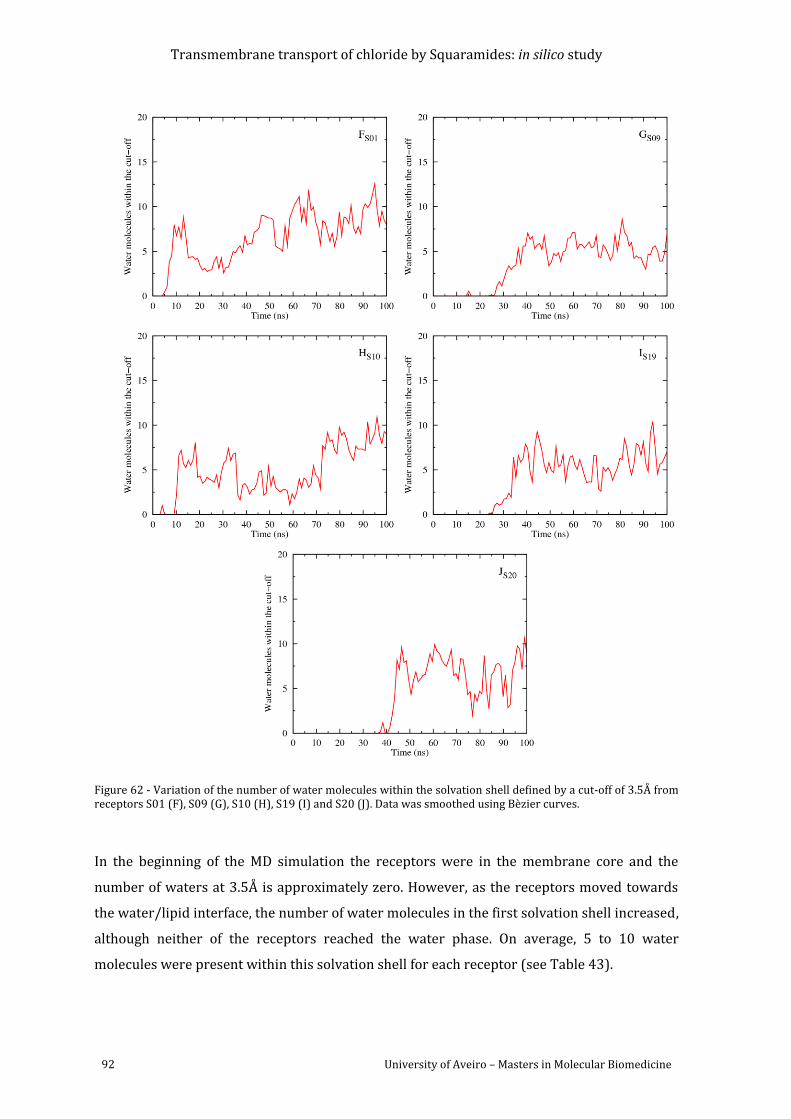
Transmembrane transport of chloride by Squaramides: in silico study
92 University of Aveiro – Masters in Molecular Biomedicine
Figure 62 - Variation of the number of water molecules within the solvation shell defined by a cut-off of 3.5Å from receptors S01 (F), S09 (G), S10 (H), S19 (I) and S20 (J). Data was smoothed using Bèzier curves.
In the beginning of the MD simulation the receptors were in the membrane core and the
number of waters at 3.5Å is approximately zero. However, as the receptors moved towards
the water/lipid interface, the number of water molecules in the first solvation shell increased,
although neither of the receptors reached the water phase. On average, 5 to 10 water
molecules were present within this solvation shell for each receptor (see Table 43).
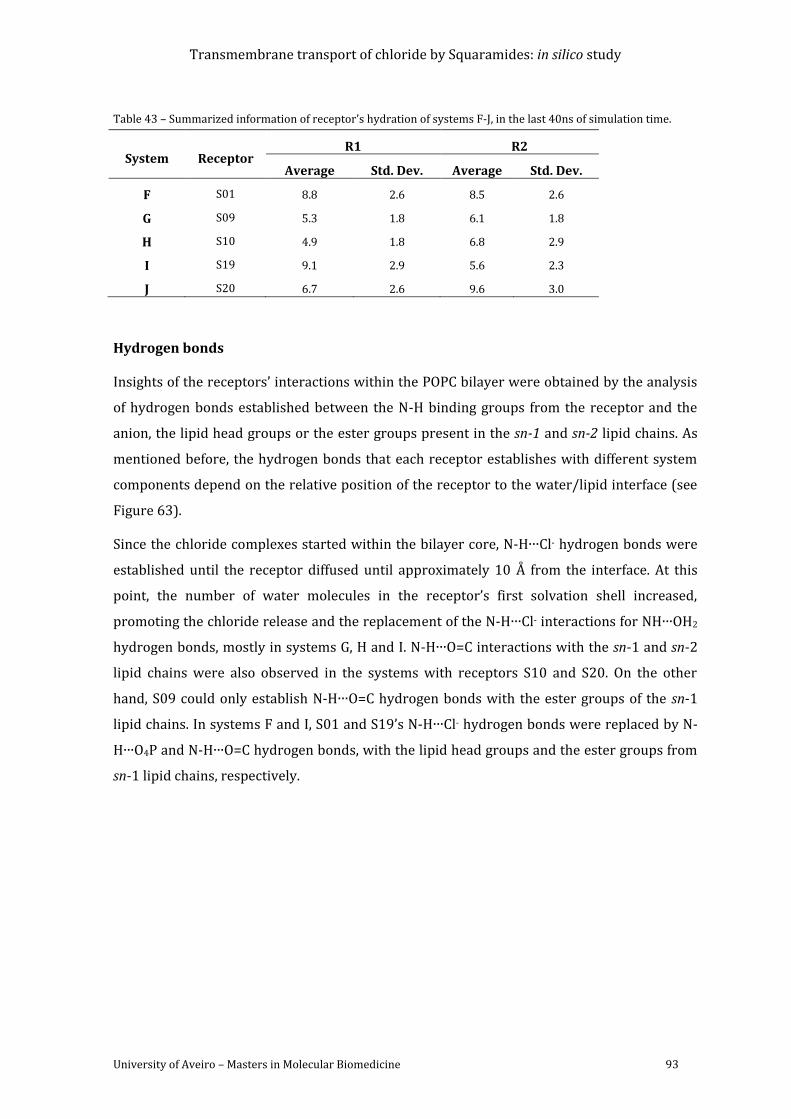
Transmembrane transport of chloride by Squaramides: in silico study
University of Aveiro – Masters in Molecular Biomedicine 93
Table 43 – Summarized information of receptor’s hydration of systems F-J, in the last 40ns of simulation time.
System Receptor R1 R2
Average Std. Dev. Average Std. Dev.
F S01 8.8 2.6 8.5 2.6
G S09 5.3 1.8 6.1 1.8
H S10 4.9 1.8 6.8 2.9
I S19 9.1 2.9 5.6 2.3
J S20 6.7 2.6 9.6 3.0
Hydrogen bonds
Insights of the receptors’ interactions within the POPC bilayer were obtained by the analysis
of hydrogen bonds established between the N-H binding groups from the receptor and the
anion, the lipid head groups or the ester groups present in the sn-1 and sn-2 lipid chains. As
mentioned before, the hydrogen bonds that each receptor establishes with different system
components depend on the relative position of the receptor to the water/lipid interface (see
Figure 63).
Since the chloride complexes started within the bilayer core, N-H∙∙∙Cl- hydrogen bonds were
established until the receptor diffused until approximately 10 Å from the interface. At this
point, the number of water molecules in the receptor’s first solvation shell increased,
promoting the chloride release and the replacement of the N-H∙∙∙Cl- interactions for NH∙∙∙OH2
hydrogen bonds, mostly in systems G, H and I. N-H∙∙∙O=C interactions with the sn-1 and sn-2
lipid chains were also observed in the systems with receptors S10 and S20. On the other
hand, S09 could only establish N-H∙∙∙O=C hydrogen bonds with the ester groups of the sn-1
lipid chains. In systems F and I, S01 and S19’s N-H∙∙∙Cl- hydrogen bonds were replaced by N-
H∙∙∙O4P and N-H∙∙∙O=C hydrogen bonds, with the lipid head groups and the ester groups from
sn-1 lipid chains, respectively.
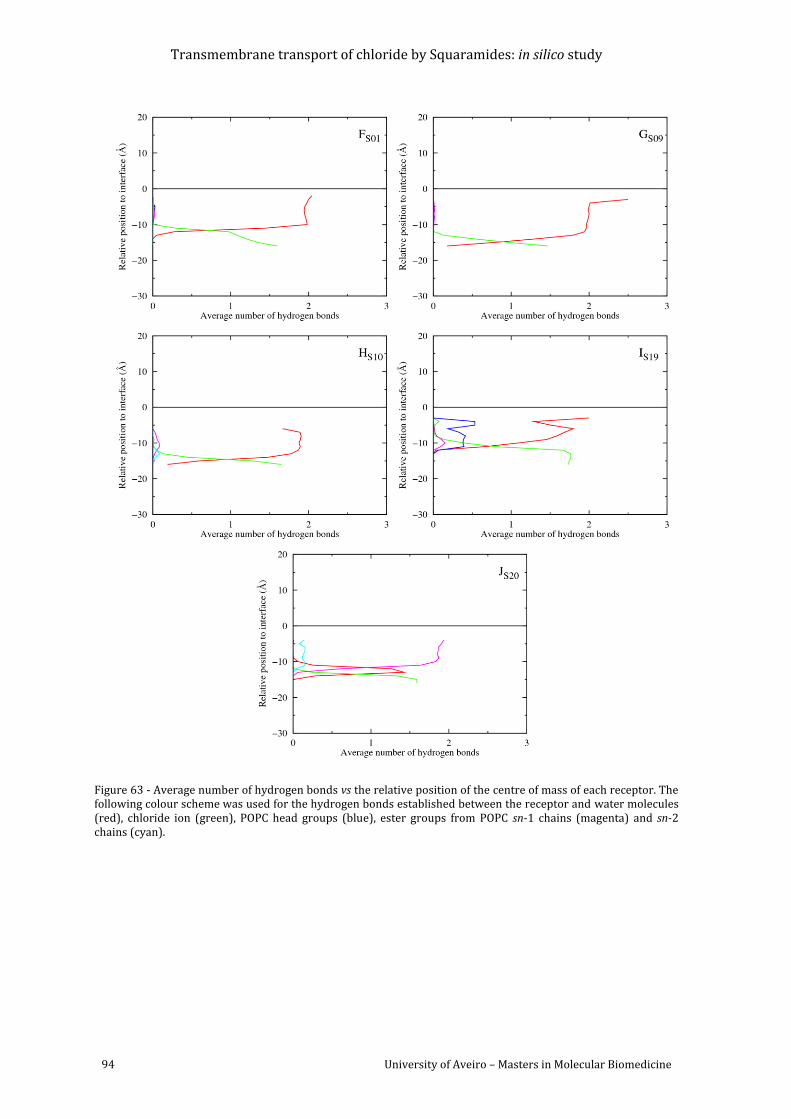
Transmembrane transport of chloride by Squaramides: in silico study
94 University of Aveiro – Masters in Molecular Biomedicine
Figure 63 - Average number of hydrogen bonds vs the relative position of the centre of mass of each receptor. The following colour scheme was used for the hydrogen bonds established between the receptor and water molecules (red), chloride ion (green), POPC head groups (blue), ester groups from POPC sn-1 chains (magenta) and sn-2 chains (cyan).
Transmembrane transport of chloride by Squaramides: in silico study
University of Aveiro – Masters in Molecular Biomedicine 95
Torsion angles
The conformational changes experienced by each receptor throughout the 100 ns of MD
simulation time were evaluated using the C=C-N-C torsion angles (see Figure 49). The
conformational changes experienced by each receptor within the bilayer, before or after the
chloride release are equivalent. Therefore, the distribution of C=C-N-C torsion angles for the
100 ns simulation is plotted in the histograms of Figure 64. The negative C=C-N-C torsion
angles lower than -120° were shifted by the addition of 360°. In the subsequent analysis,
torsion angles within the 120° to 240° range correspond to an anti/anti conformation
consistent with chloride bonding.
As mentioned before, squaramides are naturally rigid molecules and the POPC bilayer is a
highly packed medium. Considering both conditions, the conformational freedom of the
receptors is limited and the initial anti/anti conformation is preserved during the simulation
time in all systems.
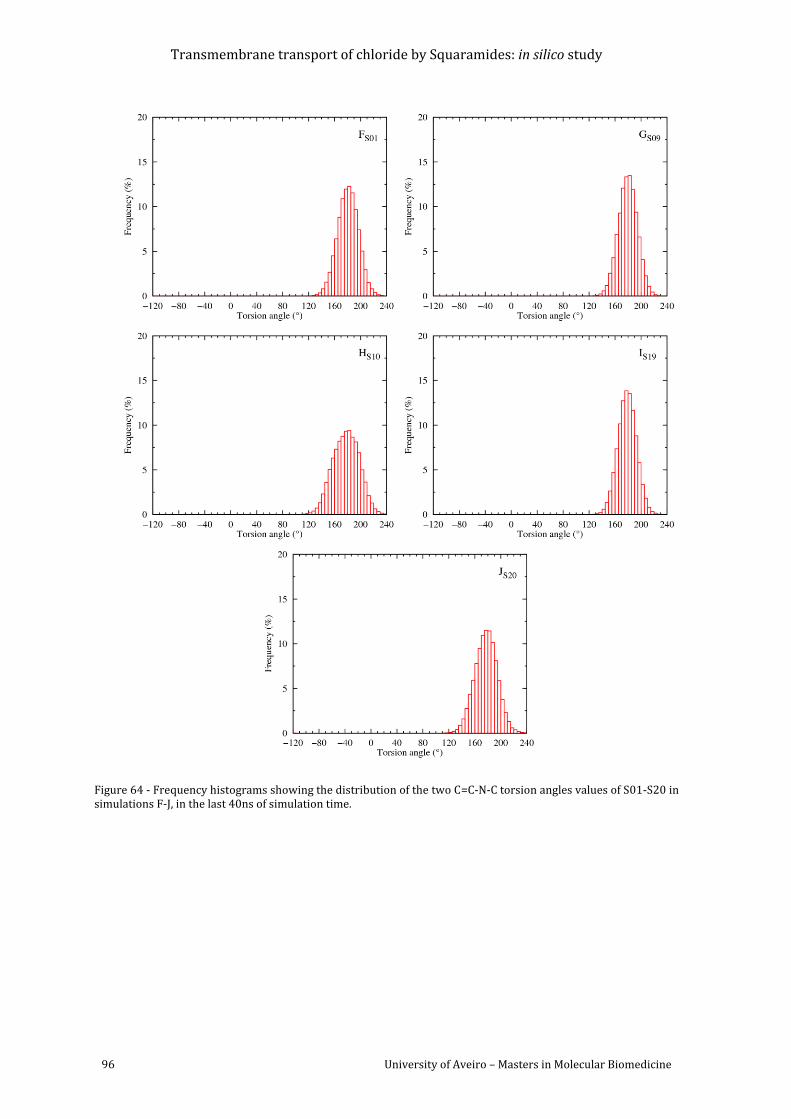
Transmembrane transport of chloride by Squaramides: in silico study
96 University of Aveiro – Masters in Molecular Biomedicine
Figure 64 - Frequency histograms showing the distribution of the two C=C-N-C torsion angles values of S01-S20 in simulations F-J, in the last 40ns of simulation time.
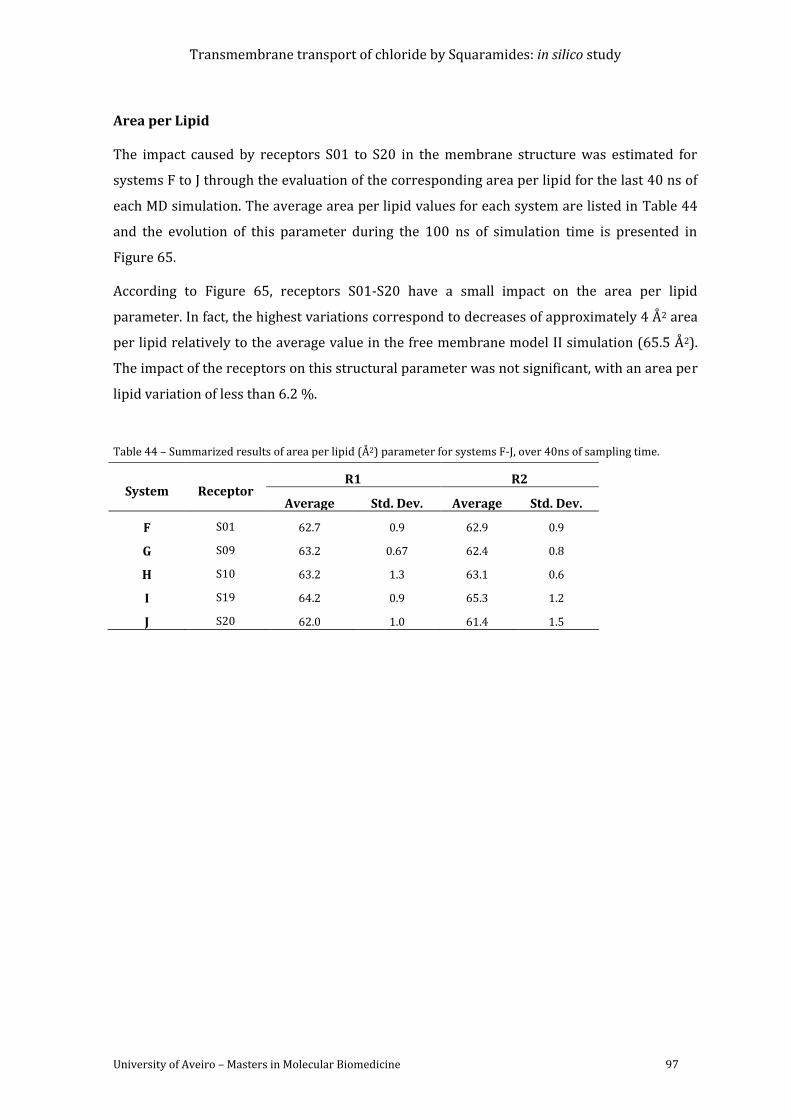
Transmembrane transport of chloride by Squaramides: in silico study
University of Aveiro – Masters in Molecular Biomedicine 97
Area per Lipid
The impact caused by receptors S01 to S20 in the membrane structure was estimated for
systems F to J through the evaluation of the corresponding area per lipid for the last 40 ns of
each MD simulation. The average area per lipid values for each system are listed in Table 44
and the evolution of this parameter during the 100 ns of simulation time is presented in
Figure 65.
According to Figure 65, receptors S01-S20 have a small impact on the area per lipid
parameter. In fact, the highest variations correspond to decreases of approximately 4 Å2 area
per lipid relatively to the average value in the free membrane model II simulation (65.5 Å2).
The impact of the receptors on this structural parameter was not significant, with an area per
lipid variation of less than 6.2 %.
Table 44 – Summarized results of area per lipid (Å2) parameter for systems F-J, over 40ns of sampling time.
System Receptor R1 R2
Average Std. Dev. Average Std. Dev.
F S01 62.7 0.9 62.9 0.9
G S09 63.2 0.67 62.4 0.8
H S10 63.2 1.3 63.1 0.6
I S19 64.2 0.9 65.3 1.2
J S20 62.0 1.0 61.4 1.5
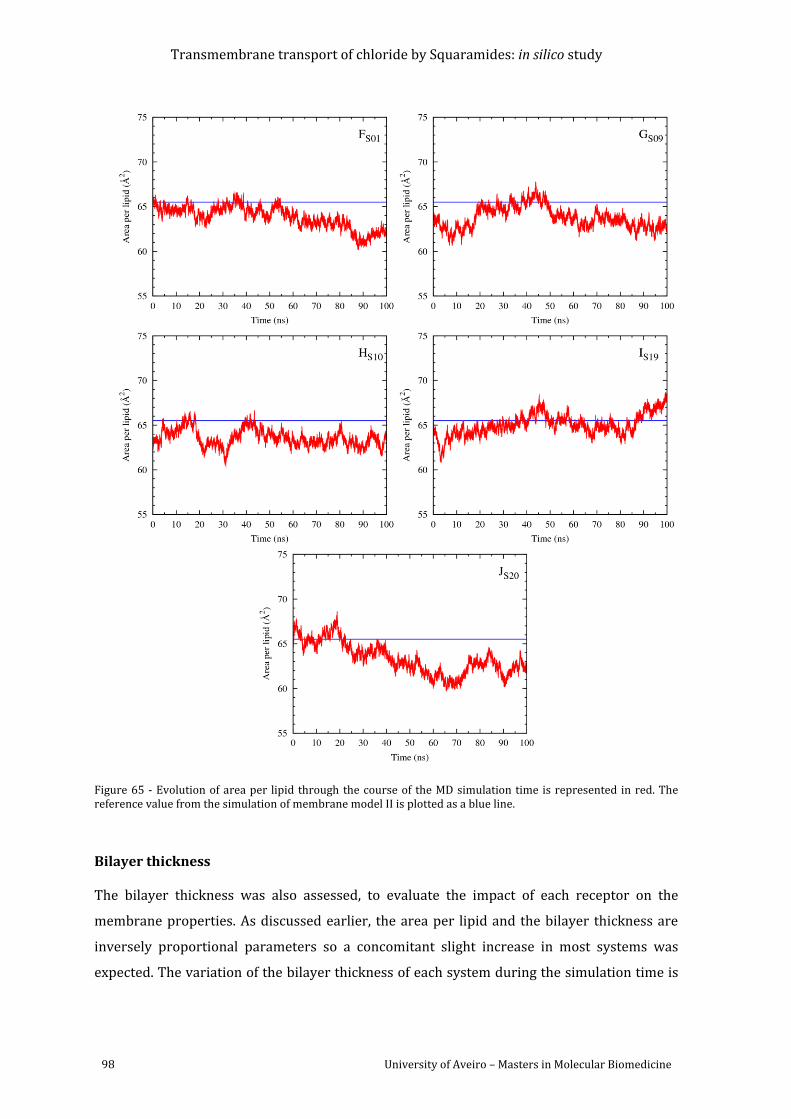
Transmembrane transport of chloride by Squaramides: in silico study
98 University of Aveiro – Masters in Molecular Biomedicine
Figure 65 - Evolution of area per lipid through the course of the MD simulation time is represented in red. The reference value from the simulation of membrane model II is plotted as a blue line.
Bilayer thickness
The bilayer thickness was also assessed, to evaluate the impact of each receptor on the
membrane properties. As discussed earlier, the area per lipid and the bilayer thickness are
inversely proportional parameters so a concomitant slight increase in most systems was
expected. The variation of the bilayer thickness of each system during the simulation time is
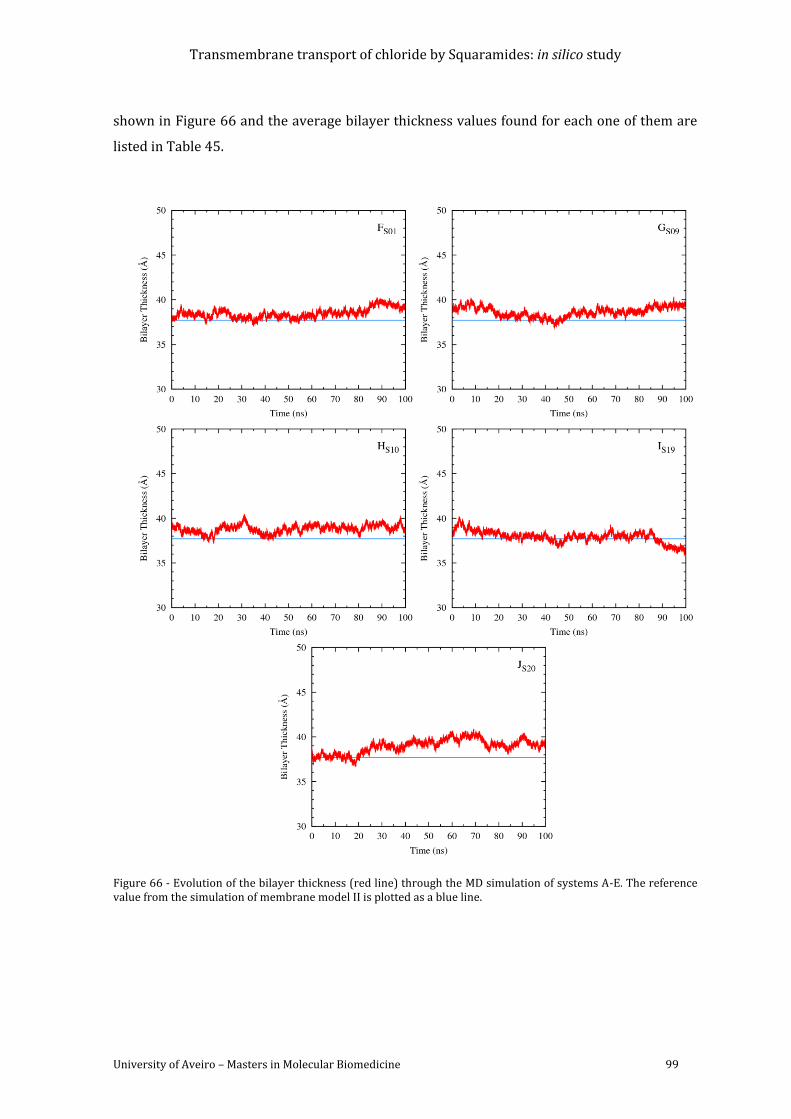
Transmembrane transport of chloride by Squaramides: in silico study
University of Aveiro – Masters in Molecular Biomedicine 99
shown in Figure 66 and the average bilayer thickness values found for each one of them are
listed in Table 45.
Figure 66 - Evolution of the bilayer thickness (red line) through the MD simulation of systems A-E. The reference value from the simulation of membrane model II is plotted as a blue line.
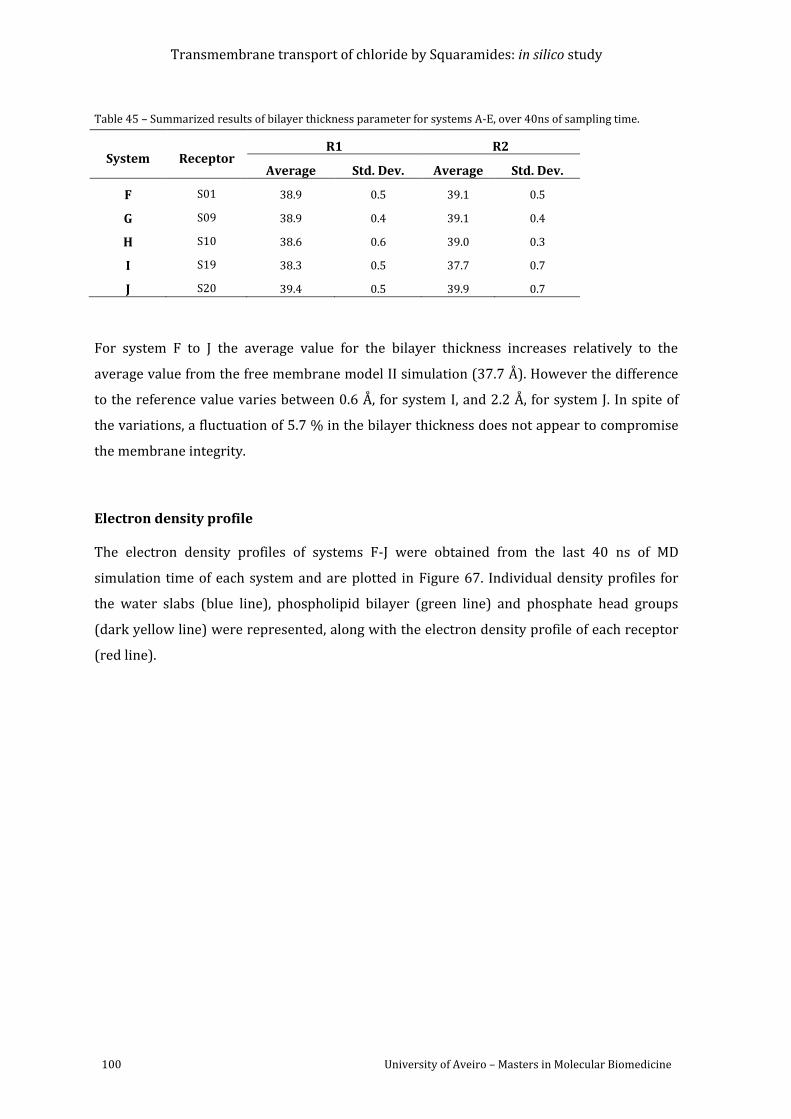
Transmembrane transport of chloride by Squaramides: in silico study
100 University of Aveiro – Masters in Molecular Biomedicine
Table 45 – Summarized results of bilayer thickness parameter for systems A-E, over 40ns of sampling time.
System Receptor R1 R2
Average Std. Dev. Average Std. Dev.
F S01 38.9 0.5 39.1 0.5
G S09 38.9 0.4 39.1 0.4
H S10 38.6 0.6 39.0 0.3
I S19 38.3 0.5 37.7 0.7
J S20 39.4 0.5 39.9 0.7
For system F to J the average value for the bilayer thickness increases relatively to the
average value from the free membrane model II simulation (37.7 Å). However the difference
to the reference value varies between 0.6 Å, for system I, and 2.2 Å, for system J. In spite of
the variations, a fluctuation of 5.7 % in the bilayer thickness does not appear to compromise
the membrane integrity.
Electron density profile
The electron density profiles of systems F-J were obtained from the last 40 ns of MD
simulation time of each system and are plotted in Figure 67. Individual density profiles for
the water slabs (blue line), phospholipid bilayer (green line) and phosphate head groups
(dark yellow line) were represented, along with the electron density profile of each receptor
(red line).
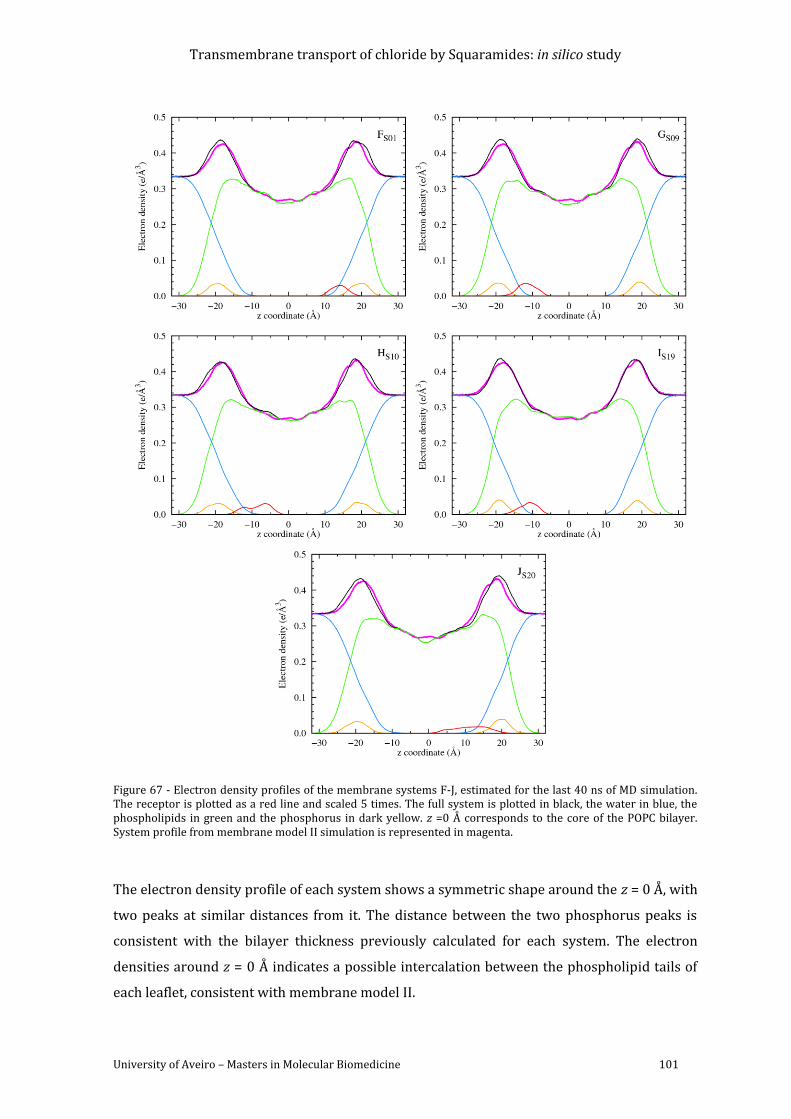
Transmembrane transport of chloride by Squaramides: in silico study
University of Aveiro – Masters in Molecular Biomedicine 101
Figure 67 - Electron density profiles of the membrane systems F-J, estimated for the last 40 ns of MD simulation. The receptor is plotted as a red line and scaled 5 times. The full system is plotted in black, the water in blue, the phospholipids in green and the phosphorus in dark yellow. z =0 Å corresponds to the core of the POPC bilayer. System profile from membrane model II simulation is represented in magenta.
The electron density profile of each system shows a symmetric shape around the z = 0 Å, with
two peaks at similar distances from it. The distance between the two phosphorus peaks is
consistent with the bilayer thickness previously calculated for each system. The electron
densities around z = 0 Å indicates a possible intercalation between the phospholipid tails of
each leaflet, consistent with membrane model II.
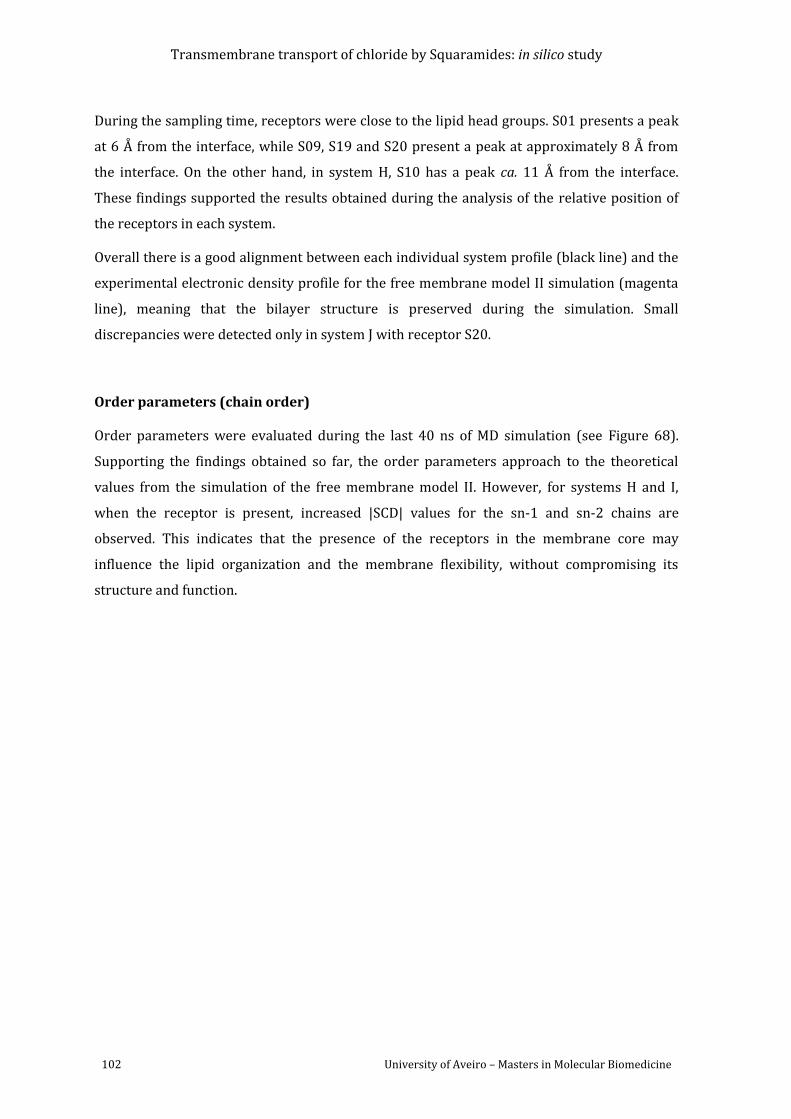
Transmembrane transport of chloride by Squaramides: in silico study
102 University of Aveiro – Masters in Molecular Biomedicine
During the sampling time, receptors were close to the lipid head groups. S01 presents a peak
at 6 Å from the interface, while S09, S19 and S20 present a peak at approximately 8 Å from
the interface. On the other hand, in system H, S10 has a peak ca. 11 Å from the interface.
These findings supported the results obtained during the analysis of the relative position of
the receptors in each system.
Overall there is a good alignment between each individual system profile (black line) and the
experimental electronic density profile for the free membrane model II simulation (magenta
line), meaning that the bilayer structure is preserved during the simulation. Small
discrepancies were detected only in system J with receptor S20.
Order parameters (chain order)
Order parameters were evaluated during the last 40 ns of MD simulation (see Figure 68).
Supporting the findings obtained so far, the order parameters approach to the theoretical
values from the simulation of the free membrane model II. However, for systems H and I,
when the receptor is present, increased |SCD| values for the sn-1 and sn-2 chains are
observed. This indicates that the presence of the receptors in the membrane core may
influence the lipid organization and the membrane flexibility, without compromising its
structure and function.
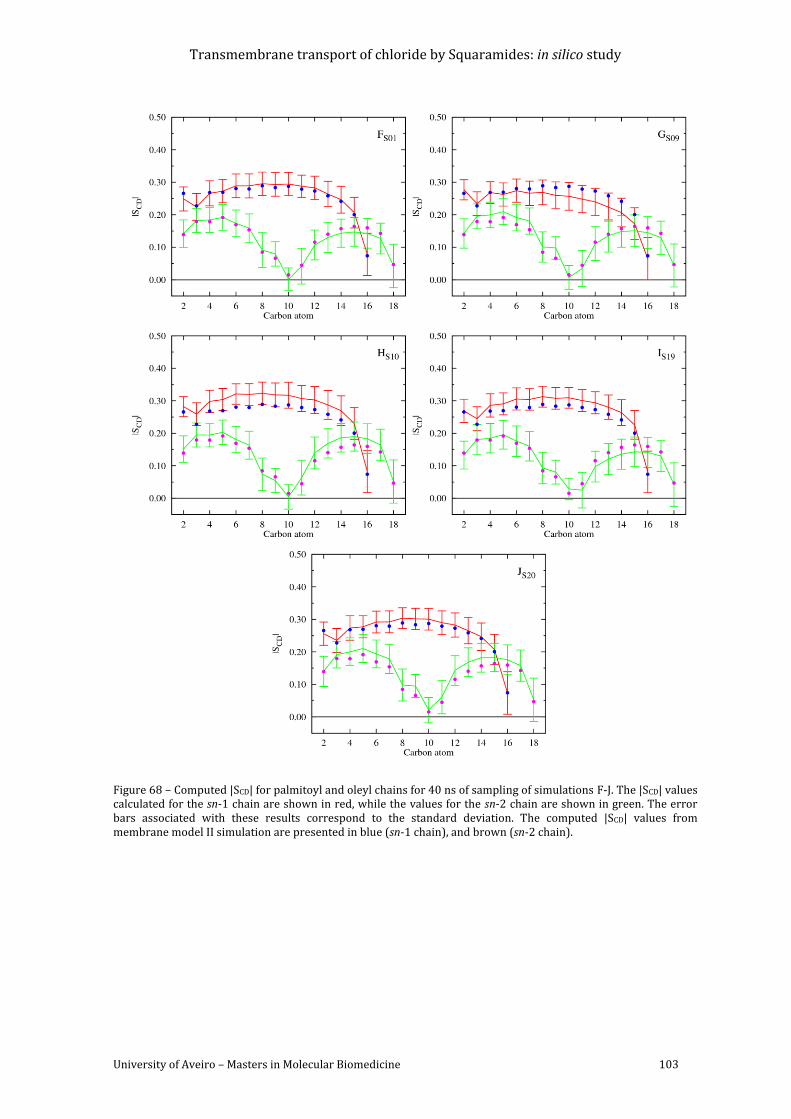
Transmembrane transport of chloride by Squaramides: in silico study
University of Aveiro – Masters in Molecular Biomedicine 103
Figure 68 – Computed |SCD| for palmitoyl and oleyl chains for 40 ns of sampling of simulations F-J. The |SCD| values calculated for the sn-1 chain are shown in red, while the values for the sn-2 chain are shown in green. The error bars associated with these results correspond to the standard deviation. The computed |SCD| values from membrane model II simulation are presented in blue (sn-1 chain), and brown (sn-2 chain).
Transmembrane transport of chloride by Squaramides: in silico study
104 University of Aveiro – Masters in Molecular Biomedicine
The results for the parameters evaluated on a representative replicate of systems F-J are
presented in Table 46.
Table 46 - Comparison between biophysical parameters for the phospholipid bilayer systems F-J.
Parameter
System
F G H I J Theoretical
(model II)
Arrival to interface (ns) 15 11 32 34 44 -
Receptor hydration 5.3±2.3 5.3±1.8 6.8±2.9 5.6±2.3 6.7±2.6 -
Area per lipid (Å2) 64.7±0.9 63.2±0.7 63.1±0.6 65.3±1.2 61.4±1.5 65.5
Bilayer thickness (Å) 37.9±0.8 38.9±0.4 39.0±0.3 37.7±0.7 39.9±0.7 37.7
Electron density profile
Good fitting
with
theoretical
results
Good fitting
with
theoretical
results
Good fitting
with
theoretical
results
Good fitting
with
theoretical
results
Misalignment
with
theoretical
results
(116-117)
Order parameters
|SCD|
increased
values
Disorder and
flexibility
|SCD|
increased
values
Disorder and
flexibility
Disorder and
flexibility (116-117)
Results depicted herein show a marginal effect of the receptors on the membrane structural
parameters. Indeed, for the selected replicates, the maximum variation of 6.2 % and 5.7 % in
area per lipid and bilayer thickness, respectively, does not seem large enough to alter the
membrane structure and integrity. The electron density profiles show a good fitting with the
theoretical values from free membrane (model II) simulation, although system J shows a
small misalignment in the system individual profile. The order parameters show slight
increases in the |SCD| values, however, still compatible with a fluid phase membrane. When
inserted in the bilayer core, squaramides were able to hold the chloride anion, which was
released only when the complexes reached the 10 Å distance from the interface.
Transmembrane transport of chloride by Squaramides: in silico study
University of Aveiro – Masters in Molecular Biomedicine 105
4. Conclusions
As mentioned in the beginning of this work, the anion transport across cellular membranes is
an important process, essential for the cell functioning. Therefore the development of
synthetic transporters capable of replacing defective membrane transporters is a great
challenge and a growing research field in the supramolecular chemistry area. The design of
these synthetic molecules requires knowledge and expertise so that a fine balance between
anion selectivity and lipophilic character can be achieved, granting transport activity to
molecules.
In this context, since June 2012, an in silico study was carried out in POPC membrane models
to assess the behaviour of squaramide chloride complexes and their interaction with the
phospholipid bilayer.
As a first step in this theoretical investigation, specific bond term parameters for the
squaramide entity were generated using the crystal data deposited with CSD, which were
used together with GAFF default parameters to describe the squaramides. Overall, this
combination accurately reproduced the structure of the squaramide unit in the crystal state,
which is characterized by the existence of multiple N-H···O hydrogen bonds. Therefore, the
new set of parameters is more appropriate to be used in simulation of squaramides in
solvents, as water, with donor and acceptor hydrogen ability.
The study was continued with MD simulations of membrane systems. A free POPC membrane
model (fully hydrated) was simulated and then used to accommodate the receptors in the
bilayer core. This simulation was used as reference to evaluate the impact of the squaramides
on the structural parameters of lipid bilayer (area per lipid, bilayer thickness, electron
density profile and order parameters). When the receptors were placed in the water phase,
an overhydrated membrane previously simulated with LIPID11 was used as reference.
Squaramide chloride complexes were then placed in the water slab and in the membrane
core of the system. The structural parameters aforementioned were assessed to evaluate the
impact of each squaramide in the membrane properties. The diffusion and interaction of each
small molecule with phospholipid bilayer was evaluated through the analysis of the receptor
relative position, hydration, hydrogen bonds and C=C-N-C torsion angles (between the
squaramide core and C adjacent from the substituent) for 100 ns. Two replicates of each
system were simulated to confirm the results. Data showed that all the receptors have the
ability to diffuse from the water slab and permeate the phospholipid bilayer, as well as the
Transmembrane transport of chloride by Squaramides: in silico study
106 University of Aveiro – Masters in Molecular Biomedicine
ability to move from the bilayer core towards the water/lipid interface, releasing the chloride
from the complex. Some biophysical parameters of the membrane were perturbed by the
presence of the complexes. However, since squaramides are small molecules with low
molecular weight, the differences from the estimated values for pure membrane models were
marginal. In the systems where the complexes were placed in the water slab, the structural
parameters showed slight perturbations in the area per lipid and bilayer thickness
parameters.
Summarizing, these molecules present a high degree of lipophilicity but were still able to
diffuse in lipophilic and hydrophilic media with a marginal impact to the membrane structure
and properties. In agreement to previous experimental studies squaramides have a great
potential as functional binding units to integrate new transmembrane anion transporters
much more efficient than their ureas and thioureas analogous.
Moreover, Molecular Dynamics simulation is a very comprehensive and powerful tool to
understand, at the molecular level, the diffusion of the chloride associations trough the
membrane, the interaction with phospholipid head groups as well as the transport
mechanisms, enabling the rational research and development of new drug-like molecules for
channel replacement therapies.
Transmembrane transport of chloride by Squaramides: in silico study
University of Aveiro – Masters in Molecular Biomedicine 107
5. Future work
Following the same reasoning, more MD studies can be performed to test the transmembrane
transport of physiologically relevant anions such as bicarbonate, sulphate, phosphate and
nitrate. In addition, this theoretical investigation will be extended to new and more
sophisticated squaramide molecules, in collaboration with Prof. Gale´s group.
Another approach can be the molecular design and simulation of squaramide-based
transporters with amino acid moieties. Since the squaramide unit is not enough to maintain
hydrogen bonds in competitive media, more complex molecules with several “squaric units”
suitable for anion transport using ion carrier mechanism, channels or anion π-slides, among
others. The molecular dynamics will be an excellent tool to investigate this crucial feature of
the anion transmembrane transport.
The theoretical studies will include MD simulations in phospholipid bilayer models
complemented by quantum-chemical calculations to evaluate the binding affinity of each
squaramide to different anions. These results will also be correlated with receptors
experimental transport activity (e.g. EC50).
This work will be carried out using a similar approach to the one used so far, however the
lipid molecules will be eventually described with new a force field compatible with GAFF, but
not requiring the use of surface tension as LIPID11. Other significant step forward in the
anion transport area will be the estimative of the free energy barrier required by the anion-
squaramide complex to cross the lipid interface by constraint MD simulations with extraction
of the corresponding potential of mean force (PMF). The application of other MD approaches
that allow an enhanced sampling of biological membrane systems, such as replica-exchange
molecular dynamics (REMD), will be also tested. In other words, these type of MD
methodologies combined with unconstrained MD simulations will be valuable insights
towards the full understanding of the anion transport assisted by artificial receptors. All
these in silico studies will be a major breakthrough in the field of the anion transport.

Transmembrane transport of chloride by Squaramides: in silico study
University of Aveiro – Masters in Molecular Biomedicine 109
6. References
1. Alberts, B., Johnson, A., Lewis, J., Raff, M., Roberts, K. and Walter, P., Molecular Biology of the Cell, 4th Ed., Garland Science, 2002.
2. Lodish, H., Berk, A., Matsudaira, P., Kaiser, C. A., Krieger, M., Scott, M. P., Zipursky, L. and Darnell, J., Molecular Cell Biology, 4th Ed., W. H. Freeman, 2000.
3. McNally, B. A., Leevy, W. M. and Smith, B. D., Recent Advances in Synthetic Membrane Transporters, Supramol Chem, 2007, 19, 29-37.
4. Red Blood Cell Laboratory Children's Hospital Oakland Research Institute, 2010, .
5. Rhoades, R. A. and Tanner, G. A., Medical Physiology, 2nd Ed., Lippincott Williams & Wilkins, 2003.
6. Davis, J. T., Okunola, O. and Quesada, R., Recent Advances in the Transmembrane Transport of Anions, Chem. Soc. Rev., 2010, 39, 3843-3862.
7. Boron, W. F. and Boulpaep, E., Medical Physiology - Updated Edition, Updated Edition, Saunders, 2004.
8. Cannon, S., Physiologic Principles Underlying Ion Channelopathies, Neurotherapeutics, 2007, 4, 174-183.
9. Ashcroft, F. M., Ion Channels and Disease, 1st Ed., Academic Press, 1999.
10. Gaillard, T. and Case, D. A., Evaluation of DNA Force Fields in Implicit Solvation, Journal of Chemical Theory and Computation, 2011, 7, 3181-3198.
11. Cook, G. A., Prakash, O., Zhang, K., Shank, L. P., Takeguchi, W. A., Robbins, A., Gong, Y. X., Iwamoto, T., Schultz, B. D. and Tomich, J. M., Activity and Structural Comparisons of Solution Associating and Monomeric Channel-Forming Peptides Derived from the Glycine Receptor M2 Segment, Biophys. J., 2004, 86, 1424-1435.
12. Valkenier, H. and Davis, A. P., Making a Match for Valinomycin: Steroidal Scaffolds in the Design of Electroneutral, Electrogenic Anion Carriers, Acc. Chem. Res., 2013, .
13. George, A. L. J., Inherited Channelopathies Associated with Epilepsy, Epilepsy currents / American Epilepsy Society, 2004, 4, 65-70.
14. Scotet, V., Dugueperoux, I., Saliou, P., Rault, G., Roussey, M., Audrezet, M.-P. and Ferec, C., Evidence for Decline in the Incidence of Cystic Fibrosis: A 35-Year Observational Study in Brittany, France, Orphanet Journal of Rare Diseases, 2012, 7, 14.
15. Ionophores, Available On: <Http://Www.Ncbi.Nlm.Nih.Gov/Mesh/68007476>, MeSH Database, Accessed on April 4th 2013.
16. De Riccardis, F., Izzo, I., Montesarchio, D. and Tecilla, P., Ion Transport through Lipid Bilayers by Synthetic Ionophores: Modulation of Activity and Selectivity, Acc. Chem. Res., 2013, .
17. I-Lev. Encyclopedia of Science and Technology, McGraw-Hill, 2007, 9, 445-447.
18. Seganish, J. L. and Davis, J. T., Prodigiosin Is a Chloride Carrier That Can Function as an Anion Exchanger, Chem. Commun., 2005, 0, 5781-5783.
19. Davis, A. P., Sheppard, D. N. and Smith, B. D., Development of Synthetic Membrane Transporters for Anions, Chem. Soc. Rev., 2007, 36, 348-357.
20. McNally, B. A., O’Neil, E. J., Nguyen, A. and Smith, B. D., Membrane Transporters for Anions That Use a Relay Mechanism, J. Am. Chem. Soc., 2008, 130, 17274-17275.
Transmembrane transport of chloride by Squaramides: in silico study
110 University of Aveiro – Masters in Molecular Biomedicine
21. Gale, P. A., Pérez-Tomás, R. and Quesada, R., Anion Transporters and Biological Systems, Acc. Chem. Res., 2013, .
22. Davis, J. T., Gale, P. A., Okunola, O. A., Prados, P., Iglesias-Sanchez, J. C., Torroba, T. and Quesada, R., Using Small Molecules to Facilitate Exchange of Bicarbonate and Chloride Anions across Liposomal Membranes, Nat Chem, 2009, 1, 138-144.
23. Hernandez, P. I., Moreno, D., Javier, A. A., Torroba, T., Perez-Tomas, R. and Quesada, R., Tambjamine Alkaloids and Related Synthetic Analogs: Efficient Transmembrane Anion Transporters, Chem. Commun., 2012, 48, 1556-1558.
24. Saggiomo, V., Otto, S., Marques, I., Felix, V., Torroba, T. and Quesada, R., The Role of Lipophilicity in Transmembrane Anion Transport, Chem. Commun., 2012, 48, 5274-5276.
25. Antonisse, M. M. G. and Reinhoudt, D. N., Neutral Anion Receptors: Design and Application, Chem. Commun., 1998, 443-448.
26. Sidorov, V., Kotch, F. W., Abdrakhmanova, G., Mizani, R., Fettinger, J. C. and Davis, J. T., Ion Channel Formation from a Calix[4]Arene Amide That Binds Hcl, J. Am. Chem. Soc., 2002, 124, 2267-2278.
27. Sidorov, V., Kotch, F. W., Kuebler, J. L., Lam, Y. F. and Davis, J. T., Chloride Transport across Lipid Bilayers and Transmembrane Potential Induction by an Oligophenoxyacetamide, J. Am. Chem. Soc., 2003, 125, 2840-2841.
28. Seganish, J. L., Santacroce, P. V., Salimian, K. J., Fettinger, J. C., Zavalij, P. and Davis, J. T., Regulating Supramolecular Function in Membranes: Calixarenes That Enable or Inhibit Transmembrane Cl- Transport, Angew. Chem. Int. Ed. Engl., 2006, 45, 3334-3338.
29. Okunola, O. A., Seganish, J. L., Salimian, K. J., Zavalij, P. Y. and Davis, J. T., Membrane-Active Calixarenes: Toward 'Gating' Transmembrane Anion Transport, Tetrahedron, 2007, 63, 10743-10750.
30. Sessler, J. L., Weghorn, S. J., Morishima, T., Rosingana, M., Lynch, V. and Lee, V., Rosarin - a New, Easily Prepared Hexapyrrolic Expanded Porphyrin, J. Am. Chem. Soc., 1992, 114, 8306-8307.
31. Sessler, J. L., Andrievsky, A., Gale, P. A. and Lynch, V., Anion Binding: Self-Assembly of Polypyrrolic Macrocycles, Angewandte Chemie-International Edition in English, 1996, 35, 2782-2785.
32. Sessler, J. L., An, D. Q., Cho, W. S. and Lynch, V., Calix[N]Bipyrroles: Synthesis, Characterization, and Anion-Binding Studies, Angew Chem Int Edit, 2003, 42, 2278-2281.
33. Sessler, J. L., Eller, L. R., Cho, W. S., Nicolaou, S., Aguilar, A., Lee, J. T., Lynch, V. M. and Magda, D. J., Synthesis, Anion-Binding Properties, and in Vitro Anticancer Activity of Prodigiosin Analogues, Angew Chem Int Edit, 2005, 44, 5989-5992.
34. Gale, P. A., Light, M. E., McNally, B., Navakhun, K., Sliwinski, K. E. and Smith, B. D., Co-Transport of H+/Cl- by a Synthetic Prodigiosin Mimic, Chem. Commun., 2005, 0, 3773-3775.
35. Fisher, M. G., Gale, P. A., Hiscock, J. R., Hursthouse, M. B., Light, M. E., Schmidtchen, F. P. and Tong, C. C., 1,2,3-Triazole-Strapped Calix[4]Pyrrole: A New Membrane Transporter for Chloride, Chem. Commun., 2009, 3017-3019.
36. Haynes, C. J. E., Moore, S. J., Hiscock, J. R., Marques, I., Costa, P. J., Felix, V. and Gale, P. A., Tunable Transmembrane Chloride Transport by Bis-Indolylureas, Chem. Sci., 2012, 3, 1436-1444.
Transmembrane transport of chloride by Squaramides: in silico study
University of Aveiro – Masters in Molecular Biomedicine 111
37. Moore, S. J., Haynes, C. J. E., Gonzalez, J., Sutton, J. L., Brooks, S. J., Light, M. E., Herniman, J., Langley, G. J., Soto-Cerrato, V., Perez-Tomas, R., Marques, I., Costa, P. J., Felix, V. and Gale, P. A., Chloride, Carboxylate and Carbonate Transport by Ortho-Phenylenediamine-Based Bisureas, Chem. Sci., 2013, 4, 103-117.
38. Madhavan, N., Robert, E. C. and Gin, M. S., A Highly Active Anion-Selective Aminocyclodextrin Ion Channel, Angew. Chem. Int. Ed., 2005, 44, 7584-7587.
39. Difabio, G., Randazzo, A., D'Onofrio, J., Ausin, C., Pedroso, E., Grandas, A., De Napoli, L. and Montesarchio, D., Cyclic Phosphate-Linked Oligosaccharides: Synthesis and Conformational Behavior of Novel Cyclic Oligosaccharide Analogues, J. Org. Chem., 2006, 71, 3395-3408.
40. Brotherhood, P. R. and Davis, A. P., Steroid-Based Anion Receptors and Transporters, Chem. Soc. Rev., 2010, 39, 3633-3647.
41. Davis, A. P. and Joos, J. B., Steroids as Organising Elements in Anion Receptors, Coord. Chem. Rev., 2003, 240, 143-156.
42. Clare, J. P., Ayling, A. J., Joos, J. B., Sisson, A. L., Magro, G., Perez-Payan, M. N., Lambert, T. N., Shukla, R., Smith, B. D. and Davis, A. P., Substrate Discrimination by Cholapod Anion Receptors: Geometric Effects and the "Affinity-Selectivity Principle", J. Am. Chem. Soc., 2005, 127, 10739-10746.
43. Davis, A. P., Anion Binding and Transport by Steroid-Based Receptors, Coord. Chem. Rev., 2006, 250, 2939-2951.
44. Judd, L. W. and Davis, A. P., From Cholapod to Cholaphane Transmembrane Anion Carriers: Accelerated Transport through Binding Site Enclosure, Chem Commun (Camb), 2010, 46, 2227-2229.
45. Reddy, G. L., Iwamoto, T., Tomich, J. M. and Montal, M., Synthetic Peptides and Four-Helix Bundle Proteins as Model Systems for the Pore-Forming Structure of Channel Proteins. Ii. Transmembrane Segment M2 of the Brain Glycine Receptor Is a Plausible Candidate for the Pore-Lining Structure, J. Biol. Chem., 1993, 268, 14608-14615.
46. Schlesinger, P. H., Ferdani, R., Liu, J., Pajewska, J., Pajewski, R., Saito, M., Shabany, H. and Gokel, G. W., Scmtr: A Chloride-Selective, Membrane-Anchored Peptide Channel That Exhibits Voltage Gating, J. Am. Chem. Soc., 2002, 124, 1848-1849.
47. Schlesinger, P. H., Ferdani, R., Pajewski, R., Pajewska, J. and Gokel, G. W., A Hydrocarbon Anchored Peptide That Forms a Chloride- Selective Channel in Liposomes, Chem. Commun., 2002, 0, 840-841.
48. You, L., Ferdani, R., Li, R. Q., Kramer, J. P., Winter, R. E. K. and Gokel, G. W., Carboxylate Anion Diminishes Chloride Transport through a Synthetic, Self-Assembled Transmembrane Pore, Chem-Eur J, 2008, 14, 382-396.
49. Djedovic, N., Ferdani, R., Harder, E., Pajewska, J., Pajewski, R., Weber, M. E., Schlesinger, P. H. and Gokel, G. W., The C- and N-Terminal Residues of Synthetic Heptapeptide Ion Channels Influence Transport Efficacy through Phospholipid Bilayers, New J. Chem., 2005, 29, 291-305.
50. Sakai, N., Sorde, N., Das, G., Perrottet, P., Gerard, D. and Matile, S., Synthetic Multifunctional Pores: Deletion and Inversion of Anion/Cation Selectivity Using Pm and Ph, Org Biomol Chem, 2003, 1, 1226-1231.
51. Das, G., Onouchi, H., Yashima, E., Sakai, N. and Matile, S., Binding of Organic Anions by Synthetic Supramolecular Metallopores with Internal Mg2+–Aspartate Complexes, ChemBioChem, 2002, 3, 1089-1096.
Transmembrane transport of chloride by Squaramides: in silico study
112 University of Aveiro – Masters in Molecular Biomedicine
52. Gorteau, V., Julliard, M. D. and Matile, S., Hydrophilic Anchors for Transmembrane Anion-Pi Slides, J. Membr. Sci., 2008, 321, 37-42.
53. Janout, V. and Regen, S. L., Bioconjugate-Based Molecular Umbrellas, Bioconj. Chem., 2009, 20, 183-192.
54. Deng, G., Dewa, T. and Regen, S. L., A Synthetic Ionophore That Recognizes Negatively Charged Phospholipid Membranes, J. Am. Chem. Soc., 1996, 118, 8975-8976.
55. Quiñonero, D., Frontera, A., Ballester, P. and Deyà, P. M., A Theoretical Study of Aromaticity in Squaramide and Oxocarbons, Tetrahedron Lett., 2000, 41, 2001-2005.
56. Quiñonero, D., Prohens, R., Garau, C., Frontera, A., Ballester, P., Costa, A. and Deyà, P. M., A Theoretical Study of Aromaticity in Squaramide Complexes with Anions, Chem. Phys. Lett., 2002, 351, 115-120.
57. Rotger, C., Soberats, B., Quinonero, D., Frontera, A., Ballester, P., Benet-Buchholz, J., Deya, P. M. and Costa, A., Crystallographic and Theoretical Evidence of Anion-Pi and Hydrogen-Bonding Interactions in a Squaramide-Nitrate Salt, Eur. J. Org. Chem., 2008, 1864-1868.
58. Quinonero, D., Garau, C., Frontera, A., Ballester, P., Costa, A. and Deya, P. M., Quantification of Aromaticity in Oxocarbons: The Problem of the Fictitious "Nonaromatic" Reference System, Chemistry, 2002, 8, 433-438.
59. Storer, R. I., Aciro, C. and Jones, L. H., Squaramides: Physical Properties, Synthesis and Applications, Chem Soc Rev, 2011, 40, 2330-2346.
60. Prohens, R., Portell, A., Puigjaner, C., Barbas, R., Alcobe, X., Font-Bardia, M. and Tomas, S., Cooperative Induction in Double H-Bonding Donor/Acceptor Compounds: Chains Vs. Ribbons, CrystEngComm, 2012, 14, 5745-5748.
61. Kawahara, S.-i., Taira, K. and Uchimaru, T., Hydrogen Bond Cooperativity Derived from Neighboring Hydrogen Bond Formation: Case Study in Three Iso-Complexes of C8h9n5o2, Chem. Phys., 2003, 290, 79-83.
62. Amendola, V., Bergamaschi, G., Boiocchi, M., Fabbrizzi, L. and Milani, M., The Squaramide Versus Urea Contest for Anion Recognition, Chem-Eur J, 2010, 16, 4368-4380.
63. Garau, C., Frontera, A., Ballester, P., Quinonero, D., Costa, A. and Deya, P. M., A Theoretical Ab Initio Study of the Capacity of Several Binding Units for the Molecular Recognition of Anions, Eur. J. Org. Chem., 2005, 2005, 179-183.
64. Quiñonero, D., Frontera, A., Suñer, G. A., Morey, J., Costa, A., Ballester, P. and Deyà, P. M., Squaramide as a Binding Unit in Molecular Recognition, Chem. Phys. Lett., 2000, 326, 247-254.
65. Amendola, V., Fabbrizzi, L., Mosca, L. and Schmidtchen, F. P., Urea-, Squaramide-, and Sulfonamide-Based Anion Receptors: A Thermodynamic Study, Chem-Eur J, 2011, 17, 5972-5981.
66. Rostami, A., Colin, A., Li, X. Y., Chudzinski, M. G., Lough, A. J. and Taylor, M. S., N,N'-Diarylsquaramides: General, High-Yielding Synthesis and Applications in Colorimetric Anion Sensing, J. Org. Chem., 2010, 75, 3983-3992.
67. Rostami, A., Wei, C. J., Guerin, G. and Taylor, M. S., Anion Detection by a Fluorescent Poly(Squaramide): Self-Assembly of Anion-Binding Sites by Polymer Aggregation, Angew. Chem. Int. Ed. Engl., 2011, 50, 2059-2062.
68. Prohens, R., Tomas, S., Morey, J., Deya, P. M., Ballester, P. and Costa, A., Squaramido-Based Receptors: Molecular Recognition of Carboxylate Anions in Highly Competitive Media., Tetrahedron Lett., 1998, 39, 1063-1066.
Transmembrane transport of chloride by Squaramides: in silico study
University of Aveiro – Masters in Molecular Biomedicine 113
69. Frontera, A., Orell, M., Garau, C., Quinonero, D., Molins, E., Mata, I. and Morey, J., Preparation, Solid-State Characterization, and Computational Study of a Crown Ether Attached to a Squaramide, Org Lett, 2005, 7, 1437-1440.
70. Kim, C. U. and Misco, P. F., A Facile Synthesis of 1-Hydroxy-2- Phosphonocyclobutenedione, Tetrahedron Lett., 1992, 33, 3961-3962.
71. Ramalingam, V., Domaradzki, M. E., Jang, S. and Muthyala, R. S., Carbonyl Groups as Molecular Valves to Regulate Chloride Binding to Squaramides, Organic Letters, 2008, 10, 3315-3318.
72. Busschaert, N., Kirby, I. L., Young, S., Coles, S. J., Horton, P. N., Light, M. E. and Gale, P. A., Squaramides as Potent Transmembrane Anion Transporters, Angew. Chem. Int. Ed. Engl., 2012, 51, 4426-4430.
73. Siu, S. W., Vacha, R., Jungwirth, P. and Bockmann, R. A., Biomolecular Simulations of Membranes: Physical Properties from Different Force Fields, J. Chem. Phys., 2008, 128, 125103.
74. Leach, A. R., Molecular Modelling: Principles and Applications, 1st Ed., Longman, 1996.
75. Hinchliffe, A., Molecular Modelling for Beginners, 1st Ed., Wiley, 2003.
76. Cramer, C. J., Essentials of Computational Chemistry: Theories and Models, 2nd Ed., Wiley, 2004.
77. Arinaminpathy, Y., Sansom, M. S. P. and Biggin, P. C., Molecular Dynamics Simulations of the Ligand-Binding Domain of the Ionotropic Glutamate Receptor Glur2, Biophys. J., 2002, 82, 676-683.
78. Marrink, S. J., Risselada, H. J., Yefimov, S., Tieleman, D. P. and de Vries, A. H., The Martini Force Field: Coarse Grained Model for Biomolecular Simulations, J. Phys. Chem. B, 2007, 111, 7812-7824.
79. Alder, B. J. and Wainwright, T. E., Phase Transition for a Hard Sphere System, The Journal of Chemical Physics, 1957, 27, 1208-1209.
80. Janosi, L. and Gorfe, A. A., Simulating Popc and Popc/Popg Bilayers: Conserved Packing and Altered Surface Reactivity, Journal of Chemical Theory and Computation, 2010, 6, 3267-3273.
81. Klauda, J. B., Venable, R. M., Freites, J. A., O'Connor, J. W., Tobias, D. J., Mondragon-Ramirez, C., Vorobyov, I., MacKerell, A. D. and Pastor, R. W., Update of the Charmm All-Atom Additive Force Field for Lipids: Validation on Six Lipid Types, J. Phys. Chem. B, 2010, 114, 7830-7843.
82. Rosso, L. and Gould, I. R., Structure and Dynamics of Phospholipid Bilayers Using Recently Developed General All-Atom Force Fields, J. Comput. Chem., 2008, 29, 24-37.
83. Jojart, B. and Martinek, T. A., Performance of the General Amber Force Field in Modeling Aqueous Popc Membrane Bilayers, J. Comput. Chem., 2007, 28, 2051-2058.
84. Skjevik, A. A., Madej, B. D., Walker, R. C. and Teigen, K., Lipid11: A Modular Framework for Lipid Simulations Using Amber, J. Phys. Chem. B, 2012, 116, 11124-11136.
85. Dickson, C. J., Rosso, L., Betz, R. M., Walker, R. C. and Gould, I. R., Gafflipid: A General Amber Force Field for the Accurate Molecular Dynamics Simulation of Phospholipid, Soft Matter, 2012, 8, 9617-9627.
86. Poger, D. and Mark, A. E., On the Validation of Molecular Dynamics Simulations of Saturated and Cis-Monounsaturated Phosphatidylcholine Lipid Bilayers: A Comparison with Experiment, Journal of Chemical Theory and Computation, 2010, 6, 325-336.
Transmembrane transport of chloride by Squaramides: in silico study
114 University of Aveiro – Masters in Molecular Biomedicine
87. Chiu, S. W., Pandit, S. A., Scott, H. L. and Jakobsson, E., An Improved United Atom Force Field for Simulation of Mixed Lipid Bilayers, J. Phys. Chem. B, 2009, 113, 2748-2763.
88. Kirschner, K. N., Yongye, A. B., Tschampel, S. M., Gonzalez-Outeirino, J., Daniels, C. R., Foley, B. L. and Woods, R. J., Glycam06: A Generalizable Biomolecular Force Field. Carbohydrates, J. Comput. Chem., 2008, 29, 622-655.
89. Quiñonero, D., Tomàs, S., Frontera, A., Garau, C., Ballester, P., Costa, A. and Deyà, P. M., Opls All-Atom Force Field for Squaramides and Squaric Acid, Chem. Phys. Lett., 2001, 350, 331-338.
90. Allen, F., The Cambridge Structural Database: A Quarter of a Million Crystal Structures and Rising, Acta Crystallographica Section B, 2002, 58, 380-388.
91. Jin, X. Q., Min, Q. Q., Zheng, Y. F., Wang, P. C., Zhu, J. and Zhou, H. B., Synthesis and Structural Features of Chiral Cyclic Squaramides and Their Application in Asymmetric Catalytic Reaction, Arkivoc, 2010, 322-335.
92. Kolev, T., Seidel, R. W., Mayer-Figge, H., Spiteller, M., Sheldrick, W. S. and Koleva, B. B., Crystal Structures and Spectroscopic Properties of Ester Amide and Diamide of Squaric Acid with Prolinamide, Spectrochimica Acta Part A: Molecular and Biomolecular Spectroscopy, 2009, 72, 502-509.
93. Lunelli, B., Roversi, P., Ortoleva, E. and Destro, R., Geometry and Molecular Parameters of 3,4-Bis(Dimethylamino)-3-Cyclobutene-1,2-Dione and Its Isomer Bis(Dimethylamino)Squaraine. Combined Study by Ir Spectroscopy, Xrd and Ab Initio Mo Calculations, J. Chem. Soc., Faraday Trans., 1996, 92, 3611-3623.
94. Oh, J.-S., Kim, K. I. and Song, C. E., Enantioselective Synthesis of [Small Alpha]-Deuterium Labelled Chiral [Small Alpha]-Amino Acids Via Dynamic Kinetic Resolution of Racemic Azlactones, Org Biomol Chem, 2011, 9, 7983-7985.
95. Silva, C. E., Dos Santos, H. l. F., Speziali, N. L., Diniz, R. and de Oliveira, L. F. C., Role of the Substituent Effect over the Squarate Oxocarbonic Ring: Spectroscopy, Crystal Structure, and Density Functional Theory Calculations of 1,2-Dianilinosquairane, The Journal of Physical Chemistry A, 2010, 114, 10097-10109.
96. Porel, M., Ramalingam, V., Domaradzki, M. E., Young, V. G., Ramamurthy, V. and Muthyala, R. S., Chloride Sensing Via Suppression of Excited State Intramolecular Proton Transfer in Squaramides, Chem. Commun., 2013, .
97. Muthyala, R. S., Subramaniam, G. and Todaro, L., The Use of Squaric Acid as a Scaffold for Cofacial Phenyl Rings, Org. Lett., 2004, 6, 4663-4665.
98. Portell, A., Barbas, R., Braga, D., Polito, M., Puigjaner, C. and Prohens, R., New Polymorphic Hydrogen Bonding Donor-Acceptor System with Two Temperature Coincident Solid-Solid Transitions, CrystEngComm, 2009, 11, 52-54.
99. Mattes, R., Johann, G. and Pieper, C., Bisamide Der Quadratsäure, Monatsh Chem, 1987, 118, 105-113.
100. Malerich, J. P., Hagihara, K. and Rawal, V. H., Chiral Squaramide Derivatives Are Excellent Hydrogen Bond Donor Catalysts, J. Am. Chem. Soc., 2008, 130, 14416-14417.
101. Estarellas, C., Rotger, M. C., Capo , M., uin onero, D., Frontera, A., Costa, A. and Deya , P. M., Anion−Π Interactions in Four-Membered Rings, Org. Lett., 2009, 11, 1987-1990.
102. Bayly, C. I., Cieplak, P., Cornell, W. and Kollman, P. A., A Well-Behaved Electrostatic Potential Based Method Using Charge Restraints for Deriving Atomic Charges: The Resp Model, The Journal of Physical Chemistry, 1993, 97, 10269-10280.
Transmembrane transport of chloride by Squaramides: in silico study
University of Aveiro – Masters in Molecular Biomedicine 115
103. Jakalian, A., Bush, B. L., Jack, D. B. and Bayly, C. I., Fast, Efficient Generation of High-Quality Atomic Charges. Am1-Bcc Model: I. Method, J. Comput. Chem., 2000, 21, 132-146.
104. Jakalian, A., Jack, D. B. and Bayly, C. I., Fast, Efficient Generation of High-Quality Atomic Charges. Am1-Bcc Model: Ii. Parameterization and Validation, J. Comput. Chem., 2002, 23, 1623-1641.
105. Wang, J., Wang, W., Kollman, P. A. and Case, D. A., Automatic Atom Type and Bond Type Perception in Molecular Mechanical Calculations, J. Mol. Graphics Model., 2006, 25, 247-260.
106. Walker, R. C., Crowley, M. F. and Case, D. A., The Implementation of a Fast and Accurate Qm/Mm Potential Method in Amber, J. Comput. Chem., 2008, 29, 1019-1031.
107. Frisch, M. J., Trucks, G. W., Schlegel, H. B., Scuseria, G. E., Robb, M. A., Cheeseman, J. R., Scalmani, G., Barone, V., Mennucci, B., Petersson, G. A., Nakatsuji, H., Caricato, M., Li, X., Hratchian, H. P., Izmaylov, A. F., Bloino, J., Zheng, G., Sonnenberg, J. L., Hada, M., Ehara, M., Toyota, K., Fukuda, R., Hasegawa, J., Ishida, M., Nakajima, T., Honda, Y., Kitao, O., Nakai, H., Vreven, T., Montgomery, J. A., Peralta, J. E., Ogliaro, F., Bearpark, M., Heyd, J. J., Brothers, E., Kudin, K. N., Staroverov, V. N., Kobayashi, R., Normand, J., Raghavachari, K., Rendell, A., Burant, J. C., Iyengar, S. S., Tomasi, J., Cossi, M., Rega, N., Millam, J. M., Klene, M., Knox, J. E., Cross, J. B., Bakken, V., Adamo, C., Jaramillo, J., Gomperts, R., Stratmann, R. E., Yazyev, O., Austin, A. J., Cammi, R., Pomelli, C., Ochterski, J. W., Martin, R. L., Morokuma, K., Zakrzewski, V. G., Voth, G. A., Salvador, P., Dannenberg, J. J., Dapprich, S., Daniels, A. D., Farkas, Foresman, J. B., Ortiz, J. V., Cioslowski, J. and Fox, D. J. Gaussian 09, Revision D.01, Wallingford CT, 2009, .
108. Wang, J., Wolf, R. M., Caldwell, J. W., Kollman, P. A. and Case, D. A., Development and Testing of a General Amber Force Field, J. Comput. Chem., 2004, 25, 1157-1174.
109. Wang, J., Wolf, R. M., Caldwell, J. W., Kollman, P. A. and Case, D. A., Junmei Wang, Romain M. Wolf, James W. Caldwell, Peter A. Kollman, and David A. Case, "Development and Testing of a General Amber Force Field"Journal of Computational Chemistry(2004) 25(9) 1157–1174, J. Comput. Chem., 2005, 26, 114-114.
110. Halgren, T. A., Merck Molecular Force Field. I. Basis, Form, Scope, Parameterization, and Performance of Mmff94, J. Comput. Chem., 1996, 17, 490-519.
111. Kolossváry, I. and Guida, W. C., Low Mode Search. An Efficient, Automated Computational Method for Conformational Analysis: Application to Cyclic and Acyclic Alkanes and Cyclic Peptides, J. Am. Chem. Soc., 1996, 118, 5011-5019.
112. Kolossváry, I. and Guida, W. C., Low-Mode Conformational Search Elucidated: Application to C39h80 and Flexible Docking of 9-Deazaguanine Inhibitors into Pnp, J. Comput. Chem., 1999, 20, 1671-1684.
113. Kolossváry, I. and Keserü, G. M., Hessian-Free Low-Mode Conformational Search for Large-Scale Protein Loop Optimization: Application to C-Jun N-Terminal Kinase Jnk3, J. Comput. Chem., 2001, 22, 21-30.
114. Keserû, G. M. and Kolossváry, I., Fully Flexible Low-Mode Docking: Application to Induced Fit in Hiv Integrase, J. Am. Chem. Soc., 2001, 123, 12708-12709.
115. Jorgensen, W. L., Chandrasekhar, J., Madura, J. D., Impey, R. W. and Klein, M. L., Comparison of Simple Potential Functions for Simulating Liquid Water, J. Chem. Phys., 1983, 79, 926-935.
116. Kucerka, N., Nieh, M. P. and Katsaras, J., Fluid Phase Lipid Areas and Bilayer Thicknesses of Commonly Used Phosphatidylcholines as a Function of Temperature, Bba-Biomembranes, 2011, 1808, 2761-2771.
Transmembrane transport of chloride by Squaramides: in silico study
116 University of Aveiro – Masters in Molecular Biomedicine
117. Marques, I., Colaço, A. R., Costa, P. J., Busschaert, N., Gale, P. A. and Félix, V. Tris-Thiourea Tripodal-Based Molecules as Chloride Transmembrane Transporters: Insights from Molecular Dynamics Simulations, 2013, (submitted).
118. Case, D. A., Darden, T. A., Cheatham III, T. E., Simmerling, C. L., Wang, J., Duke, R. E., Luo, R., Walker, R. C., Zhang, W., Merz, K. M., Roberts, B., Hayik, S., Roitberg, A., Seabra, G., Swails, J., Götz, A. W., Kolossváry, I., Wong, K. F., Paesani, F., Vanicek, J., Wolf, R. M., Liu, J., Wu, X., Brozell, S. R., Steinbrecher, T., Gohlke, H., Cai, Q., Ye, X., Wang, J., Antonisse, M. G., Hsieh, M. J., Cui, G., Roe, D. R., Mathews, D. H., Seetin, M. G., Salomon-Ferrer, R., Sagui, C., Babin, V., Luchko, T., Gusarov, S., Kovalenko, A. and P.A., K. Amber12, University of California, San Francisco, 2012, .
119. Bayly, C. I., Cieplak, P., Cornell, W. D. and Kollman, P. A., A Well-Behaved Electrostatic Potential Based Method Using Charge Restraints for Deriving Atomic Charges - the Resp Model, J. Phys. Chem., 1993, 97, 10269-10280.
120. Joung, I. S. and Cheatham, T. E., 3rd, Determination of Alkali and Halide Monovalent Ion Parameters for Use in Explicitly Solvated Biomolecular Simulations, The journal of physical chemistry. B, 2008, 112, 9020-9041.
121. Schrodinger, LLC The Pymol Molecular Graphics System, Version 1.3r1, 2010, .
122. Jo, S., Kim, T. and Im, W., Automated Builder and Database of Protein/Membrane Complexes for Molecular Dynamics Simulations, PloS one, 2007, 2, e880.
123. Darden, T., York, D. and Pedersen, L., Particle Mesh Ewald - an N.Log(N) Method for Ewald Sums in Large Systems, J. Chem. Phys., 1993, 98, 10089-10092.
124. Loncharich, R. J., Brooks, B. R. and Pastor, R. W., Langevin Dynamics of Peptides - the Frictional Dependence of Isomerization Rates of N-Acetylalanyl-N'-Methylamide, Biopolymers, 1992, 32, 523-535.
125. Berendsen, H. J. C., Postma, J. P. M., van Gunsteren, W. F., DiNola, A. and Haak, J. R., Molecular Dynamics with Coupling to an External Bath, The Journal of Chemical Physics, 1984, 81, 3684-3690.
126. Ryckaert, J. P., Ciccotti, G. and Berendsen, H. J. C., Numerical-Integration of Cartesian Equations of Motion of a System with Constraints - Molecular-Dynamics of N-Alkanes, Journal of Computational Physics, 1977, 23, 327-341.
127. Salomon-Ferrer, R., Götz, A. W., Poole, D., Le Grand, S. and Walker, R. C. Routine Microsecond Molecular Dynamics Simulations with Amber on Gpus. 2. Explicit Solvent Particle Mesh Ewald, American Chemical Society, 2013, 9, 3878-3888.
128. Götz, A. W., Williamson, M. J., Xu, D., Poole, D., Le Grand, S. and Walker, R. C. Routine Microsecond Molecular Dynamics Simulations with Amber on Gpus. 1. Generalized Born, American Chemical Society, 2012, 8, 1542-1555.
129. Le Grand, S., Götz, A. W. and Walker, R. C. Spfp: Speed without Compromise—a Mixed Precision Model for Gpu Accelerated Molecular Dynamics Simulations, 2013, 184, 374-380.
130. Loeffler, H. Handy Routines for Ptraj/Cpptraj, 2010, .
131. Siwko, M. E., Marrink, S. J., de Vries, A. H., Kozubek, A., Uiterkamp, A. J. M. S. and Mark, A. E., Does Isoprene Protect Plant Membranes from Thermal Shock? A Molecular Dynamics Study, Bba-Biomembranes, 2007, 1768, 198-206.
132. Huber, T., Rajamoorthi, K., Kurze, V. F., Beyer, K. and Brown, M. F., Structure of Docosahexaenoic Acid-Containing Phospholipid Bilayers as Studied by H-2 Nmr and Molecular Dynamics Simulations, J. Am. Chem. Soc., 2002, 124, 298-309.
Transmembrane transport of chloride by Squaramides: in silico study
University of Aveiro – Masters in Molecular Biomedicine 117
133. Seelig, J. and Waespesarcevic, N., Molecular Order in Cis and Trans Unsaturated Phospholipid Bilayers, Biochemistry (Mosc). 1978, 17, 3310-3315.
134. Perly, B., Smith, I. C. P. and Jarrell, H. C., Effects of the Replacement of a Double-Bond by a Cyclopropane Ring in Phosphatidylethanolamines - a H-2 Nmr-Study of Phase-Transitions and Molecular-Organization, Biochemistry (Mosc). 1985, 24, 1055-1063.
135. Martinez, L., Andrade, R., Birgin, E. G. and Martinez, J. M., Packmol: A Package for Building Initial Configurations for Molecular Dynamics Simulations, J. Comput. Chem., 2009, 30, 2157-2164.

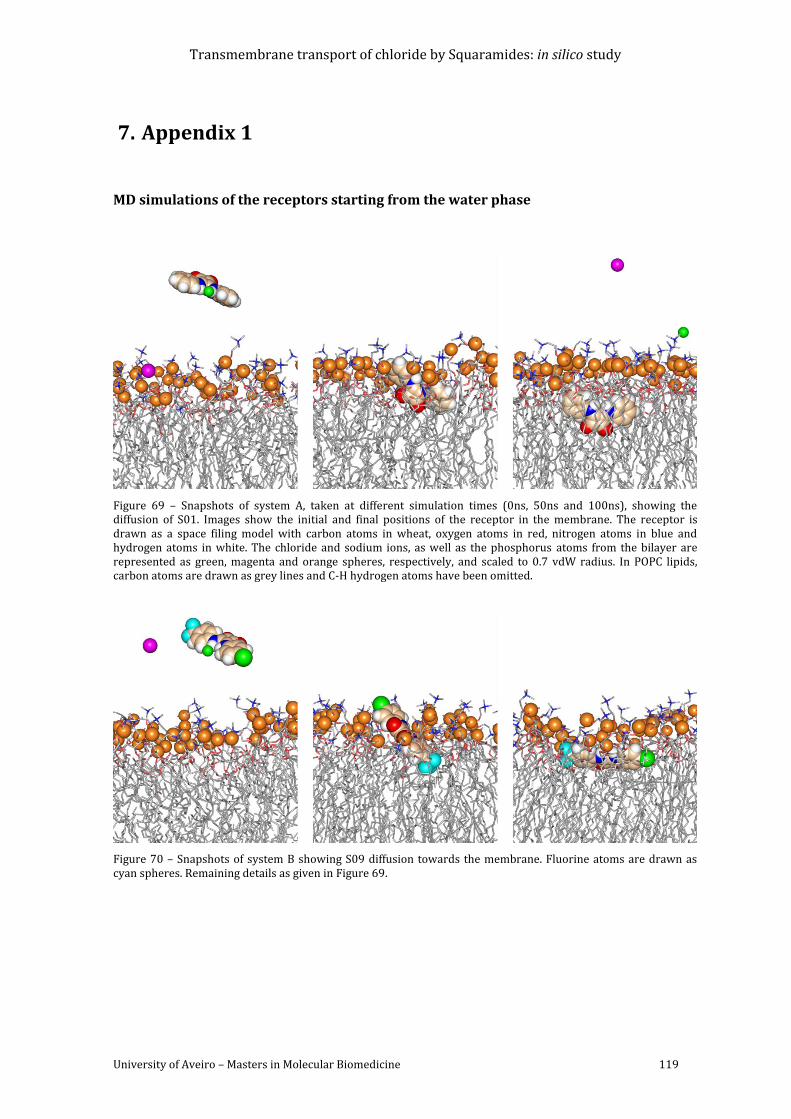
Transmembrane transport of chloride by Squaramides: in silico study
University of Aveiro – Masters in Molecular Biomedicine 119
7. Appendix 1
MD simulations of the receptors starting from the water phase
Figure 69 – Snapshots of system A, taken at different simulation times (0ns, 50ns and 100ns), showing the diffusion of S01. Images show the initial and final positions of the receptor in the membrane. The receptor is drawn as a space filing model with carbon atoms in wheat, oxygen atoms in red, nitrogen atoms in blue and hydrogen atoms in white. The chloride and sodium ions, as well as the phosphorus atoms from the bilayer are represented as green, magenta and orange spheres, respectively, and scaled to 0.7 vdW radius. In POPC lipids, carbon atoms are drawn as grey lines and C-H hydrogen atoms have been omitted.
Figure 70 – Snapshots of system B showing S09 diffusion towards the membrane. Fluorine atoms are drawn as cyan spheres. Remaining details as given in Figure 69.
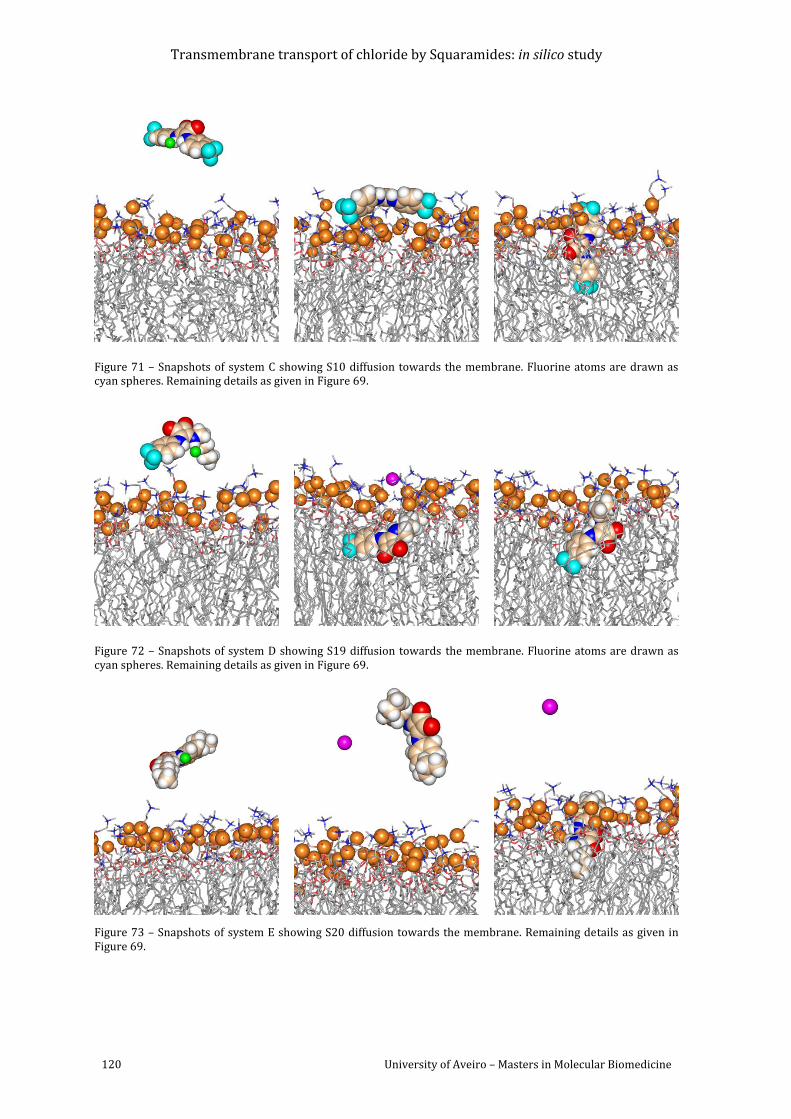
Transmembrane transport of chloride by Squaramides: in silico study
120 University of Aveiro – Masters in Molecular Biomedicine
Figure 71 – Snapshots of system C showing S10 diffusion towards the membrane. Fluorine atoms are drawn as cyan spheres. Remaining details as given in Figure 69.
Figure 72 – Snapshots of system D showing S19 diffusion towards the membrane. Fluorine atoms are drawn as cyan spheres. Remaining details as given in Figure 69.
Figure 73 – Snapshots of system E showing S20 diffusion towards the membrane. Remaining details as given in Figure 69.
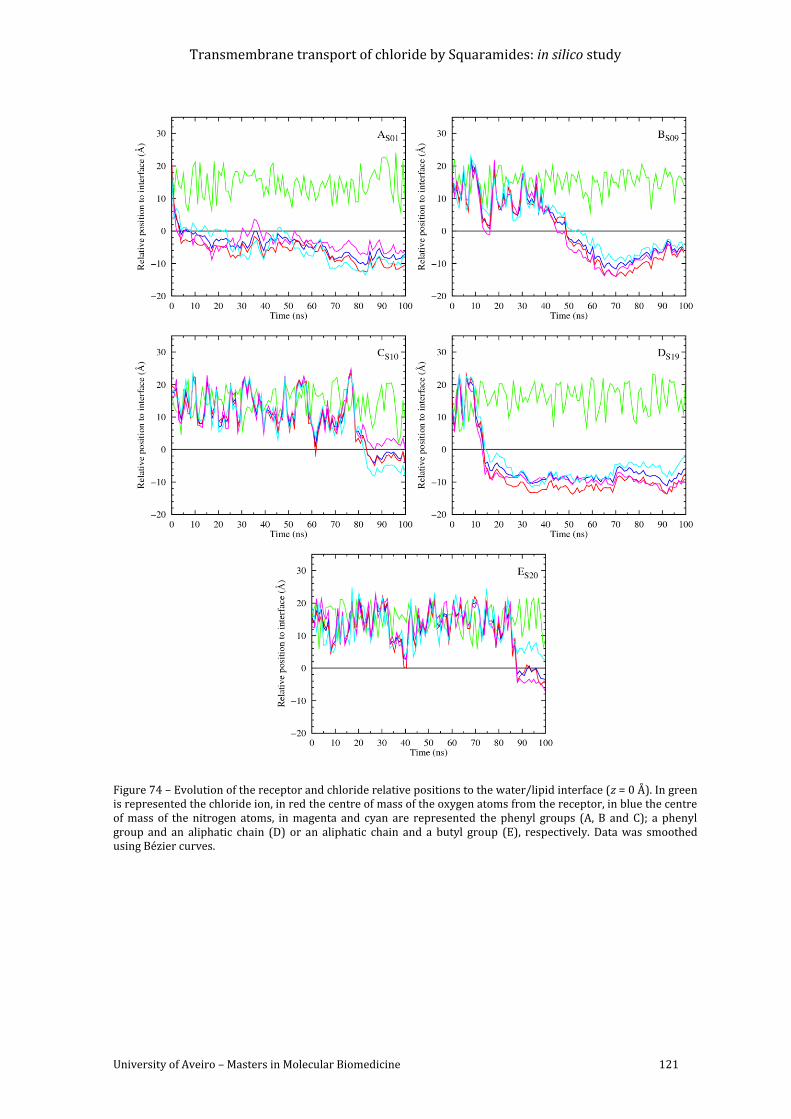
Transmembrane transport of chloride by Squaramides: in silico study
University of Aveiro – Masters in Molecular Biomedicine 121
Figure 74 – Evolution of the receptor and chloride relative positions to the water/lipid interface (z = 0 Å). In green is represented the chloride ion, in red the centre of mass of the oxygen atoms from the receptor, in blue the centre of mass of the nitrogen atoms, in magenta and cyan are represented the phenyl groups (A, B and C); a phenyl group and an aliphatic chain (D) or an aliphatic chain and a butyl group (E), respectively. Data was smoothed using Bézier curves.
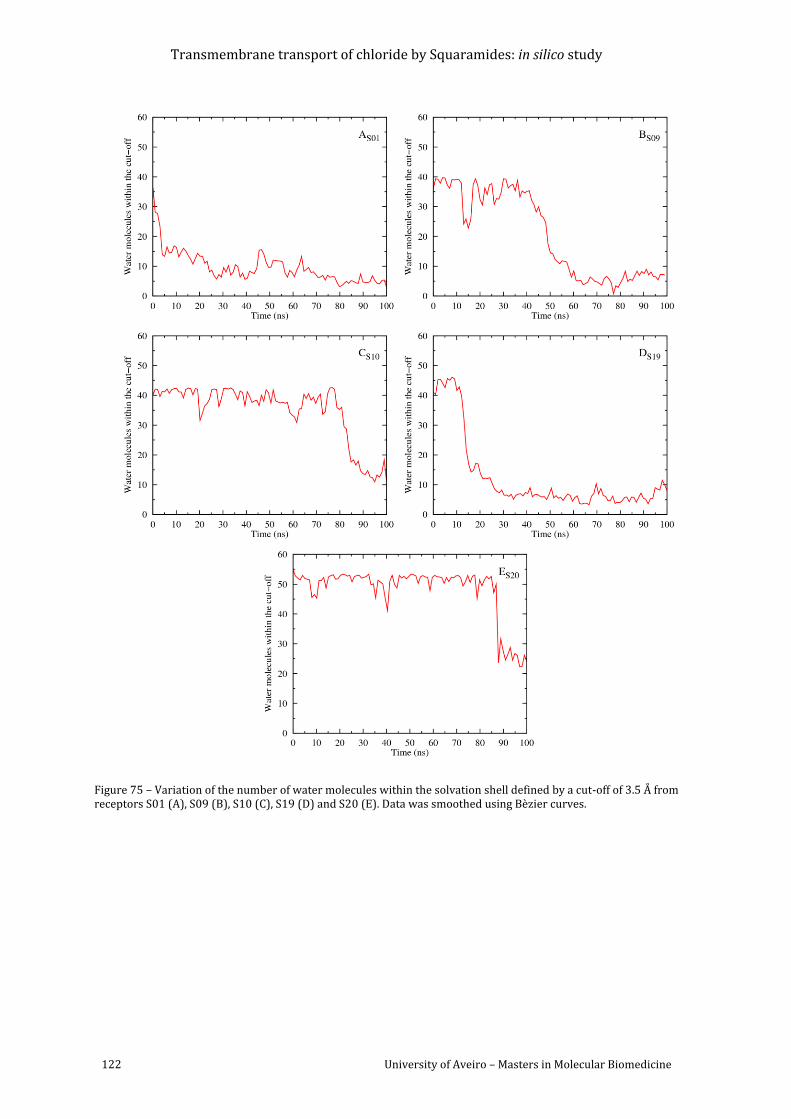
Transmembrane transport of chloride by Squaramides: in silico study
122 University of Aveiro – Masters in Molecular Biomedicine
Figure 75 – Variation of the number of water molecules within the solvation shell defined by a cut-off of 3.5 Å from receptors S01 (A), S09 (B), S10 (C), S19 (D) and S20 (E). Data was smoothed using Bèzier curves.
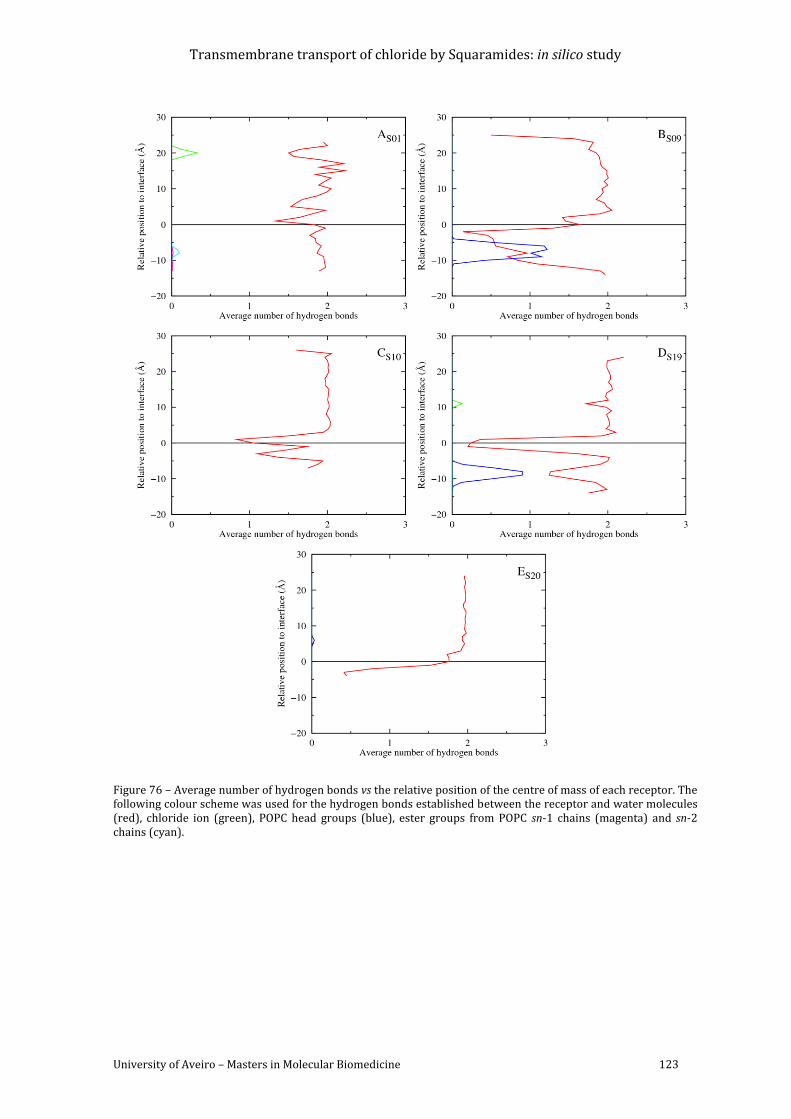
Transmembrane transport of chloride by Squaramides: in silico study
University of Aveiro – Masters in Molecular Biomedicine 123
Figure 76 – Average number of hydrogen bonds vs the relative position of the centre of mass of each receptor. The following colour scheme was used for the hydrogen bonds established between the receptor and water molecules (red), chloride ion (green), POPC head groups (blue), ester groups from POPC sn-1 chains (magenta) and sn-2 chains (cyan).
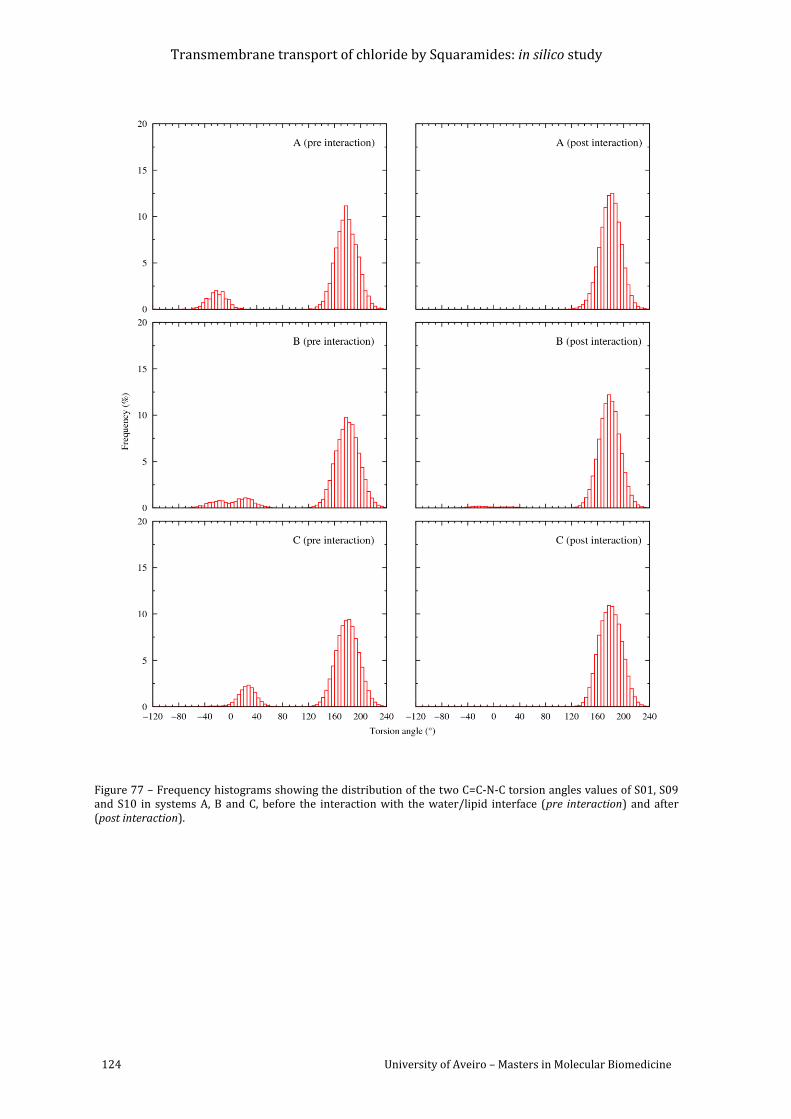
Transmembrane transport of chloride by Squaramides: in silico study
124 University of Aveiro – Masters in Molecular Biomedicine
Figure 77 – Frequency histograms showing the distribution of the two C=C-N-C torsion angles values of S01, S09 and S10 in systems A, B and C, before the interaction with the water/lipid interface (pre interaction) and after (post interaction).
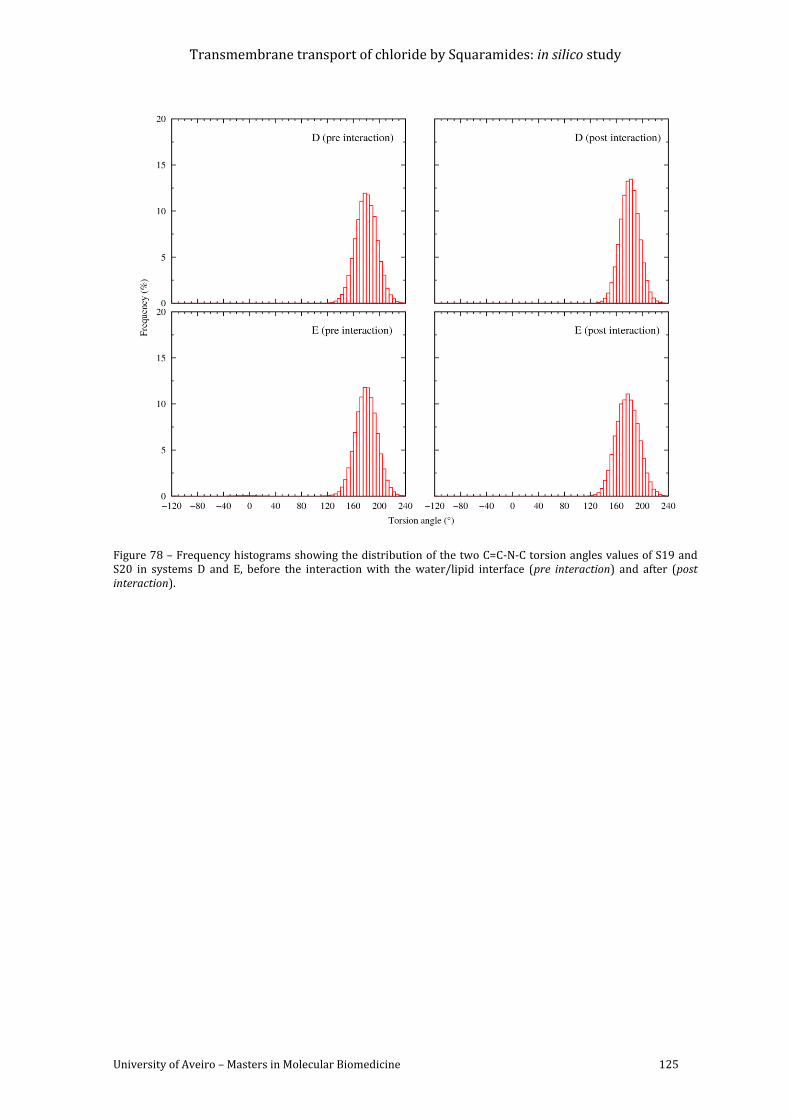
Transmembrane transport of chloride by Squaramides: in silico study
University of Aveiro – Masters in Molecular Biomedicine 125
Figure 78 – Frequency histograms showing the distribution of the two C=C-N-C torsion angles values of S19 and S20 in systems D and E, before the interaction with the water/lipid interface (pre interaction) and after (post interaction).
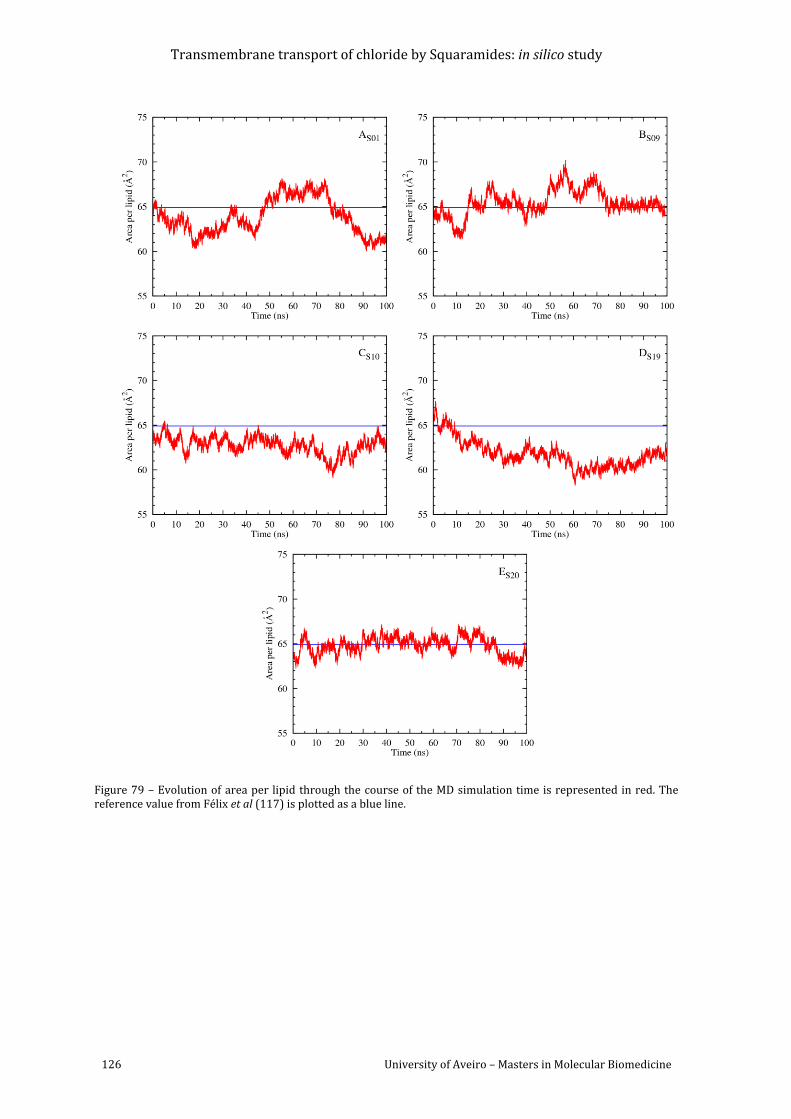
Transmembrane transport of chloride by Squaramides: in silico study
126 University of Aveiro – Masters in Molecular Biomedicine
Figure 79 – Evolution of area per lipid through the course of the MD simulation time is represented in red. The reference value from Félix et al (117) is plotted as a blue line.
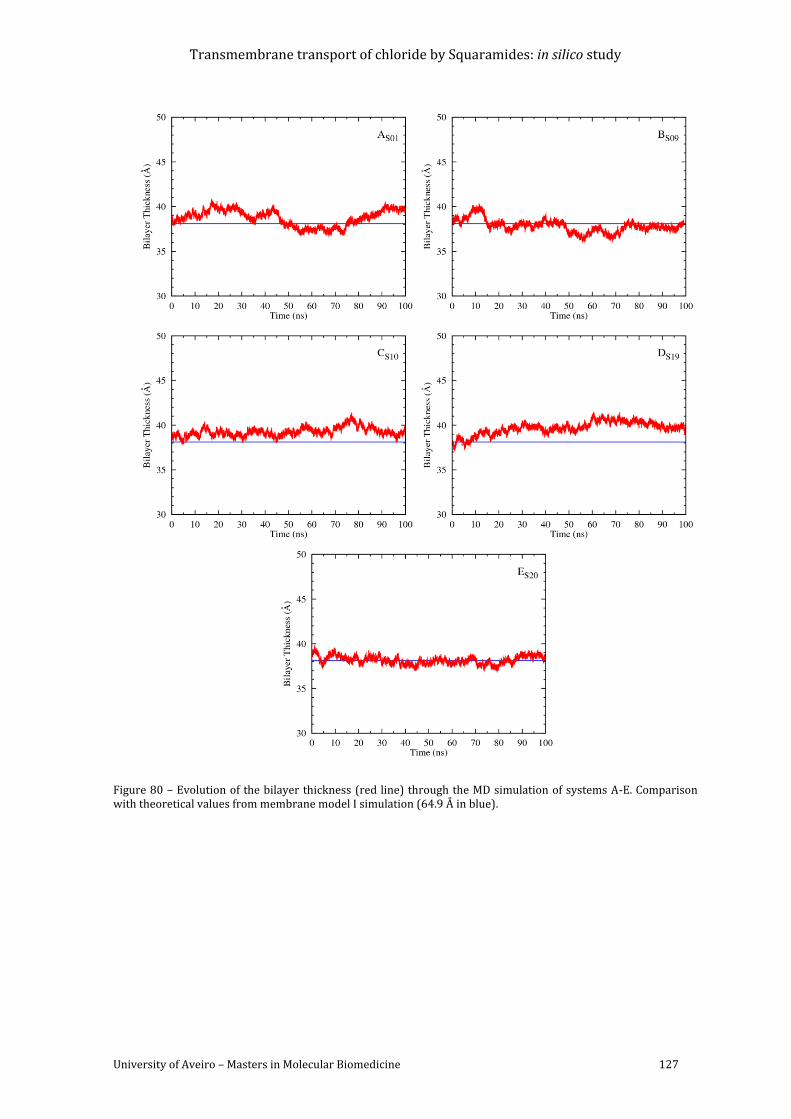
Transmembrane transport of chloride by Squaramides: in silico study
University of Aveiro – Masters in Molecular Biomedicine 127
Figure 80 – Evolution of the bilayer thickness (red line) through the MD simulation of systems A-E. Comparison with theoretical values from membrane model I simulation (64.9 Å in blue).
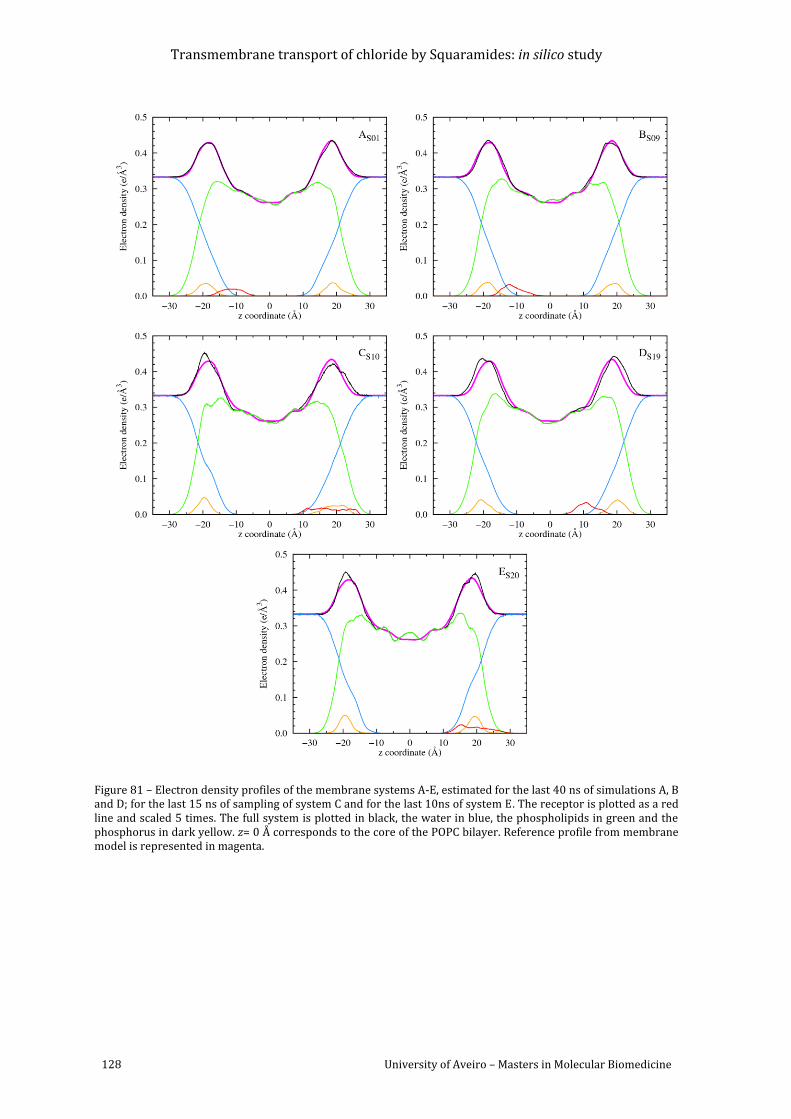
Transmembrane transport of chloride by Squaramides: in silico study
128 University of Aveiro – Masters in Molecular Biomedicine
Figure 81 – Electron density profiles of the membrane systems A-E, estimated for the last 40 ns of simulations A, B and D; for the last 15 ns of sampling of system C and for the last 10ns of system E. The receptor is plotted as a red line and scaled 5 times. The full system is plotted in black, the water in blue, the phospholipids in green and the phosphorus in dark yellow. z= 0 Å corresponds to the core of the POPC bilayer. Reference profile from membrane model is represented in magenta.
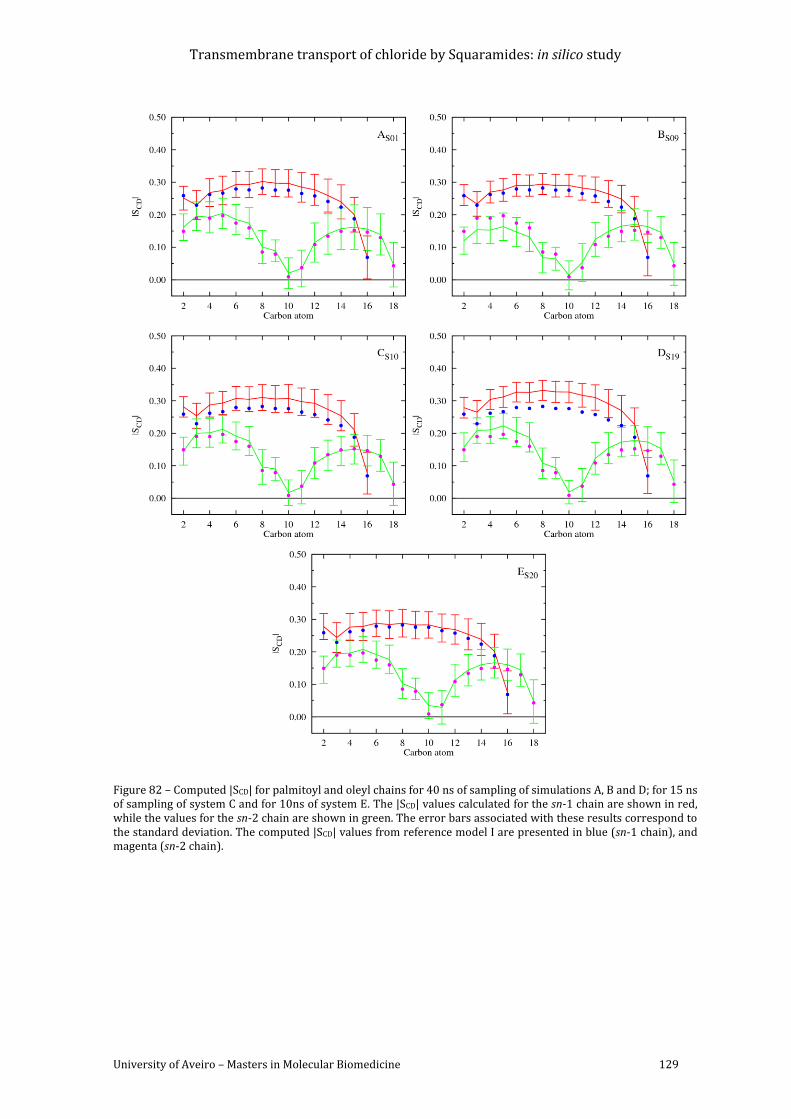
Transmembrane transport of chloride by Squaramides: in silico study
University of Aveiro – Masters in Molecular Biomedicine 129
Figure 82 – Computed |SCD| for palmitoyl and oleyl chains for 40 ns of sampling of simulations A, B and D; for 15 ns of sampling of system C and for 10ns of system E. The |SCD| values calculated for the sn-1 chain are shown in red, while the values for the sn-2 chain are shown in green. The error bars associated with these results correspond to the standard deviation. The computed |SCD| values from reference model I are presented in blue (sn-1 chain), and magenta (sn-2 chain).
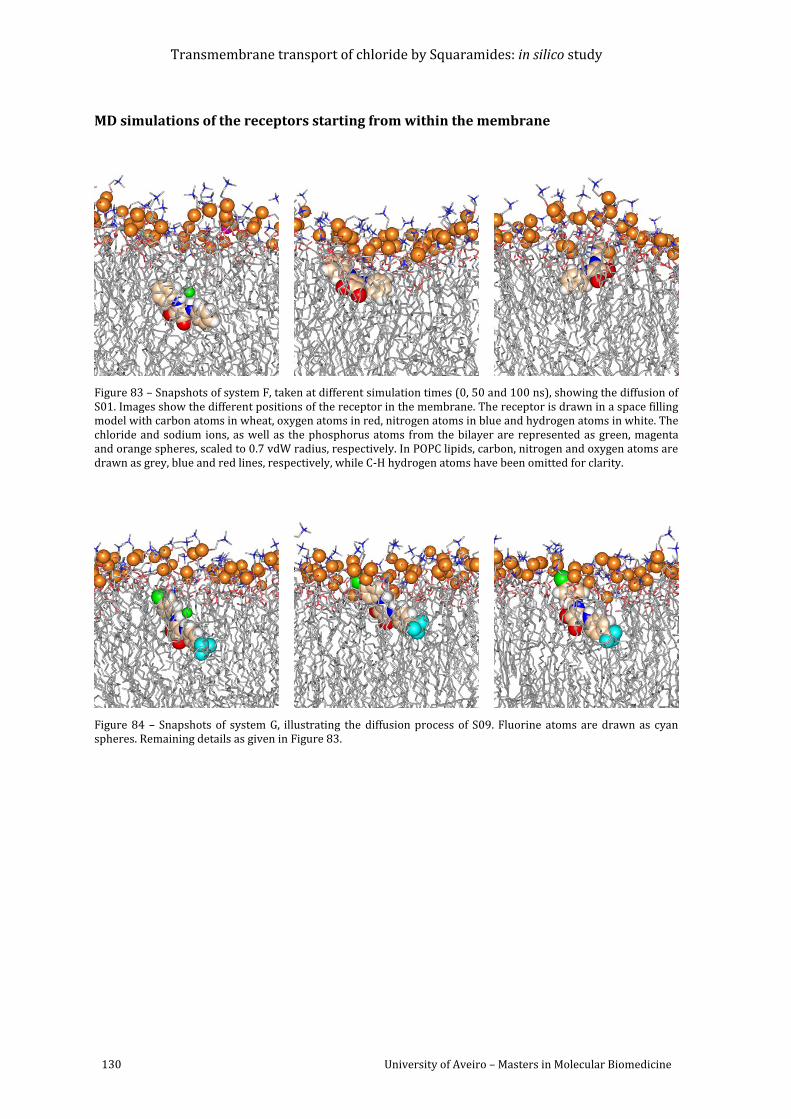
Transmembrane transport of chloride by Squaramides: in silico study
130 University of Aveiro – Masters in Molecular Biomedicine
MD simulations of the receptors starting from within the membrane
Figure 83 – Snapshots of system F, taken at different simulation times (0, 50 and 100 ns), showing the diffusion of S01. Images show the different positions of the receptor in the membrane. The receptor is drawn in a space filling model with carbon atoms in wheat, oxygen atoms in red, nitrogen atoms in blue and hydrogen atoms in white. The chloride and sodium ions, as well as the phosphorus atoms from the bilayer are represented as green, magenta and orange spheres, scaled to 0.7 vdW radius, respectively. In POPC lipids, carbon, nitrogen and oxygen atoms are drawn as grey, blue and red lines, respectively, while C-H hydrogen atoms have been omitted for clarity.
Figure 84 – Snapshots of system G, illustrating the diffusion process of S09. Fluorine atoms are drawn as cyan spheres. Remaining details as given in Figure 83.
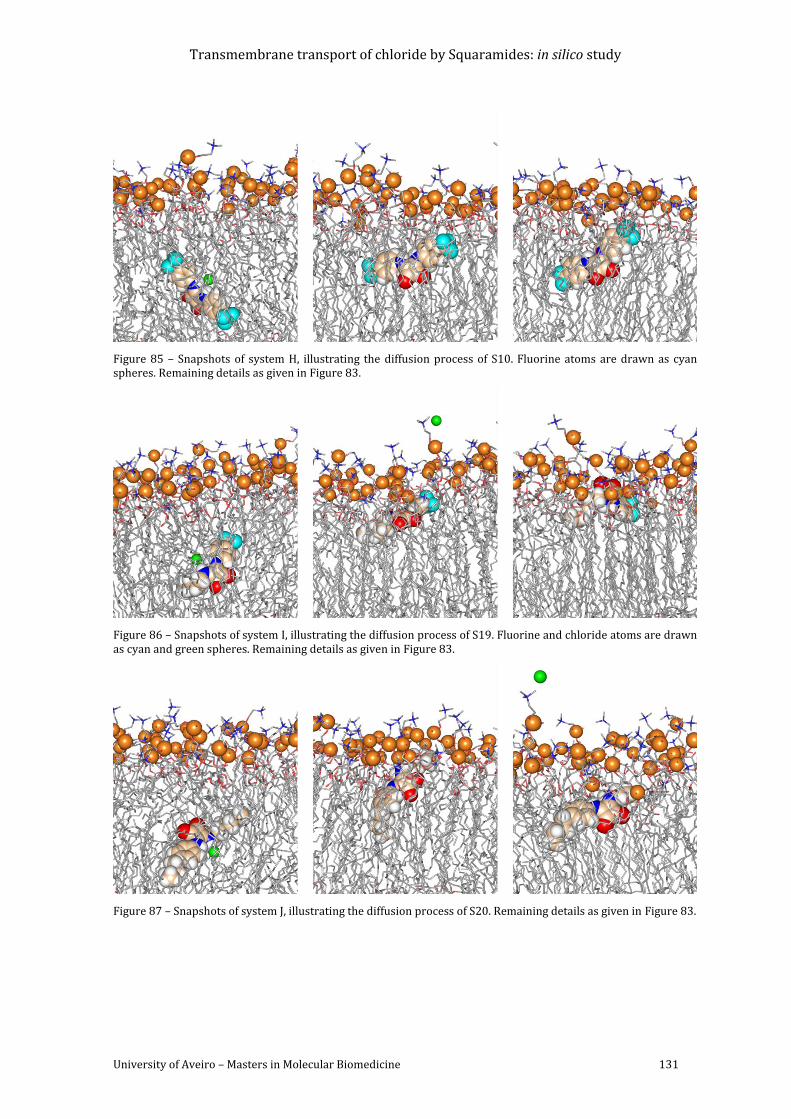
Transmembrane transport of chloride by Squaramides: in silico study
University of Aveiro – Masters in Molecular Biomedicine 131
Figure 85 – Snapshots of system H, illustrating the diffusion process of S10. Fluorine atoms are drawn as cyan spheres. Remaining details as given in Figure 83.
Figure 86 – Snapshots of system I, illustrating the diffusion process of S19. Fluorine and chloride atoms are drawn as cyan and green spheres. Remaining details as given in Figure 83.
Figure 87 – Snapshots of system J, illustrating the diffusion process of S20. Remaining details as given in Figure 83.
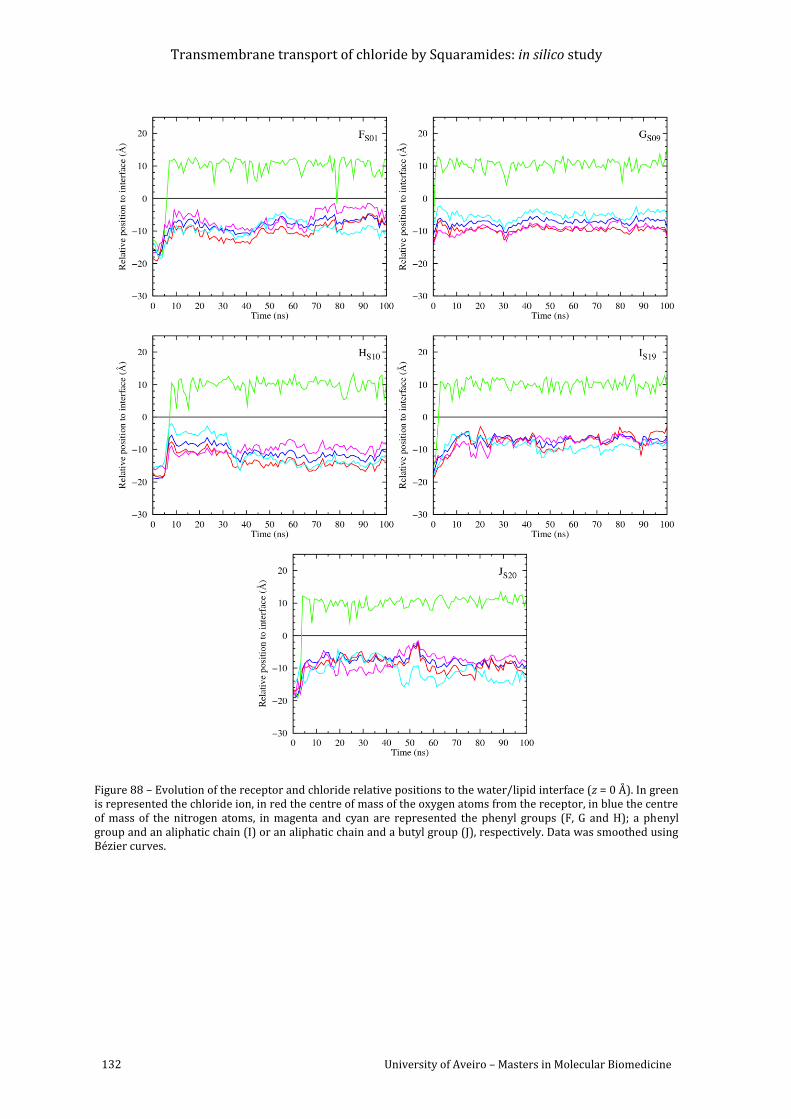
Transmembrane transport of chloride by Squaramides: in silico study
132 University of Aveiro – Masters in Molecular Biomedicine
Figure 88 – Evolution of the receptor and chloride relative positions to the water/lipid interface (z = 0 Å). In green is represented the chloride ion, in red the centre of mass of the oxygen atoms from the receptor, in blue the centre of mass of the nitrogen atoms, in magenta and cyan are represented the phenyl groups (F, G and H); a phenyl group and an aliphatic chain (I) or an aliphatic chain and a butyl group (J), respectively. Data was smoothed using Bézier curves.
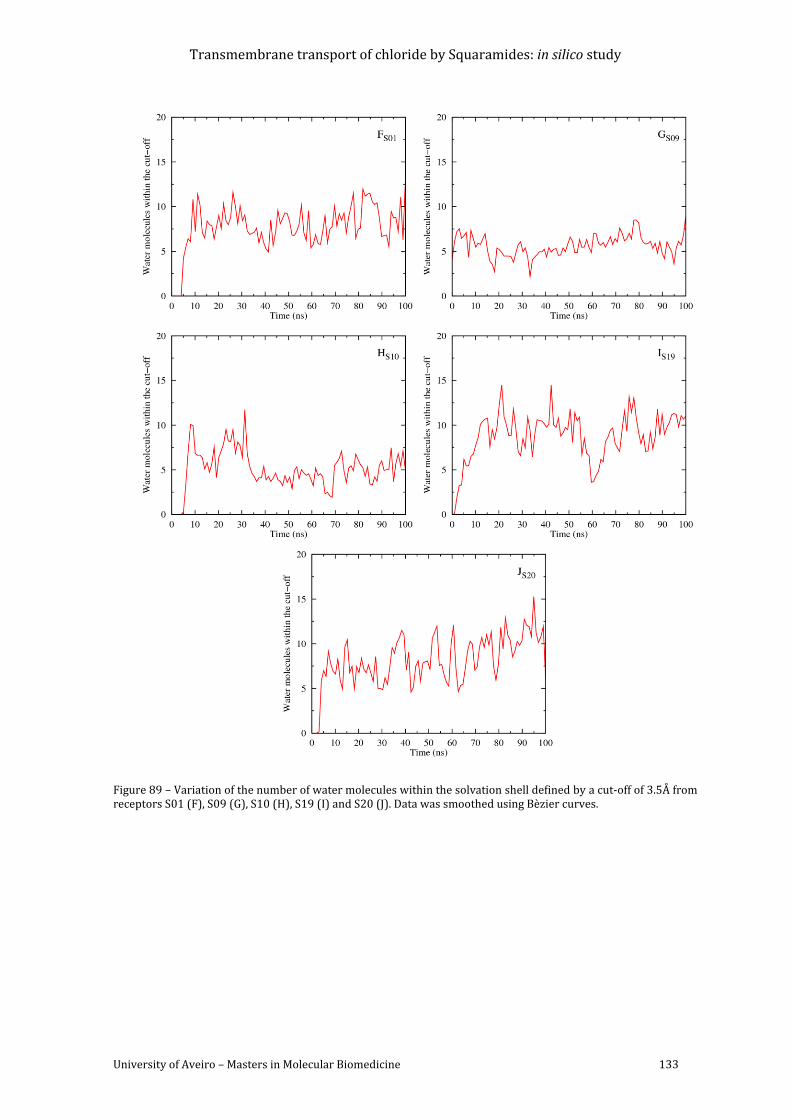
Transmembrane transport of chloride by Squaramides: in silico study
University of Aveiro – Masters in Molecular Biomedicine 133
Figure 89 – Variation of the number of water molecules within the solvation shell defined by a cut-off of 3.5Å from receptors S01 (F), S09 (G), S10 (H), S19 (I) and S20 (J). Data was smoothed using Bèzier curves.
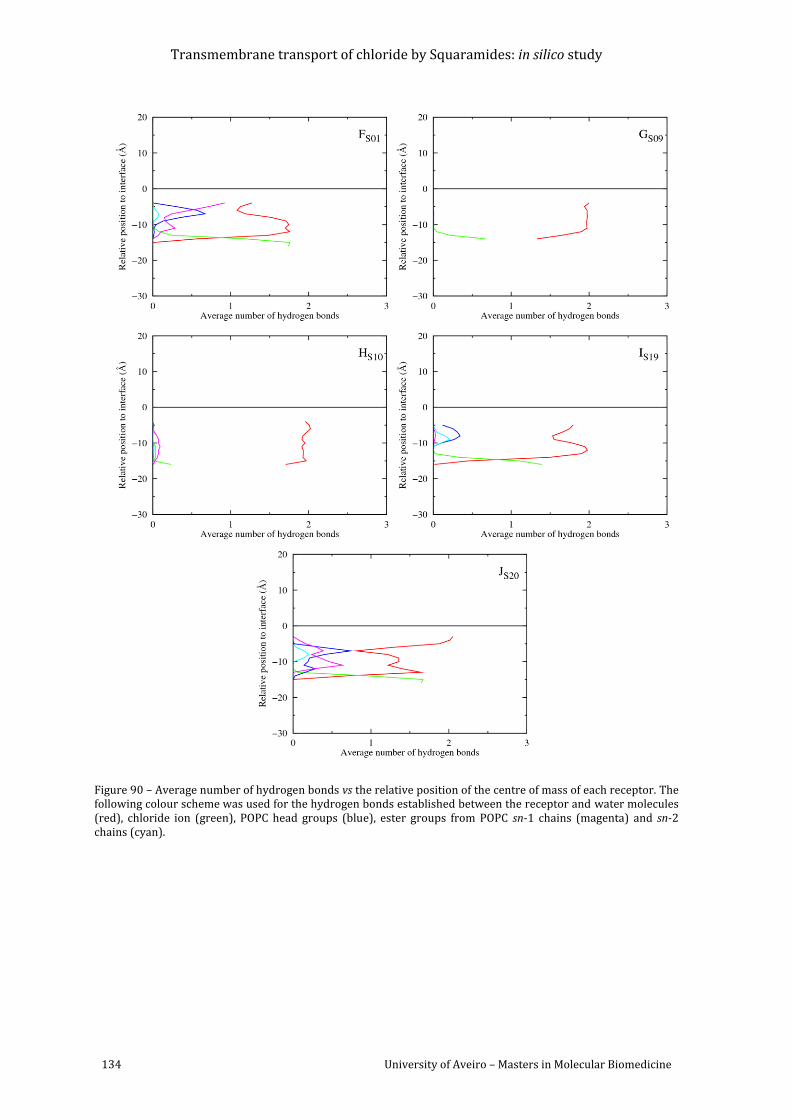
Transmembrane transport of chloride by Squaramides: in silico study
134 University of Aveiro – Masters in Molecular Biomedicine
Figure 90 – Average number of hydrogen bonds vs the relative position of the centre of mass of each receptor. The following colour scheme was used for the hydrogen bonds established between the receptor and water molecules (red), chloride ion (green), POPC head groups (blue), ester groups from POPC sn-1 chains (magenta) and sn-2 chains (cyan).
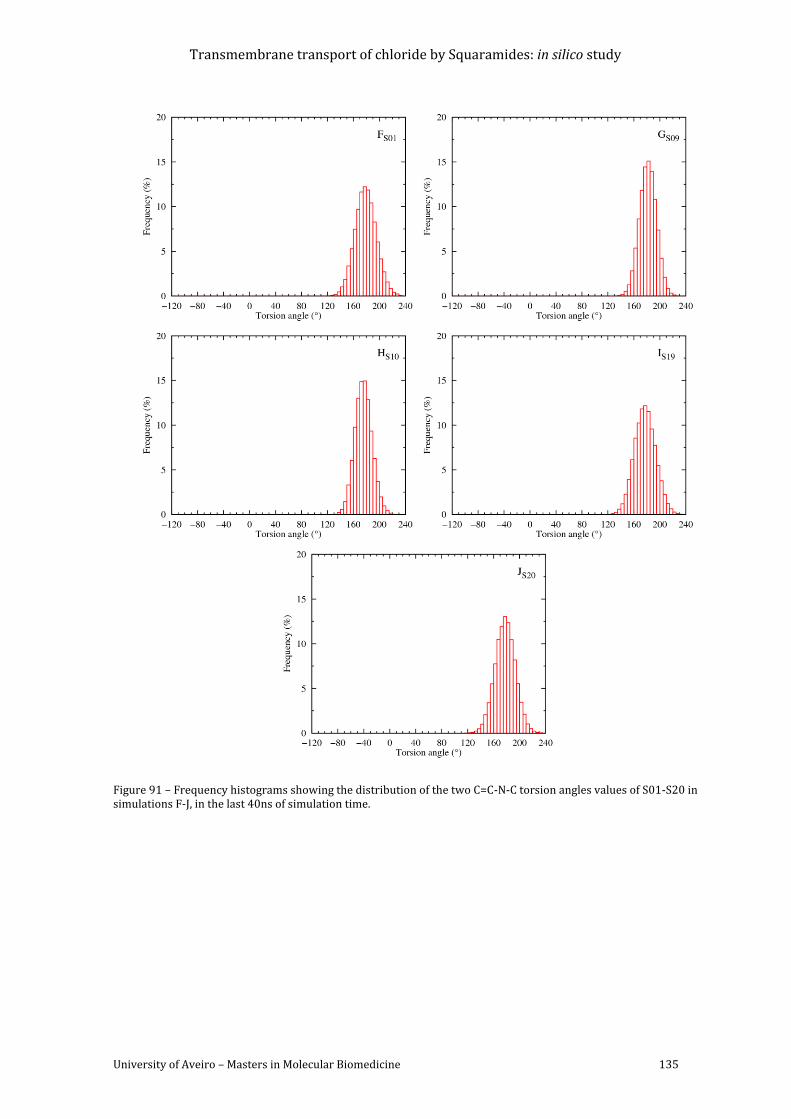
Transmembrane transport of chloride by Squaramides: in silico study
University of Aveiro – Masters in Molecular Biomedicine 135
Figure 91 – Frequency histograms showing the distribution of the two C=C-N-C torsion angles values of S01-S20 in simulations F-J, in the last 40ns of simulation time.
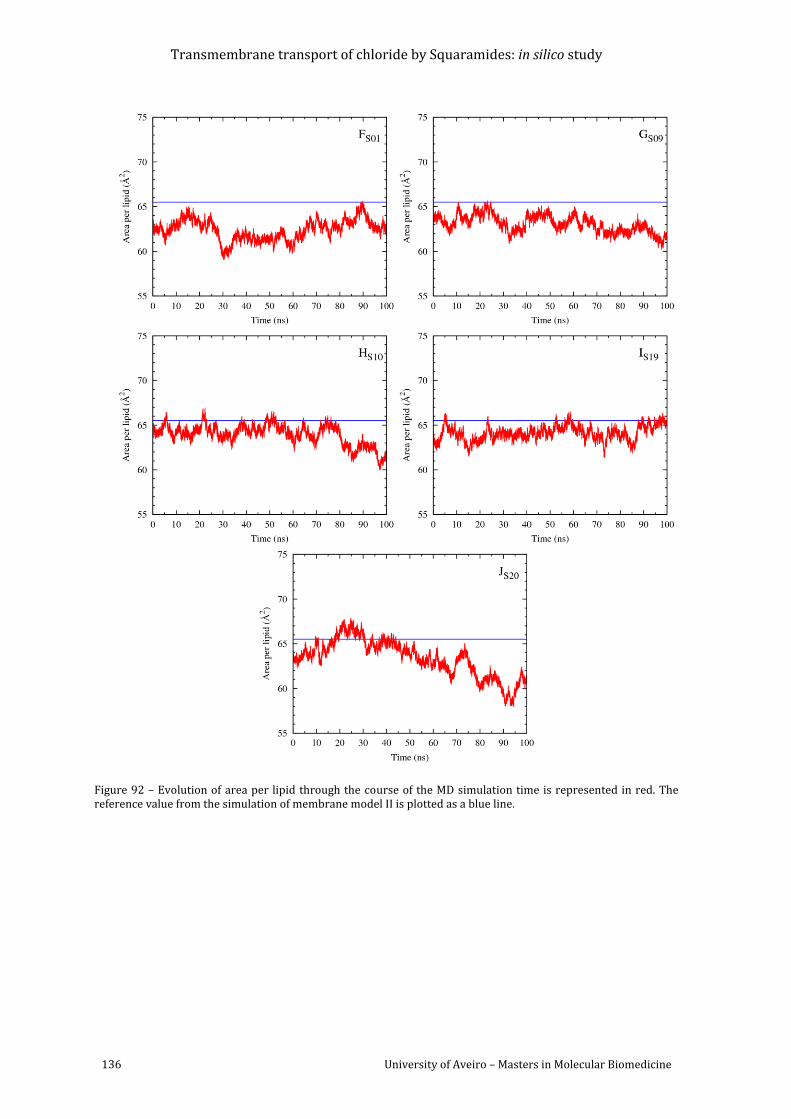
Transmembrane transport of chloride by Squaramides: in silico study
136 University of Aveiro – Masters in Molecular Biomedicine
Figure 92 – Evolution of area per lipid through the course of the MD simulation time is represented in red. The reference value from the simulation of membrane model II is plotted as a blue line.
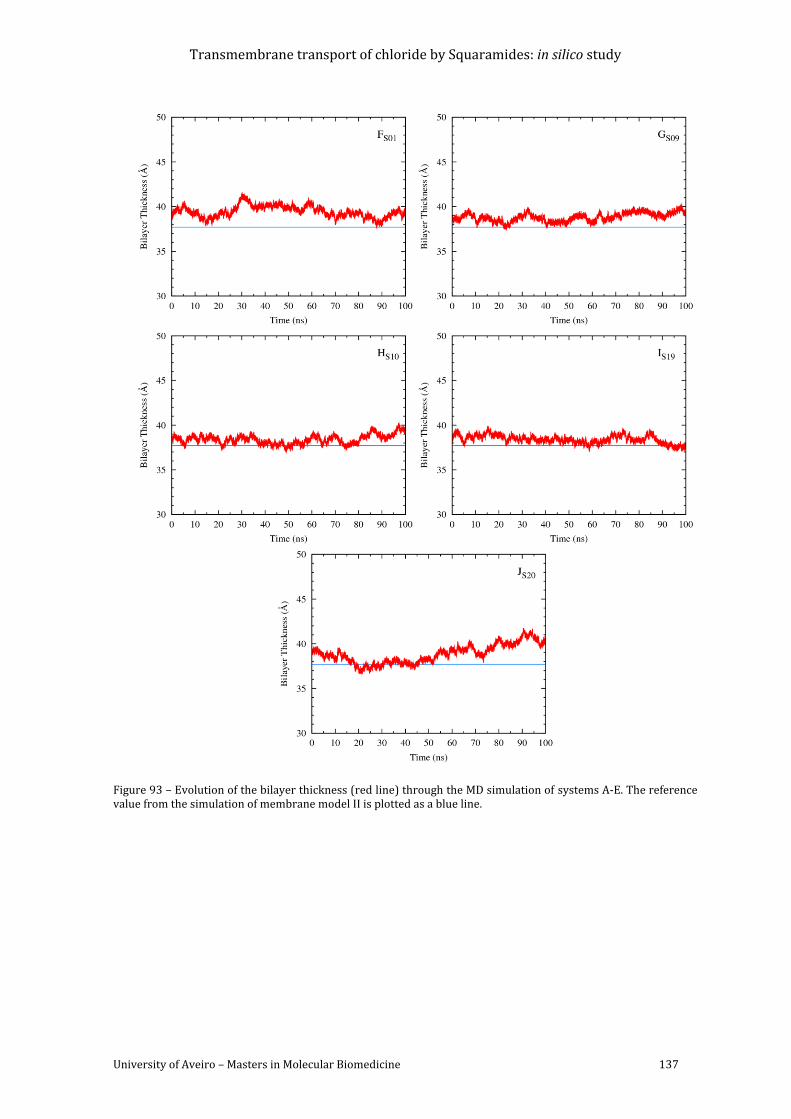
Transmembrane transport of chloride by Squaramides: in silico study
University of Aveiro – Masters in Molecular Biomedicine 137
Figure 93 – Evolution of the bilayer thickness (red line) through the MD simulation of systems A-E. The reference value from the simulation of membrane model II is plotted as a blue line.
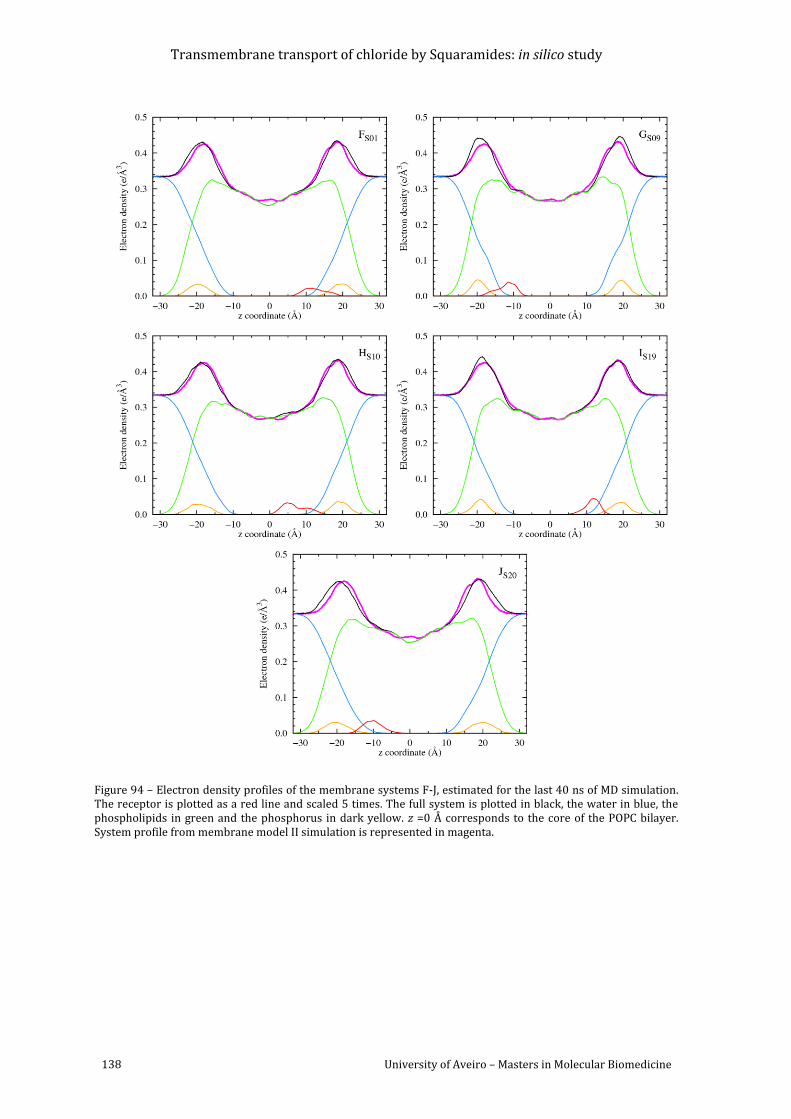
Transmembrane transport of chloride by Squaramides: in silico study
138 University of Aveiro – Masters in Molecular Biomedicine
Figure 94 – Electron density profiles of the membrane systems F-J, estimated for the last 40 ns of MD simulation. The receptor is plotted as a red line and scaled 5 times. The full system is plotted in black, the water in blue, the phospholipids in green and the phosphorus in dark yellow. z =0 Å corresponds to the core of the POPC bilayer. System profile from membrane model II simulation is represented in magenta.
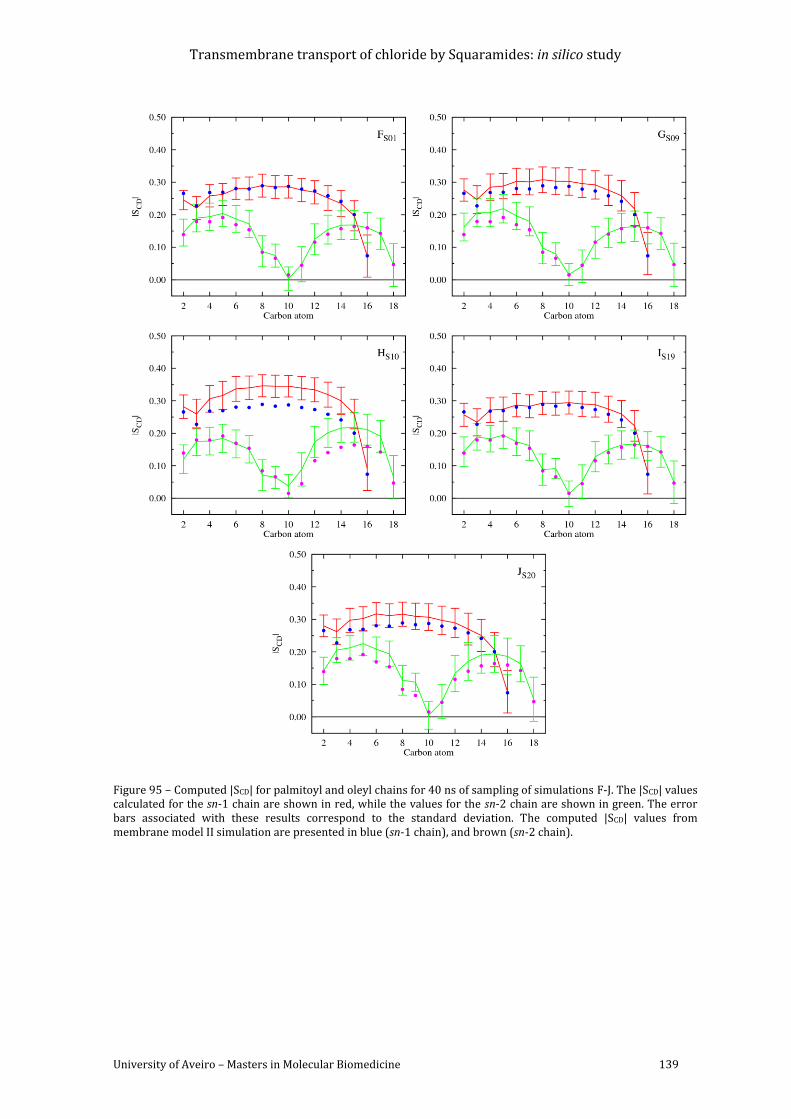
Transmembrane transport of chloride by Squaramides: in silico study
University of Aveiro – Masters in Molecular Biomedicine 139
Figure 95 – Computed |SCD| for palmitoyl and oleyl chains for 40 ns of sampling of simulations F-J. The |SCD| values calculated for the sn-1 chain are shown in red, while the values for the sn-2 chain are shown in green. The error bars associated with these results correspond to the standard deviation. The computed |SCD| values from membrane model II simulation are presented in blue (sn-1 chain), and brown (sn-2 chain).


