Embed Size (px)
Citation preview
EVALUATING THE VIABILITY OF HEMP FIBRE IN STONE MATRIX
ASPHALT
Submitted in partial fulfillment of the requirement for the award of the
degree of
MASTER OF TECHNOLOGY
In
Transportation Engineering
(Civil Engineering)
By
CHANDER SEN DUTT
(11512393)
SUPERVISOR
MR. NITIN BHARDWAJ
School of Civil Engineering
LOVELY PROFESSIONAL UNIVERSITY, PHAGWARA
2017
i
DECLARATION
I, Chander Sen Dutt hereby declare that the project report entitled, “EVALUATING THE
VIABILITY OF HEMP FIBRE IN STONE MATRIX ASPHALT” is submitted in the
partial fulfillment of the requirements for the award of degree of Master of Civil Engineering , in
the school of Civil Engineering at Lovely professional University Phagwara. This is my own
work and the results are presented in this report. The material is not copied from any source or
from any institution.
Date: Chander Sen Dutt
Place: (11512393)
ii
CERTIFICATE
Certified that this project report entitled “ EVALUATING THE VIABILITY OF HEMP
FIBRE IN STONE MATRIX ASPHALT”, submitted individually by Chander Sen Dutt
student of Civil Engineering , Lovely professional University Phagwara, carried out the work
under my supervision for the award of degree. This report has not been submitted to any other
university/institution for the award of any degree.
Signature of Supervisor
Nitin Bhardwaj
Assistant Professor
School of Civil Engineering
iii
ACKNOWLEDGEMENT
I am profoundly thankful to my dissertation mentor who took interest on my project work and
helped me all along for its completion by providing the required information for acquiring some
authentic results in my report. I am thankful to get a regular support from all my teaching staff of
the department of civil engineering. I thank to all my colleagues, my friends, my parents who
helped me all along to complete my research and thesis work which would not be possible
without their support. I also thank to my HOD Mrs. Man deep Kaur and our Dean Dr V. Rajesh
Kumar for their esteem support. At last I thank to my university management for making this
project successful by providing necessary information and resources.
Signature of student
Chander Sen Dutt
iv
ABSTRACT
SMA Mix is a mixture which differs from a normal bituminous mix on the basis of quantity of
coarse aggregates. In SMA the assemblage of coarse aggregates is kept high and the materials
other added are binder, filler and fibers. The basic purpose of adding fiber to SMA Mix is to
make the mix stabilized. Various fibers which are added to SMA can be some natural fiber,
polymer or synthetic fibers. Because of high amount of coarse aggregates in SMA, it makes the
structure’s skeleton more firms and there is efficient allocation of load distribution network. The
thick asphalt film with binder exhibits durability of the mix. The fibers helps in averting the
drain down of the mix and make the pavement’s texture rough enough to achieve friction
attribute when the top binder film gets removed by the action of traffic. On the basis of structural
behavior of SMA it makes the mix resistant to rutting, more durability and hence increases the
service life of the pavement.
In this project an effort is made to go through the various engineering properties of the SMA by
adding some non conventional fiber called hemp fiber to it. This fiber made from Cannabis plant
is generally considered as waste in India and is of no use yet here. According to the previous
research various fibers added to SMA Mix were taken as per MORT&H specifications when 0.3
% of fiber was added to SMA. In this research the fiber added was Hemp fiber and various
engineering properties of SMA Mix were studied and checked by conducting Marshall Test to
meet the desirable standards for the mix.
v
TABLE OF CONTENTS
DESCRIPTION PAGE No.
DECLARATION i
CERTIFICATE ii
ACKNOWLEDGEMENT iii
ABSTRACT iv
CONTENTS v
LIST OF FIGURES viii
LIST OF TABLES ix
LIST OF ABBREVIATIONS x
CHAPTER 1: INTRODUCTION 1-3
1.1 General 1
1.2 Scope of study 2
1.3 Advantages of SMA over conventional mix 2
1.4 Objective of study 3
CHAPTER 2: LITERATURE REVIEW 4-8
2.1 Previous studies 4
2.2 Bituminous mix design 6
vi
2.3 Bituminous mix properties 7
2.4 Bituminous mix design concrete 8
CHAPTER 3: RESEARCH METHOD AND MATERIAL CHARACTERIZATION 10-27
3.1 Methodologies 10
3.2 Material characterizations 10
3.2.1 Mineral aggregates 11
3.2.2 Mineral filler 11
3.2.3 Bitumen as binder 13
3.2.4 Stabilizing additives 13
3.3 Hemp fiber 14
3.3.1 Extraction of hemp fiber 14
3.3.2 Characteristic of hemp fiber 15
3.4 Experiments to be performed 16
3.4.1 Test done for coarse aggregates 16
3.4.2 Test done for fine aggregates 17
3.4.3 Test done for bitumen 18
3.4.4 Test done for filler 18
3.4.5 Test done for bituminous mix 19
3.4.6 Marshall test 24
3.4.7 Test procedure 26
3.4.8 Parameters used 27
CHAPTER 4: RESULTS AND DISCUSSIONS 29-42
4.1 Laboratory investigations 29
4.1.1 Gradation of aggregates 29
4.1.2 Aggregate test result 30
4.1.3 Binder test result 31
vii
4.1.4 Sieve analysis for mix 32
4.2 Marshall test results 34
4.3 Graphs obtained 35
4.3.1 Stability vs. binder content 35
4.3.2 Flow value vs. binder content 36
4.3.3 VMA vs. binder content 37
4.3.4 VFB vs. binder content 38
4.3.5 Volume of voids vs. binder content 39
4.3.6 Unit weight vs. binder content 40
4.4 Determinations of mix design parameters 41
4.5 Interpretations of results 42
CHAPTER 5: CONCLUSION AND FUTURE SCOPE 44
5.1 Concluding remarks 44
5.2 Future scope 44
REFERENCES 45
viii
LIST OF FIGURES
FIGURE No. DESCRIPTION PAGE No.
1.1 Gap graded mix structure (SMA) 2
3.1 Methodology 10
3.2 Fly ash 12
3.3 Hemp fiber (stabilizer) 15
3.4 Mixing of samples 20
3.5 Hammering of mould 21
3.6 Cylindrical hammer 22
3.7 A typical sample 23
3.8 Samples prepared 24
3.9 Breaking head with sample 25
3.10 Sample without fiber and with fiber 26
4.1 Gradation of aggregates 29
4.2 Stability vs. binder content 36
4.3 Flow value vs. binder content 37
4.4 VMA vs. binder content 38
4.5 VFB vs. binder content 39
4.6 Volume of voids vs. binder content 40
4.7 Unit weight vs. binder content 41
ix
LIST OF TABLES
TABLE NO. DESCRIPTION PAGE No.
3.1 Physical requirement of aggregates for SMA 11
3.2 Properties of Fly Ash (Class F) 12
3.3 Desirable properties of bitumen (VG-30) 13
3.4 Chemical composition of Hemp fiber 16
3.5 Chemical composition of other natural fibers 16
3.6 Composition of SMA Mix 19
4.1 Gradation of aggregates 29
4.2 Los Angeles test 30
4.3 Impact value test 30
4.4 Crushing value test 30
4.5 Flakiness and Elongation index test 30
4.6 Specific gravity test 31
4.7 Water absorption test 31
4.8 Bitumen test results 31
4.9 Gradation of samples without fiber 32
4.10 Gradation of samples with fiber 32
4.11 Stability and flow value for samples without fiber 33
4.12 Stability and flow value for samples with fiber 34
4.13 Marshal parameters for samples with fiber 35
4.14 Stability vs. binder content 35
4.15 Flow value vs. binder content 36
4.16 VMA vs. binder content 37
4.17 VFB vs. binder content 38
4.18 Volume of voids vs. binder content 39
4.19 Unit weight vs. binder content 40
4.20 Various mix parameters at 4% air voids 41
x
LIST OF ABBREVIATIONS
ABBREVIATIONS FULL FORM
VG Viscosity grade
Rpm Rotation per minute
% age Percentage
Cum Cumulative
STD Standard specifications
DBM Dense bituminous macadam
SMA Stone matrix asphalt
Min minute
Cm centimeter
Mm millimeter
Gm Bulk specific gravity
Kg Kilogram
KN Kilo Newton
Gm Bulk specific gravity
Gt Theoretical specific gravity
Va Volume of air voids
VMA Voids filled with mineral aggregates
VFB Voids filled with bitumen
OBC Optimum binder content
OFC Optimum fiber content
HMA Hot mix asphalt
IRC Indian road congress
Mort&h Ministry of road transport and highways
ASTM American society for testing and materials
1
CHAPTER 1
INTRODUCTION
1.1 General.
In mid 1960 European black-top production companies was in necessitate of a surface course to
oppose rutting, scraped area and troubles because of overwhelming movement of traffic and
studded tires. Therefore S .MA was produced. It was initially created in .Germany and because of
its predominant exhibitions SMA was in the long run included as an institutionalized mix class in
their asphalt details. Because of its higher groove resistance and sturdiness it is widely utilized as
a part of other European nations for more than two decades. As an after effect of this extensive
achievement accomplished by Europe, different nations as well as India have begun utilizing
S.MA or looking into on its usage and reasonability for their asphalt mixes.
Different reviews uncovers that utilization of SMA for surfacing street asphalts is required to
fundamentally expand the toughness and groove confrontation of the mixes.SMA is a mix
contains 70-80 percentage coarse total of aggregate with little fine aggregates in overall mass, 5-
7 percentage of binder, .8-12 percentage of filler, and around 0.3-0.5.percentage of fiber or
modifier. Since coarse aggregates don't distort as much as black-top folio under load, this stone-
on-stone contact incredibly decreases rutting. In this manner utilization of high coarse total give
better rut resistance and skid resistance .Due to high substance of bitumen it fills the voids
between the totals affectively and ties them together, consequently adding to its solidness from
untimely splitting and raveling. A potential issue connected with SMA is drainage and bleeding.
Draining is brought about because of trouble in getting the vital compaction. More bitumen
content causes seepage, and as capacity and situation temperatures cannot be brought down and
it remain a noteworthy issue connected with S .MA .Therefore balancing out added substances,
for example, fibers , rubbers and polymers are being utilized to harden the framework along
these lines lessening the drawdown, bleeding altogether .
The diverse types of stabilize agent which are used in S.MA are by and large costly consequently
there exist a need to acquire an alternative, bring down cost stabilizers that will essentially serve
a similar goal, likewise as got by utilizing other regularly utilized stabilizing additive substances.
Henceforth here we attempted to utilize a common fiber, in particular the hemp fiber in SMA
Mix.
2
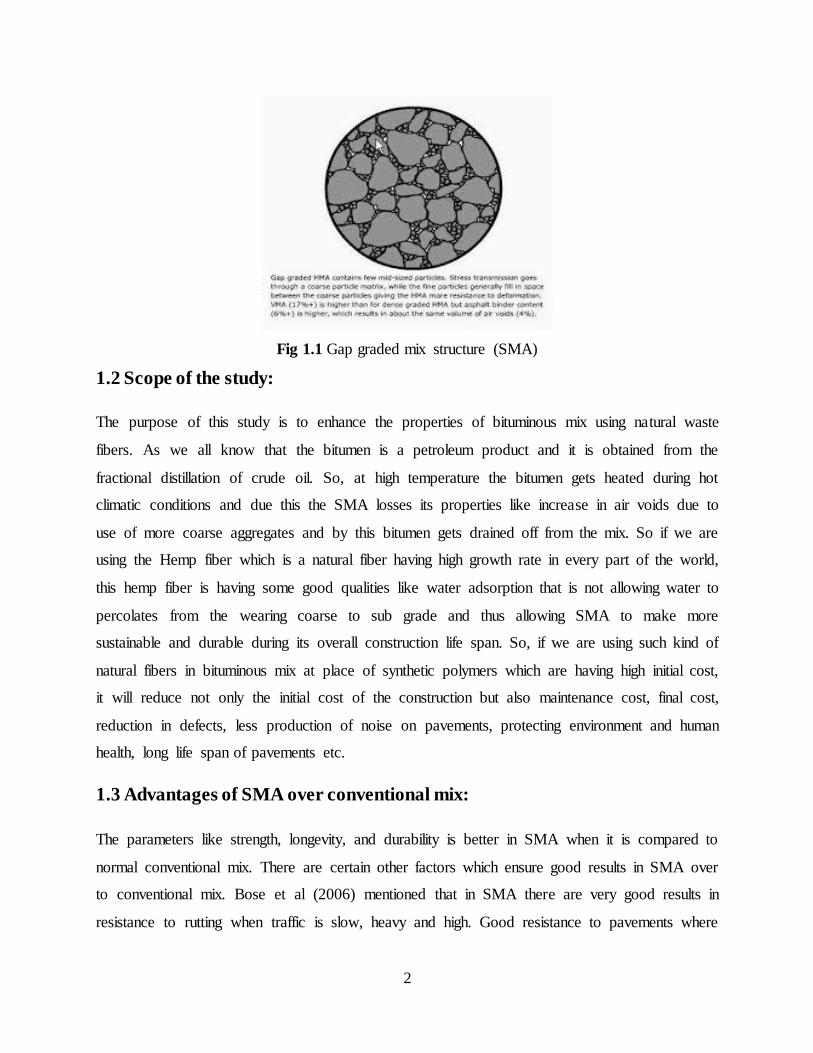
Fig 1.1 Gap graded mix structure (SMA)
1.2 Scope of the study:
The purpose of this study is to enhance the properties of bituminous mix using natural waste
fibers. As we all know that the bitumen is a petroleum product and it is obtained from the
fractional distillation of crude oil. So, at high temperature the bitumen gets heated during hot
climatic conditions and due this the SMA losses its properties like increase in air voids due to
use of more coarse aggregates and by this bitumen gets drained off from the mix. So if we are
using the Hemp fiber which is a natural fiber having high growth rate in every part of the world,
this hemp fiber is having some good qualities like water adsorption that is not allowing water to
percolates from the wearing coarse to sub grade and thus allowing SMA to make more
sustainable and durable during its overall construction life span. So, if we are using such kind of
natural fibers in bituminous mix at place of synthetic polymers which are having high initial cost,
it will reduce not only the initial cost of the construction but also maintenance cost, final cost,
reduction in defects, less production of noise on pavements, protecting environment and human
health, long life span of pavements etc.
1.3 Advantages of SMA over conventional mix:
The parameters like strength, longevity, and durability is better in SMA when it is compared to
normal conventional mix. There are certain other factors which ensure good results in SMA over
to conventional mix. Bose et al (2006) mentioned that in SMA there are very good results in
resistance to rutting when traffic is slow, heavy and high. Good resistance to pavements where
3
temperature fluctuation is very high and also at high temperature prone pavements. Resistance to
skid factor is increased, in conventional mix pavements the degree of noise is high as compared
to SMA pavements which produce less noise .SMA ensures good resistance to cracking and
fatigue at low temperatures, durability of pavement is increased and also lowers the permeability
rate and sensitivity to moisture. According to Brown and Manglorkar (1993) SMA Mix provides
good resistance to plastic deformation when there is heavy traffic with high tire pressure. Due to
rough texture in SMA it provides good friction between tires and pavement when the upper film
of binder on pavement gets removed due to traffic and lowering the skid factor. Even though the
cost of SMA Mix is 15 to 25 % more as compared to conventional mix, but it is acceptable if we
compare with the life span of both mixes when used in pavements, so it is well justified. On the
basis of these factors it can be well proved that a pavement made by SMA Mix is better as
compared to HMA mix. Various types of fibers have been used yet in SMA as stabilizer. But
many of the fibers are not easily available in India or they cost more. So here we used hemp fiber
which is found abundantly in India and is considered as non conventional/waste fiber because its
growth is illegal in India
1.4 Objectives of study:
The main purpose in this project work is using non conventional/common fibers as here
hemp fiber is used in place of other conventional fibers and to study its viability in SMA.
To prevent the drain down property of water in SMA.
Preparing the Marshal specimens and to check the various Marshall properties by adding
fiber.
To determine the satisfactory results of hemp fiber when used in SMA.
To evaluate the various properties of Stone matrix mix samples by further related test
type results.
4
CHAPTER 2
.LITERATURE REVIEW
2.1 Previous studies: Lot of researches has been done and are still proceeding for the
advancement and enhancements in S .MA. A brief survey of writing examined and connected for
the combination of this venture is being depicted beneath. Ever since the advancement of SMA
in Germany in mid .1960 and its achievement in European nations, numerous nations world wide
have used the theory of SMA. It was institutionalized in numerous nations worldwide and turned
into a part of the transportation powers for the nations, as well as India.
Manglokar and Browne in 1993, studied about SMA and DGM mixes where they used
granite and siliceous gravel as aggregates. The fiber which they added to the mix was cellulose
fiber. They performed Marshall Test, Indirect tensile test, Drain down test on the mix. They
concentrated on the type of aggregates because SMA posses more content of coarse aggregates.
The high content of these aggregates make the mixture firm with more use of stone to stone
contact. This property of SMA helps in achieving good value for load distribution providing
good resistance action against rutting and to the plastic deformation under heavy load of traffic.
SMA posses a ought to texture so friction between tiers and pavements gets increased which
leads to better skid resistance.
Bradley et al (2004) used carpet fiber and waste tires at the place of cellulose fiber for
improving the stability and strength of the mix. He concluded a significant decrease in drain
down characteristics of SMA Mix. He also found that when fiber added to mix is exposed to
moisture, don’t tends to decrease or weakens the mix properties, but helps in increasing
toughness of the SMA mix.
Kama raj et al (2004) studied about SMA mixes by adding rubber powder to it. He used
bitumen of grade 80/100. Other mix he made was dense grade mix in which he added filler stone
dust and lime, fiber added was cellulose fiber and found stability of mix by performing different
tests.
.Reddy et. al (2004) He made use of crumb rubber which is taken from waste tires and binder
of grade 80/100 to make the SMA Mix. In this mixture he made improvements over fatigue and
permanent deformation and found that the mix he made showed more resistance to moisture as
compared to normal mix.
5
Hauxin Chen and Qinwuxu . They added five types of polymers to SMA mix in which
there was one part of polyacrylonitrile, one part he added of lignin, one part of asbestos and two
parts of polyesters They study about the physical properties of fiber like what will be the
difference in drain down characteristics of mix and moisture absorption value when such
polymers are added to the mix. They observed that rutting performance and flow value got
significantly improved of the asphalt binder.
Muniandy and Haut (2006) used a cellulose fiber derived from palm oil tree. It showed
that the rheological properties of this modified mix when added to PG 64-22; binder gets
modified to PG 70-72. It also increases fatigue performance of the mix. The amount of fiber
taken was 6% at which it shows maximum fatigue life of SMA.
C.S Bindu, Beena K.S 2010, they prepared one mix in which he added shredded plastic
waste to SMA as stabilizing agent and one mix was prepared without any stabilizing agent. On
both these mixes he performed Marshall Test, tensile and compressive strength Test at different
quantity of bitumen (6-8) %, and at different proportion of plastic wastes (6-12) % by weight.
Esmail Ahmadinia, Mohd Rehan Karim, Mahrz Abdelaziz, Majid Zargar and
Payam Shafi have considered the waste influence of synthetic bottles like Poly-ethylene
Terephthalate in SMA Mix by fluctuating the amount and then by detecting its engineering
properties. The outcome of this observation was positive. It improved the quality of SMA and
also proved that the use of waste plastic bottles is environmental friendly.
Punith et al in the year 2004 have done a relative study of SMA with asphalt concrete mix.
They did this by using reclaimed polythene which is present in the type of some carry bags.
These act as stabilizing agents having size . 3 mm and 0.4 . %. The outcome of the test specified
that mix property of AC and SMA Mix got improved by adding reclaimed polythene which are
used as a stabilizer and it displayed the properties like enhanced rut resistance, creep and aging.
Kumar et al in the year 2007 studied the two types of fibers. In his study of SMA Mix, he
used the jute fiber which was covered with low viscosity binder. He then related his observation
with an imported cellulose fiber which was imported from Germany. 60/70 grade bitumen was
used and he came to the conclusion that 0.3% is the optimum fiber percentage of the mixture.
The equivalent results of import were shown by the Jute fiber.
6
Xue et al (2008) partially replaced fly ash incinerator by fine aggregates and mineral filler.
He took Basic Oxygen slag as a component of coarse aggregates with polyester fiber of length
6.3 mm in SMA Mix. PG 76-22 was taken as binder and he carried test like Marshall test, super
pave method for design purpose. He found it suitable for SMA Mix.
Jony Hassanet at al in the year 2010 has studied the influence of fillers which used waste
powder made from glass as mineral filler on the Marshall property in SM.A by relating it with
SMA in which usual Portland cement, lime stone was used as space filler which vary in its
content by 4-7%. The ideal content of the glass power was found to be 13%. The usage of glass
power as filler in SMA leads to increase in its stability up to 13%. There is a decrease in its flow
value up to 39%. Comparing to SMA Mix, the density is also decreased as it contains cement
layer and lime stone.
2.2 Bituminous mix Design:
A bituminous mix design is a combination in which aggregates, binder (bitumen), filler are
added to prepare a mix up which should be effective, strong and durable and also should be
economical. The content of bitumen is added as such it provides good elastic properties,
effectively impervious and also acceptable dissipative property. The main requirements of the
mix are to provide various components which are as follows:
An adequate content of bitumen to make a long lasting pavement’s life.
Better in opposing shear deformation usually at high temperature pavements.
Bitumen should be as compacted that there should be sufficient air voids for additional
compaction by traffic.
Mix should be having adequate workability so that it can be easily place without
segregation.
It should be enough resistant to premature cracking which is due to repeated bending of
traffic.
It should avert shrinkage cracks which are at low temperatures pavements.
7
2.3 Bituminous mix properties:
Stability: It can be demarcated as the resistance which is offered by the paving mix to
deform beneath the transfer traffic load. Two cases of failure:
Shoving defect - It refers to the oblique stiff deformation which arises at the areas
focusing severe acceleration.
Grooving defect- It refers to the longitudinal folding which occurs because of
channelization of traffic present on roads. Stability is dependent upon the inter-particle
rubbing, predominantly of aggregates and consistency that is given by the bitumen. There
should be appropriate binder that has to be accessible to cover whole particles at the
similar time that would offer sufficient liquid friction. When the particles are away from
each other and the binder content is high, there is decrease in stability.
Durability: Durability refers to the amt. of resistance of the mix in contrast to
weathering action and abrasion actions. Weathering leads to harden, which occurs due to
the loss of volatiles. Tensile strain is caused by wheel loads which lead to abrasion.
Distinct examples of failure are:
Pot-holes- It refers to the weakening of local pathways.
Stripping- It refers to the binder loss from the aggregates which lead to the exposure of
aggregates.
.Disintegration is reduced by more binder content as they leads the mix to be filled air and
water proof and the asphalt film is more resistance to strengthening.
Flexibility: To stabilize traffic loads and to prevent cracking of surface, flexibility is a
quantity which is used to measure the level of bending strength of the surface. Fracture
leads to the formation of cracks like hair shape cracks, alligator cracks present. The main
reason behind the fracture is the shrinkage of the binder and fragility of the binder. The
shrinkage cracks are formed due to the change in quantity of binder volume because of
ageing. The frequent bending of the plane due to transfer loads leads to the fragility. If
the content of bitumen is high, it will provide superior elasticity and less breakage.
Skid resistance: Resistance which for reducing the skidding action which depends on
texture provided and binder’s content used. It is an essential element in speedy traffic.
Generally, a coarse surface type of texture is required at the top surface.
8
Workability: It is defined as the way by which the mix can be positioned and packed
down to design the needed conditions and its shape. It is dependent upon the degree of
aggregates, aggregate’s shape and quality, content of used binder and its type. Flaky,
angular and stretched aggregate’s workability. Rounded aggregates, leads to
improvement in workability.
Some Prudent properties:
To meet traffic demand there should be stability.
For proper binding and water proofing bitumen content should be made certain.
Due to traffic there should be well voids compaction.
Traffic load should meet up flexibility particularly in cold season.
For construction purpose there should be an adequate workability.
It should be a cost effective mix.
2.4 Bituminous mix design concrete:
HMA (Hot mix asphalt concrete) it is the mix which is prepared by providing more heat
to binder for decreasing the viscosity of it. Aggregates are dried for removing the moisture if
present in the mix. Aggregates are mixed at a temperature of 150 C. When asphalt is suitably hot
the paving and compaction of mix is done. HMAC is used mostly pavements where traffic rate is
high such as at highways and also used at race tracks and air fields.
WMA (Warm mix asphalt) this type of asphalt concrete is made by the addition of zeolites
waxes, asphaltic emulsions and water is also added sometimes to asphalt binder prior to mixing.
A temperature of 20C is maintained when it is processed. It is laid at lower temperatures with
lower rate of mixing so it requires less consumption of fuels thereby producing fewer amounts of
volatiles like carbon dioxide, vapors and other effluents which can cause pollution.
Cold mix asphalt mixture: It is formed by an emulsion of water and soap. It is less viscous
when it is in emulsified state so it is easy to work and compaction. It takes the properties of
HMAC as he emulsions break out after sufficient removal of water from it. This concrete used
acts as a patching material mostly and on the roads where traffic is less.
9
Cut back asphalt concrete It is prepared when kerosene or any other lighter fraction
material like petroleum is dissolved in it. In dissolved form it is having less viscosity and the mix
is very workable. After laying the mixture the lighter fractions present gets evaporated. The cut
back asphalt is replaced by asphalt because it produces volatile organic compounds which also
lead to pollution
Natural asphalt concrete The naturally readied black-top cement is prepared from bitumen
rocks where the nearness of sedimentary rocks up well bitumen close to its surface .SMA is
additionally named as stone mastic black-top which was produced in Europe to conquer issues
like rutting and to make the asphalts more tough where on streets movement is high . In SMA the
content of coarse totals is high so it shapes a stone skeleton sort of structure in which stones get
interlocked to each other in this manner coming about imperviousness to permanent distortion. It
is loaded with folio (bitumen), filler and fibers. Fiber here acts as stabilizer which avoid draw
down of bitumen as it is having more number of air voids in view of more utilization of coarse
totals. Structure of SMA is coarse totals (70-80) %, filler (10-12) %, binder (5-7) %, fiber (0.3)
%. . The reason for adding fiber is to minimize the drain down of bitumen mortar; it additionally
gives better grating in wet climate conditions.
10
CHAPTER 3
RESEARCH METHODOLOY AND MARERIAL CHARACTERIZATION
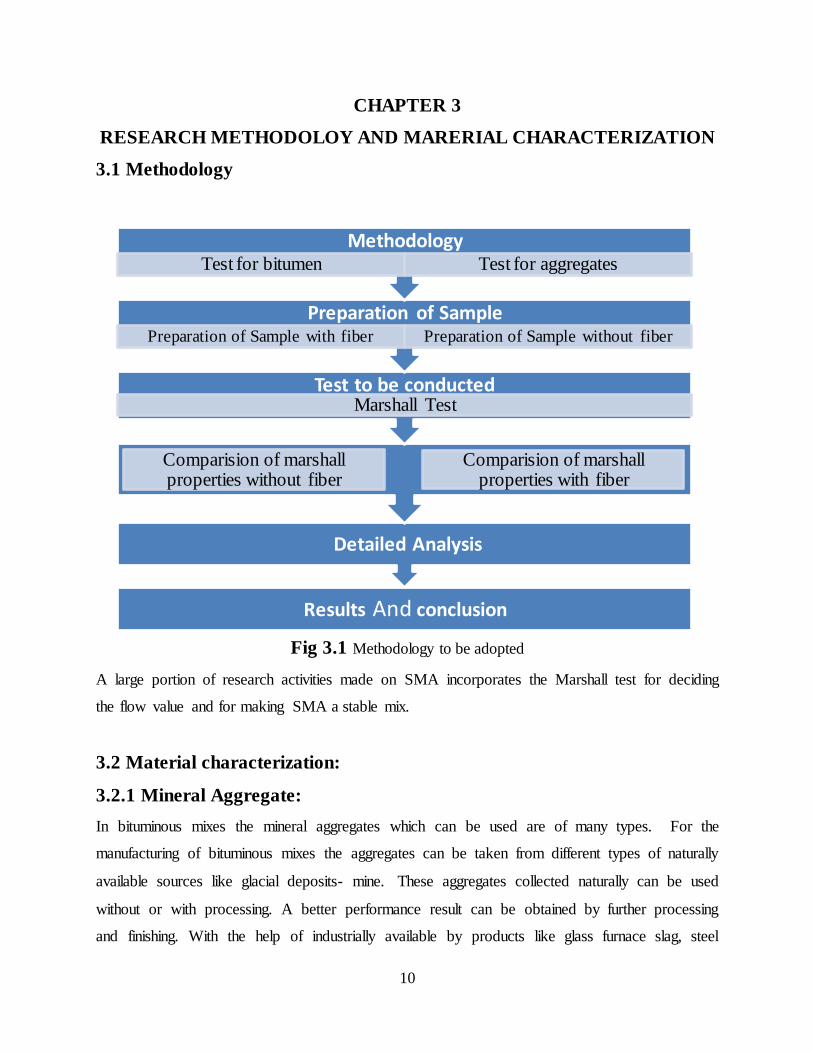
3.1 Methodology
Fig 3.1 Methodology to be adopted
A large portion of research activities made on SMA incorporates the Marshall test for deciding
the flow value and for making SMA a stable mix.
3.2 Material characterization:
3.2.1 Mineral Aggregate:
In bituminous mixes the mineral aggregates which can be used are of many types. For the
manufacturing of bituminous mixes the aggregates can be taken from different types of naturally
available sources like glacial deposits- mine. These aggregates collected naturally can be used
without or with processing. A better performance result can be obtained by further processing
and finishing. With the help of industrially available by products like glass furnace slag, steel
Results And conclusion
Detailed Analysis
Comparision of marshall properties without fiber
Comparision of marshall properties with fiber
Test to be conducted Marshall Test
Preparation of Sample Preparation of Sample with fiber Preparation of Sample without fiber
Methodology Test for bitumen Test for aggregates
11
slag etc. are used with these aggregates to improve the quality characteristics of the mix. As we
know in SMA matrix aggregates used play necessary role in giving good strength to mixture
because 70- 80 percent of coarse aggregates are totally present in the mix, These coarse
aggregates results better in case of shear strength and show a good resistance factor to rutting
resistance when compared to normal BC because this stone to stone contact of coarse aggregate
form a firm skeleton type of structure. Aggregates should be:
Rough in texture for resisting rutting and other movements.
It should be cubical in shape.
The degree of hardness should be as such that under heavy traffic it can resist fracture.
More resistant to polishing and other factors like abrasion and attrition.
Table 3.1 Physical requirements of coarse aggregates for Stone Matrix Asphalt
Property Test Method Specifications
Cleanliness Grain size Analysis IS:2386 P-1 < 2% passing 0.075
mm sieve
Particle Shape Combined Flakiness
and Elongation Index
IS:2386 P-1 < 30%
Strength Los Angeles
Abrasion value and
impact value
IS:2386 P-4 < 25% and < 18%
Durability Soundness test IS:2386 P-5 < 18%
Water Absorption Water absorption IS:2386 P-3 < 2%
3.2.2 Mineral filler:
In SMA matrix the mineral fillers have a measure impact on its properties. It adds to the increase
in the stiffness of the matrix. Fillers in case of HMA mixture have an effect on its workability,
aging and moisture resistance. In general these fillers have measure impact over the properties
like air void presence and voids in aggregates present. Various mineral fillers such as OPC, slag
cement, hydrated lime, fly ash etc. Stuart and Mogawar in 1996 made study over mineral fillers
in SMA. Both they selected 8 type of fillers on their performance basis, gradation etc. They
12
checked drain down of the mastic, low temperature cracking, moisture susceptibility, rutting, and
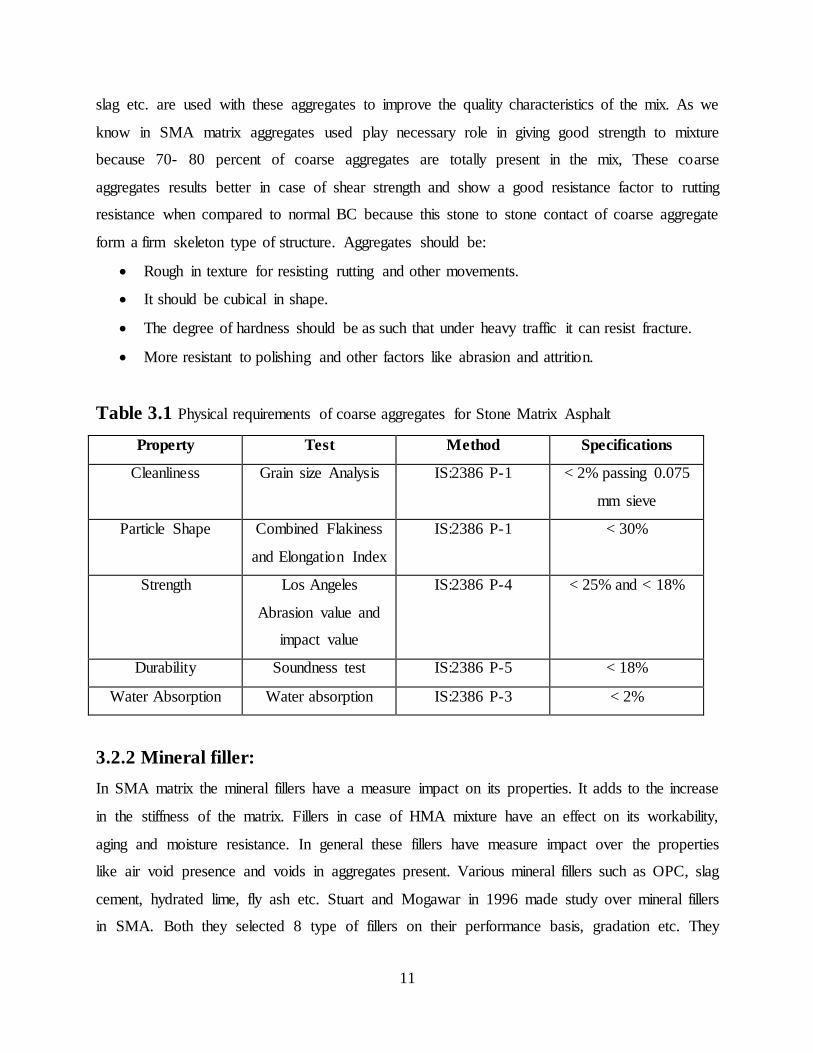
workability of SMA mixture. So here we are used to use fly ash as a filler material to determine
our work and to check the various engineering properties of SMA. In this research we used Class
F fly ash because of its cementitious properties.
Fig 3.2 Fly ash
Table 3.2 Properties of Fly Ash (Class F)
Component Bituminous Sub-Bituminous Lignite
SiO2 (%) 20-60 40-60 15-45
Al2O3 (%) 5-35 20-30 20-25
Fe2O3 (%) 10-40 5-10 4-15
CaO (%) 1-12 4-30 15-40
LOl (%) 0-15 0-3 0-5
13
3.2.3 Bitumen as Binder:
In bituminous mixture binder helps in binding the aggregates filler, fines and stabilizer and act
there as a binding agent. The durability of the mix is achieved by adding binder to it. The
bitumen is that part of the mix which affects various characteristics of bituminous mixture.
Characteristics like aging, temperature susceptibility, viscous elastic properties are affected by
the use of binder. At low temperature it solidifies so can’t be used for longer loading period.
Bitumen acts as a viscous elastic material at normal temperature as it shows both the properties
of viscosity and elasticity at normal pavement’s temperature. It acts like material elastic in nature
elastic at low temperatures and when high temperature is there, it behaves like a viscous fluid.
Bitumen behaves like a stabilizer for bituminous mix which contains various additives like
fibers, polymers etc. As we know the primary agent which is used for binding of aggregates with
filler and fiber is bitumen, so here we tried using VG-30 grade of bitumen in SMA.
The grade of the bitumen is adopted as per the SMA considerations and heavy traffic conditions,
as per the IRC and Mort&h specifications that is VG-30 grade which was taken from the
bitumen agency situated in Jalandhar Jyoti Chowk. The tests which we need to perform before
using the bitumen in bituminous mix design that are penetration test, viscosity test, softening
point, ductility etc.
Table 3.3 Showing desirable properties of bitumen (VG-30)
Tests Standard specifications
Penetration test (mm) 60-70
Viscosity (poise) @60°C 2400
Ductility (cm) 40 cm/min
Softening point (degree) 47
Specific gravity 0.9-1.06
3.2.4 Stabilizing additives:
To enhance better binding and to avert drain down from mortar stabilizing additives are added in
the mixture like Polyester, cellulose, minerals. Different properties of stabilizing additives which
are introduced to the mix are categorized as follows:
14
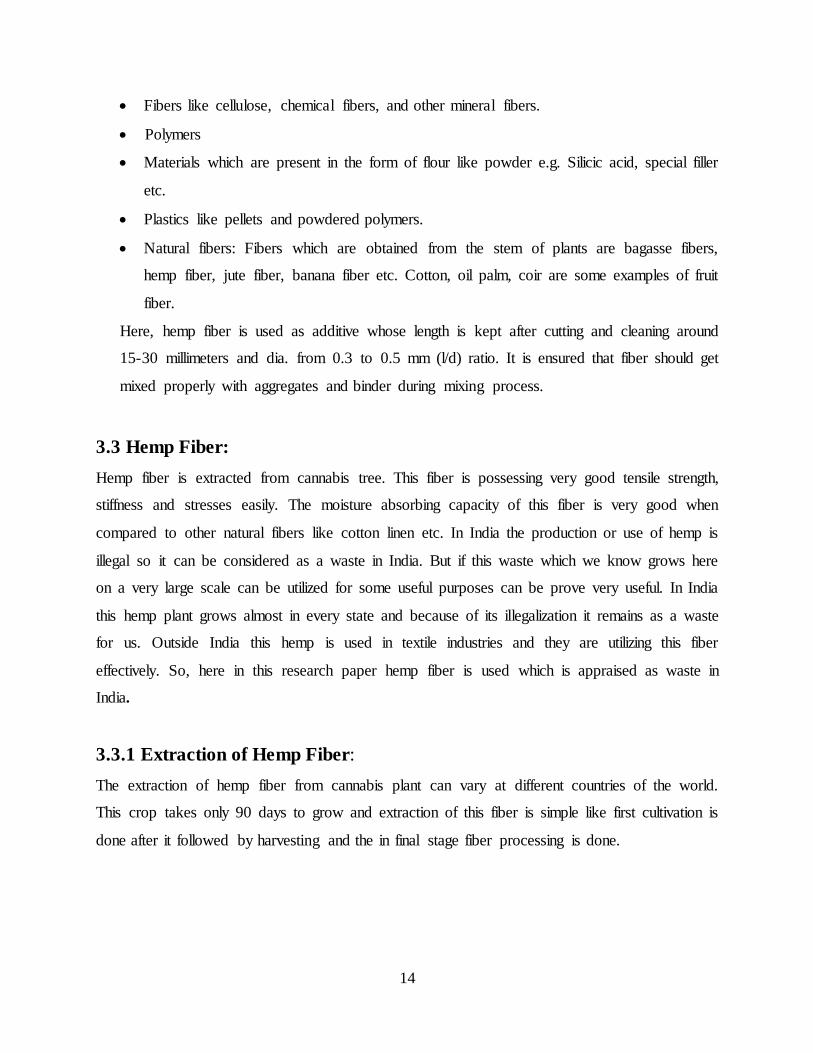
Fibers like cellulose, chemical fibers, and other mineral fibers.
.Polymers
Materials which are present in the form of flour like powder e.g. Silicic acid, special filler
etc.
Plastics like pellets and powdered polymers.
Natural fibers: Fibers which are obtained from the stem of plants are bagasse fibers,
hemp fiber, jute fiber, banana fiber etc. Cotton, oil palm, coir are some examples of fruit
fiber.
Here, hemp fiber is used as additive whose length is kept after cutting and cleaning around
15-30 millimeters and dia. from 0.3 to .0.5 mm (l/d) ratio. It is ensured that fiber should get
mixed properly with aggregates and binder during mixing process.
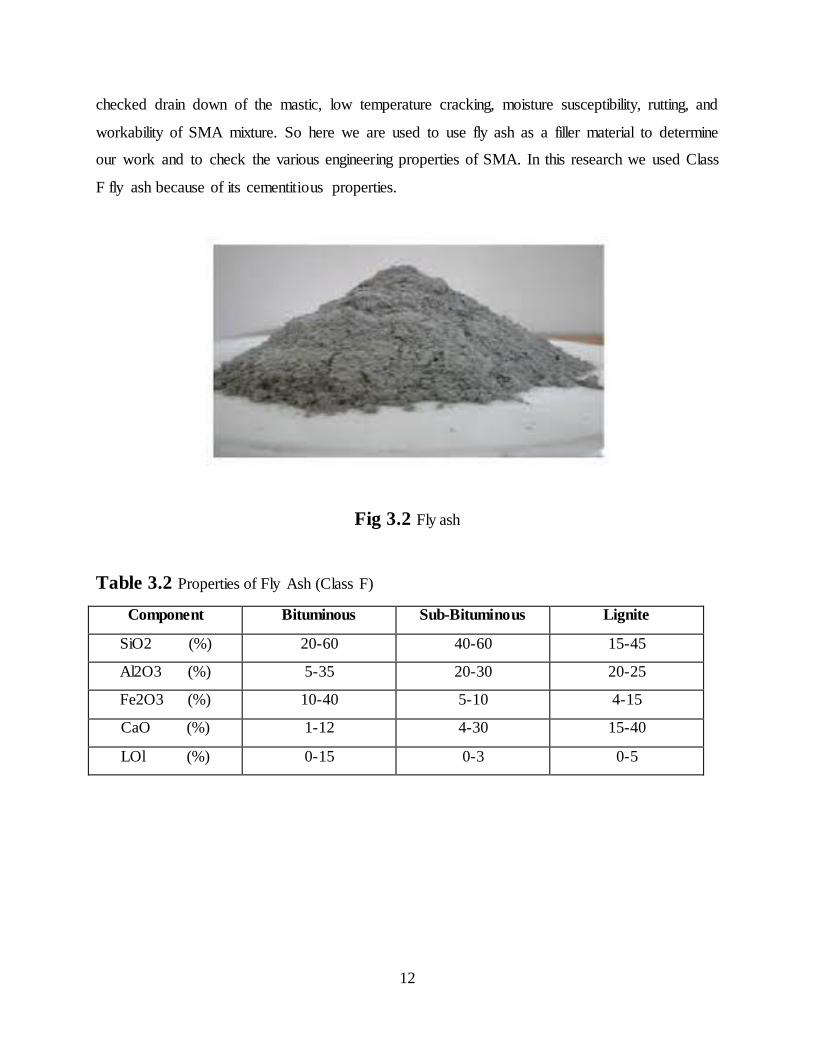
3.3 Hemp Fiber:
Hemp fiber is extracted from cannabis tree. This fiber is possessing very good tensile strength,
stiffness and stresses easily. The moisture absorbing capacity of this fiber is very good when
compared to other natural fibers like cotton linen etc. In India the production or use of hemp is
illegal so it can be considered as a waste in India. But if this waste which we know grows here
on a very large scale can be utilized for some useful purposes can be prove very useful. In India
this hemp plant grows almost in every state and because of its illegalization it remains as a waste
for us. Outside India this hemp is used in textile industries and they are utilizing this fiber
effectively. So, here in this research paper hemp fiber is used which is appraised as waste in
India.
3.3.1 Extraction of Hemp Fiber:
The extraction of hemp fiber from cannabis plant can vary at different countries of the world.
This crop takes only 90 days to grow and extraction of this fiber is simple like first cultivation is
done after it followed by harvesting and the in final stage fiber processing is done.
15
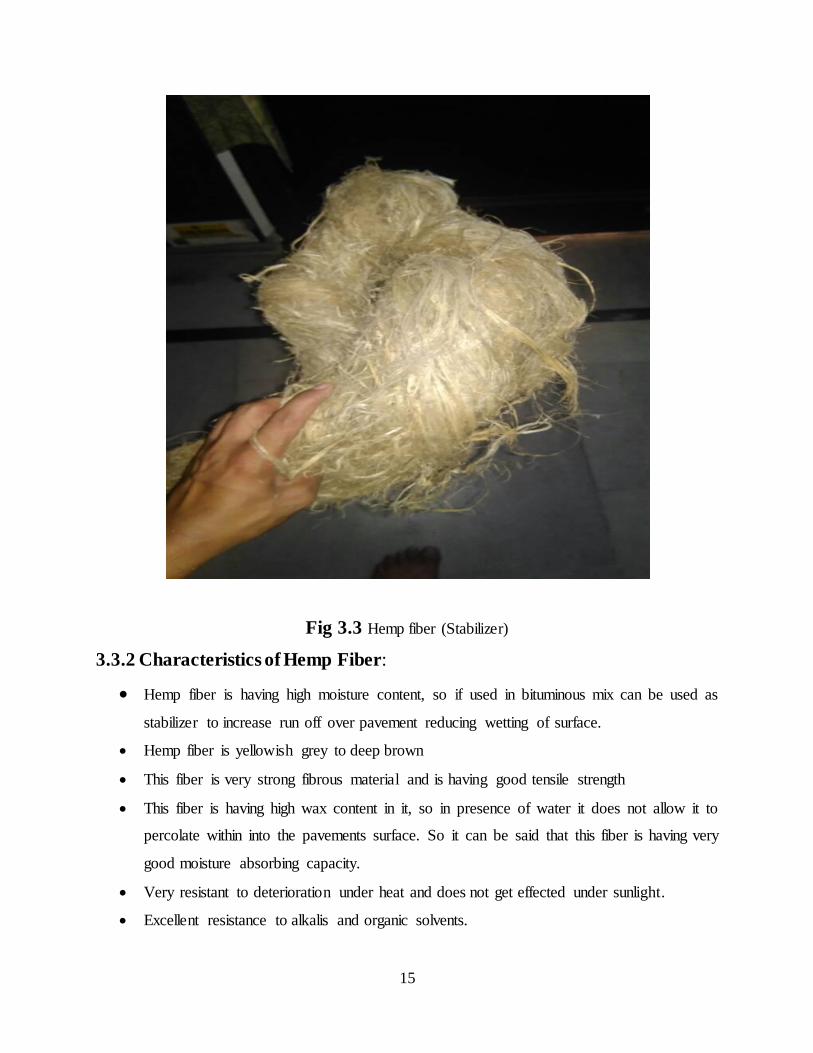
Fig 3.3 Hemp fiber (Stabilizer)
3.3.2 Characteristics of Hemp Fiber:
Hemp fiber is having high moisture content, so if used in bituminous mix can be used as
stabilizer to increase run off over pavement reducing wetting of surface.
Hemp fiber is yellowish grey to deep brown
This fiber is very strong fibrous material and is having good tensile strength
This fiber is having high wax content in it, so in presence of water it does not allow it to
percolate within into the pavements surface. So it can be said that this fiber is having very
good moisture absorbing capacity.
Very resistant to deterioration under heat and does not get effected under sunlight.
Excellent resistance to alkalis and organic solvents.
16
It is not attacked by moth-grubs or beetles.
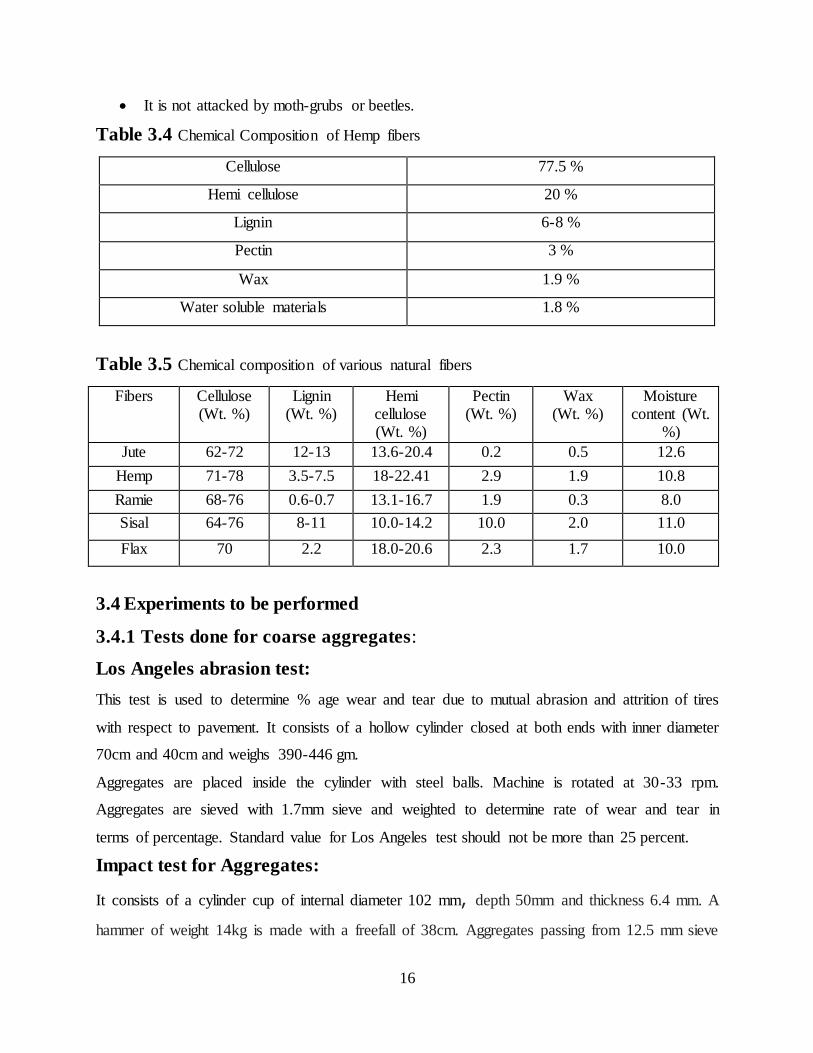
Table 3.4 Chemical Composition of Hemp fibers .
Cellulose. 77.5 %
Hemi cellulose 20 %
Lignin. 6-8 %
Pectin 3 %
Wax 1.9 %
Water soluble materials 1.8 %
Table 3.5 Chemical composition of various natural fibers
Fibers Cellulose. (Wt. %)
Lignin (Wt. %)
Hemi cellulose. (Wt. %)
Pectin (Wt. %)
Wax (Wt. %)
Moisture. content (Wt.
%) Jute 62-72 12-13 13.6-20.4 0.2 0.5 12.6
Hemp 71-78 3.5-7.5 18-22.41 2.9 1.9 10.8
Ramie 68-76 0.6-0.7 13.1-16.7 1.9 0.3 8.0
Sisal 64-76 8-11 10.0-14.2 10.0 2.0 11.0
Flax 70 2.2 18.0-20.6 2.3 1.7 10.0
3.4 Experiments to be performed
3.4.1 Tests done for coarse aggregates:
Los Angeles abrasion test:
This test is used to determine % age wear and tear due to mutual abrasion and attrition of tires
with respect to pavement. It consists of a hollow cylinder closed at both ends with inner diameter
70cm and 40cm and weighs 390-446 gm.
Aggregates are placed inside the cylinder with steel balls. Machine is rotated at 30-33 rpm.
Aggregates are sieved with 1.7mm sieve and weighted to determine rate of wear and tear in
terms of percentage. Standard value for Los Angeles test should not be more than 25 percent.
Impact test for Aggregates:
It consists of a cylinder cup of internal diameter 102 mm, depth 50mm and thickness 6.4 mm. A
hammer of weight 14kg is made with a freefall of 38cm. Aggregates passing from 12.5 mm sieve
17
and retained on 10mm sieve are used. Aggregates filled in cylinder are given 15 blows for three
layers and then hammered aggregates are sieved by 2.36 mm sieve.
Crushing value test:
.Amount of aggregates passed from 12.5. mm are sieve and retained on .10 mm I.S sieve are taken.
Aggregates crushing value is given by (B/A)*100.
Where B. = fraction of weight passing from appropriate sieve.
A = Weight of SS .D sample
Flakiness and Elongation index:
The flakiness index for aggregates is the %age of the total wt. of the passing aggregates though
various gauges of thickness gauge to the total sample wt.
.The elongation index for aggregates is the %age of the total wt. of the retained aggregates though
various gauges of length gauge to the total weight of the sample taken.
Specific gravity of aggregates:
This test is determined to find out strength and quality of aggregates. Specific gravity for coarse
aggregates is determined by equation:
* 100
.Water Absorption test for aggregates:
.Water absorption is determined by equation:
*100
Here,
W1= Dry saturated weight
W2= Combined weight of material and basket in water
3.4.2 Test done for fine aggregates:
These are the aggregates which passes through .4.75 mm IS . sieve and retain on 0.075 . mm IS
sieve. The test for fine aggregates was performed to obtain specific gravity and was found 2.8
which lies in between 2.5 to 3 (range of specific gravity for fine aggregates).
18
3.4.3 Test done for bitumen:
In this research various bitumen tests were performed corresponding to that penetration,
ductility, softening point, viscosity for taken bitumen was calculated.
Penetration test:
This test is used to examine consistency of bitumen by determining the penetration of a standard
needle at specified conditions of time and temperature. This distance is measure of 1/10 th of a
mm. Penetration value for grade 60/70 means that penetration lies between 60 to 70.
Ductility test:
Ductility test measures stretching/adhesive property of bitumen. A good ductility of binder forms
a thin film with aggregates and improve interlocking of aggregates. It is measured in centimeters
when two clips of standard briquette are forced apart @50mm per minute.
.Viscosity test:
Viscosity test determines the resistance against flow of bitumen. It greatly influences the strength
of pavement at the application of temperature. At low temperature the binder simply lubricates
the aggregates rather than providing a thin film for binder action. Similarly at high temp resist
the compaction effort and results in heterogeneous mix.
Softening point:
It is the temperature at which the substance attains a particular degree of softening. This test is
also termed as Ring and ball apparatus method. It tells us about the energy required to soft the
bitumen before its application on roads surface.
3.4.4 Test done for filler:
Specific gravity test:
.Specific gravity of filler material was calculated by Le. Chatlier Apparatus. The specific gravity
of filler was found 2.1 and standard range is 1.9 to 2.8 for class F fly ash.
19
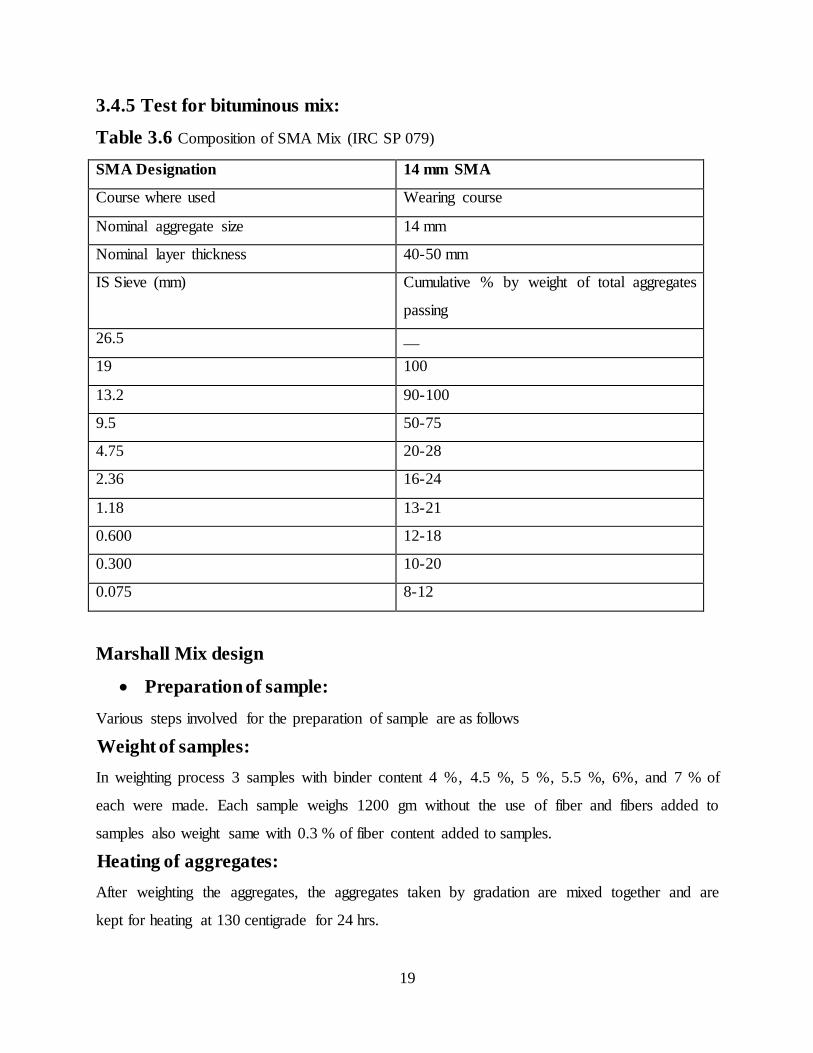
3.4.5 Test for bituminous mix:
Table 3.6 Composition of SMA Mix (IRC SP 079)
SMA Designation. 14 mm SMA.
Course where used Wearing course
Nominal aggregate size 14 mm
Nominal layer thickness 40-50 mm
IS Sieve (mm) Cumulative % by weight of total aggregates
passing
26.5 __
19 100
13.2 90-100
9.5 50-75
4.75 20-28
2.36 16-24
1.18 13-21
0.600 12-18
0.300 10-20
0.075 8-12
Marshall Mix design
.Preparation of sample:
Various steps involved for the preparation of sample are as follows
.Weight of samples:
In weighting process 3 samples with binder content 4 %., .4.5 %, 5 %., 5.5 %, 6%., and .7 % of
each were made. Each sample weighs 1200 gm without the use of fiber and fibers added to
samples also weight same with 0.3 % of fiber content added to samples.
.Heating of aggregates:
After weighting the aggregates, the aggregates taken by gradation are mixed together and are
kept for heating at 130 centigrade for 24 hrs.
20
Heating of bitumen: Bitumen was heated at a high temperature so that it gets liquefied
easily when mixed with aggregates and fiber.
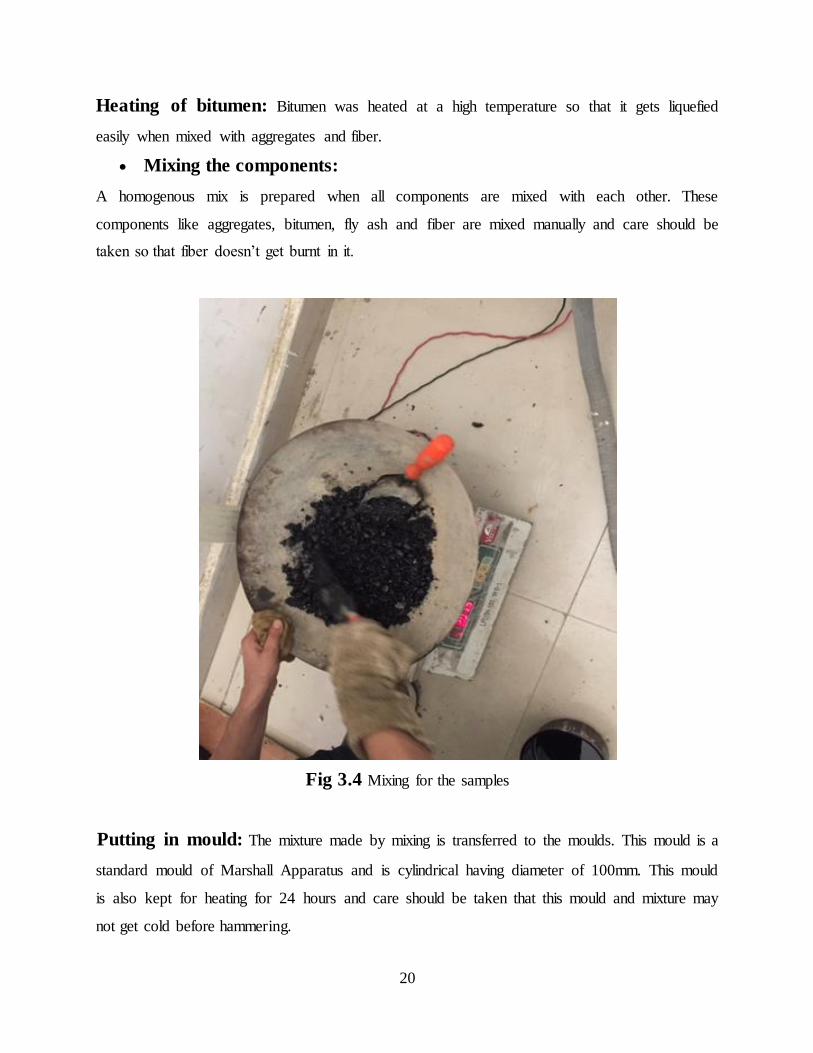
Mixing the components:
A homogenous mix is prepared when all components are mixed with each other. These
components like aggregates, bitumen, fly ash and fiber are mixed manually and care should be
taken so that fiber doesn’t get burnt in it.
Fig 3.4 Mixing for the samples
.Putting in mould: The mixture made by mixing is transferred to the moulds. This mould is a
standard mould of Marshall Apparatus and is cylindrical having diameter of 100mm. This mould
is also kept for heating for 24 hours and care should be taken that this mould and mixture may
not get cold before hammering.
21
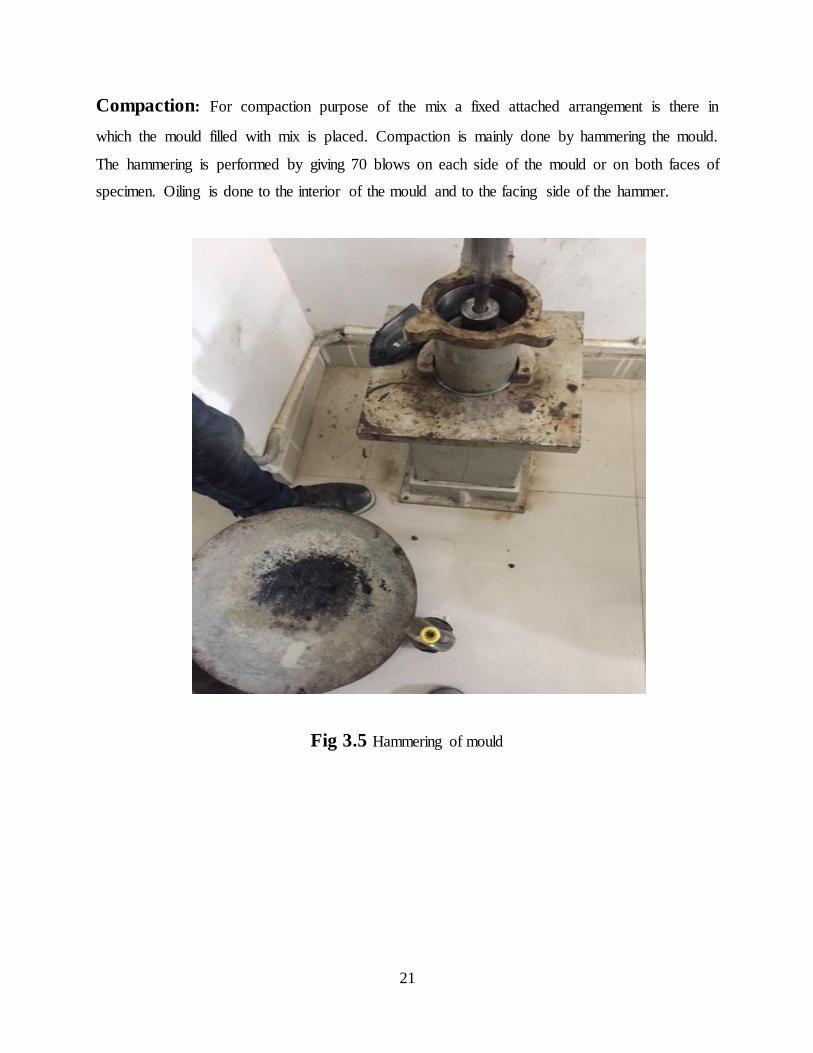
Compaction: For compaction purpose of the mix a fixed attached arrangement is there in
which the mould filled with mix is placed. Compaction is mainly done by hammering the mould.
The hammering is performed by giving 70 blows on each side of the mould or on both faces of
specimen. Oiling is done to the interior of the mould and to the facing side of the hammer.
Fig 3.5 Hammering of mould
22
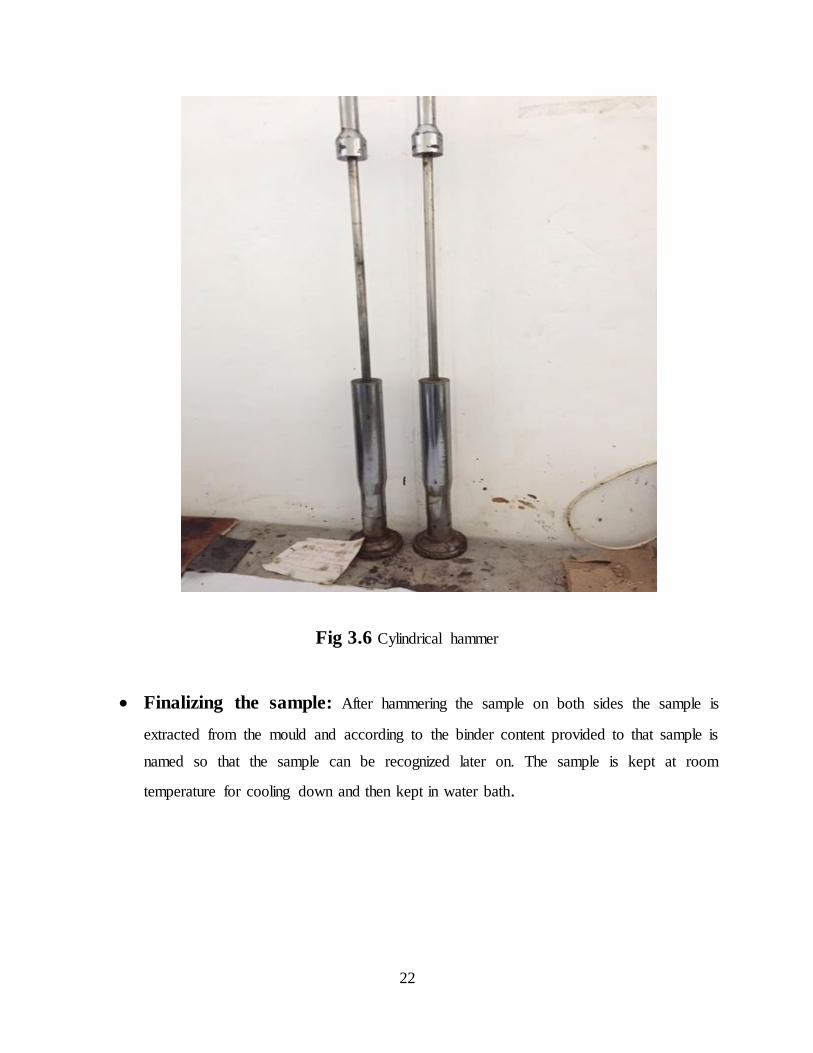
Fig 3.6 Cylindrical hammer
Finalizing the sample: After hammering the sample on both sides the sample is
extracted from the mould and according to the binder content provided to that sample is
named so that the sample can be recognized later on. The sample is kept at room
temperature for cooling down and then kept in water bath.
23
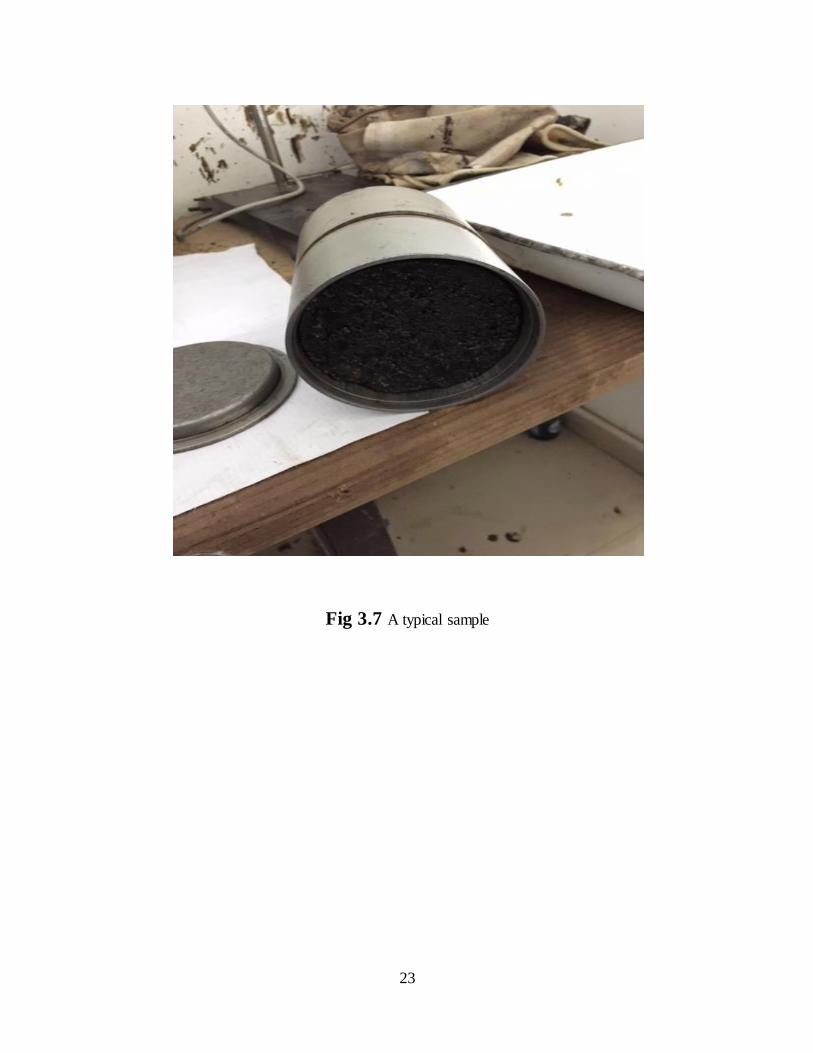
Fig 3.7 A typical sample
24
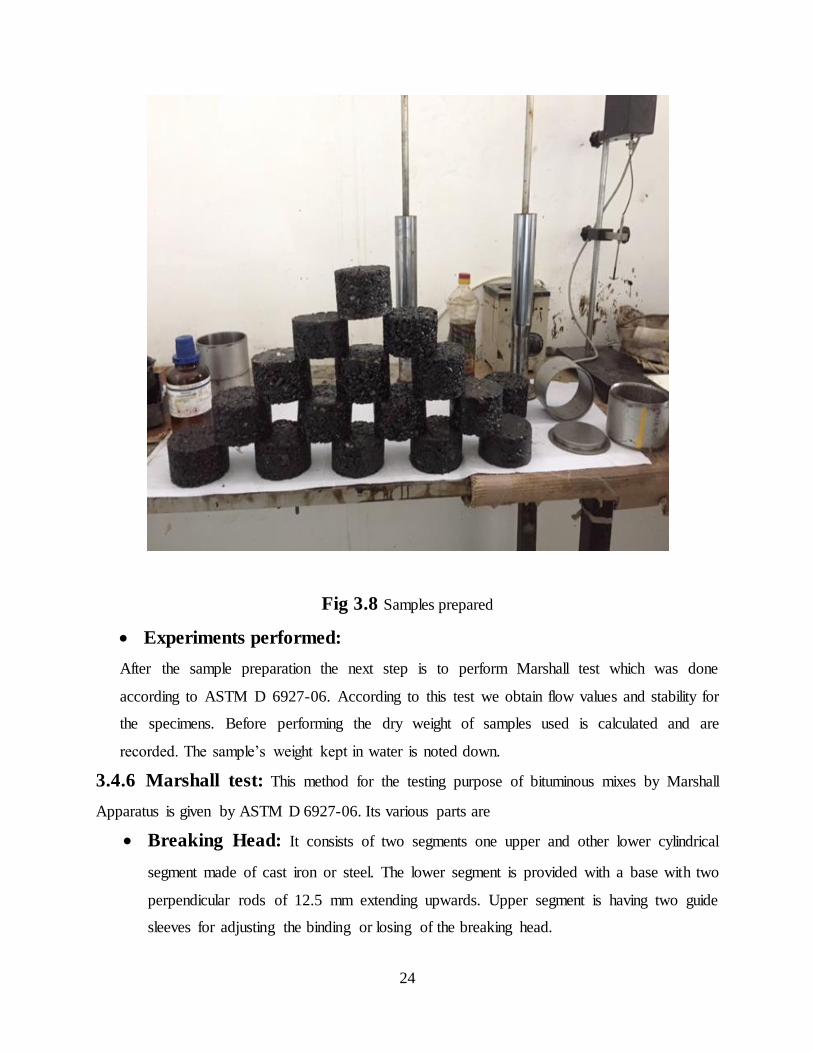
Fig 3.8 Samples prepared
Experiments performed:
After the sample preparation the next step is to perform Marshall test which was done
according to ASTM D 6927-06. According to this test we obtain flow values and stability for
the specimens. Before performing the dry weight of samples used is calculated and are
recorded. The sample’s weight kept in water is noted down.
3.4.6 .Marshall test: This method for the testing purpose of bituminous mixes by Marshall
Apparatus is given by ASTM. D 6927-06. Its various parts are
Breaking Head: It consists of two segments one upper and other lower cylindrical
segment made of cast iron or steel. The lower segment is provided with a base with two
perpendicular rods of 12.5 mm extending upwards. Upper segment is having two guide
sleeves for adjusting the binding or losing of the breaking head.
25
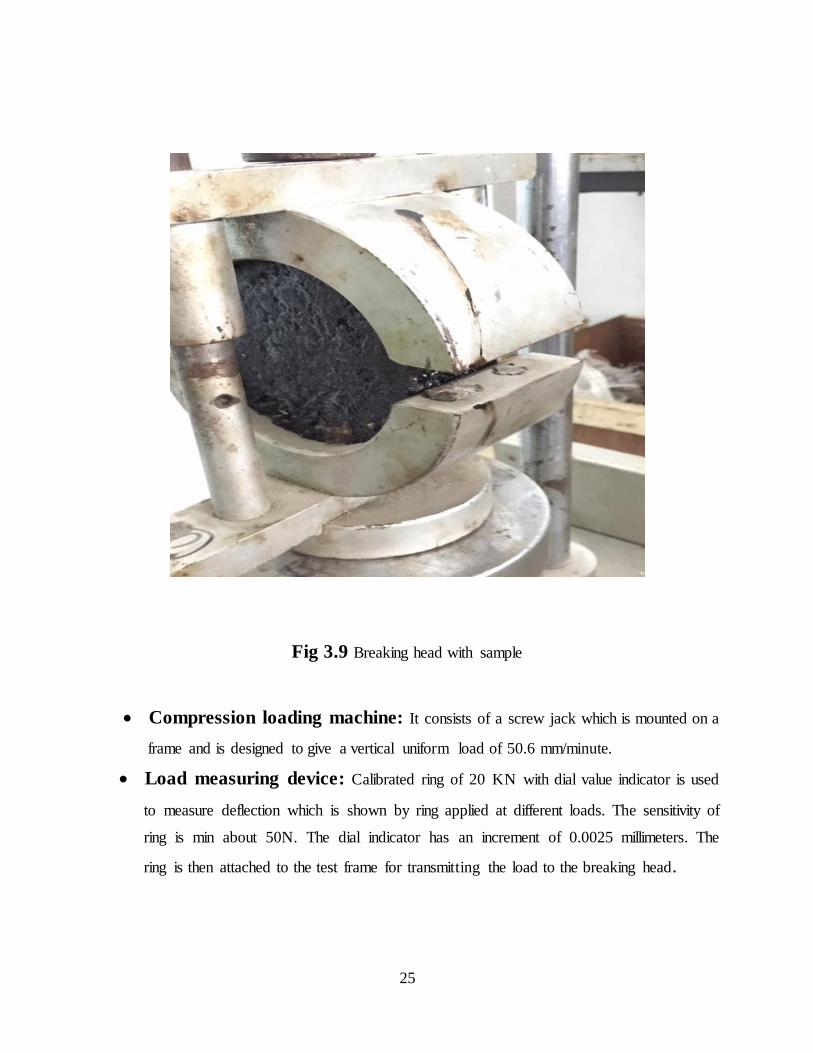
Fig 3.9 Breaking head with sample
.Compression loading machine: It consists of a screw jack which is mounted on a
frame and is designed to give a vertical uniform load of 50.6 . mm/minute.
.Load measuring device: Calibrated ring of 20 KN with dial value indicator is used
to measure deflection which is shown by ring applied at different loads. The sensitivity of
ring is min about 50N. The dial indicator has an increment of 0.0025 millimeters. The
ring is then attached to the test frame for transmitting the load to the breaking head.
26
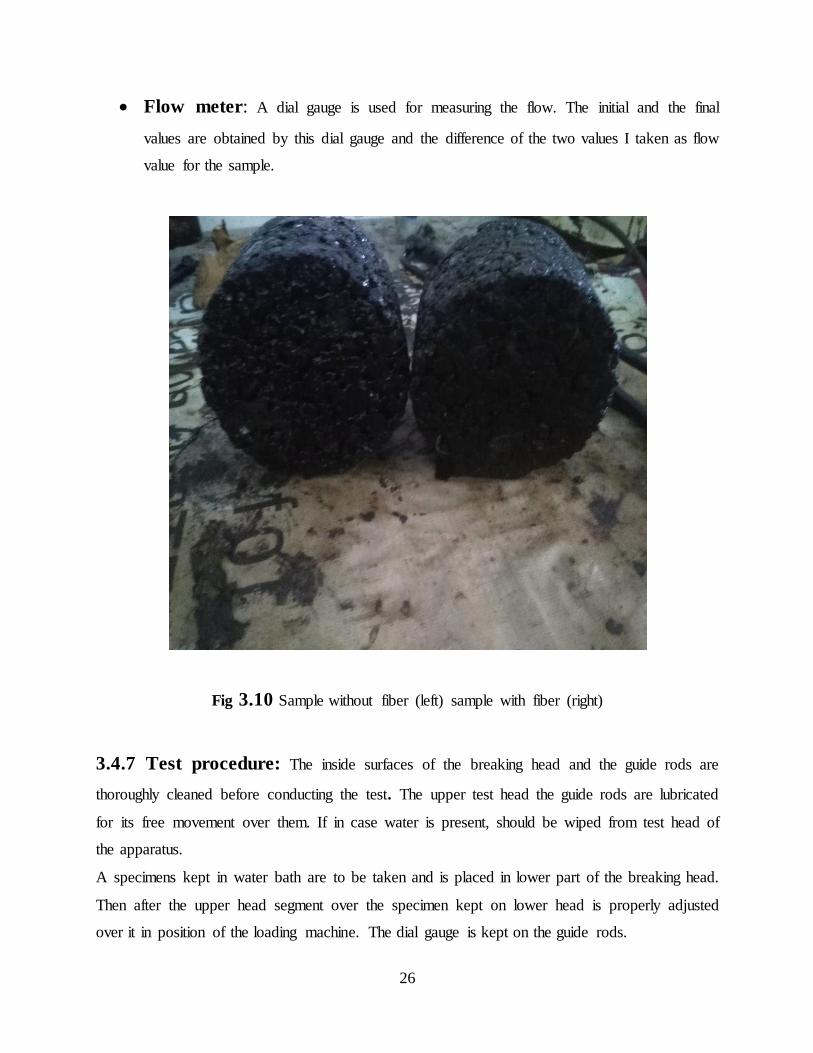
Flow meter: A dial gauge is used for measuring the flow. The initial and the final
values are obtained by this dial gauge and the difference of the two values I taken as flow
value for the sample.
Fig. 3.10 Sample without fiber (left) sample with fiber (right)
3.4.7 Test procedure: The inside surfaces of the breaking head and the guide rods are
thoroughly cleaned before conducting the test. The upper test head the guide rods are lubricated
for its free movement over them. If in case water is present, should be wiped from test head of
the apparatus.
A specimens kept in water bath are to be taken and is placed in lower part of the breaking head.
Then after the upper head segment over the specimen kept on lower head is properly adjusted
over it in position of the loading machine. The dial gauge is kept on the guide rods.
27
The time for the sample from water bath to the final load determination should not exceed 30
seconds. The proving ring of the dial gauge measure the values and the readings are thus taken.
In this case 100kg load is equal to the 36 divisions of the proving ring.
3.4.8 Parameters used:
1. Theoretical specific gravity of the mix (Gt):
Gt = W1+W2+W3+Wb/ (W1/G1+W2/G2+W3/G3+Wb/Gb)
Here,
W1 = wt. of coarse aggregates.
W2 = wt. of fine aggregates.
W3 = wt. of filler material.
Wb = wt. of bitumen.
G1 = Specific. gravity of coarse aggregates.
G2 = Specific. gravity of fine aggregates.
G3 = Specific gravity of filler.
Gb = Specific gravity of bitumen.
2. Bulk specific gravity (Gm):
Gm = Wa / (Wa-Ww)
Here,
Wa = weight of sample in air.
Ww = wt. of sample in water.
3. Air voids (Vv):
Vv = (Gt-Gm) /Gt * 100
Here,
Gt = Theoretical. sp. Gravity of the mix.
Gm = Bulk sp. Gravity of the mix.
4. Percentage of volume of bitumen (Vb):
28
Vb = (Wb/Gb)/(W1+W2+W3+Wb)/Gm
5. Volume of voids in mineral aggregates (VMA):
VMA = Vv + Vb
6. Voids filled with bitumen (VFB):
VFB = Vb *100 / VMA
29
CHAPTER 4
RESULTS AND DISCUSSIONS
4.1 Laboratory investigation:
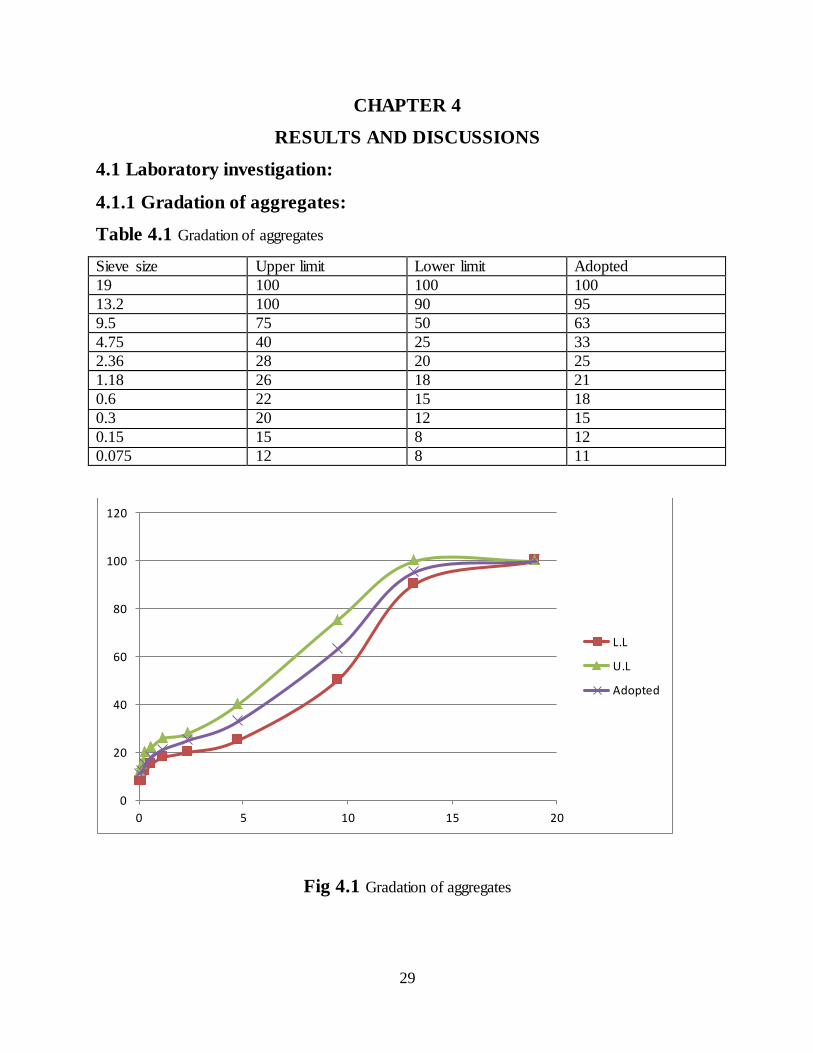
4.1.1 Gradation of aggregates:
Table 4.1 Gradation of aggregates
Sieve size. Upper limit. Lower limit Adopted 19 100 100 100 13.2 100 90 95 9.5 75 50 63 4.75 40 25 33 2.36 28 20 25 1.18 26 18 21 0.6 22 15 18 0.3 20 12 15 0.15 15 8 12 0.075 12 8 11
Fig 4.1 Gradation of aggregates
0
20
40
60
80
100
120
0 5 10 15 20
L.L
U.L
Adopted
30
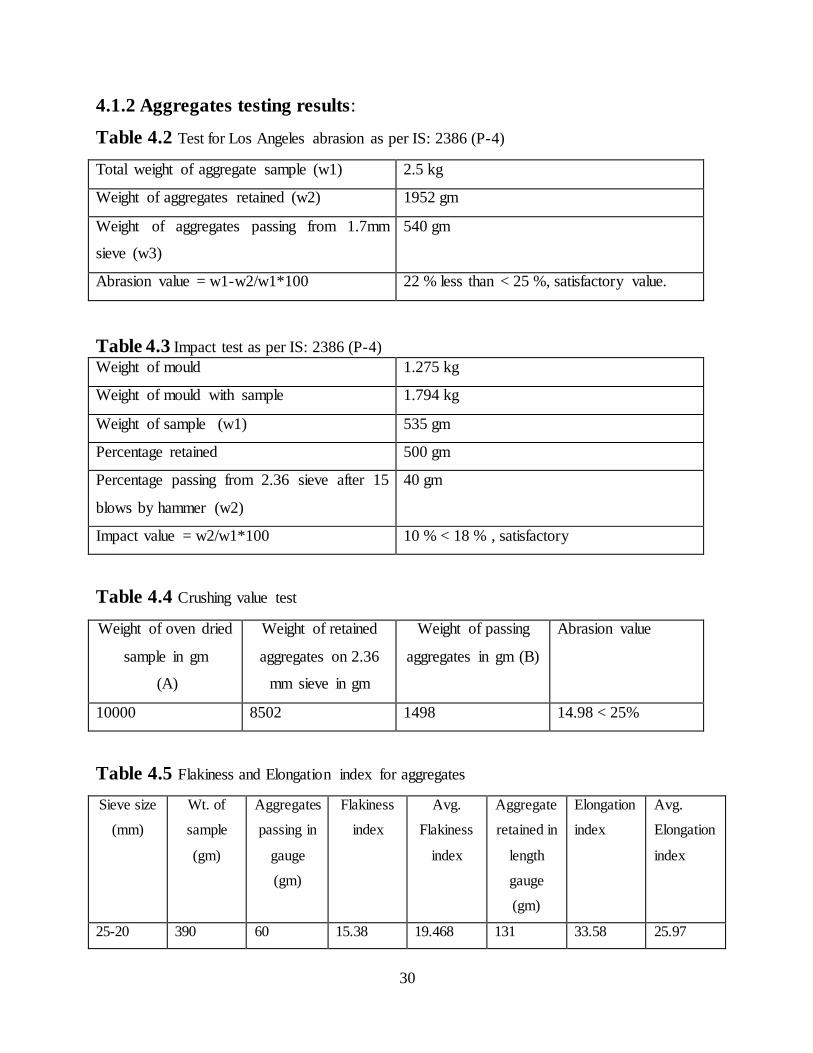
4.1.2 Aggregates testing results:
Table 4.2 Test for Los Angeles abrasion as per IS: 2386 (P-4)
Total weight of aggregate sample (w1) . 2.5 kg
Weight of aggregates retained (w2) 1952 gm
Weight of aggregates passing from 1.7mm
sieve (w3)
540 gm
Abrasion value = w1-w2/w1*100 22 % less than < 25 %, satisfactory value.
Table 4.3 Impact test as per IS: 2386 (P-4) Weight of mould 1.275 kg
Weight of mould with sample 1.794 kg
Weight of sample (w1) 535 gm
Percentage retained 500 gm
Percentage passing from 2.36 sieve after 15
blows by hammer (w2)
40 gm
Impact value = w2/w1*100 10 % < 18 % , satisfactory
Table 4.4 Crushing value test
Weight of oven dried
sample in gm
(A)
Weight of retained
aggregates on 2.36
mm sieve in gm
Weight of passing
aggregates in gm (B)
Abrasion value
10000 8502 1498 14.98 < 25%
Table 4.5 Flakiness and Elongation index for aggregates
Sieve size .
(mm)
Wt. of
sample
(gm)
Aggregates
passing in
gauge
(gm)
Flakiness
index
Avg.
Flakiness
index
Aggregate
retained in
length
gauge
(gm)
Elongation
index
Avg.
Elongation
index
25-20 390 60 15.38 19.468 131 33.58 25.97
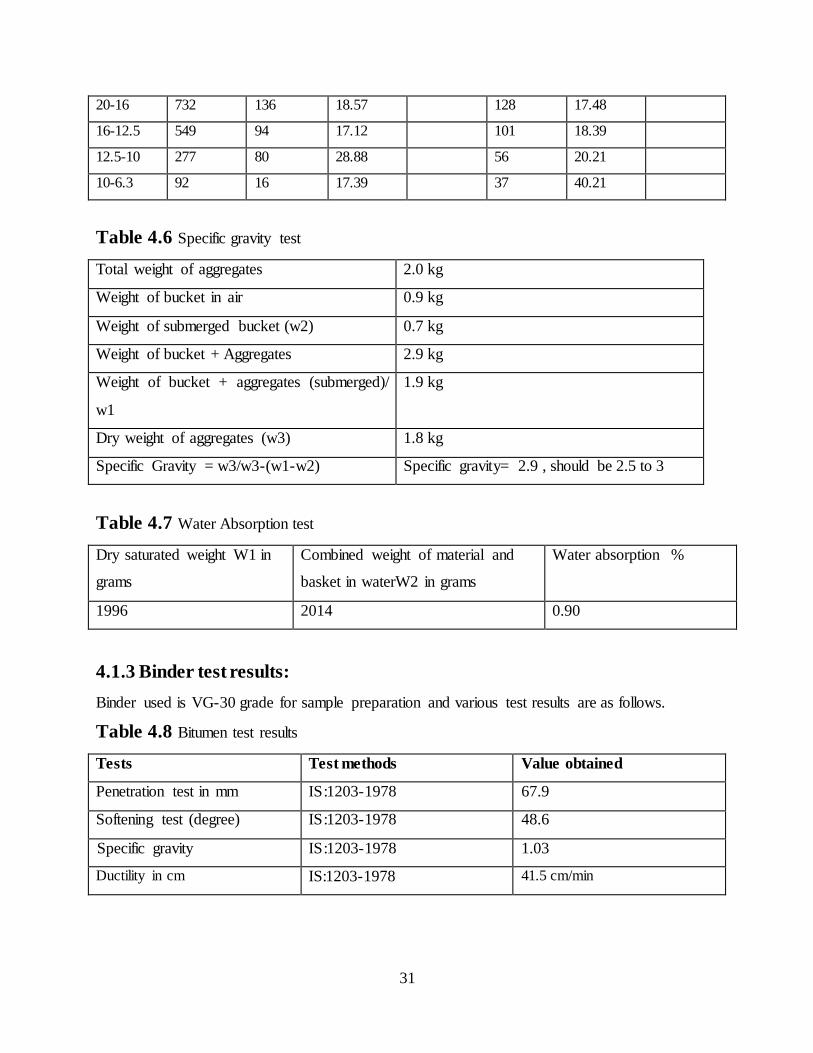
31
20-16 732 136 18.57 128 17.48
16-12.5 549 94 17.12 101 18.39
12.5-10 277 80 28.88 56 20.21
10-6.3 92 16 17.39 37 40.21
Table 4.6 Specific gravity test
Total weight of aggregates 2.0 kg
Weight of bucket in air 0.9 kg
Weight of submerged bucket (w2) 0.7 kg
Weight of bucket + Aggregates 2.9 kg
Weight of bucket + aggregates (submerged)/
w1
1.9 kg
Dry weight of aggregates (w3) 1.8 kg
Specific Gravity = w3/w3-(w1-w2) Specific gravity= 2.9 , should be 2.5 to 3
Table 4.7 Water Absorption test
Dry saturated weight W1 in
grams
Combined weight of material and
basket in waterW2 in grams
Water absorption %
1996 2014 0.90
4.1.3 Binder test results:
Binder used is VG-30 grade for sample preparation and various test results are as follows.
Table 4.8 Bitumen test results
Tests Test methods Value obtained
Penetration test in mm IS.:1203-1978 67.9
Softening test. (degree) IS.:1203-1978 48.6
.Specific gravity IS.:1203-1978 1.03.
Ductility in cm IS:1203-1978 41.5 cm/min
32
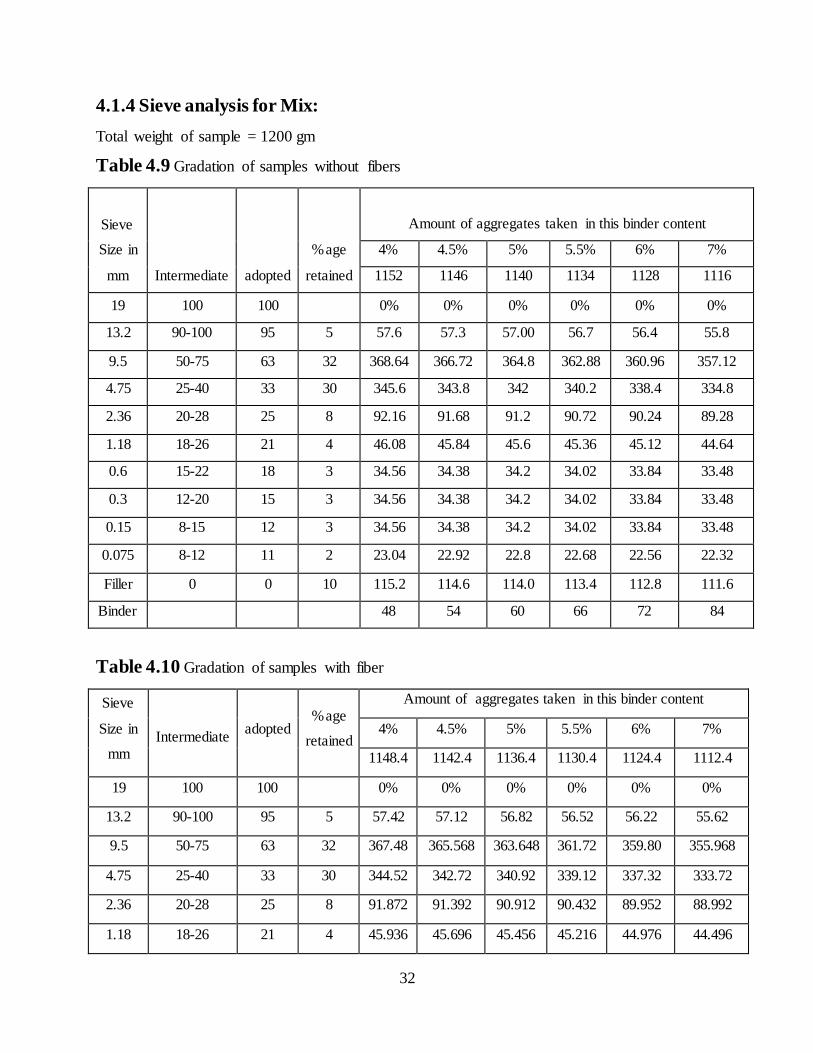
4.1.4 Sieve analysis for Mix:
Total weight of sample = 1200 gm
Table 4.9 Gradation of samples without fibers
Sieve . .
Size . in
mm Intermediate . adopted
% .age .
retained
Amount of aggregates . taken in this binder content
4% . 4.5% 5% 5.5% 6% 7%
1152. 1146 1140 1134 1128 1116
19 100 100 0% 0% 0% 0% 0% 0%
13.2 90-100 95 5 57.6 57.3 57.00 56.7 56.4 55.8
9.5 50-75 63 32 368.64 366.72 364.8 362.88 360.96 357.12
4.75 25-40 33 30 345.6 343.8 342 340.2 338.4 334.8
2.36 20-28 25 8 92.16 91.68 91.2 90.72 90.24 89.28
1.18 18-26 21 4 46.08 45.84 45.6 45.36 45.12 44.64
0.6 15-22 18 3 34.56 34.38 34.2 34.02 33.84 33.48
0.3 12-20 15 3 34.56 34.38 34.2 34.02 33.84 33.48
0.15 8-15 12 3 34.56 34.38 34.2 34.02 33.84 33.48
0.075 8-12 11 2 23.04 22.92 22.8 22.68 22.56 22.32
Filler 0 0 10 115.2 114.6 114.0 113.4 112.8 111.6
Binder. 48. 54 60. 66 72. 84
Table 4.10 Gradation of samples with fiber
Sieve .
Size . in
mm Intermediate. adopted
% .age
retained
Amount of aggregates taken in this binder content
4% 4.5% 5% 5.5% 6% 7%
1148.4 1142.4 1136.4 1130.4 1124.4 1112.4
19 100 100 0% 0% 0% 0% 0% 0%
13.2 90-100 95 5 57.42 57.12 56.82 56.52 56.22 55.62
9.5 50-75 63 32 367.48 365.568 363.648 361.72 359.80 355.968
4.75 25-40 33 30 344.52 342.72 340.92 339.12 337.32 333.72
2.36 20-28 25 8 91.872 91.392 90.912 90.432 89.952 88.992
1.18 18-26 21 4 45.936 45.696 45.456 45.216 44.976 44.496
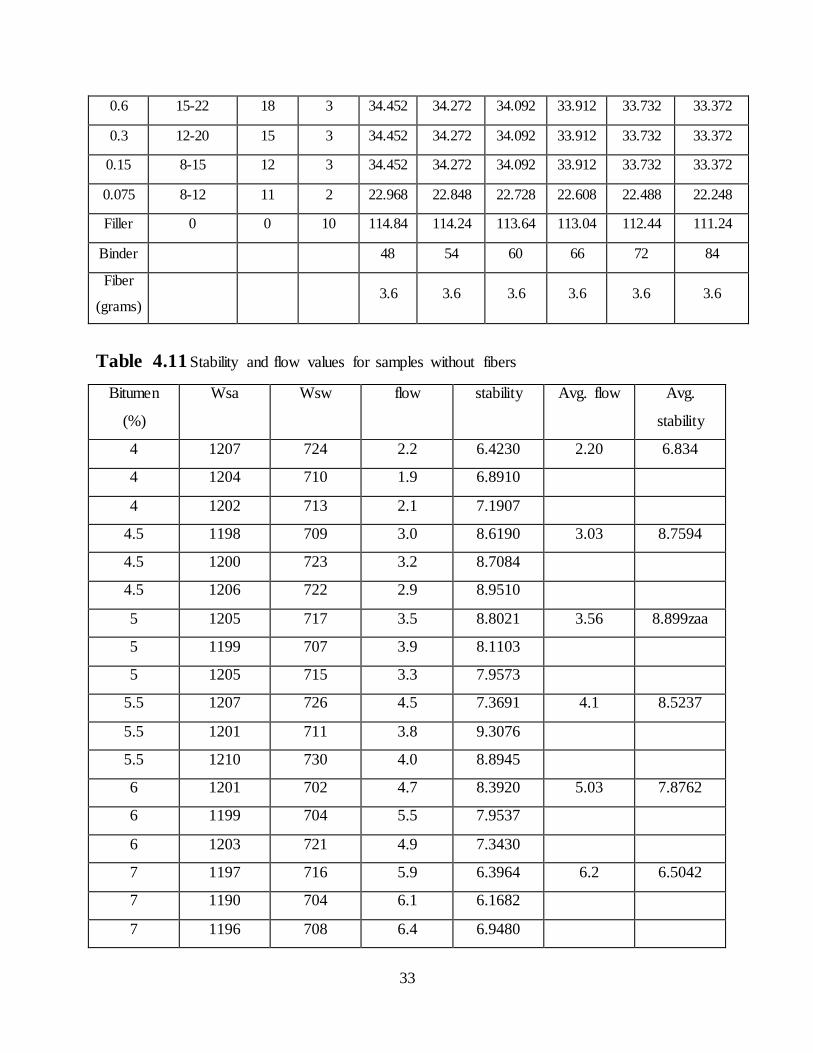
33
0.6 15-22 18 3 34.452 34.272 34.092 33.912 33.732 33.372
0.3 12-20 15 3 34.452 34.272 34.092 33.912 33.732 33.372
0.15 8-15 12 3 34.452 34.272 34.092 33.912 33.732 33.372
0.075 8-12 11 2 22.968 22.848 22.728 22.608 22.488 22.248
Filler 0 0 10 114.84 114.24 113.64 113.04 112.44 111.24
Binder. 48. 54. 60. 66 72. 84
Fiber
(grams) 3.6 3.6. 3.6 3.6 3.6. 3.6.
Table 4.11 Stability and flow values. for samples without fibers
Bitumen.
(%)
Wsa. Wsw. flow stability Avg. flow Avg.
stability
4 1207 724 2.2 6.4230 2.20 6.834
4 1204 710 1.9 6.8910
4 1202 713 2.1 7.1907
4.5 1198 709 3.0 8.6190 3.03 8.7594
4.5 1200 723 3.2 8.7084
4.5 1206 722 2.9 8.9510
5 1205 717 3.5 8.8021 3.56 8.899zaa
5 1199 707 3.9 8.1103
5 1205 715 3.3 7.9573
5.5 1207 726 4.5 7.3691 4.1 8.5237
5.5 1201 711 3.8 9.3076
5.5 1210 730 4.0 8.8945
6 1201 702 4.7 8.3920 5.03 7.8762
6 1199 704 5.5 7.9537
6 1203 721 4.9 7.3430
7 1197 716 5.9 6.3964 6.2 6.5042
7 1190 704 6.1 6.1682
7 1196 708 6.4 6.9480
34
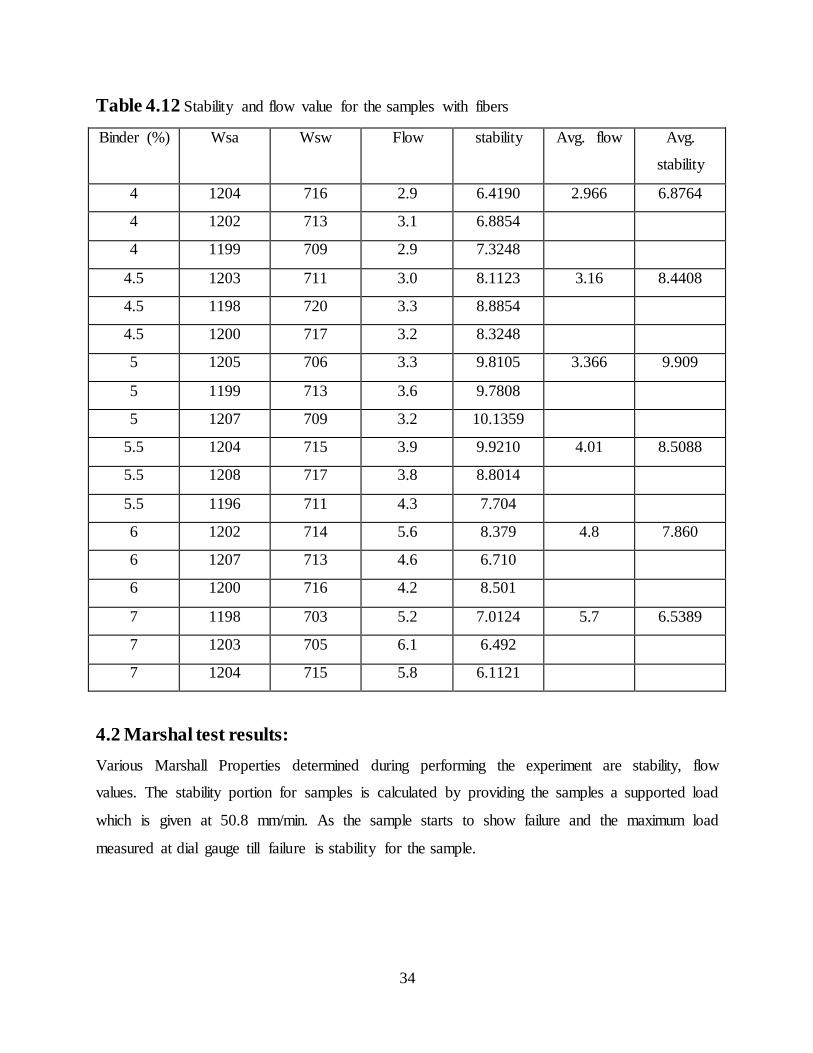
Table 4.12 Stability and flow value for the samples. with fibers
Binder. (%) Wsa Wsw Flow stability Avg. flow Avg.
stability
4 1204 716 2.9 6.4190 2.966 6.8764
4 1202 713 3.1 6.8854
4 1199 709 2.9 7.3248
4.5 1203 711 3.0 8.1123 3.16 8.4408
4.5 1198 720 3.3 8.8854
4.5 1200 717 3.2 8.3248
5 1205 706 3.3 9.8105 3.366 9.909
5 1199 713 3.6 9.7808
5 1207 709 3.2 10.1359
5.5 1204 715 3.9 9.9210 4.01 8.5088
5.5 1208 717 3.8 8.8014
5.5 1196 711 4.3 7.704
6 1202 714 5.6 8.379 4.8 7.860
6 1207 713 4.6 6.710
6 1200 716 4.2 8.501
7 1198 703 5.2 7.0124 5.7 6.5389
7 1203 705 6.1 6.492
7 1204 715 5.8 6.1121
4.2 Marshal test results:
Various Marshall Properties determined during performing the experiment are stability, flow
values. The stability portion for samples is calculated by providing the samples a supported load
which is given at 50.8 mm/min. As the sample starts to show failure and the maximum load
measured at dial gauge till failure is stability for the sample.
35
4.13 Table: Marshall Parameters for samples with fibers
Binder. Content. (%)
Avg. VMA Avg. Va. VFB Stability (KN)
Flow (mm)
4 14.04 4.66 70.78 6.876 2.96 4.5 13.97 3.90 78.68 8.440 3.16 5 13.88 2.96 84.56 9.909 3.36
5.5 14.78 2.81 86.55 8.508 4.01 6 15.72 2.88 89.92 7.860 4.8 7 16.19 2.11 93.02 6.538 5.7
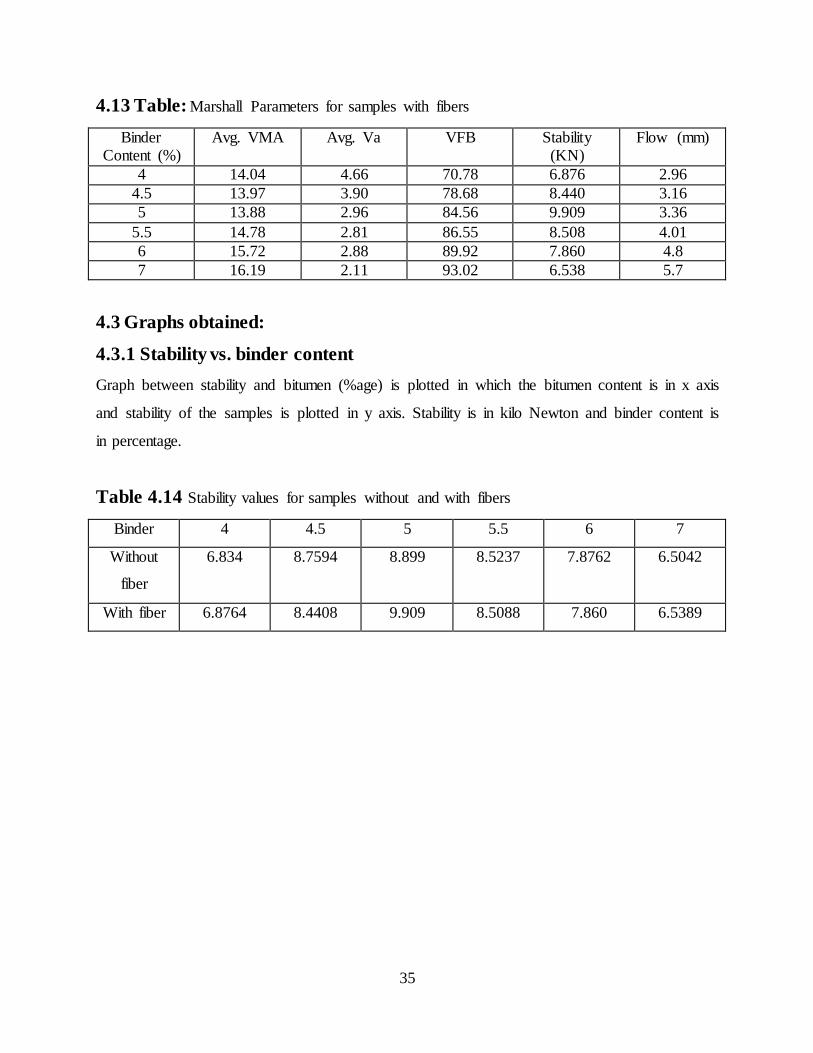
4.3 Graphs obtained:
4.3.1 . Stability vs. binder content
Graph between stability and bitumen (%age) is plotted in which the bitumen content is in x axis
and stability of the samples is plotted in y axis. Stability is in kilo Newton and binder content is
in percentage.
Table 4.14 Stability values for samples without and with fibers
Binder 4 4.5 5 5.5 6 7
Without
fiber
6.834 8.7594 8.899 8.5237 7.8762 6.5042
With fiber 6.8764 8.4408 9.909 8.5088 7.860 6.5389
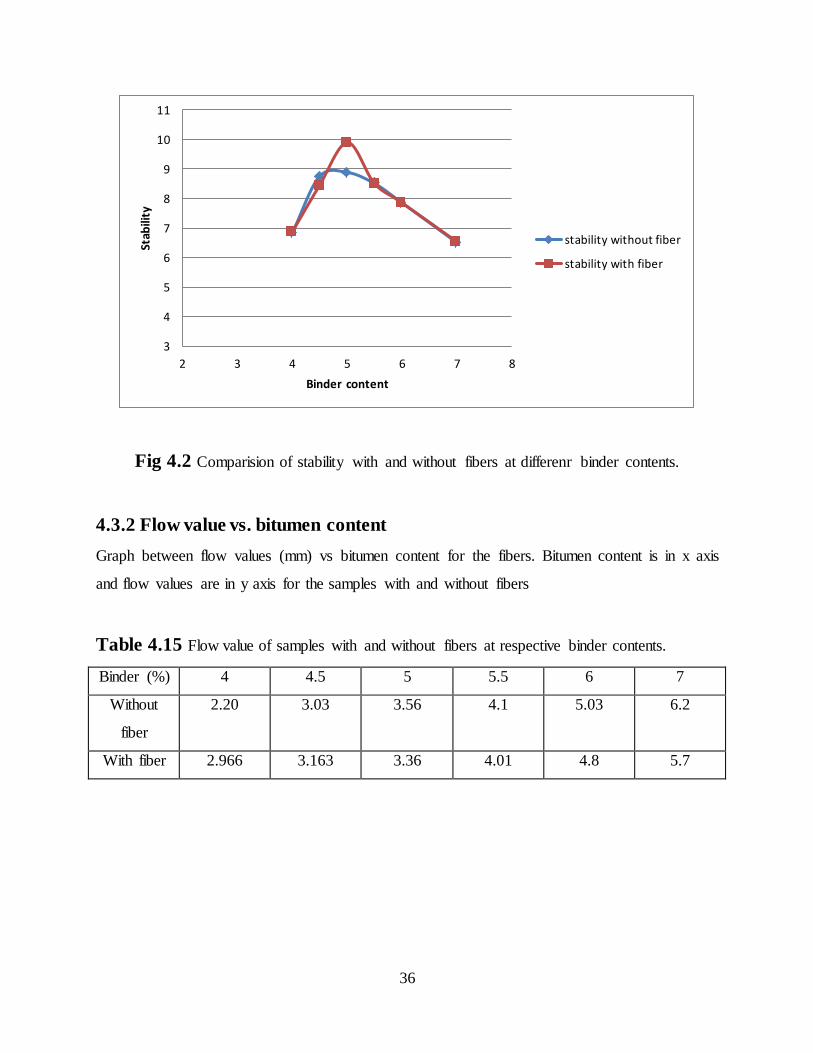
36
Fig 4.2 Comparision of stability with and without fibers at differenr binder contents.
4.3.2 . Flow value vs. bitumen content
Graph between flow values (mm) vs bitumen content for the fibers. Bitumen content is in x axis
and flow values are in y axis for the samples with and without fibers
Table 4.15 Flow value of samples with and without fibers at respective binder contents.
Binder. (%) 4 4.5 5 5.5 6 7
Without
fiber
2.20 3.03 3.56 4.1 5.03 6.2
With fiber 2.966 3.163 3.36 4.01 4.8 5.7
3
4
5
6
7
8
9
10
11
2 3 4 5 6 7 8
Stab
ility
Binder content
stability without fiber
stability with fiber
37
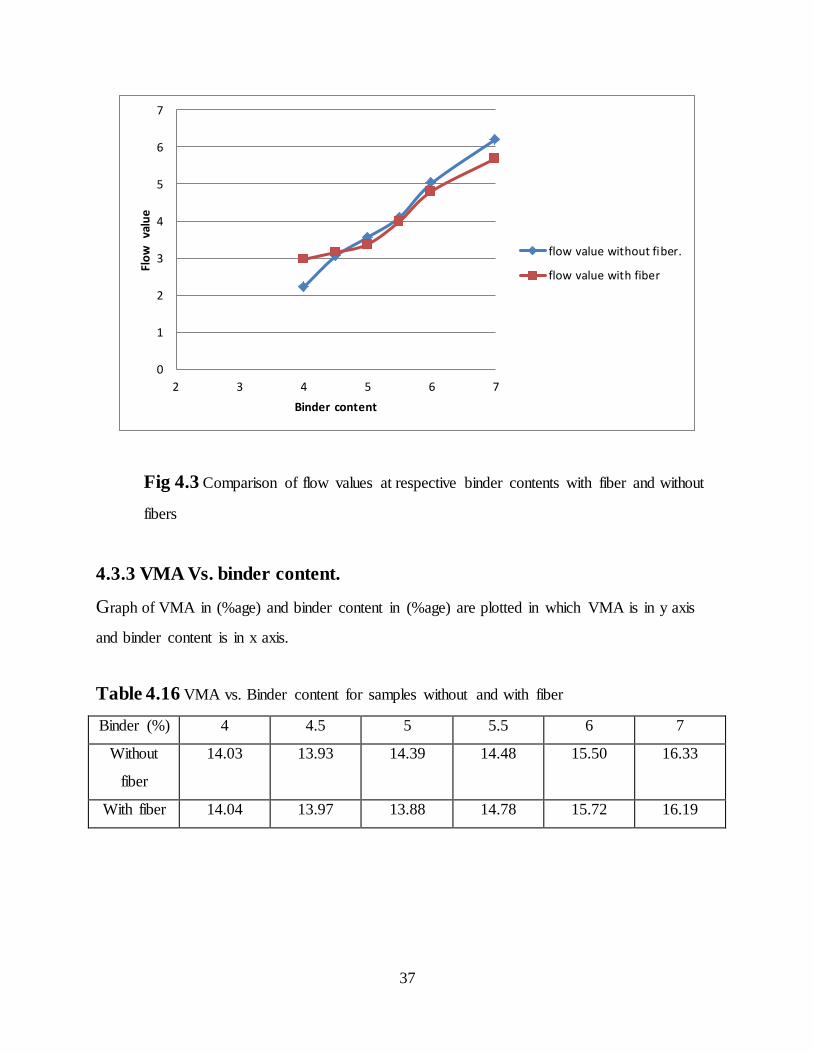
Fig . 4.3 Comparison of flow values at respective binder contents with fiber and without
fibers
4.3.3 . VMA. Vs. binder content.
Graph of VMA in (%age) and binder content in (%age) are plotted in which VMA is in y axis
and binder content is in x axis.
Table 4.16 VMA vs. Binder content for samples without and with fiber
Binder. (%) 4 4.5 5 5.5 6 7
Without
fiber
14.03 13.93 14.39 14.48 15.50 16.33
With fiber 14.04 13.97 13.88 14.78 15.72 16.19
0
1
2
3
4
5
6
7
2 3 4 5 6 7
Flo
w
valu
e
Binder content
flow value without fiber.
flow value with fiber
38
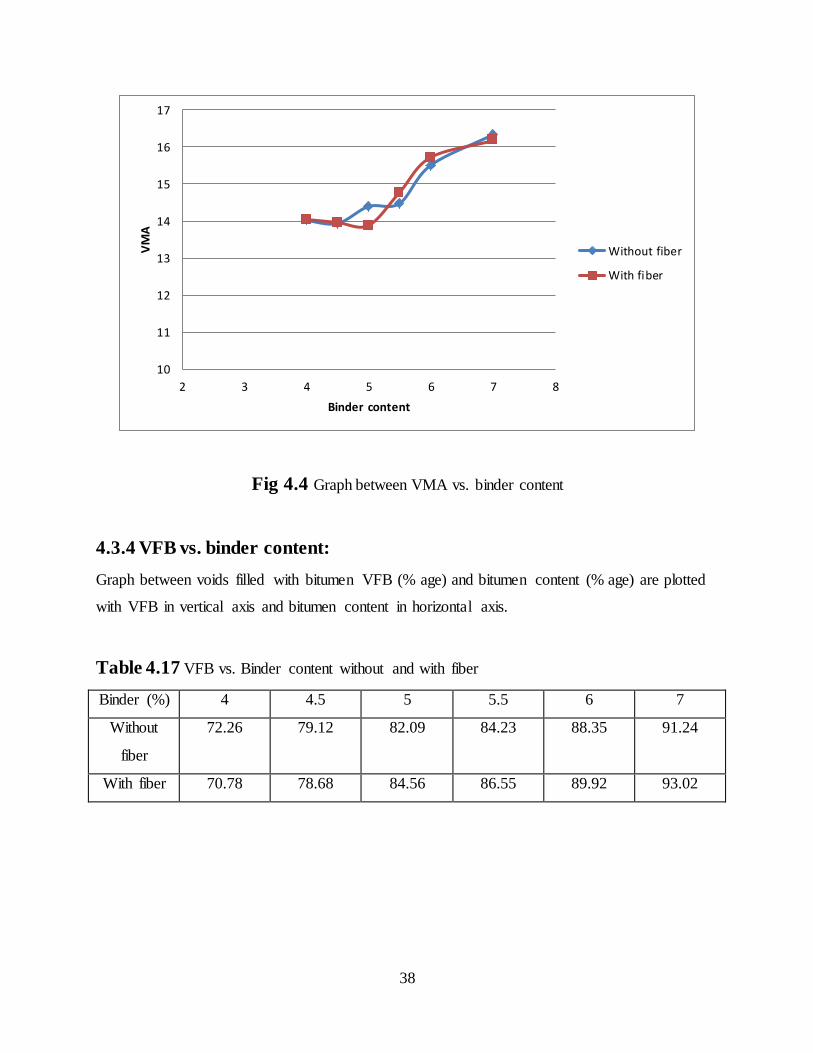
Fig 4.4 Graph between VMA vs. binder content
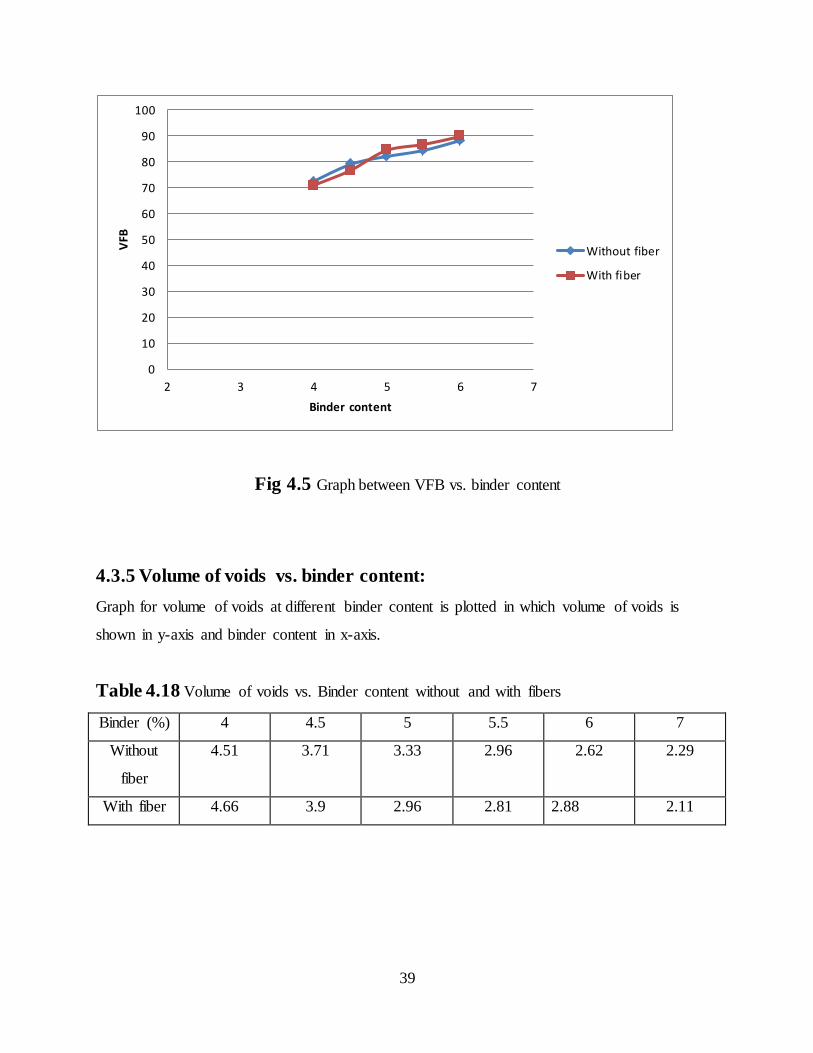
4.3.4 VFB vs. binder content:
Graph between voids filled with bitumen VFB (% age) and bitumen content (% age) are plotted
with VFB in vertical axis and bitumen content in horizontal axis.
Table 4.17 VFB vs. Binder content without and with fiber
Binder (%) 4 4.5 5 5.5 6 7
Without
fiber
72.26 79.12 82.09 84.23 88.35 91.24
With fiber 70.78 78.68 84.56 86.55 89.92 93.02
10
11
12
13
14
15
16
17
2 3 4 5 6 7 8
VM
A
Binder content
Without fiber
With fiber
39
Fig 4.5 Graph between VFB vs. binder content
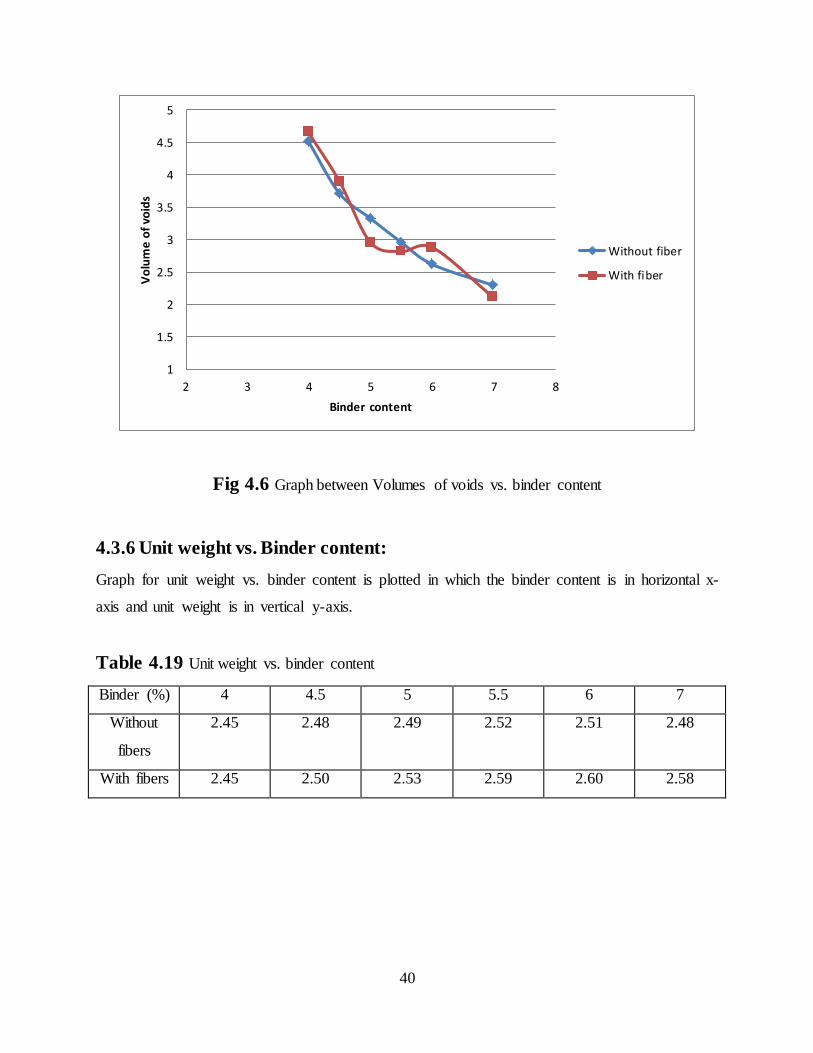
4.3.5 Volume of voids vs. binder content:
Graph for volume of voids at different binder content is plotted in which volume of voids is
shown in y-axis and binder content in x-axis.
Table 4.18 Volume of voids vs. Binder content without and with fibers
Binder (%) 4 4.5 5 5.5 6 7
Without
fiber
4.51 3.71 3.33 2.96 2.62 2.29
With fiber 4.66 3.9 2.96 2.81 2.88 2.11
0
10
20
30
40
50
60
70
80
90
100
2 3 4 5 6 7
VFB
Binder content
Without fiber
With fiber
40
Fig 4.6 Graph between Volumes of voids vs. binder content
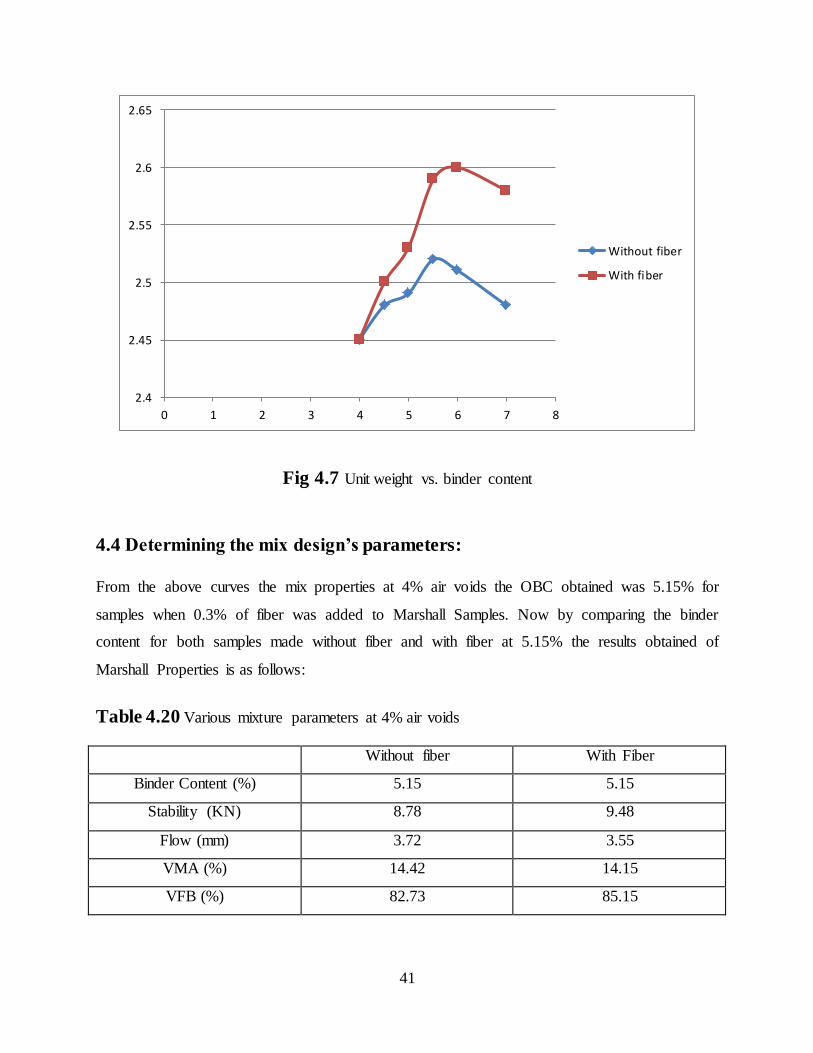
4.3.6 Unit weight vs. Binder content:
Graph for unit weight vs. binder content is plotted in which the binder content is in horizontal x-
axis and unit weight is in vertical y-axis.
Table . 4.19 Unit weight vs. binder content
Binder (%) 4 4.5 5 5.5 6 7
Without
fibers
2.45 2.48 2.49 2.52 2.51 2.48
With fibers 2.45 2.50 2.53 2.59 2.60 2.58
1
1.5
2
2.5
3
3.5
4
4.5
5
2 3 4 5 6 7 8
Vo
lum
e o
f vo
ids
Binder content
Without fiber
With fiber
41
Fig 4.7 Unit weight vs. binder content
4.4 . Determining the mix design’s parameters: From the above curves the mix properties at 4% air voids the OBC obtained was 5.15% for
samples when 0.3% of fiber was added to Marshall Samples. Now by comparing the binder
content for both samples made without fiber and with fiber at 5.15% the results obtained of
Marshall Properties is as follows:
Table 4.20 Various mixture parameters at 4% air voids
Without. fiber With. Fiber
Binder. . Content (%) 5.15 5.15
Stability. (KN) 8.78 9.48
Flow (mm) 3.72 3.55
VMA (%) 14.42 14.15
VFB (%) 82.73 85.15
2.4
2.45
2.5
2.55
2.6
2.65
0 1 2 3 4 5 6 7 8
Without fiber
With fiber
42
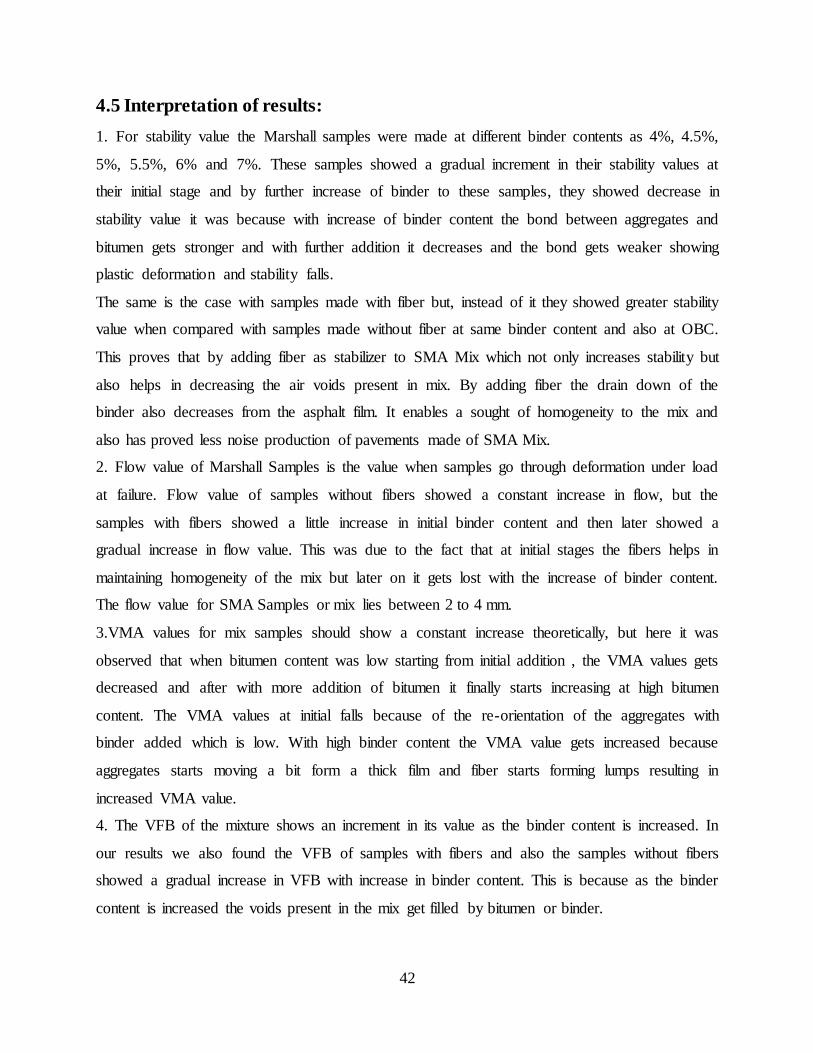
4.5 Interpretation of results:
1. For stability value the Marshall samples were made at different binder contents as 4%, 4.5%,
5%, 5.5%, 6% and 7%. These samples showed a gradual increment in their stability values at
their initial stage and by further increase of binder to these samples, they showed decrease in
stability value it was because with increase of binder content the bond between aggregates and
bitumen gets stronger and with further addition it decreases and the bond gets weaker showing
plastic deformation and stability falls.
The same is the case with samples made with fiber but, instead of it they showed greater stability
value when compared with samples made without fiber at same binder content and also at OBC.
This proves that by adding fiber as stabilizer to SMA Mix which not only increases stability but
also helps in decreasing the air voids present in mix. By adding fiber the drain down of the
binder also decreases from the asphalt film. It enables a sought of homogeneity to the mix and
also has proved less noise production of pavements made of SMA Mix.
2. Flow value of Marshall Samples is the value when samples go through deformation under load
at failure. Flow value of samples without fibers showed a constant increase in flow, but the
samples with fibers showed a little increase in initial binder content and then later showed a
gradual increase in flow value. This was due to the fact that at initial stages the fibers helps in
maintaining homogeneity of the mix but later on it gets lost with the increase of binder content.
The flow value for SMA Samples or mix lies between 2 to 4 mm.
3.VMA values for mix samples should show a constant increase theoretically, but here it was
observed that when bitumen content was low starting from initial addition , the VMA values gets
decreased and after with more addition of bitumen it finally starts increasing at high bitumen
content. The VMA values at initial falls because of the re-orientation of the aggregates with
binder added which is low. With high binder content the VMA value gets increased because
aggregates starts moving a bit form a thick film and fiber starts forming lumps resulting in
increased VMA value.
4. The VFB of the mixture shows an increment in its value as the binder content is increased. In
our results we also found the VFB of samples with fibers and also the samples without fibers
showed a gradual increase in VFB with increase in binder content. This is because as the binder
content is increased the voids present in the mix get filled by bitumen or binder.
43
5. The air voids theoretically decreases when binder addition is increased it is due to the fact that
it fills up the voids present in mix. The Va was less near OBC of samples with fiber because of
the fact that on addition of bitumen and fiber the voids present in mix got filled up. If there is any
increase in air voids after OBC is due to improper mixing of samples.
44
CHAPTER 5
CONCLUSION AND FUTURE SCOPE
5.1 Concluding remarks:
The literature review provides a general idea about the previous researches made which were
done on bituminous mixes such as SMA, dense grade mixture. Observing the chief points from
these researches in mind, the selection for SMA composition based on current study is used. In
this research an effort is made to evaluate different properties of SMA by performing various
tests like Marshall Test. The binder’s grade used in this research is VG-30 grade bitumen. Fly
ash is added as filler in the research. MORT&H gradation is adopted. In this research fiber which
was used is Hemp fiber and other materials are added to mix. Fiber is added to avert the drain
down of bitumen and it is found in previous researches that by adding fiber the drain down of
binder gets decreased from asphalt film. At OBC of samples it was showing increased stability
when compared to the samples made without fibers at same binder content. The fiber added was
taken 0.3% which is a standard value for SMA mix samples. This fiber is abundantly available
across the world as also in India and is considered as a waste because it is illegal in India. This
fiber has not been used yet in SMA Mix or in past literature review.
5.2 Future Scope:
Hemp fiber can also be tested /checked with other type of bitumen of different grades.
Other type of test with other HMA type and super paves.
Other natural and synthetic fibers with different content of fiber can also be tried.
Future investigation of hemp fiber used in rigid pavements.
Use of other type of fillers can also be tested with hemp fiber to check the performance.
Legalization of cannabis plant in India, so with the help of this fiber we can utilize it in
other useful purposes.
45
REFERENCES
1. Brown, E. R., & Manglorkar, H. (1993). Evaluation of laboratory properties of SMA
mixtures. National Center for Asphalt Technology, Report, (93-5), 159.
2. Bradley J. Putman and Serji N. Amirkhanian (2004), “Utilization of Waste Fibre in Stone
Matrix Asphalt Mixtures”, Resources, Conservation and Recycling, Volume 42, Issue 3, pp 265-
27.
3. Kamraj C., Kumar G., Sharma G., Jain P.K. and Venkanna Babu P. (2004), “Laboratory
Studies on the Behaviour of Stone Matrix Asphalt vis-à-vis Dense Graded Bituminous Mixes
using Natural Rubber Powder (Wet Process)”, Highway Research Bulletin, No 71, IRC, New
Delhi.
4. Reddy K.S., Palit S.K. and Pandey B.B. (2004), “Laboratory Evaluation of Crumb Rubber
Modified Asphalt Mixes”, Journal of Materials in Civil Engineering, ASCE, pp 45-53
5. Huaxin Chen and Qinwu Xu (2010), Experimental study of fibers in stabilizing and
reinforcing asphalt binder, Fuel 89 (2010) 1616–1622
6. Muniandy, R., & Huat, B. B. (2006). Laboratory diameteral fatigue performance of stone
matrix asphalt with cellulose oil palm fiber. American Journal of Applied Sciences, 3(9), 2005-
2010.
7. Bindu, C. S., & Beena, K. S. (2013). COMPARISON OF SHEAR STRENGTH
CHARACTERISTICS OF STONE MATRIX ASPHALT MIXTURE WITH WASTE
PLASTICS AND POLYPROPYLENE
8. Ahmadinia, E., Zargar, M., Karim, M. R., Abdelaziz, M., & Shafigh, P. (2011). Using waste
plastic bottles as additive for stone mastic asphalt.Materials & Design, 32(10), 4844-4849.
46
9. Punith, V. S., Suresha, S. N., Raju, S., Bose, S., & Veeraragavan, A. (2011). Laboratory
investigation of open-graded friction-course mixtures containing polymers and cellulose
fibers. Journal of Transportation Engineering, 138(1), 67-74.
10. Kumar, P., Chandra, S., & Bose, S. (2007). Laboratory investigations on SMA mixes with
different additives. International Journal of Pavement Engineering, 8(1), 11-18.
11. Xue, Y., Hou, H., Zhu, S., & Zha, J. (2009). Utilization of municipal solid waste incineration
ash in stone mastic asphalt mixture: pavement performance and environmental
impact. Construction and Building Materials, 23(2), 989-996.
12. H. Jony Hassan, Y. Jahad Israa (2010), “The Effect of Using Glass Power filler on Hot
Asphalt Concrete Mixture Properties”, Engg and Technology journal, vol.29, Issue1


