Embed Size (px)
Citation preview

D|S|P Housing & Development Consultants
Wycombe District Council
Community Infrastructure Levy
Viability Assessment Ref: DSP 11023
November 2011
Dixon Searle LLP
The Well House
28D Headley Road
Grayshott
Hindhead
GU26 6LD
www.dixonsearle.co.uk

Wycombe District Council - CIL Economic Viability D|S|P Housing & Development Consultants
Wycombe District Council – CIL Viability Assessment (Ref. No. DSP11023) i
Contents
Introduction 1 Assessment Methodology 5 Findings 30
Figures
Figure 1: Simplified Residual Land
Valuation Principles
Figure 2: Relationship between RLV
& Potential Maximum CIL
Rate
Figure 3: Residential Scheme Types
Figure 4: Residential Unit Sizes
Figure 5: Commercial Scheme Types
Figure 6: Residential Values
Figure 7: Land Registry Average
House Prices
Figure 8: Rental Value for
Commercial Schemes
Figure 9: Build Cost Data
Figure 10: Build Period
Figure 11: Other uses – example
value/cost relationships

Wycombe District Council - CIL Economic Viability D|S|P Housing & Development Consultants
Wycombe District Council – CIL Viability Assessment (Ref. No. DSP11023) ii
Figure 12: CIL charging trial rates as %
of Gross Development
Value - Residential
Figure 13: CIL charging trial rates as %
of Gross Development
Value – Commercial
Figure 14: CIL charging trial rates as %
of Build Cost – Residential
Figure 15: CIL charging trial rates as %
of Build Cost – Commercial
Figure 16: CIL charging trial rates as %
of Total Development Cost
– Residential
Figure 17: CIL charging trial rates as %
of Total Development Cost
– Commercial
Figure 18: Residential CIL trial rates -
Charge per Dwelling
Equivalent
Figure 19: Commercial CIL trial rates -
Charge per Dwelling
Equivalent

Wycombe District Council - CIL Economic Viability D|S|P Housing & Development Consultants
Wycombe District Council – CIL Viability Assessment (Ref. No. DSP11023) iii
Appendices
Appendix I:
Assumptions outline
Appendix IIA:
Residential Results Summaries
Appendix IIB:
Commercial Results Summaries
Appendix III:
Market, Values and Assumptions –
Research and Background

Wycombe District Council - CIL Economic Viability D|S|P Housing & Development Consultants
Wycombe District Council – CIL Viability Assessment (Ref. No. DSP11023) iv
Executive Summary
1. The Community Infrastructure Levy has been introduced by the Government as a
means of Local Authorities pooling development contributions to help fund the
provision of the local infrastructure needed to support the planned growth in their
area. By 2014 it will largely, though not entirely, replace s.106 as a means of
securing such contributions (after then, pooling of s.106 contributions to fund
wider infrastructure provision) will be limited).
2. The CIL will be chargeable on a per square metre (sq m) basis; on all new
development exceeding 100 sq m (including extensions) and including new
dwellings of less than 100 sq m. Affordable housing and developments by charities
will not be subject to CIL. Subject to certain rules, the CIL will not apply to any
existing accommodation on a development site (whether demolished or reused) –
that floor area will be deducted from the chargeable development within the
charging calculation.
3. In the process of considering its local implementation of the CIL, Wycombe District
Council appointed Dixon Searle Partnership (DSP) to review the scope for a range
of development types (residential and commercial / non-residential) to support
CIL funding in the District.
4. The purpose of this resulting study is to inform the Council’s consideration of
proposed CIL charging rate(s) in the District, by use type and potentially also by
locality – depending on viability, varying charging rates may be set. In setting rates
that strike an appropriate balance between contributing to local infrastructure
funding needs (the funding gap) and development viability, Local Authorities also
consider a wide range of other information - including on site supply and the
relevance of various development types to their area.
5. The study involved key stages of research, assumptions setting, carrying out a
wide range of appraisals and review. The appraisals used residual land valuation
principles, as have become the main established approach to this type of study.
6. For residential development suitable parameters for CIL charging were found to
be in the range £100 - £150 / sq m. More detailed review of the findings suggests
options to set either a single charging rate across District at £125/sq m; or set a
dual rate with a second, higher, charging level at £150/sq m applicable to the

Wycombe District Council - CIL Economic Viability D|S|P Housing & Development Consultants
Wycombe District Council – CIL Viability Assessment (Ref. No. DSP11023) v
higher value areas of the District where stronger viability outcomes are generally
seen. We consider that the latter approach would better respect the housing
values patterns in the District, whereby and the NW-SE “central axis of the
District” - through and including the town of High Wycombe - would be best
served by the lower of these potential rates (£125/sq m).
7. The viability of a range of commercial / non-residential development types in the
District was found to be highly variable. However, we saw an over-riding theme
that retail related development presents the only clear scope for meaningful CIL
contributions. Respecting the balance that needs to be found, we recommend
that suitable rates for retail development are no more than £250 / sq m for large
units (supermarkets and retail warehousing) and not more than half that for
smaller scale retail developments (e.g. convenience stores and others).
8. In a wide range of other cases, it was found that CIL charging would generally
either exacerbate a lack of viability or could place added risk to development
coming forward across the District. In summary, at the current time and for the
foreseeable future we therefore recommend a nil (£0/sq m) charging rate
applicable to other uses including business development (B uses).
9. In all cases the resulting CIL charging rates are considered to represent an
appropriate balance in the local circumstances. The report includes detailed
information and commentary. It also makes associated recommendations relating
to regular monitoring and potential review of the local CIL charging regime.
Executive Summary ends.
November 2011.

Wycombe District Council - CIL Economic Viability D|S|P Housing & Development Consultants
Wycombe District Council – CIL Viability Assessment (Ref. No. DSP11023) 1
1 Introduction
1.1. Background – Community Infrastructure Levy and Purpose of this Report
1.1.1 The Community Infrastructure Levy (‘CIL’) came into force in April 2010 and allows
local authorities in England and Wales to raise funds from developers undertaking
new developments in their area. The levy is charged on most new developments that
involve an increase in floor space. Most developments under 100 square metres in
area will not pay the levy, for example, a small extension to a house. But
development that involves the creation of a new residential unit (such as a house or a
flat) will pay the charge, even if the unit is below 100 square metres in area. The
charge will be expressed as a rate per sq m of development. The money raised can be
spent on the infrastructure needed to support the development of the Council area
and the government will require that charging authorities allocate a meaningful
proportion of levy revenue raised in each neighbourhood back to that
neighbourhood.
1.1.2 CIL takes the form of a charge levied per square metre of net additional floorspace of
development. The levy rates will have to be underpinned firstly by evidence of the
infrastructure needed to support new development and secondly by evidence of
development viability.
1.1.3 Wycombe District Council has been working with infrastructure providers since 2008
in preparing its Infrastructure Delivery Plan to support the Wycombe Development
Framework and is updating this document following further engagement. This will
form the basis of identifying the total cost of infrastructure associated with
supporting the development plan (Core Strategy) led growth in the District; including
the element that can be funded from CIL (the infrastructure funding gap) subject also
to the scope as reviewed following viability testing.
1.1.4 Infrastructure is taken to mean any service or facility that supports the District and its
population and includes but is not limited to transport, energy, water, drainage,
waste, ITC, open space, affordable housing, education, health community services
and culture and leisure. In the case of current Community Infrastructure Levy (CIL)
scope, and therefore this assessment, affordable housing is assumed to be outside
the scope of CIL and dealt with in the established way through site specific planning
(s.106) agreements. Affordable housing has been allowed for separately, in addition
to CIL.

Wycombe District Council - CIL Economic Viability D|S|P Housing & Development Consultants
Wycombe District Council – CIL Viability Assessment (Ref. No. DSP11023) 2
1.1.5 Any authority wishing to charge CIL must produce a charging schedule setting out the
levy’s rates in its area. The CIL rate or rates should be set at a level that ensures that
development within their area is not put at serious risk.
1.1.6 A key requirement of CIL and setting the charging schedule is that it should strike an
appropriate balance between the desirability of funding infrastructure from the levy
and the potential effects that imposing the levy may have upon the economic
viability of development. In order to meet the requirement of Regulation 14 of the
CIL Regulations April 2010 (as amended) the Council therefore appointed
consultants, Dixon Searle Partnership, to provide the evidence base to inform the
development of and support the Council’s draft charging schedule in viability terms.
1.1.7 This study investigates the potential for charging CIL by showing the likely impact on
the economic viability of residential and non-residential development scenarios
across Wycombe District. It aims to provide the Council with advice as to the likely
viability of seeking developer contributions towards infrastructure in the form of CIL
charging; including the viability considerations and potential rate or rates at which
that can be set in the local context.
1.1.8 The approach taken in this study follows the well recognised methodology of residual
land valuation. Put simply the residual land value produced by a potential
development is calculated by subtracting the costs of achieving that development
from the revenue generated by the completed scheme (the gross development value
– ‘GDV’).
1.1.9 The residual valuation technique has been used to run appraisals on both residential
and non-residential scheme typologies (notional or hypothetical schemes) that are
likely to come forward across the Wycombe District area. The residual values
generated for the purposes of this study and for indicating the potential viability of a
scheme need exceed an existing or alternative use value (‘EUV’ or ‘AUV’) whilst at the
same time contributing towards the Community Infrastructure Levy. In considering
the relationship between the land value created by a scenario and some comparative
level that might need to be reached, we have to acknowledge that in practice this is a
dynamic one and can be highly variable. It is not an exact science, as is acknowledged

Wycombe District Council - CIL Economic Viability D|S|P Housing & Development Consultants
Wycombe District Council – CIL Viability Assessment (Ref. No. DSP11023) 3
in a range of similar work and in technical papers and guidance notes on the topic of
considering and assessing development viability. Therefore, so as to inform our
judgments in making this overview, our practice is to look at a range of potential land
value levels that might need to be reached in various scenarios.
1.1.10 The potential level of CIL charge viable in each scenario has been varied through an
iterative process exploring trial rates of between £0 and £250 per square metre; with
an indication given also of the potential maximum CIL level that could theoretically
be achieved where it is outside these parameters.
1.1.11 The results of each of the appraisals are compared to a range of potential existing or
alternative use value benchmarks or other guides relevant to the circumstances - to
determine the potential scope for various CIL rate contributions according to
development type and with varying completed scheme value levels (GDVs). The
results sets have been tabulated in summary form and those are included as
Appendices IIA (residential) and IIB (commercial) to the rear of this document.
1.1.12 In considering the potential charging rates we have also considered the results
alongside a variety of additional measures for reviewing the scale of the potential CIL
rates. This includes reviewing the potential CIL rates in terms of percentage of
development cost, percentage of development value; and the equivalent sum in £s
per unit or by scheme total. All of these areas help us and the Council to consider the
likely proportional effects and the level of CIL that could reasonably be expected to
be charged on development without putting it at unduly at risk across Wycombe
District; i.e. as part of finding the right balance between infrastructure funding needs
and the viability of development in the Council’s area.
1.1.13 The report then sets out findings for Wycombe District Council to consider in taking
forward its further development work on the local implementation of the CIL and in
particular the Council’s Draft Charging Schedule (focussing on the conclusions, allied
to a range of results and other indications as discussed and set out in the
Appendices).

Wycombe District Council - CIL Economic Viability D|S|P Housing & Development Consultants
Wycombe District Council – CIL Viability Assessment (Ref. No. DSP11023) 4
1.2 Notes and Limitations
1.2.1 This study has been carried out using well recognised residual valuation techniques
by consultants highly experienced in the production of strategic viability assessments
for local authority policy development.
1.2.2 In order to carry out this type of study a large quantity of data is reviewed and a
range of assumptions are required alongside that which rarely fits all eventualities -
small changes in assumptions can have a significant individual or cumulative effect on
the residual land value generated and / or the value of the CIL funding potential.
1.2.3 It should be noted that in practice every scheme is different and no study of this
nature can reflect the variances seen in site specific cases.
1.2.4 Specific assumptions and values applied for our schemes are unlikely to be
appropriate for all developments and a degree of professional judgment is required.
We are confident, however, that our assumptions are reasonable in terms of making
this viability overview and informing the Council’s work on its CIL preliminary draft
charging schedule preparations.

Wycombe District Council - CIL Economic Viability D|S|P Housing & Development Consultants
Wycombe District Council – CIL Viability Assessment (Ref. No. DSP11023) 5
2 Assessment Methodology
2.1 Residual Valuation
2.1.1 This study investigates the potential for a range of development types to contribute
to infrastructure provision funding across Wycombe District through the collection of
financial contributions charged via a Community Infrastructure Levy.
2.1.2 In order to do this we have run development appraisals using the well recognised
principles of residual valuation on a number of notional scheme types, both
residential and non-residential/commercial.
2.1.3 Residual valuation as the name suggests provides a “residual” value from the gross
development value (GDV) of a scheme after all other costs are taken into account.
The diagram below shows the simplified principles behind residual valuation:
Figure 1: Simplified Residual Land Valuation Principles

Wycombe District Council - CIL Economic Viability D|S|P Housing & Development Consultants
Wycombe District Council – CIL Viability Assessment (Ref. No. DSP11023) 6
2.1.4 Having allowed for the costs of development, finance and profit, the resulting figure
indicates the sum that is potentially available to pay for the land.
2.1.5 In order to guide on a range of likely viability outcomes the assessment process also
requires a benchmark, or range of benchmarks of some form, against which to
compare the resulting residual value (‘RLV’) - such as an indication of existing or
alternative land use values (‘EUVs’ or ‘AUVs’) relevant to the site use and locality;
including any potential uplift required to encourage a site to be released for
development (which might be termed a premium, over-bid, incentive or similar).
Essentially this means taking an appropriate high level view around the potential
level(s) that land value may need to reach in order to drive varying prospects of
schemes being viable.
2.1.6 The level of land value sufficient to encourage the release of a site for development is
in practice a site specific and highly subjective matter. It often relates to a range of
factors including the actual site characteristics and the specific requirements or
circumstances of the landowner. Therefore indications of land values using sources
such as the Valuation Office Agency (VOA) reporting, previous evidence held by the
Council and any available sales evidence have been used for this purpose in making
our assessment. Recently there has been a relatively low level of activity on land
deals and consequently there has been very little to go on in terms of examples; the
range of reporting mentioned above has to be relied upon to inform our assumptions
and judgments. This is certainly not just a Wycombe District factor, but one that we
are typically experiencing in carrying out these types of studies. In assessing results,
the surplus or excess residual (land value) remaining after these indicative land value
comparisons is shown as the margin potentially available to fund CIL contributions.
2.1.7 From an overview of those relationships, in the context of the range of wider
assumptions within particular scenarios, we can see results trends – deteriorating
RLV and therefore viability outcomes as scheme value (GDV) decreases; and / or
costs rise – e.g. through adding/increasing affordable housing, increasing build costs
(e.g. with varying commercial development types) and increasing “trial” CIL rates.
Any potential margin (CIL funding scope) is then considered in the round so that
charging rates are not pushed to the limits but also for some other scope to support

Wycombe District Council - CIL Economic Viability D|S|P Housing & Development Consultants
Wycombe District Council – CIL Viability Assessment (Ref. No. DSP11023) 7
viability given the range of costs etc that could move around. In essence, the steps
taken to consider that potential margin or surplus are as follows:
Figure 2: Relationship Between RLV & Potential Maximum CIL Rate (surplus or margin
potentially available for CIL)
2.1.8 The assumptions that go into the residual land value appraisals are set out in more
detail in this chapter. Further information is also available at Appendices I and III.
They reflect the local market (through research on local values, costs and types of
provision, etc) and locally relevant planning policies (taking into account the policies
set out within the Wycombe District Council adopted Core Strategy1) as well as other
practical delivery aspects locally.
2.2 Site Typologies / Notional Site Types
2.2.1 Appraisals using the principles outlined above have been carried out to review the
viability of different types of residential and commercial developments. The
scenarios were developed and discussed with the Council following a review of
information it provided; such as the Council’s monitoring database and Strategic
1 Wycombe District Council – Wycombe Development Framework Adopted Core Strategy (July 2008)

Wycombe District Council - CIL Economic Viability D|S|P Housing & Development Consultants
Wycombe District Council – CIL Viability Assessment (Ref. No. DSP11023) 8
Housing Land Availability Assessment (SHLAA) data in the case of the residential
scenarios. It was necessary to determine scenario types likely to come forward across
the District. The scheme types were then proposed to and agreed with the Council as
reasonably representative for the purposes of this high level overview viability
assessment.
2.2.2 For residential schemes, six scenarios were tested with the following mix of units and
including integrated affordable housing (where required by and in accordance with
the Council’s policy):
Figure 3: Residential Scheme Types
Scheme Type Overall Scheme Mix
1 House 1 x 4BH
4 Houses 2 x 2BH; 2 x 3BH
14 Mixed 2 x 1BF, 3 x 2BF; 2 x 2BH, 5 x 3BH, 2 x 4BH
25 Mixed 3 x 1BF, 5 x 2BF; 4 x 2BH, 9 x 3BH, 4 x 4BH
50 Mixed 6 x 1BF, 10 x 2BF; 8 x 2BH, 18 x 3BH, 8 x 4BH
100 Mixed 12 x 1BF, 20 x 2BF; 16 x 2BH, 32 x 3BH, 16 x 4BH
Note: BH = bed house; BF = bed flat
2.2.3 The unit mixes were again based on information provided by the Council and reflect a
range of different types of development that could come forward regularly across the
District so as to ensure that viability has been tested with reference to the ongoing
housing supply themes and policies. Each scheme type was also tested over a range
of value levels representing varying residential values seen currently across
Wycombe District and also allowing us to consider the impact on development
viability of changing market conditions over time.
2.2.4 As above, a key area of the assumptions setting for the residential scenarios was to
reflect the Council’s Core Strategy policies, including on affordable housing. Those
policies require affordable housing on sites of 15 or more units in the High Wycombe
Urban Area, Marlow and Princes Risborough; and on developments of 5 or more
units in the remainder of the District. The Council requires 40% affordable housing on
greenfield sites and sites that were last used for business (“B-class use” or similar sui-
generis employment generating use). On other sites, 30% affordable housing is
required. The affordable housing requirements are based on percentages of bed
Wycombe District Council - CIL Economic Viability D|S|P Housing & Development Consultants
Wycombe District Council – CIL Viability Assessment (Ref. No. DSP11023) 9
spaces within a development, not numbers of units. The scheme typologies applied
in this study reflect those policies and full details of the private and affordable
housing numbers assumed within each scheme scenario can be seen in Appendix I –
Assumptions Spreadsheet.
2.2.5 The unit sizes assumed for the purposes of this study are as follows:
Figure 4: Residential Unit Sizes
Unit Sizes (sq m) Affordable Private
1-bed flat 50 45
2-bed flat 67 60
2-bed house 75 75
3-bed house 85 95
4-bed house 110 125
2.2.6 As with many areas of the study assumptions there will be a variety of dwelling sizes
coming forward in practice, varying by scheme and location. No single size or even
range of assumed sizes will represent all dwellings coming forward. Since there is a
relationship between dwelling sizes, their values and their build costs, it is the levels
of those that are most important for the purposes of this study (i.e. expressed in £ sq
m terms); rather than the specific dwelling sizes to which those levels of costs and
values are applied. With the approach, the indicative ‘Values Levels’ (‘VL’s) used in
the study can then be applied to varying (alternative) dwelling sizes. The approach to
focus on values and costs per sq m also fits with the way developers tend to price
and assess schemes; and is consistent with CIL principles. It provides a more relevant
context for considering the potential viability scope and the also, purely as an
additional measure, reviewing the potential CIL charging rate outcomes as
proportions of the schemes values and costs.
2.2.7 The unit / development sizes indicated are gross internal areas (GIAs). They are
reasonably representative of the type of units coming forward for smaller and
average family accommodation, within the scheme types likely to be seen most
frequently providing on-site integrated affordable housing. We acknowledge that
these 3 and 4-bed house sizes, in particular, may be small compared with some
coming forward. All will vary, and from scheme to scheme. However, our research
suggests that the values (£ sales values) applicable to larger house types would

Wycombe District Council - CIL Economic Viability D|S|P Housing & Development Consultants
Wycombe District Council – CIL Viability Assessment (Ref. No. DSP11023) 10
generally exceed those produced by our dwelling size assumptions and would be
similarly priced in terms of the relevant analysis – i.e. looking at the range of £ per sq
m ‘Value levels’ basis. In summary on this point, it is always necessary to consider the
size of new build accommodation in looking at its price. The range of prices
expressed in £s per square metre is the therefore the key measure used in
considering the research, working up the range of values levels for testing; and in
reviewing the results.
2.2.8 In the same way, the Commercial scheme scenarios were developed through the
review of information supplied by, and through Consultation with, the Council;
supplemented with and checked against wider information. The following sets out
the various notional scheme types modelled for this study, covering a range of uses
in order to test the impact on viability of requiring CIL contributions from key types of
commercial development considered likely to be relevant in the District:
Figure 5: Commercial Development Types
Development Type Example Scheme Type(s) GIA
(m²)
Site
Coverage
Site
Size
(Ha)
Large Retail -
supermarket
Large Supermarket – edge of/out of
town 4000 35% 1.14
Large Retail – retail
warehousing
Retail warehouse – various locations.
Could also include smaller
supermarkets.
1000 40% 0.25
Small Retail –
convenience store (to
include comparison,
A1-A5)
Convenience Store - various
locations. Also includes food and
drink, financial services.
300 60% 0.05
Business development
- B1(a) Offices
- Town Centre
In town Office Building 1000 200% 0.05
Business development
- B1(a) Offices
Business Park
Edge of town Office Building 3000 40% 0.75
Business development
B1 , B2, B8 - Industrial
/ Warehousing
Move-on type industrial unit
including offices - industrial estate
(also office uses in industrial estate
type buildings and locations)
500 40% 0.13

Wycombe District Council - CIL Economic Viability D|S|P Housing & Development Consultants
Wycombe District Council – CIL Viability Assessment (Ref. No. DSP11023) 11
Business development
B1, B2, B8 - Industrial /
Warehousing
Larger industrial / warehousing unit
including offices - industrial estate 3000 40% 0.75
Hotel
(budget - 120 rooms)
Hotel - edge of town centre / edge of
town 3000 50% 0.60
Residential Institution
- Care home Nursing Home 2100 60% 0.35
D1/D2 - Institutional /
Community / Health Clinic or similar 500 40% 0.13
Leisure (D2) Fitness centres, bowling, etc 2500 50% 0.50
2.2.9 Although highly variable in practice, these types and sizes of schemes are thought to
be reasonably representative of a range of commercial scheme scenarios that could
come forward in Wycombe District. As in respect of the assumptions for the
residential scenarios, a variety of local development industry stakeholders including
property agents, developers and their planning agents / advisers were contacted and
invited to supply any readily available market information, guides or particular
examples; including on values, land values and other development appraisal
assumptions. Again, as part of assembling and reviewing assumptions, we were also
in contact with staff from the Council’s major projects and property section, together
with planning staff with employment sites knowledge and experience. Alongside
seeking and, to varying degrees receiving, soundings from a range of sources such as
these, DSP used information sourced from Estates Gazette Interactive (EGi), the VOA
Rating List and Wycombe DC / Invest in Bucks website resources. Further
information is provided within Appendix III to this report.
2.2.10 The site coverage percentages indicated in Figure 5 are based on information
provided by and discussed with the planning staff from their local knowledge and
records, as supplemented / verified by local development examples and case studies
from our research where possible. Additional information included articles and
development industry features sourced from a variety of construction related
publications; and in some cases property marketing details. Collectively, our research
enabled us to apply a level of “sense check” to our proposed assumptions. Appendix
III outlines the range of information considered.
2.2.11 In addition to testing the commercial uses of key relevance above, further
consideration was given to other uses that may potentially come forward across the

Wycombe District Council - CIL Economic Viability D|S|P Housing & Development Consultants
Wycombe District Council – CIL Viability Assessment (Ref. No. DSP11023) 12
District. These include, amongst others, non-commercially driven facilities
(community halls, medical facilities, schools, etc) and other commercial uses such as
motor sales, garages / depots / workshops, agricultural storage, surgeries / similar,
and day nurseries.
2.2.12 Clearly there is potentially a very wide range of such schemes that could come
forward. Alongside their viability, it is also relevant for the Council to consider the
frequency and distribution of these; and their role in the delivery of the development
plan (Core Strategy). For these scheme types, as a first step it was possible to review
in basic terms the key relationship between their completed value per square metre
and the cost of building.
2.2.13 Where quickly it can be seen that the build cost (even before all other costs such as
finance, fees, profits, purchase and sale, etc are allowed for) outweighs or is close to
the completed value, it becomes clear that a scenario is not financially viable in the
usual development sense being reviewed here and related to any CIL contributions
scope. We are also able to consider these value/cost relationships alongside the
range of main appraisal assumptions and the results that those provide. This
amounts to adding iteratively to the picture seen from those main assumptions and
appraisals, whereby a further deteriorating relationship between values and costs
provides a clear picture of further reducing prospects of viable schemes in this sense.
This starts to indicate schemes that require other support rather than being able to
produce a surplus capable of some level of contribution to CIL.
2.2.14 Through this iterative / exploratory process we could determine whether there were
any further scenarios that warranted carrying out additional viability appraisals.
Having explored the viability trends produced by examination of the cost/value
relationships we found that in many other cases, completed scheme values were at
levels insufficient to cover development costs and thus would not support any level
of CIL, certainly not on any regular basis. Through this process and linking it in to our
continual contact with Council officers, collectively we considered there to be two
further commercial scenarios that could be significantly relevant in the District to
warrant consideration alongside (akin to) retail uses, potentially occurring in edge of
town / industrial or retail park type locations. These were reviewed, having the
potential to be viable so as to potentially support CIL contributions.
Wycombe District Council - CIL Economic Viability D|S|P Housing & Development Consultants
Wycombe District Council – CIL Viability Assessment (Ref. No. DSP11023) 13
2.2.15 Further information on this section of the review process is provided within the
findings commentary in Chapter 3.
2.3 Gross Development Value (Scheme Value; ‘GDV’) - Residential
2.3.1 For the residential scheme types modelled in this study a range of (sales) value levels
have been applied to each scenario. As mentioned previously, this is in order to test
the scope for and the sensitivity of scheme viability to the requirement for a range of
potential CIL rates; potentially including geographical values variations and / or with
changing values as may be seen with further market variations. As above, the trial CIL
rates were explored iteratively. This involved increasing the trial rate applied to each
scenario, over a scale up to £250/sq m, so that we could consider the ability of
schemes of varying values to support, or not, CIL contributions at various potential
rates.
2.3.2 We carried out our own desktop and on the ground research on residential values
across Wycombe District. In addition, it is always preferable to consider a range of
information so as to look for common themes and pointers. Therefore we also used
existing information for example contained within the Council’s Delivery and Site
Allocations DPD Viability Assessment2, Buckinghamshire Strategic Housing Market
Assessment3; and from sources such Land Registry data, VOA and previous study
assessments by the DVS arm of the VOA as well as various consultants.
2.3.3 A framework needs to be established for gathering and reviewing property values
data. Our first stage desktop research using online property marketing and prices
web resources - principally ‘rightmove’ - focussed on the four Local Community Areas
(LCAs) as set out in the Local Area Plans associated with the Community Strategy and
linked in to the Council’s Core Strategy DPD as a delivery and monitoring mode for a
series of objectives. These LCAs had been mapped and considered for the Local Area
Plans, with their various characteristics in mind, and it was felt that this
2 DVS – Viability Assessment – Wycombe Development Framework Delivery and Site Allocations DPD (June
2010) 3 Fordham Research – Buckinghamshire Strategic Housing Market Assessment (July 2008)

Wycombe District Council - CIL Economic Viability D|S|P Housing & Development Consultants
Wycombe District Council – CIL Viability Assessment (Ref. No. DSP11023) 14
understanding or way of describing the local geography would form a sound starting
point as a framework for researching house prices – their levels and patterns across
the District. This approach was suggested, and agreed by the Council, as a relevant
and workable basis against which to begin to consider whether any significant values
variations by geography existed across the District. This in turn would then inform
any due consideration of whether, and if so how, to determine any varying “viability
zones” or similar. Open minds were kept as to whether the potential to vary CIL
charging rates by locality would be relevant, meaningful and, if so, justified, in this
District - or not. The four LCAs are: High Wycombe LCA; South West Chilterns and
Marlow; Chepping Wye Valley; Princes Risborough.
2.3.4 Following our initial research based on these LCAs, however, it became apparent that
whilst that review clearly showed a distinction in typical values levels between the
High Wycombe LCA and the other three (the former having typically lower values),
the values patterns and variations seen were not sufficiently represented by this
potential Community Areas based view alone.
2.3.5 Therefore, further research was then carried out by reference to other sources
including the type of property pricing and heat-mapping information that is available
through web-bases resources such as ‘zoopla.co.uk’, which use a combination of
Land Registry data (on sold prices) and a form of “Automated Valuation Model” to
also provide current price indications based on very large data sets and trends.
Having identified a clear scenario of typically lower values in the key urban area of
High Wycombe, this further layer of review informed more detailed discussions with
the Council’s officers, given their local knowledge and experience. With the officers
we were then able to test and consider variations on a theme which respected the
typically lower values already seen in the main urban area High Wycombe. As will be
outlined in Chapter 3, this process informed a developing view of how to most
appropriately describe and cater for the values and viability variations seen. Through
ongoing discussion and consideration of the various data and knowledge sources –
SHMA identified values patterns, LCAs based research using ‘rightmove’,
‘Zoopla’/Land Registry and local knowledge – alongside the Council considering the
likely distribution of development, this moved to a settled, evidenced view of the
variations to be respected in proposing options for the local approach to CIL charging
on residential developments.

Wycombe District Council - CIL Economic Viability D|S|P Housing & Development Consultants
Wycombe District Council – CIL Viability Assessment (Ref. No. DSP11023) 15
2.3.6 The data sources behind our assumptions (including values, costs, land values, site
coverage etc) are shown in Appendix III – Background Data - and are not included in
the main part of this report. However, a summary of the values range applied for
each residential scenario (expressed as ‘Value Levels’) is shown in Figure 6 below.
Each residential scheme type was appraised at 5 value levels. These are shown as £
per sq m (sales) rates, being the key point of reference as was explained above.
Purely for the purposes of indicating what those £ per sq m values mean for the
pricing of our assumed unit sizes, those are also set out – as at Figure 6 below.
Figure 6: Residential Values
Revenue
(Sales value –
£ per sq m)
Value Level
1
Value Level
2
Value Level
3
Value Level
4
Value Level
5
£2,500 £3,000 £3,500 £4,000 £4,500
£ per sq ft
equivalent £232 £279 £325 £372 £418
Revenue (£)
Value Level
1
Value Level
2
Value Level
3
Value Level
4
Value Level
5
1-bed flat £112,500 £135,000 £157,500 £180,000 £202,500
2-bed flat £150,000 £180,000 £210,000 £240,000 £270,000
2-bed house £187,500 £225,000 £262,500 £300,000 £337,500
3-bed house £237,500 £285,000 £332,500 £380,000 £427,500
4-bed house £312,500 £375,000 £437,500 £500,000 £562,500
2.3.7 In addition to the market housing we have assumed a requirement for affordable
housing where applicable; in line with the Council’s affordable housing policies (see
above). Within the proportions (overall %s) of affordable housing, approximately two
thirds is required as “affordable rent” accommodation and one third “intermediate”
tenure (the latter usually being in the form of shared ownership or similar). This is a
fairly typical approach to targeting an appropriate affordable housing tenure mix. It
was agreed with the Council that for the “affordable” tenure the modelling should
reflect the new “Affordable Rent” product as detailed within the Homes and
Communities Agency’s (HCA) Affordable Homes Programme (2011-2015). For the
affordable housing the revenue that is assumed to be received by a developer is
Wycombe District Council - CIL Economic Viability D|S|P Housing & Development Consultants
Wycombe District Council – CIL Viability Assessment (Ref. No. DSP11023) 16
based on only the capitalised value of the net rental stream (affordable rent) or
capitalised net rental stream and capital value of retained equity (in the case of low
cost/affordable home ownership – i.e. typically shared ownership). Currently the HCA
expects affordable housing of either tenure on s.106 sites to be delivered with nil
grant input; at the very least this should be the starting assumption pending any
review of viability and later funding support for specific scenarios / programmes. We
have therefore made no allowance for grant.
2.3.8 The value of the affordable housing (level of revenue received for it by the
developer) is variable by its very nature. We consulted with locally active Registered
Providers (‘RP’s) to allow us to further test our judgments on the potential level of
receipt a developer could expect to receive for both Affordable Rented and Shared
Ownership tenures. We undertook not to disclose specific information and therefore
consolidated the data in order to inform an average/overall view of the inevitably
varying responses and indications. The resulting revenue indications were reviewed
in the context of our extensive experience in dealing with affordable housing policy
development and site specific viability issues (including specific work on affordable
rents for other authorities); together with trials using the HCA’s Development
Appraisal Tool (‘DAT’) which can be used to calculate affordable housing revenue. It
was decided to base our revenue assumptions on the average percentage of market
(sales) value (‘MV’) generated for both Affordable Rent and Shared Ownership; and
to apply those within our viability appraisals. Figure 7, below, provides an overview
of this process.
2.3.9 For affordable rented properties the assumption has been made that the Local
Housing Allowance (LHA) levels will act as an upper level above which rents will not
be set (i.e. that they represent 80% of market rent including service charge). This is to
ensure that the percentage of MV figure does not reach a point that in practice
would be unaffordable or impractical. In practice, the values generated could be
dependent on property size and other factors including the RP’s own development
strategies and therefore would vary from case to case when looking at site specifics.
The RP may have access to other sources of funding, such as related to its own
business plan, funding resources, cross-subsidy from sales/other tenure forms,
recycled capital grant from stair-casing receipts, for example, but such additional
funding cannot be regarded as the norm for the purposes of setting viability study

Wycombe District Council - CIL Economic Viability D|S|P Housing & Development Consultants
Wycombe District Council – CIL Viability Assessment (Ref. No. DSP11023) 17
assumptions – it is highly scheme dependent and variable and so has not been
factored in here

Wycombe District Council - CIL Economic Viability D|S|P Housing & Development Consultants
Wycombe District Council – CIL Viability Assessment (Ref. No. DSP11023) 18
Figure 7: Average (affordable housing) Revenue Data Supplied by RP Respondents
Unit Type Ave. Unit Size (m²)
Ave. MV (£)
Ave. MR (£/week)
Ave. AR (£/week)
Ave. AR Offer (£)
Ave. SO Offer (£)
Ave. MV (£/m²))
Ave. AR Offer(£/m²)
Ave. SO Offer(£/m²)
Ave. % MV - AR
Ave. % MV - SO
1bf (2p) 49.86 £151,000 £141 £109 £85,698 £98,824 £3,028 £1,710 £1,991 57% 65%
2 bf (4p) 67.55 £182,500 £177 £137 £110,686 £126,712 £2,702 £1,635 £1,875 60% 69%
2bh (4p) 75.4 £221,000 £197 £153 £123,291 £144,456 £2,931 £1,636 £1,916 56% 66%
3bh (5p) 85.26 £280,200 £234 £184 £148,070 £169,849 £3,286 £1,737 £1,993 53% 60%
4bh (6p) 105.4 £346,250 £318 £247 £192,428 £212,619 £3,285 £1,833 £2,016 56% 62%
Overall N/A N/A N/A N/A N/A N/A £3,047 £1,708 £1,959 53% 65%
Notes: ‘AR’ = Affordable Rent ‘MR’ = Market Rent ‘SO’ = Shared Ownership ‘MV’ = Market Value

Wycombe District Council - CIL Economic Viability D|S|P Housing & Development Consultants
Wycombe District Council – CIL Viability Assessment (Ref. No. DSP11023) 19
2.4 Gross Development Value (Completed Scheme (capital) Value) - Commercial
2.4.1 The value (GDV) generated by a commercial or other non-residential scheme varies
enormously by type of specific type of development and location. In order to
consider the viability of various commercial development types a range of
assumptions needed to be made with regard to the rental values and yields that
would drive the levels of completed scheme values that would be compared with the
various development costs to be applied within each commercial scheme appraisal.
Broadly the commercial appraisals process follows that carried out for the residential
scenarios, with a range of different information sources informing the values
(revenue) related inputs. Data on yields and rental values was from a range of
sources including the VOA, EGi, consultation and a range of development industry
publications and features. As with the residential information, Appendix III sets out
more detail on the assumptions background for the commercial schemes.
2.4.2 Figure 8 below shows the range of rental values assumed for each scheme type; for
capitalisation based on associated yield assumptions to provide a Gross Development
Value for each scheme; dependent on the combination of yield and rental value
indications applied. The rental values were tested at varying levels and are
representative of low, medium and high rental values assessed as relevant for each
commercial scheme type in the District. These were assumed for new builds,
consistent with the nature of the CIL regulations in that refurbishments / conversions
/ straight reuse of existing property will not attract CIL payments.
2.4.3 These varying rental levels were combined with yields assumed at between 6.5% and
8% (varying dependent on scheme type). All schemes were appraised initially using a
yield assumption of 8% (results set not included). All were then appraised at 7.5%
(which, following further review, we considered appropriate to develop as the base
set for most forms of commercial / non-residential development envisaging good
quality new development, rather than much of the transactional evidence – which
relates mostly to older accommodation. Retail and hotel scenarios were also
appraised at 6.5% yield; which was felt to be more reflective of likely levels for those
scenarios – particularly the large retail (supermarkets / retail warehousing) and hotel
scenario. This range, overall, enabled to us to explore the sensitivity of the outcomes
to such variations, given that in practice a wide variety of rental and yield

Wycombe District Council - CIL Economic Viability D|S|P Housing & Development Consultants
Wycombe District Council – CIL Viability Assessment (Ref. No. DSP11023) 20
expectations or requirements could be seen. We settled our view that the medium
level rental assumptions combined with 7.5% base yield (6.5% for large retail and
hotel uses) were the most appropriate at the current time in providing context for
reviewing results and considering viability outcomes.
2.4.4 It is important to note here that small variations, particularly in the yield assumption,
but also in rental value assumptions, can have a significant impact on the gross
development value that is available to support the development costs (and thus the
viability of a scheme) together with any potential CIL funding scope. We consider this
very important to bear in mind in the context of the balance that must be found
between infrastructure funding needs and viability. Overly optimistic assumptions, or
assumptions that would rely on infrequent circumstances in the local context, could
well act against finding that balance in our view.
2.4.5 Overall, this approach enabled us to consider the sensitivity of likely viability
outcomes to changes in the capitalised rents and allowed us to then consider the
most relevant areas of the results in coming to our overview. As with other study
elements, particular assumptions used will not necessarily match scheme specifics
and therefore we need to look instead at whether / how frequently local scenarios
are likely to fall within the potentially viable areas of the results (including as values
vary). This is explained further in Chapter 3 which follows.
Figure 8: Rental Value for Commercial Schemes
Scheme Type Value Level
(Annual Rent Indication £ /m²)
(“Low”) (“Medium”) (“High”)
Large Retail (supermarket – convenience) £200 £250 £300
Large Retail (retail warehouse/supermarket) £150 £200 £250
Small Retail
(convenience; also comparison; A1-A5) £125 £150 £175
Business development - Town Centre offices £160 £190 £220
Business development - Business Park £170 £200 £230
Business development
- B1, B2, B8 - Industrial / Warehousing - Small £80 £90 £100
Business development £70 £80 £90

Wycombe District Council - CIL Economic Viability D|S|P Housing & Development Consultants
Wycombe District Council – CIL Viability Assessment (Ref. No. DSP11023) 21
- B1, B2, B8 - Industrial / Warehousing - Larger
Hotel (budget - 120 rooms) £150 £188 £225
Residential Institution (care/nursing home) £160 £180 £200
Institutional / Community / Health £120 £150 £180
Leisure (e.g . Fitness, bowling) £100 £120 £140
2.4.6 We are making this viability assessment following a period of significant recession
which has seen a major downturn in the fortunes of the property market – from an
international and national to a local level, and affecting all property types (residential
and commercial). At the time of writing we still have a weak economic backdrop
feeding through in to significant ongoing property market uncertainty. Although
there have been a range of mixed signs in 2011, we are still seeing low levels of
development activity. This is caused by a cocktail of factors e.g. as a result of low
occupier demand, and related to poor availability of attractively priced and readily
available finance for property development and purchasing. The RICS Commercial
Market Survey states for Q3 of 2011 that “tentative recovery in real estate shows
signs of faltering”. It goes on to say “that tenant demand retreated over the quarter
which, coupled with rising available space, is resulting in a more negative view on
rental expectations. Surveyors attribute the fall in sentiment to the uncertain outlook
for the wider economy… Significantly, sentiment has fallen across all sectors of the
market. Retail demand slipped furthest into negative territory, while available space
also rose fastest in the retail sector. However, rental expectations at the national level
were most negative for offices”.
2.4.7 As with residential, consideration was given to whether there should be any varying
approach to CIL charging levels for commercial and other developments in the
District.
2.4.8 On review, whilst most scheme types would not occur, or at least not regularly, in the
smaller settlements / rural areas, it was considered that the key types could occur at
the 3 major settlements of High Wycombe, Marlow and Prince Risborough. However,
in each case it was considered that variations in values and viability outcomes would
be more likely to be the result of detailed site and scheme specific characteristics,
and not necessarily driven by distinctions between location in the more general
geographical sense that area based CIL variations would mean in a District like

Wycombe District Council - CIL Economic Viability D|S|P Housing & Development Consultants
Wycombe District Council – CIL Viability Assessment (Ref. No. DSP11023) 22
Wycombe. On review of the commercial values data, no justifiable or readily
definable approach to varying the potential CIL charging on commercial / other
development types was found. Whilst certain specific scheme types could create
more value in one location compared with another in the District, typically, there was
felt to be no clear or useful pattern which might be described for that – as there was
for residential. This will be clarified in Chapter 3 and can be seen the through the
variety of values information at Appendix III.
2.5 Development Costs - General
2.5.1 Total development costs can vary significantly from one site or scheme to another.
For these strategic overview purposes, however, assumptions have to be fixed to
enable the comparison of results and outcomes in a way which is not unduly affected
by how variable site specific cases can be. As with the residential scenarios, an
overview of the various available data sources is required; and is appropriate. Each
area of the development cost assumptions is informed by data - from sources such as
the RICS Building Cost Information Service (BCIS), development consultation /
scheme examples where available, professional experience and other research. For
this overview we have not allowed for particular abnormal costs that may be
associated with particular sites as these are highly specific and can distort
comparisons at this level of review. In our view, and again related to the need to
consider balance (and not “push to the limits”) in setting CIL charging rates, this is
another factor that should be kept in mind; in some circumstances and over time,
overall costs could rise from current / assumed levels. The interaction between
values and costs is what counts and, whilst any costs rise may be accompanied by
increased values from assumed levels, this cannot be relied upon.
2.6 Development Costs – Build Costs
2.6.1 The base build cost levels shown below are taken from the BCIS. In each case the
median figure, rebased to Q3 2011 and a Wycombe location index (109 relative to a
national level of 100) is used. Costs shown are for each development type (residential
and commercial):

Wycombe District Council - CIL Economic Viability D|S|P Housing & Development Consultants
Wycombe District Council – CIL Viability Assessment (Ref. No. DSP11023) 23
Figure 9: Build Cost Data (BCIS Median, Q3 2011, Location Index 109)
Use Property Type BCIS Build
Cost (£/m²)*
Residential One off housing £1,299
Residential Mixed developments £890
Residential Flats £1,015
Large Retail Supermarket £1,197
Large Retail Retail warehouse £610
Small Retail Convenience Store £753
Business development Town Centre Office Building £1,394
Business development Business Park Office Building £1,309
Business development Industrial unit including offices £792
Business development Larger industrial / warehousing unit
including offices. £631
Hotel (budget - 120 rooms) Hotel. £1,410
Residential Institution Nursing (care) Home £1,394
Institutional / Community
/ Health Clinic or similar £1,390
Leisure Fitness etc £1,675 *excludes externals and contingencies (these are added to base build cost)
2.6.2 The above build cost levels do not include contingencies or external works. An
allowance for externals has been added to the above base build cost on a variable
basis depending on the scheme type. This is typically between 14% and 21% of base
build cost for flatted and housing schemes, respectively, based on analysis of specific
schemes within the BCIS dataset. A notional allowance for externals of 20% of base
build cost has been added for all commercial schemes, based on a range of
information sources and cost models. There will always be a range of data and
opinions on, and methods of describing, build costs. In our view, we have made
reasonable assumptions which lie within the range of figures we generally see for
typical new build schemes (rather than high specification or particularly complex
schemes which might require particular construction techniques or materials). As
with many aspects there is no single appropriate figure in reality, so judgments on
overview assumptions are necessary. As with any assumption of course this will be
highly site specific. In the same way that we have mentioned the potential to see
increased costs in some cases, we could also see cases where externals costs or other
elements will be lower than those assumed. Once again, in accordance with

Wycombe District Council - CIL Economic Viability D|S|P Housing & Development Consultants
Wycombe District Council – CIL Viability Assessment (Ref. No. DSP11023) 24
considering balance and the prospect of scheme specifics varying in practice, we aim
to pitch assumptions which are appropriate and realistic through not looking as
favourably as possible at all assumptions areas.
2.6.3 An allowance of 5% of build cost has also been added to cover contingencies. This is a
relatively standard assumption in our recent experience. We have seen variations,
again, either side of this level in practice.
2.6.4 Survey and normal site preparation costs have also been allowed for on a notional
basis (£500 and £4,000 per unit respectively for residential; variable within the
commercial schemes).
2.6.5 In addition, for this broad test of viability it is not possible to test all variations to
additional costs however a further allowance of 4-5% has also been added to the
total build cost in respect of achieving higher sustainable design and construction
standards (either in relation to building regulations or equivalent requirements – e.g.
Code for Sustainable Homes / BREEAM). This allowance has been added to all build
costs to reflect a potential future increase in costs in relation to the sustainable
construction agenda above current standards.
2.6.6 The interaction of costs and values levels will need to be considered again at future
review points. In this context it is also important to bear in mind that the base build
cost levels will also vary over time. In the recent recessionary period we have seen
build costs fall, but moving ahead they are expected to rise again. The latest BCIS
data indicates that tender prices increased by 0.9% compared to the previous quarter
(the 5th consecutive rise since 2nd quarter 2010) and 3.7% over the preceding year.
The forecasts suggest continued fluctuation in tender prices but with a general
upwards trend. The current forecast to 2013 suggests the following:
“Following the sharp rise in the 2nd quarter, the rate of increase in materials prices is
expected to slow down in the second half of the year. Energy, fuel and raw materials
prices continue to drive up the unit costs of materials. It is therefore anticipated that
materials prices will continue to rise for the foreseeable future at a pace below the
rate of inflation. General inflation is expected to peak just below 6% towards the end
of 2011, falling to around 3% over the forecast period.

Wycombe District Council - CIL Economic Viability D|S|P Housing & Development Consultants
Wycombe District Council – CIL Viability Assessment (Ref. No. DSP11023) 25
It is anticipated that the deteriorating economic outlook is going to keep wage
inflation at bay in the first year of the forecast period. Wage awards are expected to
rise well behind the rate of general inflation, with workloads still well below pre-
recession levels. However, wages are expected to rapidly increase in the medium term
to recover some of the lost income following the expected return to above long term
growth in 2013.
After a relatively positive start to 2011, new work output stalled in the 2nd quarter
and it is now anticipated to fall in both 2011 and 2012, with growth only returning in
2013. Revised output figures revealed that the impact of the public sector cutbacks is
already having a negative effect on the construction industry, with private sector
growth only expected to start mitigating the decline in public spending in 2012 and
2013. However, despite the cuts in public sector investment, it is anticipated that the
infrastructure sector will grow over the forecast period, but with relatively modest
growth in 2011 and 2012”.4
2.7 Development Costs – Fees, Finance & Profit (Residential)
2.7.1 The following costs have been assumed for the purposes of this study and vary
slightly depending on the type of development (residential or commercial). Other
development cost allowances for residential scenarios are as follows:
Professional and other fees: Total of 15% of build cost (including planning, building
regulations, insurances etc)
Site Acquisition Fees: 0.75% agent’s fees
0.75% legal fees
Standard rate (scale) for Stamp Duty Land Tax
Finance: 6% interest rate (assumes scheme is debt funded)
Arrangement fee variable – basis 1% (of cost)
4 RICS BCIS News – “Tender Price Update” (25/10/11) http://service.bcis.co.uk/V3_BCIS/template.html

Wycombe District Council - CIL Economic Viability D|S|P Housing & Development Consultants
Wycombe District Council – CIL Viability Assessment (Ref. No. DSP11023) 26
Marketing costs: 3.0% sales fees
£600 per unit legal fees
Developer Profit: Affordable Housing – 6% of GDV
Open Market Housing – 20% of GDV
2.8 Development Costs – Fees, Finance & Profit (Commercial)
2.8.1 Other development cost allowances for commercial development are as follows:
Professional and other fees: Total of 12% of build cost (including planning, building
regulations, insurances etc)
Site Acquisition Fees: 1.0% agent’s fees
0.75% legal fees
Standard rate (scale) for Stamp Duty land Tax
Finance: 6% interest rate (assumes scheme is debt funded)
Arrangement fee variable
Marketing costs: 1% promotion costs (% of annual income)
1.5% sales fees (of sales price where applicable)
10% letting / management fees (% of annual income)
Developer Profit: 20% of GDV
2.9 Build Period
2.9.1 The build period assumed for each development scenario has been based on BCIS
data (using its Construction Duration calculator by entering the specific scheme types
modelled in this study) alongside professional experience and informed by examples
where available. The following build periods have therefore been assumed (note this

Wycombe District Council - CIL Economic Viability D|S|P Housing & Development Consultants
Wycombe District Council – CIL Viability Assessment (Ref. No. DSP11023) 27
is for the build only; lead-in and extended sales periods have also allowed on a
variable basis according to scheme scale, having the effect of increasing the periods
over which finance costs are applied):
Figure 10: Build Period
Scheme Type Build Period (months)
1-4 Unit Housing Schemes 6
14 Unit Housing Scheme 9
25 Unit Mixed Housing
Scheme 12
50 Unit Mixed Housing
Scheme 18
100 Unit Mixed Housing
Scheme 24
Large Retail -supermarket 9
Large Retail –retail
warehousing 7
Small Retail (principally
convenience stores) 3.5
Business
- Town Centre Offices 6
Business
- Business Park Offices 10
Industrial (small) 6.5
Industrial / Warehousing
(larger) 8
Hotel (budget - 120 rooms) 10
Care Home 16
Institutional / Community
/ Health 7.5
Leisure 12
2.10 Other S.106 Costs
2.10.1 An ongoing site specific s.106 allowance (financial contribution) has been factored
into the appraisal assumptions as well (alongside affordable housing). On discussion
with the Council it was considered that a majority of existing Planning Obligation

Wycombe District Council - CIL Economic Viability D|S|P Housing & Development Consultants
Wycombe District Council – CIL Viability Assessment (Ref. No. DSP11023) 28
requirements would be taken up within the CIL proposals, but nevertheless that small
scale site specific requirements (perhaps dedicated highways improvements /
alterations or similar) could remain in some circumstances. The appraisals included a
notional sum of £500 per dwelling on this aspect purely for the purposes of this study
and in the context of seeking to allow for a range of potential scenarios and
requirements.
2.11 Land value comparisons
2.11.1 As discussed previously, in order to consider the likely viability scope for a range of
potential (trial) CIL contribution rates in relation to any development scheme, a
comparison needs to be made between the outturn results of the development
appraisals (in terms of RLV) and some benchmark or known land value. As suitable
context for a high level review of this nature, DSP’s practice is to compare the wide
range of appraisal RLV results with a variety of potential land value comparisons. This
allows us to consider a wide range of potential scenarios and outcomes and the
viability trends across those. This approach reflects the varied land supply picture
that the Council expects to see, including the regular occurrence of schemes coming
forward on former employment land in the future.
2.11.2 The scale of the difference between the RLV and comparative land value level (i.e.
surplus after all costs, profit and likely land value expectations have been met) in any
particular example, and as that changes between scenarios, allows us to judge the
potential CIL funding scope. It follows that, in the event of little or no surplus, or a
negative outcome (deficit), then we can see that, alongside the other costs assumed,
there is little or no CIL contribution scope.
2.11.3 In order to inform these land value comparisons or benchmarks we sought to find
examples of recent land transactions locally (no firm evidence of such was available
from the various soundings we took) alongside data sourced from the VOA, previous
research / studies provided by the Council, consultation and other on-line resources.
Each of the RLV results is compared to a range of land value levels representing
typical values for sites of varying types (greenfield, employment and existing
residential) based on these considerations. Again, scheme specific scenarios and the

Wycombe District Council - CIL Economic Viability D|S|P Housing & Development Consultants
Wycombe District Council – CIL Viability Assessment (Ref. No. DSP11023) 29
particular influence of site owners’ circumstances and requirements will in practice
be variable.
2.11.4 In terms of the VOA, data available for comparison has reduced significantly since
the July 2009 publication of its Property Market Report; with data provided only for
2 areas within the South East in the latest (January 2011) report. However, the July
2009 report provides a range of values for industrial land for the South East and the
January 2011 report indicates that commercial market had changed little in
between. Other information has been sourced from existing research (for example
the Council’s Delivery and Site Allocations DPD Viability Assessment) together with
general indications and responses as were otherwise available.
2.11.5 As well as a level of value relating to an existing or alternative use driving a site’s
value (‘EUV’ or ‘AUV’), there may be an element of premium (an over-bid or
incentive) required to enable the release of land for development. In our view, this
would not apply, however, in situations where there is no established ready market
for an existing or alternative use. The HCA’s draft document ‘Transparent Viability
Assumptions’ that accompanies its Area Wide Viability Model suggests that “the
rationale of the development appraisal process is to assess the residual land value
that is likely to be generated by the proposed development and to compare it with a
benchmark that represents the value required for the land to come forward for
development”. This benchmark is referred to as threshold land value in that
example: “Threshold land value is commonly described as existing use value plus a
premium, but there is not an authoritative definition of that premium, largely
because land market circumstances vary widely”. Further it goes on to say that
“There is some practitioner convention on the required premium above EUV, but
this is some way short of consensus and the views of Planning Inspectors at
Examination of Core Strategy have varied”. These types of acknowledgements of the
variables involved in practice align to our thinking on the potential range of
scenarios likely to be seen. As further acknowledged later, this is one of a number of
factors to be kept in mind in setting suitable rates which balance viability factors
with the infrastructure needs side.
2.11.6 We would stress here that any overbid level of land value (i.e. incentive or uplifted
level of land value) would be dependent on a ready market for the existing or other

Wycombe District Council - CIL Economic Viability D|S|P Housing & Development Consultants
Wycombe District Council – CIL Viability Assessment (Ref. No. DSP11023) 30
use that could be continued or considered as an alternative to pursuing the
redevelopment option being assumed. The influences of existing / alternative uses
on site value need to be carefully considered. At a time of a low demand through
depressed commercial property market circumstances, for example, we would not
expect to see inappropriate levels of benchmarks or land price expectations being
set for opportunities created from those sites. Just as other scheme specifics and
appropriate appraisal inputs vary, landowners’ expectations will need to be realistic.
2.11.7 Essentially this approach leads to the comparison of the RLV results in £s per hectare
(having taken into account all values and costs including varying levels of CIL) to a
range of potential land values representing various greenfield, previously developed
land (e.g. former commercial uses) or existing residential (residential intensification)
benchmark land value indications. The range of land value comparisons is set out
beneath the results tables (at Appendices IIA and IIB) and further information is set
out within the wider research as included at Appendix III. The results trends
associated with these are seen at Appendices IIA and IIB, as explained in chapter 3
below.

Wycombe District Council - CIL Economic Viability D|S|P Housing & Development Consultants
Wycombe District Council – CIL Viability Assessment (Ref. No. DSP11023) 31
3 Findings
3.1 Introduction
3.1.1 Results summaries are included at Appendix IIA (residential scenarios) and Appendix
IIB (commercial/non-residential); in each case reflecting the scenarios set out at
Appendix I. Within Appendices IIA and IIB there are different tables according to the
type of host site assumed for the scenarios and bearing in mind the variables /
dynamics discussed for example at 2.1.4 within the methodology section – e.g.
greenfield, PDL (former commercial) and residential intensification. In the case of the
commercial results, there are 2 sets covering alternative yield views of 6.5% (on retail
and hotel uses) and 7.5% (on all uses); as discussed, in relation to exploring the
sensitivity of the results to these factors.
3.1.2 In summary Appendix IIA and IIB results tables show:
Left side column: Scheme scenario (dwelling numbers/scheme type and,
where relevant, affordable housing proportion).
Under each residential scheme type: Increasing value (GDV) level (VL 1-5).
Under each commercial scheme type: Increasing value (GDV) – L (low); M
(Medium); High (H). The ‘M’ value levels considered the key area regarding
current time balanced interpretation of results, ‘L’ and ‘H’ looking at the
sensitivity of outcomes flowing from lower or higher values, related to varying
scheme type / location; and / or market movements.
Left hand side of main table area: RLV appraisal results expressed in £s.
Right hand side of main table area: RLV appraisal results expressed in £s per
Ha equivalent, given the assumed scenarios on type, density/coverage, etc.
o Within each of those sections the coloured cells (see below) are the
key areas in terms of reviewing trends. The trial CIL rates – in £s per
sq m are shown across the top row - applied as a key part of the

Wycombe District Council - CIL Economic Viability D|S|P Housing & Development Consultants
Wycombe District Council – CIL Viability Assessment (Ref. No. DSP11023) 32
iterative process of exploring the affect on likely viability (or risk to
the scheme proceeding) of those rates increasing. As discussed
earlier, realistically this has to be carried out in steps to control to
reasonable parameters the extent of the appraisal modelling exercise.
Providing these trial rates span a wide enough range and have small
enough steps in between, the iterative process can be applied and
considered successfully. We have considered rates of £0 to £250/sq m
for residential and commercial scenarios.
o The colour coding provides a rough guide only to trends – helping to
highlight the general results trends. Based on the accepted nature of
such an exercise, i.e. not being an exact science, this must not be
over-interpreted as representing any strict cut-offs as regards viability
/ non-viability. In practice, switch points between viability and non-
viability will be variable and this process explores the likelihood of
various realistically assumed values and costs (including potential CIL
rates) proving to be workable and therefore achieving the most
appropriate points for finding balance between CIL rates and the high
level of the local infrastructure needs.
o Taking into account the above comments, the colours therefore
indicate general trends as follows:
Green - Considered to be good viability prospects
Yellow - Considered to be reduced viability prospects –
potentially ranging from marginal to more clearly viable,
depending on particular details i.e. potentially viable
Red – In the main clearly poor viability outcomes – no to very
low prospect of viable schemes.
Far right side: two columns indicating the theoretical maximum potential CIL
charging rates by applying any potential RLV surplus / margin (see 2.1.5 and
associated text on methodology) fully to CIL. In each case the lower potential
maximum CIL rate on the left is based on the requirement to exceed the
higher of the land value benchmarks applied according to the scenario. The
second column (far right) indicates the potential maximum CIL rate based on

Wycombe District Council - CIL Economic Viability D|S|P Housing & Development Consultants
Wycombe District Council – CIL Viability Assessment (Ref. No. DSP11023) 33
applying the full amount of any surplus having exceeded the relevant lower
end land value benchmark for each type. That far right column therefore
indicates the very maximum CIL rate figure potentially applicable in each case
– should that set of circumstances be workable in all respects and were the
CIL rate to be pushed up to its fullest possible extent in these viability
overview terms.
Footnotes at the bottom – reminder of land value benchmark indications and
ranges; bearing in mind the context and explanations provided elsewhere.
3.1.3 In addition, each results Appendix contains appraisal summary sheets, which display
the key input areas, relationship between those and the outputs (Indicative RLVs)
they produced (as transposed to the table discussed above). Bearing in mind the
study purpose and nature, these are not the full appraisals, given the volume and
added complexity of information that would involve displaying. They are intended to
provide an overview of the main assumptions areas and the outcomes, and to further
help an understanding of how the residual land valuation process has been used
here.
3.1.4 On reviewing the results and the Council taking this further in to the wider
consideration of its preliminary draft charging schedule CIL rate(s) proposals, a
number of key principles have been and are to be kept in mind – for example:
a. The CIL rates should not be taken to their limits. Bearing in mind that in
practice:
i. Costs will vary from these assumptions levels (build costs being a key
example) – we have allowed appropriately and have not kept these to
what might be minimum levels by any means. Some scope may be
needed where costs are higher, however, by reason of site specific
abnormals, increasing carbon reduction agenda requirements, etc.
ii. Land owners’ situations and requirements will vary. While, as stated,
those will need to be realistic (and, as part of that, assessments will
need to be made as to whether there are realistic prospects of

Wycombe District Council - CIL Economic Viability D|S|P Housing & Development Consultants
Wycombe District Council – CIL Viability Assessment (Ref. No. DSP11023) 34
securing significant value from existing or alternative uses in the
prevailing market), they could be outside the ranges we have explored
in making our overviews; including at higher levels.
iii. The market remains uncertain and could continue to falter, including
to an increased view (reducing sales volumes and further impacting on
prices – directly impacting the GDV assumptions; hence the range of
value levels explored for sensitivity).
iv. Affordable housing provision (as been assumed where required
alongside the trial CIL rates) and other wider planning objectives such
as sustainability remain key priorities of the Council. HCA funding for
affordable housing appears to be uncertain and likely to continue
being limited in application for the foreseeable future. Again,
appropriate revenue assumptions have been made.
v. Developer’s profit level (and related funders’) requirements could well
vary. Particularly in the case of commercial schemes, we could see
lower profit level requirements than those we have assumed.
However, we felt it appropriate in particularly depressed commercial
market conditions to acknowledge that there may need to be some
scope in this regard; or in respect of other commercial scheme
costs/risks. This, again, is part of setting assumptions which fit with
arriving at a balanced approach overall; not looking to remove cost
from collective assumptions so that scheme prospects become too
dependent on those particular assumptions proving correct in
practice. All will vary, and so how they inter-act will too, when it
comes to site specifics.
b. The potential CIL charging rates need to be considered alongside other factors
relevant to the locality and development plan (Core Strategy), for example
regarding:

Wycombe District Council - CIL Economic Viability D|S|P Housing & Development Consultants
Wycombe District Council – CIL Viability Assessment (Ref. No. DSP11023) 35
i. Location and frequency of key parts of the local growth planning –
considering where will development in the main be coming forward
(in relation to the values patterns for example).
ii. Types and frequency of schemes likely to be relevant; including
accepting that in practice variation is very wide – particularly on
commercial/non-residential, where schemes could be seen in many
shapes and sizes, uses and combinations thereof, etc. However, it is
necessary to consider the local relevance of those alongside their
likely typical viability in terms of any scope to support viability. Focus
needs to be on the main relevant types, given this is all about the plan
(Core Strategy) delivery and the area as a whole.
iii. Respecting clear values patterns but also understanding that there are
bound to be imperfections in defining any viability zones or similar – in
practice values can change over a very short distance (within schemes,
different sides or ends of roads, with different aspects, school
catchments, with other local variations, etc). A suitable overview
needs to be made and the charging regime not becoming
overcomplicated by aiming to respect too many of these detailed
aspects. It would not be possible to respect them all fully in any event.
iv. Understanding that some schemes may not be able to support the
collective requirements, but looking at the bigger – District-wide –
picture.
v. On the flip-side, also understanding that some schemes / scheme
types may in theory have been able to fund a greater level of
contribution than the recommended levels (and/or greater levels of
other obligations) – in the context of balance in setting levels, not
adding undue risk to delivery and therefore moving forward with the
local economy and growth.
vi. The variety of site types that is expected to come forward – meaning
reviewing the results scales in the context of a range of potential land

Wycombe District Council - CIL Economic Viability D|S|P Housing & Development Consultants
Wycombe District Council – CIL Viability Assessment (Ref. No. DSP11023) 36
value comparison levels. We do not consider it appropriate to rely on
comparisons at a single land value level for each scenario as
development will come forward in various guises and on a range of
site types over time. In assessing results it has been necessary to
consider viability outcomes across the results sets and various land
value comparison levels.
vii. The scale of local infrastructure needs and therefore likely funding gap
in assessing the balance. This is large here; meaning that the Council
does need to look quite hard at securing a significant but realistic level
of funding through CIL as a key ingredient of the overall funding
packages.
viii. The collection of CIL payments from net new development – in
practice we are informed by the Council that a very significant number
of developments in the District will entail some level of “netting-off”
of existing floorspace in the calculations. This means that the CIL rate
will not be applied to the full scale of new development in many cases.
This could be by way of replaced or re-used / part re-used buildings.
Our appraisals have not factored-in any netting-off in this way,
because this will be a highly variable influence on scheme outcomes.
Refurbishment costs may also be relevant to overall viability
calculations on site specifics. The Council expects the netting-off effect
to further ensure that the charging rates(s) are not set “right up to the
margin of economic viability” (see 3.1.6 below).
3.1.5 The results are highly variable in line with the broad overview nature of this
assessment, which is to be used as a viability health-check from a strategic
perspective alongside the Council’s wider work on, and consideration of, a range of
other factors such as these.

Wycombe District Council - CIL Economic Viability D|S|P Housing & Development Consultants
Wycombe District Council – CIL Viability Assessment (Ref. No. DSP11023) 37
3.1.6 This all links to avoiding “setting a charge right up to the margin of economic
viability”5 in accordance with the tone of the Government (CLG) guidance. Local
authorities have significant scope to consider exactly how they will assess and arrive
at the right balance in a particular area.
3.1.7 A common theme running through all of the results (commercial and residential) is
that they are highly sensitive to varied appraisal inputs and the land value
comparisons considered as potential benchmark ranges. A relatively small
adjustment, particularly in some assumption areas can have a significant effect on
the result.
3.1.8 This assessment process explores the degree to which changes in key assumptions
produce varying results. In this way it is not a specific valuation exercise (it cannot be)
but it has enabled us to consider the likelihood of a wide range of potential CIL
charging rates being achievable and suitable. In the case of poor viability results (no
or low viability prospects), this included looking at the extent to which assumptions
would need to vary (improve in favour of viability) to make those suitable approaches
as a sustainable CIL levels; and vice-versa on scenarios with good viability prospects
(the potential leeway for decrease of those outcomes); and whether those
sensitivities amount to realistic scenarios or not given what we can currently see of
market conditions, etc.
3.1.9 Potentially there are almost infinite variations of assumptions that could be worked
through. It is important therefore that an overview is made. In doing so, we can
review the results trends; i.e. it is also possible to consider what type of outcomes
would be found between the points (appraisal assumptions combinations) that have
been modelled. Ultimately there will be no getting away from the reality of a range of
outcomes, within and potentially outside the scope of appraisal inputs we have used.
There may be cases where specific developments are unable to bear some or all of
the additional cost of CIL (in the same way that is sometimes seen with other
obligations on a scheme). Such viability outcomes are unlikely to not be limited to CIL
5 DCLG – Community Infrastructure Levy Guidance – Charge Setting and Charging Schedule Procedures (March
2010)

Wycombe District Council - CIL Economic Viability D|S|P Housing & Development Consultants
Wycombe District Council – CIL Viability Assessment (Ref. No. DSP11023) 38
charging, however, but may also link with market conditions (arguably the biggest
single factor) affordable housing, scheme design / construction / specification
requirements (including but not limited to sustainable construction) and wider
planning objectives. Usually, the collective costs impact on schemes will be relevant
for consideration where issues arise, so that some level of prioritisation may be
required – bearing in mind that CIL payments will be non-negotiable.
3.1.10 It is important to note, when we refer to highly variable outcomes / sensitive results,
that:
This is not just a Wycombe factor, but one that we firmly believe will have to
be recognised in any similar assessment and practical local application of the
Government’s CIL regime – regardless of location.
These characteristics would apply regardless of the CIL rate(s) set, so that with
particular scheme difficulties (for all development types) setting a significantly
lower CIL rate would not necessarily resolve any viability issues; we could still
see a range of unviable or marginally viable schemes with even a zero (£0) CIL
rate. The overall results – see the coloured tables at Appendices I and II
include a range of unviable results in relation to particular scenarios and
especially on some commercial types (including what amounts to negative CIL
potential).
Values Patterns
3.1.11 In the assessment stages, we relied on the market research before deciding on
whether any sufficiently clear values patterns were evident for a reliable link with CIL
charging rates for Wycombe – i.e. that might be varied in some way by geography –
particular zones / key centres / localities or similar.
3.1.12 With reference to the research summarised at Appendix III, we found a range of clear
and relatively consistent pointers to residential values variations and patterns in the
District. These showed:

Wycombe District Council - CIL Economic Viability D|S|P Housing & Development Consultants
Wycombe District Council – CIL Viability Assessment (Ref. No. DSP11023) 39
a. Lower values in the High Wycombe Local Community Area (LCA) compared
with the other 3 LCAs covering the District.
b. High Wycombe urban area having values variations within it, as with all areas,
but typically towards the low end of the values range seen in the District as a
whole. New builds have been seen to have the potential to buck trends, but
we would still expect to see patterns; relative levels varying to some degree
at this District-wide level.
c. Through values “heat mapping” a clear pattern of typically lower values
running NW-SE parallel broadly to the M40 / A40 from Stokenchurch in the
west of the District to Chepping Wycombe and adjoining areas in the east.
These typically lower values effectively from an approximately NW-SE “axis”
through the District, either side of which the values typically increase with
moving out towards Marlow and the Thames Valley rural areas in the south;
and northwards, again to the rural areas and smaller settlements.
d. Settlements linked to and outside the High Wycombe urban area within this
“axis” typically have lower values than the areas to the north and south.
e. This same picture was echoed by the wards area based heat type mapping
that was included in the wider area (Buckinghamshire based) SHMA
information from 2007; values patterns (relative values variations – on a
typical rather than specific location/scheme based view) within the District
have remained, as would be expected.
f. No clear picture of lower values in Princes Risborough on a reliable basis,
particularly in respect of levels for new builds. The fact that significant
development here is likely to have been delivered through s.106
arrangements is also relevant, since in the next few years the scale of new
development likely to be related to CIL provisions there may well be relatively
low. Collectively, it is considered that there is little clear justification for
aligning the approach at this settlement to that/those for the lower value
areas within the central “axis” area; if an approach with more than one CIL
rate is to be pursued.

Wycombe District Council - CIL Economic Viability D|S|P Housing & Development Consultants
Wycombe District Council – CIL Viability Assessment (Ref. No. DSP11023) 40
3.1.13 A similar process was considered with respect to non-residential (commercial)
schemes – i.e. whether or not there were any particular values patterns or distinct
scenarios that might influence the implementation of a charging schedule for the
District.
3.1.14 It was decided that the Wycombe commercial property and development market
should and really can only logically be treated as one for this strategic purpose in
practical terms – without the local CIL charging approach potentially becoming overly
complex. No clear patterns were seen; variations are more scheme and precise
details / location driven. In reality, certain types of commercial development could
occur across a wide range of locations within the District (for example smaller retail
proposals – e.g. new convenience stores, care homes and similar proposals, hotels,
small office developments). Conversely, “out of town centre” larger retail proposals,
larger scale office development and industrial /warehousing is likely to occur in a
relatively limited range of locations between which it may well be difficult to
distinguish values on general location (geographical area) alone – edges of main
settlements. Overall, following the consideration of options we are of the opinion
that a clear District-wide application of the CIL by commercial / non-residential
development type will be most appropriate for Wycombe; as has been the case in
several other local authority cases progressed to this extent to date. Unlike
residential development in this District, our view is that no amount of attempted
sensitivity to particular local value variations is likely to be capable of actually
respecting the variations likely to be seen in practice; there are no clear broad
patterns without this becoming very complicated. Higher and lower value commercial
space of varying types has been delivered in each of the main settlements.
3.1.15 Therefore, rather than variation by area (locality), in carrying out the research for this
study we developed the view that the key variable characteristics associated with
different types of development require an approach that moves away from a single
CIL rate. Development type rather than locality should be the key driver for
commercial scenarios.

Wycombe District Council - CIL Economic Viability D|S|P Housing & Development Consultants
Wycombe District Council – CIL Viability Assessment (Ref. No. DSP11023) 41
3.1.16 Therefore the assessment outcomes will now be discussed by development type,
starting with residential and then moving on to non-residential commercial / non-
residential development scenarios.
3.2 Residential scenarios (including Sheltered Housing) – Findings
3.2.1 Value Levels 2-5 represent the key scenarios; the lower to middle part of that range
being generally applicable to the central “axis” scenarios; middle to upper to the
Marlow area and smaller settlements / rural areas north and south.
3.2.2 Overall (District-wide) the parameters for suitable CIL charging rates are £100 - £150/
sq m. While it is possible to look at some results from higher end value scenarios, we
consider that there relevance would not be significant enough to warrant a level of
charge set above this range in any of the local circumstances. This is stated with the
above points about balance and the need to recognise factors such as higher house
prices tending to drive higher land price expectations.
3.2.3 Whilst a single District-wide (blanket type) approach could be taken – that is an
option - we consider that there are sufficiently clear values patterns stemming from
the varying characteristics (High Wycombe plus “central axis” compared with Marlow
plus north and south) to support a dual charging zone approach; following those two
sets of characteristics.
3.2.4 A single rate would need to be set at what amounts to the lowest common
denominator approach, i.e. respecting likely lower values and viability trends in High
Wycombe and also the central axis area, as we have described it. This would mean a
rate not exceeding £125/sq m in our view.
3.2.5 However, we consider that a more locally relevant approach respecting the patterns
seen would be to reflect the increased values and tone of viability findings applicable
to the Marlow, wider south and northern areas of the District. This would produce an
appropriate charging level of £125/sq m typically lower value areas (i.e. central NW-
SE axis); £150/sq m for the remainder of the District.

Wycombe District Council - CIL Economic Viability D|S|P Housing & Development Consultants
Wycombe District Council – CIL Viability Assessment (Ref. No. DSP11023) 42
3.2.6 We would not recommend charges set in excess of these levels, even though some
high value scenarios would appear to have the potential in some cases to support
that.
3.2.7 This relates reasonably well to the District Council’s existing largely formulaic basis
for seeking and securing a range of planning obligations and contributions (through
s.106 agreements) most of which will be replaced by the wide ranging scope of CIL in
covering all but site specific matters (affordable housing and perhaps particular site
specific issues such as dedicated highways improvements). A small residual allowance
per dwelling has been made within our appraisals for any matters that will not be
covered by the CIL and still need to go in to a s.106 agreement along with affordable
housing obligations (where applicable).
3.2.8 As above, there will be lower value schemes and localities where developments
struggle in viability terms, even without any significant CIL contribution. So far as we
can see, no lower level set for CIL could ensure the deliverability of all these
individual schemes on a reliable basis; or make sure that some levels of CIL were
always collectable. In some cases, viability is inherently low or marginal, regardless of
CIL or other specific cost implications. These are not just Wycombe DC factors; we
find them in much of our wider viability work.
3.2.9 Associated with this, we think it will be necessary to monitor outcomes annually as
part of the Council’s normal monitoring processes, with a view to informing any
potential / necessary review in perhaps 2-3 or more years time as other policy
developments take place; and in response to market and costs movements and any
other key viability influences over time.
3.2.10 The results of the residential appraisals are typically most sensitive to the Value
Levels assumed for the market housing that will drive scheme viability. Other factors
which can also have a significant effect on viability outcomes are:
Scheme density – linked to land take (site area occupied) and the land value
requirement / expectation.
Build costs – generally, but including related to sustainable design and
construction.
Other costs side influences – profit levels, finance, fees, etc.

Wycombe District Council - CIL Economic Viability D|S|P Housing & Development Consultants
Wycombe District Council – CIL Viability Assessment (Ref. No. DSP11023) 43
Any abnormal development costs.
3.2.11 We carried out additional exploratory appraisals on the single unit residential
scenarios. These are not included within the final reporting owing to the need to
produce a realistically scoped scale of work and documentation; as with many other
angles where in theory this type of work could be expanded to even greater levels of
detail, beyond the expectations of the CIL guidance on considering viability.
3.2.12 On this point, however, we found that, for low value scenarios, increasing the
dwelling size reduced the RLV and viability outcome further; and for higher viability
scenarios (scenarios with already positive outcomes) the opposite was seen –
viability indications were improved. As seen through those appraisals, this is simply a
case of increasing the direction of an existing outcome – either way (depending on
whether as a starting point it is a viable scenario given the typical relationship
between costs and values seen at the particular point on the values scale). The
indications are that larger dwelling sizes, as may be seen more on the smallest
schemes, will tend to show better viability outcomes providing they are in situations
and locations that support at the mid to upper values for the District.
3.3 Commercial / Non-Residential Findings
3.3.1 As would be expected, the commercial appraisal findings are very wide ranging. For
this strategic overview rather than detailed valuation exercise we have essentially
considered the interaction of rent and yield as presenting a view of sample ranges
within which capitalised net rents could fall.
3.3.2 In this way we have explored various combinations of assumptions (including
capitalised rental levels) which produce a range of results from negative outcomes
(meaning very limited or nil CIL scope) to those which produce meaningful and in
some cases considerable CIL scope. To illustrate the trends we see, the coloured
tables in Appendix IIB use the same “coding” principles as the residential results
tables (green indicating good prospects of viable schemes through to red indicating
no or very limited / marginal viability prospects at best).

Wycombe District Council - CIL Economic Viability D|S|P Housing & Development Consultants
Wycombe District Council – CIL Viability Assessment (Ref. No. DSP11023) 44
3.3.3 Another factor to which the commercial outcomes are greatly sensitive is the site
coverage of a scheme, i.e. the amount of accommodation to be provided on a given
site area; very much the equivalent of residential scheme density. This can affect
results considerably, combined with the land buy-in cost for the scheme. We saw the
effect these factors with residential too.
3.3.4 Factors such as build costs clearly have an impact too, but for the given scheme
scenarios are not likely to vary to an extent which makes this a more significant single
driver of results than the values influences (rents and yields) outlined above. In
practice, it will be the interaction of actual appraisal inputs (rather than these high
level assessment assumptions) that determines specific outcomes. There are some
commercial use types where build costs, or build and other development costs, will
not be met or will not be sufficiently exceeded by the completed values (GDVs) so as
to promote viable development.
3.3.5 We will now summarise the assessment findings for the commercial uses
(development scenarios) considered, bearing in mind that scheme types will be highly
variable.
3.4 Retail scenarios (Use Classes A1 – A5; i.e. also covering food and drink, financial
services, etc)
3.4.1 In general, we saw very good viability indications for the retail scenarios we ran,
based on the range of assumptions applied. These schemes showed the best viability
outcomes from the wide range seen; including residential. As a high level outcome
this is consistent with our previous and wider work in this field, as well as findings by
other consultants. This tone of results is shown by the largely green coloured cells in
the Appendix IIB results summary tables (using this measure of potential CIL scope up
to £250 / sq m; and beyond that level given the theoretical maximum CIL rate levels
shown).
3.4.2 We consider that the CIL charging rate for the larger retail type (supermarkets and
retail warehousing) could be taken up to £250/sq m, but that it in finding balance and
not posing undue additional risk to the delivery of any such proposals, the Council
should closely consider not going further than this; i.e. not pursuing CIL charging

Wycombe District Council - CIL Economic Viability D|S|P Housing & Development Consultants
Wycombe District Council – CIL Viability Assessment (Ref. No. DSP11023) 45
rates set further towards the very high theoretical maximums. Behind this, the
prospect that relatively high land values may be associated with this form of
development need to be kept in mind, together with the significant overall
development costs. We can see also that the larger supermarket appraisals with
lower value assumptions produced results indicating non-viability. The retail
warehousing scenario starts to produce land values that could be marginal beyond
the £200/sq m CIL trial level with reference to our PDL comparison, which is another
factor in coming to the view that rates higher than the above (up to) £250/sq m
recommendation would be inappropriate.
3.4.3 We also considered an intermediate sized supermarket (of 1,300 sq m) in the
background to seeking a relatively simple overall approach to retail, but were unable
to distinguish that, at this level of review, from the larger supermarket or retail
warehousing scenarios in likely viability terms. We have therefore not reported that
particular variation in detail.
3.4.4 Similarly, whilst appraising the smaller retail (A1 to A5) category, we explored the
sensitivity of that scenario type to varied size (floor area). Since this would not trigger
varying values or costs at this level of review, basically the reported values / costs
relationship stays constant; so that we do not see altering viability prospects as we
altered its floor area. This means that the outcomes for this scenario (as for many
others) are not dependent on the specific size of unit. The key factor differentiating
these types of retail scenarios from the larger ones is the value / cost relationship
related to the type of premises and the use of them; they are simply different
scenarios where that relationship is not as positive as it is in respect of larger,
generally out of town / edge of town stores. Specific floor area will not produce a
different nature of use and value /cost relationship.
3.4.5 We consider that creating a link with the scale of sales floor space associated with the
Sunday Trading provisions (3,000 sq ft / approx. 280sq m;) may be the most
appropriate threshold for any differentiation between CIL charging rates for retail
development. This means the overall unit size (which could vary greatly with ancillary
and other space included) would not necessarily need to be determined as the key
factor in differentiating for this scheme type.

Wycombe District Council - CIL Economic Viability D|S|P Housing & Development Consultants
Wycombe District Council – CIL Viability Assessment (Ref. No. DSP11023) 46
3.4.6 Whilst on the face of it the rate at which they potentially create land value appears
similar to the larger retail (supermarket/retail warehousing) scenario, the actual sums
of money available for land purchase become relatively small, particularly if the CIL
cost trial assumed too high a rate. It is also likely that, where these schemes come
forward, that could be often on previously developed land; or be associated with
mixed uses whereby there will need to be a positive contribution to overall viability
(potentially as part of supporting other non-viable or less viable uses as part of
neighbourhood centre developments, etc).
3.4.7 Overall, we consider that a charging rate set at around half of the large retail rate
would be appropriate. It seems possible to justify more, but again we would question
whether that would begin to add an undue effect on likely viability. We recommend
that the Council considers a CIL charging rate of no more than £125/sq for small retail
scenarios, and this does not have to link to a specific floor area size.
3.4.8 We are envisaging the principally relevant form of development here being new
convenience stores.
3.4.9 In the background to this recommended viability distinction, it is also likely that a less
favourable rental capitalisation rate would be applied to smaller retail units such as
these (the 7.5% yield scenarios probably better representing these than the 6.5%
yields). This reinforces the varied nature of the value levels available to outweigh the
costs. We can see also that the theoretical maximum CIL rates are significantly lower
than those indicated for the large retail scenarios.
3.4.10 While we understand the prospect of new build comparison shopping units to be
relatively limited in planning (and certainly in economic) terms in the coming few
years, we consider that – should that form of development come forward – it would
be appropriate to link that to a similar level of CIL charging; rather than the higher
(larger retail) rate. This could be relevant in parades / any neighbourhood centres.
3.4.11 There are a range of retail related uses, such as motor sales units and retail
warehousing / wholesale type clubs / businesses, which may also be seen in the
District, albeit possibly not regularly. Whilst it is not possible to cover all
eventualities, and that is not the intention of CIL by our understanding, we consider

Wycombe District Council - CIL Economic Viability D|S|P Housing & Development Consultants
Wycombe District Council – CIL Viability Assessment (Ref. No. DSP11023) 47
that it would be appropriate in viability terms to relate these to the lower CIL rate for
retail; particularly in preference to aligning them with usually less viable prospects
(those with lower value levels to support development costs), as will now be
discussed.
3.4.12 We assume that new fast food outlets, e.g. as part of retail developments, would be
treated as part of the retail scheme and (from our wider research) with values per sq
m at broadly similar to supermarket levels this would be an appropriate outcome.
3.4.13 Other uses under the umbrella of retail would be treated similarly. Individual units
would be charged according to their size as per the potential dual retail rate scenario
put forward above.
3.5 Business Development – Office / Industrial / Warehousing scenarios (Use Classes
B1, B1a, B2, B8)
3.5.1 In terms of likely scheme viability, these are simpler to discuss than retail. Whilst
again proposals could be highly variable in nature, the results convincingly show that
there is no foreseeable scope for any meaningful level of CIL charge to be made
applicable to such schemes in Wycombe District, reflecting similar findings across the
country due to the recent economic conditions.
3.5.2 These results indicate that only with the most optimistic capitalised rental scenarios
(yield and annual rent assumptions combinations), higher density (site coverage) and
/ or lower land value expectations do we see marginally viable schemes; but then
with little room for manoeuvre as seen through the low CIL charging rates only
possible even with a range of those ingredients in place (no more than say £50/ sq
m).
3.5.3 We consider that the collective assumptions need to be moved to points that are too
optimistic in order to create meaningful CIL scope at the current time and in the
foreseeable future.
3.5.4 The industrial unit type scenarios reviewed produced worse results on the basis of
the assumptions applied. As such, we have not considered it appropriate or
Wycombe District Council - CIL Economic Viability D|S|P Housing & Development Consultants
Wycombe District Council – CIL Viability Assessment (Ref. No. DSP11023) 48
necessary to further explore where the potentially workable scenarios may lie in
terms of wider views of assumptions. In practice, we could also see less favourable
yield and rental combinations than those we have reviewed. We would certainly not
want to assume more favourable rental capitalisation than from a 7.5% yield for
these scheme types in the current ongoing climate of economic uncertainty.
3.5.5 Any funding yield benefits from seeking the collection of a nominal / modest level of
CIL charge would in our view be far outweighed by the likely additional risk placed
upon these forms of development through additional costs.
3.5.6 In summary, we recommend that a zero (£0) CIL charging rate be considered for
these use types.
3.6 Hotels
3.6.1 The budget type hotel scenarios reviewed represent a range of outcomes that are
again very sensitive to the capitalised rental assumptions (varying combinations of
annual rentals and yields) driving the appraisals.
3.6.2 Whilst we consider that the 6.5% yield test scenarios could well be more or as
relevant to this development type as those run at a 7.5% yield trial, only with the
highest value assumptions do we see results that suggest a good prospect of viability.
Even with a greenfield starting point scenario, the improving (limited viability
prospects) outcomes look to be marginal and would probably rely on Council owned
land or some other joint venture type scenario where land was not being purchased
in the market.
3.6.3 There are currently two budget hotel developments progressing in the town as part
of a mixed use scheme. Bearing in mind the Council will need to consider the
likelihood of further development of this type occurring regularly in the coming few
years balanced against the potential to add further risk to its delivery, we
recommend that at the current point a zero (£0) charging rate be considered for this
use type. In looking for the right balance, it appears that the likely limited CIL yield
(contribution to funding gap) potential would not outweigh the added risk to the
viability of any new build / extension proposals for hotel use.

Wycombe District Council - CIL Economic Viability D|S|P Housing & Development Consultants
Wycombe District Council – CIL Viability Assessment (Ref. No. DSP11023) 49
3.7 Residential Institutions – Care Homes
3.7.1 Since proposals falling under this category could again be highly variable in nature, as
well as in terms of the values and other assumptions potentially applicable to varying
scheme specifics, through discussion with the Council we have focussed our appraisal
basis on a notional Care Homes scenario at this stage. Related to the ageing
population profile, as in many areas it is a form of provision considered relevant as
part of the overall accommodation and care offer available within the District.
3.7.2 We have not been able to identify or been provided with any recent development
examples or other comparables / guides as to likely financial assumptions associated
with this form of development in the District. In the absence of such information, it
has been necessary to make high level assumptions as befits this level of study, and
in a similar way to that carried out for other development types, explore what would
need to change within the assumptions to create scenarios with reasonable viability
prospects.
3.7.3 On the assumptions applied, based around a typical suburban low rise development
for this type of use, we have found a very similar tone of results to those associated
with hotels. Therefore, similarly, our evidence suggests poor viability prospects
unless assumptions are moved in favour of viability by increasing values and / or
reducing costs from the levels assumed.
3.7.4 Based on very similar thinking to that above in relation to budget hotels, therefore,
currently we are not able to support any meaningful level of CIL scope in respect of
such developments. Within the general monitoring scenario, however, the Council
should keep this under review with respect to experience in practice, since this type
of provision as new build is not familiar in the District. It remains to be seen in what
guise and t what degree, if at all, it could begin to come forward if sufficiently led by
the demands of an ageing population.
3.7.5 A zero (£0) CIL charging rate is recommended.
Wycombe District Council - CIL Economic Viability D|S|P Housing & Development Consultants
Wycombe District Council – CIL Viability Assessment (Ref. No. DSP11023) 50
3.8 Other uses – including Community Uses
3.8.1 Following our extensive iterative review process, throughout this assessment we can
see that once values fall to a certain level there is simply not enough development
revenue to support the developments costs, even before CIL scope is considered (i.e.
where adding CIL cost simply increases the nominal or negative numbers produced
by the residual land value results – makes the RLVs, and therefore viability prospects,
lower or moves them further into negative).
3.8.2 In such scenarios, a level of CIL charge or other similar degree of added cost in any
form would not usually be the single cause of a lack of viability. Such scenarios are
generally unviable in the sense we are studying here – as a starting point. This is
because they have either a very low or no real commercial value and yet the
development costs are often similar to equivalent types of commercial builds. We
regularly see that the even the build costs, and certainly the total costs, exceed levels
that can be supported based on any usual view of development viability. These are
often schemes that require financial support through some form of subsidy or
through the particular business plans of the organisations promoting and using them.
3.8.3 As will be seen below, there are a wide range of potential development types which
could come forward as new builds, but even collectively these are not likely to be
significant in terms of “lost opportunity” as regards CIL funding scope. We consider
that many of these uses would more frequently occupy existing / refurbished /
adapted premises.
3.8.4 A clear case in point will be community uses which generally either generate very low
or sub-market level income streams from various community groups and as a general
rule require very significant levels of subsidy to support their development cost; in
the main they are likely to be a long way from producing any meaningful CIL scope.
3.8.5 There are of course a range of other arguments in support of a distinct approach for
such uses. For example, in themselves, such facilities are generally contributing to the
wider availability of community infrastructure. They may even be the very types of
facilities that the pooled CIL contributions will ultimately support to some degree. For

Wycombe District Council - CIL Economic Viability D|S|P Housing & Development Consultants
Wycombe District Council – CIL Viability Assessment (Ref. No. DSP11023) 51
all this, so far as we can see the guiding principle in considering the CIL regime as may
be applied to these types of scenarios remains their viability as new build scenarios.
3.8.6 In any event, from our viability perspective, a zero (£0) CIL rate is recommended in
these instances.
3.8.7 As a part of reviewing the viability prospects associated with a range of other uses,
we compared their estimated typical values (or range of values) – with reference to
values research from local entries in the VOA’s Rating List and with their likely build
cost levels (base build costs before external works and fees) sourced from BCIS. As
has been discussed above, where the relationship between these two key appraisal
ingredients is not favourable (i.e. where costs exceed or are not sufficiently
outweighed by values) then we can quickly see that we are no dealing with viable
development scenarios. The lack of positive relationship is often such that, even with
low land costs assumed, schemes will not be viable. Some of these types of new
developments may in any event be promoted / owned by charitable organisations
and thereby be exempt from CIL charging (as affordable housing is).
3.8.8 Figure 11 below provides examples of the review of relationship between values and
costs in a range of these other scenarios. This is not an exhaustive list by any mean,
but it enables us the gain a clear picture of the extent of development types which
(even if coming forward as new builds) would be unlikely to support CIL funding
scope so as to sufficiently outweigh the added viability burden and complication in
the local CIL regime.

Wycombe District Council - CIL Economic Viability D|S|P Housing & Development Consultants
Wycombe District Council – CIL Viability Assessment (Ref. No. DSP11023) 52
Figure 11: Other uses – example value/cost relationships
Example
development
type
Annual
rental value
£/sq m
Indicative
capital value
Base build cost
–BCIS**
Viability
prospects and
Notes
Halls –
community halls,
etc
£10 - 30 £100 - 300 £1,481
(General
purpose halls)
Clear lack of
development
viability
Community
centres, clubs and
similar
£20 - 40 £200 - 400 £1,395
(Community
centres)
Clear lack of
development
viability
Garages & depots £40 – 75
(max £125)
£400 – 750
(max £1250)
£778
(Builders yards,
highways
depots and
similar)
Similar to low
grade industrial
(B uses) – costs
generally
exceed values
Storage – e.g. on
farms / other
Up to £60 -
90
Up to £600 -
900
£474 - £526
(agricultural
storage to
purpose built
warehouse)
As above –
assumed B type
uses. Costs
generally
exceed values.
No evidence in
support of
regular viability.
Surgeries / similar
£90 - 185 £900 – 1850
£1,410
(health centres,
clinics, group
practice
surgeries).
Insufficient
viability to
clearly out-
weigh costs on
a reliable basis.
Day nurseries £80 - 125 £800 - 1250 £1,580 Costs generally
exceed values.
Lack of
development
viability

Wycombe District Council - CIL Economic Viability D|S|P Housing & Development Consultants
Wycombe District Council – CIL Viability Assessment (Ref. No. DSP11023) 53
Example
development
type
Annual
rental value
£/sq m
Indicative
capital value
Base build cost
–BCIS**
Viability
prospects and
Notes
Leisure – other
bowling / cinema
£115 - £125 £1533
(@7.5% yield)
£1,148 Likely marginal
development
viability at best.
Leisure – private
health / fitness
£120 £1600
@7.5%yield)
£1,683
(Gymnasia,
fitness centres
etc)
Costs outweigh
values. No
evidence in
support of
regular viability.
*£/sq m rough guide prior to all costs allowances (based on assumed 10% yield for illustrative purposes - unless stated
otherwise)
**excluding external works, fees, contingencies, sustainability additions, etc.
3.8.9 With the exception of retail linked uses, such as mentioned at 3.4.11 above, our
recommendation is for the Council to consider a zero (£0) CIL rate in respect of a
range of other uses. As in other cases, this could be reviewed in response to
monitoring information. Our over-riding view is that the frequency of other new build
scenarios that could support meaningful CIL scope is likely to be very limited.
3.8.10 As alternatives, and we understand that there is no guidance pointing either way, the
Council could consider leaving such other proposals to “default “ to a nominal rate;
or to a higher rate to capture contributions from a small number of developments -
but with the risk that others would present difficulties.
3.9 Charge Setting and CIL Rate Review
3.9.1 To further inform the Council’s rate setting and ongoing work, we have considered
the range of potential CIL rates that have been viability tested in terms of their
proportion of completed development value (sales value or ‘GDV’) and proportion of
development cost. In looking at proportion of cost, we have considered alternative
comparisons – firstly against build costs (including external works, fees and
contingency), and then at the potential CIL rates as a proportion of the wider
development costs.

Wycombe District Council - CIL Economic Viability D|S|P Housing & Development Consultants
Wycombe District Council – CIL Viability Assessment (Ref. No. DSP11023) 54
3.9.2 The following figures (contained with the tables at Figures 12 to 19) do not relate to
the viability testing (they are not viability tested outcomes or recommendations)
beyond the fact that we have considered them at a selection of the potential CIL
(trial) rates tested for viability. The cost and values assumptions used to calculate the
following proportions are as assumed within the study. Please see the figures below.
Figure 12: CIL charging trial rates as % of Gross Development Value - Residential
CIL Charge (£/m²)
Value Level
1 2 3 4 5
£2,500 £3,000 £3,500 £4,000 £4,500
£75 3.0% 2.5% 2.1% 1.9% 1.7%
£100 4.0% 3.3% 2.9% 2.5% 2.2%
£125 5.0% 4.2% 3.6% 3.1% 2.8%
£150 6.0% 5.0% 4.3% 3.8% 3.3%
£175 7.0% 5.8% 5.0% 4.4% 3.9%
£200 8.0% 6.7% 5.7% 5.0% 4.4%
Figure 13: CIL charging trial rates as % of Gross Development Value – Commercial
Yield / Capitalised Rental Value (£ / m²)
Scheme Type 8.00% Yield 7.50% Yield 6.50% Yield
L M H L M H L M H
Large Retail - Supermarket £2,500 £3,125 £3,750 £2,667 £3,333 £4,000 £3,077 £3,846 £4,615
Large Retail – Retail
Warehouse £1,875 £2,500 £3,125 £2,000 £2,667 £3,333 £2,308 £3,077 £3,846
Small Retail / Other(A1-A5) £1,563 £1,875 £2,188 £1,667 £2,000 £2,333 £1,923 £2,308 £2,692
Budget hotel £1,875 £2,344 £2,813 £2,000 £2,500 £3,000 £2,308 £2,885 £3,462
Scheme Type CIL
Rate (£/m²)
8.00% yield 7.50% Yield 6.5% Yield
Low Med High Low Med High Low Med High
Large Retail - Supermarket
£50 2.0% 1.6% 1.3% 1.9% 1.5% 1.3% 1.6% 1.3% 1.1%
£100 4.0% 3.2% 2.7% 3.8% 3.0% 2.5% 3.3% 2.6% 2.2%
£150 6.0% 4.8% 4.0% 5.6% 4.5% 3.8% 4.9% 3.9% 3.3%
£200 8.0% 6.4% 5.3% 7.5% 6.0% 5.0% 6.5% 5.2% 4.3%
£250 10.0% 8.0% 6.7% 9.4% 7.5% 6.3% 8.1% 6.5% 5.4%

Wycombe District Council - CIL Economic Viability D|S|P Housing & Development Consultants
Wycombe District Council – CIL Viability Assessment (Ref. No. DSP11023) 55
Scheme Type CIL
Rate (£/m²)
8.00% yield 7.50% Yield 6.5% Yield
Low Med High Low Med High Low Med High
Large Retail - Retail
Warehouse
£50 2.7% 2.0% 1.6% 2.5% 1.9% 1.5% 2.2% 1.6% 1.3%
£100 5.3% 4.0% 3.2% 5.0% 3.8% 3.0% 4.3% 3.3% 2.6%
£150 8.0% 6.0% 4.8% 7.5% 5.6% 4.5% 6.5% 4.9% 3.9%
£200 10.7% 8.0% 6.4% 10.0% 7.5% 6.0% 8.7% 6.5% 5.2%
£250 13.3% 10.0% 8.0% 12.5% 9.4% 7.5% 10.8% 8.1% 6.5%
Small Retail / Other(A1-A5)
£50 3.2% 2.7% 2.3% 3.0% 2.5% 2.1% 2.6% 2.2% 1.9%
£100 6.4% 5.3% 4.6% 6.0% 5.0% 4.3% 5.2% 4.3% 3.7%
£150 9.6% 8.0% 6.9% 9.0% 7.5% 6.4% 7.8% 6.5% 5.6%
£200 12.8% 10.7% 9.1% 12.0% 10.0% 8.6% 10.4% 8.7% 7.4%
£250 16.0% 13.3% 11.4% 15.0% 12.5% 10.7% 13.0% 10.8% 9.3%
Budget hotel
£50 2.7% 2.1% 1.8% 2.5% 2.0% 1.7% 2.2% 1.7% 1.4%
£100 5.3% 4.3% 3.6% 5.0% 4.0% 3.3% 4.3% 3.5% 2.9%
£150 8.0% 6.4% 5.3% 7.5% 6.0% 5.0% 6.5% 5.2% 4.3%
£200 10.7% 8.5% 7.1% 10.0% 8.0% 6.7% 8.7% 6.9% 5.8%
£250 13.3% 10.7% 8.9% 12.5% 10.0% 8.3% 10.8% 8.7% 7.2%
Figure 14: CIL charging trial rates as % of Build Cost – Residential
1-Unit: CIL Charge (£/m²)
Total Build Costs*
CIL Charge as % of
Cost
4+-Units: CIL Charge (£/m²)
Total Build Costs*
CIL Charge as % of
Cost £75
£2,082
3.6%
£75
£1,484
5.1%
£100 4.8%
£100 6.7%
£125 6.0%
£125 8.4%
£150 7.2%
£150 10.1%
£175 8.4%
£175 11.8%
£200 9.6%
£200 13.5%
*average including base build, externals, contingencies and fees

Wycombe District Council - CIL Economic Viability D|S|P Housing & Development Consultants
Wycombe District Council – CIL Viability Assessment (Ref. No. DSP11023) 56
Figure 15: CIL charging trial rates as % of Build Cost – Commercial
Scheme Type CIL Rate (£/m²) Total Build
Costs* CIL Charge as %
of Cost
Large Retail - Supermarket
£50 £1,854 2.7%
£100 £1,854 5.4%
£150 £1,854 8.1%
£200 £1,854 10.8%
£250 £1,854 13.5%
Large Retail - Retail Warehouse
£50 £955 5.2%
£100 £955 10.5%
£150 £955 15.7%
£200 £955 20.9%
£250 £955 26.2%
Small Retail -convenience (and other related, comparison, A1-
A5)
£50 £1,165 4.3%
£100 £1,165 8.6%
£150 £1,165 12.9%
£200 £1,165 17.2%
£250 £1,165 21.5%
Budget hotel
£50 £2,170 2.3%
£100 £2,170 4.6%
£150 £2,170 6.9%
£200 £2,170 9.2%
£250 £2,170 11.5%
*average including base build, externals, contingencies and fees
Figure 16: CIL charging trial rates as % of Total Development Cost – Residential
1-Unit: CIL Charge (£/m²)
Total Development
Costs*
CIL Charge as % of
Cost
4+-Units:
CIL Charge (£/m²)
Total Development
Costs*
CIL Charge as % of
Cost
£75
£3,498
2.1%
£75
£2,812
2.7%
£100 2.9%
£100 3.6%
£125 3.6%
£125 4.4%
£150 4.3%
£150 5.3%
£175 5.0%
£175 6.2%
£200 5.7%
£200 7.1%
*total development cost assuming 20% developer profit and £3m/ha land value

Wycombe District Council - CIL Economic Viability D|S|P Housing & Development Consultants
Wycombe District Council – CIL Viability Assessment (Ref. No. DSP11023) 57
Figure 17: CIL charging trial rates as % of Total Development Cost – Commercial
Scheme Type CIL Rate (£/m²)
Total Development
Costs*
CIL Charge as % of Cost
Large Retail - Supermarket
£50 £3,058 1.6%
£100 £3,058 3.3%
£150 £3,058 4.9%
£200 £3,058 6.5%
£250 £3,058 8.2%
Large Retail - Retail Warehouse
£50 £2,041 2.4%
£100 £2,041 4.9%
£150 £2,041 7.3%
£200 £2,041 9.8%
£250 £2,041 12.2%
Small Retail -convenience (and other related, comparison, A1-A5)
£50 £2,911 1.7%
£100 £2,911 3.4%
£150 £2,911 5.2%
£200 £2,911 6.9%
£250 £2,911 8.6%
Budget hotel
£50 £2,974 1.7%
£100 £2,974 3.4%
£150 £2,974 5.0%
£200 £2,974 6.7%
£250 £2,974 8.4%
3.9.3 The Council may also wish to consider potential charging rates in the context of levels
of existing planning obligations (sought and collected) – e.g. per dwelling or per
development. The following tables may assist in considering these comparisons (the
commercial scheme examples appraised are included here after the residential ones).

Wycombe District Council - CIL Economic Viability D|S|P Housing & Development Consultants
Wycombe District Council – CIL Viability Assessment (Ref. No. DSP11023) 58
Figure 18: Residential CIL trial rates - Charge per Dwelling Equivalent
£75/m² CIL Charge
Scheme Size / Type Total Chargeable Floor Area (m²)
Total CIL Charge Equivalent Charge
per Private Dwelling
1 House 125 £9,375 £9,375
4 Houses 340 £25,500 £6,375
14 Mixed (0% AH) 1149 £86,175 £6,155
14 Mixed (30% AH) 780 £58,500 £6,500
14 Mixed (40% AH) 703 £52,725 £6,591
25 Mixed (30% AH) 1475 £110,625 £6,507
25 Mixed (40% AH) 1208 £90,600 £6,969
50 Mixed (40% AH) 2510 £188,250 £6,723
100 Mixed (40% AH) 4995 £374,625 £6,811
£100/m² CIL Charge
Scheme Size / Type Total Chargeable Floor Area (m²)
Total CIL Charge Equivalent Charge
per Private Dwelling
1 House 125 £12,500 £12,500
4 Houses 340 £34,000 £8,500
14 Mixed (0% AH) 1149 £114,900 £8,207
14 Mixed (30% AH) 780 £78,000 £8,667
15 Mixed (40% AH) 703 £70,300 £8,788
25 Mixed (30% AH) 1475 £147,500 £8,676
25 Mixed (40% AH) 1208 £120,800 £9,292
50 Mixed (40% AH) 2510 £251,000 £8,964
100 Mixed (40% AH) 4995 £499,500 £9,082

Wycombe District Council - CIL Economic Viability D|S|P Housing & Development Consultants
Wycombe District Council – CIL Viability Assessment (Ref. No. DSP11023) 59
£125/m² CIL Charge
Scheme Size / Type Total Chargeable Floor Area (m²)
Total CIL Charge
Equivalent Charge per Private
Dwelling
1 House 125 £15,625 £15,625
4 Houses 340 £42,500 £10,625
14 Mixed (0% AH) 1149 £143,625 £10,259
14 Mixed (30% AH) 780 £97,500 £10,833
15 Mixed (40% AH) 703 £87,875 £10,984
25 Mixed (30% AH) 1475 £184,375 £10,846
25 Mixed (40% AH) 1208 £151,000 £11,615
50 Mixed (40% AH) 2510 £313,750 £11,205
100 Mixed (40% AH) 4995 £624,375 £11,352
£150/m² CIL Charge
Scheme Size / Type Total Chargeable Floor Area (m²)
Total CIL Charge
Equivalent Charge per Private
Dwelling
1 House 125 £18,750 £18,750
4 Houses 340 £51,000 £12,750
14 Mixed (0% AH) 1149 £172,350 £12,311
14 Mixed (30% AH) 780 £117,000 £13,000
15 Mixed (40% AH) 703 £105,450 £13,181
25 Mixed (30% AH) 1475 £221,250 £13,015
25 Mixed (40% AH) 1208 £181,200 £13,938
50 Mixed (40% AH) 2510 £376,500 £13,446
100 Mixed (40% AH) 4995 £749,250 £13,623
£175/m² CIL Charge
Scheme Size / Type Total Chargeable Floor Area (m²)
Total CIL Charge
Equivalent Charge per Private
Dwelling
1 House 125 £21,875 £21,875
4 Houses 340 £59,500 £14,875
14 Mixed (0% AH) 1149 £201,075 £14,363
14 Mixed (30% AH) 780 £136,500 £15,167
15 Mixed (40% AH) 703 £123,025 £15,378
25 Mixed (30% AH) 1475 £258,125 £15,184
25 Mixed (40% AH) 1208 £211,400 £16,262
50 Mixed (40% AH) 2510 £439,250 £15,688
100 Mixed (40% AH) 4995 £874,125 £15,893

Wycombe District Council - CIL Economic Viability D|S|P Housing & Development Consultants
Wycombe District Council – CIL Viability Assessment (Ref. No. DSP11023) 60
£200/m² CIL Charge
Scheme Size / Type Total Chargeable Floor Area (m²)
Total CIL Charge
Equivalent Charge per Private
Dwelling
1 House 125 £25,000 £25,000
4 Houses 340 £68,000 £17,000
14 Mixed (0% AH) 1149 £229,800 £16,414
14 Mixed (30% AH) 780 £156,000 £17,333
15 Mixed (40% AH) 703 £140,600 £17,575
25 Mixed (30% AH) 1475 £295,000 £17,353
25 Mixed (40% AH) 1208 £241,600 £18,585
50 Mixed (40% AH) 2510 £502,000 £17,929
100 Mixed (40% AH) 4995 £999,000 £18,164
Figure 19: Commercial CIL trial rates - Charge per Dwelling Equivalent
£50/m² CIL Charge
Scheme Size / Type Total Chargeable Floor Area (m²)
Total CIL Charge
Large Retail - Supermarket 4000 £200,000
Large Retail - Retail Warehouse 1000 £50,000
Small Retail (principally convenience stores) 300 £15,000
Hotel 3000 £150,000
£100/m² CIL Charge
Scheme Size / Type Total Chargeable Floor Area (m²)
Total CIL Charge
Large Retail - Supermarket 4000 £400,000
Large Retail - Retail Warehouse 1000 £100,000
Small Retail (principally convenience stores) 300 £30,000
Hotel 3000 £300,000

Wycombe District Council - CIL Economic Viability D|S|P Housing & Development Consultants
Wycombe District Council – CIL Viability Assessment (Ref. No. DSP11023) 61
£150/m² CIL Charge
Scheme Size / Type Total Chargeable Floor Area (m²)
Total CIL Charge
Large Retail - Supermarket 4000 £600,000
Large Retail - Retail Warehouse 1000 £150,000
Small Retail (principally convenience stores) 300 £45,000
Hotel 3000 £450,000
£200/m² CIL Charge
Scheme Size / Type Total Chargeable Floor Area (m²)
Total CIL Charge
Large Retail - Supermarket 4000 £800,000
Large Retail - Retail Warehouse 1000 £200,000
Small Retail (principally convenience stores) 300 £60,000
Hotel 3000 £600,000
£250/m² CIL Charge
Scheme Size / Type Total Chargeable Floor Area (m²)
Total CIL Charge
Large Retail - Supermarket 4000 £1,000,000
Large Retail - Retail Warehouse 1000 £250,000
Small Retail (principally convenience stores) 300 £75,000
Hotel 3000 £750,000
3.9.4 The Council may wish to use the above information to consider the potential CIL
charging rates recommended, and the wider potential rates / options, as part of its
balancing of objectives and overall assessment. Comparison of potential CIL charging
rates with current s.106 contributions levels could be a useful aspect for context /
benchmarking what the potential CIL rates mean in practice.

Wycombe District Council - CIL Economic Viability D|S|P Housing & Development Consultants
Wycombe District Council – CIL Viability Assessment (Ref. No. DSP11023) 62
3.10 Summary – CIL rate and other recommendations
3.10.1 In summary, from a viability point of view we recommend the following parameters
for consideration by the District Council in taking forward the setting of a draft CIL
charging schedule:
A. Residential
Recommendation:
Dual rate approach - £125/sq m NW-SE central axis
(typically lower value zone)
- £150/sq m elsewhere
(typically higher value zones, north and south of central
axis)
(Alternative: single District wide rate not exceeding £125/sq m)
B. Retail – large (supermarket / retail warehousing)
Recommendation:
Rate not higher than £250/sq m
C. Retail – smaller/other (principally convenience stores but also applicable to all
other categories including A1-A5, comparison shopping and retail linked (e.g.
motor sales, retail warehousing/wholesaling clubs)
Recommendation:
Approximately half large retail rate – suggested not exceeding £125/sq m
D. Business Development - Office and Industrial (B1, B1a, B2, B8)
Recommendation:
Zero rate (£0)
E. Hotels and Care Homes
Recommendation:
Zero rate (£0) on balance in preference to a low / nominal rate
(Alternative: nominal / low CIL rate, but difficult to justify in viability terms)

Wycombe District Council - CIL Economic Viability D|S|P Housing & Development Consultants
Wycombe District Council – CIL Viability Assessment (Ref. No. DSP11023) 63
F. Community and other uses
Recommendation:
Zero rate (£0) on balance in preference to a low / nominal rate
(Alternative: nominal / low CIL rate, but difficult to justify in viability terms)
3.10.2 Additional recommendation: To consider monitoring and review. The DCLG Charge
Setting Procedures (paragraph 75)6 state that: ‘The Government has not specified a
recommended lifetime for charging schedules and there is no requirement in the Act
placing charging authorities under a duty to review their charging schedules.
However, charging authorities are strongly encouraged to keep their charging
schedules under review. This is important to ensure that CIL charges remain
appropriate over time – for instance as market conditions change, and also so that
they remain relevant to the gap in the funding for the infrastructure needed to
support the development of their area. Although there is no fixed period or frequency
for this we recommend that the Council begins to consider its more detailed
implementation strategies around CIL, including how it will monitor and potentially
review CIL collection and levels – informed by the experience of operating it in
practice.’ (Italics section quoted from the CLG document).
3.10.3 Additional recommendation: To implement such monitoring processes and use
them to inform the future review of the local implementation of the CIL. The DCLG
CIL Overview7 document (at paragraphs 19 and 20) touches on the intended open
and transparent nature of the levy and in doing so states that charging authorities
must prepare short monitoring reports each year.
3.10.4 Additional recommendation: As has been the case with s.106 obligations, to
consider the scope (as far as permitted) to phase CIL payment timings where
needed as part of mitigation against scheme viability and / or delivery issues.
Through all of our development viability work, particularly in relation to larger
developments and especially longer running / phased residential schemes, we
6 DCLG – Community Infrastructure Levy Guidance – Charge Setting and Charging Schedule Procedures (March
2010) 7 DCLG – The Community Infrastructure Levy - An Overview (May 2011)

Wycombe District Council - CIL Economic Viability D|S|P Housing & Development Consultants
Wycombe District Council – CIL Viability Assessment (Ref. No. DSP11023) 64
observe the impact that the particular timing of planning obligations have. The same
will apply to the payments due under the CIL. Front loading of significant costs can
impact development cash flows in a very detrimental way, as costs (negative
balances) are carried in advance of sales income counteracting those. Considering
the spreading of the cost burden to some extent - as far as may be permissible - even
on some smaller schemes, may well provide a useful tool for supporting viability in
the early stages. Allied to this, the Council may wish to consider the extent to which
pooled funds might be used to forward-fund or part fund key early infrastructure
elements that may be required to facilitate schemes progressing, or proceeding more
smoothly. This is not a new principle. Discussions with developers on the timing of
affordable housing provision and / or financial contribution obligations, for example,
could also continue to be important in this regard. In some cases, an affordable
housing element provides valuable and relatively secure cash flow; in others there
may be overall scheme benefits from phasing its provision differently.
Main text of study report ends.
November 2011.

D|S|P Housing & Development Consultants
Appendix I
Assumptions

D|S|P Housing and Development Consultants
Private Mix
Affordable
Tenure Split
66% AR; 34%
LCHO
Private Mix
Affordable
Tenure Split
66% AR; 34%
LCHO
1 House 1 x 4BH 30 1 x 4BH N/A N/A N/A
4 Houses 2 x 2BH; 2 x 3BH 30 2 x 2BH; 2 x 3BH N/A 2 x 2BH; 2 x 3BH N/A
14 Mixed (Urban)
2 x 1BF, 3 x 2BF; 2
x 2BH, 5 x 3BH, 2 x
4BH
50 N/A N/A
2 x 1BF, 3 x 2BF; 2
x 2BH, 5 x 3BH, 2
x 4BH
N/A
14 Mixed (Rural)2 x 1BF, 3 x 2BF; 2
x 2BH, 5 x 3BH, 2 x
4BH
502 x 1BF, 1 x 2BF;
4 x 3BH, 2 x 4BH
2 x 2BH, 1 x 3BH
AR; 2 x 2BF
LCHO
2 x 1BF; 1 x 2BH,
3 x 3BH, 2 x 4BH
1 x 2BH, 2 x 3BH
AR; 3 x 2BF
LCHO
25 Mixed
3 x 1BF, 5 x 2BF; 4
x 2BH, 9 x 3BH, 4 x
4BH
50
3 x 1BF, 2 x 2BF;
2 x 2BH, 6 x
3BH, 4 x 4BH
2 x 2BH, 3 x 3BH
AR, 3 x 2BF
LCHO
2 x 1BF, 1 x 2BF; 6
x 3BH, 4 x 4BH
4 x 2BH, 3 x 3BH
AR, 1 x 1BF, 4 x
2BF LCHO
50 Mixed
6 x 1BF, 10 x 2BF;
8 x 2BH, 18 x 3BH,
8 x 4BH
30 / 50 N/A N/A
5 x 1BF, 2 x 2BF; 2
x 2BH, 12 x 3BH, 7
x 4BH
6 x 2BH, 6 x
3BH, 1 x 4BH
AR, 1 x 1BF, 8 x
2BF LCHO
100 Mixed
12 x 1BF, 20 x 2BF;
16 x 2BH, 32 x
3BH, 16 x 4BH
30 / 50 N/A N/A
10 x 1BF, 4 x 2BF;
2 x 2BH, 24 x 3BH,
15 x 4BH
14 x 2BH, 12 x
3BH, 1 x 4BH
AR, 2 x 1BF, 16 x
2BF LCHO"N/A" indicates tenure mix not possible or where would be identical to higher or lower affordable housing proportion.
Unit Sizes (sq m) Affordable Private
1-bed flat 50 45
2-bed flat 67 60
2-bed house 75 75
3-bed house 85 95
4-bed house 110 125
Percentage Affordable Housing & Tenure Mix
Site Type
Residential Intensification /
Garden
Residential Intensification /
Garden
Greenfield / Employment
Greenfield / Employment
Residential Intensification /
Greenfield / Employment
Residential Intensification /
Garden
Residential Intensification /
Garden
30% Affordable Housing (Sites of
15 units or more in urban areas;
5 units or more in rural areas)
40% Affordable Housing on
Greenfield and Employment Sites
of 15 or more in urban areas and 5
units or more in rural areas.Likely Density
(dph)
Affordable housing based on proprotion of bedspaces. Target of 50% one and two bed properties, 50% three and four bed (or more) properties for affordable rent; all LCHO properties should be 1 & 2-bed properties
Site Size Appraised
Dwelling Mix (BF
= Bed Flat; BH =
Bed House
Wycombe District Council - Community Infrastructure Levy Viability Assessment - Residential Assumptions Sheet
Appendix I - Development Assumptions

D|S|P Housing and Development Consultants
1-bed flat £112,500 £135,000 £157,500 £180,000 £202,500
2-bed flat £150,000 £180,000 £210,000 £240,000 £270,000
2-bed house £187,500 £225,000 £262,500 £300,000 £337,500
3-bed house £237,500 £285,000 £332,500 £380,000 £427,500
4-bed house £312,500 £375,000 £437,500 £500,000 £562,500
Value (£ / m²) £2,500 £3,000 £3,500 £4,000 £4,500
Development Costs
RESIDENTIAL BUILDING, MARKETING & S106 COSTS
Build Costs Flats (Generally) (£/m²)1 £1,208
Build Costs Houses (Mixed Developments) (£/m²)1 £1,127
Build Costs - Houses (One Off Generally) (£/m²)1 £1,644
Site Preparation (£ / unit) £4,000
Survey Costs (£ / unit) £500
Contingencies (% of build cost) 5%
Professional Fees & Insurances (% of build cost) 15.0%
4%
Lifetime Homes / Other (£ per unit)3 £545
Planning obligations /non-CIL costs (£ per unit) £500
Marketing & Sales Costs (%of GDV) 3%
Legal Fees on sale (£ per unit) £600
DEVELOPER'S RETURN FOR RISK AND PROFIT
Open Market Housing Profit (% of GDV) 20.0%
Affordable Housing Profit (% of GDV) 6.0%
FINANCE & ACQUISITION COSTS
Arrangement Fee - (% of loan) 1.0%
Miscellaeneous (Surveyors etc) - per unit 0.00%
Agents Fees (% of site value) 0.75%
Legal Fees (% of site value) 0.75%
Stamp Duty (% of site value) 0% to 5%
Finance Rate - Build (%) 6.0%
Finance Rate - Land (%) 6.0%
Notes:
Build costs taken from 1st Quarter 2011 (i.e. not forecast) and rebased to Wycombe Location Factor of 108 without externals, contingencies or fees
Above build costs have externals at 21% for houses; 14% for flats added.
1 Build cost taken as "Median" figure from BCIS for that build type - e.g. flats ; houses storey heights etc and then rounded. Median figure gives a better figure than the Mean as it is not so influenced by rogue figures that can distort the mean on
small sample sizes. BCIS data: Flats (Generally): £1,015/m² GIA; Houses Mixed Development: £890/m²; one off housing: £1,299/m² GIA.
2 The above costs are based on the Cost of Building to the Code for Sustanable Homes - Updated Cost Review (August 2011) cost data assuming Building Regs 2010 baseline.
3 Allowance to achieve Lifetime Homes Standards acknowledged within report as potential variable cost issue (depending on design etc).There have been a number of studies into the costs and benefits of building to the Lifetime Homes standard.
These have concluded that the costs range from £545 to £1615 per dwelling, depending on: the experience of the home designer and builder; the size of the dwelling (it is easier to design larger dwellings that incorporate Lifetime Homes standards
cost effectively than smaller ones); whether Lifetime Homes design criteria were designed into developments from the outset or whether a standard house type is modified (it is more cost effective to incorporate the standards at the design stage
rather than modify standard designs); and any analysis of costs is a ‘snapshot' in time. The net cost of implementing Lifetime Homes will diminish as the concept is more widely adopted and as design standards, and market expectations, rise
(www.lifetimehomes.org.uk).
Open Market
Value
Sustainable Design / Construction Standards (% of
build cost)2 - Code Level 3 and 4
Value Level 5Value Level 4Value Level 3Value Level 1 Value Level 2
Appendix I - Development Assumptions
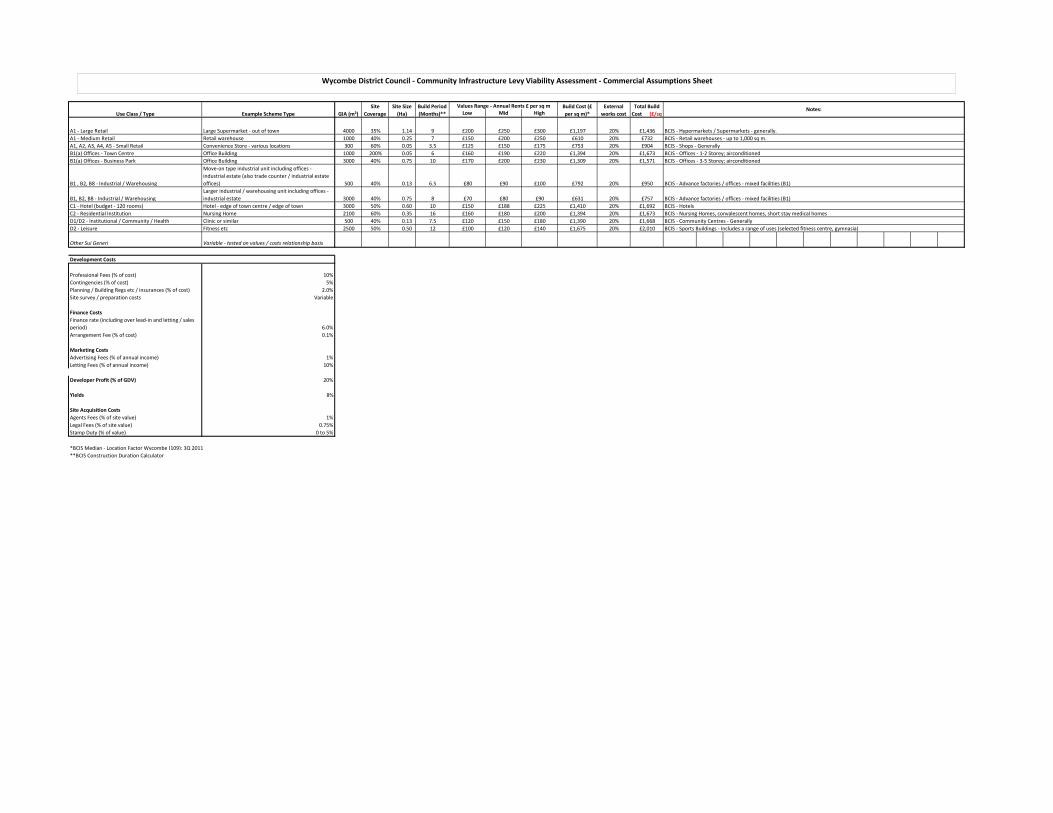
Low Mid High
A1 - Large Retail Large Supermarket - out of town 4000 35% 1.14 9 £200 £250 £300 £1,197 20% £1,436
A1 - Medium Retail Retail warehouse 1000 40% 0.25 7 £150 £200 £250 £610 20% £732
A1, A2, A3, A4, A5 - Small Retail Convenience Store - various locations 300 60% 0.05 3.5 £125 £150 £175 £753 20% £904
B1(a) Offices - Town Centre Office Building 1000 200% 0.05 6 £160 £190 £220 £1,394 20% £1,673
B1(a) Offices - Business Park Office Building 3000 40% 0.75 10 £170 £200 £230 £1,309 20% £1,571
B1 , B2, B8 - Industrial / Warehousing
Move-on type industrial unit including offices -
industrial estate (also trade counter / industrial estate
offices) 500 40% 0.13 6.5 £80 £90 £100 £792 20% £950
B1, B2, B8 - Industrial / Warehousing
Larger industrial / warehousing unit including offices -
industrial estate 3000 40% 0.75 8 £70 £80 £90 £631 20% £757
C1 - Hotel (budget - 120 rooms) Hotel - edge of town centre / edge of town 3000 50% 0.60 10 £150 £188 £225 £1,410 20% £1,692
C2 - Residential Institution Nursing Home 2100 60% 0.35 16 £160 £180 £200 £1,394 20% £1,673
D1/D2 - Institutional / Community / Health Clinic or similar 500 40% 0.13 7.5 £120 £150 £180 £1,390 20% £1,668
D2 - Leisure Fitness etc 2500 50% 0.50 12 £100 £120 £140 £1,675 20% £2,010
Other Sui Generi Variable - tested on values / costs relationship basis
Development Costs
Professional Fees (% of cost) 10%
Contingencies (% of cost) 5%
Planning / Building Regs etc / insurances (% of cost) 2.0%
Site survey / preparation costs Variable
Finance Costs
Finance rate (including over lead-in and letting / sales
period) 6.0%
Arrangement Fee (% of cost) 0.1%
Marketing Costs
Advertising Fees (% of annual income) 1%
Letting Fees (% of annual income) 10%
Developer Profit (% of GDV) 20%
Yields 8%
Site Acquisition Costs
Agents Fees (% of site value) 1%
Legal Fees (% of site value) 0.75%
Stamp Duty (% of value) 0 to 5%
*BCIS Median - Location Factor Wycombe (109); 3Q 2011
**BCIS Construction Duration Calculator
BCIS - Hypermarkets / Supermarkets - generally.
BCIS - Sports Buildings - Includes a range of uses (selected fitness centre, gymnasia)
BCIS - Community Centres - Generally
BCIS - Nursing Homes, convalescent homes, short stay medical homes
BCIS - Hotels
BCIS - Advance factories / offices - mixed facilities (B1)
BCIS - Advance factories / offices - mixed facilities (B1)
BCIS - Offices - 3-5 Storey; airconditioned
BCIS - Offices - 1-2 Storey; airconditioned
BCIS - Shops - Generally
BCIS - Retail warehouses - up to 1,000 sq m.
Use Class / TypeNotes:
Build Period
(Months)**
Site Size
(Ha)
Site
CoverageGIA (m²)Example Scheme Type
Values Range - Annual Rents £ per sq m Total Build
Cost (£/sq
External
works cost
Build Cost (£
per sq m)*
Wycombe District Council - Community Infrastructure Levy Viability Assessment - Commercial Assumptions Sheet

D|S|P Housing & Development Consultants
Appendix IIa
Residential Results Summaries
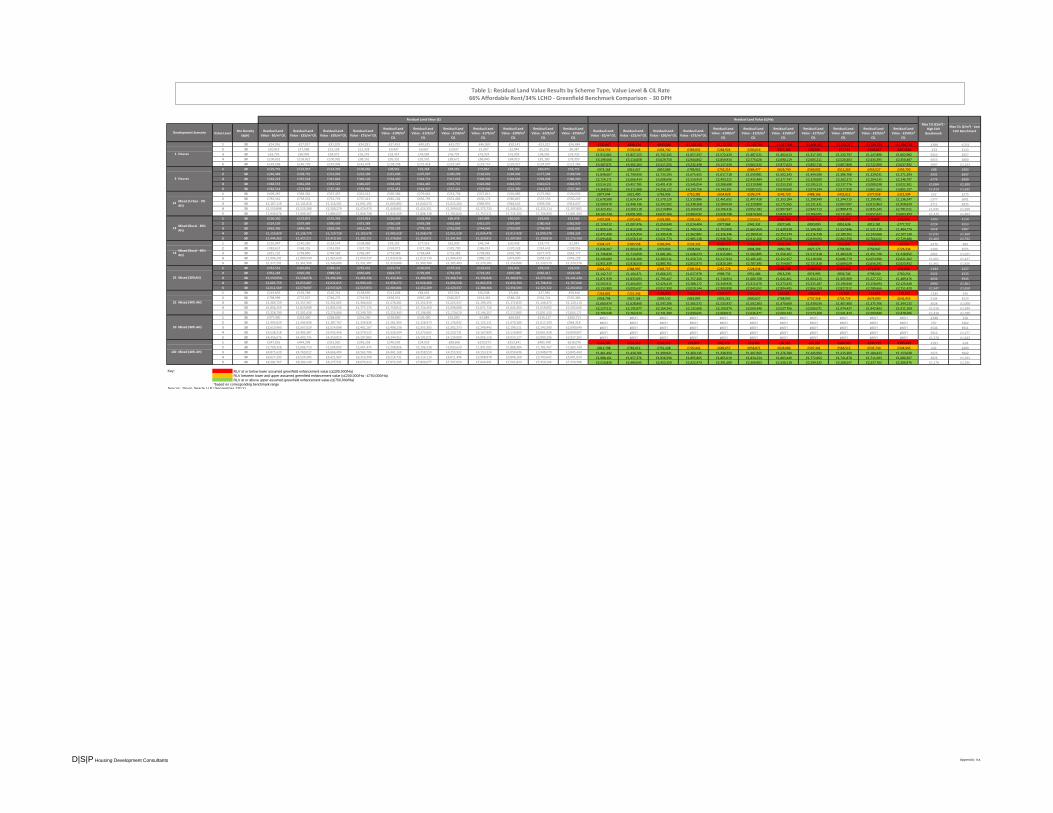
Value LevelSite Density
(dph)
Residual Land
Value - £0/m² CIL
Residual Land
Value - £25/m² CIL
Residual Land
Value - £50/m² CIL
Residual Land
Value - £75/m² CIL
Residual Land
Value - £100/m²
CIL
Residual Land
Value - £125/m²
CIL
Residual Land
Value - £150/m²
CIL
Residual Land
Value - £175/m²
CIL
Residual Land
Value - £200/m²
CIL
Residual Land
Value - £225/m²
CIL
Residual Land
Value - £250/m²
CIL
Residual Land
Value - £0/m² CIL
Residual Land
Value - £25/m² CIL
Residual Land
Value - £50/m² CIL
Residual Land
Value - £75/m² CIL
Residual Land
Value - £100/m²
CIL
Residual Land
Value - £125/m²
CIL
Residual Land
Value - £150/m²
CIL
Residual Land
Value - £175/m²
CIL
Residual Land
Value - £200/m²
CIL
Residual Land
Value - £225/m²
CIL
Residual Land
Value - £250/m²
CIL
1 30 -£24,766 -£27,937 -£31,109 -£34,281 -£37,453 -£40,625 -£43,797 -£46,969 -£50,141 -£53,312 -£56,484 -£742,967 -£838,124 -£933,280 -£1,028,436 -£1,123,592 -£1,218,749 -£1,313,905 -£1,409,061 -£1,504,217 -£1,599,374 -£1,694,530 -£398 -£251
2 30 £20,819 £17,988 £15,158 £12,328 £9,497 £6,667 £3,837 £1,007 -£2,044 -£5,216 -£8,387 £624,556 £539,648 £454,740 £369,832 £284,924 £200,016 £115,108 £30,200 -£61,311 -£156,467 -£251,624 -£33 £113
3 30 £63,735 £60,905 £58,075 £55,245 £52,414 £49,584 £46,754 £43,924 £41,093 £38,263 £35,433 £1,912,061 £1,827,153 £1,742,245 £1,657,337 £1,572,429 £1,487,521 £1,402,613 £1,317,705 £1,232,797 £1,147,890 £1,062,982 £310 £457
4 30 £106,652 £103,822 £100,992 £98,161 £95,331 £92,501 £89,671 £86,840 £84,010 £81,180 £78,350 £3,199,566 £3,114,658 £3,029,750 £2,944,842 £2,859,934 £2,775,026 £2,690,119 £2,605,211 £2,520,303 £2,435,395 £2,350,487 £653 £800
5 30 £149,569 £146,739 £143,909 £141,078 £138,248 £135,418 £132,587 £129,757 £126,927 £124,097 £121,266 £4,487,071 £4,402,163 £4,317,255 £4,232,348 £4,147,440 £4,062,532 £3,977,624 £3,892,716 £3,807,808 £3,722,900 £3,637,992 £997 £1,143
1 30 £129,755 £122,057 £114,359 £106,660 £98,962 £91,264 £83,565 £75,867 £68,169 £60,470 £52,772 £973,164 £915,427 £857,689 £799,952 £742,214 £684,477 £626,740 £569,002 £511,265 £453,527 £395,790 £88 £303
2 30 £246,489 £238,791 £231,092 £223,394 £215,696 £207,997 £200,299 £192,601 £184,902 £177,204 £169,506 £1,848,667 £1,790,930 £1,733,193 £1,675,455 £1,617,718 £1,559,981 £1,502,243 £1,444,506 £1,386,768 £1,329,031 £1,271,294 £431 £647
3 30 £363,223 £355,524 £347,826 £340,128 £332,430 £324,731 £317,033 £309,335 £301,636 £293,938 £286,240 £2,724,171 £2,666,434 £2,608,696 £2,550,959 £2,493,222 £2,435,484 £2,377,747 £2,320,009 £2,262,272 £2,204,535 £2,146,797 £774 £990
4 30 £468,553 £461,038 £453,523 £446,007 £438,492 £441,465 £433,767 £426,068 £418,370 £410,672 £402,973 £3,514,151 £3,457,785 £3,401,419 £3,345,054 £3,288,688 £3,310,988 £3,253,250 £3,195,513 £3,137,776 £3,080,038 £3,022,301 £1,084 £1,300
5 30 £582,514 £574,998 £567,483 £559,968 £552,452 £544,937 £537,421 £529,906 £522,390 £514,875 £507,360 £4,368,853 £4,312,488 £4,256,122 £4,199,756 £4,143,391 £4,087,025 £4,030,660 £3,974,294 £3,917,928 £3,861,563 £3,805,197 £1,419 £1,635
1 30 £409,287 £383,362 £357,437 £331,512 £305,586 £279,661 £253,736 £227,811 £201,885 £175,960 £150,035 £877,044 £821,490 £765,936 £710,382 £654,828 £599,274 £543,720 £488,166 £432,612 £377,058 £321,504 £52 £275
2 30 £783,341 £758,032 £732,723 £707,413 £682,104 £656,795 £631,486 £606,176 £580,867 £555,558 £530,249 £1,678,588 £1,624,354 £1,570,120 £1,515,886 £1,461,652 £1,407,418 £1,353,184 £1,298,949 £1,244,715 £1,190,481 £1,136,247 £377 £601
3 30 £1,167,119 £1,141,810 £1,116,501 £1,091,192 £1,065,882 £1,040,573 £1,015,264 £989,955 £964,645 £939,336 £914,027 £2,500,970 £2,446,736 £2,392,502 £2,338,268 £2,284,034 £2,229,800 £2,175,565 £2,121,331 £2,067,097 £2,012,863 £1,958,629 £711 £935
4 30 £1,550,898 £1,525,588 £1,500,279 £1,474,970 £1,449,661 £1,424,351 £1,399,042 £1,373,733 £1,348,424 £1,323,114 £1,297,805 £3,323,352 £3,269,118 £3,214,884 £3,160,650 £3,106,416 £3,052,182 £2,997,947 £2,943,713 £2,889,479 £2,835,245 £2,781,011 £1,045 £1,269
5 30 £1,934,676 £1,909,367 £1,884,057 £1,858,748 £1,833,439 £1,808,130 £1,782,820 £1,757,511 £1,732,202 £1,706,893 £1,681,583 £4,145,734 £4,091,500 £4,037,266 £3,983,032 £3,928,798 £3,874,564 £3,820,329 £3,766,095 £3,711,861 £3,657,627 £3,603,393 £1,379 £1,603
1 30 £190,350 £172,872 £155,393 £137,914 £120,435 £102,956 £85,478 £67,999 £50,520 £33,041 £15,562 £407,894 £370,439 £332,985 £295,530 £258,075 £220,621 £183,166 £145,712 £108,257 £70,802 £33,348 -£205 £1242 30 £524,539 £507,489 £490,439 £473,389 £456,338 £439,288 £432,854 £415,375 £397,897 £380,418 £362,939 £1,124,012 £1,087,476 £1,050,940 £1,014,404 £977,868 £941,332 £927,545 £890,090 £852,636 £815,181 £777,727 £224 £5533 30 £863,396 £846,346 £829,296 £812,246 £795,195 £778,145 £761,095 £744,045 £726,995 £709,945 £692,895 £1,850,134 £1,813,598 £1,777,062 £1,740,526 £1,703,990 £1,667,454 £1,630,918 £1,594,382 £1,557,846 £1,521,310 £1,484,774 £658 £9874 30 £1,153,829 £1,136,779 £1,119,728 £1,102,678 £1,085,628 £1,068,578 £1,051,528 £1,034,478 £1,017,428 £1,000,378 £983,328 £2,472,490 £2,435,954 £2,399,418 £2,362,882 £2,326,346 £2,289,810 £2,253,274 £2,216,738 £2,180,202 £2,143,666 £2,107,130 £1,031 £1,3605 30 £1,444,262 £1,427,211 £1,410,161 £1,393,111 £1,376,061 £1,359,011 £1,341,961 £1,324,911 £1,307,861 £1,290,810 £1,273,760 £3,094,846 £3,058,310 £3,021,774 £2,985,238 £2,948,702 £2,912,166 £2,875,630 £2,839,094 £2,802,558 £2,766,022 £2,729,486 £1,403 £1,732
1 30 £155,947 £140,260 £124,574 £108,888 £93,202 £77,516 £61,830 £46,144 £30,458 £14,772 -£1,043 £334,171 £300,558 £266,945 £233,332 £199,719 £166,106 £132,493 £98,880 £65,266 £31,653 -£2,236 -£276 £892 30 £483,657 £468,355 £453,054 £437,752 £433,073 £417,386 £401,700 £386,014 £370,328 £354,642 £338,956 £1,036,407 £1,003,618 £970,830 £938,041 £928,013 £894,399 £860,786 £827,173 £793,560 £759,947 £726,334 £190 £5553 30 £815,191 £799,890 £784,589 £769,287 £753,986 £738,684 £723,383 £708,082 £692,780 £677,479 £662,177 £1,746,839 £1,714,050 £1,681,261 £1,648,473 £1,615,684 £1,582,895 £1,550,107 £1,517,318 £1,484,529 £1,451,740 £1,418,952 £662 £1,0274 30 £1,096,241 £1,080,940 £1,065,639 £1,050,337 £1,035,036 £1,019,734 £1,004,433 £989,132 £973,830 £958,529 £943,228 £2,349,089 £2,316,300 £2,283,511 £2,250,723 £2,217,934 £2,185,145 £2,152,357 £2,119,568 £2,086,779 £2,053,990 £2,021,202 £1,062 £1,4275 30 £1,377,291 £1,361,990 £1,346,689 £1,331,387 £1,316,086 £1,300,784 £1,285,483 £1,270,182 £1,254,880 £1,239,579 £1,224,278 £2,951,339 £2,918,550 £2,885,761 £2,852,973 £2,820,184 £2,787,395 £2,754,607 £2,721,818 £2,689,029 £2,656,241 £2,623,452 £1,461 £1,826
1 30 £353,531 £320,831 £288,131 £255,431 £222,731 £190,031 £157,331 £124,631 £91,931 £59,232 £26,532 £424,237 £384,997 £345,757 £306,518 £267,278 £228,038 £188,798 £149,558 £110,318 £71,078 £31,838 -£184 £1272 30 £952,264 £920,392 £888,521 £856,649 £824,777 £792,905 £761,033 £729,161 £697,289 £665,417 £633,545 £1,142,717 £1,104,471 £1,066,225 £1,027,978 £989,732 £951,486 £913,239 £874,993 £836,746 £798,500 £760,254 £222 £5333 30 £1,559,950 £1,528,078 £1,496,206 £1,464,334 £1,432,462 £1,400,590 £1,368,718 £1,336,846 £1,304,974 £1,273,102 £1,241,230 £1,871,939 £1,833,693 £1,795,447 £1,757,200 £1,718,954 £1,680,708 £1,642,461 £1,604,215 £1,565,969 £1,527,722 £1,489,476 £634 £9454 30 £2,085,759 £2,053,887 £2,022,015 £1,990,143 £1,958,272 £1,926,400 £1,894,528 £1,862,656 £1,830,784 £1,798,912 £1,767,040 £2,502,911 £2,464,665 £2,426,419 £2,388,172 £2,349,926 £2,311,679 £2,273,433 £2,235,187 £2,196,940 £2,158,694 £2,120,448 £990 £1,3015 30 £2,611,569 £2,579,697 £2,547,825 £2,515,953 £2,484,081 £2,452,209 £2,420,337 £2,388,466 £2,356,594 £2,324,722 £2,292,850 £3,133,883 £3,095,637 £3,057,390 £3,019,144 £2,980,898 £2,942,651 £2,904,405 £2,866,159 £2,827,912 £2,789,666 £2,751,420 £1,347 £1,658
1 30 £219,835 £192,788 £165,741 £138,695 £111,648 £84,601 £57,554 £30,508 £3,461 -£27,395 -£58,810 £263,802 £231,346 £198,890 £166,434 £133,977 £101,521 £69,065 £36,609 £4,153 -£32,874 -£70,572 -£335 £442 30 £798,999 £772,637 £746,275 £719,913 £693,551 £667,189 £640,827 £614,465 £588,103 £561,741 £535,380 £958,798 £927,164 £895,530 £863,895 £832,261 £800,627 £768,993 £737,358 £705,724 £674,090 £642,455 £144 £5233 30 £1,383,729 £1,357,367 £1,331,005 £1,304,643 £1,278,281 £1,251,919 £1,225,557 £1,199,195 £1,172,833 £1,146,472 £1,120,110 £1,660,474 £1,628,840 £1,597,206 £1,565,572 £1,533,937 £1,502,303 £1,470,669 £1,439,034 £1,407,400 £1,375,766 £1,344,132 £628 £1,0084 30 £1,856,259 £1,829,898 £1,803,536 £1,777,174 £1,750,812 £1,724,450 £1,698,088 £1,671,726 £1,645,364 £1,619,002 £1,592,640 £2,227,511 £2,195,877 £2,164,243 £2,132,608 £2,100,974 £2,069,340 £2,037,706 £2,006,071 £1,974,437 £1,942,803 £1,911,169 £1,019 £1,3995 30 £2,328,790 £2,302,428 £2,276,066 £2,249,705 £2,223,343 £2,196,981 £2,170,619 £2,144,257 £2,117,895 £2,091,533 £2,065,171 £2,794,548 £2,762,914 £2,731,280 £2,699,645 £2,668,011 £2,636,377 £2,604,743 £2,573,108 £2,541,474 £2,509,840 £2,478,206 £1,410 £1,790
1 30 £377,490 £323,090 £268,690 £214,290 £159,890 £105,490 £51,090 -£3,989 -£69,563 -£135,137 -£200,711 #REF! #REF! #REF! #REF! #REF! #REF! #REF! #REF! #REF! #REF! #REF! -£348 £18
2 30 £1,493,629 £1,440,698 £1,387,767 £1,334,836 £1,281,904 £1,228,973 £1,176,042 £1,123,111 £1,070,180 £1,017,249 £964,318 #REF! #REF! #REF! #REF! #REF! #REF! #REF! #REF! #REF! #REF! #REF! £97 £462
3 30 £2,619,960 £2,567,029 £2,514,098 £2,461,167 £2,408,236 £2,355,305 £2,302,373 £2,249,442 £2,196,511 £2,143,580 £2,090,649 #REF! #REF! #REF! #REF! #REF! #REF! #REF! #REF! #REF! #REF! #REF! £546 £911
4 30 £3,538,318 £3,485,387 £3,432,456 £3,379,525 £3,326,594 £3,273,663 £3,220,731 £3,167,800 £3,114,869 £3,061,938 £3,009,007 #REF! #REF! #REF! #REF! #REF! #REF! #REF! #REF! #REF! #REF! #REF! £912 £1,277
5 30 £4,456,676 £4,403,745 £4,350,814 £4,297,883 £4,244,952 £4,192,021 £4,139,089 £4,086,158 £4,033,227 £3,980,296 £3,927,365 #REF! #REF! #REF! #REF! #REF! #REF! #REF! #REF! #REF! #REF! #REF! £1,278 £1,643
1 30 £547,016 £444,398 £351,920 £246,258 £140,595 £34,933 -£88,606 -£220,973 -£353,341 -£485,708 -£618,076 £164,105 £133,319 £105,576 £73,877 £42,179 £10,480 -£26,582 -£66,292 -£106,002 -£145,712 -£185,423 -£391 -£242 30 £2,709,328 £2,606,710 £2,504,092 £2,401,474 £2,298,856 £2,196,238 £2,093,620 £1,991,002 £1,888,384 £1,785,767 £1,683,149 £812,798 £782,013 £751,228 £720,442 £689,657 £658,871 £628,086 £597,301 £566,515 £535,730 £504,945 £42 £4093 30 £4,871,639 £4,769,022 £4,666,404 £4,563,786 £4,461,168 £4,358,550 £4,255,932 £4,153,314 £4,050,696 £3,948,078 £3,845,460 £1,461,492 £1,430,706 £1,399,921 £1,369,136 £1,338,350 £1,307,565 £1,276,780 £1,245,994 £1,215,209 £1,184,423 £1,153,638 £475 £8424 30 £6,627,203 £6,524,585 £6,421,967 £6,319,349 £6,216,731 £6,114,114 £6,011,496 £5,908,878 £5,806,260 £5,703,642 £5,601,024 £1,988,161 £1,957,376 £1,926,590 £1,895,805 £1,865,019 £1,834,234 £1,803,449 £1,772,663 £1,741,878 £1,711,093 £1,680,307 £826 £1,1935 30 £8,382,767 £8,280,149 £8,177,531 £8,074,913 £7,972,295 £7,869,677 £7,767,059 £7,664,441 £7,561,823 £7,459,206 £7,356,588 £2,514,830 £2,484,045 £2,453,259 £2,422,474 £2,391,689 £2,360,903 £2,330,118 £2,299,332 £2,268,547 £2,237,762 £2,206,976 £1,178 £1,545
Key: RLV at or below lower assumed greenfield enhancement value (c£200,000/Ha)
RLV between lower and upper assumed greenfield enhancement value (c£200,000/Ha - £750,000/Ha)
RLV at or above upper assumed greenfield enhancement value (c£750,000/Ha)
*based on corresponding benchmark rangeSource: Dixon Searle LLP (September 2011)
Max CIL (£/m²) -
High EUV
Benchmark
Max CIL (£/m²) - Low
EUV Benchmark
Mixed (30%AH)
Development Scenario
Residual Land Value (£/Ha)Residual Land Value (£)
Houses
4
Mixed (Urban - 0%
AH)
Mixed (Rural - 30%
AH)
14Mixed (Rural - 40%
AH)
14
14
25
Houses
1
Mixed (40% AH)100
25 Mixed (40% AH)
50 Mixed (40% AH)
Table 1: Residual Land Value Results by Scheme Type, Value Level & CIL Rate 66% Affordable Rent/34% LCHO - Greenfield Benchmark Comparison - 30 DPH
D|S|P Housing Development Consultants Appendix IIa

Value LevelSite Density
(dph)
Residual Land
Value - £0/m² CIL
Residual Land
Value - £25/m² CIL
Residual Land
Value - £50/m² CIL
Residual Land
Value - £75/m² CIL
Residual Land
Value - £100/m²
CIL
Residual Land
Value - £125/m²
CIL
Residual Land
Value - £150/m²
CIL
Residual Land
Value - £175/m²
CIL
Residual Land
Value - £200/m²
CIL
Residual Land
Value - £225/m²
CIL
Residual Land
Value - £250/m²
CIL
Residual Land
Value - £0/m² CIL
Residual Land
Value - £25/m² CIL
Residual Land
Value - £50/m² CIL
Residual Land
Value - £75/m² CIL
Residual Land
Value - £100/m²
CIL
Residual Land
Value - £125/m²
CIL
Residual Land
Value - £150/m²
CIL
Residual Land
Value - £175/m²
CIL
Residual Land
Value - £200/m²
CIL
Residual Land
Value - £225/m²
CIL
Residual Land
Value - £250/m²
CIL
1 50 -£24,766 -£27,937 -£31,109 -£34,281 -£37,453 -£40,625 -£43,797 -£46,969 -£50,141 -£53,312 -£56,484 -£1,238,279 -£1,396,873 -£1,555,466 -£1,714,060 -£1,872,654 -£2,031,248 -£2,189,841 -£2,348,435 -£2,507,029 -£2,665,623 -£2,824,216 -£438 -£318
2 50 £20,819 £17,988 £15,158 £12,328 £9,497 £6,667 £3,837 £1,007 -£2,044 -£5,216 -£8,387 £1,040,926 £899,413 £757,900 £616,386 £474,873 £333,360 £191,847 £50,334 -£102,185 -£260,779 -£419,373 -£73 £47
3 50 £63,735 £60,905 £58,075 £55,245 £52,414 £49,584 £46,754 £43,924 £41,093 £38,263 £35,433 £3,186,768 £3,045,255 £2,903,742 £2,762,228 £2,620,715 £2,479,202 £2,337,689 £2,196,176 £2,054,662 £1,913,149 £1,771,636 £270 £390
4 50 £106,652 £103,822 £100,992 £98,161 £95,331 £92,501 £89,671 £86,840 £84,010 £81,180 £78,350 £5,332,610 £5,191,097 £5,049,584 £4,908,070 £4,766,557 £4,625,044 £4,483,531 £4,342,018 £4,200,504 £4,058,991 £3,917,478 £613 £733
5 50 £149,569 £146,739 £143,909 £141,078 £138,248 £135,418 £132,587 £129,757 £126,927 £124,097 £121,266 £7,478,452 £7,336,939 £7,195,426 £7,053,913 £6,912,399 £6,770,886 £6,629,373 £6,487,860 £6,346,347 £6,204,833 £6,063,320 £957 £1,077
1 50 £129,755 £122,057 £114,359 £106,660 £98,962 £91,264 £83,565 £75,867 £68,169 £60,470 £52,772 £1,621,940 £1,525,711 £1,429,482 £1,333,253 £1,237,024 £1,140,795 £1,044,566 £948,337 £852,108 £755,879 £659,650 £29 £205
2 50 £246,489 £238,791 £231,092 £223,394 £215,696 £207,997 £200,299 £192,601 £184,902 £177,204 £169,506 £3,081,112 £2,984,884 £2,888,655 £2,792,426 £2,696,197 £2,599,968 £2,503,739 £2,407,510 £2,311,281 £2,215,052 £2,118,823 £372 £548
3 50 £363,223 £355,524 £347,826 £340,128 £332,430 £324,731 £317,033 £309,335 £301,636 £293,938 £286,240 £4,540,285 £4,444,056 £4,347,827 £4,251,598 £4,155,369 £4,059,140 £3,962,911 £3,866,682 £3,770,453 £3,674,224 £3,577,995 £715 £892
4 50 £468,553 £461,038 £453,523 £446,007 £438,492 £441,465 £433,767 £426,068 £418,370 £410,672 £402,973 £5,856,918 £5,762,975 £5,669,032 £5,575,090 £5,481,147 £5,518,313 £5,422,084 £5,325,855 £5,229,626 £5,133,397 £5,037,168 £1,025 £1,202
5 50 £582,514 £574,998 £567,483 £559,968 £552,452 £544,937 £537,421 £529,906 £522,390 £514,875 £507,360 £7,281,422 £7,187,479 £7,093,537 £6,999,594 £6,905,651 £6,811,709 £6,717,766 £6,623,823 £6,529,880 £6,435,938 £6,341,995 £1,360 £1,537
1 50 £409,287 £383,362 £357,437 £331,512 £305,586 £279,661 £253,736 £227,811 £201,885 £175,960 £150,035 £1,461,740 £1,369,150 £1,276,560 £1,183,970 £1,091,380 £998,790 £906,200 £813,609 £721,019 £628,429 £535,839 -£9 £173
2 50 £783,341 £758,032 £732,723 £707,413 £682,104 £656,795 £631,486 £606,176 £580,867 £555,558 £530,249 £2,797,647 £2,707,257 £2,616,867 £2,526,477 £2,436,086 £2,345,696 £2,255,306 £2,164,916 £2,074,525 £1,984,135 £1,893,745 £316 £499
3 50 £1,167,119 £1,141,810 £1,116,501 £1,091,192 £1,065,882 £1,040,573 £1,015,264 £989,955 £964,645 £939,336 £914,027 £4,168,284 £4,077,894 £3,987,503 £3,897,113 £3,806,723 £3,716,333 £3,625,942 £3,535,552 £3,445,162 £3,354,772 £3,264,382 £650 £833
4 50 £1,550,898 £1,525,588 £1,500,279 £1,474,970 £1,449,661 £1,424,351 £1,399,042 £1,373,733 £1,348,424 £1,323,114 £1,297,805 £5,538,920 £5,448,530 £5,358,140 £5,267,750 £5,177,360 £5,086,969 £4,996,579 £4,906,189 £4,815,799 £4,725,408 £4,635,018 £984 £1,167
5 50 £1,934,676 £1,909,367 £1,884,057 £1,858,748 £1,833,439 £1,808,130 £1,782,820 £1,757,511 £1,732,202 £1,706,893 £1,681,583 £6,909,557 £6,819,167 £6,728,777 £6,638,386 £6,547,996 £6,457,606 £6,367,216 £6,276,825 £6,186,435 £6,096,045 £6,005,655 £1,318 £1,501
1 50 £190,350 £172,872 £155,393 £137,914 £120,435 £102,956 £85,478 £67,999 £50,520 £33,041 £15,562 £679,823 £617,399 £554,974 £492,550 £430,126 £367,701 £305,277 £242,853 £180,428 £118,004 £55,580 -£294 -£252 50 £524,539 £507,489 £490,439 £473,389 £456,338 £439,288 £432,854 £415,375 £397,897 £380,418 £362,939 £1,873,353 £1,812,460 £1,751,567 £1,690,673 £1,629,780 £1,568,887 £1,545,908 £1,483,484 £1,421,060 £1,358,635 £1,296,211 £134 £4033 50 £863,396 £846,346 £829,296 £812,246 £795,195 £778,145 £761,095 £744,045 £726,995 £709,945 £692,895 £3,083,557 £3,022,664 £2,961,770 £2,900,877 £2,839,984 £2,779,090 £2,718,197 £2,657,304 £2,596,410 £2,535,517 £2,474,624 £568 £8384 50 £1,153,829 £1,136,779 £1,119,728 £1,102,678 £1,085,628 £1,068,578 £1,051,528 £1,034,478 £1,017,428 £1,000,378 £983,328 £4,120,817 £4,059,924 £3,999,030 £3,938,137 £3,877,244 £3,816,350 £3,755,457 £3,694,564 £3,633,671 £3,572,777 £3,511,884 £941 £1,2105 50 £1,444,262 £1,427,211 £1,410,161 £1,393,111 £1,376,061 £1,359,011 £1,341,961 £1,324,911 £1,307,861 £1,290,810 £1,273,760 £5,158,077 £5,097,184 £5,036,290 £4,975,397 £4,914,504 £4,853,611 £4,792,717 £4,731,824 £4,670,931 £4,610,037 £4,549,144 £1,313 £1,582
1 50 £155,947 £140,260 £124,574 £108,888 £93,202 £77,516 £61,830 £46,144 £30,458 £14,772 -£1,043 £556,952 £500,930 £444,908 £388,886 £332,865 £276,843 £220,821 £164,799 £108,777 £52,756 -£3,726 -£376 -£772 50 £483,657 £468,355 £453,054 £437,752 £433,073 £417,386 £401,700 £386,014 £370,328 £354,642 £338,956 £1,727,345 £1,672,697 £1,618,049 £1,563,402 £1,546,688 £1,490,666 £1,434,644 £1,378,622 £1,322,600 £1,266,579 £1,210,557 £91 £3893 50 £815,191 £799,890 £784,589 £769,287 £753,986 £738,684 £723,383 £708,082 £692,780 £677,479 £662,177 £2,911,398 £2,856,750 £2,802,102 £2,747,454 £2,692,807 £2,638,159 £2,583,511 £2,528,863 £2,474,215 £2,419,567 £2,364,920 £562 £8614 50 £1,096,241 £1,080,940 £1,065,639 £1,050,337 £1,035,036 £1,019,734 £1,004,433 £989,132 £973,830 £958,529 £943,228 £3,915,148 £3,860,500 £3,805,852 £3,751,204 £3,696,557 £3,641,909 £3,587,261 £3,532,613 £3,477,965 £3,423,317 £3,368,670 £962 £1,2615 50 £1,377,291 £1,361,990 £1,346,689 £1,331,387 £1,316,086 £1,300,784 £1,285,483 £1,270,182 £1,254,880 £1,239,579 £1,224,278 £4,918,898 £4,864,250 £4,809,602 £4,754,954 £4,700,307 £4,645,659 £4,591,011 £4,536,363 £4,481,715 £4,427,068 £4,372,420 £1,362 £1,660
1 50 £353,531 £320,831 £288,131 £255,431 £222,731 £190,031 £157,331 £124,631 £91,931 £59,232 £26,532 £707,062 £641,662 £576,262 £510,863 £445,463 £380,063 £314,663 £249,263 £183,863 £118,463 £53,063 -£269 -£152 50 £952,264 £920,392 £888,521 £856,649 £824,777 £792,905 £761,033 £729,161 £697,289 £665,417 £633,545 £1,904,529 £1,840,785 £1,777,041 £1,713,297 £1,649,553 £1,585,809 £1,522,065 £1,458,321 £1,394,577 £1,330,834 £1,267,090 £137 £3913 50 £1,559,950 £1,528,078 £1,496,206 £1,464,334 £1,432,462 £1,400,590 £1,368,718 £1,336,846 £1,304,974 £1,273,102 £1,241,230 £3,119,899 £3,056,155 £2,992,411 £2,928,667 £2,864,923 £2,801,179 £2,737,435 £2,673,691 £2,609,948 £2,546,204 £2,482,460 £549 £8034 50 £2,085,759 £2,053,887 £2,022,015 £1,990,143 £1,958,272 £1,926,400 £1,894,528 £1,862,656 £1,830,784 £1,798,912 £1,767,040 £4,171,519 £4,107,775 £4,044,031 £3,980,287 £3,916,543 £3,852,799 £3,789,055 £3,725,311 £3,661,567 £3,597,823 £3,534,079 £906 £1,1605 50 £2,611,569 £2,579,697 £2,547,825 £2,515,953 £2,484,081 £2,452,209 £2,420,337 £2,388,466 £2,356,594 £2,324,722 £2,292,850 £5,223,139 £5,159,395 £5,095,651 £5,031,907 £4,968,163 £4,904,419 £4,840,675 £4,776,931 £4,713,187 £4,649,443 £4,585,699 £1,262 £1,516
1 50 £219,835 £192,788 £165,741 £138,695 £111,648 £84,601 £57,554 £30,508 £3,461 -£27,395 -£58,810 £439,670 £385,576 £331,483 £277,389 £223,296 £169,202 £115,109 £61,015 £6,922 -£54,790 -£117,620 -£439 -£1282 50 £798,999 £772,637 £746,275 £719,913 £693,551 £667,189 £640,827 £614,465 £588,103 £561,741 £535,380 £1,597,997 £1,545,273 £1,492,549 £1,439,826 £1,387,102 £1,334,378 £1,281,654 £1,228,930 £1,176,207 £1,123,483 £1,070,759 £41 £3513 50 £1,383,729 £1,357,367 £1,331,005 £1,304,643 £1,278,281 £1,251,919 £1,225,557 £1,199,195 £1,172,833 £1,146,472 £1,120,110 £2,767,457 £2,714,733 £2,662,010 £2,609,286 £2,556,562 £2,503,838 £2,451,114 £2,398,391 £2,345,667 £2,292,943 £2,240,219 £525 £8354 50 £1,856,259 £1,829,898 £1,803,536 £1,777,174 £1,750,812 £1,724,450 £1,698,088 £1,671,726 £1,645,364 £1,619,002 £1,592,640 £3,712,519 £3,659,795 £3,607,071 £3,554,347 £3,501,624 £3,448,900 £3,396,176 £3,343,452 £3,290,728 £3,238,005 £3,185,281 £916 £1,2265 50 £2,328,790 £2,302,428 £2,276,066 £2,249,705 £2,223,343 £2,196,981 £2,170,619 £2,144,257 £2,117,895 £2,091,533 £2,065,171 £4,657,580 £4,604,857 £4,552,133 £4,499,409 £4,446,685 £4,393,961 £4,341,238 £4,288,514 £4,235,790 £4,183,066 £4,130,343 £1,307 £1,617
1 50 £377,490 £323,090 £268,690 £214,290 £159,890 £105,490 £51,090 -£3,989 -£69,563 -£135,137 -£200,711 #REF! #REF! #REF! #REF! #REF! #REF! #REF! #REF! #REF! #REF! #REF! -£447 -£148
2 50 £1,493,629 £1,440,698 £1,387,767 £1,334,836 £1,281,904 £1,228,973 £1,176,042 £1,123,111 £1,070,180 £1,017,249 £964,318 #REF! #REF! #REF! #REF! #REF! #REF! #REF! #REF! #REF! #REF! #REF! -£3 £296
3 50 £2,619,960 £2,567,029 £2,514,098 £2,461,167 £2,408,236 £2,355,305 £2,302,373 £2,249,442 £2,196,511 £2,143,580 £2,090,649 #REF! #REF! #REF! #REF! #REF! #REF! #REF! #REF! #REF! #REF! #REF! £446 £745
4 50 £3,538,318 £3,485,387 £3,432,456 £3,379,525 £3,326,594 £3,273,663 £3,220,731 £3,167,800 £3,114,869 £3,061,938 £3,009,007 #REF! #REF! #REF! #REF! #REF! #REF! #REF! #REF! #REF! #REF! #REF! £812 £1,111
5 50 £4,456,676 £4,403,745 £4,350,814 £4,297,883 £4,244,952 £4,192,021 £4,139,089 £4,086,158 £4,033,227 £3,980,296 £3,927,365 #REF! #REF! #REF! #REF! #REF! #REF! #REF! #REF! #REF! #REF! #REF! £1,178 £1,477
1 50 £547,016 £444,398 £351,920 £246,258 £140,595 £34,933 -£88,606 -£220,973 -£353,341 -£485,708 -£618,076 £273,508 £222,199 £175,960 £123,129 £70,298 £17,466 -£44,303 -£110,487 -£176,670 -£242,854 -£309,038 -£491 -£1912 50 £2,709,328 £2,606,710 £2,504,092 £2,401,474 £2,298,856 £2,196,238 £2,093,620 £1,991,002 £1,888,384 £1,785,767 £1,683,149 £1,354,664 £1,303,355 £1,252,046 £1,200,737 £1,149,428 £1,098,119 £1,046,810 £995,501 £944,192 £892,883 £841,574 -£58 £2423 50 £4,871,639 £4,769,022 £4,666,404 £4,563,786 £4,461,168 £4,358,550 £4,255,932 £4,153,314 £4,050,696 £3,948,078 £3,845,460 £2,435,820 £2,384,511 £2,333,202 £2,281,893 £2,230,584 £2,179,275 £2,127,966 £2,076,657 £2,025,348 £1,974,039 £1,922,730 £375 £6754 50 £6,627,203 £6,524,585 £6,421,967 £6,319,349 £6,216,731 £6,114,114 £6,011,496 £5,908,878 £5,806,260 £5,703,642 £5,601,024 £3,313,602 £3,262,293 £3,210,984 £3,159,675 £3,108,366 £3,057,057 £3,005,748 £2,954,439 £2,903,130 £2,851,821 £2,800,512 £726 £1,0265 50 £8,382,767 £8,280,149 £8,177,531 £8,074,913 £7,972,295 £7,869,677 £7,767,059 £7,664,441 £7,561,823 £7,459,206 £7,356,588 £4,191,383 £4,140,074 £4,088,765 £4,037,456 £3,986,148 £3,934,839 £3,883,530 £3,832,221 £3,780,912 £3,729,603 £3,678,294 £1,078 £1,378
Key: RLV at or below lower assumed PDL non-residential value (c£750,000/Ha)
RLV between lower and upper assumed PDL non-residential value (c£750,000/Ha - £1,500,000/Ha)
RLV at or above upper assumed PDL non-residential value (c£1,500,000/Ha)
*based on corresponding benchmark rangeSource: Dixon Searle LLP (September 2011)
25 Mixed (40% AH)
100 Mixed (40% AH)
50 Mixed (40% AH)
14Mixed (Rural - 30%
AH)
14Mixed (Rural - 40%
AH)
25 Mixed (30%AH)
1 Houses
4 Houses
14Mixed (Urban - 0%
AH)
Max CIL (£/m²) -
High EUV
Benchmark
Max CIL (£/m²) - Low
EUV Benchmark
Residual Land Value (£) Residual Land Value (£/Ha)
Development Scenario
Table 2a: Residual Land Value Results by Scheme Type, Value Level & CIL Rate 66% Affordable Rent/34% LCHO - PDL Non-Residential Benchmark Comparison - 50 DPH
D|S|P Housing Development Consultants Appendix IIa

Value LevelSite Density
(dph)
Residual Land
Value - £0/m² CIL
Residual Land
Value - £25/m² CIL
Residual Land
Value - £50/m² CIL
Residual Land
Value - £75/m² CIL
Residual Land
Value - £100/m²
CIL
Residual Land
Value - £125/m²
CIL
Residual Land
Value - £150/m²
CIL
Residual Land
Value - £175/m²
CIL
Residual Land
Value - £200/m²
CIL
Residual Land
Value - £225/m²
CIL
Residual Land
Value - £250/m²
CIL
Residual Land
Value - £0/m² CIL
Residual Land
Value - £25/m² CIL
Residual Land
Value - £50/m² CIL
Residual Land
Value - £75/m² CIL
Residual Land
Value - £100/m²
CIL
Residual Land
Value - £125/m²
CIL
Residual Land
Value - £150/m²
CIL
Residual Land
Value - £175/m²
CIL
Residual Land
Value - £200/m²
CIL
Residual Land
Value - £225/m²
CIL
Residual Land
Value - £250/m²
CIL
1 30 -£24,766 -£27,937 -£31,109 -£34,281 -£37,453 -£40,625 -£43,797 -£46,969 -£50,141 -£53,312 -£56,484 -£742,967 -£838,124 -£933,280 -£1,028,436 -£1,123,592 -£1,218,749 -£1,313,905 -£1,409,061 -£1,504,217 -£1,599,374 -£1,694,530 -£598 -£398
2 30 £20,819 £17,988 £15,158 £12,328 £9,497 £6,667 £3,837 £1,007 -£2,044 -£5,216 -£8,387 £624,556 £539,648 £454,740 £369,832 £284,924 £200,016 £115,108 £30,200 -£61,311 -£156,467 -£251,624 -£233 -£33
3 30 £63,735 £60,905 £58,075 £55,245 £52,414 £49,584 £46,754 £43,924 £41,093 £38,263 £35,433 £1,912,061 £1,827,153 £1,742,245 £1,657,337 £1,572,429 £1,487,521 £1,402,613 £1,317,705 £1,232,797 £1,147,890 £1,062,982 £110 £310
4 30 £106,652 £103,822 £100,992 £98,161 £95,331 £92,501 £89,671 £86,840 £84,010 £81,180 £78,350 £3,199,566 £3,114,658 £3,029,750 £2,944,842 £2,859,934 £2,775,026 £2,690,119 £2,605,211 £2,520,303 £2,435,395 £2,350,487 £453 £653
5 30 £149,569 £146,739 £143,909 £141,078 £138,248 £135,418 £132,587 £129,757 £126,927 £124,097 £121,266 £4,487,071 £4,402,163 £4,317,255 £4,232,348 £4,147,440 £4,062,532 £3,977,624 £3,892,716 £3,807,808 £3,722,900 £3,637,992 £797 £997
1 30 £129,755 £122,057 £114,359 £106,660 £98,962 £91,264 £83,565 £75,867 £68,169 £60,470 £52,772 £973,164 £915,427 £857,689 £799,952 £742,214 £684,477 £626,740 £569,002 £511,265 £453,527 £395,790 -£207 £88
2 30 £246,489 £238,791 £231,092 £223,394 £215,696 £207,997 £200,299 £192,601 £184,902 £177,204 £169,506 £1,848,667 £1,790,930 £1,733,193 £1,675,455 £1,617,718 £1,559,981 £1,502,243 £1,444,506 £1,386,768 £1,329,031 £1,271,294 £137 £431
3 30 £363,223 £355,524 £347,826 £340,128 £332,430 £324,731 £317,033 £309,335 £301,636 £293,938 £286,240 £2,724,171 £2,666,434 £2,608,696 £2,550,959 £2,493,222 £2,435,484 £2,377,747 £2,320,009 £2,262,272 £2,204,535 £2,146,797 £480 £774
4 30 £468,553 £461,038 £453,523 £446,007 £438,492 £441,465 £433,767 £426,068 £418,370 £410,672 £402,973 £3,514,151 £3,457,785 £3,401,419 £3,345,054 £3,288,688 £3,310,988 £3,253,250 £3,195,513 £3,137,776 £3,080,038 £3,022,301 £790 £1,084
5 30 £582,514 £574,998 £567,483 £559,968 £552,452 £544,937 £537,421 £529,906 £522,390 £514,875 £507,360 £4,368,853 £4,312,488 £4,256,122 £4,199,756 £4,143,391 £4,087,025 £4,030,660 £3,974,294 £3,917,928 £3,861,563 £3,805,197 £1,125 £1,419
1 30 £409,287 £383,362 £357,437 £331,512 £305,586 £279,661 £253,736 £227,811 £201,885 £175,960 £150,035 £877,044 £821,490 £765,936 £710,382 £654,828 £599,274 £543,720 £488,166 £432,612 £377,058 £321,504 -£253 £52
2 30 £783,341 £758,032 £732,723 £707,413 £682,104 £656,795 £631,486 £606,176 £580,867 £555,558 £530,249 £1,678,588 £1,624,354 £1,570,120 £1,515,886 £1,461,652 £1,407,418 £1,353,184 £1,298,949 £1,244,715 £1,190,481 £1,136,247 £73 £377
3 30 £1,167,119 £1,141,810 £1,116,501 £1,091,192 £1,065,882 £1,040,573 £1,015,264 £989,955 £964,645 £939,336 £914,027 £2,500,970 £2,446,736 £2,392,502 £2,338,268 £2,284,034 £2,229,800 £2,175,565 £2,121,331 £2,067,097 £2,012,863 £1,958,629 £407 £711
4 30 £1,550,898 £1,525,588 £1,500,279 £1,474,970 £1,449,661 £1,424,351 £1,399,042 £1,373,733 £1,348,424 £1,323,114 £1,297,805 £3,323,352 £3,269,118 £3,214,884 £3,160,650 £3,106,416 £3,052,182 £2,997,947 £2,943,713 £2,889,479 £2,835,245 £2,781,011 £741 £1,045
5 30 £1,934,676 £1,909,367 £1,884,057 £1,858,748 £1,833,439 £1,808,130 £1,782,820 £1,757,511 £1,732,202 £1,706,893 £1,681,583 £4,145,734 £4,091,500 £4,037,266 £3,983,032 £3,928,798 £3,874,564 £3,820,329 £3,766,095 £3,711,861 £3,657,627 £3,603,393 £1,075 £1,379
1 30 £190,350 £172,872 £155,393 £137,914 £120,435 £102,956 £85,478 £67,999 £50,520 £33,041 £15,562 £407,894 £370,439 £332,985 £295,530 £258,075 £220,621 £183,166 £145,712 £108,257 £70,802 £33,348 -£653 -£2052 30 £524,539 £507,489 £490,439 £473,389 £456,338 £439,288 £432,854 £415,375 £397,897 £380,418 £362,939 £1,124,012 £1,087,476 £1,050,940 £1,014,404 £977,868 £941,332 £927,545 £890,090 £852,636 £815,181 £777,727 -£225 £2243 30 £863,396 £846,346 £829,296 £812,246 £795,195 £778,145 £761,095 £744,045 £726,995 £709,945 £692,895 £1,850,134 £1,813,598 £1,777,062 £1,740,526 £1,703,990 £1,667,454 £1,630,918 £1,594,382 £1,557,846 £1,521,310 £1,484,774 £209 £6584 30 £1,153,829 £1,136,779 £1,119,728 £1,102,678 £1,085,628 £1,068,578 £1,051,528 £1,034,478 £1,017,428 £1,000,378 £983,328 £2,472,490 £2,435,954 £2,399,418 £2,362,882 £2,326,346 £2,289,810 £2,253,274 £2,216,738 £2,180,202 £2,143,666 £2,107,130 £582 £1,0315 30 £1,444,262 £1,427,211 £1,410,161 £1,393,111 £1,376,061 £1,359,011 £1,341,961 £1,324,911 £1,307,861 £1,290,810 £1,273,760 £3,094,846 £3,058,310 £3,021,774 £2,985,238 £2,948,702 £2,912,166 £2,875,630 £2,839,094 £2,802,558 £2,766,022 £2,729,486 £954 £1,403
1 30 £155,947 £140,260 £124,574 £108,888 £93,202 £77,516 £61,830 £46,144 £30,458 £14,772 -£1,043 £334,171 £300,558 £266,945 £233,332 £199,719 £166,106 £132,493 £98,880 £65,266 £31,653 -£2,236 -£774 -£2762 30 £483,657 £468,355 £453,054 £437,752 £433,073 £417,386 £401,700 £386,014 £370,328 £354,642 £338,956 £1,036,407 £1,003,618 £970,830 £938,041 £928,013 £894,399 £860,786 £827,173 £793,560 £759,947 £726,334 -£308 £1903 30 £815,191 £799,890 £784,589 £769,287 £753,986 £738,684 £723,383 £708,082 £692,780 £677,479 £662,177 £1,746,839 £1,714,050 £1,681,261 £1,648,473 £1,615,684 £1,582,895 £1,550,107 £1,517,318 £1,484,529 £1,451,740 £1,418,952 £164 £6624 30 £1,096,241 £1,080,940 £1,065,639 £1,050,337 £1,035,036 £1,019,734 £1,004,433 £989,132 £973,830 £958,529 £943,228 £2,349,089 £2,316,300 £2,283,511 £2,250,723 £2,217,934 £2,185,145 £2,152,357 £2,119,568 £2,086,779 £2,053,990 £2,021,202 £564 £1,0625 30 £1,377,291 £1,361,990 £1,346,689 £1,331,387 £1,316,086 £1,300,784 £1,285,483 £1,270,182 £1,254,880 £1,239,579 £1,224,278 £2,951,339 £2,918,550 £2,885,761 £2,852,973 £2,820,184 £2,787,395 £2,754,607 £2,721,818 £2,689,029 £2,656,241 £2,623,452 £963 £1,461
1 30 £353,531 £320,831 £288,131 £255,431 £222,731 £190,031 £157,331 £124,631 £91,931 £59,232 £26,532 £424,237 £384,997 £345,757 £306,518 £267,278 £228,038 £188,798 £149,558 £110,318 £71,078 £31,838 -£608 -£1842 30 £952,264 £920,392 £888,521 £856,649 £824,777 £792,905 £761,033 £729,161 £697,289 £665,417 £633,545 £1,142,717 £1,104,471 £1,066,225 £1,027,978 £989,732 £951,486 £913,239 £874,993 £836,746 £798,500 £760,254 -£202 £2223 30 £1,559,950 £1,528,078 £1,496,206 £1,464,334 £1,432,462 £1,400,590 £1,368,718 £1,336,846 £1,304,974 £1,273,102 £1,241,230 £1,871,939 £1,833,693 £1,795,447 £1,757,200 £1,718,954 £1,680,708 £1,642,461 £1,604,215 £1,565,969 £1,527,722 £1,489,476 £210 £6344 30 £2,085,759 £2,053,887 £2,022,015 £1,990,143 £1,958,272 £1,926,400 £1,894,528 £1,862,656 £1,830,784 £1,798,912 £1,767,040 £2,502,911 £2,464,665 £2,426,419 £2,388,172 £2,349,926 £2,311,679 £2,273,433 £2,235,187 £2,196,940 £2,158,694 £2,120,448 £567 £9905 30 £2,611,569 £2,579,697 £2,547,825 £2,515,953 £2,484,081 £2,452,209 £2,420,337 £2,388,466 £2,356,594 £2,324,722 £2,292,850 £3,133,883 £3,095,637 £3,057,390 £3,019,144 £2,980,898 £2,942,651 £2,904,405 £2,866,159 £2,827,912 £2,789,666 £2,751,420 £923 £1,347
1 30 £219,835 £192,788 £165,741 £138,695 £111,648 £84,601 £57,554 £30,508 £3,461 -£27,395 -£58,810 £263,802 £231,346 £198,890 £166,434 £133,977 £101,521 £69,065 £36,609 £4,153 -£32,874 -£70,572 -£853 -£3352 30 £798,999 £772,637 £746,275 £719,913 £693,551 £667,189 £640,827 £614,465 £588,103 £561,741 £535,380 £958,798 £927,164 £895,530 £863,895 £832,261 £800,627 £768,993 £737,358 £705,724 £674,090 £642,455 -£373 £1443 30 £1,383,729 £1,357,367 £1,331,005 £1,304,643 £1,278,281 £1,251,919 £1,225,557 £1,199,195 £1,172,833 £1,146,472 £1,120,110 £1,660,474 £1,628,840 £1,597,206 £1,565,572 £1,533,937 £1,502,303 £1,470,669 £1,439,034 £1,407,400 £1,375,766 £1,344,132 £111 £6284 30 £1,856,259 £1,829,898 £1,803,536 £1,777,174 £1,750,812 £1,724,450 £1,698,088 £1,671,726 £1,645,364 £1,619,002 £1,592,640 £2,227,511 £2,195,877 £2,164,243 £2,132,608 £2,100,974 £2,069,340 £2,037,706 £2,006,071 £1,974,437 £1,942,803 £1,911,169 £502 £1,0195 30 £2,328,790 £2,302,428 £2,276,066 £2,249,705 £2,223,343 £2,196,981 £2,170,619 £2,144,257 £2,117,895 £2,091,533 £2,065,171 £2,794,548 £2,762,914 £2,731,280 £2,699,645 £2,668,011 £2,636,377 £2,604,743 £2,573,108 £2,541,474 £2,509,840 £2,478,206 £893 £1,410
1 30 £377,490 £323,090 £268,690 £214,290 £159,890 £105,490 £51,090 -£3,989 -£69,563 -£135,137 -£200,711 #REF! #REF! #REF! #REF! #REF! #REF! #REF! #REF! #REF! #REF! #REF! -£846 -£348
2 30 £1,493,629 £1,440,698 £1,387,767 £1,334,836 £1,281,904 £1,228,973 £1,176,042 £1,123,111 £1,070,180 £1,017,249 £964,318 #REF! #REF! #REF! #REF! #REF! #REF! #REF! #REF! #REF! #REF! #REF! -£401 £97
3 30 £2,619,960 £2,567,029 £2,514,098 £2,461,167 £2,408,236 £2,355,305 £2,302,373 £2,249,442 £2,196,511 £2,143,580 £2,090,649 #REF! #REF! #REF! #REF! #REF! #REF! #REF! #REF! #REF! #REF! #REF! £48 £546
4 30 £3,538,318 £3,485,387 £3,432,456 £3,379,525 £3,326,594 £3,273,663 £3,220,731 £3,167,800 £3,114,869 £3,061,938 £3,009,007 #REF! #REF! #REF! #REF! #REF! #REF! #REF! #REF! #REF! #REF! #REF! £414 £912
5 30 £4,456,676 £4,403,745 £4,350,814 £4,297,883 £4,244,952 £4,192,021 £4,139,089 £4,086,158 £4,033,227 £3,980,296 £3,927,365 #REF! #REF! #REF! #REF! #REF! #REF! #REF! #REF! #REF! #REF! #REF! £780 £1,278
1 30 £547,016 £444,398 £351,920 £246,258 £140,595 £34,933 -£88,606 -£220,973 -£353,341 -£485,708 -£618,076 £164,105 £133,319 £105,576 £73,877 £42,179 £10,480 -£26,582 -£66,292 -£106,002 -£145,712 -£185,423 -£891 -£3912 30 £2,709,328 £2,606,710 £2,504,092 £2,401,474 £2,298,856 £2,196,238 £2,093,620 £1,991,002 £1,888,384 £1,785,767 £1,683,149 £812,798 £782,013 £751,228 £720,442 £689,657 £658,871 £628,086 £597,301 £566,515 £535,730 £504,945 -£459 £423 30 £4,871,639 £4,769,022 £4,666,404 £4,563,786 £4,461,168 £4,358,550 £4,255,932 £4,153,314 £4,050,696 £3,948,078 £3,845,460 £1,461,492 £1,430,706 £1,399,921 £1,369,136 £1,338,350 £1,307,565 £1,276,780 £1,245,994 £1,215,209 £1,184,423 £1,153,638 -£26 £4754 30 £6,627,203 £6,524,585 £6,421,967 £6,319,349 £6,216,731 £6,114,114 £6,011,496 £5,908,878 £5,806,260 £5,703,642 £5,601,024 £1,988,161 £1,957,376 £1,926,590 £1,895,805 £1,865,019 £1,834,234 £1,803,449 £1,772,663 £1,741,878 £1,711,093 £1,680,307 £326 £8265 30 £8,382,767 £8,280,149 £8,177,531 £8,074,913 £7,972,295 £7,869,677 £7,767,059 £7,664,441 £7,561,823 £7,459,206 £7,356,588 £2,514,830 £2,484,045 £2,453,259 £2,422,474 £2,391,689 £2,360,903 £2,330,118 £2,299,332 £2,268,547 £2,237,762 £2,206,976 £677 £1,178
Key: RLV at or below lower assumed PDL non-residential value (c£750,000/Ha)
RLV between lower and upper assumed PDL non-residential value (c£750,000/Ha - £1,500,000/Ha)
RLV at or above upper assumed PDL non-residential value (c£1,500,000/Ha)
*based on corresponding benchmark rangeSource: Dixon Searle LLP (September 2011)
100 Mixed (40% AH)
Max CIL (£/m²) -
High EUV
Benchmark
Max CIL (£/m²) - Low
EUV Benchmark
50 Mixed (40% AH)
14Mixed (Rural - 40%
AH)
25 Mixed (30%AH)
25 Mixed (40% AH)
4 Houses
14Mixed (Urban - 0%
AH)
14Mixed (Rural - 30%
AH)
Residual Land Value (£) Residual Land Value (£/Ha)
Development Scenario
1 Houses
Table 2b: Residual Land Value Results by Scheme Type, Value Level & CIL Rate 66% Affordable Rent/34% LCHO - PDL Non-Residential Benchmark Comparison - 30 DPH
D|S|P Housing Development Consultants Appendix IIa

Value LevelSite Density
(dph)
Residual Land
Value - £0/m² CIL
Residual Land
Value - £25/m² CIL
Residual Land
Value - £50/m² CIL
Residual Land
Value - £75/m² CIL
Residual Land
Value - £100/m²
CIL
Residual Land
Value - £125/m²
CIL
Residual Land
Value - £150/m²
CIL
Residual Land
Value - £175/m²
CIL
Residual Land
Value - £200/m²
CIL
Residual Land
Value - £225/m²
CIL
Residual Land
Value - £250/m²
CIL
Residual Land
Value - £0/m² CIL
Residual Land
Value - £25/m² CIL
Residual Land
Value - £50/m² CIL
Residual Land
Value - £75/m² CIL
Residual Land
Value - £100/m²
CIL
Residual Land
Value - £125/m²
CIL
Residual Land
Value - £150/m²
CIL
Residual Land
Value - £175/m²
CIL
Residual Land
Value - £200/m²
CIL
Residual Land
Value - £225/m²
CIL
Residual Land
Value - £250/m²
CIL
1 50 -£24,766 -£27,937 -£31,109 -£34,281 -£37,453 -£40,625 -£43,797 -£46,969 -£50,141 -£53,312 -£56,484 -£1,238,279 -£1,396,873 -£1,555,466 -£1,714,060 -£1,872,654 -£2,031,248 -£2,189,841 -£2,348,435 -£2,507,029 -£2,665,623 -£2,824,216 -£678 -£438
2 50 £20,819 £17,988 £15,158 £12,328 £9,497 £6,667 £3,837 £1,007 -£2,044 -£5,216 -£8,387 £1,040,926 £899,413 £757,900 £616,386 £474,873 £333,360 £191,847 £50,334 -£102,185 -£260,779 -£419,373 -£313 -£73
3 50 £63,735 £60,905 £58,075 £55,245 £52,414 £49,584 £46,754 £43,924 £41,093 £38,263 £35,433 £3,186,768 £3,045,255 £2,903,742 £2,762,228 £2,620,715 £2,479,202 £2,337,689 £2,196,176 £2,054,662 £1,913,149 £1,771,636 £30 £270
4 50 £106,652 £103,822 £100,992 £98,161 £95,331 £92,501 £89,671 £86,840 £84,010 £81,180 £78,350 £5,332,610 £5,191,097 £5,049,584 £4,908,070 £4,766,557 £4,625,044 £4,483,531 £4,342,018 £4,200,504 £4,058,991 £3,917,478 £373 £613
5 50 £149,569 £146,739 £143,909 £141,078 £138,248 £135,418 £132,587 £129,757 £126,927 £124,097 £121,266 £7,478,452 £7,336,939 £7,195,426 £7,053,913 £6,912,399 £6,770,886 £6,629,373 £6,487,860 £6,346,347 £6,204,833 £6,063,320 £717 £957
1 50 £129,755 £122,057 £114,359 £106,660 £98,962 £91,264 £83,565 £75,867 £68,169 £60,470 £52,772 £1,621,940 £1,525,711 £1,429,482 £1,333,253 £1,237,024 £1,140,795 £1,044,566 £948,337 £852,108 £755,879 £659,650 -£324 £29
2 50 £246,489 £238,791 £231,092 £223,394 £215,696 £207,997 £200,299 £192,601 £184,902 £177,204 £169,506 £3,081,112 £2,984,884 £2,888,655 £2,792,426 £2,696,197 £2,599,968 £2,503,739 £2,407,510 £2,311,281 £2,215,052 £2,118,823 £19 £372
3 50 £363,223 £355,524 £347,826 £340,128 £332,430 £324,731 £317,033 £309,335 £301,636 £293,938 £286,240 £4,540,285 £4,444,056 £4,347,827 £4,251,598 £4,155,369 £4,059,140 £3,962,911 £3,866,682 £3,770,453 £3,674,224 £3,577,995 £362 £715
4 50 £468,553 £461,038 £453,523 £446,007 £438,492 £441,465 £433,767 £426,068 £418,370 £410,672 £402,973 £5,856,918 £5,762,975 £5,669,032 £5,575,090 £5,481,147 £5,518,313 £5,422,084 £5,325,855 £5,229,626 £5,133,397 £5,037,168 £672 £1,025
5 50 £582,514 £574,998 £567,483 £559,968 £552,452 £544,937 £537,421 £529,906 £522,390 £514,875 £507,360 £7,281,422 £7,187,479 £7,093,537 £6,999,594 £6,905,651 £6,811,709 £6,717,766 £6,623,823 £6,529,880 £6,435,938 £6,341,995 £1,007 £1,360
1 50 £409,287 £383,362 £357,437 £331,512 £305,586 £279,661 £253,736 £227,811 £201,885 £175,960 £150,035 £1,461,740 £1,369,150 £1,276,560 £1,183,970 £1,091,380 £998,790 £906,200 £813,609 £721,019 £628,429 £535,839 -£375 -£9
2 50 £783,341 £758,032 £732,723 £707,413 £682,104 £656,795 £631,486 £606,176 £580,867 £555,558 £530,249 £2,797,647 £2,707,257 £2,616,867 £2,526,477 £2,436,086 £2,345,696 £2,255,306 £2,164,916 £2,074,525 £1,984,135 £1,893,745 -£49 £316
3 50 £1,167,119 £1,141,810 £1,116,501 £1,091,192 £1,065,882 £1,040,573 £1,015,264 £989,955 £964,645 £939,336 £914,027 £4,168,284 £4,077,894 £3,987,503 £3,897,113 £3,806,723 £3,716,333 £3,625,942 £3,535,552 £3,445,162 £3,354,772 £3,264,382 £285 £650
4 50 £1,550,898 £1,525,588 £1,500,279 £1,474,970 £1,449,661 £1,424,351 £1,399,042 £1,373,733 £1,348,424 £1,323,114 £1,297,805 £5,538,920 £5,448,530 £5,358,140 £5,267,750 £5,177,360 £5,086,969 £4,996,579 £4,906,189 £4,815,799 £4,725,408 £4,635,018 £619 £984
5 50 £1,934,676 £1,909,367 £1,884,057 £1,858,748 £1,833,439 £1,808,130 £1,782,820 £1,757,511 £1,732,202 £1,706,893 £1,681,583 £6,909,557 £6,819,167 £6,728,777 £6,638,386 £6,547,996 £6,457,606 £6,367,216 £6,276,825 £6,186,435 £6,096,045 £6,005,655 £953 £1,318
1 50 £190,350 £172,872 £155,393 £137,914 £120,435 £102,956 £85,478 £67,999 £50,520 £33,041 £15,562 £679,823 £617,399 £554,974 £492,550 £430,126 £367,701 £305,277 £242,853 £180,428 £118,004 £55,580 -£833 -£2942 50 £524,539 £507,489 £490,439 £473,389 £456,338 £439,288 £432,854 £415,375 £397,897 £380,418 £362,939 £1,873,353 £1,812,460 £1,751,567 £1,690,673 £1,629,780 £1,568,887 £1,545,908 £1,483,484 £1,421,060 £1,358,635 £1,296,211 -£404 £1343 50 £863,396 £846,346 £829,296 £812,246 £795,195 £778,145 £761,095 £744,045 £726,995 £709,945 £692,895 £3,083,557 £3,022,664 £2,961,770 £2,900,877 £2,839,984 £2,779,090 £2,718,197 £2,657,304 £2,596,410 £2,535,517 £2,474,624 £30 £5684 50 £1,153,829 £1,136,779 £1,119,728 £1,102,678 £1,085,628 £1,068,578 £1,051,528 £1,034,478 £1,017,428 £1,000,378 £983,328 £4,120,817 £4,059,924 £3,999,030 £3,938,137 £3,877,244 £3,816,350 £3,755,457 £3,694,564 £3,633,671 £3,572,777 £3,511,884 £402 £9415 50 £1,444,262 £1,427,211 £1,410,161 £1,393,111 £1,376,061 £1,359,011 £1,341,961 £1,324,911 £1,307,861 £1,290,810 £1,273,760 £5,158,077 £5,097,184 £5,036,290 £4,975,397 £4,914,504 £4,853,611 £4,792,717 £4,731,824 £4,670,931 £4,610,037 £4,549,144 £775 £1,313
1 50 £155,947 £140,260 £124,574 £108,888 £93,202 £77,516 £61,830 £46,144 £30,458 £14,772 -£1,043 £556,952 £500,930 £444,908 £388,886 £332,865 £276,843 £220,821 £164,799 £108,777 £52,756 -£3,726 -£973 -£3762 50 £483,657 £468,355 £453,054 £437,752 £433,073 £417,386 £401,700 £386,014 £370,328 £354,642 £338,956 £1,727,345 £1,672,697 £1,618,049 £1,563,402 £1,546,688 £1,490,666 £1,434,644 £1,378,622 £1,322,600 £1,266,579 £1,210,557 -£507 £913 50 £815,191 £799,890 £784,589 £769,287 £753,986 £738,684 £723,383 £708,082 £692,780 £677,479 £662,177 £2,911,398 £2,856,750 £2,802,102 £2,747,454 £2,692,807 £2,638,159 £2,583,511 £2,528,863 £2,474,215 £2,419,567 £2,364,920 -£35 £5624 50 £1,096,241 £1,080,940 £1,065,639 £1,050,337 £1,035,036 £1,019,734 £1,004,433 £989,132 £973,830 £958,529 £943,228 £3,915,148 £3,860,500 £3,805,852 £3,751,204 £3,696,557 £3,641,909 £3,587,261 £3,532,613 £3,477,965 £3,423,317 £3,368,670 £364 £9625 50 £1,377,291 £1,361,990 £1,346,689 £1,331,387 £1,316,086 £1,300,784 £1,285,483 £1,270,182 £1,254,880 £1,239,579 £1,224,278 £4,918,898 £4,864,250 £4,809,602 £4,754,954 £4,700,307 £4,645,659 £4,591,011 £4,536,363 £4,481,715 £4,427,068 £4,372,420 £764 £1,362
1 50 £353,531 £320,831 £288,131 £255,431 £222,731 £190,031 £157,331 £124,631 £91,931 £59,232 £26,532 £707,062 £641,662 £576,262 £510,863 £445,463 £380,063 £314,663 £249,263 £183,863 £118,463 £53,063 -£777 -£2692 50 £952,264 £920,392 £888,521 £856,649 £824,777 £792,905 £761,033 £729,161 £697,289 £665,417 £633,545 £1,904,529 £1,840,785 £1,777,041 £1,713,297 £1,649,553 £1,585,809 £1,522,065 £1,458,321 £1,394,577 £1,330,834 £1,267,090 -£371 £1373 50 £1,559,950 £1,528,078 £1,496,206 £1,464,334 £1,432,462 £1,400,590 £1,368,718 £1,336,846 £1,304,974 £1,273,102 £1,241,230 £3,119,899 £3,056,155 £2,992,411 £2,928,667 £2,864,923 £2,801,179 £2,737,435 £2,673,691 £2,609,948 £2,546,204 £2,482,460 £41 £5494 50 £2,085,759 £2,053,887 £2,022,015 £1,990,143 £1,958,272 £1,926,400 £1,894,528 £1,862,656 £1,830,784 £1,798,912 £1,767,040 £4,171,519 £4,107,775 £4,044,031 £3,980,287 £3,916,543 £3,852,799 £3,789,055 £3,725,311 £3,661,567 £3,597,823 £3,534,079 £397 £9065 50 £2,611,569 £2,579,697 £2,547,825 £2,515,953 £2,484,081 £2,452,209 £2,420,337 £2,388,466 £2,356,594 £2,324,722 £2,292,850 £5,223,139 £5,159,395 £5,095,651 £5,031,907 £4,968,163 £4,904,419 £4,840,675 £4,776,931 £4,713,187 £4,649,443 £4,585,699 £754 £1,262
1 50 £219,835 £192,788 £165,741 £138,695 £111,648 £84,601 £57,554 £30,508 £3,461 -£27,395 -£58,810 £439,670 £385,576 £331,483 £277,389 £223,296 £169,202 £115,109 £61,015 £6,922 -£54,790 -£117,620 -£1,060 -£4392 50 £798,999 £772,637 £746,275 £719,913 £693,551 £667,189 £640,827 £614,465 £588,103 £561,741 £535,380 £1,597,997 £1,545,273 £1,492,549 £1,439,826 £1,387,102 £1,334,378 £1,281,654 £1,228,930 £1,176,207 £1,123,483 £1,070,759 -£580 £413 50 £1,383,729 £1,357,367 £1,331,005 £1,304,643 £1,278,281 £1,251,919 £1,225,557 £1,199,195 £1,172,833 £1,146,472 £1,120,110 £2,767,457 £2,714,733 £2,662,010 £2,609,286 £2,556,562 £2,503,838 £2,451,114 £2,398,391 £2,345,667 £2,292,943 £2,240,219 -£96 £5254 50 £1,856,259 £1,829,898 £1,803,536 £1,777,174 £1,750,812 £1,724,450 £1,698,088 £1,671,726 £1,645,364 £1,619,002 £1,592,640 £3,712,519 £3,659,795 £3,607,071 £3,554,347 £3,501,624 £3,448,900 £3,396,176 £3,343,452 £3,290,728 £3,238,005 £3,185,281 £295 £9165 50 £2,328,790 £2,302,428 £2,276,066 £2,249,705 £2,223,343 £2,196,981 £2,170,619 £2,144,257 £2,117,895 £2,091,533 £2,065,171 £4,657,580 £4,604,857 £4,552,133 £4,499,409 £4,446,685 £4,393,961 £4,341,238 £4,288,514 £4,235,790 £4,183,066 £4,130,343 £686 £1,307
1 50 £377,490 £323,090 £268,690 £214,290 £159,890 £105,490 £51,090 -£3,989 -£69,563 -£135,137 -£200,711 #REF! #REF! #REF! #REF! #REF! #REF! #REF! #REF! #REF! #REF! #REF! -£1,045 -£447
2 50 £1,493,629 £1,440,698 £1,387,767 £1,334,836 £1,281,904 £1,228,973 £1,176,042 £1,123,111 £1,070,180 £1,017,249 £964,318 #REF! #REF! #REF! #REF! #REF! #REF! #REF! #REF! #REF! #REF! #REF! -£600 -£3
3 50 £2,619,960 £2,567,029 £2,514,098 £2,461,167 £2,408,236 £2,355,305 £2,302,373 £2,249,442 £2,196,511 £2,143,580 £2,090,649 #REF! #REF! #REF! #REF! #REF! #REF! #REF! #REF! #REF! #REF! #REF! -£151 £446
4 50 £3,538,318 £3,485,387 £3,432,456 £3,379,525 £3,326,594 £3,273,663 £3,220,731 £3,167,800 £3,114,869 £3,061,938 £3,009,007 #REF! #REF! #REF! #REF! #REF! #REF! #REF! #REF! #REF! #REF! #REF! £214 £812
5 50 £4,456,676 £4,403,745 £4,350,814 £4,297,883 £4,244,952 £4,192,021 £4,139,089 £4,086,158 £4,033,227 £3,980,296 £3,927,365 #REF! #REF! #REF! #REF! #REF! #REF! #REF! #REF! #REF! #REF! #REF! £580 £1,178
1 50 £547,016 £444,398 £351,920 £246,258 £140,595 £34,933 -£88,606 -£220,973 -£353,341 -£485,708 -£618,076 £273,508 £222,199 £175,960 £123,129 £70,298 £17,466 -£44,303 -£110,487 -£176,670 -£242,854 -£309,038 -£1,092 -£4912 50 £2,709,328 £2,606,710 £2,504,092 £2,401,474 £2,298,856 £2,196,238 £2,093,620 £1,991,002 £1,888,384 £1,785,767 £1,683,149 £1,354,664 £1,303,355 £1,252,046 £1,200,737 £1,149,428 £1,098,119 £1,046,810 £995,501 £944,192 £892,883 £841,574 -£659 -£583 50 £4,871,639 £4,769,022 £4,666,404 £4,563,786 £4,461,168 £4,358,550 £4,255,932 £4,153,314 £4,050,696 £3,948,078 £3,845,460 £2,435,820 £2,384,511 £2,333,202 £2,281,893 £2,230,584 £2,179,275 £2,127,966 £2,076,657 £2,025,348 £1,974,039 £1,922,730 -£226 £3754 50 £6,627,203 £6,524,585 £6,421,967 £6,319,349 £6,216,731 £6,114,114 £6,011,496 £5,908,878 £5,806,260 £5,703,642 £5,601,024 £3,313,602 £3,262,293 £3,210,984 £3,159,675 £3,108,366 £3,057,057 £3,005,748 £2,954,439 £2,903,130 £2,851,821 £2,800,512 £126 £7265 50 £8,382,767 £8,280,149 £8,177,531 £8,074,913 £7,972,295 £7,869,677 £7,767,059 £7,664,441 £7,561,823 £7,459,206 £7,356,588 £4,191,383 £4,140,074 £4,088,765 £4,037,456 £3,986,148 £3,934,839 £3,883,530 £3,832,221 £3,780,912 £3,729,603 £3,678,294 £477 £1,078
Key: RLV at or below lower assumed PDL residential value (c£1,500,000/Ha)
RLV between lower and upper assumed PDL residential value (c£1,500,000/Ha - £3,000,000/Ha)
RLV at or above upper assumed PDL residential value (c£3,000,000/Ha)
*based on corresponding benchmark rangeSource: Dixon Searle LLP (September 2011)
25 Mixed (40% AH)
100 Mixed (40% AH)
50 Mixed (40% AH)
14Mixed (Rural - 30%
AH)
14Mixed (Rural - 40%
AH)
25 Mixed (30%AH)
1 Houses
4 Houses
14Mixed (Urban - 0%
AH)
Max CIL (£/m²) -
High EUV
Benchmark
Max CIL (£/m²) - Low
EUV Benchmark
Residual Land Value (£) Residual Land Value (£/Ha)
Development Scenario
Table 3a: Residual Land Value Results by Scheme Type, Value Level & CIL Rate 66% Affordable Rent/34% LCHO - PDL Residential Benchmark Comparison - 50 DPH
D|S|P Housing Development Consultants Appendix IIa

Value LevelSite Density
(dph)
Residual Land
Value - £0/m² CIL
Residual Land
Value - £25/m² CIL
Residual Land
Value - £50/m² CIL
Residual Land
Value - £75/m² CIL
Residual Land
Value - £100/m²
CIL
Residual Land
Value - £125/m²
CIL
Residual Land
Value - £150/m²
CIL
Residual Land
Value - £175/m²
CIL
Residual Land
Value - £200/m²
CIL
Residual Land
Value - £225/m²
CIL
Residual Land
Value - £250/m²
CIL
Residual Land
Value - £0/m² CIL
Residual Land
Value - £25/m² CIL
Residual Land
Value - £50/m² CIL
Residual Land
Value - £75/m² CIL
Residual Land
Value - £100/m²
CIL
Residual Land
Value - £125/m²
CIL
Residual Land
Value - £150/m²
CIL
Residual Land
Value - £175/m²
CIL
Residual Land
Value - £200/m²
CIL
Residual Land
Value - £225/m²
CIL
Residual Land
Value - £250/m²
CIL
1 30 -£24,766 -£27,937 -£31,109 -£34,281 -£37,453 -£40,625 -£43,797 -£46,969 -£50,141 -£53,312 -£56,484 -£742,967 -£838,124 -£933,280 -£1,028,436 -£1,123,592 -£1,218,749 -£1,313,905 -£1,409,061 -£1,504,217 -£1,599,374 -£1,694,530 -£998 -£598
2 30 £20,819 £17,988 £15,158 £12,328 £9,497 £6,667 £3,837 £1,007 -£2,044 -£5,216 -£8,387 £624,556 £539,648 £454,740 £369,832 £284,924 £200,016 £115,108 £30,200 -£61,311 -£156,467 -£251,624 -£633 -£233
3 30 £63,735 £60,905 £58,075 £55,245 £52,414 £49,584 £46,754 £43,924 £41,093 £38,263 £35,433 £1,912,061 £1,827,153 £1,742,245 £1,657,337 £1,572,429 £1,487,521 £1,402,613 £1,317,705 £1,232,797 £1,147,890 £1,062,982 -£290 £110
4 30 £106,652 £103,822 £100,992 £98,161 £95,331 £92,501 £89,671 £86,840 £84,010 £81,180 £78,350 £3,199,566 £3,114,658 £3,029,750 £2,944,842 £2,859,934 £2,775,026 £2,690,119 £2,605,211 £2,520,303 £2,435,395 £2,350,487 £53 £453
5 30 £149,569 £146,739 £143,909 £141,078 £138,248 £135,418 £132,587 £129,757 £126,927 £124,097 £121,266 £4,487,071 £4,402,163 £4,317,255 £4,232,348 £4,147,440 £4,062,532 £3,977,624 £3,892,716 £3,807,808 £3,722,900 £3,637,992 £397 £797
1 30 £129,755 £122,057 £114,359 £106,660 £98,962 £91,264 £83,565 £75,867 £68,169 £60,470 £52,772 £973,164 £915,427 £857,689 £799,952 £742,214 £684,477 £626,740 £569,002 £511,265 £453,527 £395,790 -£795 -£207
2 30 £246,489 £238,791 £231,092 £223,394 £215,696 £207,997 £200,299 £192,601 £184,902 £177,204 £169,506 £1,848,667 £1,790,930 £1,733,193 £1,675,455 £1,617,718 £1,559,981 £1,502,243 £1,444,506 £1,386,768 £1,329,031 £1,271,294 -£452 £137
3 30 £363,223 £355,524 £347,826 £340,128 £332,430 £324,731 £317,033 £309,335 £301,636 £293,938 £286,240 £2,724,171 £2,666,434 £2,608,696 £2,550,959 £2,493,222 £2,435,484 £2,377,747 £2,320,009 £2,262,272 £2,204,535 £2,146,797 -£108 £480
4 30 £468,553 £461,038 £453,523 £446,007 £438,492 £441,465 £433,767 £426,068 £418,370 £410,672 £402,973 £3,514,151 £3,457,785 £3,401,419 £3,345,054 £3,288,688 £3,310,988 £3,253,250 £3,195,513 £3,137,776 £3,080,038 £3,022,301 £202 £790
5 30 £582,514 £574,998 £567,483 £559,968 £552,452 £544,937 £537,421 £529,906 £522,390 £514,875 £507,360 £4,368,853 £4,312,488 £4,256,122 £4,199,756 £4,143,391 £4,087,025 £4,030,660 £3,974,294 £3,917,928 £3,861,563 £3,805,197 £537 £1,125
1 30 £409,287 £383,362 £357,437 £331,512 £305,586 £279,661 £253,736 £227,811 £201,885 £175,960 £150,035 £877,044 £821,490 £765,936 £710,382 £654,828 £599,274 £543,720 £488,166 £432,612 £377,058 £321,504 -£862 -£253
2 30 £783,341 £758,032 £732,723 £707,413 £682,104 £656,795 £631,486 £606,176 £580,867 £555,558 £530,249 £1,678,588 £1,624,354 £1,570,120 £1,515,886 £1,461,652 £1,407,418 £1,353,184 £1,298,949 £1,244,715 £1,190,481 £1,136,247 -£537 £73
3 30 £1,167,119 £1,141,810 £1,116,501 £1,091,192 £1,065,882 £1,040,573 £1,015,264 £989,955 £964,645 £939,336 £914,027 £2,500,970 £2,446,736 £2,392,502 £2,338,268 £2,284,034 £2,229,800 £2,175,565 £2,121,331 £2,067,097 £2,012,863 £1,958,629 -£203 £407
4 30 £1,550,898 £1,525,588 £1,500,279 £1,474,970 £1,449,661 £1,424,351 £1,399,042 £1,373,733 £1,348,424 £1,323,114 £1,297,805 £3,323,352 £3,269,118 £3,214,884 £3,160,650 £3,106,416 £3,052,182 £2,997,947 £2,943,713 £2,889,479 £2,835,245 £2,781,011 £131 £741
5 30 £1,934,676 £1,909,367 £1,884,057 £1,858,748 £1,833,439 £1,808,130 £1,782,820 £1,757,511 £1,732,202 £1,706,893 £1,681,583 £4,145,734 £4,091,500 £4,037,266 £3,983,032 £3,928,798 £3,874,564 £3,820,329 £3,766,095 £3,711,861 £3,657,627 £3,603,393 £465 £1,075
1 30 £190,350 £172,872 £155,393 £137,914 £120,435 £102,956 £85,478 £67,999 £50,520 £33,041 £15,562 £407,894 £370,439 £332,985 £295,530 £258,075 £220,621 £183,166 £145,712 £108,257 £70,802 £33,348 -£1,551 -£6532 30 £524,539 £507,489 £490,439 £473,389 £456,338 £439,288 £432,854 £415,375 £397,897 £380,418 £362,939 £1,124,012 £1,087,476 £1,050,940 £1,014,404 £977,868 £941,332 £927,545 £890,090 £852,636 £815,181 £777,727 -£1,122 -£2253 30 £863,396 £846,346 £829,296 £812,246 £795,195 £778,145 £761,095 £744,045 £726,995 £709,945 £692,895 £1,850,134 £1,813,598 £1,777,062 £1,740,526 £1,703,990 £1,667,454 £1,630,918 £1,594,382 £1,557,846 £1,521,310 £1,484,774 -£688 £2094 30 £1,153,829 £1,136,779 £1,119,728 £1,102,678 £1,085,628 £1,068,578 £1,051,528 £1,034,478 £1,017,428 £1,000,378 £983,328 £2,472,490 £2,435,954 £2,399,418 £2,362,882 £2,326,346 £2,289,810 £2,253,274 £2,216,738 £2,180,202 £2,143,666 £2,107,130 -£316 £5825 30 £1,444,262 £1,427,211 £1,410,161 £1,393,111 £1,376,061 £1,359,011 £1,341,961 £1,324,911 £1,307,861 £1,290,810 £1,273,760 £3,094,846 £3,058,310 £3,021,774 £2,985,238 £2,948,702 £2,912,166 £2,875,630 £2,839,094 £2,802,558 £2,766,022 £2,729,486 £57 £954
1 30 £155,947 £140,260 £124,574 £108,888 £93,202 £77,516 £61,830 £46,144 £30,458 £14,772 -£1,043 £334,171 £300,558 £266,945 £233,332 £199,719 £166,106 £132,493 £98,880 £65,266 £31,653 -£2,236 -£1,770 -£7742 30 £483,657 £468,355 £453,054 £437,752 £433,073 £417,386 £401,700 £386,014 £370,328 £354,642 £338,956 £1,036,407 £1,003,618 £970,830 £938,041 £928,013 £894,399 £860,786 £827,173 £793,560 £759,947 £726,334 -£1,303 -£3083 30 £815,191 £799,890 £784,589 £769,287 £753,986 £738,684 £723,383 £708,082 £692,780 £677,479 £662,177 £1,746,839 £1,714,050 £1,681,261 £1,648,473 £1,615,684 £1,582,895 £1,550,107 £1,517,318 £1,484,529 £1,451,740 £1,418,952 -£832 £1644 30 £1,096,241 £1,080,940 £1,065,639 £1,050,337 £1,035,036 £1,019,734 £1,004,433 £989,132 £973,830 £958,529 £943,228 £2,349,089 £2,316,300 £2,283,511 £2,250,723 £2,217,934 £2,185,145 £2,152,357 £2,119,568 £2,086,779 £2,053,990 £2,021,202 -£432 £5645 30 £1,377,291 £1,361,990 £1,346,689 £1,331,387 £1,316,086 £1,300,784 £1,285,483 £1,270,182 £1,254,880 £1,239,579 £1,224,278 £2,951,339 £2,918,550 £2,885,761 £2,852,973 £2,820,184 £2,787,395 £2,754,607 £2,721,818 £2,689,029 £2,656,241 £2,623,452 -£32 £963
1 30 £353,531 £320,831 £288,131 £255,431 £222,731 £190,031 £157,331 £124,631 £91,931 £59,232 £26,532 £424,237 £384,997 £345,757 £306,518 £267,278 £228,038 £188,798 £149,558 £110,318 £71,078 £31,838 -£1,455 -£6082 30 £952,264 £920,392 £888,521 £856,649 £824,777 £792,905 £761,033 £729,161 £697,289 £665,417 £633,545 £1,142,717 £1,104,471 £1,066,225 £1,027,978 £989,732 £951,486 £913,239 £874,993 £836,746 £798,500 £760,254 -£1,049 -£2023 30 £1,559,950 £1,528,078 £1,496,206 £1,464,334 £1,432,462 £1,400,590 £1,368,718 £1,336,846 £1,304,974 £1,273,102 £1,241,230 £1,871,939 £1,833,693 £1,795,447 £1,757,200 £1,718,954 £1,680,708 £1,642,461 £1,604,215 £1,565,969 £1,527,722 £1,489,476 -£637 £2104 30 £2,085,759 £2,053,887 £2,022,015 £1,990,143 £1,958,272 £1,926,400 £1,894,528 £1,862,656 £1,830,784 £1,798,912 £1,767,040 £2,502,911 £2,464,665 £2,426,419 £2,388,172 £2,349,926 £2,311,679 £2,273,433 £2,235,187 £2,196,940 £2,158,694 £2,120,448 -£281 £5675 30 £2,611,569 £2,579,697 £2,547,825 £2,515,953 £2,484,081 £2,452,209 £2,420,337 £2,388,466 £2,356,594 £2,324,722 £2,292,850 £3,133,883 £3,095,637 £3,057,390 £3,019,144 £2,980,898 £2,942,651 £2,904,405 £2,866,159 £2,827,912 £2,789,666 £2,751,420 £76 £923
1 30 £219,835 £192,788 £165,741 £138,695 £111,648 £84,601 £57,554 £30,508 £3,461 -£27,395 -£58,810 £263,802 £231,346 £198,890 £166,434 £133,977 £101,521 £69,065 £36,609 £4,153 -£32,874 -£70,572 -£1,888 -£8532 30 £798,999 £772,637 £746,275 £719,913 £693,551 £667,189 £640,827 £614,465 £588,103 £561,741 £535,380 £958,798 £927,164 £895,530 £863,895 £832,261 £800,627 £768,993 £737,358 £705,724 £674,090 £642,455 -£1,408 -£3733 30 £1,383,729 £1,357,367 £1,331,005 £1,304,643 £1,278,281 £1,251,919 £1,225,557 £1,199,195 £1,172,833 £1,146,472 £1,120,110 £1,660,474 £1,628,840 £1,597,206 £1,565,572 £1,533,937 £1,502,303 £1,470,669 £1,439,034 £1,407,400 £1,375,766 £1,344,132 -£924 £1114 30 £1,856,259 £1,829,898 £1,803,536 £1,777,174 £1,750,812 £1,724,450 £1,698,088 £1,671,726 £1,645,364 £1,619,002 £1,592,640 £2,227,511 £2,195,877 £2,164,243 £2,132,608 £2,100,974 £2,069,340 £2,037,706 £2,006,071 £1,974,437 £1,942,803 £1,911,169 -£533 £5025 30 £2,328,790 £2,302,428 £2,276,066 £2,249,705 £2,223,343 £2,196,981 £2,170,619 £2,144,257 £2,117,895 £2,091,533 £2,065,171 £2,794,548 £2,762,914 £2,731,280 £2,699,645 £2,668,011 £2,636,377 £2,604,743 £2,573,108 £2,541,474 £2,509,840 £2,478,206 -£142 £893
1 30 £377,490 £323,090 £268,690 £214,290 £159,890 £105,490 £51,090 -£3,989 -£69,563 -£135,137 -£200,711 #REF! #REF! #REF! #REF! #REF! #REF! #REF! #REF! #REF! #REF! #REF! -£1,842 -£846
2 30 £1,493,629 £1,440,698 £1,387,767 £1,334,836 £1,281,904 £1,228,973 £1,176,042 £1,123,111 £1,070,180 £1,017,249 £964,318 #REF! #REF! #REF! #REF! #REF! #REF! #REF! #REF! #REF! #REF! #REF! -£1,397 -£401
3 30 £2,619,960 £2,567,029 £2,514,098 £2,461,167 £2,408,236 £2,355,305 £2,302,373 £2,249,442 £2,196,511 £2,143,580 £2,090,649 #REF! #REF! #REF! #REF! #REF! #REF! #REF! #REF! #REF! #REF! #REF! -£948 £48
4 30 £3,538,318 £3,485,387 £3,432,456 £3,379,525 £3,326,594 £3,273,663 £3,220,731 £3,167,800 £3,114,869 £3,061,938 £3,009,007 #REF! #REF! #REF! #REF! #REF! #REF! #REF! #REF! #REF! #REF! #REF! -£582 £414
5 30 £4,456,676 £4,403,745 £4,350,814 £4,297,883 £4,244,952 £4,192,021 £4,139,089 £4,086,158 £4,033,227 £3,980,296 £3,927,365 #REF! #REF! #REF! #REF! #REF! #REF! #REF! #REF! #REF! #REF! #REF! -£216 £780
1 30 £547,016 £444,398 £351,920 £246,258 £140,595 £34,933 -£88,606 -£220,973 -£353,341 -£485,708 -£618,076 £164,105 £133,319 £105,576 £73,877 £42,179 £10,480 -£26,582 -£66,292 -£106,002 -£145,712 -£185,423 -£1,892 -£8912 30 £2,709,328 £2,606,710 £2,504,092 £2,401,474 £2,298,856 £2,196,238 £2,093,620 £1,991,002 £1,888,384 £1,785,767 £1,683,149 £812,798 £782,013 £751,228 £720,442 £689,657 £658,871 £628,086 £597,301 £566,515 £535,730 £504,945 -£1,460 -£4593 30 £4,871,639 £4,769,022 £4,666,404 £4,563,786 £4,461,168 £4,358,550 £4,255,932 £4,153,314 £4,050,696 £3,948,078 £3,845,460 £1,461,492 £1,430,706 £1,399,921 £1,369,136 £1,338,350 £1,307,565 £1,276,780 £1,245,994 £1,215,209 £1,184,423 £1,153,638 -£1,027 -£264 30 £6,627,203 £6,524,585 £6,421,967 £6,319,349 £6,216,731 £6,114,114 £6,011,496 £5,908,878 £5,806,260 £5,703,642 £5,601,024 £1,988,161 £1,957,376 £1,926,590 £1,895,805 £1,865,019 £1,834,234 £1,803,449 £1,772,663 £1,741,878 £1,711,093 £1,680,307 -£675 £3265 30 £8,382,767 £8,280,149 £8,177,531 £8,074,913 £7,972,295 £7,869,677 £7,767,059 £7,664,441 £7,561,823 £7,459,206 £7,356,588 £2,514,830 £2,484,045 £2,453,259 £2,422,474 £2,391,689 £2,360,903 £2,330,118 £2,299,332 £2,268,547 £2,237,762 £2,206,976 -£324 £677
Key: RLV at or below lower assumed PDL residential value (c£1,500,000/Ha)
RLV between lower and upper assumed PDL residential value (c£1,500,000/Ha - £3,000,000/Ha)
RLV at or above upper assumed PDL residential value (c£3,000,000/Ha)
*based on corresponding benchmark rangeSource: Dixon Searle LLP (September 2011)
100 Mixed (40% AH)
Max CIL (£/m²) -
High EUV
Benchmark
Max CIL (£/m²) - Low
EUV Benchmark
50 Mixed (40% AH)
14Mixed (Rural - 40%
AH)
25 Mixed (30%AH)
25 Mixed (40% AH)
4 Houses
14Mixed (Urban - 0%
AH)
14Mixed (Rural - 30%
AH)
Residual Land Value (£) Residual Land Value (£/Ha)
Development Scenario
1 Houses
Table 3a: Residual Land Value Results by Scheme Type, Value Level & CIL Rate 66% Affordable Rent/34% LCHO - PDL Residential Benchmark Comparison - 30 DPH
D|S|P Housing Development Consultants Appendix IIa

D|S|P Housing and Development Consultants
Net RLV: £1,400,590
DEVELOPMENT TYPE Residential
DEVELOPMENT DESCRIPTION 25 Unit Scheme
DEVELOPMENT SIZE (TOTAL m²) - GIA 2,081
Total Private Affordable % AH
25 17 8 32%
% Private % SR %AR % Int 1 % Int 2
68% 0% 20% 12% 0%
SITE SIZE (HA) 0.50
VALUE / AREA 3
REVENUE
Affordable Housing Revenue £1,208,550
Open Market Housing Revenue £5,162,500
Total Value of Scheme £6,371,050
RESIDENTIAL BUILDING, MARKETING & S106 COSTS
Build Costs £2,382,223
Fees, Contingencies, Planning Costs etc £476,445
Planning Application Costs £8,375
Site Preparation / Survey Costs etc £112,500
Other Costs £0
Sustainable Design & Construction Costs / Lifetime Homes £109,664
Total Build Costs £3,089,207
Section 106 / CIL Costs £196,875
Marketing Costs & Legal Fees £206,132
Total s106 & Marketing Costs £403,007
Finance on Build Costs £104,766
TOTAL DEVELOPMENT COSTS £3,596,979
DEVELOPER'S RETURN FOR RISK AND PROFIT
Open Market Housing Profit £1,032,500
Affordable Housing Profit £72,513
Total Operating Profit £1,105,013
GROSS RESIDUAL LAND VALUE £1,669,058
Residual Land Value Data Summary & Results
PERCENTAGE BY TENURE
TOTAL NUMBER OF UNITS

D|S|P Housing and Development Consultants
FINANCE & ACQUISITION COSTS
Arrangement Fee / Misc Fees (Surveyors etc) £16,691
Agents Fees £12,518
Legal Fees £12,518
Stamp Duty £66,762
Interest on Land Purchase £159,979
Total Finance & Acquisition Costs £268,468
NET RESIDUAL LAND VALUE £1,400,590 (ignores finance & acquisition
RLV (£ per Ha) £2,801,179 costs if GRLV Negative)
NRLV as % of GDV 22.0%

D|S|P Housing & Development Consultants
Appendix IIb
Commercial Results Summaries

Scheme Type Value LevelTota Floor Area
(m²)Site Size (Ha)
Residual Land
Value - £0/m² CIL
Residual Land
Value - £10/m² CIL
Residual Land
Value - £20/m² CIL
Residual Land
Value - £50/m² CIL
Residual Land
Value - £100/m² CIL
Residual Land
Value - £150/m² CIL
Residual Land
Value - £200/m² CIL
Residual Land
Value - £250/m² CIL
Residual Land
Value - £0/m² CIL
Residual Land
Value - £10/m² CIL
Residual Land
Value - £20/m² CIL
Residual Land
Value - £50/m² CIL
Residual Land
Value - £100/m² CIL
Residual Land
Value - £150/m² CIL
Residual Land
Value - £200/m² CIL
Residual Land
Value - £250/m² CIL
L 4000 1.14 £755,517 £719,608 £683,698 £575,968 £401,205 £224,725 £39,124 -£161,992 £662,735 £631,235 £599,735 £505,235 £351,935 £197,128 £34,319 -£142,098 -£25 £132
M 4000 1.14 £2,608,812 £2,572,903 £2,536,993 £2,429,263 £2,249,714 £2,070,165 £1,890,616 £1,711,068 £2,288,432 £2,256,932 £2,225,432 £2,130,933 £1,973,434 £1,815,935 £1,658,436 £1,500,936 £438 £595
H 4000 1.14 £4,462,107 £4,426,197 £4,390,288 £4,282,558 £4,103,009 £3,923,460 £3,743,911 £3,564,362 £3,914,129 £3,882,629 £3,851,130 £3,756,630 £3,599,131 £3,441,632 £3,284,133 £3,126,634 £902 £1,059
L 1000 0.25 £543,136 £534,095 £525,054 £497,930 £452,724 £412,333 £366,593 £320,852 £2,172,546 £2,136,381 £2,100,216 £1,991,721 £1,810,896 £1,649,333 £1,466,371 £1,283,409 £356 £493
M 1000 0.25 £1,012,070 £1,003,029 £993,988 £966,864 £921,658 £876,452 £831,245 £786,039 £4,048,282 £4,012,117 £3,975,952 £3,867,457 £3,686,632 £3,505,807 £3,324,982 £3,144,157 £825 £962
H 1000 0.25 £1,481,004 £1,471,963 £1,462,922 £1,435,798 £1,390,592 £1,345,386 £1,300,179 £1,254,973 £5,924,018 £5,887,853 £5,851,688 £5,743,193 £5,562,368 £5,381,543 £5,200,718 £5,019,893 £1,294 £1,431
L 300 0.05 £41,050 £38,180 £35,310 £26,699 £12,349 -£2,110 -£17,242 -£32,373 £820,997 £763,595 £706,193 £533,987 £246,978 -£42,209 -£344,834 -£647,459 £12 £103
M 300 0.05 £116,132 £113,262 £110,392 £101,782 £87,432 £73,081 £58,731 £44,380 £2,322,649 £2,265,247 £2,207,845 £2,035,640 £1,748,631 £1,461,622 £1,174,612 £887,603 £262 £354
H 300 0.05 £189,133 £186,295 £183,456 £174,939 £160,745 £146,551 £133,813 £119,463 £3,782,667 £3,725,890 £3,669,113 £3,498,783 £3,214,898 £2,931,014 £2,676,265 £2,389,256 £505 £597
L 1000 0.05 -£474,010 -£484,160 -£494,310 -£524,760 -£575,510 N/A N/A N/A -£9,480,202 -£9,683,202 -£9,886,202 -£10,495,202 -£11,510,202 N/A N/A N/A -£512 -£484
M 1000 0.05 -£157,360 -£167,510 -£177,660 -£208,110 -£258,860 N/A N/A N/A -£3,147,192 -£3,350,192 -£3,553,192 -£4,162,192 -£5,177,192 N/A N/A N/A -£195 -£167
H 1000 0.05 £147,379 £139,546 £130,049 £101,558 £54,073 N/A N/A N/A £2,947,575 £2,790,926 £2,600,986 £2,031,164 £1,081,462 N/A N/A N/A £110 £137
L 3000 0.75 -£832,769 -£863,519 -£894,269 -£986,519 -£1,140,269 N/A N/A N/A -£1,110,359 -£1,151,359 -£1,192,359 -£1,315,359 -£1,520,359 N/A N/A N/A -£465 -£328
M 3000 0.75 £107,166 £79,020 £50,875 -£36,667 -£190,417 N/A N/A N/A £142,888 £105,361 £67,833 -£48,889 -£253,889 N/A N/A N/A -£152 -£14
H 3000 0.75 £931,112 £904,277 £877,441 £796,935 £662,758 N/A N/A N/A £1,241,483 £1,205,702 £1,169,922 £1,062,580 £883,677 N/A N/A N/A £123 £260
L 500 0.13 -£203,445 -£208,520 -£213,595 -£228,820 -£254,195 N/A N/A N/A -£1,564,964 -£1,604,003 -£1,643,041 -£1,760,156 -£1,955,349 N/A N/A N/A -£602 -£459
M 500 0.13 -£151,447 -£156,528 -£161,609 -£176,853 -£202,259 N/A N/A N/A -£1,164,976 -£1,204,063 -£1,243,150 -£1,360,409 -£1,555,842 N/A N/A N/A -£498 -£355
H 500 0.13 -£98,673 -£103,754 -£108,835 -£124,079 -£149,485 N/A N/A N/A -£759,020 -£798,106 -£837,193 -£954,452 -£1,149,885 N/A N/A N/A -£392 -£249
L 3000 0.75 -£804,624 -£835,224 -£865,824 -£957,624 -£1,110,624 N/A N/A N/A -£1,072,831 -£1,113,631 -£1,154,431 -£1,276,831 -£1,480,831 N/A N/A N/A -£456 -£318
M 3000 0.75 -£487,990 -£518,590 -£549,190 -£640,990 -£793,990 N/A N/A N/A -£650,653 -£691,453 -£732,253 -£854,653 -£1,058,653 N/A N/A N/A -£350 -£213
H 3000 0.75 -£171,356 -£201,956 -£232,556 -£324,356 -£477,356 N/A N/A N/A -£228,474 -£269,274 -£310,074 -£432,474 -£636,474 N/A N/A N/A -£245 -£107
L 3000 0.60 -£1,924,256 -£1,955,006 -£1,985,756 -£2,078,006 -£2,231,756 N/A N/A N/A -£3,207,094 -£3,258,344 -£3,309,594 -£3,463,344 -£3,719,594 N/A N/A N/A -£791 -£681
M 3000 0.60 -£736,941 -£767,691 -£798,441 -£890,691 -£1,044,441 N/A N/A N/A -£1,228,234 -£1,279,484 -£1,330,734 -£1,484,484 -£1,740,734 N/A N/A N/A -£396 -£286
H 3000 0.60 £397,838 £370,675 £343,512 £262,023 £130,773 N/A N/A N/A £663,063 £617,791 £572,520 £436,705 £217,955 N/A N/A N/A -£17 £93
L 2100 0.35 -£1,133,695 N/A N/A N/A N/A N/A N/A N/A -£3,239,128 N/A N/A N/A N/A N/A N/A N/A -£665 -£573
M 2100 0.35 -£690,500 N/A N/A N/A N/A N/A N/A N/A -£1,972,856 N/A N/A N/A N/A N/A N/A N/A -£454 -£362
H 2100 0.35 -£247,304 N/A N/A N/A N/A N/A N/A N/A -£706,584 N/A N/A N/A N/A N/A N/A N/A -£243 -£151
L 500 0.13 -£459,206 N/A N/A N/A N/A N/A N/A N/A -£3,532,352 N/A N/A N/A N/A N/A N/A N/A -£1,113 -£970
M 500 0.13 -£300,887 N/A N/A N/A N/A N/A N/A N/A -£2,314,513 N/A N/A N/A N/A N/A N/A N/A -£797 -£654
H 500 0.13 -£142,568 N/A N/A N/A N/A N/A N/A N/A -£1,096,674 N/A N/A N/A N/A N/A N/A N/A -£480 -£337
L 2500 0.50 -£3,463,006 N/A N/A N/A N/A N/A N/A N/A -£6,926,011 N/A N/A N/A N/A N/A N/A N/A -£1,535 -£1,425
M 2500 0.50 -£2,935,337 N/A N/A N/A N/A N/A N/A N/A -£5,870,675 N/A N/A N/A N/A N/A N/A N/A -£1,324 -£1,214
H 2500 0.50 -£2,407,669 N/A N/A N/A N/A N/A N/A N/A -£4,815,338 N/A N/A N/A N/A N/A N/A N/A -£1,113 -£1,003
Key: RLV at or below lower assumed greenfield enhancement value (c£200,000/Ha)
RLV between lower and upper assumed greenfield enhancement value (c£200,000/Ha - £750,000/Ha)
RLV at or above upper assumed greenfield enhancement value (c£750,000/Ha)
*based on corresponding benchmark rangeSource: Dixon Searle LLP (September 2011)
Nursing Home
Fitness
Clinic or similar
Hotel - edge of town
Larege industrial warehousing
including offices
Move on type industrial unit
including offices
Out of Town Office Building
CIL Range (£/m²)*
Town Centre Office Building
Convenience Store
Retail Warehouse
Residual Land Value (£) Residual Land Value (£/Ha)
Industrial /
Warehousing
Leisure
B1, B2,
B8
D2
B1, B2,
B8
Industrial /
Warehousing
D1/D2 Community /Health
C1 Hotel
Residential InstitutionC2
A1
A1-A5
B1(a)
A1
Offices
Medium Retail
Small Retail
B1(a) Offices
Use Class / Type
Large RetailLarge Supermarket (Out of
Town)
Table 4: Residual Land Value Results by Use Class, Scheme Type, Value Level & CIL Rate Greenfield Benchmark Comparison
D|S|P Housing and Development Consultants Appendix IIb

Scheme Type Value LevelTota Floor Area
(m²)Site Size (Ha)
Residual Land
Value - £0/m² CIL
Residual Land
Value - £10/m² CIL
Residual Land
Value - £20/m² CIL
Residual Land
Value - £50/m² CIL
Residual Land
Value - £100/m² CIL
Residual Land
Value - £150/m² CIL
Residual Land
Value - £200/m² CIL
Residual Land
Value - £250/m² CIL
Residual Land
Value - £0/m² CIL
Residual Land
Value - £10/m² CIL
Residual Land
Value - £20/m² CIL
Residual Land
Value - £50/m² CIL
Residual Land
Value - £100/m² CIL
Residual Land
Value - £150/m² CIL
Residual Land
Value - £200/m² CIL
Residual Land
Value - £250/m² CIL
L 4000 1.14 £755,517 £719,608 £683,698 £575,968 £401,205 £224,725 £39,124 -£161,992 £662,735 £631,235 £599,735 £505,235 £351,935 £197,128 £34,319 -£142,098 -£239 -£25
M 4000 1.14 £2,608,812 £2,572,903 £2,536,993 £2,429,263 £2,249,714 £2,070,165 £1,890,616 £1,711,068 £2,288,432 £2,256,932 £2,225,432 £2,130,933 £1,973,434 £1,815,935 £1,658,436 £1,500,936 £225 £438
H 4000 1.14 £4,462,107 £4,426,197 £4,390,288 £4,282,558 £4,103,009 £3,923,460 £3,743,911 £3,564,362 £3,914,129 £3,882,629 £3,851,130 £3,756,630 £3,599,131 £3,441,632 £3,284,133 £3,126,634 £688 £902
L 1300 0.33 -£401,610 -£414,903 -£428,195 -£468,073 -£534,535 -£600,998 -£667,460 -£733,923 -£1,217,000 -£1,257,280 -£1,297,561 -£1,418,402 -£1,619,803 -£1,821,205 -£2,022,606 -£2,224,008 -£690 -£499
M 1300 0.33 £252,726 £240,914 £229,103 £198,289 £137,822 £78,256 £17,085 -£47,900 £765,836 £730,044 £694,251 £600,875 £417,642 £237,140 £51,772 -£145,152 -£186 £4
H 1300 0.33 £852,032 £840,361 £828,691 £793,679 £735,325 £676,972 £618,618 £560,265 £2,581,915 £2,546,550 £2,511,184 £2,405,087 £2,228,258 £2,051,430 £1,874,601 £1,697,773 £275 £465
L 1000 0.25 £543,136 £534,095 £525,054 £497,930 £452,724 £412,333 £366,593 £320,852 £2,172,546 £2,136,381 £2,100,216 £1,991,721 £1,810,896 £1,649,333 £1,466,371 £1,283,409 £168 £356
M 1000 0.25 £1,012,070 £1,003,029 £993,988 £966,864 £921,658 £876,452 £831,245 £786,039 £4,048,282 £4,012,117 £3,975,952 £3,867,457 £3,686,632 £3,505,807 £3,324,982 £3,144,157 £637 £825
H 1000 0.25 £1,481,004 £1,471,963 £1,462,922 £1,435,798 £1,390,592 £1,345,386 £1,300,179 £1,254,973 £5,924,018 £5,887,853 £5,851,688 £5,743,193 £5,562,368 £5,381,543 £5,200,718 £5,019,893 £1,106 £1,294
L 300 0.05 £41,050 £38,180 £35,310 £26,699 £12,349 -£2,110 -£17,242 -£32,373 £820,997 £763,595 £706,193 £533,987 £246,978 -£42,209 -£344,834 -£647,459 -£113 £12
M 300 0.05 £116,132 £113,262 £110,392 £101,782 £87,432 £73,081 £58,731 £44,380 £2,322,649 £2,265,247 £2,207,845 £2,035,640 £1,748,631 £1,461,622 £1,174,612 £887,603 £137 £262
H 300 0.05 £189,133 £186,295 £183,456 £174,939 £160,745 £146,551 £133,813 £119,463 £3,782,667 £3,725,890 £3,669,113 £3,498,783 £3,214,898 £2,931,014 £2,676,265 £2,389,256 £380 £505
L 1000 0.05 -£474,010 -£484,160 -£494,310 -£524,760 -£575,510 N/A N/A N/A -£9,480,202 -£9,683,202 -£9,886,202 -£10,495,202 -£11,510,202 N/A N/A N/A -£549 -£512
M 1000 0.05 -£157,360 -£167,510 -£177,660 -£208,110 -£258,860 N/A N/A N/A -£3,147,192 -£3,350,192 -£3,553,192 -£4,162,192 -£5,177,192 N/A N/A N/A -£232 -£195
H 1000 0.05 £147,379 £139,546 £130,049 £101,558 £54,073 N/A N/A N/A £2,947,575 £2,790,926 £2,600,986 £2,031,164 £1,081,462 N/A N/A N/A £72 £110
L 3000 0.75 -£832,769 -£863,519 -£894,269 -£986,519 -£1,140,269 N/A N/A N/A -£1,110,359 -£1,151,359 -£1,192,359 -£1,315,359 -£1,520,359 N/A N/A N/A -£653 -£465
M 3000 0.75 £107,166 £79,020 £50,875 -£36,667 -£190,417 N/A N/A N/A £142,888 £105,361 £67,833 -£48,889 -£253,889 N/A N/A N/A -£339 -£152
H 3000 0.75 £931,112 £904,277 £877,441 £796,935 £662,758 N/A N/A N/A £1,241,483 £1,205,702 £1,169,922 £1,062,580 £883,677 N/A N/A N/A -£65 £123
L 500 0.13 -£203,445 -£208,520 -£213,595 -£228,820 -£254,195 N/A N/A N/A -£1,564,964 -£1,604,003 -£1,643,041 -£1,760,156 -£1,955,349 N/A N/A N/A -£797 -£602
M 500 0.13 -£151,447 -£156,528 -£161,609 -£176,853 -£202,259 N/A N/A N/A -£1,164,976 -£1,204,063 -£1,243,150 -£1,360,409 -£1,555,842 N/A N/A N/A -£693 -£498
H 500 0.13 -£98,673 -£103,754 -£108,835 -£124,079 -£149,485 N/A N/A N/A -£759,020 -£798,106 -£837,193 -£954,452 -£1,149,885 N/A N/A N/A -£587 -£392
L 3000 0.75 -£804,624 -£835,224 -£865,824 -£957,624 -£1,110,624 N/A N/A N/A -£1,072,831 -£1,113,631 -£1,154,431 -£1,276,831 -£1,480,831 N/A N/A N/A -£643 -£456
M 3000 0.75 -£487,990 -£518,590 -£549,190 -£640,990 -£793,990 N/A N/A N/A -£650,653 -£691,453 -£732,253 -£854,653 -£1,058,653 N/A N/A N/A -£538 -£350
H 3000 0.75 -£171,356 -£201,956 -£232,556 -£324,356 -£477,356 N/A N/A N/A -£228,474 -£269,274 -£310,074 -£432,474 -£636,474 N/A N/A N/A -£432 -£245
L 3000 0.60 -£1,924,256 -£1,955,006 -£1,985,756 -£2,078,006 -£2,231,756 N/A N/A N/A -£3,207,094 -£3,258,344 -£3,309,594 -£3,463,344 -£3,719,594 N/A N/A N/A -£941 -£791
M 3000 0.60 -£736,941 -£767,691 -£798,441 -£890,691 -£1,044,441 N/A N/A N/A -£1,228,234 -£1,279,484 -£1,330,734 -£1,484,484 -£1,740,734 N/A N/A N/A -£546 -£396
H 3000 0.60 £397,838 £370,675 £343,512 £262,023 £130,773 N/A N/A N/A £663,063 £617,791 £572,520 £436,705 £217,955 N/A N/A N/A -£167 -£17
L 2100 0.35 -£1,133,695 N/A N/A N/A N/A N/A N/A N/A -£3,239,128 N/A N/A N/A N/A N/A N/A N/A -£790 -£665
M 2100 0.35 -£690,500 N/A N/A N/A N/A N/A N/A N/A -£1,972,856 N/A N/A N/A N/A N/A N/A N/A -£579 -£454
H 2100 0.35 -£247,304 N/A N/A N/A N/A N/A N/A N/A -£706,584 N/A N/A N/A N/A N/A N/A N/A -£368 -£243
L 500 0.13 -£459,206 N/A N/A N/A N/A N/A N/A N/A -£3,532,352 N/A N/A N/A N/A N/A N/A N/A -£1,308 -£1,113
M 500 0.13 -£300,887 N/A N/A N/A N/A N/A N/A N/A -£2,314,513 N/A N/A N/A N/A N/A N/A N/A -£992 -£797
H 500 0.13 -£142,568 N/A N/A N/A N/A N/A N/A N/A -£1,096,674 N/A N/A N/A N/A N/A N/A N/A -£675 -£480
L 2500 0.50 -£3,463,006 N/A N/A N/A N/A N/A N/A N/A -£6,926,011 N/A N/A N/A N/A N/A N/A N/A -£1,685 -£1,535
M 2500 0.50 -£2,935,337 N/A N/A N/A N/A N/A N/A N/A -£5,870,675 N/A N/A N/A N/A N/A N/A N/A -£1,474 -£1,324
H 2500 0.50 -£2,407,669 N/A N/A N/A N/A N/A N/A N/A -£4,815,338 N/A N/A N/A N/A N/A N/A N/A -£1,263 -£1,113
Key: RLV at or below lower assumed PDL non-residential value (c£750,000/Ha)
RLV between lower and upper assumed PDL non-residential value (c£750,000/Ha - £1,500,000/Ha)
RLV at or above upper assumed PDL non-residential value (c£1,500,000/Ha)
*based on corresponding benchmark rangeSource: Dixon Searle LLP (September 2011)
D2 Leisure Fitness
C2 Residential Institution Nursing Home
D1/D2 Community /Health Clinic or similar
B1, B2,
B8
Industrial /
Warehousing
Larege industrial warehousing
including offices
C1 Hotel Hotel - edge of town
B1(a) Offices Out of Town Office Building
B1, B2,
B8
Industrial /
Warehousing
Move on type industrial unit
including offices
A1-A5 Small Retail Convenience Store
B1(a) Offices Town Centre Office Building
A1 Medium Retail Smaller Supermarket
A1 Medium Retail Retail Warehouse
Residual Land Value (£/Ha)
CIL Range (£/m²)*Use Class / Type
A1 Large RetailLarge Supermarket (Out of
Town)
Residual Land Value (£)
Table 5: Residual Land Value Results by Use Class, Scheme Type, Value Level & CIL Rate PDL Benchmark Comparison
D|S|P Housing and Development Consultants Appendix II

Scheme Type Value LevelTota Floor Area
(m²)Site Size (Ha)
Residual Land
Value - £0/m² CIL
Residual Land
Value - £10/m² CIL
Residual Land
Value - £20/m² CIL
Residual Land
Value - £50/m² CIL
Residual Land
Value - £100/m² CIL
Residual Land
Value - £150/m² CIL
Residual Land
Value - £200/m² CIL
Residual Land
Value - £250/m² CIL
Residual Land
Value - £0/m² CIL
Residual Land
Value - £10/m² CIL
Residual Land
Value - £20/m² CIL
Residual Land
Value - £50/m² CIL
Residual Land
Value - £100/m² CIL
Residual Land
Value - £150/m² CIL
Residual Land
Value - £200/m² CIL
Residual Land
Value - £250/m² CIL
L 4000 1.14 £1,908,161 £1,872,251 £1,836,341 £1,728,612 £1,549,063 £1,369,514 £1,189,965 £1,010,416 £1,673,825 £1,642,325 £1,610,825 £1,516,326 £1,358,827 £1,201,328 £1,043,829 £886,330 £263 £420
M 4000 1.14 £4,049,616 £4,013,707 £3,977,797 £3,870,067 £3,690,519 £3,510,970 £3,331,421 £3,151,872 £3,552,295 £3,520,795 £3,489,295 £3,394,796 £3,237,297 £3,079,798 £2,922,299 £2,764,800 £799 £955
H 4000 1.14 £6,191,072 £6,155,162 £6,119,253 £6,011,523 £5,831,974 £5,652,425 £5,472,876 £5,293,327 £5,430,765 £5,399,265 £5,367,765 £5,273,266 £5,115,767 £4,958,268 £4,800,769 £4,643,270 £1,334 £1,491
L 1300 0.33 -£81,610 -£94,903 -£108,195 -£148,073 -£214,535 -£280,998 -£347,460 -£413,923 -£247,303 -£287,584 -£327,864 -£448,705 -£650,106 -£851,508 -£1,052,909 -£1,254,311 -£253 -£114
M 1300 0.33 £624,320 £612,650 £600,979 £565,967 £507,613 £449,260 £395,626 £336,568 £1,891,880 £1,856,514 £1,821,148 £1,715,051 £1,538,223 £1,361,394 £1,198,867 £1,019,904 £290 £429
H 1300 0.33 £1,320,293 £1,308,623 £1,296,952 £1,261,940 £1,203,587 £1,145,233 £1,086,880 £1,028,526 £4,000,889 £3,965,523 £3,930,158 £3,824,061 £3,647,232 £3,470,404 £3,293,575 £3,116,747 £825 £965
L 1000 0.25 £761,863 £752,821 £743,780 £716,656 £671,450 £626,244 £581,038 £535,831 £3,047,450 £3,011,285 £2,975,120 £2,866,625 £2,685,800 £2,504,975 £2,324,150 £2,143,325 £574 £712
M 1000 0.25 £1,303,705 £1,294,664 £1,285,623 £1,258,499 £1,213,293 £1,168,087 £1,122,880 £1,077,674 £5,214,821 £5,178,656 £5,142,491 £5,033,996 £4,853,171 £4,672,346 £4,491,521 £4,310,696 £1,116 £1,254
H 1000 0.25 £1,845,548 £1,836,507 £1,827,466 £1,800,342 £1,755,136 £1,709,929 £1,664,723 £1,619,517 £7,382,192 £7,346,027 £7,309,862 £7,201,367 £7,020,542 £6,839,717 £6,658,892 £6,478,067 £1,658 £1,796
L 300 0.05 £99,413 £96,543 £93,673 £85,062 £70,712 £56,361 £42,011 £27,661 £1,988,257 £1,930,855 £1,873,453 £1,701,247 £1,414,238 £1,127,229 £840,220 £553,211 £206 £298
M 300 0.05 £184,141 £181,302 £178,464 £169,947 £155,753 £141,559 £128,766 £114,416 £3,682,826 £3,626,049 £3,569,272 £3,398,941 £3,115,057 £2,831,172 £2,575,324 £2,288,315 £489 £580
H 300 0.05 £264,010 £261,233 £258,457 £250,128 £236,246 £227,369 £213,175 £198,981 £5,280,190 £5,224,663 £5,169,136 £5,002,555 £4,724,920 £4,547,387 £4,263,502 £3,979,618 £755 £847
L 3000 0.60 -£1,185,795 -£1,216,545 -£1,247,295 -£1,339,545 -£1,493,295 N/A N/A N/A -£1,976,325 -£2,027,575 -£2,078,825 -£2,232,575 -£2,488,825 N/A N/A N/A -£545 -£435
M 3000 0.60 £168,388 £140,570 £114,079 £29,643 -£121,364 N/A N/A N/A £280,646 £234,283 £190,132 £49,405 -£202,273 N/A N/A N/A -£94 £16
H 3000 0.60 £1,359,721 £1,332,886 £1,306,051 £1,225,544 £1,091,367 N/A N/A N/A £2,266,202 £2,221,477 £2,176,751 £2,042,574 £1,818,945 N/A N/A N/A £303 £413
Key: RLV at or below lower assumed greenfield enhancement value (c£200,000/Ha)
RLV between lower and upper assumed greenfield enhancement value (c£200,000/Ha - £750,000/Ha)
RLV at or above upper assumed greenfield enhancement value (c£750,000/Ha)
*based on corresponding benchmark rangeSource: Dixon Searle LLP (September 2011)
Use Class / Type
Residual Land Value (£/Ha)Residual Land Value (£)
Large Retail
A1 Smaller Supermarket
Large Supermarket (Out of
Town)
A1
A1-A5
Medium Retail
A1
Medium Retail
Small Retail
C1 Hotel
CIL Range (£/m²)*
Convenience Store
Retail Warehouse
Hotel - edge of town
Table 6: Residual Land Value Results by Use Class, Scheme Type, Value Level & CIL Rate Greenfield Benchmark Comparison - 6.5% Yield
D|S|P Housing and Development Consultants Appendix IIb

Scheme Type Value LevelTota Floor Area
(m²)Site Size (Ha)
Residual Land
Value - £0/m² CIL
Residual Land
Value - £10/m² CIL
Residual Land
Value - £20/m² CIL
Residual Land
Value - £50/m² CIL
Residual Land
Value - £100/m² CIL
Residual Land
Value - £150/m² CIL
Residual Land
Value - £200/m² CIL
Residual Land
Value - £250/m² CIL
Residual Land
Value - £0/m² CIL
Residual Land
Value - £10/m² CIL
Residual Land
Value - £20/m² CIL
Residual Land
Value - £50/m² CIL
Residual Land
Value - £100/m² CIL
Residual Land
Value - £150/m² CIL
Residual Land
Value - £200/m² CIL
Residual Land
Value - £250/m² CIL
L 4000 1.14 £1,908,161 £1,872,251 £1,836,341 £1,728,612 £1,549,063 £1,369,514 £1,189,965 £1,010,416 £1,673,825 £1,642,325 £1,610,825 £1,516,326 £1,358,827 £1,201,328 £1,043,829 £886,330 £50 £263
M 4000 1.14 £4,049,616 £4,013,707 £3,977,797 £3,870,067 £3,690,519 £3,510,970 £3,331,421 £3,151,872 £3,552,295 £3,520,795 £3,489,295 £3,394,796 £3,237,297 £3,079,798 £2,922,299 £2,764,800 £585 £799
H 4000 1.14 £6,191,072 £6,155,162 £6,119,253 £6,011,523 £5,831,974 £5,652,425 £5,472,876 £5,293,327 £5,430,765 £5,399,265 £5,367,765 £5,273,266 £5,115,767 £4,958,268 £4,800,769 £4,643,270 £1,120 £1,334
L 1300 0.33 -£81,610 -£94,903 -£108,195 -£148,073 -£214,535 -£280,998 -£347,460 -£413,923 -£247,303 -£287,584 -£327,864 -£448,705 -£650,106 -£851,508 -£1,052,909 -£1,254,311 -£444 -£253
M 1300 0.33 £624,320 £612,650 £600,979 £565,967 £507,613 £449,260 £395,626 £336,568 £1,891,880 £1,856,514 £1,821,148 £1,715,051 £1,538,223 £1,361,394 £1,198,867 £1,019,904 £99 £290
H 1300 0.33 £1,320,293 £1,308,623 £1,296,952 £1,261,940 £1,203,587 £1,145,233 £1,086,880 £1,028,526 £4,000,889 £3,965,523 £3,930,158 £3,824,061 £3,647,232 £3,470,404 £3,293,575 £3,116,747 £635 £825
L 1000 0.25 £761,863 £752,821 £743,780 £716,656 £671,450 £626,244 £581,038 £535,831 £3,047,450 £3,011,285 £2,975,120 £2,866,625 £2,685,800 £2,504,975 £2,324,150 £2,143,325 £387 £574
M 1000 0.25 £1,303,705 £1,294,664 £1,285,623 £1,258,499 £1,213,293 £1,168,087 £1,122,880 £1,077,674 £5,214,821 £5,178,656 £5,142,491 £5,033,996 £4,853,171 £4,672,346 £4,491,521 £4,310,696 £929 £1,116
H 1000 0.25 £1,845,548 £1,836,507 £1,827,466 £1,800,342 £1,755,136 £1,709,929 £1,664,723 £1,619,517 £7,382,192 £7,346,027 £7,309,862 £7,201,367 £7,020,542 £6,839,717 £6,658,892 £6,478,067 £1,471 £1,658
L 300 0.05 £99,413 £96,543 £93,673 £85,062 £70,712 £56,361 £42,011 £27,661 £1,988,257 £1,930,855 £1,873,453 £1,701,247 £1,414,238 £1,127,229 £840,220 £553,211 £81 £206
M 300 0.05 £184,141 £181,302 £178,464 £169,947 £155,753 £141,559 £128,766 £114,416 £3,682,826 £3,626,049 £3,569,272 £3,398,941 £3,115,057 £2,831,172 £2,575,324 £2,288,315 £364 £489
H 300 0.05 £264,010 £261,233 £258,457 £250,128 £236,246 £227,369 £213,175 £198,981 £5,280,190 £5,224,663 £5,169,136 £5,002,555 £4,724,920 £4,547,387 £4,263,502 £3,979,618 £630 £755
L 3000 0.60 -£1,185,795 -£1,216,545 -£1,247,295 -£1,339,545 -£1,493,295 N/A N/A N/A -£1,976,325 -£2,027,575 -£2,078,825 -£2,232,575 -£2,488,825 N/A N/A N/A -£695 -£545
M 3000 0.60 £168,388 £140,570 £114,079 £29,643 -£121,364 N/A N/A N/A £280,646 £234,283 £190,132 £49,405 -£202,273 N/A N/A N/A -£244 -£94
H 3000 0.60 £1,359,721 £1,332,886 £1,306,051 £1,225,544 £1,091,367 N/A N/A N/A £2,266,202 £2,221,477 £2,176,751 £2,042,574 £1,818,945 N/A N/A N/A £153 £303
Key: RLV at or below lower assumed PDL non-residential value (c£750,000/Ha)
RLV between lower and upper assumed PDL non-residential value (c£750,000/Ha - £1,500,000/Ha)
RLV at or above upper assumed PDL non-residential value (c£1,500,000/Ha)
*based on corresponding benchmark rangeSource: Dixon Searle LLP (September 2011)
Residual Land Value (£) Residual Land Value (£/Ha)
CIL Range (£/m²)*Use Class / Type
A1 Large RetailLarge Supermarket (Out of
Town)
A1 Medium Retail Smaller Supermarket
A1 Medium Retail Retail Warehouse
A1-A5 Small Retail Convenience Store
C1 Hotel Hotel - edge of town
Table 7: Residual Land Value Results by Use Class, Scheme Type, Value Level & CIL Rate PDL Benchmark Comparison - 6.5% Yield
D|S|P Housing and Development Consultants Appendix IIb

D|S|P Housing and Development Consultants
Net RLV: -£190,417
DEVELOPMENT TYPE Commercial
USE CLASS B1(a) Offices
DEVELOPMENT DESCRIPTION Out of Town Offices
DEVELOPMENT SIZE (TOTAL m²) - GIA 3,000
VALUE AREA Medium Value
SITE SIZE (HA) 0.75
REVENUE
Rental Value (£/m²) £200
Yield (%) 7.50%
Annual Rental Income £600,000
Gross Development Value £8,000,000
Initial Void / Rent Free Period £0
Total Value of Scheme £8,000,000
RESIDENTIAL BUILDING, MARKETING & S106 COSTS
Build Costs £4,908,750
Fees, Contingencies, Planning Costs etc £834,488
Site Preparation / Survey Costs etc £75,000
Other Costs £0
Sustainable Design & Construction Costs / BREEAM Costs £245,438
Total Build Costs £6,063,675
CIL Costs £300,000
Promotion, Sales & Letting Costs £66,000
Total s106 & Marketing Costs £366,000
Finance on Build Costs £160,742
TOTAL DEVELOPMENT COSTS £6,590,417
DEVELOPER'S RETURN FOR RISK AND PROFIT
B1(a) Offices £1,600,000
Total Operating Profit £1,600,000
GROSS RESIDUAL LAND VALUE -£190,417
FINANCE & ACQUISITION COSTS
Arrangement Fee / Misc Fees (Surveyors etc) -£190
Agents Fees -£1,904
Legal Fees -£1,428
Stamp Duty £0
Interest on Land Purchase -£12,606
Total Finance & Acquisition Costs -£16,129
NET RESIDUAL LAND VALUE -£190,417 (ignores finance & acquisition
RLV (£ per Ha) -£253,889 costs if GRLV Negative)
Residual Land Value Data Summary & Results
D|S|P Housing & Development Consultants
Appendix III
Property Market Report

Wycombe District Council
D|S|P Housing & Development Consultants
D|S|P Housing & Development Consultants
Wycombe District Council
Market, Values and Assumptions Research
Background - Community Infrastructure Levy
Viability Assessment
Appendix III
Dixon Searle LLP
The Well House
28D Headley Road
Grayshott
Hindhead
GU26 6LD
www.dixonsearle.co.uk

Wycombe District Council
D|S|P Housing & Development Consultants
Wycombe District Council – CIL Viability Assessment (DSP11023) – Appendix III 1
Appendix III contents Page (of this Appendix)
DSP New-build housing research 2 – 5
Overall residential market review (Local Community Areas) 6 – 11
Extended residential values research 12 – 31
Residential values summary (value levels) 32
Commercial & other property information 33 – 56
Other property information (market context and trends,
house price trends etc) 56 – 68
EGi Wycombe Town Report Extract
Wycombe District Council
D|S|P Housing & Development Consultants
Wycombe District Council – CIL Viability Assessment (DSP11023) – Appendix III 2
DSP New Build Housing Values Research – August / September 2011
(Current new build developments noted)
Address Description Price Size (m2)
Price per m2
Price Less 20%
Price Less 10%
Price Plus 10%
Developer / Agent
High Wycombe
Houses
Kingshill Grange, Kingshill Road
4 bed detached
£499,995 155.4 £3,217 £2,574 £2,896 £3,539
Taylor Wimpey
4 bed detached
£494,995 141.0 £3,511 £2,808 £3,160 £3,862
4 bed semi £399,995 115.9 £3,451 £2,761 £3,106 £3,796
4 bed terraced £367,995 115.0 £3,200 £2,560 £2,880 £3,520
4 bed terraced £344,995 115.0 £3,000 £2,400 £2,700 £3,300
4 bed terraced £339,995 121.3 £2,803 £2,242 £2,523 £3,083
4 bed terraced £339,995 115.3 £2,949 £2,359 £2,654 £3,244
Nightingale Place, Totteridge
4 bed detached
£499,950 128.0 £3,906 £3,125 £3,515 £4,296
Wye Residential- Amberleigh
Homes
4 bed detached
£489,950 117.0 £4,188 £3,350 £3,769 £4,606
3 bed semi £339,950 100.0 £3,400 £2,720 £3,060 £3,739
3 bed semi £339,950 100.0 £3,400 £2,720 £3,060 £3,739
3 bed semi £319,950 85.0 £3,764 £3,011 £3,388 £4,141
3 bed semi £319,950 85.0 £3,764 £3,011 £3,388 £4,141
Cedar Place, Wye Dene, London Road
3 bed townhouse
£359,950 143.2 £2,514 £2,011 £2,262 £2,765
St James Homes
(Berkeley Group)
3 bed townhouse
£319,950 106.4 £3,007 £2,406 £2,706 £3,308
3 bed townhouse
£300,000 89.2 £3,363 £2,691 £3,027 £3,700
3 bed townhouse
£290,000 89.2 £3,251 £2,601 £2,926 £3,576
Littleworth Road, Downley
3 bed detached
£320,000 72.0 £4,444 £3,556 £4,000 £4,889 Thompson
Wilson
Average £374,563 113.1 £3,335 £2,668 £3,001 £3,668
Flats
Kingshill Grange, Kingshill Road
2 bed flat £219,995 67.0 £3,284 £2,627 £2,955 £3,612
Taylor Wimpey
2 bed flat £199,995 59.4 £3,365 £2,692 £3,029 £3,702
1 bed flat £174,995 41.5 £4,215 £3,372 £3,793 £4,636
1 bed flat £172,995 41.5 £4,167 £3,333 £3,750 £4,583
1 bed flat £169,995 41.5 £4,094 £3,275 £3,685 £4,504
Wycombe District Council
D|S|P Housing & Development Consultants
Wycombe District Council – CIL Viability Assessment (DSP11023) – Appendix III 3
Address Description Price Size (m2)
Price per m2
Price Less 20%
Price Less 10%
Price Plus 10%
Developer / Agent
Chilterns Gate, Wye Dene, London
Road
2 bed flat £199,950 60.3 £3,316 £2,653 £2,985 £3,648
St James Homes
(Berkeley Group)
1 bed flat £159,950 42.7 £3,742 £2,994 £3,368 £4,117
1 bed flat £155,950 40.5 £3,851 £3,080 £3,466 £4,236
1 bed flat £152,950 40.5 £3,777 £3,021 £3,399 £4,154
1 bed flat £149,950 39.5 £3,796 £3,037 £3,417 £4,176
Willow Tree Gardens, Plomer
Green Lane, Downley
2 bed flat £225,000 n/k n/k n/k n/k n/k
Wye Residential -Beeks Ltd
2 bed flat £225,000 n/k n/k n/k n/k n/k
2 bed flat £225,000 n/k n/k n/k n/k n/k
2 bed flat £225,000 n/k n/k n/k n/k n/k
2 bed flat £199,950 n/k n/k n/k n/k n/k
2 bed flat £199,950 n/k n/k n/k n/k n/k
2 bed flat £199,950 n/k n/k n/k n/k n/k
2 bed flat £199,950 n/k n/k n/k n/k n/k
2 bed flat £199,950 n/k n/k n/k n/k n/k
2 bed flat £199,950 n/k n/k n/k n/k n/k
Marlow Hill 2 bed flat £189,950 52.0 £3,653 £2,922 £3,288 £4,018
Connells (Fairview
New Homes)
Marsden House, John North Close
2 bed flat £187,500 n/k n/k n/k n/k n/k
Loughton Site Sales -
shared ownership
2 bed flat £187,500 n/k n/k n/k n/k n/k
2 bed flat £185,000 n/k n/k n/k n/k n/k
2 bed flat £185,000 n/k n/k n/k n/k n/k
2 bed flat £182,500 n/k n/k n/k n/k n/k
2 bed flat £182,500 n/k n/k n/k n/k n/k
2 bed flat £180,000 n/k n/k n/k n/k n/k
2 bed flat £180,000 n/k n/k n/k n/k n/k
Eden Gardens, West Wycombe
Road
2 bed flat £180,000 65.0 £2,769 £2,215 £2,492 £3,046
Chancellors
2 bed flat £180,000 65.0 £2,769 £2,215 £2,492 £3,046
2 bed flat £175,000 65.0 £2,692 £2,154 £2,423 £2,962
1 bed flat £155,000 52.0 £2,981 £2,385 £2,683 £3,279
1 bed flat £155,000 52.0 £2,981 £2,385 £2,683 £3,279
Eden Gardens, West Wycombe
Road
1 bed flat £130,000 n/k n/k n/k n/k n/k
Catalyst Housing -
shared ownership
Chairborough Court, Cressex Business Park, High Wycombe
2 bed flat £179,950 n/k n/k n/k n/k n/k Warren
Property Matters
2 bed flat £174,950 n/k n/k n/k n/k n/k
2 bed flat £174,950 n/k n/k n/k n/k n/k
2 bed flat £174,950 n/k n/k n/k n/k n/k

Wycombe District Council
D|S|P Housing & Development Consultants
Wycombe District Council – CIL Viability Assessment (DSP11023) – Appendix III 4
Address Description Price Size (m2)
Price per m2
Price Less 20%
Price Less 10%
Price Plus 10%
Developer / Agent
2 bed flat £164,950 n/k n/k n/k n/k n/k
2 bed flat £164,950 n/k n/k n/k n/k n/k
2 bed flat £164,950 n/k n/k n/k n/k n/k
2 bed flat £164,950 n/k n/k n/k n/k n/k
1 bed flat £164,950 n/k n/k n/k n/k n/k
1 bed flat £159,950 n/k n/k n/k n/k n/k
Lindsay Avenue
2 bed flat £179,950 61.0 £2,950 £2,360 £2,655 £3,245
Thompson Wilson
2 bed flat £164,950 57.0 £2,894 £2,315 £2,604 £3,183
1 bed flat £149,950 53.0 £2,829 £2,263 £2,546 £3,112
1 bed flat £144,950 42.5 £3,411 £2,728 £3,070 £3,752
West End Road 2 bed flat £170,000 n/k n/k n/k n/k n/k
Catalyst Housing -
shared ownership
Average £179,814 52.0 £3,377 £2,701 £3,039 £3,714
Marlow & SW Chilterns
Houses
154, Marlow Bottom
4 bed detached £550,000 n/k n/k n/k n/k n/k Thames Valley
Properties
Stokenchurch 3 bed semi £279,950 100.0 £2,800 £2,240 £2,520 £3,079 Andrew
Milsom 3 bed semi £279,950 100.0 £2,800 £2,240 £2,520 £3,079
Average £369,967 100.0 £2,800 £2,240 £2,520 £3,079
Chepping Wye Valley
Houses
Sawpit Hill, Hazlemere
3 bed semi £499,950 143.8 £3,477 £2,781 £3,129 £3,824 Robertsons
Average £499,950 143.8 £3,477 £2,781 £3,129 £3,824
Flats
Hughenden Court, Penn Road, Hazlemere
(Retirement Flats)
2 bed flat £326,950 58.0 £5,637 £4,510 £5,073 £6,201 McCarthy & Stone
(numbers of
remaining flats/prices estimated
2 bed flat £326,950 58.0 £5,637 £4,510 £5,073 £6,201
1 bed flat £259,950 49.5 £5,252 £4,201 £4,726 £5,777
1 bed flat £259,950 49.5 £5,252 £4,201 £4,726 £5,777
1 bed flat £259,950 49.5 £5,252 £4,201 £4,726 £5,777
1 bed flat £247,950 49.5 £5,009 £4,007 £4,508 £5,510

Wycombe District Council
D|S|P Housing & Development Consultants
Wycombe District Council – CIL Viability Assessment (DSP11023) – Appendix III 5
Address Description Price Size (m2)
Price per m2
Price Less 20%
Price Less 10%
Price Plus 10%
Developer / Agent
1 bed flat £247,950 49.5 £5,009 £4,007 £4,508 £5,510 from website) 1 bed flat £247,950 49.5 £5,009 £4,007 £4,508 £5,510
Average £272,200 51.6 £5,257 £4,206 £4,731 £5,783
Note: New build 4 bed detached house for sale (requires completion), St John’s Avenue, Penn - £375,000.
North West Chilterns
Houses
Priory Gardens, Mill Lane, Princes
Risborough
4 bed detached £599,950 n/k n/k n/k n/k n/k
Croudace Homes
4 bed detached £599,950 n/k n/k n/k n/k n/k
2 bed semi £299,950 n/k n/k n/k n/k n/k
2 bed semi £249,950 n/k n/k n/k n/k n/k
2 bed terraced £229,950 n/k n/k n/k n/k n/k
Windmill Lane, Bledlow Ridge
4 bed detached £535,000 129.5 £4,131 £3,305 £3,718 £4,544 Thompson
Wilson 4 bed detached £479,500 116.0 £4,134 £3,307 £3,720 £4,547
4 bed detached £445,000 110.0 £4,045 £3,236 £3,641 £4,450
Woodlands, Clifford Road,
Princes Risborough
4 bed detached £499,950 166.3 £3,006 £2,405 £2,706 £3,307 Tim Russ & Co 2 bed semi £289,950 90.8 £3,193 £2,555 £2,874 £3,513
Innkeepers Court, Longwick, Princes
Risborough 4 bed detached £499,950 152.0 £3,289 £2,631 £2,960 £3,618
Strutt & Parker
Warrendene Road, Hughenden Valley
3 bed semi £475,000 149.0 £3,188 £2,550 £2,869 £3,507 Wynyard, Wright &
Ellis 3 bed semi £475,000 149.0 £3,188 £2,550 £2,869 £3,507
Thame Road, Longwick
3 bed semi £399,950 120.0 £3,333 £2,666 £3,000 £3,666 Bonners & Babingtons
Kimblewick Road, Great Kimble
3 bed semi £365,000 104.0 £3,510 £2,808 £3,159 £3,861 Michael Graham
Jasmine Crescent 2 bed bungalow £249,950 62.0 £4,031 £3,225 £3,628 £4,435 The JNP Partnership
Average £428,568 122.6 £3,550 £2,840 £3,195 £3,905
Flats
Priory Gardens, Mill Lane, Princes
Risborough
2 bed flat £274,950 n/k n/k n/k n/k n/k Croudace Homes 1 bed flat £199,950 n/k n/k n/k n/k n/k
Average £237,450 n/k n/k n/k n/k n/k

Wycombe District Council
D|S|P Housing & Development Consultants
Wycombe District Council – CIL Viability Assessment (DSP11023) – Appendix III 6
Overall market review – Values patterns - Re-sales Values Research
High Wycombe Local Community Area (773 properties)
1 Bed 2 Bed 3 Bed 4 Bed Detached n/a £231,317 £323,428 £433,142 Semi-Detached n/a £206,020 £235,090 £279,323 Terraced n/a £186,580 £228,511 £292,985 Flats £130,924 £168,550 n/a n/a Bungalows n/a £256,141 £306,250 £406,661
Overall Average Minimum
1st Quartile Median
3rd Quartile Maximum
1-Bed Flats £130,924 £65,000 £117,875 £129,975 £144,950 £174,995
2-Bed Flats £168,550 £109,950 £150,000 £170,000 £182,500 £249,950
2-Bed Houses £196,137 £139,995 £176,725 £194,950 £214,950 £360,000
3-Bed Houses £248,230 £155,000 £214,950 £235,000 £274,988 £450,000
4-Bed Houses £389,388 £180,000 £319,950 £379,950 £447,475 £755,000
2-Bed Bungalows £256,141 £179,950 £225,000 £265,000 £299,950 £329,950
3-Bed Bungalows £306,250 £209,950 £268,738 £314,950 £337,488 £390,000
4-Bed Bungalows £406,661 £315,000 £340,000 £410,000 £430,000 £575,000
September 2011, www.rightmove.co.uk

Wycombe District Council
D|S|P Housing & Development Consultants
Wycombe District Council – CIL Viability Assessment (DSP11023) – Appendix III 7
Marlow & SW Chilterns Local Community Area (417 properties)
1 Bed 2 Bed 3 Bed 4 Bed Detached n/a £474,980 £440,121 £609,113 Semi-Detached n/a £296,476 £337,125 £410,081 Terraced n/a £266,381 £308,130 £448,983 Flats £167,190 £258,905 n/a n/a Bungalows n/a £356,465 £510,256 £521,795
Overall Average Minimum
1st Quartile Median
3rd Quartile Maximum
1-Bed Flats £167,190 £120,000 £152,488 £165,000 £187,750 £199,950
2-Bed Flats £258,905 £131,000 £167,500 £220,000 £285,000 £725,000
2-Bed Houses £294,222 £174,995 £220,496 £267,475 £343,700 £690,000
3-Bed Houses £348,461 £199,950 £259,950 £315,000 £384,988 £1,300,000
4-Bed Houses £558,217 £233,000 £399,950 £525,000 £635,000 £1,350,000
2-Bed Bungalows £356,465 £275,000 £321,213 £344,950 £396,200 £449,950
3-Bed Bungalows £510,256 £150,000 £346,238 £442,475 £567,313 £1,600,000
4-Bed Bungalows £521,795 £389,950 £424,975 £499,950 £587,475 £750,000
September 2011, www.rightmove.co.uk

Wycombe District Council
D|S|P Housing & Development Consultants
Wycombe District Council – CIL Viability Assessment (DSP11023) – Appendix III 8
Chepping Wye Valley Local Community Area (435 properties)
1 Bed 2 Bed 3 Bed 4 Bed Detached n/a £328,283 £394,165 £550,329 Semi-Detached n/a £284,506 £324,293 £369,850 Terraced n/a £238,929 £260,022 £404,264 Flats £173,275 £213,321 n/a n/a Bungalows n/a £356,188 £444,363 £567,259
Overall Average Minimum
1st Quartile Median
3rd Quartile Maximum
1-Bed Flats £173,275 £119,950 £143,988 £153,250 £201,213 £259,950
2-Bed Flats £213,321 £134,950 £159,950 £189,950 £238,738 £495,000
2-Bed Houses £257,769 £166,250 £229,950 £245,000 £256,213 £499,950
3-Bed Houses £317,480 £189,950 £249,950 £292,450 £341,250 £795,000
4-Bed Houses £499,106 £262,000 £385,000 £430,000 £565,000 £1,050,000
2-Bed Bungalows £356,188 £185,000 £309,500 £329,950 £369,995 £580,000
3-Bed Bungalows £444,363 £275,000 £354,988 £377,500 £468,738 £895,000
4-Bed Bungalows £567,259 £275,000 £462,475 £499,950 £635,000 £995,000
September 2011, www.rightmove.co.uk

Wycombe District Council
D|S|P Housing & Development Consultants
Wycombe District Council – CIL Viability Assessment (DSP11023) – Appendix III 9
NW Chilterns Local Community Area (272 properties)
1 Bed 2 Bed 3 Bed 4 Bed Detached n/a £300,000 £453,783 £607,390 Semi-Detached n/a £271,642 £307,169 £423,274 Terraced n/a £225,277 £308,725 £387,475 Flats £135,961 £202,471 n/a n/a Bungalows n/a £294,850 £438,895 £542,767
Overall Average Minimum
1st Quartile Median
3rd Quartile Maximum
1-Bed Flats £135,961 £99,950 £118,950 £129,950 £140,000 £199,950
2-Bed Flats £202,471 £129,950 £173,700 £197,475 £218,738 £280,000
2-Bed Houses £247,816 £159,950 £225,000 £249,950 £282,450 £345,000
3-Bed Houses £453,783 £209,950 £287,475 £325,000 £375,000 £820,000
4-Bed Houses £572,846 £249,950 £412,463 £545,000 £699,713 £1,250,000
2-Bed Bungalows £294,850 £230,000 £250,000 £272,500 £328,713 £425,000
3-Bed Bungalows £438,895 £345,000 £374,975 £425,000 £487,475 £595,000
4-Bed Bungalows £542,767 £399,950 £475,000 £570,000 £599,950 £650,000
September 2011, www.rightmove.co.uk
Wycombe District Council
D|S|P Housing & Development Consultants
Wycombe District Council – CIL Viability Assessment (DSP11023) – Appendix III 10
Wycombe District Council Data – Local Community Areas
– Indicative values hierarchy (based on 4 above tables sets)
Average Asking Prices Analysis - Flats and Houses
Settlement 1 Bed Flats
2 Bed Flats
2 Bed House
3 Bed House
4 Bed House
All Properties
North West Chilterns £135,961 £202,471 £247,816 £363,011 £572,846 £434,489
SW Chilterns & Marlow £167,190 £258,905 £294,222 £348,461 £558,217 £379,306
Chepping Wye Valley £173,275 £213,321 £257,769 £317,480 £499,106 £331,441
High Wycombe £130,924 £168,550 £196,137 £248,230 £389,388 £223,770
Overall £141,606 £194,669 £244,607 £301,218 £508,725 £310,491
Average Asking Price Analysis
Flats and Houses
1 Bed Flat - £141,606 2 Bed Flat - £194,669
2 Bed House
Terraced £226,846 Semi-
Detached £253,262 Detached £362,808
3 Bed House
Terraced £267,299 Semi-
Detached £282,205 Detached £394,084
4 Bed House
Terraced £366,213 Semi-
Detached £373,862 Detached £556,248

Wycombe District Council
D|S|P Housing & Development Consultants
Wycombe District Council – CIL Viability Assessment (DSP11023) – Appendix III 11
Average Asking Prices Analysis - Bungalows
Settlement 2 Bed
Bungalow 3 Bed
Bungalow 4 Bed
Bungalow All
Properties
SW Chilterns & Marlow £356,465 £510,256 £521,795 £474,077
Chepping Wye Valley £356,188 £444,363 £567,259 £441,019
North West Chilterns £294,850 £438,895 £542,767 £395,264
High Wycombe £256,141 £306,250 £406,661 £307,428
Overall £310,993 £422,774 £513,111 £402,671
Average Asking Price Analysis - Bungalows
2 Bed Bungalow - £310,993 3 Bed Bungalow - £422,774 4 Bed Bungalow - £513,111
September 2011, www.rightmove.co.uk

Wycombe District Council
D|S|P Housing & Development Consultants
Wycombe District Council – CIL Viability Assessment (DSP11023) – Appendix III 12
Wycombe DC Extended Residential Values Research October 2011
Zoopla Sourced example data 19.10.11
Source: www.zoopla.co.uk (19/10/2011)
Average values data (searched on settlement / locality names)
follows:
(Source of information in tables on this and following pages: www.zoopla.co.uk - October 2011)

Wycombe District Council
D|S|P Housing & Development Consultants
Wycombe District Council – CIL Viability Assessment (DSP11023) – Appendix III 13
Flackwell Heath Property
type Avg. current
value Ave. £ per sq ft. Ave. no. of beds
Ave. £ paid (last 12 months)
Detached £449,290 £264 3.7 £427,476
Semi-detached
£321,349 £271 3.1 £324,665
Terraced £252,425 - 2.9 £228,917
Flats £199,371 - 2.0 £202,500
Period Average Price Paid (£) No. of sales
Last year 338,843 54
Last 3 years 342,367 184
Last 5 years 340,128 364
Last 7 years 330,293 560
Average current value estimate: £371,048 Average current asking price: £353,193
Wooburn Green
Property type
Ave. current value
Ave. £ per sq ft. Ave. no. of beds Ave. £ paid
(last 12 months)
Detached £510,820 £323 3.8 £651,000
Semi-detached
£293,184 £291 3.0 £278,690
Terraced £266,686 £326 2.6 £295,100
Flats £204,346 £271 1.8 £164,286
Period Average Price Paid (£) No. of sales
Last year 332,462 52
Last 3 years 319,572 190
Last 5 years 316,188 402
Last 7 years 295,325 629
Average current value estimate: £330,089 Average current asking price: £368,062
Source: www.zoopla.co.uk - October 2011

Wycombe District Council
D|S|P Housing & Development Consultants
Wycombe District Council – CIL Viability Assessment (DSP11023) – Appendix III 14
Bourne End Property
type Ave. current
value Ave. £ per sq ft. Ave. no. of beds
Ave. £ paid (last 12 months)
Detached £704,255 £326 4.0 £662,273
Semi-detached
£355,119 £322 3.3 £395,905
Terraced £310,070 £310 2.7 £254,996
Flats £242,836 £303 1.9 £227,555
Period Average Price Paid (£) No. of sales
Last year 450,377 68
Last 3 years 414,421 249
Last 5 years 427,593 462
Last 7 years 411,988 701
Average current value estimate: £467,623 Average current asking price: £749,843 (only 9 properties)
High Wycombe
Property type
Ave. current value
Ave. £ per sq ft. Ave. no. of beds Ave. £ paid
(last 12 months)
Detached £451,749 £284 3.9 £437,216
Semi-detached
£248,020 £263 3.1 £250,577
Terraced £215,544 £263 2.7 £223,591
Flats £161,530 £256 1.7 £162,361
Period Average Price Paid (£) No. of sales
Last year 273,387 1,224
Last 3 years 271,785 4,049
Last 5 years 270,834 8,977
Last 7 years 260,647 13,817
Average current value estimate: £285,131 Average current asking price: £297,803
Source: www.zoopla.co.uk - October 2011

Wycombe District Council
D|S|P Housing & Development Consultants
Wycombe District Council – CIL Viability Assessment (DSP11023) – Appendix III 15
Loudwater Property
type Ave. current
value Ave. £ per sq ft. Ave. no. of beds
Ave. £ paid (last 12 months)
Detached £370,564 £254 3.6 £399,375
Semi-detached
£259,944 £272 3.0 £279,700
Terraced £228,722 - 2.5 £259,650
Flats £171,268 £203 1.8 £138,000
Period Average Price Paid (£) No. of sales
Last year 280,180 15
Last 3 years 231,131 63
Last 5 years 244,136 156
Last 7 years 231,274 235
Average current value estimate: £260,405 Average current asking price: £241,933 (9 properties)
Lane End
Property type
Ave. current value
Ave. £ per sq ft. Ave. no. of beds Ave. £ paid
(last 12 months)
Detached £464,499 £286 3.7 £332,350
Semi-detached
£263,175 £276 3.0 £259,333
Terraced £219,032 £290 2.7 £215,300
Flats £248,436 - 1.0 £370,000
Period Average Price Paid (£) No. of sales
Last year 287,545 22
Last 3 years 303,626 79
Last 5 years 294,476 160
Last 7 years 285,080 265
Average current value estimate: £312,390 Average current asking price: £487,488 (12 properties)

Wycombe District Council
D|S|P Housing & Development Consultants
Wycombe District Council – CIL Viability Assessment (DSP11023) – Appendix III 16
Hazlemere Property
type Ave. current
value Ave. £ per sq ft. Ave. no. of beds
Ave. £ paid (last 12 months)
Detached £419,276 £272 3.9 £442,623
Semi-detached
£273,951 £264 3.2 £267,634
Terraced £244,796 £265 3.0 £257,409
Flats £235,440 £282 2.1 £226,362
Period Average Price Paid (£) No. of sales
Last year 311,225 86
Last 3 years 301,370 324
Last 5 years 312,537 637
Last 7 years 299,680 959
Average current value estimate: £313,149 Average current asking price: £348,375
Downley
Property type
Ave. current value
Ave. £ per sq ft. Ave. no. of beds Ave. £ paid
(last 12 months)
Detached £369,550 £271 3.8 £386,136
Semi-detached
£257,217 £270 3.1 £262,997
Terraced £232,196 £326 2.8 £223,783
Flats £177,669 - 2.0 £205,062
Period Average Price Paid (£) No. of sales
Last year 273,935 48
Last 3 years 263,357 159
Last 5 years 268,632 279
Last 7 years 260,254 397
Average current value estimate: £285,230 Average current asking price: £287,705
Source: www.zoopla.co.uk - October 2011
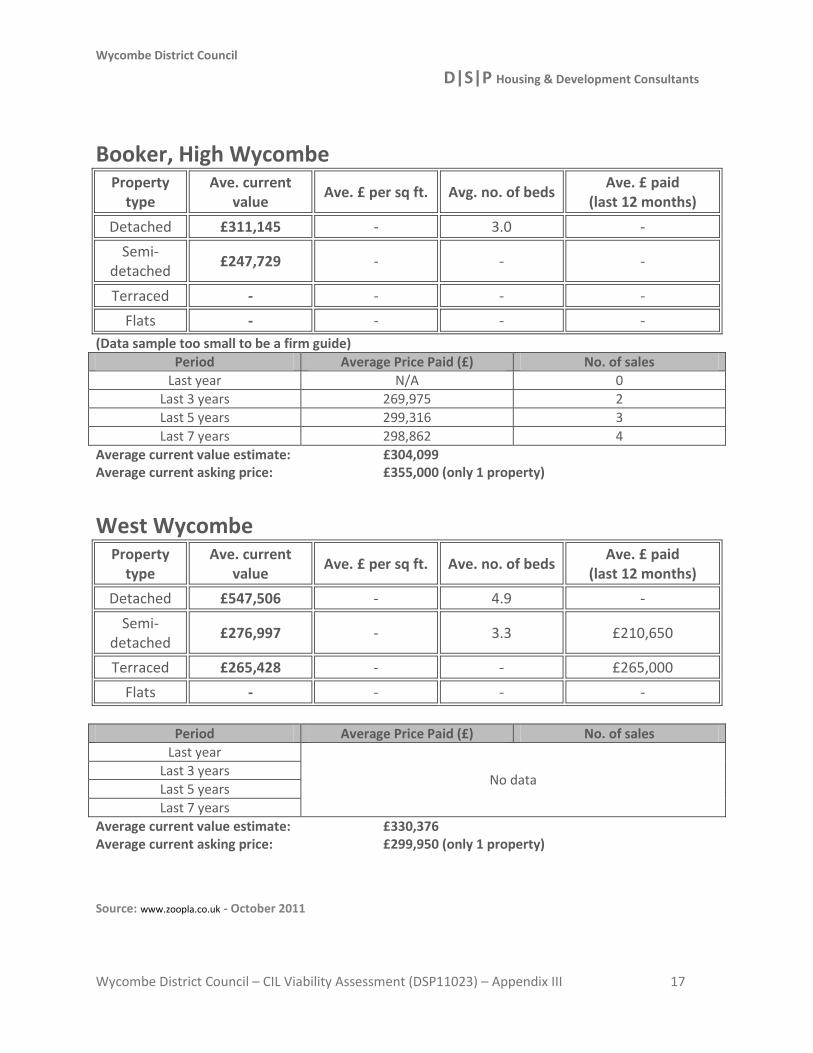
Wycombe District Council
D|S|P Housing & Development Consultants
Wycombe District Council – CIL Viability Assessment (DSP11023) – Appendix III 17
Booker, High Wycombe Property
type Ave. current
value Ave. £ per sq ft. Avg. no. of beds
Ave. £ paid (last 12 months)
Detached £311,145 - 3.0 -
Semi-detached
£247,729 - - -
Terraced - - - -
Flats - - - -
(Data sample too small to be a firm guide)
Period Average Price Paid (£) No. of sales
Last year N/A 0
Last 3 years 269,975 2
Last 5 years 299,316 3
Last 7 years 298,862 4
Average current value estimate: £304,099 Average current asking price: £355,000 (only 1 property)
West Wycombe
Property type
Ave. current value
Ave. £ per sq ft. Ave. no. of beds Ave. £ paid
(last 12 months)
Detached £547,506 - 4.9 -
Semi-detached
£276,997 - 3.3 £210,650
Terraced £265,428 - - £265,000
Flats - - - -
Period Average Price Paid (£) No. of sales
Last year
No data Last 3 years
Last 5 years
Last 7 years
Average current value estimate: £330,376 Average current asking price: £299,950 (only 1 property)
Source: www.zoopla.co.uk - October 2011

Wycombe District Council
D|S|P Housing & Development Consultants
Wycombe District Council – CIL Viability Assessment (DSP11023) – Appendix III 18
Marlow Property
type Ave. current
value Ave. £ per sq ft. Ave. no. of beds
Ave. £ paid (last 12 months)
Detached £672,219 £383 3.9 £662,357
Semi-detached
£405,494 £380 3.3 £406,043
Terraced £350,741 £350 2.8 £375,240
Flats £292,893 £406 1.9 £280,069
Period Average Price Paid (£) No. of sales
Last year 489,494 225
Last 3 years 455,590 757
Last 5 years 466,282 1,509
Last 7 years 443,346 2,339
Average current value estimate: £487,120 Average current asking price: £750,687
Stokenchurch
Property type
Ave. current value
Ave. £ per sq ft. Ave. no. of beds Ave. £ paid
(last 12 months)
Detached £367,821 £249 3.8 £332,993
Semi-detached
£246,314 £249 3.1 £306,250
Terraced £208,706 £231 2.9 £221,063
Flats £154,379 £242 1.9 £145,600
Period Average Price Paid (£) No. of sales
Last year 266,530 31
Last 3 years 246,761 122
Last 5 years 253,789 271
Last 7 years 244,219 439
Average current value estimate: £258,588 Average current asking price: £378,112
Source: www.zoopla.co.uk - October 2011

Wycombe District Council
D|S|P Housing & Development Consultants
Wycombe District Council – CIL Viability Assessment (DSP11023) – Appendix III 19
Radnage Property
type Ave. current
value Ave. £ per sq ft. Ave. no. of beds
Ave. £ paid (last 12 months)
Detached £620,567 £337 4.1 £577,917
Semi-detached
£395,004 - 3.6 £477,667
Terraced £297,864 - 2.0 -
Flats - - - -
Period Average Price Paid (£) No. of sales
Last year 544,900 9
Last 3 years 589,370 23
Last 5 years 619,223 43
Last 7 years 557,548 63
Average current value estimate: £570,620 Average current asking price: £265,000 (only 2 properties)
Ibstone
Property type
Ave. current value
Ave. £ per sq ft. Ave. no. of beds Ave. £ paid
(last 12 months)
Detached £775,356 £349 4.3 -
Semi-detached
£353,644 - 3.8 -
Terraced - - - -
Flats - - - -
Period Average Price Paid (£) No. of sales
Last year N/A 0
Last 3 years 826,643 7
Last 5 years 702,714 14
Last 7 years 690,091 22
Average current value estimate: £677,284 Average current asking price: £1,028,750 (only 4 properties)
Source: www.zoopla.co.uk - October 2011

Wycombe District Council
D|S|P Housing & Development Consultants
Wycombe District Council – CIL Viability Assessment (DSP11023) – Appendix III 20
Turville Property
type Ave. current
value Ave. £ per sq ft. Ave. no. of beds
Ave. £ paid (last 12 months)
Detached £1,252,093 - - £800,000
Semi-detached
£441,724 - - -
Terraced £416,823 - - -
Flats £547,332 - - -
Period Average Price Paid (£) No. of sales
Last year 800,000 1
Last 3 years 904,600 5
Last 5 years 778,000 10
Last 7 years 619,400 15
Average current value estimate: £696,446 Average current asking price: £N/A (0 properties)
Fawley
Property type
Ave. current value
Ave. £ per sq ft. Ave. no. of beds Ave. £ paid
(last 12 months)
Detached £1,795,059 - 4.7 -
Semi-detached
£642,236 - - -
Terraced - - - -
Flats - - - -
Period Average Price Paid (£) No. of sales
Last year N/A 0
Last 3 years 1,154,250 4
Last 5 years 1,333,555 9
Last 7 years 1,097,799 15
Average current value estimate: £1,590,185 Average current asking price: £1,600,000 (1 property)
Source: www.zoopla.co.uk - October 2011

Wycombe District Council
D|S|P Housing & Development Consultants
Wycombe District Council – CIL Viability Assessment (DSP11023) – Appendix III 21
Hambleden Property
type Ave. current
value Ave. £ per sq ft. Ave. no. of beds
Ave. £ paid (last 12 months)
Detached £1,428,126 £531 4.9 £1,703,703
Semi-detached
£524,426 £407 3.0 £1,600,000
Terraced £552,041 - 3.2 -
Flats £399,150 £438 2.0 £249,950
Period Average Price Paid (£) No. of sales
Last year 1,392,212 5
Last 3 years 1,227,680 17
Last 5 years 1,057,783 32
Last 7 years 954,056 49
Average current value estimate: £933,996 Average current asking price: £1,250,000 (only 1 property)
Medmenham
Property type
Ave. current value
Ave. £ per sq ft. Ave. no. of beds Ave. £ paid
(last 12 months)
Detached £1,410,578 £360 4.0 £727,500
Semi-detached
£678,366 £517 3.5 -
Terraced £550,675 - 2.2 -
Flats - - - -
Period Average Price Paid (£) No. of sales
Last year 727,500 2
Last 3 years 577,583 12
Last 5 years 1,059,850 20
Last 7 years 964,199 29
Average current value estimate: £1,066,990 Average current asking price: £1,850,000 (only 2 properties)
Source: www.zoopla.co.uk - October 2011

Wycombe District Council
D|S|P Housing & Development Consultants
Wycombe District Council – CIL Viability Assessment (DSP11023) – Appendix III 22
Horsleys Green Property
type Ave. current
value Ave. £ per sq ft. Ave. no. of beds
Ave. £ paid (last 12 months)
Detached £478,443 £360 3.2 £335,000
Semi-detached
£262,329 - - -
Terraced - - - -
Flats - - - -
Period Average Price Paid (£) No. of sales
Last year
No data Last 3 years
Last 5 years
Last 7 years
Average current value estimate: £463,856 Average current asking price: £N/A (0 properties)
Studley Green
Property type
Ave. current value
Ave. £ per sq ft. Ave. no. of beds Ave. £ paid
(last 12 months)
Detached £366,231 - 3.5 -
Semi-detached
£321,970 - 3.2 -
Terraced - - - -
Flats - - - -
Period Average Price Paid (£) No. of sales
Last year
No data Last 3 years
Last 5 years
Last 7 years
Average current value estimate: £352,163 Average current asking price: £N/A (0 properties)
Source: www.zoopla.co.uk - October 2011

Wycombe District Council
D|S|P Housing & Development Consultants
Wycombe District Council – CIL Viability Assessment (DSP11023) – Appendix III 23
Beacons Bottom Property
type Ave. current
value Ave. £ per sq ft. Ave. no of beds
Ave. £ paid (last 12 months)
Detached £444,286 £247 3.9 -
Semi-detached
£360,651 - 3.2 £283,000
Terraced £288,123 - - -
Flats - - - -
Period Average Price Paid (£) No. of sales
Last year
No data Last 3 years
Last 5 years
Last 7 years
Average current value estimate: £420,759 Average current asking price: £N/A (0 properties)
Bledlow Ridge
Property type
Ave. current value
Ave. £ per sq ft. Ave. no. of beds Ave. £ paid
(last 12 months)
Detached £632,307 £306 4.1 £586,333
Semi-detached
£404,519 - 3.5 £295,000
Terraced - - - -
Flats - - - -
Period Average Price Paid (£) No. of sales
Last year 513,500 8
Last 3 years 493,714 21
Last 5 years 565,914 46
Last 7 years 519,263 79
Average current value estimate: £598,723 Average current asking price: £708,317 (3 properties only)
Source: www.zoopla.co.uk - October 2011

Wycombe District Council
D|S|P Housing & Development Consultants
Wycombe District Council – CIL Viability Assessment (DSP11023) – Appendix III 24
Bradenham Property
type Ave. current
value Ave. £ per sq ft. Ave. no. of beds
Ave. £ paid (last 12 months)
Detached £726,297 - 4.3 -
Semi-detached
- - - -
Terraced - - - -
Flats - - - -
Period Average Price Paid (£) No. of sales
Last year
No data Last 3 years
Last 5 years
Last 7 years
Average current value estimate: £420,759 Average current asking price: £N/A (0 properties)
Walters Ash
Property type
Ave. current value
Ave. £ per sq ft. Ave. no. of beds Ave. £ paid (last 12m)
Detached £468,322 £291 3.7 £475,990
Semi-detached
£298,935 - 3.3 £425,000
Terraced - - 3.0 -
Flats £138,577 - - -
Period Average Price Paid (£) No. of sales
Last year 467,492 6
Last 3 years 382,748 22
Last 5 years 384,336 37
Last 7 years 356,574 55
Average current value estimate: £382,388 Average current asking price: £302,475 (only 2 properties
Source: www.zoopla.co.uk - October 2011

Wycombe District Council
D|S|P Housing & Development Consultants
Wycombe District Council – CIL Viability Assessment (DSP11023) – Appendix III 25
Lacey Green Property
type Ave. current
value Ave. £ per sq ft. Ave. no. of beds
Ave. £ paid (last 12 months)
Detached £524,299 £282 4.1 £487,500
Semi-detached
£318,351 £219 3.6 £325,000
Terraced £287,712 - 3.5 £422,500
Flats £152,459 - - -
Period Average Price Paid (£) No. of sales
Last year 433,333 3
Last 3 years 403,338 17
Last 5 years 414,086 49
Last 7 years 416,680 76
Average current value estimate: £457,038 Average current asking price: £444,950 (only 2 properties)
Loosley Row
Property type
Ave. current value
Ave. £ per sq ft. Ave. no. of beds Ave. £ paid
(last 12 months)
Detached £678,977 £268 4.4 £712,500
Semi-detached
£384,768 - 3.0 -
Terraced £413,003 - - -
Flats - - - -
Period Average Price Paid (£) No. of sales
Last year 712,500 5
Last 3 years 575,893 14
Last 5 years 536,931 22
Last 7 years 521,666 33
Average current value estimate: £591,012 Average current asking price: £675,000 (1 property only)
Source: www.zoopla.co.uk - October 2011

Wycombe District Council
D|S|P Housing & Development Consultants
Wycombe District Council – CIL Viability Assessment (DSP11023) – Appendix III 26
Princes Risborough Property
type Ave. current
value Ave. £ per sq ft. Ave. no. of beds
Ave. £ paid (last 12 months)
Detached £538,161 £303 4.0 £489,917
Semi-detached
£285,976 £285 3.1 £292,623
Terraced £256,732 £271 2.6 £233,324
Flats £167,464 £234 1.9 £199,197
Period Average Price Paid (£) No. of sales
Last year 362,064 150
Last 3 years 372,484 425
Last 5 years 384,329 861
Last 7 years 371,024 1,288
Average current value estimate: £394,251 Average current asking price: £401,953
Monks Risborough
Property type
Ave. current value
Ave. £ per sq ft. Ave. no. of beds Ave. £ paid
(last 12 months)
Detached £494,460 £278 4.0 £462,048
Semi-detached
£271,873 - 2.9 £279,695
Terraced £251,833 - 2.3 £246,750
Flats £170,149 - - -
Period Average Price Paid (£) No. of sales
Last year 383,035 34
Last 3 years 393,524 55
Last 5 years 398,528 97
Last 7 years 390,795 124
Average current value estimate: £387,733 Average current asking price: £432,317
Source: www.zoopla.co.uk - October 2011

Wycombe District Council
D|S|P Housing & Development Consultants
Wycombe District Council – CIL Viability Assessment (DSP11023) – Appendix III 27
Longwick Property
type Ave. current
value Ave. £ per sq ft. Ave. no. of beds
Ave. £ paid (last 12 months)
Detached £400,509 £229 3.7 £510,450
Semi-detached
£306,734 - 3.2 -
Terraced £324,041 - 2.6 £246,750
Flats £242,991 - - -
Period Average Price Paid (£) No. of sales
Last year 466,500 6
Last 3 years 365,082 33
Last 5 years 362,586 70
Last 7 years 349,608 104
Average current value estimate: £357,675 Average current asking price: £332,475 (only 2 properties)
Little Kimble
Property type
Ave. current value
Ave. £ per sq ft. Ave. no. of beds Ave. £ paid
(last 12 months)
Detached £671,325 £330 4.4 £491,250
Semi-detached
£362,686 £332 3.0 £342,500
Terraced £314,749 - - -
Flats - - - -
Period Average Price Paid (£) No. of sales
Last year 416,875 4
Last 3 years 371,556 8
Last 5 years 470,830 15
Last 7 years 418,469 30
Average current value estimate: £506,128 Average current asking price: £399,475 (only 2 properties)
Source: www.zoopla.co.uk - October 2011

Wycombe District Council
D|S|P Housing & Development Consultants
Wycombe District Council – CIL Viability Assessment (DSP11023) – Appendix III 28
Great Kimble Property
type Ave. current
value Ave. £ per sq ft. Ave. no. of beds
Ave. £ paid (last 12 months)
Detached £592,426 £365 4.0 -
Semi-detached
£318,026 - 2.5 £285,000
Terraced £238,072 - - -
Flats £185,297 - - -
Period Average Price Paid (£) No. of sales
Last year 285,000 3
Last 3 years 451,853 13
Last 5 years 405,490 21
Last 7 years 381,758 32
Average current value estimate: £445,609 Average current asking price: £253,500 (only 4 properties)
Ellesborough
Property type
Ave. current value
Ave. £ per sq ft. Ave. no. of beds Ave. £ paid
(last 12 months)
Detached £673,156 - 4.7 £662,500
Semi-detached
£121,232 - - -
Terraced - - - -
Flats - - - -
Period Average Price Paid (£) No. of sales
Last year 662,500 1
Last 3 years 800,000 2
Last 5 years 765,000 3
Last 7 years 765,000 3
Average current value estimate: £581,169 Average current asking price: £N/A (0 properties)
Source: www.zoopla.co.uk - October 2011

Wycombe District Council
D|S|P Housing & Development Consultants
Wycombe District Council – CIL Viability Assessment (DSP11023) – Appendix III 29
Great Hampden Property
type Ave. current
value Ave. £ per sq ft. Ave. no. of beds Ave. £ paid (last 12m)
Detached - - - -
Semi-detached
£509,795 - - -
Terraced - - - -
Flats - - - -
Period Average Price Paid (£) No. of sales
Last year N/A 0
Last 3 years N/A 0
Last 5 years 525,000 1
Last 7 years 525,000 1
Average current value estimate: £509,795 Average current asking price: £N/A (0 properties)
Little Hampden
Property type
Ave. current value
Ave. £ per sq ft. Ave. no. of beds Ave. £ paid (last 12m)
Detached £1,225,300 - 4.3 -
Semi-detached
£523,470 - 3.0 -
Terraced - - - -
Flats - - - -
Period Average Price Paid (£) No. of sales
Last year N/A 0
Last 3 years 920,000 2
Last 5 years 871,667 3
Last 7 years 765,000 4
Average current value estimate: £1,069,338 Average current asking price: £N/A (0 properties) Source: www.zoopla.co.uk - October 2011

Wycombe District Council
D|S|P Housing & Development Consultants
Wycombe District Council – CIL Viability Assessment (DSP11023) – Appendix III 30
Indicative values hierarchy – Values patterns DSP analysis from above based zoopla research – Highest to lowest (Based on ave. sold prices, last 5 years from above tables – more data across area on that basis, rather than taking a more recent view only)
Fawley
1,333,555
Medmenham
1,059,850
Hambleden
1,057,783
Little Hampden
871,667
Turville
778,000
Ellesborough
765,000
Ibstone
702,714
Radnage
619,223
Bledlow Ridge
565,914
Loosley Row
536,931
Great Hampden
525,000
Little Kimble
470,830
Marlow
466,282
Bourne End
427,593
Lacey Green
414,086
Great Kimble
405,490
Monks Risborough
398,528
Walters Ash
384,336
Princes Risborough
384,329
Longwick
362,586
Flackwell Heath
340,128
Wooburn Green
316,188

Wycombe District Council
D|S|P Housing & Development Consultants
Wycombe District Council – CIL Viability Assessment (DSP11023) – Appendix III 31
Hazlemere
312,537
Booker, High Wycombe
299,316
Lane End
294,476
High Wycombe
270,834
Downley
268,632
Stokenchurch
253,789
Loudwater
244,136
Note: Areas excluded from the above (no comparable data):
West Wycombe
No data
Horsleys Green
No data
Studley Green
No data
Beacons Bottom
No data
Bradenham
No data Other notes on above zoopla sourced review information:
Totteridge – not recognised (part of wider postcode view only)
Cressex area – no data
Hughenden – no data
Handy Cross – no data
Bledlow-cum-Saunderton – no data
There will always be exceptions and imperfections in any attempt to define values patterns /areas.

Wycombe District Council
D|S|P Housing & Development Consultants
Wycombe District Council – CIL Viability Assessment (DSP11023) – Appendix III 32
Residential Values Summary
Overall, for the purposes of this strategic overview of the viability scope for CIL, we decided to
focus our appraisals around the following values range - represented by what we refer to as
Values Levels 1 to 5 (1 being the lowest level trialed; 5 the highest).
In very general terms the value levels appraised can be loosely aligned with High Wycombe
values in or around value levels 2-3; Princes Risborough value levels around 2-4 and Marlow at
the upper end of 3-4, occasionally reaching value level 5.
WDC new build housing assumptions - Values Range
Value Level
1-Bed Flats 2-Bed Flats 2-Bed
Houses 3-Bed
Houses 4-Bed
Houses £ / sq m
guide £ / sq ft
guide
1 £112,500 £150,000 £187,500 £237,500 £312,500 £2,500 £232
2 £135,000 £180,000 £225,000 £285,000 £375,000 £3,000 £278
3 £157,500 £210,000 £262,500 £332,500 £437,500 £3,500 £325
4 £180,000 £240,000 £300,000 £380,000 £500,000 £4,000 £372
5 £202,500 £270,000 £337,500 £427,500 £562,500 £4,500 £418
Source: DSP from overview of residential research (indicative prices based on assumed market dwellings floor areas – key information being the
range of per sq ft /m sales values levels, which can also be applied to other dwelling types and sizes. In practice dwelling sizes will vary – the
above have been selected for the purposes of this study. Value levels 1 to 5 indicate increasing values as seen varying through location and / or
market conditions).
Values assume:
1-bed flat at 45 sq m (484 sq ft)
2-bed flat at 60 sq m (646 sq ft)
2-bed house at 75 sq m (807 sq ft)
3-bed house at 95 sq m (1023 sq ft)
4-bed house at 125 sq m (1346 sq ft)
(But note that the £/sq m (or £/sq ft) rates are the key measure and can be applied to any property
types / sizes)

Wycombe District Council
D|S|P Housing & Development Consultants
Wycombe District Council – CIL Viability Assessment (DSP11023) – Appendix III 33
Commercial Property – Rents, Yields and other information
– Examples and indications as available
Type / Details Size – sq m Rental or freehold price indication
Yield indication (where known)
Source / Other / comments
INDUSTRIAL / Warehousing - Examples
9 Wycombe Industrial Mall, West End Street, High Wycombe
165 sq m Quoting £12,000 p.a. rental (£73/sq m) or freehold at £165,000 (£1000/sq m).
(suggests circa 7.3% yield indication, but unconfirmed)
Wycombe DC Land and Property listing September 2011. Agents Brown & Merry Commercial.
10 Wycombe Industrial Mall, West End Street, High Wycombe
97 sq m Quoting £10,500 p.a. rental (£108/sq m) or freehold at £160,000 (£1649/sq m).
(suggests circa 6.6% yield indication, but unconfirmed)
Wycombe DC Land and Property listing September 2011. Agents Brown & Merry Commercial.
Lords Mill, Oakridge Road, High Wycombe
156 sq m Quoting £96/sq m.
EGi Availability – as at 12/09/11. To let – Duncan Bailey Kennedy. Currently used as offices.
Units G & H, Hillbottom Road, Sands Industrial Estate, Wycombe
1282 – 2592 sq m
Quoting £7/sq ft i.e. £75/sq m
EGi Availability – as at 12/09/11. To let – Aitchison Raffety
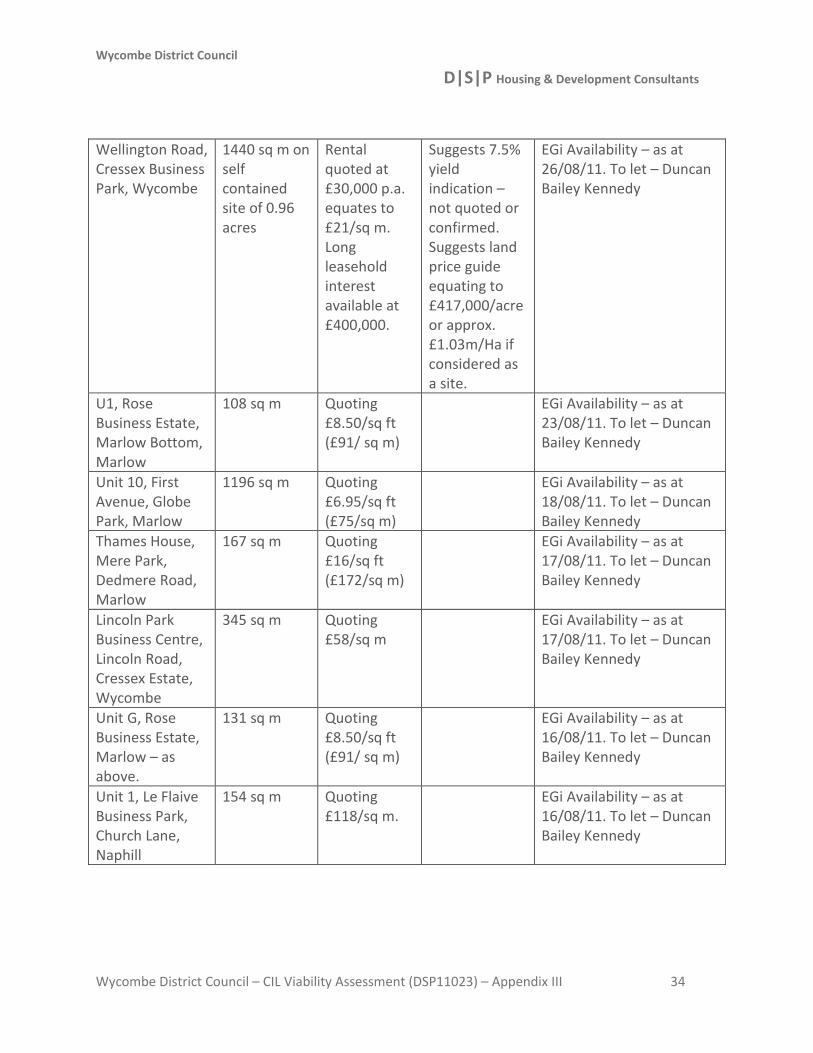
Wycombe District Council
D|S|P Housing & Development Consultants
Wycombe District Council – CIL Viability Assessment (DSP11023) – Appendix III 34
Wellington Road, Cressex Business Park, Wycombe
1440 sq m on self contained site of 0.96 acres
Rental quoted at £30,000 p.a. equates to £21/sq m. Long leasehold interest available at £400,000.
Suggests 7.5% yield indication – not quoted or confirmed. Suggests land price guide equating to £417,000/acre or approx. £1.03m/Ha if considered as a site.
EGi Availability – as at 26/08/11. To let – Duncan Bailey Kennedy
U1, Rose Business Estate, Marlow Bottom, Marlow
108 sq m Quoting £8.50/sq ft (£91/ sq m)
EGi Availability – as at 23/08/11. To let – Duncan Bailey Kennedy
Unit 10, First Avenue, Globe Park, Marlow
1196 sq m Quoting £6.95/sq ft (£75/sq m)
EGi Availability – as at 18/08/11. To let – Duncan Bailey Kennedy
Thames House, Mere Park, Dedmere Road, Marlow
167 sq m Quoting £16/sq ft (£172/sq m)
EGi Availability – as at 17/08/11. To let – Duncan Bailey Kennedy
Lincoln Park Business Centre, Lincoln Road, Cressex Estate, Wycombe
345 sq m Quoting £58/sq m
EGi Availability – as at 17/08/11. To let – Duncan Bailey Kennedy
Unit G, Rose Business Estate, Marlow – as above.
131 sq m Quoting £8.50/sq ft (£91/ sq m)
EGi Availability – as at 16/08/11. To let – Duncan Bailey Kennedy
Unit 1, Le Flaive Business Park, Church Lane, Naphill
154 sq m Quoting £118/sq m.
EGi Availability – as at 16/08/11. To let – Duncan Bailey Kennedy

Wycombe District Council
D|S|P Housing & Development Consultants
Wycombe District Council – CIL Viability Assessment (DSP11023) – Appendix III 35
Unit 16 Lincoln Park Business Centre, Lincoln Road, Cressex Estate, Wycombe
202 sq m Quoting £81/sq m
EGi Availability – as at 16/08/11. To let – Duncan Bailey Kennedy
Norths Estate, Old Oxford Road, Piddington
76 sqm Quoting £91/sq m
EGi Availability – as at 16/08/11. To let – Duncan Bailey Kennedy
Unit 12, Wye Industrial Estate, London Road, Wycombe
182 sq m Quoting £118/sq m.
EGi Availability – as at 12/08/11. To let – Duncan Bailey Kennedy
Unit B5 Regent Park, Summerleys Road, Princes Risborough
180 sq m Quoting £9.25/sq ft (£100/sq m)
EGi Availability – as at 27/07/11. Last of these units available - Stupples.
2 Hughenden Avenue, High Wycombe
2015 sq m Quoting £75/sq m. Freehold also available quoting £1.65m
(Suggests circa 9% indication – not quoted)
EGi Availability – as at 16/06/11. To let / for sale – Gerald Eve
Rose Industrial Estate, Marlow
104 – 212 sq m
Quoting £7.50/sq ft (£81/sq m)
EGi Availability – as at 16/06/11. To let – Kempton Carr Croft
Ministry Wharf, Saunderton, Wycombe
157 sq m Quoting approx £76/ sq m
EGi Availability – as at 16/06/11. To let - Stupples
6 Soho Mills, Wooburn Green
233 sq m Quoting £59/sq m
EGi Availability – as at 16/06/11. To let – Deriaz Slater
Unit 5, Tannery Road, Gomm Road, Wycombe
930 sq m Quoting £42.50/sq m. May also be available for sale – no price indicated.
EGi Availability – as at 16/06/11. To let – Duncan Bailey Kennedy

Wycombe District Council
D|S|P Housing & Development Consultants
Wycombe District Council – CIL Viability Assessment (DSP11023) – Appendix III 36
Units A & C Hillbottom Road, Sands Industrial Estate – as above
1421 – 1746 sq m
Quoting £7/sq ft i.e. £75/sq m
EGi Availability – as at 14/06/11. To let – Aitchison Raffety
Building 2 Hillbottom Road – as above
1681 sq m Quoting £42.50/sq m - warehouse
EGi Availability – as at 13/06/11. To let – Duncan Bailey Kennedy
Soundsorba House, Shaftsbury Street, Wycombe
170 sq m Quoting £82/sq m
EGi Availability – as at 10/06/11. To let – Duncan Bailey Kennedy
Wellington Road, Cressex Business Park, Wycombe
516 sq m Quoting £7/sq ft (£75/sq m). Currently set us as trade counter / warehousing.
EGi Availability – as at 07/06/11. To let – Deriaz Slater
Union Estate, 1-4 Hillbottom Road; as above
471 – 694 sq m
Quoting £6/sq ft (£65/sq m). Indication may also be available freehold.
EGi Availability – as at 07/06/11. To let – Deriaz Slater
9 York Way, Cressex Business Park, Wycombe
120 sq m Quoting £117/sq m rental or £210,000 freehold (indicates £1750/sq m freehold)
(Suggests circa 6.6% yield indication – not quoted)
EGi Availability – as at 01/06/11 - Stupples

Wycombe District Council
D|S|P Housing & Development Consultants
Wycombe District Council – CIL Viability Assessment (DSP11023) – Appendix III 37
Unit 4, Fieldhouse lane, Marlow
321 sq m Quoting £93/sq m rental or available long leasehold from WDC quoting £425,000 (£1324/sq m freehold).
(Suggests circa 7% yield indication – not quoted)
EGi Availability – as at 25/05/11. To let – Duncan Bailey Kennedy
Unit 4 Barnes Wallis Court, Wellington Road, Cressex Estate, Wycombe
316 sq m Quoting £95/sq m
EGi Availability – as at 17/05/11. To let – Duncan Bailey Kennedy
Knaves Beech Way, Wycombe
400 sq m Quoting £96/sq m.
EGi Availability – as at 13/05/11. To let – Philip Marsh Collins Deung
134-136 Lane End Road, Wycombe
1292 sq m Quoting £48/sq m.
EGi Availability – as at 05/05/11. To let – Deriaz Slater
15 Station Road, Wycombe
239 sq m Quoting £125/sq m
EGi Availability – as at 09/02/11. To let - Stupples
Maygilt House, Grafton Street, Wycombe
319 sq m Quoting £88/sq m to rent or £325,000 freehold (indicates £1019/sq m freehold)
(Suggests yield indication approx 8.5%)
EGi Availability – as at 26/01/11. To let - Stupples
Dashwood Works Industrial Centre
307 sq m Quoting £39/sq m
EGi Availability – as at 07/12/10. To let – Stupples
Unit 12 London Road, Wycombe
182 sq m Quoting £118/sq m
EGi Availability – as at 01/12/10. To let - Stupples
10 Britannia Industrial Park
132 sq m Quoting £106/sq m
EGi Availability – as at 10/11/10. To let – Deriaz Slater

Wycombe District Council
D|S|P Housing & Development Consultants
Wycombe District Council – CIL Viability Assessment (DSP11023) – Appendix III 38
19 Lincoln Road, Cressex Estate, Wycombe
248 sq m Quoting from £53/sq m)
EGi Availability – as at 13/10/10. To let – Deriaz Slater
Brow Business Centre, Copyground Lane, Wycombe
99 sq m Quoting £91/sq m
EGi Availability – as at 17/08/11. To let – Stupples.
OUT OF TOWN / LARGE RETAIL - Examples
Retail warehouses (large non-food retail – out of centres)
Retail warehouse, Bellfield Road, High Wycombe (Carpetright unit) HP13 5HN
752 sq m £160/sq m VOA Rating list 01/04/10 – current rateable value (RV) £120,000
Ditto (Comet Unit)
532 sq m £160/ sq m VOA Rating list 01/04/10 – current rateable value (RV) £85,000
Ditto (Focus DIY unit)
3243 sq m £149/sq m VOA Rating list 01/04/10 – current rateable value (RV) £457,500
185-197 Gordon Road, High Wycombe HP13 6AR
1261 sq m £110/sq m VOA Rating list 01/04/10 – current rateable value (RV) £80,000
Ditto (Majestic Wine Unit)
254 sq m £160/ sq m VOA Rating list 01/04/10 – current rateable value (RV) £40,500
Unit D1, Knaves Beech Business Centre, Davies Way, Loudwater, HP10 9QY
3030 sq m £150/ sq m VOA Rating list 01/04/10 – current rateable value (RV) £435,000
Ditto – Unit D2 972 sq m £150/sq m VOA Rating list 01/04/10 – current rateable value (RV) £145,000

Wycombe District Council
D|S|P Housing & Development Consultants
Wycombe District Council – CIL Viability Assessment (DSP11023) – Appendix III 39
Ditto – Unit E 5178 sq m £150/sq m VOA Rating list 01/04/10 – current rateable value (RV) £695,000
300 London Road High Wycombe, HP11 1LJ
3681 sq m £220/ sq m VOA Rating list 01/04/10 – current rateable value (RV) £620,000
330-336 London Road, High Wycombe, HP11 1LH
1599 sq m £220/ sq m VOA Rating list 01/04/10 – current rateable value (RV) £365,000
635 London Road, High Wycombe, HP11 1EZ
909 sq m £220/ sq m VOA Rating list 01/04/10 – current rateable value (RV) £202,000
412-416 London Road, High Wycombe, HP11 1LP (Tile Trading unit)
517 sq m £155 / sq m VOA Rating list 01/04/10 – current rateable value (RV) £60,000
London Road, High Wycombe, HP11 1EZ (B&Q Unit)
4008 sq m £220/sq m VOA Rating list 01/04/10 – current rateable value (RV) £780,000
29-31 Oxford Street, High Wycombe HP11 2DJ
497 sq m £200/ sq m VOA Rating list 01/04/10 – current rateable value (RV) £99,500
Pink Road, Lacey Green, Princes Risborough, HP27 0PG
2036 sq m £32.50/sq m VOA Rating list 01/04/10 –
Queen Alexandra Road, High Wycombe, HP11 2JX (Staples Office store unit)
1426 sq m £190/sq m VOA Rating list 01/04/10 – current rateable value (RV) £270,000.

Wycombe District Council
D|S|P Housing & Development Consultants
Wycombe District Council – CIL Viability Assessment (DSP11023) – Appendix III 40
Short Street, High Wycombe, HP11 2QH (Dulux Decorator Centre Unit)
609 sq m £70/sq m VOA Rating list 01/04/10 – current rateable value (RV) £36,500
30-32 The Parade, Marlow Road, Bourne End, SL8 5SY
796 sq m £67.50/sq m VOA Rating list 01/04/10 – current rateable value (RV) £45,500
Unit A Wycombe Retail Park, Ryemead Way, HP11 1FY
1872 sq m £285/sq m VOA Rating list 01/04/10 – current rateable value (RV) £555,000
Ditto – Unit B 929 sq m £285/sq m VOA Rating list 01/04/10 – current rateable value (RV) £299,000
Ditto – Unit C 3250 sq m £285/sq m VOA Rating list 01/04/10 – current rateable value (RV) £815,000
Ditto – Unit D1 888 sq m £285/sq m VOA Rating list 01/04/10 – current rateable value (RV) £267,500
Ditto – Unit D2/D3
1085 sq m £285/sq m VOA Rating list 01/04/10 – current rateable value (RV) £350,000
Ditto – Unit D4 794 sq m £285/sq m VOA Rating list 01/04/10 – current rateable value (RV) £236,000
Ditto – Unit E 1476 sq m £285/sq m VOA Rating list 01/04/10 – current rateable value (RV) £430,000
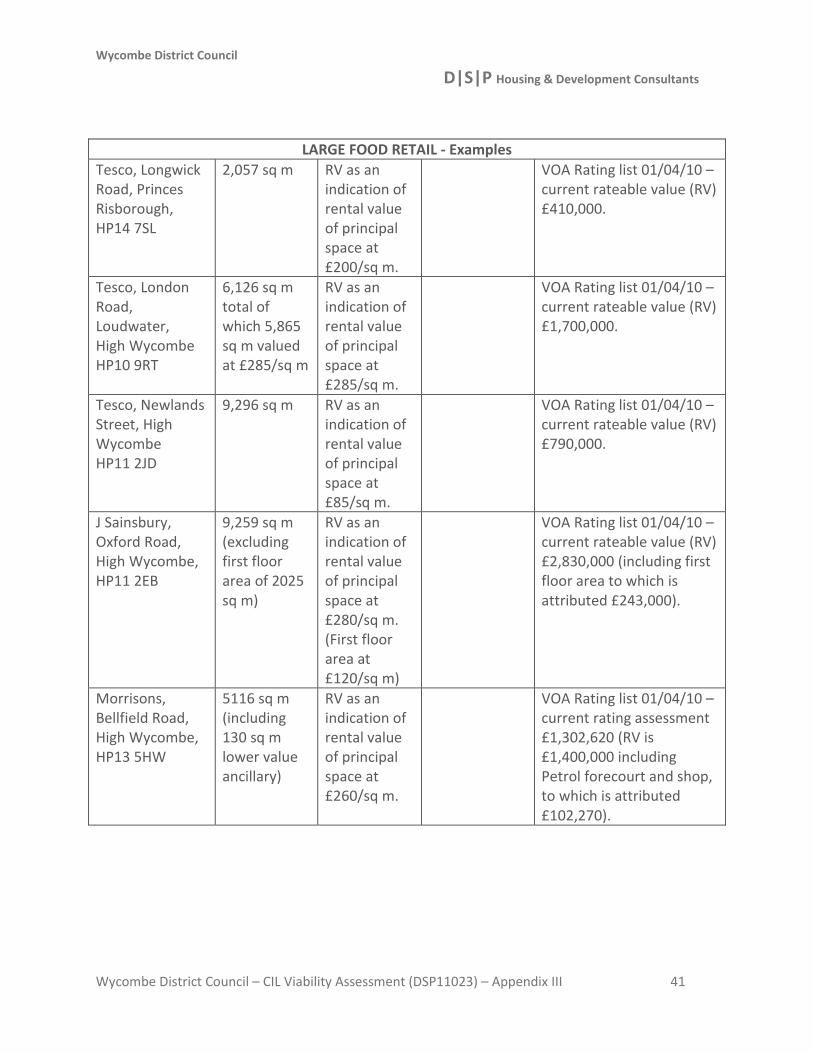
Wycombe District Council
D|S|P Housing & Development Consultants
Wycombe District Council – CIL Viability Assessment (DSP11023) – Appendix III 41
LARGE FOOD RETAIL - Examples
Tesco, Longwick Road, Princes Risborough, HP14 7SL
2,057 sq m RV as an indication of rental value of principal space at £200/sq m.
VOA Rating list 01/04/10 – current rateable value (RV) £410,000.
Tesco, London Road, Loudwater, High Wycombe HP10 9RT
6,126 sq m total of which 5,865 sq m valued at £285/sq m
RV as an indication of rental value of principal space at £285/sq m.
VOA Rating list 01/04/10 – current rateable value (RV) £1,700,000.
Tesco, Newlands Street, High Wycombe HP11 2JD
9,296 sq m RV as an indication of rental value of principal space at £85/sq m.
VOA Rating list 01/04/10 – current rateable value (RV) £790,000.
J Sainsbury, Oxford Road, High Wycombe, HP11 2EB
9,259 sq m (excluding first floor area of 2025 sq m)
RV as an indication of rental value of principal space at £280/sq m. (First floor area at £120/sq m)
VOA Rating list 01/04/10 – current rateable value (RV) £2,830,000 (including first floor area to which is attributed £243,000).
Morrisons, Bellfield Road, High Wycombe, HP13 5HW
5116 sq m (including 130 sq m lower value ancillary)
RV as an indication of rental value of principal space at £260/sq m.
VOA Rating list 01/04/10 – current rating assessment £1,302,620 (RV is £1,400,000 including Petrol forecourt and shop, to which is attributed £102,270).

Wycombe District Council
D|S|P Housing & Development Consultants
Wycombe District Council – CIL Viability Assessment (DSP11023) – Appendix III 42
Asda, Crest Road, High Wycombe, HP11 1UA
9,000 sq m main areas plus approx 500 sq m ancillary
Main areas at £295/sq m; ancillary at max. £73/sq m.
VOA Rating list 01/04/10 – current RV is £2,750,000 including Petrol forecourt and shop, to which is attributed £70,890).
RETAIL – Centres / Local Parades - Examples
5 Kingswood Parade, Marlow Bottom
56 sq m Rental indication £11,500 p.a. (£205/sq m) or freehold quoted at £150,000 (£2679/sq m)
(Suggests yield indication of 7.7%)
Wycombe DC Land & Property web pages Sept 2011. Agents DBK.
High Street, Princes Risborough
301 Rental indication £52,500 p.a. after proposed works. Indicates circa £174/sq m.
EGi Availability – as at 06/09/11. Shop in local parade. To let after extension works – Duncan Bailey Kennedy.
Duke Street, Princes Risborough
Approx 127 sq m.
Rental indication £20,000 p.a. after discounted year 1 rent. Indicates circa £157/sq m. Freehold price indication of £275,000 also quoted.
(Suggests yield indication approx. 7.3% at full rent but unconfirmed).
EGi Availability – as at 25/08/11. Shop in local parade. To let / for sale – Duncan Bailey Kennedy.

Wycombe District Council
D|S|P Housing & Development Consultants
Wycombe District Council – CIL Viability Assessment (DSP11023) – Appendix III 43
Unit 7, Hazlemere Park Parade, Hazlemere, Wycombe
60 sq m Rental indication approx. £283/sq m overall
EGi Availability – as at 25/08/11. Shop in local parade. To let – Duncan Bailey Kennedy.
Unit 5, 27-32 White Hart Street, Wycombe
166 sq m Rental indication approx. £390/sq m overall
EGi Availability – as at 25/08/11. Non-prime town centre retail. To let – Duncan Bailey Kennedy.
78 High Street Princes Risborough
35 sq m Rental indication approx. £271/sq m overall.
EGi Availability – as at 05/08/11. To let – James A Baker
55 West Street, Marlow
65 sq m Rental indication approx. £384/sq m overall.
EGi Availability – as at 06/07/11. To let – Deriaz Slater Commercial.
24 West Street, Marlow
191 sq m Rental indication approx. £366/sq m overall
EGi Availability – as at 06/07/11. To let – Deriaz Slater Commercial. Restaurant/cafe.
Acorn House, 3-4 Straight Bit, Flackwell Heath
79 sq m Rental indication approx. £215/sq m overall
EGi Availability – as at 16/06/10. (Shop unit within local parade). To let – Aitchison Raffety.
102 Easton Street, Wycombe
42 sq m Rental indication approx. £370/sq m overall
EGi Availability – as at 16/06/11. Non-prime town centre retail. To let – Aitchison Raffety.
4-5 Castle Street, Wycombe
149 sq m Rental indication approx. £215/sq m overall
EGi Availability – as at 16/06/11. Non-prime town centre retail. To let – Stupples.
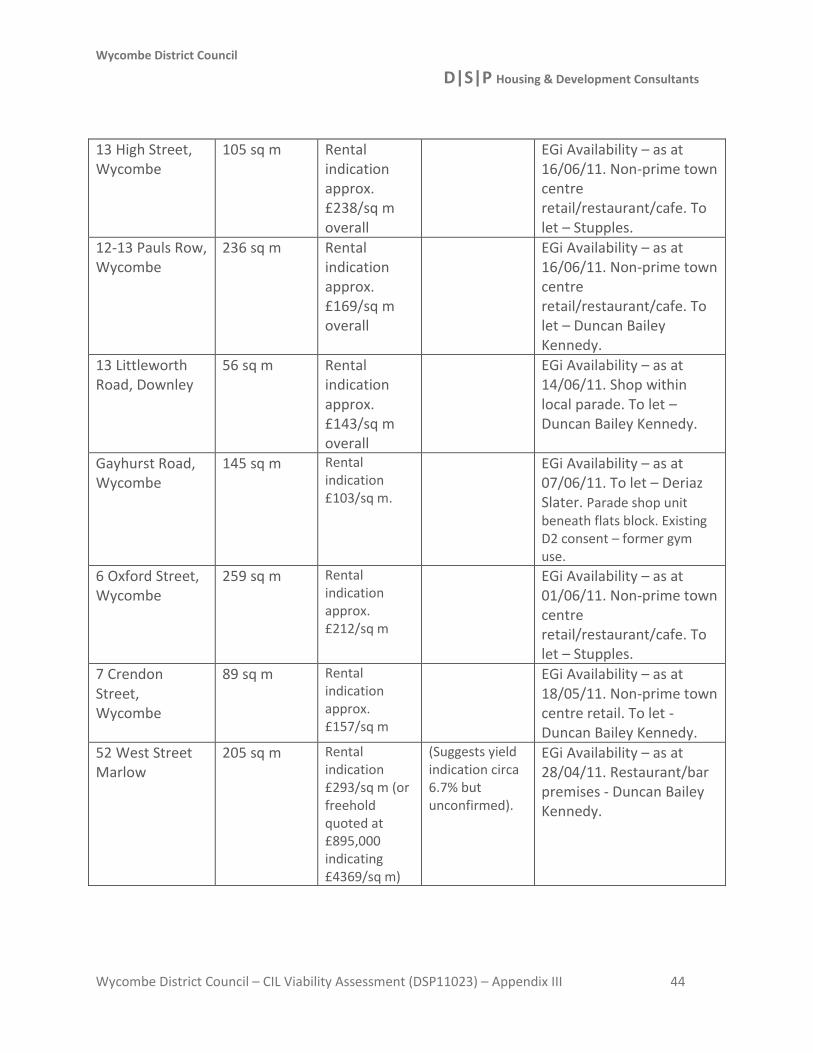
Wycombe District Council
D|S|P Housing & Development Consultants
Wycombe District Council – CIL Viability Assessment (DSP11023) – Appendix III 44
13 High Street, Wycombe
105 sq m Rental indication approx. £238/sq m overall
EGi Availability – as at 16/06/11. Non-prime town centre retail/restaurant/cafe. To let – Stupples.
12-13 Pauls Row, Wycombe
236 sq m Rental indication approx. £169/sq m overall
EGi Availability – as at 16/06/11. Non-prime town centre retail/restaurant/cafe. To let – Duncan Bailey Kennedy.
13 Littleworth Road, Downley
56 sq m Rental indication approx. £143/sq m overall
EGi Availability – as at 14/06/11. Shop within local parade. To let – Duncan Bailey Kennedy.
Gayhurst Road, Wycombe
145 sq m Rental indication £103/sq m.
EGi Availability – as at 07/06/11. To let – Deriaz Slater. Parade shop unit beneath flats block. Existing D2 consent – former gym use.
6 Oxford Street, Wycombe
259 sq m Rental indication approx. £212/sq m
EGi Availability – as at 01/06/11. Non-prime town centre retail/restaurant/cafe. To let – Stupples.
7 Crendon Street, Wycombe
89 sq m Rental indication approx. £157/sq m
EGi Availability – as at 18/05/11. Non-prime town centre retail. To let - Duncan Bailey Kennedy.
52 West Street Marlow
205 sq m Rental indication £293/sq m (or freehold quoted at £895,000 indicating £4369/sq m)
(Suggests yield indication circa 6.7% but unconfirmed).
EGi Availability – as at 28/04/11. Restaurant/bar premises - Duncan Bailey Kennedy.

Wycombe District Council
D|S|P Housing & Development Consultants
Wycombe District Council – CIL Viability Assessment (DSP11023) – Appendix III 45
10 Crendon Street, Wycombe
36 sq m Rental indication approx. £333/sq m
EGi Availability – as at 08/04/11. Non-prime town centre retail. To let - Duncan Bailey Kennedy.
34 Crendon Street, Wycombe
214 -534 sq m
Quoting £50,000 p.a. (indicates £234/sq m based on smaller floor area)
EGi Availability – as at 07/04/11. Non-prime town centre retail/restaurant/cafe. To let – Tudor Property.
1 Swains Market, Flackwell Heath
93 sq m Rental indication approx. £161/sq m overall
EGi Availability – as at 01/12/10. (Smaller settlement centre). To let – Stupples.
Pauls Row, High Wycombe
58 sq m. (Restaurant / cafe premises)
Rental indication approx. £172/sq m overall
EGi Availability – as at 01/12/10. (Close town centre). To let – Stupples.
3 Easton Street, Wycombe
15 sq m Rental indication approx. £433/sq m overall
EGi Availability – as at 16/06/11. Non-prime town centre retail. To let – Stupples
91 High Street Prestwood
380 sq m. Detached house incorporating retail unit 35 sq m.
Offers sought for freehold in order of £350,000. (Analysis uncertain)
Wycombe DC Land & Property web pages Sept 2011. Agents DBK.
Co-Op Unit, Park Parade Centre, Hazlemere, HP15 7AA
1176 sq m over ground and first floors.
£112.50 VOA Rating list 01/04/10 – current rateable value (RV) £144,000.
OFFICES - Examples Queenhithe House, Kings Square, Wycombe Marsh
88 sq m Quoting rents at approx £10/sq ft (£108/sq m)
EGi Availability – as at 15/09/11. To let – Duncan Bailey Kennedy

Wycombe District Council
D|S|P Housing & Development Consultants
Wycombe District Council – CIL Viability Assessment (DSP11023) – Appendix III 46
Unit 6 Barnes Wallis Court, Wellington Road, Cressex Estate, Wycombe
270 sq m Quoting £106/sq m
EGi Availability – as at 13/09/11. To let – Duncan Bailey Kennedy
The weighbridge, Brewery Courtyard, High Street, Marlow
665 sq m Quoting £22.50/sq ft (£242/sq m)
EGi Availability – as at 08/09/11. To let – Duncan Bailey Kennedy
Westfields, London Road, Wycombe
101 sq m Quoting rents from approx £54/sq m (£5/sq ft)
EGi Availability – as at 07/09/11. To let – Duncan Bailey Kennedy
Hampden Court, London Road, Loudwater, Wycombe
Quoting £17.50/sq ft (£188/sq m)
EGi Availability – as at 02/09/11. To let – Capita Symonds
Bourne End Business Park, Bourne End
85 sq m Quoting £17,000 p.a. – indicates circa £18.50/sq ft (£200/sq m)
EGi Availability – as at 01/09/11. To let – Deriaz Slater Commercial
Buckingham Court, London Road, Loudwater, Wycombe
Quoting £15 - 23/sq ft (£161 - £248/sq m)
EGi Availability – as at 01/09/11. To let – Capita Symonds
Soho Mills / Studios, Bourne End
Quoting £10/sq ft (£108/sq m)
EGi Availability – as at 30/08/11. To let – Philip Marsh Collins Deung
Knaves Beech Business Centre, Loudwater, Wycombe
434 sq m Quoting approx £54/sq m
EGi Availability – as at 30/08/11. To let – Duncan Bailey Kennedy
The Long Barn, Unit T, Rose Business Estate, Marlow Bottom
111 sq m Quoting £10/sq ft (£108/sq m)
EGi Availability – as at 23/08/11. To let – Duncan Bailey Kennedy
65 High Street Marlow
87 sq m Quoting approx £195/sq m
EGi Availability – as at 16/08/11. To let – Duncan Bailey Kennedy

Wycombe District Council
D|S|P Housing & Development Consultants
Wycombe District Council – CIL Viability Assessment (DSP11023) – Appendix III 47
The Old Courthouse, Hugheneden Road, High Wycombe
129 sq m Quoting £107/sq m
EGi Availability – as at 16/08/11. To let – Duncan Bailey Kennedy
Rye Park House, London Road, Wycombe
181 – 818 sq m
Quoting rent from £5.95/sq ft (£64/sq m)
EGi Availability – as at 16/08/11. To let – Duncan Bailey Kennedy
Old Bank House, High Street, Wycombe
42 – 683 sq m Quoting rent £12/sq ft (£129/sq m)
EGi Availability – as at 22/07/11. To let – Stupples
Part of Geodis Building, Coronation Road, Wycombe
117 sq m Quoting £17/sq ft (£183/sq m)
EGi Availability – as at 22/07/11. To let – Stupples
Lancaster House, Lancaster Road, Cressex Business Park, Wycombe (Industrial estate style build and location)
447 sq m Quoting £9/sq ft (£97/sq m)
EGi Availability – as at 15/07/11. To let – Deriaz Slater Commercial
2 Market Square, Marlow
65 sq m Quoting £16/sq ft (£172/sq m)
EGi Availability – as at 01/07/11. To let – Duncan Bailey Kennedy
45 West Street, Marlow
139 – 204 sq m
Quoting £16/sq ft (£172/sq m)
EGi Availability – as at 21/06/11. To let – Duncan Bailey Kennedy
Forty Green Courtyard, Forty Green Farm, Bledlow
41 – 254 sq m Quoting rent £10/sq ft (£108/sq m)
EGi Availability – as at 18/06/11. To let – Stupples
Morris Place, Spittal Street, Marlow
65 sq m Quoting £130/ sq m
EGi Availability – as at 16/06/11. To let – Deriaz Slater Commercial
19a West Street, Marlow
157 sq m Quoting £20/sq ft (£215/sq m)
EGi Availability – as at 16/06/11. To let – Cluttons

Wycombe District Council
D|S|P Housing & Development Consultants
Wycombe District Council – CIL Viability Assessment (DSP11023) – Appendix III 48
Marlow Business Centre, Station Road, Marlow
Quoting £187.50 - £237.50 basis uncertain but assumed/ sq m.
EGi Availability – as at 16/06/11. To let – not through local agents.
Harleyford Manor, Harleyford, Wycombe
98 – 1255 sq m
Quoting £23.30/sq ft (£250/sq m)
EGi Availability – as at 16/06/11. To let – Jones Lang LaSalle
Apollo House, Mercury Park, Wycombe Lane
228 – 466 sq m
Quoting £19.95/sq ft (£215/sq m)
EGi Availability – as at 16/06/11. To let – Lambert Smith Hampton
10 Dashwood Avenue, Wycombe
51 sq m Quoting £157/sq m
EGi Availability – as at 16/06/11. To let – Stupples
Thame House, Castle Street, Wycombe
46 – 247 sq m Quoting £13/sq ft (£140/sq m)
EGi Availability – as at 16/06/11. To let – Stupples
Riley House, Riley Road, Marlow
254 sq m Quoting £17.50/sq ft (£188/sq m)
EGi Availability – as at 07/06/11. To let – Deriaz Slater Commercial
Lancaster House – as above (Aidelle House, Lancaster Road)
485 sq m Quoting £8.50 & £9/sq ft (£91 - 97/sq m)
EGi Availability – as at 19/05/11. To let – Deriaz Slater Commercial
46-48 The Green, Wooburn Green
127 sq m Quoting £10/sq ft (£108/sq m)
EGi Availability – as at 13/06/11. To let – Lambert Smith Hampton
Knaves Beech Way, Wycombe
97 to 576 sq m Quoting £10/sq ft i.e. £108/sq m
EGi Availability – as at 11/05/11. To let – Philip Marsh Collins Deung
Atlas House, Third Avenue, Marlow (Globe Business Park)
492 sq m Quoting £21/sq ft (£226/sq m)
EGi Availability – as at 01/04/11. To let – Knight Frank
St John’s Court, Easton Street, Wycombe
186 – 2044 sq m
Quoting £16.50/sq ft (£178/sq m) following refurbishment.
EGi Availability – as at 29/03/11. To let – Duncan Bailey Kennedy. Entry also at 18/08/11.

Wycombe District Council
D|S|P Housing & Development Consultants
Wycombe District Council – CIL Viability Assessment (DSP11023) – Appendix III 49
Marlow International, Marlow
1181 – 2702 sq m
Quoting £22/sq ft (£237/sq m)
EGi Availability – as at 25/03/11. To let – Knight Frank
83 – 89 High Street, Marlow
120 sq m Quoting £16/sq ft (£172/sq m)
EGi Availability – as at 24/03/11. To let – Deriaz Slater Commercial
4 Cliveden Office Village, Cressex Business Park, Wycombe
261 sq m Quoting £16/sq ft (£172/sq m)
EGi Availability – as at 08/03/11. To let – Brasier Freeth
11 Eghams Court, Boston Drive, Bourne End
105 sq m Quoting £16,000 p.a. - indicates circa £14/sq ft (£152/sq m)
EGi Availability – as at 22/02/11. To let – Deriaz Slater Commercial
Forty Green Courtyard, Forty Green, Bledlow
57 – 139 sq m Quoting £16/sq ft (£172/sq m)
EGi Availability – as at 17/02/11. To let – Stupples
Buckingham Court, Kingsmead Business Park, London Road, Wycombe
194 sq m Quoting £15/sq ft i.e. £161/sq m
EGi Availability – as at 11/02/11. To let – Stupples
65 sq m Quoting £8,500 p.a. -indicates circa £12/sq ft (£131/sq m)
EGi Availability – as at 03/02/11. To let – Deriaz Slater Commercial
Western House, Mendy Street, Wycombe
54 sq m Quoting £14.50/ sq ft i.e. £156/sq m
EGi Availability – as at 31/01/11. To let – Stupples
Western House, Mendy Street, Wycombe
108 sq m Quoting £12.50/ sq ft i.e. £135/sq m
EGi Availability – as at 31/01/11. To let – Stupples
4th Floor, Apollo Centre, Debsorough Road, Wycombe
122 sq m Quoting £9.95/ sq ft i.e. £107/sq m
EGi Availability – as at 27/01/11. To let – Stupples
Anglo Office Park, Lincoln Road, Cressex Estate, Wycombe
164 – 318 sq m
Quoting £5/ sq ft i.e. £54/sq m
EGi Availability – as at 27/01/11. To let – Stupples
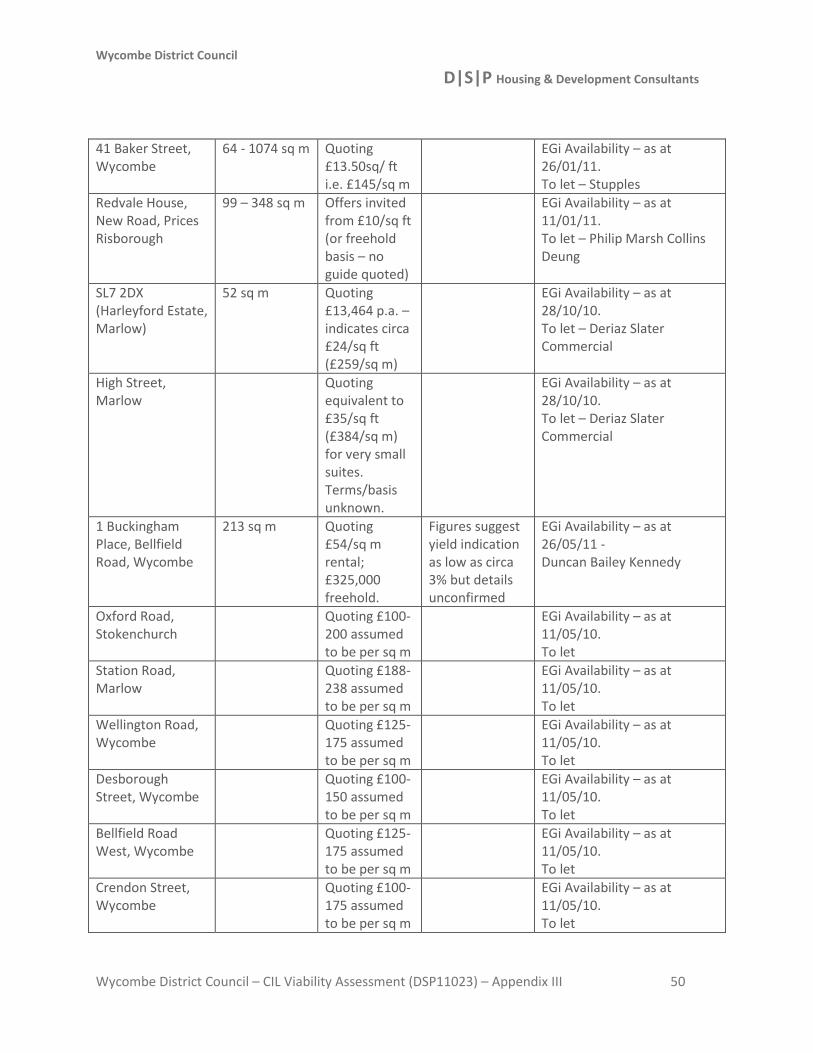
Wycombe District Council
D|S|P Housing & Development Consultants
Wycombe District Council – CIL Viability Assessment (DSP11023) – Appendix III 50
41 Baker Street, Wycombe
64 - 1074 sq m Quoting £13.50sq/ ft i.e. £145/sq m
EGi Availability – as at 26/01/11. To let – Stupples
Redvale House, New Road, Prices Risborough
99 – 348 sq m Offers invited from £10/sq ft (or freehold basis – no guide quoted)
EGi Availability – as at 11/01/11. To let – Philip Marsh Collins Deung
SL7 2DX (Harleyford Estate, Marlow)
52 sq m Quoting £13,464 p.a. – indicates circa £24/sq ft (£259/sq m)
EGi Availability – as at 28/10/10. To let – Deriaz Slater Commercial
High Street, Marlow
Quoting equivalent to £35/sq ft (£384/sq m) for very small suites. Terms/basis unknown.
EGi Availability – as at 28/10/10. To let – Deriaz Slater Commercial
1 Buckingham Place, Bellfield Road, Wycombe
213 sq m Quoting £54/sq m rental; £325,000 freehold.
Figures suggest yield indication as low as circa 3% but details unconfirmed
EGi Availability – as at 26/05/11 - Duncan Bailey Kennedy
Oxford Road, Stokenchurch
Quoting £100-200 assumed to be per sq m
EGi Availability – as at 11/05/10. To let
Station Road, Marlow
Quoting £188-238 assumed to be per sq m
EGi Availability – as at 11/05/10. To let
Wellington Road, Wycombe
Quoting £125-175 assumed to be per sq m
EGi Availability – as at 11/05/10. To let
Desborough Street, Wycombe
Quoting £100-150 assumed to be per sq m
EGi Availability – as at 11/05/10. To let
Bellfield Road West, Wycombe
Quoting £125-175 assumed to be per sq m
EGi Availability – as at 11/05/10. To let
Crendon Street, Wycombe
Quoting £100-175 assumed to be per sq m
EGi Availability – as at 11/05/10. To let

Wycombe District Council
D|S|P Housing & Development Consultants
Wycombe District Council – CIL Viability Assessment (DSP11023) – Appendix III 51
Glory Park, Wycombe
Quoting £125-148 assumed to be per sq m
EGi Availability – as at 11/05/10. To let
Lincoln Road, Wycombe
Quoting £125-175 assumed to be per sq m
EGi Availability – as at 14/04/10. To let
Abbey Barn Road, Wycombe
Quoting £215/sq m inclusive
EGi Availability – as at 19/03/10
Wycombe 3, Boundary Road, Wycombe
1612 sq m Let at £107.64/sq m
EGi Office deals listing 18/11/10
St John’s Court, 86 Easton Street, Wycombe
2052 sq m Freehold £1.31m indicates £638/sq m freehold.
EGi Office deals listing 27/09/10
The Clockhouse, Frogmooor, Wycombe
900 sq m Freehold £930,000 indicates £1033/sq m freehold.
EGi Office deals listing 21/09/10
11-15 High Street Marlow
41 sq m Let at £122/sq m
EGi Office deals listing 28/07/10
Liston Exchange, Cromwell Gardens, Marlow
218 sq m Let at £199/ sq m
EGi Office deals listing 28/07/10
Paje House, 164 West Wycombe Road, Wycombe
19 sq m Let at £204/sq m
EGi Office deals listing 01/07/10
27 Castle Street, Wycombe
48 sq m Let at £146/sq m
EGi Office deals listing 30/06/10
Foundation House, Lower Church Street, Wycombe
106 sq m Let at £113/sq m
EGi Office deals listing 25/06/10
Knaves Beech Business Centre, 5 Davies Way, Wycombe
4513 sq m Freehold at £12.5 m indicates £2769/sq m freehold.
EGi Office deals listing 18/06/10
Buckingham House, Desborough Road, Wycombe
95 sq m Let at £168/sq m
EGi Office deals listing 01/06/10

Wycombe District Council
D|S|P Housing & Development Consultants
Wycombe District Council – CIL Viability Assessment (DSP11023) – Appendix III 52
Ditto 31 sq m Let at £215/sq m
EGi Office deals listing 01/06/10
Archway House, Bellfield Road, High Wycombe
114 sq m Let at £131/sq m
EGi Office deals listing 01/06/10
Atlas House, Third Avenue, Globe Park, Marlow
660 sq m Let at £200/sq m
EGi Office deals listing 15/05/2010
Artisan, Hillbottom Road, Wycombe
566 sq m Let at £125/sq m
EGi Office deals listing 01/05/10
Ditto 268 sq m Let at £178/sq m
EGi Office deals listing 01/06/10
The Courtyard, Furlong Road, Bourne End
181 sq m Let at £166/sq m
EGi Office deals listing 06/04/10
Mere Park, James House, Dedmere Road, Marlow
43 sq m Let at £108/sq m
EGi Office deals listing 15/02/10
Tudor House, 649 London Road, Wycombe
199 sq m Let at £142/sq m
EGi Office deals listing 01/02/10
Mercury Park, Gemini 1, Wycombe Lane, Wycombe
140 sq m Let at £269/sq m
EGi Office deals listing 07/01/10
Glory Park, Glory Mill Lane, Wycombe
593 sq m Let at £296/sq m
EGi Office deals listing 07/01/10
Stokenchurch Business Park, Ibstone Road
123 sq m Let at £204/sq m
EGi Office deals listing 30/11/09
Saunderton Estate, Wycombe Road, Wycombe
4767 sq m Freehold at £2.95m indicates £619/sq m freehold
EGi Office deals listing 01/11/09
Notes: Information from older Offices listings not included. The above not exhaustive.
VOA Rating categories for retail are Hypermarkets & superstores (over 2500 sq m); Large food stores (750-2500 sq m); retail warehouse & premises; shops & premises

Wycombe District Council
D|S|P Housing & Development Consultants
Wycombe District Council – CIL Viability Assessment (DSP11023) – Appendix III 53
HOTELS
Searched VOA Rating List web-site but summary valuations not available owing to commercial sensitivities – limited information to apply. Wider web research showed values to be highly variable dependent on type, location and likely letting income. In practice, much on viability will depend on specifics. Assumptions have been made – see report details.
CARE HOMES
From our research, so far as we could see there is no well established new build care homes market – no current examples. No readily available local information to inform values assumptions, which were considered following wider research and looking further afield. Searched VOA Rating List web-site but none found. Limited information to apply. Wider web research showed values to be highly variable dependent on type, location and other factors. Again, viability will in practice depend on specifics. Assumptions have been made – see report details.
MISCELLANEOUS / LAND (as advertised)
Abbey Barn Road, Wycombe. Development site with planning permission for a building of 258 sq m over 2 floors, with D1 use.
Quoting £50,000 for the site freehold
EGi Availability – as at 28/10/10 – Stupples. Potential for a crèche, for example.
Castlefield House Clinic, Chiltern Avenue, High Wycombe
182 sq m on site of 0.321 acre.
Quoting £225,000 freehold. (Equates to circa £700,000/acre or £1.729m/Ha on that basis).
Wycombe DC Land & Property web resource Sept 2011. D1 Use (former clinic) but also now with B1 consent. DBK are agents.

Wycombe District Council
D|S|P Housing & Development Consultants
Wycombe District Council – CIL Viability Assessment (DSP11023) – Appendix III 54
Hughenden Quarters, Hughenden Avenue, High Wycombe, HP13 5XX
1 acre (northside); 4 acres (middle); 2 acres (southside)
No guide prices
Wycombe DC Land & Property web resource Sept 2011. Martin Somers Deriaz Slater Commercial Marlow 01628 495500 Or Clive Haines High Wycombe 01494 557337 [email protected]
30 Oxford Road, High Wycombe
298 sq m retail plus 5 flats over
Retail let at £50,000 p.a. plus flats at £33,000 p.a. totalling £88,000 p.a. Freehold offered at £1m on this investment basis.
(Suggests circa 8.8% yield, but unconfirmed)
Wycombe DC Land & Property web resource Sept 2011. Agents Deriaz Slater.
Trades & Social Club, Queens Road, High Wycombe
867 sq m building with car parking area.
Available freehold, quoting £500,000 – to suit D1/D2 uses but also formerly had consent for 11 no. 2 bed flats plus replacement club.
Wycombe DC Land & Property web resource Sept 2011. Agents DBK.
Institute Road, Marlow
279 sq m new D1 Use premises.
Freehold under offer – no quoted price.
Wycombe DC Land & Property web resource Sept 2011. Agents Deriaz Slater.

Wycombe District Council
D|S|P Housing & Development Consultants
Wycombe District Council – CIL Viability Assessment (DSP11023) – Appendix III 55
Chinnor Road, Bledlow Ridge, HP15 5HA
759 sq m industrial unit on 0.45 acre site
Offered freehold, with no quoted price guide.
Wycombe DC Land & Property web resource Sept 2011. Agents DBK.
Land off A40, Wycombe Road, Stokenchurch
Total about 68 acres or in various ‘lot’ sizes 3 – 4 acres. Arable farmland for sale with “paddock or investment potential”.
Quoting circa £8,000/acre (about £20,000/Ha)
Vantage Land web advert. www.vantageland.co.uk
Mudds Bank, Water End, Stokenchurch
Similar lots to above
Ditto Vantage Land
London Road, High Wycombe
Commercial property for sale on 0.384 Ha site.
No quoted price.
Agents R Whitley & Co
West Wycombe Road, High Wycombe
Car sales showroom and motor workshop to rear.
Offered for sale with asking price £300,000.
Agents Thompson Wilson
High Wycombe Office premises with detailed planning permission for residential
Offered for sale with asking price £250,000
Suggests for 3 townhouses. Advertised on UK Land Directory Ltd.
Stockenchurch (Marlow LCA)
Building plot for sale with planning for 4 bed house -
£249,950

Wycombe District Council
D|S|P Housing & Development Consultants
Wycombe District Council – CIL Viability Assessment (DSP11023) – Appendix III 56
Examples of other information sources
Other land value indications where available
DVS (Delivery and Site allocations DPD) June 2010 Viability Assessment:
Greenfield land for residential: £250,000 - £300,000/acre
Employment sites: £300,000 - £400,000/acre
Unserviced sites: £500,000 - £600,000/acre
VOA Property Market Reporting – none relating to High Wycombe – South East Figures
Industrial land
From £/Ha To £/Ha Typical £/Ha
July 09 250,000 2,475,000 1,256,000
Jan 10 Single figure quoted 1,312,500
Jan 11 Report stated ‘awaiting details’
South East ‘Residential land’ indicated at £2.46m/Ha Jan 2010; ‘awaiting details’ 2011.
DSP has considered a range of land values.

Wycombe District Council
D|S|P Housing & Development Consultants
Wycombe District Council – CIL Viability Assessment (DSP11023) – Appendix III 57
Economic context
Bank of England
Current official Bank Rate (Base Rate) remained at 0.5% - since be reduced to that level in
March 2009.
Agents’ summary of Business Conditions August 2011 (extracts re economic back-drop):
Growth rate of nominal spending on consumer goods and services remained weak
Activity in the housing market continued to be subdued, and was thought to have fallen
further in some areas
.....A number of reports of an increased in caution among prospective buyers, and of a
rise in the number of mortgages being withdrawn at a late stage in the transaction
process. According to contacts this had led to more frequent instances of housing chains
having broken down.
First time buyers continued to find it difficult to secure funding.
But weak demand from would-be owner occupiers had supported rents in the lettings
market, which continued to attract buy-to-let investors.
.....the anticipated rate of employment growth (in manufacturing) appeared to have levelled off in recent months, as expectations about the durability of the recovery, especially in the domestic market, had been revised down a little. In business services, intentions pointed to a continued gradual increase in headcount, although at a pace that was well below pre-recession levels, held back in part by expectations of ongoing weakness in public sector activity. The Agents’ score for employment intentions in the consumer-facing sector had been falling for several months, and suggested that there would be little or no growth in jobs over the next year.
Construction output appeared to be rising gradually, supported by some sizeable
infrastructure and energy related projects, along with several large commercial
developments in London, and activity related to the Olympics. There had also been some
increase in residential construction, although there were signs of a loss of momentum,
reflecting softening conditions in the housing market. Large firms with agreements with
the public sector had seen activity hold up slightly better than expected. But there had
been a marked fall in new orders from the public sector, and that was beginning to be
felt. As big contracts became scarcer, smaller companies were experiencing increased
competition from large firms for work on small-scale extension and maintenance
projects.

Wycombe District Council
D|S|P Housing & Development Consultants
Wycombe District Council – CIL Viability Assessment (DSP11023) – Appendix III 58
Credit conditions - Large firms reported that they were able to access bank finance at
reasonable terms. And contacts had perceived an intensification of competition among
banks for the business of the most creditworthy borrowers. Credit conditions were also
improving for some medium-sized companies with strong balance sheets, particularly if
they were content to use asset-backed forms of finance. But small companies, with weak
cash flow or relatively little collateral, still found borrowing terms prohibitive. There had
recently been some signs of an easing in credit conditions due to the return of venture
capital funds and non-bank providers of asset-backed finance. But some contacts
reported that trade credit had become more difficult to obtain, particularly for suppliers
to the retail and construction sectors.

Wycombe District Council
D|S|P Housing & Development Consultants
Wycombe District Council – CIL Viability Assessment (DSP11023) – Appendix III 59
Housing Market context
Royal Institution of Chartered Surveyors (RICS) Housing Market Survey (extracts) July 2011:
‘Prices continue to fall on balance, with more surveyors reporting declines rather than
increases.’
‘Activity levels remain pretty flat (and depressed), with new buyer enquiries and new vendor
instructions not recording much movement.’
Whilst there were no surveyor feedback comments for Wycombe District locations, there were
a number from the wider Buckinghamshire area; examples as follows:
‘Price absolutely key to achieving a sale. Anything overpriced not selling. Good levels of viewing
but viewing to sales ratio very high – indicative of cautious buyers and overpriced stock.’
‘Lower value well priced stock is still receiving good interest. There is some indication that
vendors understand the market is finely balanced currently.’
‘If property is priced sensibly there is still strong interest. Those vendors who are not realistic will
receive little interest in this market place.’
Land Registry House Price Index July 2011 (released 26 August 2011)
‘The July data reveals a slight change in the prevailing downward trend.’
‘Whilst the annual rate of change remains negative at -2.1%, the rate of monthly price change is
1.3%.....this is the largest monthly change since January 2010.’
‘The number of property transactions has decreased over the last year. In February to May 2010
there was an average of 49,600 sales per month. In the same months this year, the figure was
45,489.’
Summary of England and Wales picture:
Annual change in ave. house prices -2.1% (minus 2.1%)
Monthly change in ave. house prices 1.3% (positive)
Average price £163,049

Wycombe District Council
D|S|P Housing & Development Consultants
Wycombe District Council – CIL Viability Assessment (DSP11023) – Appendix III 60
Summary of South East picture:
Annual change in ave. house prices -1.1% (minus 1.1%)
Monthly change in ave. house prices 0.9% (positive)
Average price £209,309
Summary of Buckinghamshire picture:
Annual change in ave. house prices -1.3% (minus 1.3%)
Monthly change in ave. house prices 0.2% (positive)
Average price £254,910
CLG House Price Index August 2011 (released 11 October 2011)
‘In August UK house prices decreased by 1.3% over the year and increased by 0.6% over the
month...’
‘Average house prices remain unchanged over the quarter to August, compared to a quarterly
decrease of 0.2% from the quarter to May.’
‘Prices paid by first time buyers were 1.8% lower on average than a year earlier and prices paid
by former owner occupiers also decreased by 1.1%.’
‘Prices for new properties were 9.2% higher on average than a year earlier whilst prices for pre-
owned properties decreased by 2%.’
Update at closing study period:
Land Registry House Price Index September 2011 (released 28th October 2011)
‘September house prices down 2.6 per cent since August: average house price in England and
Wales now £162,019

Wycombe District Council
D|S|P Housing & Development Consultants
Wycombe District Council – CIL Viability Assessment (DSP11023) – Appendix III 61
The September data from Land Registry's flagship House Price Index shows an annual price
decrease of 2.6 per cent (change of minus 2.6%) which takes the average property value in
England and Wales to £162,109. The monthly change from August to September is a decrease of
0.3 per cent and continues the negative monthly price change seen in August of -0.1 per cent.
The only region in England and Wales to experience an increase in its average property value
over the last 12 months is London with a movement of 2.7 per cent. The North West experienced
the greatest monthly rise with a movement of 1.0 per cent. The North East experienced the
greatest annual price fall with a decrease of 8.2 per cent and the most significant monthly price
fall with a movement of -3.9 per cent.
The most up-to-date figures available show that during July 2011, the number of completed
house sales in England and Wales decreased by 11 per cent to 59,919 from 67,475 in July 2010.
The number of properties sold in England and Wales for over £1 million in July 2011 decreased
by 24 per cent to 707 from 932 in July 2010.’
Summary of England and Wales picture:
Annual change in ave. house prices -2.6% (minus 2.6%)
Monthly change in ave. house prices -0.3% (minus 0.3%)
Average price £162,109
Summary of South East picture:
Annual change in ave. house prices -2.1% (minus 2.1%)
Monthly change in ave. house prices 0.0% (no change over the month)
Average price £207,244
Summary of Buckinghamshire picture:
Annual change in ave. house prices -0.7% (minus 1.3%)
Monthly change in ave. house prices 0.5% (positive)

Wycombe District Council
D|S|P Housing & Development Consultants
Wycombe District Council – CIL Viability Assessment (DSP11023) – Appendix III 62
Average price £257,380
This latest trend indicates Buckinghamshire price trends marginally more positive than both the
South East and England & Wales pictures. Following the significant market movements (peak to
early/mid 2008 followed by steep falls to the trough in early/mid 2009) of the preceding period,
overall, house prices are indicated to have been relatively flat over the last year or so – with
relatively small scale house price movements, as the following Land Registry index trend graphs
show:
Source: Land Registry - House Prices Index (custom reports) –
http://www.landreg.gov.uk/house-prices/house-price-index-custom-reports

Wycombe District Council
D|S|P Housing & Development Consultants
Wycombe District Council – CIL Viability Assessment (DSP11023) – Appendix III 63
Land Registry - House Prices Index (custom reports) –
http://www.landreg.gov.uk/house-prices/house-price-index-custom-reports

Wycombe District Council
D|S|P Housing & Development Consultants
Wycombe District Council – CIL Viability Assessment (DSP11023) – Appendix III 64
Land Registry House Price Index report - Buckinghamshire Council vs South East Region
(January 2006 - September 2011)
(Source: http://www.landreg.gov.uk/house-prices/house-price-index-custom-reports)
Month
Buckinghamshire Council South East Region
Index Average Price (£)
Index Average Price (£)
January 2006 266.6 232,791 273.2 196,286
February 2006 268.8 234,698 275.1 197,642
March 2006 270 235,760 275.5 197,949
April 2006 271.5 237,090 276.7 198,804
May 2006 272 237,498 278.3 199,910
June 2006 272.5 237,976 279.7 200,965
July 2006 274.6 239,823 281.4 202,145
August 2006 276.6 241,514 282.8 203,181
September 2006 278.5 243,184 285.4 205,014
October 2006 280.4 244,809 286.8 206,042
November 2006 282.9 246,992 290.1 208,399
December 2006 285.2 249,036 292.8 210,337
January 2007 289.1 252,435 296.5 212,988
February 2007 292.8 255,642 299.8 215,412
March 2007 296.2 258,628 299.4 215,099
April 2007 299.6 261,631 302.9 217,612
May 2007 301.2 263,000 305.5 219,476
June 2007 303.9 265,401 306.8 220,434

Wycombe District Council
D|S|P Housing & Development Consultants
Wycombe District Council – CIL Viability Assessment (DSP11023) – Appendix III 65
July 2007 305.6 266,893 310.8 223,302
August 2007 308.5 269,395 314.1 225,634
September 2007 310.1 270,770 313.7 225,344
October 2007 309.6 270,315 315.6 226,719
November 2007 311.1 271,660 316 227,047
December 2007 311.5 272,012 315.5 226,669
January 2008 312.5 272,911 317.9 228,405
February 2008 316 275,924 316 227,017
March 2008 317.8 277,473 313.4 225,148
April 2008 (PEAK) 318.5 278,078 311.4 223,724
May 2008 317.3 277,071 310.4 222,978
June 2008 313.7 273,944 305.6 219,581
July 2008 310 270,671 303 217,679
August 2008 303.6 265,095 294.7 211,753
September 2008 298.9 261,013 287.7 206,701
October 2008 293.3 256,156 282 202,579
November 2008 287.9 251,399 273.8 196,684
December 2008 283.4 247,431 268.6 192,938
January 2009 277.8 242,546 266.8 191,663
February 2009 270.9 236,567 263.7 189,424
March 2009 265.8 232,082 258.9 185,999
April 2009 261.1 228,034 259.7 186,593
May 2009 (TROUGH) 260.6 227,552 261.8 188,105

Wycombe District Council
D|S|P Housing & Development Consultants
Wycombe District Council – CIL Viability Assessment (DSP11023) – Appendix III 66
June 2009 264.8 231,214 264.6 190,063
July 2009 267.1 233,230 268.6 192,956
August 2009 270.3 236,011 271.5 195,070
September 2009 272.1 237,571 275.8 198,123
October 2009 274.9 240,072 279.3 200,635
November 2009 278.4 243,061 281.6 202,283
December 2009 280.1 244,624 282.3 202,814
January 2010 284 248,025 289.3 207,836
February 2010 285.5 249,345 290.5 208,731
March 2010 287.4 250,980 288.8 207,457
April 2010 291 254,101 288.4 207,186
May 2010 290.5 253,708 294 211,229
June 2010 291.8 254,831 291.5 209,418
July 2010 295.8 258,319 294.4 211,482
August 2010 296.4 258,799 295.1 212,030
September 2010 296.8 259,205 294.8 211,787
October 2010 297.4 259,727 292.1 209,870
November 2010 294.6 257,209 289.9 208,252
December 2010 294.3 256,966 288.3 207,093
January 2011 293.6 256,338 288.2 207,045
February 2011 293.2 256,005 288.1 206,953
March 2011 293 255,884 287.5 206,582
April 2011 293.5 256,287 287.3 206,393

Wycombe District Council
D|S|P Housing & Development Consultants
Wycombe District Council – CIL Viability Assessment (DSP11023) – Appendix III 67
May 2011 292.6 255,539 286.1 205,545
June 2011 291.4 254,462 288 206,936
July 2011 294.2 256,875 290.3 208,585
August 2011 293.1 255,973 288.5 207,245
September 2011 294.7 257,380 288.5 207,244
(Source of above; Land Registry – http://www.landreg.gov.uk/house-prices/house-price-index-custom-reports - highlighting
emphasis by DSP)
Quick analysis of these Land Registry House Price Index trends:
Latest available information suggests –
- values at their peak (approx April 2008) were about 8% higher than current levels
- values fell by about 18% from peak to trough
- values have increased by about 12% from their trough (May 2009) levels
- values now are at very similar levels to those seen at the end of 2006, Autumn 2008 and one
year ago
- again, little overall change in values over the last year
RICS Commercial Property Market Survey – Quarter 3 2011
This was released under the headline ‘Tentative recovery in real estate shows signs of
faltering’.
The survey report goes on to say that:
- ‘Occupier demand falls back for the first since Q3 2010’
- ‘London rental expectations ease (reduce), though offices remain more resilient’
- ‘Capital value expectations outside the capital turn more negative as investment demand dries
up’
‘The latest RICS UK Commercial Market Survey shows that tenant demand retreated over the quarter
which, coupled with rising available space, is resulting in a more negative view on rental
expectations. Surveyors attribute the fall in sentiment to the uncertain outlook for the wider
economy.
At the all property level, respondents turned downbeat across much of the UK, though the picture in
London and the South remains broadly flat.

Wycombe District Council
D|S|P Housing & Development Consultants
Wycombe District Council – CIL Viability Assessment (DSP11023) – Appendix III 68
There are also some tentative signs that the London market, which has largely bucked the national
trend up to now, is beginning to see sentiment ease; rents are expected to fall in the capital for the
first time in a year. Meanwhile, outside of London rental expectations turned even more negative.
Significantly, sentiment has fallen across all sectors of the market. Retail demand slipped furthest
into negative territory, while available space also rose fastest in the retail sector.
However, rental expectations at the national level were most negative for offices.
Development starts declined across all sectors, while investment demand remained largely
unchanged from last quarter.
Capital value expectations fell across all sectors outside of London, most noticeably for offices.’
(Source: RICS UK Commercial Market Survey Q3 2011)
Included within a wide range of information supplied to us by the Council, we also considered the
Strategic Marketability Assessment of employment sites within Wycombe District (Lambert Smith
Hampton March 2010), which provides local area context on the commercial market. We do not
repeat the detail within that here, however one of its summary points was that: ‘Little commercial
development is expected in the short term due to the current lack of development funding as a result
of the “credit crunch”.’ The “credit crunch” theme is expanded in that report.
Additional background resources on the commercial market locally include:
- Wycombe DC’s 2010 Employment Land Review
- http://www.investinbucks.co.uk/property-search
- http://propertysearch.evolutive.co.uk/cgi-
bin/db2www.exe/Wycombe_Prop_Search.d2w/input?userid=3553 (Wycombe District Property
Search – note overlap with ‘invest in Bucks’ listings)

Wycombe District Council
D|S|P Housing & Development Consultants
Wycombe District Council – CIL Viability Assessment (DSP11023) – Appendix III 69
Notes to Appendix III
This is not intended to be and must not be interpreted as definitive or formal valuation
exercise.
The research carried out has not been exhaustive. It has focused on information readily
available from the District Council and a range of other sources as noted in this
Appendix, as is appropriate to informing a range of assumptions and judgments in
keeping with the high level nature of this viability overview.
In practice, assumptions and appraisal inputs, as well as outcomes, will vary beyond the
ranges explored here. In our opinion the most relevant range of guides and
assumptions, bearing in mind the study purpose, have been used. These have enabled
us to consider the points at which likely scheme viability would support CIL
contributions of certain levels – to consider the potential “switch points” and
assumptions combinations that could mean schemes moving in to viable or non-viable
territory.
As it does with other areas of policy and delivery, the Council will be able to keep an eye
on market trends and consider keeping under review the type of information contained
within this study Appendix – to help inform its ongoing monitoring and any potential
future review in light of market and cost movements, any changes in infrastructure
requirements and regulations; and local delivery experiences.
per sq m (/sq m) = per square metre (may also be seen as m²). Rental rates / price
indications and floor areas given in sq m are normally rounded to the nearest (whole) sq
using conventional rounding.
per sq ft (/sq ft) = per square foot (may also be seen as ft²).
1 sq m = 10.764 sq ft
1 Hectare (Ha/ha) = 2.47 acres
In this Appendix the text sections in italics are quoted from the sources listed; non-italic
sections within or adjacent to those are comments or clarifications added by DSP.
Extracts from the EGi Wycombe Town Report follow.
EGi Extract Follows:

Area: Wycombe (2010 Districts and Council Areas)
Map of Area

Area: Wycombe (2010 Districts and Council Areas)Base: Great Britain
Detached
(Area)
Detached
(England
& Wales)
Semi
Detached
(Area)
Semi Detached (England & Wales)
Terraced (Area)
Terraced (England & Wales)
Flat/Maisonette (Area)
Flat/Maisonette (England & Wales)
Q102 £322,105 £196,044 £196,104 £118,512 £174,357 £103,613 £133,469 £93,150
Q202 £311,940 £205,705 £209,765 £128,151 £182,181 £112,439 £125,615 £99,836
Q302 £370,337 £223,059 £216,020 £139,248 £191,422 £122,311 £144,285 £105,226
Q402 £390,210 £233,596 £223,555 £143,911 £201,276 £123,523 £142,059 £108,325
Q103 £403,146 £238,212 £220,615 £144,905 £205,478 £128,323 £140,761 £112,572
Q203 £402,269 £245,157 £236,159 £150,946 £190,099 £134,896 £144,308 £115,133
Q303 £424,898 £254,895 £234,588 £160,183 £182,850 £139,446 £143,359 £117,104
Q403 £392,086 £259,345 £252,146 £162,054 £192,678 £143,999 £173,368 £122,732
Q104 £386,119 £264,315 £251,838 £165,144 £215,063 £145,877 £164,687 £127,132
Q204 £426,671 £271,079 £239,436 £177,211 £196,919 £154,906 £167,176 £133,433
Q304 £422,542 £287,458 £260,218 £187,136 £234,514 £164,738 £177,072 £139,440
Q404 £423,786 £290,669 £255,556 £188,561 £222,691 £162,640 £166,265 £140,371
Q105 £398,942 £293,287 £244,770 £185,121 £206,300 £162,103 £164,814 £142,110
Q205 £401,869 £293,444 £262,311 £185,914 £208,815 £164,041 £164,591 £142,433
Q305 £440,189 £302,735 £268,356 £194,731 £216,494 £169,897 £172,158 £145,010
Q405 £424,641 £298,099 £274,605 £193,378 £218,829 £170,138 £160,281 £145,021
Q106 £433,250 £300,219 £266,480 £193,745 £216,926 £172,820 £170,174 £146,870
Q206 £492,496 £306,661 £269,163 £200,709 £221,246 £178,961 £161,549 £151,702
Q306 £464,798 £319,137 £274,637 £209,747 £255,099 £186,872 £188,663 £154,479
Q406 £519,745 £320,476 £279,824 £210,616 £274,446 £186,563 £186,989 £155,059
Q107 £482,583 £326,363 £303,270 £211,759 £245,638 £190,281 £177,552 £160,140
Q207 £497,428 £335,484 £313,389 £219,550 £252,545 £198,421 £183,646 £164,999
Q307 £516,336 £348,092 £307,926 £230,083 £275,273 £205,580 £206,500 £168,438
Q407 £519,807 £351,058 £352,316 £225,482 £267,861 £203,822 £212,233 £170,270
Q108 £512,857 £347,179 £303,593 £220,939 £259,968 £200,213 £180,552 £168,706
Q208 £524,541 £340,709 £311,141 £219,663 £253,471 £198,402 £195,280 £170,021
Q308 £545,841 £343,333 £297,134 £218,174 £280,939 £193,256 £185,504 £167,368
Q408 £472,151 £320,534 £278,195 £198,363 £268,828 £177,211 £176,139 £160,545
Q109 £474,101 £304,328 £271,665 £187,464 £215,278 £168,188 £197,748 £155,790
Q209 £465,426 £294,403 £265,117 £190,931 £226,593 £172,387 £183,895 £154,797
Q309 £494,560 £311,996 £293,445 £203,058 £270,354 £184,237 £186,490 £157,786
Q409 £502,984 £316,271 £289,008 £207,763 £254,749 £187,433 £224,167 £161,832
Q110 £467,111 £333,730 £302,628 £212,908 £241,152 £194,672 £190,650 £163,614
Q210 £526,021 £328,031 £299,822 £214,459 £254,708 £193,673 £173,385 £167,544
Q310 £538,147 £343,793 £301,720 £223,007 £248,022 £198,991 £200,790 £166,974
Q410 £489,204 £336,692 £308,597 £215,288 £284,050 £194,266 £195,690 £165,119
Q111 £497,778 £337,241 £305,837 £212,139 £252,877 £191,405 £178,298 £166,616
(Not Available for Scotland)*Please note that if prices are shown as '£0' no data is available for the corresponding centre. Please also note that these quarters relate to financial quarters.
Residential Property Prices
£0
£100,000
£200,000
£300,000
£400,000
£500,000
£600,000 Q
102
Q20
2
Q30
2
Q40
2
Q10
3
Q20
3
Q30
3
Q40
3
Q10
4
Q20
4
Q30
4
Q40
4
Q10
5
Q20
5
Q30
5
Q40
5
Q10
6
Q20
6
Q30
6
Q40
6
Q10
7
Q20
7
Q30
7
Q40
7
Q10
8
Q20
8
Q30
8
Q40
8
Q10
9
Q20
9
Q30
9
Q40
9
Q11
0
Q21
0
Q31
0
Q41
0
Q11
1
Detached (Area) Semi Detached (Area) Semi Detached (England & Wales)
Terraced (Area) Terraced (England & Wales) Flat/Maisonette (Area)
Flat/Maisonette (England & Wales) Detached (England & Wales)


Area: Wycombe (2010 Districts and Council Areas)Base: Great Britain
Colliers International has provided its estimated prime retail rents for key In Town locations throughout the UK.
Provided by Colliers International ©.
The Colliers International In Town retail rents database is based upon their opinion of the open market Zone A rent in more than 600 shopping locations in the UK.
The rental values relate to a hypothetical shop unit of optimum size and configuration in the prime pitch. The figures have been arrived at by adopting zone sizes standard for the location and are expressed at £ per sq ft per annum.
In the case of shopping centre locations where the rent payable is the greater of the base Rent (a percentage of of Full Rental Value (typically 80%)) or a percentage of turnover, the rental contained is Full Rental Value (i.e. grossed up Base Rent).
In assessing their opinion of the open market Zone A rent Colliers International only acknowledge the presence of shopping centres once completed and open to the public.
*Please note that if rent values are shown as '£0' no data is available for the corresponding years. Only the top ten centres whose rents are highest in 2010 are graphed.
Centre 1987 1988 1989 1990 1991 1992 1993 1994 1995 1996 1997 1998 1999 2000 2001 2002 2003 2004 2005 2006 2007 2008 2009 2010 2011High Wycombe £55 £60 £80 £80 £75 £65 £65 £65 £65 £70 £70 £70 £75 £75 £80 £85 £85 £85 £90 £90 £90 £130 £100 £100 £100Marlow £30 £45 £55 £50 £45 £40 £35 £35 £35 £35 £40 £45 £50 £55 £55 £60 £60 £70 £75 £80 £90 £100 £85 £90 £95
Retail Rents
Estimated Zone A Rents
Contact: Dr Richard Doidge, Director of Research Consultancy, Colliers International. Email: [email protected] Tel: 020 7344 6872
£0
£20
£40
£60
£80
£100
£120
£140
Zone
A R
ent (
£psf
)
Year - Figures published every June
Prime In Town Retail Rents High Wycombe
Marlow

Area: Wycombe (2010 Districts and Council Areas) © Retail Locations 2006
Base: Great Britain Contact Retail Locations
on 020 8559 1944
www.retaillocations.co.uk
Data for
area
Data as %
for area
Data for
base
Data as %
for base
Index
av=100
Type of Store
Accessories & Jewellery 12 3% 2,902 2% 141
Antiques & Art 3 1% 807 1% 127
Books Video & Music 4 1% 960 1% 142
Cards & Stationery 6 1% 1,809 1% 113
Cash & Carry 1 0% 438 0% 78
Clothing 80 20% 21,786 16% 125
CoffeeShops 11 3% 3,153 2% 119
Crafts Hobbies & Toys 7 2% 1,077 1% 222
Department Store and Variety Store 10 2% 4,874 4% 70
Drink & CTN 7 2% 2,855 2% 84
Electrical & Computer Goods 9 2% 3,216 2% 96
Estate Agents 12 3% 3,778 3% 108
13 3% 7,013 5% 63
Furniture 5 1% 1,225 1% 139
Hardware & DIY 20 5% 5,859 4% 117
Mobile Phones / Telecommunications 11 3% 3,440 2% 109
Pharmacy Health & Beauty 41 10% 13,664 10% 102
Restaurants Bars & Cafes 54 13% 18,711 14% 99
Services - Financial 34 8% 12,840 9% 90
Services - Motor 37 9% 13,457 10% 94
Sports 5 1% 1,748 1% 98
Supermarket 16 4% 9,314 7% 59
Travel agent 6 1% 2,989 2% 69
404 1 137915
Fast Food Take Away
A listing of the retailers in this catchment area, by type. Index figures over 100 suggest a greater than usual concentration of this type in this area.
Retail Profile

Area: Wycombe (2010 Districts and Council Areas) Wycombe (2010 Districts and Council Areas) © Retail Locations 2006
Base: Great Britain Contact Retail Locations
on 020 8559 1944
A listing of key UK retailers and their presence or requirements in this catchment area. www.retaillocations.co.uk
Retailer Count of branches in
this area
Requirements
3 Store 1 -
Argos 2 0
Boots 3 0
Burger King 0 9
Carphone Warehouse 3 2
Claire's 1 0
Clarks 2 3
Costa Coffee 5 4
Domino's 1 -
Dorothy Perkins 2 3
Game 1 0
Greggs 2 0
HMV 1 -
Halfords 2 0
Holland & Barrett 1 0
Iceland 1 0
KFC 2 1
Marks & Spencer 1 -
McDonald's 1 1
Monsoon Accessorize 3 0
New Look 1 3
Next 1 -
Phones 4 U 0 0
Pizza Express 2 0
Instore (Poundstretcher) 0 -
Primark 1 -
Sainsbury's 2 6
Starbucks 2 3
Subway 4 4
Superdrug 2 0
Tesco 6 3
Waterstone's 1 -
WH Smith 3 0
*Please note that if values are '-' then no requirement data is available
Key Retail Profile
Requirements relate to the centre name in Drivetime and Radius reports, however in Local Authority reports requirements are an accumulation of centres in the contour.

Area: Wycombe (2010 Districts and Council Areas)Base: Great Britain
The 20 most recent deals for this area and sector are displayed below, click on the arrows on the date heading to show all the deals.
Date Postcode Address Type Lessee/ Purchaser
Total Space Price Rental PSM Yield (%)
31/08/2011 HP12 4HJ
Artisan, Hillbottom Road, High Wycombe, Buckinghamshire, HP12 4HJ
Lease Lessee: Maritz Research Limited
1393.53 Net sq m N/A N/A N/A
21/05/2011 SL7 1AB
65 High Street, Marlow, Buckinghamshire, SL7 1AB
Lease Lessee: Private individual(s)
130.528 Net sq m N/A N/A N/A
15/04/2011 SL7 2LU
11 West Street, Marlow, Buckinghamshire, SL7 2LU
Lease Lessee: Private individual(s)
56.5775 Net sq m N/A N/A N/A
15/04/2011 HP13 6EQ
Valley Business Centre, Gordon Road, High Wycombe, Buckinghamshire, HP13 6EQ
Lease Lessee: Private individual(s)
812.152 Net sq m N/A N/A N/A
15/04/2011 SL8 5TD
Temple House, Regatta Place, Marlow Road, Bourne End, Buckinghamshire, SL8 5TD
Lease Lessee: Private individual(s)
245.262 Net sq m N/A N/A N/A
01/04/2011 SL8 5YS
Eghams Court, Boston Drive, Bourne End, Buckinghamshire, SL8 5YS
Lease Lessee: Private individual(s)
105.444 Net sq m N/A N/A N/A
22/11/2010 HP27 9PX
Regent Park, Princes Estate, Summerleys Road, Princes Risborough, Buckinghamshire, HP27 9PX
Lease Lessee: Cat-UK Services Limited
301.747 Net sq m N/A N/A N/A
18/11/2010 HP10 9PN
Wycombe 3, Boundary Road, High Wycombe, Buckinghamshire, HP10 9PN
Lease Lessee: Phoenix IT Group
1612.04 Net sq m N/A £107.64 N/A
28/10/2010 HP13 6NR
9 Amersham Hill, High Wycombe, Buckinghamshire, HP13 6NR
Lease Lessee: Carers UK Limited
17.1869 Net sq m N/A N/A N/A
27/09/2010 HP11 1JX
St Johns Court, 86 Easton Street, High Wycombe, Buckinghamshire, HP11 1JX
Sale Purchaser: IVG UK Limited
2052.03 Net sq m £1310000 N/A N/A
27/09/2010 HP13 6NR
9 Amersham Hill, High Wycombe, Buckinghamshire, HP13 6NR
Lease Lessee: Key Letts Limited
18.5805 Net sq m N/A N/A N/A
21/09/2010 HP13 5DL
The Clock House, Frogmoor, High Wycombe, Buckinghamshire, HP13 5DL
Sale Purchaser: Private individual(s)
899.758 Net sq m £930000 N/A N/A
03/09/2010 HP11 2HL
Swan House, 1 White Hart Street, High Wycombe, Buckinghamshire, HP11 2HL
Lease
Lessee: London College of Executives Limited
639.353 Net sq m N/A N/A N/A
31/08/2010 HP14 3SX
Stokenchurch House, Oxford Road, High Wycombe, Buckinghamshire, HP14 3SX
Lease Lessee: Verathon Medical (UK) Limited
745.262 Net sq m N/A N/A N/A
25/08/2010 HP11 2AE
27 High Street, High Wycombe, Buckinghamshire, HP11 2AE
Licence Lessee: Private individual(s)
19.8811 Net sq m N/A N/A N/A
Office Deals Listing

28/07/2010 SL7 1AU
11-15 High Street,
Marlow,
Buckinghamshire,
SL7 1AU
Lease
Lessee:
Marketing Analytix
Limited
40.877 Net sq
mN/A £122.28 N/A
28/07/2010 SL7 1BG
Liston Exchange,
Cromwell Gardens,
Marlow,
Buckinghamshire,
SL7 1BG
Lease
Lessee:
FoundOcean
Limited
218.32 Net sq
mN/A £199.13 N/A
01/07/2010 HP27 0AS
Friars Cottage,
Market Square,
Princes Risborough,
Buckinghamshire,
HP27 0AS
Lease Lessee: Private
Client
48.7737 Net
sq mN/A N/A N/A
01/07/2010 HP12 3AE
Paje House, 164
West Wycombe
Road, High
Wycombe,
Buckinghamshire,
HP12 3AE
Lease Lessee: Private
Client
18.9521 Net
sq mN/A £204.52 N/A
30/06/2010 HP13 6RU
27 Castle Street,
High Wycombe,
Buckinghamshire,
HP13 6RU
Lease Lessee: Private
Client48 Net sq m N/A £145.83 N/A
25/06/2010 HP14 3TG
Foundation House,
Lower Church Street,
High Wycombe,
Buckinghamshire,
HP14 3TG
Lease
Lessee: Positive
Steps Childrens
Day Nursery
Limited
106 Net sq m N/A £113.21 N/A
18/06/2010 HP10 9QR
Knaves Beech
Business Centre, 5
Davies Way, High
Wycombe,
Buckinghamshire,
HP10 9QR
Sale &
Leaseback
Lessee: Dreams,
Purchaser:
Clarenco LLP
4513.01 Net
sq m£12500000 N/A 7.3
01/06/2010 HP12 3BW
Fryers Works, The
Gatehouse,
Abercromby Avenue,
High Wycombe,
Buckinghamshire,
HP12 3BW
Lease Lessee: Private
Clients
102.843 Net
sq mN/A N/A N/A
01/06/2010 HP11 2PR
Buckingham House,
Desborough Road,
High Wycombe,
Buckinghamshire,
HP11 2PR
Lease Lessee: Private
Clients
95.039 Net sq
mN/A £167.92 N/A
01/06/2010 HP11 2PR
Buckingham House,
Desborough Road,
High Wycombe,
Buckinghamshire,
HP11 2PR
Lease Lessee: Private
Client
31.2152 Net
sq mN/A £215.28 N/A
01/06/2010 HP13 5HJ
Archway House,
Bellfield Road, High
Wycombe,
Buckinghamshire,
HP13 5HJ
Lease Lessee: Private
Client
114.27 Net sq
mN/A £131.32 N/A
01/06/2010 HP13 6LA
Prospect House,
Crendon Street, High
Wycombe,
Buckinghamshire,
HP13 6LA
Lease Lessee: Private
Client
164.994 Net
sq mN/A N/A N/A
15/05/2010 SL7 1EY
Atlas House, Third
Avenue, Globe Park,
Marlow,
Buckinghamshire,
SL7 1EY
Lease
Lessee: Seagate
Software (UK)
Limited
659.606 Net
sq mN/A £200.53 N/A
01/05/2010 HP12 4HJ
Artisan, Hillbottom
Road, High
Wycombe,
Buckinghamshire,
HP12 4HJ
Lease Lessee: TTI,
Incorporated
566.054 Net
sq mN/A £125.08 N/A
01/05/2010 HP12 4HJ
Artisan, Hillbottom
Road, High
Wycombe,
Buckinghamshire,
HP12 4HJ
Lease N/A268.023 Net
sq mN/A £177.61 N/A
01/05/2010 HP11 1HA
Westfields, London
Road, High
Wycombe,
Buckinghamshire,
HP11 1HA
Lease Lessee: Private
individual(s)
220.643 Net
sq mN/A N/A N/A

20/04/2010 HP10 9YU
14 Knaves Beech
Business Centre,
Davies Way, High
Wycombe,
Buckinghamshire,
HP10 9YU
Lease
Lessee: Sun Life
Unit Assurance
Limited
918.06 Net sq
mN/A N/A N/A
08/04/2010 HP10 9TJ
The Mill House,
London Road, High
Wycombe,
Buckinghamshire,
HP10 9TJ
Lease
Lessee:
Rodericks Dental
Foundation
184.039 Net
sq mN/A N/A N/A
06/04/2010 SL8 5AU
The Courtyard,
Furlong Road,
Bourne End,
Buckinghamshire,
SL8 5AU
Lease Lessee: Private
Client
180.509 Net
sq mN/A £166.20 N/A
01/04/2010 SL7 2NB
48 West Street,
Marlow,
Buckinghamshire,
SL7 2NB
Lease Lessee: Private
Client
325.158 Net
sq mN/A N/A N/A
01/04/2010 SL7 1DD
2A Chapel Street,
Marlow,
Buckinghamshire,
SL7 1DD
Lease Lessee: Private
Client
91.0442 Net
sq mN/A N/A N/A
31/03/2010 SL7 1TJ
Chapel House, Liston
Road, Marlow,
Buckinghamshire,
SL7 1TJ
Lease Lessee: Waitrose1585.38 Net
sq mN/A N/A N/A
15/02/2010 SL7 1FJ
Mere Park, James
House, Dedmere
Road, Marlow,
Buckinghamshire,
SL7 1FJ
Lease N/A43.2925 Net
sq mN/A £107.64 N/A
15/02/2010 SL7 3SD
Chiltern House, Fern
Lane, Marlow,
Buckinghamshire,
SL7 3SD
Lease N/A172.705 Net
sq mN/A N/A N/A
01/02/2010 HP11 2PE
Lordsmill, Oakridge
Road, High
Wycombe,
Buckinghamshire,
HP11 2PE
Lease Lessee: Private
Clients
155.147 Net
sq mN/A N/A N/A
01/02/2010 SL8 5YP
Station Court, Station
Road, Bourne End,
Buckinghamshire,
SL8 5YP
Lease Lessee: Private
individual(s)
94.7603 Net
sq mN/A N/A N/A
01/02/2010 HP11 1EZ
Tudor House, 649
London Road, High
Wycombe,
Buckinghamshire,
HP11 1EZ
Lease Lessee: Private
Client
198.811 Net
sq mN/A £142.30 N/A
15/01/2010 SL7 2LY
Oak House, Potts
Place, West Street,
Marlow,
Buckinghamshire,
SL7 2LY
Sale
Purchaser:
Private
individual(s)
76.1799 Net
sq mN/A N/A N/A
15/01/2010 SL7 1NG
11-13 Station Road,
Marlow,
Buckinghamshire,
SL7 1NG
Lease N/A54.9981 Net
sq mN/A N/A N/A
07/01/2010 HP10 0HH
Mercury Park, Gemini
1, Wycombe Lane,
High Wycombe,
Buckinghamshire,
HP10 0HH
Lease N/A139.353 Net
sq mN/A £269.10 N/A

Area: Wycombe (2010 Districts and Council Areas)Base: Great Britain
Planning applications for this use type in this area. The most recent 20 are displayed, use the filter arrows to display more.
Address Status Application Date Permission Date Subsector Proposed Size Units Planning Authority
Wessex Road Industrial Estate, Wessex Road, Bourne End, Buckinghamshire, SL8 5DT
PPG 23/06/2011 03/08/2011 Industrial (B8), Business (B1a) 100 Gross sq m Wycombe District
Council
Hampden Saw Mills, Great Hampden, Great Missenden, Buckinghamshire, HP16 9RG
App 05/05/2011
Business (B1a), Business (B1c), Industrial (B8), Assembly & Leisure (D2)
215 Gross sq m Wycombe District Council
85-87 Holtspur Lane, High Wycombe, Buckinghamshire, HP10 0AU
App 08/03/2011 Business (B1a) 4725 Gross sq m Wycombe District Council
Knaves Beech Industrial Estate, Knaves Beech Way, High Wycombe, Buckinghamshire, HP10 9QY
PPG 10/01/2011 30/03/2011 Business (B1a), Industrial (B8) 93 Gross sq m Wycombe District
Council
Knaves Beech Industrial Estate, Knaves Beech Way, High Wycombe, Buckinghamshire, HP10 9QY
PPG 10/01/2011 30/03/2011 Business (B1a), Industrial (B8) 93 Gross sq m Wycombe District
Council
Amersham And Wycombe College, Spring Lane, High Wycombe, Buckinghamshire, HP10 9HE
PPG 08/12/2010 02/02/2011 Non-resi Institutional (D1), Business (B1a) N/A N/A Wycombe District
Council
Park Mill Farm, Summerleys Road, Princes Risborough, Buckinghamshire, HP27 9QB
OutRef 07/10/2010
Residential (C3), Business (B1a), Retail (A1), Retail (A2), Retail (A3), Assembly & Leisure (D2), Assembly & Leisure (D2)
896 Gross sq m Wycombe District Council
Land To The Rear Of The Hogs Head, 84 High Street, Marlow, Buckinghamshire, SL7 1AQ
PPG 06/08/2010 23/11/2010 Business (B1a) 750 Gross sq m Wycombe District Council
Land At Lance Way, Collingwood Close &, Clarke Drive, High Wycombe, Buckinghamshire, HP13 7ED
PPG 12/05/2010 11/08/2010 Residential (C3), Business (B1a), Retail (A1)
168 Gross sq m Wycombe District Council
Globeside Business Park, One Globeside, Fieldhouse Lane, Marlow, Buckinghamshire, SL7 1HZ
OutPPG 30/03/2010 29/06/2010 Business (B1a) 6825 Gross sq m Wycombe District Council
Former Hypnos Site, Station Road, Princes Risborough, Buckinghamshire, HP27 9DN
Lap 12/02/2010 Residential (C3), Business (B1a), Retail (A1), General
N/A N/A Wycombe District Council
Land At Wycombe Sports Centre, Marlow Hill, High Wycombe, Buckinghamshire, HP11 1TJ
OutPPG 07/12/2009 27/05/2011 Hotels (C1), Business (B1a), Assembly & Leisure (D2)
33105 Gross sq m Wycombe District Council
Cressex Business Park, Halifax Road, High Wycombe, Buckinghamshire, HP12 3SD
App 20/11/2009 Industrial (B1/2/8), Business (B1a) 164 Gross sq m Wycombe District
Council
Regent Park, Summerleys Road, Princes Risborough, Buckinghamshire, HP27 9LE
App 01/10/2009 Business (B1a) 557 Gross sq m Wycombe District Council
Swan House, 1 White Hart Street, High Wycombe, Buckinghamshire, HP11 2HL
App 28/08/2009 Business (B1a), Non-resi Institutional (D1) N/A N/A Wycombe District
Council
Planning Applications - Office

Chapel House, Liston
Road, Marlow,
Buckinghamshire, SL7 1TJ
PPG 10/07/2009 12/03/2010 Retail (A1), Business
(B1a)736 Gross sq m
Wycombe District
Council
Chapel House, Liston
Road, Marlow,
Buckinghamshire, SL7 1TJ
PPG 10/07/2009 12/03/2010 Retail (A1), Business
(B1a)736 Gross sq m
Wycombe District
Council
17-25 Octagon Parade,
White Hart Street; 2-10
Octagon Court Bull Lane,
Oxford Street, High
Wycombe,
Buckinghamshire, HP11
2HU
App 26/06/2009 Hotels (C1), Retail
(A1), Business (B1a)N/A N/A
Wycombe District
Council
Land Adjacent To, 23
Easton Street, High
Wycombe,
Buckinghamshire, HP11
1NT
With 12/02/2009 Residential (C3),
Business (B1a)596 Gross sq m
Wycombe District
Council
Former De La Rue Site,
Coates Lane, High
Wycombe,
Buckinghamshire, HP13
5EY
PPG 27/01/2009 28/04/2009
Business (B1a),
Industrial (B8),
General
N/A N/AWycombe District
Council

Area: Wycombe (2010 Districts and Council Areas)Base: Great Britain
The 20 most recent deals for this area and sector are displayed below, click on the arrows on the date heading to show all the deals.
Date Postcode Address Type Lessee/ Purchaser
Total Space Price (£) Zone A Rent Yield (%)
24/06/2011 HP14 3SX
29-31 Oxford Road, High Wycombe, Buckinghamshire, HP14 3SX
Investment Sale Purchaser: PZR 489.223 Net sq
m £1500000 N/A 6.93
02/06/2011 SL7 1AB57 High Street, Marlow, Buckinghamshire, SL7 1AB
Lease Lessee: Mint Velvet 82.683 Net sq m N/A N/A N/A
06/04/2011 HP11 2BW
4-5 Cornmarket, High Wycombe, Buckinghamshire, HP11 2BW
Lease Lessee: Money Shop (The) 159.42 Net sq m N/A £33000 N/A
01/04/2011 SL7 1AU31 High Street, Marlow, Buckinghamshire, SL7 1AU
Lease Lessee: Private individual(s) 128.67 Net sq m N/A £82500 N/A
21/12/2010 HP11 2QA
150 Desborough Road, High Wycombe, Buckinghamshire, HP11 2QA
Lease Lessee: Private individual(s)
52.6756 Net sq m N/A £13000 N/A
03/12/2010 HP13 6RG
Edric House, 30-48 Castle Street, High Wycombe, Buckinghamshire, HP13 6RG
Sale Purchaser: Imani Foods Limited
148.644 Net sq m £350000 N/A N/A
15/08/2010 HP15 7LQ
3 Market Parade, High Wycombe, Buckinghamshire, HP15 7LQ
Lease Lessee: Wye Residential LLP
83.4262 Net sq m N/A £17650 N/A
11/08/2010 HP15 7DD
42 Sawpit Hill, High Wycombe, Buckinghamshire, HP15 7DD
Sale Purchaser: Private individual(s)
85.9346 Net sq m £308000 N/A N/A
01/05/2010 SL8 5SB67 The Parade, Bourne End, Buckinghamshire, SL8 5SB
Lease Lessee: Private Clients
166.667 Net sq m N/A N/A N/A
01/05/2010 SL8 5SB
33-35 The Parade, Bourne End, Buckinghamshire, SL8 5SB
Lease Lessee: Budz Cafe Lounge Limited
105.909 Net sq m N/A N/A N/A
15/04/2010 HP27 0AT
15 Duke Street, Princes Risborough, Buckinghamshire, HP27 0AT
Sale Purchaser: Private Clients
20.2527 Net sq m £185000 N/A N/A
31/03/2010 HP11 2AG
40 High Street, High Wycombe, Buckinghamshire, HP11 2AG
Lease N/A 740 Net sq m N/A N/A N/A
26/02/2010 HP11 2QL
205 Desborough Road, High Wycombe, Buckinghamshire, HP11 2QL
Lease N/A 150.223 Net sq m N/A £15000 N/A
25/02/2010 HP11 2TE
206 Desborough Road, High Wycombe, Buckinghamshire, HP11 2TE
Lease Lessee: Private individual(s)
61.4084 Net sq m N/A £14100 N/A
24/02/2010 SL7 1AW
30-32 High Street, Marlow, Buckinghamshire, SL7 1AW
Sale Purchaser: Private individual(s)
185.805 Net sq m £1500000 N/A N/A
15/02/2010 SL8 5DG
12 Furlong Road, Bourne End, Buckinghamshire, SL8 5DG
Lease N/A 40.6912 Net sq m N/A N/A N/A
01/01/2010 HP11 2QA
154 Desborough Road, High Wycombe, Buckinghamshire, HP11 2QA
Lease Lessee: Private Clients
26.3842 Net sq m N/A £5000 N/A
Retail Deals Listing
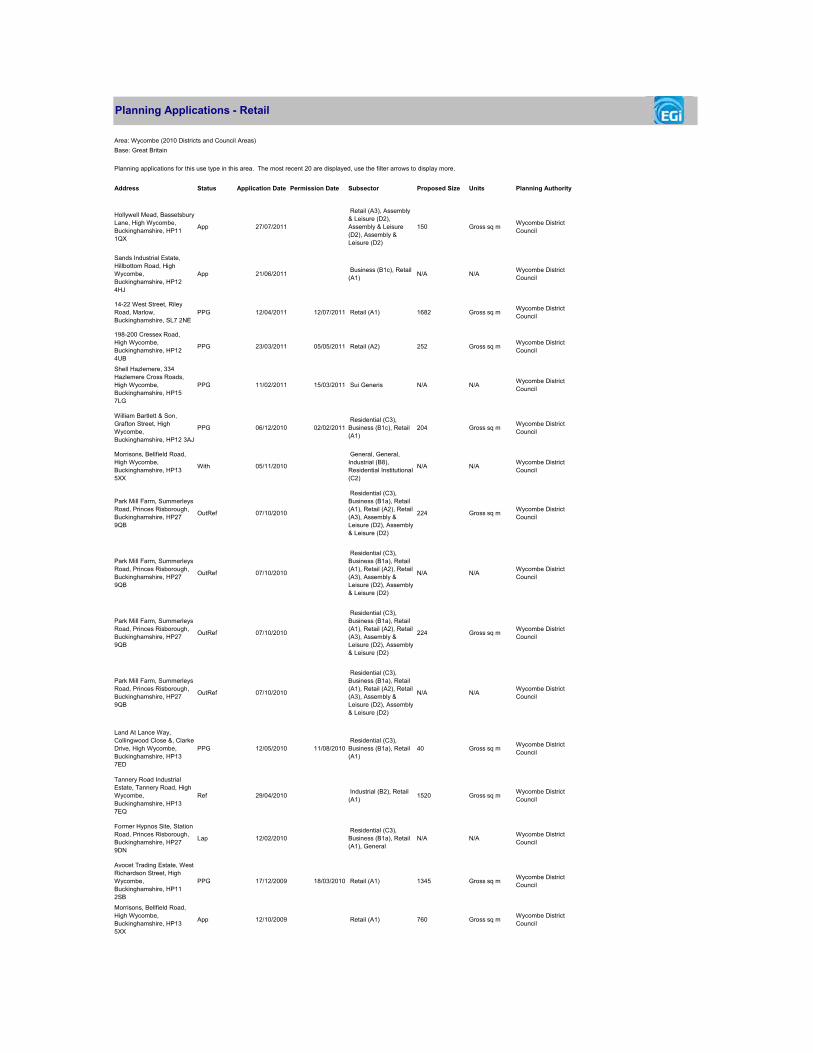
Area: Wycombe (2010 Districts and Council Areas)Base: Great Britain
Planning applications for this use type in this area. The most recent 20 are displayed, use the filter arrows to display more.
Address Status Application Date Permission Date Subsector Proposed Size Units Planning Authority
Hollywell Mead, Bassetsbury Lane, High Wycombe, Buckinghamshire, HP11 1QX
App 27/07/2011
Retail (A3), Assembly & Leisure (D2), Assembly & Leisure (D2), Assembly & Leisure (D2)
150 Gross sq m Wycombe District Council
Sands Industrial Estate, Hillbottom Road, High Wycombe, Buckinghamshire, HP12 4HJ
App 21/06/2011 Business (B1c), Retail (A1) N/A N/A Wycombe District
Council
14-22 West Street, Riley Road, Marlow, Buckinghamshire, SL7 2NE
PPG 12/04/2011 12/07/2011 Retail (A1) 1682 Gross sq m Wycombe District Council
198-200 Cressex Road, High Wycombe, Buckinghamshire, HP12 4UB
PPG 23/03/2011 05/05/2011 Retail (A2) 252 Gross sq m Wycombe District Council
Shell Hazlemere, 334 Hazlemere Cross Roads, High Wycombe, Buckinghamshire, HP15 7LG
PPG 11/02/2011 15/03/2011 Sui Generis N/A N/A Wycombe District Council
William Bartlett & Son, Grafton Street, High Wycombe, Buckinghamshire, HP12 3AJ
PPG 06/12/2010 02/02/2011 Residential (C3), Business (B1c), Retail (A1)
204 Gross sq m Wycombe District Council
Morrisons, Bellfield Road, High Wycombe, Buckinghamshire, HP13 5XX
With 05/11/2010
General, General, Industrial (B8), Residential Institutional (C2)
N/A N/A Wycombe District Council
Park Mill Farm, Summerleys Road, Princes Risborough, Buckinghamshire, HP27 9QB
OutRef 07/10/2010
Residential (C3), Business (B1a), Retail (A1), Retail (A2), Retail (A3), Assembly & Leisure (D2), Assembly & Leisure (D2)
224 Gross sq m Wycombe District Council
Park Mill Farm, Summerleys Road, Princes Risborough, Buckinghamshire, HP27 9QB
OutRef 07/10/2010
Residential (C3), Business (B1a), Retail (A1), Retail (A2), Retail (A3), Assembly & Leisure (D2), Assembly & Leisure (D2)
N/A N/A Wycombe District Council
Land At Lance Way, Collingwood Close &, Clarke Drive, High Wycombe, Buckinghamshire, HP13 7ED
PPG 12/05/2010 11/08/2010 Residential (C3), Business (B1a), Retail (A1)
40 Gross sq m Wycombe District Council
Tannery Road Industrial Estate, Tannery Road, High Wycombe, Buckinghamshire, HP13 7EQ
Ref 29/04/2010 Industrial (B2), Retail (A1) 1520 Gross sq m Wycombe District
Council
Former Hypnos Site, Station Road, Princes Risborough, Buckinghamshire, HP27 9DN
Lap 12/02/2010 Residential (C3), Business (B1a), Retail (A1), General
N/A N/A Wycombe District Council
Avocet Trading Estate, West Richardson Street, High Wycombe, Buckinghamshire, HP11 2SB
PPG 17/12/2009 18/03/2010 Retail (A1) 1345 Gross sq m Wycombe District Council
Morrisons, Bellfield Road, High Wycombe, Buckinghamshire, HP13 5XX
App 12/10/2009 Retail (A1) 760 Gross sq m Wycombe District Council
Planning Applications - Retail

Chapel House, Liston Road,
Marlow, Buckinghamshire,
SL7 1TJ
PPG 10/07/2009 12/03/2010 Retail (A1), Business
(B1a)849 Gross sq m
Wycombe District
Council
Chapel House, Liston Road,
Marlow, Buckinghamshire,
SL7 1TJ
PPG 10/07/2009 12/03/2010 Retail (A1), Business
(B1a)849 Gross sq m
Wycombe District
Council
17-25 Octagon Parade,
White Hart Street; 2-10
Octagon Court Bull Lane,
Oxford Street, High
Wycombe,
Buckinghamshire, HP11
2HU
App 26/06/2009 Hotels (C1), Retail
(A1), Business (B1a)N/A N/A
Wycombe District
Council
15 Queens Square, High
Wycombe,
Buckinghamshire, HP11
2DF
PPG 12/03/2009 24/06/2009 Retail (A2) N/A N/AWycombe District
Council

Area: Wycombe (2010 Districts and Council Areas)Base: Great Britain 06/09/2011
Address Opening Date Total Size (sq m)
Opening Hours
Anchor Tenants Owner(s)
Wycombe Retail Park, Abbey Barn Lane, High Wycombe, Buckinghamshire, HP10 9QQ
31/08/2004 9940.54 N/A N/A Kennet Properties Limited
Knaves Beech Retail Park, Knaves Beech Way, High Wycombe, Buckinghamshire, HP10 9QY
01/05/2002 8173.73 N/A N/A UK Commercial Property Trust
The Chilterns Shopping Centre, Church Street, High Wycombe, Buckinghamshire, HP13 5ES
01/05/1987 9290.238:30am-17.30pm Mon to Sat
Primark,Wilkinson
Buckinghamshire Chiltern University College, GRANADA UK RENTAL AND RETAIL LIMITED, Royal London Mutual Insurance Society (The)
Eden, Oxford Road, Western Sector, High Wycombe, Buckinghamshire, HP11 2DQ
01/01/1969 81824.5
Mon-Fri 09:00-20:00, Sat 09:30-19:00, Sun 11:00-17:00
Bhs,House of Fraser,Marks & Spencer
Brookfield Europe, Reuben Brothers Foundation, Stannifer Developments Limited, Westfield Shoppingtowns Limited
Shopping Centre Details
Details from EGi's Shopping Centre Research. The Shopping Centre Research database contains information on purpose-built retail schemes - shopping centre, retail park, factory outlet, or shopping park. The database focuses on schemes of in excess of 50.

Area: Wycombe (2010 Districts and Council Areas)Base: Great Britain
The 20 most recent deals for this area and sector are displayed below, click on the arrows on the date heading to show all the deals.
Date Postcode Address Type Lessee/ Purchaser
Total Space Price (£) Rental PSM Yield (%)
01/04/2011 HP12 3RB
Abbey House, Lincoln Road, High Wycombe, Buckinghamshire, HP12 3RB
Lease Lessee: Private individual(s)
1200.48 Net sq m N/A N/A N/A
01/04/2011 HP11 2LT
Riverside Business Centre, Victoria Street, High Wycombe, Buckinghamshire, HP11 2LT
Lease Lessee: Private individual(s)
111.483 Net sq m N/A £80.73 N/A
01/04/2011 SL8 5DT
Wessex Road Industrial Estate, Wessex Road, Bourne End, Buckinghamshire, SL8 5DT
Lease Lessee: Private individual(s)
603.679 Net sq m N/A N/A N/A
14/10/2010 HP12 4BY
C&C Works, Chapel Lane, High Wycombe, Buckinghamshire, HP12 4BY
Lease Lessee: Translux Limited
1752.42 Net sq m N/A N/A N/A
04/10/2010 HP27 9PX
Regent Park, Princes Estate, Summerleys Road, Princes Risborough, Buckinghamshire, HP27 9PX
Lease Lessee: Molins plc
2701 Net sq m N/A £92.00 N/A
22/09/2010 HP12 3AJ
Maygilt House, 6 Grafton Street, High Wycombe, Buckinghamshire, HP12 3AJ
Lease Lessee: South Bucks NHS Trust
99.4983 Net sq m N/A £64.37 N/A
23/07/2010 HP27 9PX
Regent Park, Princes Estate, Summerleys Road, Princes Risborough, Buckinghamshire, HP27 9PX
Investment Sale
Lessee: Molins plc, Purchaser: Kingston Estates Limited
2701.04 Net sq m £2962500 N/A N/A
12/07/2010 HP14 4HW
Ministry Wharf, Wycombe Road, High Wycombe, Buckinghamshire, HP14 4HW
Lease Lessee: M S Precision Limited
115.942 Net sq m N/A £77.61 N/A
30/06/2010 HP12 3AB
161 West Wycombe Road, High Wycombe, Buckinghamshire, HP12 3AB
Sale Purchaser: Private individual(s)
851.821 Net sq m £660000 N/A N/A
15/06/2010 HP12 4AZ
Thames Water, Mill End Road, High Wycombe, Buckinghamshire, HP12 4AZ
Sale Purchaser: Skillbond Limited
0.655578 Hectares N/A N/A N/A
28/02/2010 HP14 3JS
T & L Furniture Sawmills, 28 The Row, High Wycombe, Buckinghamshire, HP14 3JS
Licence N/A 66.3322 Net sq m N/A £60.28 N/A
28/02/2010 HP14 3JS
T & L Furniture Sawmills, 28 The Row, High Wycombe, Buckinghamshire, HP14 3JS
Licence Lessee: FOOD FOR THOUGHT LIMITED
297.287 Net sq m N/A £40.04 N/A
Industrial Deals Listing

28/02/2010 HP11 1LG
320 London Road,
High Wycombe,
Buckinghamshire,
HP11 1LG
Sale
Purchaser:
Private
individual(s)
510.962 Net
sq m£318000 N/A N/A
26/02/2010 HP27 9PX
Regent Park,
Princes Estate,
Summerleys Road,
Princes
Risborough,
Buckinghamshire,
HP27 9PX
Sale Purchaser: Fun
Collectables
221.479 Net
sq m£275000 N/A N/A
10/02/2010 HP10 0AU
85-87 Holtspur
Lane, High
Wycombe,
Buckinghamshire,
HP10 0AU
Lease
Lessee:
Tactical
Performance
Group
3679 Net sq
mN/A £32.00 N/A
30/01/2010 HP14 3JS
T & L Furniture
Sawmills, 28 The
Row, High
Wycombe,
Buckinghamshire,
HP14 3JS
Licence
Lessee:
Saphire
Wedding Cars
278.707 Net
sq mN/A £32.29 N/A
15/01/2010 HP12 3HZ
Wycombe Trade
Park, Lancaster
Road, High
Wycombe,
Buckinghamshire,
HP12 3HZ
Lease N/A472.222 Net
sq mN/A N/A N/A
15/01/2010 HP12 3ES
Britannia Industrial
Park, Dashwood
Avenue, High
Wycombe,
Buckinghamshire,
HP12 3ES
Lease N/A109.532 Net
sq mN/A N/A N/A
15/01/2010 HP11 2LT
Riverside Business
Centre, Victoria
Street, High
Wycombe,
Buckinghamshire,
HP11 2LT
Lease N/A141.397 Net
sq mN/A N/A N/A
01/01/2010 HP14 3JS
T & L Furniture
Sawmills, 28 The
Row, High
Wycombe,
Buckinghamshire,
HP14 3JS
Lease Lessee: Private
Clients
2508.36 Net
sq mN/A £6.78 N/A
01/01/2010 HP12 3RP
Ranton Site,
Coronation Road,
High Wycombe,
Buckinghamshire,
HP12 3RP
Lease
Lessee:
PRESTIGE
TOOLS
LIMITED
445.281 Net
sq mN/A £44.89 N/A
01/01/2010 HP12 3PS
Cressex Business
Park, Trenchard
House, Wellington
Road, High
Wycombe,
Buckinghamshire,
HP12 3PS
Sale
Purchaser:
Hazlemere
Estates
Management
Ltd
3344.48 Net
sq m£1150000 N/A N/A
01/01/2010 HP13 5RE
Manor Courtyard,
Hughenden
Avenue, High
Wycombe,
Buckinghamshire,
HP13 5RE
Lease N/A2787.07 Net
sq mN/A £10.76 N/A

Area: Wycombe (2010 Districts and Council Areas)Base: Great Britain
Planning applications for this use type in this area. The most recent 20 are displayed, use the filter arrows to display more.
Address Status Application Date Permission Date
Subsector Proposed Size Units Planning Authority
Wessex Road Industrial Estate, Wessex Road, Bourne End, Buckinghamshire, SL8 5DT
PPG 23/06/2011 03/08/2011 Industrial (B8), Business (B1a) 761 Gross sq m
Wycombe District Council
Roundwood House, 134-136 Lane End Road, High Wycombe, Buckinghamshire, HP12 4HX
App 14/06/2011 Industrial (B8) 1293 Gross sq mWycombe District Council
Hampden Saw Mills, Great Hampden, Great Missenden, Buckinghamshire, HP16 9RG
App 05/05/2011
Business (B1a), Business (B1c), Industrial (B8), Assembly & Leisure (D2)
50 Gross sq mWycombe District Council
Spring Bank House, High Street, High Wycombe, Buckinghamshire, HP14 3JH
Ref 06/04/2011 Residential (C3), Industrial (B1/2/8)
1114 Gross sq mWycombe District Council
Former Turner Groundscare, Chinnor Road, Princes Risborough, Buckinghamshire, HP27 9PH
PPG 31/03/2011 06/05/2011 Business (B1c), Industrial (B2) N/A N/A
Wycombe District Council
Southside Farm, London Road, High Wycombe, Buckinghamshire, HP10 0NN
App 29/03/2011 Industrial (B2), Business (B1c), General
N/A N/AWycombe District Council
Knaves Beech Industrial Estate, Knaves Beech Way, High Wycombe, Buckinghamshire, HP10 9QY
PPG 10/01/2011 30/03/2011 Business (B1a), Industrial (B8) 1560 Gross sq m
Wycombe District Council
Knaves Beech Industrial Estate, Knaves Beech Way, High Wycombe, Buckinghamshire, HP10 9QY
PPG 10/01/2011 30/03/2011 Business (B1a), Industrial (B8) 1560 Gross sq m
Wycombe District Council
Morrisons, Bellfield Road, High Wycombe, Buckinghamshire, HP13 5XX
With 05/11/2010
General, General, Industrial (B8), Residential Institutional (C2)
N/A N/AWycombe District Council
William Bartlett & Son, Grafton Street, High Wycombe, Buckinghamshire, HP12 3AJ
App 29/10/2010
Residential (C3), Industrial (B8), Industrial (B2)
1998 Gross sq mWycombe District Council
William Bartlett & Son, Grafton Street, High Wycombe, Buckinghamshire, HP12 3AJ
App 29/10/2010
Residential (C3), Industrial (B8), Industrial (B2)
217 Gross sq mWycombe District Council
William Bartlett & Son, Grafton Street, High Wycombe, Buckinghamshire, HP12 3AJ
App 29/10/2010
Residential (C3), Industrial (B8), Industrial (B2)
1998 Gross sq mWycombe District Council
William Bartlett & Son, Grafton Street, High Wycombe, Buckinghamshire, HP12 3AJ
App 29/10/2010
Residential (C3), Industrial (B8), Industrial (B2)
217 Gross sq mWycombe District Council
Wycombe Marsh Southern Land, London Road, Genoa Way, High Wycombe, Buckinghamshire, HP11 1EZ
OutPPG 16/08/2010 25/07/2011
Residential (C3), Industrial (B1/2), Non-resi Institutional (D1)
2800 Gross sq mWycombe District Council
Planning Applications - Industrial

Thames Water, Mill End
Road, High Wycombe,
Buckinghamshire, HP12
4AZ
PPG 26/07/2010 05/01/2011 Industrial (B8) 776 Gross sq m
Wycombe
District
Council
Tannery Road Industrial
Estate, Tannery Road, High
Wycombe,
Buckinghamshire, HP13
7EQ
Ref 29/04/2010 Industrial (B2),
Retail (A1)2649 Gross sq m
Wycombe
District
Council
Matrix House, Lincoln
Road, High Wycombe,
Buckinghamshire, HP12
3RB
PPG 02/03/2010 26/04/2010 Industrial
(B1/2/8)780 Gross sq m
Wycombe
District
Council
Sands Industrial Estate,
Hillbottom Road, High
Wycombe,
Buckinghamshire, HP12
4HJ
PPG 01/02/2010 11/03/2010
Industrial
(B1/2), Business
(B1c)
4 Units
Wycombe
District
Council
Cressex Business Park,
Halifax Road, High
Wycombe,
Buckinghamshire, HP12
3SD
App 20/11/2009
Industrial
(B1/2/8),
Business (B1a)
870 Gross sq m
Wycombe
District
Council
Abbey House & Matrix
House, Lincoln Road, High
Wycombe,
Buckinghamshire, HP12
3RB
OutPPG 25/06/2009 25/08/2009 Industrial
(B1/2/8)2379 Gross sq m
Wycombe
District
Council