Embed Size (px)
Citation preview
Evaluation of a segmentation procedure to delineate organs foruse in construction of a radiation therapy planning atlas
Sharif M. Qatarneh a,�, Marilyn E. Noz b, Simo Hyodynmaa c, GeraldQ. Maguire, Jr d, Elissa L. Kramer b, Joakim Crafoord e
a Department of Medical Radiation Physics, Karolinska Institute, Stockholm University, P.O. Box 260, SE-171 76 Stockholm, Swedenb Department of Radiology, New York University, New York, NY, USA
c Department of Oncology, Tampere University Hospital, Tampere, Finlandd Institute for Microelectronics and Information Technology, Royal Institute of Technology (KTH), Stockholm, Sweden
e Department of Radiology, Karolinska Hospital, Stockholm, Sweden
Accepted 18 September 2002
Abstract
Objectives: This paper evaluates a semi-automatic segmentation procedure to enhance utilizing atlas based treatment
plans. For this application, it is crucial to provide a collection of ‘reference’ organs, restorable from the atlas so that
they closely match those of the current patient. To enable assembling representative organs, we developed a semi-
automatic procedure using an active contour method. Method: The 3D organ volume was identified by defining
contours on individual slices. The initial organ contours were matched to patient volume data sets and then
superimposed on them. These starting contours were then adjusted and refined to rapidly find the organ outline of the
given patient. Performance was evaluated by contouring organs of different size, shape complexity, and proximity to
surrounding structures. We used representative organs defined on CT volumes obtained from 12 patients and compared
the resulting outlines to those drawn by a radiologist. Results: A strong correlation was found between the area
measures of the delineated liver (r�/0.992), lung (r�/0.996) and spinal cord (r�/0.81), obtained by both segmentation
techniques. A paired Student’s t -test showed no statistical difference between the two techniques regarding the liver and
spinal cord (p �/0.05). Conclusion: This method could be used to form ‘standard’ organs, which would form part of a
whole body atlas (WBA) database for radiation treatment plans as well as to match atlas organs to new patient data.
# 2002 Elsevier Science Ireland Ltd. All rights reserved.
Keywords: Active contour model; Matching transformation; Radiation therapy planning; Segmentation; Whole body atlas
1. Introduction
The aim of radiation therapy is to provide
the highest possible tumor control while
keeping the normal healthy tissue toxicity as
low as possible. This can only be achieved
� Corresponding author. Tel.: �/46-8-5177-3452; fax: �/46-8-
343-525
E-mail address: [email protected] (S.M.
Qatarneh).
International Journal of Medical Informatics 69 (2003) 39�/55
www.elsevier.com/locate/ijmedinf
1386-5056/02/$ - see front matter # 2002 Elsevier Science Ireland Ltd. All rights reserved.
PII: S 1 3 8 6 - 5 0 5 6 ( 0 2 ) 0 0 0 7 9 - 5
when the exact location of the target volume
to be treated is defined with respect to all
organs at risk. Precise delineation of all
relevant anatomical structures and their bio-
logical response characteristics are necessary
for accurate beam alignment and treatment
planning [1]. Furthermore, quantitative meth-
ods are required to give a more accurate
description of volumes of interest specifically
related to radiotherapy for optimization of the
whole treatment planning process [2].Computed tomography (CT) and Magnetic
Resonance (MR) are the best imaging mod-
alities for delineating volumes of interest for
radiation therapy. MR is considered to be
superior to CT when soft tissue contrast,
especially near bony structures, is of major
concern. However, CT has the advantage over
MR for obtaining strict geometrical informa-
tion about anatomical structures as well as
tissue density information that is necessary for
dose calculations in radiation therapy plan-
ning [3].Segmentation is used for dividing a volume
into multiple areas or objects with distinct
features, such as individual organs or tissues.
Humans perform these tasks by visual inspec-
tion using complex analysis of size, shape,
location, texture, intensity and proximity to
surrounding structures. In radiation therapy
planning, the aims of the segmentation pro-
cess can be stated as:
1) To provide a clear identification of the
target volumes, organs at risk and other
regions of interest for evaluating the
tumor cure and the probability of normal
tissue complication using radiobiological
models [1].2) To allocate the right radiobiological re-
sponse parameters and radiation trans-
port quantities to the relevant organs in
the patient for treatment planning.
3) To provide a 3D visualization and projec-
tion of different organs and target vo-
lumes for determining suitable beam
directions in tumors eye view and selecting
the internal target volume and set-up
margins in beams eye view [2,3].
We are developing a whole body atlas
(WBA), which will serve as a database of
radiation treatment plans, radiation transport
data, radiobiological response data, organs at
risk, tumor staging and many other para-
meters that are needed for radiation treatment
optimization. The atlas will, in addition,
contain standardized, segmented organs form-
ing a reference or standard man, which would
then be converted into the exact anatomic
organs of an individual patient for final
treatment planning. Different organs have to
be segmented to form a reference organ data
set for this standard man geometry. That
organ set will then be stored in the WBA.In this paper, we investigate a two-step
method suitable for transforming these stan-
dard atlas organs into those of an individual
patient. This method is also suitable for the
generation of the standardized organs. The
first step is to match and superimpose the
contours derived from the Visible Human
Male data set (VHMCT), considered as re-
ference man, to consecutive patient image
slices [4,5]. The second step consists of refin-
ing these contours by applying an active
contour model to outline the patient’s organ.
The usability of the transformation in the first
step for matching 3D volumes of the thorax
and abdomen for construction of a WBA has
been evaluated in earlier work [6,7]. A 2D
segmentation method based on applying ac-
tive contour models seems appealing due to
the model’s ability to segment anatomical
structures by exploiting mixed image data
constraints together with a priori knowledge
S.M. Qatarneh et al. / International Journal of Medical Informatics 69 (2003) 39�/5540
about the location, size, and shape of thestructures [8,9].
The Visible Human Project CT data set(VHPCT) is a library that represents almost acomplete CT data set of adult male andfemale cadavers [5]. The VHPCT as well asthe optical VHP data set has been used togenerate a versatile 3D anatomical atlas [10].In this work, the VHMCT data set wasconsidered as standard man geometry.
The main purpose of this work is toevaluate a semi-automatic segmentation pro-cedure, which could be used for generatingand utilizing a WBA database to delineatedifferent organs for radiation therapy plan-ning. This would then allow utilizing WBAfor:
1) Accurate and simple comparisons usingthe whole library of treatment plans fordifferent disease stages and treatmenttechniques.
2) Storage of patient specific data in acompact atlas form using the transforma-tion parameter data set.
3) Access to ideal reference points for opti-mal organ warping.
Our segmentation approach utilizes poly-nomial warping transformation together withactive contour models and employs theVHPCT data set as standard man geometry.
2. Active contour models
Active contour models, commonly calledsnakes, are energy-minimizing splines guidedby external constraint forces and influencedby image forces that pull them toward theshape’s features such as lines and edges[8,9,11].
The position of a snake can be representedparametrically by, v(s)�/(x(s), y(s)), where
v(s) is the curve of the snake, x and y are theco-ordinate functions, and s � /[0,1] is thecurve’s arc length.
The total energy of the snake Etotal can thenbe given in terms of three basic energyfunctions [8,12]:
Etotal�g1
0
Einternal(v(s))ds�g1
0
Eedge(v(s))ds
�Eregion(v(s)) (1)
The energy functions correspond to theforces that control active contour models,which are internal and image forces. Theinternal energy of the snake model can bewritten as:
Einternal�v1½v?(s)½2�v2½vƒ(s)½2 (2)
where v ?(s) and vƒ(s) indicate the first andsecond derivatives of v(s), respectively. Theinternal energy contains a first-order termcontrolled by v1, and a second-order termcontrolled by v2. The values of these twoterms (elasticity parameters) determine theextent to which the snake can stretch orbend at any point along its length. The first-order term introduces ‘tension’, while thesecond-order term produces ‘stiffness’.
By processing a raw image of intensity I(x ,y), edges can be found with a gradient-basedweighted energy function. Having:
Eedge��v3½9I(x; y)½ (3)
This energy produces a force that drives thesnake towards pixel locations with large imagegradients when Eedge is minimized.
The active contour model that we haveimplemented incorporates region informationanalysis together with the Greedy algorithm[12,13]. The Greedy algorithm computes thetotal energy for the current location (i.e. onevertex and each of its neighbors). The locationhaving the smallest value is chosen as the newposition and so on. The region energy is
S.M. Qatarneh et al. / International Journal of Medical Informatics 69 (2003) 39�/55 41
derived from the analysis of the pixel inten-sities in the region defined by the contour. Ifthere are N contours, the image is segmentedinto N�/1 regions.
Defining ni as the number of pixels in theith region, D as the mean CT-number value(Hounsfield units) of the CT image, Di as themean CT-number value of the ith region, D
ji
as the CT-number of the jth pixel in the ithregion, then:
S2b�
XN
i�0
ni(Di�D)2 (4)
and,
S2w�
XN
i�0
Xni
j�1
(Dji �Di)
2 (5)
where S2b/�/between region, and S2
w/�/withinregion variance. The region-based energy isgiven by [12],
Eregion�v4
S2w
S2b
(6)
region energy minimization occurs when S2w is
minimized and S2b is maximized.
Active contour models do not try to solvethe entire problem of finding salient imagefeatures; they rely on other mechanisms toplace them somewhere near a desired solution.Therefore, we have employed a warpingtechnique to produce a snake’s seed that isclose enough to the outline that we are seeking[4,6].
3. Material and methods
For the purposes of this work, the VisibleHuman Male CT data set (VHMCT) wasconsidered as reference man [5]. The VHMCTcontains 509 axial CT slices taken at 1�/5 mmintervals. The body section chosen was theupper abdomen (i.e. hepatic region), covered
by 62 axial CT slices. This region was used forboth liver and spinal cord delineation. In caseof right lung delineation, the thorax was thebody section of interest, covered by 70 axialCT slices. The CT scans, for the hepatic regionand the thorax, were taken at 3 mm intervalsand the resolution was reduced to 256�/256pixels in order to decrease processing time.
CT scans of the abdomen for six femalepatients (aged 37�/60) who had advancedbreast cancer were used for the liver and thespinal cord delineation. Prior to imaging,three patients had intravenous injection andthe other three had orally administered iodineCT contrast agent. The data set of the hepaticregion varied between 18 and 26 slices, all ofwhich cover the selected region of interestfrom the top to the bottom of the organ. Thethoracic CT scans of six patients (two female,four male*/aged 52�/81) who had non-smallcell lung carcinoma were used for the rightlung delineation. The data set of the thoracicregion varied between 40 and 45 slices.
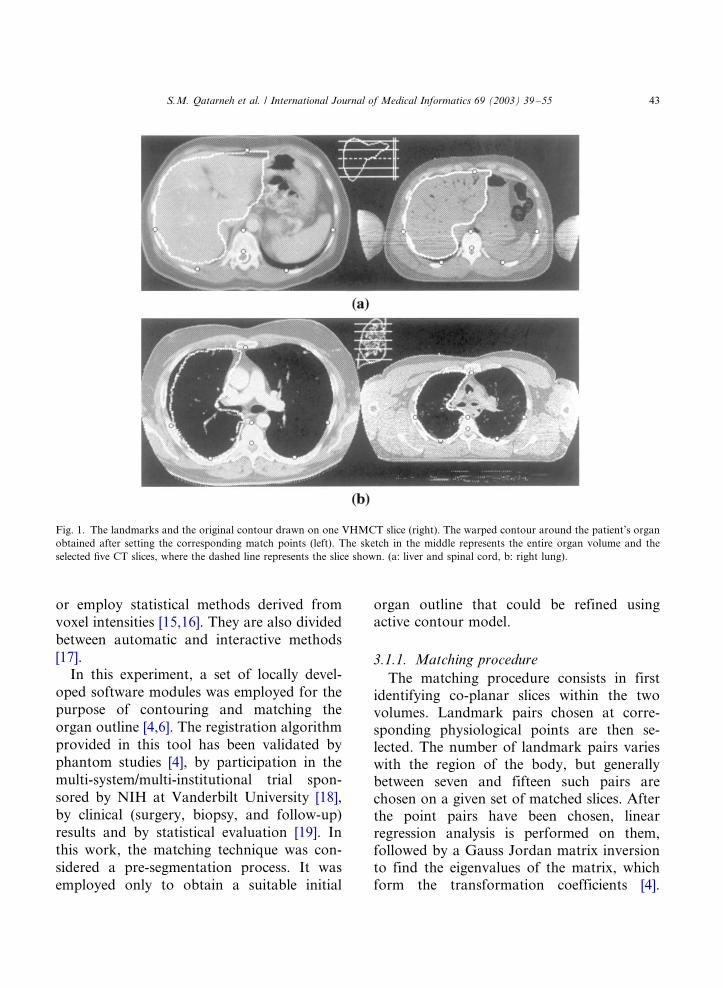
All patient images used were reduced to amatrix size of 256�/256 with a pixel sizeranging from 1 to 1.5 mm with a 7 mmdistance between slices. Five slices for eachpatient were selected for both warping andsegmentation, covering the organ at equalintervals from the top to the bottom of theorgan. A sketch in the middle of Fig. 1represents the organ (e.g. liver, spinal cordand right lung) and the five selected CT slices.
3.1. Matching transformation
Prior to the segmentation process, a match-ing technique was utilized to get the optimalseed (i.e. initial contour) for the snake torefine. These types of registration algorithmsgenerally either require identification of cor-responding points, lines, and/or surfaces in thetwo volumes to be fused [14]; or employvolume techniques based on voxel intensities
S.M. Qatarneh et al. / International Journal of Medical Informatics 69 (2003) 39�/5542
or employ statistical methods derived from
voxel intensities [15,16]. They are also divided
between automatic and interactive methods
[17].In this experiment, a set of locally devel-
oped software modules was employed for the
purpose of contouring and matching the
organ outline [4,6]. The registration algorithm
provided in this tool has been validated by
phantom studies [4], by participation in the
multi-system/multi-institutional trial spon-
sored by NIH at Vanderbilt University [18],
by clinical (surgery, biopsy, and follow-up)
results and by statistical evaluation [19]. In
this work, the matching technique was con-
sidered a pre-segmentation process. It was
employed only to obtain a suitable initial
organ outline that could be refined usingactive contour model.
3.1.1. Matching procedure
The matching procedure consists in firstidentifying co-planar slices within the twovolumes. Landmark pairs chosen at corre-sponding physiological points are then se-lected. The number of landmark pairs varieswith the region of the body, but generallybetween seven and fifteen such pairs arechosen on a given set of matched slices. Afterthe point pairs have been chosen, linearregression analysis is performed on them,followed by a Gauss Jordan matrix inversionto find the eigenvalues of the matrix, whichform the transformation coefficients [4].
Fig. 1. The landmarks and the original contour drawn on one VHMCT slice (right). The warped contour around the patient’s organ
obtained after setting the corresponding match points (left). The sketch in the middle represents the entire organ volume and the
selected five CT slices, where the dashed line represents the slice shown. (a: liver and spinal cord, b: right lung).
S.M. Qatarneh et al. / International Journal of Medical Informatics 69 (2003) 39�/55 43
Either first or second order polynomials are
used, depending on the severity of the trans-
formation to produce a full non-affine (warp-
ing) transformation. The linear regression is
used to minimize the effects of mismatched
pairs. The transformation coefficients*/the
eigenvalues*/are then used together with a
re-sampling technique to determine the new
coordinates for each pixel in the slice to be
moved. The alteration achieved by the appli-
cation of the algorithm may be performed on
either the slices themselves or on a contour
drawn on the slice which outlines a particular
structure. In this experiment, seven landmark
pairs were chosen on each selected slice pair.
The landmarks were placed at physiological
points, which were easily recognizable in both
the VHMCT and patients scans, so that they
would be easily recognized by any observer.
For the abdomen and the thorax, the points
used in this experiment were as shown in (Fig.
1):
1) Linea Alba (or the posterior center pointof the sternum for the thorax studies).
2) Anterior center point of vertebrae.3) Furthest two points on the rib cage (right/
left) aligned with the vertebrae point.4) Anterior center point of cauda equina.5) Lowest two points (right/left) on the
posterior part of rib cage.
3.1.2. VHMCT images
The organs (i.e. liver, spinal cord, and right
lung) were outlined manually in all VHMCT
slices and the organ contours were checked by
an experienced radiologist. Afterwards, a set
of seven landmarks for each particular
VHMCT slice was selected. Once landmarks
were chosen and the outlines were drawn, any
slice could be used with any patient’s slice in
the next stage of the procedure.
3.1.3. Patients’ images
A visual inspection was performed in orderto find approximate similarity between aselected patient’s CT slice and the correspond-ing VHMCT slice. No attempt was made tore-project the set of patient slices to exactlymatch the VHMCT slice set, as we were onlyusing the warped contour as an initial start forthe snake- not as a true registration of theorgans. Then, the corresponding landmarks(i.e. seven match points) were set on thepatient’s slice. Afterwards, a transformedcontour of the organ was warped from theVHMCT slice into the patient’s slice. Fig. 1shows the seven landmarks and the originalorgan outline drawn on the VHMCT slice(right), while the warped contour around theorgan in the patient slice was generated aftersetting the corresponding match points (left).
3.2. Segmentation
Ultimately, the initial contour (i.e. snake’sseed) should be defined so that it is closeenough to the desired outline to avoid havingit trapped in local minima of the energy thatdo not correspond to a boundary of thephysical object we are seeking. For thepurpose of delineating the liver and the lung,the snake’s performance was optimal whenthe initial contour was placed inside the organof interest. This is necessary due to the factthat much less distinct features exist in themore ‘homogeneous’ inner region of the organthan the outside region where many morestructures exist. If initially placed outside theorgan, the snake could easily be trapped inlocal minima of the potential surface that donot correspond to the features of the organ. Inother words, the initial contour must be largeenough so that it is not too far from theboundary of the organ, and small enough sothat it has more freedom to move inside ahomogeneous background towards the or-
S.M. Qatarneh et al. / International Journal of Medical Informatics 69 (2003) 39�/5544
gan’s boundary. Provided that the trans-formed lung outline was close to the lungboundary in most cases, it was not alwaysnecessary to have the lung contour inside theorgan since the attenuation of the lung differshighly from the surrounding tissue. However,it was not possible to place the transformedspinal cord outline inside the organ due to itssmall size.
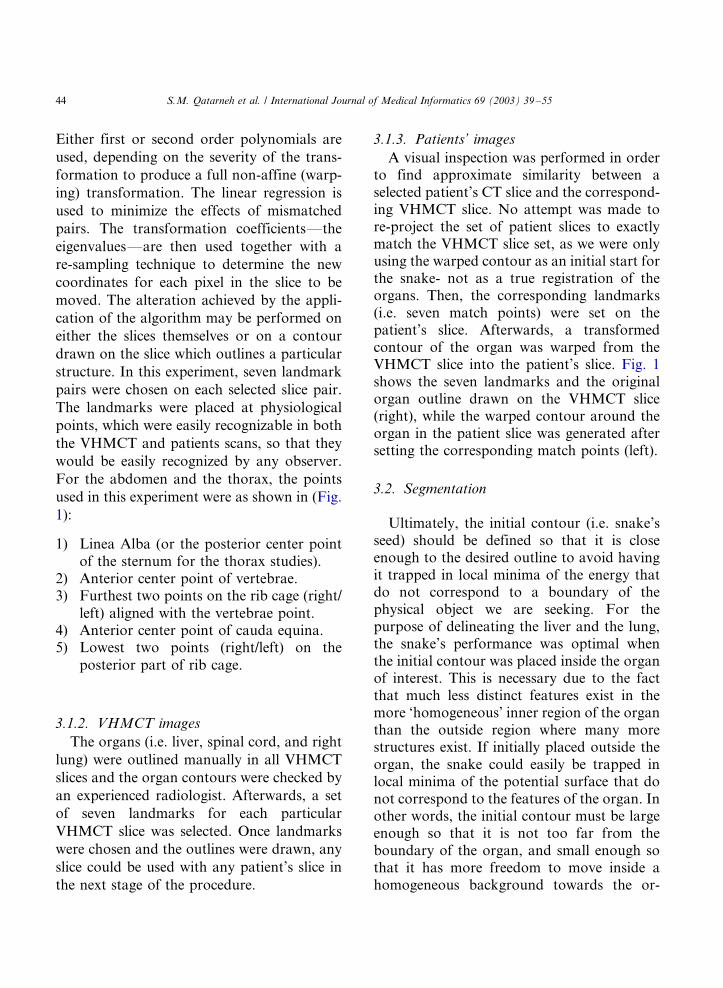
Individual contour vertex or the wholetransformed contour could be manuallymoved, if necessary, to get it as close aspossible to the organ of interest prior torunning the snake program. This feature,which is implemented by mouse ‘click/drag’features in the user interface, gives the user theability to pull snake’s elements away fromlocal features that do not correspond to theorgan of interest. The number of contour’svertices that can be transferred individually,for position editing, is limited to 15% of theoverall number of vertices. To initialize thecontour inside the organ, a ‘shrink to fit’approach was implemented where the wholetransformed contour was shrunk to fit intothe organ. The approximate size of the outlineafter being shrunk is 85% of the original size.The re-sized warped contour is the snake’sseed in that case. The warped liver outline,transferred and shrunk in size, is shown (Fig.2a).
The controlling parameters of the snake,which include tension weight, stiffness weight,edge term, and image energy minimizationparameters, were tested for optimal efficiencyon patients’ images. The active contour’sperformance was judged to be optimal whenthe snake-refined contour closely matched themanually drawn one without user interaction.The performance was found to be optimalwhen the snake’s energy weights were fixed(Table 1).
Using higher tension weight than stiffnessweight gives the snake sufficient flexibility to
follow the round shape of the liver or the lung
boundaries, while favoring higher region
weight than edge weight marks the impor-
tance of the image homogeneity over the
gradient attraction force. The edge weight
was set lower for the lung to avoid the contour
being trapped in pixels with high image
gradient that are present inside the less
homogeneous lung Eq. (3). Due to the small
size of the spinal cord, the tension weight was
set to obtain enough elasticity but the stiffness
weight was set to maximum so that the snake
could stretch enough to avoid clustering of
neighboring vertices. Higher edge term was
favored to region term since the edges of the
Fig. 2. (a) The transformed liver and spinal cord outlines
(white), the resized liver outline (black), and the final snake-
refined liver and spinal cord contours (dotted black). (b) The
warped right lung outline (white) and the final snake-refined
lung contour (dotted white).
S.M. Qatarneh et al. / International Journal of Medical Informatics 69 (2003) 39�/55 45
spinal vertebrae provide high gradients to
attract the snake.Generally, the distance between vertices in
the initial contour (i.e. warped outline) was
defined to be between 5 mm for the spinal
cord and around 1 cm for both the liver and
the lung. That provided enough control to
avoid clustering of the snake’s vertices at one
region when a vertex is trapped in a local
minimum. The snake is then initialized to find
the true outline of the patient’s organ of
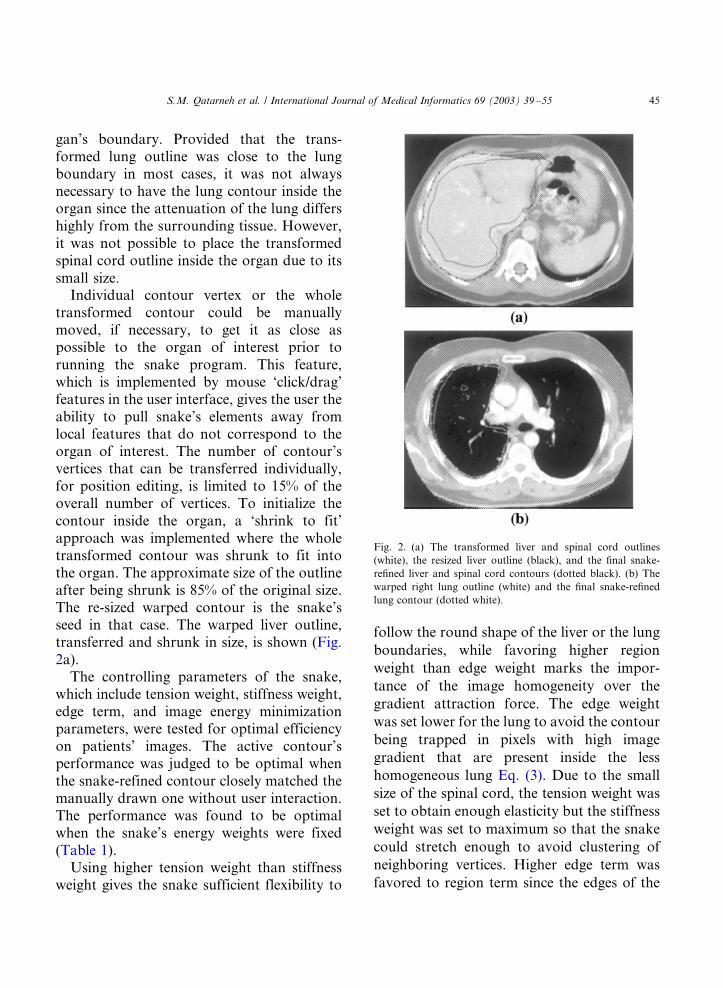
interest. Fig. 2 shows the initial warped organoutline and the final snake-refined contour.The whole procedure was applied to the fivedifferent organ slices from each of the twelvepatients. Fig. 3 shows a schematic representa-tion of the implemented procedure.
4. Evaluation
Thirty snake-refined outlines, for each or-gan, were evaluated using radiologist-drawnoutlines as a gold standard. Manual contour-ing was executed before any snake-refinedoutlines were obtained. The three organs weremanually delineated, by the same radiologist,while the window and the level settings of thedisplay were fixed. Statistical and quantitativeanalyses were performed on all sets of seg-mented images regarding:
4.1. Area inside the contour and the
approximate volume of the organ
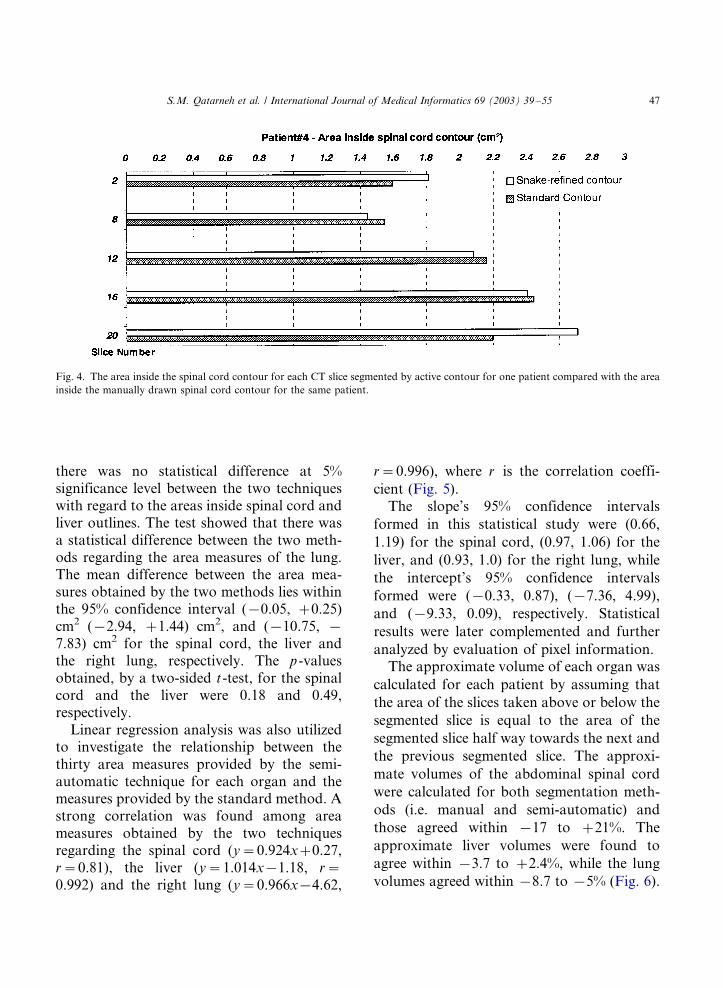
The area inside the contour was calculatedfor each outline obtained after semi-automaticand manual segmentation. Fig. 4 shows thearea inside the spinal cord contour for eachCT slice as segmented by active contour, forone patient, compared with the area insidecontour for the manually segmented slice.
The sixty area measures obtained for eachorgan were statistically investigated in orderto estimate the difference between the semi-automatic technique and the manual techni-que. A paired Student’s t-test showed that
Table 1
Optimal snake parameters for each organ
Organ Tension weight v1 Stiffness weight v2 Edge term v3 Region term v4
Liver 0.60 0.35 0.45 0.65
Spinal cord 0.50 0.95 0.70 0.30
Lung 0.50 0.30 0.25 0.50
Fig. 3. Steps in the segmentation procedure.
S.M. Qatarneh et al. / International Journal of Medical Informatics 69 (2003) 39�/5546
there was no statistical difference at 5%significance level between the two techniqueswith regard to the areas inside spinal cord andliver outlines. The test showed that there wasa statistical difference between the two meth-ods regarding the area measures of the lung.The mean difference between the area mea-sures obtained by the two methods lies withinthe 95% confidence interval (�/0.05, �/0.25)cm2 (�/2.94, �/1.44) cm2, and (�/10.75, �/
7.83) cm2 for the spinal cord, the liver andthe right lung, respectively. The p-valuesobtained, by a two-sided t-test, for the spinalcord and the liver were 0.18 and 0.49,respectively.
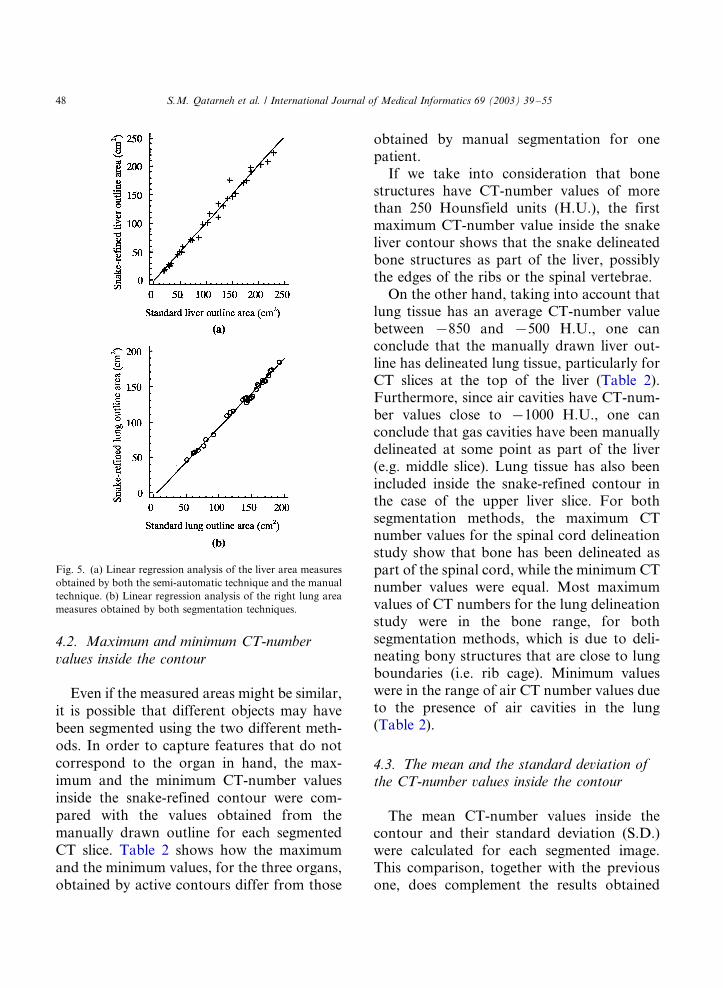
Linear regression analysis was also utilizedto investigate the relationship between thethirty area measures provided by the semi-automatic technique for each organ and themeasures provided by the standard method. Astrong correlation was found among areameasures obtained by the two techniquesregarding the spinal cord (y�/0.924x�/0.27,r�/0.81), the liver (y�/1.014x�/1.18, r�/
0.992) and the right lung (y�/0.966x�/4.62,
r�/0.996), where r is the correlation coeffi-
cient (Fig. 5).The slope’s 95% confidence intervals
formed in this statistical study were (0.66,
1.19) for the spinal cord, (0.97, 1.06) for the
liver, and (0.93, 1.0) for the right lung, while
the intercept’s 95% confidence intervals
formed were (�/0.33, 0.87), (�/7.36, 4.99),
and (�/9.33, 0.09), respectively. Statistical
results were later complemented and further
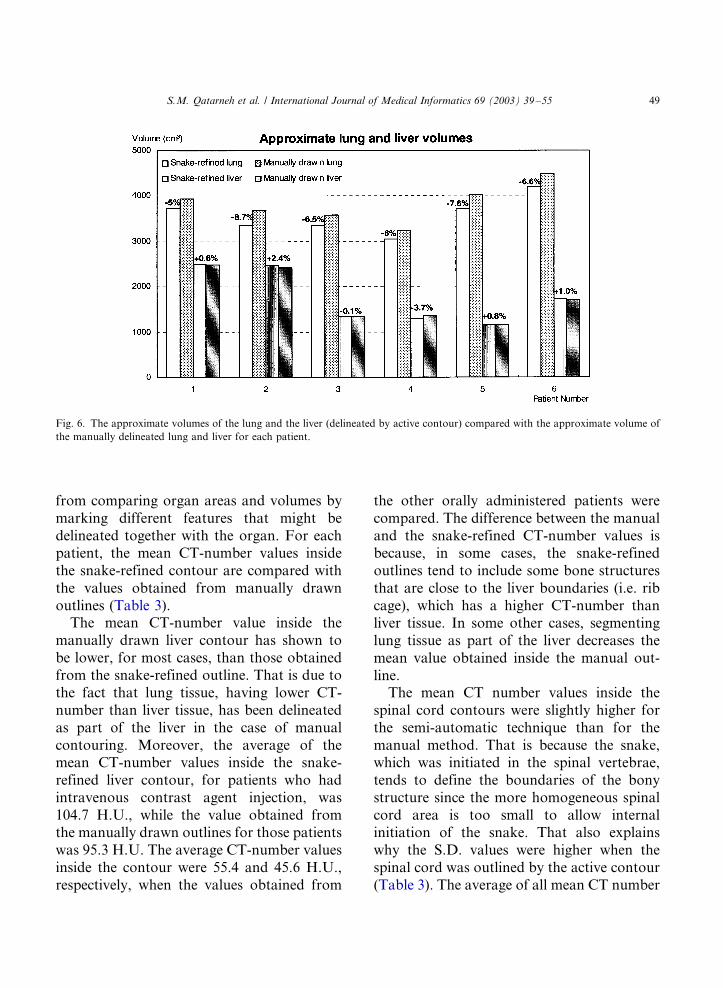
analyzed by evaluation of pixel information.The approximate volume of each organ was
calculated for each patient by assuming that
the area of the slices taken above or below the
segmented slice is equal to the area of the
segmented slice half way towards the next and
the previous segmented slice. The approxi-
mate volumes of the abdominal spinal cord
were calculated for both segmentation meth-
ods (i.e. manual and semi-automatic) and
those agreed within �/17 to �/21%. The
approximate liver volumes were found to
agree within �/3.7 to �/2.4%, while the lung
volumes agreed within �/8.7 to �/5% (Fig. 6).
Fig. 4. The area inside the spinal cord contour for each CT slice segmented by active contour for one patient compared with the area
inside the manually drawn spinal cord contour for the same patient.
S.M. Qatarneh et al. / International Journal of Medical Informatics 69 (2003) 39�/55 47
4.2. Maximum and minimum CT-number
values inside the contour
Even if the measured areas might be similar,it is possible that different objects may havebeen segmented using the two different meth-ods. In order to capture features that do notcorrespond to the organ in hand, the max-imum and the minimum CT-number valuesinside the snake-refined contour were com-pared with the values obtained from themanually drawn outline for each segmentedCT slice. Table 2 shows how the maximumand the minimum values, for the three organs,obtained by active contours differ from those
obtained by manual segmentation for onepatient.
If we take into consideration that bonestructures have CT-number values of morethan 250 Hounsfield units (H.U.), the firstmaximum CT-number value inside the snakeliver contour shows that the snake delineatedbone structures as part of the liver, possiblythe edges of the ribs or the spinal vertebrae.
On the other hand, taking into account thatlung tissue has an average CT-number valuebetween �/850 and �/500 H.U., one canconclude that the manually drawn liver out-line has delineated lung tissue, particularly forCT slices at the top of the liver (Table 2).Furthermore, since air cavities have CT-num-ber values close to �/1000 H.U., one canconclude that gas cavities have been manuallydelineated at some point as part of the liver(e.g. middle slice). Lung tissue has also beenincluded inside the snake-refined contour inthe case of the upper liver slice. For bothsegmentation methods, the maximum CTnumber values for the spinal cord delineationstudy show that bone has been delineated aspart of the spinal cord, while the minimum CTnumber values were equal. Most maximumvalues of CT numbers for the lung delineationstudy were in the bone range, for bothsegmentation methods, which is due to deli-neating bony structures that are close to lungboundaries (i.e. rib cage). Minimum valueswere in the range of air CT number values dueto the presence of air cavities in the lung(Table 2).
4.3. The mean and the standard deviation ofthe CT-number values inside the contour
The mean CT-number values inside thecontour and their standard deviation (S.D.)were calculated for each segmented image.This comparison, together with the previousone, does complement the results obtained
Fig. 5. (a) Linear regression analysis of the liver area measures
obtained by both the semi-automatic technique and the manual
technique. (b) Linear regression analysis of the right lung area
measures obtained by both segmentation techniques.
S.M. Qatarneh et al. / International Journal of Medical Informatics 69 (2003) 39�/5548
from comparing organ areas and volumes by
marking different features that might be
delineated together with the organ. For eachpatient, the mean CT-number values inside
the snake-refined contour are compared with
the values obtained from manually drawn
outlines (Table 3).The mean CT-number value inside the
manually drawn liver contour has shown to
be lower, for most cases, than those obtainedfrom the snake-refined outline. That is due to
the fact that lung tissue, having lower CT-
number than liver tissue, has been delineated
as part of the liver in the case of manual
contouring. Moreover, the average of themean CT-number values inside the snake-
refined liver contour, for patients who had
intravenous contrast agent injection, was
104.7 H.U., while the value obtained fromthe manually drawn outlines for those patients
was 95.3 H.U. The average CT-number values
inside the contour were 55.4 and 45.6 H.U.,
respectively, when the values obtained from
the other orally administered patients were
compared. The difference between the manual
and the snake-refined CT-number values isbecause, in some cases, the snake-refined
outlines tend to include some bone structures
that are close to the liver boundaries (i.e. rib
cage), which has a higher CT-number thanliver tissue. In some other cases, segmenting
lung tissue as part of the liver decreases the
mean value obtained inside the manual out-
line.The mean CT number values inside the
spinal cord contours were slightly higher for
the semi-automatic technique than for the
manual method. That is because the snake,which was initiated in the spinal vertebrae,
tends to define the boundaries of the bony
structure since the more homogeneous spinal
cord area is too small to allow internalinitiation of the snake. That also explains
why the S.D. values were higher when the
spinal cord was outlined by the active contour
(Table 3). The average of all mean CT number
Fig. 6. The approximate volumes of the lung and the liver (delineated by active contour) compared with the approximate volume of
the manually delineated lung and liver for each patient.
S.M. Qatarneh et al. / International Journal of Medical Informatics 69 (2003) 39�/55 49
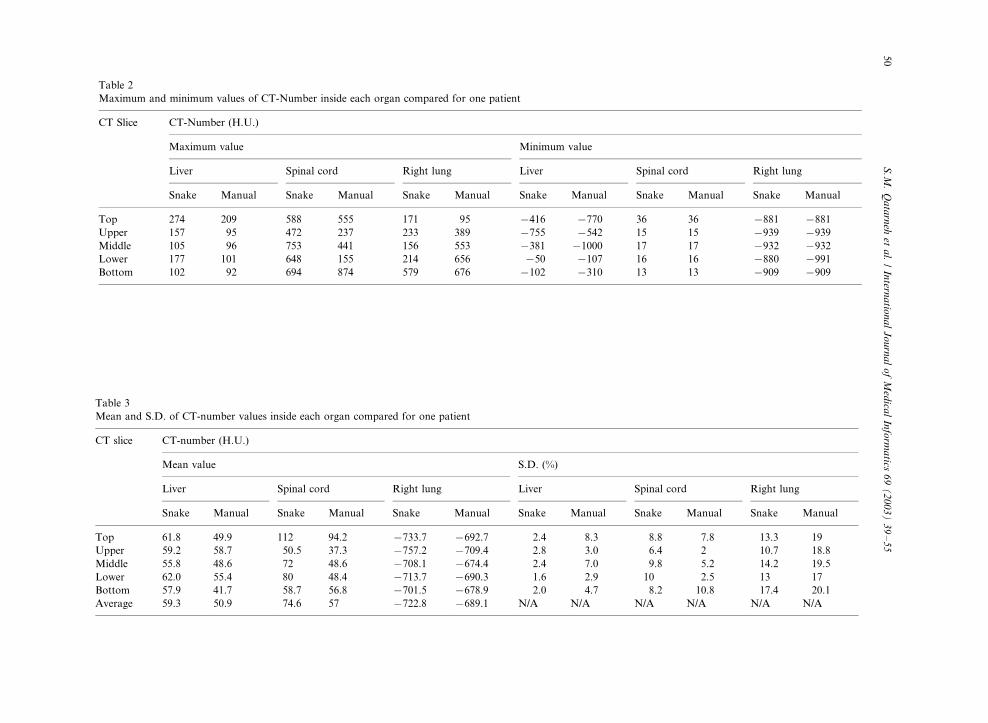
Table 2
Maximum and minimum values of CT-Number inside each organ compared for one patient
CT Slice CT-Number (H.U.)
Maximum value Minimum value
Liver Spinal cord Right lung Liver Spinal cord Right lung
Snake Manual Snake Manual Snake Manual Snake Manual Snake Manual Snake Manual
Top 274 209 588 555 171 95 �/416 �/770 36 36 �/881 �/881
Upper 157 95 472 237 233 389 �/755 �/542 15 15 �/939 �/939
Middle 105 96 753 441 156 553 �/381 �/1000 17 17 �/932 �/932
Lower 177 101 648 155 214 656 �/50 �/107 16 16 �/880 �/991
Bottom 102 92 694 874 579 676 �/102 �/310 13 13 �/909 �/909
Table 3
Mean and S.D. of CT-number values inside each organ compared for one patient
CT slice CT-number (H.U.)
Mean value S.D. (%)
Liver Spinal cord Right lung Liver Spinal cord Right lung
Snake Manual Snake Manual Snake Manual Snake Manual Snake Manual Snake Manual
Top 61.8 49.9 112 94.2 �/733.7 �/692.7 2.4 8.3 8.8 7.8 13.3 19
Upper 59.2 58.7 50.5 37.3 �/757.2 �/709.4 2.8 3.0 6.4 2 10.7 18.8
Middle 55.8 48.6 72 48.6 �/708.1 �/674.4 2.4 7.0 9.8 5.2 14.2 19.5
Lower 62.0 55.4 80 48.4 �/713.7 �/690.3 1.6 2.9 10 2.5 13 17
Bottom 57.9 41.7 58.7 56.8 �/701.5 �/678.9 2.0 4.7 8.2 10.8 17.4 20.1
Average 59.3 50.9 74.6 57 �/722.8 �/689.1 N/A N/A N/A N/A N/A N/A
S.M
.Q
ata
rneh
eta
l./
Intern
atio
na
lJ
ou
rna
lo
fM
edica
lIn
form
atics
69
(2
00
3)
39�
/55
50
values inside lung contours refined by snakewas 4% higher than the one obtained frommanually drawn outlines. Interestingly, formost cases, the S.D. for CT-number valuesinside the manually drawn liver and lungoutlines was found to be higher than theS.D. in the case of active contour segmenta-tion (Table 3). That might be due to thepartial volume effect, which makes it evenmore complicated to manually outline tissuestructures that are close to lung tissue, whileactive contours tend to emphasize the homo-geneity in the segmented region at the cost ofleaving out some organ tissue.
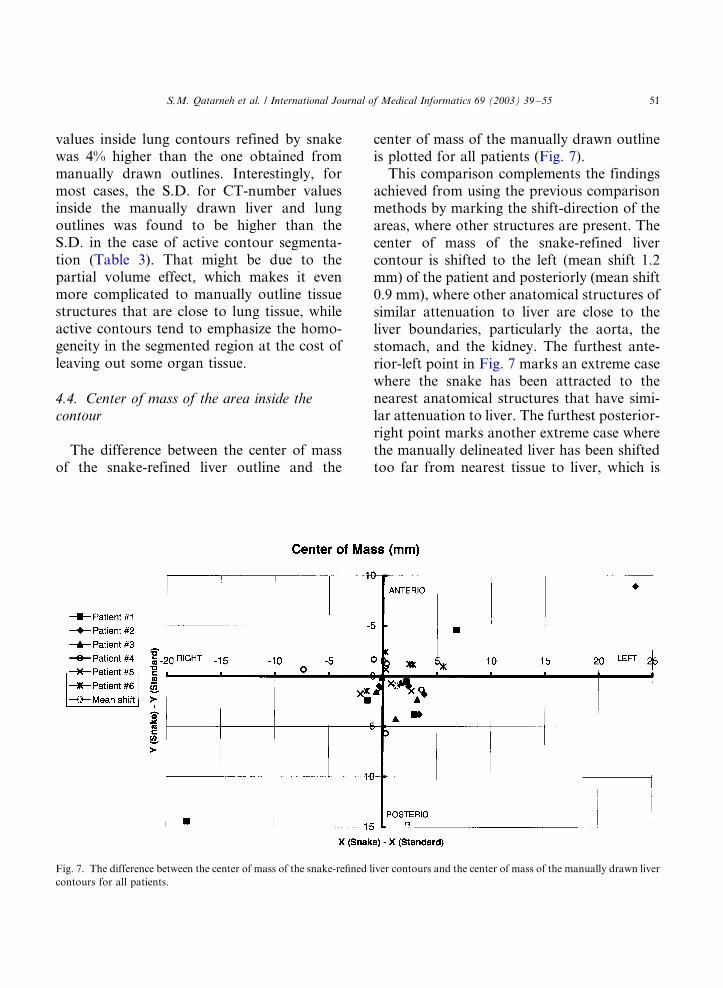
4.4. Center of mass of the area inside thecontour
The difference between the center of massof the snake-refined liver outline and the
center of mass of the manually drawn outlineis plotted for all patients (Fig. 7).
This comparison complements the findingsachieved from using the previous comparisonmethods by marking the shift-direction of theareas, where other structures are present. Thecenter of mass of the snake-refined livercontour is shifted to the left (mean shift 1.2mm) of the patient and posteriorly (mean shift0.9 mm), where other anatomical structures ofsimilar attenuation to liver are close to theliver boundaries, particularly the aorta, thestomach, and the kidney. The furthest ante-rior-left point in Fig. 7 marks an extreme casewhere the snake has been attracted to thenearest anatomical structures that have simi-lar attenuation to liver. The furthest posterior-right point marks another extreme case wherethe manually delineated liver has been shiftedtoo far from nearest tissue to liver, which is
Fig. 7. The difference between the center of mass of the snake-refined liver contours and the center of mass of the manually drawn liver
contours for all patients.
S.M. Qatarneh et al. / International Journal of Medical Informatics 69 (2003) 39�/55 51
present to the left of the patient. The center ofmass of the snake-refined spinal cord contouragreed within 0.3 mm in both directions. Forthe right lung cases, the mean shift of thesnake-refined outline was found to be 0.5 mmto the left of the patient and 3 mm posteriorly.
5. Discussion
5.1. Segmentation technique
The active contour model is a dynamicsystem with a number of parameters, whichmust be tuned to give an appropriate responsefor the application at hand. Hence, the para-meters were tuned specifically for each organ
and used to segment organ slices for differentpatients. The snake was successful in findingthe organ boundary in most cases, but it hasshown limitations, particularly for the liverdelineation study, where other structures ofsimilar attenuation characteristics are close tothe organ boundaries, such as stomach, kid-ney, intestine, pancreas, and the large vessels[11]. Although other segmentation methodshave been proposed, we chose this onebecause of its applicability to all organs andtissues in the body. Moreover, other segmen-tation techniques have suffered ‘segmentationleakage’ due their disability in filling gaps insoft organs’ walls [20].
5.2. Statistical and pixel information analysis
Quantitatively, the two segmentation meth-ods did not significantly differ when the areameasures of the liver and the spinal cord oneach slice were tested (p �/0.05). The pairedStudent’s t-test showed also that there is astatistical difference between the two methodswith regard to lung area measures. Pixelinformation analysis showed that both tech-niques could suffer limitations but the semi-automatic technique proved more efficientsince S.D. of mean CT-Number values werenoticeably less for the liver and the lung. Ahigher S.D. implies that different neighboringtissues, which could be considered as ‘inho-mogeneities’, were delineated together withthe more homogeneous tissue of interest. TheS.D. values together with the area measures,for the lung, showed that the manual methodis further complicated by the partial volumeeffect while the active contour model tends toemphasize the homogeneity in the delineatedlung at the cost of leaving out some lungtissue. The semi-automatic technique is lessinfluenced by the partial volume effect be-cause the snake is attracted to pixels thatmostly contain lung tissue, from which high
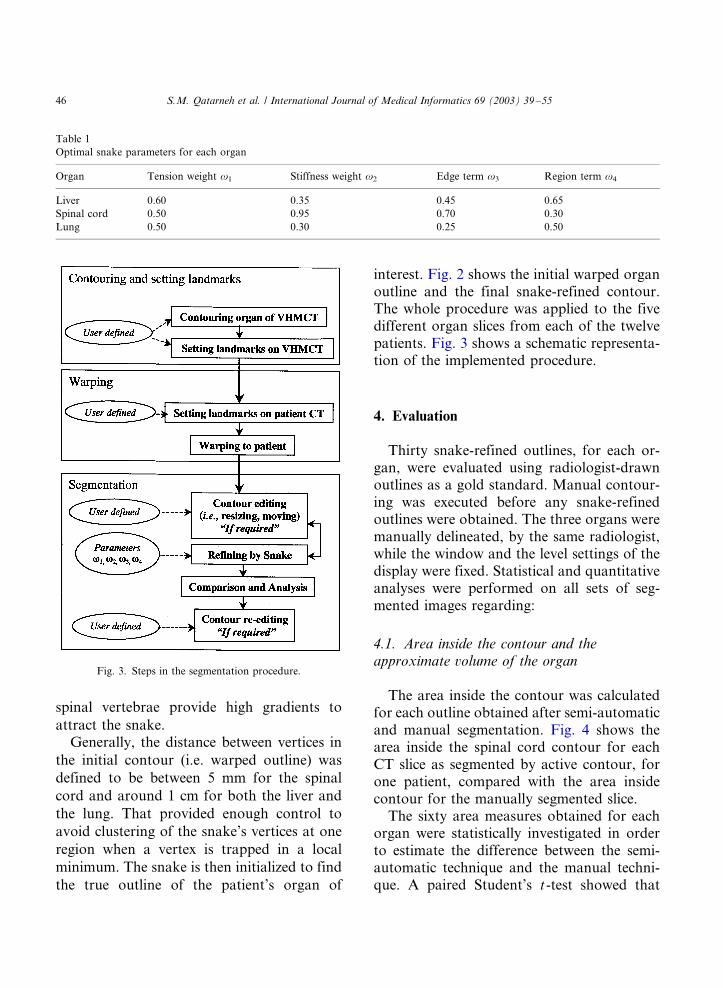
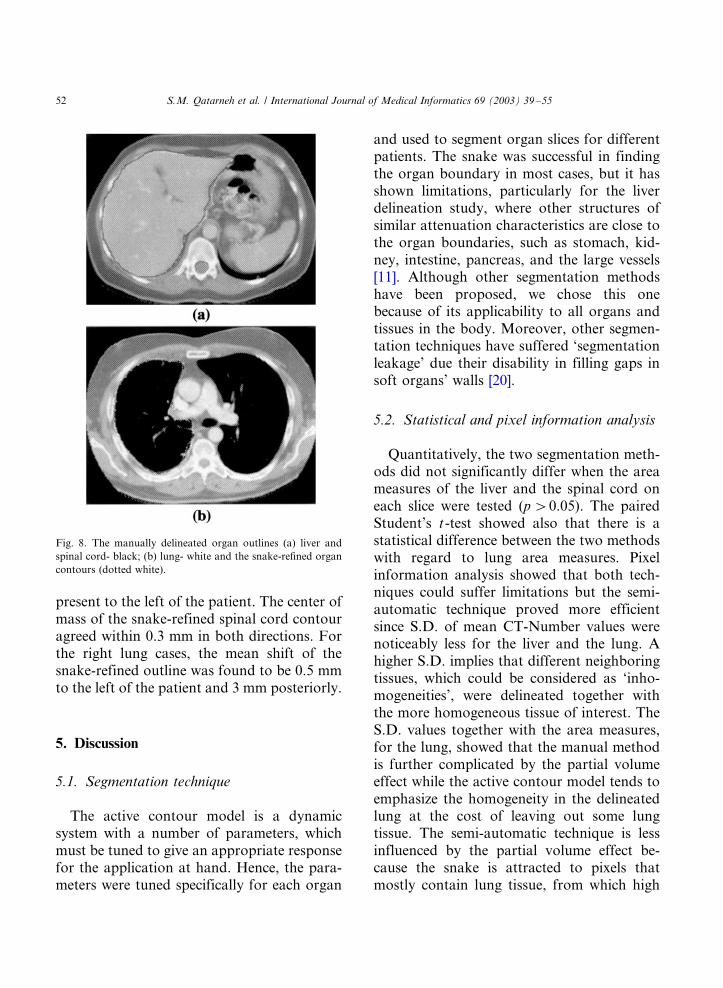
Fig. 8. The manually delineated organ outlines (a) liver and
spinal cord- black; (b) lung- white and the snake-refined organ
contours (dotted white).
S.M. Qatarneh et al. / International Journal of Medical Informatics 69 (2003) 39�/5552
image forces (i.e. edge and region energies) arecreated.
Linear regression analysis showed a strongrelationship and a high degree of correlationbetween the area measures obtained by thesemi-automatic technique and those obtainedby the manual technique regarding the organsof interest (Fig. 5). Qualitatively, the segmen-ted slices were visually inspected and anagreement between the snake-refined contoursand the manually drawn contours was noticed(Fig. 8).
5.3. Segmentation efficiency
The average time required to manuallydelineate the three organs for each patientwas 4.7 min while that time was 3.8 min whenthe organs where delineated by the activecontour and, therefore, achieving time gainby a factor of 1.2. Both times include the timeneeded to edit or re-delineate the outline ifrequired. However, that factor approachesunity, on average, when the time requiredfor setting landmarks on the patient’s CT inthe semi-automatic technique is considered,leaving the possible gain in accuracy as themain goal.
Several matching techniques together withthreshold-based segmentation technique havebeen utilized for automatic atlas-based seg-mentation of bony structures [21]. A fullyautomatic segmentation procedure, however,is difficult to implement on many organs dueto their anatomical variations and their shapecomplexity. In addition, the low attenuationdifference between soft tissues in the bodymakes automatic segmentation a non-trivialtask to implement [22,23]. The small size ofthe spinal cord provides limited control of theactive contour but this is compensated to alarge extent by the high attenuation differencebetween the spinal cord and the bone. Thelarge size of the lung and its high attenuation
difference with surrounding tissue provides anultimate environment of control and freedomfor the snake to find the lung boundaries.Delineation of the liver is more complicatedthan delineation of other organs due to itscomplex shape and its low attenuation differ-ence with surrounding tissue. As a result, useof prior knowledge of the approximate shapeand size of the organ is necessary to getoptimal segmentation results.
This study utilized 2D landmarks, whichwere selected in each 2D plane of the volumeonly, as the segmentation technique was usedon a slice. 3D tools for segmentation, includ-ing 3D snake ‘balloons’, are required if areliable WBA is to be utilized for delineationof organs in radiation therapy planning. Thelandmarks were predefined to spread evenlyover the entire data set in a way that can giveflexibility and freedom to segment any organin the data set. A better registration method,which utilizes absolute and relative 3D land-marks defining recognizable anatomical struc-tures, has been developed [6]. Fixed anatomicreference points which are used as referencefor radiation therapy alignment could beconsidered as landmarks as well. Usually,contrast agent should not be used for radia-tion therapy patients because it changes pixelinformation, which might complicate densitycorrections in dose planning [3].
5.4. Standard man data set
The VHMCT data set was employed as areference to get the initial seed for the snake torefine in order to achieve optimal segmenta-tion. Either the VHMCT or the Visible Hu-man Female CT data set can be used to obtainthe optimal initial seed, as long as the tools forwarping and segmentation provide reasonableresults. The VHMCT organs might not be thebest ‘Standard Organs’ since post mortemchanges caused re-shaping of soft organs,
S.M. Qatarneh et al. / International Journal of Medical Informatics 69 (2003) 39�/55 53
which tend to be more elastic than usual. The
left and the right liver lobes, for example, are
more separate from one another than in an
average person. Also, there are many post
mortem changes such as the existence of more
gas in the intestine than usual. That can be
noticed in Fig. 1a, where small gas bubbles in
the liver, probably in the portal system, and
large void cavities are present in some of the
slices. Noisy artifacts can also be noticed in
most slices because the arms were positioned
inside the scanned field (i.e. arms positioned
next to the body and the hands on the
abdomen), whereas the arms of radiation
therapy patients are positioned outside the
examined field. Finally, the VHMCT data set
was not acquired with a single field of view
and it contains some corrupted or missing
slices [5].Hence for the organs which are to be
entered into the WBA, we will segment
healthy organs from typical radiation therapy
patients. The same organ from several pa-
tients will thus be averaged so that we produce
a 3D representation of that organ which will
then be entered into the database. For organs
which can change radically in size from
patient to patient, variations such as ‘below
average’, ‘average’, and ‘above average’ organ
will be used. Once the set of representative
organs have been accumulated in the WBA,
they will be transformed from the atlas to a
current patient. Once the transformation is
judged to be a satisfactory match [6], this
same transformation can then be applied to a
standardized treatment plan, which has also
been stored in the WBA. This transformed
treatment plan will serve as a starting point
for the treatment plan to be developed for the
current patient. The idea is that in instances
where the plan can be complicated (biologi-
cally and physically optimized treatment plan-
ning, inverse planning, IMRT) [1], the initial
starting plan will reduce the time for theplanning cycle.
6. Conclusion
This work highlights the potential forapplying semi-automatic segmentation techni-ques to multiple organs at the same time forthe purpose of radiation therapy. Activecontour models can segment many organs,irrespective of the attenuation difference whencompared with surrounding organs and theorgan shape complexity. Satisfactory segmen-tation results were obtained by the semi-automatic technique having an overall suffi-cient agreement with the manual technique.The study addressed using 2D contours only,but 3D tools for whole body segmentation areneeded, however, if a reliable radiation ther-apy planning atlas is to be beneficial to actualpatients.
Acknowledgements
This work was supported by a grant fromK.K. Stiftelse. The authors acknowledge thework done by Sharok Kimiaei and JonasPetterson in developing the active contourmodel software and Candice L. Aitken fordoing the original patient liver outlines used inthis work.
References
[1] A. Brahme, J. Chavaudra, T. Landberg, E.C. McCullough,
F. Nulssin, A. Rawlinson, G. Svensson, H. Svensson,
Accuracy requirements and quality assurance of external
beam therapy with photons and electrons, Acta Oncol.,
Suppl. 1 (1988).
[2] M. Goitein, M. Abrams, D. Rowell, H. Pollari, J. Wiles,
Multi-dimensional treatment planning: II. Beam’s eye
view, back projection, and projection through CT sections,
Int. J. Radiat. Oncol. Biol. Phys. 9 (1983) 189�/197.
S.M. Qatarneh et al. / International Journal of Medical Informatics 69 (2003) 39�/5554
[3] P. Aaltonen, A. Brahme, I. Lax, S. Levernes, I. Naslund,
J.B. Reitan, I. Turesson, Specification of dose delivery in
radiation therapy: Recommendations by the Nordic Asso-
ciation of Clinical Physics (NACP), Acta Oncol. 36 (Suppl.
10) (1997) 10.
[4] G.Q. Maguire, Jr, M.E. Noz, H. Rusinek, J. Jaeger, E.L.
Kramer, J.J. Sanger, G. Smith, Graphics applied to
medical image registration, IEEE Trans. Comput. Graph.
Appl. 11 (1991) 70�/79.
[5] V. Spitzer, M.J. Ackerman, A.L. Scherzinger, D. Whit-
lock, The visible human male: a technical report, J. Am.
Med. Inf. Assoc. 3 (1996) 118�/130.
[6] M.E. Noz, G.Q. Maguire, Jr, M.P. Zeleznik, E.L. Kramer,
F. Mahmoud, J. Crafoord, A versatile functional-ana-
tomic image fusion method for volume data sets, J. Med.
Syst. 25 (2001) 297�/307.
[7] L. Thurfjell, P. Ranefall, E. Bengtsson, A deformable atlas
of the chest based on the visible man, Machine Graph Vis.
7 (1998) 179�/186.
[8] M. Kass, A. Witkin, D. Terzopoulos, Snakes: active
contour models, Int. J. Comput. Vis. 1 (1988) 321�/331.
[9] T. McInerney, D. Terzopoulos, Deformable models in
medical image analysis, Med. Image Anal. 1 (1996) 91�/
108.
[10] T. Schiemann, J. Nuthmann, U. Tiede, K.H. Hohne,
Generation of 3D anatomical atlases using the visible
human, R.L. Arenson, R.M. Friedenberg (Eds.), Compu-
ter Applications to Assist Radiology-Symposium Founda-
tion-SCAR 96, 1996, pp. 62�/67.
[11] S.M. Qatarneh, J. Crafoord, E.L. Kramer, G.Q. Maguire,
Jr, A. Brahme, M.E. Noz, S. Hyodynmaa, A whole body
atlas for segmentation and delineation of organs for
radiation therapy planning, Nucl. Instrum. Methods A
471 (2001) 160�/164.
[12] C.S. Poon, M. Braun, Image segmentation by a deform-
able contour model incorporating region analysis, Phys.
Med. Biol. 42 (1997) 1833�/1841.
[13] D.J. Williams, M. Shah, A fast algorithm for active
contours and curvature estimation, CVGIP: Image Under-
standing 55 (1992) 14�/26.
[14] C.R. Meyer, G.S. Leichtman, J.A. Burnberg, R.L. Wahl,
R.L. Quint, Simultaneous usage of homologous points,
lines and planes for optimal, 3D, linear registration of
multimodality imaging data, IEEE Trans. Med. Imag. 14
(1995) 1�/11.
[15] C.R. Meyer, J.L. Boes, B. Kim, P. Bland, K.R. Zasadny,
P.V. Kison, K. Koral, K.A. Frey, R.L. Wahl, Demonstra-
tion of accuracy and clinical versatility of mutual informa-
tion for automatic multimodality image fusion using affine
and thin plate spline warped geometric deformations, Med.
Image Anal. 3 (1997) 195�/206.
[16] F. Maes, A. Collignon, D. Vandermeulen, G. Marchal, P.
Suetens, Multimodality image registration by maximiza-
tion of mutual information, IEEE Trans. Med. Imag. 16
(1997) 187�/198.
[17] T. Pfluger, C. Vollmar, A. Wismuller, S. Dresel, P. Berger,
P. Suntheim, G. Leinsinger, K. Hahn, Quantitative
comparison of automatic and interactive methods for
MRI-SPECT image registration of the brain based on 3-
dimensional calculation of error, J. Nucl. Med. 41 (2000)
1823�/1829.
[18] J. West, J.M. Fitzpatrick, M.Y. Wang, B.M. Dawant, C.R.
Maurer, Jr, R.M. Kessler, R.J. Maciunas, C. Barillot, D.
Lemoine, A. Collignon, F. Maes, P. Suetens, D. Vander-
meulen, P.A. van den Elsen, S. Napel, T.S. Sumanaweera,
B. Harkness, P.F. Hemler, D.L.G. Hill, D.J. Hawkes, C.
Studholme, J.B.A. Maintz, M.A. Viergever, G. Malan-
dain, X. Pennac, M.E. Noz, G.Q. Maguire, Jr, M. Pollack,
C.A. Pelizzari, R.A. Robb, D. Hanson, R.P. Woods,
Comparison and evaluation of retrospective intermodality
brain image registration techniques, J. Comput. Assisted
Tomogr. 21 (1997) 554�/566.
[19] S. Katyal, E.L. Kramer, M.E. Noz, D. McCauley, A.
Chachoua, A. Steinfeld, Fusion of immunoscintigraphy
single photon emission computed tomography (SPECT)
with CT of the chest in patients with non-small cell lung
cancer, Cancer Res. 55 (Suppl.) (1995) 5759s�/5763s.
[20] M. Mazonakis, J. Damilakis, H. Varveris, P. Prassopou-
los, N. Gourtsoyiannis, Image segmentation in treatment
planning for prostate cancer using region growing techni-
que, Br. J. Radiol. 74 (2001) 243�/248.
[21] J. Ehrhardt, H. Handels, T. Malina, B. Strathmann, W.
Plotz, S.J. Poppl, Atlas-based segmentation of bone
structures to support the virtual planning of hip opera-
tions, Int. J. Med. Inform. 64 (2001) 439�/447.
[22] J.L. Boes, T.E. Weymouth, C.R. Meyer, Multiple organ
definition in CT using a Bayesian approach for 3D model
fitting, Proc. SPIE 2573, Vis. Geometry IV (1995) 244�/
251.
[23] Y. Boykov, V.S. Lee, H. Rusinek, R. Bansal, Segmenta-
tion of dynamic N-D data sets via graph cuts using
Markov models, in: W. Niessen, M. Viergever (Eds.),
Medical Image Computing and Computer-Assisted Inter-
vention-MICCAI, Springer, Berlin, 2001, pp. 1058�/1066.
S.M. Qatarneh et al. / International Journal of Medical Informatics 69 (2003) 39�/55 55


