Embed Size (px)
Citation preview

Seediscussions,stats,andauthorprofilesforthispublicationat:https://www.researchgate.net/publication/259128979
EvaluationofclimateadaptationoptionsforSudano-Saheliancroppingsystems
ARTICLEinFIELDCROPSRESEARCH·FEBRUARY2014
ImpactFactor:2.98·DOI:10.1016/j.fcr.2013.10.014
CITATIONS
11
READS
105
6AUTHORS,INCLUDING:
MarkVanWijk
ConsultativeGrouponInternationalAgricu…
135PUBLICATIONS2,715CITATIONS
SEEPROFILE
MarcCorbeels
Cirad-Larechercheagronomiquepourled…
120PUBLICATIONS2,234CITATIONS
SEEPROFILE
MarianaCRufino
ConsultativeGrouponInternationalAgricu…
75PUBLICATIONS1,158CITATIONS
SEEPROFILE
KenGiller
WageningenUniversity
491PUBLICATIONS14,394CITATIONS
SEEPROFILE
Allin-textreferencesunderlinedinbluearelinkedtopublicationsonResearchGate,
lettingyouaccessandreadthemimmediately.
Availablefrom:BoubaTraore
Retrievedon:04February2016

Es
Ba
b
1c
d
ARRA
KCTRCW
1
CigbtgfNtrt
P+
(
1h
Europ. J. Agronomy 49 (2013) 115– 125
Contents lists available at SciVerse ScienceDirect
European Journal of Agronomy
jo ur nal homepage: www.elsev ier .com/ locate /e ja
ffects of climate variability and climate change on crop production inouthern Mali
ouba Traorea,c,∗, Marc Corbeelsb, Mark T. van Wijkc,d, Mariana C. Rufinod, Ken E. Gillerc
Institut D’Economie Rurale (IER), Programme Coton, Station de Recherche Agronomique de N’Tarla Bp: 28, Koutiala, MaliCentre de Coopération Internationale en Recherche Agronomique pour le Développement (CIRAD)-Annual Cropping Systems C/O Embrapa Cerrados Km8, BR 020-Ridovia Brasilia/Fortaleza CP 08223, CEP 73310-970, Planaltina, DF, BrazilPlant Production Systems, Wageningen University, P.O. Box 430, 6700 AK Wageningen, The NetherlandsSustainable Livestock Futures, International Livestock Research Institute (ILRI), P.O. Box 30709, 00100 Nairobi, Kenya
a r t i c l e i n f o
rticle history:eceived 15 October 2012eceived in revised form 3 April 2013ccepted 4 April 2013
eywords:limate changeemperature increaseainfall variabilityottonest Africa
a b s t r a c t
In West Africa predictions of future changes in climate and especially rainfall are highly uncertain, and upto now no long-term analyses are available of the effects of climate on crop production. This study analyseslong-term trends in climate variability at N’Tarla and Sikasso in southern Mali using a weather datasetfrom 1965 to 2005. Climatic variables and crop productivity were analysed using data from an experimentconducted from 1965 to 1993 at N’Tarla and from a crop yield database from ten cotton growing districtsof southern Mali. Minimum daily air temperature increased on average by 0.05 ◦C per year during theperiod from 1965 to 2005 while maximum daily air temperature remained constant. Seasonal rainfallshowed large inter-annual variability with no significant change over the 1965–2005 period. However,the total number of dry days within the growing season increased significantly at N’Tarla, indicating achange in rainfall distribution. Yields of cotton, sorghum and groundnut at the N’Tarla experiment varied
(30%) without any clear trend over the years. There was a negative effect of maximum temperature,number of dry days and total seasonal rainfall on cotton yield. The variation in cotton yields was relatedto the rainfall distribution within the rainfall season, with dry spells and seasonal dry days being keydeterminants of crop yield. In the driest districts, maize yields were positively correlated with rainfall.Our study shows that cotton production in southern Mali is affected by climate change, in particularinfal
through changes in the ra. Introduction
Since the early 1990s the Intergovernmental Panel for Climatehange (IPCC) has provided evidence of accelerated global warm-
ng and climate change. The last IPCC report concludes that thelobal average temperature in the last 100–150 years has increasedy 0.76 ◦C (0.57–0.95 ◦C) (IPCC, 2007). Finding evidence of globalrends in rainfall is complex because of large regional differences,aps in spatial coverage and temporal shortfalls in the data. Rain-all generally increased over the 20th century in eastern parts oforth and South America, northern Europe and northern and cen-
ral Asia. Drying has been observed in the Sahel, the Mediterraneanegion, southern Africa and parts of southern Asia (IPCC, 2007). Fur-hermore, there is evidence for increases in the frequency of both
∗ Corresponding author at: Plant Production Systems, Wageningen University,.O. Box 430, 6700 AK Wageningen, The Netherlands. Tel.: +223 79 41 47 57/31 645473259.
E-mail addresses: [email protected], [email protected]. Traore).
161-0301/$ – see front matter © 2013 Elsevier B.V. All rights reserved.ttp://dx.doi.org/10.1016/j.eja.2013.04.004
l distribution.© 2013 Elsevier B.V. All rights reserved.
severe droughts and heavy rains in many regions of the world. Cli-mate change due to greenhouse gas emissions is expected to furtherincrease temperature and alter precipitation patterns. All 21 Gen-eral Circulation Models (GCMs) used by IPCC predict a temperatureincrease in sub-Saharan Africa in the order of 3.3 ◦C by the end of the21st century. With regard to predicted changes in rainfall amountsin sub-Saharan Africa, the uncertainty is considerably greater and inmany instances models do not agree on whether changes in rainfallwill be positive or negative (Cooper et al., 2008).
Rainfed agriculture produces nearly 90% of sub-Saharan Africa’sfood and feed (Rosegrant et al., 2002), and is major livelihood activ-ity for 70% of the population (FAO, 2003). This agricultural sector isnegatively affected by climate variability, particularly through heatwaves, droughts, floods, and other extreme weather events. Overall,the success or failure of crop production under rainfed conditions inSudano-Sahelian West Africa is strongly linked to rainfall patterns(Graef and Haigis, 2001).
In West Africa, a combination of external and internal forcesmakes the climate of the region one of the most erratic in the world(Zeng, 2003). Annual cycles of rainfall are strongly determined bythe position of the inter-tropical convergence zone (WCRP, 1999).

1 Agron
Mmf1sSpoTmtbmuf1twme
tcat2mtos(2A
eSftmtc
2
2
z((ttvi
misg(Cfcs(
16 B. Traore et al. / Europ. J.
any studies have characterized the rainy season in West Africa;ost of them were based on decadal, monthly or total annual rain-
all analysis (Ati et al., 2002; Nicholson, 1980; Sivakumar et al.,984), while others studies described the start and end of rainyeason (Diop, 1996; Dodd and Jolliffe, 2001; Omotosho et al., 2000;tern and Coe, 1982). A good understanding of seasonal variabilityatterns is of critical importance because of the highly unstablenset of the rainy season and the high frequency of dry spells.he last century’s climate in Sudano-Sahelian West Africa wasarked by high spatial and temporal variability and by alterna-
ions between dry and wet seasons (Servat et al., 1998). A reviewy Traoré et al. (2007) of current knowledge on the regional cli-ate in Sudano-Sahelian West Africa revealed that rainfall remains
npredictable. This rainfall unpredictability is a major constraintor farmers who have to plan the start of the cropping season (Piéri,989). The first rains are not always followed by the full start ofhe monsoon (Sultan and Janicot, 2003), dry spells can occur after-ards, i.e. during the early stages of the crop growth so that seedsay not germinate properly or germinated plants may die off. How-
ver, if sowing is delayed, the land may be too wet to till.Southern Mali occupies 13.5% (approximately 160.825 km2) of
he Malian territory. It represents 50% of the cultivable lands of theountry and holds 40% of the Malian population. In southern Maligricultural activities play an essential role in supplying food tohe country; they represent 45% of the country’s income (Deveze,006). Most people in the region are likely to be vulnerable to cli-ate variability (Sivakumar et al., 2005). Hence, it is imperative
o better quantify climate variability and change and their effectsn crop production. Several studies analysing long-term relation-hips between climate and crop yields have been published recentlyKucharik and Serbin, 2008; Lobell and Burke, 2008; Lobell et al.,008; Lobell and Field, 2007), but none of these focused on Westfrica.
We analysed long-time series of weather data recorded in south-rn Mali, and crop yield data from an experiment at the Researchtation of the Institut de l’Economie Rurale at N’Tarla and fromarmers’ fields in ten districts in southern Mali. The objectives ofhis study are therefore: (i) to quantify possible changes in cli-
ate and crop production over 30 years in southern Mali and (ii)o quantify the effect of annual climate variability and change onrop production.
. Methods
.1. Study area and source of data
The climate in southern Mali is typical of the Sudano-Sahelianone. Average long-term annual rainfall is 846 ± 163 mm at N’Tarla12◦35′N, 5◦42′W 302 m.a.s.l.) and 1073 ± 187 mm at Sikasso11◦35′N, 5◦68′W 374 m.a.s.l.). The rainy season extends from Mayo October and the seasonal average temperature is 29 ◦C. Duringhe dry season (November–April) the temperature and saturationapour deficit increase and crop production is impossible withoutrrigation (Sivakumar, 1988).
The most common farming systems in the region are extensiveixed agrosylvo-pastoral systems, focused around cotton (Gossyp-
um hirsutum L.) – the main cash crop – in rotation with cereals –orghum (Sorghum bicolor (L.) Moench), pearl millet (Pennisetumlaucum (L.) R.Br.), maize (Zea mays L.) – and legumes – groundnutArachis hypogaea L.) and cowpea (Vigna unguiculata (L.) Walp.).otton and to a lesser extent maize, receive nutrient inputs in the
orm of organic manure and/or chemical fertilizer, as well as pesti-ides. Other cereal crops seldom receive any fertilizer. As a result,oils are often mined and soil organic matter contents are decliningPiéri, 1989). Cattle, goats and sheep are the main livestock species.
omy 49 (2013) 115– 125
Agro-pastoralists generally practice sedentary farming, althoughdue to large herd sizes and the lack of feed resources, transhumanceis practiced in the dry season.
2.2. Climate data
The meteorological data used for the climate analysis in thisstudy were recorded at the meteorological stations of N’Tarla(12◦35′N, 5◦42′W 302 m.a.s.l.) and Sikasso (11◦35′N, 5◦68′W374 m.a.s.l). The database contained long-term (from 1965 to 2005)records of daily rainfall and minimum and maximum temperatures.Daily minimum and maximum temperature were averaged overthe rainy season to represent the seasonal temperatures. For thedistricts, we used the annual rainfall data as they were recorded atthe different districts with rain gauges.
2.3. Long-term crop experiment
An experiment was conducted from 1965 to 1993 at theN’Tarla agricultural research station (12◦35′N, 5◦42′W 302 m.a.s.l.)to determine the long-term impact of cotton-based croppingsystems on soil fertility (IRCT, 1969). The trial was set upaccording to a Fisher block design with three crops (cotton,sorghum, groundnut) as part of a rotation, four fertilization treat-ments and four replications. Initially, a 3-year crop rotationcotton–sorghum–groundnut was used, from 1968 the crop rotationwas cotton–sorghum–groundnut–sorghum and in 1976 returnedto the 3-year rotation cotton–sorghum–groundnut. At the start ofthe experiment, the four fertilization treatments were: an unfertili-zed control, application of manure, application of mineral fertilizerand the combined application of manure and mineral fertilizer. Thefertilizer treatments were modified over time, with the aim to limitsoil fertility decline. In the first phase (1965–1979) of the exper-iment, mineral fertilizer and manure (9 t DM ha−1) were appliedonly to cotton. From 1980 onwards, mineral fertilizer was allo-cated to the three crops and manure to cotton (6 t DM ha−1) andsorghum (3 t DM ha−1). Mineral fertiliser was then also applied inthe control treatment. Weed and pest control were carried out on alltreatments according to the standards recommended by the localagricultural research institute (IER/CMDT/OHVN, 1998).
The soils of the experimental site are highly weathered and clas-sified as Lixisols (FAO, 2006). They have a sandy-loam texture (<10%clay) at the surface, but are richer in clay with depth (30% at 60 cmdepth). Soil organic carbon content is low (0.3%), pH is around 6and CEC is less than 3 cmol (+) kg−1. They are typical soils for theregion.
For the analysis of impacts of climate variability and change oncrop production, we used only the crop yields of the treatment withthe combined application of manure and mineral fertilizer. Sincein this treatment there was no significant trend in soil carbon overtime, we did not expect soil carbon or soil fertility in general, to havea strong influence on trends in crop yields. We, therefore, assumedthat water was the main limiting factor. On the other hand, to eval-uate the long-term effects of soil fertility on crop production, thecrop yields in the control treatment were used.
2.4. Crop yields from farmers’ fields
Crop yield data from ten cotton growing districts of southernMali (Fig. 1) were obtained from the Malian cotton company (Com-pagnie Malienne pour le Développement des Textiles). From the
available data, a database was developped with average yieldsat district level for cotton (1974–2005) and maize (1994–2005)together with the corresponding annual rainfall in the districtsto evaluate yield-rainfall relationships. Yields from the database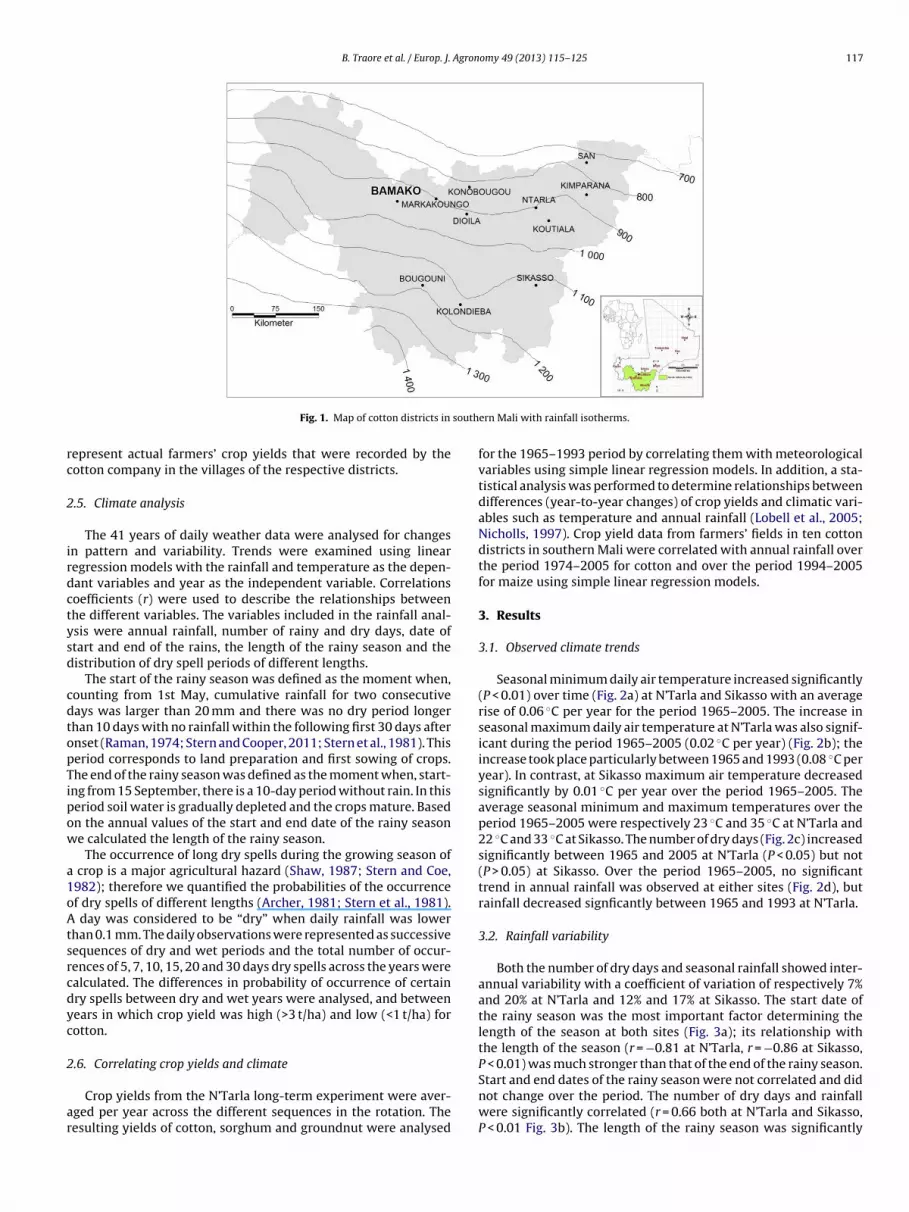
B. Traore et al. / Europ. J. Agronomy 49 (2013) 115– 125 117
south
rc
2
irdctysd
cdtopTipow
a1oAtsrcdyc
2
ar
Fig. 1. Map of cotton districts in
epresent actual farmers’ crop yields that were recorded by theotton company in the villages of the respective districts.
.5. Climate analysis
The 41 years of daily weather data were analysed for changesn pattern and variability. Trends were examined using linearegression models with the rainfall and temperature as the depen-ant variables and year as the independent variable. Correlationsoefficients (r) were used to describe the relationships betweenhe different variables. The variables included in the rainfall anal-sis were annual rainfall, number of rainy and dry days, date oftart and end of the rains, the length of the rainy season and theistribution of dry spell periods of different lengths.
The start of the rainy season was defined as the moment when,ounting from 1st May, cumulative rainfall for two consecutiveays was larger than 20 mm and there was no dry period longerhan 10 days with no rainfall within the following first 30 days afternset (Raman, 1974; Stern and Cooper, 2011; Stern et al., 1981). Thiseriod corresponds to land preparation and first sowing of crops.he end of the rainy season was defined as the moment when, start-ng from 15 September, there is a 10-day period without rain. In thiseriod soil water is gradually depleted and the crops mature. Basedn the annual values of the start and end date of the rainy seasone calculated the length of the rainy season.
The occurrence of long dry spells during the growing season of crop is a major agricultural hazard (Shaw, 1987; Stern and Coe,982); therefore we quantified the probabilities of the occurrencef dry spells of different lengths (Archer, 1981; Stern et al., 1981).
day was considered to be “dry” when daily rainfall was lowerhan 0.1 mm. The daily observations were represented as successiveequences of dry and wet periods and the total number of occur-ences of 5, 7, 10, 15, 20 and 30 days dry spells across the years werealculated. The differences in probability of occurrence of certainry spells between dry and wet years were analysed, and betweenears in which crop yield was high (>3 t/ha) and low (<1 t/ha) forotton.
.6. Correlating crop yields and climate
Crop yields from the N’Tarla long-term experiment were aver-ged per year across the different sequences in the rotation. Theesulting yields of cotton, sorghum and groundnut were analysed
ern Mali with rainfall isotherms.
for the 1965–1993 period by correlating them with meteorologicalvariables using simple linear regression models. In addition, a sta-tistical analysis was performed to determine relationships betweendifferences (year-to-year changes) of crop yields and climatic vari-ables such as temperature and annual rainfall (Lobell et al., 2005;Nicholls, 1997). Crop yield data from farmers’ fields in ten cottondistricts in southern Mali were correlated with annual rainfall overthe period 1974–2005 for cotton and over the period 1994–2005for maize using simple linear regression models.
3. Results
3.1. Observed climate trends
Seasonal minimum daily air temperature increased significantly(P < 0.01) over time (Fig. 2a) at N’Tarla and Sikasso with an averagerise of 0.06 ◦C per year for the period 1965–2005. The increase inseasonal maximum daily air temperature at N’Tarla was also signif-icant during the period 1965–2005 (0.02 ◦C per year) (Fig. 2b); theincrease took place particularly between 1965 and 1993 (0.08 ◦C peryear). In contrast, at Sikasso maximum air temperature decreasedsignificantly by 0.01 ◦C per year over the period 1965–2005. Theaverage seasonal minimum and maximum temperatures over theperiod 1965–2005 were respectively 23 ◦C and 35 ◦C at N’Tarla and22 ◦C and 33 ◦C at Sikasso. The number of dry days (Fig. 2c) increasedsignificantly between 1965 and 2005 at N’Tarla (P < 0.05) but not(P > 0.05) at Sikasso. Over the period 1965–2005, no significanttrend in annual rainfall was observed at either sites (Fig. 2d), butrainfall decreased signficantly between 1965 and 1993 at N’Tarla.
3.2. Rainfall variability
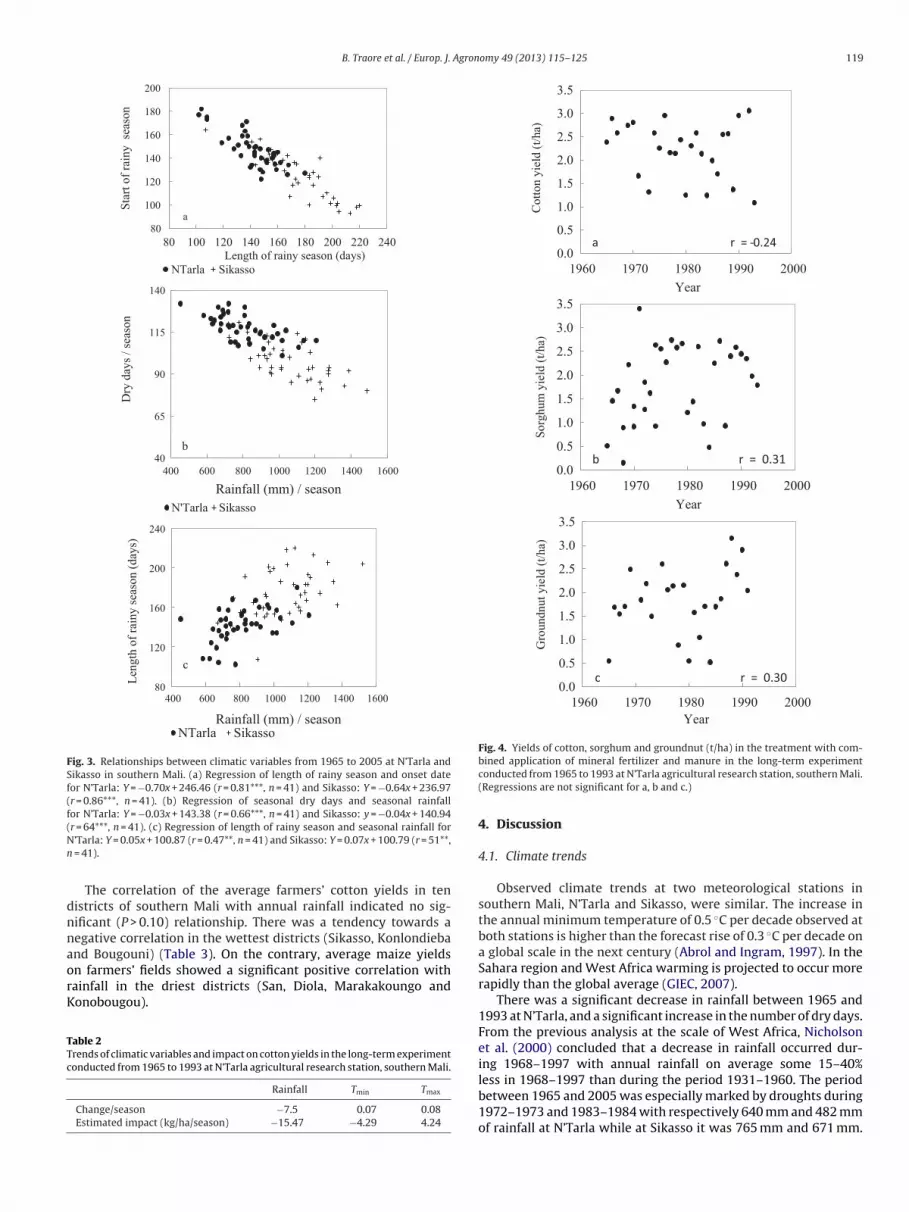
Both the number of dry days and seasonal rainfall showed inter-annual variability with a coefficient of variation of respectively 7%and 20% at N’Tarla and 12% and 17% at Sikasso. The start date ofthe rainy season was the most important factor determining thelength of the season at both sites (Fig. 3a); its relationship withthe length of the season (r = −0.81 at N’Tarla, r = −0.86 at Sikasso,P < 0.01) was much stronger than that of the end of the rainy season.
Start and end dates of the rainy season were not correlated and didnot change over the period. The number of dry days and rainfallwere significantly correlated (r = 0.66 both at N’Tarla and Sikasso,P < 0.01 Fig. 3b). The length of the rainy season was significantly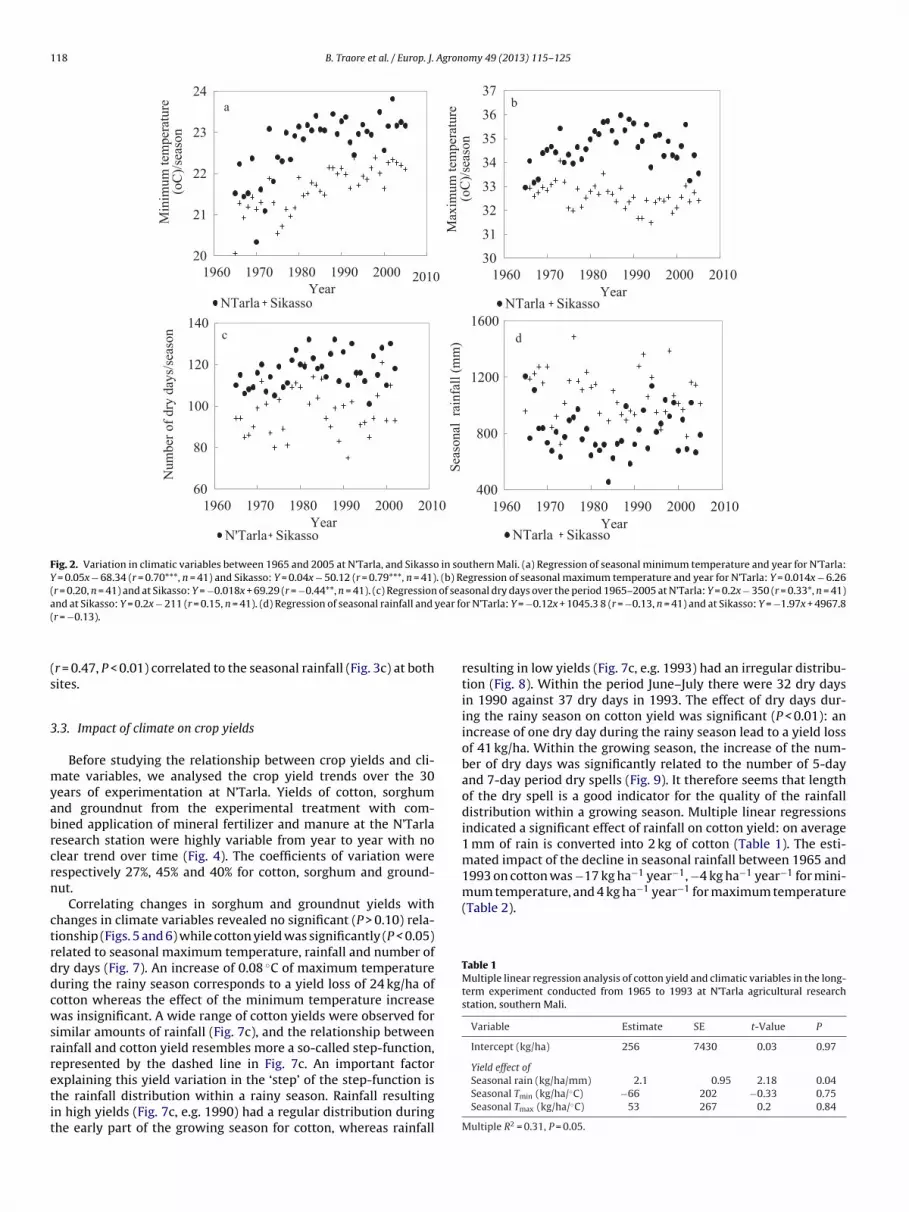
118 B. Traore et al. / Europ. J. Agronomy 49 (2013) 115– 125
20
21
22
23
24
1960 1970 1980 1990 2000 2010
Min
imum
tem
per
ature
(o
C)/
seas
on
YearNTarla Sikasso
a
30
31
32
33
34
35
36
37
1960 1970 1980 1990 2000 2010
Max
imum
tem
per
ature
(o
C)/
seas
on
YearNTarla Sikasso
b
60
80
100
120
140
1960 1970 1980 1990 2000 2010
Num
ber
of
dry
day
s/se
ason
YearN'Tarla Sikasso
c
400
800
1200
1600
1960 1970 1980 1990 2000 2010
Sea
sonal
ra
infa
ll (
mm
)
YearNTarla Sikasso
d
Fig. 2. Variation in climatic variables between 1965 and 2005 at N’Tarla, and Sikasso in southern Mali. (a) Regression of seasonal minimum temperature and year for N’Tarla:Y = 0.05x − 68.34 (r = 0.70***, n = 41) and Sikasso: Y = 0.04x − 50.12 (r = 0.79***, n = 41). (b) Regression of seasonal maximum temperature and year for N’Tarla: Y = 0.014x − 6.26(r = 0.20, n = 41) and at Sikasso: Y = −0.018x + 69.29 (r = −0.44**, n = 41). (c) Regression of seasonal dry days over the period 1965–2005 at N’Tarla: Y = 0.2x − 350 (r = 0.33*, n = 41)a year fo(
(s
3
myabrcrn
ctrddcwsrretit
1993 on cotton was −17 kg ha year , −4 kg ha year for mini-mum temperature, and 4 kg ha−1 year−1 for maximum temperature(Table 2).
Table 1Multiple linear regression analysis of cotton yield and climatic variables in the long-term experiment conducted from 1965 to 1993 at N’Tarla agricultural researchstation, southern Mali.
Variable Estimate SE t-Value P
Intercept (kg/ha) 256 7430 0.03 0.97
Yield effect of
nd at Sikasso: Y = 0.2x − 211 (r = 0.15, n = 41). (d) Regression of seasonal rainfall and
r = −0.13).
r = 0.47, P < 0.01) correlated to the seasonal rainfall (Fig. 3c) at bothites.
.3. Impact of climate on crop yields
Before studying the relationship between crop yields and cli-ate variables, we analysed the crop yield trends over the 30
ears of experimentation at N’Tarla. Yields of cotton, sorghumnd groundnut from the experimental treatment with com-ined application of mineral fertilizer and manure at the N’Tarlaesearch station were highly variable from year to year with nolear trend over time (Fig. 4). The coefficients of variation wereespectively 27%, 45% and 40% for cotton, sorghum and ground-ut.
Correlating changes in sorghum and groundnut yields withhanges in climate variables revealed no significant (P > 0.10) rela-ionship (Figs. 5 and 6) while cotton yield was significantly (P < 0.05)elated to seasonal maximum temperature, rainfall and number ofry days (Fig. 7). An increase of 0.08 ◦C of maximum temperatureuring the rainy season corresponds to a yield loss of 24 kg/ha ofotton whereas the effect of the minimum temperature increaseas insignificant. A wide range of cotton yields were observed for
imilar amounts of rainfall (Fig. 7c), and the relationship betweenainfall and cotton yield resembles more a so-called step-function,epresented by the dashed line in Fig. 7c. An important factor
xplaining this yield variation in the ‘step’ of the step-function ishe rainfall distribution within a rainy season. Rainfall resultingn high yields (Fig. 7c, e.g. 1990) had a regular distribution duringhe early part of the growing season for cotton, whereas rainfallr N’Tarla: Y = −0.12x + 1045.3 8 (r = −0.13, n = 41) and at Sikasso: Y = −1.97x + 4967.8
resulting in low yields (Fig. 7c, e.g. 1993) had an irregular distribu-tion (Fig. 8). Within the period June–July there were 32 dry daysin 1990 against 37 dry days in 1993. The effect of dry days dur-ing the rainy season on cotton yield was significant (P < 0.01): anincrease of one dry day during the rainy season lead to a yield lossof 41 kg/ha. Within the growing season, the increase of the num-ber of dry days was significantly related to the number of 5-dayand 7-day period dry spells (Fig. 9). It therefore seems that lengthof the dry spell is a good indicator for the quality of the rainfalldistribution within a growing season. Multiple linear regressionsindicated a significant effect of rainfall on cotton yield: on average1 mm of rain is converted into 2 kg of cotton (Table 1). The esti-mated impact of the decline in seasonal rainfall between 1965 and
−1 −1 −1 −1
Seasonal rain (kg/ha/mm) 2.1 0.95 2.18 0.04Seasonal Tmin (kg/ha/◦C) −66 202 −0.33 0.75Seasonal Tmax (kg/ha/◦C) 53 267 0.2 0.84
Multiple R2 = 0.31, P = 0.05.
B. Traore et al. / Europ. J. Agronomy 49 (2013) 115– 125 119
80
100
120
140
160
180
200
80 100 120 140 160 180 200 220 240
Sta
rt o
f ra
iny se
ason
Length of rainy season (days)
NTarla Sikasso
a
80
120
160
200
240
400 600 800 1000 1200 1400 1600
Len
gth
of
rain
y s
easo
n (
day
s)
Rainfall (mm) / season
Rainfall (mm) / season
NTarla Sikasso
c
40
65
90
115
140
400 600 800 1000 1200 1400 1600
Dry
day
s /
seas
on
N'Tarla Sikasso
b
Fig. 3. Relationships between climatic variables from 1965 to 2005 at N’Tarla andSikasso in southern Mali. (a) Regression of length of rainy season and onset datefor N’Tarla: Y = −0.70x + 246.46 (r = 0.81***, n = 41) and Sikasso: Y = −0.64x + 236.97(r = 0.86***, n = 41). (b) Regression of seasonal dry days and seasonal rainfallfor N’Tarla: Y = −0.03x + 143.38 (r = 0.66***, n = 41) and Sikasso: y = −0.04x + 140.94(Nn
dnnaorK
TTc
0.0
0.5
1.0
1.5
2.0
2.5
3.0
3.5
1960 1970 1980 1990 2000
Cott
on y
ield
(t/
ha)
Year
r = -0.24a
0.0
0.5
1.0
1.5
2.0
2.5
3.0
3.5
1960 1970 1980 1990 2000
Sorg
hum
yie
ld (
t/ha)
Year
r = 0.31b
0.0
0.5
1.0
1.5
2.0
2.5
3.0
3.5
1960 1970 1980 1990 2000
Gro
undnut
yie
ld (
t/ha)
Year
r = 0.30c
Fig. 4. Yields of cotton, sorghum and groundnut (t/ha) in the treatment with com-
r = 64***, n = 41). (c) Regression of length of rainy season and seasonal rainfall for’Tarla: Y = 0.05x + 100.87 (r = 0.47**, n = 41) and Sikasso: Y = 0.07x + 100.79 (r = 51**,
= 41).
The correlation of the average farmers’ cotton yields in tenistricts of southern Mali with annual rainfall indicated no sig-ificant (P > 0.10) relationship. There was a tendency towards aegative correlation in the wettest districts (Sikasso, Konlondieba
nd Bougouni) (Table 3). On the contrary, average maize yieldsn farmers’ fields showed a significant positive correlation withainfall in the driest districts (San, Diola, Marakakoungo andonobougou).able 2rends of climatic variables and impact on cotton yields in the long-term experimentonducted from 1965 to 1993 at N’Tarla agricultural research station, southern Mali.
Rainfall Tmin Tmax
Change/season −7.5 0.07 0.08Estimated impact (kg/ha/season) −15.47 −4.29 4.24
bined application of mineral fertilizer and manure in the long-term experimentconducted from 1965 to 1993 at N’Tarla agricultural research station, southern Mali.(Regressions are not significant for a, b and c.)
4. Discussion
4.1. Climate trends
Observed climate trends at two meteorological stations insouthern Mali, N’Tarla and Sikasso, were similar. The increase inthe annual minimum temperature of 0.5 ◦C per decade observed atboth stations is higher than the forecast rise of 0.3 ◦C per decade ona global scale in the next century (Abrol and Ingram, 1997). In theSahara region and West Africa warming is projected to occur morerapidly than the global average (GIEC, 2007).
There was a significant decrease in rainfall between 1965 and1993 at N’Tarla, and a significant increase in the number of dry days.From the previous analysis at the scale of West Africa, Nicholsonet al. (2000) concluded that a decrease in rainfall occurred dur-ing 1968–1997 with annual rainfall on average some 15–40%
less in 1968–1997 than during the period 1931–1960. The periodbetween 1965 and 2005 was especially marked by droughts during1972–1973 and 1983–1984 with respectively 640 mm and 482 mmof rainfall at N’Tarla while at Sikasso it was 765 mm and 671 mm.
120 B. Traore et al. / Europ. J. Agronomy 49 (2013) 115– 125
-3
-2
-1
0
1
2
3
-3 -2 -1 0 1 2 3
∆
Sorg
hum
yie
ld (
t/ha)
r = 0.26
a-3
-2
-1
0
1
2
3
-3 -2 -1 0 1 2 3
∆
Sorg
hum
yie
ld (
t/ha)
∆ Tmax (oC)∆ Tmax (oC)
r = 0.20
b
-3
-2
-1
0
1
2
3
-3 -2 -1 0 1 2 3
∆
Sorg
hum
yie
ld (
t/ha)
∆ Rainfall (mm) / season
r = -0.01
c-3
-2
-1
0
1
2
3
-3 -2 -1 0 1 2 3
∆
Sorg
hum
yie
ld (
t/ha)
∆ Dry days / season
r = - 0.12
d
Fig. 5. Changes in mean yields of sorghum (t/ha) against change in seasonal minimum temperature, seasonal maximum temperature, seasonal rainfall and number of drydays in the long-term experiment conducted from 1965 to 1993 at N’Tarla agricultural research station in southern Mali. (Regressions are not significant for a, b, c and d.)
-3
-2
-1
0
1
2
3
-3 -2 -1 0 1 2 3
∆
Gro
undnut
yie
ld (
t/ha)
∆ Tmin ( oC)
r = 0.18
a-3
-2
-1
0
1
2
3
-3 -2 -1 0 1 2 3
∆
Gro
undnut
yie
ld (
t/ha)
∆ Tmax (oC)
r = 0.24
b
-3
-2
-1
0
1
2
3
-3 -2 -1 0 1 2 3
∆ G
roundnut
yie
ld (
t/ha)
∆ Rainfall (mm) / season
r = 0.17
c-3
-2
-1
0
1
2
3
-3 -2 -1 0 1 2 3
∆ G
roundnut
yie
ld (
t/ha)
∆ Dry days / season
r = - 0.03
d
Fig. 6. Changes in mean yields of groundnut (t/ha) against change in minimum temperature, maximum temperature, annual rainfall and number of dry days in the long-termexperiment conducted from 1965 to 1993 at N’Tarla agricultural research station in southern Mali. (Regressions are not significant for a, b, c and d.)

B. Traore et al. / Europ. J. Agronomy 49 (2013) 115– 125 121
-3
-2
-1
0
1
2
3
-3 -2 -1 0 1 2 3
∆ C
ott
on y
ield
(t/
ha)
∆ Tmin (oC)
r = -0.24
a-3
-2
-1
0
1
2
3
-3 -2 -1 0 1 2 3
∆ C
ott
on y
ield
(t/
ha)
∆ Tmax (oC)
r = -0.40
b
-3
-2
-1
0
1
2
3
-3 -2 -1 0 1 2 3
∆ C
ott
on y
ield
(t/
ha)
∆ Rainfall (mm) / season
r = 0.56
c
1990
1993
-3
-2
-1
0
1
2
3
-3 -2 -1 0 1 2 3
∆ C
ott
on y
ield
(t/
ha)
∆ Dry days/season
r = -0.53
d
F raturee south
Otwi
itaHai
4
a
TS
ig. 7. Changes in mean yields of cotton (t/ha) against change in minimum tempexperiment conducted from 1965 to 1993 at N’Tarla agricultural research station in
ur analysis showed that in terms of rainfall amount and distribu-ion, there is a clear indication that the Sikasso area is currently likehat N’Tarla was 40 years ago, and that climate bands are shifting
n the region.There is considerable uncertainty about future rainfall patterns
n West Africa (IPCC, 2007). The clearest signal is the large propor-ional increase in rainfall from June to August in the Sahara wherebsolute amounts of rainfall are extremely small (Washington andarrison, 2004). Overall, it is expected that more year to year vari-tion in rainfall will occur in the majority of the zones where anncrease in rainfall is projected (FAO, 2008).
.2. Rainfall variability and associated risk for crop production
The rainfall analysis revealed sequences of dry spells whichffect cotton yields. The occurrence of dry spell of 5, 7, 10, 15 and 20
able 3imple linear regression coefficients between cotton and maize yields against total annua
Cotton district Cotton
R2 Slope Estimate Prob.
Koutiala 0.0 0.007 1128 0.965
Mpessoba 0.07 0.132 1057 0.55
Sikasso 0.03 −0.176 1507 0.333
Bougouni 0.06 −0.201 1322 0.169
Konlondieba 0.09 −0.419 1580 0.123
Kimparana 0.07 −0.336 1157 0.212
San 0.05 0.472 478 0.281
Diola 0.03 −0.233 1362 0.353
Marakakoungo 0.0 0.017 1113 0.941
Konobougou 0.0 0.038 956 0.909
All districts 0.06 0.2724 855 0.001
, maximum temperature, annual rainfall and number of dry days in the long-termern Mali. Regressions are not significant for a but significant for b, c and d (P < 0.05).
days was highest in May and October (results not shown). This pointout the uncertainty of the regularity of rainfall in May which repre-sents the land preparation period, which consequently may delaythe planting date and reduce rainy season length. It also indicatesthe magnitude of the risk of planting in May. In the case of late plant-ing, the grain filling period of varieties of maize such as Sotubakawith a growing cycle of 115–120 days extends until October whichalso corresponds to a period of high probability of dry spells. Fre-quent dry spell with high evapotranspiration demand may lead toa decrease in yield of up to 40% because of insufficient water sup-ply during grain filling stage (Barron et al., 2003). Consequently,the significant increase of the number of dry days during the rainy
season and its impact on yield makes it one of the most importantcharacteristic of climate change in southern of Mali.The start date of the rainy season was demonstrated to bethe key variable to which all other seasonal rainfall variables are
l rainfall in 10 cotton districts of southern Mali.
Maize Averagerainfall (mm)
R2 Slope Estimate Prob.
0.09 0.481 1375 0.258 8590.04 0.542 1169 0.49 8870.03 0.202 2100 0.467 11140.04 0.326 1564 0.451 11260.14 0.787 880 0.313 10780.00 0.12 1306 0.865 7480.44 1.143 355 0.013 6580.2 0.783 1218 0.091 7980.24 0.922 930 0.059 7870.23 0.865 1015 0.086 719
0.32 0.988 871 0.001 862

122 B. Traore et al. / Europ. J. Agron
0
200
400
600
800
121 141 161 181 201 221 241 261 281 301 321
Cum
ula
tive
rain
fall
(m
m)
Julian day of year
1990 1993
Goodrainfall distribu�on
Longdry spell during early growth
Fts
ra(blbbAitmOrmsd
F(N(
ig. 8. An example of dry spell analysis for two contrasting years (1990 and 1993)hat received similar cumulative rainfall at N’Tarla agricultural research station inouthern Mali. The number of dry days was 132 in 1990 and 126 in 1993.
elated. Many farmers are aware that rainy seasons with early onsetre generally better for crop production than those with late onsetSivakumar, 1990; Stewart, 1991). The lack of a clear relationshipetween the start and the end of the rainy season refutes the popu-
ar belief that late beginnings of the rainy season are compensatedy late ending of rainy season or that rainy seasons become shorterecause of a late onset and early end. In the south of the Westfrican Sahel the rainy season starts earlier and ends later than
n the north (Traoré et al., 2000, 2007). These characteristics ofhe Sudano-Sahélien climate are due to the north–south move-
ent of the intertropical front (Diarra et al., 1987; Diop, 1996;ladipo and Kyari, 1993; Sivakumar, 1988). An early start of the
ainy season presents some risks as a long dry spell after planting
ay result in crop failure. Conversely, a late end of the rainy sea-on will make short-cycle cultivars prone to insect attack and birdamage (Stewart, 1991).
80
90
100
110
120
130
140
0 2 4 6 8 10 12
Num
ber
of
dry
day
s/se
ason
Five days dry spell
ar = 0.49
80
90
100
110
120
130
140
0 2 4 6 8 10 12Num
ber
of
dry
day
s/se
ason
Seven days dry spell
br = 0.36
ig. 9. Regression between dry spells/season and number of five days dry spella) and seven days dry (b) periods in a year over the period 1965–2005 at’Tarla agricultural research station in southern Mali. (a) Y = 1.9176x + 104.74***,
b) Y = 1.9186x + 104.43*.
omy 49 (2013) 115– 125
4.3. Increased temperature and associated risk for cropproduction
We observed no clear effects of changes in seasonal temperatureon production of sorghum and groundnut. A detailed examina-tion of the temperature records of N’Tarla and Sikasso shows thatmaximum daily temperatures do not exceed 36 ◦C, while mini-mum temperatures are above below 20 ◦C, which seems not tobe a limiting factor for sorghum and groundnut production insouthern Mali. However, there was a negative effect of increasein seasonal maximum temperature on cotton yield even thoughreported values in the literature of critical maximum temperaturesare around 40 ◦C (Reddy et al., 1992). Similar effects of temperatureincreases on rice yields were reported (Peng et al., 2004). Over-all, the sensitivity of crops to a temperature increase varies amongcultivars because plants have adapted to a relative wide range ofthermal environments (Hartwell et al., 1997). C4 cereals such assorghum respond better to increased temperature than C3 plantssuch as cotton (Sombroek and Gommes, 1997). Moreover, most ofthe sorghum and maize varieties grown in southern Mali are localtypes which may provide more flexibility for adaptation (Clementand Leblanc, 1980; Kouressy, 2002).
High temperatures or heat waves usually occur in conjunctionwith other environmental stresses such as drought and high lightintensity (Rahman, 2006) which might lead to increased crop waterrequirements and therefore cause scalding in cereals (Burke, 1990),disturb flowering and strongly reduce crop yield (Fisher et al., 1997;Mackill and Coffman, 1982; Zheng and Mackill, 1982). A recentmeta-analysis of fully fertilized maize experiments in southern andeastern Africa showed that an increase in the temperature duringthe growing season can lead to a significant decrease of 3% in maizegrain production (Lobell et al., 2011). For cotton, it is observed thatthe phase of boll formation is most sensitive to high temperatures(Reddy et al., 1992).
4.4. Climate change, rainfall and crop production
Analysis of data from the long-term cropping experiment atN’Tarla revealed that cotton is more affected by increase in maxi-mum temperature than sorghum or groundnut. Annual variabilityin rainfall amounts, rainfall onset, number of dry days during therainy season and rainfall distribution was large, and determinedvariations in yield of cotton. Our analysis showed that the numberof dry days is a good indicator of the quality of the rainfall distribu-tion for cotton production, and was strongly related to cotton yield.It is clear from this analysis that the number of dry days is as impor-tant as seasonal rainfall. Under farmers conditions no clear impactof rainfall on cotton yields was observed, probably because otherfactors such as low soil fertility and insect attacks which are limitingyields (Kanté, 2001; Lanc on et al., 2007), as suggested by the factthat lower yields were observed on farmers’ fields than at the exper-imental site at N’Tarla. It should also be noted that in the wettestdistricts such as Sikasso, Bougouni and Konlondieba relatively highrainfall amounts might reduce cotton yields as a result of increasedair humidity that support development of harmful insects whichcan cause rot of fruit bolls (Rahman, 2006).
Effects of declining soil fertility on the cotton yield of the controltreatment of the N’Tarla experiment (Fig. 10) were more impor-tant than effects of climate change during the period 1965 to 1980.Interestingly, after full fertiliser application in 1980, average yieldsincreased but also showed more year-to-year variability. This ispossibly related to the fact that after fertilisation, nutrient limita-
tion became less important than water availability for crop yields,thereby resulting in strong links between variations in growingseason weather conditions and yield. In sub-Saharan Africa theissues of soil fertility management have dominated the debate
B. Traore et al. / Europ. J. Agronomy 49 (2013) 115– 125 123
0
500
1000
1500
2000
2500
3000
3500
1965 (1231)
1966 (769)
1967 (1140)
1969 (868)
1970 (742)
1971 (710)
1973 (640)
1974 (832)
1975 (937)
1976 (940)
1977 (993)
1978 904)
1979 (866)
1980 (796)
1981 (737)
1982 (746)
1983 (734)
1984 (482)
1985 (645)
1986 (750)
1987 (747)
1988 (998)
1989 (599)
1990 (734)
1992 (987)
1993 (704)
Cott
on Y
ield
(kg/h
a)
Annual rainfall (mm/year)
Combined application of manure and fertiliser Control treatment
F 1965i es rep
o1ciedmtsocba1mAdthftitem
btrtdtep
4
raitacdt(
ig. 10. Cotton yield trend per year under two rates of fertility management fromndicates the start of using 163 kg ha−1 of N in both treatments. Values in parenthes
n sustainability of farming for a long time (Breman, 2002; Piéri,989). Our findings stress that, effects of declining soil fertility areertainly as important as those of climate effects (rainfall variabil-ty and number of dry days) at field level. However, disentanglingffects of climate and soil fertility is not straightforward, and resultsepend on the spatial scale of analysis. Spatial variability of cli-ate is an important factor affecting regional crop productivity in
he arid and semi-arid regions (Sivakumar and Hatfield, 1990), acale at which small-scale variations in soil fertility are averagedut and where long term trends in soil fertility decline are diffi-ult to detect. Extrapolating our results to large scales is difficultecause of a large spatial variability in soil fertility within distancess short as a few meters (Brouwer et al., 1993; Buerkert and Lamers,999; Manu et al., 1996), diversity in farm types and agriculturalanagement practices (Soumaré et al., 2004; Traoré et al., 2005).ll of these factors affect the relative importance of changes in theriving variables of crop production, and it is therefore essentialhat studies make clear at which integration level there resultsold: field, farm, landscape or regional level. A possible solution
or this issue could be the use of dynamic crop growth simula-ion models directly linked to spatial databases containing detailnformation on soil properties, and management practices. Thenhe importance of the different factors could be unraveled at differ-nt integration levels. However, these databases do not exist at theoment.The important characteristic determining the relationship
etween rainfall and crop production was the rainfall distribu-ion which is related to the number of dry days during theainy season. Better distribution of rainfall changes substantiallyhe relationship between average seasonal rainfall and crop pro-uction (Lobell and Burke, 2008). This means that an averageotal amount of annual rainfall in Sahelian regions is not nec-ssarily synonymous with good rainy season or with good croproduction.
.5. Adaptive crop management strategies
Traditionally, farmers cope with climate variability throughisk-averse management practices such as the distribution of earlynd late crop maturity types throughout the landscape and spread-ng of sowing dates (Ouattara et al., 1998). This approach indicateshat there is a great demand by farmers for climatic informationt an intra-seasonal time scale. Accurate seasonal weather fore-
ast information would help farmers to optimize their immediateecisions and tactical planning of crop management. Currentlyhe predictably of seasonal rainfall is highly variable across AfricaCooper et al., 2008).to 1993 at N’Tarla agricultural research station, southern Mali. The vertical lineresent annual rainfall.
An improvement in the seasonal weather forecasting skillsand effective agrometeorology extension services are crucial foragricultural communities to adjust to future climate variability.Farmers could use this seasonal climate information to plan cropmanagement tactically, such as adjusting planting and fertilizationdates. Our finding shows that the late start of the season deter-mined the length of the season provides an opportunity for farmersto adjust their management by planting shorter-duration varietieswhen the rains start late. Longer-term information on the natureof climate variability and change may help farmers to design newcropping systems and/or management that is more adapted to theclimate. As an example to cope with increased dry spells, land man-agement using contour ridging (Gigou et al., 2006) improves wateruse efficiency as rainwater on the field is channelled between theridges, where it filters into the soil and reduces runoff. For cot-ton systems an alternative management practice based on a highplant density and the use of a crop growth regulators was tested asa way to cope with climate variability and change (Barrabe et al.,2007; Rapidel et al., 2006). With this new practice the crop cov-ers the ground earlier, the cycle of production is reduced by 10–20days which induces an adaptive behavior to climate variability andchange, with yield increases of about 30–40% (Rapidel et al., 2009;Traoré, 2011).
5. Conclusions
Observed climate trends at two meteorological stations insouthern Mali, N’Tarla and Sikasso, were similar. The main variablethat characterised the rainfall season was the date of start of therainy season which determines the length of the cropping period.Indeed, the delayed start of the rainy season also causes plantingdelays and therefore increases the risk of low plant production.
Overall, the impact of seasonal rainfall and maximum tempera-ture variability on cotton yield is greater than that of the long-termchanges in climatic variables. The important characteristic betweenrainfall and crop production is the rainfall distribution which isrelated to the number of dry days during the rainy season. The sig-nificant increase of the number of dry days during the rainy seasonover the period 1965–1993 and its impact on yield makes it one ofthe most important characteristic of climate change in southern ofMali. An average total rainfall in Sahelian regions is not necessarilysynonymous with good rainy season or with good crop production.In our study which is based on an analysis at field level, it appears
that the effects of declining soil fertility are as important as thoseof climate variability and change. However, disentangling effects ofclimate and soil fertility is not straightforward, and results dependon the spatial scale of analysis.
1 Agron
A
tMDBDTcafl
R
A
AA
B
B
B
B
B
B
C
C
D
D
D
D
F
F
F
F
G
G
G
H
24 B. Traore et al. / Europ. J.
cknowledgements
Our sincere thanks to all of our predecessors and colleagues fromhe Agronomy Department of the N’Tarla Research Station: M.M.J.
ontlibert, B. Miribel, C. Gaborel, R. Kaiser, F. Moor, M. Cretenet, J.M.ouzet, C. Malcoiffe, Z. Sanogo, A. Gakou, D. Ballo, A.W. Touré and. Traoré. We thank M.L. Richard, and M. Cretenet of the Agronomyivision of IRCT/CIRAD for their technical and scientific support.he results of this long term experiment represent the pride andommitment of many different field technicians – our thanks toll of them. We also thank M. Soumare for facilitating access toarmers’ crop yield data collected by the Compagnie Malienne poure Développement des Textiles.
eferences
brol, Y.P., Ingram K.T., 1997. Les effets de la hausse des températures diurnes etnocturnes sur la croissance et les rendements de certaines plantes cultivées. In:FAO, POLYTECHNICA (Eds.), Changements du climat et production agricole, Agri-culture mondiale: Horizon 2010. FAO/POLYTECHNICA, Rome, p. 472 (chapitre6).
rcher, D.R., 1981. Rainfall sequences in northern Malawi. Weather 36, 2–9.ti, O.F., Stigter, C.J., Oladipo, E.O., 2002. A comparison of methods to determine the
onset of the growing season in northern Nigeria. Int. J. Climatol. 22, 731–742.arrabe, A., Rapidel, B., Sissoko, F., Traore, B., Wery, J., 2007. Elaboration and test of
a decision rule for the application of mepiquat chloride on cotton in Mali. Eur. J.Agron. 27, 197–204.
arron, J., Rockström, J., Gichuki, F., Hatibu, N., Hughes, D., 2003. Dry spell anal-ysis and maize yields for two semi-arid locations in east Africa. Agric. ForestMeteorol. 117, 23–37.
reman, H., 2002. Soil fertility and farmers’ revenue: keys to desertification control.In: Shimizu, H. (Ed.), Integration and Regional Researches to Combat Deser-tification. Present State and Future Prospect. The 16th Global EnvironmentCGER/NIES. Tsukuba, pp. 26–41.
rouwer, J., Fussel, L.K., Hermann, L., 1993. Soil and crop growth microvariability inthe West African semi-arid tropics: a possible risk reducing factor for subsistencefarmers. Agric. Ecosyst. Environ. 45, 229–238.
uerkert, A., Lamers, J.P.A., 1999. Soil erosion and deposition effects on surfacecharacteristics and pearl millet growth in the West African Sahel. Plant Soil,239–253.
urke, J.J., 1990. High temperature stress and adaptation in crops. In: Alscher, R.G.,Cummings, J.R. (Eds.), Stress Response in Plants: Adaptation and AcclimationMechanisms. Wiley–Liss, New York, pp. 295–309.
lement, J.C., Leblanc, J.M., 1980. Prospection des mils pénicilaires, sorgho et gram-inées mineures en Afrique de l‘Ouest. In: Campagne 1978. République du Mali.International Board for Plant Genetic Resources, Orstom, Paris.
ooper, P.J.M., Dimes, J., Rao, K.P.C., Shapiro, B., Shiferaw, B., Twomlow, S., 2008.Coping better with current climatic variability in the rain-fed farming systems ofsub-Saharan Africa: an essential first step in adapting to future climate change?Agric. Ecosyst. Environ. 126, 24–35.
eveze, J.C., 2006. Le devenir des agricultures cotonnières: Cas du Mali, Documentde travail. AFD, Mali31.
iarra, B., Lidon, B., Valet, S., Traoré, S.B., 1987. Zonage des potentialités agropédo-climatiques du Mali. In: ICRISAT (Ed.), Les cultures associées au Mali. ICRISAT,Bamako, pp. 17–28.
iop, M., 1996. A propos de la durée de la saison des pluies au Sénégal. Sécheresse7, 7–15.
odd, D.E.S., Jolliffe, I.T., 2001. Early detection of the start of the wet season insemiarid tropical climates of Western Africa. Int. J. Climatol. 21, 1251–1262.
AO, 2003. Responding to Agricultural and Food Insecurity Challenges MobilisingAfrica to Implement Nepad Programmes FAO. FAO, Maputo, Mozambique.
AO, 2006. World reference base for soil resources 2006. In: A Framework forInternational Classification Correlation and Communication. FAO, Rome.
AO, 2008. Climate and Climate Change: Atlas on Regional integration in West Africa.ECOWAS-SWAC/OECD. Abuja, Nigeria.
isher, G., Frouhberg, K., Parry, M.L., Rosenzweig, C., 1997. Les effets potentiels duchangement de climat sur la production et la sécurité alimentaires mondiales.In: FAO, POLYTECHNICA (Eds.), Changements du climat et production agricole,Agriculture mondiale: Horizon 2010. FAO/POLYTECHNICA, Rome, p. 472.
IEC, Bilan, 2007 des changements climatiques. Contribution des Groupes de travailI, II et III au quatrième Rapport d’évaluation du Groupe d’experts intergouverne-mental sur l’évolution du climat, Genève, Suisse, 2007.
igou, J., Traoré, K., Giraudy, F., Coulibaly, H., Sogoba, B., Doumbia, M., 2006. Amé-nagement paysan des terres et réduction du ruissellement dans les savanesafricaines. Cah. Agric. 15, 116–122.
raef, F., Haigis, J., 2001. Spatial and temporal rainfall variability in the Sahel andits effects on farmers’ management strategies. J. Arid Environ. 48, 221–231.
artwell, L., Allen, J.R., Baker, J.T., Boote, J.K., 1997. L‘effet fertilisant du CO2: pro-duction et rétention accrues d‘hydrates de carbone en termes de rendement enbiomasse et en grain. In: FAO, POLYTECHNICA (Eds.), Changements du climat et
omy 49 (2013) 115– 125
production agricole, Agriculture mondiale: Horizon 2010. FAO/POLYTECHNICA,Rome, p. 472.
IER/CMDT/OHVN, 1998. Mémoire de réunion de concertation sur la baisse de rende-ment de la variété NTA 88-6 au cours de la campagne 97/98. Institut d‘EconomieRurale, N‘Tarla, Mali34.
IPCC, 2007. Summary for policymakers. In: Solomon, S., Qin, D., Manning, M., Chen,Z., Marquis, M., Averyt, K.B., Tignor, M., Miller, H.L. (Eds.), Climate Change 2007:The Physical Science Basis. Contribution of Working Group I to the Fourth Assess-ment Report of the Intergovernmental Panel on Climate Change. CambridgeUniversity Press, Cambridge, United Kingdom/New York.
IRCT, 1969. Expérimenation régionale cotonnière. Station de N‘Tarla, République duMali41.
Kanté, S., 2001. Gestion de la fertilité des sols par classe d‘exploitation au Mali-Sud.Documents sur la Gestion des Ressources Tropicales. Tropical Resource Man-agement Papers. Wageningen University and Research Centre Departement ofPlant Science, p. 225.
Kucharik, C.J., Serbin, S.P., 2008. Impacts of recent climate change on Wisconsincorn and soybean yield trend. Environ. Res. Lett 3.
Lanc on, J., Wery, J., Rapidel, B., Angokaye, M., Gérardeaux, E., Gaborel, C., Ballo, D.,Fadegnon, B., 2007. A methodology to design and assess integrated crop man-agement systems: application to cotton in West Africa. Agron. Sustain. Dev. 27,101–110.
Lobell, D.B., Burke, M.B., 2008. Why are agricultural impacts of climate change souncertain? The importance of temperature relative to precipitation. Environ.Res. Lett. 3, 8.
Lobell, D.B., Field, C.B., 2007. Global scale climate–crop yield relationships and theimpacts of recent warming. Environ. Res. Lett. 2, 7.
Lobell, D.B., Ortiz-Monasterio, J.I., Asner, G.P., Matson, P.A., Naylor, R.L., Falcon, W.P.,2005. Analysis of wheat yield and climatic trends in Mexico. Field Crops Research94, 250–256.
Lobell, D.B., Schlenker, W., Costa-Roberts, J., 2011. Climatetrends and global crop production since 1980. Sci. Exp. Rep.,http://dx.doi.org/10.1126/science.1204531:1-9.
Mackill, D.J., Coffman, W.L.J.R., 1982. Pollen shedding and combining ability for hightemperature tolerance in rice. Crop Sci. 20, 730–733.
Manu, A., Pfordresher, A.A., Geiger, S.C., Wilding, L.P., Hossner, L.R., 1996. Soil param-eters related to crop growth variability in Western Niger, West Africa. Soil Sci.Soc. Am. J. 60, 283–288.
Nicholls, N., 1997. Increased australian wheat yield due to recent climate trends.Nature 387, 484–485.
Nicholson, S.E., 1980. The nature of rainfall fluctuations in subtropical West Africa.Mon. Wea. Rev. 108, 473–487.
Nicholson, S.E., Some, B., Kone, B., 2000. An analysis of recent rainfall conditionsin West Africa, including the rainy seasons of the 1997 El Nino and the 1998 LaNina years’. J. Climate 13, 2628–2640.
Oladipo, E.O., Kyari, J.D., 1993. Fluctuations in the onset, termination andlength of the growing season in northern Nigeria Theor. Appl. Climatol. 347,241–250.
Omotosho, J.B., Balogun, A.A., Ogunjobi, K., 2000. Predicting monthly and seasonalrainfall, onset and cessation of the rainy season in West Africa using only surfacedata. Int. J. Climatol. 20, 865–880.
Ouattara, M., Vaksmann, M., Reyniers, F.N., Kouressy, M., Niangado, O., 1998.Variabilité phénologique des sorghos du Mali et adaptation à la diversité desagro-écosystèmes. In: Bacci, L., Reyniers, F.N. (Eds.), Le futur des céréales pho-topériodiques pour une production durable en Afrique tropicale semi-aride.CeSIA, Florence, Italy, pp. 123–137.
Peng, S., Huang, J., Sheehy, J.E., Laza, R.C., Visperas, R.M., Zhong, X., Centeno, G.S.,Khush, G.S., Cassman, K.G., 2004. Rice yields decline with higher night temper-ature from global warming. PNAS 101, 9971–9975.
Piéri, C., 1989. Fertilité des terres de savanes. Bilan de trente ans de recherche et dedéveloppement agricoles au sud du Sahara, p. 443.
Rahman, H., 2006. Number and weight of cotton lint fibres: variation due to hightemperatures in the field. Australian J. Agric. Res. 57, 83–590.
Raman, C.V.R., 1974. Analysis of commencement of Monsoon rains over Maha-rashtra State for agricultural planning. In: Scientific Report 216. MeteorologicalDepartment, Poona, India.
Rapidel, B., Defèche, C., Traoré, B., Lancon, J., Wery, J., 2006. In-field development ofa conceptual crop functioning and management model: a case study on cottonin southern Mali. Eur. J. Agron. 24, 304–315.
Rapidel, B., Traoré, B., Sissoko, F., Lanc on, J., Wery, J., 2009. Experiment-based proto-typing to design and assess cotton management systems in West Africa. Agron.Sustain. Dev., http://dx.doi.org/10.1051/agro/2009016.
Reddy, K.R., Hodges, H.F., Reddy, V.R., 1992. Temperature eVects on cotton fruitretention. Agron. J. 84, 26–30.
Rosegrant, M.W., Cai, X., Cline, S.A., 2002. World water and food to 2025: deal-ing with scarcity. In: IFPRI-2020 Vision/International Water Management Book.IFPRI, Washington, DC.
Servat, E., Paturel, J.E., Kouame, B., Travaglio, M., Ouedraogo, M., Boyer, J.F.,Lubes-Niel, H., Fristch, J.M., Masson, J.M., Marieu, B., 1998. Identification, carac-térisation et conséquences d‘une variabilité hydrologique en Afrique de l‘Ouestet Centrale. In: Servat, E., et al. (Eds.), Water Resources Variability in Africa during
the XXth Century. Abidjan, pp. 323–337.Shaw, A.B., 1987. An analysis of the rainfall regimes on the coastal region of Guyana.Int. J. Climatol. 7, 291–302.
Sivakumar, M.V., Konaté, M., Virmani, S.M., 1984. Agroclimatologie de l‘Afrique del‘Ouest: le Mali. In: Bulletin d‘Information. ICRISAT, Patancheru.

Agron
S
S
S
S
S
S
S
S
S
S
mate Research Programme, International Clivar Project Office Publication Series
B. Traore et al. / Europ. J.
ivakumar, M.V.K., 1988. Predicting rainy season potential from the onset of rainsin southern sahelian and sudanian climatic zones of West Africa. Agric. For.Meteorol. 42, 295–305.
ivakumar, M.V.K., 1990. Exploiting rainy season potential from the onset of rainsin the Sahelian zone of West Africa. Agric. For. Meteorol. 51, 321–332.
ivakumar, M.V.K., Hatfield, J.L., 1990. Spatial variability of rainfall at an experimen-tal station in Niger. West Africa Theor. Appl. Climatol. 42, 33–39.
ivakumar, M.V.K., Das, H.P., Brunini, O., 2005. Impacts of present and future climatevariability and change on agriculture and forestery in the arid and semi-aridtropics. Clim. Change 70, 31–72.
ombroek, W.G., Gommes, R., 1997. L’énigme: Changement de climat - agriculture.In: FAO, POLYTECHNICA (Ed.), Changements du climat et production agricole,Agriculture mondiale. Horizon 2010, Rome, p. 472.
oumaré, M., Bazile, D., Vaksmann, M., Kouressy, M., Diallo, K., Hamala Diakité, C.H.,2004. Diversité agroécosystémique et devenir des céréales traditionnelles ausud du Mali. Cah. Agric. 17, 79–85.
tern, R.D., Coe, R., 1982. The use of rainfall models in agricultural planning. Agric.Meteorol. 26, 35–50.
tern, R.D., Cooper, P.J.M., 2011. Assessing climate risk and cliamte change usingrainfall data – a case study from zambia. Expl. Agric. 47, 241–266.
tern, R.D., Dennett, M.D., Dale, I.C., 1981. Analysing daily rainfall measurements to
give agronomically useful results. I. Direct methods. Expl. Agric. 18, 223–236.tewart, J.I., 1991. Principles and performance of response farming. In: Muchow,R.C., Bellamy, J.A. (Eds.), Proceedings of the international symposium on Climaticrisk in crop production: Models and management for the semiarid tropics andsubtropics, Brisbane, Australia, pp. 361–382.
omy 49 (2013) 115– 125 125
Sultan, B., Janicot, S., 2003. The West African monsoon dynamics. Part II: the preonsetand onset of the summer monsoon. J. Clim. 16, 3407–3427.
Traoré, B., 2011. Fiche technique de la culture du coton à forte densité et à croissancerégulée au Mali, Programme Coton. IER, Bamako-Mali.
Traoré, B., Rapidel, B., Sissoko, F., Doucouré, C.T., 2005. Evolution des techniquesculturales en zone cotonnière entre 1997 et 2002. Les Cahiers de l‘EconomieRurale, 2ème trimestre 2, 21–28.
Traoré, P.C.S., Kouressy, M., Vaksmann, M., Tabo, R., Maikano, I., Traoré, S.B., Cooper,P., 2007. Climate prediction and agriculture: What Is different about Sudano-Sahelian West Africa? chapter 19. In: Sivakumar, M.V.K., Hansen, J. (Eds.),Climate Prediction and Agriculture: Advances and Challenges. Springer, USA,pp. 189–203.
Traoré, S.B., Reyniers, F.N., Vaksmaann, M., Koné, B., Sidibé, A., Yoroté, A., Yattara,K.M.K., 2000. Adaptation à la sécheresse des écotypes locaux de sécheresse.Sécheresse 11, 227–237.
Washington, R., Harrison, M., 2004. African Climate Report: A Report Commis-sioned by the UK Government to Review African Climate Science, Policy andOptions for Action. Climatology Research Group, Oxford University Centre forthe Environment, UK45.
WCRP, 1999. Climate Research for Africa. Informal Report No. 16/1999. World Cli-
No. 29. Southampton, United Kingdom.Zeng, N., 2003. Drought in the Sahel. Science 302, 999–1000.Zheng, K.L., Mackill, D.T., 1982. Effect of high temperature on anther dehiscence and
pollination in rice. Sabrao J. 14, 61–66.


