Embed Size (px)
Citation preview
Hydrology of malaria: Model development and application
to a Sahelian village
Arne Bomblies,1 Jean-Bernard Duchemin,2 and Elfatih A. B. Eltahir1
Received 13 February 2008; revised 8 September 2008; accepted 29 September 2008; published 31 December 2008.
[1] We present a coupled hydrology and entomology model for the mechanisticsimulation of local-scale response of malaria transmission to hydrological andclimatological determinants in semiarid, desert fringe environments. The model is appliedto the Sahel village of Banizoumbou, Niger, to predict interannual variability in malariavector mosquito populations that lead to variations in malaria transmission. Using a high-resolution, small-scale distributed hydrology model that incorporates remotely sensed datafor land cover and topography, we simulate the formation and persistence of the poolsconstituting the primary breeding habitat of Anopheles gambiae s.l. mosquitoes, theprincipal regional malaria vector mosquitoes. An agent-based mosquito population modelis coupled to the distributed hydrology model, with aquatic-stage and adult-stagecomponents. Through a dependence of aquatic-stage mosquito development and adultemergence on pool persistence, we model small-scale hydrology as a dominant control ofmosquito abundance. For each individual adult mosquito, the model tracks attributesrelevant to population dynamics and malaria transmission, which are updated asmosquitoes interact with their environment, humans, and animals. Weekly fieldobservations were made in 2005 and 2006. A 16% increase in rainfall between the twoyears was accompanied by a 132% increase in mosquito abundance between 2005 and2006. The model reproduces mosquito population variability at seasonal and interannualtimescales and highlights individual pool persistence as a dominant control. Futuredevelopments of the presented model can be used in the evaluation of impacts of climatechange on malaria, as well as the a priori evaluation of environmental management-basedinterventions.
Citation: Bomblies, A., J.-B. Duchemin, and E. A. B. Eltahir (2008), Hydrology of malaria: Model development and application to a
Sahelian village, Water Resour. Res., 44, W12445, doi:10.1029/2008WR006917.
1. Introduction
1.1. Background
[2] Malaria is inextricably tied to water. Because malariavector mosquitoes utilize water bodies for breeding, malariacannot exist in regions where environmental conditionsprohibit the formation and persistence of such water bodies.Consequently, for regions where water availability limitsmosquito populations, hydrology models can provide usefulpredictive tools for vector mosquito population dynamics,which extends to malaria force of infection. Addressing theinherently cross-disciplinary nature of this problem usingnumerical modeling techniques at the appropriate spatialand temporal scales should result in an improved under-standing of malaria transmission dynamics. We present sucha model in this study, applicable to village-scale malariatransmission within African desert-fringe environments
such as the Sahel. We then apply the model to Banizoum-bou, a typical Sahelian village in southwestern Niger.[3] Malaria burden is particularly severe in sub-Saharan
Africa. Sixty percent of the world’s 300–500 millionclinical malaria cases and 80% of worldwide malaria deaths[World Health Organization, 2005] occur in this region.This disproportionately high disease burden in Africa is dueprimarily to the dominance of Plasmodium falciparum, themost severe and fatal form of human malaria, as well asbehavioral traits of Anopheles gambiae mosquitoes, theprincipal vectors of the disease in much of the continent.An. gambiae’s strong preference for human hosts (anthro-pophily) makes it an exceedingly efficient vector [White,1974; Costantini et al., 1996a].[4] In the African Sahel, monsoonal rainfall collects in
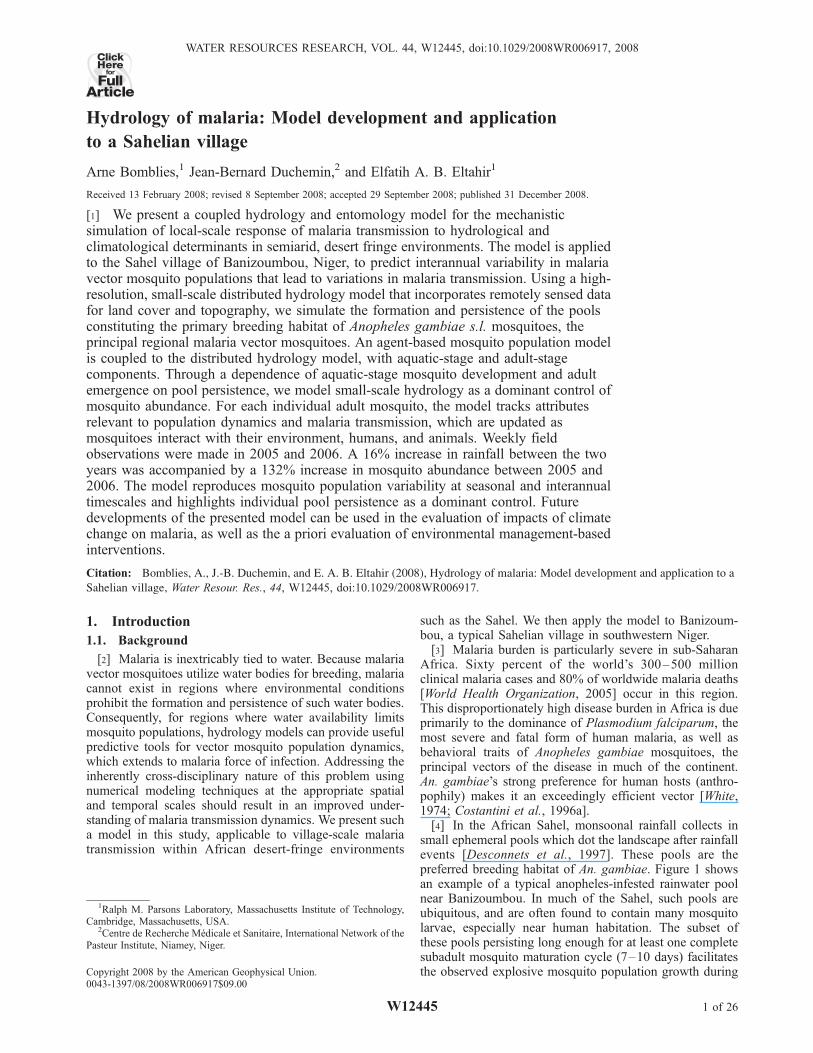
small ephemeral pools which dot the landscape after rainfallevents [Desconnets et al., 1997]. These pools are thepreferred breeding habitat of An. gambiae. Figure 1 showsan example of a typical anopheles-infested rainwater poolnear Banizoumbou. In much of the Sahel, such pools areubiquitous, and are often found to contain many mosquitolarvae, especially near human habitation. The subset ofthese pools persisting long enough for at least one completesubadult mosquito maturation cycle (7–10 days) facilitatesthe observed explosive mosquito population growth during
1Ralph M. Parsons Laboratory, Massachusetts Institute of Technology,Cambridge, Massachusetts, USA.
2Centre de Recherche Medicale et Sanitaire, International Network of thePasteur Institute, Niamey, Niger.
Copyright 2008 by the American Geophysical Union.0043-1397/08/2008WR006917$09.00
W12445
WATER RESOURCES RESEARCH, VOL. 44, W12445, doi:10.1029/2008WR006917, 2008ClickHere
for
FullArticle
1 of 26
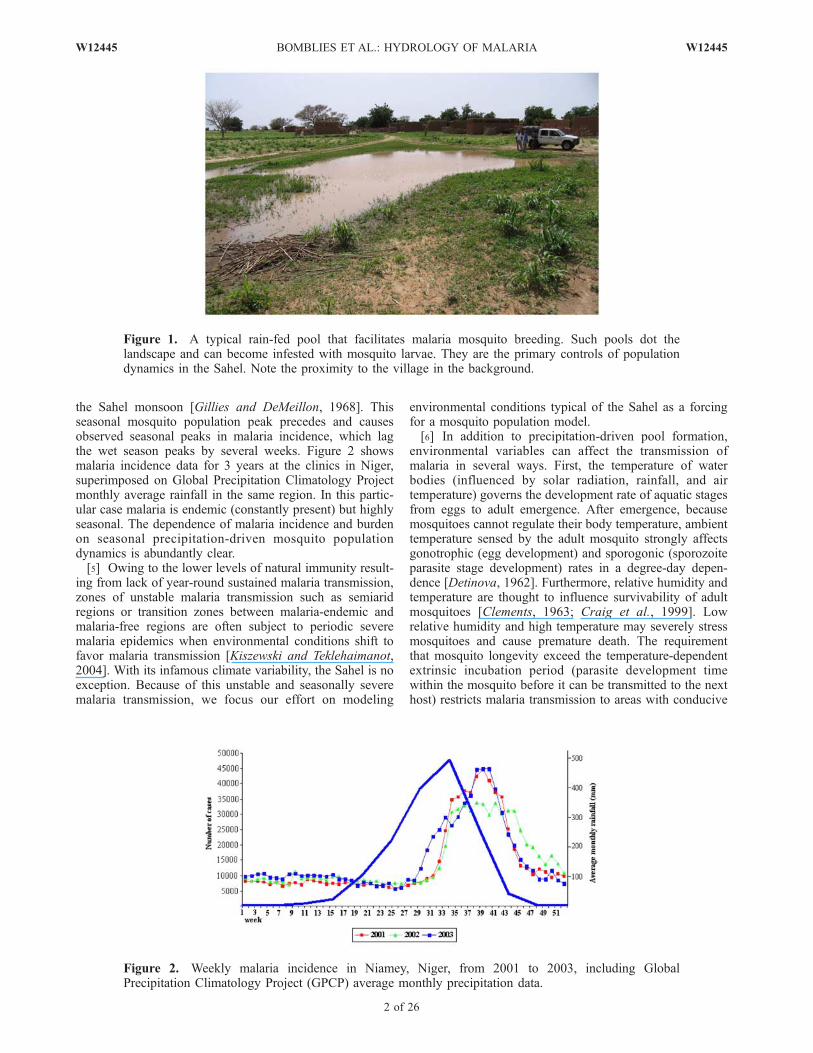
the Sahel monsoon [Gillies and DeMeillon, 1968]. Thisseasonal mosquito population peak precedes and causesobserved seasonal peaks in malaria incidence, which lagthe wet season peaks by several weeks. Figure 2 showsmalaria incidence data for 3 years at the clinics in Niger,superimposed on Global Precipitation Climatology Projectmonthly average rainfall in the same region. In this partic-ular case malaria is endemic (constantly present) but highlyseasonal. The dependence of malaria incidence and burdenon seasonal precipitation-driven mosquito populationdynamics is abundantly clear.[5] Owing to the lower levels of natural immunity result-
ing from lack of year-round sustained malaria transmission,zones of unstable malaria transmission such as semiaridregions or transition zones between malaria-endemic andmalaria-free regions are often subject to periodic severemalaria epidemics when environmental conditions shift tofavor malaria transmission [Kiszewski and Teklehaimanot,2004]. With its infamous climate variability, the Sahel is noexception. Because of this unstable and seasonally severemalaria transmission, we focus our effort on modeling
environmental conditions typical of the Sahel as a forcingfor a mosquito population model.[6] In addition to precipitation-driven pool formation,
environmental variables can affect the transmission ofmalaria in several ways. First, the temperature of waterbodies (influenced by solar radiation, rainfall, and airtemperature) governs the development rate of aquatic stagesfrom eggs to adult emergence. After emergence, becausemosquitoes cannot regulate their body temperature, ambienttemperature sensed by the adult mosquito strongly affectsgonotrophic (egg development) and sporogonic (sporozoiteparasite stage development) rates in a degree-day depen-dence [Detinova, 1962]. Furthermore, relative humidity andtemperature are thought to influence survivability of adultmosquitoes [Clements, 1963; Craig et al., 1999]. Lowrelative humidity and high temperature may severely stressmosquitoes and cause premature death. The requirementthat mosquito longevity exceed the temperature-dependentextrinsic incubation period (parasite development timewithin the mosquito before it can be transmitted to the nexthost) restricts malaria transmission to areas with conducive
Figure 1. A typical rain-fed pool that facilitates malaria mosquito breeding. Such pools dot thelandscape and can become infested with mosquito larvae. They are the primary controls of populationdynamics in the Sahel. Note the proximity to the village in the background.
Figure 2. Weekly malaria incidence in Niamey, Niger, from 2001 to 2003, including GlobalPrecipitation Climatology Project (GPCP) average monthly precipitation data.
2 of 26
W12445 BOMBLIES ET AL.: HYDROLOGY OF MALARIA W12445
climate conditions. In addition, small-scale variability inthese variables associated with microhabitats (e.g., in houses,in tree canopies, or other such shelters) may provide refugessought out by mosquitoes to escape highly stressful ambientconditions such as low humidity, high temperature, or highwind, and may influence survivability and vectorial capacity[Okech et al., 2003]. Thus, actual mosquito longevity andsporogonic development may differ from those predicted bycoarse-resolution models for mosquitoes occupying micro-habitats. Malaria transmission and force of infection stronglydepends on both mosquito longevity and sporogonic devel-opment [Ross, 1911; Macdonald, 1957].[7] Spatial relationships between Anopheles breeding
habitat, the vectors’ human hosts, and favorable micro-habitats can also significantly factor into transmissionintensity of a human population. Flight distance betweenproductive breeding sites and nearest human habitation canaffect mosquito fecundity through lower time required foreach gonotrophic cycle [Le Menach et al., 2005; Minakawaet al., 2002], and proximity of predicted breeding pools tosources of airborne nutriment such as maize pollen canstrongly influence pool productivity [Ye-Ebiyo et al., 2003].[8] Mosquito population response to environmental per-
turbations such as climate variability is highly nonlinear.This is due not only to nonlinear hydrologic response torainfall variability and the threshold temperature and hu-midity effects outlined above, but also to ecological limi-tations of nutrient competition and predation, which act inresponse to exponentially growing populations, in a nega-tive feedback [Sutherst, 2004]. The combined effects fromall of these factors suggest that simple correlative studies ofmalaria prevalence with climate variables may not suffice,and a more sophisticated approach is necessary in order toadequately predict system response to perturbation scenar-ios. The complex system of malaria’s dependence onenvironmental conditions may be best studied using arepresentative mechanistic model.[9] The presented model was developed for two primary
goals. First, we seek to understand the effects of interannualclimate variability on village-scale malaria transmission.Identification of the environmental factors driving seasonaltransmission variability is a key to understanding longer-term trends in malaria transmission [Pascual and Dobson,2005]. In the Sahel, anopheles breeding pool persistence(and therefore potential for mosquito breeding productivity)depends as much on precipitation frequency, timing andindividual storm hyetographs as it does on cumulativerainfall. Excessive rainfall may flush out breeding pools,but storm return periods significantly longer than typicalpool persistence times would result in pool desiccation, totalsterilization of all aquatic-stage mosquitoes within that pool,and would therefore preclude adult mosquito development[Charlwood et al., 1995]. Site-specific microtopography,microclimate, and soil and vegetation type determine poolpersistence. Interannual variability in humidity and temper-ature can affect populations as well, as described above. Themodel was developed to address effects of the Sahel’spronounced climate variability on malaria transmissionand transmissibility, measured by malaria prevalence andmosquito vectorial capacity. Future applications of thecoupled model can evaluate effects of climate change onmalaria transmission. Accurate forecasts may be limited by
the model’s inability to simulate human adaptation to long-term climate change, but the mechanisms for evaluatingclimate change effects on malaria transmission in a stable,stationary population are built into the model.[10] The second purpose of the coupled model develop-
ment was to construct a modeling framework that allowsexplicit representation of the spatial determinants of malariatransmission. Differences in pool productivities may berelated to a variety of proximal factors, all of which havesmall characteristic scales, such as nearby human habitation,presence of livestock (which act as an alternate blood mealsource for anophelines), nearby pollen sources such asmaize or millet or microhabitat availability. Mosquitoes’interactions with these spatial determinants and the villageinhabitants can be represented using an agent-based ap-proach operating on a small-scale grid. Spatial structure ofthe population is maintained, which is absent in analyticalmodels with ‘‘perfect mixing’’ assumptions. With such aformat, mosquito population structure can be reproduced,observed, and studied in a simulated, virtual field environ-ment. An important extension of this design purpose is thatpotential local intervention methodologies can be evaluateda priori. The model can evaluate a variety of environmentalmanagement scenarios, such as the effects of pool removal,draining, larviciding, etc. In addition, specific questionsabout mosquito population behavior such as dry seasonsurvival, or intervillage mosquito migrations can beexamined.[11] Several studies have confirmed association of climate
variability and malaria transmission, and some models havedemonstrated predictive ability based on malaria/climateassociations using past observations [e.g., Teklehaimanot etal., 2004; Thomson et al., 2006]. However, with an associa-tive approach and a coarse spatial scale, these types of modelscannot fully untangle the complexities of malaria depen-dence on environmental variables, and thus may not provideadequate predictive ability to test climate change or intenseclimate variability scenarios. In addition, because small-scale spatial variations in soil, vegetation type and especiallytopography influence the degree of pooling for a givenrainfall amount, coarse resolution models may be limited inapplicability [Thomson et al., 2004]. Resolution must beadequately high in order to predict precipitation effects onAnopheles gambiae mosquito ecology in the Sahel. Shamanet al. [2002] demonstrated that high-resolution soil moisturemodeling that incorporates topographic details yields goodcorrelation of soil moisture states with captured mosquitoabundances in New Jersey. However, improvements onmalaria models that are based largely on correlations withmosquito abundances or historical incidence data can bemade with a mechanistic, first-principle simulation of envi-ronment-dependent processes involved, operating at appro-priate scales. This should yield predictive ability forresponse to perturbations beyond the limits of past obser-vations, such as extreme climate variability or climatechange. For such a model, hydrology and entomologysimulators are necessary intermediates.[12] We evaluate the effects of climate variability on
malaria transmissibility in the Sahel using the presentedcoupled hydrology/entomology model, forced with 2005and 2006 field data. The application of this model toBanizoumbou, Niger, will demonstrate the model’s utility
W12445 BOMBLIES ET AL.: HYDROLOGY OF MALARIA
3 of 26
W12445
for studying malaria transmission responses to environmen-tal variability.
1.2. Study Area
[13] Banizoumbou is a village in southwestern Niger (13�310, 2� 390) of about 1000 inhabitants and is located in asemiarid plateau landscape of tiger bush, millet fields,fallow, and bare soil. Land use and land cover types inBanizoumbou’s immediate environs are typical for NigerSahelian villages. Average annual rainfall in nearby Niameyis 562 mm over the period 1905–1989 [Le Barbe andLebel, 1997], all of which falls during the single May toOctober rain season with a peak in August. Because ofextended drought, during the period 1968–1990, the aver-age annual precipitation has decreased to 495 mm [Le Barbeand Lebel, 1997]. Average annual rainfall in recent years inBanizoumbou is slightly less at 450 mm. The majority ofthe annual rainfall occurs during the West African monsoonpeak between mid-July and late August. The rain tends tofall at a high rate, with a distinctive hyetograph shapeconsisting of an initial burst of high-intensity and short-duration rain (squall line), followed by several hours of low-intensity rainfall from the trailing stratiform [Amani andLebel, 1996].[14] Regional topography as seen in digital elevation
models reveals an extensive drainage network. However,these channels no longer conduct runoff, as they are relicsfrom a wetter period [Talbot, 1980]. Pleistocene aeoliansand deposits in the drainages impound water in thechannels [Peugeot et al., 2003], confining runoff to smallclosed-basin catchments, which are typically no more than1 km in length [Desconnets et al., 1997]. SurroundingBanizoumbou, small catchments drain into pools severalmeters to tens of meters across [Desconnets et al., 1997].Pool inflows are balanced by a change in volume, infiltra-tion, and evaporation, and levels fluctuate in response toinflows from concentrated runoff. Incidentally, infiltrationfrom these pools is the primary source of recharge to theunconfined aquifer [Leduc et al., 2001]. A layer of low-permeability clayey soil lines the bottom of these pools[Desconnets et al., 1997]. Outside of the pools, homogenoussandy soils with 10–15% fine particle content predominatein the hillslopes and valley bottom ravines, and infiltrationcapacity in these sandy soils can reach 45 cm/h [Peugeot etal., 2003]; however, the soils are highly susceptible to crustformation [Hoogmoed and Stroosnijder, 1984]. When crustforms, runoff coefficients can increase to 90%, with dramaticconsequences for pool inflows [Casenave and Valentin,1992].[15] Subsistence dry-land agriculture dominates food
production, and local vegetation consists primarily of milletfields near the village. Most of the land is farmed, someareas are left fallow, and the remainder consists of tiger bushshrubland, which is generally more distant from the villageand is common near surrounding plateau tops. Banizoum-bou villagers farm pearl millet almost exclusively, withsmall plots of beans, groundnuts, and other crops makingup an insignificant portion of the cultivated land.[16] As previously stated, Anopheles gambiae s.s. and
Anopheles arabiensis mosquitoes dominate malaria trans-mission in Banizoumbou [White, 1974; J.-B. Duchemin,personal communication, 2005]. Both of these species aremembers of the Anopheles gambiae s.l. species complex,
genus Anopheles (the only mosquito genus capable oftransmitting malaria) [Gillies and DeMeillon, 1968]. Thestrong anthropophily (human-biting nature) of Anophelesgambiae s.l. mosquitoes makes them highly efficientmalaria vectors [White, 1974;Coluzzi et al., 1979; Costantiniet al., 1998]. The less abundant (and less anthropophilic)Anopheles species such as An. pharoensis and An. rufipesplay only a very minor role in Banizoumbou malaria trans-mission [Muriu et al., 2008; Appawu et al., 2004]. The highlyanthropophilic vector Anopheles funestus has never beencaptured in Banizoumbou and is assumed absent.
2. Model Development
[17] The presented model was developed to evaluatethe aforementioned complexities in mosquito populationresponse to climate variables in the Sahel, simulatingbreeding pool formation and persistence with a distributedhydrology model. Previous hydrology models have success-fully correlated soil moisture and mosquito abundance.For example, Patz et al. [1998] showed an improvedexplanation of variance in An. gambiae abundance andbiting in Western Kenya using modeled soil moisture,compared to both rainfall alone and normalized differencevegetation index (NDVI). Potential for the use of hydrologicmodeling to predict malaria transmission was demonstratedwith this study, however the spatial and temporal resolutionsused in the model were low. Improvements on the use of asoil moisture model to predict mosquito abundance weremade by Shaman et al. [2002]. As previously mentioned,they predicted distributed soil moisture at high spatialand temporal resolution in New Jersey, to correlate withobserved abundances of mosquito species Aedes vexans,Anopheles walkeri, and Culex pipiens. Ahumada et al.[2004] developed a model to predict population dynamicsof Cx. quinquefasciatus in Hawaii, as a function of seasonalchanges in environmental conditions. These authorssuccessfully predicted temporal population patterns alongan altitudinal gradient. Depinay et al. [2004] and Pascual etal. [2006] incorporated temperature-dependent subadultdevelopment rates into mosquito population models. Weuse these prior studies as a foundation for our modeldevelopment. However, we explicitly represent the distrib-uted pooled water that constitutes anopheles mosquitobreeding habitat as well as the soil moisture which governsthe formation of this habitat, and link the resulting pooledwater locations with a high temporal resolution individual-based representation of mosquito populations interactingwith the environment.[18] Figure 3 shows the conceptual schematic and
coupling of various model components. Because spatialdistributions of pools relative to human habitation are soimportant and can play a large role in transmission intensity[Le Menach et al., 2005; Minakawa et al., 1999; Minakawaet al., 2002], a gridded region surrounding human habitationforms the model domain and individual pool locations arepredicted using fine-scale topography as hydrology modelinput. Simulated pools in topographic depressions hostsubadult mosquitoes, which emerge as individual ‘‘agents’’if their host pool persists long enough, and are free tointeract with their simulated environment within the modeldomain based on a set of preassigned rules and attributes.
4 of 26
W12445 BOMBLIES ET AL.: HYDROLOGY OF MALARIA W12445
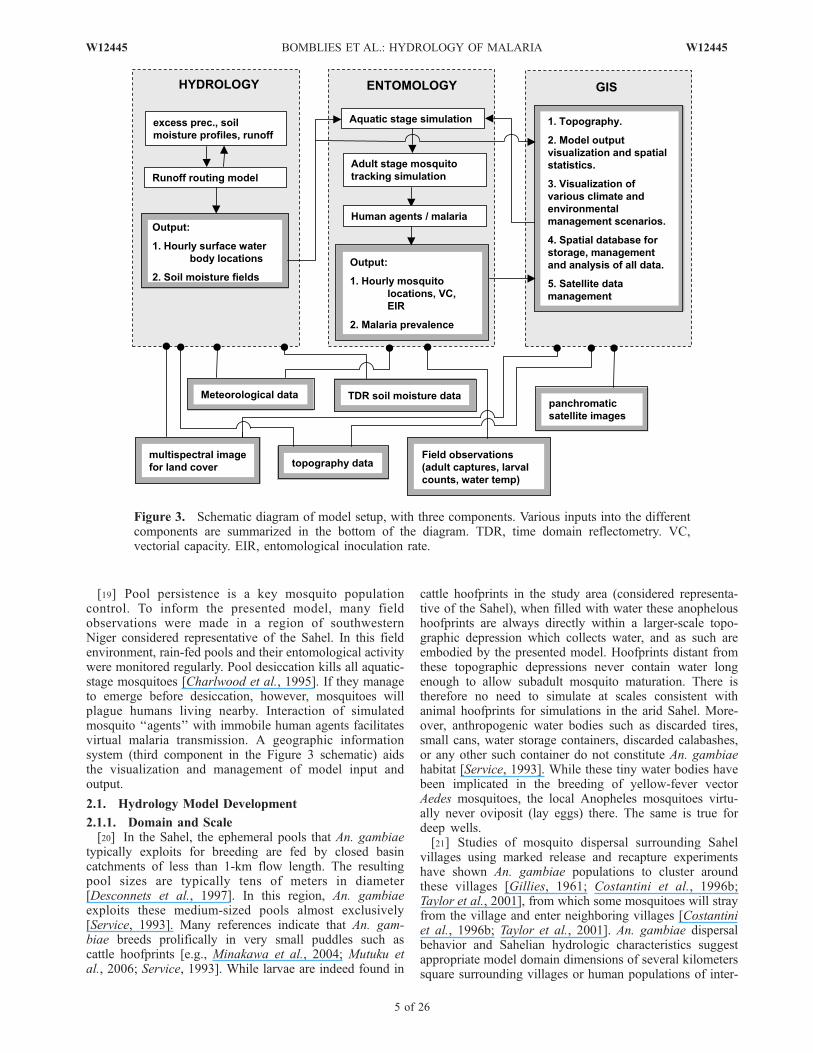
[19] Pool persistence is a key mosquito populationcontrol. To inform the presented model, many fieldobservations were made in a region of southwesternNiger considered representative of the Sahel. In this fieldenvironment, rain-fed pools and their entomological activitywere monitored regularly. Pool desiccation kills all aquatic-stage mosquitoes [Charlwood et al., 1995]. If they manageto emerge before desiccation, however, mosquitoes willplague humans living nearby. Interaction of simulatedmosquito ‘‘agents’’ with immobile human agents facilitatesvirtual malaria transmission. A geographic informationsystem (third component in the Figure 3 schematic) aidsthe visualization and management of model input andoutput.
2.1. Hydrology Model Development
2.1.1. Domain and Scale[20] In the Sahel, the ephemeral pools that An. gambiae
typically exploits for breeding are fed by closed basincatchments of less than 1-km flow length. The resultingpool sizes are typically tens of meters in diameter[Desconnets et al., 1997]. In this region, An. gambiaeexploits these medium-sized pools almost exclusively[Service, 1993]. Many references indicate that An. gam-biae breeds prolifically in very small puddles such ascattle hoofprints [e.g., Minakawa et al., 2004; Mutuku etal., 2006; Service, 1993]. While larvae are indeed found in
cattle hoofprints in the study area (considered representa-tive of the Sahel), when filled with water these anopheloushoofprints are always directly within a larger-scale topo-graphic depression which collects water, and as such areembodied by the presented model. Hoofprints distant fromthese topographic depressions never contain water longenough to allow subadult mosquito maturation. There istherefore no need to simulate at scales consistent withanimal hoofprints for simulations in the arid Sahel. More-over, anthropogenic water bodies such as discarded tires,small cans, water storage containers, discarded calabashes,or any other such container do not constitute An. gambiaehabitat [Service, 1993]. While these tiny water bodies havebeen implicated in the breeding of yellow-fever vectorAedes mosquitoes, the local Anopheles mosquitoes virtu-ally never oviposit (lay eggs) there. The same is true fordeep wells.[21] Studies of mosquito dispersal surrounding Sahel
villages using marked release and recapture experimentshave shown An. gambiae populations to cluster aroundthese villages [Gillies, 1961; Costantini et al., 1996b;Taylor et al., 2001], from which some mosquitoes will strayfrom the village and enter neighboring villages [Costantiniet al., 1996b; Taylor et al., 2001]. An. gambiae dispersalbehavior and Sahelian hydrologic characteristics suggestappropriate model domain dimensions of several kilometerssquare surrounding villages or human populations of inter-
Figure 3. Schematic diagram of model setup, with three components. Various inputs into the differentcomponents are summarized in the bottom of the diagram. TDR, time domain reflectometry. VC,vectorial capacity. EIR, entomological inoculation rate.
W12445 BOMBLIES ET AL.: HYDROLOGY OF MALARIA
5 of 26
W12445
est and a resolution of 10 m. The presented model allowsflexible, user-prescribed fine spatial discretization directlysurrounding the population of interest for detailed poolresolution, and coarser resolutions away from pool locationsin a telescopic mesh refinement. Coarse discretization atthe pool catchments’ upper reaches allows efficient andadequate overland flow simulation. The existence of small-scale pools in distant areas is not expected to influencesignificantly the village anopheline population, and there-fore provides an acceptable compromise, which allows bothsatisfactory overland flow simulation and feasible run times.2.1.2. Overland Flow[22] Pool formation is simulated by distributed flow
routing. A finite difference solution of a diffusion waveapproximation to the St. Venant equations determines rout-ed and pooled water for each time step. Run-on onto down-gradient grid cells combines with available precipitation forthe next iteration of the unsaturated zone model. In thismanner, shallow flow over a spatially variable infiltratingsurface is simulated. Flow velocity is represented by Mann-ing’s equation with distributed roughness parameter n. Theformulation follows that of Lal [1998]. The continuityequation for shallow flow is
@h
@tþ @ huð Þ
@xþ @ hvð Þ
@y� P þ I þ ET ¼ 0; ð1Þ
where u and v are the flow velocities in the x and ydirections, respectively, h is the water depth, P isprecipitation, I is infiltration, and ET is evapotranspiration.[23] The momentum equations for the x and y directions
are
@ huð Þ@t
þ @ u2hð Þ@x
þ @ uvhð Þ@y
þ hg@ hþ zð Þ
@xþ ghSfx ¼ 0; ð2Þ
@ hvð Þ@t
þ @ v2hð Þ@y
þ @ uvhð Þ@x
þ hg@ hþ zð Þ
@yþ ghSfy ¼ 0; ð3Þ
where g is the gravitational acceleration, and Sfx and Sfy arethe friction slopes in the x and y directions, respectively. Forthe diffusion wave approximation, we neglect the first threeterms, which represent inertial effects. We make thereplacement H = h + z for water level above a datum.Equations (2) and (3) then reduce to
@H
@x¼ �Sfx; ð4Þ
@H
@y¼ �Sfy: ð5Þ
Manning’s equation relates flow velocity to friction slopeand flow depth. For the x direction,
u ¼ 1
nh23S
12
fx; ð6Þ
where n is the Manning’s roughness coefficient whichdetermines resistance to overland flow. The y direction
velocity is formulated similarly. Following Lal [1998], wereformulate equation (6) in terms of H and n:
u ¼ � h23
nffiffiffiffiffiffiSfx
p @H
@x¼ �K
h
@H
@x; ð7Þ
v ¼ � h23
nffiffiffiffiffiffiSfy
p @H
@y¼ �K
h
@H
@y; ð8Þ
with K = h53
nffiffiffiffiSf
p .
[24] Equations (1), (4), (5), (7), and (8) are then solvedusing the alternate-direction implicit (ADI) method. Lal[1998] found ADI to be the most efficient solver of severalcommon options. At half time steps, the following equationsare evaluated sequentially:
H*i;j ¼ Hn
i;j þDt
DAKiþ1=
2;j H*
iþ1;j � H*i;j
� �þ Ki�1=
2;j H*
i�1;j � H*i;j
� �h iþ Dt
DAKi;jþ1=
2Hn
i;jþ1 � Hni;j
� �þ Ki;j�1=
2Hn
i;j�1 � Hni;j
� �h iþ P;
ð9Þ
Hnþ1i;j ¼ H*
i;j þDt
DAKiþ1=
2;j H*
iþ1;j � H*i;j
� �þ Ki�1=
2;j H*
i�1;j � H*i;j
� �h iþ Dt
DAKi;jþ1=
2Hnþ1
i;jþ1 � Hnþ1i;j
� �þ Ki;j�1=
2Hnþ1
i;j�1 � Hnþ1i;j
� �h iþ P: ð10Þ
DA is the grid cell area, or DxDy. Hni,j is the flow depth at
the previous time step, H*i,j is the flow depth at a half timestep, and Hn+1
i,j is the updated flow depth after both x and ydirections are solved implicitly. Dt in this formulation ishalf of the model time step. Infiltration and evapotranspira-tion are left out of this formulation because they are updatedin the unsaturated zone model, in a separate modelsubroutine.[25] Topography at very high resolution is a critical
parameter for overland flow simulation and prediction ofpool formation. Topography determines the cell-to-cell bedslope, which is then used to determine intercell flowpotentials [Lal, 1998]. The model uses a digital elevationmodel (DEM) that was derived from a combination of aground topographic survey and Envisat synthetic apertureradar data [Toutin and Gray, 2000]. In addition to topogra-phy, Manning’s n in equation (6) strongly controls thetiming and volume of hydrographs entering topographicdepressions. This roughness parameter depends on thevegetation cover and soil type at the grid cell, and influen-ces overland flow velocities.2.1.3. Land Surface Scheme[26] The model presented borrows heavily from the land
surface scheme LSX of Pollard and Thompson [1995]. Themodel simulates six soil layers and two vegetation layers fora detailed representation of hydrologic processes in thevertical column. LSX simulates momentum, energy, andwater fluxes between the vegetation layers, soil, and theatmosphere. Vegetation type and soil type strongly influ-ence soil moisture profile simulation, and spatially variable
6 of 26
W12445 BOMBLIES ET AL.: HYDROLOGY OF MALARIA W12445
soil and vegetation properties are used to assign roughnessin the runoff routing model. Spatial variability of soilproperties is a key determinant of the endorheic behaviorobserved in typical Sahel catchments [Peugeot et al., 2003].[27] Vertical soil layer thicknesses are assigned to allow
simulation of a low-permeability structural crust commonlyobserved at the land surface in bare soil and sparselyvegetated areas of the Sahel [d’Herbes and Valentin,1997]. Precipitation at each grid cell is partitioned betweenrunoff and infiltration, on the basis of Hortonian runoffprocesses. The resulting infiltration flux is redistributed inthe unsaturated zone with a Richards equation solver, withsoil hydraulic parameters assigned for each layer and gridcell. The Richards equation governs vertical water move-ment through the unsaturated zone, for which the modeluses an implicit solver. The Richards equation is
@q z; tð Þ@t
¼ @
@zKu qð Þ @f q; zð Þ
@zþ Ku qð Þ
� �ð11Þ
where q is soil moisture [cm3 cm�3], Ku(q) is unsaturatedhydraulic conductivity [m s�1], 8(q,z) is head value [m],and z is elevation [m].[28] Several key hydrologic parameters govern the rainfall
partitioning into infiltration and runoff. Saturated hydraulicconductivity and porosity are two critical parameters. Thesoil model subroutine determines unsaturated zone hydraulicconductivity as a function of soil moisture following Camp-bell’s equation [Campbell, 1985]:
K qð Þ ¼ Ks
qqs
2bþ3
; ð12Þ
where q is the volumetric water content, and qs is thevolumetric water content at saturation, (porosity) b is amodel exponent dependent on soil texture, and Ks is thesaturated hydraulic conductivity. The b exponent isintroduced in this formulation as a model parameter, andderives from the moisture release equation [Campbell andNorman, 1998]:
ym ¼ ye
qqs
�b
; ð13Þ
where ym is the matric potential and ye is the air entrypotential. Air entry potential and b exponent are two soilparameters which influence unsaturated zone water redis-tribution, and nominal values are thus assigned on the basisof the observed soil texture in the field following Table 9.1of Campbell and Norman [1998]. In addition, root zone soilwater uptake from transpiration is forced by canopy-levelclimatic variables.2.1.4. Model Inputs[29] Necessary model inputs come from a variety of
sources. The climate data for model forcing can come frommeteorological stations in the field, and/or from regionalclimate model simulations. Meteorologic variable inputs forthe hydrology model are temperature and humidity, windspeed and direction, incoming solar radiation, and precipi-tation. These six variables can be assumed spatially invari-ant over the model domain or can be represented asdistributed rasters, on the basis of either multiple measure-ments or assumptions, to account for the existence ofmosquito microhabitats. Table 1 summarizes all hydrologymodel inputs.2.1.5. Model Operation[30] The hydrology model operates according to the
schematic shown in Figure 3. The overland flow moduleoperates at a small user-defined time step (nominally 1 s),while the unsaturated zone model is stepped at a coarsertime step (nominally 1 h). Vegetation canopy energy andwater redistribution calculations are performed at this timestep as well. The vegetation module tracks evapotranspira-tion and root zone moisture uptake for the various vegetationtypes. This interacts with themodel’s soil water redistributioncomponent, which tracks both soil moisture and temperaturein the vertical column. Routed water depths from theoverland flow module are updated for infiltration and evapo-transpiration losses at each model time step before beingreturned to the overland flow routing subroutine.2.1.6. Model Output[31] Pool depth rasters generated at each model time step
(nominally 1 h) serve as entomology model input. Theloosely coupled model structure derives from the one-waydependence of entomology on hydrology, as well as theneed to calibrate the model components separately. Eachoutput file contains water depths for each model grid cell,based on the user-prescribed grid configuration. Soil mois-
Table 1. Hydrology Model Inputs
Variable Type Remarks
Vegetation distributed supervised classification of multispectral satellite image(e.g., Landsat)
Roughness distributed assigned on the basis of vegetation classificationSoil type distributed supervised classification and knowledge of local soil
compositionsTopography distributed synthetic aperture radar products (e.g., Radarsat) or
other suitable digital elevation model sourcePrecipitation lumped from meteorological station or climate model outputTemperature lumped from meteorological station or climate model outputHumidity lumped from meteorological station or climate model outputWind speed lumped from meteorological station or climate model outputWind direction lumped from meteorological station or climate model outputSW radiation lumped from meteorological station or climate model outputGrid resolution user-defined flexible telescopic mesh refinement grid layout to
accommodate area of interestTime step user-defined different time steps as input for overland flow and
unsaturated zone models
W12445 BOMBLIES ET AL.: HYDROLOGY OF MALARIA
7 of 26
W12445
ture profiles are tracked for each grid cell. Volumetric watercontent time series for user-specified points are also gener-ated as output to allow hydrology model validation usingprofile soil moisture measurements such as time domainreflectometry (TDR) probes.
2.2. Entomology Model Development
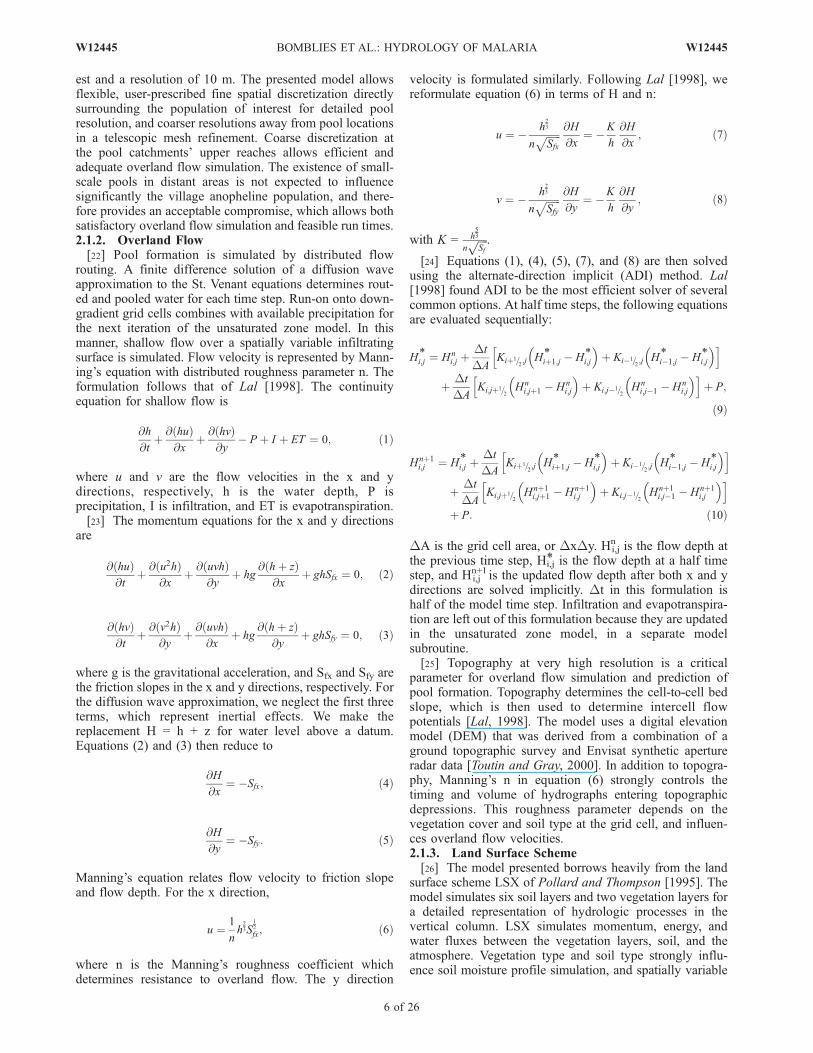
[32] Malaria response to environmental determinants issimulated using individual mosquito and human ‘‘agents.’’Mobile individual mosquito agents behave probabilisticallyaccording to a prescribed set of rules governing dispersaland discrete events (e.g., blood meals, egg laying, etc.), inresponse to their immediate environment. This formulationallows population behavior of both mosquitoes and malariaparasites to emerge on the basis of the individuals’ actions.Characteristics of each mosquito such as location andgonotrophic or infective status are tracked through time.At least two bites are required for a new malaria infection,one for the mosquito to acquire the parasite from an infectedhuman, and a second bite from an uninfected human tocause the secondary infection (see Figure 4). Interactionwith the human population, acquisition of infection, intrin-sic and extrinsic incubation periods (parasite developmenttime in humans and mosquitoes, respectively), and infec-tious bites upon subsequent contact with humans are allsimulated in the described manner. Only female mosquitoesare tracked, because male mosquitoes do not take bloodmeals and therefore play no role in malaria transmission.We assume that male availability for mating is not limiting.2.2.1. Model Input[33] Model input for the entomology component includes
pool water levels from the hydrology model output, as well
as local meteorological conditions, if they are set to varyspatially. Certain aspects of mosquito behavior depend onrelative humidity and temperature, and mosquito dispersal isinfluenced by wind speed and direction, both for physicaldisplacement when wind is very strong, as well as to directplumes of CO2 and human odor from the villages which actas host-seeking cues [Healy and Copland, 1995; Takken andKnols, 1999]. CO2-mediated flight behavior is describedbelow. In addition, aquatic-stage development rates forthe subadult mosquitoes depend on water temperatures[Depinay et al., 2004]. Egg development within an adultmosquito, as well as the sporozoite phase of the plasmodiumparasite, depend on ambient temperature [Detinova, 1962;Craig et al., 1999]. Accordingly, these six variables (airtemperature, water temperature, humidity, wind speed, winddirection, and distributed water depths) are the primaryinputs for the entomology model. Water depth and temper-ature for each grid cell are predicted by the hydrologymodel, and the remaining four can be either field measuredor supplied by climate models.[34] The entomology model input variables temperature
and humidity can be either spatially invariant throughout thedomain, or can be distributed to allow simulation of micro-habitats potentially inhabited by mosquitoes. These micro-habitats, possibly under shady trees or in houses, can offercomfortable refuges to mosquitoes as an alternative to harshambient conditions. The less stressful conditions of suitablemicrohabitats can decrease mortality and temperature var-iations and can influence the parasite extrinsic incubationperiod [Okech et al., 2003]. Both of these relevant micro-habitat-related processes can affect village-scale malaria
Figure 4. Advancement of aquatic stages of mosquitoes, from eggs to different stages of larvae, topupae, and finally to adult emergence. The parasite enters the mosquito’s body at the first infectiousblood meal, which it uses to develop and deposit its first clutch of eggs. Parasite development continueswith a degree-day dependence until the mosquito becomes infectious to humans. Transmission occurswhen the infectious mosquito takes a second blood meal from a different human. Then, the parasite’sintrinsic incubation period begins within the human body. A new mosquito takes a blood meal followingthe intrinsic incubation period and becomes infectious to repeat the transmission cycle.
8 of 26
W12445 BOMBLIES ET AL.: HYDROLOGY OF MALARIA W12445
transmission. Assignment of distributed temperature andhumidity values can be done on the basis of remotelysensed land cover types. However, in the model applicationpresented here, they are assumed spatially invariant.2.2.2. Aquatic-Stage Simulation[35] Aquatic-stage, or subadult, mosquitoes advance
through several stages between eggs and adult mosquitoes.As shown in Figure 4, eggs hatch to become L1, or first-stagelarvae. They then advance through three more larval stages(instars) as they grow and mature, to finally pupate. Pupae donot feed. They remain in this state for approximately two daysbefore emerging as adult mosquitoes.[36] Simulation of aquatic-stage development relies on
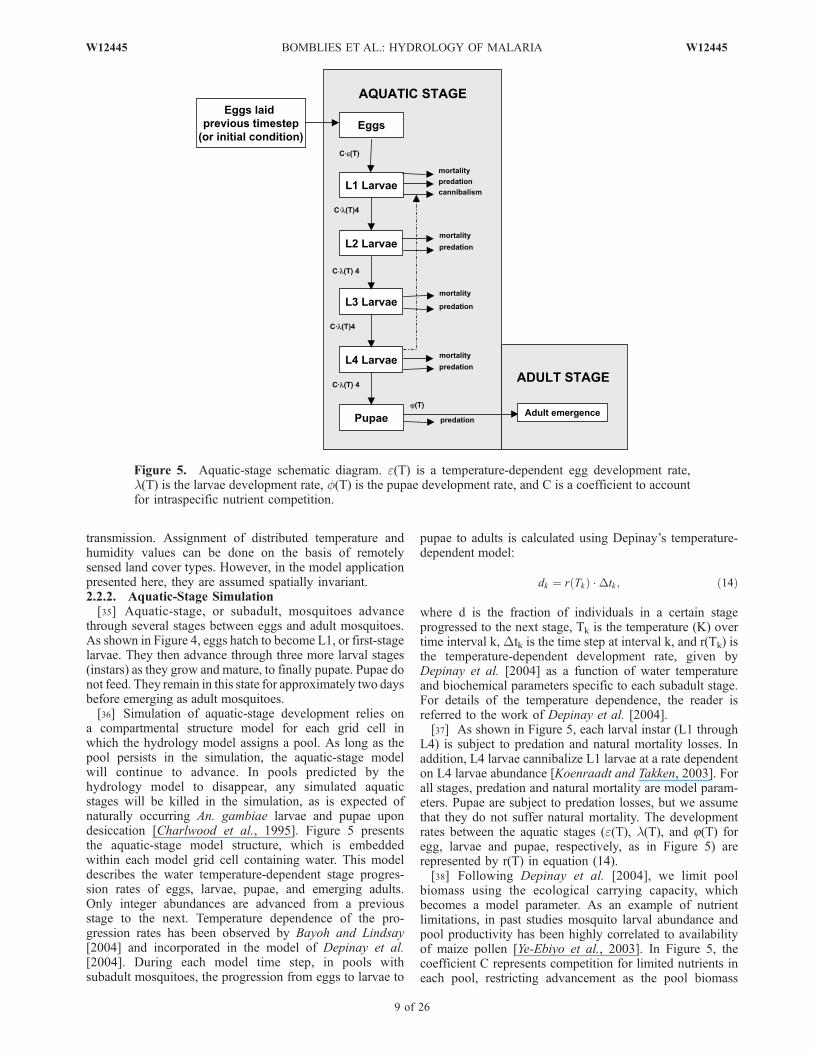
a compartmental structure model for each grid cell inwhich the hydrology model assigns a pool. As long as thepool persists in the simulation, the aquatic-stage modelwill continue to advance. In pools predicted by thehydrology model to disappear, any simulated aquaticstages will be killed in the simulation, as is expected ofnaturally occurring An. gambiae larvae and pupae upondesiccation [Charlwood et al., 1995]. Figure 5 presentsthe aquatic-stage model structure, which is embeddedwithin each model grid cell containing water. This modeldescribes the water temperature-dependent stage progres-sion rates of eggs, larvae, pupae, and emerging adults.Only integer abundances are advanced from a previousstage to the next. Temperature dependence of the pro-gression rates has been observed by Bayoh and Lindsay[2004] and incorporated in the model of Depinay et al.[2004]. During each model time step, in pools withsubadult mosquitoes, the progression from eggs to larvae to
pupae to adults is calculated using Depinay’s temperature-dependent model:
dk ¼ r Tkð Þ �Dtk ; ð14Þ
where d is the fraction of individuals in a certain stageprogressed to the next stage, Tk is the temperature (K) overtime interval k,Dtk is the time step at interval k, and r(Tk) isthe temperature-dependent development rate, given byDepinay et al. [2004] as a function of water temperatureand biochemical parameters specific to each subadult stage.For details of the temperature dependence, the reader isreferred to the work of Depinay et al. [2004].[37] As shown in Figure 5, each larval instar (L1 through
L4) is subject to predation and natural mortality losses. Inaddition, L4 larvae cannibalize L1 larvae at a rate dependenton L4 larvae abundance [Koenraadt and Takken, 2003]. Forall stages, predation and natural mortality are model param-eters. Pupae are subject to predation losses, but we assumethat they do not suffer natural mortality. The developmentrates between the aquatic stages (e(T), l(T), and 8(T) foregg, larvae and pupae, respectively, as in Figure 5) arerepresented by r(T) in equation (14).[38] Following Depinay et al. [2004], we limit pool
biomass using the ecological carrying capacity, whichbecomes a model parameter. As an example of nutrientlimitations, in past studies mosquito larval abundance andpool productivity has been highly correlated to availabilityof maize pollen [Ye-Ebiyo et al., 2003]. In Figure 5, thecoefficient C represents competition for limited nutrients ineach pool, restricting advancement as the pool biomass
Figure 5. Aquatic-stage schematic diagram. e(T) is a temperature-dependent egg development rate,l(T) is the larvae development rate, f(T) is the pupae development rate, and C is a coefficient to accountfor intraspecific nutrient competition.
W12445 BOMBLIES ET AL.: HYDROLOGY OF MALARIA
9 of 26
W12445
approaches the assigned carrying capacity. As in Depinay’smodel, an intraspecific competition coefficient is defined as
C ¼ e� w
e
� �; ð15Þ
where w is the sum of total larval biomass in the pool gridcell, and e is the ecological carrying capacity [mg biomassm�2]. Ecological carrying capacity is an assigned modelparameter and is assumed to be time invariant.[39] Several other factors influence larvae. Pool water
temperatures in excess of 40 degrees result in death oflarvae [Jepson et al., 1947; Depinay et al., 2004]. Inaddition, we assume that oviposition does not occur inpools deeper than a threshold depth [Minakawa et al.,2005]. This is consistent with our own observations thatwave action (which generally occurs in deeper, larger,unvegetated pools) seems to deter larvae, either by waveaction drowning them or by waves discouraging oviposi-tion. Also, deep water in the center of large pools appears tocontain virtually no larvae. In the hydrology simulation,shrinking pools will regularly dry out grid cells at the pooledges as the receding water line causes a retreat of the poolboundaries. As soon as one pool grid cell is predicted tobecome dry, all subadult mosquitoes are simply moved intothe adjacent cells, concentrating larvae and pupae intoremaining pool cells. Clearly, this will impact furtherdevelopment of the remaining subadult mosquitoes throughthe C coefficient of equation (15). Field observations showhigh spatial variability in larval density within each pool.Clusters of subadult mosquitoes populate certain areas. Inthe model, however, larval abundance is constant through-out each pooled grid cell. Within a multicell pool spanningseveral grid cells, the model allows heterogeneity in larvalabundances between adjacent cells. This is consistent withfield observations of spatial variability in larval abundance.2.2.3. Adult-Stage Simulation[40] After emergence from the pools, adult mosquitoes
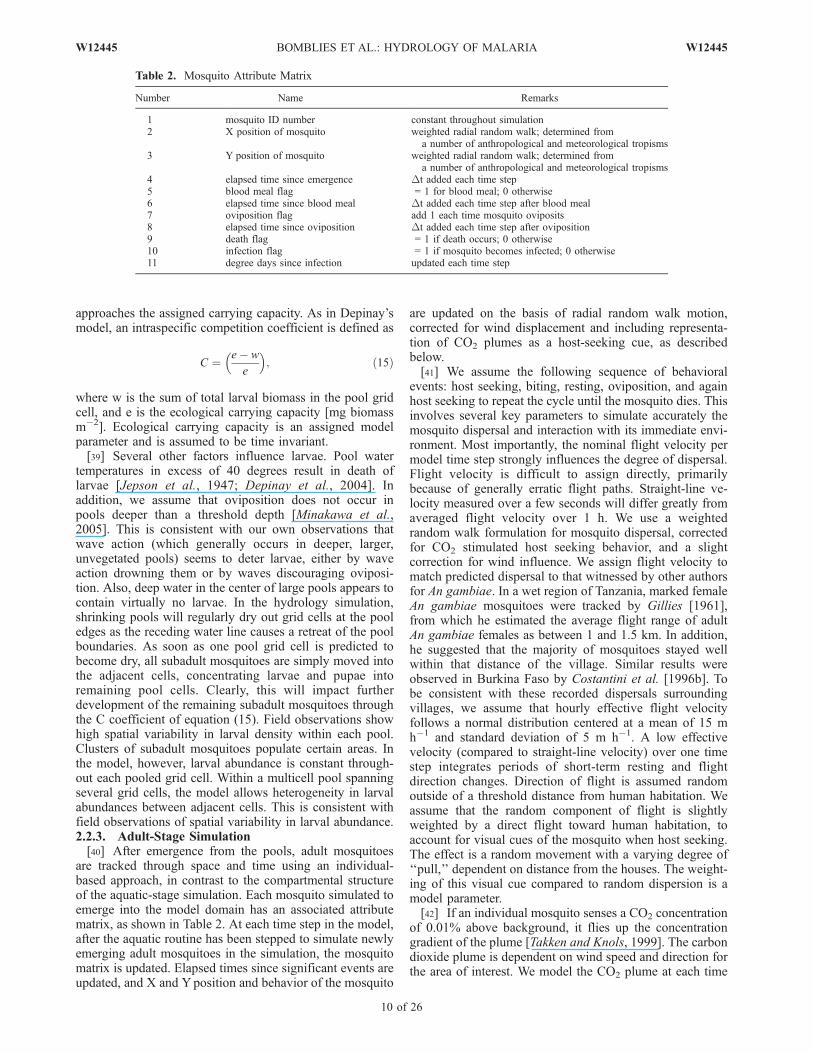
are tracked through space and time using an individual-based approach, in contrast to the compartmental structureof the aquatic-stage simulation. Each mosquito simulated toemerge into the model domain has an associated attributematrix, as shown in Table 2. At each time step in the model,after the aquatic routine has been stepped to simulate newlyemerging adult mosquitoes in the simulation, the mosquitomatrix is updated. Elapsed times since significant events areupdated, and X and Yposition and behavior of the mosquito
are updated on the basis of radial random walk motion,corrected for wind displacement and including representa-tion of CO2 plumes as a host-seeking cue, as describedbelow.[41] We assume the following sequence of behavioral
events: host seeking, biting, resting, oviposition, and againhost seeking to repeat the cycle until the mosquito dies. Thisinvolves several key parameters to simulate accurately themosquito dispersal and interaction with its immediate envi-ronment. Most importantly, the nominal flight velocity permodel time step strongly influences the degree of dispersal.Flight velocity is difficult to assign directly, primarilybecause of generally erratic flight paths. Straight-line ve-locity measured over a few seconds will differ greatly fromaveraged flight velocity over 1 h. We use a weightedrandom walk formulation for mosquito dispersal, correctedfor CO2 stimulated host seeking behavior, and a slightcorrection for wind influence. We assign flight velocity tomatch predicted dispersal to that witnessed by other authorsfor An gambiae. In a wet region of Tanzania, marked femaleAn gambiae mosquitoes were tracked by Gillies [1961],from which he estimated the average flight range of adultAn gambiae females as between 1 and 1.5 km. In addition,he suggested that the majority of mosquitoes stayed wellwithin that distance of the village. Similar results wereobserved in Burkina Faso by Costantini et al. [1996b]. Tobe consistent with these recorded dispersals surroundingvillages, we assume that hourly effective flight velocityfollows a normal distribution centered at a mean of 15 mh�1 and standard deviation of 5 m h�1. A low effectivevelocity (compared to straight-line velocity) over one timestep integrates periods of short-term resting and flightdirection changes. Direction of flight is assumed randomoutside of a threshold distance from human habitation. Weassume that the random component of flight is slightlyweighted by a direct flight toward human habitation, toaccount for visual cues of the mosquito when host seeking.The effect is a random movement with a varying degree of‘‘pull,’’ dependent on distance from the houses. The weight-ing of this visual cue compared to random dispersion is amodel parameter.[42] If an individual mosquito senses a CO2 concentration
of 0.01% above background, it flies up the concentrationgradient of the plume [Takken and Knols, 1999]. The carbondioxide plume is dependent on wind speed and direction forthe area of interest. We model the CO2 plume at each time
Table 2. Mosquito Attribute Matrix
Number Name Remarks
1 mosquito ID number constant throughout simulation2 X position of mosquito weighted radial random walk; determined from
a number of anthropological and meteorological tropisms3 Y position of mosquito weighted radial random walk; determined from
a number of anthropological and meteorological tropisms4 elapsed time since emergence Dt added each time step5 blood meal flag = 1 for blood meal; 0 otherwise6 elapsed time since blood meal Dt added each time step after blood meal7 oviposition flag add 1 each time mosquito oviposits8 elapsed time since oviposition Dt added each time step after oviposition9 death flag = 1 if death occurs; 0 otherwise10 infection flag = 1 if mosquito becomes infected; 0 otherwise11 degree days since infection updated each time step
10 of 26
W12445 BOMBLIES ET AL.: HYDROLOGY OF MALARIA W12445
step, with exhaling human and animal agents in the modelgrid as CO2 sources. This is done using the Gaussiandispersion equation:
CCO2 ¼Q
2puwsysz
exp � 1
2
y2
s2y
!
� exp � 1
2
z� Heð Þ2
s2z
!þ exp � 1
2
zþ Heð Þ2
s2z
!" #; ð16Þ
where CCO2 is the concentration of CO2 [g m�3] at anyposition x meters downwind of the source, y meterscrosswind of the source, and z meters above the groundlevel; Q is the carbon dioxide exhalation rate [g s�1]; uw isthe horizontal wind velocity along the plume centerline [ms�1]; He is the height of the emission plume centerlineabove the ground [m]; sz is the vertical standard deviationof the emission distribution [m]; and sy is the horizontalstandard deviation of the emission distribution [m].[43] The horizontal and vertical dispersion is a function of
atmospheric stability conditions and downwind distance[Smith, 1968]. We assume that stable atmospheric condi-tions prevail during the nighttime periods of high mosquitoactivity, owing to radiative cooling at the land surface underclear skies. From the work of Smith [1968], the horizontaland vertical dispersions for such conditions are given by
sy ¼ 0:31x0:71
sz ¼ 0:06x0:71:ð17Þ
Furthermore, we assume a height of 1.0 m at whichmosquitoes sense the plume, and an emission height of1.5 m. The source emission of carbon dioxide exhaled isassumed to be 275 mL min�1 per human, and that emittedby livestock is estimated at 3925 mL min�1 [Kinsman et al.,1995]. The concentration of carbon dioxide at each timestep and position in the model domain is calculated as thesum of the contributions of all exhaling members of thecommunity. The plume dimensions and directions vary withwind speed and direction, and mosquito activity response toCO2 cues therefore varies strongly throughout the modeldomain. The plume is always oriented directly downwind.[44] Anopheles gambiae s.l. is nocturnal in feeding and
oviposition habits [Haddow, 1954]. The model simulatesthe diurnal cycle, and allows mosquito activity only duringthe evening and nighttime hours. Anophelines are assumedto rest during the day, either in houses or in nearbyvegetation.[45] Bed net use is represented by a simple parameteri-
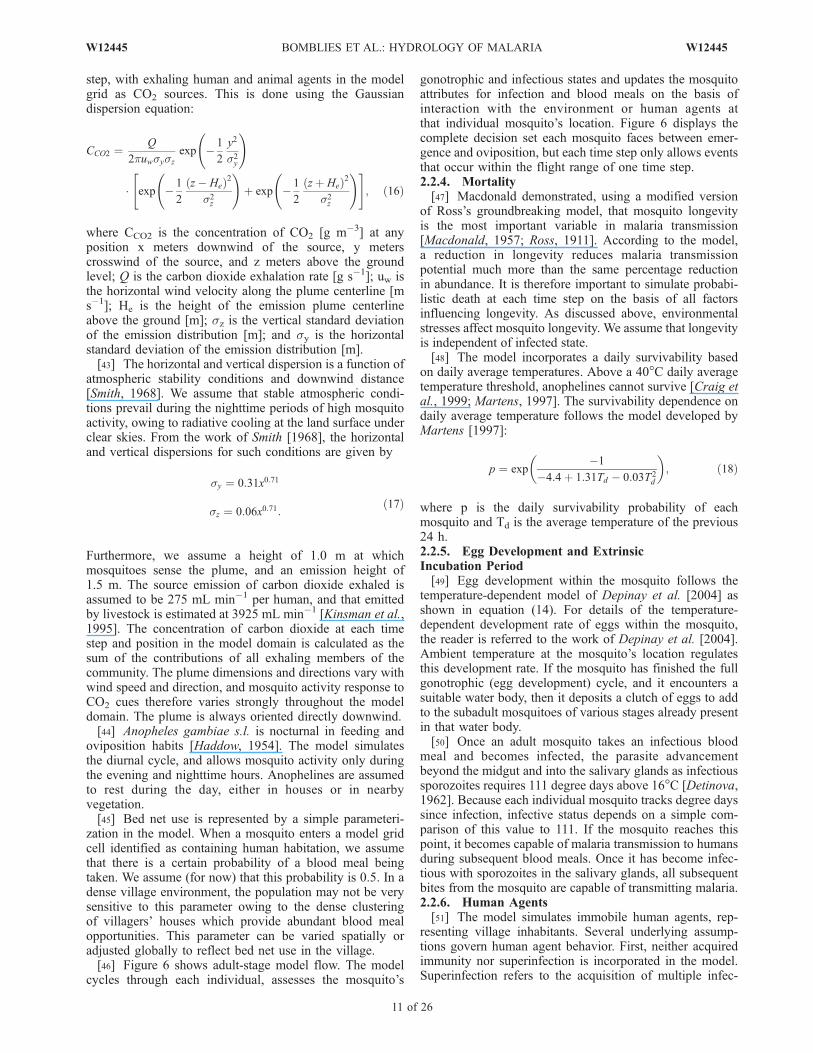
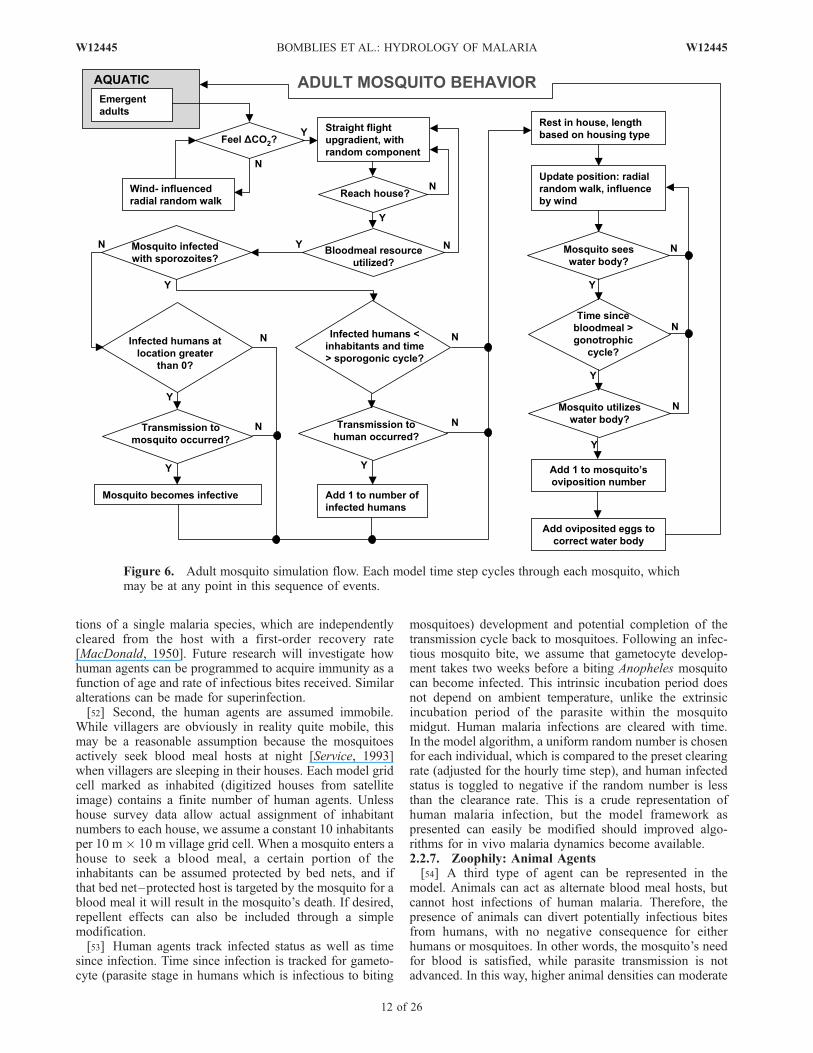
zation in the model. When a mosquito enters a model gridcell identified as containing human habitation, we assumethat there is a certain probability of a blood meal beingtaken. We assume (for now) that this probability is 0.5. In adense village environment, the population may not be verysensitive to this parameter owing to the dense clusteringof villagers’ houses which provide abundant blood mealopportunities. This parameter can be varied spatially oradjusted globally to reflect bed net use in the village.[46] Figure 6 shows adult-stage model flow. The model
cycles through each individual, assesses the mosquito’s
gonotrophic and infectious states and updates the mosquitoattributes for infection and blood meals on the basis ofinteraction with the environment or human agents atthat individual mosquito’s location. Figure 6 displays thecomplete decision set each mosquito faces between emer-gence and oviposition, but each time step only allows eventsthat occur within the flight range of one time step.2.2.4. Mortality[47] Macdonald demonstrated, using a modified version
of Ross’s groundbreaking model, that mosquito longevityis the most important variable in malaria transmission[Macdonald, 1957; Ross, 1911]. According to the model,a reduction in longevity reduces malaria transmissionpotential much more than the same percentage reductionin abundance. It is therefore important to simulate probabi-listic death at each time step on the basis of all factorsinfluencing longevity. As discussed above, environmentalstresses affect mosquito longevity. We assume that longevityis independent of infected state.[48] The model incorporates a daily survivability based
on daily average temperatures. Above a 40�C daily averagetemperature threshold, anophelines cannot survive [Craig etal., 1999; Martens, 1997]. The survivability dependence ondaily average temperature follows the model developed byMartens [1997]:
p ¼ exp�1
�4:4þ 1:31Td � 0:03T2d
; ð18Þ
where p is the daily survivability probability of eachmosquito and Td is the average temperature of the previous24 h.2.2.5. Egg Development and ExtrinsicIncubation Period[49] Egg development within the mosquito follows the
temperature-dependent model of Depinay et al. [2004] asshown in equation (14). For details of the temperature-dependent development rate of eggs within the mosquito,the reader is referred to the work of Depinay et al. [2004].Ambient temperature at the mosquito’s location regulatesthis development rate. If the mosquito has finished the fullgonotrophic (egg development) cycle, and it encounters asuitable water body, then it deposits a clutch of eggs to addto the subadult mosquitoes of various stages already presentin that water body.[50] Once an adult mosquito takes an infectious blood
meal and becomes infected, the parasite advancementbeyond the midgut and into the salivary glands as infectioussporozoites requires 111 degree days above 16�C [Detinova,1962]. Because each individual mosquito tracks degree dayssince infection, infective status depends on a simple com-parison of this value to 111. If the mosquito reaches thispoint, it becomes capable of malaria transmission to humansduring subsequent blood meals. Once it has become infec-tious with sporozoites in the salivary glands, all subsequentbites from the mosquito are capable of transmitting malaria.2.2.6. Human Agents[51] The model simulates immobile human agents, rep-
resenting village inhabitants. Several underlying assump-tions govern human agent behavior. First, neither acquiredimmunity nor superinfection is incorporated in the model.Superinfection refers to the acquisition of multiple infec-
W12445 BOMBLIES ET AL.: HYDROLOGY OF MALARIA
11 of 26
W12445
tions of a single malaria species, which are independentlycleared from the host with a first-order recovery rate[MacDonald, 1950]. Future research will investigate howhuman agents can be programmed to acquire immunity as afunction of age and rate of infectious bites received. Similaralterations can be made for superinfection.[52] Second, the human agents are assumed immobile.
While villagers are obviously in reality quite mobile, thismay be a reasonable assumption because the mosquitoesactively seek blood meal hosts at night [Service, 1993]when villagers are sleeping in their houses. Each model gridcell marked as inhabited (digitized houses from satelliteimage) contains a finite number of human agents. Unlesshouse survey data allow actual assignment of inhabitantnumbers to each house, we assume a constant 10 inhabitantsper 10 m 10 m village grid cell. When a mosquito enters ahouse to seek a blood meal, a certain portion of theinhabitants can be assumed protected by bed nets, and ifthat bed net–protected host is targeted by the mosquito for ablood meal it will result in the mosquito’s death. If desired,repellent effects can also be included through a simplemodification.[53] Human agents track infected status as well as time
since infection. Time since infection is tracked for gameto-cyte (parasite stage in humans which is infectious to biting
mosquitoes) development and potential completion of thetransmission cycle back to mosquitoes. Following an infec-tious mosquito bite, we assume that gametocyte develop-ment takes two weeks before a biting Anopheles mosquitocan become infected. This intrinsic incubation period doesnot depend on ambient temperature, unlike the extrinsicincubation period of the parasite within the mosquitomidgut. Human malaria infections are cleared with time.In the model algorithm, a uniform random number is chosenfor each individual, which is compared to the preset clearingrate (adjusted for the hourly time step), and human infectedstatus is toggled to negative if the random number is lessthan the clearance rate. This is a crude representation ofhuman malaria infection, but the model framework aspresented can easily be modified should improved algo-rithms for in vivo malaria dynamics become available.2.2.7. Zoophily: Animal Agents[54] A third type of agent can be represented in the
model. Animals can act as alternate blood meal hosts, butcannot host infections of human malaria. Therefore, thepresence of animals can divert potentially infectious bitesfrom humans, with no negative consequence for eitherhumans or mosquitoes. In other words, the mosquito’s needfor blood is satisfied, while parasite transmission is notadvanced. In this way, higher animal densities can moderate
Figure 6. Adult mosquito simulation flow. Each model time step cycles through each mosquito, whichmay be at any point in this sequence of events.
12 of 26
W12445 BOMBLIES ET AL.: HYDROLOGY OF MALARIA W12445
malaria transmission intensity in a village. Anopheles gam-biae s.s. and An. arabiensis are predominantly anthropo-philic, greatly preferring human blood to animal blood.There is some variation in anthropophily between the twomalaria vectors simulated in the model, with An gambiaesensu stricto showing greater preference for human bloodmeals [Coluzzi et al., 1979] and An. arabiensis showing lessdiscriminating behavior. In West Africa, studies have shownAn. arabiensis to be predominantly anthropophilic, exceptwhen near abundant alternative hosts, particularly cows[Coluzzi et al., 1979; Lindsay et al., 1993]. However, thedegree of anthropophily in An. arabiensis can vary signif-icantly by region, as evidenced by a finding of virtuallycomplete zoophily in Madagascar [Duchemin et al., 2001].Exact levels of anthopophilic behavior are unknown insouthwestern Niger. In the Sahel, animals are often foundwithin the village at a low density where people keep theirlivestock near their homes, or near some of the largest waterbodies at a higher density. Animal agents’ locations areuser-prescribed and are assumed immobile. The density pergrid cell is a model parameter.
3. Field Data
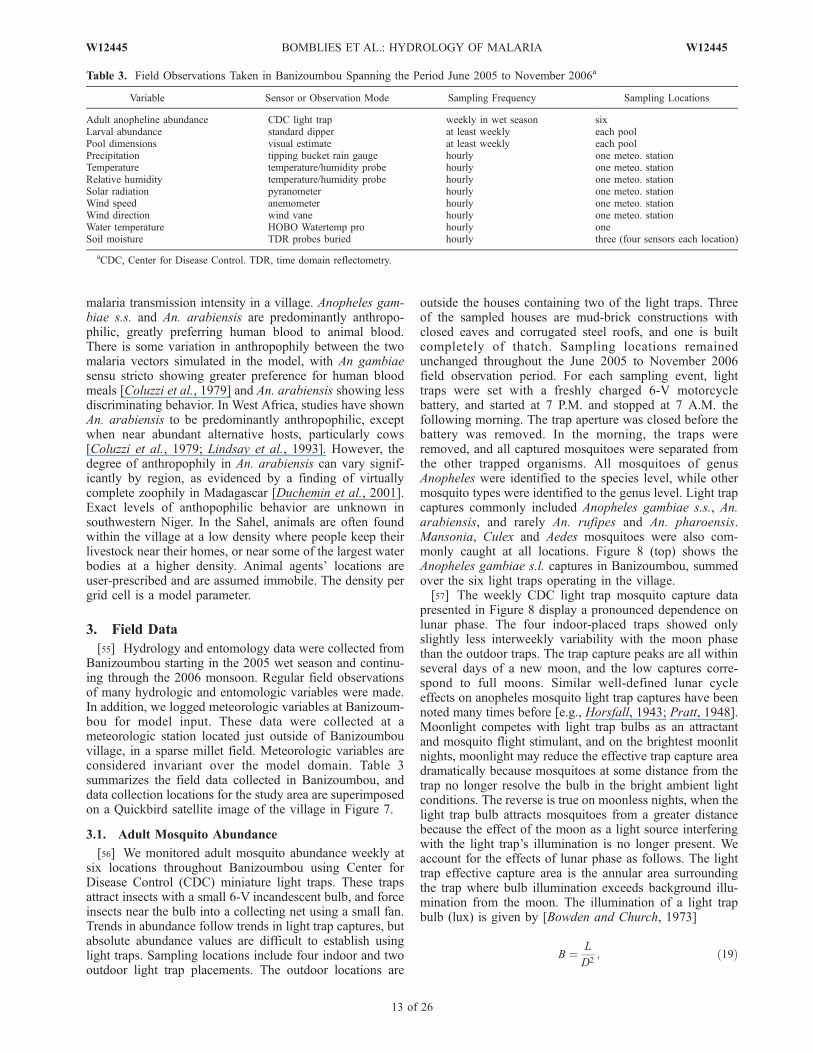
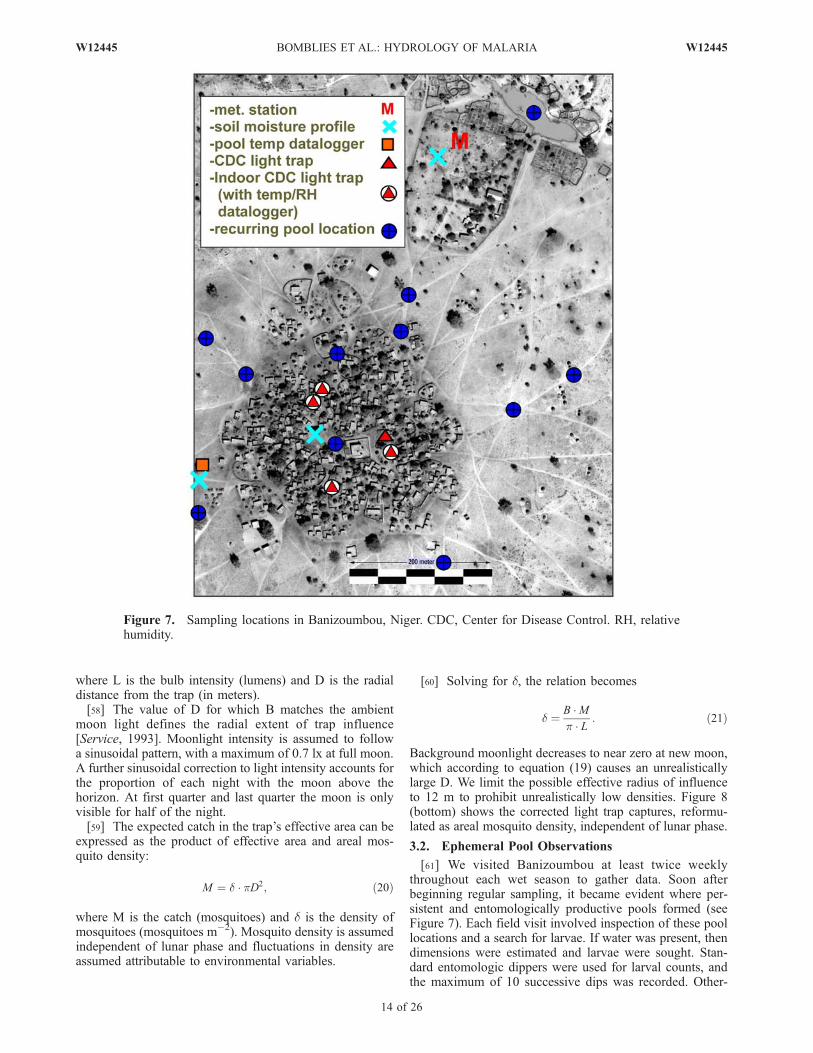
[55] Hydrology and entomology data were collected fromBanizoumbou starting in the 2005 wet season and continu-ing through the 2006 monsoon. Regular field observationsof many hydrologic and entomologic variables were made.In addition, we logged meteorologic variables at Banizoum-bou for model input. These data were collected at ameteorologic station located just outside of Banizoumbouvillage, in a sparse millet field. Meteorologic variables areconsidered invariant over the model domain. Table 3summarizes the field data collected in Banizoumbou, anddata collection locations for the study area are superimposedon a Quickbird satellite image of the village in Figure 7.
3.1. Adult Mosquito Abundance
[56] We monitored adult mosquito abundance weekly atsix locations throughout Banizoumbou using Center forDisease Control (CDC) miniature light traps. These trapsattract insects with a small 6-V incandescent bulb, and forceinsects near the bulb into a collecting net using a small fan.Trends in abundance follow trends in light trap captures, butabsolute abundance values are difficult to establish usinglight traps. Sampling locations include four indoor and twooutdoor light trap placements. The outdoor locations are
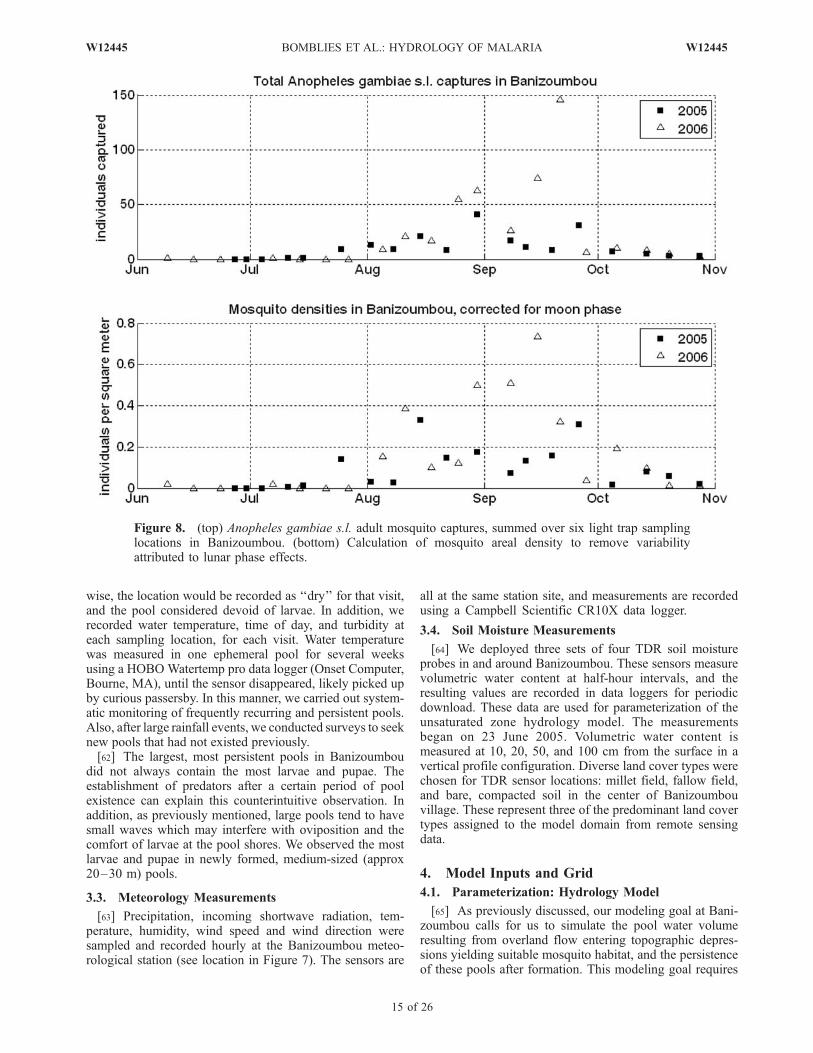
outside the houses containing two of the light traps. Threeof the sampled houses are mud-brick constructions withclosed eaves and corrugated steel roofs, and one is builtcompletely of thatch. Sampling locations remainedunchanged throughout the June 2005 to November 2006field observation period. For each sampling event, lighttraps were set with a freshly charged 6-V motorcyclebattery, and started at 7 P.M. and stopped at 7 A.M. thefollowing morning. The trap aperture was closed before thebattery was removed. In the morning, the traps wereremoved, and all captured mosquitoes were separated fromthe other trapped organisms. All mosquitoes of genusAnopheles were identified to the species level, while othermosquito types were identified to the genus level. Light trapcaptures commonly included Anopheles gambiae s.s., An.arabiensis, and rarely An. rufipes and An. pharoensis.Mansonia, Culex and Aedes mosquitoes were also com-monly caught at all locations. Figure 8 (top) shows theAnopheles gambiae s.l. captures in Banizoumbou, summedover the six light traps operating in the village.[57] The weekly CDC light trap mosquito capture data
presented in Figure 8 display a pronounced dependence onlunar phase. The four indoor-placed traps showed onlyslightly less interweekly variability with the moon phasethan the outdoor traps. The trap capture peaks are all withinseveral days of a new moon, and the low captures corre-spond to full moons. Similar well-defined lunar cycleeffects on anopheles mosquito light trap captures have beennoted many times before [e.g., Horsfall, 1943; Pratt, 1948].Moonlight competes with light trap bulbs as an attractantand mosquito flight stimulant, and on the brightest moonlitnights, moonlight may reduce the effective trap capture areadramatically because mosquitoes at some distance from thetrap no longer resolve the bulb in the bright ambient lightconditions. The reverse is true on moonless nights, when thelight trap bulb attracts mosquitoes from a greater distancebecause the effect of the moon as a light source interferingwith the light trap’s illumination is no longer present. Weaccount for the effects of lunar phase as follows. The lighttrap effective capture area is the annular area surroundingthe trap where bulb illumination exceeds background illu-mination from the moon. The illumination of a light trapbulb (lux) is given by [Bowden and Church, 1973]
B ¼ L
D2; ð19Þ
Table 3. Field Observations Taken in Banizoumbou Spanning the Period June 2005 to November 2006a
Variable Sensor or Observation Mode Sampling Frequency Sampling Locations
Adult anopheline abundance CDC light trap weekly in wet season sixLarval abundance standard dipper at least weekly each poolPool dimensions visual estimate at least weekly each poolPrecipitation tipping bucket rain gauge hourly one meteo. stationTemperature temperature/humidity probe hourly one meteo. stationRelative humidity temperature/humidity probe hourly one meteo. stationSolar radiation pyranometer hourly one meteo. stationWind speed anemometer hourly one meteo. stationWind direction wind vane hourly one meteo. stationWater temperature HOBO Watertemp pro hourly oneSoil moisture TDR probes buried hourly three (four sensors each location)
aCDC, Center for Disease Control. TDR, time domain reflectometry.
W12445 BOMBLIES ET AL.: HYDROLOGY OF MALARIA
13 of 26
W12445
where L is the bulb intensity (lumens) and D is the radialdistance from the trap (in meters).[58] The value of D for which B matches the ambient
moon light defines the radial extent of trap influence[Service, 1993]. Moonlight intensity is assumed to followa sinusoidal pattern, with a maximum of 0.7 lx at full moon.A further sinusoidal correction to light intensity accounts forthe proportion of each night with the moon above thehorizon. At first quarter and last quarter the moon is onlyvisible for half of the night.[59] The expected catch in the trap’s effective area can be
expressed as the product of effective area and areal mos-quito density:
M ¼ d � pD2; ð20Þ
where M is the catch (mosquitoes) and d is the density ofmosquitoes (mosquitoes m�2). Mosquito density is assumedindependent of lunar phase and fluctuations in density areassumed attributable to environmental variables.
[60] Solving for d, the relation becomes
d ¼ B �Mp � L : ð21Þ
Background moonlight decreases to near zero at new moon,which according to equation (19) causes an unrealisticallylarge D. We limit the possible effective radius of influenceto 12 m to prohibit unrealistically low densities. Figure 8(bottom) shows the corrected light trap captures, reformu-lated as areal mosquito density, independent of lunar phase.
3.2. Ephemeral Pool Observations
[61] We visited Banizoumbou at least twice weeklythroughout each wet season to gather data. Soon afterbeginning regular sampling, it became evident where per-sistent and entomologically productive pools formed (seeFigure 7). Each field visit involved inspection of these poollocations and a search for larvae. If water was present, thendimensions were estimated and larvae were sought. Stan-dard entomologic dippers were used for larval counts, andthe maximum of 10 successive dips was recorded. Other-
Figure 7. Sampling locations in Banizoumbou, Niger. CDC, Center for Disease Control. RH, relativehumidity.
14 of 26
W12445 BOMBLIES ET AL.: HYDROLOGY OF MALARIA W12445
wise, the location would be recorded as ‘‘dry’’ for that visit,and the pool considered devoid of larvae. In addition, werecorded water temperature, time of day, and turbidity ateach sampling location, for each visit. Water temperaturewas measured in one ephemeral pool for several weeksusing a HOBOWatertemp pro data logger (Onset Computer,Bourne, MA), until the sensor disappeared, likely picked upby curious passersby. In this manner, we carried out system-atic monitoring of frequently recurring and persistent pools.Also, after large rainfall events, we conducted surveys to seeknew pools that had not existed previously.[62] The largest, most persistent pools in Banizoumbou
did not always contain the most larvae and pupae. Theestablishment of predators after a certain period of poolexistence can explain this counterintuitive observation. Inaddition, as previously mentioned, large pools tend to havesmall waves which may interfere with oviposition and thecomfort of larvae at the pool shores. We observed the mostlarvae and pupae in newly formed, medium-sized (approx20–30 m) pools.
3.3. Meteorology Measurements
[63] Precipitation, incoming shortwave radiation, tem-perature, humidity, wind speed and wind direction weresampled and recorded hourly at the Banizoumbou meteo-rological station (see location in Figure 7). The sensors are
all at the same station site, and measurements are recordedusing a Campbell Scientific CR10X data logger.
3.4. Soil Moisture Measurements
[64] We deployed three sets of four TDR soil moistureprobes in and around Banizoumbou. These sensors measurevolumetric water content at half-hour intervals, and theresulting values are recorded in data loggers for periodicdownload. These data are used for parameterization of theunsaturated zone hydrology model. The measurementsbegan on 23 June 2005. Volumetric water content ismeasured at 10, 20, 50, and 100 cm from the surface in avertical profile configuration. Diverse land cover types werechosen for TDR sensor locations: millet field, fallow field,and bare, compacted soil in the center of Banizoumbouvillage. These represent three of the predominant land covertypes assigned to the model domain from remote sensingdata.
4. Model Inputs and Grid
4.1. Parameterization: Hydrology Model
[65] As previously discussed, our modeling goal at Bani-zoumbou calls for us to simulate the pool water volumeresulting from overland flow entering topographic depres-sions yielding suitable mosquito habitat, and the persistenceof these pools after formation. This modeling goal requires
Figure 8. (top) Anopheles gambiae s.l. adult mosquito captures, summed over six light trap samplinglocations in Banizoumbou. (bottom) Calculation of mosquito areal density to remove variabilityattributed to lunar phase effects.
W12445 BOMBLIES ET AL.: HYDROLOGY OF MALARIA
15 of 26
W12445
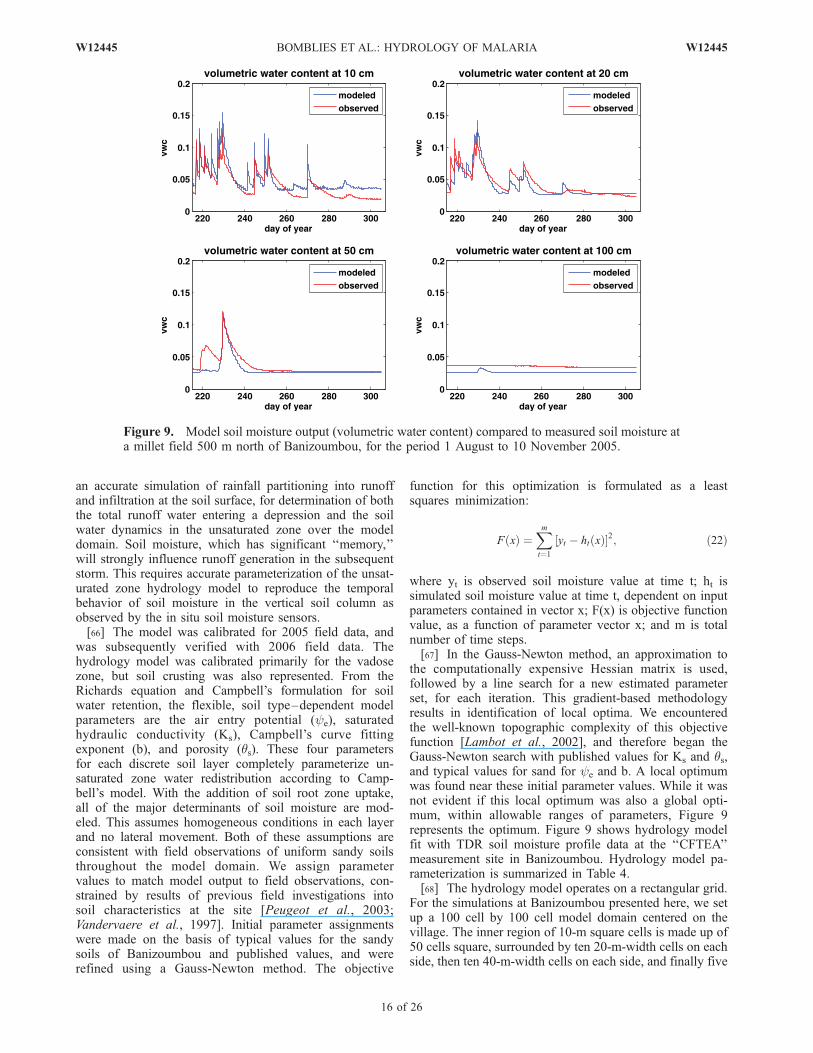
an accurate simulation of rainfall partitioning into runoffand infiltration at the soil surface, for determination of boththe total runoff water entering a depression and the soilwater dynamics in the unsaturated zone over the modeldomain. Soil moisture, which has significant ‘‘memory,’’will strongly influence runoff generation in the subsequentstorm. This requires accurate parameterization of the unsat-urated zone hydrology model to reproduce the temporalbehavior of soil moisture in the vertical soil column asobserved by the in situ soil moisture sensors.[66] The model was calibrated for 2005 field data, and
was subsequently verified with 2006 field data. Thehydrology model was calibrated primarily for the vadosezone, but soil crusting was also represented. From theRichards equation and Campbell’s formulation for soilwater retention, the flexible, soil type–dependent modelparameters are the air entry potential (ye), saturatedhydraulic conductivity (Ks), Campbell’s curve fittingexponent (b), and porosity (qs). These four parametersfor each discrete soil layer completely parameterize un-saturated zone water redistribution according to Camp-bell’s model. With the addition of soil root zone uptake,all of the major determinants of soil moisture are mod-eled. This assumes homogeneous conditions in each layerand no lateral movement. Both of these assumptions areconsistent with field observations of uniform sandy soilsthroughout the model domain. We assign parametervalues to match model output to field observations, con-strained by results of previous field investigations intosoil characteristics at the site [Peugeot et al., 2003;Vandervaere et al., 1997]. Initial parameter assignmentswere made on the basis of typical values for the sandysoils of Banizoumbou and published values, and wererefined using a Gauss-Newton method. The objective
function for this optimization is formulated as a leastsquares minimization:
F xð Þ ¼Xmt¼1
yt � ht xð Þ½ �2; ð22Þ
where yt is observed soil moisture value at time t; ht issimulated soil moisture value at time t, dependent on inputparameters contained in vector x; F(x) is objective functionvalue, as a function of parameter vector x; and m is totalnumber of time steps.[67] In the Gauss-Newton method, an approximation to
the computationally expensive Hessian matrix is used,followed by a line search for a new estimated parameterset, for each iteration. This gradient-based methodologyresults in identification of local optima. We encounteredthe well-known topographic complexity of this objectivefunction [Lambot et al., 2002], and therefore began theGauss-Newton search with published values for Ks and qs,and typical values for sand for ye and b. A local optimumwas found near these initial parameter values. While it wasnot evident if this local optimum was also a global opti-mum, within allowable ranges of parameters, Figure 9represents the optimum. Figure 9 shows hydrology modelfit with TDR soil moisture profile data at the ‘‘CFTEA’’measurement site in Banizoumbou. Hydrology model pa-rameterization is summarized in Table 4.[68] The hydrology model operates on a rectangular grid.
For the simulations at Banizoumbou presented here, we setup a 100 cell by 100 cell model domain centered on thevillage. The inner region of 10-m square cells is made up of50 cells square, surrounded by ten 20-m-width cells on eachside, then ten 40-m-width cells on each side, and finally five
Figure 9. Model soil moisture output (volumetric water content) compared to measured soil moisture ata millet field 500 m north of Banizoumbou, for the period 1 August to 10 November 2005.
16 of 26
W12445 BOMBLIES ET AL.: HYDROLOGY OF MALARIA W12445
cells around the outside of 80-m width. Thus, the totalmodel domain has dimensions 2.5 km 2.5 km.[69] A land cover class was assigned to each cell. This
was done by supervised classification of a Landsat 7multispectral image [Boyer, 2003]. In the vicinity of Bani-zoumbou, the dominant land cover types of millet field,fallow field, and tiger bush shrubland were identified andassigned to each grid cell to parameterize root zone hydrol-ogy, transpiration, and surface roughness.
4.2. Parameterization: Entomology Model
[70] Table 5 summarizes entomological model parametersfor the Banizoumbou simulation. Subadult-stage modelparameterization generally follows that of Depinay et al.[2004]. The subadult model parameter values presented inTable 5 are chosen on the basis of other published modelswithout field verification at Banizoumbou (e.g., ecologicalcarrying capacity). Model parameterization was constantbetween the two years, so potential errors in some param-eters are equally applied to the two years. A sensitivityanalysis was performed for each parameter in Table 5, and
its influence on peak mosquito abundance is represented inTable 5.[71] On the basis of field observations of presence of
cows, goats, and sheep near residences in Banizoumbou, wesimulate one animal per village grid cell as a source ofblood meals. Because we do not distinguish between An.gambiae s.s. and An. arabiensis as mosquito agents in themodel, we assign a 10% chance of a blood meal beingtaken, should a blood-seeking mosquito encounter an ani-mal. This value reflects the dominance of anthropophilicAn. gambiae s.s. and the greater availability of human bloodmeals. Outside of village areas, for modeling purposes weassume there are no animals available for blood meals. Thisis supported by our observation that during the malariatransmission season, villagers prevent animals from roam-ing freely because they damage crops.[72] In December 2005, Niger was the subject of a
nationwide insecticide-treated bed net (ITN) distributionprogram. All families with children under 6 in Niger weregiven a free ITN from the program [Loewenberg, 2006]. In
Table 5. Entomology Model Parameterization
Variable Nominal Value Units Referencea Sensitivityb
Aquatic-Stage SimulationCannibalism rate 0.0008 h�1 7 mediumNumber of eggs lain per oviposition 150 4 lowEgg death rate 0.001 h�1 none very lowWeight of first-stage larvae 0.02 mg none lowWeight of stage 2 larvae 0.16 mg none mediumWeight of stage 3 larvae 0.30 mg none mediumWeight of stage 4 larvae 0.45 mg none lowLag time for predators to establish 240 h 2 lowCarrying capacity of pools 300 mg m�2 2 lowLarvae death rate 0.005 h�1 6 very lowMaximum predation rate for larvae 0.006 h�1 2 mediumPupae predation rate 0.005 h�1 none very low
Adult Mosquito Simulation and Human IndividualsHuman infection clearing rate 0.0005 h�1 6 very lowDegree days above 18�C necessary for sporozoites 111 deg-day 3 very lowProbability that a mosquito takes a blood meal 0.07 none lowAverage mosquito flight velocity 15 m h�1 1 lowTime required for gametocyte development 336 h 6 very lowWeighting of random walk versus straight line 0.2 none mediumResting time 24 h none mediumThreshold distance for visual cues 15 m 5 lowUtilization probability of water 0.95 none low
aReferences are as follows: 1, Costantini et al. [1996b]; 2, Depinay et al. [2004]; 3, Detinova [1962]; 4, Detinova and Gillies[1964]; 5, Gillies [1980]; 6, Hoshen and Morse [2004]; 7, Koenraadt and Takken [2003].
bParameter sensitivity gauged by maximum simulated abundance.
Table 4. Hydrology Model Parameters, Including Saturated Hydraulic Conductivity Ks, Porosity qs, Campbell’s
‘‘b’’ Exponent, Air Entry Potential Ye, and Manning’s na
Surface Crust
Parameter Subsoil, All Classes Millet Field Fallow Pool Bottom
Ks 5.0 10�2 mm s�1b 5.5 10�4 mm s�1 1.9 10�3 mm s�1b 1.7 10�4 mm s�1
qs 0.3b 0.25 0.3b 0.3B 2.9 6.0 6.0 7.6Ye �0.98 J kg�1 �2.84 J kg�1 �2.84 J kg�1 �3.63 J kg�1
N NA 0.12c 0.17c 0.05
aWe use published parameters (when possible) for nominal values, which have been fine-tuned using a Gauss-Newtonparameter estimation technique.
bFrom Vandervaere et al. [1997].cFrom Desconnets et al. [1996].
W12445 BOMBLIES ET AL.: HYDROLOGY OF MALARIA
17 of 26
W12445
Banizoumbou, we noted that 20% of all households wereprotected by an ITN as a result of the December 2005 bednet distribution. The permethrin-treated bed nets have aknockdown killing effect on mosquitoes attempting to feedon a sleeper under the net, and the resulting dramaticreduction in average daily survivability of a mosquitopopulation makes ITNs highly effective for malaria control.We simulate the presence of bed nets in 2006 by killing apercentage of host-seeking mosquitoes entering houses withbed nets and attempting to feed. Not all mosquitoes simu-lated to enter an ITN-protected household will die. Becausegenerally not all sleepers in the house are covered by anITN, we assume that 80% of attempted blood meals aresuccessful, because a repellent effect of the bed net maydivert bites from protected individuals to unprotected inhab-itants. The rest of the attempted blood meals result in themosquito’s death. ITN protection in houses is assignedrandomly within the village so that the observed 20%coverage is attained. Mosquitoes that are in a village gridcell but are not seeking blood meal hosts are assumed to beflying past the houses and not entering, and are therefore notsubject to the ITN’s knockdown effect.
5. Results
5.1. Hydrology
[73] We simulate hydrology in Banizoumbou, Niger, forthe 2005 and 2006 wet seasons. The 2005 wet season
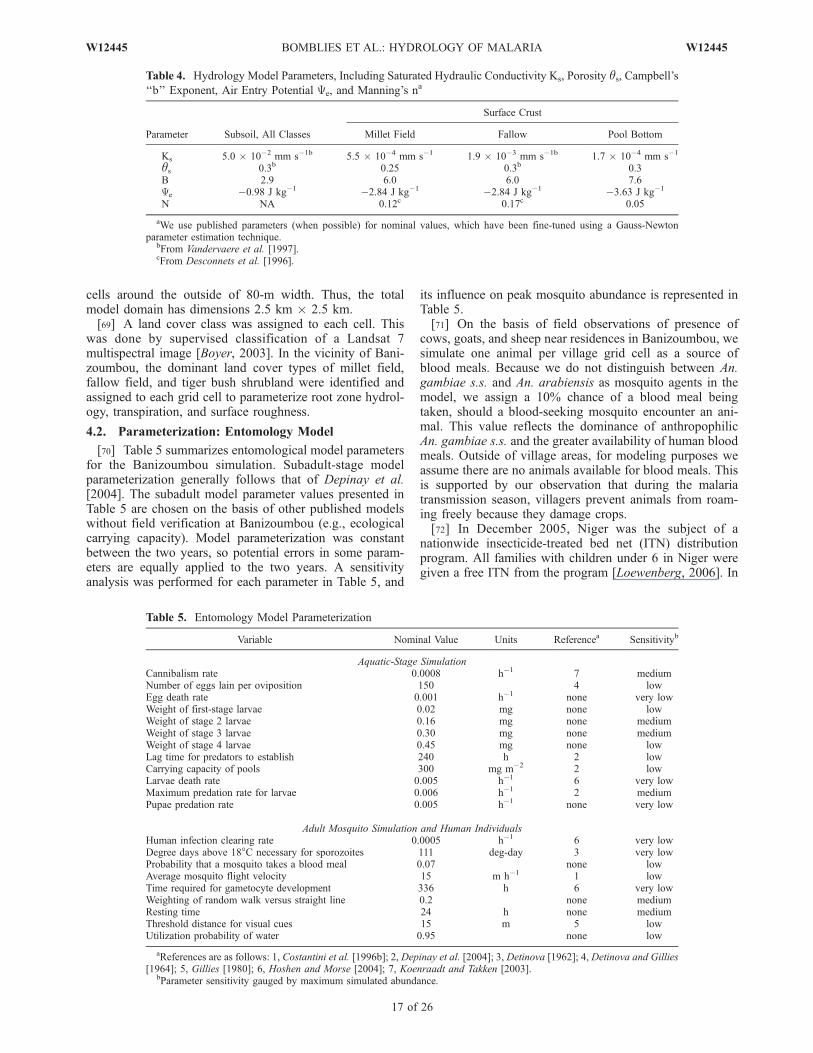
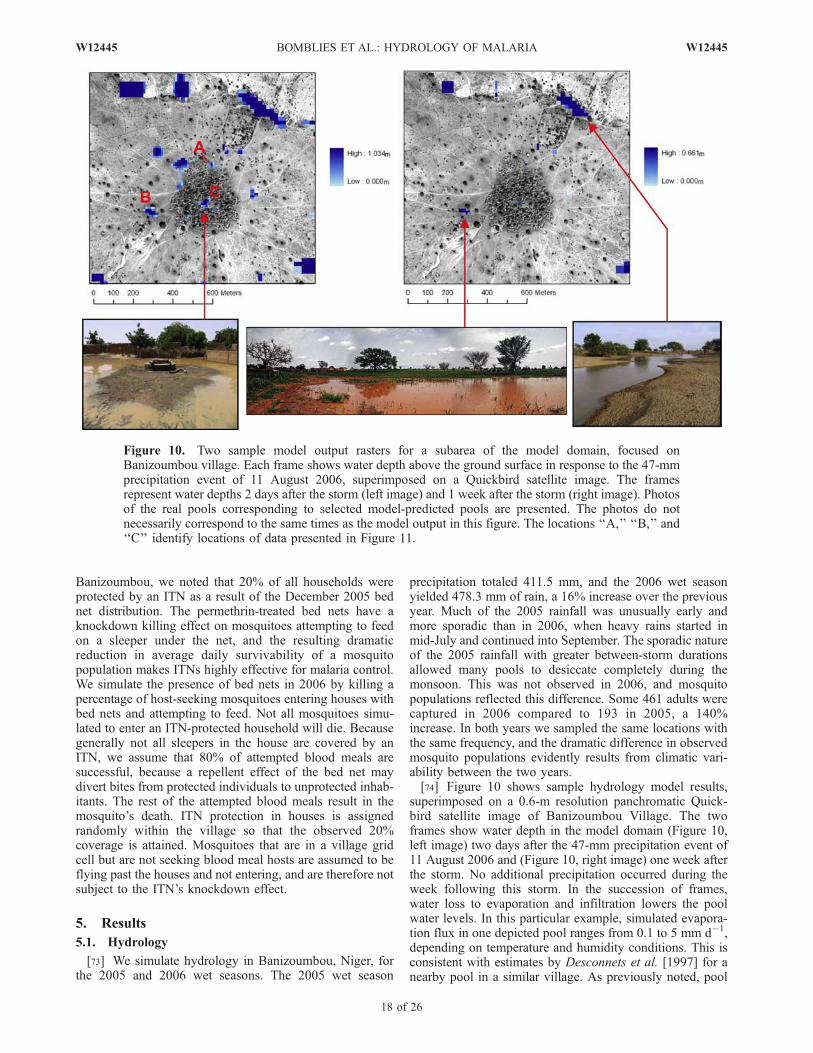
precipitation totaled 411.5 mm, and the 2006 wet seasonyielded 478.3 mm of rain, a 16% increase over the previousyear. Much of the 2005 rainfall was unusually early andmore sporadic than in 2006, when heavy rains started inmid-July and continued into September. The sporadic natureof the 2005 rainfall with greater between-storm durationsallowed many pools to desiccate completely during themonsoon. This was not observed in 2006, and mosquitopopulations reflected this difference. Some 461 adults werecaptured in 2006 compared to 193 in 2005, a 140%increase. In both years we sampled the same locations withthe same frequency, and the dramatic difference in observedmosquito populations evidently results from climatic vari-ability between the two years.[74] Figure 10 shows sample hydrology model results,
superimposed on a 0.6-m resolution panchromatic Quick-bird satellite image of Banizoumbou Village. The twoframes show water depth in the model domain (Figure 10,left image) two days after the 47-mm precipitation event of11 August 2006 and (Figure 10, right image) one week afterthe storm. No additional precipitation occurred during theweek following this storm. In the succession of frames,water loss to evaporation and infiltration lowers the poolwater levels. In this particular example, simulated evapora-tion flux in one depicted pool ranges from 0.1 to 5 mm d�1,depending on temperature and humidity conditions. This isconsistent with estimates by Desconnets et al. [1997] for anearby pool in a similar village. As previously noted, pool
Figure 10. Two sample model output rasters for a subarea of the model domain, focused onBanizoumbou village. Each frame shows water depth above the ground surface in response to the 47-mmprecipitation event of 11 August 2006, superimposed on a Quickbird satellite image. The framesrepresent water depths 2 days after the storm (left image) and 1 week after the storm (right image). Photosof the real pools corresponding to selected model-predicted pools are presented. The photos do notnecessarily correspond to the same times as the model output in this figure. The locations ‘‘A,’’ ‘‘B,’’ and‘‘C’’ identify locations of data presented in Figure 11.
18 of 26
W12445 BOMBLIES ET AL.: HYDROLOGY OF MALARIA W12445
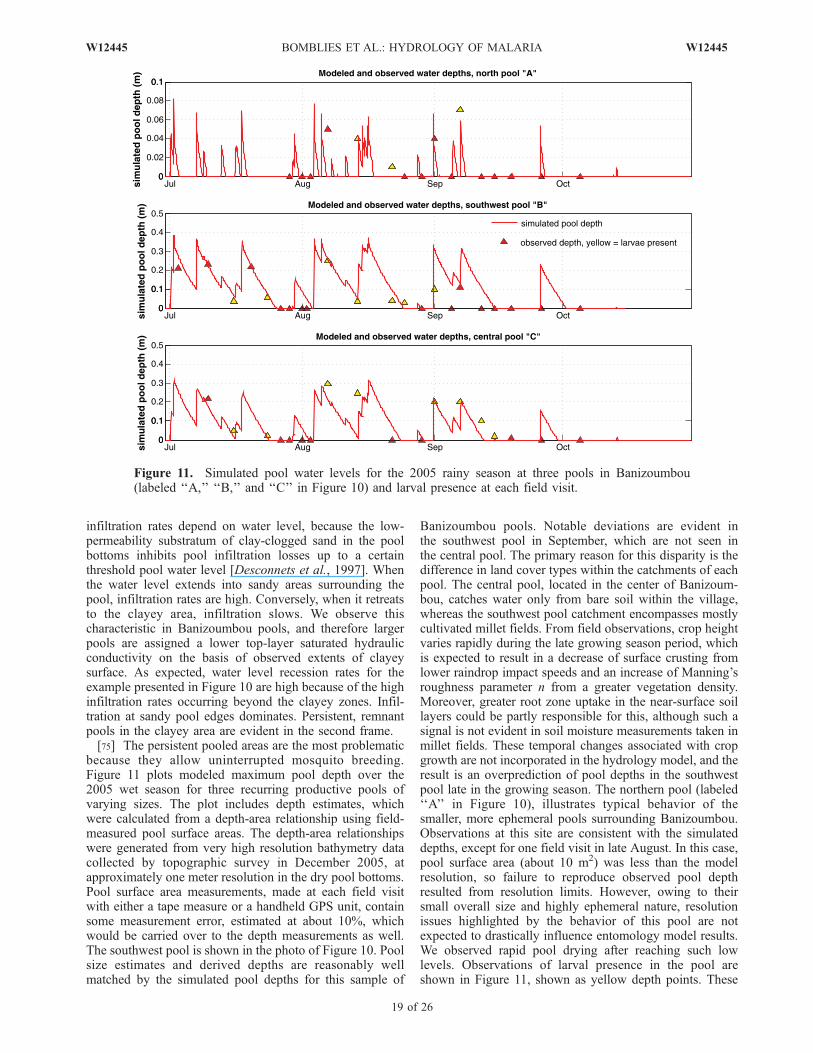
infiltration rates depend on water level, because the low-permeability substratum of clay-clogged sand in the poolbottoms inhibits pool infiltration losses up to a certainthreshold pool water level [Desconnets et al., 1997]. Whenthe water level extends into sandy areas surrounding thepool, infiltration rates are high. Conversely, when it retreatsto the clayey area, infiltration slows. We observe thischaracteristic in Banizoumbou pools, and therefore largerpools are assigned a lower top-layer saturated hydraulicconductivity on the basis of observed extents of clayeysurface. As expected, water level recession rates for theexample presented in Figure 10 are high because of the highinfiltration rates occurring beyond the clayey zones. Infil-tration at sandy pool edges dominates. Persistent, remnantpools in the clayey area are evident in the second frame.[75] The persistent pooled areas are the most problematic
because they allow uninterrupted mosquito breeding.Figure 11 plots modeled maximum pool depth over the2005 wet season for three recurring productive pools ofvarying sizes. The plot includes depth estimates, whichwere calculated from a depth-area relationship using field-measured pool surface areas. The depth-area relationshipswere generated from very high resolution bathymetry datacollected by topographic survey in December 2005, atapproximately one meter resolution in the dry pool bottoms.Pool surface area measurements, made at each field visitwith either a tape measure or a handheld GPS unit, containsome measurement error, estimated at about 10%, whichwould be carried over to the depth measurements as well.The southwest pool is shown in the photo of Figure 10. Poolsize estimates and derived depths are reasonably wellmatched by the simulated pool depths for this sample of
Banizoumbou pools. Notable deviations are evident inthe southwest pool in September, which are not seen inthe central pool. The primary reason for this disparity is thedifference in land cover types within the catchments of eachpool. The central pool, located in the center of Banizoum-bou, catches water only from bare soil within the village,whereas the southwest pool catchment encompasses mostlycultivated millet fields. From field observations, crop heightvaries rapidly during the late growing season period, whichis expected to result in a decrease of surface crusting fromlower raindrop impact speeds and an increase of Manning’sroughness parameter n from a greater vegetation density.Moreover, greater root zone uptake in the near-surface soillayers could be partly responsible for this, although such asignal is not evident in soil moisture measurements taken inmillet fields. These temporal changes associated with cropgrowth are not incorporated in the hydrology model, and theresult is an overprediction of pool depths in the southwestpool late in the growing season. The northern pool (labeled‘‘A’’ in Figure 10), illustrates typical behavior of thesmaller, more ephemeral pools surrounding Banizoumbou.Observations at this site are consistent with the simulateddepths, except for one field visit in late August. In this case,pool surface area (about 10 m2) was less than the modelresolution, so failure to reproduce observed pool depthresulted from resolution limits. However, owing to theirsmall overall size and highly ephemeral nature, resolutionissues highlighted by the behavior of this pool are notexpected to drastically influence entomology model results.We observed rapid pool drying after reaching such lowlevels. Observations of larval presence in the pool areshown in Figure 11, shown as yellow depth points. These
Figure 11. Simulated pool water levels for the 2005 rainy season at three pools in Banizoumbou(labeled ‘‘A,’’ ‘‘B,’’ and ‘‘C’’ in Figure 10) and larval presence at each field visit.
W12445 BOMBLIES ET AL.: HYDROLOGY OF MALARIA
19 of 26
W12445
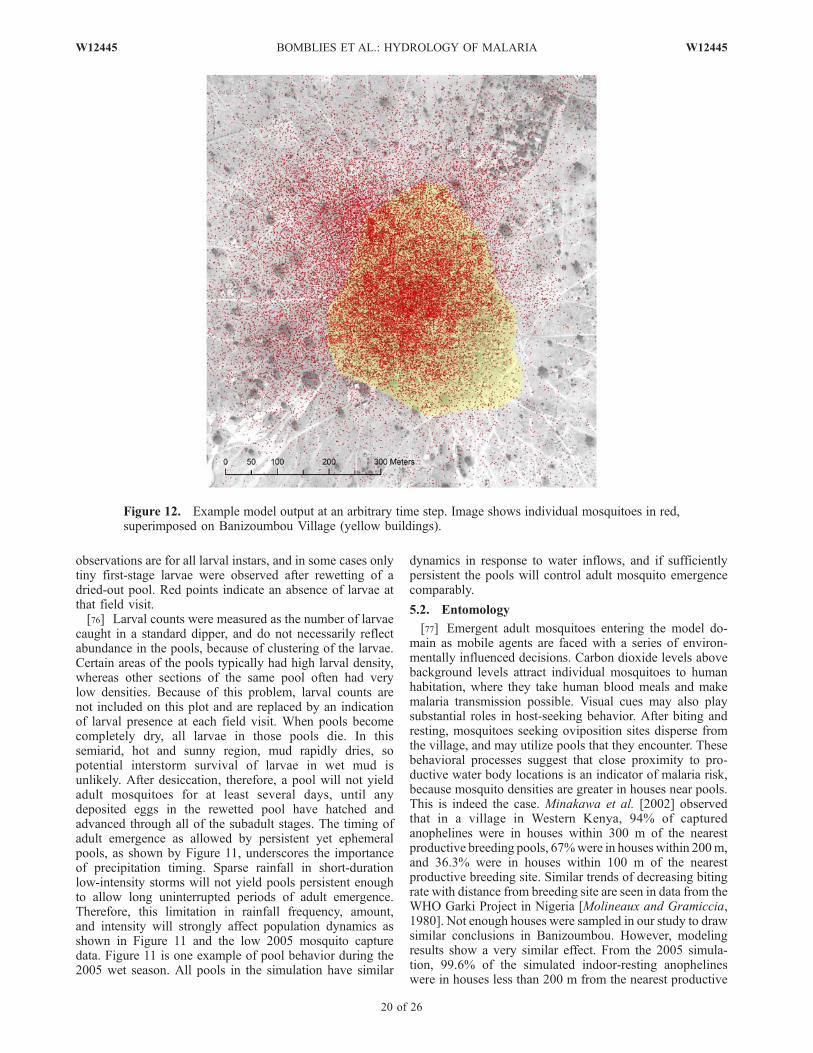
observations are for all larval instars, and in some cases onlytiny first-stage larvae were observed after rewetting of adried-out pool. Red points indicate an absence of larvae atthat field visit.[76] Larval counts were measured as the number of larvae
caught in a standard dipper, and do not necessarily reflectabundance in the pools, because of clustering of the larvae.Certain areas of the pools typically had high larval density,whereas other sections of the same pool often had verylow densities. Because of this problem, larval counts arenot included on this plot and are replaced by an indicationof larval presence at each field visit. When pools becomecompletely dry, all larvae in those pools die. In thissemiarid, hot and sunny region, mud rapidly dries, sopotential interstorm survival of larvae in wet mud isunlikely. After desiccation, therefore, a pool will not yieldadult mosquitoes for at least several days, until anydeposited eggs in the rewetted pool have hatched andadvanced through all of the subadult stages. The timing ofadult emergence as allowed by persistent yet ephemeralpools, as shown by Figure 11, underscores the importanceof precipitation timing. Sparse rainfall in short-durationlow-intensity storms will not yield pools persistent enoughto allow long uninterrupted periods of adult emergence.Therefore, this limitation in rainfall frequency, amount,and intensity will strongly affect population dynamics asshown in Figure 11 and the low 2005 mosquito capturedata. Figure 11 is one example of pool behavior during the2005 wet season. All pools in the simulation have similar
dynamics in response to water inflows, and if sufficientlypersistent the pools will control adult mosquito emergencecomparably.
5.2. Entomology
[77] Emergent adult mosquitoes entering the model do-main as mobile agents are faced with a series of environ-mentally influenced decisions. Carbon dioxide levels abovebackground levels attract individual mosquitoes to humanhabitation, where they take human blood meals and makemalaria transmission possible. Visual cues may also playsubstantial roles in host-seeking behavior. After biting andresting, mosquitoes seeking oviposition sites disperse fromthe village, and may utilize pools that they encounter. Thesebehavioral processes suggest that close proximity to pro-ductive water body locations is an indicator of malaria risk,because mosquito densities are greater in houses near pools.This is indeed the case. Minakawa et al. [2002] observedthat in a village in Western Kenya, 94% of capturedanophelines were in houses within 300 m of the nearestproductive breeding pools, 67%were in houses within 200m,and 36.3% were in houses within 100 m of the nearestproductive breeding site. Similar trends of decreasing bitingrate with distance from breeding site are seen in data from theWHO Garki Project in Nigeria [Molineaux and Gramiccia,1980]. Not enough houses were sampled in our study to drawsimilar conclusions in Banizoumbou. However, modelingresults show a very similar effect. From the 2005 simula-tion, 99.6% of the simulated indoor-resting anophelineswere in houses less than 200 m from the nearest productive
Figure 12. Example model output at an arbitrary time step. Image shows individual mosquitoes in red,superimposed on Banizoumbou Village (yellow buildings).
20 of 26
W12445 BOMBLIES ET AL.: HYDROLOGY OF MALARIA W12445
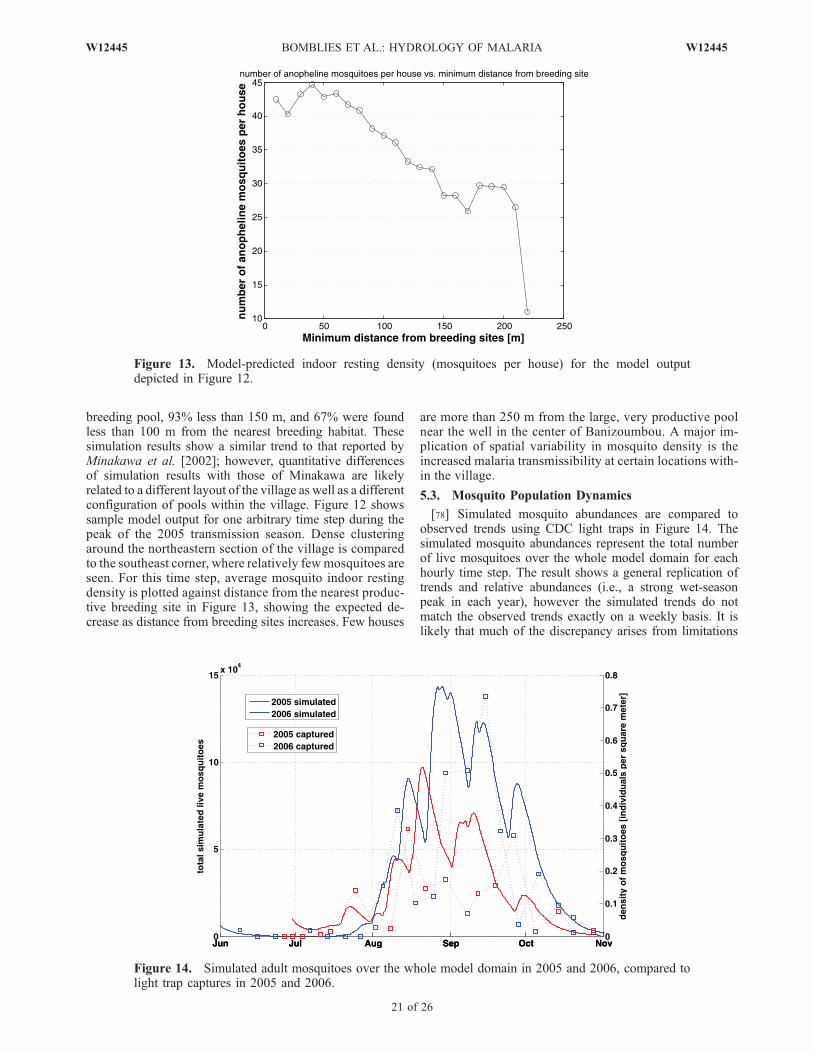
breeding pool, 93% less than 150 m, and 67% were foundless than 100 m from the nearest breeding habitat. Thesesimulation results show a similar trend to that reported byMinakawa et al. [2002]; however, quantitative differencesof simulation results with those of Minakawa are likelyrelated to a different layout of the village as well as a differentconfiguration of pools within the village. Figure 12 showssample model output for one arbitrary time step during thepeak of the 2005 transmission season. Dense clusteringaround the northeastern section of the village is comparedto the southeast corner, where relatively fewmosquitoes areseen. For this time step, average mosquito indoor restingdensity is plotted against distance from the nearest produc-tive breeding site in Figure 13, showing the expected de-crease as distance from breeding sites increases. Few houses
are more than 250 m from the large, very productive poolnear the well in the center of Banizoumbou. A major im-plication of spatial variability in mosquito density is theincreased malaria transmissibility at certain locations with-in the village.
5.3. Mosquito Population Dynamics
[78] Simulated mosquito abundances are compared toobserved trends using CDC light traps in Figure 14. Thesimulated mosquito abundances represent the total numberof live mosquitoes over the whole model domain for eachhourly time step. The result shows a general replication oftrends and relative abundances (i.e., a strong wet-seasonpeak in each year), however the simulated trends do notmatch the observed trends exactly on a weekly basis. It islikely that much of the discrepancy arises from limitations
Figure 13. Model-predicted indoor resting density (mosquitoes per house) for the model outputdepicted in Figure 12.
Figure 14. Simulated adult mosquitoes over the whole model domain in 2005 and 2006, compared tolight trap captures in 2005 and 2006.
W12445 BOMBLIES ET AL.: HYDROLOGY OF MALARIA
21 of 26
W12445
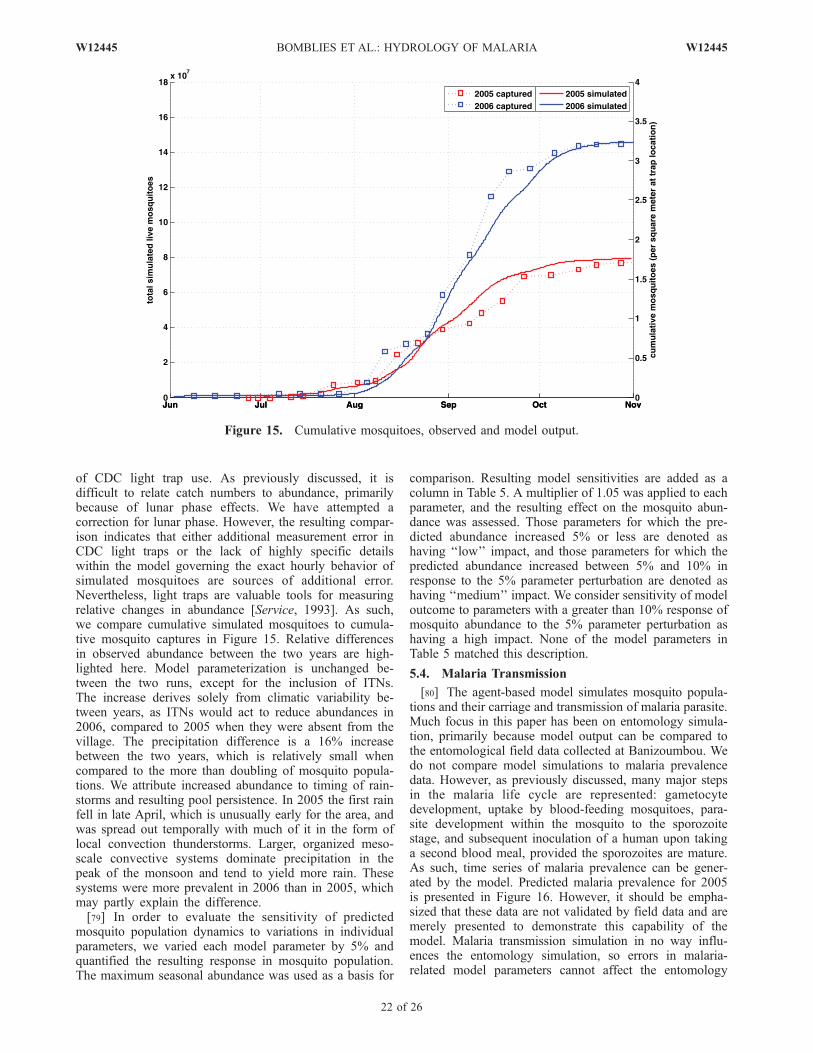
of CDC light trap use. As previously discussed, it isdifficult to relate catch numbers to abundance, primarilybecause of lunar phase effects. We have attempted acorrection for lunar phase. However, the resulting compar-ison indicates that either additional measurement error inCDC light traps or the lack of highly specific detailswithin the model governing the exact hourly behavior ofsimulated mosquitoes are sources of additional error.Nevertheless, light traps are valuable tools for measuringrelative changes in abundance [Service, 1993]. As such,we compare cumulative simulated mosquitoes to cumula-tive mosquito captures in Figure 15. Relative differencesin observed abundance between the two years are high-lighted here. Model parameterization is unchanged be-tween the two runs, except for the inclusion of ITNs.The increase derives solely from climatic variability be-tween years, as ITNs would act to reduce abundances in2006, compared to 2005 when they were absent from thevillage. The precipitation difference is a 16% increasebetween the two years, which is relatively small whencompared to the more than doubling of mosquito popula-tions. We attribute increased abundance to timing of rain-storms and resulting pool persistence. In 2005 the first rainfell in late April, which is unusually early for the area, andwas spread out temporally with much of it in the form oflocal convection thunderstorms. Larger, organized meso-scale convective systems dominate precipitation in thepeak of the monsoon and tend to yield more rain. Thesesystems were more prevalent in 2006 than in 2005, whichmay partly explain the difference.[79] In order to evaluate the sensitivity of predicted
mosquito population dynamics to variations in individualparameters, we varied each model parameter by 5% andquantified the resulting response in mosquito population.The maximum seasonal abundance was used as a basis for
comparison. Resulting model sensitivities are added as acolumn in Table 5. A multiplier of 1.05 was applied to eachparameter, and the resulting effect on the mosquito abun-dance was assessed. Those parameters for which the pre-dicted abundance increased 5% or less are denoted ashaving ‘‘low’’ impact, and those parameters for which thepredicted abundance increased between 5% and 10% inresponse to the 5% parameter perturbation are denoted ashaving ‘‘medium’’ impact. We consider sensitivity of modeloutcome to parameters with a greater than 10% response ofmosquito abundance to the 5% parameter perturbation ashaving a high impact. None of the model parameters inTable 5 matched this description.
5.4. Malaria Transmission
[80] The agent-based model simulates mosquito popula-tions and their carriage and transmission of malaria parasite.Much focus in this paper has been on entomology simula-tion, primarily because model output can be compared tothe entomological field data collected at Banizoumbou. Wedo not compare model simulations to malaria prevalencedata. However, as previously discussed, many major stepsin the malaria life cycle are represented: gametocytedevelopment, uptake by blood-feeding mosquitoes, para-site development within the mosquito to the sporozoitestage, and subsequent inoculation of a human upon takinga second blood meal, provided the sporozoites are mature.As such, time series of malaria prevalence can be gener-ated by the model. Predicted malaria prevalence for 2005is presented in Figure 16. However, it should be empha-sized that these data are not validated by field data and aremerely presented to demonstrate this capability of themodel. Malaria transmission simulation in no way influ-ences the entomology simulation, so errors in malaria-related model parameters cannot affect the entomology
Figure 15. Cumulative mosquitoes, observed and model output.
22 of 26
W12445 BOMBLIES ET AL.: HYDROLOGY OF MALARIA W12445
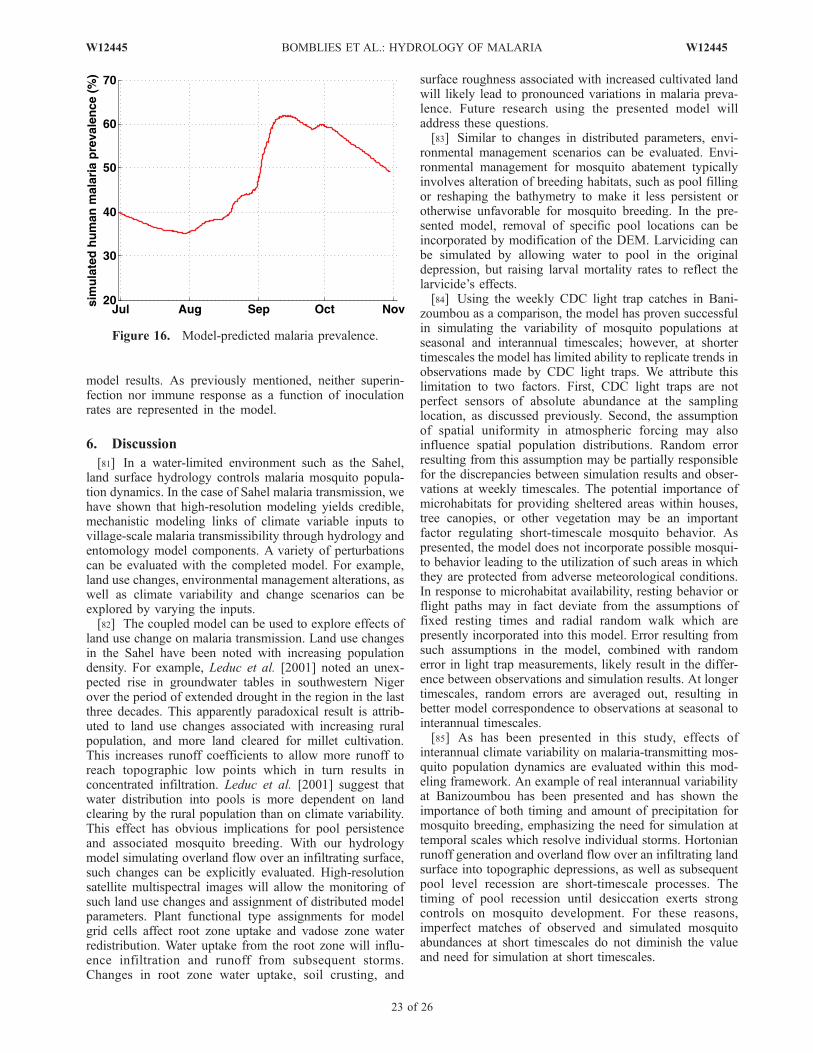
model results. As previously mentioned, neither superin-fection nor immune response as a function of inoculationrates are represented in the model.
6. Discussion
[81] In a water-limited environment such as the Sahel,land surface hydrology controls malaria mosquito popula-tion dynamics. In the case of Sahel malaria transmission, wehave shown that high-resolution modeling yields credible,mechanistic modeling links of climate variable inputs tovillage-scale malaria transmissibility through hydrology andentomology model components. A variety of perturbationscan be evaluated with the completed model. For example,land use changes, environmental management alterations, aswell as climate variability and change scenarios can beexplored by varying the inputs.[82] The coupled model can be used to explore effects of
land use change on malaria transmission. Land use changesin the Sahel have been noted with increasing populationdensity. For example, Leduc et al. [2001] noted an unex-pected rise in groundwater tables in southwestern Nigerover the period of extended drought in the region in the lastthree decades. This apparently paradoxical result is attrib-uted to land use changes associated with increasing ruralpopulation, and more land cleared for millet cultivation.This increases runoff coefficients to allow more runoff toreach topographic low points which in turn results inconcentrated infiltration. Leduc et al. [2001] suggest thatwater distribution into pools is more dependent on landclearing by the rural population than on climate variability.This effect has obvious implications for pool persistenceand associated mosquito breeding. With our hydrologymodel simulating overland flow over an infiltrating surface,such changes can be explicitly evaluated. High-resolutionsatellite multispectral images will allow the monitoring ofsuch land use changes and assignment of distributed modelparameters. Plant functional type assignments for modelgrid cells affect root zone uptake and vadose zone waterredistribution. Water uptake from the root zone will influ-ence infiltration and runoff from subsequent storms.Changes in root zone water uptake, soil crusting, and
surface roughness associated with increased cultivated landwill likely lead to pronounced variations in malaria preva-lence. Future research using the presented model willaddress these questions.[83] Similar to changes in distributed parameters, envi-
ronmental management scenarios can be evaluated. Envi-ronmental management for mosquito abatement typicallyinvolves alteration of breeding habitats, such as pool fillingor reshaping the bathymetry to make it less persistent orotherwise unfavorable for mosquito breeding. In the pre-sented model, removal of specific pool locations can beincorporated by modification of the DEM. Larviciding canbe simulated by allowing water to pool in the originaldepression, but raising larval mortality rates to reflect thelarvicide’s effects.[84] Using the weekly CDC light trap catches in Bani-
zoumbou as a comparison, the model has proven successfulin simulating the variability of mosquito populations atseasonal and interannual timescales; however, at shortertimescales the model has limited ability to replicate trends inobservations made by CDC light traps. We attribute thislimitation to two factors. First, CDC light traps are notperfect sensors of absolute abundance at the samplinglocation, as discussed previously. Second, the assumptionof spatial uniformity in atmospheric forcing may alsoinfluence spatial population distributions. Random errorresulting from this assumption may be partially responsiblefor the discrepancies between simulation results and obser-vations at weekly timescales. The potential importance ofmicrohabitats for providing sheltered areas within houses,tree canopies, or other vegetation may be an importantfactor regulating short-timescale mosquito behavior. Aspresented, the model does not incorporate possible mosqui-to behavior leading to the utilization of such areas in whichthey are protected from adverse meteorological conditions.In response to microhabitat availability, resting behavior orflight paths may in fact deviate from the assumptions offixed resting times and radial random walk which arepresently incorporated into this model. Error resulting fromsuch assumptions in the model, combined with randomerror in light trap measurements, likely result in the differ-ence between observations and simulation results. At longertimescales, random errors are averaged out, resulting inbetter model correspondence to observations at seasonal tointerannual timescales.[85] As has been presented in this study, effects of
interannual climate variability on malaria-transmitting mos-quito population dynamics are evaluated within this mod-eling framework. An example of real interannual variabilityat Banizoumbou has been presented and has shown theimportance of both timing and amount of precipitation formosquito breeding, emphasizing the need for simulation attemporal scales which resolve individual storms. Hortonianrunoff generation and overland flow over an infiltrating landsurface into topographic depressions, as well as subsequentpool level recession are short-timescale processes. Thetiming of pool recession until desiccation exerts strongcontrols on mosquito development. For these reasons,imperfect matches of observed and simulated mosquitoabundances at short timescales do not diminish the valueand need for simulation at short timescales.
Figure 16. Model-predicted malaria prevalence.
W12445 BOMBLIES ET AL.: HYDROLOGY OF MALARIA
23 of 26
W12445
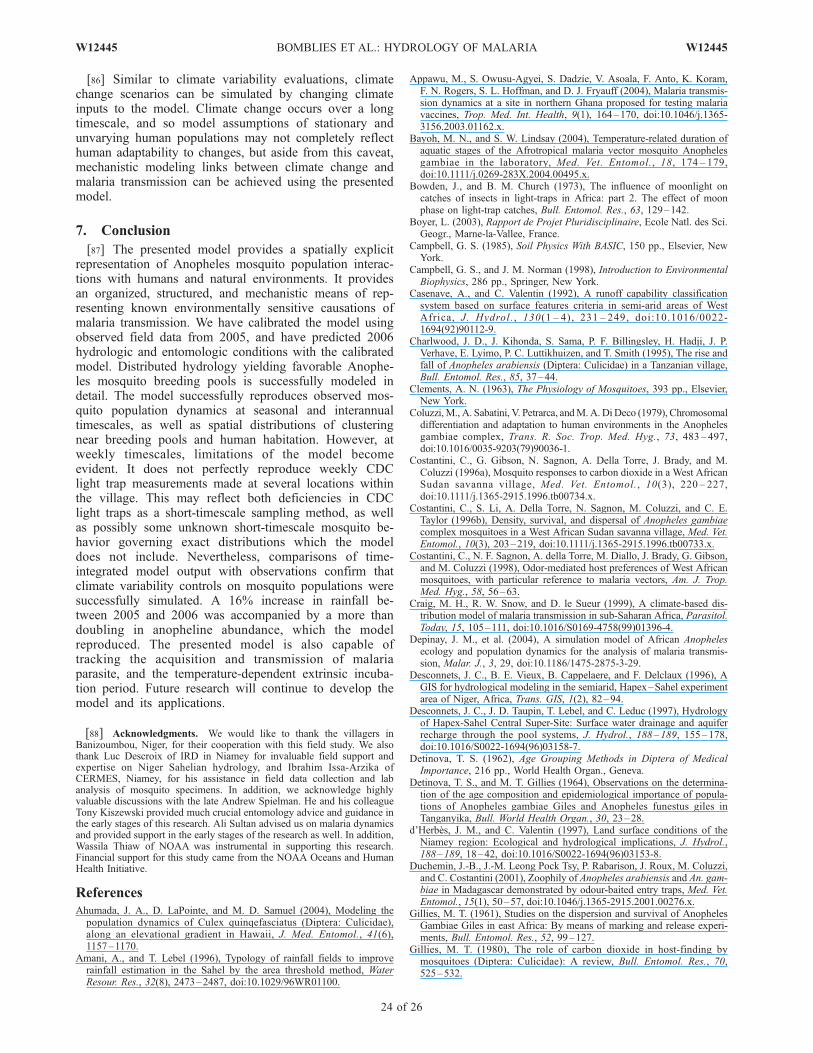
[86] Similar to climate variability evaluations, climatechange scenarios can be simulated by changing climateinputs to the model. Climate change occurs over a longtimescale, and so model assumptions of stationary andunvarying human populations may not completely reflecthuman adaptability to changes, but aside from this caveat,mechanistic modeling links between climate change andmalaria transmission can be achieved using the presentedmodel.
7. Conclusion
[87] The presented model provides a spatially explicitrepresentation of Anopheles mosquito population interac-tions with humans and natural environments. It providesan organized, structured, and mechanistic means of rep-resenting known environmentally sensitive causations ofmalaria transmission. We have calibrated the model usingobserved field data from 2005, and have predicted 2006hydrologic and entomologic conditions with the calibratedmodel. Distributed hydrology yielding favorable Anophe-les mosquito breeding pools is successfully modeled indetail. The model successfully reproduces observed mos-quito population dynamics at seasonal and interannualtimescales, as well as spatial distributions of clusteringnear breeding pools and human habitation. However, atweekly timescales, limitations of the model becomeevident. It does not perfectly reproduce weekly CDClight trap measurements made at several locations withinthe village. This may reflect both deficiencies in CDClight traps as a short-timescale sampling method, as wellas possibly some unknown short-timescale mosquito be-havior governing exact distributions which the modeldoes not include. Nevertheless, comparisons of time-integrated model output with observations confirm thatclimate variability controls on mosquito populations weresuccessfully simulated. A 16% increase in rainfall be-tween 2005 and 2006 was accompanied by a more thandoubling in anopheline abundance, which the modelreproduced. The presented model is also capable oftracking the acquisition and transmission of malariaparasite, and the temperature-dependent extrinsic incuba-tion period. Future research will continue to develop themodel and its applications.
[88] Acknowledgments. We would like to thank the villagers inBanizoumbou, Niger, for their cooperation with this field study. We alsothank Luc Descroix of IRD in Niamey for invaluable field support andexpertise on Niger Sahelian hydrology, and Ibrahim Issa-Arzika ofCERMES, Niamey, for his assistance in field data collection and labanalysis of mosquito specimens. In addition, we acknowledge highlyvaluable discussions with the late Andrew Spielman. He and his colleagueTony Kiszewski provided much crucial entomology advice and guidance inthe early stages of this research. Ali Sultan advised us on malaria dynamicsand provided support in the early stages of the research as well. In addition,Wassila Thiaw of NOAA was instrumental in supporting this research.Financial support for this study came from the NOAA Oceans and HumanHealth Initiative.
ReferencesAhumada, J. A., D. LaPointe, and M. D. Samuel (2004), Modeling thepopulation dynamics of Culex quinqefasciatus (Diptera: Culicidae),along an elevational gradient in Hawaii, J. Med. Entomol., 41(6),1157–1170.
Amani, A., and T. Lebel (1996), Typology of rainfall fields to improverainfall estimation in the Sahel by the area threshold method, WaterResour. Res., 32(8), 2473–2487, doi:10.1029/96WR01100.
Appawu, M., S. Owusu-Agyei, S. Dadzie, V. Asoala, F. Anto, K. Koram,F. N. Rogers, S. L. Hoffman, and D. J. Fryauff (2004), Malaria transmis-sion dynamics at a site in northern Ghana proposed for testing malariavaccines, Trop. Med. Int. Health, 9(1), 164–170, doi:10.1046/j.1365-3156.2003.01162.x.
Bayoh, M. N., and S. W. Lindsay (2004), Temperature-related duration ofaquatic stages of the Afrotropical malaria vector mosquito Anophelesgambiae in the laboratory, Med. Vet. Entomol., 18, 174 – 179,doi:10.1111/j.0269-283X.2004.00495.x.
Bowden, J., and B. M. Church (1973), The influence of moonlight oncatches of insects in light-traps in Africa: part 2. The effect of moonphase on light-trap catches, Bull. Entomol. Res., 63, 129–142.
Boyer, L. (2003), Rapport de Projet Pluridisciplinaire, Ecole Natl. des Sci.Geogr., Marne-la-Vallee, France.
Campbell, G. S. (1985), Soil Physics With BASIC, 150 pp., Elsevier, NewYork.
Campbell, G. S., and J. M. Norman (1998), Introduction to EnvironmentalBiophysics, 286 pp., Springer, New York.
Casenave, A., and C. Valentin (1992), A runoff capability classificationsystem based on surface features criteria in semi-arid areas of WestAfrica, J. Hydrol. , 130(1 – 4), 231 – 249, doi:10.1016/0022-1694(92)90112-9.
Charlwood, J. D., J. Kihonda, S. Sama, P. F. Billingsley, H. Hadji, J. P.Verhave, E. Lyimo, P. C. Luttikhuizen, and T. Smith (1995), The rise andfall of Anopheles arabiensis (Diptera: Culicidae) in a Tanzanian village,Bull. Entomol. Res., 85, 37–44.
Clements, A. N. (1963), The Physiology of Mosquitoes, 393 pp., Elsevier,New York.
Coluzzi,M., A. Sabatini, V. Petrarca, andM.A.Di Deco (1979), Chromosomaldifferentiation and adaptation to human environments in the Anophelesgambiae complex, Trans. R. Soc. Trop. Med. Hyg., 73, 483 – 497,doi:10.1016/0035-9203(79)90036-1.
Costantini, C., G. Gibson, N. Sagnon, A. Della Torre, J. Brady, and M.Coluzzi (1996a), Mosquito responses to carbon dioxide in a West AfricanSudan savanna village, Med. Vet. Entomol., 10(3), 220 – 227,doi:10.1111/j.1365-2915.1996.tb00734.x.
Costantini, C., S. Li, A. Della Torre, N. Sagnon, M. Coluzzi, and C. E.Taylor (1996b), Density, survival, and dispersal of Anopheles gambiaecomplex mosquitoes in a West African Sudan savanna village, Med. Vet.Entomol., 10(3), 203–219, doi:10.1111/j.1365-2915.1996.tb00733.x.
Costantini, C., N. F. Sagnon, A. della Torre, M. Diallo, J. Brady, G. Gibson,and M. Coluzzi (1998), Odor-mediated host preferences of West Africanmosquitoes, with particular reference to malaria vectors, Am. J. Trop.Med. Hyg., 58, 56–63.
Craig, M. H., R. W. Snow, and D. le Sueur (1999), A climate-based dis-tribution model of malaria transmission in sub-Saharan Africa, Parasitol.Today, 15, 105–111, doi:10.1016/S0169-4758(99)01396-4.
Depinay, J. M., et al. (2004), A simulation model of African Anophelesecology and population dynamics for the analysis of malaria transmis-sion, Malar. J., 3, 29, doi:10.1186/1475-2875-3-29.
Desconnets, J. C., B. E. Vieux, B. Cappelaere, and F. Delclaux (1996), AGIS for hydrological modeling in the semiarid, Hapex–Sahel experimentarea of Niger, Africa, Trans. GIS, 1(2), 82–94.
Desconnets, J. C., J. D. Taupin, T. Lebel, and C. Leduc (1997), Hydrologyof Hapex-Sahel Central Super-Site: Surface water drainage and aquiferrecharge through the pool systems, J. Hydrol., 188–189, 155–178,doi:10.1016/S0022-1694(96)03158-7.
Detinova, T. S. (1962), Age Grouping Methods in Diptera of MedicalImportance, 216 pp., World Health Organ., Geneva.
Detinova, T. S., and M. T. Gillies (1964), Observations on the determina-tion of the age composition and epidemiological importance of popula-tions of Anopheles gambiae Giles and Anopheles funestus giles inTanganyika, Bull. World Health Organ., 30, 23–28.
d’Herbes, J. M., and C. Valentin (1997), Land surface conditions of theNiamey region: Ecological and hydrological implications, J. Hydrol.,188–189, 18–42, doi:10.1016/S0022-1694(96)03153-8.
Duchemin, J.-B., J.-M. Leong Pock Tsy, P. Rabarison, J. Roux, M. Coluzzi,and C. Costantini (2001), Zoophily of Anopheles arabiensis and An. gam-biae in Madagascar demonstrated by odour-baited entry traps, Med. Vet.Entomol., 15(1), 50–57, doi:10.1046/j.1365-2915.2001.00276.x.
Gillies, M. T. (1961), Studies on the dispersion and survival of AnophelesGambiae Giles in east Africa: By means of marking and release experi-ments, Bull. Entomol. Res., 52, 99–127.
Gillies, M. T. (1980), The role of carbon dioxide in host-finding bymosquitoes (Diptera: Culicidae): A review, Bull. Entomol. Res., 70,525–532.
24 of 26
W12445 BOMBLIES ET AL.: HYDROLOGY OF MALARIA W12445
Gillies, M. T., and B. DeMeillon (1968), The Anophelinae of Africa Southof the Sahara, S. Afr. Inst. of Med. Res., Johannesburg.
Haddow, A. J. (1954), Studies of the biting habits of African mosquitoes:An appraisal of methods employed, with special reference to the twenty-four hour catch, Bull. Entomol. Res., 45, 199–242.
Healy, T. P., and M. J. W. Copland (1995), Activation of Anophelesgambiae mosquitoes by carbon dioxide and human breath, Med. Vet.Entomol., 9, 331–336, doi:10.1111/j.1365-2915.1995.tb00143.x.
Hoogmoed, W. B., and L. Stroosnijder (1984), Crust formation on sandysoils in the Sahel. I. Rainfall and infiltration, Soil Tillage Res., 4, 5–23,doi:10.1016/0167-1987(84)90013-8.
Horsfall, W. R. (1943), Some responses of the malaria mosquito to light,Ann. Entomol. Soc. Am., 36(1), 41–45.
Hoshen, M. B., and A. P. Morse (2004), Aweather-driven model of malariatransmission, Malar. J., 3, 32, doi:10.1186/1475-2875-3-32.
Jepson, W. F., A. Moutia, and C. Courtois (1947), The malaria problem inMauritius: The bionomics of Mauritian anophelines, Bull. Entomol. Res.,38, 177–208.
Kinsman, R., F. D. Sauer, H. A. Jackson, and M. S. Wolynetz (1995),Methane and carbon dioxide emissions from dairy cows in fulllactation monitored over a six-month period, J. Dairy Sci., 78,2760–2766.
Kiszewski, A., and A. Teklehaimanot (2004), A review of the clinical andepidemiologic burdens of epidemic malaria, Am. J. Trop. Med. Hyg.,71(suppl. 2), 128–135.
Koenraadt, C. J. M., and W. Takken (2003), Cannibalism and predationamong larvae of the Anopheles gambiae complex, Med. Vet. Entomol.,17, 61–66, doi:10.1046/j.1365-2915.2003.00409.x.
Lal, W. (1998), Performance comparison of overland flow algorithms,J. Hydraul. Eng., 124(4), 342–349.
Lambot, S., M. Javaux, F. Hupet, and M. Vanclooster (2002), A globalmultilevel coordinate search procedure for estimating the unsaturated soilhydraulic properties, Water Resour. Res., 38(11), 1224, doi:10.1029/2001WR001224.
Le Barbe, L., and T. Lebel (1997), Rainfall climatology of the Hapex-Sahelregion during the years 1950–1990, J. Hydrol., 188–189, 43– 73,doi:10.1016/S0022-1694(96)03154-X.
Leduc, C., G. Favreau, and P. Schroeter (2001), Long-term rise in aSahelian water-table: The Continental Terminal in south-west Niger,J. Hydrol., 243, 43–54, doi:10.1016/S0022-1694(00)00403-0.
Le Menach, A., F. E. McKenzie, A. Flahault, and D. L. Smith (2005), Theunexpected importance of mosquito oviposition behaviour for malaria:Non-productive larval habitats can be sources for malaria transmission,Malar. J., 4, 23, doi:10.1186/1475-2875-4-23.
Lindsay, S. W., P. L. Alonso, J. Schellenberg, J. Hemingway, J. H.Adiamah, F. C. Shenton, M. Jawara, and B. M. Greenwood (1993),A malaria control trial using insecticide-treated bed nets and targetedchemoprophylaxis in a rural area of The Gambia, West Africa: 7.Impact of permethrin-impregnated bed nets on malaria vectors, Trans.R. Soc. Hyg. Trop. Med., 87, 45– 51, doi:10.1016/0035-9203(93)90175-P.
Loewenberg, S. (2006), Niger welcomes largest bednet distribution inhistory, Lancet, 367(9521), 1473, doi:10.1016/S0140-6736(06)68630-3.
MacDonald, G. (1950), The analysis of infection rates in diseases in whichsuperinfection occurs, Trop. Diseases Bull., 47, 907–915.
Macdonald, G. (1957), The Epidemiology and Control of Malaria, 201 pp.,Oxford Univ. Press, New York.
Martens, W. J. M. (1997), Health Impacts of Climate Change and OzoneDepletion: An Eco-epidemiological Modeling Approach, MaastrichtUniv., Maastricht, Netherlands.
Minakawa, N., C. M. Mutero, J. I. Githure, J. C. Beier, and G. Yan (1999),Spatial distribution and habitat characterization of anopheline mosquitolarvae in Western Kenya, Am. J. Trop. Med. Hyg., 61(6), 1010–1016.
Minakawa, N., P. Seda, and G. Yan (2002), Influence of host and larvalhabitat distribution on the abundance of African malaria vectors inWestern Kenya, Am. J. Trop. Med. Hyg., 67(1), 32–38.
Minakawa, N., G. Sonye, M. Mogi, and G. Yan (2004), Habitat character-istics of Anopheles gambiae s.s. larvae in a Kenyan highland, Med. Vet.Entomol., 18(3), 301–305, doi:10.1111/j.0269-283X.2004.00503.x.
Minakawa, N., G. Sonye, and G. Yan (2005), Relationships betweenoccurrence of Anopheles gambiae s.l. (Diptera: Culicidae) and size andstability of larval habitats, J. Med. Entomol., 42(3), 295 – 300,doi:10.1603/0022-2585(2005)042[0295:RBOOAG]2.0.CO;2.
Molineaux, L., and G. Gramiccia (1980), The Garki Project, 311 pp., WorldHealth Organ., Geneva.
Muriu, S. M., E. J. Muturu, J. I. Shililu, C. M. Mbogo, J. M. Mwangangi,B. G. Jacob, L. W. Irungu, R. W. Mukabana, J. I. Githure, and R. J.
Novak (2008), Host choice and multiple blood feeding behaviour ofmalaria vectors and other anophelines in Mwea rice scheme, Kenya,Malar. J., 7, 43, doi:10.1186/1475-2875-7-43.
Mutuku, F. M., J. A. Alaii, M. N. Bayoh, J. E. Gimnig, J. M. Vulule,E. D. Walker, E. Kabiru, and W. A. Hawley (2006), Distribution,description, and local knowledge of larval habitats of Anophelesgambiae s.l. in a village in western Kenya, Am. J. Trop. Med.Hyg., 74, 44–53.
Okech, B. A., L. C. Gouagna, G. F. Killeen, B. G. Knols, E. W. Kabiru, J. C.Beier, G. Yan, and J. I. Githure (2003), Influence of sugar availability andindoor microclimate on survival of Anopheles gambiae (Diptera: Culici-dae) under semifield conditions in Western Kenya, J. Med. Entomol.,40(5), 657–663.
Pascual, M., and A. Dobson (2005), Seasonal patterns of infectious dis-eases, PLOS Med., 2(1), article e5.
Pascual, M., J. A. Ahumada, L. F. Chaves, X. Rodo, and M. Bouma (2006),Malaria resurgence in the East African Highlands: Temperature trendrevisited, Proc. Natl. Acad. Sci. U. S. A., 103(15), 5829 – 5834,doi:10.1073/pnas.0508929103.
Patz, J. A., K. Strzepek, S. Lele, M. Hedden, S. Greene, B. Noden,S. Hay, L. Kalkstein, and J. C. Beier (1998), Predicting key malariatransmission factors, biting and entomological inoculation rates,using modeled soil moisture in Kenya, Trop. Med. Int. Health,3(10), 818–827.
Peugeot, C., B. Cappelaere, B. E. Vieux, L. Seguis, and A. Maia (2003),Hydrologic process simulation of a semiarid, endoreic catchment inSahelian West Niger: 1. Model-aided data analysis and screening,J. Hydrol., 279, 224–243, doi:10.1016/S0022-1694(03)00181-1.
Pollard, D., and S. L. Thompson (1995), Use of a land-surface-transferscheme (LSX) in a global climate model: The response to doublingstomatal resistance, Global Planet. Change, 10, 129–161, doi:10.1016/0921-8181(94)00023-7.
Pratt, H. D. (1948), Influence of the moon on light trap collections ofAnopheles albimanus in Puerto Rico, J. Natl. Malar. Soc., 7, 212–220.
Ross, R. (1911), The Prevention of Malaria, 2nd ed., John Murray, London.Service, M. W. (1993), Mosquito Ecology: Field Sampling Methods, 2nded., 988 pp., Elsevier, New York.
Shaman, J., M. Stieglitz, C. Stark, S. Le Blancq, and M. Cane (2002),Predicting flood and swampwater mosquito abundances using a dynamichydrology model, Emerg. Infect. Diseases, 8, 6–13.
Smith, M. E. (Ed.) (1968), Recommended Guide for the Prediction of theDispersion of Airborne Effluents, 85 pp., Am. Soc. of Mech. Eng., NewYork.
Sutherst, R. W. (2004), Global change and human vulnerability to vector-borne diseases, Clin. Microbiol. Rev., 17(1), 136–173, doi:10.1128/CMR.17.1.136-173.2004.
Takken, W., and B. Knols (1999), Odor-mediated behavior of afrotropicalmalaria mosquitoes, Annu. Rev. Entomol., 44, 131–157, doi:10.1146/annurev.ento.44.1.131.
Talbot, M. R. (1980), Environmental responses to climatic change in theWest African Sahel over the past 20,000 years, in The Sahara and theNile: Quaternary Environments and Prehistoric Occupation in NorthernAfrica, pp. 37–62, A. A. Balkema, Brookfield, Vt.
Taylor, C. E., Y. T. Toure, J. Carnahan, D. E. Norris, G. Dolo, S. F. Traore,F. E. Edillo, and G. C. Lanzaro (2001), Gene flow among populations ofthe malaria vector, Anopheles gambiae, in Mali, West Africa, Genetics,157, 743–750.
Teklehaimanot, H. D., J. Schwartz, A. Teklehaimanot, and M. Lipsitch(2004), Weather-based prediction of Plasmodium falciparum malariain epidemic-prone regions of Ethiopia: II. Weather-based predictionsystems perform comparably to early detection systems in identify-ing times for interventions, Malar. J., 3, 44, doi:10.1186/1475-2875-3-44.
Thomson, M. C., S. J. Connor, N. J. Ward, and D. Molyneux (2004),Impact of climate variability on infectious disease in West Africa, Eco-Health, 1, 138–150, doi:10.1007/s10393-004-0004-y.
Thomson, M. C., F. J. Doblas-Reyes, S. J. Mason, R. Hagedorn, S. J.Connor, T. Phindela, A. P. Morse, and T. N. Palmer (2006), Malariaearly warnings based on seasonal climate forecasts from multi-modelensembles, Nature, 439, 576–579, doi:10.1038/nature04503.
Toutin, T., and L. Gray (2000), State-of-the-art of elevation extraction fromsatellite SAR data, ISPRS J. Photogramm. Remote Sens., 55, 13–33,doi:10.1016/S0924-2716(99)00039-8.
Vandervaere, J.-P., C. Peugeot, M. Vauclin, M. Angulo Jaramillo, andT. Lebel (1997), Estimating hydraulic conductivity of crusted soils usingdisc infiltrometers and mini tensiometers, J. Hydrol., 188–189, 203–223,doi:10.1016/S0022-1694(96)03160-5.
W12445 BOMBLIES ET AL.: HYDROLOGY OF MALARIA
25 of 26
W12445

White, G. B. (1974), Anopheles gambiae complex and disease transmissionin Africa, Trans. R. Soc. Trop. Med. Hyg., 68(4), 278–301, doi:10.1016/0035-9203(74)90035-2.
World Health Organization (2005), World malaria report, Geneva, availableat http://rbm.who.int/wmr2005/html/1-2.htm.
Ye-Ebiyo, Y., R. J. Pollack, A. Kiszewski, and A. Spielman (2003),Enhancement of development of larval Anopheles Arabiensis by proxi-
mity to flowering maize (Zea Mays) in turbid water and when crowded,Am. J. Trop. Med. Hyg., 68(6), 748–752.
����������������������������A. Bomblies and E. A. B. Eltahir, Ralph M. Parsons Laboratory,
Massachusetts Institute of Technology, 15 Vassar Street, Cambridge, MA02139, USA. ([email protected])
J.-B. Duchemin, Centre de Recherche Medicale et Sanitaire, Interna-tional Network of the Pasteur Institute, BP 10887 Niamey, Niger.
26 of 26
W12445 BOMBLIES ET AL.: HYDROLOGY OF MALARIA W12445


