Embed Size (px)
Citation preview

Journal oflmmunologicalMethods, 78 (1985) 13-24 13 Elsevier
JIM03430
Evaluation of Flow Cytometry and Fluorescence Microscopy for the Estimation of Bovine
Mononuclear Phagocytes
Per Matsson 1, Caroline Fossum 2 and Bengt Larsson 3
I Department of Pathology, 2 Department of Virology, and J Department of Cattle and Sheep Diseases, Swedish University of Agricultural Sciences, College of Veterinary Medicine, 750 07 Uppsala, Sweden
(Received 3 July 1984, accepted 27 November 1984)
Bovine blood mononuclear cells were isolated by density gradient centrifugation on Ficoll-Paque. Phagocytic mononuclear cells were characterized functionally by ingestion of fluorescent latex beads. After incubation with beads the cells were treated with Triton X-100 and propidium iodide (PI) to stain DNA. Cells were analyzed with a FACS-II! instrument connected to a Nuclear Data-6660 multiparame- ter computer system. The computer was used to evaluate the 2 parameter histograms in order to enumerate the percentage of cells with different numbers of associated beads. With this system we also obtained information about cell concentration and number of beads per cell. Results from flow cytometry and manual counting by fluorescence microscopy were compared and good correlation (r = 0.91) was obtained. During the first hours of incubation latex beads adhered to cell surfaces as demonstrated by FCM histograms and fluorescence microscopy. Blood mononuclear phagocytes have to be incubated for several hours before significant phagocytotic activity can be detected.
Key words: flow cytometry - bovine monocytes - phagocytosis
Introduction
Monocytes are a minor cell popula t ion in b lood but play an impor tan t role in the
defence against infect ions by phagocytosis and degradat ion of invading micro-
organisms, as ant igen-present ing cells and by secretion of monokines. Also, in in
vi tro tests, the s t imulatory response of bovine lymphocytes to different mitogens and
their ability to react in mixed lymphocyte cultures are dependent on the p ropor t ion
of monocytes present in the cell preparat ions (Mastro and Sniezek, 1983/84) .
Rel iable methods for the ident if icat ion and quant i ta t ion of monocytes are therefore
important . Methods worked out for ident i f icat ion of human monocytes unfor-
tunately cannot be directly applied to bovine monocytes since they cannot be
Abbreviations." ANAE, acid-naphthyl acetate esterase; FCM, flow cytometry; FCS, fetal calf serum; MNC, mononuclear cells; PBS, phosphate-buffered saline; PI, propidium iodide.
0022-1759/85/$03.30 © 1985 Elsevier Science Publishers B.V. (Biomedical Division)
14
reliably differentiated on blood smears stained according to Wright (Hammer and Weber, 1974) and are not distinguished from bovine lymphocytes by acid c~-naph- thyl acetate esterase (ANAE) staining (Yang et al., 1979). Monoclonal antibodies have been used for the identification of human monocytes (Ugolini et al., 1980) but are not yet available for bovine monocytes.
Since phagocytic capacity, by definition, is one of the criteria for identification of monocytes, our interest focused on the methodological aspects involved with flow cytometric (FCM) enumeration of bovine mononuclear phagocytic cells. By the use of fluorescent beads and FCM it is possible not only to determine the proportion of phagocytic cells but also to measure phagocytic capacity in terms of number of beads associated per cell. The use of FCM also allows the possibility of measuring the concentration of free beads and cells. This should be of importance since the availability of particles is essential for phagocytosis.
Studies on the influence of incubation time, bead size and bead to cell ratio revealed that optimal phagocytosis was obtained when the cells were incubated overnight with 2 /~m beads at a ratio close to 25 beads per cell. The data obtained with FCM were compared with results from fluorescence microscopy and related to differential counting. The differential counting gave a lower proportion of mono- cytes (4.3%) with a greater variation (SD = 5.2) than the method based on phago- cytic capacity, 6.0% _+ 2.6 by FCM and 6.4% _+ 2.4 by fluorescence microscopy. Attempts were also made to distinguish non-specific adsorption of latex beads to cells from real phagocytosis by various evaluations of FCM data.
Material and Methods
Isolation of cells Heparinized (25 IU /ml ) blood was collected from 20 feed lots calves of Swedish
Red and White Breed aged 2 3 months, on 5 occasions over 10 weeks. Mononuclear cells were isolated by centrifugation on Ficoll-Paque (Pharmacia Fine Chemicals, Uppsala) according to BOyum (1968). Mononuclear cells (MNC) collected from the interface were washed twice in phosphate-buffered saline (PBS) and resuspended at a concentration of 10 6 cells per ml RPMI 1640 growth medium, supplemented with 2 mM L-glutamine, 200 I U / m l penicillin, 200/~g/ml streptomycin and 10% fetal calf serum (FCS).
Phagocytic assay The MNC were incubated with fluorescent latex beads (Polyscience, Northamp-
ton, England) at 37°C for 14-17 h, if not otherwise indicated. Two milliliter volumes of cell suspension, 106 cells/ml, were incubated in 3 ml minisorb test tubes (Nunc, Denmark) rotating at 0.5 rpm. Four different sizes of latex beads were tested, 0.57, 0.91, 1.72 and 4.43 ~m. The bead to cell ratios ranged from 250 : 1 to 1 : 1. Four different batches of '2/~m' beads were also tested.

15
Preparation of samples for analysis During development of the phagocytic assay, various methods for preparation of
samples were tested. (a) Following Steinkamp et al. (1982), each sample was layered on 3 ml of
newborn calf serum and centrifuged for 10 min at 360 x g, The pelleted cells were washed in saline before fixation.
(b) Methanol-fixed cells were incubated in xylene for 10 rain at room temperature to dissolve extracellular beads (Gardner et al., 1973).
(c) One hundred microliters 1% Triton X-100 were added to give a final concentration of 0.05% detergent in the samples.
All samples were stained by addition of 25 /~1 propidium iodide (PI, 1 mg /ml PBS) and examined within 3 h. As a routine preparation method for the phagocytic assay the detergent procedure was used.
Flow cytometric eualuation of prepared samples The instrument used was a slightly modified flow cytometer (FACS-III, Becton
Dickinson) equipped with a 5 W argon ion laser (Spectra Physics) and dual fluorescence channels. In order to calculate the number of particles passing the detector per unit volume the sample was forced into the system at a constant speed maintained with a peristaltic pump (no. 2132, LKB, Sweden). A computer system (ND-6660 multiparameter acquisition system, Nuclear Data, Chicago, IL) was used to collect and display the signals coming from the FACS-III system.
During analysis the argon ion laser was run at 488 nm and 500 mW effect. Dual fluorescence channels were used for green (530-565 nm) and red (600-650 nm) fluorescent light detection. The ND-6660 multiparameter system was set up to analyze signals from the red and green light detectors with a 2-parameter histogram (64 x 64). The samples were run at the same speed and the system was triggered on red fluorescence. For measuring the relative bead to cell ratio the red and green signals were counted automatically (Tektronix DC-504) and the ratio was recorded.
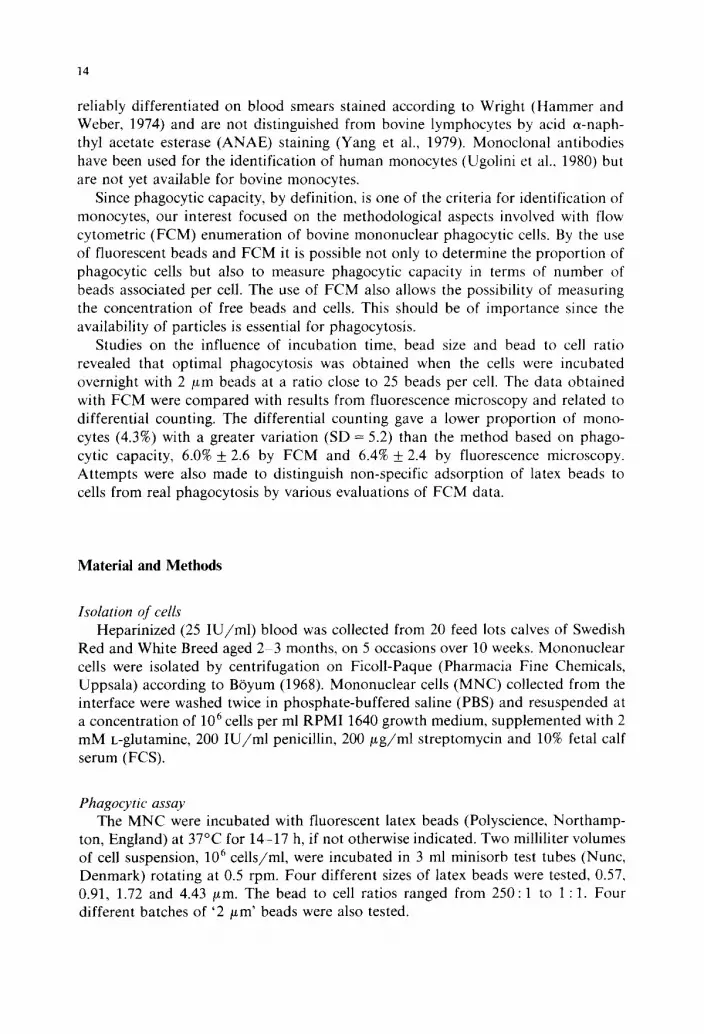
After analysis, the 2-parameter histogram was divided into 7 areas, A -G , where area A defined cells without beads and areas B-E defined cells with increasing numbers of beads. Area F defined doublets of cells and area G cell debris (Fig. 1). The number of cells in each area was then calculated.
Fluorescence microscopy Samples from the cell preparations were scored in a fluorescence microscope
(Leitz, Orthoplan) equipped with a 200 W mercury arc lamp and Ploemopak I2 and M. 100-150 cells in each sample were counted and the proportion of phagocytic cells was determined by counting cells with 3 or more beads as phagocytic cells.
Morphological identification of monocytes among mononuclear cells by differential cell counting
Routine differential counts were performed on 75 samples of 2 ml EDTA-blood at the Department of Clinical Chemistry (College of Veterinary Medicine, Swedish Agricultural University) by a standard method. The proportion of monocytes among
16
kl3
g -..I
_3
t
0 !
. . . . . . . . . . . . . . . . . . . . . . . . . . -aTO . . . . . . . . . . . . . . . . . . . . . . . . . . . . T6--' 0
REL, GREEN FLUORESCENCE INTENSITY
Fig. 1. Correlated dot-plot between red (DNA) and green (beads) fluorescence signals. The areas in the dot-plot describe: A, single cells with no latex beads; B, single cells with a low number of latex beads: C-E , Single cells with increasing number of latex beads; F, cell doublets with no latex beads; G, debris.
blood MNC was calculated as the number of monocytes divided by the number of monocytes plus the number of lymphocytes.
Statistical analyses Linear regression was used to determine
variables (Ostle and Mensing, 1975). the degree of correlation between
Results
Influence of size and concentration of latex beads" on the phagocytic assay To optimize the phagocytic assay, different sizes, batches and concentrations of
latex beads were tested. As revealed by microscopy, the smallest beads tested, 0.57 and 0.91 t~m, tended spontaneously to form aggregates that bound to and covered the cells, making it impossible to get a reliable number of phagocytosing cells. The largest beads, 4.43 /~m, were hardly phagocytosed by any cell. Optimal resolution and phagocytic activity was obtained with 2/~m beads both as regards FCM analysis and fluorescence microscopy, even if different batches varied in homogeneity and brightness. The following experiments were therefore performed with 1.72 /~m latex beads (Polyscience, batch no. 23390).
Addition of 5/~1 latex bead stock solution to 2 ml cell suspension gave an average ratio of 25 _+ 5 free beads/cell at the time of analysis. The relation between the

17
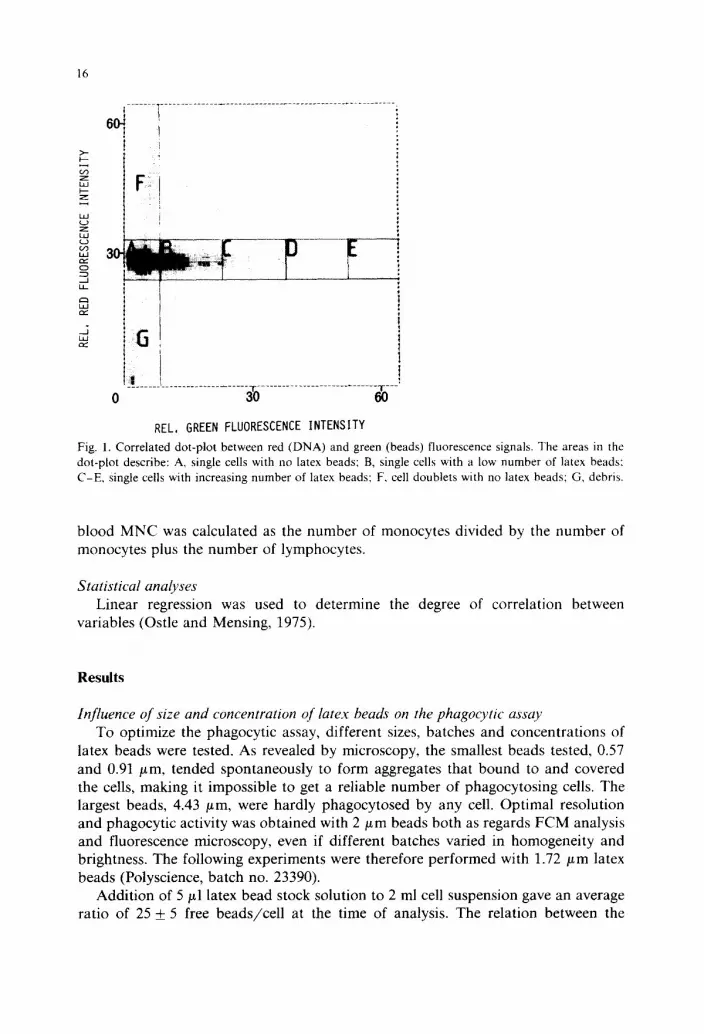
number of beads added and the number of cells associated with beads followed a linear equation y = kx + l (y = bead concentration, x = cells associated with beads, k = 1.38, l = 1.31) and had a correlation coefficient of 0.99 (n = 33) (Fig. 2). Adherent beads probably gave the positive slope of the line and phagocytosed beads the negative intercept.
FCM measurements of the cell concentration and the bead to cell ratio in the samples at the time of analysis showed good reproducibility with an average cell concentration of 0.83 × 10 6 -F 11% per ml and 25 +_ 5 beads per cell.
Linear regression analysis, over 22 samples, between the volume of beads added to the samples (/zl beads/sample) and bead concentration calculated from the FACS-III , gave a correlation coefficient of 0.98 (Fig. 3).
Influence of sample preparation technique on the phagocytic assay Removal of free beads by centrifugation of the samples on calf serum and
subsequent washing of the pelleted cells is time consuming and removes only free but not adherent beads. Repeated centrifugations led to cellular losses, which interfered with calculation of the proportion of phagocytic cells.
Both free and adherent beads are dissolved by xylene treatment but the cells need fixation in methanol to resist the xylene. Methanol fixation induced aggregation in
u J
m
5 0 -
10
I I I I I t 1 f i I
: v
3
2
1
0 ~ [ 'k~, I J ,,t,,, ! J
1 2 3 4 5 8 9 30 40
% CELLS W I T H BEADS
Fig. 2. Correlation between amount of beads added (~l beads/sample) and proportion (%) of cells with beads (r = 0.99, n = 32).

]8
the cell suspension, which therefore had to be filtered prior to analysis. Removal of the aggregates made it impossible to obtain a reliable proportion of phagocytic cells.
Addition of detergent to the samples was sufficient to allow penetration of PI for DNA staining and also minimized aggregate formation. Since the technique of preparation was simple and rapid and eliminated prefiltration of the samples, it was used in the experiments described. However, the samples need to be analyzed within 3 h after the addition of detergent since exposure of cells for a longer period causes swelling of cells and loss of phagocytosed beads.
Influence of incubation time on the phagocytic assay The effect of incubation time on the proportion of observed phagocytic cells was
studied over a 17 h incubation period (Fig. 4). The microscopic observations divided the cell population into cells with 1-2 beads and cells with >/3 beads as proportions of the total cell population. The F'CM data were analyzed with respect to number of cells in the different areas defined in Material and Methods. The results are expressed as mean values of 3 experiments. Microscopic observation showed that after 10 min incubation, 12% of the cells had bound 1-2 beads while none of the cells had phagocytosed >/3 beads. The proportion of cells with 1 2 beads decreased slightly after 2 h incubation and was reduced to 2.7% after 8 h, where it remained even until 17 h. After 4 h incubation the proportion of cells with >~ 3 beads began to increase and reached a value of 5.3% after 17 h.
The same pattern was observed with FCM analysis of the sample. Seventeen percent of the cells were found in area B after 10 min incubation. The number of cells in area B began to decrease after 2 h incubation and was reduced to 4.6% after 8 h and remained at 4.2% after 17 h (Fig. 4). The total proportion of cells in areas C E was constant but a redistribution of cells from area C to areas D and E, indicating an increased number of beads per cell, was observed after 8 h incubation (Fig. 5).
I 0
,--, L, W m
3 0,"
2 4 6 8
RATIO
,7 I I [ 1 I
30 ~0 5O
BEADS/CELLS
Fig. 3. C o r r e l a t i o n be tween a m o u n t of b e a d s a d d e d to the s amp le (p.l b e a d s / s a m p l e ) a n d ca l cu l a t ed bead to cell ra t io ( r = 0.98, n = 22).

19
Proport ion cetts wi th tatex beads
20
\
\
\
\ ~ \ I - / " - . V ~, / - / " - ...
10 • .-" "-.
.... o'~'~.. ~-~--''" ~-'--'°~" I .................. I I . . . . . . . . .
I - - - I " I " I ~ ~ I I 1 1 I
10' 30' 1 2 /. 8 17 hours
Fig. 4. P ropor t ion (%) of cells with latex beads af ter d i f ferent incuba t ion times. M e a n value of 3
exper iments . - - , cells wi th < 3 latex beads. Ident i f ied by f luorescence microscopy. - - - , cells
wi th > 3 latex beads. Ident i f ied by f luorescence microscopy. - . . . . , cells in area B. • . . . . . , cells in area
C - E .
Correlations between different techniques for identification of bovine monocytes The correlation coefficient between the proportion of phagocytic cells in 94
samples determined by FCM and by fluorescence microscopy was calculated (r = 0.53). When the mean microscopy value for each FCM value was calculated the correlation increased (r = 0.91) (Fig. 6). The correlation between the proportion of phagocytes identified morphologically and by FCM was also calculated (r = 0.33)
Ratio area D + E / C
1.0
I.-- (...)
(,.) m
o Oo 0.5
I-- .._J
,= . . . . . . .
--° . . . . . . . . .
t I I I I I / t I
10" 30' 1 2 4 8 17 hours
I N C U B A T I O N T I M E
Fig. 5. T ime d e p e n d e n c e of p h a g o c y t o s i s as ca l cu l a t ed f r o m F C M do t -p lo t s where the n u m b e r o f cells in
a reas D + E is d iv ided b y the n u m b e r o f cells in a r e a C. This ra t io ind ica tes the p h a g o c y t i c act iv i ty of the
cells, The 3 lines r ep resen t values for p h a g o c y t i c act iv i ty o b t a i n e d f r o m 3 d i f fe ren t calves.

20
(n = 75). When the mean percentage of monocytes calculated from differential counting for each FCM value was calculated, the correlation coefficient increased to 0.78 (Fig. 7).
Proportion of mono~ytes among bovine MNC The mean value for the proportion of monocytes among bovine MNC obtained
from the animals described in Material and Methods varied with the method used for their identification. Differential counting gave a lower proportion of monocytes (4.3%) with a greater variation (SD = 5.2) than the method based on phagocytic capacity. The proportion of phagocytic cells was estimated at 6.0% _+ 2.6 by FCM and at 6.4% _+ 2.4 in the fluorescence microscope (Table I).
20
E I
~,15
E
u
f~ N 5
4.0 ee C
I
c~ c i , c
c
I !
i i I
5 10 15 % phagocytic cetl.s-FCH analysis
Fig. 6. Correlation between proportion (%) of phagocytic cells enumerated by FCM and by fluorescence microscopy. For each FCM value the mean microscopy value was calculated. • = mean value+_SD,
n = number of samples, r = 0.91.

21
1 5
c
E I
",~
o
E I
Z
E
. ' -
~ + - ,, I ~ C
r,+
ii uP
i i
iI I I I
5 10 15 % phagocytic coLLs-FCM analysis
Fig. 7. Correlation between the proportion of phagocytic cells enumerated by FCM and monocytes identified morphologically. For each FCM value the mean monocyte value was calculated. 1 = mean value + SD, n = number of samples, r = 0.78.
TABLE 1
PROPORTION OF MONOCYTES AMONG MONONUCLEAR CELLS OBTAINED FROM CALVES (2-3 MONTHS OLD) DETERMINED BY DIFFERENTIAL COUNTING, FLOW CYTOMETRY AND FLUORESCENCE MICROSCOPY
Differential FCM Fluorescence counting microscopy
Mean value 4.3 6.0 6.4 SD 5.2 2.6 2.4 n 38 38 37 Range 0-20 2-14 3-13
Discuss ion
Several authors, using different methods, have quantified the proportion of monocytes among bovine blood MNC. However, the proportion of cells identified as monocytes varies with the method used. Hammer and Weber (1974) found 6.7% monocytes by a hematological method but found as many as 22.3% monocytes when examining the ultrastructure of cells from the same preparations in the electron microscope. Grewal et al. (1978) identified 4-7% of the cells as monocytes using

22
Giemsa's staining, Johansson and Morein (1983) found 3 9% monocytes using peroxidase staining, while Splitter and Everlitt (1982) identified 18% of the cells as monocytes by uptake of neutral red. From microscopy for latex particle ingestion, different proportions of monocytes among bovine blood MNC have been reported, ranging from 6% (Usinger and Splitter, 1981) or 7% (Hu and Muscoplat, 1980) to 19% (Paul et al., 1979).
The proportion of active phagocytic cells is relevant to assessment of the immunological status of an animal. Further, the capacity of bovine lymphocytes to react in mixed lymphocyte cultures, and to respond to different mitogens in the lymphocyte stimulation test, is highly dependent on the proportion of monocytes present in the cell preparations used (Mastro and Sniezek, 1983/84). A reliable method for the identification and quantitation of bovine monocytes is therefore needed. Cell preparations used in tests measuring cell-mediated immune reactivity are commonly isolated by Ficoll centrifugation of blood, which gives a cell popula- tion depleted of red blood cells and granulocytes, but enriched for lymphocytes and monocytes. We therefore used phagocytic activity, one of the characteristic proper- ties of monocytes/macrophages, to discriminate between monocytes and lympho- cytes. The method described here has also proved useful for cells isolated from the dry period secretion of the mammary gland (Concha, Holmberg and Astr/Sm, unpublished).
To optimize conditions for phagocytic assay, we chose fluorescent latex beads as material to be phagocytosed. The fluorescence emitted from the particles makes them easy to observe in the fluorescence microscope and also permits flow cytomet- ric measurements by which as many as 10,000 cells may be counted over a short period. Further, inert non-opsonized latex beads are not degraded after phagocytosis and the phagocytic activity is not influenced by previous exposure of the animal to any antigen as it may be in assays based on bacterial ingestion.
Results by both FCM analysis and cell counting in the microscope are markedly affected if the cells or beads aggregate. The simple and rapid preparation technique with addition of detergent to the samples prior to analysis reduces almost all cellular clumping and eliminates the need for prefiltration of the samples. Detergent also increased the permeability of cell membranes enough to allow penetration of propidium iodide for staining of DNA.
The red fluorescence emitted from PI-labeled DNA made it possible to dis- tinguish clearly between singlets and doublets of cells and cell debris during FCM analysis and also simplified identification and counting of cells in the fluorescence microscope.
The main problem to overcome when determining the proportion of phagocytic cells is to distinguish between adherent latex beads and truly phagocytosed ones. Attempts have been made to eliminate non-phagocytosed latex beads from prepara- tions prior to examination. Gardner et al. (1973) successfully dissolved extracellular beads with xylene in fixed cell preparations. Xylene could not be used on cells in suspension, since it induces cell clumping, affects the morphology of the cells and may dissolve beads already phagocytosed, leading to underestimation of phagocytic capacity (Van Furth and Diesselhoff-Den Dulk, 1980). To remove non-phagocytosed

23
particles Steinkamp et al. (1982) centrifuged the samples on serum gradients. Only free, not adherent, particles were removed by this procedure.
The use of different fluorochrome labels for cells (red fluorescence) and latex beads (green fluorescence) made it easier to distinguish adherent extracellular beads from truly phagocytosed beads in the fluorescence microscope. With FCM analysis free beads are electronically distinguished if the speed of analysis, i.e., the mean time between analyses of the 2 kinds of particles is less than the coincidence timing of the instrument (Parod and Brain, 1983). FCM analysis also made it possible to divide bead uptake into different categories (Fig. 1) reflecting different amounts of particles associated with cells, and allowed calculation of bead uptake from the dual fluores- cence histogram. We found that cells rarely bind more than 1-2 beads at a time. These cells were found in area B and were omitted when calculating the proportion of true phagocytes.
Phagocytosis is limited by the number of beads accessible to the phagocytes. If the bead to cell ratio is sufficient to allow all phagocytes to ingest beads, the proportion of observed phagocytes should be independent of the particle concentra- tion (Bass~Se and Solberg, 1984). However, Fig. 3 shows that the number of cells with beads increases linearly with increasing bead concentration. This increase over the plateau level was probably mainly due to adherence of beads to non-phagocytes and to a minor extent to coincidences in the analysis system.
Adherence of the particle to be phagocytosed is the first event in phagocytosis but may also occur on non-phagocytes. Adherence could be mediated by cytophilic antibodies present on both monocytes and lymphocytes when freshly isolated from blood (Lobo and Horwitz, 1976). Cytophilic antibodies are released from lympho- cyte cell membranes after 1 h incubation at 37°C (Watson, 1976) but remain on monocytes up to 16 h or more (Shaala et al., 1979).
Thus binding of latex particles via cytophilic antibodies on monocytes and lymphocytes could be responsible for the proportion of observed cells with 1-2 associated beads during the first hours of incubation (12%, by microscopic observa- tion, 17% by FCM analysis). Similarly, Dunn et al. (1983) found that 19% of mouse peritoneal cells had approximately 1 latex particle associated with them after 30 min incubation at 4°C. Length of the incubation time is thus the most important cause of recording of 'false' phagocytes owing to adherence of particles to the cells.
As well as showing that cytophilic antibodies become detached during incubation, Shaala et al. (1979) reported that freshly isolated human monocytes ingest latex particles inefficiently over short culture periods but that ingestion is more obvious in preparations incubated overnight. Bennet and Cohn (1976) also showed that phago- cytosis of bacteria by human monocytes was low during the first hours of incubation and reached maximum values after 24 h.
The proportion of phagocytes measured by FCM was confirmed by fluorescence microscopy, although some discrepancies were observed (Fig. 6) probably owing to the low number of cells counted by microscopy compared with F C M analysis, and the small number of phagocytes among blood MNC (2-15% by FCM, 1-19% by microscopy). Differential counting gave an overall lower proportion of monocytes than that obtained by measuring the proportion of phagocytes, perhaps owing to

24
difficulties in distinguishing bovine monocytes morphologically from lymphocytes (Hammer and Weber, 1974). Further, differential counting was performed directly on freshly collected blood while the proportion of phagocytes was determined on cells cultured for 14-17 h. In spite of this, the mean value for phagocytes determined by FCM (6.0 _+ 2.6) and by fluorescence microscopy was related to the proportion of monocytes determined by differential counting (Table I).
In summary we wish to stress the importance of long incubation time when determining the proportion of bovine monocytes in cell preparations obtained from freshly collected blood for 2 reasons. During the first hour of incubation, latex particles adhere to non-phagocytic cells thus giving a false proportion of monocytes. Secondly, freshly collected monocytes need to mature in culture to attain their full phagocytic capacity.
Acknowledgements
We express our thanks to Mr. Karlborg for allowing us to collect blood from his calves. We also thank Mrs. I. Andersson for typing the manuscript.
This work was financially supported by grants from the Swedish Council for Forestry and Agricultural Research.
References
BassOe, C.F. and C.O. Solberg, 1984, Acta Pathol. Microbiol. Scand. 92, 43. Bennet, W.E. and Z. Cohn, 1965, J. Exp. Med. 123, 145. B6yum, A., 1968, Scand. J. Clin. Lab. Invest. 21 (Suppl. 9), 4. Dunn, P.A., W.R. Eaton, E.D. Lopatin, J.E. McEntire and B.W. Papermaster, 1983, J. lmmunol. Methods
64, 71. Gardner, D.E., J.A. Graham, F.J. Miller, J.W. Illing and D.L. Coffin, 1973, Appl. Microbiol. 25,471. Grewal, A.S., B.T. Rouse and L.A. Babiuk, 1978, Int. Arch. Allergy Appl. Immunol. 56, 289. Hammer, B.F. and A.F. Weber, 1974, Am. J. Vet. Res. 35, 527. Hu, W.S. and C.C. Muscoplat, 1980, Am. J. Vet. Res. 41,447. Johansson, C. and B. Morein, 1983, Vet. Immunol. Immunopathol. 4, 345. Lobo, P.I. and D.A. Horwitz, 1976, J. Immunol. 117, 939. Mastro, A.M. and M.J. Sniezek, 1983/84, Vet. Immunol. Immunopathol., 5, 161. Ostle, B. and R. Mensing, 1975, Statistics in Research: Basic Concepts and Techniques for Research
Workers (Iowa State University Press, lowa) p. 237. Parod, R.J. and J.D. Brain, 1983, Am. J. Physiol. 245, 220. Paul, P.S., D.R. Senogles, C.C. Muscoplat and D.W. Johnson, 1979, Clin. Exp. Immunol. 35, 306. Shaala, A.Y., H.S. Dhaliwal, S. Bishop and N.R. Ling, 1979, J. lmmunol. Methods 27, 175. Splitter, G.A. and K.M. Everlith, 1982, Cell. Immunol. 70, 205. Steinkamp, J.A., J.S. Wilson, G.E. Saunders and C.C. Stewart, 1982, Science 215, 64. Ugolini, V., G. Nunez, G. Smith, P. Stastny and J.D. Capra, 1980, Proc. Natl. Acad. Sci. U.S.A. 77, 6764. Usinger, W.R. and G.A. Splitter, 1981, J. Immunol. Methods 45, 209. Van Furth, R. and M.M.C. Diesselhoff-Den Dulk, 1980, Scand. J. Immunol. 12. 265. Watson, D.L., 1976, Immunology 31, 159. Yang, T.J., P.A. Jantzen and L.F. Williams, 1979, Immunology 38, 85.


