Embed Size (px)
Citation preview

Cs
ICUDB
RUJB
EJCDG
JDCDG
1
Cbmlfaeteealnfsatmi�beiwc
AI3
Journal of Biomedical Optics 15�4�, 047010 �July/August 2010�
J
ell deformation cytometry using diode-bar opticaltretchers
hab Srajharles D. Eggletonniversity of Maryland Baltimore Countyepartment of Mechanical Engineeringaltimore, Maryland 21250
alph Jimenezniversity of Colorado
ILA and Department of Chemistry and Biochemistryoulder, Colorado 80309
rich Hoovereff Squierolorado School of Minesepartment of Physicsolden, Colorado 80401
ustin Chichesteravid W. M. Marrolorado School of Minesepartment of Chemical Engineeringolden, Colorado 80401
Abstract. The measurement of cell elastic parameters using opticalforces has great potential as a reagent-free method for cell classifica-tion, identification of phenotype, and detection of disease; however,the low throughput associated with the sequential isolation and prob-ing of individual cells has significantly limited its utility and applica-tion. We demonstrate a single-beam, high-throughput method whereoptical forces are applied anisotropically to stretch swollen erythro-cytes in microfluidic flow. We also present numerical simulations ofmodel spherical elastic cells subjected to optical forces and show thatdual, opposing optical traps are not required and that even a singlelinear trap can induce cell stretching, greatly simplifying experimentalimplementation. Last, we demonstrate how the elastic modulus of thecell can be determined from experimental measurements of the equi-librium deformation. This new optical approach has the potential tobe readily integrated with other cytometric technologies and, with thecapability of measuring cell populations, enabling true mechanical-property-based cell cytometry. © 2010 Society of Photo-Optical InstrumentationEngineers. �DOI: 10.1117/1.3470124�
Keywords: biomedical optics; cells; detectors.Paper 09564RR received Dec. 18, 2009; revised manuscript received Jun. 2, 2010;accepted for publication Jun. 3, 2010; published online Aug. 4, 2010.
Introduction
ellular elastic properties are primarily related to their mem-rane composition and cytoskeletal architecture, which is re-odeled by physiological and pathological events during the
ife cycle. The forces required to observe deformation rangerom �10 to 1000 pN, depending on the cell type and therea of its application. Accordingly, measured values of celllasticity vary over orders of magnitude depending on the cellype, health, and technique employed for measurement. Forxample, malignant fibroblasts have been found with half thelasticity of normal cells as determined by micropipettespiration,1 whereas malignant epithelial cells have a 10-foldower elastic modulus than normal cells as measured via scan-ing force microscopy.2,3 Furthermore, metastatic cells takenrom patients with suspected lung, breast, and pancreas cancerhow 70% reduction in the elastic modulus as measured bytomic force microscopy �AFM�.4 This study also found thathe distribution of cell stiffness for the metastatic cells is
uch narrower than for healthy cells. Parasitic infection alsonfluences cell mechanics—for example, red blood cellsRBCs� infected by Plasmodium falciparum are observed toe significantly stiffer than normal RBCs, as malaria parasitesxpress proteins that stiffen the cell membrane.5,6 Differencesn the elastic modulus of normal RBCs and those infectedith parasites at different growth stages have shown, in some
ases, 10-fold increases in the elastic modulus.7,8 These ex-
ddress all correspondence to David Marr, Colorado School of Mines, 1500llinois Street, Golden, Colorado 80401. Tel: 303-273-3008; Fax: 303-273-730; E-mail: [email protected]
ournal of Biomedical Optics 047010-
amples of disease-cell mechanics correlations suggest thatcellular mechanical properties may provide a direct route todetecting disease or assessing its progression and motivatesthe development of a cytometry-based technique for measur-ing the distribution of elastic parameters.
Traditional bulk methods that subject cell suspensions toshear forces and extract a mean deformability with lightscattering9,10 provide average information for large numbersof cells but cannot resolve single-cell properties. In contrast, arange of methods including AFM,11,12 micro-needles,13,14 cellstretching between plates,15 micropipette aspiration,16 mag-netic microbeads,17 intracellular methods,18,19 and microflu-idic flow-based methods,20,21 can probe the mechanics ofsmall numbers of individual cells. Most recently, optical trap-ping techniques have been used to manipulate cells in variousways, both with and without attached micro-beads.22–27 In anapproach closely related to the method presented here, cellstrapped by divergent counterpropagating light sources28 havebeen elongated along the beam axis.28,29 In this technique,however, each cell is sequentially trapped and then stretched,resulting in very low throughput; efforts to increase speed andperform measurements in microfluidic systems have attained10 to 100 cells /h to date.30,31 However, because both fluiddrag on trapped cells and measurement rate are proportionalto fluid velocity, extension of this method to flowingsystems29 to increase throughput would require increasing la-ser power to optical intensities that result in cell damage.32,33
1083-3668/2010/15�4�/047010/7/$25.00 © 2010 SPIE
July/August 2010 � Vol. 15�4�1
npfsoslaahoWuottamuctffafflfcselr
22Tmfspwnwmus
tboesmtsdis
Sraj et al.: Cell deformation cytometry using diode-bar optical stretchers
J
To achieve single-cell resolved measurements for largeumbers �103 or more� of cells at data acquisition rates com-arable to current cell cytometers, we have developed a dif-erent approach in which an anisotropic optical trap from aingle emitter diode laser probes individual cells in a continu-us microfluidic flow. In earlier work with linear traps fromingle-emitter diodes, we demonstrated that these compactight sources can impart significant forces34 appropriate forctuating flowing cells. Here, we present both experimentalnd computational results on simplified new geometries forigh-throughput cell-mechanics measurements and first dem-nstrate that a single anisotropic trap can deform static cells.e then extend this approach to cells in microfluidic flow
sing long diode bars in a format whose throughput is limitednly by the time scale of the cell elastic response. To illustratehe mechanism of force generation and to obtain the cell elas-ic parameters, we model the cell deformation as a function ofpplied optical trap power using the immersed boundaryethod �IBM�35 coupled with ray-optics. The IBM has been
sed extensively to simulate cell–fluid interactions35–38 andell interactions with ligand-coated surfaces37 and can be usedo model the deformation in both optical and hydrodynamicorce fields. In our studies, the diode laser induces opticalorces on the cell surface due to the refractive index mismatchnd refraction at the fluid/cell interface. This interaction de-orms the cell until its elasticity balances the applied opticalorces. In addition, the deformation causes fluid flow thateads to viscous stresses that influence the characteristic timesor the induced stretch and its relaxation to equilibrium. Thisombination of experiment and simulation demonstrates that aingle linear diode optical trap provides a convenient geom-try for inducing deformation and obtaining the shear modu-us of each cell from the observed equilibrium deformation atates �1 s−1.
Materials and Methods.1 Experimental Methodhe experimental design is illustrated in Fig. 1. Rectangularicrofluidic channels 15 �m deep and 150 �m wide were
abricated in polydimethyl-siloxane �PDMS� using standardoft lithography techniques39 and bonded to glass usinglasma surface activation. A pair of 10� �NA 0.25� objectivesas used to image the diode laser into the microfluidic chan-el. A 200-mW, single-mode, 830-nm, 1�3 �m laser diodeas used for measurements on stationary cells, and a 5-W,ultimode, 808-nm, 1�200 �m single-emitter laser was
sed for measurements in flow. Applied laser power was mea-ured at the system input.
For this initial study, we employ swollen RBCs becausehey lack internal structure and their elastic properties haveeen well characterized. In addition and because only the thin,uter phospholipid membrane contributes to the overall celllasticity, they can be numerically modeled as a simplepherical elastic shell filled with a homogeneous fluid. Experi-entally, samples consisted of heparinized bovine RBCs ob-
ained from a slaughterhouse and used within 24 h of acqui-ition. Samples were centrifuged at 4000 rpm for 10 min,ecanted, and diluted in tris buffered saline at 145 mOsm tonduce swelling. Measurements on spherical cells simplifyimulation of the applied optical forces40 and eliminate rota-
ournal of Biomedical Optics 047010-
tion of RBCs in the trap.41 RBCs were imaged using Koehlerillumination though a 40� Carl Ziess objective and a 640�480 pixel CCD camera operating at 100 frames /s. Imageswere stored and analyzed by first normalizing and subtractinga background frame, smoothing with a 9�9 Gaussian kernel,and applying a threshold. Contours were then found usingOpenCV,42 which was also used to determine spatial mo-ments, the centroid, an equivalent ellipse, the ellipse orienta-tion relative to the trapping bar, and the major and minor axesmagnitudes corresponding to that ellipse. The changes in theminor �B� and major �A� axis width during and after stretchrelaxation were used to calculate the percentage of minorstretch as �B−B0� /B0 and of major stretch as �A−A0� /A0.Image analysis of stored video was performed on a computerwith a 2.66-GHz quad core processor. Image analysis timesare equivalent to video length at 100 frames /s and could bedone in real time with straightforward program modification.
2.2 Numerical MethodIn the IBM, a finite element model of the cell membrane isused to relate local membrane forces to local membrane de-formation. Details of the numerical implementation and vali-dation of the model can be found in previous work.36 Here,we modify the IBM to simulate cell deformation due to diodebar optical traps by imposing external optical forces from aray-optics model of the 808-nm light source. We apply theseoptical forces to find the equilibrium deformation and thenremove the forces to simulate the relaxation process. Forswollen RBCs, we model the cell as a sphere of initial radiusa=3 �m with an infinitely thin, hyperelastic, neo-Hookeanmembrane of negligible bending resistance, characterizedsolely by the membrane shear modulus Gh=3.4�10−2 dyne /cm. In this model, the strain energy is given byWh=Gh��1
2+�22+�1
−2�2−2−3� /2, where �1 and �2 are the pla-
nar principal strains. In our simulations, an unstressed spheri-cal cell is first placed in an incompressible Newtonian fluidwith the same density �=1 g /cm3 and viscosity �=0.8 cP asthe cytoplasmic fluid. The index of refraction is 1.37 for thefluid inside the cell43 and 1.33 outside the cell. The fluid do-
Fig. 1 Experimental setup, including flowing microfluidic geometry.Measurements made within the trap �near the end� and after exitingthe trap are used to determine cell shape and orientation.
July/August 2010 � Vol. 15�4�2

mpstt
dlBcghmdfa=twtitReama
33Wult1o
Fpd4d1=
Sraj et al.: Cell deformation cytometry using diode-bar optical stretchers
J
ain is a cube with a side that is 8 times the cell radius witheriodic boundary conditions. The uniform grid used in ourimulations has 643 nodes, with a grid spacing of a /8, whilehe finite element cell grid has 20,480 triangular elements. Aime step of 10−5 s was used to ensure numerical stability.
To compare the magnitude of the simulated and measuredeformations, we characterize the deformed cell with the Tay-or deformation parameter DF= �A−B� / �A+B�, where A and
are the lengths of the major and minor axes of elongatedells. Defined here for the x-y plane �Fig. 1�, DF describes theeometrical deformation from perfect spheres �DF=0� toighly elongated morphologies. To extract the cell shearodulus from experimental data, we simulate the equilibrium
eformation DF��F*� as a function of dimensionless force F*or several different applied laser powers, thereby generating
standard curve that is used with measurements of DFDF�−DF0 to extract a corresponding F* and Gh. In this,
he dimensionless force is defined as F*=Foptical /3aGh,here Foptical=n1PQ /c, with P the laser power incident on
he cell, c the speed of light in a vacuum, n1 the refractivendex of the surrounding medium, and Q a factor describinghe amount of momentum transferred, calculated followingef. 28 for spherical model systems but adapted here for lin-ar optical sources.44 Q is independent of the power appliednd depends only on object geometry and reflectance of theedium. In our simulations and under small deformation, we
ssume constant forces with a constant Q calculated as 0.011.
Results and Discussion.1 Experimental Results/Static Measurementse first show in Fig. 2 that a single, anisotropic beam can be
sed to elongate individual RBCs trapped with a 1�3 �maser diode under static, no-flow conditions. Laser powers upo 80 mW consistently lead to stretching on the order of 5 to5%, where, at lower applied powers, a clear linear trend isbserved. The change in slope and the large error bars at
ig. 2 Measured RBC minor axis stretch as a function of appliedower under static conditions. Insets show images of cells at threeifferent applied powers: �a� 10 mW/�m; �b� 30 mW/�m; �c�0 mW/�m. RBCs �n=9� were individually trapped and stretcheduring a ramping of applied power for a total time of approximatelyto 2 min. A linear fit to the low-power regime finds that %stretch�−0.57±0.09�*power/ length �mW/�m�+ �3.54±0.93�.
ournal of Biomedical Optics 047010-
higher applied powers demonstrate a limit to the amount ofpower an RBC can experience before permanent deformationin a static optical trap if exposed for long times.33 If, however,stretching times are kept short, repeated measurements can bemade on a single RBC at higher powers, as demonstrated inFig. 3 and Video 1. In these measurements, the undeformedRBCs are not spherical; thus, the laser induces both alignmentand stretch along the long axis of the laser beam. The majorstretch axis of the cell and the laser axis are not perfectlyaligned because the 3-�m “long” axis of the laser is signifi-cantly shorter than the RBC diameter �6 to 8 �m�. Figure 4and Video 2 quantify both the measured cell stretch and re-laxation as the laser is repeatedly switched on and off. Nodeviation of measured stretch was seen in �50 cycles. A fitof the measured stretch relaxation to a decaying exponentialover multiple measurements indicates that the time scalesfor the stretching and cell relaxation are on the order of�r�0.10 s, as observed in previous studies.45,46
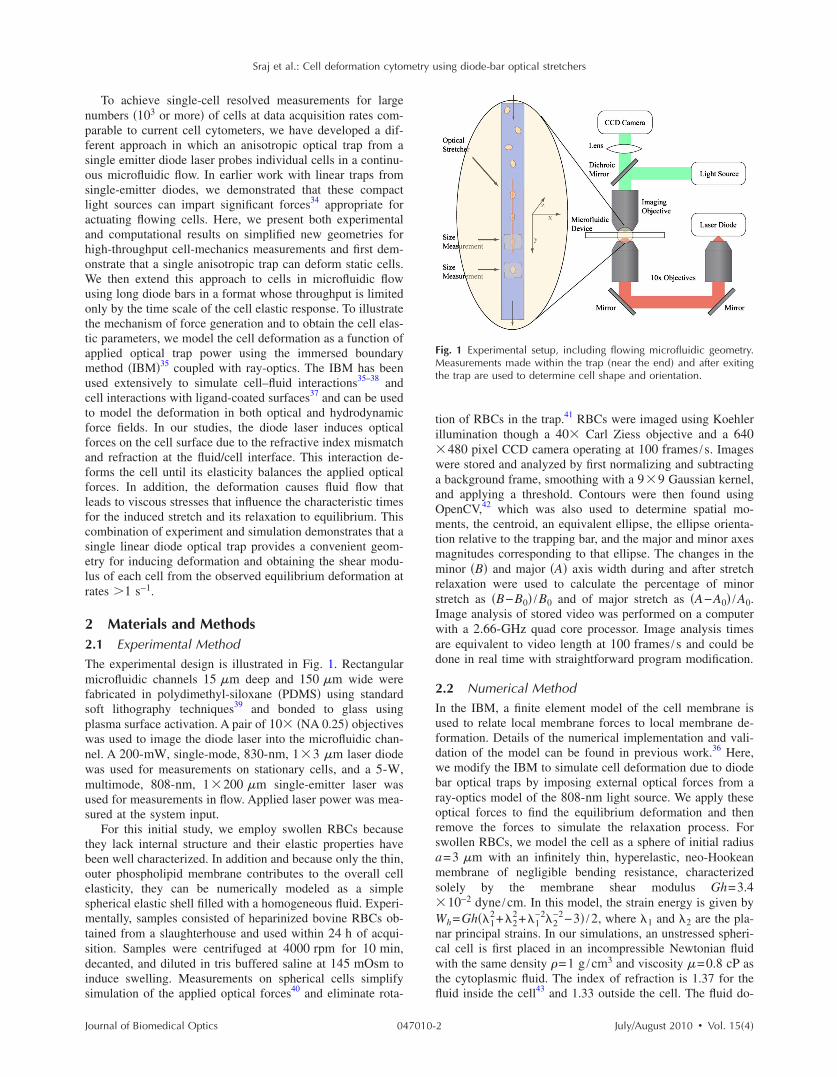
3.2 Experimental Results/Dynamic MeasurementsHere, we present measurements of RBC stretching in rectan-gular microfluidic channels at flow speeds of �50 �m /s witha 1�200 �m emitter operated at 3.2 W measured at the im-aging plane outside the medium �Fig. 5�. By comparing thecell size before and after exiting the trap, the average stretchwas found to be 2 to 3%. Due to conservation of mass, stretchalong the minor axis is negative, while stretch along the majoraxis �parallel to the laser axis� is positive �Fig. 5�a��, and as
Fig. 3 Sequential images of an RBC repeatedly stretched with a1�3 �m laser diode at 40 mW/�m applied power. �a� Trap on; �b�then off; �c� then on again �Video 1�. Unlike the slower ramping ex-periments of Fig. 2, higher powers can be employed for repeated,rapid measurement where we have seen no alteration of cell behaviorafter 50 pulses. Scale bar=4 �m.
Video 1. A single RBC can be repeatedly stretched using a1�3 �m optical stretcher �1.9 MB�.�URL: http://dx.doi.org/10.1117/1.3470124.1�.
July/August 2010 � Vol. 15�4�3
etctsdnrstRTs
3Npddttolsboi
FwDa
Vh
Sraj et al.: Cell deformation cytometry using diode-bar optical stretchers
J
xpected, cells tend to orient ��5 deg� along the axis of therap �Fig. 5�b��. Simple geometric considerations assuming aonstant ellipsoidal volume indicate an average cell deforma-ion along the beam axis of 1.6%. Although this value is rea-onable, validation of the constant volume assumption andirect measurement of cell deformation along this axis wasot possible with the current experimental setup. One can alsoecast this data in terms of DF, as shown in Fig. 6, where thetretch within the optical trap is seen as a cluster of data abovehe DF�=DF0 line. In this single experiment, data for 1275BCs were taken in under 20 min at a rate of �1.2 cell /s.his measurement rate is significantly faster than previousingle-cell measurement demonstrations.29
.3 Computational Resultsext, we present computational results describing the forcerofiles and deformations generated by the trap laser. The pre-iction of net optical forces on cells and colloids has beenescribed in the literature;47,48 however, modeling of cell op-ical stretching forces has only recently been discussed.45,49 Inhese models, a ray optics approach used to determine theptical forces on large spherical systems is extended to calcu-ation of local stress profiles across the front and back sphereurfaces as a function of refractive index and incident laseream profile. This approach is valid when the size of thebject is much larger than the wavelength of the light,50 whichs true here as the diameter of the erythrocytes ranges from
ig. 4 Cell relaxation in the repeated stretches of Fig. 3 and Video 1ith deformation �DF� �raw data inset� relative to the unstretched sizeF�0� as the laser is removed. Simple exponential fit to the cell relax-tion after removal of the stretching laser gives �r=0.10±0.02 s.
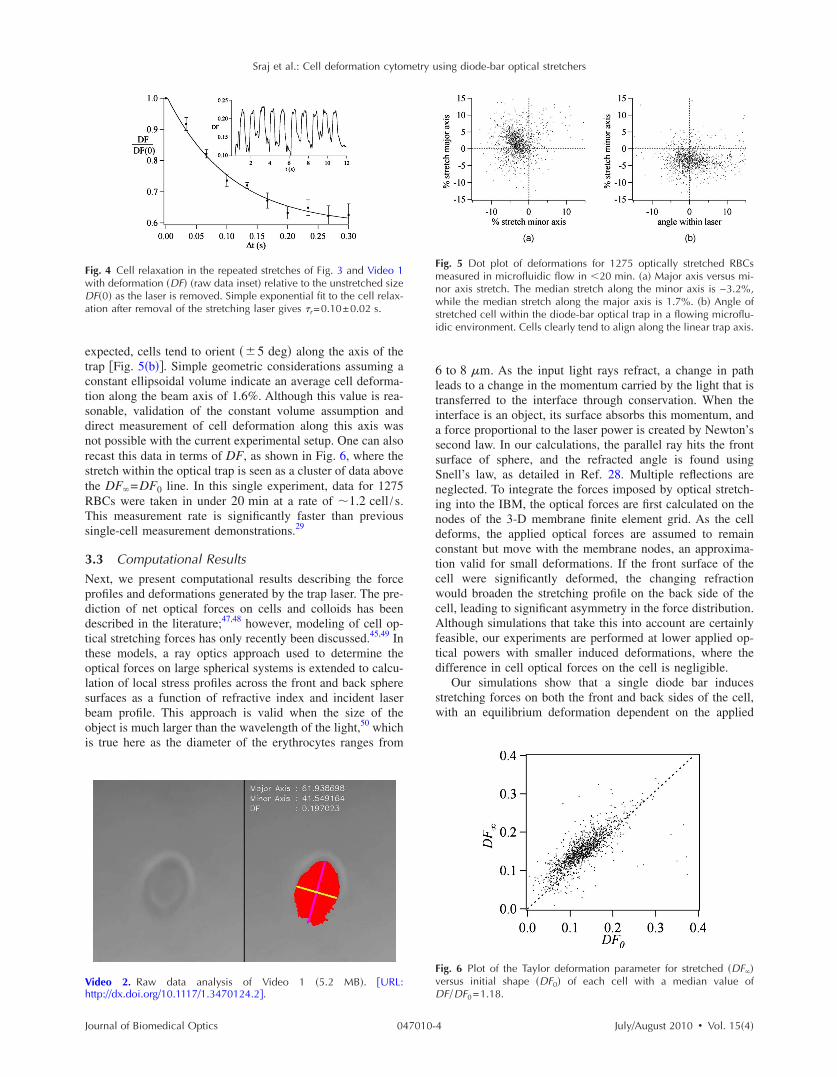
ideo 2. Raw data analysis of Video 1 �5.2 MB�. �URL:ttp://dx.doi.org/10.1117/1.3470124.2�.
ournal of Biomedical Optics 047010-
6 to 8 �m. As the input light rays refract, a change in pathleads to a change in the momentum carried by the light that istransferred to the interface through conservation. When theinterface is an object, its surface absorbs this momentum, anda force proportional to the laser power is created by Newton’ssecond law. In our calculations, the parallel ray hits the frontsurface of sphere, and the refracted angle is found usingSnell’s law, as detailed in Ref. 28. Multiple reflections areneglected. To integrate the forces imposed by optical stretch-ing into the IBM, the optical forces are first calculated on thenodes of the 3-D membrane finite element grid. As the celldeforms, the applied optical forces are assumed to remainconstant but move with the membrane nodes, an approxima-tion valid for small deformations. If the front surface of thecell were significantly deformed, the changing refractionwould broaden the stretching profile on the back side of thecell, leading to significant asymmetry in the force distribution.Although simulations that take this into account are certainlyfeasible, our experiments are performed at lower applied op-tical powers with smaller induced deformations, where thedifference in cell optical forces on the cell is negligible.
Our simulations show that a single diode bar inducesstretching forces on both the front and back sides of the cell,with an equilibrium deformation dependent on the applied
Fig. 5 Dot plot of deformations for 1275 optically stretched RBCsmeasured in microfluidic flow in 20 min. �a� Major axis versus mi-nor axis stretch. The median stretch along the minor axis is −3.2%,while the median stretch along the major axis is 1.7%. �b� Angle ofstretched cell within the diode-bar optical trap in a flowing microflu-idic environment. Cells clearly tend to align along the linear trap axis.
Fig. 6 Plot of the Taylor deformation parameter for stretched �DF��versus initial shape �DF0� of each cell with a median value ofDF /DF =1.18.
0July/August 2010 � Vol. 15�4�4

ptdctfifppmfiolcfi
3TavfssUiinseolatsci=dtp=
Fwratpp
Sraj et al.: Cell deformation cytometry using diode-bar optical stretchers
J
ower. In addition to the steady state deformation induced byhe optical stretcher, we observe that a single diode bar pro-uces a net translating force in the z direction, pushing theell away from the light source. This motion is apparent overhe time scale of the applied stretching forces. In an uncon-ned system, one can estimate the expected z translation awayrom the optical trap with z�t��Fzt /6 �a. Using typicalarameters, we estimate Fz�5.6 pN for applied 16 mW /�mowers, leading to a z translation of 10 �m in the 0.1-seasurement times necessary; however, in our highly con-ned systems, significant movement in the z direction was notbserved. In this case, translation out of the image plane wasikely prevented by the presence of the wall, where, with aorresponding Fz
*0.02, any influence of the physical con-nement on deformation is expected to be relatively small.
.4 Cell Elasticity Cytometryo prepare a general relation between measured deformationnd applied laser power, a set of simulations was performed atarying applied forces �Fig. 7�a�� with a characteristic timeor deformation of t0=�a2 /Foptical and tc=�a /3Gh fortretch relaxation. These results demonstrate that cells rapidlytretch but reach a maximum deformation at longer times.pon removal of the applied forces, the cell relaxes back to
nitial shape, where as expected, the equilibrium deformationncreases with the applied force, as does the response timeeeded to reach equilibrium. We have tested this approach byimulating the deformation of model cells of different size andlastic modulus and found that the resulting deformations falln the same master curve. Figure 7�b� shows the dimension-ess force F* as a function of DF�, a plot �curve fit� thatllows for determination of the cell shear modulus Gh fromhe experimental laser diode measurements. In this, cells aretretched until equilibrium DF� at a given power P and theorresponding F* found from the measured deformation, asllustrated in Fig. 7�b�. Gh is then obtained from Ghn1PQ /3acF*. Figure 8 demonstrates this approach on theata presented in Figs. 5 and 6 under high-throughput condi-ions, where the resulting scatter in Gh is apparent in theopulation of stretched cells and a median value of Gh3.14�10−3 dyne /cm is measured. This value falls within
ig. 7 �a� Dynamics of cell deformation for different applied forceshere a maximum value DF� is reached before the applied forces are
emoved and relaxation is observed. Note that different time scalesre used for the stretching �t0� and relaxation �tc� processes. �b� Varia-ion of the equilibrium stretch DF�=DF�−DF0 as a function of ap-lied force, where F* is fitted to a simple polynomial. The mean ex-erimental value measured in Fig. 5�b� is DF�=0.023.
ournal of Biomedical Optics 047010-
the range of values reported for the shear modulus of humanRBCs of 2.5�10−3 to 1.3�10−2 dyne /cm22,26,28 measuredunder varying osmotic conditions. Note that for the individualmeasurements in which DF is negative, our approach resultsin a negative cell stiffness. Despite the inaccuracy inherent ineach individual measurement using bright-field imaging of thecells, we obtain results that cluster around a physically rea-sonable median value. Higher contrast methods that resolvethe cell sizes more precisely would eliminate these points.Furthermore, the reasonable agreement between our medianvalue and published values of Gh implies that even relativelysimple instrumentation with low-precision size measurementscould be used to create practical devices.
The theoretical maximum measurement rate for stretchingin flow is set by the response time of the cells. In particular,the cells must remain stretched for times within the trap onthe order of the relaxation time constant �r, for which we usethe value of �r=0.10 s determined in the static measurementsof Fig. 4. Defining a characteristic cell dimension � that in-cludes average spacing between cells allows prediction ofmaximum theoretical device throughput �=L /��. With a di-ode bar of length L=200 �m and using a characteristic spac-ing of 20 �m, measurements of 100 cells /s are achievablegiven the current system and experimental parameters. Sig-nificantly higher throughput will be achievable with stiffercells, which have faster relaxation times, and by parallelizingthe design, which is a desirable and achievable goal with themicrofluidic platform used in this study.
4 ConclusionsIn conclusion, we demonstrate that a simple asymmetric op-tical trap created by an inexpensive diode laser can be used tooptically stretch blood cells in both static and dynamic, flow-ing environments. This approach is both practical and scal-able, making it a useful technology for rapid measurements ofcell deformability. Of particular advantage is that the methodis optically based and is therefore inherently compatible withcurrent optical cell-characterization technologies. In addition,we simulate the transient cell deformation induced by a singlelinear diode bar optical stretcher and compare the deformation
Fig. 8 The measured shear modulus Gh extracted for each cell in thedynamic cell stretcher. Because of large variations in the outlyingdata, median values are used and determined as Gh=3.14�10−3 dyne/cm.
July/August 2010 � Vol. 15�4�5

aHfultn
ATtNaQ
R
1
1
1
1
1
1
1
1
1
Sraj et al.: Cell deformation cytometry using diode-bar optical stretchers
J
nd relaxation by varying laser power on cells with neo-ookean membrane properties. Our simulations show that the
orces imposed by a single diode bar optical stretcher can besed to both deform and translate cells and that a dimension-ess single master curve relating laser power to cell deforma-ion enables one to determine the cell elasticity of significantumbers of individual cells.
cknowledgmentshe authors gratefully acknowledge support from the Na-
ional Science Foundation under Grant No. DBI-045468, theational Institutes of Health under Grant No. RO1-AI063366,
nd from the Butcher Foundation. RJ is a staff member in theuantum Physics Division of NIST.
eferences1. K. A. Ward, W. I. Li, S. Zimmer, and T. Davis, “Viscoelastic prop-
erties of transformed-cells—role in tumor-cell progression and me-tastasis formation,” Biorheology 28�3–4�, 301–313 �1991�.
2. M. Lekka, P. Laidler, D. Gil, J. Lekki, Z. Stachura, and A. Z. Hrynk-iewicz, “Elasticity of normal and cancerous human bladder cells stud-ied by scanning force microscopy,” Eur. Biophys. J. 28, 312–316�1999�.
3. S. Park, D. Koch, R. Cardenas, J. Kas, and C. K. Shih, “Cell motilityand local viscoelasticity of fibroblasts,” Biophys. J. 89�6�, 4330–4342�2005�.
4. Q. S. Li, G. Y. H. Lee, C. N. Ong, and C. T. Lim, “AFM indentationstudy of breast cancer cells,” Biochem. Biophys. Res. Commun.374�4�, 609–613 �2008�.
5. G. Y. H. Lee and C. T. Lim, “Biomechanics approaches to studyinghuman diseases,” Trends Biotechnol. 25�3�, 111–118 �2007�.
6. S. Suresh, J. Spatz, J. P. Mills, A. Micoulet, M. Dao, C. T. Lim, M.Beil, and T. Seufferlein, “Connections between single-cell biome-chanics and human disease states: gastrointestinal cancer and ma-laria,” Acta Biomater. 1, 15–30 �2005�.
7. J. P. Mills, M. Diez-Silva, D. J. Quinn, M. Dao, M. J. Lang, K. S.Tan, C. T. Lim, G. Milon, P. H. David, O. Mercereau-Puijalon, S.Bonnefoy, and S. Suresh, “Effect of plasmodial RESA protein ondeformability of human red blood cells harboring Plasmodium falci-parum,” Proc. Natl. Acad. Sci. U.S.A. 104�22�, 9213–9217 �2007�.
8. S. Suresh, “Mechanical response of human red blood cells in healthand disease: some structure-property-function relationships,” J.Mater. Res. 8, 1871–1877 �2006�.
9. W. Groner, N. Mohandas, and M. Bessis, “New optical technique formeasuring erythrocyte deformability with the ektacytometer,” Clin.Chem. 26, 1435–1442 �1980�.
0. Y. R. Kim and L. Ornstein, “Isovolumetric sphering of erythrocytesfor more accurate and precise cell volume measurement by flow cy-tometry,” Cytometry 3, 419–427 �1983�.
1. A. L. Weisenhorn, M. Khorsandi, S. Kasas, V. Gotzos, and H. J. Butt,“Deformation and height anomaly of soft surfaces studied with anAFM,” Nanotechnology 4, 106–113 �1993�.
2. M. Radmacher, M. Fritz, C. M. Kacher, J. P. Cleveland, and P. K.Hansma, “Measuring the viscoelastic properties of human plateletswith the atomic force microscope,” Biophys. J. 70, 556–567 �1996�.
3. B. Daily, E. L. Elson, and G. I. Zahalak, “Cell poking: determinationof the elastic area compressibility modulus of the erythrocyte mem-brane,” Biophys. J. 45, 671–682 �1986�.
4. S. Felder and E. L. Elson, “Mechanics of fibroblast locomotion:quantitative analysis of forces and motions at the leading lamellas offibroblasts,” J. Cell Biol. 111, 2513–2526 �1990�.
5. O. Thoumine and A. Ott, “Time scale dependent viscoelastic andcontractile regimes in fibroblasts probed by microplate manipula-tion,” J. Cell. Sci. 110, 2109–2116 �1997�.
6. R. M. Hochmuth, “Micropipette aspiration of living cells,” J. Bio-mech. 33�1�, 15–22 �2000�.
7. R. C. Spero, L. Vicci, J. Cribb, D. Bober, V. Swaminathan, E. T.O’Brien, S. L. Rogers, and R. Superfine, “High throughput system formagnetic manipulation of cells, polymers, and biomaterials,” Rev.Sci. Instrum. 79, 083707 �2008�.
8. S. Kumar, I. Z. Maxwell, A. Heisterkamp, T. R. Polte, T. P. Lele, M.
ournal of Biomedical Optics 047010-
Salanga, E. Mazur, and D. E. Ingber, “Viscoelastic retraction ofsingle living stress fibers and its impact on cell shape, cytoskeletalorganization, and extracellular matrix mechanics,” Biophys. J.90�10�, 3762–3773 �2006�.
19. Y. Tseng, T. P. Kole, and D. Wirtz, “Micromechanical mapping oflive cells by multiple-particle-tracking microrheology,” Biophys. J.83�6�, 3162–3176 �2002�.
20. S. C. Gifford, M. G. Frank, J. Derganc, C. Gabel, R. H. Austin, T.Yoshida, and M. W. Bitensky, “Parallel microchannel-based measure-ments of individual erythrocyte areas and volumes,” Biophys. J. 84,623–633 �2003�.
21. J. P. Shelby, J. White, K. Ganesan, P. K. Rathod, and D. T. Chiu, “Amicrofluidic model for single-cell capillary obstruction by Plasmo-dium falciparum–infected erythrocytes,” Proc. Natl. Acad. Sci. U.S.A.100, 14618–14622 �2003�.
22. P. B. Bareil, Y. Sheng, Y. Q. Chen, and A. Chiou, “Calculation ofspherical red blood cell deformation in a dual-beam opticalstretcher,” Opt. Express 15�24�, 16029–16034 �2007�.
23. P. B. Bareil, Y. L. Sheng, and A. Chiou, “Local stress distribution onthe surface of a spherical cell in an optical stretcher,” Opt. Express14�25�, 12503–12509 �2006�.
24. P. J. H. Bronkhorst, G. J. Streekstra, J. Grimbergen, E. J. Nijhof, J. J.Sixma, and G. J. Brakenhoff, “A new method to dtudy dhape recov-ery of ted blood vells using multiple optical trapping,” Biophys. J. 69,1666–1673 �1995�.
25. R. R. Haruta, M. L. Barjas-Castro, S. T. O. Saad, F. F. Costa, A.Fontes, L. C. Barbosa, and C. L. Cesar, “Mechanical properties ofstored red blood cells using optical tweezers,” Blood 92, 2975–2977�1998�.
26. S. Hénon, G. Lenormand, A. Richert, and F. Gallet, “A new determi-nation of the shear modulus of the human erythrocyte membraneusing optical tweezers,” Biophys. J. 76, 1145–1151 �1999�.
27. G. B. Liao, P. B. Bareil, Y. Sheng, and A. Chiou, “One-dimensionaljumping optical tweezers for optical stretching of bi-concave humanred blood cells,” Opt. Express 16, 1996–2004 �2008�.
28. J. Guck, R. Ananthakrishnan, H. Mahmood, T. J. Moon, C. C. Cun-ningham, and J. Käs, “The optical stretcher: a novel laser tool tomicromanipulate cells,” Biophys. J. 81, 767–784 �2001�.
29. J. Guck, S. Schinkinger, B. Lincoln, F. Wottawah, S. Ebert, M. Rom-eyke, D. Lenz, H. M. Erickson, R. Ananthakrishnan, D. Mitchell, J.Käs, S. Ulvick, and C. Bilby, “Optical deformability as an inherentcell marker for testing malignant transformation and metastatic com-petence,” Biophys. J. 88�5�, 3689–3698 �2005�.
30. B. Lincoln, S. Schinkinger, K. Travis, F. Wottaway, S. Ebert, F.Sauer, and J. Guck, “Reconfigurable microfluidic integration of adual-beam laser trap with biomedical applications,” Biomed. Mi-crodevices 9, 703–710 �2007�.
31. B. Lincoln, F. Wottawah, S. Schinkinger, S. Ebert, and J. Guck,“High-throughput rheological measurements with an opticalstretcher,” Methods Cell Biol. 83, 397–423 �2007�.
32. Y. Liu, G. J. Sonek, M. W. Berns, and B. J. Tromberg, “Physiologicalmonitoring of optically trapped cells: assessing the effects of confine-ment by 1064-nm laser tweezers using microfluorometry,” Biophys.J. 71, 2158–2167 �1996�.
33. K. C. Neuman, E. H. Chadd, G. F. Liou, K. Bergman, and S. M.Block, “Characterization of photodamage to Escherichia coli in op-tical traps,” Biophys. J. 77, 2856–2863 �1999�.
34. R. W. Applegate Jr., J. Squier, T. Vestad, J. Oakey, and D. W. M.Marr, “Optical trapping, manipulation, and sorting of cells and col-loids in microfluidic systems with diode laser bars,” Opt. Express 12,4390–4398 �2004�.
35. C. Peskin and D. McQueen, “A three-dimensional computationalmethod for blood flow in the heart I. Immersed elastic fibers in aviscous incompressible fluid,” J. Comput. Phys. 81, 372–405 �1989�.
36. C. D. Eggleton and A. S. Popel, “Large deformation of red blood cellghosts in a simple shear flow,” Phys. Fluids 10�8�, 1834–1845�1998�.
37. P. Pawar, S. Jadhav, C. D. Eggleton, and K. Konstantopoulos, “Rolesof cell and microvillus deformation and receptor-ligand binding ki-netics in cell rolling,” Am. J. Physiol. Heart Circ. Physiol. 298,H1439–H1450 �2008�.
38. C. S. Peskin, “Numerical analysis of blood flow in the heart,” J.Comput. Phys. 25, 220–252 �1977�.
39. D. C. Duffy, J. C. McDonald, O. J. A. Schueller, and G. M. White-sides, “Rapid prototyping of microfluidic systems in poly�dimethyl-
July/August 2010 � Vol. 15�4�6

4
4
4
4
4
4
Sraj et al.: Cell deformation cytometry using diode-bar optical stretchers
J
siloxane�,” Anal. Chem. 70�23�, 4974–4984 �1998�.0. J. T. Yu, J. Y. Chen, Z. F. Lin, L. Xu, P. N. Wang, and M. Gu,
“Surface stress on the erythrocyte under laser irradiation with finite-difference time-domain calculation,” J. Biomed. Opt. 10, 064013�2005�.
1. S. C. Grover, R. C. Gauthier, and A. G. Skirtach, “Analysis of thebehavior of erythrocytes in an optical trapping system,” Opt. Express7, 533–539 �2000�.
2. “OpenCV,” open source software, available at http://opencvlibrary.sourceforge. net/wiki-static/.
3. E. Evans and Y. C. Fung, “Improved measurements of the erythrocytegeometry,” Microvasc. Res. 4�4�, 335–347 �1972�.
4. R. W. Applegate Jr., J. Squier, T. Vestad, J. Oakey, and D. W. M.Marr, “Fiber-focused diode-bar optical trapping for microfluidic flowmanipulation,” Appl. Phys. Lett. 92, 013904 �2008�.
5. F. Wottawah, S. Schinkinger, B. Lincoln, R. Ananthakrishnan, M.
ournal of Biomedical Optics 047010-
Romeyke, J. Guck, and J. Käs, “Optical rheology of biological cells,”Phys. Rev. Lett. 94, 098103 �2005�.
46. C. T. Lim, M. Dao, S. Suresh, C. H. Sow, and K. T. Chew, “Largedeformation of living cells using laser traps,” Acta Mater. 52, 1837–1845 �2004�.
47. A. Ashkin, “Forces of a single-beam gradient laser trap on a dielec-tric sphere in the ray optics regime,” Biophys. J. 61, 569–582 �1992�.
48. J. Y. Walz and D. C. Prieve, “Prediction and measurement of theoptical trapping forces on a microscopic dielectric sphere,” Langmuir8, 3073–3082 �1992�.
49. J. Guck, R. Ananthakrishnan, T. J. Moon, C. C. Cunningham, and J.Käs, “Optical deformability of soft biological dielectrics,” Phys. Rev.Lett. 84, 5451–5454 �2000�.
50. H. C. van de Hulst, Light Scattering by Small Particles, John Wileyand Sons, New York �1957�.
July/August 2010 � Vol. 15�4�7