Embed Size (px)
Citation preview

ORIGINAL PAPER
Evaluation of high-resolution satellite rainfall products using raingauge data over complex terrain in southwest China
Meixian Liu & Xianli Xu & Alexander Y. Sun &
Kelin Wang & Yuemin Yue & Xiaowei Tong & Wen Liu
Received: 5 August 2013 /Accepted: 17 January 2014# Springer-Verlag Wien 2014
Abstract Availability of high-resolution satellite rainfall prod-ucts provides a great opportunity to monitor precipitation fre-quently over large and remote areas. However, the accuracies ofthese products need thorough assessment before they can bewidely used. The objective of this study is to evaluate theaccuracies of Tropical Rainfall Measuring MissionMultisatellite Precipitation Analysis 3B42 products (TMPAV6and TMPAV7) using a network of 75 rain gauges over South-western China. The study region has a complex terrain, whichmakes it challenging for TMPA rainfall products to give reliableestimates. The results show that the TMPA products tend tounderestimate the occurrences of rainfall events. Furthermore,TMPA V6 always underestimates the precipitation, while V7generally overestimates rainfall in wet season and underesti-mates it in dry season. Under- and overestimation of rainfall bythe two products can be mainly attributed to false alarm events.The overall accuracies of the two products depend heavily onthe time scale. At the daily scale, these products may not be
reliable; however, the overall accuracies are improved substan-tially when the time scale is extended from daily to monthly andseasonal scales. Reliability of the TMPA precipitation estimatesis also dependent on the climate zones and elevation to someextent and shows clear seasonal variations. In the wet monthsfromMay to September, the estimates for TMPA 3B42 V6 andV7 tend to be more accurate. In comparison, the accuracy of V7is improved slightly over V6. However, V7 still has somemajorlimitations in reproducing precipitation in dry seasons and inhigh-elevation regions with complex terrains, suggesting thatfurther improvements in TMPA precipitation retrieval algo-rithms are still needed for this type of regions.
1 Introduction
Accurate information on the spatiotemporal distribution ofprecipitation is highly required for the fields of meteorology,hydrology, and ecology (Hu et al. 2013). Conventional raingauge networks provide relatively accurate point measure-ments of precipitation. However, the uneven distribution ofgauges and their limited coverage areas impose a considerableproblem when dealing with large regions, as well as inrepresenting areal means (Xie and Arkin 1996). Moreover,the rain gauges are usually sparse in remote and undevelopedareas (Feidas 2010) such as mountainous regions (Feyera andMekonnen 2010). In recent years, high-resolution satelliteprecipitation products provide a great opportunity for remote-ly monitoring precipitation over large and remote areas. Cur-rently, there are over 30 satellite precipitation retrieval tech-niques and more than 10 satellite rainfall products (Liu et al.2011), among which the Tropical Rainfall Measuring Mission(TRMM) Multisatellite Precipitation Analysis (TMPA) is be-lieved to produce the best estimates of quasi-global precipita-tion (50°N–S) and is being widely used for various meteoro-logical and hydrological applications (Nazrul and Uyeda
M. Liu :X. Xu (*) :K. Wang :Y. Yue :X. TongKey Laboratory for Agro-ecological Processes in SubtropicalRegion, Institute of Subtropical Agriculture, Chinese Academy ofSciences, Changsha 410125, People’s Republic of Chinae-mail: [email protected]: www.ecohydroxu.jimdo.com
M. Liue-mail: [email protected]
M. Liu :X. Xu :K. Wang :Y. Yue :X. TongHuanjiang Observation and Research Station for Karst Ecosystem,Chinese Academy of Sciences, Huanjiang 547100, China
A. Y. SunBureau of Economic Geology, Jackson School of Geosciences, TheUniversity of Texas at Austin, Austin, TX 78712, USA
W. LiuCollege of Resources and Environmental Sciences, Hunan NormalUniversity, Changsha 410081, China
Theor Appl ClimatolDOI 10.1007/s00704-014-1092-4

2007; Karaseva et al. 2012; Yong et al. 2013a). During thepast 10 years, the TMPA algorithm has undergone three majorupgrades, due to updates of sensors and algorithms. Detaileddescriptions regarding the three revisions of TMPA can befound in Yong et al. (2013b) and Huffman and Bolvin (2013).The latest two official research products versions are theTMPA 3B42V6 and TMPA 3B42V7, which were releasedin February 2009 and December 2012. As soon as TMPA3B42V7 was released, the product developers recommendedthat all TMPA users immediately switch to the newest V7datasets.
However, the accuracy of satellite rainfall products can beaffected by various factors such as the retrieval algorithms anddata sources (sensors). Even for the same type of data, theaccuracy often varies significantly in different regions and atvarious spatiotemporal scales. A number of validations andevaluations have been carried out at regional and global scales(Hu et al. 2013; Liu et al. 2011; Feidas 2010; Shin et al. 2001)and on the improvement of the latest version TMPA overearlier versions (Su et al. 2011; Yong et al. 2012; Prakashet al. 2013). Previous studies pointed out that satellite rainfallproducts tend to underestimate high precipitation and overes-timate low precipitation (Chen et al. 2013; Prasetia et al. 2013;Habib et al. 2009). Some also reported that high root-meansquare error (RMSE) occurs mostly during the periods of lowprecipitation (Prasetia et al. 2013); the overall accuracy ofsatellite rainfall products is higher in wet months than in drymonths and has a certain relationship with the topography (Huet al. 2013) and elevation (Karaseva et al. 2012; Hong et al.2007).
Several studies have already been conducted to evaluatethe performance of satellite rainfall products over differentregions in China (Hu et al. 2013; Li et al. 2012a, b, c; Jianget al. 2010; Liu et al. 2010; Zeng and Li 2011; Yong et al.2013a, b); however, few studies have been done in southwest-ern China. Southwest China, which includes the transitionsfrom Tibet Plateau to the foothills and plains in eastern andsouthern China, is a well-known mountainous area(Hengduan Mountain ranges) with very complex terrain. Thiskind of terrain is challenging for many satellite rainfall retriev-al algorithms developed for both infrared (IR) and passivemicrowave (PM) sensors (Yin et al. 2008; Dinku et al. 2007,2008). For the PM algorithms, the first challenge is the warmorographic rain, and the second one comes from very coldsurfaces and ice-covered mountain tops, which could be con-fused with precipitation (Dinku et al. 2008). Moreover, theclimate in southwest China is not only controlled by the SouthAsia monsoon but also influenced by the East Asia monsoon,Tibet Plateau monsoon, and the Westerly (Li et al. 2012a, b,c). The air moisture mainly comes from theWesterly in winterand spring, and monsoon moisture originates from the Bay ofBengal and the South China Sea in summer and from thewestern Pacific Ocean in fall. Furthermore, the precipitation in
this area is also influenced by the microclimate controlled bycomplex terrain, such as the occurrences of dry-hot valleyclimate. Hence, the precipitation in this region shows highspatial and temporal variability, presenting another challengeto the satellite rainfall retrieval algorithms.
Owing to the specific geography and climate, natural haz-ards such as floods or drought (Zhang et al. 2010) are frequentin the area. Particularly, compared to the same season in thepast several years, the precipitation in this region had beenreduced no less than 50 % since the beginning of fall in 2009.The 2009/2010 drought had serious impact on agriculturalproduction and drinking water supplies (Wang 2010; Wanget al. 2010). On the other hand, this region is alsooverpopulated and the economy is relatively underdeveloped.The high food demand of the large population and the limitedland resources drive the inhabitants to overexploit the naturalrecourses, leading to serious soil loss and ecosystem degrada-tion (Fan et al. 2011; Cai 1996; Deng et al. 2009). A betterknowledge of precipitation patterns may help improve watermanagement and reduce the risks of precipitation-related nat-ural hazards in this region. This study aims to evaluate thehigh-resolution TMPA 3B42 precipitation products at differ-ent time scales, topographic conditions, and climate zones.Our main objectives are to (1) evaluate if these products canbe used for water management or natural hazard prediction inthis region and (2) investigate the difference between the twoversions of products (V6 and V7).
2 Study area and data
2.1 Study area
The study area includes Yunnan, Guizhou, and Guangxi Prov-ince, which covers a total area of 8.0×10⁵ km2 in the south-western part of China. This region exhibits significant varia-tions in elevations, ranging from sea level to 6740 m (MountKawakarpo in northwestern Yunnan), and is characterized bya very complex topography (Fig. 1a), which generally de-clines from west toward east and from north toward south.There are three geomorphic units within this area, includingthe southern part of Hengduan Mountains (22–32°N, 97–103°E) with many large rivers and a series of north–southoriented mountains (4,000–5,000 m amsl), the Yunnan-Guizhou Plateau (1,800–1,900 m amsl) (Zhao and Chen1999), and the Guangxi hilly basin (80–200 m amsl). Inparticular, karst landform is prevalent in this region, coveringabout 28, 37.8, and 73 % of Yunnan, Guangxi, and GuizhouProvince, respectively (Zeng 1994; Lan and Mo 1995; Denget al. 2009).
This area can be divided into six climate zones (NationalStandard of the People's Republic of China 1998), namely, theplateau temperate, warm temperate, north subtropical, south
M. Liu et al.

subtropical, mid-subtropical, and north tropic zone, respec-tively (Fig. 1b). The precipitation decreases from southeast tonorthwest and from south to north, varying from more than2,500 mm in the north seacoast of Beibu Gulf (Guangxi) toless than 700 mm in the northwest and northeast part ofYunnan (Fig. 2). The low precipitation in some areas mayattribute to the dry-hot valley microclimates, which are spo-radically distributed over upper reaches of the Yangtze,Nujiang, Yuanjiang, Langcang, and Honghe River Basins(Gao et al. 2012; Jin 1999; Ou 1994). The precipitation in thisregion also shows clear seasonal variations. It increases fromabout 28 mm/month in January and February to about230 mm/month in June and July and then decreases gradually
to 30 mm/month in December. More than 73 % of the precip-itation is received from May to September.
2.2 Rain gauge data
In situ gauge measurements of precipitation are used to eval-uate accuracy of the satellite rainfall products. The measure-ments of precipitation are monitored twice a day at 8:00 AMand 8:00 PM by China Meteorological Administration. In thisstudy, 13 years (1998–2010) of continuous dataset of dailyprecipitation from a network of 75 meteorological stations(Fig. 1b) is used. These gauges are evenly distributed inhorizontal space (Fig. 1b), but the elevations of these gauges
Fig. 1 a Topography map of southwest China. b Main climatic region-alization (National Standard of the People's Republic of China 1998) ofthe study area (A plateau temperate, B warm temperate zone, C north
subtropical zone, D south subtropical zone, E mid-subtropical zone, andF north tropic zone), while the dark dots show the locations of themeteorological stations
Fig. 2 Distribution of mean annual precipitation (millimeters per year) (1998–2010) for all gauges in the study area
Performance of satellite rainfall products in southwest China

vary from 4.5 to 3,319 m. Among the 75 gauges, 27, 11, 17,14, and 4 gauges are in the elevation range of 0–500, 500–1,500, 1,500–2,000, and 2,000–2,500 m, respectively, and 2gauges are above 3,000 m (3,277 and 3,319 m). The precip-itation data are acquired from http://old-cdc.cma.gov.cn/.
2.3 TMPA 3B42 data
The TRMM, co-sponsored by the National Aeronautics andSpace Administration (NASA) of the USA and the JapanAerospace Exploration Agency, was launched on November28, 1997 (Kummerow et al. 2000). The main objective ofTRMM is to provide information on rainfall distribution in thetropical and subtropical regions of the world (Kummerowet al. 1998). It covers the global region between 50°N and50°S (Huffman et al. 2007). TRMM has a number ofprecipitation-related instrumentations on board, including aprecipitation radar, a visible and infrared sensor, and a micro-wave imager (Kummerow et al. 2000). During the past10 years, the TRMM Multisatellite Precipitation Analysis(TMPA) algorithm has undergone three major upgrades dueto the new sensors used and algorithmic changes. The latesttwo versions, known as TMPA 3B42V6 and 3B42V7, areselected for this study. The details about the update fromV6 toV7 can be found in Huffman and Bolvin (2013). The twoproducts have high spatial resolution (0.25×0.25°) and high-temporal resolution (3 h) (Huffman et al. 2004). Moreover,previous studies pointed out that the TMPA 3B42 performedbetter than other satellite rainfall products in mountainousareas (Dinku et al. 2008; Gao and Liu 2013), and the latestone (V7) was also shown to be substantially improved overV6 (Yong et al. 2013a, b; Prakash et al. 2013).
2.4 Evaluation methods
The precipitation data of the TMPA 3B42V6 and V7 gridnearest to ground gauge station are used (Karaseva et al.2012). Firstly, point-to-point comparisons at the daily, month-ly, and seasonal scale are conducted. All the data are used toobtain scatter plots, statistical correlations, and error values.This evaluates the reliability of satellite measurements atdifferent time scales and locations. The results will also showwhether TMPA works well for the geographical areas insouthwest China. Next, the entire area is divided into fiveclimate zones according to the National Standard of the Peo-ple's Republic of China (1998) (Fig. 1b). The warm temperate(B), north subtropical (C), south subtropical (D), mid-subtropical (E), and north tropic zone (F) has 7, 9, 34, 17,and 8 rain gauges, respectively. Evaluations are done atmonthly and seasonal scales. Variations of statistical errorsare also investigated to see whether any seasonal bias exists.Finally, the study area is divided into five elevation ranges:below 500, 500–1,000, 1,000–1,500, 1,500–2,000, and above
2,000 m. Evaluations are done at the monthly scale for thetopographical validation.
For evaluating the accuracy of the satellite products, thecorrelation coefficient (r), mean bias error (BIAS), and bias-corrected RMSE (Feidas 2010; Prasetia et al. 2013), andMeanSquare Skill Score (MSSS) (Murphy 1988) are employed, andthe specific calculations are as follows:
�Gj ¼ 1
n
X
i¼1
n
Gij �F j ¼ 1
n
X
i¼1
n
Fij
r j ¼
X
i¼1
n
Fij−F�j
� �Gij−G
�j
� �2
n−1ð ÞδF jδG j
ð1Þ
BIAS j %ð Þ ¼
X
i¼1
n
Fij−Gij
� �
X
i¼1
n
Gij
� 100% ð2Þ
MBE j ¼ 1
n
X
i¼1
n
Fij−Gij
� �
RMSE j %ð Þ ¼
ffiffiffiffiffiffiffiffiffiffiffiffiffiffiffiffiffiffiffiffiffiffiffiffiffiffiffiffiffiffiffiffiffiffiffiffiffiffiffiffiffiffiffiffiffiffiffi1
n
X
i¼1
n
Fij−MBEj−Gij
� �2s
X
i¼1
n
Gij
� 100 %
ð3Þ
S2Gj ¼1
n
X
i¼1
n
Gij−G�j
� �2
MSE j ¼ 1
n
X
i¼1
n
Fij−Gij
� �2MSEcj ¼ n
n−1
� �2S2Gj
MSSS j ¼ 1−MSE j
MSEcj
where Fij are the estimates at station j, Gij are the referencegauge values at station j, δFj and δGj are their standard devia-tions, MSSSj is the Mean Square Skill Score for station (j),and n is the number of data pairs. In this analysis, BIAS andRMSE are used to evaluate the systematic and random errorsof the TMPA precipitation, respectively, while the R andMSSS are used to identify the validity. RMSE is calculatedafter the bias is removed from the satellite estimates (Feidas2010). According to Adeyewa and Nakamura (2003), if the
M. Liu et al.

RMSE of a product estimates is less than 50 %, the estimateswould be reliable. On the other hand, the BIAS is also used toexamine if the satellite rainfall products underestimate oroverestimate precipitation. In particular, for more detailedinformation in the daily time scale comparison, bias score(BS), hit rate (HR), missing rate (MR), and faults alarm rate(FAR) are also computed; they are defined as follows:
BS ¼ forecast events
observed eventsð5Þ
HR ¼ hits
observed eventsð6Þ
MR ¼ missed events
observed eventsð7Þ
FAR ¼ false alarms
no eventsð8Þ
where “forecast events”means the number of events (or days)that the TMPA estimate (V6 or V7) is non-zero, “observedevents” is the number of events that the gauge observation isnon-zero, “hits” is the number of pairs that both the TMPAestimate and the gauge observation are non-zero, “missedevents” is the number of pairs that the TMPA estimate is zerobut the gauge observation is non-zero, “no events” is thenumber of no rain days, and the “false-alarmed events” isthe number of pairs that the TMPA estimate is non-zero butthe gauge observation is zero.
3 Results
3.1 Point-to-point comparison at different time scales
The BS, HR, FAR, and BIAS for each gauge are presented inFig. 3. Overall, both V6 and V7 have the similar distributionof BS, HR and FAR, although the values (BS, HR, and FAR)for V7 are generally higher than that for V6 (Table 1).
There is a gradually decreasing trend of BS from westernYunnan toward Guangxi and Guizhou. High values are gen-erally found in the western Yunnan highland, whereas lowsare mainly in Guizhou (Fig. 3a, d). Overall, the BS values forV7 (mean value was 0.86) are higher than that for V6 (meanvalue was 0.78). The BS at 69 and 58 gauges are lower than 1for V6 and V7, respectively, and only few gauges in the mid
and western Yunnan are above 1, especially for V7, indicatingoverall underestimation of rainfall occurrences by the satelliterainfall products. The HR has a similar spatial distribution ofBS. The ranges of HR are 0.33–0.84 and 0.34–0.83, respec-tively, for V6 and V7, with mean values of 0.54 and 0.57. Thehighest HR for both V6 and V7 are observed at the Deqingauge in northwest Yunnan, which is located at an altitude of3,319 m. The ranges of FAR for V6 and V7 are 0.12–0.62 and0.13–0.65, respectively. From Fig. 3c, f, it is clear that lowFAR (<0.15) occur in east Yunnan and Guangxi for V6;whereas for V7, low values are generally found in Guangxi.As the same, the highest FAR for both the two versions occurat the Deqin gauge (Fig. 3c, f). The BIAS of V6 range from−45.61 to 46.81 % (Fig. 3, Table 1), in which 43 of the 75gauges are tolerable (−10 %<BIAS<10 %), whereas for V7,the BIAS range from −22.24 to 107.34 %, in which 44 out ofthe 75 gauges are tolerable. A closer look finds that the BIASat 42 and 22 gauges are negative for V6 and V7, respectively.
For further comparison, the time series of monthly precip-itation in this area and the corresponding scatter plots aregiven in Fig. 4. The figures demonstrate that both the TMPAV6 and V7 catch the evolution of the precipitation at themonthly scale well. Figure 4b reveals that TMPA V6 tendsto slightly underestimate precipitation within the whole year,while V7 always slightly underestimates precipitation in dryseason (January, February, November, and December) andslightly overestimates the precipitation in wet season (Mayto September). The mean regionally averaged annual precip-itation (1998–2010) derived from the gauge and from TMPA3B42 V6 and V7 are 1,279.9, 1,213.2, and 1,358.4 mm,respectively.
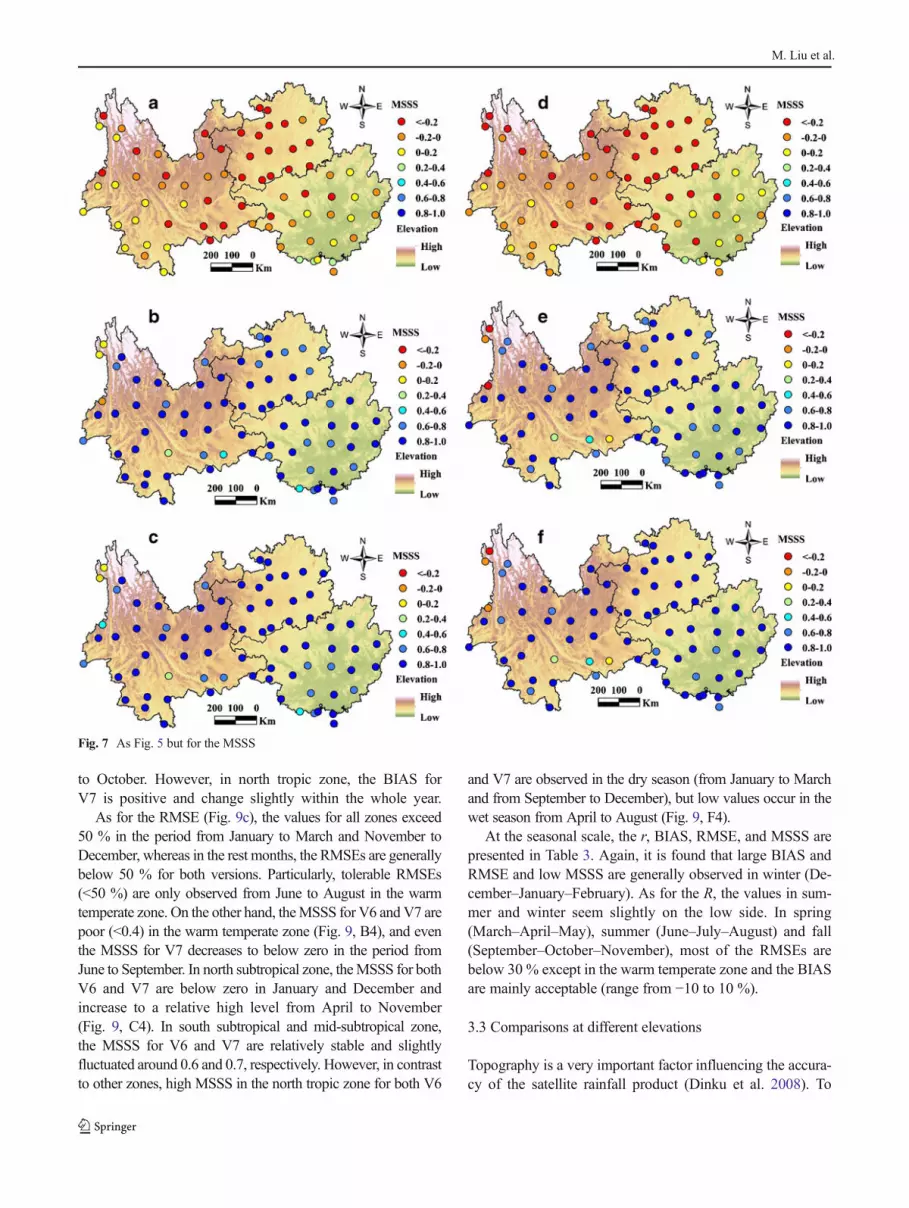
The correlation coefficient (r), bias-corrected RMSE, andMSSS for each gauge are presented in Figs. 5, 6, and Fig. 7,respectively. At the daily scale, the r for V6 ranges from 0.08to 0.55, with a mean of 0.40 (Fig. 5 and Table 1). The V7displays no obvious improvements of r compared to V6 at thistime scale, as the range is 0.08–0.58 with the samemean valueof 0.4. No obvious differences between the distributions of thetwo versions (Fig. 5a, d) are found. In general, relatively highr values are observed in the southern and northeastern part ofGuangxi province, where the annual precipitation generallyexceeds 1,600 mm (Figs. 2 and 5). The RMSEs are higherthan 50 % at the daily scale. Their values range from 184.4 to419.3 % with a mean of 316.1 % for V6, and from 207 to418.0 % with a mean of 207 % for V7 (Fig. 6a, d). The MSSSare all below 0.2 for both the two versions (Fig. 7a, d), and thelow values are mainly found in Guizhou and southeast Yun-nan. In comparison, the MSSS derived from V6 (−0.68–0.26with a mean of −0.16) slightly exceed that from V7 (−0.96–0.24 with a mean of −0.23).
At the monthly scale, the r of V7 varies from 0.51 to 0.97with a mean of 0.91, and 96 % of the gauges have r higherthan 0.8. For V7, the r ranges from 0.51 to 0.98 with a mean of
Performance of satellite rainfall products in southwest China

0.96, exhibiting slightly improvement compared to V6(Fig. 5b, e; Table 1). With respect to the RMSE, the valuesfor V6 range from 26.33 to 87.12 % with a mean of 40.71 %,and 82.7 % of the gauges are below 50 %. For V7, the valuesrange from 17.09 to 102.15 % with a mean value of 37.60 %,
and 89.3 % of the gauges are below 50% (Fig. 6b, e, Table 1).Generally, relatively high RMSE are found in northwest Yun-nan and south Guangxi (Fig. 6b, e). As for the MSSS, thevalues for V6 range from −0.08 to 0.93 (mean value is 0.78),among which 49 out of 75 gauges are higher than 0.8 and only
Fig. 3 Spatial distribution of bias score, hit rate, false alarm rate, and BIAS in the study area, where the left column (a, b, c, and d) is the indicators for theTMPAV6 and the right column (e, f, g, and h) is for the TMPAV7
M. Liu et al.

one gauge is below zero (Fig. 6b). Whereas the MSSS for V7ranges from −1.97 to 0.97 (mean value is 0.77), and 52 out of75 gauges are higher than 0.8, but there are still 3 gauges inwest Yunnan being below zero (Fig. 6e).
At the seasonal scale, the average r reaches 0.95 and 0.96for V6 and V7. No obvious differences in r between V6 andV7 can be observed (Fig. 5c and f). At this time scale, theRMSEs for V6 at all gauges are below 50 % (Fig. 6c) and themean RMSE is 28.76 %. While for V7, the mean RMSEdecreases to 24.17 %, but four gauges still have RMSE valuesexceeding 50%. TheMSSS values also exhibit improvementscompared to that at monthly scale. However, even though theaccuracy of the TMPA is significantly improved at the
monthly and seasonal scale, it is noticeable that poor r andMSSS and large errors can still be observed, as at the Deqin(the big red dot in Fig. 7f) and Gongshan gauges (the big greendot in Fig. 5c, f), which are located in the eastern HengduanMountain.
3.2 Comparisons in different climate zones
Note that due to the poor performance of TMPA products atdaily scale, daily scale comparison is not conducted in thisstep. The scatter plots for V7 are generally above that for V6,and the V7 tends to have a smaller scatter than V6 in all zonesexcept the warm temperate zone (Fig. 8B). This observation
Table 1 Different error statistics between TMPA and rain gauge at seasonal time scales
Version BIAS (%) BS HR FAR Correlation coefficient (r) RMSE (%) MSSS
Daily Monthly Seasonal Daily Monthly Seasonal Daily Monthly Seasonal
V6 Max. 46.81 1.71 0.82 0.62 0.55 0.97 0.99 419.30 87.12 46.67 0.26 0.93 0.97
Min. −45.61 0.47 0.33 0.12 0.08 0.51 0.66 184.37 26.33 14.00 −0.68 −0.08 0.00
Mean −2.28 0.78 0.54 0.16 0.40 0.91 0.95 316.10 40.71 25.63 −0.16 0.78 0.83
Std. Dev. 15.63 0.19 0.11 0.06 0.09 0.07 0.05 50.81 11.26 7.88 0.22 0.18 0.17
V7 Max. 107.34 1.91 0.83 0.65 0.58 0.98 0.99 418.10 102.15 72.43 0.24 0.97 0.98
Min. −22.24 0.49 0.34 0.13 0.08 0.56 0.69 207.00 17.09 10.18 −0.96 −1.67 −2.29Mean 8.70 0.86 0.57 0.18 0.40 0.93 0.96 324.93 37.60 24.17 −0.23 0.77 0.80
Std. Dev. 18.09 0.24 0.12 0.08 0.09 0.06 0.04 48.89 14.55 10.81 0.26 0.36 0.42
Fig. 4 Time-series monthly precipitation fromTMPA (V6 andV7) vs. that from rain gauge (a, b) and the corresponding scatter plots (c) in the study area
Performance of satellite rainfall products in southwest China

can also be confirmed by the results presented in Table 2,which shows that the r value for V7 is slightly higher than thatfor V6. The results in Table 2 show that the r values for V6and V7 in all zones exceed 0.8, and the values for the latterslightly exceed that for the former. However, even though V7has higher r in warm temperate zone, the larger BIAS(25.17 %) and RMSE (68.04 %) and lower MSSS (0.47)imply that V7 has a poorer performance than V6.
Overall, the BIAS values for V7 are generally positive,while the V6 has negative BIAS in all zones except in thewarm temperate zone. As for V6, the largest BIAS (−9.42 %)is observed in the north tropical zone and the smallest one(0.40 %) occur in the warm temperate zone. However, thoughthe BIAS of V6 in warm temperate zone is really small, thehigh RMSE (60.26 %) reveals that high uncertainty existingfor V6 in this zone. Similar to warm temperate zone, V6 also
exhibits poor performance in the south subtropical zone(RMSE>50 %). In the other three zones (north subtropical,mid-subtropical, and north tropical zone), V6 seems to bereliable. As for V7, except in the warm temperate zone, theaccuracy is tolerable, especially in north subtropical, southsubtropical, and mid-subtropical zones (Table 2).
To further examine the performance of TMPAV6 and V7within a year, the variations of the monthly statistical indica-tors are studied for the five climate zones (Fig. 9). As a whole,the intrayear trends of the indicators derived from V6 and V7are nearly the same. The r values (Fig. 9, B1–F1) for mid-subtropical and north tropic zone stays at a high value near 0.8within the whole year with slight fluctuation, whereas for thesouth subtropical zone, it maintains a high level from Januaryto October but then shows a noticeably drop in November andDecember. In the north subtropical zone, the r values are poor
Fig. 5 Spatial distribution of correlation coefficients (R) between TMPA3B42 and rain gauge data at three time scales, where the left column (a, b,c) is for the TMPAV6, and the right column (e and f) for the TMPAV7; in
the same column, the first figure represents the daily results, and so thesecond and third the monthly and seasonal
M. Liu et al.

from January to March and are at a tolerable level (about 0.8)in the rest of the year. In warm temperate zone, the r showsmore variability than other zones. In comparison, the varia-tions of V6 seem to be smoother (fluctuate around about 0.7)than that for V7 in warm temperate zone, which increasesfrom about 0.75 in January and February to 0.92 inMarch andthen reduces dramatically until September, but thereafter risesagain to about 0.75 in October and November and drops to0.48 in December.
As for BIAS, its absolute value generally decreasessince January and reaches to a relative stable low levelfrom April to September and then increases since October(Fig. 9, B2–F2). Similar to R, the BIAS in the warmtemperate zone shows more variability, and in the southsubtropical, mid-subtropical, and north tropic zone, theBIAS for both V6 and V7 vary relatively smoothly. Inthe warm temperate zone, large negative BIAS values are
observed from January to March and November to De-cember for both versions but especially for V6. However,in the period from April to October, both V6 and V7overestimate the precipitation, especially for V7, the BIASeven exceeds 30 %. In the north subtropical zone, largenegative BIAS (<−30 %) are found in January, February,and December for both V6 and V7, whereas in the restmonths, V6 slightly underestimates precipitation withmean BIAS of −3.1 % but V7 always overestimatesprecipitation (mean BIAS is 4.5 %). In the south subtrop-ical, mid-subtropical, and north tropic zone, large negativeBIAS exceeding −25 % in dry season (January, February,November, and December) and tolerable BIAS (−10 %<BIAS<0) in the rest months are observed for V6. In southsubtropical and mid-subtropical zone, the BIAS for V7 inthe whole year are acceptable (−10 %<BIAS<10 %);small positive BIAS are generally observed from April
Fig. 6 As Fig. 5 but for the RMSE
Performance of satellite rainfall products in southwest China
to October. However, in north tropic zone, the BIAS forV7 is positive and change slightly within the whole year.
As for the RMSE (Fig. 9c), the values for all zones exceed50 % in the period from January to March and November toDecember, whereas in the rest months, the RMSEs are generallybelow 50 % for both versions. Particularly, tolerable RMSEs(<50 %) are only observed from June to August in the warmtemperate zone. On the other hand, theMSSS for V6 and V7 arepoor (<0.4) in the warm temperate zone (Fig. 9, B4), and eventhe MSSS for V7 decreases to below zero in the period fromJune to September. In north subtropical zone, theMSSS for bothV6 and V7 are below zero in January and December andincrease to a relative high level from April to November(Fig. 9, C4). In south subtropical and mid-subtropical zone,the MSSS for V6 and V7 are relatively stable and slightlyfluctuated around 0.6 and 0.7, respectively. However, in contrastto other zones, high MSSS in the north tropic zone for both V6
and V7 are observed in the dry season (from January to Marchand from September to December), but low values occur in thewet season from April to August (Fig. 9, F4).
At the seasonal scale, the r, BIAS, RMSE, and MSSS arepresented in Table 3. Again, it is found that large BIAS andRMSE and low MSSS are generally observed in winter (De-cember–January–February). As for the R, the values in sum-mer and winter seem slightly on the low side. In spring(March–April–May), summer (June–July–August) and fall(September–October–November), most of the RMSEs arebelow 30 % except in the warm temperate zone and the BIASare mainly acceptable (range from −10 to 10 %).
3.3 Comparisons at different elevations
Topography is a very important factor influencing the accura-cy of the satellite rainfall product (Dinku et al. 2008). To
Fig. 7 As Fig. 5 but for the MSSS
M. Liu et al.

evaluate the effects of topography on the reliability of TMPA,validations are performed at different elevations (Dinku et al.2008; Karaseva et al. 2012). Note that only the results calcu-lated at monthly scale are presented in this part, as a similartrend is observed at seasonal scale (Fig. 10 and Table 4).
As shown in Fig. 10, V7 has a smaller scatter than V6 in 0–500, 500–1,000, and 1,000–1,500 m ranges, whereas in the1,500–2,000 m and >2,000 m ranges, V7 is more scattered.Relatively, in the elevation ranges of 1,500–2,000 and 1,500–2,000 m, both V6 and V7 have greater scatters than in otherranges. Overall, all the r values exceed 0.85 and vary slightlyover all the elevation ranges (Table 4). The MSSS are mostlyhigher than 0.75, except the values of V7 in the highland(>2,000 m). The BIAS for V6 are negative when the elevation
is below 2,000 m (Table 4); however, overall overestimation(BIAS=3.2 %) occurs in the highland (>2,000 m). As for V7,the BIAS are positive in all elevation ranges, especially in thehighland (>2,000 m) (BIAS=24.5 %). With respect to theRMSE, the results indicate that V6 is acceptable in allranges except in 0–500 m (RMSE=52.0 %), and the V7has poor performance (RMSE=58.4 %) in the highland(>2,000 m). In other three ranges (500–1,000, 1,000–1,500, and 1,500–2,000 m), the RMSE for V7 are lowerthan that for V6. In particular, no obvious trends or statisti-cal relationships exist between the indicators and elevationfor V6; whereas for V7, R and MSSS have overall decreas-ing trends with the increase of elevation to some extent(Table 4).
Fig. 8 Monthly precipitation of the TMPA 3B42V6 vs. that of rain gauge data for the five climate zones; B warm temperate zone, C north subtropicalzone, D south subtropical zone, E mid-subtropical zone, and F north tropic zone
Table 2 Different error statistics of monthly precipitation for the five climatic zones
Climate zones Observed mean (mm) V6 V7
V6 mean (mm) r BIAS (%) RMSE MSSS V7 mean (mm) r BIAS (%) RMSE (%) MSSS
Warm temperate 73.5 73.8 0.81 0.40 60.26 0.64 92.0 0.83 25.17 68.04 0.47
North subtropical 87.0 80.1 0.91 −7.89 38.11 0.81 87.5 0.92 0.59 35.92 0.84
South subtropical 121.8 115.8 0.89 −4.89 50.79 0.79 127.8 0.93 4.96 41.93 0.86
Mid-subtropical 94.9 90.2 0.91 −4.97 42.92 0.82 98.6 0.92 3.90 39.79 0.84
North tropical 122.1 110.6 0.90 −9.42 41.51 0.80 136.6 0.94 11.87 36.76 0.84
Performance of satellite rainfall products in southwest China

4 Discussions
Precipitation and its spatiotemporal variations provide veryimportant input in hydrology, meteorology, agriculture, andecosystem and water resources management. Conventional insitu stations (rain gauge) could provide relatively accuratemeasurements of precipitation but have several shortages(Fotis et al. 2011; Feidas et al. 2009). Thus, satellite rainfallproducts have become an attractive alternative because oftheir high sampling frequencies in space and time (Feidaset al. 2009). We validate the TMPA 3B42V6 and TMPA3B42V6 products over a complex terrain in southwest China,where floods, drought, and landslide occur frequently; theregion exhibits a fragile ecosystem, especially in the karstregion (Zhang et al. 2010). The main purpose is to evaluateif this product can be used for water management or naturalhazards prediction in this area and to investigate the differ-ences between the two versions (V6 and V7).
Results show that there exists an apparent gradually de-creasing trend in BS from western Yunnan toward Guangxiand Guizhou. High values are generally found in the westernYunnan highland, and the lows are mainly in Guizhou (Fig. 3).The TMPA always underestimates the occurrence of precipi-tation events, about 92 and 77.3 % of the gauges are
underestimated by V6 and V7, respectively. Slight overesti-mation of rainy events is mainly observed in the northwestYunnan for V7, and large underestimation mainly occurs inGuizhou. A reasonable explanation is that, in Guangxi andGuizhou, the complex karst landform easily triggers orograph-ic rain, which the TMPA could not adequately capture (Adleret al. 2003), especially in Guizhou. On the other hand, the coldsurface and ice covers over mountaintops in northwest Yun-nan could be misclassified as rain clouds in passive MWalgorithms, leading to precipitation events overestimation.The hit rate (HR) and false alarm ratio (FAR) are closelyrelated to BS because high forecast events would inducehigher HR and FAR. The BS for TMPAV7 are always higherthan that for V6, especially in the Yunnan highland; therefore,the corresponding HR, FAR, and BIAS are also higher thanthat for V6 (Yong et al. 2013a).
Furthermore, the differences of BS between V6 and V7also induce another result that the V6 generally underesti-mates precipitation, while V7 tends to slightly overestimateprecipitation in the study area in wet season (May to Septem-ber). A closer look of the data shows that during the studyperiod (1998–2010), 75.1 % of the precipitation data derivedfrom V7 were higher than that from V6 in the rainy days (theday that gauge data are above zero). However, similar to the
0.2
0.4
0.6
0.8
1
Jan MarMay Jul SepNov
C-V6
C1
0.2
0.4
0.6
0.8
1C
orr.
Co
(CC
)
B-V6
B-V7B10.2
0.4
0.6
0.8
1
Jan MarMay Jul Sep Nov
D-V6D
0.2
0.4
0.6
0.8
1
Jan MarMay Jul Sep Nov
E-V6E
0.2
0.4
0.6
0.8
1
Jan MarMay Jul Sep Nov
E-V6F
-60
-40
-20
0
20
40
60
Jan MarMay Jul SepNov
C-V6
C
-60-40-20
0204060
BIA
S (%
)
B2
-60
-40
-20
0
20
40
60
Jan MarMay Jul Sep Nov
D-V6D2
-60
-40
-20
0
20
40
60
Jan MarMay Jul Sep Nov
E-V6E
-60
-40
-20
0
20
40
60
Jan MarMay Jul Sep Nov
F-V6F
0
20
40
60
80
100
120
Jan MarMay Jul SepNov
C-V6
C30
306090
120150180
RM
SE (
%)
B
0
20
40
60
80
100
120
Jan MarMay Jul SepNov
D-V6
D30
20406080
100
120
Jan MarMay Jul SepNov
E-V6
E0
20406080
100
120
Jan MarMay Jul SepNov
F-V6
F
-1
-0.6
-0.2
0.2
0.6
1
Jan MarMay Jul SepNov
C-V6
C
-4
-3
-2
-1
0
1
MSS
S (%
)
B0
0.2
0.4
0.6
0.8
1
Jan MarMay Jul Sep Nov
D-V6
D40
0.2
0.4
0.6
0.8
1
Jan MarMay Jul Sep Nov
E-V6E
-0.2
0
0.2
0.4
0.6
0.8
1
Jan MarMay Jul SepNov
F
Fig. 9 Monthly values of error statistics for the five climatic zones; Bwarm temperate zone, C north subtropical zone,D south subtropical zone, Emid-subtropical zone, and F north tropic zone
M. Liu et al.

V6, V7 also generally overestimates light and underestimatesthe moderate and heavy precipitations (Yong et al. 2013a; Gaoand Liu 2013); the overestimation of V7 can be attributed tothe false alarm events. In particular, in the wet season (May toSeptember), the V6 markedly underestimates the heavy pre-cipitation, but the total amount of the false-alarmed precipita-tion is not enough to counteract the total amount ofunderestimated and the missed precipitation; therefore, overallunderestimation of precipitation for V6 is more apparent inthis period. However for the V7, the precipitation amount ofthe false-alarmed events exceeds the total of underestimationof the “hit events” and the precipitation of the missed events.On the other hand, the fact that V7 underestimates precipita-tion in the dry season is because the false alarm precipitationcannot counteract the underestimation and missed precipita-tion, similar to the explanation for V6.
On the other hand, the accuracies of both TMPA3B42V6 andV7 heavily depend on the time scale (Hu et al. 2013). At thedaily time scale, the correlation coefficients (r) and bias-corrected root-mean square error (RMSE) and Mean SquareSkill Score (MSSS) suggest that both the two versions maynot perform well to retrieve daily precipitation in this area.Compared to other areas (Jiang et al. 2010; Hu et al. 2013;Javanmard et al. 2010; Jamandre and Narisma 2013), the per-formance of TMPA is even poorer in the study area, mainly due
to the complex topography and climatology systems. When thetime scale is expanded from daily to monthly, the accuracies aresubstantially improved, as evidenced by the rapid increase in rand MSSS and dramatic reduction in RMSE. At the seasonalscale, the accuracies are enhanced slightly again. These resultsare in agreement with other findings (Hu et al. 2013; Anton et al.2010; Li et al. 2012a, b, c; Yong et al. 2013a). A possibleexplanation is that, at a longer time scale, the positive errorsprobably counteract the negative errors and induce a moreaccurate and representative datawhen aggregating the daily data.
Furthermore, the r, BIAS, RMSE, and MSSS show obvi-ous seasonal variation. As showed in Fig. 9, the results indi-cate that the TMPAV6 generally underestimates precipitationin the whole year though some slight overestimation occurduring the wet season, and the TMPA V7 always underesti-mates precipitation in winter and slightly overestimates it inthe wet season. The results in Fig. 9 also imply that TMPA ismore accurate in the wet season (from April to September)(Prasetia et al. 2013; Hu et al. 2013; Yin et al. 2008), but largenegative BIAS are generally observed in winter that TMPAeasily lose the rainy events in the period. Overall, TMPAV7performs a litter better than the V6 according to the indicators(Yong et al. 2013a; Prakash et al. 2013).
The climate types and topography have some certain rela-tionships with the TMPA accuracy. From the comparisons, the
Table 3 Values of the R, BIAS, RMSE, and MSSS of seasonal evaluation for the five climatic zones
Indicators Climate zones V6 V7
Winter Spring Summer Autumn Winter Spring Summer Autumn
r Warm temperate zone 0.66 0.66 0.62 0.63 0.73 0.85 0.55 0.66
North subtropical zone 0.42 0.80 0.82 0.81 0.49 0.86 0.83 0.85
South subtropical zone 0.78 0.84 0.74 0.81 0.84 0.89 0.87 0.89
Mid-subtropical zone 0.81 0.90 0.75 0.81 0.85 0.92 0.79 0.84
North tropic zone 0.82 0.80 0.45 0.60 0.87 0.77 0.66 0.85
BIAS (%) Warm temperate zone −54.1 −12.3 8.4 12.0 −21.6 14.9 31.1 36.8
North subtropical zone −48.3 −3.6 −4.1 −10.0 −33.2 1.7 5.1 −1.3South subtropical zone −27.6 −0.9 −4.2 −4.1 −11.4 6.0 5.9 6.5
Mid-subtropical zone −26.0 −3.4 −2.0 −8.0 −10.2 2.5 7.6 0.4
North tropic zone −12.1 −2.9 −10.9 −11.5 5.4 13.9 13.3 7.3
RMSE (%) Warm temperate zone 114.6 69.8 21.1 39.4 98.1 48.1 33.3 53.4
North subtropical zone 52.5 22.1 16.5 20.7 49.8 18.6 16.4 18.9
South subtropical zone 45.2 26.0 30.1 33.9 39.0 21.8 22.6 26.8
Mid-subtropical zone 44.2 25.0 21.1 26.7 38.9 22.1 20.0 25.2
North tropic zone 43.0 21.9 24.3 28.5 47.4 25.4 19.2 18.2
MSSS Warm temperate zone 0.16 0.40 0.26 0.29 0.47 0.70 −1.97 −0.77North subtropical zone −0.90 0.60 0.65 0.55 −0.34 0.72 0.64 0.70
South subtropical zone 0.46 0.70 0.53 0.66 0.68 0.77 0.72 0.78
Mid-subtropical zone 0.50 0.80 0.56 0.63 0.69 0.84 0.55 0.70
North tropic zone 0.62 0.44 −0.21 0.23 0.57 0.04 0.07 0.68
Performance of satellite rainfall products in southwest China

TMPA V6 performs better in the south subtropical, mid-subtropical, and north tropic zone, and V7 in all the zonesexcept the warm temperate zone. It is worth noting that in thewarm temperate zone (highland), both TMPA V6 and V7obviously overestimate the precipitation. That might be relat-ed to the topography of this zone. Yin et al. (2008) reportedthat the TMPA 3B42V5 (an earlier version of TMPA)overestimated precipitation in this mountainous region (Tibet-an Plateau), and Gao and Liu (2013) found the overestimationwas more obvious at higher elevations. The large RMSE andlow MSSS reveal that the retrieved precipitation form TMPAis much uncertain in this zone. However, the V6 seems toperform relatively better than V7 in the warm temperatezone.
As for the different elevations, overall negative BIAS forV6 are observed in the area below 2,000 m, whereas a smallpositive BIAS is obtained when the elevation is higher than
2,000 m. However, for the V7, the overall BIAS is positive inall elevation ranges. The overall overestimation of precipita-tion in area above 2,000 m may be due to the cold surface andice covers over mountaintops, which could be misclassified asrain clouds in passive MW algorithms and consequently leadto precipitation overestimation (Feyera and Mekonnen 2010).Overestimation of precipitation in mountainous region hasalso been reported in other mountainous regions and satelliterainfall products (Hong et al. 2007; Yin et al. 2008; Dinkuet al. 2010).Moreover, the snow cover prevents retrievals withpassive microwave window channels, and the difficulties indetecting precipitation at high-elevation TRMM’s precipita-tion radar (Barros et al. 2006) induce uncertainty and largeerrors in the high-altitude region. Furthermore, Karaseva et al.(2012) found that the RMSE and BIAS exhibited an increas-ing trend in Kyrgyzstan when the elevation increased. Incontrast, we find no obvious elevation-dependent tendencies
Table 4 Different error statistics between TMPA 3B42 and rain gauge monthly precipitation at different elevation ranges
Elevation (m) Observed mean (mm) V6 V7
V6 mean (mm) r BIAS (%) RMSE MSSS V7 mean (mm) r BIAS (%) RMSE (%) MSSS
0–500 127.5 122.9 0.89 −3.6 52.0 0.78 133.8 0.93 4.9 41.9 0.86
500–1,000 102.5 94.4 0.91 −8.0 41.3 0.81 106.0 0.93 3.4 36.2 0.86
1,000–1,500 101.2 95.6 0.92 −5.5 41.1 0.84 107.6 0.93 6.3 38.9 0.86
1,500–2,000 89.3 80.9 0.87 −9.4 49.3 0.74 94.4 0.89 5.7 49.1 0.75
>2,000 68.5 70.7 0.90 3.2 47.6 0.79 85.2 0.88 24.5 58.4 0.63
Fig. 10 The monthly precipitation of the TMPA 3B42V6 vs. rain gauge data for the five elevation ranges: a 0–500m, b 500–1,000 m, c 1,000–1,500m,d 1,500–2,000 m, and e >2,000 m
M. Liu et al.

shown by the r, RMSE, BIAS, and MSSS for V6 (Gao andLiu 2013), whereas for V7, the r and MSSS decrease withincrease of elevation to some extent. Hence, the impact ofelevation on the performance of satellite estimates must beregion specific (Romilly and Gebremichael 2011). On theother hand, relatively larger random errors for V6 and V7occur in the area below 500 m and above 2,000 m, respec-tively (Table 4), suggesting that the TMPA should be usedwith great caution.
However, elevation would not be the adequate indictor oftopography. The effect of topography is more complicated, asit includes other factors than just elevation (Dinku et al. 2008).Our results show that, even though the accuracies of theTMPA are significantly improved at the monthly and seasonalscales, poor performances can be still observed in somegauges located in complex terrain, such as the Deqin (thebig red dot in Fig. 7f) and Gongshan gauge (the big greendot in Fig. 5c, f). The poor performance of TMPA at Deqinstation (3,319 m amsl) can be attributed to the ices sheet in thescan view. This Gongshan station is at the elevation of1,583 m but embraced with mountains above 4,000 m. Thecomplex topography significantly affects the microclimates inthe valley. Previous study pointed out that TMPA could notadequately capture the local rain (Adler et al. 2003) or theorographically induced precipitation (Dinku et al. 2007). Onthe other hand, the existence of ice sheets appears within15 km away from the gauge (within the sensor footprint(25 km) of TMPA 3B42) would also interfere with radarsignals (Karaseva et al. 2012) and result in errors. In thenorthwest of the study area, this kind of terrain (south part ofthe Hengduan Mountains) distributes widely. However, mostof the gauges in our study are located in the relative open area;hence, the gauge data may not adequately represent the pre-cipitation in the complex terrain for assessing the reliability ofthe TMPA in the very mountainous area. The TMPA mayperform poorer in other complexly topographic area thatungauged. Therefore, more detailed rain gauge measurementsshould be employed for further evaluation.
Currently, the satellite rainfall (TMPA) has been used inmany fields, such as estimation of rainfall erosivity (Antonet al. 2010), landslide prediction (Hong and Adler 2008),flood prediction (Hong et al. 2010), drought monitoring(Zeng et al. 2012), and extreme events (Scott et al. 2006),and several efforts have been directed to application of it forinput in distributed hydrological model (Bruno et al. 2008;Yang et al. 2009; Li et al. 2012a, b, c; Su et al. 2008). Notably,the feasibility of the model or prediction depends heavily onthe accuracy of precipitation. In particular, the rainfall trig-gered hazards, such as the landslides and floods, would bemore related to the intensity of individual precipitation eventor the daily precipitation amount, and the drought may attri-bute to low precipitation within a long period. However, theresults presented in this study suggest that both TMPAV6 and
V7 do not perform well at the daily time scale. It means thatunderestimation of the risk of hazards would be induced ifusing TMPA (V6 or V7) directly as variable for prediction orinputs for modeling in the study area. However, the improvedaccuracies of TMPA at large time scale imply that this prod-ucts might be suitable for water resource management orassessment at a long time scale. Certainly, this need furtherdetails assessment.
Above all, the TMPA 3B42V6 and V7 precipitation datashould be used with caution in this region, especially in thedry seasons. Though the overall accuracy of V7 is slightlyimproved, it is still unacceptable in the highland (>2,000 m)and even poor than V6. Hence, the TMPA products still havemuch room to improve. Specific and careful calibration is verynecessary in the application for more representative results,and the factors as the topography, climate types, and theseasonal variations should be considered fully.
5 Conclusions
This study evaluates the TMPAV6 and V7 rainfall productsusing a dense network of 75 rain gauge measurements over amountainous terrain in southwest China. This area exhibitsdramatic variation in elevation, complex topography, andclimate types. The results show that the TMPA always under-estimates the precipitation events. Overall, the bias score (BS),hit rate (HR), false alarm ratio (FAR), and BIAS for TMPAV7are higher than that for V6. The results also suggest thatTMPA V6 generally underestimates the precipitation in thisarea probably due to some missing precipitation events, andthe V7 always overestimates precipitation in wet season andunderestimates it in dry season. The underestimation andoverestimation of precipitation can be attributed to the falsealarm events. The overall accuracies of the two products relyheavily on the time scale of interest. Both the two versionsperform poorly at the daily scale, and the accuracies areimproved substantially when the scale is expanded to monthlyand seasonal. However, despite the improvement, relativelarge errors are also observed at a few sites where the landand ice sheet occurs within the TMPA radiometric field ofview (<25 km). On the other hand, the accuracies of the twoversions exhibit obvious seasonal variations that the resultsare more acceptable in the wet season fromMay to September.Furthermore, the accuracies of TMPA are also climate zoneand elevation dependent. As a whole, V7 outperforms V6 inthe region with low elevation, but suffers even poor accuracyin the highland and in the warm temperate zone in this area.
In conclusion, the TMPA 3B42 V6 and V7 rainfall prod-ucts generally perform well in wet season in most regions ofsouthwest China at monthly and seasonal scales and theaccuracy of V7 is generally improved compared to V6. How-ever, there still exist some major limitations in reproducing
Performance of satellite rainfall products in southwest China

precipitation in dry season and in areas with high elevationand complex terrain. From this perspective, we would arguethat improvements of TMPA precipitation retrieval algorithmsare still required for this kind of regions.
Acknowledgments This study is supported by the “100 talents program”of Chinese Academy of Sciences (2060299, Y251101111, Y323025111).The authors gratefully acknowledge the helpful comments from the tworeviewers and the data received from the following organizations: TMPAdata from the National Aero-nautics and Space Administration (NASA)and the rain gauge data from the China Meteorological Administration.
References
Adeyewa Z, Nakamura K (2003) Validation of TRMM radar rainfall dataover major climatic regions in Africa. J Appl Meteorol 42:331–347
Adler RF, Huffman GJ, Chang A, Ferraro R, Xie PP, Janowiak J, RudolfB, Schneider U, Curtis S, Bolvin D, Gruber A, Susskind J, Arkin P,Nelkin E (2003) The version-2 Global Precipitation ClimatologyProject (GPCP) monthly precipitation analysis (1979-present). JHydrometeorol 4:1147–1167
Anton V, Geert S, Steven MDJ (2010) Satellite-based estimation ofrainfall erosivity for Africa. J Hydrol 395:235–241
Barros AP, Chiao S, Lang TJ, Burbank D and Putkonen J (2006) Fromweather to climate—Seasonal and interannual variability of stormsand implications for erosion process in the Himalaya. GeologicalSociety of America Special Paper 398, Penrose Conference Series,Boulder, CO, 17–38
Bruno C, Walter C, Carlos EMT (2008) Daily hydrological modeling inthe Amazon basin using TRMM rainfall estimates. J Hydrol 360:207–216
Cai YL (1996) Preliminary research on ecological reconstruction in karstmountain poverty areas of southwest China. Adv Earth Sci 11(6):602–606
Chen S, Hong Y, Cao Q, Kirstetter PE, Gourley JJ, Qi YC, Zhang J,Howard K, Hu JJ, Wang J (2013) Performance evaluation of radarand satellite rainfalls for Typhoon Morakot over Taiwan: are remotesensing products ready for gauge denial scenario of extreme events?J Hydrol 506:4–13
Deng JF, Cui GY, Wang YD, Que NY, Huang BZ (2009) Rocky desert-ification and comprehensive improvement of karst areas in Yunnan.Pratacultural Sci 26(2):33–38
Dinku T, Ceccato P, Grover-Kopec E, LemmaM, Connor SJ, RopelewskiCF (2007) Validation of satellite rainfall products over East Africa’scomplex topography. Int J Remote Sens 28:1503–1526
Dinku T, Chidzambwa S, Ceccato P, Connor SJ, Ropelewski CF (2008)Validation of high-resolution satellite rainfall products over complexterrain. Int J Remote Sens 29(14):4097–4110
Dinku T, Connor SJ, Ceccato P (2010) Comparison of CMORPH andTRMM-3B42 over mountainous regions of Africa and SouthAmerica. In: Gebremichael M, Hossain F (Eds) Satellite RainfallApplications for Surface Hydrology, Springer Netherlands, pp 193–204. doi:10.1007/978-90-481-2915-7_11
Fan FD, Wang KL, Xiong Y, Xuan Y, Zhang W, Yue YM (2011)Assessment and spatial distribution of water and soil loss in karstregions, southwest China. Acta Ecol Sin 31(21):6353–6362
Feidas H (2010) Validation of satellite rainfall products over Greece.Theor Appl Climatol 99:193–216
Feidas H, Kokolatos G, Negri A, Manyin M, Chrysoulakis N,Kamarianakis Y (2009) Validation of an infrared-based satellitealgorithm to estimate accumulated rainfall over the Mediterraneanbasin. Theor Appl Climatol 95:91–109
Feyera AH, Mekonnen G (2010) Evaluation of high-resolution satelliteprecipitation products over very complex terrain in Ethiopia. J ApplMeteorol Climatol 49:1044–1051
Fotis F, Christos M, Maria AM (2011) Validation of satellite rainfallproducts for operational flood forecasting: the case of the Evroscatchment. Theor Appl Climatol 104:403–414
Gao YC, Liu MF (2013) Evaluation of high-resolution satellite precipi-tation products using rain gauge observations over the TibetanPlateau. Hydrol Earth Syst Sci 17(2):837–849
Gao Z, Wu JR, Ma HC (2012) Effects of fertilization on the growth oftwo-years old stand ofCeiba Pentandra in dry-hot valley of HongheRiver. Res Soil Water Conserv 19(2):95–100 (in Chinese)
Habib E, Henschke A, Adler R (2009) Evaluation of TMPA satellite-based research and real-time rainfall estimates during six tropical-related heavy rainfall events over Louisiana, USA. Atmos Res 94:373–388
Hong Y, Adler FR (2008) Predicting global landslide spatiotemporaldistribution: Integrating landslide susceptibility zoning techniquesand real-time satellite rainfall estimates. Int J Sediment Res 23:249–257
Hong Y, Gochis D, Cheng JT, Hsu KL, Sorooshian S (2007) Evaluationof PERSIANN-CCS rainfall measurement using the NAME EventRain Gauge Network. J Hydrometeorol 8:469–482
Hong Y, Robert F, Adler RF, George J, Huffman J, Pierce H (2010)Applications of TRMM-based multi-satellite precipitation estima-tion for global runoff prediction: prototyping a global flood model-ing system. In: Gebremichael M, Hossain F (Eds) Satellite RainfallApplications for Surface Hydrology, Springer Netherlands, pp 245–265. doi:10.1007/978-90-481-2915-7_15
HuQF, YANGDW,WANGYT, YANGHB (2013) Accuracy and spatio-temporal variation of high resolution satellite rainfall estimate overthe Ganjiang River Basin. Sci China Technol Sci 56(4):853–865
Huffman GJ, Bolvin DT (2013) Real-time TRMM Multi-SatellitePrecipitation Analysis data set documentation. ftp://meso-a.gsfc.nasa.gov /pub/trmmdocs/rt/3B4XRT_doc_V7.pdf
Huffman G, Adler R, Bolvin D, Nelkin E (2004) Uncertainty in finescaleMPA precipitation estimates and implications for hydrometeorolog-ical analysis and forecasting. 18th conf. on hydrology, 11–18January, Seattle, W.A
Huffman GJ, Adler RF, Bolvin DT, Gu GJ, Nelkin EJ, Bowman KP,Hong Y, Stocker EF, Wolff DB (2007) The TRMM multi-satelliteprecipitation analysis (TMPA): quasi-global, multi-year, combined-sensor precipitation estimates at fine scales. J Hydrometeorol 8:38–55
Jamandre CA, Narisma GT (2013) Spatio-temporal validation of satellite-based rainfall estimates in the Philippines. Atmos Res 122:599–608
Javanmard S, Yatagai A, NodzuMI, BodaghJamali J, Kawamoto H (2010)Comparing high-resolution gridded precipitation data with satelliterainfall estimates of TRMM3B42 over Iran. Adv Geosci 25:119–125
Jiang S, Ren L, Yong B, Yang X, Shi L (2010) Evaluation of high-resolution satellite precipitation products with surface rain gaugeobservations from Laohahe Basin in northern China. Water Sci Eng3(4):405–417
Jin Z (1999) A phytosociological study on the semi- savanna vegetationin the dry- hot valleys of Yuanjiang River, Yunnan. Guihaia 19(4):289–302 (in Chinese)
Karaseva MO, Marina S, Gairola RM (2012) Validation of high-resolution TRMM-3B43 precipitation product using rain gaugemeasurements over Kyrgyzstan. Theor Appl Climatol 108:147–157
Kummerow C, Barnes W, Kozu T, Shiue J, Simpson J (1998) TheTropical Rainfall Measuring Mission (TRMM) sensor package. JAtmos Oceanic Tech 15(3):809–817
Kummerow C, Simpson J, Thiele O, Barnes W, Chang ATC,Stocker E et al (2000) The status of the Tropical RainfallMeasuring Mission (TRMM) after two years in orbit. J ApplMeteorol 39:1965–1982
M. Liu et al.

Lan FS, Mo QH (1995) Analysis and evaluation of the agriculturalecosystem in karst region of Guangxi. Trop Geogr 15(3):235–243
Li XH, Zhang Q, Shao M (2012a) Spatio-temporal distribution of pre-cipitation in Poyang Lake Basin based on TRMMdata and precisionevaluation. Prog Geogr 31(9):1164–1170
Li XH, Zhang Q, Xu CY (2012b) Suitability of the TRMM satelliterainfalls in driving a distributed hydrological model for water bal-ance computations in Xinjiang catchment, Poyang lake basin. JHydrol 426–427:28–38
Li ZX, He YQ, Wang PY, Theakstone WH, An WL, Wang XF, Lu AG,Zhang W, Cao WH (2012c) Changes of daily climate extremes insouthwestern China during 1961–2008. Global Planet Change 80–81:255–272
Liu JF, Chen RS, Han CT (2010) Evaluating TRMM multi-satelliteprecipitation analysis using gauge precipitation and MODIS snow-cover products. Adv Water Sci 21:343–348
Liu Y, Fu Q, Song P et al (2011) Satellite retrieval of precipitation: Anoverview. Adv Earth Sci 26(11):1162–1172
Murphy AH (1988) Skill scores based on the mean square error and theirrelationships to the correlation coefficient. Mon Weather Rev 16:2417–2424
National Standard of the People's Republic of China (1998) Names andcodes for climate regionalization in China-Climate zones and cli-matic regions. GB/T 17297–1998
Nazrul IM, Uyeda H (2007) Use of TRMM in determining the climaticcharacteristics of rainfall over Bangladesh. Remote Sens Environ108:264–276
Ou XK (1994) Ecological condition and ecological construction in dry-hot valley of Yunnan province. Resour Environ Yangtze Val 3(3):271–276 (in Chinese)
Prakash S, Mahesh C, Gairola RM (2013) Comparison of TRMMMultisatellite Precipitation Analysis (TMPA)-3B43 version 6 and7 products with rain gauge data from ocean buoys. Remote Sens Lett4(7):677–685
Prasetia R, As-syakur RA, Osawa T (2013) Validation of TRMM precip-itation radar satellite data over Indonesian region. Theor ApplClimatol 112:575–587
Romilly TG, Gebremichael M (2011) Evaluation of satellite rainfall esti-mates over Ethiopian river basins. Hydrol Earth Syst Sci 15:1505–1514
Scott C, Ahmed S, Robert F, Adler G, HUFFMAN J, Gu GJ, Hong Y(2006) Precipitation Extremes Estimated by GPCP and TRMM:ENSORelationships. J Hydrometeorol 8:678–689, SPECIAL Section
Shin DB, Chiu LS, Kafatos M (2001) Comparison of the monthlyprecipitation derived from the TRMM satellite. Geophys Res Lett28(5):795–798
Su F, HongY, Lettenmaier D (2008) Evaluation of TRMMMulti-SatellitePrecipitation Analysis (TMPA) and its utility in hydrologic predic-tion in La Plata Basin. J Hydrometeorol 9(622):640
Su F, Gao H, Huffman GJ, Lettenmaier DP (2011) Potential utility of thereal-time TMPA-RT precipitation estimates in streamflow predic-tion. J Hydrometeorol 12:444–455
Wang SQ (2010) Three characteristics of meteorological drought inSouthwest china. China Meteorological News
Wang W, Wang WJ, Li JS, Wu H, Xu C, Liu T (2010) The impact ofsustained drought on vegetation ecosystem in Southwest Chinabased on remote sensing. Procedia Environ Sci 2:1679–1691
Xie P, Arkin PA (1996) Analyses of global monthly precipitation usinggauge observations, satellite estimates and numerical model predic-tions. J Climate 9:840–858
Yang CG, Yu ZB, Lin ZH, Hao ZC, Wang ZL, Li M (2009) Study onwatershed hydrologic processes using TRMM satellite precipitationradar products. Adv Water Sci 20(6):461–466, in Chinaese
Yin ZY, Zhang XQ, Liu XD, Colella M, Chen XL (2008) An assessmentof the biases of satellite rainfall estimates over the Tibetan Plateauand correction methods based on topographic analysis. Jhydrometeorol 9:301–326
Yong B, Hong Y, Ren LL, Gourley JJ, Huffman GJ, Chen X, Wang W,Khan SI (2012) Assessment of evolving TRMM-basedmultisatellitereal-time precipitation estimation methods and their impacts onhydrologic prediction in a high latitude basin. J Geophys Res 117:D09108. doi:10.1029/2011JD017069
Yong B, Chen B, Gourley JJ, Ren L, Hong Y, Chen X, WangW, Chen S,Gong L (2013a) Intercomparison of the Version-6 and Version-7TMPA precipitation products over high and low latitudes basinswith independent gauge networks: Is the newer version better inboth real-time and post-real-time analysis for water resources andhydrologic extremes? J Hydrol. doi:10.1016/j.jhydrol.2013.10.050
Yong B, Ren LL, Hong Y, Gourley JJ, Tian YD, Huffman GJ, Chen X,Wang WG, Wen YX (2013b) First evaluation of the climatologicalcalibration algorithm in the real-time TMPA1-RT precipitation esti-mates over two basins at high and low latitudes. Water Resour Res49:2461–2472
Zeng Z (1994) Suggestion on poverty-deviation in the karst mountainareas in south China. In: Xie Y, Yang M (eds) Human activityand karst environment. Beijing Science and Technology Press,Beijing
Zeng HW, Li LJ (2011) Accuracy validation of TRMM 3B43 data inlancing river basin. Acta Geograph Sin 66:994–1004
Zeng HW, Li LJ, Li JY (2012) The evaluation of TRMM MultisatellitePrecipitation Analysis (TMPA) in drought monitoring in theLancang River Basin. J Geogr Sci 22(2):273–282
Zhang Q, Xu CY, Zhang ZX, Chen X, Han ZQ (2010) Precipitationextremes in a karst region: a case study in the Guizhou province,southwest China. Theor Appl Climatol 101:53–65
Zhao J, Chen C (1999) Geography of China. Higher Education Press,Beijing (In Chinese)
Performance of satellite rainfall products in southwest China