Embed Size (px)
Citation preview
coatings
Article
Evaluation of Passivation Process for Stainless Steel HypotubesUsed in Coronary Angioplasty Technique
Lucien Reclaru 1,2 and Lavinia Cosmina Ardelean 2,3,*
Citation: Reclaru, L.; Ardelean, L.C.
Evaluation of Passivation Process for
Stainless Steel Hypotubes Used in
Coronary Angioplasty Technique.
Coatings 2021, 11, 448. https://
doi.org/10.3390/coatings11040448
Academic Editor: Chang-Hwan Choi
Received: 17 March 2021
Accepted: 10 April 2021
Published: 13 April 2021
Publisher’s Note: MDPI stays neutral
with regard to jurisdictional claims in
published maps and institutional affil-
iations.
Copyright: © 2021 by the authors.
Licensee MDPI, Basel, Switzerland.
This article is an open access article
distributed under the terms and
conditions of the Creative Commons
Attribution (CC BY) license (https://
creativecommons.org/licenses/by/
4.0/).
1 Scientific Independent Consultant Biomaterials and Medical Devices, 103 Paul-Vouga,2074 Marin-Neuchâtel, Switzerland; [email protected]
2 Multidisciplinary Center for Research, Evaluation, Diagnosis and Therapies in Oral Medicine, “Victor Babes”University of Medicine and Pharmacy Timisoara, 2 Eftimie Murgu sq, 300041 Timisoara, Romania
3 Department of Technology of Materials and Devices in Dental Medicine, “Victor Babes” University ofMedicine and Pharmacy Timisoara, 2 Eftimie Murgu sq, 300041 Timisoara, Romania
* Correspondence: [email protected]
Abstract: In the manufacturing of hypotubes for coronary applications, austenitic steels of types 304,304, or 316 L are being used. The manufacturing process involves bending steel strips into tubes andthe continuous longitudinal welding of the tubes. Manufacturing also includes heat treatments andstretching operations to achieve an external/internal diameter of 0.35/0.23 mm, with a tolerance of+/− 0.01 mm. Austenitic steels are sensitive to localized corrosion (pitting, crevice, and intergranular)that results from the welding process and various heat treatments. An extremely important stepis the cleaning and the internal and external passivation of the hypotube surface. During patientinterventions, there is a high risk of metal cations being released in contact with human blood.The aim of this study was to evaluate the state of passivation and corrosion resistance by usingelectrochemical methods and specific intergranular corrosion tests (the Strauss test). There weredifficulties in passivating the hypotubes and assessing the corrosion phenomena in the interior ofthe tubes. Assessments were made by plotting the open circuit potential curves and exploring thepolarization curves in the Tafel domain range of −50 mV vs. Ecorr (redox potential) and +150 mV vs.saturated calomel electrode (SCE, reference micro-electrode) for both the external and the internalsurfaces of the hypotubes. The tested hypotubes did not exhibit intergranular corrosion, as masslosses were low and, in general, close to the limit of the analytical balance. Electrochemical techniquesmade the differentiation of the passivation state of the tested hypotubes possible. The measuredcurrents were of the order of nano–pico amperes, and the quantities of electrical charges consumedfor corrosion were of the order of micro–nano coulombs.
Keywords: 304L austenitic steels; welding; hypotubes; external/internal corrosion polarization;intergranular corrosion; micro-electrodes; medical devices
1. Introduction
In 1924, William Herbert Hatfield (1882–1943) developed the “18/8” steel (18%chromium and 8% nickel, by mass), which is probably the most representative of thestainless steels that are manufactured and used worldwide.
Stainless steels are defined as alloys containing more than 50% iron and 12% chromium.The structures encountered in stainless steels are similar to those of their main constituent,iron, as they consist of two crystalline forms, depending on the temperature: between912 and 1394 C, a face-centered cubic structure, called the austenite or γ phase, is formed.Austenite is characterized as non-magnetic, ductile at any temperature, and strong hard-ening. Outside the range of 912–1394 C, a centered cubic structure, known as the ferriteα (if formed below 912 C) or δ (if formed above 1394 C) phase is formed. Ferrite ischaracterized as magnetic and fragile at low temperature, with medium ductility andlimited hardening [1].
Coatings 2021, 11, 448. https://doi.org/10.3390/coatings11040448 https://www.mdpi.com/journal/coatings
Coatings 2021, 11, 448 2 of 18
Over time, the chemical composition, mechanical properties, resistance to corrosion,machinability, and polishability of austenitic steels have evolved considerably. New produc-tion processes have been developed by the steel manufacturers, the base being representedby the “18/8” steel. By reducing carbon content, the 304 AISI grade was developed, and byadding molybdenum and less carbon, the 316 AISI grade was obtained.
Hypotubes for coronary applications are used for angioplasty and stent placement,thus restoring the proper irrigation of the heart without resorting to cardiac bypass surgery.Angioplasty enables the widening of a stenosed artery through the simple inflation of aballoon, sometimes accompanied by the placement of a stent [2,3]. Micron-sized specimens,cut from the hypotubes, represent the starting material for the manufacturing of endovas-cular stents and other biomedical devices [4]. They were designed to navigate vessels toreach lesion sights and act as guides for larger catheters [5,6].
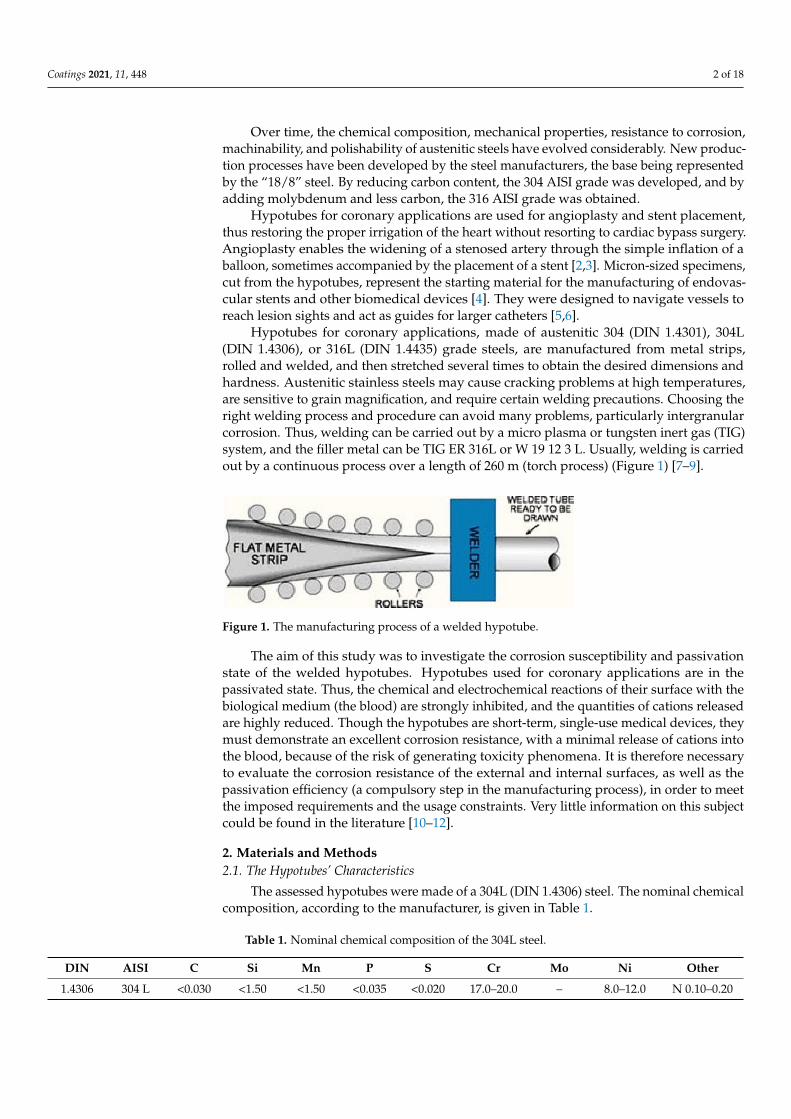
Hypotubes for coronary applications, made of austenitic 304 (DIN 1.4301), 304L(DIN 1.4306), or 316L (DIN 1.4435) grade steels, are manufactured from metal strips,rolled and welded, and then stretched several times to obtain the desired dimensions andhardness. Austenitic stainless steels may cause cracking problems at high temperatures,are sensitive to grain magnification, and require certain welding precautions. Choosing theright welding process and procedure can avoid many problems, particularly intergranularcorrosion. Thus, welding can be carried out by a micro plasma or tungsten inert gas (TIG)system, and the filler metal can be TIG ER 316L or W 19 12 3 L. Usually, welding is carriedout by a continuous process over a length of 260 m (torch process) (Figure 1) [7–9].
Figure 1. The manufacturing process of a welded hypotube.
The aim of this study was to investigate the corrosion susceptibility and passivationstate of the welded hypotubes. Hypotubes used for coronary applications are in thepassivated state. Thus, the chemical and electrochemical reactions of their surface with thebiological medium (the blood) are strongly inhibited, and the quantities of cations releasedare highly reduced. Though the hypotubes are short-term, single-use medical devices, theymust demonstrate an excellent corrosion resistance, with a minimal release of cations intothe blood, because of the risk of generating toxicity phenomena. It is therefore necessaryto evaluate the corrosion resistance of the external and internal surfaces, as well as thepassivation efficiency (a compulsory step in the manufacturing process), in order to meetthe imposed requirements and the usage constraints. Very little information on this subjectcould be found in the literature [10–12].
2. Materials and Methods2.1. The Hypotubes’ Characteristics
The assessed hypotubes were made of a 304L (DIN 1.4306) steel. The nominal chemicalcomposition, according to the manufacturer, is given in Table 1.
Table 1. Nominal chemical composition of the 304L steel.
DIN AISI C Si Mn P S Cr Mo Ni Other
1.4306 304 L <0.030 <1.50 <1.50 <0.035 <0.020 17.0–20.0 – 8.0–12.0 N 0.10–0.20
Coatings 2021, 11, 448 3 of 18
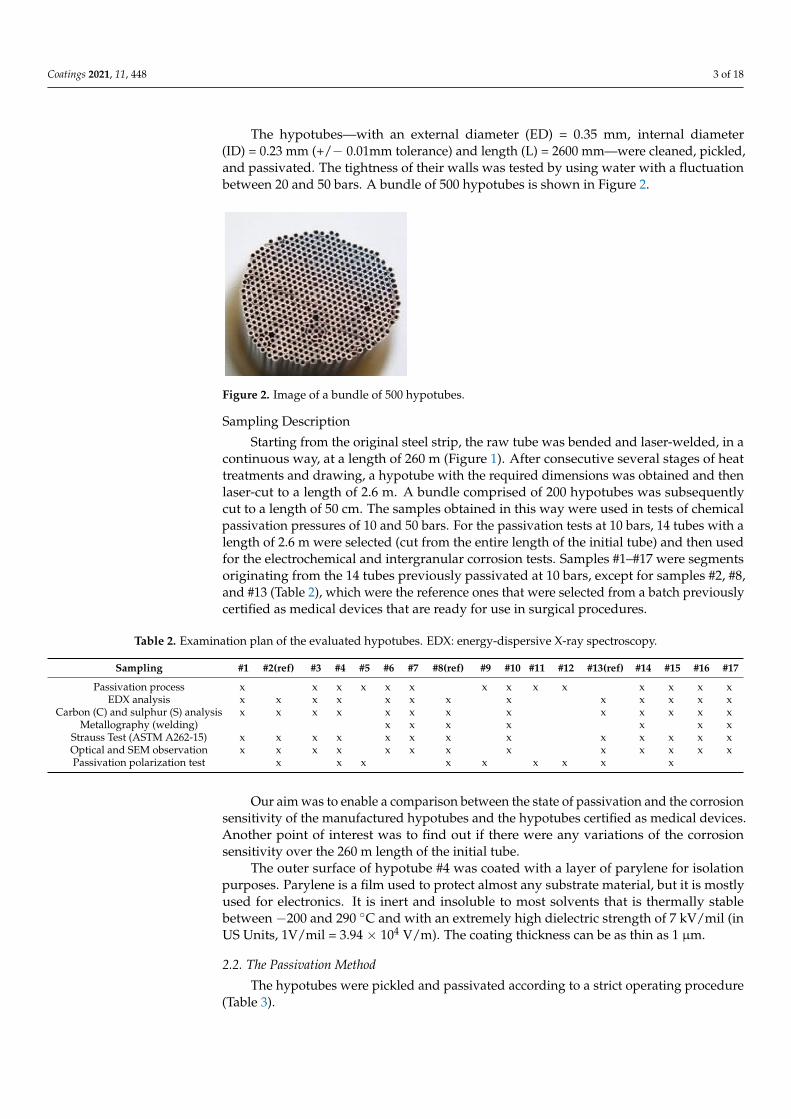
The hypotubes—with an external diameter (ED) = 0.35 mm, internal diameter(ID) = 0.23 mm (+/− 0.01mm tolerance) and length (L) = 2600 mm—were cleaned, pickled,and passivated. The tightness of their walls was tested by using water with a fluctuationbetween 20 and 50 bars. A bundle of 500 hypotubes is shown in Figure 2.
Figure 2. Image of a bundle of 500 hypotubes.
Sampling Description
Starting from the original steel strip, the raw tube was bended and laser-welded, in acontinuous way, at a length of 260 m (Figure 1). After consecutive several stages of heattreatments and drawing, a hypotube with the required dimensions was obtained and thenlaser-cut to a length of 2.6 m. A bundle comprised of 200 hypotubes was subsequentlycut to a length of 50 cm. The samples obtained in this way were used in tests of chemicalpassivation pressures of 10 and 50 bars. For the passivation tests at 10 bars, 14 tubes with alength of 2.6 m were selected (cut from the entire length of the initial tube) and then usedfor the electrochemical and intergranular corrosion tests. Samples #1–#17 were segmentsoriginating from the 14 tubes previously passivated at 10 bars, except for samples #2, #8,and #13 (Table 2), which were the reference ones that were selected from a batch previouslycertified as medical devices that are ready for use in surgical procedures.
Table 2. Examination plan of the evaluated hypotubes. EDX: energy-dispersive X-ray spectroscopy.
Sampling #1 #2(ref) #3 #4 #5 #6 #7 #8(ref) #9 #10 #11 #12 #13(ref) #14 #15 #16 #17
Passivation process x x x x x x x x x x x x x xEDX analysis x x x x x x x x x x x x x
Carbon (C) and sulphur (S) analysis x x x x x x x x x x x x xMetallography (welding) x x x x x x x
Strauss Test (ASTM A262-15) x x x x x x x x x x x x xOptical and SEM observation x x x x x x x x x x x x xPassivation polarization test x x x x x x x x x
Our aim was to enable a comparison between the state of passivation and the corrosionsensitivity of the manufactured hypotubes and the hypotubes certified as medical devices.Another point of interest was to find out if there were any variations of the corrosionsensitivity over the 260 m length of the initial tube.
The outer surface of hypotube #4 was coated with a layer of parylene for isolationpurposes. Parylene is a film used to protect almost any substrate material, but it is mostlyused for electronics. It is inert and insoluble to most solvents that is thermally stablebetween −200 and 290 C and with an extremely high dielectric strength of 7 kV/mil (inUS Units, 1V/mil = 3.94 × 10⁴ V/m). The coating thickness can be as thin as 1 µm.
2.2. The Passivation Method
The hypotubes were pickled and passivated according to a strict operating procedure(Table 3).
Coatings 2021, 11, 448 4 of 18
Table 3. The operating procedure for pickling and passivation of the hypotubes.
Procedure Medium Time (min)
Pickling HNO3 + H3PO4 + CH3COOH 60Rinsing Deionized H2O 15
Passivation 20% HNO3 20Rinsing Deionized H2O 15
Neutralisation Sol. 2% ETA 10Rinsing Deionized H2O 10Drying N2 of N55 purity -
The pickling medium was composed of 1 volume of nitric acid (67%), 2 volumesof phosphoric acid (85%), and two volumes of glacial acetic acid; it was heated to atemperature of 30 C for a duration of about 60 min.
2.2.1. The Micro-Pilot
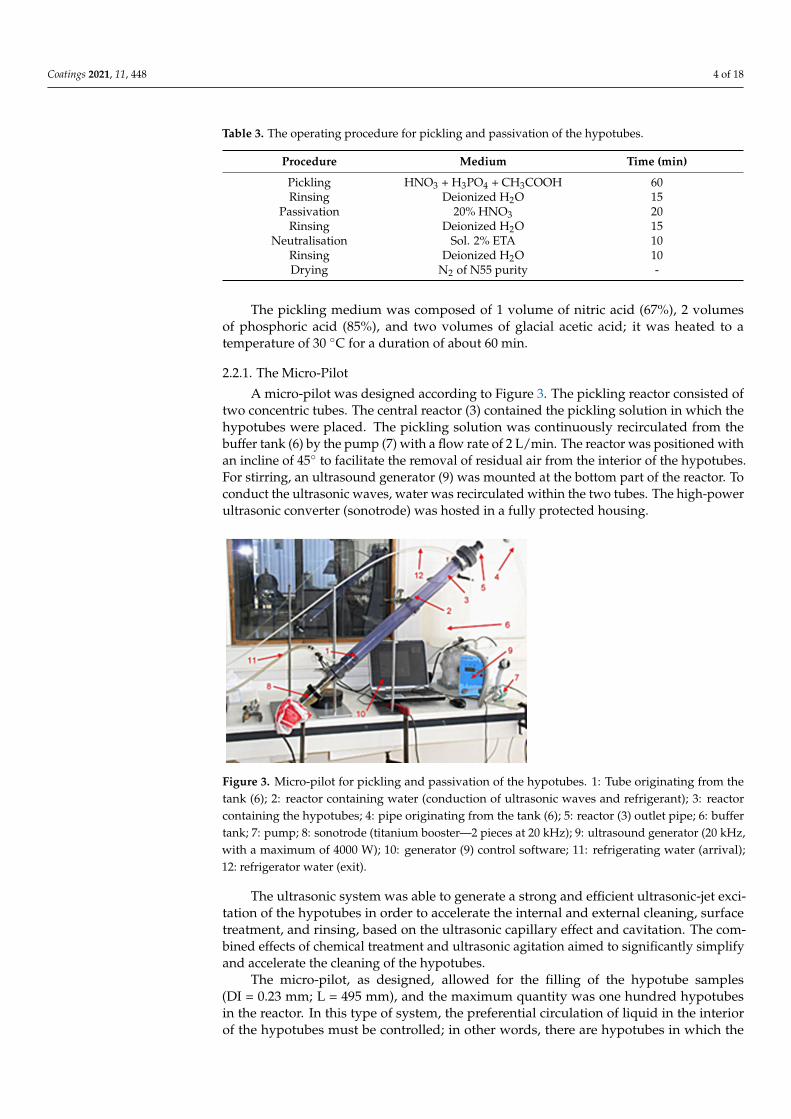
A micro-pilot was designed according to Figure 3. The pickling reactor consisted oftwo concentric tubes. The central reactor (3) contained the pickling solution in which thehypotubes were placed. The pickling solution was continuously recirculated from thebuffer tank (6) by the pump (7) with a flow rate of 2 L/min. The reactor was positioned withan incline of 45 to facilitate the removal of residual air from the interior of the hypotubes.For stirring, an ultrasound generator (9) was mounted at the bottom part of the reactor. Toconduct the ultrasonic waves, water was recirculated within the two tubes. The high-powerultrasonic converter (sonotrode) was hosted in a fully protected housing.
Figure 3. Micro-pilot for pickling and passivation of the hypotubes. 1: Tube originating from thetank (6); 2: reactor containing water (conduction of ultrasonic waves and refrigerant); 3: reactorcontaining the hypotubes; 4: pipe originating from the tank (6); 5: reactor (3) outlet pipe; 6: buffertank; 7: pump; 8: sonotrode (titanium booster—2 pieces at 20 kHz); 9: ultrasound generator (20 kHz,with a maximum of 4000 W); 10: generator (9) control software; 11: refrigerating water (arrival);12: refrigerator water (exit).
The ultrasonic system was able to generate a strong and efficient ultrasonic-jet exci-tation of the hypotubes in order to accelerate the internal and external cleaning, surfacetreatment, and rinsing, based on the ultrasonic capillary effect and cavitation. The com-bined effects of chemical treatment and ultrasonic agitation aimed to significantly simplifyand accelerate the cleaning of the hypotubes.
The micro-pilot, as designed, allowed for the filling of the hypotube samples(DI = 0.23 mm; L = 495 mm), and the maximum quantity was one hundred hypotubesin the reactor. In this type of system, the preferential circulation of liquid in the interiorof the hypotubes must be controlled; in other words, there are hypotubes in which the
Coatings 2021, 11, 448 5 of 18
pickling solution does not circulate. To verify if the liquid does circulate in the hypotubes,the orthophenanthroline hydrochloride test was carried out.
2.2.2. The Orthophenanthroline Hydrochloride Test
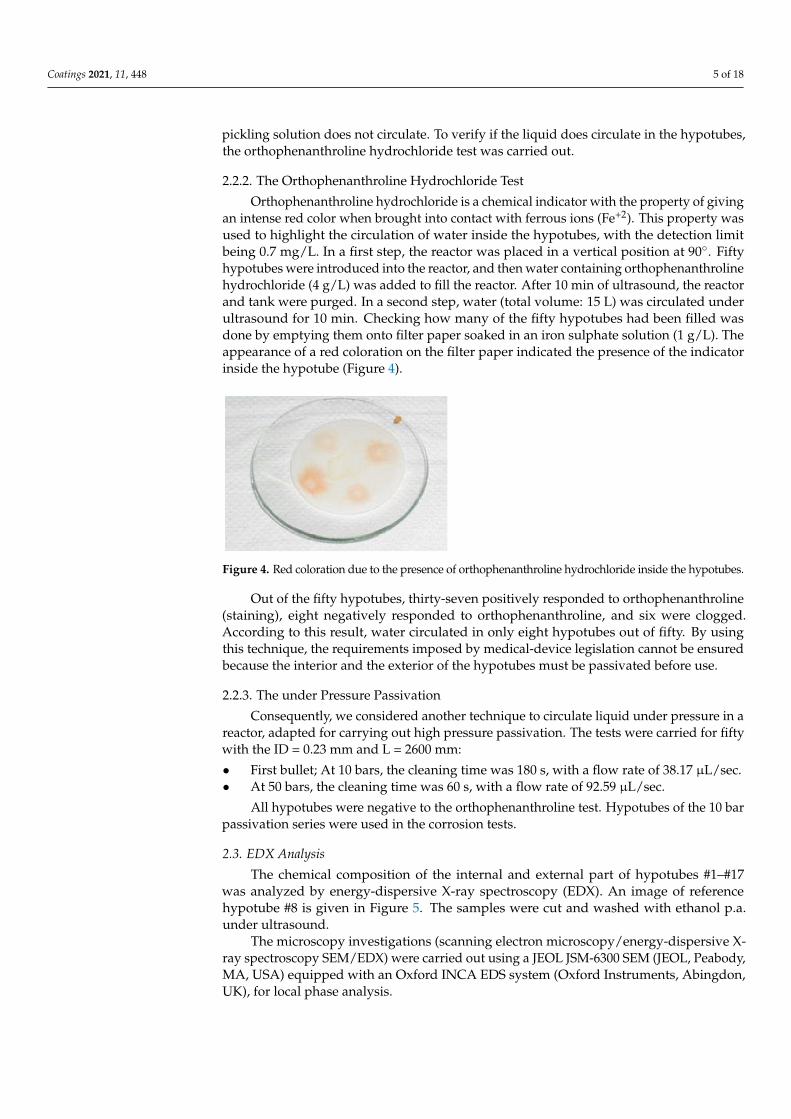
Orthophenanthroline hydrochloride is a chemical indicator with the property of givingan intense red color when brought into contact with ferrous ions (Fe+2). This property wasused to highlight the circulation of water inside the hypotubes, with the detection limitbeing 0.7 mg/L. In a first step, the reactor was placed in a vertical position at 90. Fiftyhypotubes were introduced into the reactor, and then water containing orthophenanthrolinehydrochloride (4 g/L) was added to fill the reactor. After 10 min of ultrasound, the reactorand tank were purged. In a second step, water (total volume: 15 L) was circulated underultrasound for 10 min. Checking how many of the fifty hypotubes had been filled wasdone by emptying them onto filter paper soaked in an iron sulphate solution (1 g/L). Theappearance of a red coloration on the filter paper indicated the presence of the indicatorinside the hypotube (Figure 4).
Figure 4. Red coloration due to the presence of orthophenanthroline hydrochloride inside the hypotubes.
Out of the fifty hypotubes, thirty-seven positively responded to orthophenanthroline(staining), eight negatively responded to orthophenanthroline, and six were clogged.According to this result, water circulated in only eight hypotubes out of fifty. By usingthis technique, the requirements imposed by medical-device legislation cannot be ensuredbecause the interior and the exterior of the hypotubes must be passivated before use.
2.2.3. The under Pressure Passivation
Consequently, we considered another technique to circulate liquid under pressure in areactor, adapted for carrying out high pressure passivation. The tests were carried for fiftywith the ID = 0.23 mm and L = 2600 mm:
• First bullet; At 10 bars, the cleaning time was 180 s, with a flow rate of 38.17 µL/sec.• At 50 bars, the cleaning time was 60 s, with a flow rate of 92.59 µL/sec.
All hypotubes were negative to the orthophenanthroline test. Hypotubes of the 10 barpassivation series were used in the corrosion tests.
2.3. EDX Analysis
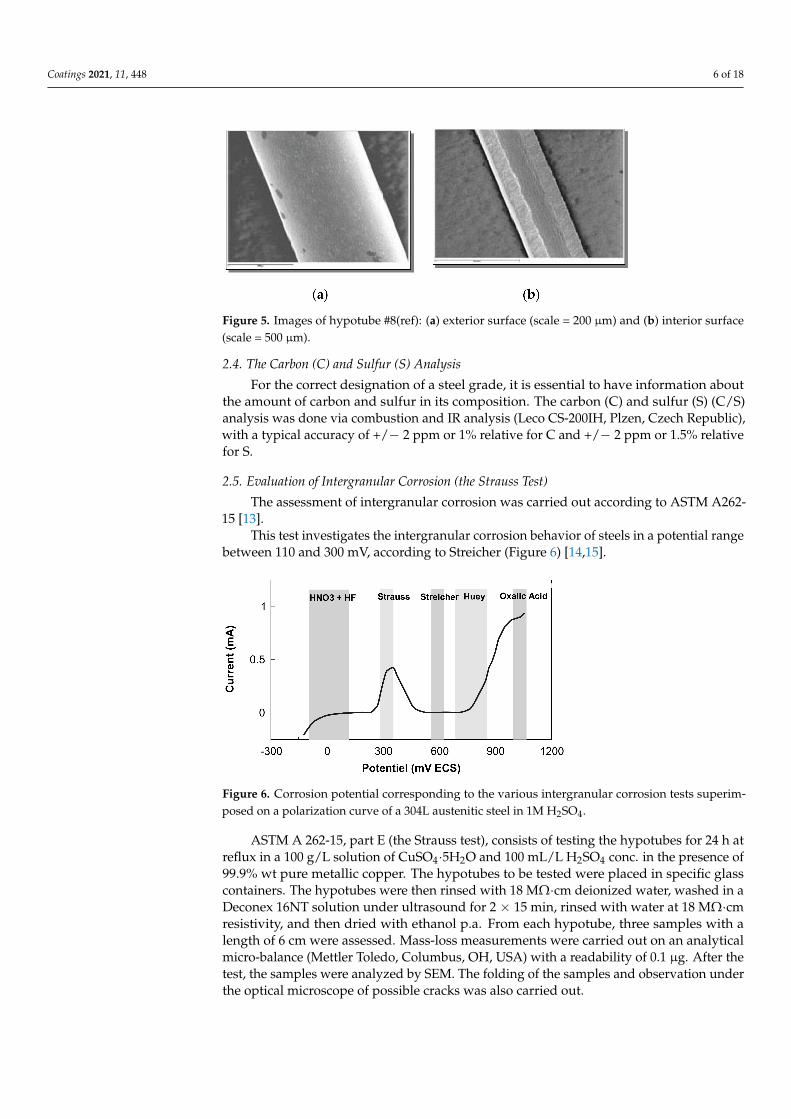
The chemical composition of the internal and external part of hypotubes #1–#17was analyzed by energy-dispersive X-ray spectroscopy (EDX). An image of referencehypotube #8 is given in Figure 5. The samples were cut and washed with ethanol p.a.under ultrasound.
The microscopy investigations (scanning electron microscopy/energy-dispersive X-ray spectroscopy SEM/EDX) were carried out using a JEOL JSM-6300 SEM (JEOL, Peabody,MA, USA) equipped with an Oxford INCA EDS system (Oxford Instruments, Abingdon,UK), for local phase analysis.
Coatings 2021, 11, 448 6 of 18
Figure 5. Images of hypotube #8(ref): (a) exterior surface (scale = 200 µm) and (b) interior surface(scale = 500 µm).
2.4. The Carbon (C) and Sulfur (S) Analysis
For the correct designation of a steel grade, it is essential to have information aboutthe amount of carbon and sulfur in its composition. The carbon (C) and sulfur (S) (C/S)analysis was done via combustion and IR analysis (Leco CS-200IH, Plzen, Czech Republic),with a typical accuracy of +/− 2 ppm or 1% relative for C and +/− 2 ppm or 1.5% relativefor S.
2.5. Evaluation of Intergranular Corrosion (the Strauss Test)
The assessment of intergranular corrosion was carried out according to ASTM A262-15 [13].
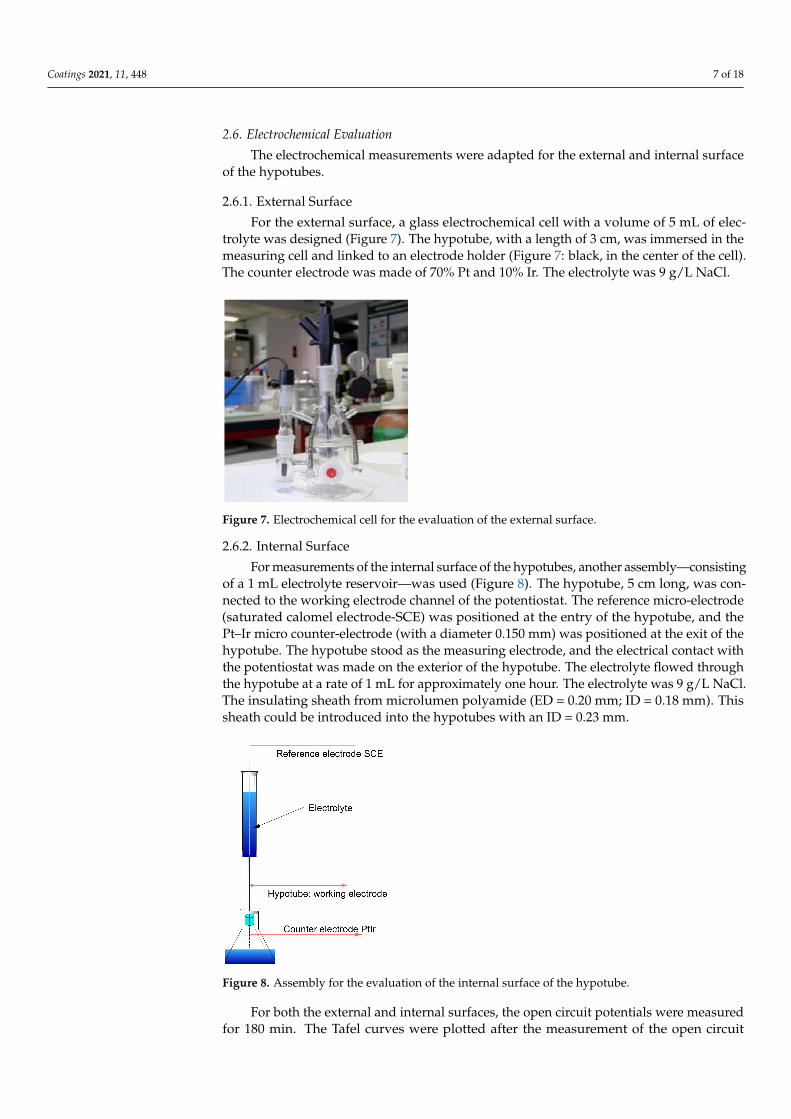
This test investigates the intergranular corrosion behavior of steels in a potential rangebetween 110 and 300 mV, according to Streicher (Figure 6) [14,15].
Figure 6. Corrosion potential corresponding to the various intergranular corrosion tests superim-posed on a polarization curve of a 304L austenitic steel in 1M H2SO4.
ASTM A 262-15, part E (the Strauss test), consists of testing the hypotubes for 24 h atreflux in a 100 g/L solution of CuSO4·5H2O and 100 mL/L H2SO4 conc. in the presence of99.9% wt pure metallic copper. The hypotubes to be tested were placed in specific glasscontainers. The hypotubes were then rinsed with 18 MΩ·cm deionized water, washed in aDeconex 16NT solution under ultrasound for 2 × 15 min, rinsed with water at 18 MΩ·cmresistivity, and then dried with ethanol p.a. From each hypotube, three samples with alength of 6 cm were assessed. Mass-loss measurements were carried out on an analyticalmicro-balance (Mettler Toledo, Columbus, OH, USA) with a readability of 0.1 µg. After thetest, the samples were analyzed by SEM. The folding of the samples and observation underthe optical microscope of possible cracks was also carried out.
Coatings 2021, 11, 448 7 of 18
2.6. Electrochemical Evaluation
The electrochemical measurements were adapted for the external and internal surfaceof the hypotubes.
2.6.1. External Surface
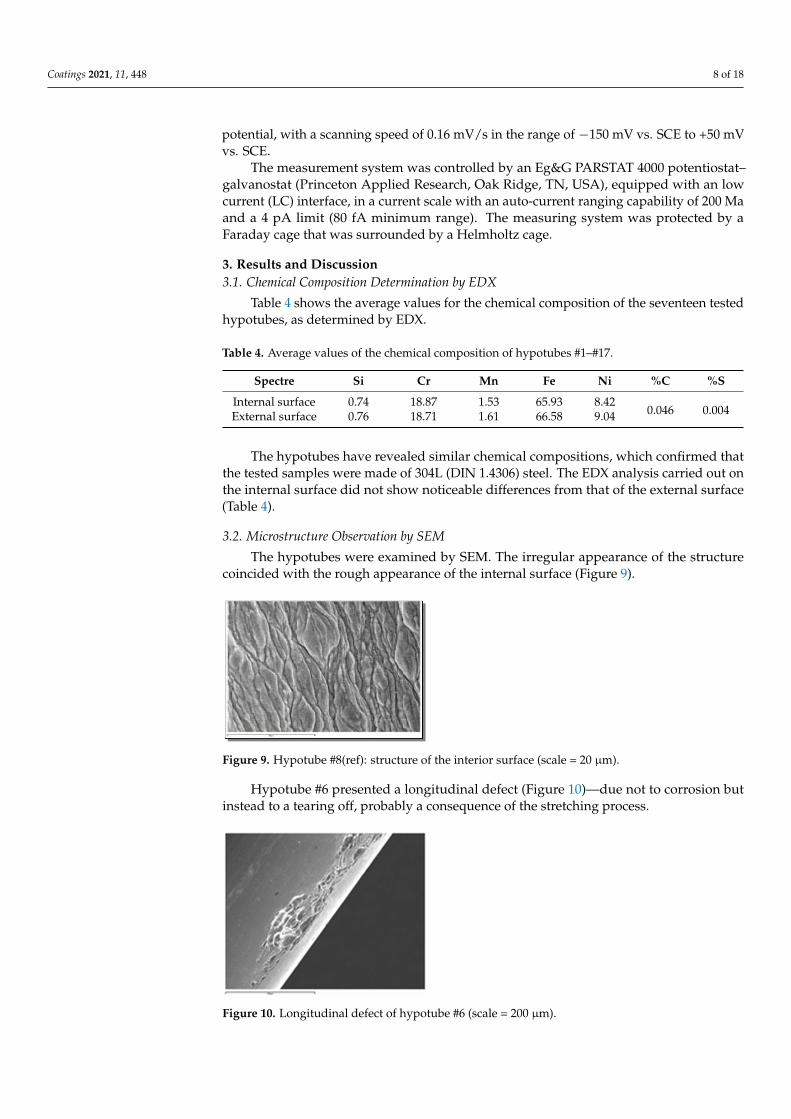
For the external surface, a glass electrochemical cell with a volume of 5 mL of elec-trolyte was designed (Figure 7). The hypotube, with a length of 3 cm, was immersed in themeasuring cell and linked to an electrode holder (Figure 7: black, in the center of the cell).The counter electrode was made of 70% Pt and 10% Ir. The electrolyte was 9 g/L NaCl.
Figure 7. Electrochemical cell for the evaluation of the external surface.
2.6.2. Internal Surface
For measurements of the internal surface of the hypotubes, another assembly—consistingof a 1 mL electrolyte reservoir—was used (Figure 8). The hypotube, 5 cm long, was con-nected to the working electrode channel of the potentiostat. The reference micro-electrode(saturated calomel electrode-SCE) was positioned at the entry of the hypotube, and thePt–Ir micro counter-electrode (with a diameter 0.150 mm) was positioned at the exit of thehypotube. The hypotube stood as the measuring electrode, and the electrical contact withthe potentiostat was made on the exterior of the hypotube. The electrolyte flowed throughthe hypotube at a rate of 1 mL for approximately one hour. The electrolyte was 9 g/L NaCl.The insulating sheath from microlumen polyamide (ED = 0.20 mm; ID = 0.18 mm). Thissheath could be introduced into the hypotubes with an ID = 0.23 mm.
Figure 8. Assembly for the evaluation of the internal surface of the hypotube.
For both the external and internal surfaces, the open circuit potentials were measuredfor 180 min. The Tafel curves were plotted after the measurement of the open circuit
Coatings 2021, 11, 448 8 of 18
potential, with a scanning speed of 0.16 mV/s in the range of −150 mV vs. SCE to +50 mVvs. SCE.
The measurement system was controlled by an Eg&G PARSTAT 4000 potentiostat–galvanostat (Princeton Applied Research, Oak Ridge, TN, USA), equipped with an lowcurrent (LC) interface, in a current scale with an auto-current ranging capability of 200 Maand a 4 pA limit (80 fA minimum range). The measuring system was protected by aFaraday cage that was surrounded by a Helmholtz cage.
3. Results and Discussion3.1. Chemical Composition Determination by EDX
Table 4 shows the average values for the chemical composition of the seventeen testedhypotubes, as determined by EDX.
Table 4. Average values of the chemical composition of hypotubes #1–#17.
Spectre Si Cr Mn Fe Ni %C %S
Internal surface 0.74 18.87 1.53 65.93 8.420.046 0.004External surface 0.76 18.71 1.61 66.58 9.04
The hypotubes have revealed similar chemical compositions, which confirmed thatthe tested samples were made of 304L (DIN 1.4306) steel. The EDX analysis carried out onthe internal surface did not show noticeable differences from that of the external surface(Table 4).
3.2. Microstructure Observation by SEM
The hypotubes were examined by SEM. The irregular appearance of the structurecoincided with the rough appearance of the internal surface (Figure 9).
Figure 9. Hypotube #8(ref): structure of the interior surface (scale = 20 µm).
Hypotube #6 presented a longitudinal defect (Figure 10)—due not to corrosion butinstead to a tearing off, probably a consequence of the stretching process.
Figure 10. Longitudinal defect of hypotube #6 (scale = 200 µm).
Coatings 2021, 11, 448 9 of 18
Because the microstructure was very fine and hardened, it would have been verydifficult to assess the grain index (Figure 11).
Figure 11. Microstructure of hypotube #8(ref): transverse surface (scale = 50 µm).
The heating and cooling that take place during the welding process affect the mi-crostructure, surface state, and composition of the welds and adjacent base metals, i.e., thesensitization of the welded area.
There is a very strict acceptance protocol after a welding process, and the following,extremely strict requirements for the parameters have to be respected:
(a) The external diameter must be ED ± 1.5% or minimum of 0.23 mm. (b) The wallthickness must be WT ± 10% or minimum 0.2 mm. (c) Lines, scratches, indents, andcavities, should be considered as defects. When counting the number of defects per meter,several defects within 1 cm (the unit of measurement) are considered to comprise one 1 cmdefect. The maximum acceptable limit is 5 cm of defects per meter. (d) Regarding thecrushing resistance test: when swatting a hypotube with a hammer, if the weld resists, itshould be considered compliant. (e) A metallographic analysis should be used to showthe eventual porosities, cracks, and welding seam shape and position. (f) The shape orgeometry of the welding seam considered acceptable following welding seam criteria isshown in Figure 12. (g) The heat treatment condition must be considered, whether it iswelded from hot-rolled or cold-rolled strip or it is bright annealed (annealing carried outin conditions that make it possible to obtain a metal surface free of oxides or showingonly very slight coloring). Heat treatment should be done in a controlled atmosphereto retain the material’s non-oxidized surface or to remove any present oxidized layers.(h) One must obtain a material certificate (through chemical analysis) and measure themechanical properties (Rp0.2 Mpa or N/mm2, Rp1.0 Mpa or N/mm2, Rm Mpa, or N/mm2
and A100 (%)).
Figure 12. Welding seam criteria.
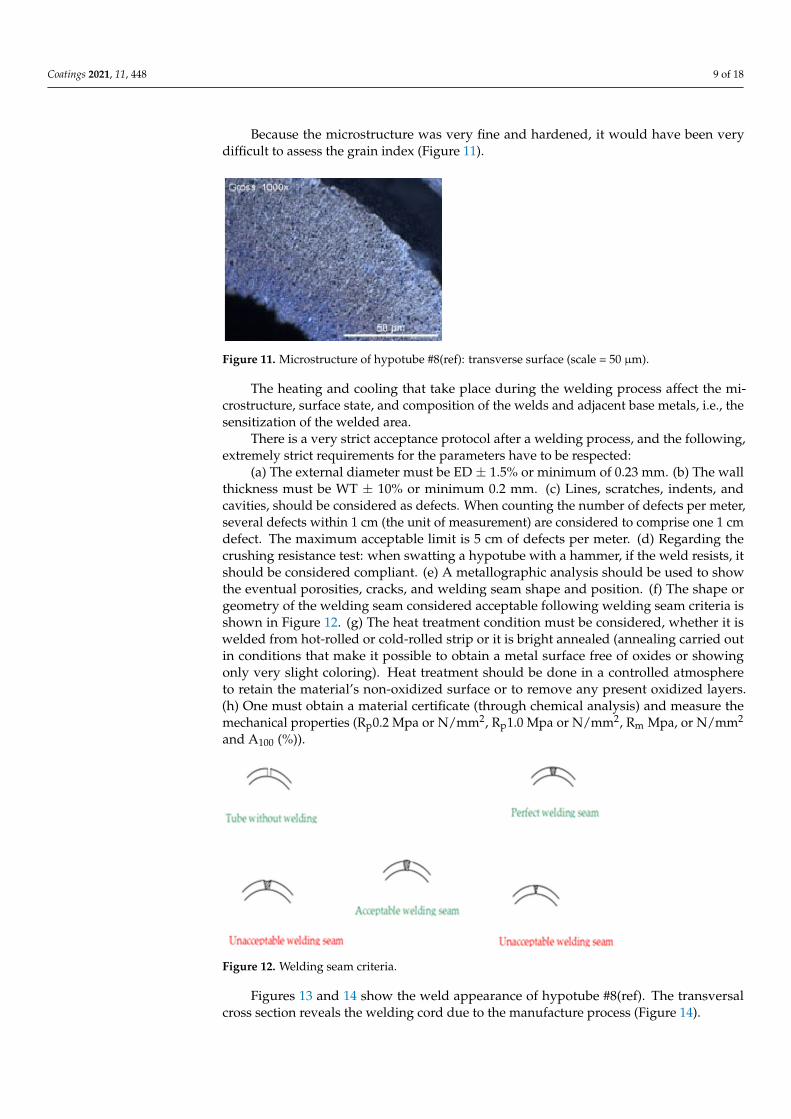
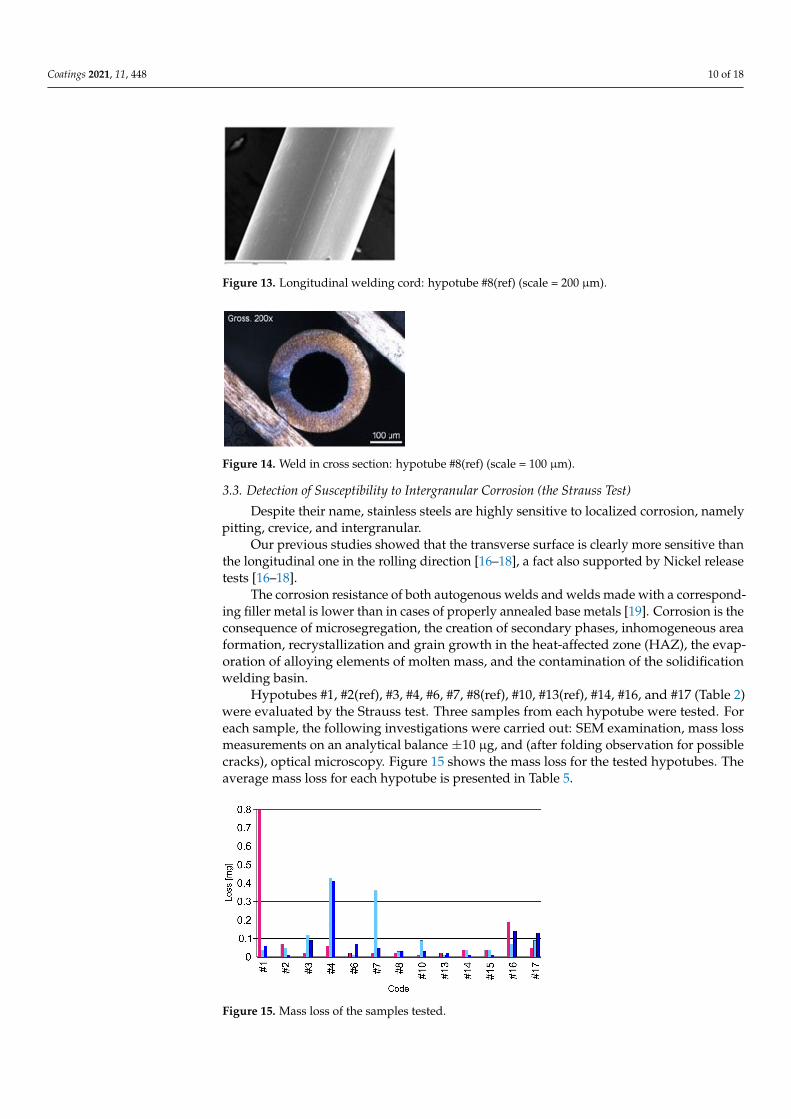
Figures 13 and 14 show the weld appearance of hypotube #8(ref). The transversalcross section reveals the welding cord due to the manufacture process (Figure 14).
Coatings 2021, 11, 448 10 of 18
Figure 13. Longitudinal welding cord: hypotube #8(ref) (scale = 200 µm).
Figure 14. Weld in cross section: hypotube #8(ref) (scale = 100 µm).
3.3. Detection of Susceptibility to Intergranular Corrosion (the Strauss Test)
Despite their name, stainless steels are highly sensitive to localized corrosion, namelypitting, crevice, and intergranular.
Our previous studies showed that the transverse surface is clearly more sensitive thanthe longitudinal one in the rolling direction [16–18], a fact also supported by Nickel releasetests [16–18].
The corrosion resistance of both autogenous welds and welds made with a correspond-ing filler metal is lower than in cases of properly annealed base metals [19]. Corrosion is theconsequence of microsegregation, the creation of secondary phases, inhomogeneous areaformation, recrystallization and grain growth in the heat-affected zone (HAZ), the evap-oration of alloying elements of molten mass, and the contamination of the solidificationwelding basin.
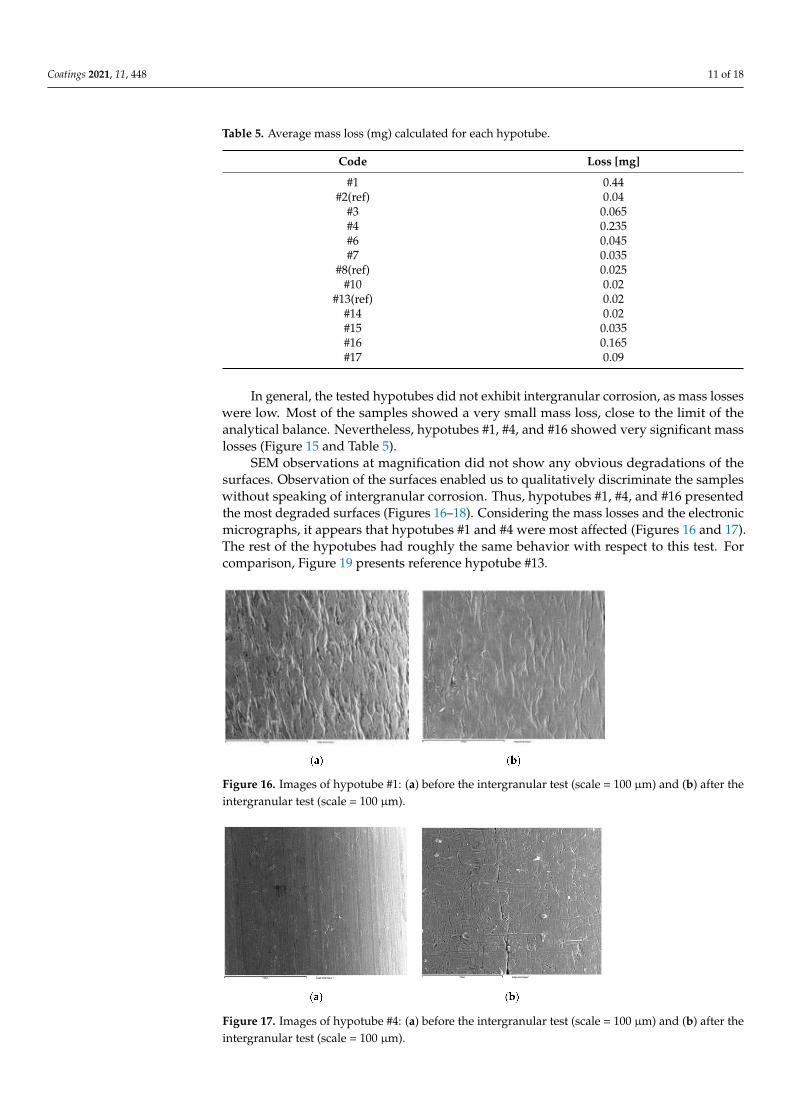
Hypotubes #1, #2(ref), #3, #4, #6, #7, #8(ref), #10, #13(ref), #14, #16, and #17 (Table 2)were evaluated by the Strauss test. Three samples from each hypotube were tested. Foreach sample, the following investigations were carried out: SEM examination, mass lossmeasurements on an analytical balance ±10 µg, and (after folding observation for possiblecracks), optical microscopy. Figure 15 shows the mass loss for the tested hypotubes. Theaverage mass loss for each hypotube is presented in Table 5.
Figure 15. Mass loss of the samples tested.
Coatings 2021, 11, 448 11 of 18
Table 5. Average mass loss (mg) calculated for each hypotube.
Code Loss [mg]
#1 0.44#2(ref) 0.04
#3 0.065#4 0.235#6 0.045#7 0.035
#8(ref) 0.025#10 0.02
#13(ref) 0.02#14 0.02#15 0.035#16 0.165#17 0.09
In general, the tested hypotubes did not exhibit intergranular corrosion, as mass losseswere low. Most of the samples showed a very small mass loss, close to the limit of theanalytical balance. Nevertheless, hypotubes #1, #4, and #16 showed very significant masslosses (Figure 15 and Table 5).
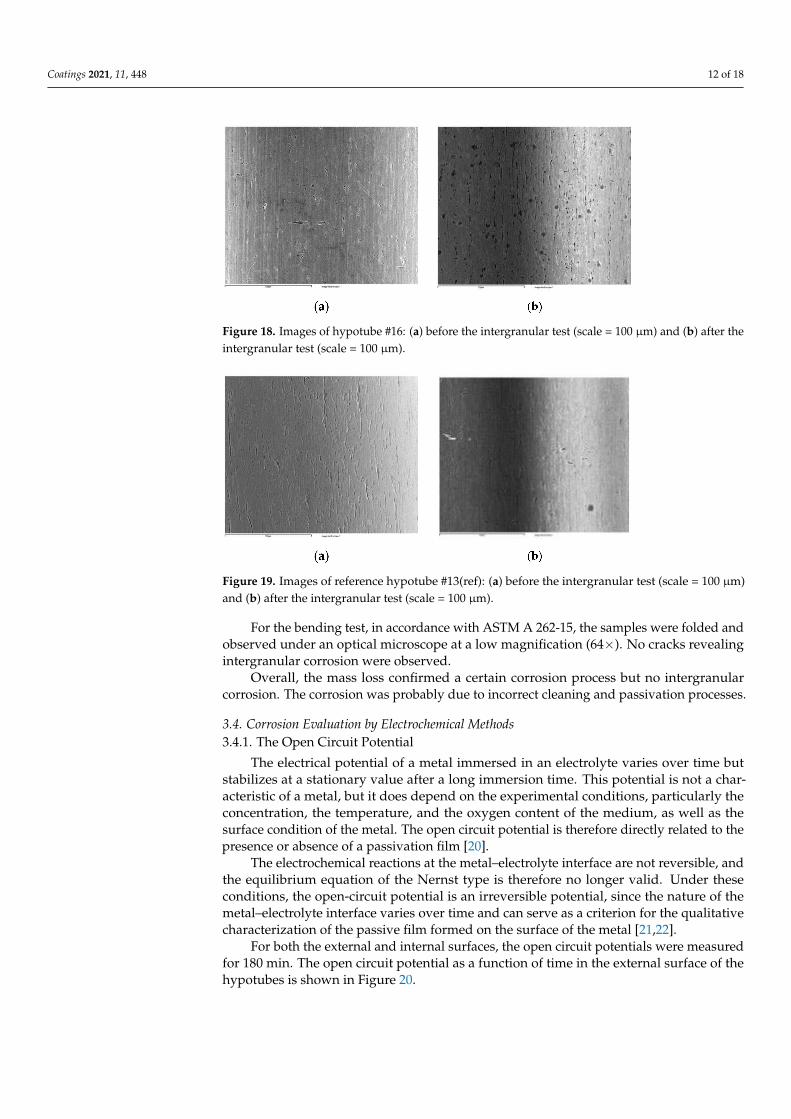
SEM observations at magnification did not show any obvious degradations of thesurfaces. Observation of the surfaces enabled us to qualitatively discriminate the sampleswithout speaking of intergranular corrosion. Thus, hypotubes #1, #4, and #16 presentedthe most degraded surfaces (Figures 16–18). Considering the mass losses and the electronicmicrographs, it appears that hypotubes #1 and #4 were most affected (Figures 16 and 17).The rest of the hypotubes had roughly the same behavior with respect to this test. Forcomparison, Figure 19 presents reference hypotube #13.
Figure 16. Images of hypotube #1: (a) before the intergranular test (scale = 100 µm) and (b) after theintergranular test (scale = 100 µm).
Figure 17. Images of hypotube #4: (a) before the intergranular test (scale = 100 µm) and (b) after theintergranular test (scale = 100 µm).
Coatings 2021, 11, 448 12 of 18
Figure 18. Images of hypotube #16: (a) before the intergranular test (scale = 100 µm) and (b) after theintergranular test (scale = 100 µm).
Figure 19. Images of reference hypotube #13(ref): (a) before the intergranular test (scale = 100 µm)and (b) after the intergranular test (scale = 100 µm).
For the bending test, in accordance with ASTM A 262-15, the samples were folded andobserved under an optical microscope at a low magnification (64×). No cracks revealingintergranular corrosion were observed.
Overall, the mass loss confirmed a certain corrosion process but no intergranularcorrosion. The corrosion was probably due to incorrect cleaning and passivation processes.
3.4. Corrosion Evaluation by Electrochemical Methods3.4.1. The Open Circuit Potential
The electrical potential of a metal immersed in an electrolyte varies over time butstabilizes at a stationary value after a long immersion time. This potential is not a char-acteristic of a metal, but it does depend on the experimental conditions, particularly theconcentration, the temperature, and the oxygen content of the medium, as well as thesurface condition of the metal. The open circuit potential is therefore directly related to thepresence or absence of a passivation film [20].
The electrochemical reactions at the metal–electrolyte interface are not reversible, andthe equilibrium equation of the Nernst type is therefore no longer valid. Under theseconditions, the open-circuit potential is an irreversible potential, since the nature of themetal–electrolyte interface varies over time and can serve as a criterion for the qualitativecharacterization of the passive film formed on the surface of the metal [21,22].
For both the external and internal surfaces, the open circuit potentials were measuredfor 180 min. The open circuit potential as a function of time in the external surface of thehypotubes is shown in Figure 20.
Coatings 2021, 11, 448 13 of 18
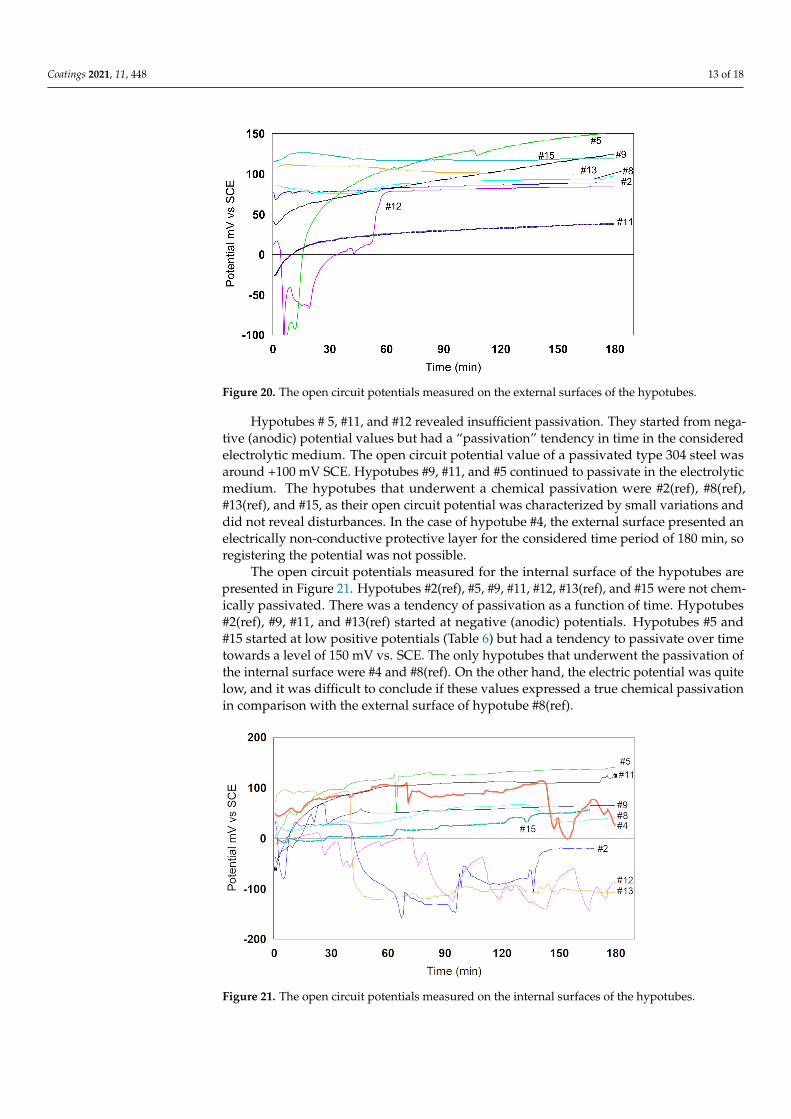
Figure 20. The open circuit potentials measured on the external surfaces of the hypotubes.
Hypotubes # 5, #11, and #12 revealed insufficient passivation. They started from nega-tive (anodic) potential values but had a “passivation” tendency in time in the consideredelectrolytic medium. The open circuit potential value of a passivated type 304 steel wasaround +100 mV SCE. Hypotubes #9, #11, and #5 continued to passivate in the electrolyticmedium. The hypotubes that underwent a chemical passivation were #2(ref), #8(ref),#13(ref), and #15, as their open circuit potential was characterized by small variations anddid not reveal disturbances. In the case of hypotube #4, the external surface presented anelectrically non-conductive protective layer for the considered time period of 180 min, soregistering the potential was not possible.
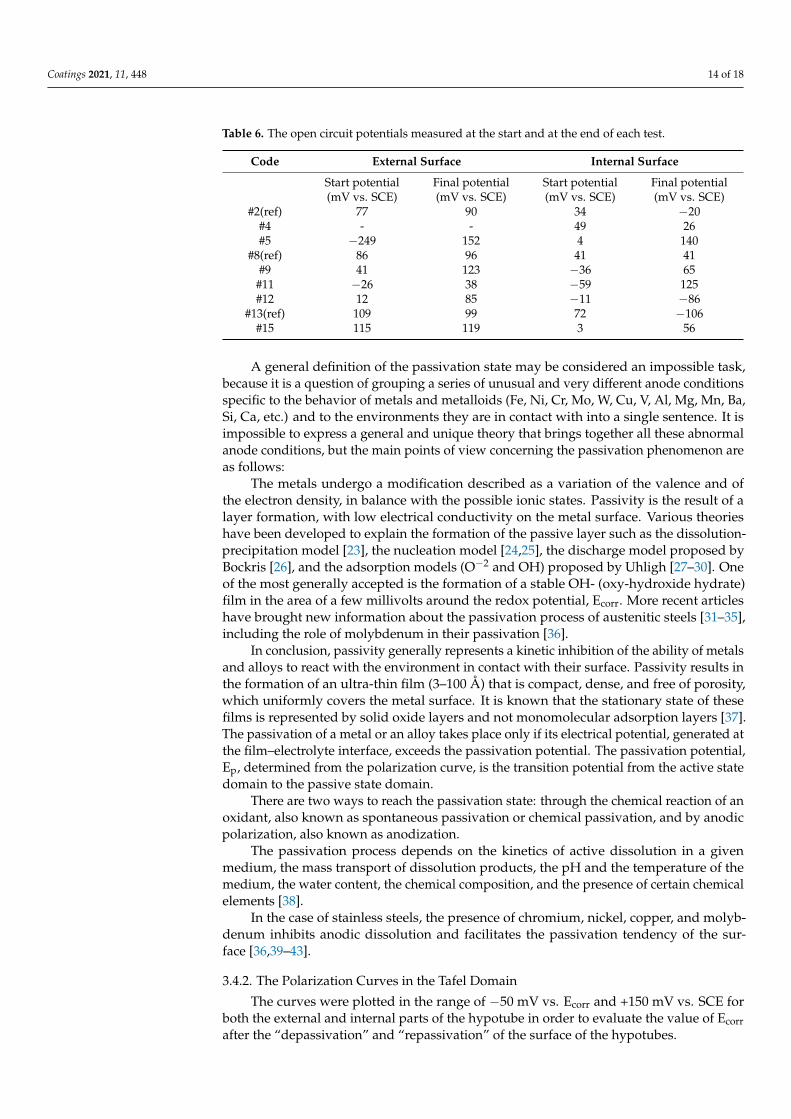
The open circuit potentials measured for the internal surface of the hypotubes arepresented in Figure 21. Hypotubes #2(ref), #5, #9, #11, #12, #13(ref), and #15 were not chem-ically passivated. There was a tendency of passivation as a function of time. Hypotubes#2(ref), #9, #11, and #13(ref) started at negative (anodic) potentials. Hypotubes #5 and#15 started at low positive potentials (Table 6) but had a tendency to passivate over timetowards a level of 150 mV vs. SCE. The only hypotubes that underwent the passivation ofthe internal surface were #4 and #8(ref). On the other hand, the electric potential was quitelow, and it was difficult to conclude if these values expressed a true chemical passivationin comparison with the external surface of hypotube #8(ref).
Figure 21. The open circuit potentials measured on the internal surfaces of the hypotubes.
Coatings 2021, 11, 448 14 of 18
Table 6. The open circuit potentials measured at the start and at the end of each test.
Code External Surface Internal Surface
Start potential Final potential Start potential Final potential(mV vs. SCE) (mV vs. SCE) (mV vs. SCE) (mV vs. SCE)
#2(ref) 77 90 34 −20#4 - - 49 26#5 −249 152 4 140
#8(ref) 86 96 41 41#9 41 123 −36 65
#11 −26 38 −59 125#12 12 85 −11 −86
#13(ref) 109 99 72 −106#15 115 119 3 56
A general definition of the passivation state may be considered an impossible task,because it is a question of grouping a series of unusual and very different anode conditionsspecific to the behavior of metals and metalloids (Fe, Ni, Cr, Mo, W, Cu, V, Al, Mg, Mn, Ba,Si, Ca, etc.) and to the environments they are in contact with into a single sentence. It isimpossible to express a general and unique theory that brings together all these abnormalanode conditions, but the main points of view concerning the passivation phenomenon areas follows:
The metals undergo a modification described as a variation of the valence and ofthe electron density, in balance with the possible ionic states. Passivity is the result of alayer formation, with low electrical conductivity on the metal surface. Various theorieshave been developed to explain the formation of the passive layer such as the dissolution-precipitation model [23], the nucleation model [24,25], the discharge model proposed byBockris [26], and the adsorption models (O−2 and OH) proposed by Uhligh [27–30]. Oneof the most generally accepted is the formation of a stable OH- (oxy-hydroxide hydrate)film in the area of a few millivolts around the redox potential, Ecorr. More recent articleshave brought new information about the passivation process of austenitic steels [31–35],including the role of molybdenum in their passivation [36].
In conclusion, passivity generally represents a kinetic inhibition of the ability of metalsand alloys to react with the environment in contact with their surface. Passivity results inthe formation of an ultra-thin film (3–100 Å) that is compact, dense, and free of porosity,which uniformly covers the metal surface. It is known that the stationary state of thesefilms is represented by solid oxide layers and not monomolecular adsorption layers [37].The passivation of a metal or an alloy takes place only if its electrical potential, generated atthe film–electrolyte interface, exceeds the passivation potential. The passivation potential,Ep, determined from the polarization curve, is the transition potential from the active statedomain to the passive state domain.
There are two ways to reach the passivation state: through the chemical reaction of anoxidant, also known as spontaneous passivation or chemical passivation, and by anodicpolarization, also known as anodization.
The passivation process depends on the kinetics of active dissolution in a givenmedium, the mass transport of dissolution products, the pH and the temperature of themedium, the water content, the chemical composition, and the presence of certain chemicalelements [38].
In the case of stainless steels, the presence of chromium, nickel, copper, and molyb-denum inhibits anodic dissolution and facilitates the passivation tendency of the sur-face [36,39–43].
3.4.2. The Polarization Curves in the Tafel Domain
The curves were plotted in the range of −50 mV vs. Ecorr and +150 mV vs. SCE forboth the external and internal parts of the hypotube in order to evaluate the value of Ecorrafter the “depassivation” and “repassivation” of the surface of the hypotubes.
Coatings 2021, 11, 448 15 of 18
In an aggressive oxidizing medium, the cathode current, which corresponds to acertain potential value, is higher, and the corrosion potential consequently moves towardshigher values. In this case, the corrosion current increases to a certain limit. In fact, if ametal is passive, an increase in the oxidizing power of the environment can reduce therate of corrosion. The metals that passivate form thin layers of oxide that strongly slowdown the dissolution rate. The anodic current, measured as a function of the potential,shows a maximum that separates the so-called active domain (metal in direct contact withthe electrolyte) from the so-called passive domain (metal covered with an oxide film). Inorder for a passive metal to show good corrosion behavior, its corrosion potential musttherefore lie in the passive domain. If a metal that has undergone chemical passivation inan oxidizing medium is immersed in an electrolyte, the value of the corrosion potentialEcorr will be Ep < Ecorr < Eb, where Eb is the breakdown potential on the polarization curveand Ep is the electrical potential in open circuit for a given time of sample immersion. Ifthe passivation is correctly done, a scan in the cathodic area will not really influence theEcorr; therefore, after returning to the anodic domain, the value of Ecorr will remain in thepassive domain and will be positive. In other words, the stability of the passivation filmwill not be disturbed by the cathodic scan.
The scanning curves plotted in the Tafel domain are presented in Figure S1 (Supple-mentary Materials). For each hypotube, the two curves plotted for the external surface (E)and the internal surface of the hypotube (I) are comparatively represented.
In Table 7, the parameters measured and calculated in the Tafel domain are presented.With the technical development of electronic measurement systems where backgroundnoise is in values of Femto and in a Faraday–Helmholtz protection circuit, current valuesof the order of nano–pico amperes can be measured. The quantities of electric chargescalculated by integrating the surfaces below curves in the anode domain are small, in theorder of a few micro coulombs. The question to be asked is what is the toxicological riskfor a patient in contact with hypotubes?
Table 7. Electrochemical parameters measured and calculated in the Tafel domain. E: external surface; I: internal surface.
Code E(i=o)mV
IcorrnA
bamV/dec
bcmV/dec
(Ei = 0 + 150 mV)µC Code E(i=o)
mVIcorrnA
bamV/dec
bcmV/dec
(Ei = 0 + 150 mV)µC
#2E 24 6.4 246 69 0.99 #2I −4 24.44 249 83 3.88#4E - - - - #4I 81 0.48 124 54 0.78#5E 29 17.5 168 60 5.56 #5I 82 0.11 162 43 8.74#8E 70 7.58 201 57 1.19 #8I 20 2.86 220 55 5.71#9E 82 0.77 200 72 4.14 #9I −12 2.85 259 50 0.91#11E −30 1.71 187 34 4.69 #11I 30 1.79 174 40 4.99#12E 26 6.81 89 52 19.72 #12I −100 3.04 86 72 5.76#13E 60 6.15 136 75 0.75 #13I −100 70.2 166 148 2.68#15E 78 0.18 99 43 0.66 #15I 70 1.15 218 20 1.73
Icorr: corrosion current calculated; ba and bc: Tafel slope; Ei=0: electrical potential for current equals zero.
It should be noted that when passing from the cathode zone to the anode zone, thepotential value for the current equals zero (I = 0); in other words, E (i = 0) or Ecorr is notalways positive. Therefore, a cathode scan of −150 mV is sufficient to destabilize the“passivation film” of certain samples.
Thus, three distinct situations have been found:
• First bullet; Surfaces with a positive open circuit potential in the Tafel domain afterscanning, where Ecorr is always positive.
• Surfaces with a positive open circuit potential (at the end of the test) and a negativeafter scanning Ecorr in the Tafel domain.
• Surfaces with a negative open circuit potential and a negative after scanning Ecorr inthe Tafel domain.
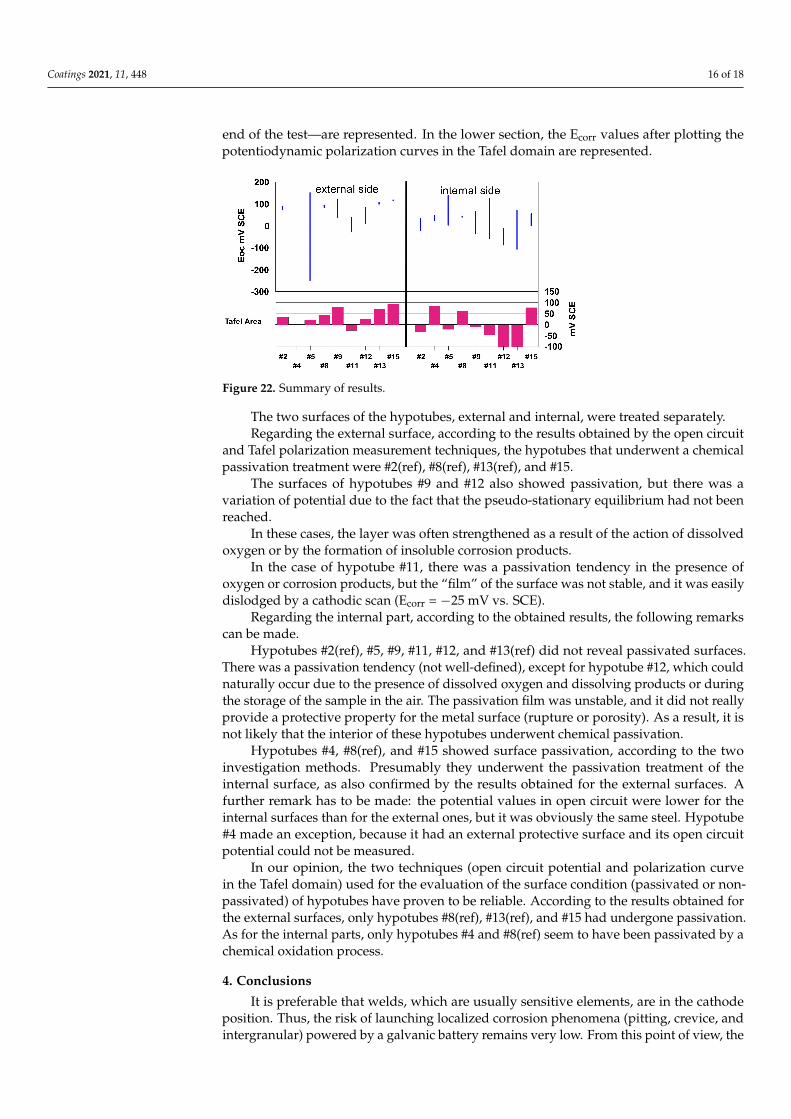
In Figure 22, a summary of the results is represented. In the upper section, theopen circuit potential values—, or more precisely, the starting value and the value at the
Coatings 2021, 11, 448 16 of 18
end of the test—are represented. In the lower section, the Ecorr values after plotting thepotentiodynamic polarization curves in the Tafel domain are represented.
Figure 22. Summary of results.
The two surfaces of the hypotubes, external and internal, were treated separately.Regarding the external surface, according to the results obtained by the open circuit
and Tafel polarization measurement techniques, the hypotubes that underwent a chemicalpassivation treatment were #2(ref), #8(ref), #13(ref), and #15.
The surfaces of hypotubes #9 and #12 also showed passivation, but there was avariation of potential due to the fact that the pseudo-stationary equilibrium had not beenreached.
In these cases, the layer was often strengthened as a result of the action of dissolvedoxygen or by the formation of insoluble corrosion products.
In the case of hypotube #11, there was a passivation tendency in the presence ofoxygen or corrosion products, but the “film” of the surface was not stable, and it was easilydislodged by a cathodic scan (Ecorr = −25 mV vs. SCE).
Regarding the internal part, according to the obtained results, the following remarkscan be made.
Hypotubes #2(ref), #5, #9, #11, #12, and #13(ref) did not reveal passivated surfaces.There was a passivation tendency (not well-defined), except for hypotube #12, which couldnaturally occur due to the presence of dissolved oxygen and dissolving products or duringthe storage of the sample in the air. The passivation film was unstable, and it did not reallyprovide a protective property for the metal surface (rupture or porosity). As a result, it isnot likely that the interior of these hypotubes underwent chemical passivation.
Hypotubes #4, #8(ref), and #15 showed surface passivation, according to the twoinvestigation methods. Presumably they underwent the passivation treatment of theinternal surface, as also confirmed by the results obtained for the external surfaces. Afurther remark has to be made: the potential values in open circuit were lower for theinternal surfaces than for the external ones, but it was obviously the same steel. Hypotube#4 made an exception, because it had an external protective surface and its open circuitpotential could not be measured.
In our opinion, the two techniques (open circuit potential and polarization curvein the Tafel domain) used for the evaluation of the surface condition (passivated or non-passivated) of hypotubes have proven to be reliable. According to the results obtained forthe external surfaces, only hypotubes #8(ref), #13(ref), and #15 had undergone passivation.As for the internal parts, only hypotubes #4 and #8(ref) seem to have been passivated by achemical oxidation process.
4. Conclusions
It is preferable that welds, which are usually sensitive elements, are in the cathodeposition. Thus, the risk of launching localized corrosion phenomena (pitting, crevice, andintergranular) powered by a galvanic battery remains very low. From this point of view, the
Coatings 2021, 11, 448 17 of 18
tested hypotubes confirmed the cathodic position of the laser weld. The Strauss test did notreveal intergranular corrosion in the welds, and no degradation of the welds after scanningin the Tafel domain was found. The welds did not reveal microcracks, incorporated gasbubbles or blisters, or specific defects in welding. There are two issues to be considered. Thefirst regards respecting the very strict manufacturing parameters, and the second regardsthe external and internal passivation of the hypotubes. One must be aware of the potentialrisks that derive from the release of metal cations like Cr, Ni, Mo, Mn, and Fe, as well astraces of other chemical elements in the coronary artery during coronary intervention.
Supplementary Materials: The following are available online at https://www.mdpi.com/2079-6412/11/4/448/s1, Figure S1: Polarization curves in the Tafel domain of the hypotubes: (a). #2(ref),(b). #4, (c). #5, (d). #8(ref), (e). #9, (f). #11, (g). #12, (h). #13(ref), (i). #15. E: external surface;I: internal surface.
Author Contributions: Conceptualization, L.R. and L.C.A.; methodology, L.R.; validation, L.R.;formal analysis, L.R.; investigation, L.R.; resources, L.R.; data curation, L.R..; writing—original draftpreparation, L.R. and L.C.A.; writing—review and editing, L.C.A.; visualization, L.C.A.; supervision,L.R.; project administration, L.R. All authors have read and agreed to the published version ofthe manuscript.
Funding: This research received no external funding.
Institutional Review Board Statement: Not applicable.
Informed Consent Statement: Not applicable.
Data Availability Statement: Not applicable.
Conflicts of Interest: The authors declare no conflict of interest.
References1. Streicher, M.A. Austenitic and Ferritic Stainless Steels. In Uhlig’s Corrosion Handbook, 3rd ed.; Winston Revie, R., Ed.; Revised by
Grubb, J.F.; Wiley: Hoboken, NJ, USA, 2011; pp. 657–694.2. Fondation Suisse de Cardiologie, Angioplastie Coronaire. Available online: https://www.swissheart.ch/fr/maladies-cardiaques-
avc/traitements/traitements/angioplastie-coronaire.html (accessed on 12 December 2020).3. Ali, R.; Greenbaum, A.B.; Kugelmass, A.D. A Review of Available Angioplasty Guiding Catheters, Wires and Balloons–Making
the Right Choice. Interv. Cardiol. Rev. 2012, 7, 100–103. [CrossRef]4. Lin, Z.; Hsiao, H.-M.; Mackiewicz, D.; Anukhin, B.; Pike, K. Anisotropic Behavior of Radiopaque NiTiPt Hypotube for Biomedical
Applications. Adv. Eng. Mater. 2009, 11, B189–B193. [CrossRef]5. Diagnostic and Interventional Cardiology, The Basics of Guide Wire Technology. Available online: https://www.dicardiology.
com/article/basics-guide-wire-technology (accessed on 12 December 2020).6. Iñigo-García, L.A.; Iñigo-Almansa, L.; Gil-Jiménez, T.; Siles-Rubio, J.R.; Ramírez-Moreno, A.; Pons, J.; Sanz Vazquez, O.; Munoz
Bellido, J.F.; Urbaneja Salas, A.; Ruiz Mateas, F. Coronary Angioplasty Guidewires: Differential Characteristics and Technology.J. Cardiol. Curr. Res. 2017, 8, 00278. [CrossRef]
7. Cunat, P.J. Soudabilité et métallurgie des soudures. In Les Aciers Inoxydables; Lacombe, P., Baroux, B., Beranger, G., Colombier, L.,Hochmann, J., Eds.; Les Editions de Physique: Les Ulis, France, 1990; pp. 798–855.
8. Siddhagiri Metals & Tubes, Welded Tubes. Available online: http://www.siddhagirimetals.com/welded-tube-supplier-astm-b516-b704-b515-b730-b626-a789-a269-b467-b468-b674-b338-a519.html (accessed on 12 December 2020).
9. VitaNeedle Stainless Steel, Welded and Drawn Tubing. Available online: https://www.vitaneedle.com/welded-and-drawn-tubing (accessed on 12 December 2020).
10. Høl, P.J.; Gjerdet, N.R.; Jonung, T. Corrosion and metal release from overlapping arterial stents under mechanical and electro-chemical stress-An experimental study. Mech. Behav. Biomed. Mater. 2019, 93, 31–35. [CrossRef] [PubMed]
11. Zhang, C.; He, L.; Chen, Y.; Dai, D.; Su, Y.; Shao, L. Corrosion Behavior and in Vitro Cytotoxicity of Ni-Ti and Stainless Steel ArchWires Exposed to Lysozyme, Ovalbumin, and Bovine Serum Albumin. ACS Omega 2020, 5, 18995–19003. [CrossRef]
12. Gotman, I. Characteristics of metals used in implants. J. Endourol. 1997, 11, 38338–38339. [CrossRef] [PubMed]13. ASTM A262-15, Standard Practices for Detecting Susceptibility to Intergranular Attack in Austenitic Stainless Steels, ASTM
International. 2015. Available online: www.astm.org (accessed on 2 May 2020).14. Streicher, M.A. Intergranular. In Corrosion Tests and Standards: Application and Interpretation, 2nd ed.; Baboian, R., Ed.; ASTM
International: West Conshohocken, PA, USA, 2004; pp. 244–266.15. Henthorne, M. Intergranular corrosion in Iron and Nickel Base Alloys. In Localized Corrosion-Cause of Metal Failure;
Henthorne, M., Ed.; ASTM Technical Publication: Philadelphia, PA, USA, 1972; pp. 66–119.
Coatings 2021, 11, 448 18 of 18
16. Reclaru, L.; Lüthy, H.; Ziegenhagen, R.; Eschler, P.-Y.; Blatter, A. Anisotropy of nickel release and corrosion in austenitic stainlesssteels. Acta Biomater. 2008, 4, 680–685. [CrossRef]
17. Reclaru, L.; Ziegenhagen, R.; Eschler, P.-Y.; Blatter, A.; Lüthy, H. Effects of Crystallographic Orientation of Stainless Steels onPitting and Crevice Corrosion and Nickel Release. In New Research on Biomaterials; Bloomington, D.R., Ed.; Nova Science PublisherInc.: New York, NY, USA, 2007; pp. 237–279.
18. Reclaru, L.; Ardelean, L.C. Corrosion Susceptibility and Allergy Potential of Austenitic Stainless Steels. Materials 2020, 13, 4187.[CrossRef]
19. ASM Handbook. Corrosion of Stainless Steel Weldments, Corrosion: Fundamentals, Testing, and Protection; ASM International: RussellTownship, OH, USA, 2003; Volume 13A, pp. 301–316.
20. Wagner, C.; Traud, W. Über die Deutung von Korrosionsvorgängen durch Überlagerung von elektrochemischen Teilvorgängenund über die Potentialbildung an Mischelektroden. Z. Electrochem. 1938, 44, 391–402. [CrossRef]
21. Haruyama, S. Electrochemical methods in passivity study. Corros. Sci. 1990, 31, 29–38. [CrossRef]22. Olefjord, I.; Elfstrom, B.-O. The Composition of the Surface during Passivation of Stainless Steels. Corrosion 1982, 38, 46–52.
[CrossRef]23. Müller, W.J. Die Bedeckungstheorie der Passivität der Metalle und ihre experimentelle Begründung. J. Phys. Chem. 1934, 38, 132.
[CrossRef]24. Fleischmann, M.; Pattison, J.; Thirsk, H.R. Electrocrystallization of thin films of thallous chloride on thallium amalgam. Trans.
Faraday Soc. 1965, 61, 1256–1269. [CrossRef]25. Lukac, C.; Lumsden, J.B.; Smialowska, S.; Staehle, R.W. Effects of Temperature on the Kinetics of Passive Film Growth on Iron.
J. Electrochem. Soc. 1975, 122, 1571–1580. [CrossRef]26. Bockris, J.O.; Genshaw, M.A.; Brusic, V.; Wroblowa, H. The mechanism of the passivation of iron in neutral solutions: An
ellipsometric and coulometric investigation. Electrochim. Acta 1971, 16, 1859–1894.27. Foroulis, Z.A.; Uhlig, H.H. Effect of Cold-Work on Corrosion of Iron and Steel in Hydrochloric Acid. J. Electrochem. Soc. 1964, 111,
522–528. [CrossRef]28. Kabanov, B.N.; Leikis, Z.I. Untersuchung der Passivität von Metallen durch Messung der Elektrodenimpedanz bei hohen
Frequenzen. Z. Elektrochem. 1958, 62, 660–663.29. Kolotyrkin, Y.M. Electrochemical behaviour and anodic passivity mechanism of certain metals in electrolyte solutions. Z. Elek-
trochem. 1958, 62, 664–669.30. Frankenthal, R.P. On the Passivity of Iron-Chromium Alloys: II. The Activation Potential. J. Electrochem. Soc. 1969, 116, 580–585.
[CrossRef]31. Lara Banda, M.; Gaona Tiburcio, C.; Zambrano-Robledo, P.; Cabral, J.A.; Estupinán, F.; Baltazar-Zamora, M.A.; Croche, R.; Vera,
E.; Almeraya-Calderón, F. Corrosion Behaviour of 304 Austenitic, 15-5PH and 17-4PH Passive Stainless Steels in Acid Solutions.Int. J. Electrochem. Sci. 2018, 13, 10314–10324. [CrossRef]
32. Hegelmann, E.; Hengst, P.; Hollmann, P.; Thronicke, P.; Buchwalder, J.A.; Schimpf, C.; Hunger, R.; Zenker, R. Improvementof Wear and Corrosion Resistance of Austenitic Stainless Steel by Combined Treatment Using Electron Beam Cladding andSubsequent Gas Nitrocarburizing. Adv. Eng. Mater. 2019, 21, 1900365. [CrossRef]
33. Gietzelt, T.; Toth, V.; Huell, A. Challenges of Diffusion Bonding of Different Classes of Stainless Steels. Adv. Eng. Mater. 2017, 23,1700367. [CrossRef]
34. Srinivasan, N.; Kain, V.; Birbilis, N.; Sunil Kumar, B.; Gandhi, M.N.; Sivaprasad, P.V.; Chai, G.; Lodh, A.; Ahmedabadi, P.M.;Samajdar, I. Plastic deformation and corrosion in austenitic stainless steel: A novel approach through microtexture and infraredspectroscopy. Corros. Sci. 2016, 111, 404–413. [CrossRef]
35. Tranchida, G.; Clesi, M.; Di Franco, F.; Di Quarto, F.; Santamaria, M. Electronic properties and corrosion resistance of passivefilms on austenitic and duplex stainless steels. Electrochim. Acta 2018, 273, 412–423. [CrossRef]
36. Jargelius-Pettersson, R.F.A.; Pound, B.G. Examination of the Role of Molybdenum in Passivation of Stainless Steels Using ACImpedance Spectroscopy. J. Electrochem. Soc. 1998, 145, 1462–1469. [CrossRef]
37. Kruger, J. Passivity. In Uhlig’s Corrosion Handbook, 3rd ed.; Winston Revie, R., Ed.; Wiley: Hoboken, NJ, USA, 2011; pp. 151–157.38. Bohni, H. Localized Corrosion of Passive Metals. In Uhlig’s Corrosion Handbook, 3rd ed.; Winston Revie, R., Ed.; Wiley: Hoboken,
NJ, USA, 2011; pp. 157–171.39. Lizlovs, E.A.; Bond, A.P. Anodic Polarization Behavior of High-Purity 13 and 18% Cr Stainless Steels Bond. J. Electrochem. Soc.
1975, 122, 719–723. [CrossRef]40. Uhlig, H.H.; Revie, R.W. Corrosion and Corrosion Control, 3rd ed.; Wiley-Interscience: New York, NY, USA, 1985.41. Crow, W.B.; Myers, J.R.; Marvin, B.D. Anodic polarization behaviour of Ni-Al alloys in sulfuric acid solutions. Corrosion 1971, 27,
459–465. [CrossRef]42. Okamoto, G. Passive film of 18-8 stainless steel structure and its function. Corros. Sci. 1973, 13, 471–489. [CrossRef]43. Tomashov, N.D.; Chernova, G.P.; Ruscol, Y.S.; Ayuyan, G.A. The passivation of alloys on titanium bases. Electrochim. Acta 1974,
19, 159–172. [CrossRef]


