Embed Size (px)
Citation preview
Evaluation of the GOES-R ABI LAP Retrieval Algorithm Using the GOES-13 Sounder
YONG-KEUN LEE, ZHENGLONG LI, AND JUN LI
Cooperative Institute for Meteorological Satellite Studies, University of Wisconsin–Madison, Madison, Wisconsin
TIMOTHY J. SCHMIT
NOAA/NESDIS/Center for Satellite Applications and Research, Camp Springs, Maryland
(Manuscript received 4 February 2013, in final form 15 September 2013)
ABSTRACT
A physical retrieval algorithm has been developed for deriving the legacy atmospheric profile (LAP)
product from infrared radiances of the Advanced Baseline Imager (ABI) on board the next-generation Geo-
stationary Operational Environmental Satellite (GOES-R) series. In this study, the GOES-R ABI LAP re-
trieval algorithm is applied to the GOES-13 sounder radiance measurements (termed the GOES-13 LAP
retrieval algorithm in this study) for its validation as well as for potential transition of the GOES-13 LAP
retrieval algorithm for the operational processing of GOES sounder data. The GOES-13 LAP retrievals
are compared with five different truth measurements: radiosonde observation (raob) and microwave
radiometer–measured total precipitable water (TPW) at the Atmospheric Radiation Measurement Cloud
and Radiation Testbed site, conventional raob, TPW measurements from the global positioning system–
integrated precipitable water NOAA network, and TPW measurements from the Advanced Microwave
Scanning Radiometer for Earth Observing System (AMSR-E). The results show that with the GOES-R
ABI LAP retrieval algorithm, theGOES-13 sounder provides better water vapor profiles than the National
Centers for Environmental Prediction (NCEP) Global Forecast System (GFS) forecast fields at the levels
between 300 and 700 hPa. The root-mean-square error (RMSE) and standard deviation (STD) of the
GOES-13 sounder TPW are consistently reduced from those of the GFS forecast no matter which mea-
surements are used as the truth. These substantial improvements indicate that the GOES-R ABI LAP
retrieval algorithm is well prepared to provide continuity of quality to some of the current GOES sounder
products, and the algorithm can be transferred to process the current GOES sounder measurements for
operational product generation.
1. Introduction
The Geostationary Operational Environmental Sat-
ellite (GOES) sounders have been observing the con-
tinental United States (CONUS) and adjacent ocean
area since 1994 at 18 infrared (IR) channels approxi-
mately between 3.7 and 14.7mm, providing quality hourly
radiances and derived products (Menzel and Purdom
1994; Menzel et al. 1998; Daniels et al. 2001; Hillger
et al. 2003, 2010). The operationally derived products
from the GOES sounders include clear-sky radiances,
temperature/moisture profiles, total precipitable water
(TPW), stability indices, cloud-top pressure, and water
vapor tracked winds (Velden et al. 1997; Schmit et al.
2002; Jin et al. 2008; Li et al. 2008, 2009). The GOES
sounder products have been shown useful for now-
casting and forecasting of weather events (Menzel et al.
1998; Schrab 1998; Li et al. 2008, 2009) and monitoring
temperature and moisture changes in the preconvective
atmospheric environment (Schmit et al. 2002).
The first of the next-generation GOES series (the
GOES-R) is scheduled for launch in 2015 and the Ad-
vanced Baseline Imager (ABI) will be the primary in-
strument on GOES-R for observing Earth’s weather
and climate (Schmit et al. 2005). As an imager, the
capability of ABI will be significantly improved over
that of the current GOES imagers considering that the
GOES-R ABI will have finer spatial resolution (2 km
for infrared channels) and a faster scan rate (15min for
full disk, plus 5min for CONUS, and 30 s for meso-
scale regions) compared to the current GOES imagers.
However, the GOES-R satellite will not carry the
Corresponding author address: Yong-Keun Lee, CIMSS, Uni-
versity of Wisconsin, 1225 West Dayton St., Madison, WI 53706.
E-mail: [email protected]
VOLUME 31 JOURNAL OF ATMOSPHER I C AND OCEAN IC TECHNOLOGY JANUARY 2014
DOI: 10.1175/JTECH-D-13-00028.1
� 2014 American Meteorological Society 3
Hyperspectral Environmental Suite (HES) dedicated to
acquire high spatial and temporal resolution tempera-
ture and moisture profiles that are the key to weather
forecasting (Schmit et al. 2005). Instead, Schmit et al.
(2008) showed that ABI, along with a numerical model
initial profile, has a similar capability to provide legacy
atmospheric temperature and moisture profiles, which
could be adequate substitutes for current GOES sounder
legacy products. Jin et al. (2008) developed the GOES-R
ABI legacy atmospheric profiles (LAP) retrieval al-
gorithm. They tested the algorithm using the European
Organisation for the Exploitation of Meteorological
Satellites (EUMETSAT)’s Spinning Enhanced Visible
and Infrared Imager (SEVIRI) measurements as proxy
and concluded that theGOES-RABI LAPwill provide
useful legacy products with a quality similar to that of
the current GOES sounder product. Xie et al. (2013)
evaluated the GOES-R ABI LAP products with the
SEVIRI data as a proxy by comparing with in situ mea-
surements obtained over the open ocean from multiple
years of the National Oceanic and Atmospheric Ad-
ministration (NOAA) Aerosols and Ocean Science Ex-
peditions (AEROSE). They found that the GOES-R
ABI LAP retrievals agree reasonably well with the
AEROSE radiosonde observations and provide im-
proved profiles of temperature and water vapor com-
pared to the National Centers for Environmental
Prediction (NCEP) Global Forecast System (GFS) fore-
cast output.
Unlike the earlier validation efforts that used SEVIRI
proxy data (e.g., Jin et al. 2008; Xie et al. 2013), we use
GOES-13 sounder data to validate the algorithm over
the relevant coverage area. This change is needed to vali-
date the algorithm performance for mesoscale weather
forecasting over CONUS, which is one of the primary
applications of the ABI. The sounding retrieval over
the Atlantic Ocean region by Xie et al. (2013) is rela-
tively easy because of its homogeneous ocean surface.
The CONUS region is generally a more challenging
environment because of the complexity of the land
surface.
Since the ABI-like atmospheric moisture retrievals
(Jin et al. 2008; Schmit et al. 2008; Xie et al. 2013) have
proven to be more useful than the temperature re-
trievals, this study will focus on validation of the mois-
ture and moisture-related products, including moisture
profiles, TPW, and the lifted index.
A brief description of the GOES-13 LAP retrieval
algorithm and an introduction of the truth data are
given in section 2. Section 3 describes the validation
results of the GOES-13 LAP products compared with
the truth data. The summary and discussion are given in
section 4.
2. The GOES-13 LAP retrieval algorithmand the truth data
a. The GOES-13 LAP retrieval algorithm
In this study, theGOES-13 LAP retrieval algorithm is
defined as the GOES-R ABI LAP retrieval algorithm
applied to theGOES-13 sounder measurements, and the
retrieval products are called theGOES-13LAPproducts.
The physical retrieval algorithm for GOES-13 LAP
uses regression-derived temperature/water vapor pro-
files as the first guess (Jin et al. 2008, 2009). A synthetic
regression technique is used to generate the regression
coefficients. The radiosonde observation (raob) atmo-
spheric profiles (6280 profiles) are employed from the
SeeBor database (Seemann et al. 2003, 2008) within the
current GOES satellite coverage: latitudes between
80.46638N and 80.46638S and longitudes between
155.86188W and 5.86188E. This dataset includes surfaceskin temperature and surface IR emissivities (Seemann
et al. 2003, 2008). The GOES-13 sounder brightness
temperatures (BTs) are simulated with the Community
Radiative Transfer Model (CRTM version 2.0.2) de-
veloped by NOAA’s Joint Center for Satellite Data
Assimilation (Weng et al. 2005; Chen et al. 2010, 2012).
The radiosonde temperature/water vapor profiles are pre-
dictands, and the simulated GOES-13 sounder 15-channel
BTs combined with forecast temperature/water vapor
profiles, surface pressure, land/ocean flag, latitude, and
month are used as predictors to generate the regression
coefficients. The forecast profiles are generated using
the raob profiles with the addition of suitable noise.
Local zenith angle (between 08 and 808) classification is
used to reduce the impacts from the viewing angle.
The regression coefficients are applied to the 15
GOES-13 sounder channels (Table 1) and the GFS
forecast fields (temperature/water vapor profiles) to
provide the first guess, similar to Li et al. (2008). This
regression-based sounding retrieval serves as the first
guess for the physical iterations. The 15 GOES-13
sounder channels, from channels 1 (14.7mm) to 15
(4.45mm), are used in both the regression process and
the physical iterative algorithm (Table 1). It should be
noted that the GOES-13 sounder has several more CO2
sensitive channels than the ABI.
The NCEP GFS 3-, 6-, and 9-h forecast fields are
available every 6 h (0000, 0600, 1200, and 1800 UTC)
over the entire globe at a horizontal resolution of 0.58and 26 vertical levels. They are spatially interpolated
to GOES-13 sounder grids and to 101 vertical levels
and temporally interpolated to every nominal hour of
GOES-13 sounder measurements. When there are mul-
tiple GFS forecasts available for a specific nominal hour,
the most recent one will be taken.
4 JOURNAL OF ATMOSPHER IC AND OCEAN IC TECHNOLOGY VOLUME 31
The GOES-13 LAP physical iterative algorithm de-
rives temperature and water vapor profiles from satellite
observed radiances using a one-dimensional variational
(1DVAR) iterative technique (Rodgers 1976; Ma et al.
1999; Li et al. 2008). During iterations, the atmospheric
profile in the form of a vector X is adjusted from the
first guess Xb to minimize a cost function J(X) (Rodgers
1976). The cost function is defined as follows:
J(X)5 [Ym 2F(X)]TE21[Ym 2F(X)]
1 [X2Xb]TgB21[X2Xb] , (1)
where B is the error covariance matrix of the first guess
Xb, E is the error covariance matrix of the observation
vector, Ym is the measurement, F(X) is the forward ra-
diative transfer operator, and g is the regularization
parameter (or smoothing factor) used for solution con-
vergence and stability (Li et al. 2000). Superscripts T and
21 are the matrix transpose and matrix inverse, re-
spectively. The background error covariance matrix B is
calculated based on the differences between the radio-
sonde dataset and the spatially and temporally collo-
cated GFS forecast products. The matrix E includes the
errors of the observed BTs (BT error in the instrument)
and the uncertainty of the radiative transfer model.
Because of the difficulty in quantifying the correlative
errors, only the diagonal element is retained. The cost
function poses two conditions on the retrieval: 1) the
retrieval is constrained to the first guess, and 2) the
calculated BT based on the retrieval is constrained to
the observed BT.
With Eq. (1) and the Newtonian method,
Xn115Xn 2 [=2J(Xn)]21=2J(Xn) , (2)
the following iterative form is derived:
dXn11 5 (F 0Tn � E21 � F 0
n
1gB21)21 � F 0Tn � E21 � (dYn1F 0
n � dXn) , (3)
where dXn 5Xn 2Xb, dYn 5Ym 2F(Xn), n is the iter-
ation step, andF 0 is the tangent linear operative (Jacobian)of forward model F. During the physical retrieval itera-
tion, the first guess is modified in a controlled manner to
fit the calculated BTs to the GOES-13 observed BTs.
More details of the procedure in the GOES-R ABI LAP
retrieval algorithm employed in this study can be found
in Li et al. (2010) and Jin et al. (2008).
The main difference in the retrieval algorithms be-
tween this study and Li et al. (2008) is the radiative
transfer model. This study employs the CRTM while Li
et al. (2008) used the Pressure-Layer Fast Algorithm for
Atmospheric Transmittance (PFAAST). As shown in
the cost function given in Eq. (1), a radiative transfer
model plays a critical role during the physical retrieval
iterations. Jin et al. (2011) showed that the CRTM is
better with temperature/moisture retrievals than PFAAST,
and the CRTM is superior in brightness temperature
simulations especially at 7.3mm (a moisture channel)
than PFAAST. Thus, the use of the CRTM to improve
our retrievals in this study may result in some differ-
ences relative to the Li et al. (2008) study, as shown
below in section 3c.
b. The truth data
1) THE MEASUREMENTS FROM THE
ARM CART SITE
The Atmospheric Radiation Measurement (ARM)
Cloud and Radiation Testbed (CART) at the Southern
Great Plains (SGP) site is the largest and most exten-
sive climate research facility in the world located at
36.618N, 97.478W (Stokes and Schwartz 1994). The
ARM CART is the first field measurement site estab-
lished by U.S. Department of Energy (DOE)’s ARM
program. The SGP site was selected as the first ARM
field measurement site because of its high variability of
weather conditions, large seasonal variability of temper-
ature, moisture and precipitation, spatially homogeneous
terrain, and easy accessibility. Since 1992, instrumenta-
tion and data processing capabilities have been incre-
mentally added at the ARM CART site. Recently, the
ARM CART site has been selected as a site in the
Global Climate Observing System (GCOS) Reference
Upper-Air Network (GRUAN) to provide long-term,
highly accurate measurements of the atmospheric pro-
files. The 6-hourly raob and 30-s TPW estimates inferred
from the microwave radiometer (MWR) at the ARM
TABLE 1. GOES-13 sounder bands used for the GOES-13 LAP
algorithm.
Band
number
Wavelength
(mm) Purpose
Corresponding
ABI band number
1 14.70 Temperature sounding
2 14.40 Temperature sounding
3 14.10 Temperature sounding
4 13.90 Temperature sounding
5 13.40 Temperature sounding 16
6 12.70 Temperature sounding
7 12.00 Surface temperature 15
8 11.00 Surface temperature 14
9 9.70 Total ozone 12
10 7.40 Water vapor 10
11 7.00 Water vapor 9
12 6.50 Water vapor 8
13 4.57 Temperature sounding
14 4.52 Temperature sounding
15 4.45 Temperature sounding
JANUARY 2014 LEE ET AL . 5
CART site are used as ground truth in this study because
they are considered stable and accurate (Liljegren 1995;
Immler et al. 2010). These data are obtained from the
ARMDataArchive for the period from11February 2011
to 30 August 2012 (Table 2) to match the GOES-13
sounder data. Note that the GOES-13 sounder radiance
observations have been available since 11 February 2011.
Raob temperature/water vapor profiles have been widely
used to evaluate remotely sensed profiles (Fuelberg and
Olson 1991; Rao and Fuelberg 1998; Jin et al. 2008).
MWRTPWhas been used as the truth data (Schmit et al.
2002, 2008; Li et al. 2008; Hanesiak et al. 2010). The
temporal and spatial collocation of the GOES-13 LAP
products and the GFS forecast products with the ARM
CART site measurements and other truth measurements
is described in section 2c. The number of samples selected
is the number of the GOES-13 sounder fields of view
(FOVs) temporally and spatially collocatedwith the truth
data. The sample sizes are 6338 and 1079 for MWRTPW
and raob, respectively (Table 3). The location of the
ARM CART site is shown in Fig. 1.
2) CONVENTIONAL RAOB
Of all the conventional raob sites, 59 sites overlapwith
theGOES-13 sounder over the eastern CONUS (Fig. 1).
The conventional raob temperature/water vapor profiles
and TPW integrated from the conventional raob water
vapor profile are used for the GOES-13 LAP product
validation for the period between 11 February 2011 and
30 August 2012. The sample size is 25 529 (Table 3).
3) THE GPS TPW MEASUREMENTS
The NOAA ground-based global positioning system–
integrated precipitable water (GPS–IPW) network
(Birkenheuer and Gutman 2005) TPW measurement
is employed as another independent source of TPW
measurement. The GPS TPW measurement is avail-
able every 30min and it is collected for the period from
11 February 2011 to 30 August 2012 from 251 NOAA
ground-based GPS–IPW network sites over the eastern
CONUS (blue circles in Fig. 1). The sample size is
1 010 609 (Table 3).
4) THE AMSR-E TPW MEASUREMENTS
The ARM CART site measurements, the conven-
tional raobs, and the GPS TPWmeasurements provide
reliable resources for validating the GOES-13 LAP
product over land. Such data are not usually available
over the ocean. However, microwave radiometer data
taken from polar orbiting satellites provide a reliable
resource over the ocean (Fetzer et al. 2006; Jin et al.
2008). The Advanced Microwave Scanning Radiome-
ter for the Earth Observing System (AMSR-E) instru-
ment provided TPWmeasurements over the ocean at a
24-km horizontal resolution. The selected measurement
coverage of AMSR-E is shown in Fig. 1. The sample size
is 3 847 196 (Table 3). Since AMSR-E ended its opera-
tion at 0726 UTC 4 October 2011, the AMSR-E TPW
data are collected for the period between 11 February
2011 and 4 October 2011.
TABLE 2. Measurement characteristics for TPW truth data obtained for the period between 11 Feb 2011 and 30 Aug 2012. AMSR-E data
availability is limited to the period between 11 Feb 2011 and 4 Oct 2011 due to operations issues.
Observation frequency Spatial resolution or coverage GOES-13 collocation criteria
MWR 30 s 36.618N, 97.478W 630min 0.28 in radius
GPS sites 30min 251 sites over eastern CONUS 630min 0.28 in radius
ARM CART site (raob) 6 h 36.618N, 97.478W 630min 0.28 in radius
Conventional raob sites 12 h* 59 sites over eastern CONUS 630min 0.28 in radius
AMSR-E 2–3 times per day 24 km over eastern CONUS ocean 630min 10 km in radius
* Nominal conventional raob launches occur routinely at 0000 and 1200 UTC with occasional launches at 0600 and 1800 UTC.
TABLE 3. Statistical comparison between TPW derived from theGOES-13 LAP algorithm and GFS forecast using five truth datasets for
the period between 11 Feb 2011 and 30 Aug 2012. The AMSR-E comparison period ended on 4 Oct 2011.
GOES-13 LAP GFS forecast
Truth mean
(mm)
No. of selected
samples
BIAS
(mm)
STD
(mm)
RMSE
(mm)
Corr
coef
BIAS
(mm)
STD
(mm)
RMSE
(mm)
Corr
coef
MWR 0.84 2.03 2.19 0.9869 0.88 2.42 2.57 0.9803 19.98 6338
ARM raob 1.52 2.50 2.93 0.9820 1.56 2.73 3.15 0.9762 20.01 1079
Conventional raob 0.28 3.10 3.12 0.9713 0.29 3.28 3.29 0.9680 19.59 25 529
GPS 0.38 2.25 2.29 0.9847 0.20 2.44 2.45 0.9814 19.52 1 010 609
AMSR-E 20.83 2.21 2.36 0.9819 21.52 2.45 2.89 0.9773 30.27 3 847 196
6 JOURNAL OF ATMOSPHER IC AND OCEAN IC TECHNOLOGY VOLUME 31
c. Collocation
To compare the GOES-13 LAP products and the
GFS forecast products with the truth measurements,
the closest GOES-13 sounder FOV to the location of
each truth measurement is searched within a 0.28 radius(except AMSR-E) and within a 30-min measurement
time difference (Table 2). The closestGOES-13 sounder
FOV to an AMSR-E FOV is searched within a 10-km
radius. MWR-measured TPWs found within 630min
are averaged and used as the truth in this study. Only
clear-sky GOES-13 sounder FOVs are considered and
the clear sky is determined by the GOES-13 sounder
cloud mask based on Schreiner et al. (2001).
3. Validation results
a. Temperature/water vapor profile
There are two truth datasets included in this study for
temperature/water vapor profile comparison: the raobs
at the ARMCART site and the conventional raob sites.
ARM raobs have an overall better quality than con-
ventional raobs (Turner et al. 2003) and more frequent
measurements (4 times a day at the ARM CART site
and usually 2 times a day at the conventional raob sites).
The conventional raob sites offer a greater geographical
distribution.
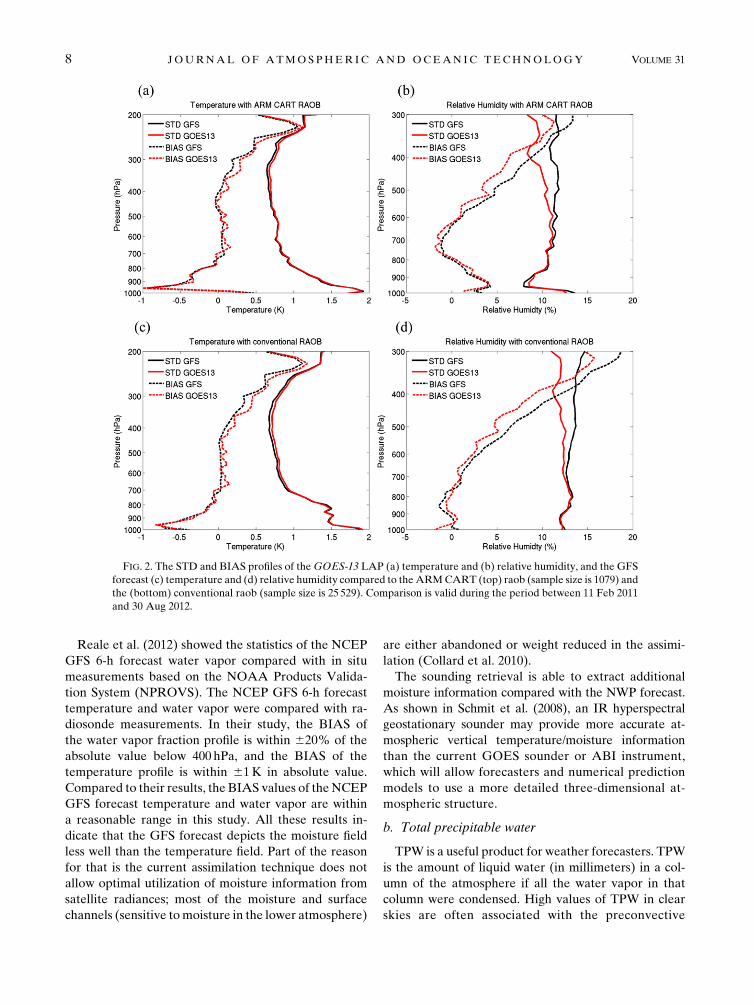
Figure 2 shows the standard deviation (STD) and
mean bias (BIAS) of the GOES-13 LAP and the GFS
forecast profiles compared with ARM raobs (Figs. 2a,b)
and conventional raobs (Figs. 2c,d). Both the tempera-
ture STD and BIAS reveal very small differences (mostly
less than 0.1K) between the retrieval and the GFS fore-
cast against either ARM raobs or conventional raobs
(Figs. 2a,c). The GFS forecast temperature shows excel-
lent quality regarding both STD and BIAS. The BIAS
value of the GFS forecast temperature is less than 1K in
magnitude (between 300 and 700hPa) at both the ARM
CART site and the conventional raob sites. These re-
sults demonstrate that the GOES-13 LAP retrieval
algorithm has difficulty improving the temperature pro-
files over the GFS forecast despite six CO2 absorption
channels in the troposphere. This is true for all traditional
low spectral resolution IR sounders [including the GOES
sounder and the High Resolution Infrared Radiation
Sounder (HIRS) or imagers with limited sounding ca-
pability (including SEVIRI and ABI)]. The main rea-
son for this is the significant progress in assimilating
satellite CO2 channel radiances in the past decades. As
a result, the NWP forecast depicts the temperature
field quite well, leaving little room for those instruments
to provide additional temperature information.
Figures 2b and 2d show the STD and BIAS of the
relative humidity profile at the ARM CART site and
the conventional raob sites, respectively. Unlike the
temperature profile in Figs. 2a and 2c, the retrieval sig-
nificantly reduces both the relative humidity STD and
BIAS from the GFS forecast for the vertical levels be-
tween 300 and 700 hPa. The GOES-13 LAP relative
humidity STD is well below 15% between 300 hPa and
the surface compared with the ARM raob and with the
conventional raob. The GOES-13 LAP relative hu-
midity BIAS is well below 18% when compared with
both the ARM raob and the conventional raob as the
truth. Such moisture information comes from the three
GOES-13 sounder water vapor channels (7.4, 7.0, and
6.5mm; Table 1). The ABI has three similar water vapor
channels (7.34, 6.95, and 6.19mm), but with a much
smaller spatial resolution (nadir: 2 km of ABI versus
10 km of GOES-13 sounder). Therefore, it is expected
that when the GOES-R ABI LAP is averaged to nom-
inal 10-km spatial resolution, it will provide similar or
even better improvement in moisture information over
the GFS forecast. Since the GOES-R ABI LAP relative
humidity profile requirement (Li et al. 2010) is 18% in
both accuracy and precision for the levels below
300 hPa, the results shown in Figs. 2b and 2d indicate
that the GOES-R ABI LAP humidity profile will meet
the requirement. In Jin et al. (2008), the SEVIRI data
are used as a proxy of the ABI data. Even though
SEVIRI has only two water vapor channels (6.2 and
7.35mm), the moisture information has been signifi-
cantly improved from the background input [European
Centre for Medium-RangeWeather Forecasts (ECMWF)
forecast fields].
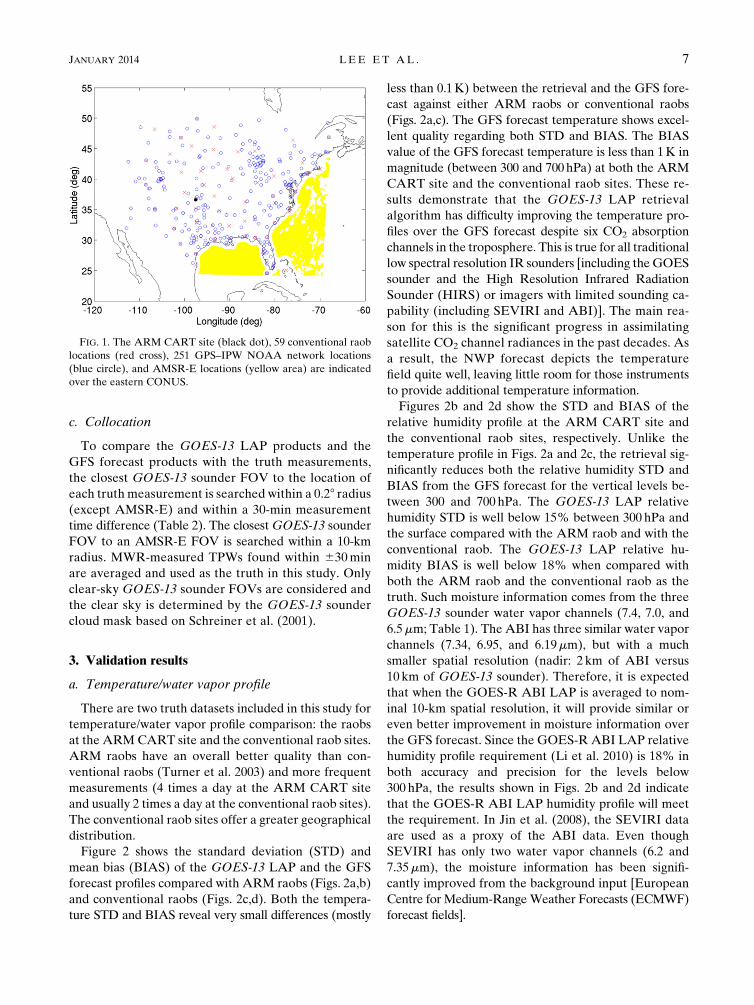
FIG. 1. The ARM CART site (black dot), 59 conventional raob
locations (red cross), 251 GPS–IPW NOAA network locations
(blue circle), and AMSR-E locations (yellow area) are indicated
over the eastern CONUS.
JANUARY 2014 LEE ET AL . 7
Reale et al. (2012) showed the statistics of the NCEP
GFS 6-h forecast water vapor compared with in situ
measurements based on the NOAA Products Valida-
tion System (NPROVS). The NCEP GFS 6-h forecast
temperature and water vapor were compared with ra-
diosonde measurements. In their study, the BIAS of
the water vapor fraction profile is within 620% of the
absolute value below 400 hPa, and the BIAS of the
temperature profile is within 61K in absolute value.
Compared to their results, the BIAS values of the NCEP
GFS forecast temperature and water vapor are within
a reasonable range in this study. All these results in-
dicate that the GFS forecast depicts the moisture field
less well than the temperature field. Part of the reason
for that is the current assimilation technique does not
allow optimal utilization of moisture information from
satellite radiances; most of the moisture and surface
channels (sensitive tomoisture in the lower atmosphere)
are either abandoned or weight reduced in the assimi-
lation (Collard et al. 2010).
The sounding retrieval is able to extract additional
moisture information compared with the NWP forecast.
As shown in Schmit et al. (2008), an IR hyperspectral
geostationary sounder may provide more accurate at-
mospheric vertical temperature/moisture information
than the current GOES sounder or ABI instrument,
which will allow forecasters and numerical prediction
models to use a more detailed three-dimensional at-
mospheric structure.
b. Total precipitable water
TPW is a useful product for weather forecasters. TPW
is the amount of liquid water (in millimeters) in a col-
umn of the atmosphere if all the water vapor in that
column were condensed. High values of TPW in clear
skies are often associated with the preconvective
FIG. 2. The STD and BIAS profiles of theGOES-13 LAP (a) temperature and (b) relative humidity, and the GFS
forecast (c) temperature and (d) relative humidity compared to theARMCART (top) raob (sample size is 1079) and
the (bottom) conventional raob (sample size is 25 529). Comparison is valid during the period between 11 Feb 2011
and 30 Aug 2012.
8 JOURNAL OF ATMOSPHER IC AND OCEAN IC TECHNOLOGY VOLUME 31
environment prior to severe storms, which are capable
of producing hail, tornadoes, heavy precipitation, and
flash floods. It is one of the critical variables used by
forecasters in the weather forecasting discussions at
the National Weather Service’s Weather Prediction
Center when there are expectations of flash flooding
or severe weather. Many satellite-derived TPW products
are available in real time worldwide. For example, the
National Environment Satellite, Data, and Information
Service (NESDIS) provides a real-time blended TPW
product as one of the precipitation products, and the
Cooperative Institute forMeteorological Satellite Studies
(CIMSS) Convective Development Nearcasting Model
(CCDNM) provides precipitable water products. The
EUMETSAT Network of Satellite Application Facilities
(NWC SAF; support to nowcasting and very short-range
forecasting) also provides precipitable water products in
real time.
Chen et al. (2008) showed that the assimilation of Mod-
erate Resolution Imaging Spectroradiometer (MODIS)
TPW data into the Weather Research and Forecasting
(WRF) model slightly improved simulated rainfall over
the region of interest in southern Oklahoma for a se-
vere thunderstorm case in June 2004, and the hurricane
track or intensity was improved by the use of MODIS
TPW data for Hurricane Isadore over the ocean in
September 2002. Liu et al. (2011) revealed the positive
impacts of MODIS- and the Atmospheric Infrared
Sounder (AIRS)-retrieved TPW on WRF simulations
of Hurricane Emily (July 2005). They showed that the
assimilation of MODIS TPW into the WRF model im-
proved the hurricane track, intensity, and 10-mwind field.
There are five independent TPW measurements used
as truth in this study: the MWR-measured TPW at the
ARM CART site (MWR TPW), the raob TPW in-
tegrated from the raob water vapor profile at the ARM
CART site (ARM raob TPW), the raob TPW integrated
from the conventional raob water vapor profiles (con-
ventional raob TPW), the GPS-measured TPW (GPS
TPW) over the CONUS land area, and the AMSR-E-
measured TPW (AMSR-E TPW) over the eastern
CONUS ocean. See Fig. 1 for the locations of these
measurements. TPWs integrated from the GOES-13
LAP and the GFS forecast water vapor profiles are
compared to these five truth datasets.
Table 3 shows the statistics (including RMSE, STD,
BIAS, and correlation coefficient) of the TPWs from
the GOES-13 LAP retrieval and the GFS forecast
compared to the five truths for the period 11 February
2011 through 30 August 2012 (AMSR-E data are col-
lected for the period 11 February 2011 through 4October
2011). The RMSE and STD values of theGOES-13 LAP
TPW are below 2.4mm, except for raob TPWs at the
ARM CART site and the conventional raob sites, and
most of the BIAS values are below 0.86mm in magni-
tude, except when using ARM raob TPW as the truth.
The GOES-R ABI LAP TPW requirements are 1mm
in accuracy and 3mm in precision (Li et al. 2010).
Again, considering that the ABI instrument has three
water vapor channels similar to those on the GOES-13
sounder but with much finer spatial and temporal reso-
lutions, the statistical values in Table 3 suggest the
GOES-R ABI LAP TPW will meet the requirements.
The agreement levels are different between the re-
trieval and the truth measurements in Table 3 due to
several possible reasons: 1) the truth TPW measure-
ments have different qualities (i.e., accuracy and pre-
cision) (Pacione et al. 2002; Mattioli et al. 2005);
2) measurement time lengths are different—the raob is
taken over a period of time while others are all instant
(snapshot) measurements; and 3) measurement spatial
resolutions are different—MWR and raob are point
measurements, while the retrieval, GPS, and AMSR-E
are over a relatively large area.
After the physical retrieval, all RMSE and STD re-
sults are reduced and correlation coefficients are in-
creased from the GFS forecast, no matter which
measurement is used as the truth. The minimum re-
duction of RMSE is 0.16mm (2.45–2.29mm) with the
GPS TPW as the truth, and the maximum reduction
is 0.53mm (2.89–2.36mm) with the AMSR-E TPW as
the truth. The minimum reduction of STD is 0.19mm
(2.44–2.25mm) with the GPS TPW as the truth, and
the maximum reduction is 0.39mm (2.42–2.03mm)
with the MWR TPW as the truth. These results indicate
the GOES-RABI LAP algorithm is effective to improve
the GFS forecast TPW using the GOES-13 sounder
measurements.
TPWs from several independent instruments, such as
MWR, GPS, raob, and AMSR-E, have been compared
in previous studies (Pacione et al. 2002; Mattioli et al.
2005; Kazumori et al. 2012). These comparisons show
that TPWs from the independent measurements agree
to within 1mm in accuracy and some instruments are
drier (or wetter) than others. Mattioli et al. (2005) com-
pared TPWs from MWR, GPS, and raob at the ARM
CART site and showed that the instruments agreed to
within 1mm in TPW STD and the TPW becomes drier
(in order from least to most dry: MWR, raob, and
GPS). Since a GPS permanent station is operating at
the ARM CART site, the GOES-13 LAP TPW statis-
tics compared against TPWs of MWR, raob, and GPS
at the ARM CART site should provide results similar
to Mattioli et al. (2005). TheGOES-13 LAP TPW BIAS
against GPS TPW at the ARM CART site is 1.88mm
(for the same time periods, not shown), indicating that
JANUARY 2014 LEE ET AL . 9
the GPS TPW is drier than the MWR TPW (GOES-13
LAP TPW BIAS of 0.84mm). The ARM raob TPW is
in the middle (GOES-13 LAP TPWBIAS of 1.52mm).
These results agree with Mattioli et al. (2005). Kazumori
et al. (2012) revealed that the AMSR-E TPW is wetter
than the TPWs measured by radiosonde and GPS, which
is consistent with the negative bias of theGOES-13 LAP
TPW against the AMSR-E TPW in Table 3.
While the GFS forecast TPW is found to be of good
quality relative to the truth datasets (i.e., low RMSE,
STD, and BIAS errors and high correlation coeffici-
ents), theGOES-13LAPTPW retrievals are found to be
superior in most aspects, indicating that the GOES-13
sounder does indeed provide additional moisture in-
formation that can improve weather forecasts using cur-
rent nowcasting and assimilation techniques (e.g., Chen
et al. 2008; Liu et al. 2011).
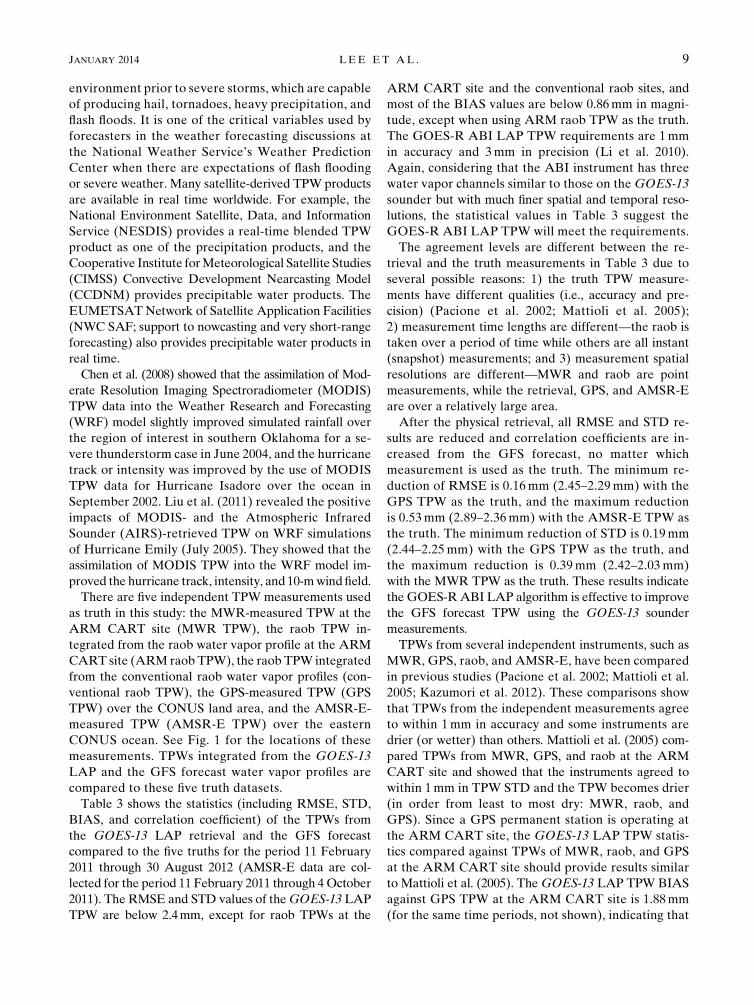
1) MONTHLY VARIATION
A reliable algorithm should perform consistently in
different months. Figure 3 shows monthly RMSE, STD,
BIAS, and the sample size of the GOES-13 LAP TPW
and the GFS forecast TPW compared to the five truths.
The STD values are large during the summer months
(June, July, and August) and small during the winter
months (December, January, and February). These re-
sults are consistent with those found by Pacione et al.
(2002) when comparing independent TPW measure-
ments (MWR, GPS, and raob).
Figure 3 depicts that the RMSE and STD found for
the GOES-13 LAP retrievals relative to all five truth
datasets are consistently lower than those found for the
GFS forecast in most months. This suggests that addi-
tional moisture information is being extracted from the
GOES-13 sounder relative to that found in the GFS
forecasts.
Unlike RMSE and STD, which are consistently im-
proved by theGOES-13LAP algorithm, the TPWBIAS
shows mixed results. The monthly variation in the TPW
BIAS depends on which truth measurement is selected.
If MWR TPW is used as truth, the GOES-13 LAP al-
gorithm improves the BIAS in 10 out of 12 months.
When the BIAS is increased, the RMSE could be in-
creased. There are three occasions in Fig. 3 when the
RMSE is increased after the retrieval: July with the
ARM raob TPW as the truth, as well as February and
October with the AMSR-E TPW as the truth. The in-
creased TPW BIAS is the reason for these three ex-
ceptions (note that the STD in theGOES-13LAPTPW
is all reduced from the GFS forecast TPW).
Dai et al. (2002) showed that the GPS-measured TPW
has a diurnal variation with peak mean TPW values ap-
pearing during the daytime in the summer over CONUS.
FIG. 3. Monthly variation of TPW RMSE, STD, BIAS, and
number of samples for the GOES-13 LAP retrieval and the GFS
forecast. The truth data are (a) the ARM CART site MWR-
measured TPW, (b) GPS-measured TPW, (c) the ARM CART
site raob TPW, (d) 59 conventional raob TPW, and (e) AMSR-E-
measured TPW. During the period between 11 Feb 2011 and 30
Aug 2012, (a)–(d) are valid, and (e) is valid during the period
between 11 Feb 2011 and 4 Oct 2011.
10 JOURNAL OF ATMOSPHER IC AND OCEAN IC TECHNOLOGY VOLUME 31
The retrieval in this study may not be able to capture the
diurnal variation in TPW during the summer months
[shown in section 3b(2)]. Dai et al. (1999, 2002) and
Wang et al. (2002) suggested likely reasons for the di-
urnal variation of TPW: 1) surface evapotranspiration,
2) mesoscale low-level horizontal convergence of mois-
ture, 3) large-scale advection, 4) large-scale atmospheric
vertical motion, and 5) localized moist convection. Con-
sidering that theGOES-13 LAP TPW has a larger BIAS
than the NCEP GFS forecast during the daytime in the
summer months over land (Fig. 6), further investigations
of these factors are needed to discover why the retrieval
quality during that time is affected.
As given in section 2a, two conditions are placed on
the retrieval by the cost function (Jin et al. 2008; Li et al.
2010): 1) the retrieval is constrained to the first guess,
and 2) the calculated BT based on the retrieval is con-
strained to the observed BT. These conditions suggest
the importance of the quality of the background inputs
(the GFS forecast temperature/water vapor profiles)
and of the qualityGOES-13 sounder BTmeasurements.
Remember that the first guess is obtained using the
background (the GFS forecast temperature/water vapor
profiles) and the GOES-13 sounder BT measurement
as predictors through regression. Therefore, the quality
of the retrieved TPW may be affected by two possible
factors: 1) the quality of the GFS forecast temperature/
water vapor profiles, and 2) the quality of theGOES-13
sounder BT measurement.
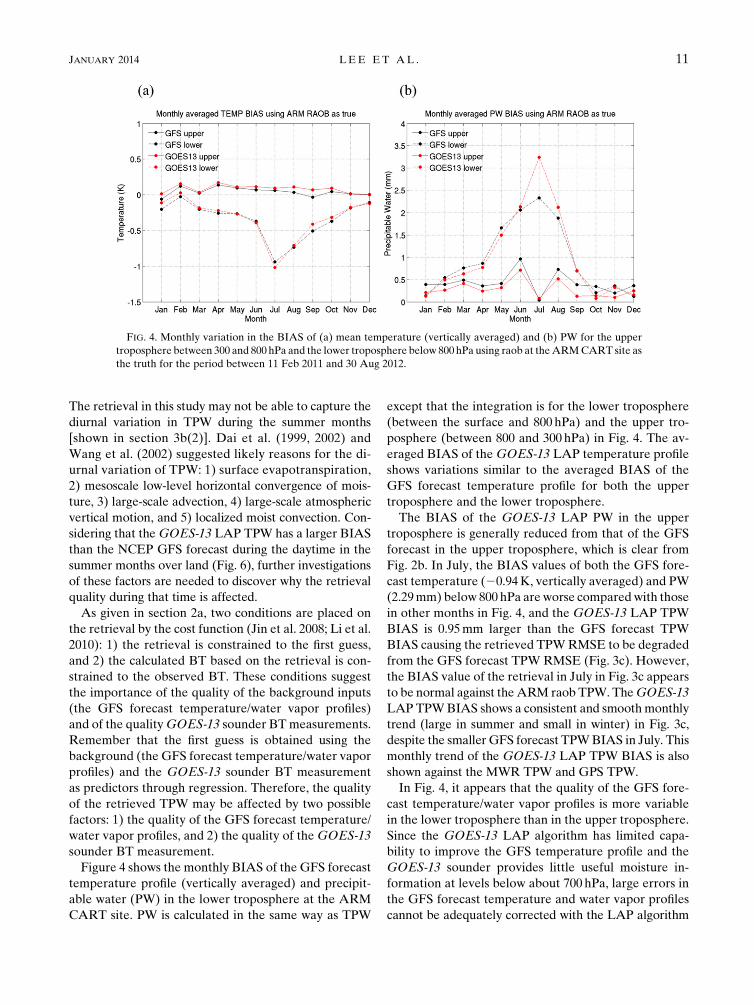
Figure 4 shows the monthly BIAS of the GFS forecast
temperature profile (vertically averaged) and precipit-
able water (PW) in the lower troposphere at the ARM
CART site. PW is calculated in the same way as TPW
except that the integration is for the lower troposphere
(between the surface and 800 hPa) and the upper tro-
posphere (between 800 and 300 hPa) in Fig. 4. The av-
eraged BIAS of the GOES-13 LAP temperature profile
shows variations similar to the averaged BIAS of the
GFS forecast temperature profile for both the upper
troposphere and the lower troposphere.
The BIAS of the GOES-13 LAP PW in the upper
troposphere is generally reduced from that of the GFS
forecast in the upper troposphere, which is clear from
Fig. 2b. In July, the BIAS values of both the GFS fore-
cast temperature (20.94K, vertically averaged) and PW
(2.29mm) below 800 hPa areworse comparedwith those
in other months in Fig. 4, and the GOES-13 LAP TPW
BIAS is 0.95mm larger than the GFS forecast TPW
BIAS causing the retrieved TPWRMSE to be degraded
from the GFS forecast TPW RMSE (Fig. 3c). However,
the BIAS value of the retrieval in July in Fig. 3c appears
to be normal against theARM raob TPW. TheGOES-13
LAP TPWBIAS shows a consistent and smoothmonthly
trend (large in summer and small in winter) in Fig. 3c,
despite the smaller GFS forecast TPWBIAS in July. This
monthly trend of the GOES-13 LAP TPW BIAS is also
shown against the MWR TPW and GPS TPW.
In Fig. 4, it appears that the quality of the GFS fore-
cast temperature/water vapor profiles is more variable
in the lower troposphere than in the upper troposphere.
Since the GOES-13 LAP algorithm has limited capa-
bility to improve the GFS temperature profile and the
GOES-13 sounder provides little useful moisture in-
formation at levels below about 700 hPa, large errors in
the GFS forecast temperature and water vapor profiles
cannot be adequately corrected with the LAP algorithm
FIG. 4. Monthly variation in the BIAS of (a) mean temperature (vertically averaged) and (b) PW for the upper
troposphere between 300 and 800 hPa and the lower troposphere below 800hPa using raob at theARMCART site as
the truth for the period between 11 Feb 2011 and 30 Aug 2012.
JANUARY 2014 LEE ET AL . 11
and the retrieved moisture is likely to have a large bias.
To determine the impact of the BIAS of the temperature/
water vapor in the first guess on the retrieval, two separate
experiments have been conducted by changing either
temperature orwater vapor amount (not shown): 1) 0.5-K
increase in the GFS forecast temperature below 800hPa,
and 2) 5% decrease in the GFS forecast water vapor
below 800 hPa. While the 0.5-K increase in the GFS
forecast temperature in the lower troposphere results
in the retrieved TPW BIAS increase (0.25mm in July)
from the GOES-13 LAP retrieval, the 5% decrease
(or about 1.15mm decrease of PW in July) in the GFS
forecast water vapor in the lower troposphere induces
the retrieved TPW BIAS decrease (0.9mm in July)
from the GOES-13 LAP retrieval. Although these ex-
periments reveal that the quality of the background
(the GFS forecast fields) affects the physical retrieval
quality, similar consistent monthly trends of the
GOES-13 LAP TPW BIAS are still observed in the
experiments. Since the background inputs (the GFS
forecast temperature/water vapor profiles) and the
GOES-13 sounder BT measurements are the two main
sources of data for the retrieval, theGOES-13 sounder
BT calibration needs to be further investigated to dis-
cover how it is related to the quality of the GOES-13
LAP retrieval.
2) DIURNAL VARIATION
Geostationary satellites have the advantage of stay-
ing over a permanent location on Earth, which makes it
possible to observe the same area continuously. This
advantage allows investigations in diurnal variation over
the observed area.
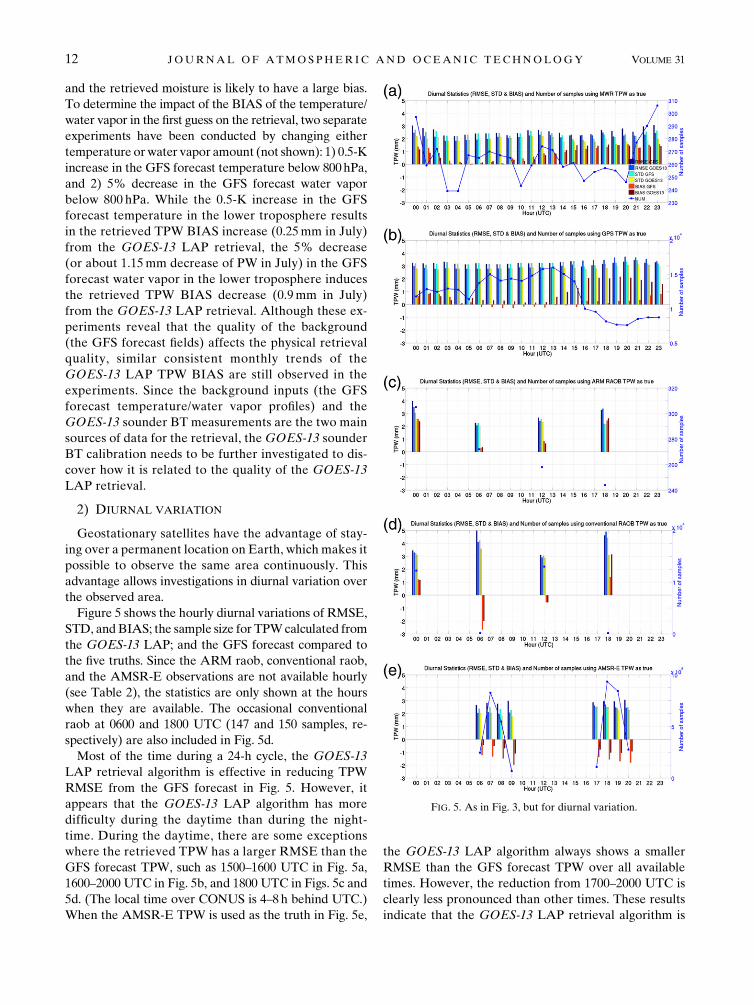
Figure 5 shows the hourly diurnal variations of RMSE,
STD, andBIAS; the sample size for TPWcalculated from
the GOES-13 LAP; and the GFS forecast compared to
the five truths. Since the ARM raob, conventional raob,
and the AMSR-E observations are not available hourly
(see Table 2), the statistics are only shown at the hours
when they are available. The occasional conventional
raob at 0600 and 1800 UTC (147 and 150 samples, re-
spectively) are also included in Fig. 5d.
Most of the time during a 24-h cycle, the GOES-13
LAP retrieval algorithm is effective in reducing TPW
RMSE from the GFS forecast in Fig. 5. However, it
appears that the GOES-13 LAP algorithm has more
difficulty during the daytime than during the night-
time. During the daytime, there are some exceptions
where the retrieved TPW has a larger RMSE than the
GFS forecast TPW, such as 1500–1600 UTC in Fig. 5a,
1600–2000 UTC in Fig. 5b, and 1800 UTC in Figs. 5c and
5d. (The local time over CONUS is 4–8 h behind UTC.)
When the AMSR-E TPW is used as the truth in Fig. 5e,
the GOES-13 LAP algorithm always shows a smaller
RMSE than the GFS forecast TPW over all available
times. However, the reduction from 1700–2000 UTC is
clearly less pronounced than other times. These results
indicate that the GOES-13 LAP retrieval algorithm is
FIG. 5. As in Fig. 3, but for diurnal variation.
12 JOURNAL OF ATMOSPHER IC AND OCEAN IC TECHNOLOGY VOLUME 31
less efficient at improving the GFS forecast in the day-
time. The degraded performance is mainly because of
the algorithm’s difficulty in improving the TPW BIAS.
In Fig. 5, the GOES-13 LAP TPW BIAS shows a clear
diurnal variation over land. The TPWSTD, on the other
hand, does not show any strong diurnal pattern; the re-
trieval always shows a smaller TPW STD than the GFS
forecast, regardless of which observation or what time
is used as the truth. It is postulated that an improved
instrument spectral resolution would improve the re-
trieval quality (Schmit et al. 2009; Sieglaff et al. 2009).
One reason is that high spectral resolution observations
will better allow for determining the surface emissivity.
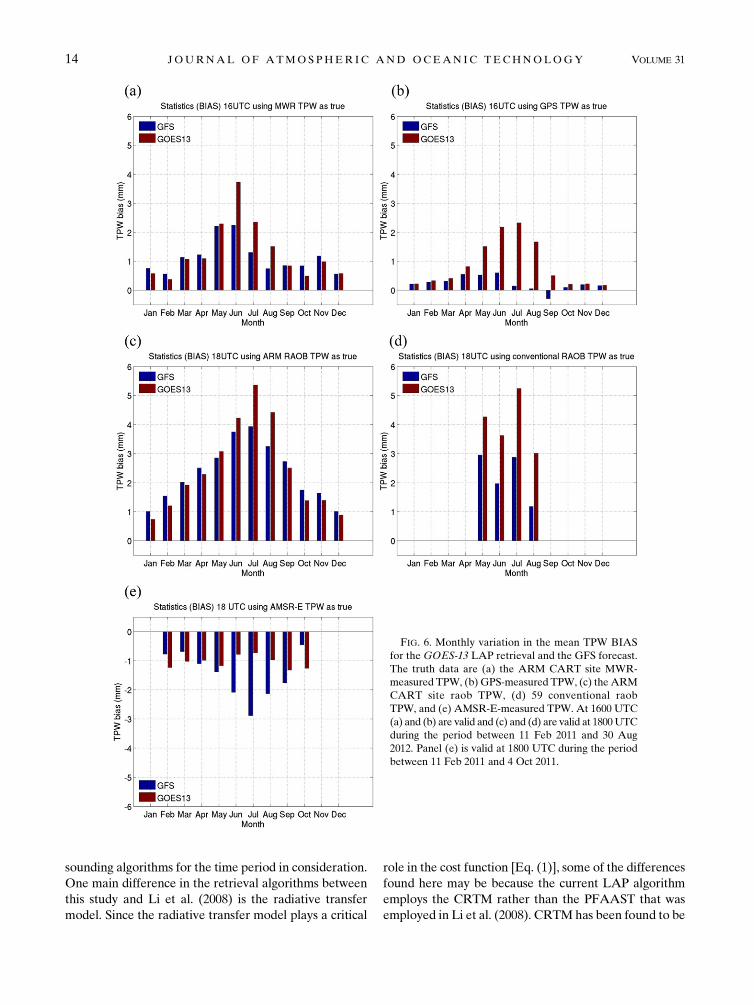
The GOES-13 LAP TPW BIAS increase during the
daytime happens mostly in the summer months (May,
June, July, and August), when compared to the truth
datasets over the CONUS land. Figure 6 shows the
monthly BIAS of the GOES-13 LAP and the GFS
forecast TPW at 1600 UTC using the MWR TPW and
GPS TPW as the truths and at 1800 UTC using the raob
TPWs at the ARM CART site and the conventional
raob sites and the AMSR-E TPW as the truths.
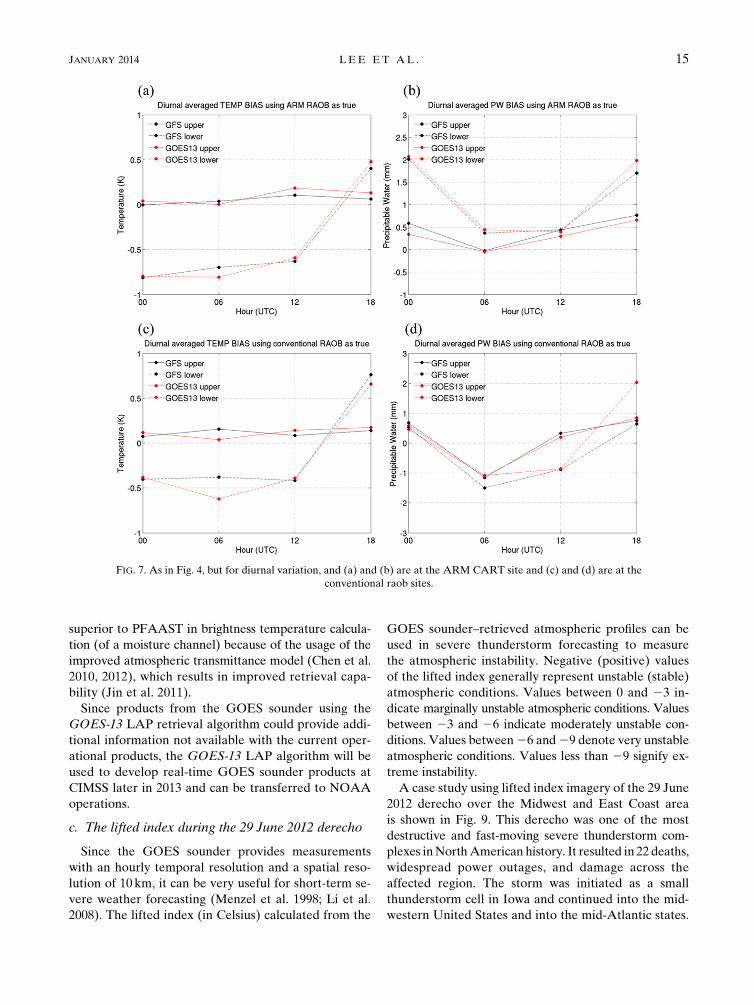
Figure 7 shows the diurnal BIAS variation in the GFS
forecast, the GOES-13 LAP temperature profile (ver-
tically averaged), PW for the upper troposphere (be-
tween 300 and 800 hPa), the lower troposphere (below
800 hPa) at the ARMCART site, and the conventional
raob sites. Similar to the monthly variation in Fig. 4, the
BIAS of the GOES-13 LAP and the GFS forecast fields
show similar variations for both the upper and lower
tropospheres. At 1800 UTC (daytime), the BIAS of both
theGFS forecast temperature (0.76K at the conventional
raob sites) and PW (1.70mm at the ARM CART site)
below 800hPa are relatively large compared to other
times inFig. 7. TheGOES-13LAPPWBIAS in the lower
troposphere is increased from the GFS forecast both at
the ARM CART site and the conventional raob sites at
this time, and thus the GOES-13 LAP TPW BIAS is in-
creased from the GFS forecast at both the ARM CART
site and the conventional raob sites in Figs. 5c and 5d.
Two separate experiments have been conducted to
examine the impacts of the background inputs (GFS
forecast fields) by changing either the temperature or
water vapor amount in the lower atmosphere (not
shown): 1) a 0.5-K decrease in the GFS forecast tem-
perature below 800 hPa at the conventional raob sites,
and 2) a 5% decrease in the GFS forecast water vapor
below 800hPa at the ARM CART site. The second ex-
periment is the same as that of the monthly variation in
Fig. 4. The 0.5-K decrease in the GFS forecast tempera-
ture in the lower troposphere results in the retrieved
TPW BIAS decrease (0.26mm at 1800 UTC) from the
GOES-13 LAP retrieval, and the 5% decrease (or
0.43mm decrease in PW at 1800 UTC) in the GFS
forecast water vapor in the lower troposphere induces
the retrieved TPWBIAS decrease (0.41mm at 1800 UTC)
from the GOES-13 LAP retrieval. From these experi-
ments, it is clear that the background inputs affect the
quality of the retrieval. And similar to the monthly
variation experiments, the consistent diurnal trend of
the GOES-13 LAP TPW BIAS is still observed after
the temperature/water vapor BIAS adjustment in the
experiments.
The increased BIAS in the GOES-13 LAP TPW at
1800 UTC (and possibly for July in Fig. 4 as well) may
be due to the possible calibration issue in observed
GOES-13 BTs. Yu and Wu (2013) investigated the di-
urnal variation in the accuracy of theGOES-13 sounder
infrared channels. They compared GOES-13 sounder
BT measurements with AIRS and the Infrared Atmo-
spheric Sounding Interferometer (IASI) hyperspectral
measurements. Although their study is limited to a short
period between 1November 2011 and 31December 2011,
their results show that there are diurnal variations in the
accuracy of the GOES-13 sounder BT measurements in
channels 6–8; during the daytime themean BT difference
increases until noon (around 0.4K warmer than IASI),
and during the nighttime the mean BT difference de-
creases until midnight (around 0.4K colder than AIRS).
These are the three channels responsible for lower-
atmospheric moisture retrievals. These results indicate
that the GOES-13 LAP TPW retrieval might suffer from
the radiance bias in the observation. Further investigation
is needed to address this issue.
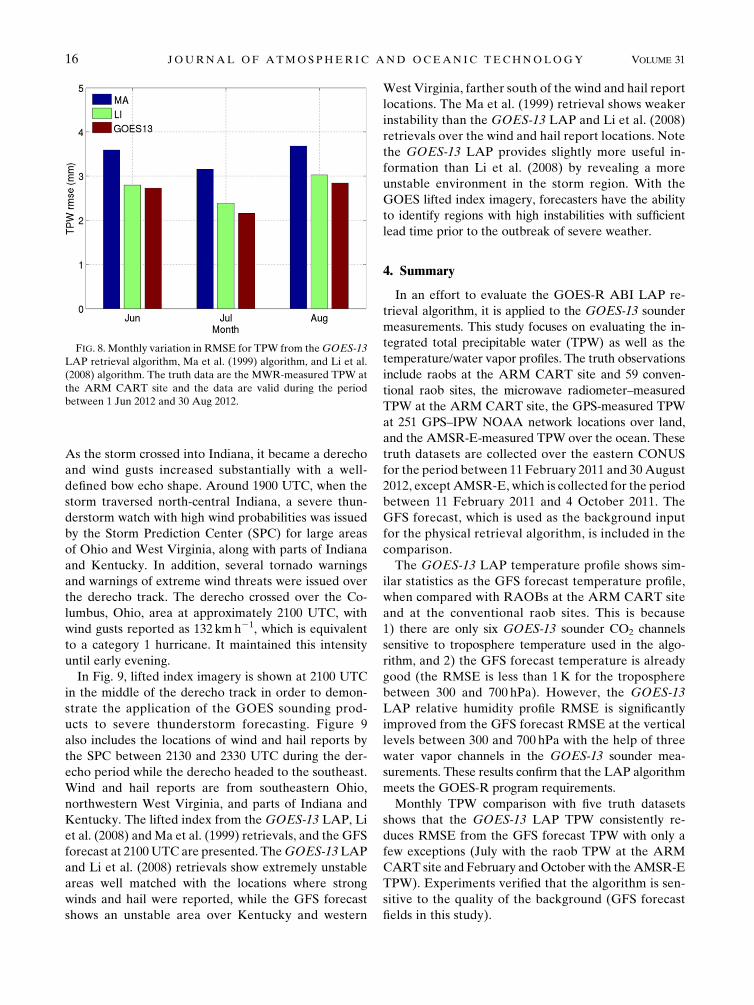
3) COMPARISON WITH THE OPERATIONAL GOESSOUNDER RETRIEVAL ALGORITHMS
In January 2013, the Li et al. (2008) GOES sounder
retrieval algorithm replaced the method of Ma et al.
(1999) in NOAA operations. Figure 8 shows the statis-
tics (RMSE) for the comparisons of TPW from the
GOES-13 LAP, Ma et al. (1999), and Li et al. (2008)
algorithms compared with the MWR TPW at the ARM
CART site over 3 months between 1 June 2012 and
30 August 2012. Only these 3 months are included be-
cause the Li et al. (2008) TPWs became available starting
1 June 2012. The sample size is 715. Figure 8 clearly
demonstrates the improvement in the Li et al. (2008) al-
gorithm over Ma et al. (1999); the RMSE difference is
0.76mm in all the 3 months. Moreover, the GOES-13
LAP TPW shows even better results than the Li et al.
(2008) algorithm; the mean RMSE difference of the 3
months between the GOES-13 LAP and Li et al. (2008)
algorithm is 0.15mm. These results imply that the
GOES-13 ABI LAP retrieval algorithm is superior to
both the current and the previous operational GOES
JANUARY 2014 LEE ET AL . 13
sounding algorithms for the time period in consideration.
One main difference in the retrieval algorithms between
this study and Li et al. (2008) is the radiative transfer
model. Since the radiative transfer model plays a critical
role in the cost function [Eq. (1)], some of the differences
found here may be because the current LAP algorithm
employs the CRTM rather than the PFAAST that was
employed in Li et al. (2008). CRTMhas been found to be
FIG. 6. Monthly variation in the mean TPW BIAS
for the GOES-13 LAP retrieval and the GFS forecast.
The truth data are (a) the ARM CART site MWR-
measured TPW, (b) GPS-measured TPW, (c) the ARM
CART site raob TPW, (d) 59 conventional raob
TPW, and (e) AMSR-E-measured TPW. At 1600 UTC
(a) and (b) are valid and (c) and (d) are valid at 1800UTC
during the period between 11 Feb 2011 and 30 Aug
2012. Panel (e) is valid at 1800 UTC during the period
between 11 Feb 2011 and 4 Oct 2011.
14 JOURNAL OF ATMOSPHER IC AND OCEAN IC TECHNOLOGY VOLUME 31
superior to PFAAST in brightness temperature calcula-
tion (of a moisture channel) because of the usage of the
improved atmospheric transmittance model (Chen et al.
2010, 2012), which results in improved retrieval capa-
bility (Jin et al. 2011).
Since products from the GOES sounder using the
GOES-13 LAP retrieval algorithm could provide addi-
tional information not available with the current oper-
ational products, the GOES-13 LAP algorithm will be
used to develop real-time GOES sounder products at
CIMSS later in 2013 and can be transferred to NOAA
operations.
c. The lifted index during the 29 June 2012 derecho
Since the GOES sounder provides measurements
with an hourly temporal resolution and a spatial reso-
lution of 10 km, it can be very useful for short-term se-
vere weather forecasting (Menzel et al. 1998; Li et al.
2008). The lifted index (in Celsius) calculated from the
GOES sounder–retrieved atmospheric profiles can be
used in severe thunderstorm forecasting to measure
the atmospheric instability. Negative (positive) values
of the lifted index generally represent unstable (stable)
atmospheric conditions. Values between 0 and 23 in-
dicate marginally unstable atmospheric conditions. Values
between 23 and 26 indicate moderately unstable con-
ditions. Values between26 and29 denote very unstable
atmospheric conditions. Values less than 29 signify ex-
treme instability.
A case study using lifted index imagery of the 29 June
2012 derecho over the Midwest and East Coast area
is shown in Fig. 9. This derecho was one of the most
destructive and fast-moving severe thunderstorm com-
plexes inNorthAmerican history. It resulted in 22 deaths,
widespread power outages, and damage across the
affected region. The storm was initiated as a small
thunderstorm cell in Iowa and continued into the mid-
western United States and into the mid-Atlantic states.
FIG. 7. As in Fig. 4, but for diurnal variation, and (a) and (b) are at the ARM CART site and (c) and (d) are at the
conventional raob sites.
JANUARY 2014 LEE ET AL . 15
As the storm crossed into Indiana, it became a derecho
and wind gusts increased substantially with a well-
defined bow echo shape. Around 1900 UTC, when the
storm traversed north-central Indiana, a severe thun-
derstorm watch with high wind probabilities was issued
by the Storm Prediction Center (SPC) for large areas
of Ohio and West Virginia, along with parts of Indiana
and Kentucky. In addition, several tornado warnings
and warnings of extreme wind threats were issued over
the derecho track. The derecho crossed over the Co-
lumbus, Ohio, area at approximately 2100 UTC, with
wind gusts reported as 132 kmh21, which is equivalent
to a category 1 hurricane. It maintained this intensity
until early evening.
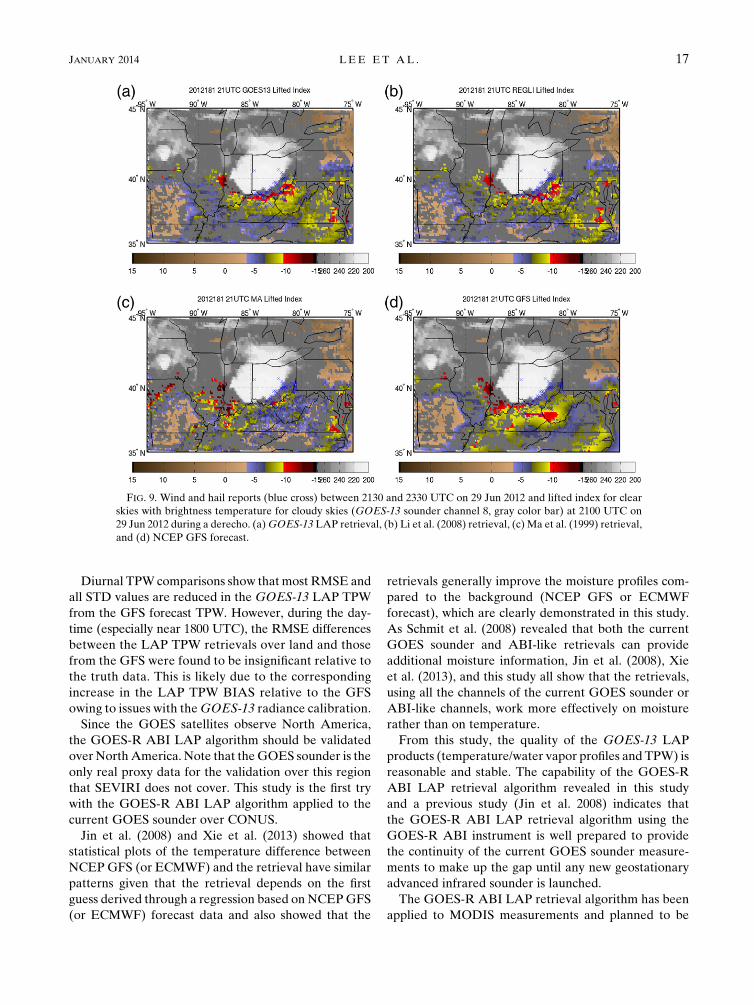
In Fig. 9, lifted index imagery is shown at 2100 UTC
in the middle of the derecho track in order to demon-
strate the application of the GOES sounding prod-
ucts to severe thunderstorm forecasting. Figure 9
also includes the locations of wind and hail reports by
the SPC between 2130 and 2330 UTC during the der-
echo period while the derecho headed to the southeast.
Wind and hail reports are from southeastern Ohio,
northwestern West Virginia, and parts of Indiana and
Kentucky. The lifted index from the GOES-13 LAP, Li
et al. (2008) andMa et al. (1999) retrievals, and the GFS
forecast at 2100UTC are presented. TheGOES-13LAP
and Li et al. (2008) retrievals show extremely unstable
areas well matched with the locations where strong
winds and hail were reported, while the GFS forecast
shows an unstable area over Kentucky and western
West Virginia, farther south of the wind and hail report
locations. The Ma et al. (1999) retrieval shows weaker
instability than the GOES-13 LAP and Li et al. (2008)
retrievals over the wind and hail report locations. Note
the GOES-13 LAP provides slightly more useful in-
formation than Li et al. (2008) by revealing a more
unstable environment in the storm region. With the
GOES lifted index imagery, forecasters have the ability
to identify regions with high instabilities with sufficient
lead time prior to the outbreak of severe weather.
4. Summary
In an effort to evaluate the GOES-R ABI LAP re-
trieval algorithm, it is applied to the GOES-13 sounder
measurements. This study focuses on evaluating the in-
tegrated total precipitable water (TPW) as well as the
temperature/water vapor profiles. The truth observations
include raobs at the ARM CART site and 59 conven-
tional raob sites, the microwave radiometer–measured
TPW at the ARM CART site, the GPS-measured TPW
at 251 GPS–IPW NOAA network locations over land,
and the AMSR-E-measured TPW over the ocean. These
truth datasets are collected over the eastern CONUS
for the period between 11 February 2011 and 30August
2012, except AMSR-E, which is collected for the period
between 11 February 2011 and 4 October 2011. The
GFS forecast, which is used as the background input
for the physical retrieval algorithm, is included in the
comparison.
The GOES-13 LAP temperature profile shows sim-
ilar statistics as the GFS forecast temperature profile,
when compared with RAOBs at the ARM CART site
and at the conventional raob sites. This is because
1) there are only six GOES-13 sounder CO2 channels
sensitive to troposphere temperature used in the algo-
rithm, and 2) the GFS forecast temperature is already
good (the RMSE is less than 1K for the troposphere
between 300 and 700 hPa). However, the GOES-13
LAP relative humidity profile RMSE is significantly
improved from the GFS forecast RMSE at the vertical
levels between 300 and 700 hPa with the help of three
water vapor channels in the GOES-13 sounder mea-
surements. These results confirm that the LAP algorithm
meets the GOES-R program requirements.
Monthly TPW comparison with five truth datasets
shows that the GOES-13 LAP TPW consistently re-
duces RMSE from the GFS forecast TPW with only a
few exceptions (July with the raob TPW at the ARM
CART site and February andOctober with the AMSR-E
TPW). Experiments verified that the algorithm is sen-
sitive to the quality of the background (GFS forecast
fields in this study).
FIG. 8. Monthly variation in RMSE for TPW from theGOES-13
LAP retrieval algorithm, Ma et al. (1999) algorithm, and Li et al.
(2008) algorithm. The truth data are the MWR-measured TPW at
the ARM CART site and the data are valid during the period
between 1 Jun 2012 and 30 Aug 2012.
16 JOURNAL OF ATMOSPHER IC AND OCEAN IC TECHNOLOGY VOLUME 31
Diurnal TPW comparisons show thatmost RMSE and
all STD values are reduced in the GOES-13 LAP TPW
from the GFS forecast TPW. However, during the day-
time (especially near 1800 UTC), the RMSE differences
between the LAP TPW retrievals over land and those
from the GFS were found to be insignificant relative to
the truth data. This is likely due to the corresponding
increase in the LAP TPW BIAS relative to the GFS
owing to issues with theGOES-13 radiance calibration.
Since the GOES satellites observe North America,
the GOES-R ABI LAP algorithm should be validated
over NorthAmerica. Note that theGOES sounder is the
only real proxy data for the validation over this region
that SEVIRI does not cover. This study is the first try
with the GOES-R ABI LAP algorithm applied to the
current GOES sounder over CONUS.
Jin et al. (2008) and Xie et al. (2013) showed that
statistical plots of the temperature difference between
NCEP GFS (or ECMWF) and the retrieval have similar
patterns given that the retrieval depends on the first
guess derived through a regression based on NCEPGFS
(or ECMWF) forecast data and also showed that the
retrievals generally improve the moisture profiles com-
pared to the background (NCEP GFS or ECMWF
forecast), which are clearly demonstrated in this study.
As Schmit et al. (2008) revealed that both the current
GOES sounder and ABI-like retrievals can provide
additional moisture information, Jin et al. (2008), Xie
et al. (2013), and this study all show that the retrievals,
using all the channels of the current GOES sounder or
ABI-like channels, work more effectively on moisture
rather than on temperature.
From this study, the quality of the GOES-13 LAP
products (temperature/water vapor profiles and TPW) is
reasonable and stable. The capability of the GOES-R
ABI LAP retrieval algorithm revealed in this study
and a previous study (Jin et al. 2008) indicates that
the GOES-R ABI LAP retrieval algorithm using the
GOES-R ABI instrument is well prepared to provide
the continuity of the current GOES sounder measure-
ments to make up the gap until any new geostationary
advanced infrared sounder is launched.
The GOES-R ABI LAP retrieval algorithm has been
applied to MODIS measurements and planned to be
FIG. 9. Wind and hail reports (blue cross) between 2130 and 2330 UTC on 29 Jun 2012 and lifted index for clear
skies with brightness temperature for cloudy skies (GOES-13 sounder channel 8, gray color bar) at 2100 UTC on
29 Jun 2012 during a derecho. (a)GOES-13 LAP retrieval, (b) Li et al. (2008) retrieval, (c) Ma et al. (1999) retrieval,
and (d) NCEP GFS forecast.
JANUARY 2014 LEE ET AL . 17
launched on the International MODIS/AIRS Process-
ing Package (IMAPP), which is publicly available and
accessed from more than 60 countries. The GOES-R
ABI LAP retrieval algorithm is also planned to be imple-
mented in the Geostationary Cloud Algorithm Testbed
(GEOCAT) for real-time GOES sounder processing.
Acknowledgments. This work was funded under the
National Oceanic and Atmospheric Administration Co-
operative Agreement NA10NES4400013. The authors
thank J. Nelson for the help to prepare GOES-13
sounder and related truth data. The views, opinions,
and findings contained in this report are those of the
author(s) and should not be construed as an official
National Oceanic and Atmospheric Administration
or U.S. government position, policy, or decision.
REFERENCES
Birkenheuer, D. L., and S. I. Gutman, 2005: A comparison of
GOES moisture-derived product and GPS-IPW data during
IHOP-2002. J. Atmos. Oceanic Technol., 22, 1838–1845.
Chen, S. H., Z. Zhao, J. S. Haase, A. Chen, and F. Vandenberghe,
2008: A study of the characteristics and assimilation of re-
trieved MODIS total precipitable water data in severe weather
simulations. Mon. Wea. Rev., 136, 3608–3628.
Chen, Y., Y.Han, P. VanDelst, and F.Weng, 2010:Onwater vapor
Jacobian in fast radiative transfer model. J. Geophys. Res.,
115, D12303, doi:10.1029/2009JD013379.
——, ——, and F. Weng, 2012: Comparison of two transmittance
algorithms in the Community Radiative Transfer Model:
Application to AVHRR. J. Geophys. Res., 117, D06206,
doi:10.1029/2011JD016656.
Collard, A., and Coauthors, 2010: An overview of the assimilation
of AIRS and IASI radiances at operational NWP centres.
Proc. 17th Int. TOVS Study Conf., Monterey, CA, TOVS
Working Group, 7.9. [Available online at http://cimss.ssec.
wisc.edu/itwg/itsc/itsc17/session7/7.9_collard.pdf.]
Dai, A., F. Giorgi, andK. E. Trenberth, 1999:Observed andmodel-
simulated precipitation diurnal cycle over the contiguous
United States. J. Geophys. Res., 104 (D6), 6377–6402.
——, J. Wang, R. H. Ware, and T. Van Hove, 2002: Diurnal vari-
ation in water vapor over North America and its implications
for sampling errors in radiosonde humidity. J. Geophys. Res.,
107, 4090, doi:10.1029/2001JD000642.
Daniels, J. M., T. J. Schmit, and D. W. Hiller, 2001: GOES-11
science test: GOES-11 imager and sounder radiance and
product validations. NOAA Tech. Rep. NESDIS 103, 49 pp.
Fetzer, E. J., B. H. Lambrigtsen, A. Eldering, H. H. Aumann, and
M. T. Chahine, 2006: Biases in total precipitable water vapor
climatologies from Atmospheric Infrared Sounder and Ad-
vanced Microwave Scanning Radiometer. J. Geophys. Res.,
111, D09S16, doi:10.1029/2005JD006598.
Fuelberg, H. E., and S. R. Olson, 1991: An assessment of VAS
derived retrievals and parameters used in thunderstorm fore-
casting. Mon. Wea. Rev., 119, 795–814.
Hanesiak, J., M. Melsness, and R. Raddatz, 2010: Observed and
modeled growing-season diurnal precipitable water vapor in
south-central Canada. J. Appl. Meteor. Climatol., 49, 2301–
2314.
Hillger, D. W., and T. J. Schmit, 2010: The GOES-14 science test:
Imager and sounder radiance and product validations. NOAA
Tech. Rep. NESDIS 131, 120 pp.
——, ——, and J. M. Daniels, 2003: Imager and sounder radiance
and product validations for the GOES-12 science test. NOAA
Tech. Rep. NESDIS 115, 66 pp.
Immler, F. J., J.Dykema, T.Gardiner,D.N.Whiteman, P.W.Thorne,
and H. Vomel, 2010: Reference quality upper-air measure-
ments: Guidance for developing GRUAN data products.
Atmos. Meas. Tech., 3, 1217–1231.
Jin, X., J. Li, T. J. Schmit, J. Li, M. D. Goldberg, and J. J. Gurka,
2008: Retrieving clear-sky atmospheric parameters from SEVIRI
and ABI infrared radiances. J. Geophys. Res., 113, D15310,
doi:10.1029/2008JD010040.
——, ——, ——, and M. D. Goldberg, 2011: Evaluation of radia-
tive transfer models in atmospheric profiling with broad-
band infrared radiance measurements. Int. J. Remote Sens.,
32, 863–874.Kazumori, M., T. Egawa, and K. Yoshimoto, 2012: A retrieval al-
gorithm of atmospheric water vapor and cloud liquid water for
AMSR-E. Eur. J. Remote Sens., 45, 63–74.Li, J., W. Wolf, W. P. Menzel, W. Zhang, H.-L. Huang, and T. H.
Achtor, 2000: Global soundings of the atmosphere from
ATOVS measurements: The algorithm and validation.
J. Appl. Meteor., 39, 1248–1268.
——, T. J. Schmit, X. Jin, andG.Martin, 2010: GOES-RAdvanced
Baseline Imager (ABI) algorithm theoretical basis document
for legacy atmospheric moisture profile, legacy atmospheric
temperature profile, total precipitable water, and derived at-
mospheric stability indices. NOAA NESDIS Center for Sat-
ellite Applications and Research Rep., 106 pp. [Available
online at http://www.goes-r.gov/products/ATBDs/baseline/
Sounding_LAP_v2.0_no_color.pdf.]
Li, Z., J. Li, W. P. Menzel, T. J. Schmit, J. P. Nelson III, J. Daniels,
and S. A. Ackerman, 2008: GOES sounding improvement and
applications to severe storm nowcasting. Geophys. Res. Lett.,
35, L03806, doi:10.1029/2007GL032797.
——, ——, ——, J. P. Nelson III, T. J. Schmit, E. Weisz, and S. A.
Ackerman, 2009: Forecasting and nowcasting improvement
in cloudy regions with high temporal GOES sounder in-
frared radiance measurements. J. Geophys. Res., 114,
D09216, doi:10.1029/2008JD010596.
Liljegren, J. C., 1995: Observations of total column precipitable
water vapor and cloud liquid water using a dual-frequency
microwave radiometer. Microwave Radiometry and Remote
Sensing of the Environment, D. Solimini, Ed., Vista Science
Press, 107–118.
Liu, Y.-C., S.-H. Chen, and F.-C. Chien, 2011: Impact of MODIS
and AIRS total precipitable water on modifying the vertical
shear and Hurricane Emily simulations. J. Geophys. Res., 116,
D02126, doi:10.1029/2010JD014528.
Ma, X. L., T. Schmit, and W. L. Smith, 1999: A nonlinear physical
retrieval algorithm—Its application to theGOES-8/9 sounder.
J. Appl. Meteor., 38, 501–513.
Mattioli, V., R. Westwater, S. I. Gutman, and V. R. Morris, 2005:
Forward model studies of water vapor using scanning micro-
wave radiometers, global positioning system, and radiosondes
during the cloudiness intercomparison experiment. IEEE
Trans. Geosci. Remote Sens., 43, 1012–1021.
Menzel, W. P., and J. F. W. Purdom, 1994: Introducing GOES-I:
The first of a new generation of Geostationary Operational
Environmental Satellites. Bull. Amer. Meteor. Soc., 75,
757–781.
18 JOURNAL OF ATMOSPHER IC AND OCEAN IC TECHNOLOGY VOLUME 31
——, F. C. Holt, T. J. Schmit, R. M. Aune, T. J. Schreiner, G. S.
Wade, andD.Gray, 1998:Application ofGOES-8/9 soundings
to weather forecasting and nowcasting. Bull. Amer. Meteor.
Soc., 79, 2059–2077.Pacione, R., E. Fionda, R. Ferrara, R. Lanotte, C. Sciarretta, and
F. Vespe, 2002: Comparison of atmospheric parameters de-
rived from GPS, VLBI and a ground-based microwave radi-
ometer in Italy. Phys. Chem. Earth, 27, 309–316.Rao, P. A., and H. E. Fuelberg, 1998: An evaluation of GOES-8
retrievals. J. Appl. Meteor., 37, 1577–1587.
Reale, T., B. Sun, F. H. Tilley, and M. Pettey, 2012: The NOAA
Products Validation System (NPROVS). J. Atmos. Oceanic
Technol., 29, 629–645.
Rodgers, C. D., 1976: Retrieval of atmospheric temperature and
composition from remote measurements of thermal radiation.
Rev. Geophys. Space Phys., 14, 609–624.
Schmit, T. J., W. F. Feltz, W. P. Menzel, J. Jung, A. P. Noel, J. N.
Heil, J. P. Nelson III, andG. S.Wade, 2002: Validation and use
of GOES sounder moisture information.Wea. Forecasting, 17,139–154.
——, M. M. Gunshor, W. P. Menzel, J. J. Gurka, J. Li, and
S. Bachmeier, 2005: Introducing the next-generationAdvanced
Baseline Imager (ABI) on GOES-R. Bull. Amer. Meteor. Soc.,
86, 1079–1096.
——, J. Li, J. J. Gurka, M. D. Goldberg, K. J. Schrab, J. Li, and
W. F. Feltz, 2008: The GOES-R Advanced Baseline Imager
and the continuation of current sounder products. J. Appl.
Meteor. Climatol., 47, 2696–2711.
——, ——, S. A. Ackerman, and J. J. Gurka, 2009: High-spectral-
and high-temporal-resolution infrared measurements from geo-
stationary orbit. J. Atmos. Oceanic Technol., 26, 2273–2292.
Schrab, K. J., 1998: Monitoring the southwest U. S. summer monsoon
using GOES-9 data. Preprints, 16th Conf. on Weather Analysis
and Forecasting, Phoenix, AZ, Amer. Meteor. Soc., 368–369.
Schreiner, A. J., T. J. Schmit, andW. P.Menzel, 2001: Observations
and trends of clouds based on GOES sounder data. J. Geo-
phys. Res., 106 (D17), 20 349–20 363.
Seemann, S. W., J. Li, W. P. Menzel, and L. E. Gumley, 2003:
Operational retrieval of atmospheric temperature, moisture,
and ozone from MODIS infrared radiances. J. Appl. Meteor.,
42, 1072–1091.
——, E. E. Borbas, R. O. Knuteson, G. R. Stephenson, and H.-L.
Huang, 2008: Development of a global infrared land surface
emissivity database for application to clear sky sounding re-
trievals from multispectral satellite radiance measurements.
J. Appl. Meteor. Climatol., 47, 108–203.
Sieglaff, J. M., T. J. Schmit, W. P. Menzel, and S. A. Ackerman,
2009: Inferring convective weather characteristics with geo-
stationary high spectral resolution IR window measurements:
A look into the future. J. Atmos. Oceanic Technol., 26, 1527–
1541.
Stokes, G. M., and S. E. Schwartz, 1994: The Atmospheric Radi-
ation Measurement (ARM) program: Programmatic back-
ground and design of the Cloud and Radiation Testbed. Bull.
Amer. Meteor. Soc., 75, 1201–1221.
Turner, D. D., B. M. Lesht, S. A. Clough, J. C. Liljegren, H. E.
Revercomb, and D. C. Tobin, 2003: Dry bias and variability in
Vaisala RS80-H radiosondes: TheARMexperience. J. Atmos.
Oceanic Technol., 20, 117–132.
Velden, C. S., C. M. Hayden, S. J. Nieman, W. P. Menzel,
S. Wanzong, and J. S. Goerss, 1997: Upper-tropospheric winds
derived from geostationary satellite water vapor observations.
Bull. Amer. Meteor. Soc., 78, 173–195.
Wang, J., A. Dai, D. J. Carlson, R. H. Ware, and J. C. Liljegren,
2002: Diurnal variation in water vapor and liquid water pro-
files from a new microwave radiometer profiler. Preprints,
Sixth Symp. on Integrated Observing Systems, Orlando, FL,
Amer. Meteor. Soc., 5.5. [Available online at http://ams.confex.
com/ams/pdfpapers/27917.pdf.]
Weng, F., Y. Han, P. van Delst, Q. Liu, and B. Yan, 2005: JCSDA
Community Radiative Transfer Model (CRTM). Proc. 14th
Int. TOVS Study Conf., Beijing, China, TOVS Working Group,
217–222. [Available online at http://library.ssec.wisc.edu/
research_Resources/publications/pdfs/ITSC14/weng02_
ITSC14_2005.pdf.]
Xie, H. N. R., and Coauthors, 2013: Integration and ocean-based
prelaunch validation of GOES-R Advanced Baseline Imager
legacy atmospheric products. J. Atmos. Oceanic Technol.,
30, 1743–1756.
Yu, F., and X. Wu, 2013: Radiometric calibration accuracy of
GOES sounder infrared channels. IEEE Trans. Geosci.
Remote Sens., 51, 1187–1199.
JANUARY 2014 LEE ET AL . 19


![[THESIS TITLE GOES HERE] - SMARTech](https://img.pdfslide.net/doc/110x75/63372020be51cc9d720edafb/thesis-title-goes-here-smartech-1682871139.jpg)


