Embed Size (px)
Citation preview
Civil Engineering
Civil Engineering Faculty Publications
University of Nebraska - Lincoln Year
Event-Based Data Collection for
Generating Actuated Controller
Performance Measures
Edward J. Smaglik∗ Anuj Sharma† Darcy M. Bullock‡
James R. Sturdevant∗∗ Gary Duncan††
∗Purdue University†University of Nebraska at Lincoln, [email protected]‡Indiana University - Purdue University - Fort Wayne, [email protected]∗∗Indiana Depatment of Transportation††Econolite Control Products
This paper is posted at DigitalCommons@University of Nebraska - Lincoln.
http://digitalcommons.unl.edu/civilengfacpub/21
Cycle-by-cycle data have been shown to be effective in the analysis of a signalized intersection with measures of effective-ness such as volume-to-capacity ratios, arrival type, and aver-age vehicular delay. Currently, actuated traffic controllers are unable to store vehicle counts and vehicle occupancy in cy-cle-by-cycle bins, requiring extra equipment and personnel to collect data in these bins. The objective of this research was to develop an integrated general purpose data collection mod-ule that time stamps detector and phase state changes within a National Electrical Manufacturers Association actuated traf-fic signal controller and uses those data to provide quantitative graphs to assess arterial progression, phase capacity utiliza-tion, movement delay, and served volumes on a cycle-by-cycle basis. Given that the United States recently received a grade of 61 of 100 on the National Traffic Signal Report Card, it is par-ticularly important that procedures such as these be used to provide performance measures over extended periods so agen-cies have cost-effective mechanisms for assessing and priority-ranking signal timing efforts.
Data collection methods used by the Highway Capacity Manual (HCM) (1) are employed worldwide for quantifying the per-formance of signal systems. Those methods are oriented to-ward adjusting hourly volumes-to peak 15-minute flow rates for analysis and work very well with manually-collected data. However, it is not feasible for agencies to schedule manual data collection activities for extended periods or during unusual pe-riods such as evening school events or weekend peaks at shop-ping malls. Consequently, it is desirable to have signal systems collect their own data for assessing their performance through an integrated general purpose data collection module within the controller.However, obtaining meaningful real-time performance data from signalized intersections has historically been challenging for two reasons:
• Typical stop-bar loop detectors provide good occupancy data but poor flow rate information (2).
• Data are typically recorded by controllers on an hourly or 15-minute basis.
However, in the case of modern traffic controllers, phase splits and phase lengths vary cycle by cycle and the arbitrary binning
in 5-, 15-, or 60-minute basis the controller does not permit tab-ulating data on a cycle-by-cycle basis. Consequently, it is im-possible to evaluate theperformance of individual phases and splits on a cycle-by-cycle basis.
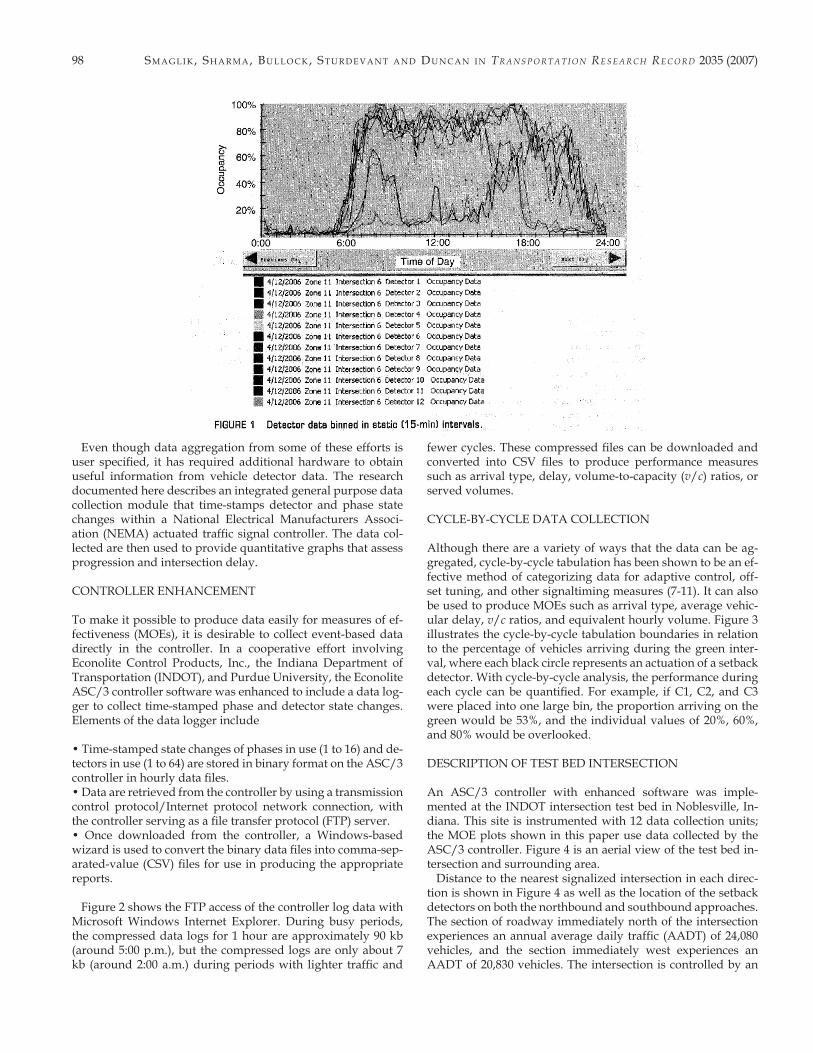
For example, Figure 1 is a 24-hour plot of occupancy binned into 15-minute intervals, downloaded from an actuated con-troller. The occupancy of 12 separate detectors is plotted ver-sus time. A similar plot can also be generated from count data. From this graph, it is clear that the intersection is reasonably busy from 5:00 a.m. to 10:00 p.m. Some detectors (for example, Detector 6) have pronounced morning and afternoon peaks. However, the following information is not at all clear from these graphs:
• How well progression is working in each direction,• If there are any split failures that need attention, and• The average delay experienced by motorists.
LITERATURE REVIEW
The North Carolina Department of Transportation found that one of the challenges of pulling useful data from loop detectors is producing it in a format that is useful to planners, designers, and other end users (3). To process data from its freeway sen-sors, the California Department of Transportation developed a system that collects loop detector data in real time and returns it in a format specified by the user (4). A system by the name of COMPASS was implemented in some areas of Toronto, Can-ada, for collecting information from SCOOT-controlled ar-terials and making it available to users. Data are collected in 20-second intervals and aggregated into time static intervals (5, 15, and 60 minutes; daily and monthly) and archived on a compact disc (3, 5). The Texas Transportation Institute recently completed research that developed a listof performance mea-sures that could be collected within the limitations of existing detection systems and then developed a prototype system to automatically collect these data. Performance measures com-puted by this system include cycle time; time to service; queue service time; duration of the green, yellow, all-red, and red in-terval for each phase; number of vehicles entering the inter-section during each interval; yellow and all-red violation rates; and phase failure rates. Collection of these data required the addition of a black box to the cabinet for data collection as well as count detectors placed in front of the stop bar (6).
Published in Transportation Research Record: Journal of the Transportation Research Board, No. 2035 (2007): 97-106. Copyright 2007, Transportation Research Board of the National Academies, Washington, D.C.
DOI: 10.3141/2035-11. Used by permission.
Event-Based Data Collection for Generating Actuated Controller Performance Measures
Edward J. Smaglik1, Anuj Sharma1, Darcy M. Bullock1,*, James R. Sturdevant2 and Gary Duncan3
1School of Civil Engineering, Purdue University, 2Division of Traffic Control Systems, Indiana Department of Transportation, 3Econolite Control Products, *[email protected]
97
98 Sm a g l i k, Sh a r m a, Bu l l o c k, St u r d e v a n t a n d du n c a n i n Tr a n s p o r T a T i o n re s e a r c h re c o r d 2035 (2007)
Even though data aggregation from some of these efforts is user specified, it has required additional hardware to obtain useful information from vehicle detector data. The research documented here describes an integrated general purpose data collection module that time-stamps detector and phase state changes within a National Electrical Manufacturers Associ-ation (NEMA) actuated traffic signal controller. The data col-lected are then used to provide quantitative graphs that assess progression and intersection delay.
CONTROLLER ENHANCEMENT
To make it possible to produce data easily for measures of ef-fectiveness (MOEs), it is desirable to collect event-based data directly in the controller. In a cooperative effort involving Econolite Control Products, Inc., the Indiana Department of Transportation (INDOT), and Purdue University, the Econolite ASC/3 controller software was enhanced to include a data log-ger to collect time-stamped phase and detector state changes. Elements of the data logger include
• Time-stamped state changes of phases in use (1 to 16) and de-tectors in use (1 to 64) are stored in binary format on the ASC/3 controller in hourly data files.• Data are retrieved from the controller by using a transmission control protocol/Internet protocol network connection, with the controller serving as a file transfer protocol (FTP) server.• Once downloaded from the controller, a Windows-based wizard is used to convert the binary data files into comma-sep-arated-value (CSV) files for use in producing the appropriate reports.
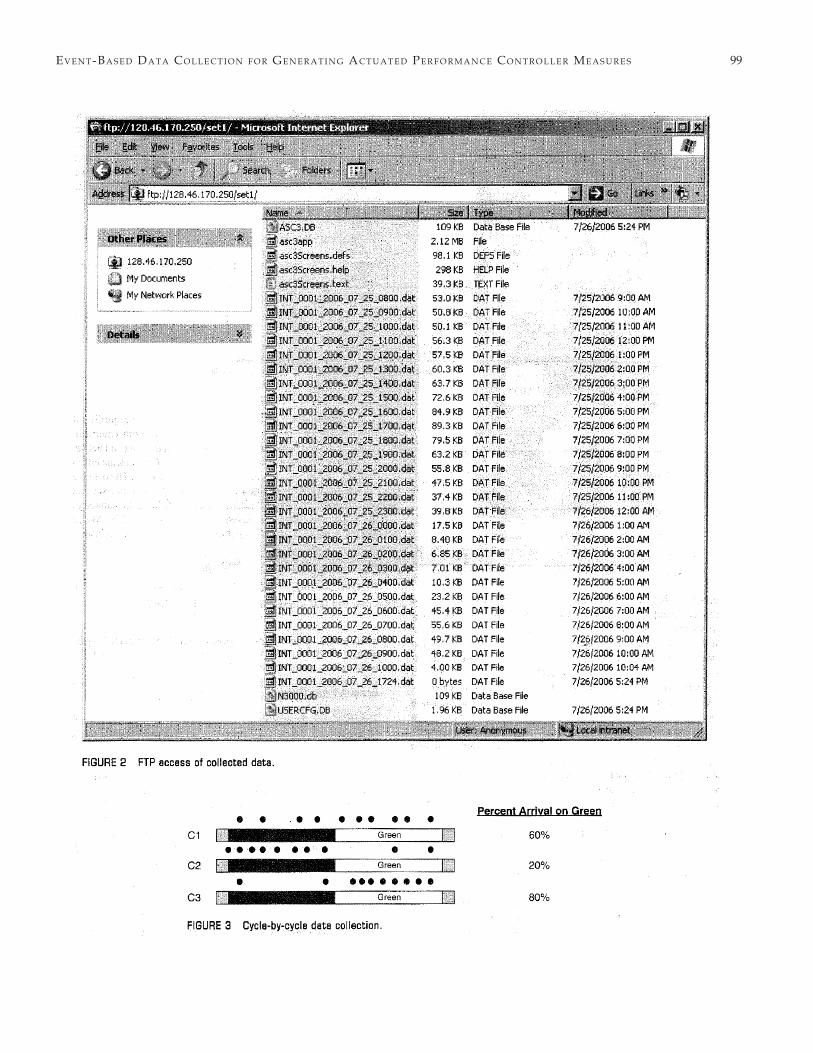
Figure 2 shows the FTP access of the controller log data with Microsoft Windows Internet Explorer. During busy periods, the compressed data logs for 1 hour are approximately 90 kb (around 5:00 p.m.), but the compressed logs are only about 7 kb (around 2:00 a.m.) during periods with lighter traffic and
fewer cycles. These compressed files can be downloaded and converted into CSV files to produce performance measures such as arrival type, delay, volume-to-capacity (v/c) ratios, or served volumes.
CYCLE-BY-CYCLE DATA COLLECTION
Although there are a variety of ways that the data can be ag-gregated, cycle-by-cycle tabulation has been shown to be an ef-fective method of categorizing data for adaptive control, off-set tuning, and other signaltiming measures (7-11). It can also be used to produce MOEs such as arrival type, average vehic-ular delay, v/c ratios, and equivalent hourly volume. Figure 3 illustrates the cycle-by-cycle tabulation boundaries in relation to the percentage of vehicles arriving during the green inter-val, where each black circle represents an actuation of a setback detector. With cycle-by-cycle analysis, the performance during each cycle can be quantified. For example, if C1, C2, and C3 were placed into one large bin, the proportion arriving on the green would be 53%, and the individual values of 20%, 60%, and 80% would be overlooked.
DESCRIPTION OF TEST BED INTERSECTION
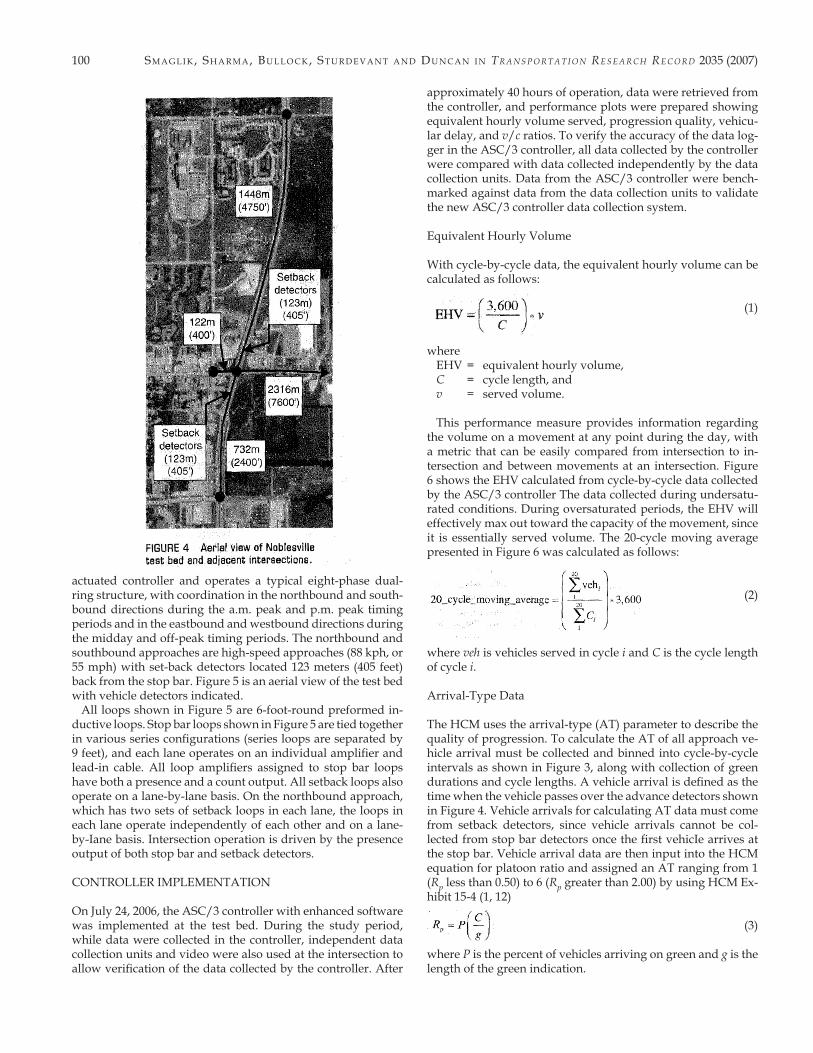
An ASC/3 controller with enhanced software was imple-mented at the INDOT intersection test bed in Noblesville, In-diana. This site is instrumented with 12 data collection units; the MOE plots shown in this paper use data collected by the ASC/3 controller. Figure 4 is an aerial view of the test bed in-tersection and surrounding area.
Distance to the nearest signalized intersection in each direc-tion is shown in Figure 4 as well as the location of the setback detectors on both the northbound and southbound approaches. The section of roadway immediately north of the intersection experiences an annual average daily traffic (AADT) of 24,080 vehicles, and the section immediately west experiences an AADT of 20,830 vehicles. The intersection is controlled by an
ev e n t-Ba S e d da t a co l l e c t i o n f o r ge n e r a t i n g ac t u a t e d Pe r f o r m a n c e co n t r o l l e r me a S u r e S 99
100 Sm a g l i k, Sh a r m a, Bu l l o c k, St u r d e v a n t a n d du n c a n i n Tr a n s p o r T a T i o n re s e a r c h re c o r d 2035 (2007)
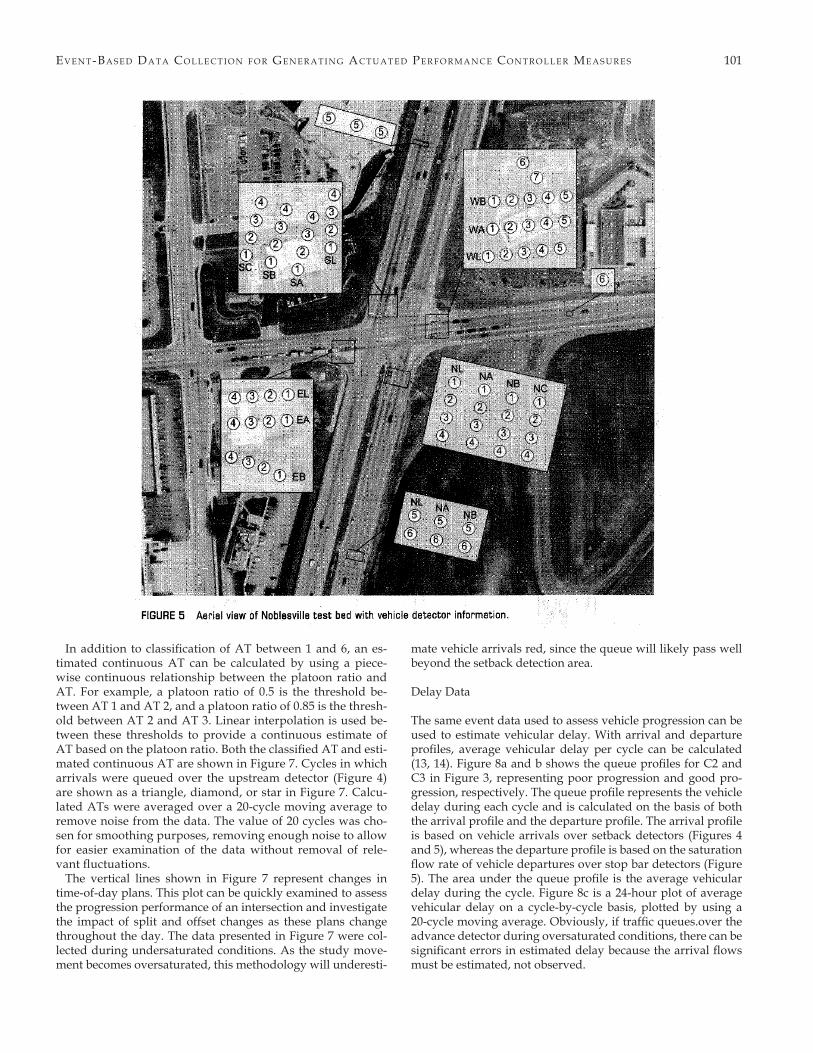
actuated controller and operates a typical eight-phase dual-ring structure, with coordination in the northbound and south-bound directions during the a.m. peak and p.m. peak timing periods and in the eastbound and westbound directions during the midday and off-peak timing periods. The northbound and southbound approaches are high-speed approaches (88 kph, or 55 mph) with set-back detectors located 123 meters (405 feet) back from the stop bar. Figure 5 is an aerial view of the test bed with vehicle detectors indicated.
All loops shown in Figure 5 are 6-foot-round preformed in-ductive loops. Stop bar loops shown in Figure 5 are tied together in various series configurations (series loops are separated by 9 feet), and each lane operates on an individual amplifier and lead-in cable. All loop amplifiers assigned to stop bar loops have both a presence and a count output. All setback loops also operate on a lane-by-lane basis. On the northbound approach, which has two sets of setback loops in each lane, the loops in each lane operate independently of each other and on a lane-by-Iane basis. Intersection operation is driven by the presence output of both stop bar and setback detectors.
CONTROLLER IMPLEMENTATION
On July 24, 2006, the ASC/3 controller with enhanced software was implemented at the test bed. During the study period, while data were collected in the controller, independent data collection units and video were also used at the intersection to allow verification of the data collected by the controller. After
approximately 40 hours of operation, data were retrieved from the controller, and performance plots were prepared showing equivalent hourly volume served, progression quality, vehicu-lar delay, and v/c ratios. To verify the accuracy of the data log-ger in the ASC/3 controller, all data collected by the controller were compared with data collected independently by the data collection units. Data from the ASC/3 controller were bench-marked against data from the data collection units to validate the new ASC/3 controller data collection system.
Equivalent Hourly Volume
With cycle-by-cycle data, the equivalent hourly volume can be calculated as follows:
(1)
whereEHV = equivalent hourly volume,C = cycle length, andv = served volume.
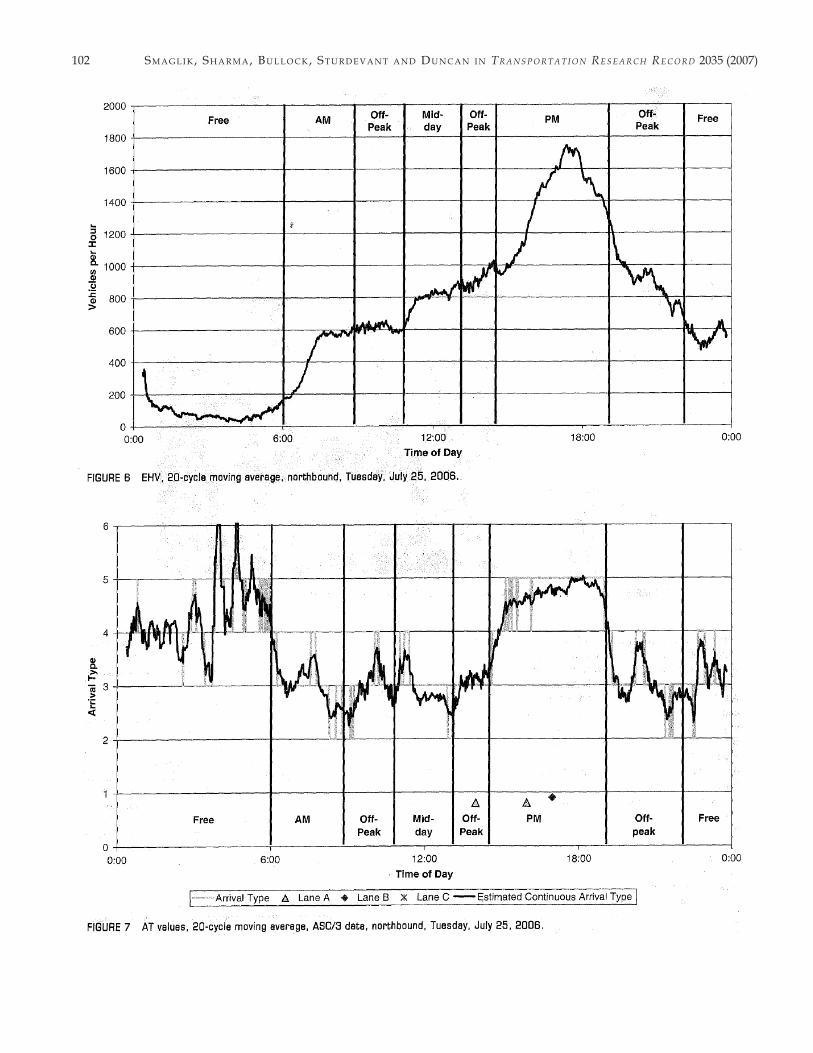
This performance measure provides information regarding the volume on a movement at any point during the day, with a metric that can be easily compared from intersection to in-tersection and between movements at an intersection. Figure 6 shows the EHV calculated from cycle-by-cycle data collected by the ASC/3 controller The data collected during undersatu-rated conditions. During oversaturated periods, the EHV will effectively max out toward the capacity of the movement, since it is essentially served volume. The 20-cycle moving average presented in Figure 6 was calculated as follows:
(2)
where veh is vehicles served in cycle i and C is the cycle length of cycle i.
Arrival-Type Data
The HCM uses the arrival-type (AT) parameter to describe the quality of progression. To calculate the AT of all approach ve-hicle arrival must be collected and binned into cycle-by-cycle intervals as shown in Figure 3, along with collection of green durations and cycle lengths. A vehicle arrival is defined as the time when the vehicle passes over the advance detectors shown in Figure 4. Vehicle arrivals for calculating AT data must come from setback detectors, since vehicle arrivals cannot be col-lected from stop bar detectors once the first vehicIe arrives at the stop bar. Vehicle arrival data are then input into the HCM equation for platoon ratio and assigned an AT ranging from 1 (Rp less than 0.50) to 6 (Rp greater than 2.00) by using HCM Ex-hibit 15-4 (1, 12)
(3)
where P is the percent of vehicles arriving on green and g is the length of the green indication.
ev e n t-Ba S e d da t a co l l e c t i o n f o r ge n e r a t i n g ac t u a t e d Pe r f o r m a n c e co n t r o l l e r me a S u r e S 101
In addition to classification of AT between 1 and 6, an es-timated continuous AT can be calculated by using a piece-wise continuous relationship between the platoon ratio and AT. For example, a platoon ratio of 0.5 is the threshold be-tween AT 1 and AT 2, and a platoon ratio of 0.85 is the thresh-old between AT 2 and AT 3. Linear interpolation is used be-tween these thresholds to provide a continuous estimate of AT based on the platoon ratio. Both the classified AT and esti-mated continuous AT are shown in Figure 7. Cycles in which arrivals were queued over the upstream detector (Figure 4) are shown as a triangle, diamond, or star in Figure 7. Calcu-lated ATs were averaged over a 20-cycle moving average to remove noise from the data. The value of 20 cycles was cho-sen for smoothing purposes, removing enough noise to allow for easier examination of the data without removal of rele-vant fluctuations.
The vertical lines shown in Figure 7 represent changes in time-of-day plans. This plot can be quickly examined to assess the progression performance of an intersection and investigate the impact of split and offset changes as these plans change throughout the day. The data presented in Figure 7 were col-lected during undersaturated conditions. As the study move-ment becomes oversaturated, this methodology will underesti-
mate vehicle arrivals red, since the queue will likely pass well beyond the setback detection area.
Delay Data
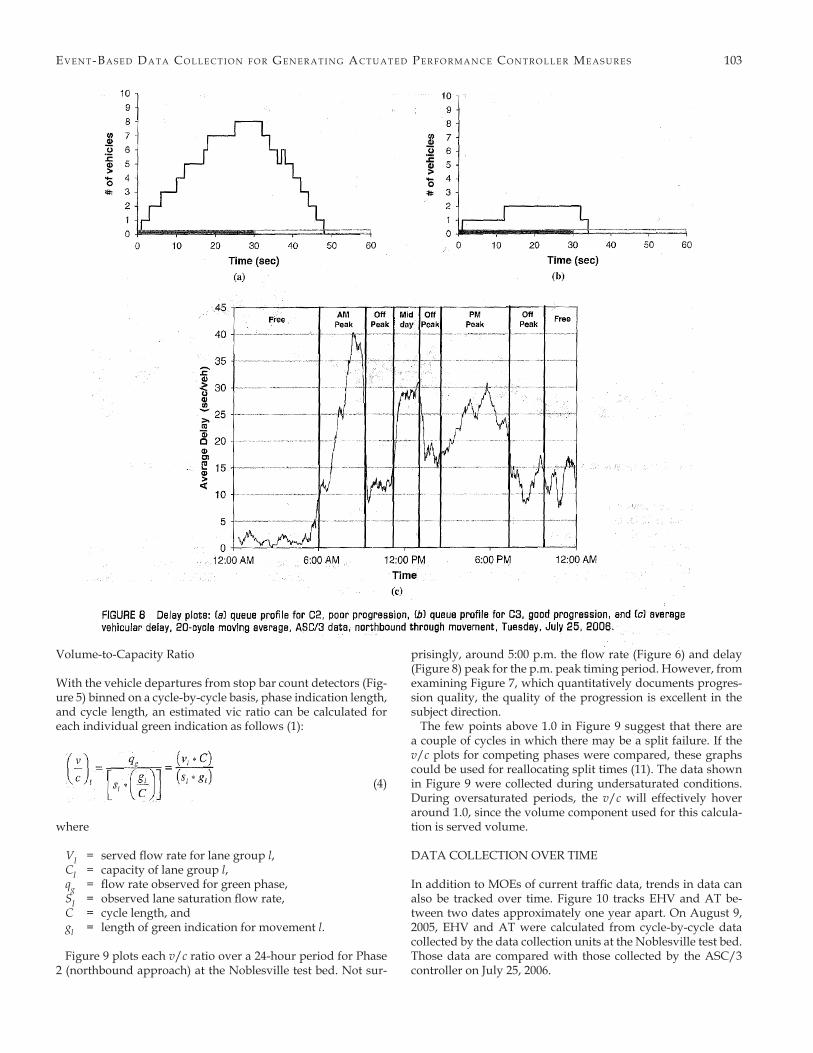
The same event data used to assess vehicle progression can be used to estimate vehicular delay. With arrival and departure profiles, average vehicular delay per cycle can be calculated (13, 14). Figure 8a and b shows the queue profiles for C2 and C3 in Figure 3, representing poor progression and good pro-gression, respectively. The queue profile represents the vehicle delay during each cycle and is calculated on the basis of both the arrival profile and the departure profile. The arrival profile is based on vehicle arrivals over setback detectors (Figures 4 and 5), whereas the departure profile is based on the saturation flow rate of vehicle departures over stop bar detectors (Figure 5). The area under the queue profile is the average vehicular delay during the cycle. Figure 8c is a 24-hour plot of average vehicular delay on a cycle-by-cycle basis, plotted by using a 20-cycle moving average. Obviously, if traffic queues.over the advance detector during oversaturated conditions, there can be significant errors in estimated delay because the arrival flows must be estimated, not observed.
102 Sm a g l i k, Sh a r m a, Bu l l o c k, St u r d e v a n t a n d du n c a n i n Tr a n s p o r T a T i o n re s e a r c h re c o r d 2035 (2007)
ev e n t-Ba S e d da t a co l l e c t i o n f o r ge n e r a t i n g ac t u a t e d Pe r f o r m a n c e co n t r o l l e r me a S u r e S 103
Volume-to-Capacity Ratio
With the vehicle departures from stop bar count detectors (Fig-ure 5) binned on a cycle-by-cycle basis, phase indication length, and cycle length, an estimated vic ratio can be calculated for each individual green indication as follows (1):
(4)
where
VI = served flow rate for lane group l,CI = capacity of lane group l,qg = flow rate observed for green phase,SI = observed lane saturation flow rate,C = cycle length, andgl = length of green indication for movement l.
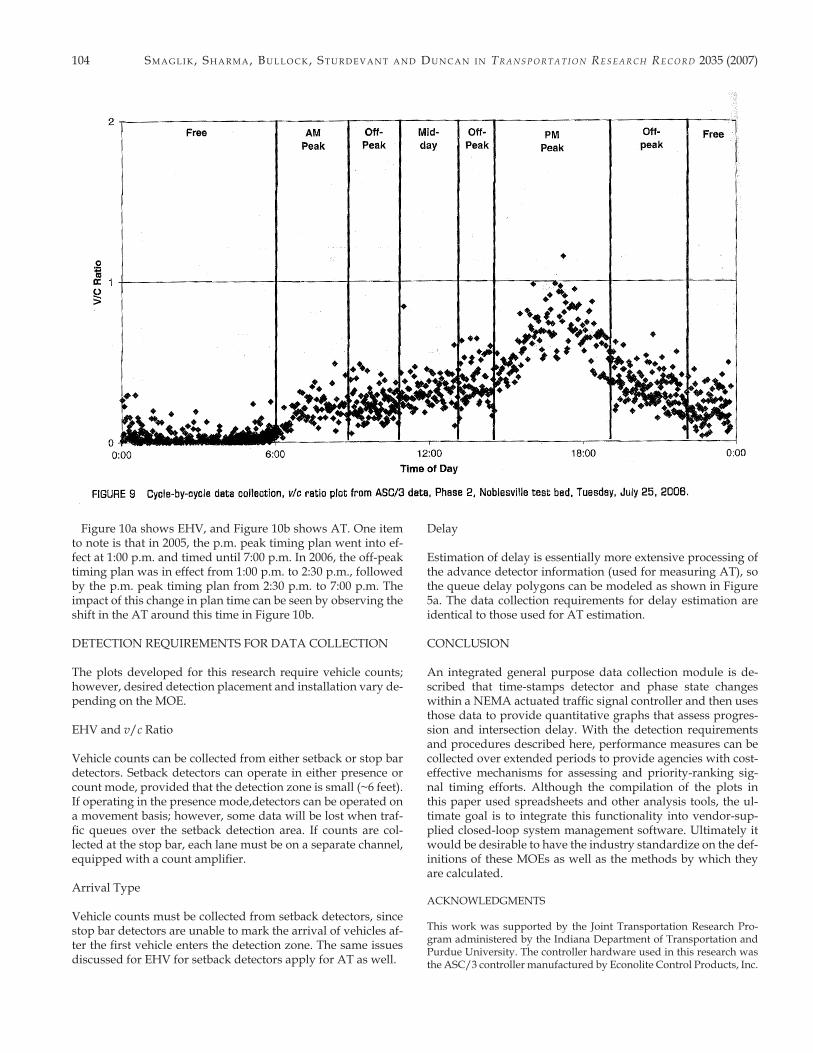
Figure 9 plots each v/c ratio over a 24-hour period for Phase 2 (northbound approach) at the Noblesville test bed. Not sur-
prisingly, around 5:00 p.m. the flow rate (Figure 6) and delay (Figure 8) peak for the p.m. peak timing period. However, from examining Figure 7, which quantitatively documents progres-sion quality, the quality of the progression is excellent in the subject direction.
The few points above 1.0 in Figure 9 suggest that there are a couple of cycles in which there may be a split failure. If the v/c plots for competing phases were compared, these graphs could be used for reallocating split times (11). The data shown in Figure 9 were collected during undersaturated conditions. During oversaturated periods, the v/c will effectively hover around 1.0, since the volume component used for this calcula-tion is served volume.
DATA COLLECTION OVER TIME
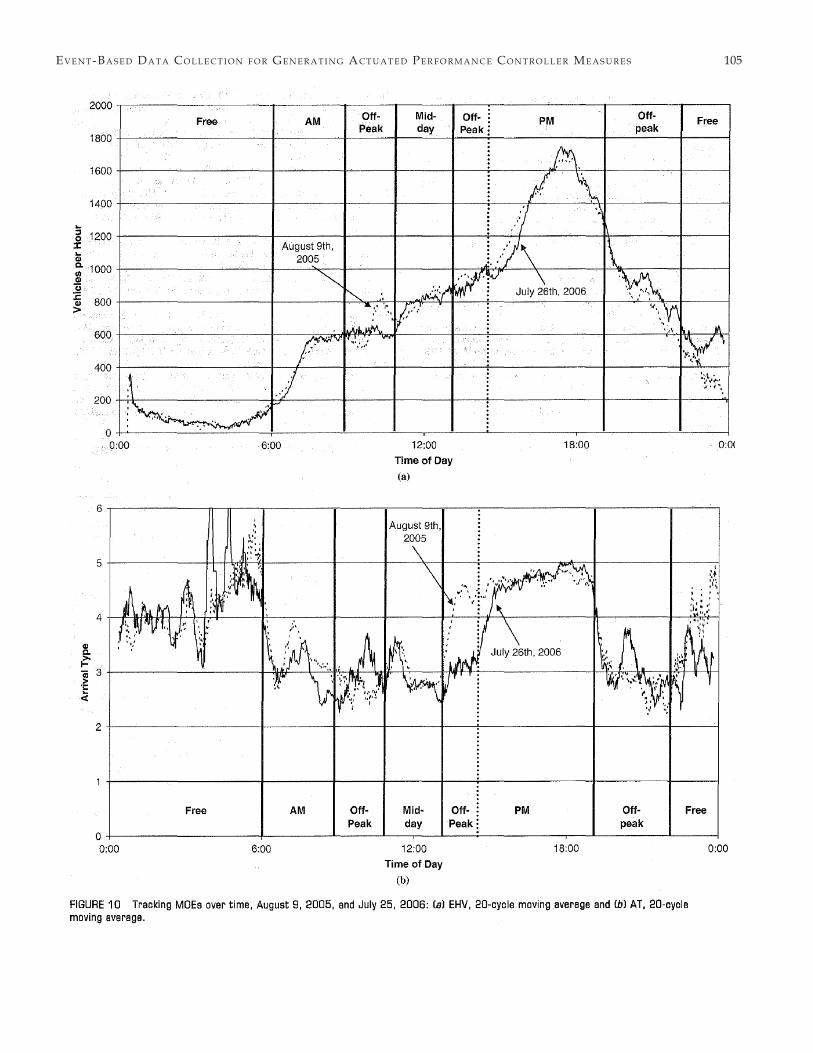
In addition to MOEs of current traffic data, trends in data can also be tracked over time. Figure 10 tracks EHV and AT be-tween two dates approximately one year apart. On August 9, 2005, EHV and AT were calculated from cycle-by-cycle data collected by the data collection units at the Noblesville test bed. Those data are compared with those collected by the ASC/3 controller on July 25, 2006.
104 Sm a g l i k, Sh a r m a, Bu l l o c k, St u r d e v a n t a n d du n c a n i n Tr a n s p o r T a T i o n re s e a r c h re c o r d 2035 (2007)
Figure 10a shows EHV, and Figure 10b shows AT. One item to note is that in 2005, the p.m. peak timing plan went into ef-fect at 1:00 p.m. and timed until 7:00 p.m. In 2006, the off-peak timing plan was in effect from 1:00 p.m. to 2:30 p.m., followed by the p.m. peak timing plan from 2:30 p.m. to 7:00 p.m. The impact of this change in plan time can be seen by observing the shift in the AT around this time in Figure 10b.
DETECTION REQUIREMENTS FOR DATA COLLECTION
The plots developed for this research require vehicle counts; however, desired detection placement and installation vary de-pending on the MOE.
EHV and v/c Ratio
Vehicle counts can be collected from either setback or stop bar detectors. Setback detectors can operate in either presence or count mode, provided that the detection zone is small (~6 feet). If operating in the presence mode,detectors can be operated on a movement basis; however, some data will be lost when traf-fic queues over the setback detection area. If counts are col-lected at the stop bar, each lane must be on a separate channel, equipped with a count amplifier.
Arrival Type
Vehicle counts must be collected from setback detectors, since stop bar detectors are unable to mark the arrival of vehicles af-ter the first vehicle enters the detection zone. The same issues discussed for EHV for setback detectors apply for AT as well.
Delay
Estimation of delay is essentially more extensive processing of the advance detector information (used for measuring AT), so the queue delay polygons can be modeled as shown in Figure 5a. The data collection requirements for delay estimation are identical to those used for AT estimation.
CONCLUSION
An integrated general purpose data collection module is de-scribed that time-stamps detector and phase state changes within a NEMA actuated traffic signal controller and then uses those data to provide quantitative graphs that assess progres-sion and intersection delay. With the detection requirements and procedures described here, performance measures can be collected over extended periods to provide agencies with cost-effective mechanisms for assessing and priority-ranking sig-nal timing efforts. Although the compilation of the plots in this paper used spreadsheets and other analysis tools, the ul-timate goal is to integrate this functionality into vendor-sup-plied closed-loop system management software. Ultimately it would be desirable to have the industry standardize on the def-initions of these MOEs as well as the methods by which they are calculated.
ACKNOWLEDGMENTS
This work was supported by the Joint Transportation Research Pro-gram administered by the Indiana Department of Transportation and Purdue University. The controller hardware used in this research was the ASC/3 controller manufactured by Econolite Control Products, Inc.
ev e n t-Ba S e d da t a co l l e c t i o n f o r ge n e r a t i n g ac t u a t e d Pe r f o r m a n c e co n t r o l l e r me a S u r e S 105
106 Sm a g l i k, Sh a r m a, Bu l l o c k, St u r d e v a n t a n d du n c a n i n Tr a n s p o r T a T i o n re s e a r c h re c o r d 2035 (2007)
REFERENCES
1. Highway Capacity Manual. 2000. Transportation Research Board, Na-tional Research Council, Washington, D.C.
2. Smaglik, E. J. Enhanced Tactical and Strategic Control Methods for Traf-fic Signal Operation. 2005. Doctoral dissertation. Purdue University, West Lafayette, Indiana.
3. Milazzo, J., R. S. Foyle, T. Rhoulac, K. Tanaka, C. Thompson, T. Delk, B. Forbis, S. Hill and S. McDonald. Overcoming Obstacles to the Use of Traffic Signal Detector Data for Traffic Forecasting. 2001. North Carolina Department of Transportation, Raleigh.
4. Chen, C., K. Petty, A. Skabardonis, P. Varaiya and Z. Jia. Freeway Performance Measurement System: Mining Loop Detector Data. 2001. Transportation Research Record: Journal of the Transportation Re-search Board, No. 1748: 96-102.
5. ITS Data Archiving: Case Study Analyses of San Antonio TransGuide Data. 1999. Texas Transportation Institute, Texas A & M University System, College Station.
6. Balke, K. N., H. Charara and R. Parker. Development of a Traffic Signal Performance Measurement System. May 2005. TTI Report 0-04422-2. Texas Transportation Institute, College Station.
7. Abbas, M., D. Bullock and L. Head. Real-Time Offset Transitioning Algorithm for Coordinating Traffic Signals. 2001. Transportation Re-search Record: Journal of the Transportation Research Board, No. 1748: 26-39.
8. Abbas, M., D. Bullock and A. Rhodes. Comparative Study of Theo-retical, Simulation, and Field Platoon Data. 2001. Traffic Engineering and Control, Vol. 42, No.7.
9. Luyanda, F., D. Gettman, S. Shelby, L. Head, D. Bullock and P. Mir-chandani. ACS-Lite Algorithmic Architecture: Applying Adaptive Control System Technology to Closed-Loop Traffic Signal Control Systems. 2004. Transportation Research Record: Journal of the Transpor-
tation Research Board, No. 1856: 175-184.10. Smaglik, E. J., D. M. Bullock and T. Urbanik Evaluation of Lane-
by Lane Vehicle Detection for Actuated Controllers Serving Multi-lane Approaches. 2005. Transportation Research Record: Journal ofthe Transportation Research Board, No. 1925: 123-133.
11. Smaglik, E. J., D. M. Bullock, and T. Urbanik II. Adaptive Split Con-trol Using Enhanced Detector Data. 2005. Proceedings, ITE Interna-tional Annual Meeting and Exhibit, Paper AB05H-11, Melbourne, Australia.
12. Smaglik, E. J., D. M. Bullock and A. Sharma. A Pilot Study on Real-Time Calculation of Arrival Type for Assessment of Arterial Per-formance. July 2007. Journal of Transportation Engineering, Vol. 133, No.7.
13. Sharma, A., D. M. Bullock and J. A. Bonneson. Input-Output and Hybrid Techniques for Real-Time Prediction of Delay and Maxi-mum Queue Length at Signalized Intersections. 2007. Transporta-tion Research Record: Journal of the Transportation Research Board, No. 2035: 69-80.
14. Bonneson J., D. Bullock, P. Koonce, D. Middleton, A. Sharma and M. Vandehay. Review of Techniques for Urban Street Performance Measurement. 2006. NCHRP Project 3-79, Quarterly Progress Report. Texas Transportation Institute, Texas A & M University System, College Station.
The contents of this paper reflect the views of the authors, who are re-sponsible for the facts and the accuracy of the data presented, and do not necessarily reflect the official views or policies of the Federal High-way Administration and the Indiana Department of Transportation, nor do the contents constitute a standard, specification, or regulation.
The Traffic Signal Systems Committee sponsored publication of this paper.