Embed Size (px)
Citation preview
ORIGINAL PAPER
Evidence for a psychotic posttraumatic stress disorder subtypebased on the National Comorbidity Survey
Mark Shevlin • Cherie Armour • Jamie Murphy •
James E. Houston • Gary Adamson
Received: 17 November 2009 / Accepted: 20 August 2010 / Published online: 2 September 2010
� Springer-Verlag 2010
Abstract
Purpose This study assessed the distribution of post-
traumatic stress disorder (PTSD) symptoms and psychosis
indicators among a large sample of individuals with a
lifetime diagnosis of PTSD. The identification of a psy-
chotic PTSD subtype was also predicted.
Method Using data from the National Comorbidity Sur-
vey a latent class analysis was conducted on the PTSD
symptoms of intrusion, avoidance, and hyperarousal and
the psychosis hallucination and delusion indicators.
Results Results indicated four latent classes, two of
which had relatively high probabilities of endorsing the
hallucination and delusion indicators. These classes were
associated with a broad range of traumatic experiences.
One particular class had high probabilities of endorsing
both the psychosis indicators and the PTSD symptoms and
was associated with a broad range of comorbid psychiatric
disorders.
Conclusion There was a candidate class that met the
characteristics expected to be evident in a psychotic PTSD
subtype.
Keywords Psychotic PTSD � Community sample �Latent class analysis
Introduction
The Diagnostic and Statistical Manual of Mental Disorders
(DSM-IV) [1] defines the symptoms of posttraumatic stress
disorder (PTSD) in terms of exposure to a traumatic event.
However, there is a growing research literature that has
also identified associations between trauma (especially
early traumatic experience) and diagnoses of psychosis or
the occurrence of psychotic-like experiences [2–6]. The
high rates of psychotic disorder and psychotic symptoms in
PTSD populations [7–9], the phenomenological similarity
of some PTSD and psychotic symptoms [10], and the
shared etiology associated with both forms of psychopa-
thology [11] have led to suggestions of a ‘psychotic PTSD’
subtype.
Sautter et al. [12] identified a group of war veterans who
met the DSM-IV criteria both for psychotic disorder and
for PTSD. This psychotic PTSD group had significantly
higher scores on measures of depression, aggression, and
general psychopathology compared to those with PTSD or
psychosis alone. Ivezic et al. [13] reported that war veter-
ans who experienced PTSD with psychotic symptoms had
high levels of comorbid depression, delusional disorder,
and anxiety disorder. Also, based on a community sample,
Sareen et al. [14] reported an increased likelihood of psy-
chotic symptom experience in individuals who had a life-
time diagnosis of PTSD. In addition this group had
significantly higher probabilities of meeting the criteria for
other psychiatric disorders. These and other studies have
shown that psychotic PTSD groups generally have lower
levels of functioning and higher levels of other psychiatric
problems. While the psychotic PTSD groups in these
studies did not require symptoms to present in any partic-
ular temporal order, Braakman et al. [15] proposed a new
diagnostic entity, PTSD with secondary psychotic features
M. Shevlin (&) � C. Armour � J. Murphy � G. Adamson
School of Psychology, University of Ulster at Magee,
Londonderry BT48 7JL, Northern Ireland, UK
e-mail: [email protected]
J. E. Houston
Nottingham Trent University, Nottingham, UK
123
Soc Psychiatry Psychiatr Epidemiol (2011) 46:1069–1078
DOI 10.1007/s00127-010-0281-4
(PTSD-SP), which was characterized by psychotic symp-
toms which were emergent after the onset of PTSD. This
new entity was shown to be associated with a broad range
of comorbid diagnoses.
Many studies alluding to a psychotic PTSD subtype
have been based on the small samples of war veterans [9,
13, 16, 17] making generalizations to other trauma cohorts
difficult. In addition, many studies have used different
assessments in order to classify individuals. Furthermore,
the criteria for psychotic PTSD have been predefined by
the researchers and differ across studies. For example, in
some studies psychotic PTSD was based on the diagnosis
of both PTSD and psychotic disorder [12], whereas other
studies only required some psychotic symptoms to be
present [14].
The primary aim of this study was to test if there was a
homogeneous group of individuals who could be described
in terms of a psychotic PTSD subtype, rather than simply
PTSD with comorbid psychosis. The identification of
homogenous groups, or latent classes, was based on the
latent class analysis (LCA). This analysis allows different
classes (groups) to be objectively identified based on the
patterns of symptom endorsement rather than a priori
definitions imposed by researchers. This study utilized the
same community sample as Sareen et al. [14] who created a
‘‘PTSD with psychotic symptoms’’ group based on a
diagnosis of PTSD and the endorsement of one or more
psychosis indicators. The LCA approach in this study
extended this analysis as it (1) included multiple psychosis
indicators to assess which particular types of psychotic
experience were most commonly endorsed; (2) explicitly
tested for a homogeneous group characterized by a high
probability of psychosis and PTSD symptom endorsement;
(3) allowed for an estimate of the size of such a group; and
(4) estimated the probability of endorsing each psychosis
and PTSD symptom within the group. On the basis of
previous research it was hypothesized that a psychotic
PTSD class would, firstly, be characterized by high prob-
abilities of endorsing both PTSD symptoms and psychosis
indicators. Importantly, psychotic PTSD classes would
have to be qualitatively different, rather than just quanti-
tatively different, from other classes in order to be judged
distinct; classes differing only quantitatively would repre-
sent groups of individuals who differed only in terms of an
underlying continuum of severity.
The second aim of the study was to assess the rela-
tionship between the psychotic PTSD subtype and a range
of traumatic experiences. Variables representing a broad
range of traumatic experiences were used to determine if
there were specific traumas that were associated with
psychotic PTSD. It was also predicted that a psychotic
PTSD subtype would have an increased risk of other
comorbid psychiatric diagnoses compared to non-psychotic
classes. In order for a psychotic PTSD class to be consid-
ered qualitatively, rather than just quantitatively different
from non-psychotic PTSD classes, the odds ratios across
the classes should not indicate a graded response.
Methods
The National Comorbidity Survey (NCS) [18] was a
collaborative epidemiologic investigation (1990–1992)
based on a stratified, multi-stage, area probability sample
of non-institutionalized persons aged between 15 and
54 years. The NCS was conducted across 48 coterminous
states of America and was designed to study the preva-
lence and correlates of DSM-III-R [19] disorders. The
initial survey employed a household sample of over 8,000
respondents and a sub-sample of the original respondents
completed the additional NCS Part II survey (N = 5,877)
that contained a further detailed risk factor battery and
additional diagnoses. Of this sample 48% were male, the
average age was 32 years. A full description of the NCS
is available [18].
Participants
Based on the NCS Part II survey there were 591 partic-
ipants with a lifetime diagnosis of PTSD which repre-
sented a weighted prevalence of 7.3%. The full NCS
population sample had 66 participants with a lifetime
diagnosis of psychosis which represented a weighted
prevalence of 0.7%. There was a positive association
between PTSD and psychosis diagnosis (v2 = 25.89,
df = 1, p = 0.00) with 19 participants receiving a life-
time diagnosis of PTSD and psychosis. This represented
3.2% of the sub-sample of participants who had a lifetime
diagnosis of PTSD.
Subsequent analyses were based on those participants
with a lifetime diagnosis of PTSD after excluding those
with a lifetime diagnosis of psychosis. This sample
(N = 568) had a mean age of 33.55 years (SD = 9.97).
There were more females (69.2%) than males in the PTSD
sample compared to the non-PTSD participants (50.1%)
and this was statistically significant (v2 = 75.05, df = 1,
p = 0.00).
Measurements
Information on symptoms of PTSD, psychosis indicators,
demographic variables, traumatic experiences and other
diagnoses was derived from The Composite International
Diagnostic Interview (CIDI) [20]. The CIDI is a fully
structured interview that produced diagnoses according to
the definitions and criteria of the DSM-III-R [19].
1070 Soc Psychiatry Psychiatr Epidemiol (2011) 46:1069–1078
123
Posttraumatic stress disorder
The Posttraumatic Stress Disorder module of the CIDI
(Section U) was used for the diagnosis of lifetime PTSD
based on the DSM-III-R criteria. Factor analytic research
has suggested that there are eight symptoms, currently
associated with the PTSD diagnosis, that are non-specific
to PTSD, but instead measure dysphoria [21]. Subsequent
studies have reported very high correlations between the
dysphoria factor and measures of depression [22] and low
associations with measures of trauma [23]. Indeed, when
depression scores are controlled for the factor loadings for
the dysphoria factor (and the correlation between the dys-
phoria factor and other PTSD factors) are significantly
attenuated [22]. These findings have led to suggestions for
the removal of the dysphoria symptoms from the list of
PTSD diagnostic criteria [24, 25]. Furthermore, research on
the phenomenological similarity of PTSD and psychotic
symptomologies has focused on the symptoms of intrusion
and hyperarousal [26]. For these reasons, and also to
reduce the number of variables in the analysis, the nine
symptoms that comprised the intrusion (B1–B5), avoidance
(C1, C2), and hyperarousal (D1, D2) symptom clusters
were selected.
The items were as follows:
1. (B1) Did you keep remembering the event when you
did not want to?
2. (B2) Did you keep having dreams or nightmares about
it afterwards?
3. (B3) Did you ever suddenly act or feel as though the
event was happening again, even though it wasn’t?
4. (B4) Did you ever get very upset when you were in a
situation that reminded you of it?
5. (B5) Did you sweat or did your heart beat fast, or did
you tremble when reminded of the upsetting
experience?
6. (C1) Did you try hard not to think about it?
7. (C2) Did you go out of your way to avoid situations
that might remind you of the event?
8. (D4) Did you become overly concerned about danger
or overly careful?
9. (D5) Did you become jumpy or easily startled by
ordinary noises or movements?
Psychosis
The psychosis screening section of the CIDI (Section K)
contained 13 items related to classic psychotic-like symp-
toms involving, for example, persecution, thought inter-
ference, and hallucinations. Items were responded to using
a simple ‘yes’ or ‘no’ response format. The CIDI was used
to assess the lifetime prevalence of non-affective psychosis
(a summary category made up of schizophrenia, schizo-
phreniform disorder, schizoaffective disorder, delusional
disorder, and atypical psychosis). The diagnosis of psy-
chosis was based on the clinical reinterviews administered
by experienced clinicians using an adapted version of
the Structured Clinical Interview for DSM-III-R (SCID)
[27].
For this study eight items were selected that represented
hallucinations and delusions. The items were as follows:
1. (Spy) Believed that people were spying on you or
following you?
2. (Pois) Believed that you were being secretly tested or
experimented on, that someone was plotting against
you, or that someone was trying to poison you or hurt
you?
3. (Mess) Believed that you were being sent special
messages through television or the radio, or that a
program had been arranged just for you alone?
4. (Hyp) Felt strange forces working on you, as if you
were being hypnotized or magic was being per-
formed on you, or you were being hit by laser beams
or X-rays?
5. (Vis) Experience of seeing something or someone that
others present could not see—that is, had a vision
when you were wide awake?
6. (Aud) Experience of hearing things that other people
could not hear, such as noises or a voice?
7. (Olfac) Bothered by strange smells around you that
nobody else was able to smell, perhaps even odors
coming from your own body?
8. (Tact) Unusual feelings inside or on your body, like
being touched when nothing was there or feeling
something moving inside your body?
Demographics
The following background variables, or demographic fac-
tors, were used in this study: age, sex (0 = male,
1 = female), ethnicity (0 = non-white, 1 = white), edu-
cation (0 = less than 16 years education, 1 = ?16 years
education), annual income (0 = $19,000 or more, 1 = less
than $19,000), household composition (0 = does not live
alone, 1 = lives alone).
Traumatic experiences
During the administration of the PTSD module, partici-
pants were provided with a booklet which listed the trau-
matic experiences. Each trauma was numbered and
participants were asked to identify the number of the event
rather than naming it. This has been shown to increase
participant’s willingness to report such information [28].
Soc Psychiatry Psychiatr Epidemiol (2011) 46:1069–1078 1071
123
The traumatic experiences were as follows:
1. You had direct combat experience in a war
2. You were involved in a life-threatening accident
3. You were involved in a fire, flood, or natural disaster
4. You witnessed someone being badly injured or killed
5. You were raped (someone had sexual intercourse
with you when you did not want to by threatening
you or using some degree of force)
6. You were sexually molested (someone touched or
felt your genitals when you did not want them to)
7. You were seriously physically attacked or assaulted
8. You were physically abused as a child
9. You were seriously neglected as a child
10. You were threatened with a weapon, held captive, or
kidnapped
Clinical variables
The CIDI lifetime diagnoses (with hierarchy) of a range of
clinical variables were used: alcohol dependence, drug
dependence, major depression, bipolar disorder, mania, and
generalized anxiety disorder. World Health Organization
field trials of the CIDI have documented good inter-rater
reliability, [29, 30] test–retest reliability [31–33], and
validity of almost all diagnoses [33].
Analysis
Analyses were conducted in three phases. First, a latent class
analysis (LCA) was conducted to determine the correct
number of classes. LCA is a statistical method used to
identify homogeneous groups, or classes, from categorical
multivariate data. In this study, LCA was employed to
determine the number and nature of classes based on the
responses to the nine PTSD items and eight psychosis
screening items. All the variables were declared as cate-
gorical and the model parameters were estimated using
robust maximum likelihood. There was very little missing
data (lowest pairwise covariance coverage was 0.97) and this
was treated using full information maximum likelihood
estimation under the assumption of data missing at random
[34]. The fit of five models (a 2-class model through to a
6-class model) was assessed. Selection of the optimal
number of latent classes was based on the several statistical
fit indices. The statistical fit indices were: Akaike informa-
tion criterion (AIC) [35], Bayesian information criterion
(BIC) [36], sample-size adjusted BIC (ssaBIC) [37], the
bootstrapped likelihood ratio test (BSLRT) [38], and entropy
measures [39]. The information statistics AIC, BIC, and
ssaBIC are goodness-of-fit measures used to compare com-
peting models; lower observed values indicate better fit. The
bootstrap likelihood ratio test was used to compare models
with increasing numbers of latent classes. When a non-sig-
nificant value (p [ 0.05) occurs it suggests that the model
with one less class should be accepted. Entropy is a stan-
dardized measure of how accurately participants are classi-
fied. Entropy values can range from 0 to 1 with higher values
indicating better classification. Recent research has sug-
gested that the BSLRT is the best method for determining the
correct number of classes [40, 41]. In order to use the BSLRT
no weighting variable was used in the part of the analysis.
Second, covariates (demographic variables and traumas)
were added to the model to examine which variables sig-
nificantly predicted class membership. The parameters
linking the covariates with the latent classes were multi-
nomial logistic regression coefficients presented as odds
ratios. Third, the classes were used to predict the clinical
variables. The posterior probabilities from the LCA model
were used to create a variable that assigned each partici-
pant to their most likely class. This variable was then
dummy-coded and used as a predictor variable in a model
with the clinical variables entered as dependent variables.
All analyses were conducted using Mplus 4.21 [41] and the
appropriate weighting variable was used in the second and
third phase of the analyses.
Results
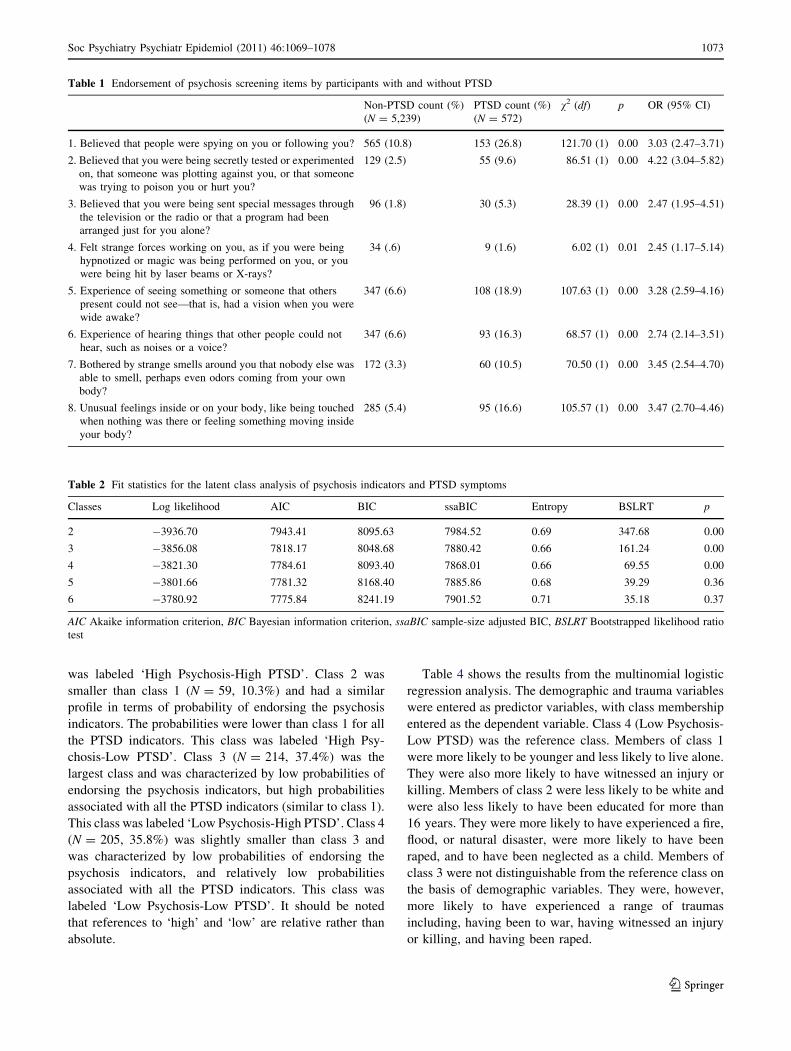
Table 1 shows the frequencies of endorsing the psychosis
screening items for the PTSD and the non-PTSD samples.
The chi-square results show that endorsement of all psy-
chosis items were significantly higher for the PTSD sample
than for the non-PTSD sample. Each psychosis variable
was regressed on the PTSD variable using binary logistic
regression. The resultant odds ratios are reported. This
shows that having a diagnosis of PTSD increased the
likelihood of endorsing any of the psychosis items between
2.45 and 4.22 times.
The fit statistics for the LCA are presented in Table 2. The
4-class solution was considered to be the best fitting model.
The AIC and ssaBIC information statistics were markedly
lower for the 4-class solution compared to the 2- and 3-class
solutions, and the BSLRT indicates that the 5-class solution
is not significantly better than the 4-class solution (and so the
4-class solution should be preferred on the basis of parsi-
mony). The BIC for the 4-class solution is higher than that
for the 3-class solution although the difference is small. The
entropy value (0.66) indicates acceptable classification of
participants. The latent class profile plot is shown in Fig. 1
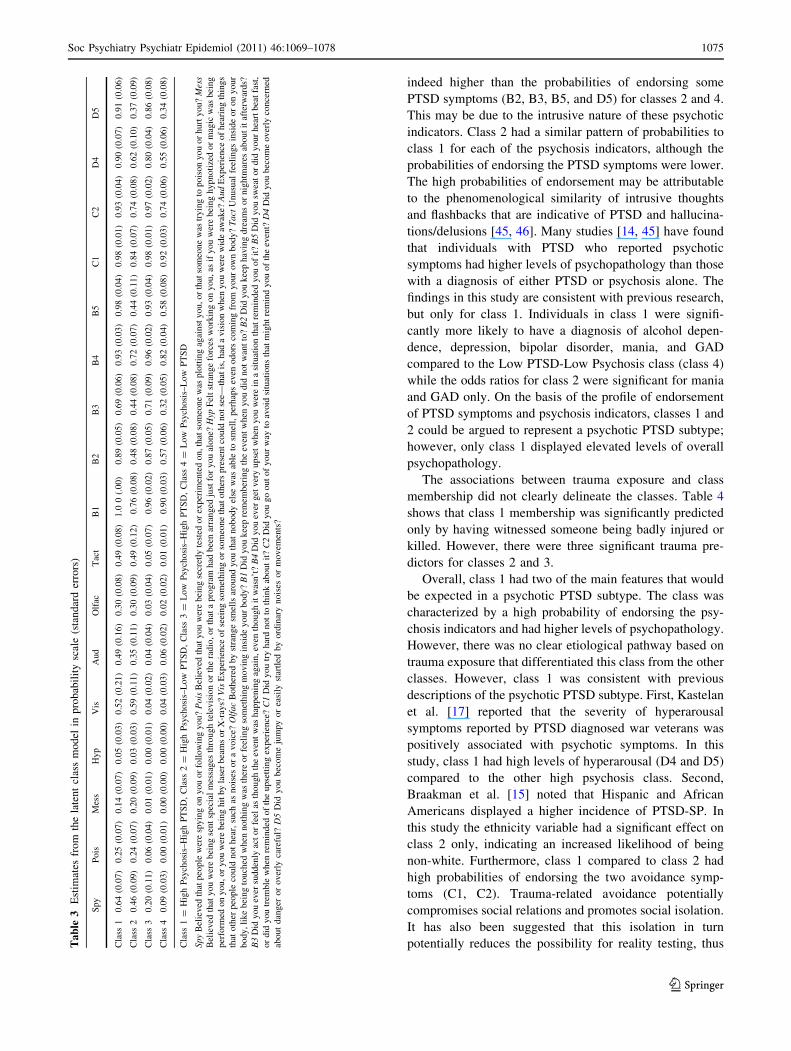
and the probabilities in Table 3.
Class 1 (N = 94, 16.4%) was characterized by relatively
high probabilities of endorsing two delusional indicators
(Spy and Poison), three hallucination indicators (visual,
olfactory, and tactile) and all PTSD indicators. This class
1072 Soc Psychiatry Psychiatr Epidemiol (2011) 46:1069–1078
123
was labeled ‘High Psychosis-High PTSD’. Class 2 was
smaller than class 1 (N = 59, 10.3%) and had a similar
profile in terms of probability of endorsing the psychosis
indicators. The probabilities were lower than class 1 for all
the PTSD indicators. This class was labeled ‘High Psy-
chosis-Low PTSD’. Class 3 (N = 214, 37.4%) was the
largest class and was characterized by low probabilities of
endorsing the psychosis indicators, but high probabilities
associated with all the PTSD indicators (similar to class 1).
This class was labeled ‘Low Psychosis-High PTSD’. Class 4
(N = 205, 35.8%) was slightly smaller than class 3 and
was characterized by low probabilities of endorsing the
psychosis indicators, and relatively low probabilities
associated with all the PTSD indicators. This class was
labeled ‘Low Psychosis-Low PTSD’. It should be noted
that references to ‘high’ and ‘low’ are relative rather than
absolute.
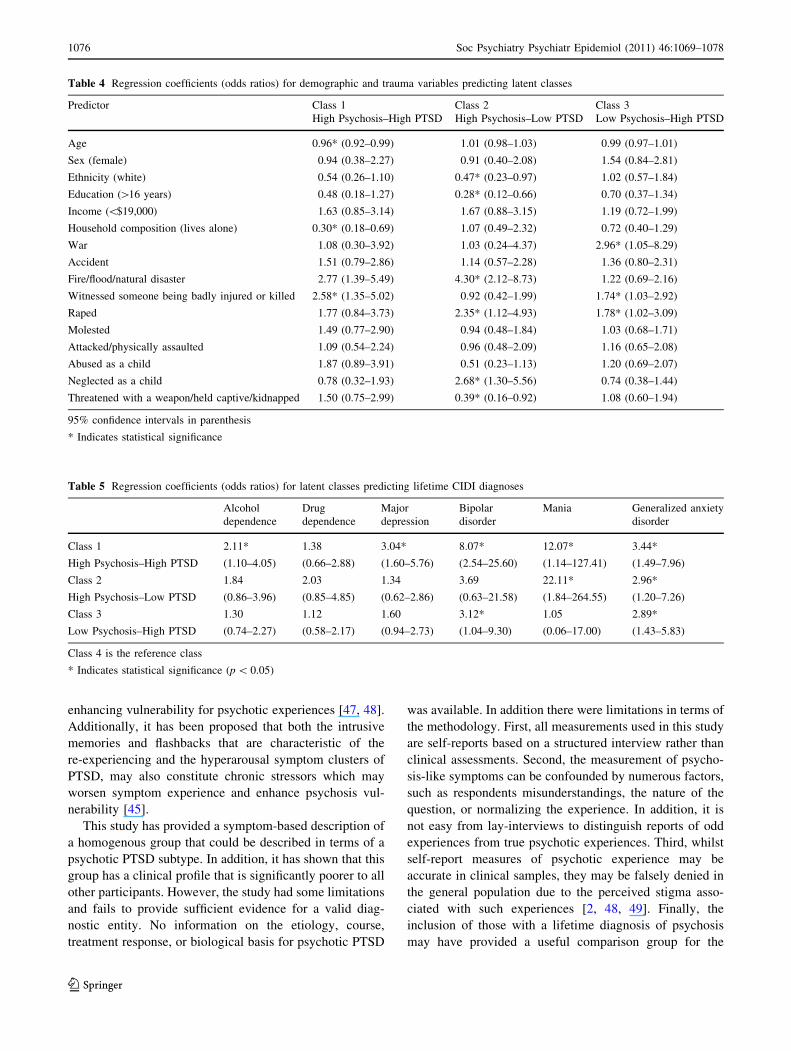
Table 4 shows the results from the multinomial logistic
regression analysis. The demographic and trauma variables
were entered as predictor variables, with class membership
entered as the dependent variable. Class 4 (Low Psychosis-
Low PTSD) was the reference class. Members of class 1
were more likely to be younger and less likely to live alone.
They were also more likely to have witnessed an injury or
killing. Members of class 2 were less likely to be white and
were also less likely to have been educated for more than
16 years. They were more likely to have experienced a fire,
flood, or natural disaster, were more likely to have been
raped, and to have been neglected as a child. Members of
class 3 were not distinguishable from the reference class on
the basis of demographic variables. They were, however,
more likely to have experienced a range of traumas
including, having been to war, having witnessed an injury
or killing, and having been raped.
Table 1 Endorsement of psychosis screening items by participants with and without PTSD
Non-PTSD count (%)
(N = 5,239)
PTSD count (%)
(N = 572)
v2 (df) p OR (95% CI)
1. Believed that people were spying on you or following you? 565 (10.8) 153 (26.8) 121.70 (1) 0.00 3.03 (2.47–3.71)
2. Believed that you were being secretly tested or experimented
on, that someone was plotting against you, or that someone
was trying to poison you or hurt you?
129 (2.5) 55 (9.6) 86.51 (1) 0.00 4.22 (3.04–5.82)
3. Believed that you were being sent special messages through
the television or the radio or that a program had been
arranged just for you alone?
96 (1.8) 30 (5.3) 28.39 (1) 0.00 2.47 (1.95–4.51)
4. Felt strange forces working on you, as if you were being
hypnotized or magic was being performed on you, or you
were being hit by laser beams or X-rays?
34 (.6) 9 (1.6) 6.02 (1) 0.01 2.45 (1.17–5.14)
5. Experience of seeing something or someone that others
present could not see—that is, had a vision when you were
wide awake?
347 (6.6) 108 (18.9) 107.63 (1) 0.00 3.28 (2.59–4.16)
6. Experience of hearing things that other people could not
hear, such as noises or a voice?
347 (6.6) 93 (16.3) 68.57 (1) 0.00 2.74 (2.14–3.51)
7. Bothered by strange smells around you that nobody else was
able to smell, perhaps even odors coming from your own
body?
172 (3.3) 60 (10.5) 70.50 (1) 0.00 3.45 (2.54–4.70)
8. Unusual feelings inside or on your body, like being touched
when nothing was there or feeling something moving inside
your body?
285 (5.4) 95 (16.6) 105.57 (1) 0.00 3.47 (2.70–4.46)
Table 2 Fit statistics for the latent class analysis of psychosis indicators and PTSD symptoms
Classes Log likelihood AIC BIC ssaBIC Entropy BSLRT p
2 -3936.70 7943.41 8095.63 7984.52 0.69 347.68 0.00
3 -3856.08 7818.17 8048.68 7880.42 0.66 161.24 0.00
4 -3821.30 7784.61 8093.40 7868.01 0.66 69.55 0.00
5 -3801.66 7781.32 8168.40 7885.86 0.68 39.29 0.36
6 -3780.92 7775.84 8241.19 7901.52 0.71 35.18 0.37
AIC Akaike information criterion, BIC Bayesian information criterion, ssaBIC sample-size adjusted BIC, BSLRT Bootstrapped likelihood ratio
test
Soc Psychiatry Psychiatr Epidemiol (2011) 46:1069–1078 1073
123
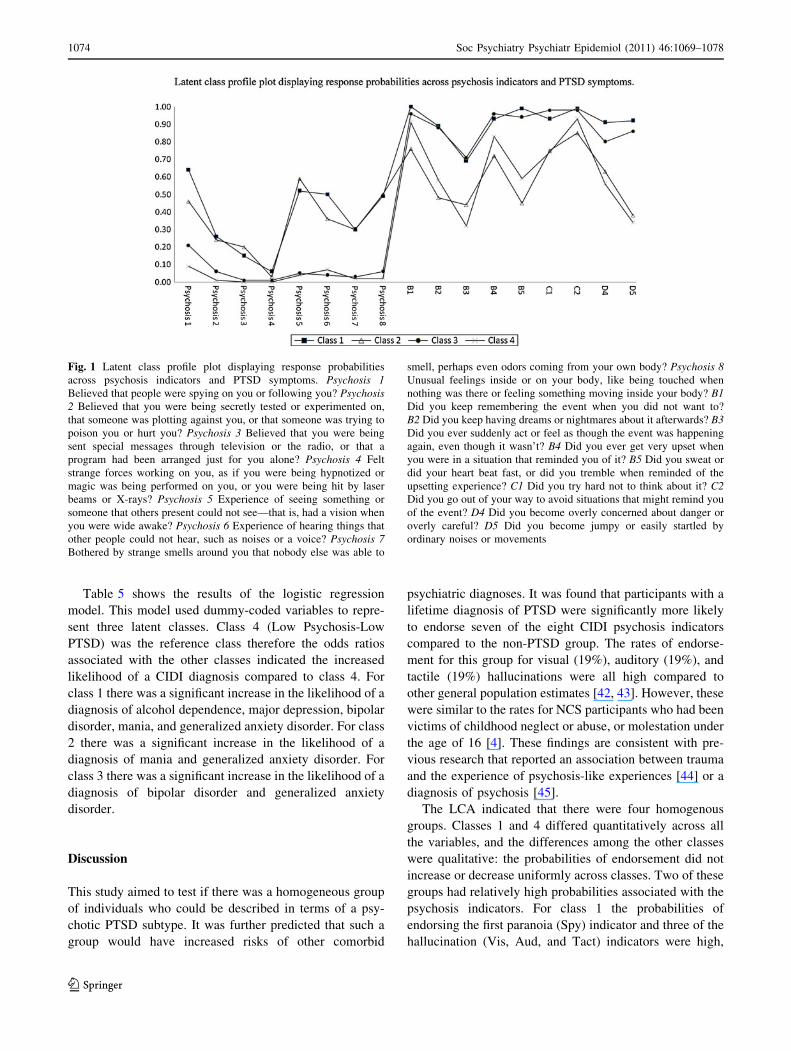
Table 5 shows the results of the logistic regression
model. This model used dummy-coded variables to repre-
sent three latent classes. Class 4 (Low Psychosis-Low
PTSD) was the reference class therefore the odds ratios
associated with the other classes indicated the increased
likelihood of a CIDI diagnosis compared to class 4. For
class 1 there was a significant increase in the likelihood of a
diagnosis of alcohol dependence, major depression, bipolar
disorder, mania, and generalized anxiety disorder. For class
2 there was a significant increase in the likelihood of a
diagnosis of mania and generalized anxiety disorder. For
class 3 there was a significant increase in the likelihood of a
diagnosis of bipolar disorder and generalized anxiety
disorder.
Discussion
This study aimed to test if there was a homogeneous group
of individuals who could be described in terms of a psy-
chotic PTSD subtype. It was further predicted that such a
group would have increased risks of other comorbid
psychiatric diagnoses. It was found that participants with a
lifetime diagnosis of PTSD were significantly more likely
to endorse seven of the eight CIDI psychosis indicators
compared to the non-PTSD group. The rates of endorse-
ment for this group for visual (19%), auditory (19%), and
tactile (19%) hallucinations were all high compared to
other general population estimates [42, 43]. However, these
were similar to the rates for NCS participants who had been
victims of childhood neglect or abuse, or molestation under
the age of 16 [4]. These findings are consistent with pre-
vious research that reported an association between trauma
and the experience of psychosis-like experiences [44] or a
diagnosis of psychosis [45].
The LCA indicated that there were four homogenous
groups. Classes 1 and 4 differed quantitatively across all
the variables, and the differences among the other classes
were qualitative: the probabilities of endorsement did not
increase or decrease uniformly across classes. Two of these
groups had relatively high probabilities associated with the
psychosis indicators. For class 1 the probabilities of
endorsing the first paranoia (Spy) indicator and three of the
hallucination (Vis, Aud, and Tact) indicators were high,
Fig. 1 Latent class profile plot displaying response probabilities
across psychosis indicators and PTSD symptoms. Psychosis 1Believed that people were spying on you or following you? Psychosis2 Believed that you were being secretly tested or experimented on,
that someone was plotting against you, or that someone was trying to
poison you or hurt you? Psychosis 3 Believed that you were being
sent special messages through television or the radio, or that a
program had been arranged just for you alone? Psychosis 4 Felt
strange forces working on you, as if you were being hypnotized or
magic was being performed on you, or you were being hit by laser
beams or X-rays? Psychosis 5 Experience of seeing something or
someone that others present could not see—that is, had a vision when
you were wide awake? Psychosis 6 Experience of hearing things that
other people could not hear, such as noises or a voice? Psychosis 7Bothered by strange smells around you that nobody else was able to
smell, perhaps even odors coming from your own body? Psychosis 8Unusual feelings inside or on your body, like being touched when
nothing was there or feeling something moving inside your body? B1Did you keep remembering the event when you did not want to?
B2 Did you keep having dreams or nightmares about it afterwards? B3Did you ever suddenly act or feel as though the event was happening
again, even though it wasn’t? B4 Did you ever get very upset when
you were in a situation that reminded you of it? B5 Did you sweat or
did your heart beat fast, or did you tremble when reminded of the
upsetting experience? C1 Did you try hard not to think about it? C2Did you go out of your way to avoid situations that might remind you
of the event? D4 Did you become overly concerned about danger or
overly careful? D5 Did you become jumpy or easily startled by
ordinary noises or movements
1074 Soc Psychiatry Psychiatr Epidemiol (2011) 46:1069–1078
123
indeed higher than the probabilities of endorsing some
PTSD symptoms (B2, B3, B5, and D5) for classes 2 and 4.
This may be due to the intrusive nature of these psychotic
indicators. Class 2 had a similar pattern of probabilities to
class 1 for each of the psychosis indicators, although the
probabilities of endorsing the PTSD symptoms were lower.
The high probabilities of endorsement may be attributable
to the phenomenological similarity of intrusive thoughts
and flashbacks that are indicative of PTSD and hallucina-
tions/delusions [45, 46]. Many studies [14, 45] have found
that individuals with PTSD who reported psychotic
symptoms had higher levels of psychopathology than those
with a diagnosis of either PTSD or psychosis alone. The
findings in this study are consistent with previous research,
but only for class 1. Individuals in class 1 were signifi-
cantly more likely to have a diagnosis of alcohol depen-
dence, depression, bipolar disorder, mania, and GAD
compared to the Low PTSD-Low Psychosis class (class 4)
while the odds ratios for class 2 were significant for mania
and GAD only. On the basis of the profile of endorsement
of PTSD symptoms and psychosis indicators, classes 1 and
2 could be argued to represent a psychotic PTSD subtype;
however, only class 1 displayed elevated levels of overall
psychopathology.
The associations between trauma exposure and class
membership did not clearly delineate the classes. Table 4
shows that class 1 membership was significantly predicted
only by having witnessed someone being badly injured or
killed. However, there were three significant trauma pre-
dictors for classes 2 and 3.
Overall, class 1 had two of the main features that would
be expected in a psychotic PTSD subtype. The class was
characterized by a high probability of endorsing the psy-
chosis indicators and had higher levels of psychopathology.
However, there was no clear etiological pathway based on
trauma exposure that differentiated this class from the other
classes. However, class 1 was consistent with previous
descriptions of the psychotic PTSD subtype. First, Kastelan
et al. [17] reported that the severity of hyperarousal
symptoms reported by PTSD diagnosed war veterans was
positively associated with psychotic symptoms. In this
study, class 1 had high levels of hyperarousal (D4 and D5)
compared to the other high psychosis class. Second,
Braakman et al. [15] noted that Hispanic and African
Americans displayed a higher incidence of PTSD-SP. In
this study the ethnicity variable had a significant effect on
class 2 only, indicating an increased likelihood of being
non-white. Furthermore, class 1 compared to class 2 had
high probabilities of endorsing the two avoidance symp-
toms (C1, C2). Trauma-related avoidance potentially
compromises social relations and promotes social isolation.
It has also been suggested that this isolation in turn
potentially reduces the possibility for reality testing, thusTa
ble
3E
stim
ates
fro
mth
ela
ten
tcl
ass
mo
del
inp
rob
abil
ity
scal
e(s
tan
dar
der
rors
)
Spy
Pois
Mes
sH
yp
Vis
Aud
Olf
acT
act
B1
B2
B3
B4
B5
C1
C2
D4
D5
Cla
ss1
0.6
4(0
.07)
0.2
5(0
.07)
0.1
4(0
.07)
0.0
5(0
.03)
0.5
2(0
.21)
0.4
9(0
.16)
0.3
0(0
.08)
0.4
9(0
.08)
1.0
0(.
00)
0.8
9(0
.05)
0.6
9(0
.06)
0.9
3(0
.03)
0.9
8(0
.04)
0.9
8(0
.01)
0.9
3(0
.04)
0.9
0(0
.07)
0.9
1(0
.06)
Cla
ss2
0.4
6(0
.09)
0.2
4(0
.07)
0.2
0(0
.09)
0.0
3(0
.03)
0.5
9(0
.11)
0.3
5(0
.11)
0.3
0(0
.09)
0.4
9(0
.12)
0.7
6(0
.08)
0.4
8(0
.08)
0.4
4(0
.08)
0.7
2(0
.07)
0.4
4(0
.11)
0.8
4(0
.07)
0.7
4(0
.08)
0.6
2(0
.10)
0.3
7(0
.09)
Cla
ss3
0.2
0(0
.11)
0.0
6(0
.04)
0.0
1(0
.01)
0.0
0(0
.01)
0.0
4(0
.02)
0.0
4(0
.04)
0.0
3(0
.04)
0.0
5(0
.07)
0.9
6(0
.02)
0.8
7(0
.05)
0.7
1(0
.09)
0.9
6(0
.02)
0.9
3(0
.04)
0.9
8(0
.01)
0.9
7(0
.02)
0.8
0(0
.04)
0.8
6(0
.08)
Cla
ss4
0.0
9(0
.03)
0.0
0(0
.01)
0.0
0(0
.00)
0.0
0(0
.00)
0.0
4(0
.03)
0.0
6(0
.02)
0.0
2(0
.02)
0.0
1(0
.01)
0.9
0(0
.03)
0.5
7(0
.06)
0.3
2(0
.05)
0.8
2(0
.04)
0.5
8(0
.08)
0.9
2(0
.03)
0.7
4(0
.06)
0.5
5(0
.06)
0.3
4(0
.08)
Cla
ss1
=H
igh
Psy
chosi
s–H
igh
PT
SD
,C
lass
2=
Hig
hP
sych
osi
s–L
ow
PT
SD
,C
lass
3=
Low
Psy
chosi
s–H
igh
PT
SD
,C
lass
4=
Low
Psy
chosi
s–L
ow
PT
SD
Spy
Bel
ieved
that
peo
ple
wer
esp
yin
gon
you
or
foll
ow
ing
you?
Pois
Bel
ieved
that
you
wer
ebei
ng
secr
etly
test
edor
exper
imen
ted
on,th
atso
meo
ne
was
plo
ttin
gag
ainst
you,or
that
som
eone
was
tryin
gto
pois
on
you
or
hurt
you?
Mes
sB
elie
ved
that
you
wer
ebei
ng
sent
spec
ial
mes
sages
thro
ugh
tele
vis
ion
or
the
radio
,or
that
apro
gra
mhad
bee
nar
ranged
just
for
you
alone?
Hyp
Fel
tst
range
forc
esw
ork
ing
on
you,
asif
you
wer
ebei
ng
hypnoti
zed
or
mag
icw
asbei
ng
per
form
edon
you,or
you
wer
ebei
ng
hit
by
lase
rbea
ms
or
X-r
ays?
Vis
Exper
ience
of
seei
ng
som
ethin
gor
som
eone
that
oth
ers
pre
sent
could
not
see—
that
is,
had
avis
ion
when
you
wer
ew
ide
awak
e?A
ud
Exper
ience
of
hea
ring
thin
gs
that
oth
erpeo
ple
could
not
hea
r,su
chas
nois
esor
avoic
e?O
lfac
Both
ered
by
stra
nge
smel
lsar
ound
you
that
nobody
else
was
able
tosm
ell,
per
hap
sev
enodors
com
ing
from
your
ow
nbody?
Tact
Unusu
alfe
elin
gs
insi
de
or
on
your
body,
like
bei
ng
touch
edw
hen
noth
ing
was
ther
eor
feel
ing
som
ethin
gm
ovin
gin
side
your
body?
B1
Did
you
kee
pre
mem
ber
ing
the
even
tw
hen
you
did
not
wan
tto
?B
2D
idyou
kee
phav
ing
dre
ams
or
nig
htm
ares
about
itaf
terw
ards?
B3
Did
you
ever
sudden
lyac
tor
feel
asth
ough
the
even
tw
ashap
pen
ing
agai
n,
even
though
itw
asn’t
?B
4D
idyou
ever
get
ver
yupse
tw
hen
you
wer
ein
asi
tuat
ion
that
rem
inded
you
of
it?
B5
Did
you
swea
tor
did
your
hea
rtbea
tfa
st,
or
did
you
trem
ble
when
rem
inded
of
the
upse
ttin
gex
per
ience
?C
1D
idyou
try
har
dnot
toth
ink
about
it?
C2
Did
you
go
out
of
your
way
toav
oid
situ
atio
ns
that
mig
ht
rem
ind
you
of
the
even
t?D
4D
idyou
bec
om
eover
lyco
nce
rned
about
dan
ger
or
over
lyca
refu
l?D
5D
idyou
bec
om
eju
mpy
or
easi
lyst
artl
edby
ord
inar
ynois
esor
movem
ents
?
Soc Psychiatry Psychiatr Epidemiol (2011) 46:1069–1078 1075
123
enhancing vulnerability for psychotic experiences [47, 48].
Additionally, it has been proposed that both the intrusive
memories and flashbacks that are characteristic of the
re-experiencing and the hyperarousal symptom clusters of
PTSD, may also constitute chronic stressors which may
worsen symptom experience and enhance psychosis vul-
nerability [45].
This study has provided a symptom-based description of
a homogenous group that could be described in terms of a
psychotic PTSD subtype. In addition, it has shown that this
group has a clinical profile that is significantly poorer to all
other participants. However, the study had some limitations
and fails to provide sufficient evidence for a valid diag-
nostic entity. No information on the etiology, course,
treatment response, or biological basis for psychotic PTSD
was available. In addition there were limitations in terms of
the methodology. First, all measurements used in this study
are self-reports based on a structured interview rather than
clinical assessments. Second, the measurement of psycho-
sis-like symptoms can be confounded by numerous factors,
such as respondents misunderstandings, the nature of the
question, or normalizing the experience. In addition, it is
not easy from lay-interviews to distinguish reports of odd
experiences from true psychotic experiences. Third, whilst
self-report measures of psychotic experience may be
accurate in clinical samples, they may be falsely denied in
the general population due to the perceived stigma asso-
ciated with such experiences [2, 48, 49]. Finally, the
inclusion of those with a lifetime diagnosis of psychosis
may have provided a useful comparison group for the
Table 4 Regression coefficients (odds ratios) for demographic and trauma variables predicting latent classes
Predictor Class 1
High Psychosis–High PTSD
Class 2
High Psychosis–Low PTSD
Class 3
Low Psychosis–High PTSD
Age 0.96* (0.92–0.99) 1.01 (0.98–1.03) 0.99 (0.97–1.01)
Sex (female) 0.94 (0.38–2.27) 0.91 (0.40–2.08) 1.54 (0.84–2.81)
Ethnicity (white) 0.54 (0.26–1.10) 0.47* (0.23–0.97) 1.02 (0.57–1.84)
Education ([16 years) 0.48 (0.18–1.27) 0.28* (0.12–0.66) 0.70 (0.37–1.34)
Income (\$19,000) 1.63 (0.85–3.14) 1.67 (0.88–3.15) 1.19 (0.72–1.99)
Household composition (lives alone) 0.30* (0.18–0.69) 1.07 (0.49–2.32) 0.72 (0.40–1.29)
War 1.08 (0.30–3.92) 1.03 (0.24–4.37) 2.96* (1.05–8.29)
Accident 1.51 (0.79–2.86) 1.14 (0.57–2.28) 1.36 (0.80–2.31)
Fire/flood/natural disaster 2.77 (1.39–5.49) 4.30* (2.12–8.73) 1.22 (0.69–2.16)
Witnessed someone being badly injured or killed 2.58* (1.35–5.02) 0.92 (0.42–1.99) 1.74* (1.03–2.92)
Raped 1.77 (0.84–3.73) 2.35* (1.12–4.93) 1.78* (1.02–3.09)
Molested 1.49 (0.77–2.90) 0.94 (0.48–1.84) 1.03 (0.68–1.71)
Attacked/physically assaulted 1.09 (0.54–2.24) 0.96 (0.48–2.09) 1.16 (0.65–2.08)
Abused as a child 1.87 (0.89–3.91) 0.51 (0.23–1.13) 1.20 (0.69–2.07)
Neglected as a child 0.78 (0.32–1.93) 2.68* (1.30–5.56) 0.74 (0.38–1.44)
Threatened with a weapon/held captive/kidnapped 1.50 (0.75–2.99) 0.39* (0.16–0.92) 1.08 (0.60–1.94)
95% confidence intervals in parenthesis
* Indicates statistical significance
Table 5 Regression coefficients (odds ratios) for latent classes predicting lifetime CIDI diagnoses
Alcohol
dependence
Drug
dependence
Major
depression
Bipolar
disorder
Mania Generalized anxiety
disorder
Class 1 2.11* 1.38 3.04* 8.07* 12.07* 3.44*
High Psychosis–High PTSD (1.10–4.05) (0.66–2.88) (1.60–5.76) (2.54–25.60) (1.14–127.41) (1.49–7.96)
Class 2 1.84 2.03 1.34 3.69 22.11* 2.96*
High Psychosis–Low PTSD (0.86–3.96) (0.85–4.85) (0.62–2.86) (0.63–21.58) (1.84–264.55) (1.20–7.26)
Class 3 1.30 1.12 1.60 3.12* 1.05 2.89*
Low Psychosis–High PTSD (0.74–2.27) (0.58–2.17) (0.94–2.73) (1.04–9.30) (0.06–17.00) (1.43–5.83)
Class 4 is the reference class
* Indicates statistical significance (p \ 0.05)
1076 Soc Psychiatry Psychiatr Epidemiol (2011) 46:1069–1078
123
psychotic PTSD subtype class in terms of comorbid psy-
chiatric diagnoses.
The current findings may have important implications
regarding the conceptualization of trauma-related diagno-
ses. It is notable that the clinical profile of the High PTSD-
High Psychosis class was significantly poorer than the
remainder of this PTSD sample. If these findings are indeed
representative of trauma psychopathology then traumatized
individuals diagnosed with PTSD might also experience
psychosis related symptoms, and if these individuals in turn
exhibit an elevated probability of clinical comorbidity, then
it would seem important that clinicians screen for the
presence of symptoms that currently lie beyond the diag-
nostic boundaries of a PTSD diagnosis.
References
1. American Psychiatric Association (1994) Diagnostic and statis-
tical manual of mental disorders, 4th edn. American Psychiatric
Association, Washington
2. Bebbington PE, Kuipers L (1992) Social causation of schizo-
phrenia. In: Bhugra D, Leff JP (eds) Principles of social psy-
chiatry. Blackwell, Oxford
3. Janssen I, Krabbendam L, Bak M, Hanssen M, Vollebergh W, de
Graaf R et al (2004) Childhood abuse as a risk factor for psy-
chotic experiences. Acta Psychiatr Scand 109:38–45
4. Shevlin M, Dorahy M, Adamson G (2007) Childhood traumas
and hallucinations: an analysis of the National Comorbidity
Survey. J Psychiatr Res 41:222–228
5. Shevlin M, Dorahy MJ, Adamson G (2007) Trauma and psy-
chosis: an analysis of the National Comorbidity Survey. Am J
Psychiatry 164:166–169
6. Elklit A, Shevlin M (2010) Female sexual victimization predicts
psychosis: a case-control study based on the Danish registry
system. Schizophr Bull. doi:10.1093/schbul/sbq048
7. Hamner MB, Frueh BC, Ulmer HG, Arana GW (1999) Psychotic
features and illness severity in combat veterans with chronic
posttraumatic stress disorder. Biol Psychiatry 45:846–852
8. Hamner MB, Fossey MD (1993) Psychotic symptoms associated
with posttraumatic-stress-disorder. Neuropsychopharmacology
9:S121–S122
9. Hamner MB (1997) Psychotic features and combat-associated
PTSD. Depress Anxiety 5:34–38
10. Morrison APSC, Read J, Turkington D (2005) Trauma and psy-
chosis: theoretical and clinical implications. Acta Psychiatr Scand
112:327–329
11. Seedat S, Stein MB, Oosthuizen PP, Emsley RA, Stein DJ (2003)
Linking posttraumatic stress disorder and psychosis—a look at
epidemiology, phenomenology, and treatment. J Nerv Ment Dis
191:675–681
12. Sautter FJ, Brailey K, Uddo MM, Hamilton MF, Beard MG,
Borges AH (1999) PTSD and comorbid psychotic disorder:
comparison with veterans diagnosed with PTSD or psychotic
disorder. J Trauma Stress 12:73–88
13. Ivezic S, Bagaric A, Oruc L, Mimica N, Ljubin T (2000) Psy-
chotic symptoms and comorbid psychiatric disorders in a Cro-
ation combat related posttraumatic stress disorder sample. Croat
Med J 41:179–183
14. Sareen J, Cox BJ, Goodwin RD, Asmundson GJG (2005)
Co-occurrence of posttraumatic stress disorder with positive
psychotic symptoms in a nationally representative sample.
J Trauma Stress 18:313–322
15. Braakman MH, Kortman FAM, van den Brink W (2009) Validity
of ‘posttraumatic stress disorder with secondary psychotic fea-
tures’: a review of the evidence. Acta Psychiatr Scand 199:15–24
16. David D, Kutcher GS, Jackson EI, Mellman TA (1999) Psychotic
symptoms in combat-related posttraumatic stress disorder. J Clin
Psychiatry 60:29–32
17. Kastelan A, Franciskovic T, Moro L, Roncevic-Grzeta I, Grkovic
J, Jurcan V et al (2007) Psychotic symptoms in combat-related
post-traumatic stress disorder. Mil Med 172:273–277
18. Kessler RC (1994) The National Comorbidity Survey of the
United States. Int Rev Psychiatry 6:365–376
19. American Psychiatric Association (1987) Diagnostic and statis-
tical manual of mental disorders, 3rd edn, revised (DSM-III-R).
American Psychiatric Association, Washington
20. World Health Organization (1990) Composite International
Diagnostic Interview (CIDI), version 1.0. World Health
Organization
21. Simms LJ, Watson D, Doebbeling BN (2002) Confirmatory
factor analyses of posttraumatic stress symptoms in deployed and
nondeployed veterans of the Gulf War. J Abnorm Psychol
111:637–647
22. Elklit A, Armour C, Shevlin M (2010) Testing alternative factor
models of PTSD and the robustness of the dysphoria factor.
J Anxiety Disord 24:147–154
23. Armour C, Shevlin M (2010) Testing the dimensionality of PTSD
and the specificity of the dysphoria factor. J Loss Trauma 15:11–27
24. Ford JD, Elhai JD, Ruggiero KJ, Frueh BC (2009) Refining
posttraumatic stress disorder diagnosis: evaluation of symptom
criteria with the National Survey of Adolescents. J Clin Psychi-
atry 70:748–755
25. Spitzer RL, First MB, Wakefield JC (2007) Saving PTSD from
itself in DSM-V. J Anxiety Disord 21:233–241
26. Morrison AP, Frame L, Larkin W (2003) Relationships between
trauma and psychosis: a review and integration. Br J Clin Psychol
42:331–353
27. Spitzer RL, Williams JBW, Gibbon M, First MB (1992) The
Structured Clinical Interview for DSM-III-R (SCID) I: history,
rationale, and description. Arch Gen Psychiatry 49:624–629
28. Kessler RC, Borges G, Walters EE (1999) Prevalence of and risk
factors for lifetime suicide attempts in the national comorbidity
survey. Arch Gen Psychiatry 56:17–626
29. Wittchen HU, Robins LN, Cottler LB, Sartorius N, Burke JD,
Regier D (1991) Cross-cultural feasibility, reliability and sources
of variance of the Composite International Diagnostic Interview
(CIDI). Br J Psychiatry 159:645–653
30. Cottler LB, Robins LN, Grant BF, Blaine J, Towle LH, Wittchen
HU et al (1991) The CIDI-core substance-abuse and dependence
questions—cross-cultural and nosological issues. Br J Psychiatry
159:653–658
31. Wacker HR, Battegay R, Muellejans R, Schloesser C (1990)
Using the CIDI-C in the general-population. Psychiatry: A World
Perspective 900:138–143
32. Janca A, Robins LN, Bucholz KK, Early TS, Shayka JJ (1992)
Comparison of Composite International Diagnostic Interview and
Clinical DSM-III-R Criteria Checklist Diagnoses. Acta Psychiatr
Scand 85:440–443
33. Schafer JL, Graham JW (2002) Missing data: our view of the
state of the art. Psychol Methods 7:147–177
34. Akaike H (1987) Factor analysis and AIC. Psychometrika
52:317–332
35. Scwartz G (1978) Estimating the dimension of a model. Ann Stat
6:461–464
36. Sclove SL (1987) Application of model selection criteria to some
problems in multivariate analysis. Psychometrika 52:333–343
Soc Psychiatry Psychiatr Epidemiol (2011) 46:1069–1078 1077
123
37. McLachlan GJ, Peel D (2000) Finite mixture models. New York,
Wiley-Interscience
38. Ramaswamy V, DeSarbo W, Reibstein D, Robinson W (1993) An
empirical pooling approach for estimating marketing mix elas-
ticities with PIMS data. Marketing Sci 12:103–124
39. Nylund KL, Asparoutiov T, Muthen BO (2007) Deciding on the
number of classes in latent class analysis and growth mixture
modeling: a Monte Carlo simulation study. Struct Equ Model
14:535–569
40. Muthen BO, Muthen L (1998–2007) Mplus Users Guide, 5th edn.
Muthen & Muthen, Los Angeles
41. Scott J, Welham J, Martin G, Bor W, Najman J, O’Callaghan M
et al (2008) Demographic correlates of psychotic-like experiences
in young Australian adults. Acta Psychiatr Scand 118:230–237
42. Johns LC, Hemsley D, Kuipers E (2002) A comparison of
auditory hallucinations in a psychiatric and non-psychiatric
group. Br J Clin Psychol 41:81–86
43. Bebbington PE, Bhugra D, Brugha T, Singleton N, Farrell M,
Jenkins R et al (2004) Psychosis, victimisation and childhood
disadvantage—evidence from the second British National Survey
of Psychiatric Morbidity. Br J Psychiatry 185:220–226
44. Mueser KT, Essock SM, Haines M, Wolfe R, Xie HY (2004)
Posttraumatic stress disorder, supported employment, and out-
comes in people with severe mental illness. CNS Spectr
9:913–925
45. Shaw K, McFarlane AC, Bookless C, Air T (2002) The aetiology
of postpsychotic posttraumatic stress disorder following a psy-
chotic episode. J Trauma Stress 15:39–47
46. Bendall S, McGorry P, Krstev H (2006) The trauma of being
psychotic: an analysis of posttraumatic stress disorder in response
to acute psychosis. In: Larkin W, Morrison AP (eds) Trauma and
psychosis: new directions for theory and therapy. Routledge,
London, pp 58–74
47. Cresswell CM, Kuipers L, Power MJ (1992) Social networks and
support in long-term psychiatric-patients. Psychol Med 22:
1019–1026
48. Bebbington PE, Kuipers L (1994) The social management of long
standing schizophrenia: the deployment of service resources.
Clinician 12:17–29
49. Butzlaff RL, Hooley JM (1998) Expressed emotion and psychi-
atric relapse—a meta-analysis. Arch Gen Psychiatry 55:547–552
1078 Soc Psychiatry Psychiatr Epidemiol (2011) 46:1069–1078
123


