Embed Size (px)
Citation preview

Evolution of occlusal shape of the first and second upper molars ofMiddle–Late Pleistocene collared lemmings (Dicrostonyx, Arvicolinae,Rodentia) in northeast European Russia
DMITRY PONOMAREV AND ANDREY PUZACHENKO
Ponomarev, D. & Puzachenko, A.2015 (October): Evolution of occlusal shape of first and second upper molars ofMiddle–Late Pleistocene collared lemmings (Dicrostonyx, Arvicolinae, Rodentia) in northeast European Russia.Boreas, Vol. 44, pp. 741–759. 10.1111/bor.12131. ISSN 0300-9483.
An approach combining traditional morphotypical methods, multivariate analysis and informational-statisticalmethods was used to study evolutionary changes in the occlusal shape of the first and second upper molars ofRecent and Middle–Late Pleistocene Dicrostonyx (32 samples) from localities in northeast European Russia(northeastern Russian Plain, the Timan Ridge and the northern part of the Urals). The evolutionary history isdescribed in terms of morphological evolutionary levels of teeth suggested by Smirnov et al. (1997, MaterialyPo Istorii I Sovremennomu Sostojaniju Fauny Severa Zapadnoj Sibiri: Sbornik Nauchnyh Trudov, Chelyabinsk,slightly modified). Based on 14C-dated samples, levels of molar evolution did not always successively replaceeach other in time, but rather there were often synchronous populations at any given level. This finding supportsthe notion of a mosaic pattern of morphotypical diversity and relatively independent, parallel evolution of lem-ming teeth amongst different populations. Six relatively distinct stages in the evolutionary history of Dicrostonyxfrom the Pechora (Dnieper) to Recent time have been described, but estimations of their relative ages are oftendebatable. The rates of change in the M1 and M2 morphotypes and morphological diversity in collared lem-mings varied over the entire time interval. The fastest replacement of morphotypes and the highest level of mor-phological diversity in the study area occurred approximately during the Lateglacial (16–10 cal. ka BP). In thepresent study, we suggest a new version of evolutionary history of collared lemmings in northeast EuropeanRussia, taking into consideration the morphological variability of molars, radiocarbon dates and geologicaldata. Our results provide a more detailed pattern of species evolution in the studied region and specific ages ofsome localities.
Dmitry Ponomarev ([email protected]), Institute of Geology of Komi Science Center, Ural Branch, RussianAcademy of Sciences, Pervomayskaya 54, 167982 Syktyvkar, Russia; Andrey Puzachenko, Institute of Geography,Russian Academy of Science, Staromonetny 29, 119017 Moscow, Russia; received 30th December 2014, accepted22nd May 2015.
Collared lemmings (Dicrostonyx Gloger, 1841, Arvi-colinae Gray, 1821) were amongst the most numerousrodents in the Pleistocene of northern Eurasia andNorth America and their range shifted south thou-sands of kilometres during glacial epochs. In the Euro-pean north, this genus is one of the three taxa(Lemmus sibiricus, Dicrostonyx, Microtus gregalis)whose fossil remains have been found in the Quater-nary alluvial sediments, and it is one of the mostimportant genera for stratigraphy in the study area.
Currently, eight valid species are recognized in thegenus Dicrostonyx based on morphological, caryologi-cal, hybridological and genetic data (Rausch & Rausch1972; Tchernyavskiy & Kozlovskiy 1980; Krohne 1982;Gileva 1983; van Wynsberghe & Engstrom 1992; Bor-owik & Engstrom 1993; Engstrom et al. 1993; Eger1995; Fedorov et al. 1999; Ehrich et al. 2000; Abram-son & Tikhonova 2002; Musser & Carleton 2005).Only two species inhabit Eurasia: D. torquatus (Pallas,1779) on the continent and D. vinogradovi (Ognev,1948) on Wrangel Island; the six other species live inNorth America.
The main trend in the evolutionary transformation oftooth morphology in the genus Dicrostonyx is wellknown and has been described in detail (e.g. Agadjanian
1973, 1976; Zazhigin 1976, 2003; Nadachowski 1982;Kochev 1984, 1993; Smirnov & Bol’shakov 1985;Smirnov et al. 1986, 1997). It consists of the develop-ment of additional elements on the molars that providebetter grinding of food, which formed as the groupadapted to feeding on coarse plant food (Smirnov et al.1997). Several Pleistocene Dicrostonyx species have beendescribed in northern Eurasia: D. gulielmi (Sanford,1870); D. henseli (Hinton, 1910); D. simplicior (Fejfar,1966); D. renidens (Zazhigin, 1974); D. ocaensis(Alexandrova, 1982); D. meridionalis (Smirnov etBorodin, 1986); and D. torquatus. In this group, fossilspecies are diagnosed based on morphotypical charac-teristics of molars, in particular the relative abundanceof different morphotypes (Agadjanian 1973, 1976;Zazhigin 1976, 2003; Kochev 1984, 1993; Smirnov &Bol’shakov 1985; Smirnov et al. 1986, 1997). In ourwork, we follow the widespread opinion regarding theclassification of Pleistocene Dicrostonyx (Sutcliffe &Kowalski 1976; Nadachowski 1982; Smirnov et al. 1986,1997), which can roughly be presented as follows: Mid-dle Pleistocene lemmings are referred to as D. simplicior,Late Pleistocene lemmings are considered D. gulielmi,and the modern-day lineage is referred to as D. torqua-tus. D. henseli is considered a synonym of D. gulielmi.
DOI 10.1111/bor.12131 © 2015 Collegium Boreas. Published by John Wiley & Sons Ltd
bs_bs_banner

During cold phases of the Middle and Late Pleisto-cene, collared lemmings were widespread in northernEurope (Fig. 1), but their wide range collapsed at theend of the Pleistocene during Greenland Interstadial 1(Bølling/Allerød) at 14.5 cal. ka BP (Prost et al. 2010).
There is no consensus amongst palaeontologists andgeologists about the age of collared lemmings at thelocalities under consideration (Guslitser & Isaychev1980; Guslitser 1981; Guslitser et al. 1985; Loseva et al.1990; Kochev 1993; Smirnov et al. 1997; Smirnov 1999;Andreicheva 2002). Some researchers (Guslitser & Isay-chev 1980; Guslitser 1981; Kochev 1993) did not rely onradiocarbon dating of assemblages from Medvezh’yacave, believing samples to be contaminated with ‘young’carbon, but Smirnov (1996) showed that the 14C datesat these locations are in agreement with the geologicaland faunal data. Taking into account the tooth mor-phology of lemmings and ignoring geological argu-ments, some of these localities are believed to beyounger than previously reported (Smirnov 1999), butgeologists are still not in agreement (Andreicheva 2002;Andreicheva & Marchenko-Vagapova 2007).
In this study, we analysed materials collected by theextraordinarily active Quaternary geologist B. Guslit-ser, who worked at the Institute of Geology in Syktyv-kar, and our new collections from cave localities at
Timan Ridge and the Nether-Polar Urals obtained inrecent years and dated by the Dutch–Russian projectCOMSEC (Ponomarev et al. 2012, 2013). Our maingoal was to provide well-dated evolutionary stages ofDicrostonyx molars using slightly modified versions ofmethodological approaches developed by Smirnovet al. (1986, 1997) and multivariate statistical methods.
Material and methods
We used the M1 and M2 of Dicrostonyx (collection cat-alogue numbers 12, 16, 18–23, 26–31, 297, 281, 282,284–289, 293–296) kept in the Tchernov GeologicalMuseum of the Institute of Geology in Syktyvkar. Weanalysed 32 samples of different ages from localities ofnortheastern (NE) European Russia (Fig. 1). Molars ofmodern animals were obtained from avian pellets col-lected by Syktyvkar geologists B. Guslitser, K. Isaychev,V. Kochev, V. Timonin and A. Yudina in the Bol’sheze-mel’skaya tundra and at Pay-Khoy Ridge. The absoluteages of fossil assemblages from Medvezhya cave, Koz-him-1, Schuger-4, Pizhma-1, Sed’yu-1 and Kur’yadorwere established by radiocarbon dating (Table 1). Con-ventional 14C dates were calibrated using the IntCal09calibration curve (Reimer et al. 2009). The calibrateddates are reported in calendar years BP (before 1950).
Fig. 1. Map of the Pleistocene–Holocene localities with Dicrostonyx remains in Europe (A), range of the Recent species (B) (Tsytsulina et al.2008) and studied localities. 1 = Pay-Khoy (Recent); 2 = Adz’va (Recent); 3 = Shapkina (Recent); 4 = Shapkina-1; 5 = Shapkina-3;6 = Shapkina-4; 7 = Laya-2; 8 = Laya-3; 9 = Laya-5; 10 = Laya-4; 11 = Serche’yu-1; 12 = Serche’yu-3; 13 = Serche’yu-4, 5, 6; 14 = Koz-him-1; 15 = Akis’; 16 = Nizhniy Dvoynik; 17 = Kipievo; 18 = Chuley; 19 = Pizhma-1; 20 = Schuger-4; 21 = Ryabovo; 22 = Gavrilovka;23 = Bol’shaya Sluda; 24 = Kur’yador; 25 = Studyonaya and Medvezh’ya caves; 26 = Un’inskaya cave; 27 = Sed’yu-1. This figure is avail-able in colour at http://www.boreas.dk.
742 Dmitry Ponomarev and Andrey Puzachenko BOREAS

Relative stratigraphical ages were determined usinggeological methods, based on the position of the layerin the section and considering lemming molar mor-phology. More specifically, we used correlationsbetween bonebeds and diamictons (tills) to define thestratigraphy. Diamictons are lithologically almostinvariable in the lateral direction and their stratigraphi-cal position can quite confidently be established basedon a complex of lithological traits such as rock petrog-raphy, the mineral composition of the rock matrix, andclast fabric.
All localities that we studied belong to two maintaphonomic types: cave (Medvezhya, Studyonaya,Un’yinskaya, Kozhim-1, Schuger-4, Pizhma-1, Sed’yu-1)and alluvial (Shapkina, Serche’yu, Ryabovo, NizhniyDvoynik, Kipievo, Laya, Chuley, Bol’shaya Sluda,Akis’, Gavrilovka) sites. The taphonomy of theKur’yador locality is still unclear because the sedi-ments there include features that indicate uncertainaquatic or soil depositional conditions and becauserodent remains occur (at least sometimes) in thepalaeoburrows and thus they might be younger thanthe dated bonebed itself (P. Kosintsev, pers. comm.2014).
Regarding tooth morphology, we used a quantita-tive method to estimate newly developed triangularlobes based on their relative sizes and by the extent ofcontortion of new enamel facets (Kochev 1984; Smir-nov et al. 1997). The angles of concavities (see expla-nation below) and relative sizes of molars and lobeswere measured in photographs that we took of thespecimens. The dimensions of the first and secondupper molars, which evolved much faster than otherteeth, were measured (Kochev 1984; Smirnov et al.1997).
Morphotypical classes were separated within thesimplicior morphotype according to the method sug-gested by Smirnov et al. (1997); the width of eachgrowing lobe was compared with others that hadalready developed normally (Fig. 2). The extent ofdevelopment of each new triangular lobe was
measured as the ratio of its width (b) to the widthof a previously developed unpaired lobe (a). Thisratio varies from almost zero (if the lobe is weaklydeveloped) to one (if the triangles are equal inwidth). The less a lobe is developed, the lower thisparameter becomes. Based on their extensive experi-ence in this field, Smirnov et al. (1997) proposedusing four stages of lobe development: (i) 0.59 andless, (ii) 0.6–0.69, (iii) 0.7–0.79 and (iv) 0.8 andgreater. However, we separated development intofive stages, where the fourth stage is 0.8–0.89 andthe fifth is 0.9 and greater. Following Smirnov et al.(1997), these morphotypical classes are indicated s1,s2, s3, s4 and s5.
When a new triangular lobe reaches a shape and sizethat is comparable to previous lobes, a small concavitywith a thin enamel strip appears on its back side; thismarks a transition to the next phase of molar evolutionin which two morphotypes are distinguished: henseliand torquatus (Smirnov et al. 1986, 1997). Molars thathad an additional enamel layer on the back side of anew lobe (sixth in M1 and fifth in M2) but whose cav-ity was not well pronounced were assigned to the sim-plicior morphotype. To evaluate the complexity ofmolar pattern, we measured the re-entrant angle ofconcavity on the back side of the new lobe proposed byKochev (1984), as shown in Fig. 3. The BAC anglewas measured with an accuracy of 5°. Analyses of thedistribution of angle values amongst Recent andancient collared lemmings from different parts of therange have revealed two peaks: one in the range 5–50�and another at 55–120� (Smirnov et al. 1986, 1997).Smirnov et al. (1986, 1997) assumed that this patternwas the result of two normal distributions within twodiscrete morphotypes (henseli and torquatus) mixingtogether. They proposed assigning angle values of themolars ranging from 5 to 50° (from 5 to 45° in the firstversion) to the henseli morphotype, but 55� and greaterto the torquatus morphotype.
The extent of discontinuity of groups (classes) withinmorphotypes is chosen experimentally (empirically)
Table 1. Radiocarbon dates for Quaternary mammal remains from studied localities.
Sites Lab. no 14C date(a BP)
1-sigma Species Datedobject
Cal. a BP range(1-sigma)
Reference
Kozhim-1, layer 2 GrA-49353 9090 45 Arvicola terrestris Mandible 10 260–10 205 Ponomarev et al. (2012)Schuger-4, layer 2 GrA-49351 9710 45 Rangifer tarandus Humerus 11 205–11 125 Ponomarev & Kryazheva (2011)Schuger-4, layer 1 GrA-49440 10 090 60 Dicrostonyx Bone 11 820–11 600 Ponomarev & Kryazheva (2011)Pizhma-1, layer 5 GrA-42216 10 180 50/45 Alopex lagopus Calcaneus 11 980–11 800 Ponomarev et al. (2012)Schuger-4, layer 3 GrA-49439 11 850 60 Lemmus Cranium 13 800–13 620 Ponomarev & Kryazheva (2011)Sed’yu-1 GrA-38567 12 310 60 Desmana moschata Mandible 14 260–14 040 Ponomarev et al. (2012)Medvezh’ya cave(brown ‘A’ loam)
LE-3059 12 230 100 mamm. indet Bone 14 240–13 900 Guslitser & Pavlov (1988)
Medvezh’ya cave(brown ‘A’ loam)
T-13476 13 260 230 mamm. indet Bone 16 670–15 830 Guslitser & Pavlov (1988)
Medvezh’ya cave(brown ‘B’ loam)
LE-3061 17 980 200 mamm. indet. Bone 21 820–21 790 Guslitser & Pavlov (1988)
Kur’yador LU-Б88 31 080 280 – – 35 610–35 130 Andreicheva (2011)
BOREAS Evolution of molar shape of Pleistocene lemmings, NE European Russia 743

and depends, first of all, on the size of a given sample.For example, Smirnov et al. (1997) suggested thefollowing subdivision for the henseli morphotype(samples of 50–100 specimens): h1 (5–10°), h2 (15–20°), h3 (25–30°), h4 (35–40°) and h5 (45–50°). For thetorquatus morphotype, they proposed six classes: t1(55–60°), t2 (65–70°), t3 (75–80°), t4 (85–90°), t5 (95–100°) and t6 (105° and greater).
We slightly modified Smirnov’s torquatus classifica-tion. It seems that separating this morphotype into sixclasses is not enough because this scheme does notalways allow one to evaluate the real complexity of themolar. There are teeth (apparently mainly of modernanimals) amongst ‘advanced’ molars that have such acomplicated posterior part that taking point B asmaximally distant from the line AC does not allow oneto properly describe the real complexity of the molar
(Fig. 3A, B). In complex molars in which point B isnot located at the maximal fold of the lobe’s cuttingedge, it is suggested to measure the DAC angle(Fig. 3C). Point D is chosen in the posterior part ofthe curve that is maximally distant from point C.Applying this method of measuring angles, their valueswithin the torquatus morphotype range maximally notto 120° but to 145°. This increases the number ofgroups in this morphotype to eight classes: t1 (55–60°),t2 (65–70°), t3 (75–80°), t4 (85–90°), t5 (95–100°), t6(105–110°), t7 (115–120°) and t8 (125° and greater).
Hence, in the present study, the total number ofmorphotypical classes was 18: five simplicior, five hens-eli and eight torquatus. Data on the proportions ofmorphotypical classes and morphotypes are given inTables 2, S1 and S2.
The classification scheme that we used is based onthe tooth categorization suggested by Smirnov et al.(1997), which takes into account the diverse evolution-ary rates of different molars. They reduced all of thediversity of morphotypical combinations to several lev-els of tooth evolution. These levels replace each otherbased on their complexity, decreasing the share of‘archaic’ and increasing the proportion of ‘advanced’morphotypes. Each sample was assigned to one of threechronospecies (Dzik 1985; Hull 1997; Saylo et al. 2011):D. simplicior, D. gulielmi or D. torquatus. Within eachmorphological species, three morphs were differentiated.On top of that, Smirnov et al. (1997) also distinguishedintermediate transitional forms of uncertain taxonomicstatus. These were given names that corresponded to thetwo species between which each was positioned (Fig. 4).
To specify levels within D. gulielmi and D. torquatus,we used the description of Smirnov et al. (1997). Wedefined stages in D. simplicior based on figure 15 inthat paper. Thus, morph 1 consisted of samples forwhich both molars were of the simplicior morphotype;morph 2 samples had molars of both simplicior andhenseli but was dominated by simplicior; and morph 3had all three morphotypes: simplicior (dominant),henseli (fewer) and torquatus (rare).
We used multivariate statistical methods to analysevariation in morphotype frequency amongst thesamples. This reduced the observed variation in the 18morphotypes to two or three uncorrelated variables that
A B C
Fig. 3. Scheme for measuring the BAC and DAC angles applied to determine the extent of development of additional elements on M1 andM2 Dicrostonyx for the henseli and torquatus morphotypes (after Smirnov et al. 1997). A, B. Scheme proposed by Kochev (1984) and used bySmirnov et al. (1997). C. Scheme for the torquatus morphotype used in this work. Points A and C are located at the edges of a developing con-cavity. Point B is chosen as maximally distant from the line AC. Point D is chosen in the posterior part of the curve that is maximally distantfrom point C at the maximal fold of the lobe’s cutting edge. This figure is available in colour at http://www.boreas.dk.
Fig. 2. Scheme of width measurements of triangular lobes in M1and M2 of Dicrostonyx, applied to identify the evolutionary levelwithin the simplicior morphotype (according to Smirnov et al. 1997).a is the width of a previously developed unpaired triangular lobe; b isthe width of a new lobe. This figure is available in colour at http://www.boreas.dk.
744 Dmitry Ponomarev and Andrey Puzachenko BOREAS

hold the main information about the variation. Toapproach a normal distribution of morphotypes arcsinetransformation was applied, according to the formula:
h ¼ arcsinf1� 2½ð f þ 3=8Þ=ðnþ 3=4Þ�g ð1Þ
where f is the frequency of each morphotype, and n isthe number of observations in the sample (Anscombe1948; Green & Suchey 1976; Vasil’yev et al. 2007). Theh values were used to evaluate Euclidean distancesbetween all pairs of samples. The dissimilarity matrixwas used for nonmetric multidimensional scaling(NMDS) (Kruskal 1964). We used a modified screetest to find the best minimum dimensionality of thedata according to the method suggested by Puz-achenko (2001) and also used previously (Kupriyanovaet al. 2003; Abramov et al. 2009). NMDS axes areorthogonal and determine the Euclidean space. Thedistances between samples (centroids) in this spacewere used to construct classification (NJ) trees (Saitou& Nei 1987).
Independently, the phenetic distances (mean mea-sure of divergence, MMD) were calculated between
all 32 samples according to formula suggested by Hart-man (1980):
MMD¼1=rXr
i¼1h1i�h2ið Þ2� 1
n1iþ0:5ð Þþ1
n2iþ0:5ð Þ� �� �
ð2Þ
where r is the number of morphotypes considered,h1i is the transformed frequency of morphotype i inpopulation 1, n1i is the score for trait i in sample 1,h2i is the transformed frequency of morphotype i inpopulation 2 and n2i is the score for trait i in sam-ple 2.
The diversity (Shannon’s) index was calculatedaccording to the equation:
H ¼ �Xr
i¼1pilog2pið Þ ð3Þ
where pi is the sample frequency of morphotype i.Sample size (N) also significantly influences the value.The calibration in this case consists of doing the samething in accordance with the following transformation:
Table 2. Relative frequencies (%) of M1 and M2 morphotypes in various samples of Dicrostonyx. For definition of morphotypes see Materialand methods and Figs 2, 3.
Sample N M1 N M2
simplicior henseli torquatus simplicior henseli torquatus
Pay-Khoy, Recent 59 1.7 – 98.3 66 – 6.1 93.9Shapkina, Recent 88 – 6.8 93.2 78 2.6 10.3 87.2Ad’zva, Recent 66 – 7.6 92.4 67 – 3.0 97.0Kozhim-1 32 9.4 40.6 50.0 30 – 60.0 40.0Schuger-4, layer 1 27 3.7 51.9 44.4 22 4.5 54.5 40.9Schuger-4, layers 2–3 48 2.1 50.0 47.9 37 – 59.5 40.5Pizhma-1 101 2.0 68.3 29.7 96 1.0 68.8 30.2Sed’yu-1 10 – 100.0 – 19 – 42.1 57.9Medvezhya, loam A 17 – 35.3 64.7 15 – 6.7 93.3Medvezhya, loam B 158 1.3 58.9 39.9 163 0.6 44.8 54.6Shapkina-1 25 8.0 56.0 36.0 19 5.3 42.1 52.6Un’yinskaya 94 8.5 62.8 28.7 61 9.8 65.6 24.6Studyonaya-1, 0–20 cm 48 4.2 47.9 47.9 39 2.6 35.9 61.5Studyonaya-5, 80–100 cm 35 – 71.4 28.6 32 6.3 50.0 43.8Kur’yador 13 15.4 61.5 23.1 8 – 37.5 62.5Ryabovo 99 9.1 75.8 15.2 106 11.3 67.9 20.8Nizhniy Dvoynik 33 15.2 69.7 15.2 18 – 83.3 16.7Serche’yu-4 113 19.5 68.1 12.4 94 8.5 75.5 16.0Kipievo-2, upper 40 17.5 72.5 10.0 33 6.1 69.7 24.2Laya-2 105 18.1 75.2 6.7 83 – 75.9 24.1Serche’yu-5 47 21.3 72.3 6.4 40 5.0 65.0 30.0Serche’yu-6 22 4.5 77.3 18.2 14 – 78.6 21.4Serche’yu-3 74 28.4 56.8 14.9 55 3.6 76.4 20.0Shapkina-3 45 15.6 80.0 4.4 55 9.1 70.9 20.0Chuley 10 70.0 30.0 – 6 33.3 66.7 –Shapkina-4 10 60.0 40.0 – 16 37.5 62.5 –Serche’yu-1 18 83.3 16.7 – 11 72.7 18.2 9.1Laya-3 27 77.8 22.2 – 16 75.0 18.8 6.3Laya-4 15 93.3 6.7 – 9 77.8 22.2 –Akis’ 28 96.4 3.6 – 15 93.3 6.7 –Bol’shaya Sluda 12 91.7 8.3 – 8 100.0 – –Gavrilovka 34 100.0 – – 27 96.3 3.7 –
BOREAS Evolution of molar shape of Pleistocene lemmings, NE European Russia 745

Hcali ¼ ½Hi � ða� b log10niÞ� þ ðaþ b log10�nÞ. The first
term of the sum in square brackets corresponds to thesubtraction of the linear trend. The second term of thesum is the scale constant, which returns the originalscale of H after subtracting the trend; �nis the medianvalue of the sample size.
Results
Statistical analysis
Within the framework of one three-dimensionsalNMDS model, the linear combination of NMDS axes
Fig. 4. Studied Dicrostonyx samples arranged by evolutionary level according to the percentage of three morphotypes in M1 and M2 (Smir-nov et al. 1997). Three morphs were separated within each of the three chronospecies (D. simplicior, D. gulielmi and D. torquatus) and alsotransitional forms of uncertain taxonomic status. The simplicior morphotype is shown in white, henseli is grey, torquatus is black. For the defi-nitions of morphotypes see Material and methods and Figs 2, 3. Radiocarbon dates are shown for several localities.
746 Dmitry Ponomarev and Andrey Puzachenko BOREAS

described 8–85% of each morphotype’s frequency vari-ation in M1 and M2 (Table 3).
The first NMDS axis (E1) was linearly correlatedwith the estimated ages of the localities (Fig. 5). Thesecond axis (E2) had a nonlinear (close to parabolic)correlation with the time scale. As can be concludedfrom the data presented in Table 3 and Fig. 5, theNMDS model represents the main patterns of mor-photype frequency variation on the one hand, andreflects the changes in the frequencies over time on theother hand. For example, the main evolutionary trenddescribed by E1 corresponds with a decrease in the fre-quencies of the s1–s5 morphotypes and with anincrease in the frequencies of the h2–h5 and t1–t8 mor-photypes. The second axis describes the nonlinear vari-ation in the morphotype frequency of h1, h2 and t5–t7in M1 and h1, h2, t6 and t7 in M2.
Axis E3 shows a nonlinear correlation with the fre-quencies of the h1–h3 morphotypes in M2 only. Thelocalities in the three-dimensional space form fourgroups relative to the E1 and E2 axes (Fig. 6).
The NJ tree (Fig. 7) shows more or less gradualchanges in molar morphology in Dicrostonyx overapproximately the last 240 ka. Only one group ofsamples dated to older than 180 ka BP was rela-tively isolated, probably because of the lack of sam-ples dated between 90 and 180 ka BP in ourmaterial. The sample from Medvezh’ya cave (brownloam A) was placed between the Recent samplesand postglacial ones.
Stages of gradual evolution of M1 and M2
Some important differences in the sizes of the samplesthat we used for our analyses of morphotypical traitsneed to be mentioned. Some samples included only 10
molars, whereas others included more than 100 mea-surements. It is very likely that the atypical composi-tion of the morphotypes in some samples (e.g. brownloam A of Medvezh’ya cave, Sed’yu-1) was because ofthe small amount of sample material from such locali-ties.
Our samples were divided into several relativelycompact groups based on the ratio of morphotypes(Figs 7, 8). These groups are not morphs or evenminor phases or morphological evolutionary levels ofmolars following the concept of Smirnov et al. (1997),but rather larger conditional stages of the evolutionaryhistory of teeth in collared lemmings.
The most morphologically archaic molars werefound in Akis, Gavrilovka and Bol’shaya Sluda. Theyrepresent the first, most ancient stage of the evolution-ary history of Dicrostonyx teeth in our study. The fre-quencies of molars of the simplicior morphotype atthese localities were not <91.7%. The distributions ofmorphotypical classes within the simplicior morpho-type in the first and second stages were almost identi-cal. In both cases, class s3 predominated with theexception being Gavrilovka, where many molars of s2were found amongst M2 (Table S2). The main differ-ence between the two stages was the higher proportionof henseli molars in the samples of the second stage.
Some less primitive morphology was observedamongst molars from localities Laya-3, Laya-4 andSerche’yu-1, which were morphs 3 and 2 of D. simplic-ior. These samples were considered the second stage ofevolution. The frequency of the simplicior morphotypewas the highest for both teeth, followed by henseli andtorquatus.
The third stage of molar evolution was correlatedwith the transitional morph D. simplicior–gulielmifound in the localities Chuley and Shapkina-4. These
Table 3. Spearman’s rank correlation coefficients between NMDS model variables (E1, E2, E3 axes) and M1, M2 nontransformed morpho-type frequencies and the share (%) of frequency variation, defined by linear combination of the NMDS axes.
Morphotypical classes E1 E2 E3 % E1 E2 E3 %M1 M2
s1 �0.46 �0.20 0.33 37.2 �0.39 �0.12 0.18 34.3s2 �0.41 0.06 0.20 52.6 �0.62 �0.20 0.09 68.3s3 �0.86 0.06 0.13 86.3 �0.69 �0.12 0.00 85.2s4 �0.78 0.32 0.00 54.9 �0.57 �0.06 �0.23 57.6s5 �0.57 0.37 �0.13 37.5 �0.25 0.53 0.02 13.2h1 �0.24 0.93 0.06 79.7 �0.23 0.92 0.35 80.9h2 0.28 0.60 �0.25 57.2 0.15 0.59 �0.37 60.4h3 0.28 0.40 �0.22 27.1 0.28 0.06 �0.44 31.7h4 0.44 0.16 �0.29 20.9 0.37 0.17 �0.22 15.4h5 0.59 0.04 �0.32 31.1 0.21 0.09 �0.16 8.4t1 0.67 �0.35 �0.26 26.7 0.49 �0.16 �0.29 21.5t2 0.61 �0.41 �0.19 55.4 0.41 �0.19 �0.15 8.4t3 0.61 �0.17 �0.02 37.6 0.37 0.03 �0.22 17.1t4 0.80 �0.41 �0.09 68.6 0.68 �0.21 �0.20 35.4t5 0.75 �0.27 0.22 78.9 0.66 �0.03 0.25 45.8t6 0.71 �0.30 0.09 65.7 0.82 �0.39 �0.20 80.1t7 0.66 �0.44 0.12 69.0 0.66 0.03 0.08 53.1t8 0.60 �0.36 0.12 56.0 0.73 �0.34 �0.12 65.5
BOREAS Evolution of molar shape of Pleistocene lemmings, NE European Russia 747

samples were very small and therefore were not suffi-ciently representative. However, taking this intoaccount, it should be noted that lemmings of thisphase were noticeably different from more developedlemmings in terms of the frequency of the simpliciormorphotype, which increased, and from more primi-tive lemmings in terms of the essential proportion ofthe henseli morphotype.
It was possible to combine some of the younger fos-sil assemblages (20–90 ka BP) into a group with thecharacteristic molar morphologies of both morphs 2and 3 of D. gulielmi (Serche’yu-3–6, Shapkina-3,Ryabovo, Nizhniy Dvoynik, Kipievo-2 and Laya-2).Teeth of the henseli morphotype predominated in thesesamples; torquatus molars were the second most fre-quent amongst M1. Assemblages formally in the thirdmorph of D. gulielmi were included in this groupbecause they had a considerable share of simpliciorteeth.
The fifth cluster consisted of material from the LateValdai localities. These samples demonstrated a rela-tively high diversity of morphotypes. In the ternaryplots, these samples formed a group stretching along
the henseli axis (Fig. 8). Most of these localities weredated by 14C to the Late Valdai and early Holocene (ina broad sense, approximately from 20 to 9 ka BP). Itshould be noted that within this time interval differentstages of molar evolutionary history are known: frommorph 1 D. torquatus to morph 3 D. gulielmi. Teeth ofthe henseli morphotype predominated (there werefewer torquatus molars) in both molars amongst themajority of samples. It is remarkable that our materialdoes not demonstrate the clear predominance of moreadvanced teeth at younger localities compared witholder ones.
In the last group, there were Recent samples with aclear predominance of molars of the torquatus mor-photype and represented by morph 3 of D. torquatus.
There was a huge gap in the complexity of molarsbetween the third and the fourth evolutionary phasesbecause intermediate levels of tooth evolution (morph1 of D. gulielmi and D. gulielmi-simplicior) were notfound in the study area.
Rates of evolutionary change in morphotypes
We have data from a compact area: the Nether-Polarand Northern Urals. Dicrostonyx remains were exca-vated from dated layers at Schuger-4, Kozhim-1 andMedvezh’ya cave, and Recent materials were collectedin the Bol’shezemel’skaya tundra and from Pay-Khoy.The rate of evolution was measured following Smirnov(2002) based on changes in morphotypes over1000 years. Our results are shown in Fig. 9.
As is very clear, not only did the morphological evo-lutionary rates vary for different time intervals butthey often changed in opposite directions. The rate ofchange in the henseli morphotype varied from –0.95%to 7.65% for 1000 years amongst M1 and from –3.724% to 5.23% for M2. Using the mean of threeRecent samples and loam B of Medvezh’ya cave asextremes in the time scale, the average rate of changein the henseli morphotype was 2.52% for M1 and1.78% (for the 1000 years) for M2. The mean rate mea-sured in the same way for the torquatus morphotypewas 1.77% for M2 and 2.5% for M1 for the 1000 years.The rates for both morphotypes were equal becausethe primitive simplicior morphotype was absent inyounger samples, when the two other morphotypesmade up the whole sample (i.e. the growth of oneoccurred at the expense of the reduction of another).
The changes in the proportions of morphotypeswere also evaluated (but very roughly) for the entireinterval: from the Pechora (Dnieper) to the present day(Fig. 10). The rate of morphotypical transformationwithin the different morphotypes and for different timeintervals greatly varied. A notable feature of the pro-cess was the dramatic increase in the frequency of thetorquatus morphotype for the last 20 ka, in contrast toits relatively gradual growth before then.
Age (cal. ka BP)
Age (cal. ka BP)
Fig. 5. Correlation of NMDS axes (E1, E2) with the age of localities.r = correlation coefficient.
748 Dmitry Ponomarev and Andrey Puzachenko BOREAS

Considering morphotypical changes, it is importantto introduce the notion of their scales (Smirnov 2002).Morphotypical dynamics within the entire intervalshould undoubtedly be assigned to an evolutionaryscale because changes twice reached the species rank.It is more difficult to identify the scale of changesobserved in short time-spans of a few thousand yearssuch as between samples from layers 2 and 3(13 710 cal. a BP) and 1 (11 710 cal. a BP) of Schu-ger-4 and Kozhim-1 (10 233 cal. a BP). The offset offrequencies of M1 (3.8% and 7.65%) between11 710 cal. a BP and 10 233 cal. a BP clearly standsout against the low rates of the two previous intervalsin the Late Pleistocene (0.95–1.75%), which is proba-bly correlated with early Holocene climate warming.It is possible that some hidden defects of our materialassociated with its collection, or with the sample size,can explain our results showing changes in oppositedirections.
Rates of morphological change can also beexpressed by statistical parameters such as pheneticdistances (MMD). Figure 11 shows the nonlinear rela-tion between the ages of samples and phenetic dis-tances (MMD). On average, as the difference in agebetween samples increased, so did the distance betweenthem. This should be expected because changes accu-mulate gradually over time, although it is ratherunclear owing to the great variation in the data. This
means that the final result is influenced not only bytime but probably also by the irregularity of the ratesof evolutionary transformation of occlusal shape andalso other processes that are difficult to measure andtake into account. A certain ‘nonlinearity’ of MMDdependency over time can be seen in our graphs (espe-cially for M1; Fig. 11). We found that when the age ofa locality varied by more than 160 ka, then the growthof its phenetic distance ‘accelerated.’ This indicates thegeneral irreversibility of the observed morphologicalchanges in collared lemming molars for the studiedtime range (i.e. the evolutionary scale of the process).In addition, its nonlinearity implies that the rate ofevolution is uneven but only for long time intervals.Overall, the occlusal surface of the teeth graduallybecame more complex during the course of evolutionof M1 and M2.
Dynamic of morphological diversity
The Shannon’s index demonstrated very significantvariation in dynamics in M1 and M2 (Table 4,Fig. 12). For both teeth, the lowest values of diversityoccurred in the most ancient samples. For a long per-iod of time, approximately 190–40 ka BP, morphologi-cal diversity remained at the average level. At the endof the Pleistocene, between 20 and 10 ka BP, it reachedmaximum values.
Fig. 6. Position of sample centroids in the space of the NMDS axes (E1, E2, E3).
BOREAS Evolution of molar shape of Pleistocene lemmings, NE European Russia 749

Morphological diversity in M1 depended upon theappearance of more complex, ‘progressive’ morpho-types (t1–t8) and on the amount of some ‘archaic’morphotypic variants (h1–h5). Morphological diver-sity in M2 depended upon morphotypical classes t4, t5and h2–h5. The dynamics of diversity in both teethwere well correlated (r=0.70, N=32, p<0.0001). Thehighest level of diversity in M1 was observed between15 and 12 cal. ka BP (mean: 12.5 cal. ka BP). An anal-ogous time window for M2 was 20–10 cal. ka BP(mean: 14.2 cal. ka BP). According to our data, theRecent samples have a low level of diversity comparedwith the Late Pleistocene samples. Accordingly, in NEEuropean Russia, the highest level of diversity of M1and M2 in collared lemmings occurred at the end ofMIS 2.
Figure 12 shows the most radical changes in molardiversity within a relatively short time window, at theend of the Pleistocene, when the distributions of mor-photypes were strongly bimodal. In the Holocene,morphological diversity in both molars significantlydecreased owing to a decline in the frequencies ofarchaic variants (henseli), and as a consequence, to theabsolute domination of progressive variants (torquatus;
t2–t8). However, it should be taken into account thatmodern data may represent a much shorter time inter-val (period of pellet accumulation) than fossil samplesand we analysed only three modern samples; therefore,we were unable to consider the real value of diversityin Recent populations.
Discussion
A gradual increase in the complexity of the occlusalsurface of Dicrostonyx molars took place duringthe Pleistocene in different parts of Eurasia. Thisevolutionary trend is used in Quaternary biostratigra-phy; however, there are several obstacles seriously lim-iting the determination of rock age based on theevolutionary levels of lemming molars (Smirnov et al.1986, 1997; Smirnov & Fedorov 2003). The main prob-lem is the very high level of molar complexity and geo-graphical variability in Recent Dicrostonyx. It wasfound that the complexity of M1 and M2 in Eurasiaincreases from west to east: the simplicior morphotypedisappears and the share of henseli becomes extremelylow. Two regions are distinguished: lemmings with sim-ple molars inhabited the area to the west of theKolyma River, and animals with complex teeth occu-pied territories to the east. The M1 and M2 of theNorth American collared lemming D. hudsonius aremorphologically identical to the teeth of the MiddlePleistocene species D. simplicior. The main conclusionbased on the geographical variation of modern col-oured lemmings is that there is no direct compatibilitybetween morphological and genetic similarities of dif-ferent lemming populations. This suggests that mor-phological resemblance is an example of parallel,independent and convergent evolution. High rates ofmolar evolution were observed in areas with variableenvironmental conditions as well as in areas with stableconditions. Hence, the most important conclusion forpalaeontologists, based on these results, is that differ-ent species of Dicrostonyx can be at an identical evolu-tionary level of molar complexity but still showsignificant variation in molar morphology even withina single subspecies (Smirnov et al. 1986, 1997; Smirnov& Fedorov 2003).
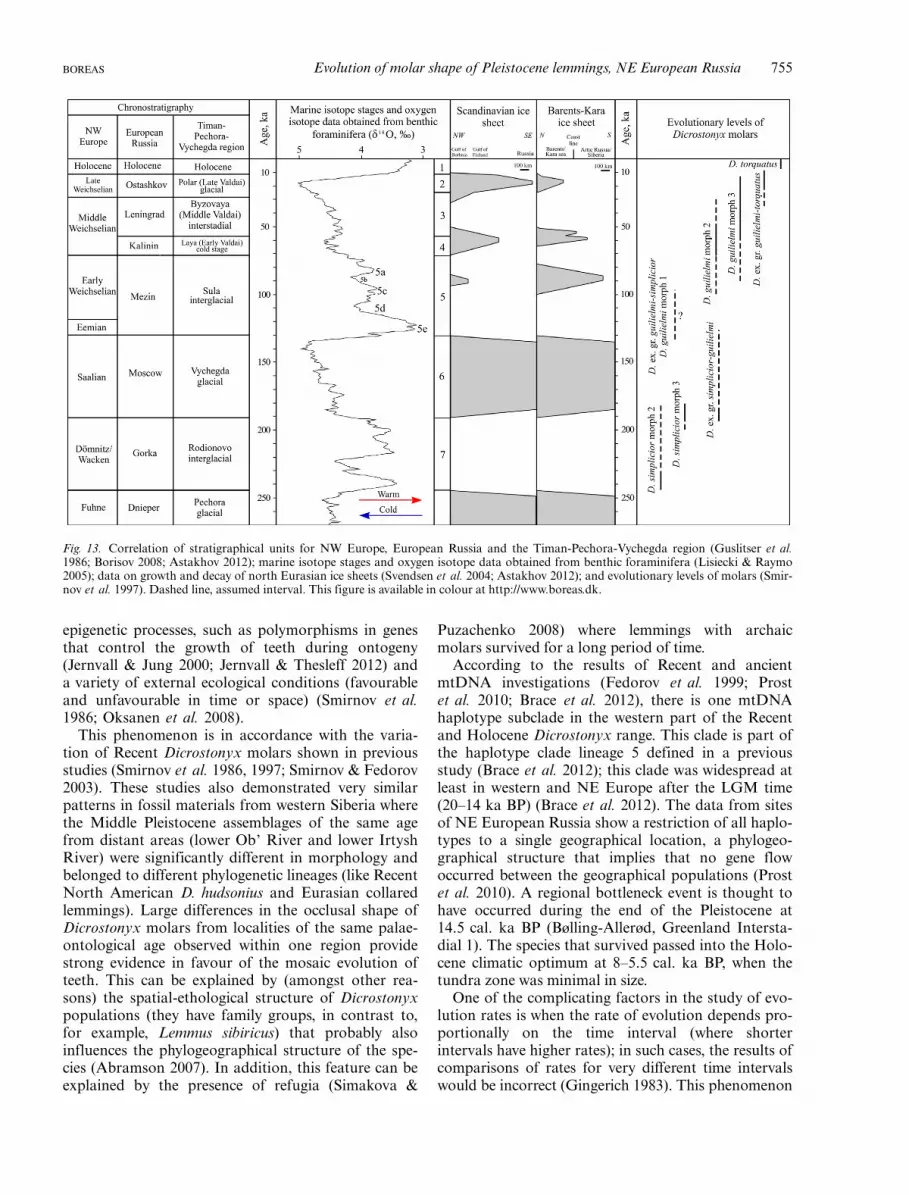
Out results can be compared with those of previousstudies (e.g. Guslitser 1981; Loseva et al. 1990; Kochev1993; Andreicheva 2002) and with the original conceptof Dicrostonyx tooth evolution proposed by Smirnovet al. (1997) and Smirnov (1999). Figure 13 shows acomparison of the morphological evolutionary levelson a chronostratigraphical chart.
Differences in the methodologies between thepresent study and previous studies led to differentresults regarding the morphotype distribution, andnot only for modern samples. For example, applyingthe technique of Kochev (1984) resulted in no M2sof the torquatus morphotype in the Serche’yu-1
Fig. 7. NJ dendrogram of collared lemming samples constructedusing the NMDS data (E1, E2 axes).
750 Dmitry Ponomarev and Andrey Puzachenko BOREAS

sample, whereas our method assigned 9% of teethto this morphotype. It should also be noted thattwo peak distributions of morphotypical classes insome cases were more clearly observed using ourmethod owing to the more detailed breakdown ofmorphotypes (Fig. S1).
Lemmings from Gavrilovka, Bol’shaya Sluda andAkis were dated to the Late Pechora (Dnieper) based
on the positions of bonebeds in the sections and on thelithology of diamictons (Andreicheva 2002). Remainsfrom Laya-4 were excavated from sediments of similarstratigraphical position, namely, between two diamic-tons dated by lithological traits to the Vychegda (Mos-cow) and Pechora (Dnieper) (Andreicheva 1992). Theincrease in the frequency of the henseli morphotype inmaterial from Gavrilovka, Bol’shaya Sluda and Akis
A
B
Fig. 8. Distribution of Dicrostonyx samples based on the ratio of morphotypes of M1 (A) and M2 (B). For definitions of morphotypes, seeMaterial and methods and Figs 2, 3. This figure is available in colour at http://www.boreas.dk.
BOREAS Evolution of molar shape of Pleistocene lemmings, NE European Russia 751

allows this assemblage to be dated to the EarlyVychegda (Moscow) although the Late Pechora cannotbe excluded. Dicrostonyx molars from Serche’yu-1 andLaya-3 are morphologically more advanced, and there-fore, considering the data on the stratigraphical posi-tion of layers and the lithology of tills (Andreicheva1992), we dated these assemblages to the EarlyVychegda (Moscow).
The molars from sites Chuley and Shapkina-4 aremore morphologically complex than teeth from Ser-che’yu-1 and Laya-3. Judging by the molar morphology,Smirnov (1999) suggested that these samples were of theLate Vychegda (Moscow), but the geological data do notsupport this conclusion. The bonebeds of Chuley andShapkina-4 underlie the Vychegda (Moscow) till, whichhas been reliably dated by lithological traits (Andreicheva1992, 2002), and the age of the Shapkina River basin issupported by a series of TL dates (Andreicheva &Marchenko-Vagapova 2007). Hence, it should beacknowledged that the most probable age of the Chuleyand Shapkina-4 sites is the Early Vychegda (Moscow).
The Late Vychegda (Moscow) and Early Sula(=Mikulino, Mezin) assemblages were most likely notfound in NE European Russia. It is probable thatlemmings of morph 1 of D. gulielmi and D. gulielmi-simplicior inhabited the study area during this timeinterval but that their remains were lost from the fossilrecord. Explaining this lack in the fossil record, Smir-nov et al. (1997) assumed that lemmings of morph 1 ofD. gulielmi lived during the Early Sula (=Mikulino,Mezin) Interglacial when the lemmings’ range wasgreatly restricted and the population dramaticallydeclined owing to climate warming.
Molars of Dicrostonyx from Serche’yu-3–6, Shapk-ina-3, the upper horizon of Kipievo, Laya-2, Ryabovoand Nizhniy Dvoynik had similar morphological com-plexity. Assemblages from Ryabovo, Nizhniy Dvoynikand Serche’yu-6 were assigned to morph 3 of D. guliel-mi, whereas remains from other localities were assignedto the more archaic morph 2 of the same species.Considering the differences in the morphological
A
B
Fig. 9. Changes in the percentages of the morphotypes henseli andtorquatus for M1 (A) and M2 (B) from the LGM to Recent times.The numbers on the curve indicate the rates of change in the percent-age for 1000 years. d18O, climate curve according to NGRIP (Svens-son et al. 2008). Samples from left to right: loam B of Medvezh’yacave; Schuger-4, layers 2 and 3; Schuger-4, layer 1; Kozhim-1; meanof three Recent samples. For definitions of morphotypes see Materialand methods and Figs 2, 3. This figure is available in colour at http://www.boreas.dk.
A
B
Fig. 10. Changes in the percentages of the three morphotypes of M1(A) and M2 (B) from the Pechora (Dnieper) to Recent times. UndatedLate Valdai and also very small (<10 teeth) samples are excluded. Fordefinitions of morphotypes see Material and methods and Figs 2, 3.This figure is available in colour at http://www.boreas.dk.
752 Dmitry Ponomarev and Andrey Puzachenko BOREAS

complexities of the molars, these two groups of sam-ples are not quite synchronous and were dated to dif-ferent episodes of the Early–Middle Valdai and LateSula. Thus, samples of lemmings of morph 2 ofD. gulielmi can be attributed to the cool intervals ofthe Late Sula (Mezin) or Laya (Early Valdai) (100–80 ka BP), whereas assemblages with remains ofmorph 3 were assigned to the Early Valdai or to theByzovaya (=Leningrad, Middle Valdai) Interstadial(approximately 60–30 ka BP) (Fig. 13). Taking the cli-matic complexity of this interval and its duration ofapproximately 60 ka (90–30 ka BP) into account, suchan assumption looks highly probable. Unfortunately,this suggestion can neither be proved nor refuted bythe available stratigraphical data. It appears that toultimately determine the age of the Middle Pleistocene,Early Valdai and Sula localities, new dating is needed.
It is worth mentioning here the results of applyingthe scheme of molar evolutionary levels proposedby Smirnov et al. (1997) to our material. The evolutionof M2 did not always take the lead over the develop-ment of M1 (Pizhma-1, Kozhim-1, Schuger-4), so thescheme should be slightly changed, taking thisinto account. This scheme is a convenient tool forevaluating the evolutionary level of molars and theircomplexity, and also, very importantly, for estimatingthe taxonomic level of differences, especially for theMiddle Pleistocene. Apparently it is meaningful toconsider the morphology of other molars, for example,m3, for evaluating the taxonomic rank of differencesfor localities older than the Early Pechora (Dnieper)because in those assemblages there still are m3 without
Table 4. Calibrated Shannon’s index (H, bit/tooth) and its standarderror (�m) of various M1 and M2 samples of Dicrostonyx.
Sample M1 M2
N H �m N H �m
Pay-Khoy, Recent 59 2.48 0.09 66 2.40 0.09Shapkina, Recent 88 2.51 0.08 78 2.44 0.10Ad’zva, Recent 66 2.79 0.08 67 2.26 0.10Kozhim-1 32 3.34 0.11 30 3.03 0.16Schuger-4, layer 1 27 3.19 0.15 22 3.57 0.11Schuger -4, layers 2–3 48 3.17 0.08 37 3.20 0.08Pizhma-1 101 2.79 0.08 96 2.78 0.07Sed’yu-1 10 2.81 0.10 19 3.26 0.16Medvezhya, loam A 17 3.23 0.15 15 2.75 0.14Medvezhya, loam B 158 2.79 0.05 163 2.66 0.04Shapkina-1 25 1.81 0.15 19 1.76 0.22Un’yinskaya 94 1.69 0.28 61 2.27 0.28Studyonaya-1, 0–20 cm 48 1.75 0.16 39 1.86 0.14Studyonaya-5, 80–100 cm 35 2.87 0.14 32 2.71 0.16Kur’yador 13 3.26 0.14 8 2.87 0.17Ryabovo 99 2.45 0.12 106 2.57 0.09Nizhniy Dvoynik 33 2.54 0.11 18 2.19 0.12Serche’yu-4 113 2.51 0.13 94 2.54 0.14Kipievo-2, upper 40 1.81 0.22 33 2.41 0.18Laya-2 105 2.79 0.20 83 2.48 0.21Serche’yu-5 47 2.01 0.11 40 2.27 0.12Serche’yu-6 22 2.00 0.07 14 2.65 0.15Serche’yu-3 74 2.49 0.17 55 3.10 0.19Shapkina-3 45 2.72 0.10 55 2.79 0.12Chuley 10 2.99 0.11 6 3.26 0.14Shapkina-4 10 2.95 0.08 16 3.02 0.10Serche’yu-1 18 2.41 0.22 11 2.17 0.23Laya-3 27 3.25 0.08 16 3.07 0.12Laya-4 15 3.01 0.14 9 2.33 0.16Akis’ 28 3.47 0.12 15 3.37 0.12Bol’shaya Sluda 12 2.69 0.17 8 1.98 0.23Gavrilovka 34 2.70 0.12 27 2.32 0.18
Age (cal. ka BP) Age (cal. ka BP)
Fig. 11. Dependency of phenetic distance (MMD) on time intervals. This figure is available in colour at http://www.boreas.dk.
BOREAS Evolution of molar shape of Pleistocene lemmings, NE European Russia 753

additional triangular lobes. In the case of collared lem-mings of the Middle and Late Pleistocene, it is betterto use two more rapidly evolving teeth, such as M1and M2, for taxonomic conclusions because it is con-venient.
The most important conclusion that we can drawfrom our study is that evolutionary levels of molarmorphology did not strictly serially follow each otherover time. During certain time intervals, lemmings withsufficiently different morphologies lived simulta-neously.
A scheme has been proposed to explain the mor-phological transition towards increased complexity of
cheek teeth in voles, including Dicrostonyx, based onchanging the combinations of basic morphotypes(Markova 2013). There should be relatively lowdiversity when the basic morphotypes in a popula-tion have the same level of morphological complexity(D. simplicior or modern D. torquatus). High diver-sity reflects a situation in which there are morpho-types with different levels of complexity at the sametime (for example, all combinations of simplicor,henseli and torquatus morphotypes in several LatePleistocene samples). The coexistence of individualswith varying degrees of tooth complexity in thepopulation may be a consequence of genetic and
Age (cal. ka BP)
Fig. 12. Evolutionary changes in the morphological diversity index (H) in M1 and M2 from the Pechora (Dnieper, Fuhne) to Recent times(points). Histograms show the morphotype distributions for different time slices. This figure is available in colour at http://www.boreas.dk.
754 Dmitry Ponomarev and Andrey Puzachenko BOREAS
epigenetic processes, such as polymorphisms in genesthat control the growth of teeth during ontogeny(Jernvall & Jung 2000; Jernvall & Thesleff 2012) anda variety of external ecological conditions (favourableand unfavourable in time or space) (Smirnov et al.1986; Oksanen et al. 2008).
This phenomenon is in accordance with the varia-tion of Recent Dicrostonyx molars shown in previousstudies (Smirnov et al. 1986, 1997; Smirnov & Fedorov2003). These studies also demonstrated very similarpatterns in fossil materials from western Siberia wherethe Middle Pleistocene assemblages of the same agefrom distant areas (lower Ob’ River and lower IrtyshRiver) were significantly different in morphology andbelonged to different phylogenetic lineages (like RecentNorth American D. hudsonius and Eurasian collaredlemmings). Large differences in the occlusal shape ofDicrostonyx molars from localities of the same palae-ontological age observed within one region providestrong evidence in favour of the mosaic evolution ofteeth. This can be explained by (amongst other rea-sons) the spatial-ethological structure of Dicrostonyxpopulations (they have family groups, in contrast to,for example, Lemmus sibiricus) that probably alsoinfluences the phylogeographical structure of the spe-cies (Abramson 2007). In addition, this feature can beexplained by the presence of refugia (Simakova &
Puzachenko 2008) where lemmings with archaicmolars survived for a long period of time.
According to the results of Recent and ancientmtDNA investigations (Fedorov et al. 1999; Prostet al. 2010; Brace et al. 2012), there is one mtDNAhaplotype subclade in the western part of the Recentand Holocene Dicrostonyx range. This clade is part ofthe haplotype clade lineage 5 defined in a previousstudy (Brace et al. 2012); this clade was widespread atleast in western and NE Europe after the LGM time(20–14 ka BP) (Brace et al. 2012). The data from sitesof NE European Russia show a restriction of all haplo-types to a single geographical location, a phylogeo-graphical structure that implies that no gene flowoccurred between the geographical populations (Prostet al. 2010). A regional bottleneck event is thought tohave occurred during the end of the Pleistocene at14.5 cal. ka BP (Bølling-Allerød, Greenland Intersta-dial 1). The species that survived passed into the Holo-cene climatic optimum at 8–5.5 cal. ka BP, when thetundra zone was minimal in size.
One of the complicating factors in the study of evo-lution rates is when the rate of evolution depends pro-portionally on the time interval (where shorterintervals have higher rates); in such cases, the results ofcomparisons of rates for very different time intervalswould be incorrect (Gingerich 1983). This phenomenon
Fig. 13. Correlation of stratigraphical units for NW Europe, European Russia and the Timan-Pechora-Vychegda region (Guslitser et al.1986; Borisov 2008; Astakhov 2012); marine isotope stages and oxygen isotope data obtained from benthic foraminifera (Lisiecki & Raymo2005); data on growth and decay of north Eurasian ice sheets (Svendsen et al. 2004; Astakhov 2012); and evolutionary levels of molars (Smir-nov et al. 1997). Dashed line, assumed interval. This figure is available in colour at http://www.boreas.dk.
BOREAS Evolution of molar shape of Pleistocene lemmings, NE European Russia 755

of ‘acceleration’ of rates of evolution becomes morecomprehensible if one takes into account that time is adenominator in the rate formula. Therefore, the longerthe time interval, the lower the rate of morphologicalevolution when other conditions are equal. Whenlocalities are of a similar age (in our case, <1000 years)then the morphological distance makes the main con-tribution to the rate value. The morphological distancecan be very large because of the mosaic pattern of evo-lution, so very high rates appear in the results.
Migration is apparently the main obstacle in theresearch of rates of morphological evolution of lem-mings (Smirnov 2002). It is very difficult to observeand prove migration although sometimes it becomespossible, and therefore while discussing rates of evolu-tion it is always necessary to have in mind that migra-tion is highly probable. Smirnov (2002) reported adecline in the rate of morphological change for inter-vals older than 20 ka (20–30 ka BP). This phenome-non is seemingly consistent with the tendency of atemporal distribution of morphological evolutionarylevels (stages) (Fig. 13). The chronospecies D. gulielmiexisted much longer than D. torquatus probablybecause the transformations within the henseli mor-photype took place more slowly than within torqua-tus. Thus, lemmings of morph 3 of D. gulielmi werepresent in the Late Sula and Early Valdai for 50 kaand animals of morph 2 existed for possibly eventwice as long, from the Late Sula to the Holocene(100 ka).
Irregularity in evolutionary rates is well known andis usually called the rule of ‘punctuated equilibrium’(Rautian 1988; Smirnov 2002). According to thismodel, there are two alternating statuses of an evolvingsystem: a short, unstable transitional one during whichthe system experiences a large infusion of novelty, anda long period of stasis (specialization process) duringwhich the main system traits remain stable. The dis-crete nature of the morphological changes in the genusDicrostonyx perhaps reflects this pattern to someextent. For example, the two peaks in the distributionof the morphotypical classes within the main morpho-types (simplicior, henseli and torquatus) imply thatthere are discrete morphs and correspondingly thereare certain stages of morphological evolution of teeththat are probably linked to irregularities in the rates ofevolution.
Conclusions
The history of morphotypical changes in occlusalshape of the first and the second upper molars of col-lared lemmings was described in terms of the levels oftooth evolution suggested by Smirnov et al. (1997). Itappears that the application of this evolutionaryscheme is the most convenient and descriptive way ofdelineating the morphological changes in the genus
Dicrostonyx for the Middle and Late Pleistocene, atleast within the studied area.
The use of a slightly modified method (applied tothe same samples) of measuring molar complexity hadlittle effect upon the estimations of evolutionary levelscompared with the techniques used in several previousstudies (Kochev 1993; Smirnov et al. 1997; Smirnov1999), with the exception of a somewhat higher pro-portion of advanced morphotypical classes in ourmaterial, which was expected.
Our results indicate that levels of tooth evolutiondid not always successively replace each other in time;rather, there were often synchronous populations atdifferent levels. Sufficient differences in molar occlusalshape of Dicrostonyx from localities of similar agewithin a given region support the notion of a mosaicpattern of morphotypical diversity and relatively inde-pendent, parallel evolution of lemming teeth. As themorphological diversity of ancient lemmings inthe study area demonstrated such mosaic patterns, themolecular-genetic methods became of particular rele-vance to reveal the palaeo-populations that were theancestors of modern animals.
Lemmings of morph 2 of D. simplicior lived duringthe Late Pechora (Dnieper) (Gavrilovka, Bol’shayaSluda and most likely Laya-4). In the Early Vychegda(Moscow), they were replaced by animals of morph3 of D. simplicior (Laya-3, Serche’yu-1) andD. simplicior-gulielmi (Chuley, Shapkina-4). Presum-ably, lemmings of the morphs D. gulielmi–simpliciorand morph 1 of D. gulielmi, whose remains have notyet been found in the fossil record, inhabited the regionduring the Late Vychegda (Moscow) glacial and EarlySula (=Mikulino, Mezin) Interglacial.
At the end of the Sula (Mezin) and possibly in theLaya (Early Valdai), lemmings of morph 2 of D. guliel-mi (Serche’yu-3–5, Shapkina-3, Laya-2, upper horizonof Kipievo) lived in the study area. Possibly at the endof the Laya (Early Valdai) and during the Byzovaya(Middle Valdai, Leningrad), the interstadial newmorph 3 of this species (Serche’yu-6, Ryabovo, Niz-hniy Dvoynik) appeared and existed during the Polar(Late Valdai) glacial (Un’inskaya, Studyonaya-5,Schuger-4) until the Pleistocene–Holocene boundary(Pizhma-1). Lemmings of the next level lived startingfrom the LGM (brown loam B of Medvezh’ya cave),during the Lateglacial (Sed’yu-1, Shapkina-1) anduntil the Early Holocene (Kozhim-1).
Our conclusions on the geological ages of localities,which were not dated using radiocarbon methods,depended to a great extent upon the debatable age esti-mates of alluvial units. The chronostratigraphy ofthose sediments is based on quite limited criteria.Thus, here we just briefly mention the main evidencefor our stratigraphical conclusions. To examine thegeology of not only single localities but also largerareas, analysing all characteristics helpful to the
756 Dmitry Ponomarev and Andrey Puzachenko BOREAS

stratigraphy of geological bodies and the stratigraphi-cal significance of fossil materials presented in the cur-rent work deserves special consideration that is beyondthe limits of this paper.
The rates of change in the M1 and M2 morpho-types and the morphological diversity in the teeth ofcollared lemmings varied over the entire time inter-val. The fastest replacement of morphotypes andhighest level of morphological diversity in NEEuropean Russia occurred approximately at the Late-glacial (16–10 cal. ka BP). This result is in agreementwith Smirnov’s (2002) conclusion about the highestrate of replacement being the gulielmi>torquatusmorphotypes (at 13 14C ka BP), obtained using morerepresentative materials for the Northern and MiddleUral regions.
The unstable rates of morphological changes makeit useless to average the values even for a relativelylong period, for example for the last 20 ka, becausemean rates for one interval do not help to under-stand the dynamics of previous stages. There is nodoubt that there are too many unknown parametersin the morphological evolution of collared lemmingteeth to judge the rates of evolution. To obtain moreaccurate rate estimations, molecular-genetic methodstogether with independent geochronological data fordifferent areas and for the whole time-span shouldbe used.
Acknowledgements. – This study was partly supported by RFBR# 13-05-00056. We are grateful to the reviewers of this paper,G. Cuenca-Besc�os and L.C. Maul, for valuable comments.
References
Abramov, A. V., Puzachenko, A. Yu. & Wiig, O. 2009: Cranial varia-tion in the European badger Meles meles (Carnivora, Mustelidae)in Scandinavia. Zoological Journal of the Linnean Society 157,433–450.
Abramson, N. I. 2007: Phylogeography: results, issues and perspec-tives. Vestnik VOGiS 11, 307–331.
Abramson, N. I. & Tikhonova, E. P. 2002: Morphometric varia-tion in collared lemming (Rodentia, Arvikolinae, Dicrostonyx)in the Eurasian Arctic in relation to karyotype and mito-chondrial DNA diversity. Russian Journal of Theriology 1,125–132.
Agadjanian, A. K. 1973: Pleistocene collared lemmings. In Markov,K. K. (ed.): Newest Tectonics, Newest Deposits and a Man, 320–355. Moscow University, Moscow (in Russian).
Agadjanian, A. K. 1976: The history of collared lemmings in thePleistocene. In Kontrimavichus, V. L. (ed.): Beringia in the Ceno-zoic, 289–295. Vladivistokskiy Nauchny Tsentr AN SSSR, Vlad-ivostok (in Russian).
Andreicheva, L. N. 1992: Main Tills of European Northeast of Russiaand their Stratigraphic Significance. 125 pp. Nauka, Saint-Peters-burg (in Russian).
Andreicheva, L. N. 2002: The Pleistocene of the European Northeast.323 pp. Ural Division of the Russian Academy of Sciences, Ekater-inburg (in Russian, with English summary).
Andreicheva, L. N. 2011: Paleogeographic environments of sedi-mentation in the ‘Kuriador’ key section of the Upper Pleisto-cene in the north-east of European Russia (the Vychegda River
basin). Lithosphere 2, 122–127 (in Russian, with English sum-mary).
Andreicheva, L. N. & Marchenko-Vagapova, T. I. 2007: The Neo-pleistocene of the north of European Russia: stratigraphy, paleoge-ography, and paleoclimate. Stratigraphy and Geological Correlation15, 421–436.
Anscombe, F. J. 1948: The transformation of poisson, binomial andnegative-binomial data. Biometrika 35, 246–254.
Astakhov, V. I. 2012: Pleistocene glaciations of northern Russia – amodern view. Boreas 42, 1–24.
Borisov, B. A. 2008: Quaternary system. In Zhamoyda, A. I. & Pet-rov, O. V. (eds.): Resolutions of the National Stratigraphic Commit-tee and its Permanent Commissions 38, 115–127. VSEGEI, StPetersburg (in Russian).
Borowik, O. A. & Engstrom, M. D. 1993: Chromosomal evolutionand biogeography of collared lemmings (Dicrostonyx) in the east-ern and High Arctic of Canada. Canadian Journal of Zoology 1,1481–1493.
Brace, S., Palkopoulou, E., Dal�enb, L., Listerd, A. M., Millere, R.,Ottee, M., Germonpr�ef, M., Blockleyg, S. P. E., Stewarth, J. R. &Barnes, I. 2012: Serial population extinctions in a small mammalindicate Late Pleistocene ecosystem instability. Proceedings of theNational Academy of Sciences of the United States of America 109,20532–20536.
Dzik, J. 1985: Typologic vs. population concepts of chronospecies:implications for ammonite biostratigraphy. Acta PalaeontologicaPolonica 30, 71–92.
Eger, J. L. 1995: Morphometric variation in the Nearctic collaredlemming (Dicrostonyx). Journal of Zoology 235, 143–161.
Ehrich, D., Fedorov, V. B., Stenseth, N. C., Krebs, C. J. & Kenney, A.J. 2000: Phylogeography and mtDNA diversity in North Americancollared lemmings (Dicrostonyx groenlandicus). Molecular Ecology9, 329–337.
Engstrom, M. D., Baker, A. J., Eger, J. L., Boonstra, R. & Brooks, R.J. 1993: Chromosomal and mitochondrial DNA variation in fourlaboratory populations of collared lemmings (Dicrostonyx). Cana-dian Journal of Zoology 71, 42–48.
Fedorov, V., Fredga, K. & Jarrel, G. 1999: Mitochondrial DNAvari-ation and evolutionary history of chromosome races of collaredlemmings (Dicrostonyx) in the Eurasian Arctic. Journal of Evolu-tionary Biology 12, 134–145.
Gileva, E. A. 1983: A contrasted pattern of chromosome evolutionin two genera of lemmings, Lemmus and Dicrostonyx. Genetica 60,173–179.
Gingerich, P. D. 1983: Rates of evolution: effects of time and tempo-ral scaling. Science 222, 159–161.
Green, R. F. & Suchey, M. J. 1976: The use of inverse sine transfor-mations in the analysis of nonmetric cranial data. American Jour-nal of Physical Anthropology 45, 61–68.
Guslitser, B. I. 1981: Comparison of sections of Pleistocene sedi-ments in the basins of the Rivers Pechora and Vychegda by the fos-sil rodent remains. In Kamaletdinov, M. A. & Yachimovich, V. L.(eds.): Pliocene and Pleistocene of Volga-Uralian Region, 28–41.Nauka, Moscow (in Russian).
Guslitser, B. I. & Isaychev, K. I. 1980: Collared lemming from thePleistocene sediments of the River Laya. In Molin, B. A. & Tsy-ganko, V. S. (eds.): Phanerozoic of the Northeast of the EuropeanPart of USSR, 81–95. Institut Geologii Komi filial AN SSSR, Sy-ktyvkar (in Russian).
Guslitser, B. I., Duryagina, D. A. & Kochev, V. A. 1985: Theage of the relief-forming moraines in the basins of the lowerRiver Pechora and the extent limit of the last ice sheet. InMolin, B. A. & Guslitser, B. I. (eds.): Subdivision and Correla-tion of the Phanerozoic Sediments of the European North ofUSSR, 97–107. Institut Geologii Komi filial AN SSSR, Sy-ktyvkar (in Russian).
Guslitser, B. I., Loseva, E. I., Lavrov, A. S. & Stepanov, A. N.1986: Timan-Pechora-Vychegda region (Scheme II). In Kras-nov, I. I. & Zarrina, Y. P. (eds.): Resheniye 2 Mezhvedomstven-nogo Stratigraficheskogo Soveshchania po Chetvertichnoi SistemeVostochno-Yevropeiskoi Platformy, 25–38. VSEGEI, Leningrad(in Russian).
BOREAS Evolution of molar shape of Pleistocene lemmings, NE European Russia 757

Guslitser, B. I. & Pavlov, P. Yu. 1988. Upper Paleolithic site Med-vezh’ya cave. In Savel’eva, E. (ed.): Sites of Stone and Metal Agesof the Northern Preurals. Materials on Archeology of EuropeanNorth East 11, 5–18. Rotaprint Komi nauchnogo tsentra, Syktyv-kar (in Russian).
Hartman, S. E. 1980: Geographical variation analysis of Dipodomysordii using nonmetric cranial traits. Journal of Mammalogy 61,436–448.
Hull, D. L. 1997: The ideal species concept – and why we can’t get it.In Oaridge, M. F., Dawah, H. A. & Wilson, M. R. (eds.): Species:The Units of Biodiversity, 357–380. Chapman & Hall, London.
Jernvall, J. & Jung, H.-S. 2000: Genotype, phenotype, and develop-mental biology of molar tooth characters. Yearbook of PhysicalAnthropology 43, 171–190.
Jernvall, J. & Thesleff, I. 2012: Tooth shape formation and toothrenewal: evolving with the same signals. Development 139, 3487–3497.
Kochev, V. A. 1984: An Estimation of Age of Quaternary Sedimentsby Fossil Remains of Collared Lemmings. 16 pp. Komi Science Cen-tre, Syktyvkar (in Russian).
Kochev, V. A. 1993: Pleistocene Rodents of North-Eastern Europe andtheir Stratigraphic Significance. 113 pp. Nauka, Saint-Petersburg(in Russian).
Krohne, D. T. 1982: The karyotype of Dicrostonys hudsonius. Journalof Mammalogy 63, 174–176.
Kruskal, B. 1964: Multidimensional scaling by optimizing goodnessof fit to nonmetric hypothesis. Psychometrika 29, 1–27.
Kupriyanova, I. F., Puzachenko, A. & Agadjanian, A. K. 2003: Tem-poral and spatial patterns of craniological variation in commonshrew, Sorex araneus (Insectivora). Zoologicheskiy Zhurnal 82,839–851 (in Russian with English summary).
Lisiecki, L. E. & Raymo, M. E. 2005: A Pliocene-Pleistocene stack of57 globally distributed benthic d18O records. Paleoceanography 20,PA1003, doi:10.1029/2004PA001071.
Loseva, E. I., Andreicheva, L. N., Duryagina, D. A., Konovalenko,L. A. & Kochev, V. A. 1990: Substantiation of Age of the Pleisto-cene Horizons of the European North-East. 27 pp. Komi ScienceCentre, Syktyvkar (in Russian).
Markova, E. A. 2013: Assesment of tooth complexity in Arvicolines(Rodentia): a morphotype-based ranking approach. ZoologicheskiiZhurnal 92, 968–980 (in Russian with English summary).
Musser, G. G. & Carleton, M. D. 2005: Superfamily Muroidea. InWilson, D. E. & Reeder, D. M. (eds.): Mammal Species of theWorld: a Taxonomic and Geographic Reference, 894–1531. TheJohns Hopkins University Press, Baltimore.
Nadachowski, A. 1982: Late Quaternary Rodents of Poland with Spe-cial Reference to Morphotype Dentition Analysis of Voles. 110 pp.Panstwowe Wydawnictwo Naukowe, Warszawa.
Oksanen, T., Oksanen, L., Dahlgren, J. & Olofsson, J. 2008: Arcticlemmings, Lemmus spp. and Dicrostonyx spp.: integrating ecologi-cal and evolutionary perspectives. Evolutionary Ecology Research10, 415–434.
Ponomarev, D. V. & Kryazheva, I. V. 2011: Late Pleistocene andHolocene small mammals from localities of the Schuger River (theNether-Polar Urals). Vestnik Instituta Geologii 7, 9–13 (in Rus-sian).
Ponomarev, D. V., van Kolfschoten, T. & van der Plicht, J. 2012: LateGlacial and Holocene micromammals of northeastern Europe.Russian Journal of Theriology 11, 121–130.
Ponomarev, D., Puzachenko, A., Bachura, O., Kosintsev, P. &van der Plicht, J. 2013: Mammal fauna during the Late Pleis-tocene and Holocene in the far northeast of Europe. Boreas42, 779–797.
Prost, S., Smirnov, N., Fedorov, V. B., Sommer, R. S., Stiller, M., Na-gel, D., Knapp, M. & Hofreiter, M. 2010: Influence of climatewarming on arctic mammals? New insights from ancient DNA.Studies of the collared lemming Dicrostonyx torquatus. PLoS ONE5, e10447, doi:10.1371/journal.pone.0010447.
Puzachenko, A. Y. 2001: Skull variability in the common mole ratSpalax microphthalmus (Spalacidae, Rodentia). 1. A method foranalysis of data, non-age variability in males. Zoologicheskiy Zhur-nal 80, 343–357 (in Russian with English summary).
Rausch, R. L. & Rausch, V. R. 1972: Observations on chromosomesof Dicrostonyx torquatus stevensoni Nelson and chromosomediversity in varying lemmings. Zeitschrift f€ur S€augetierkunde 37,372–384.
Rautian, A. S. 1988: Paleontology as a source of information on pat-terns and factors of evolution. In Menner, V. V. & Makridin, V. P.(eds.): Modern Paleontology 1, 76–117. Nedra, Moscow (in Rus-sian).
Reimer, P. J., Baillie, M. G. L., Bard, E., Bayliss, A., Beck, J. W.,Blackwell, P. G., Bronk Ramsey, C., Buck, C. E., Burr, G. S.,Edwards, R. L., Friedrich, M., Grootes, P. M., Guilderson, T. P.,Hajdas, I., Heaton, T. J., Hogg, A. G., Hughen, K. A., Kaiser, K.F., Kromer, B., McCormac, F. G., Manning, S. W., Reimer, R. W.,Richards, D. A., Southon, J. R., Talamo, S., Turney, C. S. M., vander Plicht, J. & Weyhenmeyer, C. E. 2009: IntCal09 and Marine09radiocarbon age calibration curves, 0–50 000 years cal BP. Radio-carbon 51, 1111–1150.
Saitou, N. & Nei, M. 1987: The neighbor-joining method: a newmethod for reconstructing phylogenetic trees. Molecular Biologyand Evolution 4, 406–425.
Saylo, M. C., Escoton, C. C. & Saylo, M. M. 2011: Punctuated equi-librium vs. phyletic gradualism. International Journal of Bio-Sci-ence and Bio-Technology 3, 27–42.
Simakova, A. N. & Puzachenko, A. Y. 2008: The vegetation duringthe Last Glacial Maximum (LGM) (≤24.0–≥17.0 kyr BP). InMarkova, A. K., van Kolfschoten, T. (eds.): Evolution of the Euro-pean Ecosystems during the Pleistocene - Holocene Transition (24–8 kyr BP), 315–341. KMK, Moscow (in Russian with Englishsummary).
Smirnov, N. G. 1996: Small mammal diversity of Northern Urals inthe Late Pleistocene and Holocene. In Smirnov, N. G. (ed.): Mate-rialy I Issledovanija Po Istorii Sovremennoj Fauny Urala: SbornikNauchnyh Trudov, 39–83. Izdatelstvo Ekaterinburg, Ekaterinburg(in Russian).
Smirnov, N. G. 1999: The news in the Quaternary paleotheriology ofthe European northeast. In Yushkin, N. P. (ed.): Geology and Min-eral Resources of the European Northeast of Russia: New Resultsand New Perspectives. Materials of XIII Geological Congress ofKomi Republic 2, 286–288. Institute Geologii Komi SC RAS,Syktyvkar (in Russian).
Smirnov, N. G. 2002: Rates of morphological changes in popula-tions as a one of characteristics of the chronological structure ofevolutionary process. In Glotov, N. V. & Zhukova, L. A. (eds.):All-Russian Population Seminar ‘Population, Community, Evolu-tion’, 190–210. Novoe Znanie, Kazan’ (in Russian).
Smirnov, N. G. & Bol’shakov, V. N. 1985: Unevenness of complica-tion rates of teeth of collared lemmings. Doklady Academy of Sci-ences of USSR 281, 1017–1020 (in Russian).
Smirnov, N. G. & Fedorov, V. B. 2003: Holarctic collared lemmings:traces of their spread as related to the history of the Arctic Biota.Russian Journal of Ecology 34, 332–338.
Smirnov, N. G., Bolshakov, V. N. & Borodin, A. V. 1986: PleistoceneRodents of the North of Western Siberia. 145 pp. Nauka, Moscow(in Russian).
Smirnov, N. G., Golovachev, I. B., Bachura, O. P., Kuznetsova, I. A. &Cheprakov, M. I. 1997: Complicated cases of identifying rodentteeth from Late Pleistocene and Holocene deposits of tundraregions of Northern Eurasia. InKosintsev, P. A. (ed.):Materialy PoIstorii I Sovremennomu Sostojaniju Fauny Severa Zapadnoj Sibiri:Sbornik Nauchnyh Trudov, 60–90. Riphey, Chelyabinsk (in Russian).
Sutcliffe, A. J. & Kowalski, K. 1976: Pleistocene rodents of theBritish Isles. Bulletin of the British Museum (Natural History),Geology 27, 31–147.
Svendsen, J. I., Alexanderson, H., Astakhov, V. I., Demidov, I.,Dowdeswell, J. A., Funder, S., Gataullin, V., Henriksen, M., Hjort,C., Houmark-Nielsen, M., Hubberten, H. W., Ing�olfsson, �O. ., Ja-kobsson, M., Kjær, K. H., Larsen, E., Lokrantz, H., Lunkka, J. P.,Lys�a, A., Mangerud, J., Matioushkov, A., Murray, A., M€oller, P.,Niessen, F., Nikolskaya, O., Polyak, L., Saarnisto, M., Siegert, C.,Siegert, M. J., Spielhagen, R. F. & Stein, R. 2004: Late Quaternaryice sheet history of northern Eurasia. Quaternary Science Reviews23, 1229–1271.
758 Dmitry Ponomarev and Andrey Puzachenko BOREAS

Svensson, K., Andersen, K., Bigler, M., Clausen, H. B., Dahl-Jensen, D., Davies, S. M., Johnsen, S. J., Muscheler, R., Parre-nin, F., Rasmussen, S. O., R€othlisberger, R., Seierstad, I., Stef-fensen, J. P. & Vinther, B. M. 2008: A 60 000 yearGreenland stratigraphic ice core chronology. Climate of thePast 4, 47–57.
Tchernyavskiy, F. B. & Kozlovskiy, A. I. 1980: The species status andthe history of collared lemmings (Dicrostonyx, Rodentia) of theWrangel Island. Zoological Journal 59, 266–273 (in Russian withEnglish summary).
Tsytsulina, K., Formozov, N. & Sheftel, B. 2008: Dicrostonyxtorquatus. The IUCN Red List of Threatened Species. Ver-sion 2014.3. Available at: www.iucnredlist.org (accessed 15.11.2014).
Vasil’yev, A. G., Vasil’yeva, I. A. & Bol’shakov, V. N. 2007: Phenoge-netic Variability and its Studying Methods. Tutorial. 278 pp. Ura-lian University, Ekaterinburg (in Russian).
van Wynsberghe, N. R. & Engstrom, M. D. 1992: Chromosomal var-iation in collared lemmings (Dicrostonyx) from the west HudsonBay region.Muskox 39, 203–209.
Zazhigin, V. S. 1976: Early evolutionary stages of collared lem-mings (Dicrostonychini, Microtinae, Rodentia) as characteristicrepresentatives of Beringian Subarctic fauna. In Kon-trimavichus, V. L. (ed.): Beringia in the Cenozoic, 280–288.Vladivistokskiy Nauchny Tsentr AN SSSR, Vladivostok (inRussian).
Zazhigin, V. S. 2003: On collared lemmings (Dicrostonyx, Microti-nae, Rodentia) of Oygos-Yar in Eastern Siberia and on taxonomicstatus of Middle Pleistocene species of Dicrostonyx genera. InNikol’skiy, P. A. et al. (eds.): Natural History of Russian EasternArctic in Pleistocene and Holocene, 14–26. GEOS, Moscow (inRussian).
Supporting Information
Additional Supporting Information may be found inthe online version of this article at http://www.bor-eas.dk.
Fig. S1. Comparison of frequency distributions ofmorphotypical classes of M1, assigned according tothe method suggested by Smirnov et al. (1997) (leftcolumn) and according to the method used in thiswork (right column). s1–s5, classes in the simpliciormorphotype; h1–h5, henseli morphotype; t1–t8, tor-quatus morphotype. For definitions of morphotypessee Material and methods and Figs 2 and 3.
Table S1. Relative frequencies (%) of the M1morphotypes in various samples of Dicrostonyx.Morphotypes simplicior (s1–s5), henseli (h1–h5)and torquatus (t1–t8). For definitions of morpho-types see Material and methods and Figs 2 and 3.
Table S2. Relative frequencies (%) of M2 morphotypesin various samples of Dicrostonyx. Morphotypessimplicior (s1–s5), henseli (h1–h5) and torquatus (t1–t8). For definitions of morphotypes see Material andmethods and Figs 2 and 3.
BOREAS Evolution of molar shape of Pleistocene lemmings, NE European Russia 759


