Embed Size (px)
Citation preview
http://pqx.sagepub.com/Police Quarterly
http://pqx.sagepub.com/content/early/2012/07/16/1098611112451262The online version of this article can be found at:
DOI: 10.1177/1098611112451262
published online 11 July 2012Police QuarterlyWilliam Terrill and Eugene A. Paoline III
From a National Use-of-Force StudyExamining Less Lethal Force Policy and the Force Continuum: Results
Published by:
http://www.sagepublications.com
On behalf of:
Police Executive Research Forum Police Section of the Academy of Criminal Justice Sciences
can be found at:Police QuarterlyAdditional services and information for
http://pqx.sagepub.com/cgi/alertsEmail Alerts:
http://pqx.sagepub.com/subscriptionsSubscriptions:
http://www.sagepub.com/journalsReprints.navReprints:
http://www.sagepub.com/journalsPermissions.navPermissions:
What is This?
- Jul 11, 2012OnlineFirst Version of Record
- Jul 17, 2012OnlineFirst Version of Record >>
at MICHIGAN STATE UNIV LIBRARIES on October 3, 2012pqx.sagepub.comDownloaded from
Police QuarterlyXX(X) 1 –28
© 2012 SAGE PublicationsReprints and permission:
sagepub.com/journalsPermissions.navDOI: 10.1177/1098611112451262
http://pqx.sagepub.com
451262 PQXXXX10.1177/1098611112451262Terrill and PaolinePolice Quarterly
1Michigan State University, East Lansing, MI, USA2University of Central Florida, Orlando, FL, USA
Corresponding Author:William Terrill, Associate Professor, Michigan State University, School of Criminal Justice, 532 Baker Hall, East Lansing, MI 48824-1118, USA Email: [email protected]
Examining Less Lethal Force Policy and the Force Continuum: Results From a National Use-of-Force Study
William Terrill1 and Eugene A. Paoline, III2
Abstract
The less lethal coercive power granted to police officers is not without its restrictions. Such limitations are delineated per the United States Supreme Court, via Graham v. Connor, applying the broad standard of objective reasonableness. A far more salient operational guide to assessing what is objectively reasonable rests within departmental use-of-force policy, which like other police policies can vary widely from jurisdiction to jurisdiction. To date, comprehensive empirical inquiries regarding this jurisdictional variation is unknown. At best, extant research has noted that many agencies tend to instruct officers via a force continuum, although the nature (i.e., various designs, levels, and ordering of force tactics, and appropriate force relative to citizen resistance) of such policies are relatively unknown. Based on a multiwave national survey of policing agencies, the following study examines not only the extent to which departments utilize a use-of-force continuum within their less lethal force policy, but also the types of continuum designs used and the ways in which various force tactics and citizen resistance types are situated along a continuum. The results reveal that more than 80% of responding agencies utilize a use-of-force continuum, of which the linear design is the most popular. However, the placement of various force tactics and consideration of suspect resistance vary greatly across departments. In essence, there is no commonly accepted force continuum used by practitioners. The implications of these findings are considered.
Keywords
police, use of force, coercion, policy, administrative rulemaking
at MICHIGAN STATE UNIV LIBRARIES on October 3, 2012pqx.sagepub.comDownloaded from
2 Police Quarterly XX(X)
Society permits the police to use force in the course of their duties. At the same time, limitations are set defining the extent of coercive power that the police may exercise in maintaining order and enforcing laws. Such restrictions have two interrelated com-ponents. The first is legally based and stems from the U.S. Supreme Court via Graham v. Connor, 490 U.S. 86 (1989), which states that force at arrest must be “. . . objec-tively reasonable in view of all the facts and circumstances of each particular case. . .” Despite direction from the high court, determining force that is “objectively reason-able” is not an easy task. As a result, police departments rely on a second component, use-of-force policy, which is administratively based to establish parameters for the application of force (Walker, 2007). Within this context, such policies are sometimes linked to a continuum, which detail varying levels of force in terms of severity, with the explicit purpose of offering officers guidance on how to respond to resistant citi-zens (Terrill, 2005).1 Thus, force continuum policies attempt to more readily clarify what may be considered objectively reasonable force.
There are several structural permutations involving the use of a force continuum. One of the earliest, the linear design, is modeled in the form of a ladder or hierarchical steps. According to McEwen (1997), this type of “continuum approach is to rely first on the officer’s presence to quell a situation, and if that fails, to move to increasingly severe types of force” (p. 49). Another type of a continuum structure is referred to as a modified-linear design, where subject resistance is placed into one of several levels and force options for escalation (and de-escalation) are presented within each level (see Connor, 1991). Other designs are laid out in matrix form or depicted by a wheel (see Hoffman, Lawrence, & Brown, 2004). In the matrix approach, varying forms of suspect resistance are presented along rows while varying police responses are offered on a horizontal axis. The wheel design is depicted in a circular fashion, with resistance and force options shown in a series of concentric circles (e.g., an inner circle of suspect resistance types, followed by an outer circle displaying varying forms of force in ran-dom order). This model, sometimes referred to as a “situational” continuum structure, instructs officers not to assume stepwise or linear progression.
Regardless of what continuum approach (e.g., linear, modified linear, matrix, wheel) a particular agency chooses to use (if any), the placement of different forms of force within a continuum structure can vary. For instance, there has been some debate as to whether chemical irritant sprays such as Oleoresin Capsicum (OC) should be used before or after an officer attempts to use some form of hands-on force (i.e., weap-onless force; Terrill, 2001). The same debate has begun to stir recently with respect to the placement of Conducted Energy Devices (CEDs; for example, TASER®), as some departments place these weapons low on the continuum (i.e., right after verbal direc-tion) and other agencies place it high (i.e., just before deadly force; U.S. Government Accountability Office, 2005, see also Alpert & Dunham, 2010; Thomas, Collins, & Lovrich, 2010, 2011). Of course, the implication is that some agencies view CED use as more of a first resort, whereas others encourage CED use just prior to deadly force.
Complicating matters further, some departments may rely on less specific types of continuum policies whereby force and citizen resistance are referred to only in vague
at MICHIGAN STATE UNIV LIBRARIES on October 3, 2012pqx.sagepub.comDownloaded from
Terrill and Paoline 3
terms and not categorized into specific levels, and others may offer very detailed poli-cies that lay out several levels of both force and resistance (and link force to resis-tance). Thus, not only can use-of-force policy designs vary but the placement of tactics (i.e., the ordering of hands- and weapon-based tactics) within such designs can vary as well, in terms of the incorporation of force relative to citizen resistance, which speaks directly to policy restrictiveness.
Extant research on less lethal use-of-force policies has generally taken three broad-based forms. One area has focused on the extent to which agencies utilize a use-of-force continuum and/or the various supplemental or contextual elements of force policy (e.g., whether or not there are written policies, types of tactics/weapons permit-ted, training, report and review requirements, etc., Alpert & Dunham, 2004; Hough & Tatum, 2012; McEwen, 1997; Pate & Fridell, 1993; U.S. Government Accountability Office, 2005). A second area of research has focused on the theoretical and practical principles underlying use-of-force policies that utilize a continuum (i.e., how force should be calculated relative to citizen resistance), which has also included studies aimed at the correlates of force along the continuum (Alpert & Dunham, 1997; Bazley, Lersch, & Mieczkowski, 2007; Bertomen, 2003; Crawford & Burns, 1998; Garner, Schade, Hepburn, & Buchanan, 1995; Kaminski, Edwards, & Johnson, 1999; Klinger, 1997; Terrill, 2005; Terrill & Mastrofski, 2002). A third area has focused on the con-troversy surrounding contemporary use-of-force weapons (i.e., chemical sprays and CEDs). As part of such inquiries, researchers have examined the overall effectiveness (e.g., incapacitating suspects, officer and suspect injuries, etc.) of chemical sprays and CEDs, across single (or a handful of) police organizations, with implications for where they might best be placed on a force continuum (Adang & Mensink, 2004; Kaminski et al., 1999; Smith, Kaminski, Rojek, Alpert, & Mathis, 2007; Taylor & Woods, 2010; Terrill & Paoline, 2012; White & Ready, 2007). Other work in this area, and more in line with the current study, has focused on organizational analyses regarding where these weapons are specifically placed on a use-of-force continuum (Alpert & Dunham, 2010; Thomas et al., 2010, 2011).
Although researchers have examined use-of-force policies and continuums in a variety of ways, not a single peer-reviewed study, to date, has attempted to determine the extent of, and variation in, less lethal force policies as a collective whole (i.e., the full range of hands- and weapon-based force options). This void in the literature is particularly noteworthy given the great number of police agencies throughout the country (i.e., more than 12,000 local agencies according to Hickman & Reaves, 2003). Unlike previous research on lethal force, where a defense-of-life protocol became the standard policy approach adopted by nearly all large-scale departments, even prior to the 1985 Tennessee v. Garner landmark case (Fyfe, 1988), the extent to which some sort of consistent guiding principle pervades less lethal policy adaptations, across American police departments, has simply not been investigated.
The present inquiry seeks to fill this empirical void using data collected as part of a national survey of police departments. In particular, we seek to identify the types of policy approaches being used by police agencies across the United States, the extent
at MICHIGAN STATE UNIV LIBRARIES on October 3, 2012pqx.sagepub.comDownloaded from
4 Police Quarterly XX(X)
of variation found within such approaches, and the degree to which police agencies employ varying types of restrictive (and unrestrictive) forms of less lethal policies as a means to guide officer decision making. As such, this research is different from pre-vious policy inquiries in that it is a comprehensive examination of the overall structure and the internal mechanisms of less lethal force instruction, which provides the foun-dation for assessing use-of-force appropriateness.
Less Lethal Administrative Policy and Force ContinuumsWalker (1993) notes that the use of administrative policy is the primary instrument in “. . . which law enforcement agencies attempt to control officer discretion” (p. 23). One only needs to examine the Law Enforcement Management and Administrative Statistics (LEMAS) survey results (Hickman & Reaves, 2003) to glean a rough parameter as to the extent to which police agencies rely on administrative policies over a wide range of activities (e.g., vehicle pursuits, domestic assaults, use-of-force, etc.). In terms of less lethal force policy, Terrill and Paoline (2006) recently reported that more than 97% of police departments in the United States use some form of writ-ten policy. There is also evidence indicating that force and resistance continuums are often part of broader less lethal policies. The earliest attempt to empirically document how often police agencies use a force continuum approach was conducted by McEwen (1997). He found that only 25% (24 of the 96) of the agency policies reviewed incor-porated a continuum. However, agency selection was based on a convenience sample rather than a national representative, thereby limiting generalizability. In 1998, the Police Executive Research Forum (PERF) conducted a national survey of police agen-cies that focused on police use-of-force reporting protocols. One of the pieces of information collected was whether agencies relied on a use-of-force continuum. As part of this survey, Alpert and Dunham noted that of 571 responding agencies, “. . . 72 percent were based on a use-of-force continuum” (2004, p. 156).2
Beyond the fact that most agencies appear to use a force continuum approach as part of their less lethal force policy approach, we know very little, at least empirically, with respect to continuum design (e.g., linear, modified linear, matrix, wheel) and tactical placement (e.g., force/resistance). In terms of design, Adams and Jennison (2007, p. 450) state, “The most popular use-of-force continuum conceptualizes police actions in a step-ladder arrangement.” However, they offer no evidence supporting such a statement.3
In terms of tactical placement, there is also a lack of comprehensive empirical assessments of less lethal force policies (i.e., explanations of variation across all force options). As Fridell (2005, p. 47) notes regarding use-of-force continuums, “Police agencies across the country differ with regard to the number and definitions of force levels on the continuum.” However, we currently lack a clear understanding as to the “extent” of policy variation. Nonetheless, researchers have begun to work toward this end by focusing on the appropriate tactical placement of contemporary
at MICHIGAN STATE UNIV LIBRARIES on October 3, 2012pqx.sagepub.comDownloaded from
Terrill and Paoline 5
use-of-force weapons (i.e., chemical sprays and CEDs) relative to resistance encoun-tered from citizens.
In 2004-2005, the United States General Accounting Office (GAO, 2005) con-ducted a review of force policies in seven police agencies and reported fairly wide-spread variation in terms of the tactical placement of CEDs (e.g., from low to high placement on the continuum). A few years later, in 2007-2008, Thomas and colleagues (2010) conducted a national survey of 210 police agencies asking respondents to indi-cate where, on a 0 to 10 standardized force continuum (with 0 being officer presence and 10 being lethal force), CEDs would fall. They found that more than 60% of the departments place CEDs between 5 and 7 (mean = 5.6). In a second article, using the same data, but with a reduced number of cases (n = 124), Thomas and colleagues (2011) compared CED policies with the model policy set forth by PERF in 2005. With respect to tactical placement, they found that 75 of the 124 agencies place CED at a level on the continuum where suspects must be “actively” resisting before CEDs are permitted via policy.
In a final weapon-based policy inquiry, Alpert and Dunham (2010), drawing on the PERF survey data noted in a governmental report by Smith et al. (2010), found that 57% of the agencies locate CEDs and chemical irritant sprays (e.g., Oleoresin Capsicum) at the same level on a force continuum, with another 36% placing CEDs higher. After presenting responding agencies with five situational vignettes involving varying types of citizen resistance, they found that the majority of agencies begin per-mitting CED use once suspects engage in some form of midlevel-type resistance such as “tensing up” or attempting to avoid being handcuffed. The authors conclude “that there is a movement toward standardization of practices within agency policies regard-ing the placement of CEDs” (2010, p. 246).
Current InquiryAlthough prior work has shed light on aspects of police use-of-force policy, and the use of a continuum approach in connection with less lethal weapons, we are left with few answers in relation to the extent of, and variation in, less lethal force policies as a collected whole. Other than the prevalence of use-of-force continuums, at the pres-ent time we know little (beyond anecdotal reports and rudimentary estimates) about the extent of, and variation in, policy types in terms of design, tactical placement of force options, and incorporation of varying types of citizen resistance. Within this context, using data collected as part of a national survey of police departments, the current study poses the following research questions:
Research Question 1: To what extent do agencies use a force continuum?Research Question 2: What type of force continuum designs do agencies most
often use?Research Question 3: How do agencies rank force tactics and citizen resistance
on a continuum?
at MICHIGAN STATE UNIV LIBRARIES on October 3, 2012pqx.sagepub.comDownloaded from
6 Police Quarterly XX(X)
Method
The data for the current inquiry are drawn from the Assessing Police Use of Force Policy and Outcomes project, a National Institute of Justice (NIJ)–funded study designed to examine a host of use-of-force issues (e.g., officer perceptions, degree of force usage, injuries, complaints, lawsuits). A primary component of this project involved administering a mail survey to a stratified random sample of police agencies across the country to explore the types of force policies that exist.
Survey ElementsThe survey included several sections involving a total of 57 questions. For instance, we asked whether the agency had a formal written policy on less lethal force and whether there were specific written directives for each type of force as well as numer-ous questions involving the report and review process (e.g., if force reporting was required, what constituted reportable force, whether an officer or supervisor was responsible for filing the report, and at what levels of the organization were reports reviewed?). The key elements of the survey captured whether an agency employed a force continuum approach within their policy, the type or design of continuum used, and more important, the placement of various force and resistance behaviors within a continuum framework. Thus, we draw on those questions asking respondents whether their agency relied on a force continuum as part of their policy, and if so, the type (i.e., design) of policy followed by a listing of how varying tactics and weapons are placed on the continuum (i.e., tactical placement) in terms of severity, as well as the connec-tion between force types/levels and varying forms of citizen resistance.
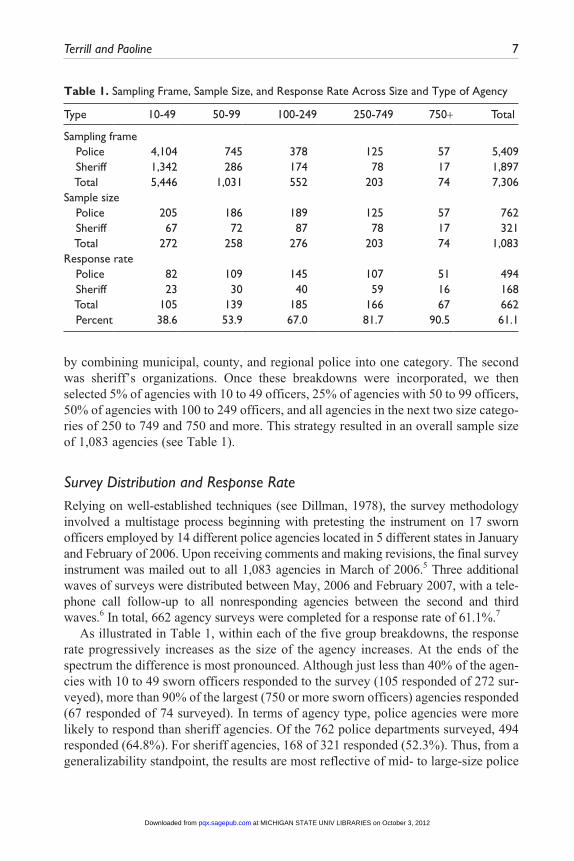
Sampling FrameAlthough there were 17,784 police agencies in the United States as of 2000, according to the Census of State and Local Law Enforcement Agencies, our sampling frame was comprised to include the 7,306 agencies that (a) have primary responsibility for polic-ing a residential population, (b) employ 10 or more full-time police officers, and (c) are a municipal or county agency (see Table 1). Selection based on these three criteria include more than 90% of all full-time sworn officers in the country (Weisburd, Greenspan, Hamilton, Williams, & Bryant, 2000).4
Sample SelectionDue to large differences in the number of agencies in different size categories, a dis-proportionate stratified random sampling strategy was employed based on agency size and type. For agency size, we chose five categories based on number of full-time sworn officers with arrest powers (i.e., 10-49, 50-99, 100-249, 250-749, and 750+ officers). For agency type, we established two categories. The first was police, formed
at MICHIGAN STATE UNIV LIBRARIES on October 3, 2012pqx.sagepub.comDownloaded from
Terrill and Paoline 7
by combining municipal, county, and regional police into one category. The second was sheriff’s organizations. Once these breakdowns were incorporated, we then selected 5% of agencies with 10 to 49 officers, 25% of agencies with 50 to 99 officers, 50% of agencies with 100 to 249 officers, and all agencies in the next two size catego-ries of 250 to 749 and 750 and more. This strategy resulted in an overall sample size of 1,083 agencies (see Table 1).
Survey Distribution and Response RateRelying on well-established techniques (see Dillman, 1978), the survey methodology involved a multistage process beginning with pretesting the instrument on 17 sworn officers employed by 14 different police agencies located in 5 different states in January and February of 2006. Upon receiving comments and making revisions, the final survey instrument was mailed out to all 1,083 agencies in March of 2006.5 Three additional waves of surveys were distributed between May, 2006 and February 2007, with a tele-phone call follow-up to all nonresponding agencies between the second and third waves.6 In total, 662 agency surveys were completed for a response rate of 61.1%.7
As illustrated in Table 1, within each of the five group breakdowns, the response rate progressively increases as the size of the agency increases. At the ends of the spectrum the difference is most pronounced. Although just less than 40% of the agen-cies with 10 to 49 sworn officers responded to the survey (105 responded of 272 sur-veyed), more than 90% of the largest (750 or more sworn officers) agencies responded (67 responded of 74 surveyed). In terms of agency type, police agencies were more likely to respond than sheriff agencies. Of the 762 police departments surveyed, 494 responded (64.8%). For sheriff agencies, 168 of 321 responded (52.3%). Thus, from a generalizability standpoint, the results are most reflective of mid- to large-size police
Table 1. Sampling Frame, Sample Size, and Response Rate Across Size and Type of Agency
Type 10-49 50-99 100-249 250-749 750+ Total
Sampling frame Police 4,104 745 378 125 57 5,409 Sheriff 1,342 286 174 78 17 1,897 Total 5,446 1,031 552 203 74 7,306Sample size Police 205 186 189 125 57 762 Sheriff 67 72 87 78 17 321 Total 272 258 276 203 74 1,083Response rate Police 82 109 145 107 51 494 Sheriff 23 30 40 59 16 168 Total 105 139 185 166 67 662 Percent 38.6 53.9 67.0 81.7 90.5 61.1
at MICHIGAN STATE UNIV LIBRARIES on October 3, 2012pqx.sagepub.comDownloaded from
8 Police Quarterly XX(X)
agencies and are consistent with what other police researchers who have conducted mail surveys have found (e.g., Pate & Fridell, 1995; Strom et al., 2009; Worrall, 2002).
FindingsTo What Extent Do Agencies Use a Force Continuum?
In line with extant research (Alpert & Dunham, 2004; GAO, 2005; McEwen, 1997), we began by asking agencies whether they relied on a force continuum approach as part of their less lethal force policy. In doing so, we offered explicit direction so as to clarify our intent stating:
By force continuum, we mean a guideline (sometimes depicted graphically) that officers can use to determine the type of force that may be used in generic situ-ations. Such guidelines are sometimes (but not always) linked with varying forms of citizen resistance in an attempt to assist officers in matching the level of force to the level of resistance/threat encountered. Some examples include linear (e.g., ladder, stair, FLETC), wheel, and matrix/box designs, although there are many variations of continuum designs besides these few examples.
Of the 662 responding agencies, 641 answered this question; of these, 518 indi-cated they utilized a force continuum. Thus, more than 80% of the respondents indi-cated that they relied on some form of a force continuum, which is a bit higher than the 72% reported by Alpert and Dunham (2004).
What Type of Force Continuum Designs Do Agencies Most Often Use?For those agencies that indicated the use of a continuum, we then asked them to iden-tify the “type” of force continuum their agency uses. We cautioned that there is no correct or ideal continuum design in existence but rather that some agencies simply prefer one design over another. To help guide them further we offered basic illustra-tive template examples of continuum designs currently in existence. Of the 518 agen-cies stating they use a force continuum, 516 agencies answered this question. By far, the most prevalent response was the use of a linear design “without” graphic repre-sentation (n = 240, 46.5%), followed by a linear approach “with” a graphic design (n = 139, 26.9%). Hence, nearly three quarters of the responding agencies indicated the use of a linear design in some form. The next most frequently used designs reported were the matrix/box approach (n = 52) and some sort of circular/wheel approach (n = 48), with both used about 10% of the time (10.1% and 9.3%, respec-tively). The remaining 37 agencies (7.2%) stated that they use some “other” type of continuum structure. In sum, our findings show that a substantial majority of police
at MICHIGAN STATE UNIV LIBRARIES on October 3, 2012pqx.sagepub.comDownloaded from
Terrill and Paoline 9
agencies do rely on a force continuum structure and that the most frequently used type is some form of linear design.
How Do Agencies Rank Force and Resistance on a Continuum?Although our first two research questions were answered with relatively straightfor-ward responses from individual survey items, the multidimensional nature of our third research question added a higher degree of complication. As such, the bulk of our inquiry focused on tactical placement, or how officers are instructed to use varying forms of force given varying types of citizen resistance encountered. Hence, this includes not only the ordering of verbal, hands-, and weapons-based tactics, but also the potential linking of force to various forms of citizen resistance that an officer might encounter. To address this research question, we asked respondents to detail their force and citizen resistance progression by asking,
Please identify the progression of citizen resistance and police use of force out-lined in your continuum policy, from the lowest level to the highest level, and indicate the types/levels of force recommended to officers for each type of resistance/threat they encounter (i.e., the range of force options available to officers for each type of citizen resistance encountered).
Of the 518 agencies that indicated they use a force continuum as part of their policy, 476 provided sufficient enough detail to examine their force progression and 371 agencies provided sufficient enough detail to examine their resistance progression.
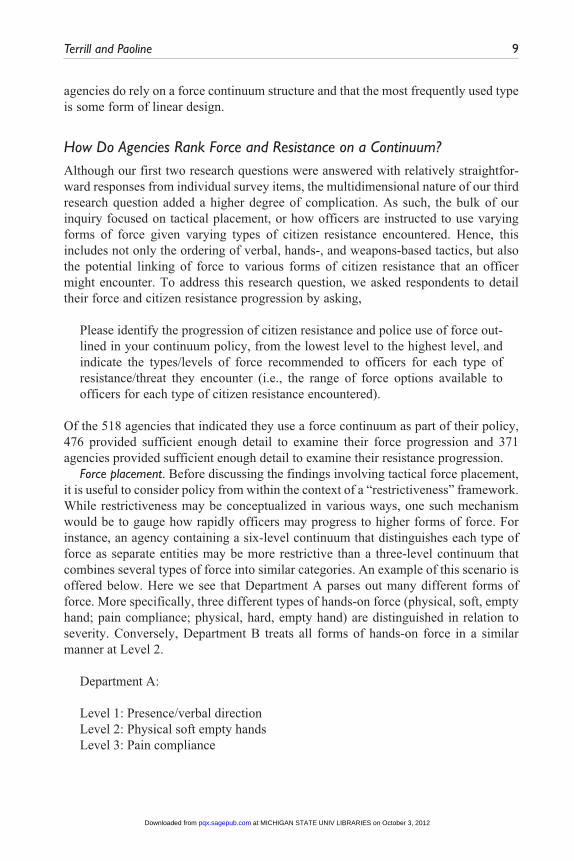
Force placement. Before discussing the findings involving tactical force placement, it is useful to consider policy from within the context of a “restrictiveness” framework. While restrictiveness may be conceptualized in various ways, one such mechanism would be to gauge how rapidly officers may progress to higher forms of force. For instance, an agency containing a six-level continuum that distinguishes each type of force as separate entities may be more restrictive than a three-level continuum that combines several types of force into similar categories. An example of this scenario is offered below. Here we see that Department A parses out many different forms of force. More specifically, three different types of hands-on force (physical, soft, empty hand; pain compliance; physical, hard, empty hand) are distinguished in relation to severity. Conversely, Department B treats all forms of hands-on force in a similar manner at Level 2.
Department A:
Level 1: Presence/verbal directionLevel 2: Physical soft empty handsLevel 3: Pain compliance
at MICHIGAN STATE UNIV LIBRARIES on October 3, 2012pqx.sagepub.comDownloaded from
10 Police Quarterly XX(X)
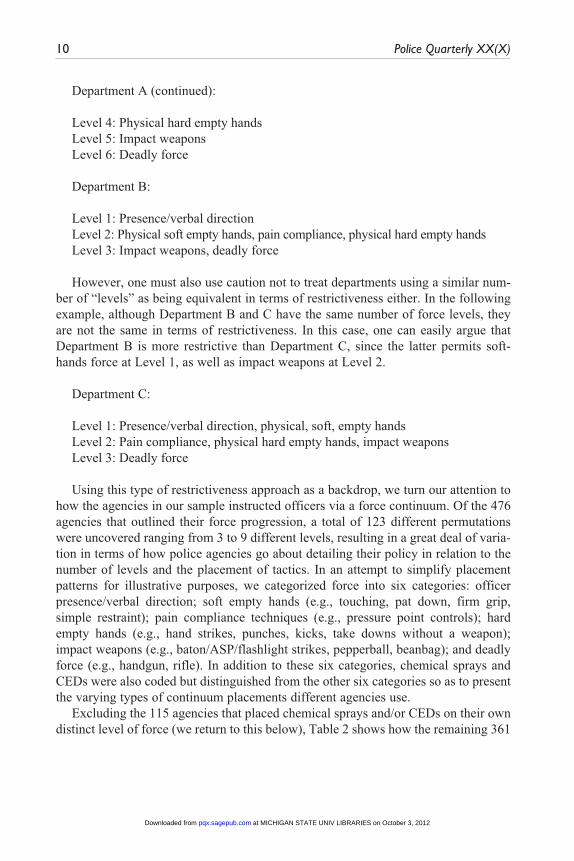
Department A (continued):
Level 4: Physical hard empty handsLevel 5: Impact weaponsLevel 6: Deadly force
Department B:
Level 1: Presence/verbal directionLevel 2: Physical soft empty hands, pain compliance, physical hard empty handsLevel 3: Impact weapons, deadly force
However, one must also use caution not to treat departments using a similar num-ber of “levels” as being equivalent in terms of restrictiveness either. In the following example, although Department B and C have the same number of force levels, they are not the same in terms of restrictiveness. In this case, one can easily argue that Department B is more restrictive than Department C, since the latter permits soft-hands force at Level 1, as well as impact weapons at Level 2.
Department C:
Level 1: Presence/verbal direction, physical, soft, empty handsLevel 2: Pain compliance, physical hard empty hands, impact weaponsLevel 3: Deadly force
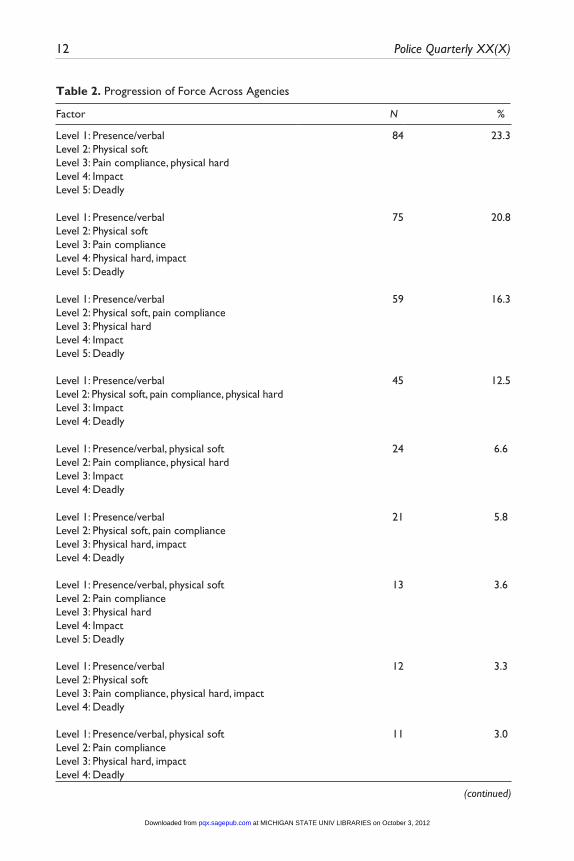
Using this type of restrictiveness approach as a backdrop, we turn our attention to how the agencies in our sample instructed officers via a force continuum. Of the 476 agencies that outlined their force progression, a total of 123 different permutations were uncovered ranging from 3 to 9 different levels, resulting in a great deal of varia-tion in terms of how police agencies go about detailing their policy in relation to the number of levels and the placement of tactics. In an attempt to simplify placement patterns for illustrative purposes, we categorized force into six categories: officer presence/verbal direction; soft empty hands (e.g., touching, pat down, firm grip, simple restraint); pain compliance techniques (e.g., pressure point controls); hard empty hands (e.g., hand strikes, punches, kicks, take downs without a weapon); impact weapons (e.g., baton/ASP/flashlight strikes, pepperball, beanbag); and deadly force (e.g., handgun, rifle). In addition to these six categories, chemical sprays and CEDs were also coded but distinguished from the other six categories so as to present the varying types of continuum placements different agencies use.
Excluding the 115 agencies that placed chemical sprays and/or CEDs on their own distinct level of force (we return to this below), Table 2 shows how the remaining 361
at MICHIGAN STATE UNIV LIBRARIES on October 3, 2012pqx.sagepub.comDownloaded from
Terrill and Paoline 11
detail their force progression. First, looking at the ends of the continuum, a large majority of the departments place the least and most severe forms of force on their own level. More than 86% of the agencies place officer presence/verbal direction on a level by itself, whereas 97.8% place deadly force by itself. Nonetheless, some agen-cies do not place such rigid restrictions on force placement at the ends of the contin-uum. For example, 49 of the agencies place officer presence/verbal direction on the same level as soft-hand tactics, whereas 8 departments permit a deadly force option along with less lethal force options.
Another way to consider force progression is by the extent to which agencies per-mit the use of impact methods with varying forms of hands-on tactics or at a higher level “after” hands-on tactics. In this case, roughly two thirds (n = 232, 64.3%) adopt a more restrictive approach by placing impact weapons only after all hand-on options, with the remaining one third (n = 129, 35.7%) of agencies placing impact weapons on the same level with hands-on force.
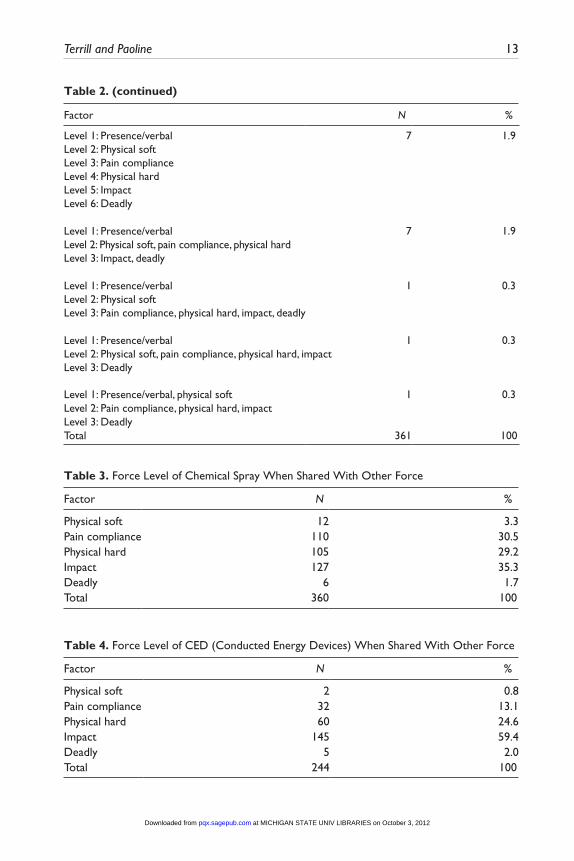
Tables 3 and 4 illustrate where chemical sprays and CEDs are placed when such force types are found at the same level as one of the six other categories of force (i.e., officer presence/verbal direction; soft empty hands; pain compliance; hard empty hands; impact weapons; and deadly force), and Table 5 shows where these weapons are located on the continuum when placed on their own distinct force level. Exactly how or where chemical sprays and CEDs fit into force continuum progression has not been entirely clear from past research (see Alpert & Dunham, 2010; Thomas et al., 2010, 2011) and has been the subject of rather intense public debate over the past two decades (Terrill & Paoline, 2012). The findings presented here show precisely where on the force continuum such mechanisms fall using a representative nationwide sam-ple. As shown in Table 3, the placement of chemical sprays on the force continuum varies widely. Roughly 30% of the agencies place chemical sprays with pain compli-ance techniques, another 29.2% place chemical sprays with hard-hand tactics, and 35.3% place chemical sprays with impact weapons. A handful of departments even place chemical sprays as low as empty-hand soft techniques (n = 12) and as high as deadly force (n = 6). Such widespread variation indicates a tremendous lack of agree-ment by police practitioners as to where chemical sprays should be placed on a force continuum.
Similar to the approach used for chemical sprays, Table 4 depicts where CEDs are placed when embedded with other types of force. Compared to chemical sprays there is somewhat less variation but far from a clear consensus. Nearly 60% of the agencies place CEDs at the impact weapon level, with another 2% placing CEDs along with deadly force. Thus, just below two thirds of the departments require some type of hands-on force before resorting to a CED. However, more than a third of the agencies place CEDs with some sort of hands-on force. In particular, a quarter of the agencies place CEDs at the same level as hard empty-hand tactics, with another 13.1% placing CEDs with pain compliance techniques.
at MICHIGAN STATE UNIV LIBRARIES on October 3, 2012pqx.sagepub.comDownloaded from
12 Police Quarterly XX(X)
Table 2. Progression of Force Across Agencies
Factor N %
Level 1: Presence/verbal 84 23.3Level 2: Physical soft Level 3: Pain compliance, physical hard Level 4: Impact Level 5: Deadly
Level 1: Presence/verbal 75 20.8Level 2: Physical soft Level 3: Pain compliance Level 4: Physical hard, impact Level 5: Deadly
Level 1: Presence/verbal 59 16.3Level 2: Physical soft, pain compliance Level 3: Physical hard Level 4: Impact Level 5: Deadly
Level 1: Presence/verbal 45 12.5Level 2: Physical soft, pain compliance, physical hard Level 3: Impact Level 4: Deadly
Level 1: Presence/verbal, physical soft 24 6.6Level 2: Pain compliance, physical hard Level 3: Impact Level 4: Deadly
Level 1: Presence/verbal 21 5.8Level 2: Physical soft, pain compliance Level 3: Physical hard, impact Level 4: Deadly
Level 1: Presence/verbal, physical soft 13 3.6Level 2: Pain compliance Level 3: Physical hard Level 4: Impact Level 5: Deadly
Level 1: Presence/verbal 12 3.3Level 2: Physical soft Level 3: Pain compliance, physical hard, impact Level 4: Deadly
Level 1: Presence/verbal, physical soft 11 3.0Level 2: Pain compliance Level 3: Physical hard, impact Level 4: Deadly
(continued)
at MICHIGAN STATE UNIV LIBRARIES on October 3, 2012pqx.sagepub.comDownloaded from
Terrill and Paoline 13
Table 3. Force Level of Chemical Spray When Shared With Other Force
Factor N %
Physical soft 12 3.3Pain compliance 110 30.5Physical hard 105 29.2Impact 127 35.3Deadly 6 1.7Total 360 100
Factor N %
Level 1: Presence/verbal 7 1.9Level 2: Physical soft Level 3: Pain compliance Level 4: Physical hard Level 5: Impact Level 6: Deadly
Level 1: Presence/verbal 7 1.9Level 2: Physical soft, pain compliance, physical hard Level 3: Impact, deadly
Level 1: Presence/verbal 1 0.3Level 2: Physical soft Level 3: Pain compliance, physical hard, impact, deadly
Level 1: Presence/verbal 1 0.3Level 2: Physical soft, pain compliance, physical hard, impact Level 3: Deadly
Level 1: Presence/verbal, physical soft 1 0.3Level 2: Pain compliance, physical hard, impact Level 3: Deadly Total 361 100
Table 2. (continued)
Table 4. Force Level of CED (Conducted Energy Devices) When Shared With Other Force
Factor N %
Physical soft 2 0.8Pain compliance 32 13.1Physical hard 60 24.6Impact 145 59.4Deadly 5 2.0Total 244 100
at MICHIGAN STATE UNIV LIBRARIES on October 3, 2012pqx.sagepub.comDownloaded from
14 Police Quarterly XX(X)
Table 5. Force Level of Chemical Sprays and CED When Occupying Own Force Levela
Chemical Spray CED Both
Factor N % N % N %
After presence/verbal 13 19.1 1 7.7 7 18.4After physical soft 8 11.8 — — 3 7.9After pain compliance 25 36.8 2 15.4 16 42.1After physical hard 20 29.4 5 38.5 12 31.6After impact 2 2.9 5 38.5 — —Total 68 100 13 100 38 100
aSeven agencies placed CED (conducted energy device) on its own level directly after chemical sprays (11 agencies had both chemical spray and CED on their own, but separate levels).
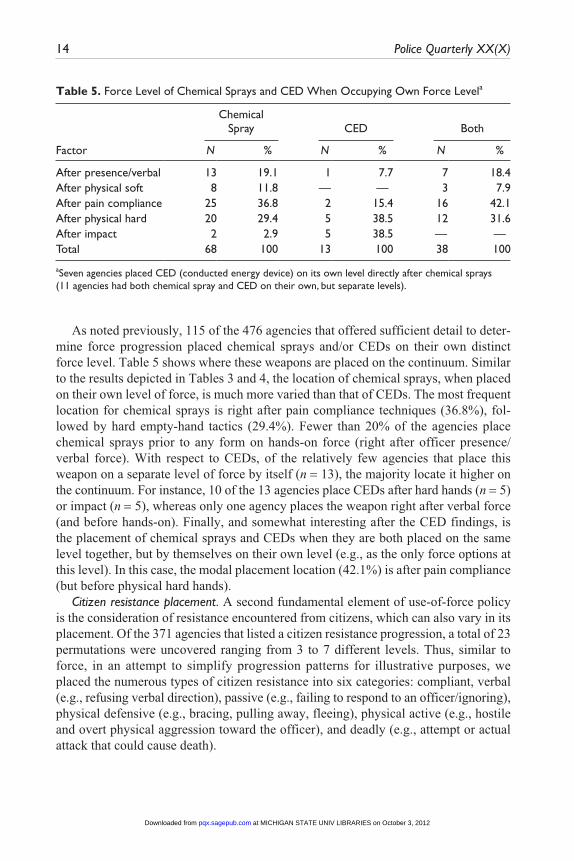
As noted previously, 115 of the 476 agencies that offered sufficient detail to deter-mine force progression placed chemical sprays and/or CEDs on their own distinct force level. Table 5 shows where these weapons are placed on the continuum. Similar to the results depicted in Tables 3 and 4, the location of chemical sprays, when placed on their own level of force, is much more varied than that of CEDs. The most frequent location for chemical sprays is right after pain compliance techniques (36.8%), fol-lowed by hard empty-hand tactics (29.4%). Fewer than 20% of the agencies place chemical sprays prior to any form on hands-on force (right after officer presence/verbal force). With respect to CEDs, of the relatively few agencies that place this weapon on a separate level of force by itself (n = 13), the majority locate it higher on the continuum. For instance, 10 of the 13 agencies place CEDs after hard hands (n = 5) or impact (n = 5), whereas only one agency places the weapon right after verbal force (and before hands-on). Finally, and somewhat interesting after the CED findings, is the placement of chemical sprays and CEDs when they are both placed on the same level together, but by themselves on their own level (e.g., as the only force options at this level). In this case, the modal placement location (42.1%) is after pain compliance (but before physical hard hands).
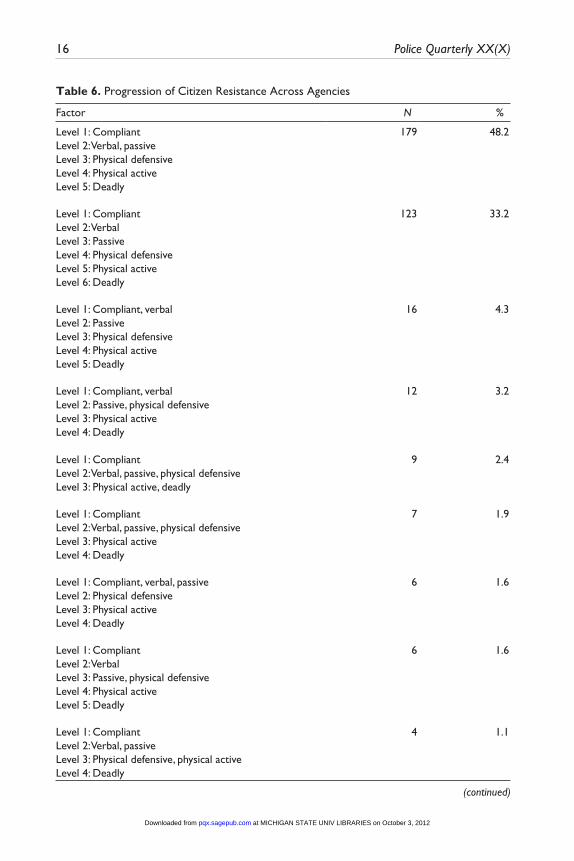
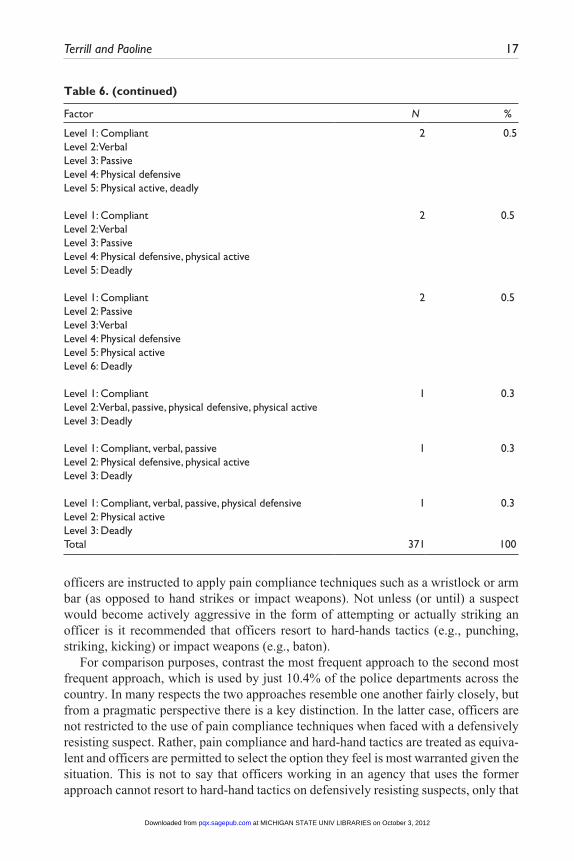
Citizen resistance placement. A second fundamental element of use-of-force policy is the consideration of resistance encountered from citizens, which can also vary in its placement. Of the 371 agencies that listed a citizen resistance progression, a total of 23 permutations were uncovered ranging from 3 to 7 different levels. Thus, similar to force, in an attempt to simplify progression patterns for illustrative purposes, we placed the numerous types of citizen resistance into six categories: compliant, verbal (e.g., refusing verbal direction), passive (e.g., failing to respond to an officer/ignoring), physical defensive (e.g., bracing, pulling away, fleeing), physical active (e.g., hostile and overt physical aggression toward the officer), and deadly (e.g., attempt or actual attack that could cause death).
at MICHIGAN STATE UNIV LIBRARIES on October 3, 2012pqx.sagepub.comDownloaded from
Terrill and Paoline 15
As shown in Table 6, nearly half (n = 179, 48.2%) of all the responding agencies who detailed their citizen resistance progression use a five-level layout in the follow-ing order: 1—compliant, 2—verbal/passive combined, 3—physical defensive, 4—physical active, and 5—deadly. The second most frequently used approach (n = 123, 33.2%) is similar except that verbal and passive resistance are split and placed on separate levels according to the following: 1—compliant, 2—verbal, 3—passive, 4—physical defensive, 5—physical active, and 6—deadly. These two approaches com-bined account for 302 (81.4%) of the 371 agencies. Although there are 12 additional permutations used, the drop-off in frequency is dramatic (e.g., the third most fre-quently used progression format only contains 16 departments). Thus, there is much less variation in how agencies detail citizen resistance compared to force progression.
Force and citizen resistance placement. Next, we consider the extent to which police agencies connect varying levels and types of citizen resistance to varying levels and types of force. Of the 476 agencies indicating that they incorporate a force continuum approach into their policy, 140 (29.5%) noted that they instruct officers in the form of a progression of force across levels via a continuum but do not indicate (i.e., link) how such force should be used in response to varying levels of citizen resistance or only semilink force and resistance.8 If the two continuums (i.e., resistance and force) are not linked, and thereby do not provide officers guidance as to the most appropriate force responses given specific types of resistance faced, the nature of restrictiveness is inherently lessened. In fact, in terms of restrictiveness, one may argue that such agen-cies are the least restrictive of those that use a force continuum.
At the other end of the spectrum, 336 (70.6%) of the responding agencies indicated that they rank both resistance and force along a continuum, as well as link specific types of force to specific types of resistance (i.e., instruct officers as to what types of force are permitted given varying types of citizen resistance).9 Interestingly, all apply some sort of “out-clause” in the sense that there is no requirement that officers “prog-ress” up or down force continuum levels in strict form (e.g., that officers must exhaust all lower forms of force prior to moving up the continuum),10 but all do specify the range of force that should be used given the level of resistance posed by the suspect.
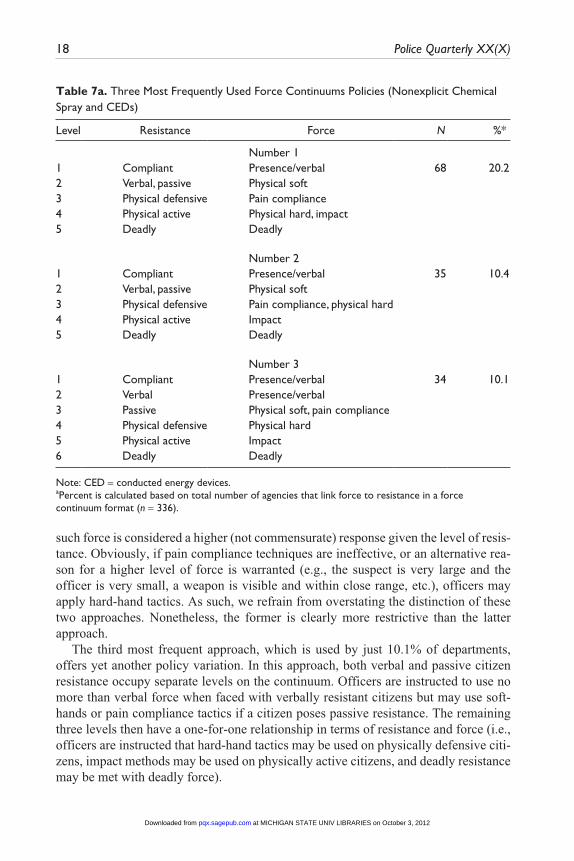
Given the varied placement of chemical sprays and CEDs throughout the force continuum, and the complicating manner in which agencies treat these weapons (as illustrated in Tables 3 through 5), we examine the most popular policy approaches used by these 336 agencies in two ways. First, in Table 7a, we consider the top policies used without explicit notation for where chemical sprays and CEDs fit into the con-tinuum (similar to Table 2). Second, in Table 7b, we consider the top policies used specifically considering where these weapons fit into the continuum.
As illustrated in Table 7a, the most frequent approach is used by just 20.2% of departments. In this model, officers are restricted from using any hands-on force unless (or until) a suspect presents at least some form of verbal or passive resistance (which are treated as similar types of resistance). If a suspect presents defensive resis-tance (i.e., pulling, pushing away from the officers attempting to avoid control),
at MICHIGAN STATE UNIV LIBRARIES on October 3, 2012pqx.sagepub.comDownloaded from
16 Police Quarterly XX(X)
Table 6. Progression of Citizen Resistance Across Agencies
Factor N %
Level 1: Compliant 179 48.2Level 2: Verbal, passive Level 3: Physical defensive Level 4: Physical active Level 5: Deadly
Level 1: Compliant 123 33.2Level 2: Verbal Level 3: Passive Level 4: Physical defensive Level 5: Physical active Level 6: Deadly
Level 1: Compliant, verbal 16 4.3Level 2: Passive Level 3: Physical defensive Level 4: Physical active Level 5: Deadly
Level 1: Compliant, verbal 12 3.2Level 2: Passive, physical defensive Level 3: Physical active Level 4: Deadly
Level 1: Compliant 9 2.4Level 2: Verbal, passive, physical defensive Level 3: Physical active, deadly
Level 1: Compliant 7 1.9Level 2: Verbal, passive, physical defensive Level 3: Physical active Level 4: Deadly
Level 1: Compliant, verbal, passive 6 1.6Level 2: Physical defensive Level 3: Physical active Level 4: Deadly
Level 1: Compliant 6 1.6Level 2: Verbal Level 3: Passive, physical defensive Level 4: Physical active Level 5: Deadly
Level 1: Compliant 4 1.1Level 2: Verbal, passive Level 3: Physical defensive, physical active Level 4: Deadly
(continued)
at MICHIGAN STATE UNIV LIBRARIES on October 3, 2012pqx.sagepub.comDownloaded from
Terrill and Paoline 17
Factor N %
Level 1: Compliant 2 0.5Level 2: Verbal Level 3: Passive Level 4: Physical defensive Level 5: Physical active, deadly
Level 1: Compliant 2 0.5Level 2: Verbal Level 3: Passive Level 4: Physical defensive, physical active Level 5: Deadly
Level 1: Compliant 2 0.5Level 2: Passive Level 3: Verbal Level 4: Physical defensive Level 5: Physical active Level 6: Deadly
Level 1: Compliant 1 0.3Level 2: Verbal, passive, physical defensive, physical active Level 3: Deadly
Level 1: Compliant, verbal, passive 1 0.3Level 2: Physical defensive, physical active Level 3: Deadly
Level 1: Compliant, verbal, passive, physical defensive 1 0.3Level 2: Physical active Level 3: Deadly Total 371 100
Table 6. (continued)
officers are instructed to apply pain compliance techniques such as a wristlock or arm bar (as opposed to hand strikes or impact weapons). Not unless (or until) a suspect would become actively aggressive in the form of attempting or actually striking an officer is it recommended that officers resort to hard-hands tactics (e.g., punching, striking, kicking) or impact weapons (e.g., baton).
For comparison purposes, contrast the most frequent approach to the second most frequent approach, which is used by just 10.4% of the police departments across the country. In many respects the two approaches resemble one another fairly closely, but from a pragmatic perspective there is a key distinction. In the latter case, officers are not restricted to the use of pain compliance techniques when faced with a defensively resisting suspect. Rather, pain compliance and hard-hand tactics are treated as equiva-lent and officers are permitted to select the option they feel is most warranted given the situation. This is not to say that officers working in an agency that uses the former approach cannot resort to hard-hand tactics on defensively resisting suspects, only that
at MICHIGAN STATE UNIV LIBRARIES on October 3, 2012pqx.sagepub.comDownloaded from
18 Police Quarterly XX(X)
Table 7a. Three Most Frequently Used Force Continuums Policies (Nonexplicit Chemical Spray and CEDs)
Level Resistance Force N %*
Number 1 1 Compliant Presence/verbal 68 20.22 Verbal, passive Physical soft 3 Physical defensive Pain compliance 4 Physical active Physical hard, impact 5 Deadly Deadly
Number 2 1 Compliant Presence/verbal 35 10.42 Verbal, passive Physical soft 3 Physical defensive Pain compliance, physical hard 4 Physical active Impact 5 Deadly Deadly
Number 3 1 Compliant Presence/verbal 34 10.12 Verbal Presence/verbal 3 Passive Physical soft, pain compliance 4 Physical defensive Physical hard 5 Physical active Impact 6 Deadly Deadly
Note: CED = conducted energy devices.aPercent is calculated based on total number of agencies that link force to resistance in a force continuum format (n = 336).
such force is considered a higher (not commensurate) response given the level of resis-tance. Obviously, if pain compliance techniques are ineffective, or an alternative rea-son for a higher level of force is warranted (e.g., the suspect is very large and the officer is very small, a weapon is visible and within close range, etc.), officers may apply hard-hand tactics. As such, we refrain from overstating the distinction of these two approaches. Nonetheless, the former is clearly more restrictive than the latter approach.
The third most frequent approach, which is used by just 10.1% of departments, offers yet another policy variation. In this approach, both verbal and passive citizen resistance occupy separate levels on the continuum. Officers are instructed to use no more than verbal force when faced with verbally resistant citizens but may use soft-hands or pain compliance tactics if a citizen poses passive resistance. The remaining three levels then have a one-for-one relationship in terms of resistance and force (i.e., officers are instructed that hard-hand tactics may be used on physically defensive citi-zens, impact methods may be used on physically active citizens, and deadly resistance may be met with deadly force).
at MICHIGAN STATE UNIV LIBRARIES on October 3, 2012pqx.sagepub.comDownloaded from
Terrill and Paoline 19
Table 7b. Three Most Frequently Used Force Continuums Policies (Explicit Chemical Spray and CEDs)
Level Resistance Force N %a
Number 1 1 Compliant Presence/verbal 29 8.62 Verbal, passive Physical soft 3 Physical defensive Pain compliance, chemical spray 4 Physical active Physical hard, impact, CED 5 Deadly Deadly
Number 2 1 Compliant Presence/verbal 24 7.12 Verbal, passive Physical soft 3 Physical defensive Pain compliance, chemical spray 4 Physical active Physical hard, impact 5 Deadly Deadly
Number 3 1 Compliant Presence/verbal 17 5.12 Verbal Presence/verbal 3 Passive Physical soft, pain compliance 4 Physical defensive Physical hard 5 Physical active Impact, chemical spray, CED 6 Deadly Deadly
Note: CED = conducted energy devices.aPercent is calculated based on total number of agencies that link force to resistance in a force continuum format (n = 336).
The key findings gleaned from Table 7a is how few agencies employ even the most commonly used approaches, as well as the rapid decline in relation to the number of agencies using the most frequent approaches. Of the 336 agencies linking force to resistance, the top approach is used by just 20% (n = 68) of the departments, and the second and third most frequently used approaches are just half that at 10% (n = 35 and n = 34, respectively). The next most frequent continuum approach (not depicted) drops in half again (5.0%, n = 17). The remaining approaches all have less than 10 agencies using them. More specifically, the remaining 199 agencies use an additional 99 differ-ent variations of a force continuum. This speaks to the enormous amount of variation in existence when it comes to force policy.
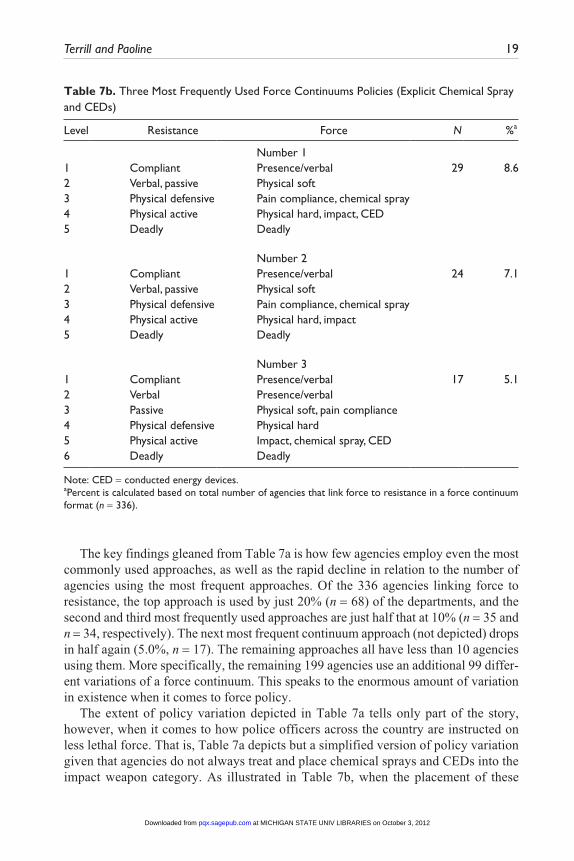
The extent of policy variation depicted in Table 7a tells only part of the story, however, when it comes to how police officers across the country are instructed on less lethal force. That is, Table 7a depicts but a simplified version of policy variation given that agencies do not always treat and place chemical sprays and CEDs into the impact weapon category. As illustrated in Table 7b, when the placement of these
at MICHIGAN STATE UNIV LIBRARIES on October 3, 2012pqx.sagepub.comDownloaded from
20 Police Quarterly XX(X)
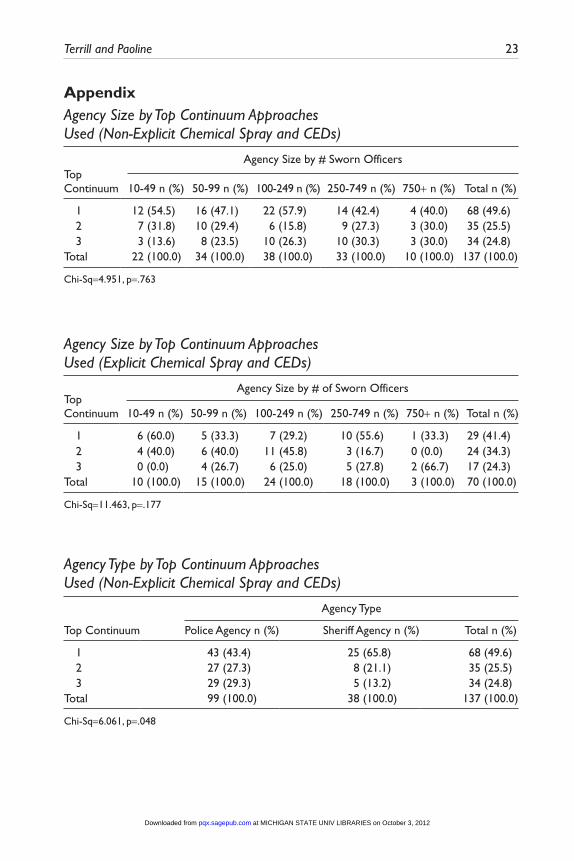
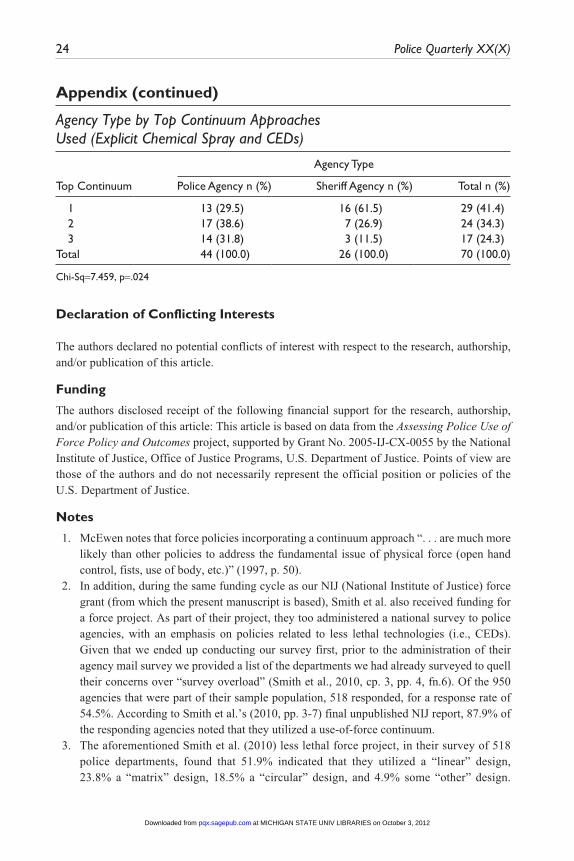
weapons are considered in tandem with the other less lethal force options, the most common policy approach is used by just 8.6% (n = 29) of the responding agencies. This model mirrors the top approach identified in Table 7a, but with chemical sprays treated on the third level of continuum similar to pain compliance force, which is to be used in response to physically defensive resistance. The second most common policy approach is used by just 24 (7.1%) of the agencies. This model again places chemical sprays on the same level as pain compliance in response to physically defensive resistance, but these agencies do not issue or permit CEDs. The third approach is used by just 17 (5.1%) of the agencies and is identical to the third-ranked approach in Table 7a, but with explicit notation as to chemical sprays and CEDs listed as impact weapons in response to physically active resistance. Each of the remaining policy approaches are used by less than 5% of the responding agencies. More specifically, the rest of the 266 agencies use an additional 166 different varia-tions of the force continuum. Once again, this speaks to the enormous amount of variation in existence when it comes to force policy. For further elaboration, please see the Appendix regarding how the three most commonly used force continuum approaches vary based on agency size and type, which also corresponds with how the sample was stratified for the national mail survey.11
DiscussionThe results presented here illustrate how police agencies across the country go about instructing officers via policy regarding force, particularly within the confines of force continuum structures. We found that a large majority of police agencies (more than 80%) use some type of continuum. Of these agencies, the linear design was, by far, the most frequently used (73%), followed by matrix/box designs and circular/wheel designs, each with roughly 10% of the agencies using them. This finding is somewhat interesting given recent discussions within the literature concerning the potential negatives of force/resistance continuums in general, and linear designs in particular (see Aveni, 2003; Peters & Brave, 2006; Petrowski, 2002; Williams, 2002). More specifically, some have argued against the use-of-force/resistance continuums on a number of fronts, such as in relation to hampering decision making, fear of liability issues, and being more restrictive than the law.12 Even during site visits to a number of agencies as part of the second phase of the Assessing Police Use of Force Policy and Outcomes project we heard concerns from police officials about the potential down side of using a force continuum. Nonetheless, what is apparent from the find-ings presented here is that a large majority of police agencies do incorporate a force continuum into their policy, and the preferred model is linear in design.
With respect to the tactical placement of hands-on force tactics (e.g., soft hands, pain compliance controls, hard hands) and weapons (e.g., batons, chemical sprays, CEDs), and how police agencies rank the order of such in terms of progression, the
at MICHIGAN STATE UNIV LIBRARIES on October 3, 2012pqx.sagepub.comDownloaded from
Terrill and Paoline 21
key finding uncovered was the enormous variation present. Even with an attempt to consolidate the many force types into broader categories, vast differences were uncovered in terms of how police agencies go about detailing their policy in relation to the number of levels and placement of tactics.13
In addition, our results reveal that it is difficult to identify a typically used force continuum approach that ranks hands- and weapon-based tactics in relation to citizen resistance levels. Although some departments are quite restrictive in terms of allowing officers to use more severe forms of force only on actively aggressive suspects, other agencies are quite liberal and place a large amount of discretion in officers hands by allowing them to use nearly all types of force against nearly all types of resistance short of extreme imbalance (e.g., allowing a baton strike to a compliant suspect). Moreover, as illustrated in Table 7a, whereas the most frequent continuum approach places hard-hand tactics (e.g., striking, punching, kicking) and impact weapons at the same force level to be used against actively aggressive suspects, the second most fre-quent policy approach moves hard-hand tactics up one level and permits such force to be used on suspects who are displaying defensive resistance (a less severe form than active aggression). Although the latter approach is clearly less restrictive compared to the former, given the low percentages uncovered it is nearly impossible to identify a standard approach being used other than the one with the greatest frequency. This fact becomes even more highlighted when chemical sprays and CEDs are broken out as separate forms of force as illustrated in Table 7b. In essence, with the exception of general agreement tending toward the ends of a continuum structure (e.g., hard-hand tactics and impact weapons are more severe than verbal commands and threats, and subsequently ranked higher), there really is no “commonly” used means of tactical placement in terms of force continuum policies (i.e., where various forms of hands-on techniques and weapons should be placed in relation to varying forms of suspect resis-tance). Departments pick and chose, and tweak and adapt, in a multitude of ways—all unfortunately, with little to no empirical evidence as to which approach is best or even better than another.
The results of this study have implications for police practitioners. Perhaps the primary contribution is that it informs police trainers, supervisors, and administrators with a glimpse of use-of-force policies that are currently in operation. Anyone who has spent time researching in a police department has undoubtedly been asked by police personnel, “What are other departments doing?” Our findings reveal that most American police departments are using a use-of-force continuum and most likely one that is depicted in a linear fashion. Unfortunately, conclusions regarding the placement of force tactics and consideration of various levels of citizen resistance within policies are less clear cut, as we found vast differences across these dimensions. As such, infor-mative summary statements for police practitioners are much easier to make in terms of whether agencies nationally are utilizing a force continuum and the type of design over policy restrictiveness.
at MICHIGAN STATE UNIV LIBRARIES on October 3, 2012pqx.sagepub.comDownloaded from
22 Police Quarterly XX(X)
Although this research provides the first comprehensive empirical national exami-nation regarding the contours of less lethal police use-of-force policies as a collective whole, it is not without limitations. First, like that confronted by other researchers, resource limitations prohibited a full-scale attempt to survey the population of American police agencies; thus, we relied on a disproportionate random sample of agencies based on size and type. Second, we realized over the course of our survey administration that the 70% to 80% response rate norm of decades past (Maguire, 2002) has changed rather dramatically, especially when the subject matter is poten-tially sensitive in nature (e.g., citizen complaints, lawsuits, use-of-force, etc.). Our telephone follow-ups between the second and third waves provided some insight into the current state of affairs. Several agencies intimated that they are inundated with surveys (i.e., mail, email, and fax) and either lack sufficient resources to complete the survey (i.e., especially smaller departments), do surveys “randomly” (i.e., pick and choose a certain number to complete), or use a “systematic” selection (e.g., only do a survey if it arrives on a certain day of the week). As a result, our 61% response rate may be good for today’s standards but might only be regarded as fair by past expecta-tions. Finally, our approach here is but the first stage in understanding the complexi-ties regarding use-of-force policies in operation. What we provide is a descriptive snapshot into what agencies are doing in terms of guiding officers, via the policy, in the application of force. What we do not know, which is of interest to practitioners and researchers alike, are the potential costs and benefits of the varying approaches, espe-cially in terms of our latter analyses on policy restrictiveness.
For police researchers and scholars, this study provides empirical evidence to sup-port the generalized claims regarding less lethal use-of-force policy structures and designs (i.e., linear continuums), although much more work is needed. The next step is to examine the policy approaches, via multisite examinations, that provide the most and least beneficial police outcomes (e.g., force usage, citizen complaints, injuries, lawsuits, etc.). In addition, the findings also suggest that aggregate comparisons (across police agencies), in terms of what might constitute objectively reasonable force, might prove to be difficult because officers, from various departments, are being guided (per their policy) in vastly different ways. Evidence of this is especially evident in our findings with respect to policy restrictiveness (i.e., the placement of force tactics and the incorporation of levels of citizen resistance). Further complicating the picture are the various “out clauses” provided by agencies that provide situational contingen-cies for circumventing, or perhaps more optimistically enhancing, the policy (e.g., suspect height/ weight, skill, mental state, drug/alcohol use, distance from officer, officer fatigue, officer injury, etc.). This suggests that officers who are applying force have a great deal of latitude depending on their individual interpretations of the encounter before them. Although our aim was to provide the front-half template for mapping the various force policies in operation, controlling for and understanding such nuances certainly presents an exciting opportunity for those interested in policy effects and outcomes.
at MICHIGAN STATE UNIV LIBRARIES on October 3, 2012pqx.sagepub.comDownloaded from
Terrill and Paoline 23
AppendixAgency Size by Top Continuum Approaches Used (Non-Explicit Chemical Spray and CEDs)
Agency Size by # Sworn OfficersTop Continuum 10-49 n (%) 50-99 n (%) 100-249 n (%) 250-749 n (%) 750+ n (%) Total n (%)
1 12 (54.5) 16 (47.1) 22 (57.9) 14 (42.4) 4 (40.0) 68 (49.6) 2 7 (31.8) 10 (29.4) 6 (15.8) 9 (27.3) 3 (30.0) 35 (25.5) 3 3 (13.6) 8 (23.5) 10 (26.3) 10 (30.3) 3 (30.0) 34 (24.8)Total 22 (100.0) 34 (100.0) 38 (100.0) 33 (100.0) 10 (100.0) 137 (100.0)
Chi-Sq=4.951, p=.763
Agency Size by Top Continuum Approaches Used (Explicit Chemical Spray and CEDs)
Agency Size by # of Sworn OfficersTop Continuum 10-49 n (%) 50-99 n (%) 100-249 n (%) 250-749 n (%) 750+ n (%) Total n (%)
1 6 (60.0) 5 (33.3) 7 (29.2) 10 (55.6) 1 (33.3) 29 (41.4) 2 4 (40.0) 6 (40.0) 11 (45.8) 3 (16.7) 0 (0.0) 24 (34.3) 3 0 (0.0) 4 (26.7) 6 (25.0) 5 (27.8) 2 (66.7) 17 (24.3)Total 10 (100.0) 15 (100.0) 24 (100.0) 18 (100.0) 3 (100.0) 70 (100.0)
Chi-Sq=11.463, p=.177
Agency Type by Top Continuum Approaches Used (Non-Explicit Chemical Spray and CEDs)
Agency Type
Top Continuum Police Agency n (%) Sheriff Agency n (%) Total n (%)
1 43 (43.4) 25 (65.8) 68 (49.6) 2 27 (27.3) 8 (21.1) 35 (25.5) 3 29 (29.3) 5 (13.2) 34 (24.8)Total 99 (100.0) 38 (100.0) 137 (100.0)
Chi-Sq=6.061, p=.048
at MICHIGAN STATE UNIV LIBRARIES on October 3, 2012pqx.sagepub.comDownloaded from
24 Police Quarterly XX(X)
Agency Type by Top Continuum Approaches Used (Explicit Chemical Spray and CEDs)
Agency Type
Top Continuum Police Agency n (%) Sheriff Agency n (%) Total n (%)
1 13 (29.5) 16 (61.5) 29 (41.4) 2 17 (38.6) 7 (26.9) 24 (34.3) 3 14 (31.8) 3 (11.5) 17 (24.3)Total 44 (100.0) 26 (100.0) 70 (100.0)
Chi-Sq=7.459, p=.024
Declaration of Conflicting Interests
The authors declared no potential conflicts of interest with respect to the research, authorship, and/or publication of this article.
Funding
The authors disclosed receipt of the following financial support for the research, authorship, and/or publication of this article: This article is based on data from the Assessing Police Use of Force Policy and Outcomes project, supported by Grant No. 2005-IJ-CX-0055 by the National Institute of Justice, Office of Justice Programs, U.S. Department of Justice. Points of view are those of the authors and do not necessarily represent the official position or policies of the U.S. Department of Justice.
Notes
1. McEwen notes that force policies incorporating a continuum approach “. . . are much more likely than other policies to address the fundamental issue of physical force (open hand control, fists, use of body, etc.)” (1997, p. 50).
2. In addition, during the same funding cycle as our NIJ (National Institute of Justice) force grant (from which the present manuscript is based), Smith et al. also received funding for a force project. As part of their project, they too administered a national survey to police agencies, with an emphasis on policies related to less lethal technologies (i.e., CEDs). Given that we ended up conducting our survey first, prior to the administration of their agency mail survey we provided a list of the departments we had already surveyed to quell their concerns over “survey overload” (Smith et al., 2010, cp. 3, pp. 4, fn.6). Of the 950 agencies that were part of their sample population, 518 responded, for a response rate of 54.5%. According to Smith et al.’s (2010, pp. 3-7) final unpublished NIJ report, 87.9% of the responding agencies noted that they utilized a use-of-force continuum.
3. The aforementioned Smith et al. (2010) less lethal force project, in their survey of 518 police departments, found that 51.9% indicated that they utilized a “linear” design, 23.8% a “matrix” design, 18.5% a “circular” design, and 4.9% some “other” design.
Appendix (continued)
at MICHIGAN STATE UNIV LIBRARIES on October 3, 2012pqx.sagepub.comDownloaded from
Terrill and Paoline 25
Although this provides some initial assessments of force continuum designs in operation, this work has not been subject to the scrutiny of the academic journal–style peer-review process. For example, one issue left unresolved is the number of agencies (i.e., rather than just percentages) that answered the question(s) regarding continuum design, as it is unknown whether or not all 518 departments answered these items or whether it was a subset of responding agencies. In addition, as pointed out by the authors themselves, the results should be taken cautiously because “agencies appeared to interpret these terms differently” (2010, cp. 3, pp. 8). As such, until these issues are resolved (i.e., via peer-review publication and deciphering survey responses on continuum model type from actual policies in operation), the picture on continuum design remains, at best, unclear.
4. The sample was drawn with the assistance of Dr. Edward Maguire, a nationally recog-nized police organization theorist and researcher, using the U.S. Dept. of Justice, Bureau of Justice Statistics. Census of State and Local Law Enforcement Agencies (CSLLEA), 2000: [United States] [Computer File]. Conducted by U.S. Dept. of Commerce, Bureau of the Census. 3rd ICPSR ed. Ann Arbor, MI: Inter-university Consortium for Political and Social Research [producer and distributor], 2003.
5. A personalized cover letter identifying the potential benefits of participation along with human subject protection information accompanied each survey instrument.
6. The telephone follow-ups revealed, in many instances, that police chiefs had moved on (and thus the survey was not opened) or that police department addresses had changed and/or were incorrect (and thus the survey was not received). This allowed project staff to mail/fax another survey for agency participation.
7. Nine additional surveys were received but were filled out so minimally (e.g., answered only one or two questions), or did not include a signature as required by our Institutional Review Boards (IRB), that they were not included in the final count. In addition, 10 agen-cies contacted us (via a response letter or phone call/message) indicating that they either did not wish to participate in our particular survey or, in some cases, they do not participate in any survey research (it was noted that such decisions are sometimes arbitrary, and at other times the result of insufficient personnel to devote appropriate time allocations).
8. Of these 140 agencies, 105 just specify force progression within their policy, 20 specify both resistance and force but make no connection (or such a vague connection) indicating that force is not linked to resistance levels, and 15 specify that they only “semi-link” force with resistance.
These latter agencies provide some partial guidance as to the force–resistance relationship but are only loosely coupled (e.g., a graphic illustration in the policy may depict impact weapons most closely connected to active resistance but also partially connected to defen-sive and passive resistance).
9. Somewhat interestingly, 21 of the 48 (or 43.8%) departments that use a partial or full-wheel/circular continuum design indicated a specific connection or link between force and resistance. The presumed reason for adopting a wheel/circular approach is because the agency does not want to “lock-in” officers as to what force to use given a level of resis-tance. Although such a goal may be accomplished given the graphical depiction of a wheel/circular model, in these 21 agencies the policy still makes the connection anyway via the text of the policy, which would seem to defeat the original purpose of selecting a wheel/circular design in the first place.
at MICHIGAN STATE UNIV LIBRARIES on October 3, 2012pqx.sagepub.comDownloaded from
26 Police Quarterly XX(X)
10. For instance, agencies identified numerous factors (other than citizen resistance) officers may consider in determining the type of force that may be used (e.g., suspect height/weight, perceived mental state, drug/alcohol use, seriousness of offense, presence of weapon, offi-cer fatigue, etc.).
11. We thank an anonymous reviewer for facilitating this thought.12. We even received written comments on some return surveys indicating that a force con-
tinuum was not part of policy for fear of liability concerns, but it was used in training—and apparently in the views of administrators somehow outside the scope of plaintiff attorneys.
13. Even in states with state-level guidelines regarding policy on police use-of-force (e.g., Florida, Michigan, and New Jersey) variation was present (i.e., individual agencies would take the state guidelines and tweak them to accommodate their individual agency preference—such as moving the TASER® from one level to another).
References
Adams, K., & Jennison, V. (2007). What we do not know about police use of Tasers. Policing: An International Journal of Police Strategies and Management, 30, 447-465.
Adang, O., & Mensink, J. (2004). Pepper spray: An unreasonable response to suspect verbal resistance. Policing: An International Journal of Police Strategies and Management, 27, 206-219.
Alpert, G. P., & Dunham, R. G. (1997). The force factor: Measuring police use of force relative to suspect resistance. Washington, DC: Police Executive Research Forum.
Alpert, G. P., & Dunham, R. G. (2004). Understanding police use of force: Officers, suspects, and reciprocity. New York, NY: Cambridge University Press.
Alpert, G. P., & Dunham R. G. (2010). Policy and training recommendations related to police use of CEDs: Overview of findings from a comprehensive national study. Police Quarterly, 13, 235-259.
Aveni, T. J. (2003). Force continuum conundrum. Law and Order, 51(12), 74-77.Bazley, T. D., Lersch, K. M., & Mieczkowski, T. (2007). Officer force versus suspect resis-
tance: A gendered analysis of patrol officers in an urban police department. Journal of Criminal Justice, 35, 183-192.
Bertomen, L. (2003). Less-lethal toolbox: Law enforcement officers test the products on the use-of-force continuum. Law Enforcement Technology, 30, 64-69.
Connor, G. (1991). Use of force continuum: Phase II. Law and Order, 39, 30-32.Crawford, C., & Burns, R. (1998). Predictors of the police use of force: The application of a
continuum perspective in Phoenix. Police Quarterly, 1, 41-63.Dillman, D. (1978). Mail and telephone surveys: The total design method. Hoboken, NJ:
Wiley.Fridell, L. A. (2005). Improving use-of-force policy, policy enforcement, and training. In
J. A. Ederheimer & L. A. Fridell (Eds.), Chief concerns: Exploring the challenges of police use of force (pp. 21-56). Washington, DC: Police Executive Research Forum.
Fyfe, J. J. (1988). Police use of deadly force: Research and reform. Justice Quarterly, 5, 164-205.Garner, J. H., Schade, T., Hepburn, J., & Buchanan, J. (1995). Measuring the continuum of
force used by and against the police. Criminal Justice Review, 20, 146-168.
at MICHIGAN STATE UNIV LIBRARIES on October 3, 2012pqx.sagepub.comDownloaded from
Terrill and Paoline 27
Graham v. Connor, 490 U.S. 386 (1989).Hickman, M., & Reaves, B. (2003). Law enforcement management and administrative statis-
tics: Local police departments 2000. Washington, DC: Bureau of Justice Statistics.Hoffman, R., Lawrence, C., & Brown, G. (2004). Canada’s national use-of-force framework for
police officers. The Police Chief, 71, 10.Hough, R. M., & Tatum, K. M. (2012). An examination of Florida policies on force continuums.
Policing: An International Journal of Police Strategies and Management, 35, 39-54.Kaminski, R. K., Edwards, S. M., & Johnson, J. W. (1999). Assessing the incapacitative effects
of pepper spray during resistive encounters with the police. Policing: An International Jour-nal of Police Strategies and Management, 22, 7-29.
Klinger, D. A. (1997). The micro-structure of nonlethal force: Baseline data from and observa-tional study. Criminal Justice Review, 20, 169-186.
Maguire, E. R. (2002). Multiwave establishment surveys of police organizations. Justice Research and Policy, 4, 39-59.
McEwen, T. (1997). Policies on less-than-lethal force in law enforcement agencies. Policing: An International Journal of Police Strategy and Management, 20, 39-59.
Pate, A. M., & Fridell, L. A. (1993). Police use of force: Official reports, citizen complaints, and legal consequences (Vol. 1). Washington, DC: Police Foundation.
Pate, A. M., & Fridell, L. A. (1995). Toward the uniform reporting of police use of force: Results from a national study. Criminal Justice Review, 20, 123-145.
Peters, J., & Brave, M. (2006). Force continuums: Are they still needed. Police and Security News, 22, 1-5.
Petrowski, T. D. (2002). Use-of-force polices and training: A reasoned approach. The FBI Law Enforcement Bulletin, 71(10), 25-32.
Smith, M. R., Kaminski, R. J., Alpert, G. P., Fridell, L. A, MacDonald, J., & Kubu, B. (2010). A multi-method evaluation of police use of force outcomes. Washington, DC: Final Report to the National Institute of Justice.
Smith, M. R., Kaminski, R. J., Rojek, J., Alpert, G. P., & Mathis, J. (2007). The impact of con-ducted energy devices and other types of force and resistance on officer and suspect injuries. Policing: An International Journal of Police Strategies & Management, 30, 423-446.
Strom, K. J., Ropero-Miller, J., Jones, S., Sikes, N., Pope, M., & Horstmann, N. (2009). Final report: The 2007 survey of law enforcement forensic evidence processing. Washington, DC: National Institute of Justice.
Taylor, B., & Woods, T. J. (2010). Injuries to officers and suspects in police use-of-force cases: A quasi-experimental evaluation. Police Quarterly, 13, 260-289.
Tennessee v. Garner, 471 U.S. 1 (1985).Terrill, W. (2001). Police coercion: Application of the force continuum. New York, NY: LFB
Scholarly Publishing.Terrill, W. (2005). Police use of force: A transactional approach. Justice Quarterly, 22, 107-138.Terrill, W., & Mastrofski, S. D. (2002). Situational and officer based determinants of police
coercion. Justice Quarterly, 19, 101-134.Terrill, W., & Paoline, E. A. (2006, November). Police use of force policy types: Results from a
national agency survey. Paper presented at the annual meeting of the American Society of Criminology, Los Angeles, CA.
at MICHIGAN STATE UNIV LIBRARIES on October 3, 2012pqx.sagepub.comDownloaded from
28 Police Quarterly XX(X)
Terrill, W., & Paoline, E. A. (2012). Conducted Energy Devices (CEDs) and citizen injuries: The shocking empirical reality. Justice Quarterly, 29, 153-182.
Thomas, K. J., Collins, P. A., & Lovrich, N. P. (2010). Conducted energy device use in munici-pal policing: Results of a national survey of policy and effectiveness assessments. Police Quarterly, 13, 290-315.
Thomas, K. J., Collins, P. A., & Lovrich, N. P. (2011). An analysis of written conducted energy device policies: Are municipal policing agencies meeting PERF recommendations. Crimi-nal Justice Policy Review, first published online July 6, 2011.
U.S. Government Accountability Office. (2005). Taser weapons: Use of Tasers by selected law enforcement agencies (Report to the Chairman, Subcommittee on National Security, Emerging Threats and International Relations, Committee on Government Reform, House of Representatives). Washington, DC: U.S. Department of Justice.
Walker, S. (1993). Taming the system: The control of discretion in criminal justice, 1950-1990. New York, NY: Oxford University Press.
Walker, S. (2007). Police accountability: Current issues and research needs. Paper presented at the National Institute of Justice (NIJ) Policing Research Workshop: Planning for the Future (2006, November 28-29). Washington, DC.
Weisburd, D., Greenspan, R., Hamilton, E. E., Williams, H., & Bryant, K. A. (2000). Police attitudes toward abuse of authority: Findings from a national study. Washington, DC: National Institute of Justice.
White, M. D., & Ready, J. (2007). The Taser as a less lethal force alternative. Police Quarterly, 10, 170-191.
Williams, G. T. (2002). Force continuums: A liability to law enforcement? The FBI Law Enforcement Bulletin, 71(6), 14-19.
Worrall, J. L. (2002). If you build it, they will come: Consequences of improved citizen com-plaint review procedures. Crime & Delinquency, 48, 355-379.
Bios
William Terrill is an associate professor in the School of Criminal Justice at Michigan State University. His research centers on police behavior, with an emphasis on police use-of-force policies and practices. He has published numerous scholarly articles, chapters, and reports, as well as a book entitled Police Coercion: Application of the Force Continuum (2001, LFB Scholarly Publishing). He recently completed a National Institute of Justice grant geared toward examining the variation in American less lethal use-of-force policies and the various outcomes associated with the differ-ent policies, as well as a private foundation grant involving an observational study of the police. He earned his PhD in 2000 from the School of Criminal Justice at Rutgers University, Newark.
Eugene A. Paoline, III, is an associate professor in the Department of Criminal Justice at the University of Central Florida. He holds a PhD in criminal justice from the University at Albany, State University of New York. His research interests include police culture, police use of force, and occupational attitudes of criminal justice practitioners. He is the author of Rethinking Police Culture (2001, LFB Scholarly Publishing), and recently completed a National Institute of Justice grant geared toward examining the variation in American less lethal use-of-force policies and the various outcomes associated with the different policies.
at MICHIGAN STATE UNIV LIBRARIES on October 3, 2012pqx.sagepub.comDownloaded from


