Embed Size (px)
Citation preview
EXAMINING THE RELATIONSHIP BETWEEN SELF-ESTEEM
AND EXTRINSIC CAREER SUCCESS AMONG
NLSY79 YOUNG ADULT RESPONDENTS
A Dissertation
Submitted to the Faculty of Argosy University Phoenix
College of Business
In Partial Fulfillment of the Requirements for the Degree of
Doctor of Business Administration
by
Justin P. Barclay
April 2011
All rights reserved
INFORMATION TO ALL USERSThe quality of this reproduction is dependent on the quality of the copy submitted.
In the unlikely event that the author did not send a complete manuscriptand there are missing pages, these will be noted. Also, if material had to be removed,
a note will indicate the deletion.
All rights reserved. This edition of the work is protected againstunauthorized copying under Title 17, United States Code.
ProQuest LLC.789 East Eisenhower Parkway
P.O. Box 1346Ann Arbor, MI 48106 - 1346
UMI 3504758
Copyright 2012 by ProQuest LLC.
UMI Number: 3504758

ii
EXAMINING THE RELATIONSHIP BETWEEN SELF-ESTEEM
AND EXTRINSIC CAREER SUCCESS AMONG
NLSY79 YOUNG ADULT RESPONDENTS
Copyright ©2011
Justin P. Barclay
All rights reserved
iii
EXAMINING THE RELATIONSHIP BETWEEN SELF-ESTEEM
AND EXTRINSIC CAREER SUCCESS AMONG
NLSY79 YOUNG ADULT RESPONDENTS
A Dissertation
Submitted to the Faculty of Argosy University Phoenix
College of Business In Partial Fulfillment of
the Requirements for the Degree of Doctor of Business Administration
by
Justin P. Barclay
April, 2011 Dissertation Committee Approval: Chris Marcum, Ph.D. Date L. A. Pogue, D.M. Claudia A. White, Ph.D. Chris Marcum, Ph.D.
iv
EXAMINING THE RELATIONSHIP BETWEEN SELF-ESTEEM
AND EXTRINSIC CAREER SUCCESS AMONG
NLSY79 YOUNG ADULT RESPONDENTS
Abstract of Dissertation
Submitted to the Faculty of Argosy University Phoenix
College of Business
In Partial Fulfillment of the Requirements for the Degree of Doctor of Business Administration
by
Justin P. Barclay
April, 2011 Chris Marcum, Ph.D. L. A. Pogue, D.M. Claudia A. White, Ph.D. Department: College of Business
v
ABSTRACT
This study tested the theory of a relationship between self-esteem and extrinsic
career success, using data taken from the Bureau of Labor Statistics' National
Longitudinal Survey of Youth (NLSY79ch). Answers were sought as to whether a
relationship exists between self-esteem and extrinsic career success, and whether self-
esteem in combination with job satisfaction also exhibited a relationship with extrinsic
career success. Simple regressions were run for single variable tests, and multiple
regressions for multivariate tests. Self-esteem in simple regressions did reliably impact
extrinsic career success, whereas job satisfaction as a coefficient failed to do so.
Education was found instead to be far more impactful. Additional research to identify
further predictors of this success from similar longitudinal data would be advantageous
for predicting career path.
vi
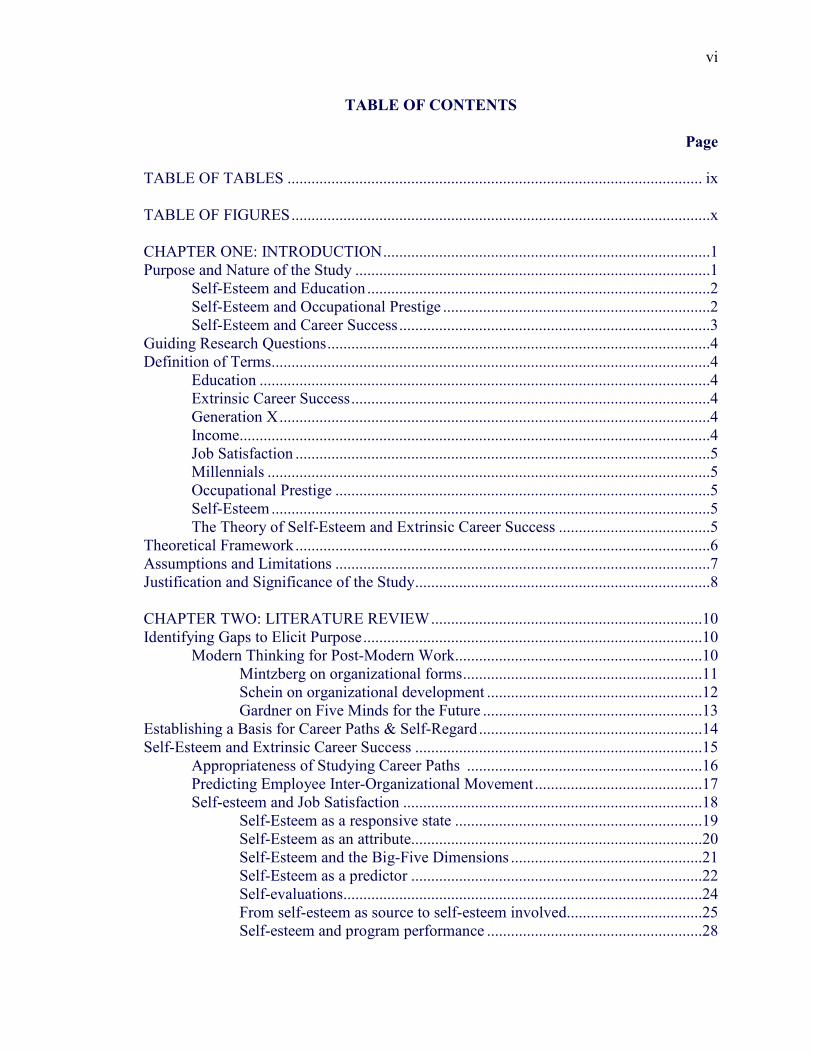
TABLE OF CONTENTS
Page
TABLE OF TABLES ........................................................................................................ ix TABLE OF FIGURES .........................................................................................................x CHAPTER ONE: INTRODUCTION ..................................................................................1 Purpose and Nature of the Study .........................................................................................1 Self-Esteem and Education ......................................................................................2 Self-Esteem and Occupational Prestige ...................................................................2 Self-Esteem and Career Success ..............................................................................3 Guiding Research Questions ................................................................................................4 Definition of Terms..............................................................................................................4 Education .................................................................................................................4 Extrinsic Career Success ..........................................................................................4 Generation X ............................................................................................................4 Income......................................................................................................................4 Job Satisfaction ........................................................................................................5 Millennials ...............................................................................................................5 Occupational Prestige ..............................................................................................5 Self-Esteem ..............................................................................................................5 The Theory of Self-Esteem and Extrinsic Career Success ......................................5 Theoretical Framework ........................................................................................................6 Assumptions and Limitations ..............................................................................................7 Justification and Significance of the Study ..........................................................................8 CHAPTER TWO: LITERATURE REVIEW ....................................................................10 Identifying Gaps to Elicit Purpose .....................................................................................10 Modern Thinking for Post-Modern Work ..............................................................10 Mintzberg on organizational forms ............................................................11 Schein on organizational development ......................................................12 Gardner on Five Minds for the Future .......................................................13 Establishing a Basis for Career Paths & Self-Regard ........................................................14 Self-Esteem and Extrinsic Career Success ........................................................................15 Appropriateness of Studying Career Paths ...........................................................16 Predicting Employee Inter-Organizational Movement ..........................................17 Self-esteem and Job Satisfaction ...........................................................................18 Self-Esteem as a responsive state ..............................................................19 Self-Esteem as an attribute.........................................................................20 Self-Esteem and the Big-Five Dimensions ................................................21 Self-Esteem as a predictor .........................................................................22 Self-evaluations..........................................................................................24 From self-esteem as source to self-esteem involved..................................25 Self-esteem and program performance ......................................................28
vii
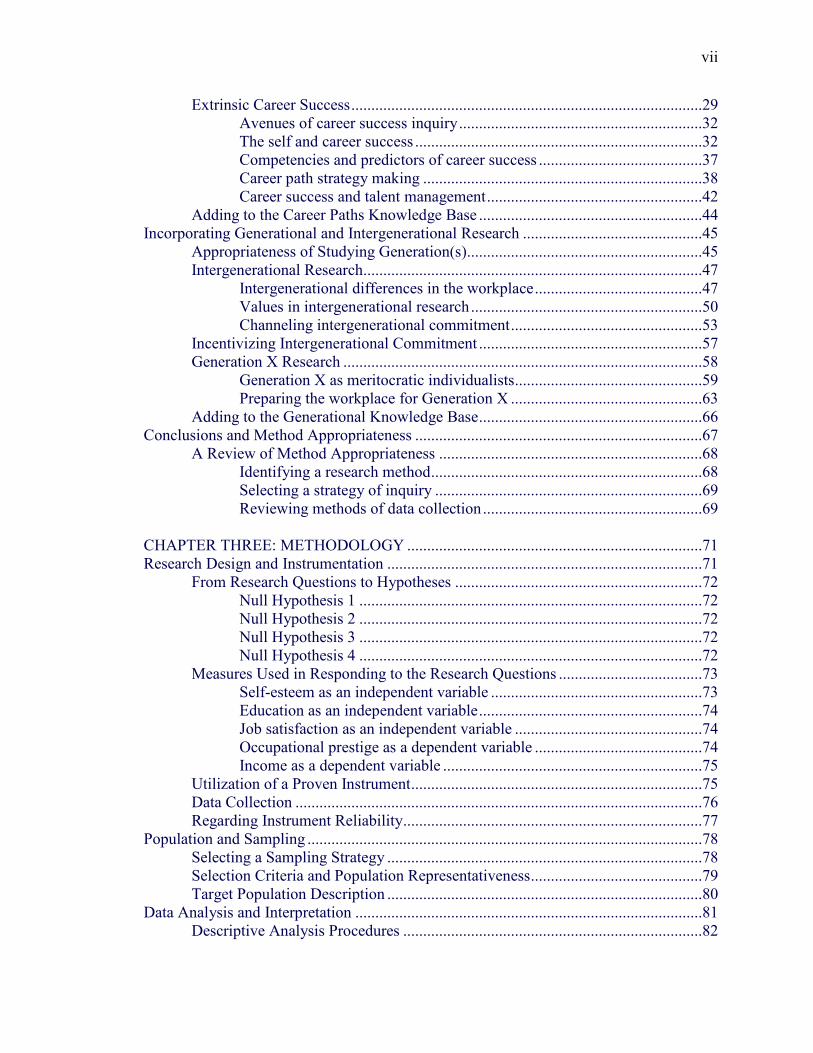
Extrinsic Career Success ........................................................................................29 Avenues of career success inquiry .............................................................32 The self and career success ........................................................................32 Competencies and predictors of career success .........................................37 Career path strategy making ......................................................................38 Career success and talent management ......................................................42 Adding to the Career Paths Knowledge Base ........................................................44 Incorporating Generational and Intergenerational Research .............................................45 Appropriateness of Studying Generation(s)...........................................................45 Intergenerational Research .....................................................................................47 Intergenerational differences in the workplace ..........................................47 Values in intergenerational research ..........................................................50 Channeling intergenerational commitment ................................................53 Incentivizing Intergenerational Commitment ........................................................57 Generation X Research ..........................................................................................58 Generation X as meritocratic individualists ...............................................59 Preparing the workplace for Generation X ................................................63 Adding to the Generational Knowledge Base ........................................................66 Conclusions and Method Appropriateness ........................................................................67 A Review of Method Appropriateness ..................................................................68 Identifying a research method ....................................................................68 Selecting a strategy of inquiry ...................................................................69 Reviewing methods of data collection .......................................................69 CHAPTER THREE: METHODOLOGY ..........................................................................71 Research Design and Instrumentation ...............................................................................71 From Research Questions to Hypotheses ..............................................................72 Null Hypothesis 1 ......................................................................................72 Null Hypothesis 2 ......................................................................................72 Null Hypothesis 3 ......................................................................................72 Null Hypothesis 4 ......................................................................................72 Measures Used in Responding to the Research Questions ....................................73 Self-esteem as an independent variable .....................................................73 Education as an independent variable ........................................................74 Job satisfaction as an independent variable ...............................................74 Occupational prestige as a dependent variable ..........................................74 Income as a dependent variable .................................................................75 Utilization of a Proven Instrument .........................................................................75 Data Collection ......................................................................................................76 Regarding Instrument Reliability ...........................................................................77 Population and Sampling ...................................................................................................78 Selecting a Sampling Strategy ...............................................................................78 Selection Criteria and Population Representativeness ...........................................79 Target Population Description ...............................................................................80 Data Analysis and Interpretation .......................................................................................81 Descriptive Analysis Procedures ...........................................................................82
viii
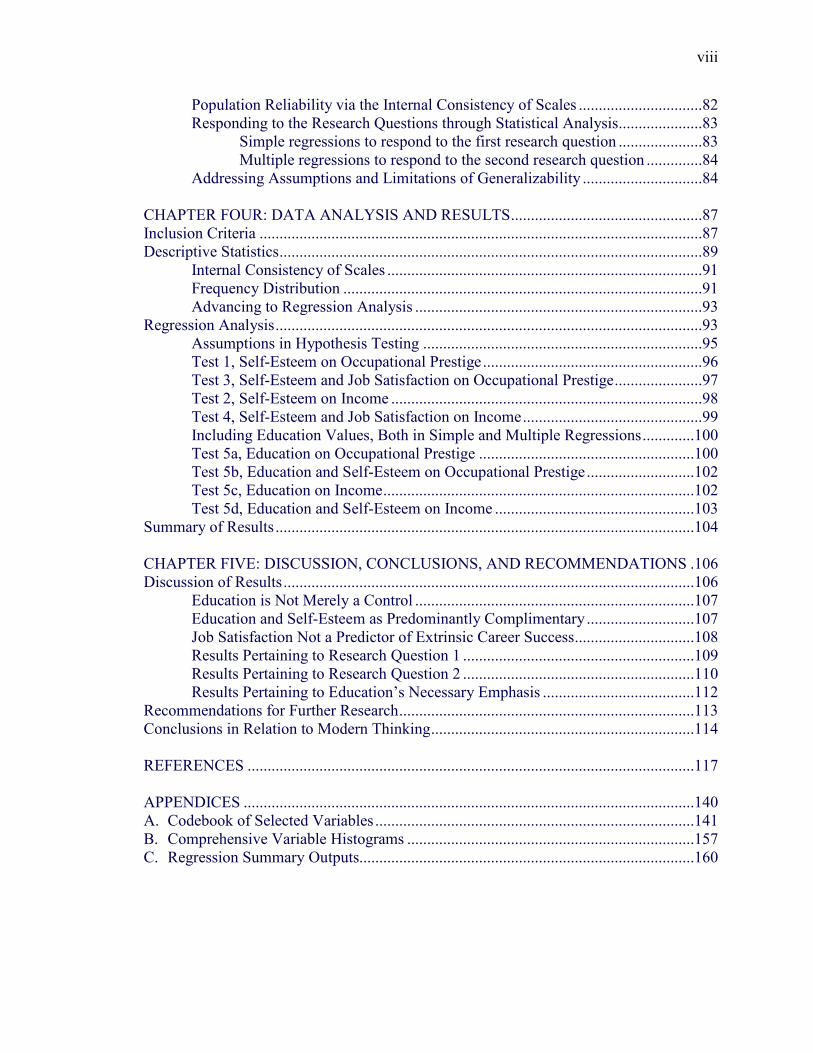
Population Reliability via the Internal Consistency of Scales ...............................82 Responding to the Research Questions through Statistical Analysis.....................83 Simple regressions to respond to the first research question .....................83 Multiple regressions to respond to the second research question ..............84 Addressing Assumptions and Limitations of Generalizability ..............................84 CHAPTER FOUR: DATA ANALYSIS AND RESULTS ................................................87 Inclusion Criteria ...............................................................................................................87 Descriptive Statistics ..........................................................................................................89 Internal Consistency of Scales ...............................................................................91 Frequency Distribution ..........................................................................................91 Advancing to Regression Analysis ........................................................................93 Regression Analysis ...........................................................................................................93 Assumptions in Hypothesis Testing ......................................................................95 Test 1, Self-Esteem on Occupational Prestige .......................................................96 Test 3, Self-Esteem and Job Satisfaction on Occupational Prestige ......................97 Test 2, Self-Esteem on Income ..............................................................................98 Test 4, Self-Esteem and Job Satisfaction on Income .............................................99 Including Education Values, Both in Simple and Multiple Regressions .............100 Test 5a, Education on Occupational Prestige ......................................................100 Test 5b, Education and Self-Esteem on Occupational Prestige ...........................102 Test 5c, Education on Income ..............................................................................102 Test 5d, Education and Self-Esteem on Income ..................................................103 Summary of Results .........................................................................................................104 CHAPTER FIVE: DISCUSSION, CONCLUSIONS, AND RECOMMENDATIONS .106 Discussion of Results .......................................................................................................106 Education is Not Merely a Control ......................................................................107 Education and Self-Esteem as Predominantly Complimentary ...........................107 Job Satisfaction Not a Predictor of Extrinsic Career Success ..............................108 Results Pertaining to Research Question 1 ..........................................................109 Results Pertaining to Research Question 2 ..........................................................110 Results Pertaining to Education’s Necessary Emphasis ......................................112 Recommendations for Further Research ..........................................................................113 Conclusions in Relation to Modern Thinking ..................................................................114 REFERENCES ................................................................................................................117 APPENDICES .................................................................................................................140 A. Codebook of Selected Variables ................................................................................141 B. Comprehensive Variable Histograms ........................................................................157 C. Regression Summary Outputs....................................................................................160
ix
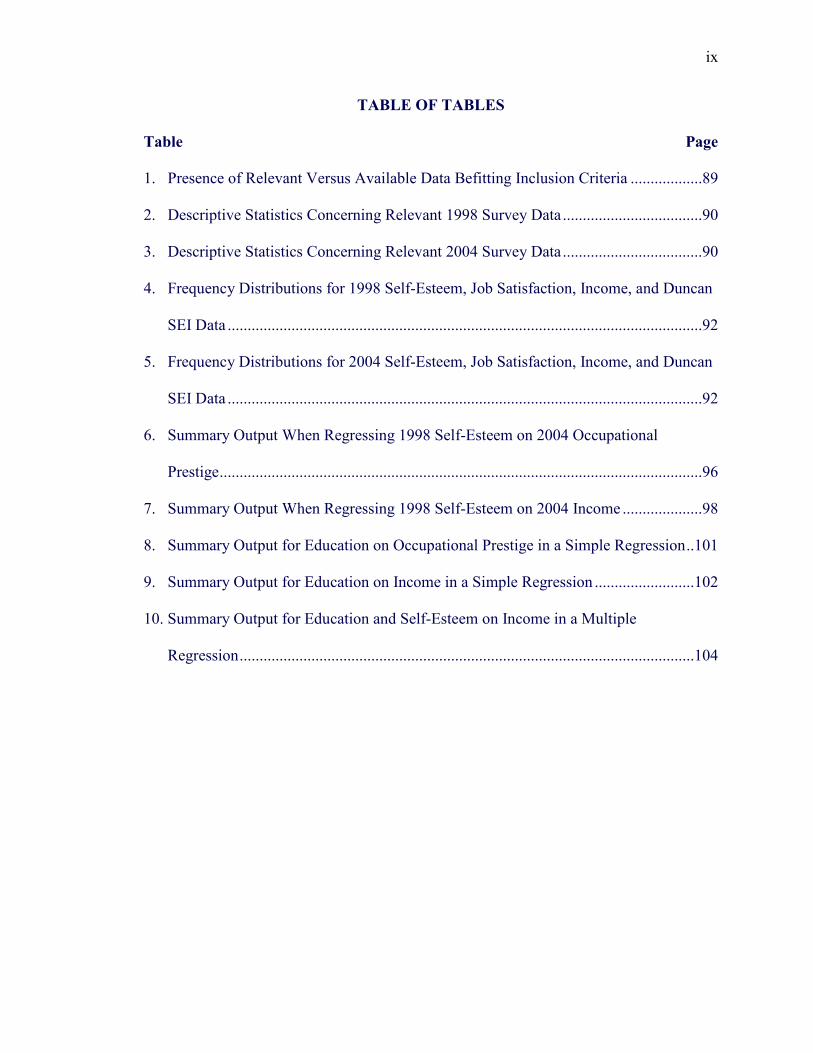
TABLE OF TABLES
Table Page 1. Presence of Relevant Versus Available Data Befitting Inclusion Criteria ..................89
2. Descriptive Statistics Concerning Relevant 1998 Survey Data ...................................90
3. Descriptive Statistics Concerning Relevant 2004 Survey Data ...................................90
4. Frequency Distributions for 1998 Self-Esteem, Job Satisfaction, Income, and Duncan
SEI Data .......................................................................................................................92
5. Frequency Distributions for 2004 Self-Esteem, Job Satisfaction, Income, and Duncan
SEI Data .......................................................................................................................92
6. Summary Output When Regressing 1998 Self-Esteem on 2004 Occupational
Prestige .........................................................................................................................96
7. Summary Output When Regressing 1998 Self-Esteem on 2004 Income ....................98
8. Summary Output for Education on Occupational Prestige in a Simple Regression ..101
9. Summary Output for Education on Income in a Simple Regression .........................102
10. Summary Output for Education and Self-Esteem on Income in a Multiple
Regression ..................................................................................................................104
x
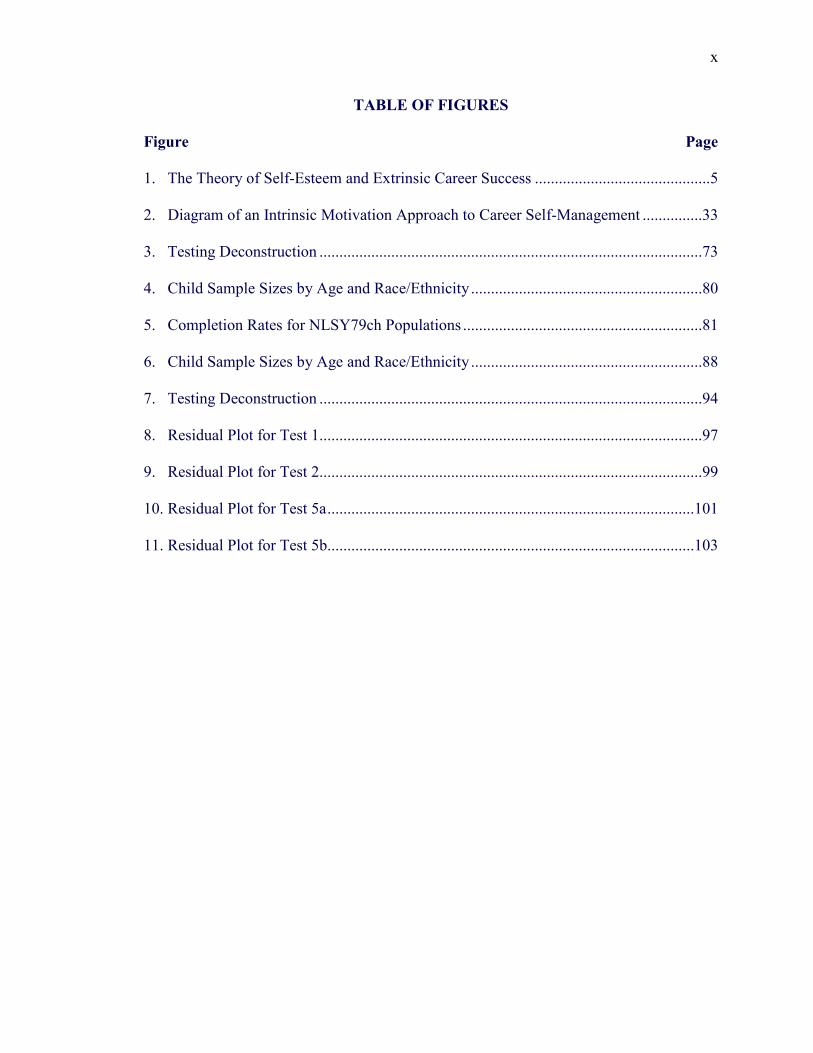
TABLE OF FIGURES
Figure Page 1. The Theory of Self-Esteem and Extrinsic Career Success ............................................5
2. Diagram of an Intrinsic Motivation Approach to Career Self-Management ...............33
3. Testing Deconstruction ................................................................................................73
4. Child Sample Sizes by Age and Race/Ethnicity ..........................................................80
5. Completion Rates for NLSY79ch Populations ............................................................81
6. Child Sample Sizes by Age and Race/Ethnicity ..........................................................88
7. Testing Deconstruction ................................................................................................94
8. Residual Plot for Test 1................................................................................................97
9. Residual Plot for Test 2................................................................................................99
10. Residual Plot for Test 5a ............................................................................................101
11. Residual Plot for Test 5b............................................................................................103
1
CHAPTER ONE: INTRODUCTION
Much has been written on self-esteem at work, job satisfaction, and extrinsic
career success. However, little has been written about the relationship between self-
esteem and its direct impact on extrinsic career success. Of the studies that have
analyzed this relationship, none have done so regarding our next generation of corporate
leadership, those from ‘Generation X’. This is at-issue when comparing Generation X
with the Baby Boomer generation, as the research has shown differences in both the
nature of career trajectories, as well as the perspectives on job satisfaction and
organizational loyalty. As the literature continues to amass volumes on driving employee
engagement, elevating job satisfaction, and providing levers for continued empowerment,
understanding must also increase regarding whether this research pertains only to point-
in-time positions, or if it applies across generations and impacts entire career paths.
Purpose and Nature of the Study
The Kammeyer-Mueller et al. (2007) study explored the relationship between
self-esteem and extrinsic career success. To ensure that this research will indeed break
new ground and contribute to the literature, previous studies concerning each of the core
variables has been addressed along with similar analyses.
The purpose of this study will be to test the theory of self-esteem and extrinsic
career success, which relates self-esteem to occupational prestige and income, controlling
for education, among respondents of the Bureau of Labor Statistics' National
Longitudinal Survey of Youth (NLSY79ch). The research will consist of four tests. The
first test will be self-esteem regressed on occupational prestige in a simple regression.
The second will be self-esteem and job satisfaction regressed on occupational prestige in
2
a multiple regression. The third test will be self-esteem regressed on income in a simple
regression. The fourth, will be self-esteem and job satisfaction regressed on income in a
multiple regression. Each will be prefaced by tests concerning the internal consistency of
scales used, the statistics for descriptive analysis, as well as tests for multicollinearity
where necessary; and all four regressions will use a time-series of eight years of survey
data.
Self-esteem and Education.
According to Forsyth, Lawrence, Burnette, & Baumeister (2007) “Theory and
prior research suggest that (a) a positive sense of self–worth and (b) perceived control
over one’s outcomes facilitate constructive responses to negative outcomes” (p. 447). It
is this combined sense of self-worth through self-driven outcomes that forms the basis of
self-esteem & education research over time. From the beginning of experimentation and
corollary research on the combined topic, researchers have assumed that an increase in
one will cause an increase in the other. However, there is some disagreement over which
way the direction lies and whether the combination can be tied to career success.
Self-esteem and Occupational Prestige.
In On Intersubjectivity and Collective Conscience in Occupational Prestige
Research, Guppy (1982) remarked “Recently Social Forces published two significant
contributions to occupational prestige research… Balkwell, Bates, and Garbin (BBG)
sought to test a key assumption in the status attainment research tradition, namely, the
intersubjectivity of occupational prestige evaluations” (p. 1178). How this particular
work became notably relevant to the literature on occupational prestige was its question
of whether the evaluations therein were a result of ‘collective conscience’ or ‘figments of
3
sociological imagination’. While this article did not go on to ultimately put the question
to rest, it did begin the drive toward specificity on agreement regarding occupation, type,
and overall prestige evaluation.
Self-esteem and Career Success.
Although the stance taken is that no direct, longitudinal studies of self-esteem and
extrinsic career success have been done over time, this does not prevent the proliferation
of studies regarding self-esteem and success in general. Feick & Rhdoewalt (1997) write
“A field study was conducted to test the hypothesis that discounted and augmented ability
self-attributions mediate the interactive effects of claimed self-handicaps and academic
success and failure on self-esteem” (p. 147). This study, while specifically targeting self-
handicaps, added substantial weight to the concept of self-attribution in the literature.
Prior to the test discussed in the article, not only had students discussed more of the
obstacles that might lead to their poorer scores on the exam, those poorer scores became a
reality when the graded version was returned to them. While this, and studies like it, did
not contribute to the literature on self-esteem and career success directly, they did
contribute toward the factors mitigating such when a direct correlation between the two
variables could not be established.
A current summary of the literature on self-esteem and career success by
Kammeyer-Mueller, Judge, & Picollo (2007) reads “Because there is an expectation that
individuals with more positive work behaviors will be compensated for their superior
performance (e.g. Judge, Higgins, et al., 1999), it is expected that income will follow” (p.
209). This supports the notion that, while self-esteem and career success are directly
4
related, no pre-existing studies have gone beyond establishing a relationship between
positive work behaviors and superior performance.
Guiding Research Questions
Fundamental to the theory on self-esteem and extrinsic career success, and to the
NLSY79ch dataset, self-esteem and its relationship to the extrinsic career success factors
are considered. The questions for study in this research therefore include:
1. Is there a relationship between self-esteem and extrinsic career success among
respondents?
2. Is there a relationship between self-esteem, job satisfaction, and extrinsic
career success among respondents?
Two observations of particular importance include the fact that prior evidence
reveals self-esteem to be substantially related to career outcomes, and that people
gravitate toward job levels that match their abilities (Kammeyer et al., 2007, p. 217).
These questions are not to confirm or deny a previously established theory. Rather, they
are designed to determine if similar effects can be seen in a more recent survey, which
could lead to potential impacts concerning self-regard and career paths. They are
designed with the intention of beginning to form conclusions about whether current
literature addresses positions in isolation or whether a larger understanding is needed to
address career paths across generations.
Definition of Terms
Education. Highest grade level of formal education completed.
Extrinsic career success. The pairing of occupational prestige and income.
Generation X. Born between 1961 and 1981 (Meister & Willyerd, 2010).
5
Income. Previous year’s income from wages or salary.
Job satisfaction. General rating of job satisfaction.
Millennials. Born between 1977 and 1997 (Meister & Willyerd, 2010).
Occupational prestige. The Duncan Socioeconomic Index (SEI) was used to measure
job complexity and occupational prestige…, which was taken from a number of experts
in the 1950s from Census data on occupational characteristics on the perceptions of the
prestige rating of occupations (Kammeyer-Mueller et al., 2007, p.208).
Self-esteem. Ten items from the 10-item scale developed by Rosenberg (1965)
(Kammeyer-Mueller et al., 2007).
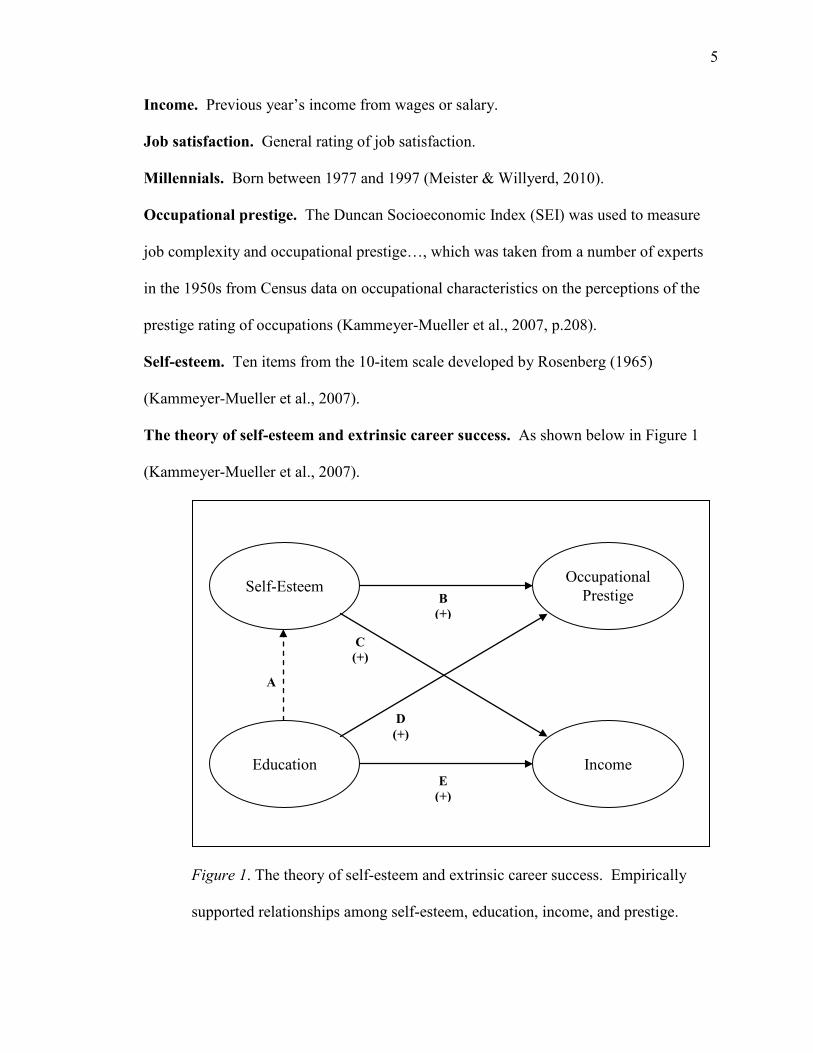
The theory of self-esteem and extrinsic career success. As shown below in Figure 1
(Kammeyer-Mueller et al., 2007).
Figure 1. The theory of self-esteem and extrinsic career success. Empirically
supported relationships among self-esteem, education, income, and prestige.
Self-Esteem Occupational Prestige
Education Income
A
B (+)
C (+)
D (+)
E (+)
6
Theoretical Framework
Extrinsic career success is a phrase that pays homage to a study done by
Kammeyer-Mueller, Judge, & Piccolo (2007), where work was done to establish a
relationship between self-esteem and its effect on income and occupational prestige.
Therefore, the authors define extrinsic career success as “a construct that includes the
income level of the job as well as the prestige of one’s occupation” (Kammeyer-Mueller,
Judge, & Piccolo, 2007, p. 206). In this landmark study, a dynamic model was tested,
which used varying regressions to analyze the relationships between variables including
self-esteem, education as a control, income, and occupational prestige. It was found that,
while extrinsic career success did not affect self-esteem over time, there was statistically
significant evidence that the reverse was true; self-esteem affected extrinsic career
success instead. This was shown over an eight-year time series and was one of the first
studies to suggest that the repercussions of individual success were related to self-regard.
Indeed, as the significant relationship between self-esteem and income is consistent with
evidence that self-evaluations are positively related to motivation and performance, we
can then begin to research the relationship between self-esteem and extrinsic career
success. Applying this theory to certain populations may give rise to further research in
the future regarding its applications in employee engagement (Kammeyer-Mueller et al.,
2007).
It has been shown that the participants of the Kammeyer-Mueller et al. (2007)
study embodied a relationship between self-esteem and extrinsic career success over an
eight-year period. The participants of this study were respondents of the National
Longitudinal Survey of Youth 1979 (NLSY79). Sponsored by the US Department of
7
Labor, Bureau of Labor Statistics, it was a multi-purpose panel survey that originally
included a nationally representative sample of over 12,000 men and women between the
ages of 14 & 21 at the end of 1978 (BLS, 2006). This population answered questions on
topics ranging from labor market experiences to socioeconomic variables and attitudes.
During the course of this survey, data was collected on self-esteem using Rosenberg’s 10-
item self-esteem scale, as well as annual wages, educational completion and achievement,
and occupational codification that was later translated using the Duncan Socioeconomic
Index to indicate occupational prestige.
Assumptions and Limitations
The research design upon which this study shall be founded is based on a number
of assumptions and limitations. This study assumes that the Bureau of Labor Statistics’
description of NLSY79 data is representative of the generation and is reported to be
accurate, although research will be done on the method by which the sample was chosen
and data collected.
It is also assumed that, as the survey data had been previously collected, and
accessible only through the Bureau of Labor Statistics’ retrieval tool, that the accessible
data is a holistic representation of data collected. The study is limited in scope, in that it
is only intended to answer questions concerning self-esteem, job satisfaction, and
extrinsic career success as they relate to one another and not in isolation.
This study is also limited to respondents of the NLSY79 Young Adult survey,
and will produce results assumed to pertain to this group alone. This study is limited to
those who provided complete responses to the required variables in the years analyzed.
This study was also limited only to those who worked full-time at the time of the survey.
8
As the Duncan Socioeconomic Index will be used to assess occupational prestige, it is
assumed that a strong consensus remains regarding these ratings, and can therefore give a
representative response of prestige. Finally, this study is limited to the potential
relationship(s) of self-esteem and/or job satisfaction on extrinsic career success and will
make no claim as to methodology for impacting levels of either self-esteem and/or job
satisfaction.
Justification and Significance of the Study
Can one’s commitment to position and organization be consistent only when
one’s self-esteem is in agreement with the occupational prestige and income of that
position? “[Job] search behavior, whether it results in turnover or not, is costly because it
absorbs time and energy that might be put to other uses (March & Simon, 1958) and may
engender psychological processes that induce withdrawal behavior and reduce
commitment to the current job and organization (Lock, 1976)” (Bretz Jr., Boudreau, &
Judge, 1994, p. 277). When researching the possible statistical relationship between self-
esteem and extrinsic career success, early results have shown a direct relationship
between increases in self-esteem and resulting increases in occupational prestige and
income as seen in the Kammeyer-Mueller et al. (2007) study. Additionally, those with
lower levels of self-esteem were shown to possess lower levels of occupational prestige
and income as well.
Generation X and Generation Y exhibit different perspectives and expectations
than the Baby Boomer generation. The retention of Generation X members and the
attraction of Generation Y members have proven elusive for many organizations
(Bridgers & Johnson, 2006). This lack of understanding as to the motivational factors
9
begets further inquiry as to whether elevating job satisfaction or employee engagement
alone is enough. Is there a relationship between self-esteem and extrinsic career success
among Generation X workers? The current literature does not sufficiently answer this
question. How do corporations prepare for a generational shift of corporate leadership to
individuals who may exhibit entirely different characteristics than previous generations?
These generations may have behaviors and attitudes about career paths and perceptions of
career success that need to be addressed.
While this research alone will not allow for conclusions germane to this upcoming
generation in its entirety, the respondents of the NLSY79 Young Adult are born into the
years that classify them as members of Generation X. Those studied by Kammeyer-
Mueller et al. and central to their theory were born into the Baby Boomer generation.
This research, therefore, is not to answer questions on Generation X, but to determine
whether further research on this generation is with merit.
10
CHAPTER TWO: LITERATURE REVIEW
In 2008, a qualitative study was performed, which reviewed the differences in
values among four generations across eleven organizations. According to its researcher,
Siebert (2008), “the majority of those interviewed for this dissertation reported wide-
ranging differences in values between the members of the different generations regarding
respect, commitment, work and life balance, expediency, and independence” (p. 3).
While this particular study gave rise to a completed dissertation on conflict and
managerial response, it equally contributed to the literature an understanding of some of
the challenges posed to organizations striving to make sense of the differences which lie
between members of differing generations while at work.
Identifying Gaps to Elicit Purpose
Targeting the efforts of the organization to a committed set of potential employees
for development is integral. To do so requires a proven methodology for predicting
career path prior to determining fit. Literature exists regarding self-esteem, career
success, and intergenerational research each in isolation, but what remains to be explored
are measures of self-esteem and extrinsic career success when studying the Generation X
workforce over time.
Modern Thinking for Post-Modern Work.
This research would be incomplete without ensuring that the conclusions be
drawn from a wide range of similar works and the most relevant research available. This
includes current research on concepts such as organizational development, organizational
form, and perceptions of work in a post-modern working environment, such as that into
which we are entering into today.
11
Mintzberg on organizational forms. As remarked by Mintzberg, Ahlstrand, and
Lampel (1998), “Cognition aside, in reviewing a large body of literature, ten distinct
points of view did emerge, most of which are reflected in management practice… each
has a unique perspective that focuses, like each of the blind men, on one major aspect of
the strategy-formation process” (p. 4). These ten points of view include the Design,
Planning, Positioning, Entrepreneurial, Cognitive, Learning, Power, Cultural,
Environmental, and Configuration Schools. Each school looks at the strategy process
differently and each one includes many sentiments regarding which is the key actor and
what drives strategy. Of particular note in this research is the Environmental School.
The Environmental School depicts the strategy process as being outside of the
organization, and the organization as being more of a ‘mirror’ to what surrounds it. This
aligns with the findings in a review of the literature, which identified research classifying
the Generation X workforce as ‘meritocratic individualists’.
These meritocratic individualists care less about mission, vision, and
organizational loyalty, and more on the alignment of incentivization based on merit. The
work of Mintzberg and others in this regard goes on further to explore organizations as
exhibiting adaptive characteristics based on ‘passive’ leadership, which focuses only on
reshaping the organization to the environment, rather than shaping the environment using
the organization. The consequences of such a premise include both the organization’s
requirement to respond to environmental factors or to be selected out, and they include
the clustering together in distinct ecological-type niches or positions where they remain
until resources become scarce or conditions become too hostile (Mintzberg et. al, 1998).
12
This becomes relevant as Mintzberg’s modern thinking on the post-modern work
environment includes organizations that need to adapt to their surroundings and provide a
deep literary relationship to the meritocratic individualists who make up the Generation X
population and to the NLSY79 Young Adult population specifically.
If we are to structure organizations in a way that is inviting to people who base
success on merit alone, and we now know how dependent that success is on a
combination of education and self-esteem, organizations must be adept at sensing and
adjusting to shifts in aptitude among those who are rising in leadership ranks.
Schein on organizational development. In a recently published article titled A
Corporate Climate of Mutual Help, Edgar Schein, known as MIT’s ‘sage of
organizational culture’ spoke of the need for interdependence to be at the heart
accountability in organizations. Schein (2011) remarked “Better teamwork requires
perpetual mutual helping, [across] boundaries… I don’t see how we’re going to get there
unless we create cultural ‘islands’ – situations in which people can go outside the
organization’s norms and practices and explicitly create [this relationship]” (p. 3). This
recalibrating of organizations speaks to the need to make pointed efforts to reduce or
eliminate the boundaries seen in organizations whereby functions are departmentalized.
Senior leadership does not exercise opportunities to make others ‘feel psychologically
safe’ as Schein describes.
Based on this evaluation, there exists a need to reorganize the organization into
one that exhibits more matrix characteristics, where specialized teams can be created
across cultural boundaries in order to solve the problem at-hand. There is a need to
create a culture of true collaboration, one where the skills of one department, function, or
13
team are not isolated from another based on organization, and one where the organization
itself is not a precursor for how work is done.
As with the research on Generation X, they crave an organization where ample
opportunities to interact abound. They seek opportunities to expand on a pre-existing
skillset by being recruited or potentially self-promoting for projects outside their existing
‘comfort zone’. Meritocratic indeed is the Generation X worker of the post-modern work
environment who can vote on which projects he/she would like to work next quarter, and
which development initiatives he/she would like to take part in as well. In this way,
organizational loyalty is directly impacted by the ability of workers to fulfill a potential
established by self-perception and self-esteem. The coming generation will only identify
with positions that befit self-evaluation, and that equally create opportunities for
consistent growth and challenge.
Gardner on five minds for the future. Howard Gardner is the John H. and Elisabeth A.
Hobbs Professor of Cognition and Education at the Harvard Graduate School of
Education. His text, titled Five Minds for the Future (2006), chronicles the aptitudes that
will be in high demand in the coming future and describes these abilities in greater detail.
These minds include the disciplinary mind, the synthesizing mind, the creating mind, the
respectful mind, and the ethical mind. In order to assess value, one must consider the
world of the future with its ubiquitous search engines, robots, and other computational
devices. The future work force will demand capacities that, until now, have been mere
options (Gardner, 2006). The disciplinary mind is concerned with specificity around a
certain trade or discipline and a deeply rooted expertise upon which much of one’s
remaining actions are built. The synthesizing mind takes in and simultaneously evaluates
14
information from a wide range of sources, much like integrative thinking, which looks
beyond the confines of a discipline and asks from where beneficial information comes
regardless of origin. The creating mind is perhaps the most straightforward since it
concerns the ability to ‘break new ground’ as Gardner puts it. The respectful mind notes
and welcomes differences between human individuals and between human groups and
tries to understand these ‘others’, and seeks to work effectively with them (Gardner,
2006, p. 3). Finally, the ethical mind regards an individual’s ability to balance their
needs in relation to the collective society surrounding him/her.
Recognizing and accepting the differences between these five minds becomes
important since it can be a tumultuous endeavor to understand persons who think
differently. It is easy to misunderstand, to be confused, and to exhibit undetected bias.
Yet, in considering these five minds, we are bestowed with a template with which to
evaluate a person’s ability to contribute to organizational success. This understanding
may allow us to evaluate the best fit for an employee based on self-regard.
Establishing a Basis for Career Paths & Self-Regard
In order to establish a theoretical basis for studying career paths and self-regard,
one must determine what drives the extrinsic career success and the organizational
commitment patterns of the Generation X workforce (Gen-X). One consistency
identified in the prevailing literature is the continued emphasis on the Baby Boomer
generation and its impact on the workforce in this country. As the Baby Boomer
generation reaches its employment horizon, there is a proliferation of research around
succession planning, employee engagement, organizational culture, and the leadership
pipeline as only a few popular topics abound in the popular presses and in the academic
15
literature. This research, including that on Gen-X, as well as the variables inclusive of
the theory of Self-Esteem and Extrinsic Career Success, will form the basis of this review
of the literature. Thus, the sections of this review will include the history of interplay of
the variables of this central theory on self-esteem and extrinsic career success and
germane intergenerational and Gen-X studies. It will also include any literature
contributing to the concepts of predicting organizational commitment and its impacts on
the leadership pipeline. In order to provide a timely basis of comparison, the literature is
from the most recent five years of available research on these topics
Self-Esteem and Extrinsic Career Success
A concise description of the struggle for employee career path stability and the
importance of this stability to organizational longevity and success are described in The
Leadership Pipeline: How to Build the Leadership-Powered Company. According to
Charan, Drotter, & Noel (2011), “Everyone is fighting over a relatively small group of
stars who, even when successfully recruited, tend to move from company to company
with alacrity” (p. 1). They describe The Leadership Pipeline as an approach to
succession planning, which has led to a broad spectrum of succession planning programs
now in-effect among some of the largest organizations currently competing. The
Leadership Pipeline is segmented into six ‘passages’ from managing self to managing
others, from managing others to managing managers, from managing managers to
functional manager, from functional manager to business manager, from business
manager to group manager, and from group manager to enterprise manager (Charan,
Drotter, & Noel, 2011).
16
Appropriateness of Studying Career Paths.
The importance of each of these passage transitions includes shifts in focus
including skill requirements, time applications, and work values. These transitions
quickly become pivotal as each passage traversed represents a significant amount of time
invested by both the developing professional and the organization supporting this
transition along the professional’s career path. With each turn, significant investments in
time, capital, and trust permeate the transaction. Yet as this employee develops in skill
and experience, so does the opportunity for movement from company to company as
highlighted by the authors. As Charan, et al. (2011) continues, “Instead of vague
determinations that a company is lacking a talent pool of young leaders, The Pipeline
approach enables you to pinpoint the precise level where problems are occurring and the
skills, time applications, and values at that level where people are coming up short” (p.
132). The Pipeline is an approach that goes beyond assessing the standard knowledge,
skills, and abilities of a given person in a given position. It is a model, which additionally
goes beyond determining the optimal level of results when measuring resource efficacy
alone and forgoes the assessment of an employee’s ability to generate those tangible
results. Instead, it searches the boundaries of what a professional does, knows, and
stands for in order to determine a perfect fit for a range of positions within an
organization. It is believed, however, that this does not come without a potential
shortcoming.
This shortcoming is not in its ability to encompass the process by which a
member of an organization is developed in time for ascension to the next appropriate
rank/passage. Rather, the shortcoming is possibly in its prediction of longevity and
17
success for an individual employee by way of organizational commitment. This is not to
claim that The Leadership Pipeline is not an asset to the organizational development
community or that succession planning as a practice has not tremendously benefited from
decades of work using this model among the Fortune 500 as a notable example alone. It
is to say, however, that not every employee is predictable. Even as the introduction to the
text claims, it is not without movement between organizations regardless of the
investment made by a single company in the defector’s professional development.
Adding a layer of predictability to this inter-organizational movement is of upmost
importance and it arms companies with the ability to be cognizant of where resources
should be allocated. This generational shift has sparked a ‘War for Talent’, which
continues with a level of fervor not seen before among corporate ranks. The potentially
intervening variable of self-esteem, as studied in the theory of Self-Esteem and Extrinsic
Career Success, demonstrates that self-esteem can, not only affect job search and short-
term performance, but also can have effects over a period of years in one’s career
(Kammeyer-Mueller et al., 2007).
Predicting employee inter-organizational movement.
That predictor, as the theory of Self-Esteem and Extrinsic Career Success,
established a relationship between career paths and self-regard in a prior study among
Baby Boomers where an individual finds one’s self most befitting in an organization
based on self-esteem levels. This was prior to applying The Pipeline development
process to get him/her to that point. It is believed that this theory can do the same thing
among the Gen-X population. As noted by Charan et al., 2011), “Succession planning is
perpetuating the enterprise by filling the pipeline with high-performance people to assure
18
that every leadership level has an abundance of these performers to draw from, both now
and in the future” (p. 167). This process can and should drive the efforts of all who
contribute to an organization’s development. Yet it is only implemented after each level
is populated with those individuals who either feel befitting of that role, or feel they are
on their way to a befitting role as potentially evidenced by the corollary relationship
between self-esteem and occupational prestige over time.
Self-Esteem and Job Satisfaction.
Since self-esteem is a primary driver of the theory of Self-Esteem and Extrinsic
Career Success, it then becomes prudent to seek out what expressions of self-esteem’s
impact have been studied over the relevant past. Studies of this personality trait include
experiments, observations, and case studies on the effects of self-esteem in the areas of
identity, self-worth, grouping, disability, learning, achievement, and success inclusive of
both intrinsic and extrinsic career success. In The Pursuit of Self-Esteem: Contingencies
of Self-Worth and Self-Regulation, Crocker, Brook, Niiya, & Villacorta (2006) describe
“a program of research examining [self-regulation] pitfalls associated with contingent
self-worth and suggest that learning orientations, particularly the willingness to embrace
failure for the learning it affords, foster successful self-regulation even in people with
highly contingent self-esteem” (p. 1749). This research, founded in a meta-analysis of
studies on the intersection of self-worth and self-regulation, covered associations of self-
worth by researching personal/individual validation goals in areas including academics,
appearance, approval, and virtue. The evidence found that the area in which a person
finds him/herself most confident is the same area in which the person is most avid to list
validation goals set to express their value in that area. One such example the study
19
provides is of a person who bases their worth on self-virtue, who consequently sought to
validate that they were moral or virtuous more often than others of differing values
(Crocker et al., 2006). The conclusion is then drawn where contingent self-esteem is
predicated on the individual’s performance in the areas most attributed as defining self-
value. These emphasized areas of worth become, not only the strongest measure for self-
induced performance assessment, but also the driver(s) of a person’s overall self-regard.
Self-esteem as a responsive state. Self-esteem can also be influenced by others’
performance as was the case in 2003, when researchers from University College of Cape
Breton measured self-esteem as a predictor of academic success. This was accomplished
by examining the relationship between self-esteem and performance when students had
received information about peers’ success or failure (Covin, Donovan, & Macintyre,
2003). In this study, 120 random Canadian undergraduate students were placed into three
groups. While these groups were all given the same practice questions from the Graduate
Record Examination (GRE), each of the three groups received a different level of
information on the success of prior test-takers on the exam in order to test whether self-
esteem and, therefore, testing ability could be impacted by others’ prior performance. In
addition to the GRE practice questions, all respondents were first given the Rosenberg
10-item, self-esteem scale to measure self-esteem’s impact as a variable to the
relationship of others’ performance and current test performance. Covin, Donovan, &
Macintyre (2003) found that “The present study demonstrates that beliefs about the self
can have complex relationships with behavior – in this case, test performance – and that
the effects of those relationships might relate to the ambiguity of the task at hand” (p.
544).
20
Self-esteem as an attribute. To garner an understanding of self-esteem’s current impact,
it also becomes prudent to review its intrinsic origins. One such study was performed in
2007 when Forsyth, Lawrence, Burnette, & Baumeister “predicted that encouraging
students to maintain their sense of self-worth and/or construe their academic outcomes as
controllable would promote achievement” (p. 447). The conclusion of this research was
contrary to its hypothesis, as D and F graded students performed worse as self-esteem
was bolstered. The study targeted those who received a C, D, or F on a psychology
course’s first exam. Of this population, groups were then formed to receive one of two
stimuli over time, where a third control group received none. Based on random
assignment, and on a weekly basis, one student group was given messaging intended to
bolster self-esteem, while the other group received messages pertaining to internal control
and personal responsibility (Forsyth, Lawrence, Burnette, & Baumeister, 2007).
Conducted entirely from email, the study population was contacted via assigned student
email accounts and asked to take part in a study on ‘communication and the use of
email’. Attesting to the communication’s purpose of providing information on academic
performance, each group was given a review question from the week’s in-class material
and they additionally received information on either internal control and personal
responsibility, or messaging intended to bolster self-esteem if in the appropriate,
randomly assigned group. The third group, while still receiving the review question, did
not receive any further information beyond the research question, to serve as an otherwise
unaffected subpopulation. The findings, in using the course’s final examination as the
dependent variable, did not substantiate the initial supposition that bolstering self-esteem
would implicitly support positive academic outcomes. Instead, as described by Forsyth,
21
Lawrence, Burnette, & Baumeister (2007), “The pattern of student grades was the
opposite of our predictions, and in fact D and F students in the self-esteem bolstering
condition showed a substantial drop in grades from the midterm (57% correct) to 38% on
the final” (p. 452-453). Later, the authors go on to discuss that perhaps bolstering one’s
self-esteem when no measurable achievements are present can lead to a ‘defensive’
attitude toward outside influence/requirement, thereby eliciting a reaction counter to a
bolstering the effort’s intent. In continuing to explore self-esteem in the academic
environment as a precursor to the workplace, constructs involving self-esteem were also
coupled alongside personality in order to measure achievement.
Self-esteem and the Big-Five dimensions. In addition to concepts such as attribution,
self-worth, and achievement, psychology as a discipline continues the search for
understanding of self-esteem’s relationship with extrinsic outcomes in academic settings
in part by using principles adapted from the Big-Five dimensions. In a study of middle
school students, Hair & Graziano (2003) hypothesized that “personality, self-esteem, and
teachers’ ratings of adjustment during the middle school years predict later life outcomes
during high school” (p. 971-972). Hair & Graziano’s understanding of self-esteem,
however, is not just a detailed account of how self-esteem and personality may predict
later outcomes. Additionally, the authors provide a level of granularity to the personality
construct, such that we may now begin to deconstruct the idea into meaningful segments
of experience while relating it to self-esteem. This gives rise to the potential of finding a
proxy for personality in present-day corporations, where it can then be assessed alongside
self-esteem as was done in this research of middle school learners. The three levels of
personality discussed include Level I or the comparative/decontextualized elements of
22
personality; Level II or contextualized plans, strategies, and concerns; Level III is the life
narrative where sense-making is performed (Hair & Graziano, 2003). The population for
the Hair & Graziano study consisted of 317, south central Texas, middle school students.
Self-reported data was collected on self-esteem and personality and standard scales were
used to obtain measures of the Big-Five personality factors and self-esteem dimensions
(Hair & Graziano, 2003). The findings, as described by Hair & Graziano (2003), include
“Our data suggest early-appearing personality characteristics and aspects of the self in
children are related to how well they adapt later to high school and its academic
environment” (p. 990).
Self-esteem as a predictor. University of Iowa researchers Shepard, Nicpon, and
Doobay (2009) contributed a collegiate level perspective to this building understanding
of what is meant by self-esteem and its potential as an outcomes predictor when they
studied early entrance college students and their responses to self-reported ratings of self-
concept. Twenty-two first-year students enrolled at a large midwestern University were
recruited voluntarily for the study. They were administered the Piers-Harris Children’s
Self-Concept Scale as a pre-test during their first week, and as a post-test during the
initial month of each student’s second semester (Shepard, Foley, Nicpon, & Doobay,
2009). These tests were designed to determine if shifts would occur in self-concept
across time when viewed in relationship to academic achievement, and in early-entrance
collegiate work specifically. Shepard et al. (2009) found that “these aspects of self-
concept may have mildly improved as a result of positive academic experiences,
engagement in more challenging coursework, and interactions with peers who share their
interests, values, and passions” (p. 52). Thus, not only can self-esteem lead to success in
23
academic work, but academic work may contribute equally to increases in self-esteem, as
a cycle of self-fulfilled expectations of success continue throughout a learner’s academic
career.
While the above may certainly contribute to the understanding of what positive
self-regard and equally positive academic outcomes may do to elicit an overall positive
experience in a confident learner, antithetical studies also exist where perspectives were
taken regarding those who had less positive experiences. Inclusive of these studies is one
by Zhang, Zhao, & Yu (2009) in the Journal of Social Behavior and Personality. The
intent was to learn more about how playing the role of either low-achiever or higher-
achiever impacted performer self-esteem. As described by the authors Zhang et al.
(2009), “The results of the current study provide powerful evidence for the proposition
that being able to hide socially devalued aspects of the self may enable individuals to
minimize the impact of the devalued identity on others’ judgments” (p. 809). To identify
these potential consequences, 76 low-achievement (LA) adolescents and 75 high-
achievers (HA) were first identified and then administered the Rosenberg Self-Esteem
Scale. The students were then introduced randomly to one of two situations. Each
participant was instructed that an interviewer, described as a respected expert in the field
of education, would like to interview some good students and give advice on learning
strategies (Zhang, Zhao, & Yu, 2009). One of the two groups received these instructions,
while the other was given similar instructions with the words “good student’ substituted
with “low-achieving student”. The results were that those who were instructed to
represent a good student reported higher self-esteem after the interview, and those who
were instructed to play the role of a low-achiever presented with lower self-esteem after
24
the interview. These results were consistently measured by the State Self-Esteem Scale,
and were consistent across actual achievement statuses elsewhere. This study showed
that, not only can self-esteem affect academic outcomes, it can even affect the outcomes
based on a fabricated representation.
Self-Evaluations. Self-esteem and outcomes do not present reciprocal affect in the
academic environment alone, however. In a study of Self-Ambivalence and Reactions to
Success Versus Failure, Riketta & Ziegler (2006) presented research, which, “tests the
innovative hypothesis that self-evaluation reactivity traces back to self-ambivalence (i.e.,
the co-presence of positive and negative self-evaluations)” (p. 547). To do so, the
authors first measured self-ambivalence and baseline self-esteem. Then they introduced a
success or failure experience, while following-up with measurement of cognitive self-
evaluation and affective reaction. The study was predicated by how ambivalence was
defined. Ambivalence denotes the co-presence of negative and positive evaluations of
the same target, which is then delineated across two operationalizations of ‘structural
ambivalence’. This deals simply with evaluations of the target and ‘experienced
ambivalence’ dealing with both evaluations of the target and tension resulting from this
awareness (Riketta & Ziegler, 2006). In a randomized experiment of 87 German
students, the population completed an inventory relating to their experienced
ambivalence and then another on structural ambivalence. Then they were tasked with
completing items taken from Raven’s Advanced Progressive Matrices (APM). The
findings, as described by Riketta & Ziegler (2006), include “this research showed that
people with strongly (vs. weakly) ambivalent attitudes toward social groups or toward
consumer goods change their evaluations of these targets more strongly after receiving
25
positive or negative information about them” (p. 557). Self-esteem is not only supported
in its ability to affect how one perceives one’s environment, but by the tension provided
by the level of ambivalence, which then can multiply this affect to the extent of
moderating, not only how an individual finds their environment, but how their reaction(s)
to it influences their self-regard as well.
Riketta & Ziegler (2006) commented in a more recent article “People differ in the
extent to which their self-evaluations fluctuate in response to positive and negative
events” (p. 547). This is not to say that self-esteem and career success have yet to be
statistically correlated in any way. This is to say that self-esteem is not a constant and,
therefore, cannot be treated in a single span of time. Thus, in further studies where self-
esteem is evaluated or compared with other variables, a time series must be identified
where fluctuations or changes in self-esteem can be tracked in comparison with changes
to the opposing variable(s) identified.
From self-esteem as source to self-esteem involved. Crocker, Brook, Niiya, &
Villacorta and their study of the contingencies of self-worth and self-regulation
highlighted how contingent self-esteem can define us, and how our own views of
personal performance are predicated on strong attributions of perceived personal
strengths and their performance. Covin, Donovan, & Macintyre showed how others’ past
performance can, not only be seen as a potential indicator for personal, individual
performance, but can actually serve as a precursor to drive task ambiguity when a
disparity between others’ past performance and personal performance exists. Forsyth,
Lawrence, Burnette, & Baumeister proved that self-esteem can, not only be a central
driver for performance, but also can be a central driver of perceptions of performance as
26
well. In other words, bolstering the self-esteem of those exhibiting poor academic
outcomes only further reinforced the behavior and drove performance further downward,
causing distance between performer and those representing authority. Hair & Graziano
pushed the boundaries of how we define self-esteem further. They coupled the Big-Five
personality factors alongside a deeper granularity of the contextualization of levels of
personality when in contrast to environment, and they did so in order to study self-
esteem’s application to levels of adaptation and readiness over time. Shepard, Nicpon,
and Doobay measured the self-concept over an early academic career in higher education
in order to determine fit in early college entry. They found that self-esteem was
supported along with further perceptions of growth and development in the learner as a
single, initial semester progressed. Zhang, Zhao, & Yu took these applications of self-
esteem and personality and applied them in an environment where learners were
instructed to portray the performance of others when in an interview setting, while
assessing self-esteem both before and after the event. This study proved that simply
portraying the low-achiever as a low achiever led to lower levels of self-esteem.
Portraying a person as a high-achiever, when this was predominantly not the case in
reality, led to higher levels of reported self-esteem.
Riketta & Ziegler, taking the application of self-esteem, personality, and
performance attribution, measured levels of self-ambivalence when in the context of
highly contingent self-esteem. In so doing, they proved that those characteristics driving
self-worth could moderate highly the perception of environment, relative self-worth, and
fit. What is commonplace throughout these studies is the inclusion of only a small list of
instruments used in measuring perception, self-esteem, and ambivalence. These
27
instruments included the Rosenberg Self-Esteem Scale, Duncan’s New Multiple Range
Test, the Psychology Response Recording System (PRRS), the Piers-Harris Children’s
Self-Concept Scale, and Raven’s Advanced Progressive Matrices (APM). The
Rosenberg [10-item] Self Esteem Scale was the instrument used more repeatedly and
consistently when measuring self-esteem. As further supported by Zhang, Zhao, & Yu
(2009), “The Rosenberg Self-Esteem Scale has been widely used to measure individual’s
trait self-esteem” (p. 807).
It may be concluded that self-esteem is both a widely understood concept and a
widely studied concept as well. Measurements such as the Rosenberg Self-Esteem Scale
have been delivering consistently reliable results for over 40 years, and little has changed
the instrument. What continues to evolve, however, is how we apply measurements of
self-esteem to varying environmental attributions. One such application regards self-
esteem among the gifted and involving self-esteem measurements to further study the
feelings and perceptions of this population. Vialle, Heaven, & Ciarrochi (2007)
“examined the relationships among personality factors, social support, emotional
wellbeing, and academic achievement in 65 gifted secondary students, a sample drawn
from a longitudinal study of over 950 students” (p. 569). This study, while focusing on
the gifted, specifically focuses on the differences between relatively low-achieving and
relatively high-achieving learners in this gifted adolescent population. Collected
information included giftedness measures, personality measures, a self-esteem measure
(also using the Rosenberg Self-Esteem Scale), a social support measure, a teacher rating
measure, and academic grades. Containing both pretest and posttest components, the
study invited students to participate in a study on ‘Youth Issues’, where student
28
questionnaires were administered during the first half of the school year, and teachers
completed a behavioral checklist and provided grade data at the end of the academic year
(Vialle, Heaven, & Ciarrochi, 2007). The results, covering affective outcomes, social
support, teacher ratings, and academic outcomes, showed a great disparity between the
academic outcomes of gifted students and the expected levels of self-esteem and
emotional health within the grouping. Specifically, while social support was found to be
abundant among those supporting the gifted population, and academic outcomes of the
same population were equally strong, affective outcomes of this group were to the
contrary of those surrounding/supporting the gifted as these levels showed increased self-
reported isolation and dissatisfaction. Vialle, Heaven, & Ciarrochi (2007) described this
by saying “the findings of our research point to the need for educators to be sensitive to
the social and emotional states of gifted adolescents and recognize their vulnerabilities”
(p. 580).
Self-esteem and program performance. Involving self-esteem at the academic level
has been coupled by self-esteem involvements in programs affecting the workplace
environment as well. In a study of self-esteem during a three-year nursing program,
relationships were quantified in terms of both self-esteem throughout the program and its
effects on patient care. Randle (2002), who performed the study, reported, “although the
majority of students start their nurse training with normal self-esteem, they leave the
course with below average self-esteem” (p. 143). This was further defined in detail when
adding the context that ‘professional self-esteem’ remained steady, yet it was ‘global self-
esteem’ which suffered greatly. In a complimentary study, it was evidenced that this
becomes tantamount. Personality plays a major role in research on work behavior and
29
work-related outcomes, and personality traits have been shown to influence individual
and organizational outcomes such as job performance (Zhang & Arvey, 2009).
According to Baumeister and Vohs (2003), ‘‘contemporary self-regulation theories aim
to understand how, over periods of days, weeks, and years, people resist temptations,
persist with effort, and carefully weigh options to choose the optimal course of action to
reach their goals’’ (p. 197). While this is only intended to be a very summarized result of
the overarching literature review on the topic, what the data begin to show is whether
self-esteem can cause changes in academic achievement and vice versa. Although the
literature on this specific relationship alone spans roughly 45 years of research, the
underlying principle is that, while education does not necessarily affect self-esteem, self-
esteem can have an impact on academic achievement when assessed early on. If no
substantial change is seen in trajectory over time, regardless of academic achievement,
initial levels of self-esteem remain.
The theory of Self-Esteem and Extrinsic Career Success looks at these
relationships when assessing self-esteem as a predictor of occupational prestige, and
elicits a call to action in order to better understand the potential that self-regard has to
impact the career paths of the Generation X workforce. To understand this implication,
however, also requires a more detailed review of what is meant by the extrinsic career
success component of the theory of Self-Esteem and Extrinsic Career Success.
Extrinsic Career Success.
The theory of Self-Esteem and Extrinsic Career success purports that the
relationship from self-esteem to extrinsic career success is based on the theory of self-
consistency, which proposes that individuals seek to enact behavior that corresponds to
30
their self-esteem (Kammeyer-Mueller et al., 2007). Yet, in order to explore those
corresponding behaviors, more must be known about how the literature defines extrinsic
career success prior to establishing its intent as the empirical result of such reactions to
self-esteem. The challenge in greater detail is best defined by Heslin (2005) as “Several
avenues for improving the conceptualization and measurement of both objective and
subjective career success are identified... paramount among these is the need for greater
sensitivity to the criteria that study participants, in different contexts, use to construe and
judge their career success” (p. 113). In a study titled Career Success in a Boundaryless
Career World, Arthur, Khapova, & Wilderom (2005) “cover adequacy of research
designs, further dimensions of career success, broader peer group comparisons, deeper
investigation of the subjectively driven person, and seeing new connections between
boundaryless career theory and career success research” (p. 177). The challenge of this
meta-analysis was to synthesize an appropriate sequence in order to ‘bring about a
rapprochement’ between career theory and the research on career success. This study
was predicated on the division between types of career success (objective and subjective)
and on five attributes considered relevant to the research on career success. Where
objective career success was sustainably defined as the unfolding sequence of a person’s
work experiences, subjective career success may be defined as the individual’s internal
apprehension and evaluation of his career across any dimensions important to the
individual (Arthur et al., 2005). Possible dimensions suggested in the research-included
income, employment security, the location of work, and status to name a few. Arthur et
al. (2005) ultimately concluded “Career success research makes inconsistent use of
contemporary career theory, particularly regarding the interdependence of subjective and
31
objective career success and how this interdependence unfolds over time. Boundaryless
career attributes of inter-organizational career mobility and extra-organizational career
support have often been neglected” (p. 197).
The impact of disconnects among the characteristics of contemporary career
theory extend beyond objective and subjective career success alone. However,
applications at the physiological and psychological levels abound as well. One such
example as described by Ballout (2007) posits, “The psychological contract is generally
defined in terms of a set of individual beliefs, shaped by the organization, regarding terms
of an exchange agreement between individuals and their organizations” (p. 741). The
distinction of additional attributes becomes meaningful as it is discovered that career
success is, not only based on the worker perceptions of intrinsic and extrinsic success, but
also on the mental and even physical reactions to such success as well. Drawing upon
organizational psychology foundations, these reactions to the perception of career success
extend to a concept described as person-environment (PE) fit. PE fit draws on the
underlying assumption that the degree of fit or match between people and their
environment produces important outcomes or benefits for employees (Ballout, 2007).
Person-job fit or PJ fit entails the relationship between the attributes of the worker and
the attributes of the job. These measures of fit give rise to a deeper understanding of how
conclusions of self-regard play a role in defining how one might assess their fit to either
environment or job. Where these concepts come to a precipice, is in the concept of
person-organization (PO) fit. Described as the compatibility between people and
organizations, manifestations of this congruence include organizational attraction and
employee selection as well as employee commitment, satisfaction, and intention to quit
32
(Ballout, 2007). Thus, although one’s self-esteem can be seen as a primary driver within
the theory of Self-Esteem and Extrinsic Career Success, it is largely on how that career
success is defined and impacted as the relationship between this theory and career paths
via perceptions of career success manifest. Once factoring for the psychophysiological
profile of career success, as detailed in a study of the same name, adding a psychological
and physiological level of analysis provides greater insight into extrinsic career success
measures in the form of salary and job position (Kovacs, 2007).
Avenues of career success inquiry. The job market is undergoing large-scale changes
and individual occupational careers are changing as well. A common core in different
conceptualizations of contemporary forms of occupational careers is the assumption that
there is a high need for individuals to regulate their careers strategically (Abele & Wiese,
2008). Advances in studying the motivators of career success have elicited a newfound
understanding of a shift from passive to active career management. This shift has given
rise to avenues of career success inquiry including personality, competencies and
predictors, career path strategy making, and career success’ impact on talent
management.
The self and career success. How career success is both measured and managed has
been largely attributed to perceptions of the self. Quigley & Tymon (2006) developed a
paper, which “proposes a model that depicts how four components of intrinsic motivation
–meaningfulness, competence, choice, and progress – can contribute to career self-
management” (p. 522). In this study, a literature review was performed where six
propositions were first developed and then researched further. These propositions
included stances on the influence of global assessments and interpretive styles, individual
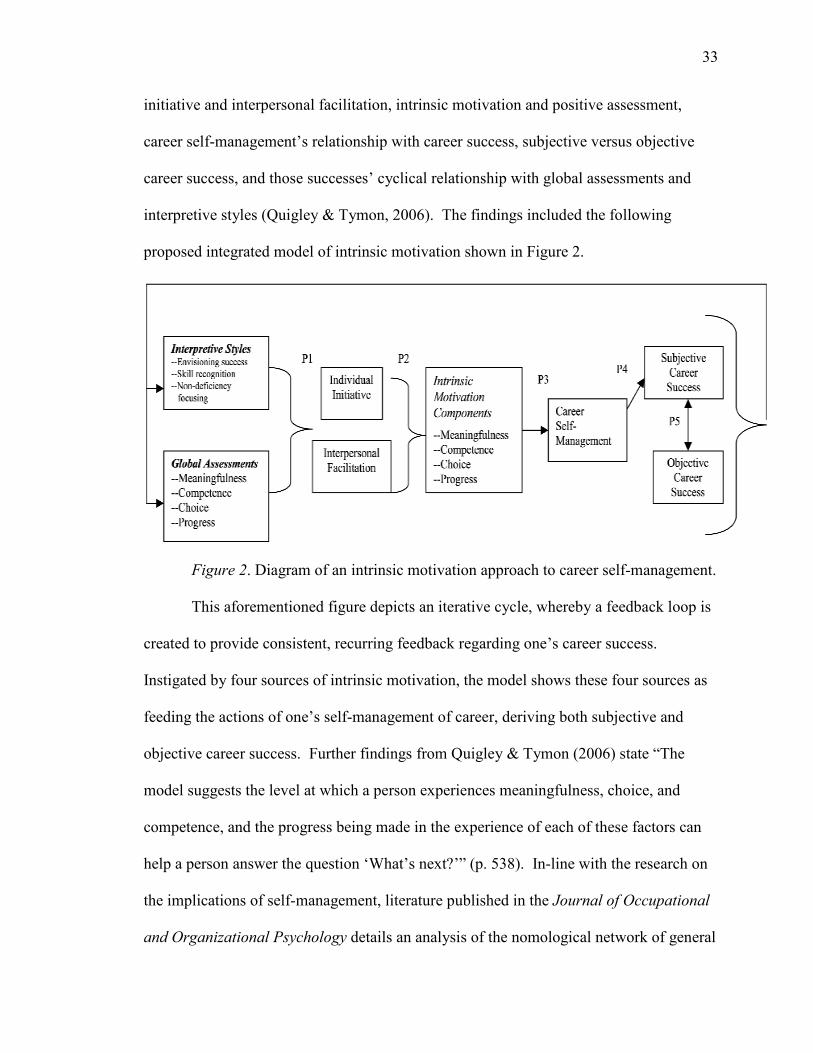
33
initiative and interpersonal facilitation, intrinsic motivation and positive assessment,
career self-management’s relationship with career success, subjective versus objective
career success, and those successes’ cyclical relationship with global assessments and
interpretive styles (Quigley & Tymon, 2006). The findings included the following
proposed integrated model of intrinsic motivation shown in Figure 2.
Figure 2. Diagram of an intrinsic motivation approach to career self-management.
This aforementioned figure depicts an iterative cycle, whereby a feedback loop is
created to provide consistent, recurring feedback regarding one’s career success.
Instigated by four sources of intrinsic motivation, the model shows these four sources as
feeding the actions of one’s self-management of career, deriving both subjective and
objective career success. Further findings from Quigley & Tymon (2006) state “The
model suggests the level at which a person experiences meaningfulness, choice, and
competence, and the progress being made in the experience of each of these factors can
help a person answer the question ‘What’s next?’” (p. 538). In-line with the research on
the implications of self-management, literature published in the Journal of Occupational
and Organizational Psychology details an analysis of the nomological network of general
34
self-management strategies, specific self-management strategies and central indicators of
career success, i.e. objective career success, self-referent subjective success, and other-
referent career success (Abele & Wiese, 2008). The study included 1,458 working
professionals who had previously graduated from a large German University. After
being sent a career development questionnaire, researchers received a response from
1,265 or 86.8% of those polled. For these 527 women and 738 men, variables measured
included selection, optimization, career planning, self-referent subjective career success,
other-referent subjective career success, objective career success, grade point average,
and study duration. Abele & Wiese (2008) concluded “different contexts of goal pursuit
need to be taken into account… knowing optimization strategies and being competent in
applying them to a specific context will lead to an optimal outcome both on an objective
and a subjective level” (p. 747). This domain-specific, dichotomous classifications of
objective and subjective career success persist through much of the current literature. In
a study titled Reconceptualizing Career Success, Gunz & Heslin (2005) conclude, “to the
extent that careers are socially constructed, people’s subjective interpretations of success
(in either of its meanings, that of a favorable outcome or simply that which flows from
events) can display patterns of shared understanding amongst people sharing social
contexts” (p. 109). Thus, although objective and subjective career success remain
separately regarded constructs when comparing the self to its regard of career success,
evidence has begun to amass showing that objective career success is not the only
structured form of the outcome. Subjective career success one day may be regarded as
equally structured and/or predictable and, therefore, more apt for thematic study across
larger groups of persons.
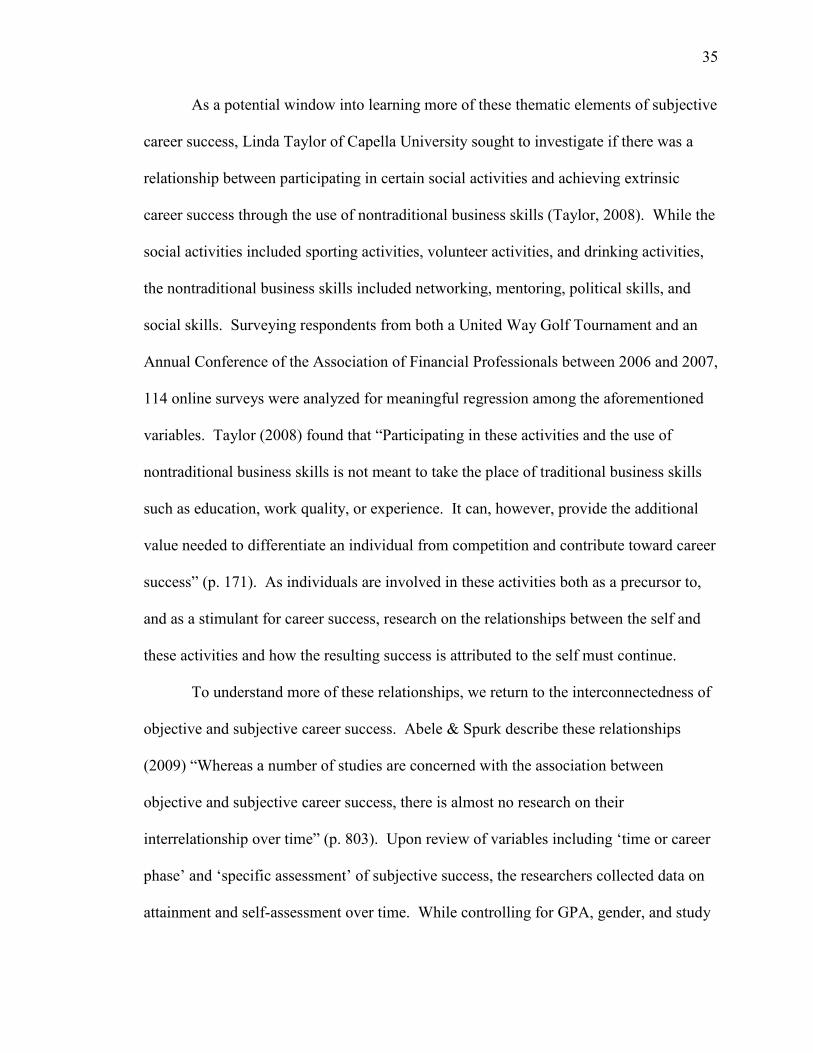
35
As a potential window into learning more of these thematic elements of subjective
career success, Linda Taylor of Capella University sought to investigate if there was a
relationship between participating in certain social activities and achieving extrinsic
career success through the use of nontraditional business skills (Taylor, 2008). While the
social activities included sporting activities, volunteer activities, and drinking activities,
the nontraditional business skills included networking, mentoring, political skills, and
social skills. Surveying respondents from both a United Way Golf Tournament and an
Annual Conference of the Association of Financial Professionals between 2006 and 2007,
114 online surveys were analyzed for meaningful regression among the aforementioned
variables. Taylor (2008) found that “Participating in these activities and the use of
nontraditional business skills is not meant to take the place of traditional business skills
such as education, work quality, or experience. It can, however, provide the additional
value needed to differentiate an individual from competition and contribute toward career
success” (p. 171). As individuals are involved in these activities both as a precursor to,
and as a stimulant for career success, research on the relationships between the self and
these activities and how the resulting success is attributed to the self must continue.
To understand more of these relationships, we return to the interconnectedness of
objective and subjective career success. Abele & Spurk describe these relationships
(2009) “Whereas a number of studies are concerned with the association between
objective and subjective career success, there is almost no research on their
interrelationship over time” (p. 803). Upon review of variables including ‘time or career
phase’ and ‘specific assessment’ of subjective success, the researchers collected data on
attainment and self-assessment over time. While controlling for GPA, gender, and study
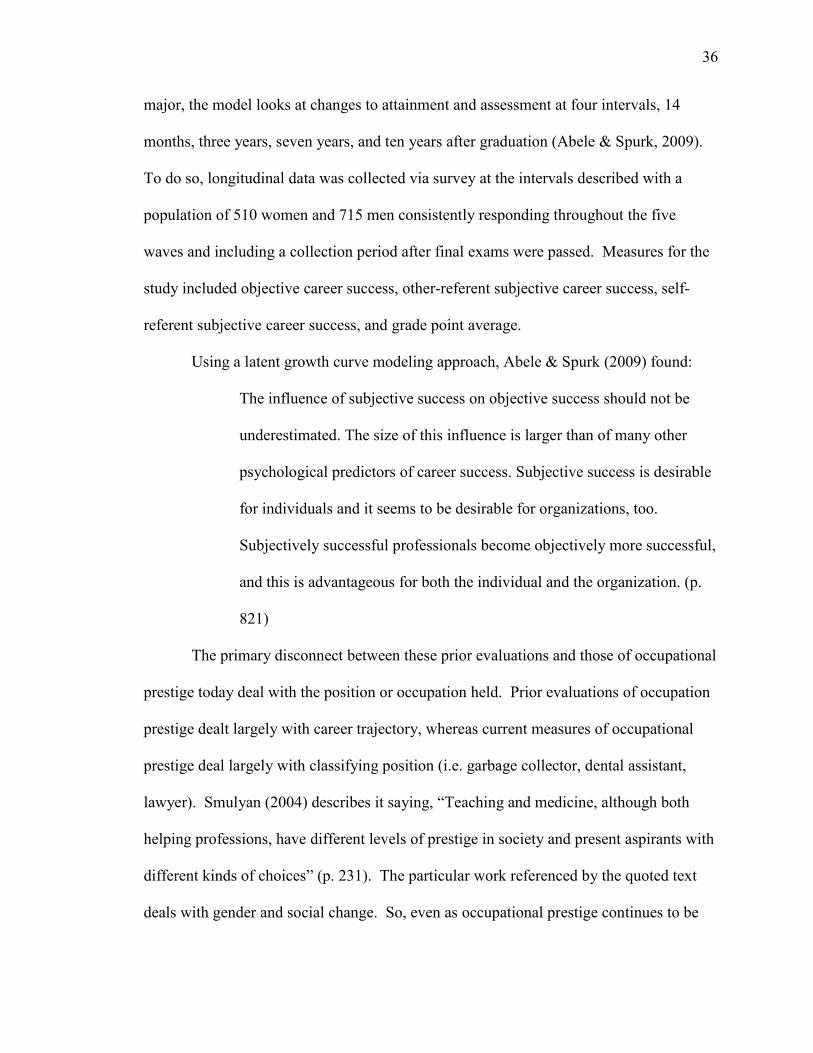
36
major, the model looks at changes to attainment and assessment at four intervals, 14
months, three years, seven years, and ten years after graduation (Abele & Spurk, 2009).
To do so, longitudinal data was collected via survey at the intervals described with a
population of 510 women and 715 men consistently responding throughout the five
waves and including a collection period after final exams were passed. Measures for the
study included objective career success, other-referent subjective career success, self-
referent subjective career success, and grade point average.
Using a latent growth curve modeling approach, Abele & Spurk (2009) found:
The influence of subjective success on objective success should not be
underestimated. The size of this influence is larger than of many other
psychological predictors of career success. Subjective success is desirable
for individuals and it seems to be desirable for organizations, too.
Subjectively successful professionals become objectively more successful,
and this is advantageous for both the individual and the organization. (p.
821)
The primary disconnect between these prior evaluations and those of occupational
prestige today deal with the position or occupation held. Prior evaluations of occupation
prestige dealt largely with career trajectory, whereas current measures of occupational
prestige deal largely with classifying position (i.e. garbage collector, dental assistant,
lawyer). Smulyan (2004) describes it saying, “Teaching and medicine, although both
helping professions, have different levels of prestige in society and present aspirants with
different kinds of choices” (p. 231). The particular work referenced by the quoted text
deals with gender and social change. So, even as occupational prestige continues to be
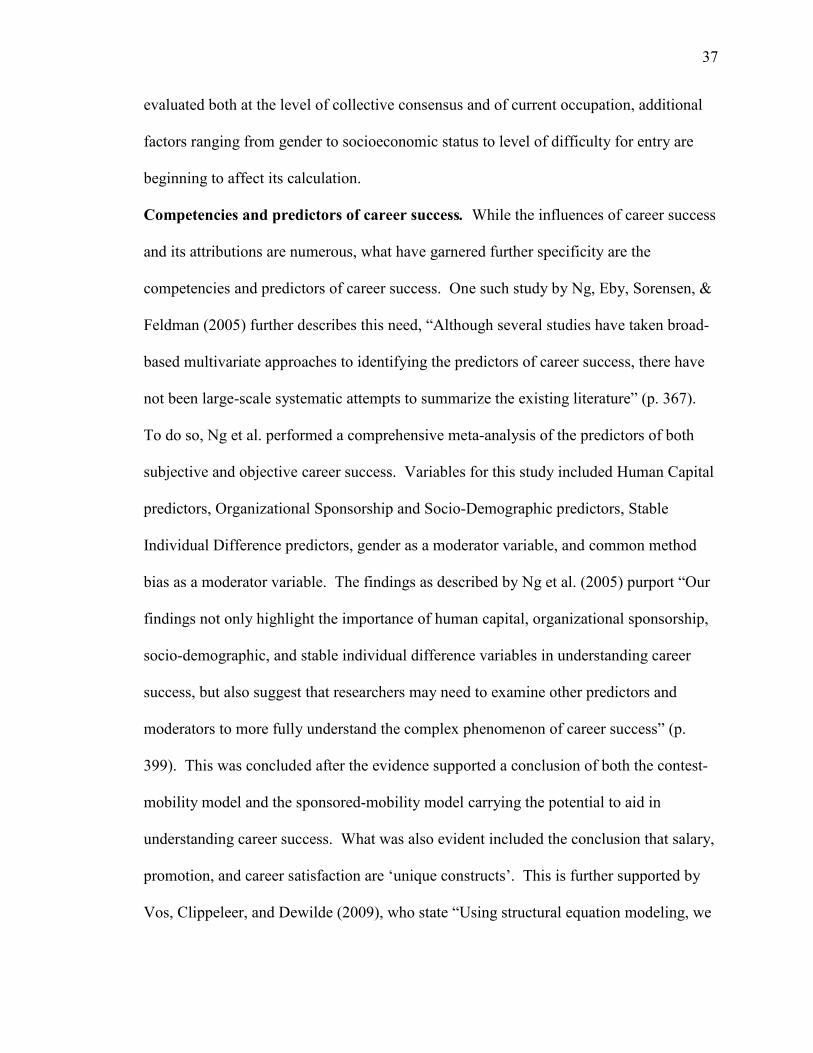
37
evaluated both at the level of collective consensus and of current occupation, additional
factors ranging from gender to socioeconomic status to level of difficulty for entry are
beginning to affect its calculation.
Competencies and predictors of career success. While the influences of career success
and its attributions are numerous, what have garnered further specificity are the
competencies and predictors of career success. One such study by Ng, Eby, Sorensen, &
Feldman (2005) further describes this need, “Although several studies have taken broad-
based multivariate approaches to identifying the predictors of career success, there have
not been large-scale systematic attempts to summarize the existing literature” (p. 367).
To do so, Ng et al. performed a comprehensive meta-analysis of the predictors of both
subjective and objective career success. Variables for this study included Human Capital
predictors, Organizational Sponsorship and Socio-Demographic predictors, Stable
Individual Difference predictors, gender as a moderator variable, and common method
bias as a moderator variable. The findings as described by Ng et al. (2005) purport “Our
findings not only highlight the importance of human capital, organizational sponsorship,
socio-demographic, and stable individual difference variables in understanding career
success, but also suggest that researchers may need to examine other predictors and
moderators to more fully understand the complex phenomenon of career success” (p.
399). This was concluded after the evidence supported a conclusion of both the contest-
mobility model and the sponsored-mobility model carrying the potential to aid in
understanding career success. What was also evident included the conclusion that salary,
promotion, and career satisfaction are ‘unique constructs’. This is further supported by
Vos, Clippeleer, and Dewilde (2009), who state “Using structural equation modeling, we
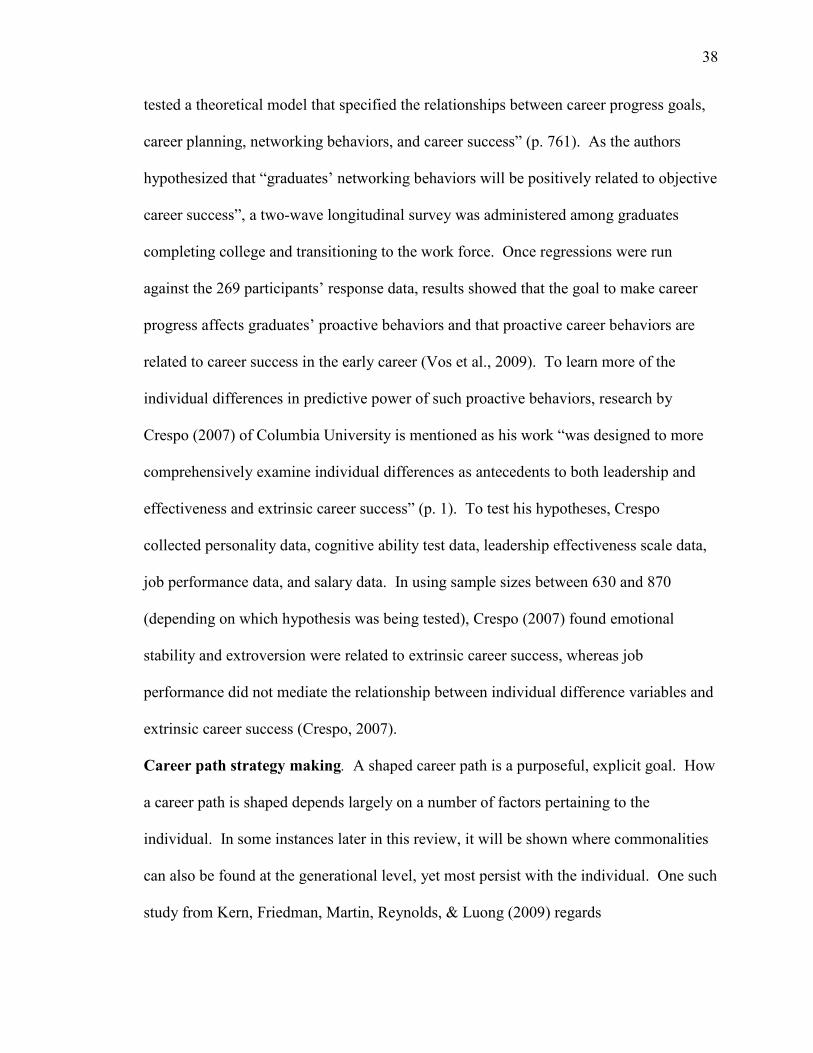
38
tested a theoretical model that specified the relationships between career progress goals,
career planning, networking behaviors, and career success” (p. 761). As the authors
hypothesized that “graduates’ networking behaviors will be positively related to objective
career success”, a two-wave longitudinal survey was administered among graduates
completing college and transitioning to the work force. Once regressions were run
against the 269 participants’ response data, results showed that the goal to make career
progress affects graduates’ proactive behaviors and that proactive career behaviors are
related to career success in the early career (Vos et al., 2009). To learn more of the
individual differences in predictive power of such proactive behaviors, research by
Crespo (2007) of Columbia University is mentioned as his work “was designed to more
comprehensively examine individual differences as antecedents to both leadership and
effectiveness and extrinsic career success” (p. 1). To test his hypotheses, Crespo
collected personality data, cognitive ability test data, leadership effectiveness scale data,
job performance data, and salary data. In using sample sizes between 630 and 870
(depending on which hypothesis was being tested), Crespo (2007) found emotional
stability and extroversion were related to extrinsic career success, whereas job
performance did not mediate the relationship between individual difference variables and
extrinsic career success (Crespo, 2007).
Career path strategy making. A shaped career path is a purposeful, explicit goal. How
a career path is shaped depends largely on a number of factors pertaining to the
individual. In some instances later in this review, it will be shown where commonalities
can also be found at the generational level, yet most persist with the individual. One such
study from Kern, Friedman, Martin, Reynolds, & Luong (2009) regards
39
conscientiousness, career success, and longevity. As described by the authors,
personality traits such as conscientiousness and achievement motivation may represent
behavioral correlates of the mental processes that partially underlie both career success
and longevity (Kern et al., 2009). For this research, extrinsic (objective) and intrinsic
(subjective) career successes were each considered variables alongside intelligence,
childhood personality, physical health and adjustment, and mortality. In analyzing 693
participants with 66 years of longitudinal data (1940-2006), the authors ran regressions
across the aforementioned variables. Kern et al. (2009) found “Our findings indicate that
career success is indeed relevant to longer life across six decades, but this appears
moderated by childhood variables likely relevant to executive functioning” (p. 160).
As executive functioning has been defined in this study to include careful
planning, impulse control, organization, and reasoning, the implication becomes that
those who exhibit higher levels of executive functioning are more likely to achieve career
success. An ambitious study from Lila Lenoria Carden of Texas A&M University (2007)
titled Pathways to Success for Moderately Defined Careers: A Study of Relationships
Among Prestige/Autonomy, Job Satisfaction, Career Commitment, Career Path, Training
and Learning, and Performance as Perceived by Project Managers studied how new
career paths can be found to be non-linear and can result in undefined professional
advancement opportunities for managers and employees in a variety of contexts (Carden,
2007). To further explore, her research included a 27-item survey instrument and six
variables, including the dependent variable of performance, alongside five independent
variables to include autonomy/prestige, career path, learning and training, job
satisfaction, and career commitment. For those aspects most relevant to career path
40
strategy making, an emphasis is placed on the results for that variable, which are included
in this review. The key finding in this instance becomes Carden’s (2007) conclusion
“Moderately defined career professionals that jointly work with organizations to plan,
design, and communicate career paths will be more likely to take ownership of the
process, effectively work to execute the career plans, retain employment in the
organization, and increase performance” (p. 160).
In addition to conscientiousness, executive functioning, and joint planning &
organization accountability for career success, other sources of strategy making can
include exploitation of understood personality traits, and an emphasis in work-family
conflict. To begin with personality, Sutin, Costa, Miech & Eaton (2009) state “The
present research addresses the dynamic transaction between extrinsic (occupational
prestige, income) and intrinsic (job satisfaction) career success and the Five-Factor
Model (FFM) of personality” (p. 71). This research includes an emphasis in
psychology’s contribution to understanding career paths wherein FFM contributes an
understanding of the self as an antecedent to understanding more of what shapes a
person’s career path. To understand what the self through the lens of FFM means
requires an explanation of the components of the model. The FFM is an empirically
derived model of personality that characterizes the individual’s emotional, interpersonal,
experiential, attitudinal and motivational style along five broad dimensions: Neuroticism,
Extraversion, Openness, Agreeableness, and Conscientiousness (Sutin et al., 2009). A
total of 731 participants were selected among the Baltimore Epidemiologic Catchment
Area (ECA) study and measured across variables including personality, occupational
prestige, personal income, and job satisfaction. Upon consideration for FFM, and in
41
taking these data into account for the 731 measures respondents, the authors concluded
“Measured concurrently, controlling for sex, ethnicity, age and education, domain-level
personality was associated with income and job satisfaction, but not prestige:
Emotionally stable and conscientious participants reported earning higher incomes and
reported more satisfaction with their jobs” (p. 80). Thus, consistent with the findings
above, conscientiousness continues to contribute largely to career path strategy making’s
success, with emotional stability being added as another key factor to the success of long-
standing plans for career success. Finally, when including elements of work-family
conflict, more can be understood of its relation to organizational effectiveness and
domain-specific determinants. To garner this understanding, Ballout (2006) worked to
“develop and present a tentative framework for understanding the relationships among
antecedents of interrole conflict” (p. 437). The framework reviews ‘individual-specific’
variables such as gender, parental demand, and working spouses, while reviewing such
‘work-specific’ variables as job involvement, job stressors, and job social support. From
these reviews of the germane variables, two resulting conflicts were identified between
FIW (referring to those responsibilities to family which interfere with work roles), and
WIF (referring to those responsibilities to work which interfere with family roles).
Ballout found that organizations need to consider a new ‘infrastructure’ in their career
development models, accounting for balancing work-family relationship and retaining a
more committed workforce; this more holistic approach integrates employees’ career
roles and home lives giving organizations more latitude and credibility and enhancing
productivity (Ballout, 2006).
42
Career success and talent management. Over the past generation, talent management
practices, especially in the United States, have been fairly dysfunctional, leading
corporations to lurch from a surplus of talent to shortfalls to surpluses and back again
(Cappelli, 2008). The introductory statement to the HBR article Talent Management for
the Twenty-First Century describes the plight felt by today’s corporations, in an era
where both the supply and demand of talent rest in environments as unstable as the
economy itself. At the precipice of this issue are the considerations for career paths
described thus far. With the greater majority of the aforementioned variables being as
descriptive of personal characteristics as much as organizational, solutions for the merger
of such concepts as career success and talent management become less frequently
available. One solution as proposed by Cappelli (2008) includes “The issues and
challenges in managing an internal talent pipeline—how employees advance through
development jobs and experiences—are remarkably similar to how products move
through a supply chain: reducing bottlenecks that block advancement, speeding up
processing time, improving forecasts to avoid mismatches” (p. 2). Hall (1976)
introduced the concept of the ‘protean career’, characterized by individuals taking the
lead in career management, driven by the change of personal rather than organizational
needs. He even argued that the ‘career’ no longer exists within organizations (Kim,
2005). The meeting place of these ideas may rest in the concept of organizational
interventions. Kim (2005) in Organizational Interventions Influencing Employee Career
Development Preferred by Different Career Success Orientations describes a “study
[which] explores Korean employees’ perspectives on organizational interventions that
influence their career development, according to personal definitions of career success (p.
43
48). A sample of 1,000 respondents of a wireless communication company responded to
a survey, which identified career success orientations and preferred organizational
interventions. Kim (2005) describes the findings as “From a practical perspective, at the
organizational level, the findings of this study imply that organizations may want to
design their career mobility systems or performance incentive systems in accordance with
employees’ career orientations” (p. 59).
Where the existing literature becomes scant, is when the task becomes elucidating
what is meant by creating organizational-individual alignment for like-minded career
planning in order to optimize career success in talent management. Research, which has
shed some light on this topic, includes Martin & Schmidt (2010) in How to Keep Your
Top Talent, wherein they list the 10 critical components of a talent development program
(p. 6). These components include (a) explicitly test candidates in three dimensions
(ability, engagement, and aspiration); (b) emphasize future competencies; (c) manage the
quantity and quality of high potentials; (d) forget rote functional or business-unit
rotations; (e) identify the riskiest, most challenging positions; (f) create individual
development plans; (g) reevaluate top talent annually; (h) offer significantly
differentiated compensation; (i) hold regular, open dialogues; (j) replace broadcast
communications about the company’s strategy with individualized messages for
emerging leaders (Martin & Schmidt, 2010).
“We conducted a survey of human resources executives from 40 companies
around the world in 2005, and virtually all of them indicated that they had an insufficient
pipeline of high-potential employees to fill strategic management roles” lament Ready &
Conger (2007) of Make Your Company a Talent Factory. In an industrial environment
44
where organizations are forced to forgo contracts, which contribute to either substantial
gain in revenue and/or market share, few organizations have in-place what the authors
call “talent factories”. In these scenarios, they marry functionality, rigorous talent
processes that support strategic and cultural objectives with vitality, emotional
commitment by management that is reflected in daily actions (Ready & Conger, 2007).
While the study speaks to the development and retention of key personnel in adopting
this approach, the further benefit to an organization employing a Generation X workforce
is a further alignment with some of the preferences of the population including
achievement, realism, and conscientiousness emphasized in evidence-based decision
making.
Adding to the Career Paths Knowledge Base.
There is, of course, an existing literature on self-esteem and careers.
Unfortunately, this research does not address the proposition from identity theory that
self-esteem and career success can influence one another (Kammeyer et al., 2007). As
the relationship between self-regard and career paths is not yet fully elucidated, this
research is poised to answer that question for the Gen-X population, thereby delivering an
assessment of how one affects the other. As was described by Hill & Hemp (2008),
“First, they (invisible people) are the well-known “demographic invisibles.” These are
people who, because of their gender, ethnicity, nationality, or even age don’t have access
to the tools—the social networks, the fast-track training courses, the stretch
assignments—that can prepare them for positions of authority and influence” (p. 3). Yet,
to maximize the impact these tools can and should have on our next generation of
45
leadership, we must continue to gain more understanding of how self-regard may act as a
predictor of career path(s) over time.
Incorporating Generational and Intergenerational Research
Earlier this year, a text titled The 2020 Workplace: How Innovative Companies
Attract, Develop, and Keep Tomorrow’s Employees Today became widely available. The
central premise of the text regards the changes to the working environment and culture of
the forward-looking organization. Founded in two global surveys of 2,500 employees,
and more than 50 case studies on companies including Deloitte, IBM, and Cisco, the text
provides evidence of the shifts in process, value, and product affecting these
organizations now and in the immediate future (Meister & Willyerd, 2010).
Appropriateness of Studying Generation(s).
Meister & Willyerd (2010) contend that “The organizations that create a
competitive advantage in the 2020 workplace will do so by instituting innovative human
resource practices – by first defining an authentic core set of organizational values and
then augmenting these by leveraging the latest tools of the social Web to reimagine
learning and development, talent management, and leadership practices” (p. 4). This
done, as the authors describe the working environment we currently experience, which
consists of four generations in the workplace simultaneously, and sharing differing sets of
values and beliefs.
The research of Meister & Willyerd (2010) discovered:
What happens in the workplace when these credentials-driven Millenials
(born 1977 to 1997 to include Gen-X) are forced to work side by side with
older coworkers, who may at times view them as out of touch with reality?
46
To successfully answer this question and the others raised by having an
age-diverse workforce coexisting in the workplace, it’s important to
develop an understanding of each generation as well as the challenges the
different generations bring to the workplace in terms of communication
styles, career aspirations, and knowledge transfer. Understanding each
generation is critical because employers who adapt the fastest to a
multigenerational workforce will be able to attract the highest-quality
employees when the war for talent is in full swing. (p. 43)
Generational studies remain critical to the study of organizations as those
organizations continue to employ generations whose norms, values, and beliefs shift over
time. The literature abounds with studies of succession planning, career paths, and
extrinsic career success in the Baby Boomer generation. Research is already beginning to
amass concerning Generation Y and those born to the new millennium. Yet, there are
still ample opportunities to contribute to the literature, the study of self-regard and career
paths among Generation X, as both a generation underserved in the literature, and those
destined by time to be our next corporate leaders. This is a generation that seeks self-
reliance, independence, and balance in their lives… often referred to as “latchkey kids” in
youth due to their early self-sufficiency. They are known for thinking like entrepreneurs,
and thriving as independent thinkers (Meister & Willyerd, 2010). To study their habits in
a longitudinal look at the relationship between self-esteem and extrinsic career success is
to better understand and prepare for tomorrow’s corporate leadership.
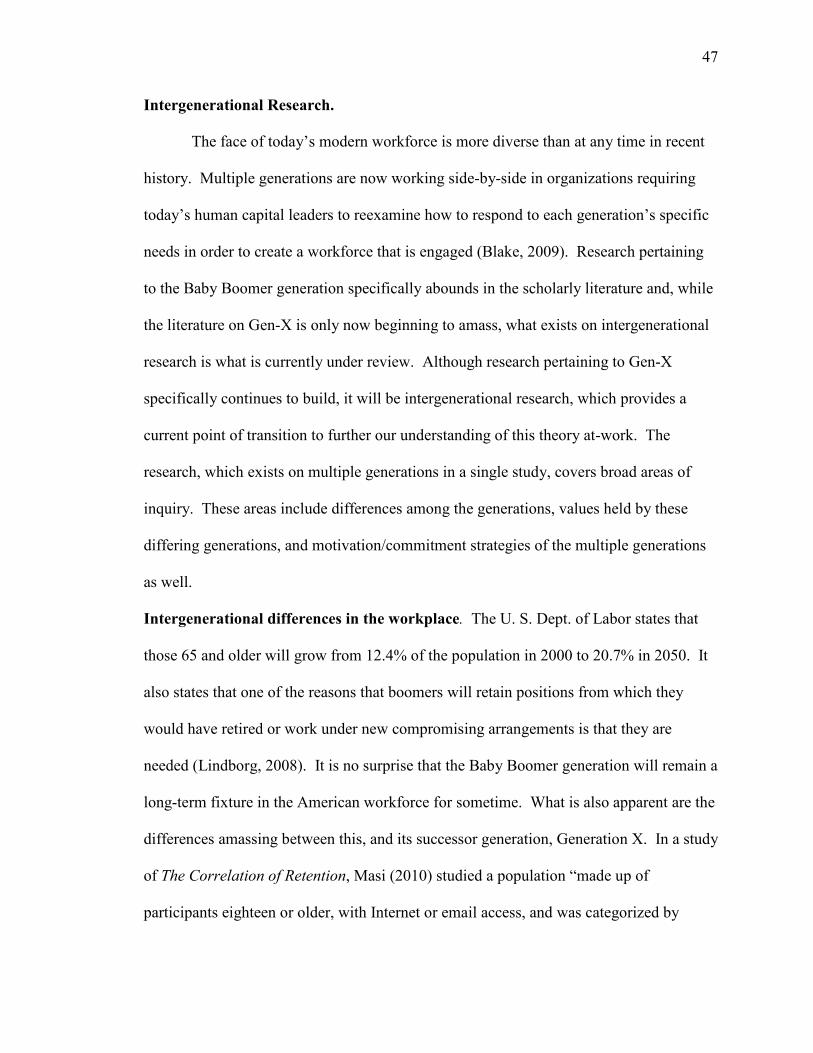
47
Intergenerational Research.
The face of today’s modern workforce is more diverse than at any time in recent
history. Multiple generations are now working side-by-side in organizations requiring
today’s human capital leaders to reexamine how to respond to each generation’s specific
needs in order to create a workforce that is engaged (Blake, 2009). Research pertaining
to the Baby Boomer generation specifically abounds in the scholarly literature and, while
the literature on Gen-X is only now beginning to amass, what exists on intergenerational
research is what is currently under review. Although research pertaining to Gen-X
specifically continues to build, it will be intergenerational research, which provides a
current point of transition to further our understanding of this theory at-work. The
research, which exists on multiple generations in a single study, covers broad areas of
inquiry. These areas include differences among the generations, values held by these
differing generations, and motivation/commitment strategies of the multiple generations
as well.
Intergenerational differences in the workplace. The U. S. Dept. of Labor states that
those 65 and older will grow from 12.4% of the population in 2000 to 20.7% in 2050. It
also states that one of the reasons that boomers will retain positions from which they
would have retired or work under new compromising arrangements is that they are
needed (Lindborg, 2008). It is no surprise that the Baby Boomer generation will remain a
long-term fixture in the American workforce for sometime. What is also apparent are the
differences amassing between this, and its successor generation, Generation X. In a study
of The Correlation of Retention, Masi (2010) studied a population “made up of
participants eighteen or older, with Internet or email access, and was categorized by
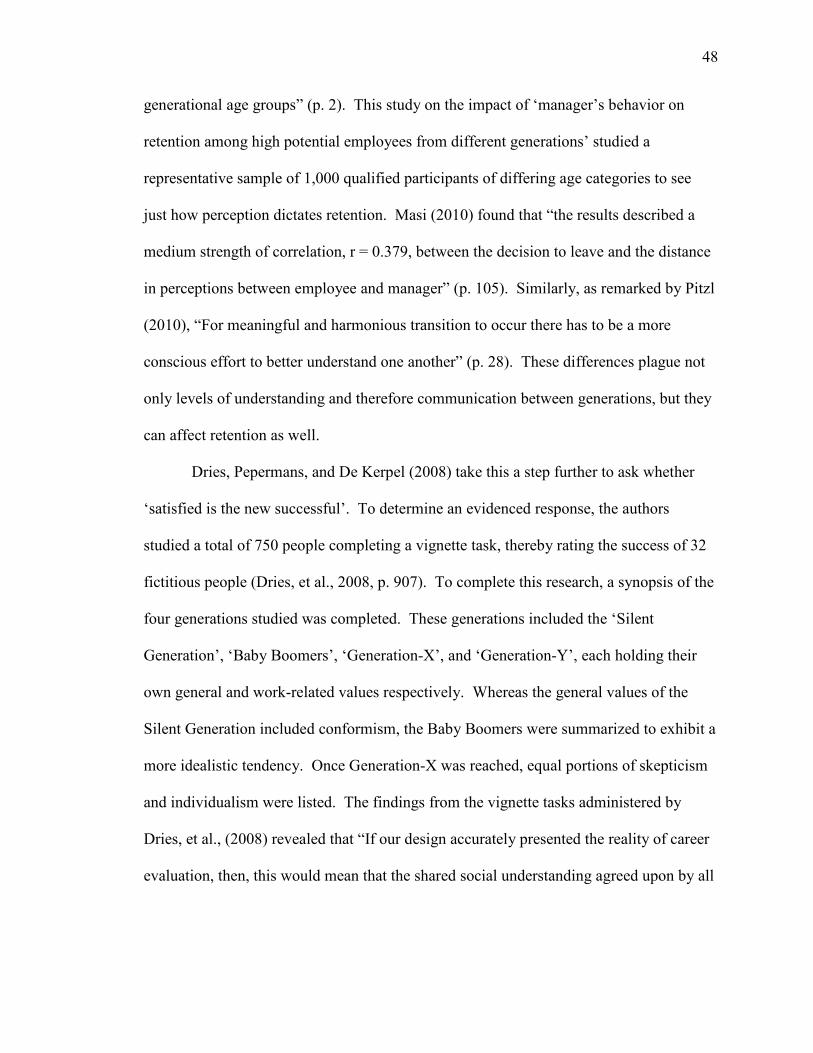
48
generational age groups” (p. 2). This study on the impact of ‘manager’s behavior on
retention among high potential employees from different generations’ studied a
representative sample of 1,000 qualified participants of differing age categories to see
just how perception dictates retention. Masi (2010) found that “the results described a
medium strength of correlation, r = 0.379, between the decision to leave and the distance
in perceptions between employee and manager” (p. 105). Similarly, as remarked by Pitzl
(2010), “For meaningful and harmonious transition to occur there has to be a more
conscious effort to better understand one another” (p. 28). These differences plague not
only levels of understanding and therefore communication between generations, but they
can affect retention as well.
Dries, Pepermans, and De Kerpel (2008) take this a step further to ask whether
‘satisfied is the new successful’. To determine an evidenced response, the authors
studied a total of 750 people completing a vignette task, thereby rating the success of 32
fictitious people (Dries, et al., 2008, p. 907). To complete this research, a synopsis of the
four generations studied was completed. These generations included the ‘Silent
Generation’, ‘Baby Boomers’, ‘Generation-X’, and ‘Generation-Y’, each holding their
own general and work-related values respectively. Whereas the general values of the
Silent Generation included conformism, the Baby Boomers were summarized to exhibit a
more idealistic tendency. Once Generation-X was reached, equal portions of skepticism
and individualism were listed. The findings from the vignette tasks administered by
Dries, et al., (2008) revealed that “If our design accurately presented the reality of career
evaluation, then, this would mean that the shared social understanding agreed upon by all
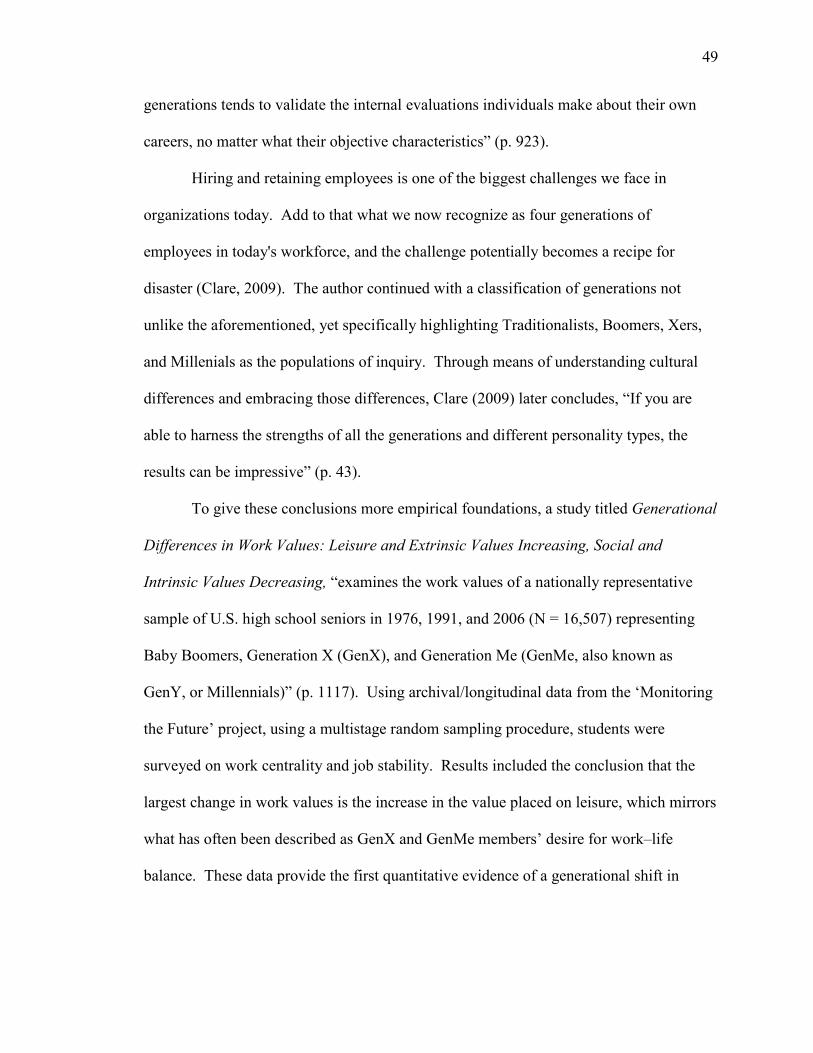
49
generations tends to validate the internal evaluations individuals make about their own
careers, no matter what their objective characteristics” (p. 923).
Hiring and retaining employees is one of the biggest challenges we face in
organizations today. Add to that what we now recognize as four generations of
employees in today's workforce, and the challenge potentially becomes a recipe for
disaster (Clare, 2009). The author continued with a classification of generations not
unlike the aforementioned, yet specifically highlighting Traditionalists, Boomers, Xers,
and Millenials as the populations of inquiry. Through means of understanding cultural
differences and embracing those differences, Clare (2009) later concludes, “If you are
able to harness the strengths of all the generations and different personality types, the
results can be impressive” (p. 43).
To give these conclusions more empirical foundations, a study titled Generational
Differences in Work Values: Leisure and Extrinsic Values Increasing, Social and
Intrinsic Values Decreasing, “examines the work values of a nationally representative
sample of U.S. high school seniors in 1976, 1991, and 2006 (N = 16,507) representing
Baby Boomers, Generation X (GenX), and Generation Me (GenMe, also known as
GenY, or Millennials)” (p. 1117). Using archival/longitudinal data from the ‘Monitoring
the Future’ project, using a multistage random sampling procedure, students were
surveyed on work centrality and job stability. Results included the conclusion that the
largest change in work values is the increase in the value placed on leisure, which mirrors
what has often been described as GenX and GenMe members’ desire for work–life
balance. These data provide the first quantitative evidence of a generational shift in
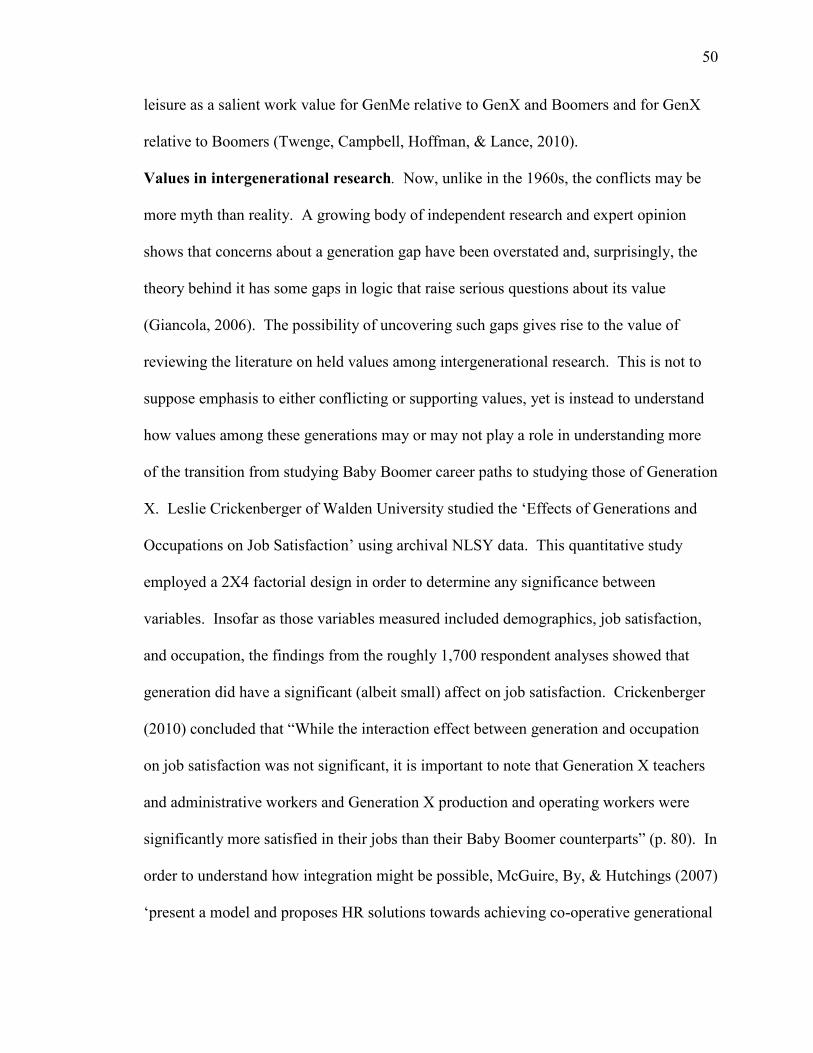
50
leisure as a salient work value for GenMe relative to GenX and Boomers and for GenX
relative to Boomers (Twenge, Campbell, Hoffman, & Lance, 2010).
Values in intergenerational research. Now, unlike in the 1960s, the conflicts may be
more myth than reality. A growing body of independent research and expert opinion
shows that concerns about a generation gap have been overstated and, surprisingly, the
theory behind it has some gaps in logic that raise serious questions about its value
(Giancola, 2006). The possibility of uncovering such gaps gives rise to the value of
reviewing the literature on held values among intergenerational research. This is not to
suppose emphasis to either conflicting or supporting values, yet is instead to understand
how values among these generations may or may not play a role in understanding more
of the transition from studying Baby Boomer career paths to studying those of Generation
X. Leslie Crickenberger of Walden University studied the ‘Effects of Generations and
Occupations on Job Satisfaction’ using archival NLSY data. This quantitative study
employed a 2X4 factorial design in order to determine any significance between
variables. Insofar as those variables measured included demographics, job satisfaction,
and occupation, the findings from the roughly 1,700 respondent analyses showed that
generation did have a significant (albeit small) affect on job satisfaction. Crickenberger
(2010) concluded that “While the interaction effect between generation and occupation
on job satisfaction was not significant, it is important to note that Generation X teachers
and administrative workers and Generation X production and operating workers were
significantly more satisfied in their jobs than their Baby Boomer counterparts” (p. 80). In
order to understand how integration might be possible, McGuire, By, & Hutchings (2007)
‘present a model and proposes HR solutions towards achieving co-operative generational
51
interaction’. The study adapted Park's Theory of Race Relations in order to explain the
distinctiveness of generational work groups and the challenges and opportunities that
these groups present when interacting in organizations. Rashford and Coghlan's cycle of
organizational change, based on the Kübler-Ross grief cycle, was then mapped onto
Park's race relations cycle in order to link generational interaction to emotional reactions
to change over time (McGuire et al., 2007). The findings from this research fell in line
with a conclusion by Glass (2007), who said “The existence of a multigenerational work
force affects two areas of human resources policy and employee development efforts:
retention and motivation” (p. 1). Bolton (2010) also of Walden University, published
research titled Career Motivation Theory: Generational Differences and Their Impact on
Organizations. This dissertation went beyond the confines of simply stating that
something must be done to bridge the differences in value among generations, and went
beyond suggesting a model be forged to do so as well.
Bolton (2010) declared, “The purpose of this study was to fill the gap between
organizational talent management strategies and employee work needs” (p. 1). With a
focus on job security and satisfaction as delineated by Maslow’s Hierarchy of Needs, the
author performed a quantitative/descriptive study of just over 2,000 participants’ data on
the subject. As is commonplace for studies in this realm, the existence of four
simultaneous generations at work was again mentioned. Human resource professionals
and business managers have been bombarded with warnings by popular magazines and
newspapers that more demographic changes are soon to come (Bolton, 2010). While
Maslow’s hierarchy was the theoretical framework chosen, the research questions were
(a) Are there differences in cohort membership, operationally defined as belonging to a
52
predetermined age category, on reported career motivation and career decisions?; (b) Is
there a link between career motivation, career decisions and generational cohort
membership based on participant scores on the PSTS?. The PSTS, representative of the
Pew Social Trends Survey, were used to gather data on career motivations and career
decisions. Bolton’s (2010) findings “suggested that Generation Y reported better career
decisions than that of all other generational cohorts, which is inconsistent with other
findings stating that they improve with age and experience” (p. 62). So, while the
approaches to work may vary across generations, continued values around career
decisions only grow strengthened across generational lines.
Since the 1960s, when the term ‘generation gap’ was first coined to describe the
differences between the WWII population (the Silent Generation) and its offspring (Baby
Boomers), generations have been learning how to co-exist (Simons, 2010, p. 29). To this
end, Riescher (2009) of Capella University studied Management Across Time: A Study of
Generational Workforce Groups (Baby Boomer and Generation X) and Leadership. To
learn more of the preferred leadership style, work values, and work attitudes to name a
few of the value of these generations, the author surveyed 942 participants across nine
companies. Drawing on ‘crossover effect’ as well as many suitable theories on studying
generations, Riescher (2009) found “The highest ranked characteristics were honest and
receptive to people and ideas among all age groups.” (p. 82). While career decisions
have ‘improved’ over time, abilities to satisfy Maslow’s lower order levels also continue,
values around trust and being receptive to others persist consistently across generations.
Thus, although Boomers tended to think of themselves as a special generation, different
from those individuals that had come before them, Generation X is typically team-
53
oriented, banding together to socialize rather than pairing off (Simons, 2010). The
assumptions made regarding four generations employed in the same organization, sharing
work processes and competing for resources sounds problematic to be sure. Yet
consistencies in values and a penchant for Gen-X to employ a collective style of working
conducive to embracing wisdom should prove beneficial in environments seeking to
channel intergenerational commitment.
Channeling intergenerational commitment. Given the impact of organizational
commitment on critical factors such as turnover, absenteeism, and job satisfaction, it is
important for employers to understand the link between generation and organizational
commitment (Love, 2005). In support of this supposition, Love (2005) “examines
whether there is an actual difference between Generation-X and the Baby Boom
Generation on levels of organizational commitment” (p. 2). While the author cites
organizational commitment to be a common topic of study, she equally concedes to the
importance of its research for researchers and organizations alike. Gender, life cycle
stage, industry sector, job type, tenure and organization of employment have been
presented as covariates in this relationship among 40 private sector organizations, 22
public sector organizations, and 38 not-for-profit organizations surveyed for a total of
over 31,000 of 120,000 surveys returned completed (Love, 2005, p. 128).
Upon examination of the data, Love (2005) found “A number of different
analyses were done to answer this question including ANOVA, ANVOCA, and
regression. In none of these cases did we observe a significant association between
generation and organizational commitment” (p. 183). This runs in stark contrast to
Buetell & Wittig-Berman (2008), who report “Managers and human resource
54
professionals need to consider generational differences in work-family program design
and monitor patterns of program usage for each group. Generation X members are
particularly concerned about work/life balance” (p. 1). This latter conclusion further
supported by Klun (2008) who used three case studies on Accenture to show “Members
of Generations X and Y are even more insistent than baby boomers are about balancing
their professional and personal lives—a potential retention issue exacerbated by the
shrinking pool of skilled talent” (p. 1).
Ryan (2009) published Predicting the Relationship Between Employee Perception
of Environmental and Outcome Factors and Job Satisfaction for Baby Boomer and
Generation X Employees in a Healthcare Organization, which looked to perform “a
factor analysis of the raw data from an employee survey at a large nonprofit healthcare
organization to determine whether selected variables that measure employee perception
of work environment and outcome factors in the organization are influenced by
generational cohort” (p. 2). Speaking to the intersection of employing four generations
simultaneously in business yet again, this study includes variables regarding the survey
instrument developed by Chicago-based HR consulting firm, HR Solutions.
Ryan (2009) mentions that the model HR Solutions uses divided the survey data
into the following specific dimensions:
1. Overall job satisfaction/pay satisfaction
2. Benefit satisfaction
3. Supervisory consideration
4. Communication
5. Human resources/personnel/policies
55
6. Concern for employees
7. Training and development
8. Strategy and mission
9. Corporate compliance
10. Performance and cooperation
11. New employees
12. Physical working conditions
13. Concern for patient care
14. Technology utilization
15. Supplemental items
Upon review of the data, viewed through the lens of each of the thematic elements
above, Ryan (2009) found “that employee perception of satisfaction with job
opportunities does not vary by generational cohort but rather by the overall work
environment” (p. 62). As further evidence to the consistencies present throughout the
generations, research exploiting the theory of Self-Esteem and Extrinsic Career Success
among the Generation X workforce becomes that much more feasible as consistent
results regarding paths may be expected when controlling for self-esteem.
The question then becomes how to channel organizational commitment, if the
assumption can now be made that organizational commitment is a consistent quality
throughout generations studied. Chan (2005) sought to understand more of this linkage
by studying the Relationship Between Generation-Responsive Leadership Behaviors and
Job Satisfaction of Generations X and Y Professionals. For this research, Chan has
drawn on a wealth of theories to further explain this phenomenon. The theories range
56
from Trait Theories to Contingency Theories to Transactional v. Transformational
Leadership and Motivation v. Job Satisfaction Theories. Employing the Multifactor
Leadership Questionnaire 5X (MLQ 5X) and the Job Descriptive Index (JDI)/Job In
General (JIG), 60 Gen-X and 60 Gen-Y professionals participated in the survey process.
While both relationships to job satisfaction and correlations between leadership behaviors
defined the research questions, Chan’s (2005) findings conclude that “Based on the
comparison of the mean scores, it can be inferred that (a) both generational cohorts had
the lowest job satisfaction level regarding their work on present job; (b) their satisfaction
with supervision was slightly higher than how they felt about their work; and (c) overall,
they placed a higher level of satisfaction with job in general” (p. 151).
As reported by Shaul (2007), “this quantitative research study [was purposed
with] the exploration of attitude within and across each generation toward money, which
is one of the least studied and oldest incentives” (p. 6). As the implication was the
retaining of talent, it is thought that the similarities in like-minded values between
generations may begin to separate when money is the reward at stake. In order to learn
more, Shaul surveyed 80 employed participants using the Money Attitude Scale or MAS.
The results indicated significant differences across generations, where Boomers do not
value money as a sign of status and prestige as highly as Gen-X. But Boomers do value
saving money and show significant differences in the retention of money (Shaul, 2007).
Shaul (2007) ultimately concluded, “Perhaps performance needs to be linked more
strongly to benefits as these employees are oftentimes underperforming and just biding
their time until they can leave” (p. 85).
57
Incentivizing Intergenerational Commitment.
It may come as no surprise that money transcends otherwise commonplace values.
Only variations in approaches to work can create or equalize the motivation to stay
committed to one’s current organization. Hollman (2008) worked to “determine the
relationship between generational membership, defined as Baby Boomer, Generation X,
and Millennial and affective, continuance, and normative organizational commitment in
one Fortune 100 firm” (p. 4). In order to better understand what each means, the Three-
Component Model Employee Commitment Survey describes affective, continuance, and
normative commitment as components to overall organizational commitment. Affective
commitment can be described as passion or association with the firm. Continuance is the
cost-benefit of staying over choosing to leave an organization. Normative describes duty,
bound by circumstances and creating an obligation. A random sample of 500 survey
responses was collected against measures including statements regarding the three types
of commitment. Findings, as described by Hollman (2008), include “The exploratory
statistical analysis indicates there is no relationship between affective and normative
organizational commitment and generational membership indicating the absence of a
connection between these variables of the study. However, there is a negative relationship
between generational membership and continuance organizational commitment” (p. 80).
What do these implications of organizational commitment type mean when pitting
them against data regarding perceptions of money, as well as perceptions of personal
value? Baby Boomers have been firmly in charge for the past few decades and, as a rule,
they have been willing to operate by a well-understood set of corporate practices and
policies related to compensation, hierarchy, and expectations for the way work ‘works’
58
(Erickson, 2010). Erickson (2010) continues saying “Generation Xers, born from 1961
through 1981, have different ideas. They are more apt to reject status-quo definitions of
success and seek their own paths” (p. 63). The author describes a study in which
hundreds of Gen-X interviews have taken place, and the upcoming generation of
leadership ‘views work in a way that current corporate executives rarely understand’.
Intergenerational research, leading to further understanding of how Gen-X differs from
its Baby Boomer counterpart, is helping to shed light on pathways for optimizing both
career path and self-regard. With the success of tomorrow’s organizations in mind,
Erickson describes ‘five context-creating leadership activities well suited for today,
which include (a) increase collaborative capacity; (b) ask compelling questions; (c)
embrace complexity and welcome disruptive information; (d) shape corporate identity;
and (e) appreciate diversity.
Generation X Research
Regardless of whether boomers quit working or stay in the workplace, there is one
prediction that can be made with some certainty: employee turnover will become the key
challenge for managers (Ludwick, 2007). Research regarding the generations is not in
short supply, nor are artifacts alluding to the pending crises regarding generational shifts
in the workplace. What is underserved is the research regarding Generation X (Gen-X)
specifically, and its patterns concerning talent, commitment, and culture. In a study of
business leaders’ core values among the Gen-X population, Kwak (2009) “examined the
alignment of core values in a group of successful Gen X business leaders. Specifically,
this study analyzed core values that tap into a particular generational cohort that
witnessed the impact of vast technological advancements and globalization” (p. 11).
59
Beginning with an in-depth review of the literature, core thematic elements were
identified to then translate into a holistic framework for inquiry in order to gather more
in-depth knowledge of levels of congruence between the perceptions/practices of
identified Gen-X leaders and the core values of their inherent organizations. Drawing on
the research frameworks of Collins (2001) and Porras (2007), the researcher created a
survey instrument which assessed both the aforementioned perceptions and practices,
upon which content analysis was performed, to derive 120 meaningful quotations from
the 30 transcripts (Kwak, 2009). The five conclusions derived according to Gen-X
include, Gen-X leaders recognized that nurturing relationships maintained their
organization’s success, that integrity is perceived as a vital value, and that the presence
and alignment of a value system is crucial to success (Kwak, 2009).
Generation X as meritocratic individualists. While by population size, both the
predecessor Baby Boomer population, and the following Millennial population far
outweigh the Generation X grouping. However, this generation is made up of individuals
who are coming into today’s leadership positions, who are poised to replace the Baby
Boomers among executive positions, and who will continue to be among the myriad
successful serial entrepreneurs shaping today’s American economy. What is missing in
the literature is further work on how the values of this generation, the habits of this
generation, and the beliefs of this generation will come to mold the experiences had in the
business environment in coming years.
The theory of Self-Esteem and Extrinsic Career Success proved to be an
invaluable predictor of career path for the Baby Boomers, which constituted the initial
study’s sample population. Yet we could gain from more literature on the Generation X
60
population and its impacts in the present and near-term future. Further research would
add to how much we have already come to know of this generation and its beliefs
surrounding career path, success, and self-regard. In a study titled Constructing Career
Scripts: How Members of Generation X Make Sense of their Careers in Business, the
author sought to learn more of how individuals make sense of their careers within
specific cultural contexts and time periods by comparing career scripts mapped to their
own and previous generations (Belden, 2009). In doing so, Belden was researching, not
only how career scripts developed among this population, but was able to understand
more of what workers in this Generation attribute success to as well. Belden concluded
that Generation-X exhibited a unique form of ‘meritocratic individualism’. Boyd (2009)
supports this conclusion with a study, which found this generation to “give short shrift to
some seasoned tenets of corporate conduct, including organizational mission,
organizational politics, and organizational loyalty” (p. 465). In both instances,
commitment, reward, and organizational citizenry are dictated by expectations of
commensurate recognition and/or reward for what is felt to be achievement/merit-based
accomplishments. This is not to say that tenure falls on deaf ears, but it is to say that the
notion that they are expendable entities bolsters the penchant to roam. In an era when
they are apt to be downsized without warning or mercy, they are acutely conscious of
their LIFO status (Boyd, 2009, p. 468).
It was this perception of (false) dichotomy between seeing Gen-X as a group with
low levels of organizational commitment, or as seeing this generation’s long-term
prospects as bleak in an otherwise dismal economy that gave rise to a special report
published by the Journal of Accountancy, which examined “this group's career goals,
61
personal values, work-related expectations and work satisfaction, to help employers
attract, retain and advance this next generation” (p. 38). In fact, fully 85% reported that
they really cared about the fate of the organizations for which they worked, and 83% said
that they were willing to put in far more effort than is normally expected in order to help
their organizations succeed (Catalyst, 2005, p. 38). As with the Belden and Boyd studies,
the reality paints a picture more accurately described as a strong sense of realism around
the need to go where opportunities are present, rather than from the basis of a need to
mitigate organizational commitment to the benefit of self-service alone. As was most
accurately described by Goldseker (2009), “Although Gen X’ers are stereotypically
considered ‘slackers,’ most members of their generation would tell you they are actively
seeking meaningful experiences and want to learn by doing. They "work to live," not
"live to work," like generations before them” (p. 118). As stereotypes abound for this
generation, it becomes prudent to then develop a deeper understanding of how better to
define this generation, and to locate germane research on what it means to create a more
meaningful corporate existence, while possibly predicating more favorable career paths
as a result.
One such study, which attempts to make this distinction, is Creating a Gen-X
Friendly Workplace to Retain Key Talent. DeMarco (2008) describes, “The year 2008
and upward, accordingly, will be characterized by the retirement of approximately 75
million baby boomers professionals. To address the [corporate recruitment and retention
difficulty] outcry, companies are advised to focus on collaborative relationships; offer
variety; work in teams; and build a strong corporate communication process” (p. 1). In a
study of voluntary turnover among Gen-X IT professionals, a researcher from the
62
University of Phoenix sought to understand why information technology professionals
have been leaving their organizations after three to five years, resulting in increased costs
due to rehiring, retraining, and loss of skill sets and knowledge (Burnes, 2006).
Employing a concurrent mixed method approach, Burnes used a nonexperimental
descriptive design combining an electronic survey and qualitative interview to gather data
on the voluntary turnover as social phenomena. While focusing on the ‘unfolding model
of voluntary employee turnover’, Burnes (2006) found that “employees often feel that the
organization will not retain them beyond 3 to 5 years” (p. 116). In response to this
presumed environment, this study revealed five factors that motivate an information
technology employee toward decision ‘path level 2 or 3’ of the unfolding model of
voluntary employee turnover in the areas of loyalty, communications styles, lack of
keeping up with technology, compensation, and leadership (Burnes, 2006).
Further scholarship into Generation X IT professionals was accomplished by
adding the job satisfaction variable to the research equation. Fismer (2005), also of
University of Phoenix, formulated a phenomenological description of the essential
structure of Information technology (IT) consulting organizations’ internal work
environments, specifically job satisfaction and leadership styles of Generation X leaders
(p. 4). Using interviews as descriptors of experience, and performing a phenomenology
of 20 IT/Gen-X leaders from 66 organizations drafted in-depth profiles. The conclusions
drawn from the content analysis of these 20 profiles, including amassed interview data,
shed light on the emergence of new patterns among professionals when taking this
specified generation into context. Fismer (2005) summarizes by concluding “interviewed
Generation X leaders identified ‘seeking advice from mentors’, ‘choosing a career
63
path/having worked for different companies’, and ‘linking education to career’ among
their core behavioral priorities” (p. 144). In addition, their primary values, specifically:
trust, loyalty, teamwork, and respect reflected humanistic thinking and focused on
inspiring their followers’ talents (Fismer, 2005, 144). To further reflect on this list of
pervasive values, Spear (2009) studied the development of Gen-X workers for positions
of executive leadership in the federal government. In this study, its author describes an
‘impending exodus of seasoned leaders’ as more than 50% of the Senior Executive
Service (SES) members as of October 2000 will leave the Federal government by
October 2007 (Spear, 2009). To understand more of what Gen-X leaders need/want from
a development program, questions on training method preferences, subject matter
preferences, and body of knowledge were explored. In a case study, supported by
numerous focus groups, Spear (2009) found that “Understanding future leaders will need
to lead differently, Generation Xers, as evidenced by the participants in the study, will
likely speak candidly about their leadership development interests and pursue
opportunities that prepare them for the leadership challenges of tomorrow” (p. 163).
These findings further support the supposition above that Gen-X workers value
humanistic thinking as well as teamwork when in the face of opportunities for further
collaboration. Anding (2009) also described this scenario as “aspects of an inward
journey resulting in a recommitment to work that allowed for an integration of the
participant's needs for achievement, challenge, and continued learning with more
meaning and authenticity (p. 2).
Preparing the workplace for Generation X. Rousseau (2007), in a preface to his
research on retention strategies and Generation X, comments, “By the time I entered the
64
workforce my perspective was much different than that of my baby-boomer parents. I
wanted mutuality. I wanted respect for my contributions. I wanted a fair wage.“ (p. 1).
The workplace of today is in no way a mirror image of organizations past, yet this is also
not to say that today’s organization is fully prepared to receive the Gen-X workforce
either. To that end, Rousseau (2007) cites that “Seventy percent of [Gen-]X’ers stated
they would quit if they thought they could find increased intellectual stimulation
elsewhere” (p. 43). As a result of an exhaustive literature review on the topic of
turnover/retention in today’s organizations, the author also concludes ”Generation X,
while more dynamic than two retention practices, is fundamentally defined by the values
that are associated with the two retention practices described in depth in this paper.
Generation X’ers want work-life balance and meaning” (p. 53).
In recent years, Herzberg’s theory on motivation and McGregor’s theories X and
Y were used to examine attitudes and motivational factors that stimulate and increase
employee satisfaction leading to increased employee recruitment and retention (Lee,
2007). Lee (2007) utilized a mixed method approach to couple a phenomenology with a
questionnaire, which surveyed members of the Society of Louisiana Certified Public
Accountants. These 16 participants allowed Lee (2007) to come to the conclusion that,
not only had recruitment and retention become a cause for concern among accounting
professionals, but also that “Organizations will need to be willing to change current
methods of recruitment and motivation techniques and consider new ways of attracting
and motivating accountants that will entice them to remain with the organization” (p.
133). The author lists ‘organizational structure’ as one viable option for change since
65
Gen-X workers were found to be more apprehensive to hierarchy as they found it more a
hindrance than a benefit.
To continue this avenue of research, the Financial Planning Association
published, Serving the Next Generation. The article, published Q1 2009, was “based on a
recent Financial Planning Association survey of 3,022 consumers with over $50,000 in
income or investable assets… focuses on the current behaviors, planning needs, and
benefits of planning to Generation X” (FPA, 2009, p. 1). As a primary takeaway from
this survey, while Generation X's areas of stress are more short term, their goals are long
term; they need a plan to help them become behaviorally future-focused as opposed to
simply thinking long term (FPA, 2009). This financial reality, as implication for an
employment one, is further defended by the supposition that we’ll work for much smaller
organizations that outsource everything but the business’s core area of expertise, and
more than half of us will eventually become contingent workers, employed part time or
as freelancers or consultants (Levit, 2009). Thus, the conclusion drawn is not one of a
pattern of behavior where Generation X is simply a grouping dedicated to freely floating
between intellectually stimulating positions, and instead speaks to a grouping of society
that faces the realities of the current economic times. They accept the harsh truth and
cynicism that invokes a survival instinct, which mitigates any current inclinations to
commit to an organization.
To offer more on the implications of preparing the workplace for Generation X,
Mitchell, McLean, & Turner (2005) provide the following description of those who
comprise this group:
66
They have trouble making decisions. They would rather hike the
Himalayas than climb a corporate ladder. They have few heroes, no
anthems, no style to call their own. They crave entertainment, but their
attention span is as short as one zap on the TV dial. They hate yuppies,
hippies, and druggies. They postpone marriage because they dread
divorce. They sneer at Range Rovers, Rolexes, and red suspenders.
Things they hold dear are family life, local activism, national parks, penny
loafers and mountain bikes. They possess only a hazy sense of their own
identity but a monumental preoccupation with all the problems the
preceding generation will leave for them to fix. (p. 26)
Adding to the Generational Knowledge Base.
Despite their best efforts, companies continue to squander what may be their
greatest asset in today’s knowledge economy: the wealth of expertise, ideas, and latent
insights that lie scattered across or deeply embedded in their organizations (Hansen &
Oetinger, 2001). As also noted in The Leadership Pipeline, the successions plans, as well
as hierarchical passage orientations of today, have great potential to contribute to the
success of tomorrow’s organizations as they prepare today’s generations for positions of
leadership. From studies on how organizations are managing the transition between
generations, to research on the values and personalities of these diverse groupings, more
can be understood about how the transition to Generation X leadership will affect the
success and sustainability of today’s companies. By furthering the research on
Generation X self-esteem levels and career path patterns, more can be known of how to
harness the knowledge of those stepping out of positions of leadership and how best to
67
prepare for the coming wake of workers centered on independence and meritocracy
among the Gen-X population. As noted by Hansen & Oetinger (2001), “using existing
knowledge to improve performance or combining strands of knowledge to create
something altogether new can help companies respond to a surprising array of challenges,
from fending off smaller, nimbler rivals to integrating businesses shoved together in a
merger” (p. 1).
Conclusions and Method Appropriateness
The implications of the possible finding of a direct relationship between these
factors affect not only the individual as a member of the workforce. They impact the
organizations he or she works for as well. This impact, it is believed, is shown in the
desire to be employed in a position befitting the individual’s self-esteem and, therefore,
perceived worth, resulting in maximum commitment to the current job and organization
only when the position is in alignment with the employee’s expectations of worth. This
essentially gives rise to the need to better understand how self-esteem impacts the
components of extrinsic career success. Until these variables are in alignment, an
employee may exhibit reduced commitment to his or her current position as described
above.
According to Kammeyer-Mueller, Judge, & Piccolo (2007), “many of the
important questions in the literature on self-esteem, social status, and identity have
reciprocal relationships at their core and therefore require repeated measures of self-
image and careers over time” (p. 205). In the same article, Self-Esteem and Extrinsic
Career Success: Test of a Dynamic Model, the authors set out to establish these repeated
measures over time, while determining the efficacy of viewing relationships between
68
self-esteem and elements of extrinsic career success. The authors continue saying “An
important note for all of these relationships is that we are focusing our attention on
changes in self-esteem, education, occupational prestige, and income rather than simply
noting zero-order relationships” (Kammeyer-Mueller et al., 2007, p.208).
A Review of Method Appropriateness.
Addressing the deficiencies in the literature concerning self-esteem and extrinsic
career success for the Gen-X workforce requires an analysis of fit for best analyzing the
potential relationship between self-esteem and extrinsic career success, and an analysis of
the intellectual merit or worthiness of such research. To do so, options concerning
research method, strategy of inquiry, and method of data collection are reviewed.
Identifying a research method. Quantitative research is a means for testing objective
theories by examining the relationship among variables; these variables, in turn, can be
measured, typically on instruments, so that numbered data can be analyzed using
statistical procedures (Creswell, 2009). This method is chosen for multiple reasons,
primary of which is the need to select a method, which accommodates the analysis of a
potential relationship as expressed between data on self-esteem and data on extrinsic
career success. Where quantitative analysis is a deductive process using largely
numerical data to express relationships, the qualitative method was not chosen due to its
inductive nature.
As qualitative research concerns the process of making sense through words,
conclusions based on thematic pattern, and induction through participative inquiry, it was
found inappropriate for the present study as more numeric data, longitudinal data is
available. Mixed method research as a final alternative, is an approach to inquiry that
69
combines both qualitative and quantitative forms, and involves philosophical
assumptions, the use of qualitative and quantitative approaches, and the mixing of both
approaches in a study (Creswell, 2009). As the aforementioned review of the literature
has determined that the appropriate variables include self-esteem and extrinsic career
success, and as longitudinal data on these variables is available for the target population,
no further qualitative research is invoked.
Selecting a strategy of inquiry. Surveys have broad appeal, particularly in democratic
cultures, because they are perceived as a reflection of the attitudes, preferences, and
opinions of the very people from whom the society’s policymakers derive their mandates
(Rea & Parker, 2005). Upon selection of a quantitative research method, opportunities
for strategy of inquiry commonly include experimentation and survey research. Survey
research provides a quantitative or numeric description of trends, attitudes, or opinions of
a population by studying a sample of that population (Creswell, 2009). As this study
aims to gather representative data from the Gen-X workforce, to then analyze the
potential relationship between self-esteem and extrinsic career success, the strategy of
inquiry must be one suitable for gathering data on such a large population. Where
experiments are suitable in more localized environments, survey data will allow for a
greater capture of representative data, as access to a larger number of respondents is
possible using this strategy of inquiry. Further, data used will be from the Bureau of
Labor Statistics' National Longitudinal Survey of Youth (NLSY) and will therefore be
from a proven, representative sample of the US Generation X workforce.
Reviewing methods of data collection. It is useful to consider the full range of
possibilities of data collection and to organize these methods, for example, by their
70
degree of predetermined nature, their use of closed-ended versus open-ended questioning,
and their focus on numeric versus nonnumeric data analysis (Creswell, 2009). While
qualitative methods may employ emerging methods of collection, open-ended interview
and observation data, and/or content analysis using image or text-based artifacts, the
NLSY uses closed-ended, numeric data.
To provide a statement of reliability for good measure, additional instances of
instrument use and reliability assessment were reviewed. One such study from
Crickenberger (2010) states the NLSY79 and therefore NLSY79ch undergo “several
assessments to ensure reliability and validity of the questionnaire... the questionnaire is
reviewed biannually by NLS Technical Review Committee, which is comprised of
multidisciplinary experts in social sciences” (p. 50).
This allows for the numeric representation of demographic, personality,
employment, and income data of the representative sample, and for a period of eight
years. This survey, which incorporates the Rosenberg 10-item self-esteem scale, as well
as questions on position, income, job satisfaction, and formal education, provides the data
necessary to examine a potential relationship between the variables inclusive of the
theory of self-esteem and extrinsic career success.
71
CHAPTER THREE: METHODOLOGY
Much literature exists regarding self-esteem, career success, and intergenerational
research, each in isolation and unrelated to one another. However, what remains to be
explored are measures of self-esteem and extrinsic career success over time, relative to
the workforce of Generation X. A review of the literature has revealed value differences
among current workforce generations. This review has also elucidated a potential
relationship between aspects of the varying personalities of different generations and the
stability of career paths, thus exhibiting the potential side effect of compromises to
organizational profitability.
Research Design and Instrumentation
This quantitative, longitudinal study using archival data will test the theory of
self-esteem and extrinsic career success, which relates self-esteem to occupational
prestige and income. This will be done using data collected from respondents of the
Bureau of Labor Statistics' National Longitudinal Survey of Youth - Children & Young
Adults (NLSY79ch). This survey was administered biannually from 1994 through 2008.
This final, archival dataset is now publically available online via the NLS Web
Investigator tool, and is accessible after a free user registration process.
Experimentation, while targeted, does not allow for the longitudinal capture of
self-esteem, job satisfaction, or extrinsic career success information as a survey would
certainly allow. Therefore, research questions under study include:
1. Is there a relationship between self-esteem and extrinsic career success among
respondents?
72
2. Is there a relationship between self-esteem, job satisfaction, and extrinsic
career success among respondents?
From Research Questions to Hypotheses.
In order to answer these research questions, this study consists of four hypotheses.
Null hypothesis 1 (H0). There is no significant relationship between self-esteem
and occupational prestige when regarding NLSY79 Young Adult respondents.
Null hypothesis 2 (H0). There is no significant relationship between self-esteem
and income when regarding NLSY79 Young Adult respondents.
Null hypothesis 3 (H0). There is no significant relationship between self-esteem,
job satisfaction, and occupational prestige when regarding NLSY79 Young Adult
respondents.
Null hypothesis 4 (H0). There is no significant relationship between self-esteem,
job satisfaction, and income when regarding NLSY79 Young Adult respondents.
A summary of the deconstruction from research questions, to statistical tests, to
hypotheses, is provided in Figure 3.
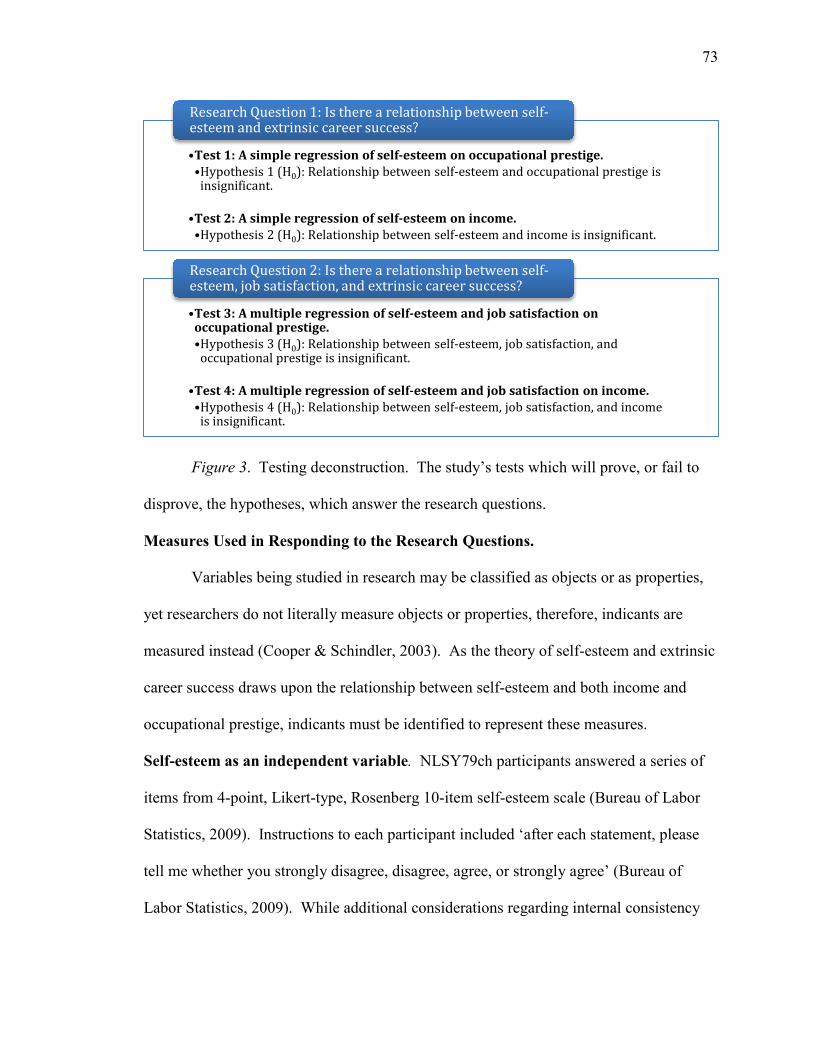
73
Figure 3. Testing deconstruction. The study’s tests which will prove, or fail to
disprove, the hypotheses, which answer the research questions.
Measures Used in Responding to the Research Questions.
Variables being studied in research may be classified as objects or as properties,
yet researchers do not literally measure objects or properties, therefore, indicants are
measured instead (Cooper & Schindler, 2003). As the theory of self-esteem and extrinsic
career success draws upon the relationship between self-esteem and both income and
occupational prestige, indicants must be identified to represent these measures.
Self-esteem as an independent variable. NLSY79ch participants answered a series of
items from 4-point, Likert-type, Rosenberg 10-item self-esteem scale (Bureau of Labor
Statistics, 2009). Instructions to each participant included ‘after each statement, please
tell me whether you strongly disagree, disagree, agree, or strongly agree’ (Bureau of
Labor Statistics, 2009). While additional considerations regarding internal consistency
•Test 1: A simple regression of self-esteem on occupational prestige. •Hypothesis 1 (H0): Relationship between self-esteem and occupational prestige is
insignificant. •Test 2: A simple regression of self-esteem on income. •Hypothesis 2 (H0): Relationship between self-esteem and income is insignificant.
Research Question 1: Is there a relationship between self-esteem and extrinsic career success?
•Test 3: A multiple regression of self-esteem and job satisfaction on occupational prestige. •Hypothesis 3 (H0): Relationship between self-esteem, job satisfaction, and
occupational prestige is insignificant. •Test 4: A multiple regression of self-esteem and job satisfaction on income. •Hypothesis 4 (H0): Relationship between self-esteem, job satisfaction, and income
is insignificant.
Research Question 2: Is there a relationship between self-esteem, job satisfaction, and extrinsic career success?
74
will be mentioned later in this chapter when regarding reliability, these data are extracted
as questions Q16-5h-a through Q16-5h-j of the survey itself.
Education as an independent variable. Respondents are branched throughout the
‘Regular Schooling’ section according to both enrollment status and highest grade
completed (Bureau of Labor Statistics, 2009). As an ordinal scale, this question asks that
respondents reply with the number of years of formal education completed. These data
are extracted as question Q4-19 of the survey.
Job satisfaction as an independent variable. Although the NLSY79ch was
administered every two years, from 1994 to 2008, a Global Job Satisfaction Item was not
included where data is available until 1998. This question asked how the respondent felt
about his/her job with their present and primary employer (Bureau of Labor Statistics,
2009). These data are extracted as question QES-89.01 of the survey.
Occupational prestige as a dependent variable. The Duncan Socioeconomic Index
(SEI) was used to measure occupational prestige. It is taken from a number of experts in
the 1950s from Census data on occupational characteristics and perceptions of prestige
(Kammeyer-Mueller et al., 2007). In order to utilize the Duncan SEI, the participant,
regarding primary job position, and then converted to an SEI score, first collected an
occupational classification code. The survey used differing question codes for this
variable throughout time since the basis of occupational classification was also evolving.
Specifically, the 1994, 1996, and 1998 survey used the 1970 Census coding frame, while
the 2000 and 2002 surveys used the 2000 Census frame, and the 2004 and forward
surveys used the latest NAICS-based codes (Bureau of Labor Statistics, 2009). These
75
data are extracted as questions QES1-55I, QES-55H.01, OCC90.01, and OCC2000.01
respectively through time.
Income as a dependent variable. As a measure of income, the question pertaining to all
wages, salary, commissions, and tips is used for all years 1994 through 2008 (Bureau of
Labor Statistics, 2009). This question is constructed to also include military income as of
2000, and is extracted as question Q15-5 of the survey.
Utilization of a Proven Instrument.
The Kammeyer-Mueller et al. (2007) study explored the relationship between
self-esteem and extrinsic career success and thus provided the first evidence of such a
relationship. The instrument chosen for the study was the National Longitudinal Survey
of Youth 1979 or NLSY79, sanctioned by the Bureau of Labor Statistics and performed
by the Center for Human Resource Research at Ohio State University. The NLSY79 is a
nationally representative probability sample of 12,686 individuals who were between the
ages of 14 and 21 in 1979; each participant has been interviewed since 1979 to assess
labor force experiences, labor market attachment, and investments in education and
training (Kammeyer-Mueller et al., 2007). As described by Crickenberger (2010), “The
NLSY79 sampling criteria were designed to represent 14-21-year-olds living in the
United States. Participants were randomly selected out of a possible 75,000 households
through a two-step process. The two-step process ensured a valid and reliable random
sampling procedure” (p. 40).
While the NLSY79 was found to be valid, reliable, and representative, it was
found to be representative of the generation we now call the Baby Boomers. Recall
instead the Erickson (2010) study which identifies the Generation X population to have
76
been born from 1961 through 1981. Consider then instead the NLSY79 Young Adult
(NLSY79ch). As described by the Bureau of Labor Statistics (2009) in their overview of
the NLSY79ch, “Starting in 1994, a different type of interview was initiated for the older
children of the NLSY79 female respondents. This ‘young adult’ data collection has
focused on NLSY79 children who have reached age 15 and over as of the end of the
relevant survey calendar year” (p. 4). This Young Adult questionnaire focused on the
transition to adulthood, with detailed questions on education, employment, training,
health, family experiences, attitudes, interactions with family members, substance use,
sexual activity, non-normative activities, computer use, health problems, and pro-social
behaviors (Bureau of Labor Statistics, 2009). Since the NLSY79ch was the direct result
of follow-up actions to the NLSY79, and since the approach to sampling and data
collection were similar between these instruments, and since the variables collected
included those studied for the population identified for this research, the NLSY79ch has
been selected as the proven instrument for this research.
Data Collection.
Young adults surveyed through 1998 used a CAPI questionnaire modeled on the
main NLSY79 interview along with a paper and pencil self-report booklet. Beginning in
2000, surveys were conducted primarily by telephone interviews, with questions from the
self-report booklet integrated into the computerized instrument (Bureau of Labor
Statistics, 2009). The variations of the National Longitudinal Survey of Youth (NLSY)
have been under study for an extensive period of time and they have withstood thorough
scientific review. As commented by Crickenberger (2010), “both the NLSY79 and the
NLSY97 provide extensive documentation on the background of the study, the research
77
design, sampling, data collection, and procedures” (p. 50). This confidence is built not
only upon the strength of evidence supporting procedures used by the researchers at Ohio
State University, but upon in-person interviews, telephonic interviews, and self-reported
survey data as well. The final, archival dataset is now publically available online and
will be downloaded via the NLS Web Investigator tool, which is accessible after a free
user registration process.
Upon accessing the dataset, one must first select all records containing data for
the aforementioned variables. Ensuring these data are at least six years apart, the data
must then be cleaned of all records containing values indicating either ‘missing’ or
‘refused’ responses. Frequencies are then generated on whatever data remains. For those
data, exhibiting a minimum six-year span between independent and dependent variables,
the pairings that generate the highest frequencies are isolated. Once the value for n is
recorded for this simplified dataset, analysis and review ensue.
Regarding Instrument Reliability.
Reliability is concerned with estimates of the degree to which a measurement is
free of random or unstable error. Reliable instruments can be used with confidence that
transient and situational factors are not interfering (Cooper & Schindler, 2003). The
literature regards the NLSY79/NLSY79ch as containing a wealth of data that social
scientists are continuously analyzing within a number of areas of interest, while also
concluding that the survey collects extensive background information on attainment and
wages alike (Price, 2010).
78
Population and Sampling
The NLSY79ch was administered with the intent of collecting representative data
from two populations, children and young adults. Upon consideration of the nature of
variables such as income and job satisfaction, focus is placed on the generation
represented by the young adult population, as described in the review of the literature as
Generation X based on date of birth.
Selecting a Sampling Strategy.
According to Cooper & Schindler (2003), “there are several compelling reasons
for sampling, including: (1) lower cost, (2) greater accuracy of results, (3) greater speed
of data collection, and (4) availability of population elements” (p. 179). Evidence was
also reviewed regarding a strategy for the sample selected, and how it is representative of
the general population the research intends to describe, while also providing predictive
power in instances where this means is appropriate. Sampling can take a great many
forms. Yet to describe the theoretical basis for sampling, certain properties when
describing a normal distribution must be taken into account. These properties include (1)
the value of the mean of sample means approaches the true population mean, also
referred to as the Central Limit Theorem; (2) the distribution of sample means will
approximate a normal curve as long as the sample size of each individual sample is
sufficiently large; (3) the standard deviation of the distribution of sample means, or
standard error, is smaller than the standard deviation of the total population (Rea &
Parker, 2005).
The identity of a population under study, the clustering or sampling design of the
population, the sampling strategy of either by probabilistic or convenience origins, and
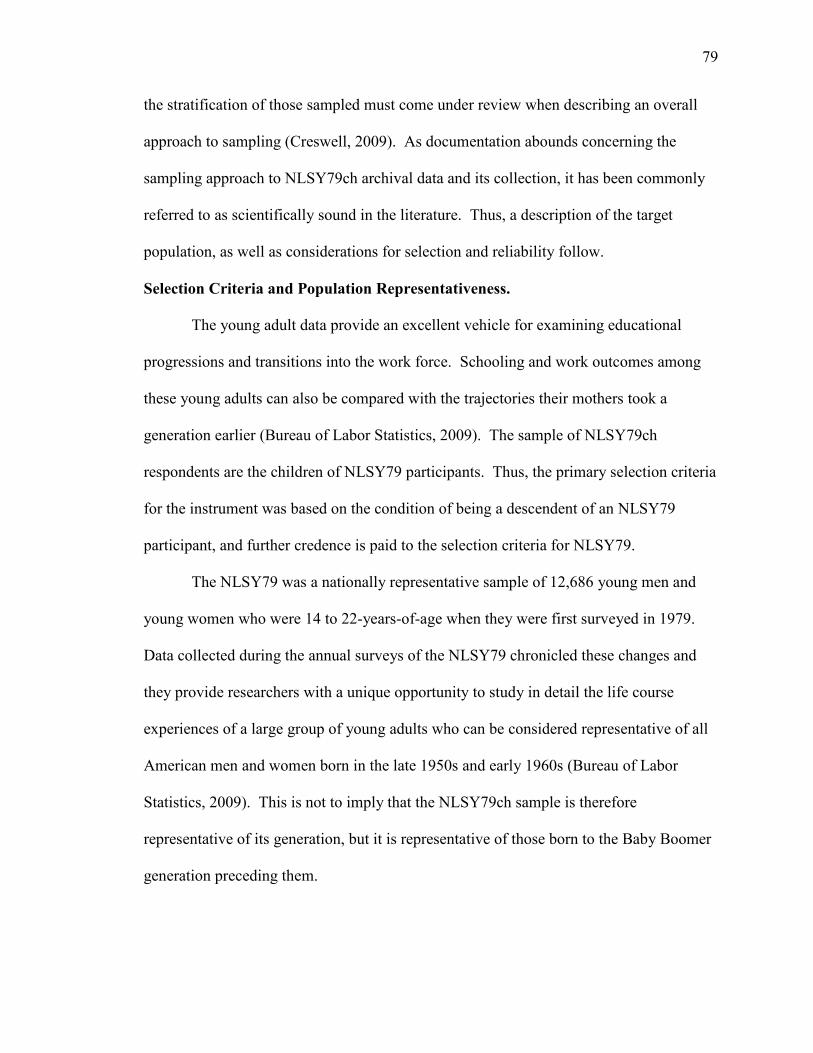
79
the stratification of those sampled must come under review when describing an overall
approach to sampling (Creswell, 2009). As documentation abounds concerning the
sampling approach to NLSY79ch archival data and its collection, it has been commonly
referred to as scientifically sound in the literature. Thus, a description of the target
population, as well as considerations for selection and reliability follow.
Selection Criteria and Population Representativeness.
The young adult data provide an excellent vehicle for examining educational
progressions and transitions into the work force. Schooling and work outcomes among
these young adults can also be compared with the trajectories their mothers took a
generation earlier (Bureau of Labor Statistics, 2009). The sample of NLSY79ch
respondents are the children of NLSY79 participants. Thus, the primary selection criteria
for the instrument was based on the condition of being a descendent of an NLSY79
participant, and further credence is paid to the selection criteria for NLSY79.
The NLSY79 was a nationally representative sample of 12,686 young men and
young women who were 14 to 22-years-of-age when they were first surveyed in 1979.
Data collected during the annual surveys of the NLSY79 chronicled these changes and
they provide researchers with a unique opportunity to study in detail the life course
experiences of a large group of young adults who can be considered representative of all
American men and women born in the late 1950s and early 1960s (Bureau of Labor
Statistics, 2009). This is not to imply that the NLSY79ch sample is therefore
representative of its generation, but it is representative of those born to the Baby Boomer
generation preceding them.
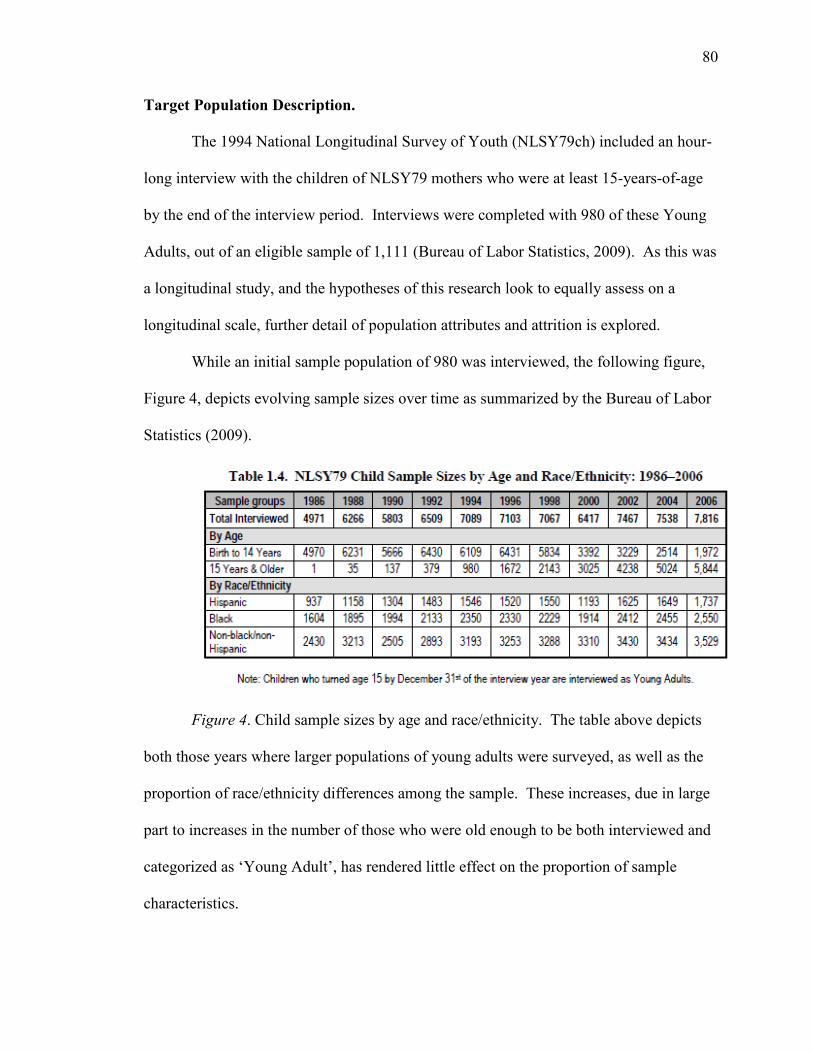
80
Target Population Description.
The 1994 National Longitudinal Survey of Youth (NLSY79ch) included an hour-
long interview with the children of NLSY79 mothers who were at least 15-years-of-age
by the end of the interview period. Interviews were completed with 980 of these Young
Adults, out of an eligible sample of 1,111 (Bureau of Labor Statistics, 2009). As this was
a longitudinal study, and the hypotheses of this research look to equally assess on a
longitudinal scale, further detail of population attributes and attrition is explored.
While an initial sample population of 980 was interviewed, the following figure,
Figure 4, depicts evolving sample sizes over time as summarized by the Bureau of Labor
Statistics (2009).
Figure 4. Child sample sizes by age and race/ethnicity. The table above depicts
both those years where larger populations of young adults were surveyed, as well as the
proportion of race/ethnicity differences among the sample. These increases, due in large
part to increases in the number of those who were old enough to be both interviewed and
categorized as ‘Young Adult’, has rendered little effect on the proportion of sample
characteristics.
81
Attrition was also explored since it is not feasible to expect a 100% response rate
for this or any similar population. This is an equally imperative measure. While initial
sampling strategy for the NLSY79 population remained representative of an entire
generation nationally, those interviewed as part of NLSY79ch were chosen by birth alone
and, therefore, were at greater risk of providing decreasingly representative data if this
subset were to substantially decrease in response rate. Yet, this was not the case, as
young adults did not need to be living with their mother in order to be eligible for
interview. Therefore, a significant number of ineligible children become eligible when
they enter the young adult ages as parental presence was no longer a requirement. As
provided by the Bureau of Labor Statistics (2009), the following figure, Figure 5, depicts
completion rates relative to this population.
Figure 5. Completion rates for NLSY79ch populations. This table represents the
completion rate percentages of those young adults found to be in-scope.
Data Analysis and Interpretation
As a vast amount of data has been concisely collected, prepared, stored, and is
available for download across the years 1994 through 2008, the parsimony emphasized
82
through only succinct statistical analysis allows for clear analyses of these five variables
over the eight survey periods.
Descriptive Analysis Procedures
With any dataset encountered, one must find ways to allow the data to tell their
story. Ordering and graphing data sets often exposes patterns and trends, thus allowing
one to learn more about the data and the underlying situation (Harvard Business
Publishing, 2010). Offering statistics such as mean or median, standard deviation, range
and/or frequency does more than merely describe essential characteristics. Descriptive
statistics, including mean/median, standard deviation, frequency, range and sample
information, will therefore be calculated.
Population Reliability Via the Internal Consistency of Scales.
In order to determine the significance of the study, elements of both validity and
reliability come under question. Various forms of validity include content validity,
predictive or concurrent validity, and construct validity. As for reliability, it is argued
that the researcher should examine whether or not authors report measures of internal
consistency (Creswell, 2009). Measuring internal consistency is a process that has been
performed on this archival data on multiple occasions with multiple and differing results.
Ranging from 0.75 to 0.90, multiple authors have cited multiple coefficient alpha
reliability or Cronbach’s alpha estimates (Crickenberger, 2010). As described by UCLA
Academic Technology Services (2010), “Cronbach's alpha is a measure of internal
consistency, that is, how closely related a set of items are as a group... a ‘high’ value of
alpha is often used as evidence that the items measure an underlying (or latent) construct”
(p. 1).
83
As described by Gliem & Gliem (2003), “Based upon the formula _ = rk/[1 + (k -
1)r] where k is the number of items considered and r is the mean of the inter-item
correlations the size of alpha is determined by both the number of items in the scale and
the mean inter-item correlations” (p. 87). The authors continue to establish scores that
are (1) >.9 are excellent; (2) >.8 are good; (3) >.7 are acceptable; (4) >.6 are
questionable; (5) >.5 are poor; and (6) <.5 are unacceptable (Gliem & Gliem, 2003).
Thus, Cronbach’s alpha will be calculated in order to determine the internal consistency
of scales when reviewing the 10-item Rosenberg Self-Esteem Scale and its implications
on internal and population reliability.
Responding to the Research Questions through Statistical Analysis.
At its essence, this research is designed to perform very few actions for the
purpose of answering equally few, pointed questions. Those questions include whether a
relationship exists between self-esteem and extrinsic career success for respondents, and
whether job satisfaction also plays a role. To evaluate, independent variables are
regressed on the dependent variables in order to establish the potential for statistically
significant relationships. Hypotheses 1 and 2 detail simple regressions of self-esteem on
the dependent variables of extrinsic career success separately. Hypotheses 3 and 4 detail
multiple regressions of self-esteem and job satisfaction on the dependent variables of
extrinsic career success separately.
Simple regressions to respond to the first research question. A simple regression,
also known as Pearson Product Moment Correlation Coefficient or Linear Correlation
Coefficient, studies the relationship between a single independent and dependent variable
over time. As described by Triola (2004), “Because the linear correlation coefficient r is
84
calculated using sample data, it is a sample statistic used to measure the strength of the
linear correlation between x and y (p. 499). Results will be reported also using
scatterplots, expressions of r value, and expressions of p value. The intention will be to
determine if the test statistic exceeds the critical value in order to either reject or fail to
reject the hypothesis of a relationship (Triola, 2004).
Multiple regressions to respond to the second research question. A multiple
regression equation will be used in order to respond to the second research question,
where multiple independent variables are regressed on each of the dependent variables
included in extrinsic career success. As Triola explains, “A multiple regression equation
expresses a linear relationship between a dependent variable y and two or more
independent variables (x1, x2, …, xk)” (p. 542). Results will also include residual plots,
expressions of adjusted r2 values, and expressions of p values. The intention will be to
reduce the opportunities for multicollinearity, to establish the value of each coefficient as
a predictor variable, and to maximize the efficacy level of the adjusted r2 value.
Addressing Assumptions and Limitations of Generalizability.
The study and use of statistical analysis, by means of evaluating the number of
both independent and dependent variables, as well as determining the types and
distribution of scores on an instrument, play a large part in coming to a clear conclusion
on which statistical tests are appropriate to render judgment against a tested hypothesis
(Cooper & Schindler, 2003; Creswell, 2009; Rea & Parker, 2005; & Triola, 2004). Yet,
even as this is true, attention must be paid to the assumptions and limitations presented by
the research and the data inherent.
85
Assumptions regarding the use of NLSY79ch archival data include the
assumption that responses were coded accurately at the time of data collection.
Assumptions regarding the storage and transfer of data via the Bureau of Labor Statistics’
online Investigator data retrieval tool include the accurate execution of both actions. The
assumption of truthful responses, alongside the assumption of no instances of self-
enhancement bias, persists as well. It is equally assumed that all numerous studies,
which reported acceptable levels of content validity for the instrument’s components
used, were accurately communicated.
Limitations include the inability to perform respondent/nonrespondent checks for
response bias on archival data (Creswell, 2009). Limitations also include the ability to
only include respondents who were employed at the time of survey in order to accurately
record levels of job satisfaction and income. Thus, these persons must also be of
employable age in order to exclude those persons recently turning 15-years-of-age at the
time of the survey and, without an upward limit on age, parental presence was not
required at the time of data collection. Limitations regarding the generalizability of the
sample continue since, although NLSY79 respondents were said to be representative of
the Baby Boomer population, the sample surveyed for NLSY79ch contained only those
born of NLSY79 respondents. This was put into place in order to avoid creating a
nationally representative sample, since this adds a layer of stratification to the sampling
strategy which precludes generalization to all Generation X workers. Thus, this research
is not assumed to lay claim to universally applied conclusions among Generation X
workers. Yet it is with the intent of communicating conclusions based on a large enough
portion of those workers, such that a recommendation can be made as to the potential
86
value of such research on a larger scale. Therefore, this research would not predict the
relationship between self-esteem and extrinsic career success for all Gen-X workers
individually, but it could provide statistical conclusions as to the potential efficacy of
such research.
87
CHAPTER FOUR: DATA ANALYSIS AND RESULTS
This research examines the potential relationship between self-esteem and
extrinsic career success among NLSY79 Young Adult respondents. To do so,
longitudinal data was collected for variables including education, self-esteem, job
satisfaction, income, and occupational prestige. Research questions under study include:
1. Is there a relationship between self-esteem and extrinsic career success among
respondents?
2. Is there a relationship between self-esteem, job satisfaction, and extrinsic
career success among respondents?
To answer these questions, both simple and multiple regressions were used to
analyze these potential relationships, by reviewing the statistical significance of their
interaction. To analyze these data, inclusion criteria are first reviewed, followed by
descriptive statistics around the received data, and finally the results of multiple
hypothesis tests via regression analyses are elucidated.
Inclusion Criteria
In order to best understand the inclusion criteria used, a review of the hypotheses
being tested is germane, followed by a review of available populations.
Null hypothesis 1 (H0). There is no significant relationship between self-esteem
and occupational prestige when regarding NLSY79 Young Adult respondents.
Null hypothesis 2 (H0). There is no significant relationship between self-esteem
and income when regarding NLSY79 Young Adult respondents.
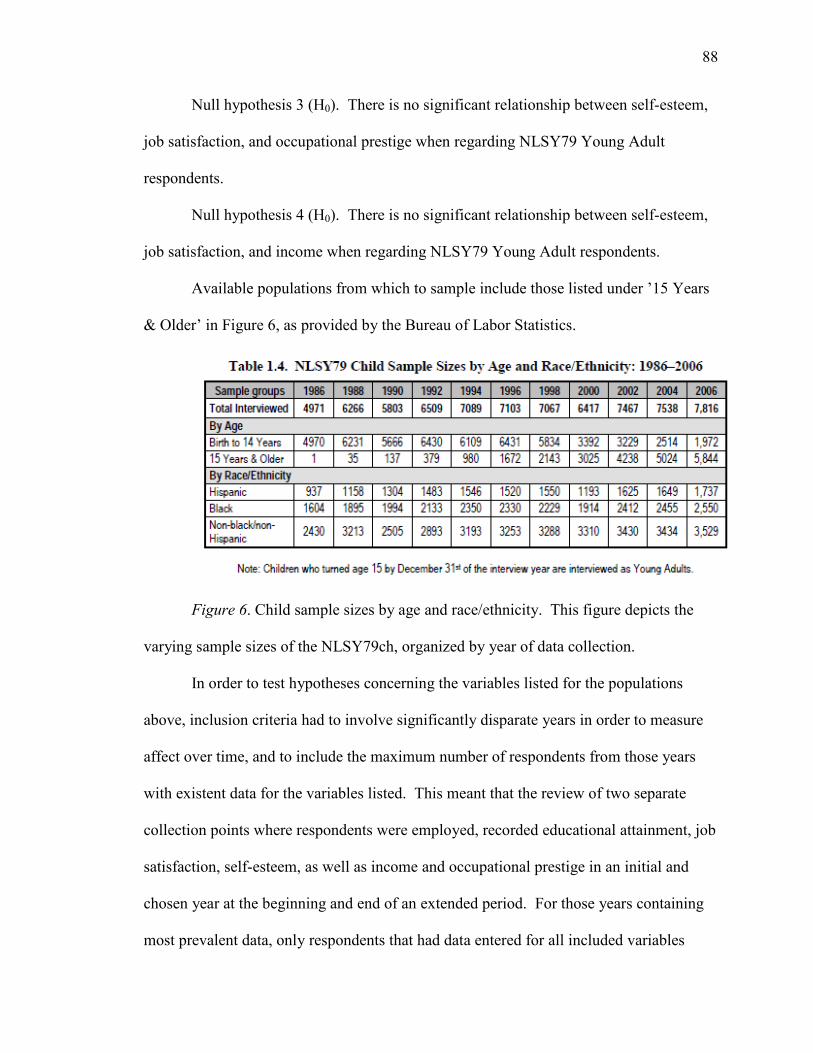
88
Null hypothesis 3 (H0). There is no significant relationship between self-esteem,
job satisfaction, and occupational prestige when regarding NLSY79 Young Adult
respondents.
Null hypothesis 4 (H0). There is no significant relationship between self-esteem,
job satisfaction, and income when regarding NLSY79 Young Adult respondents.
Available populations from which to sample include those listed under ’15 Years
& Older’ in Figure 6, as provided by the Bureau of Labor Statistics.
Figure 6. Child sample sizes by age and race/ethnicity. This figure depicts the
varying sample sizes of the NLSY79ch, organized by year of data collection.
In order to test hypotheses concerning the variables listed for the populations
above, inclusion criteria had to involve significantly disparate years in order to measure
affect over time, and to include the maximum number of respondents from those years
with existent data for the variables listed. This meant that the review of two separate
collection points where respondents were employed, recorded educational attainment, job
satisfaction, self-esteem, as well as income and occupational prestige in an initial and
chosen year at the beginning and end of an extended period. For those years containing
most prevalent data, only respondents that had data entered for all included variables
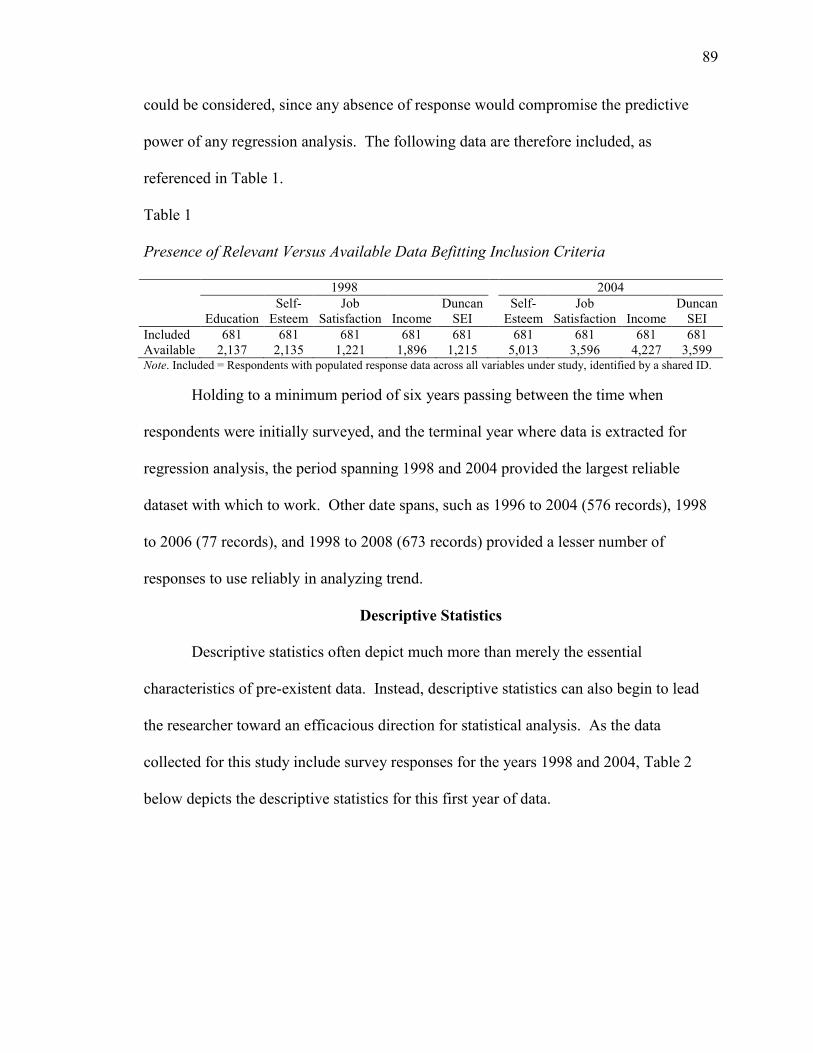
89
could be considered, since any absence of response would compromise the predictive
power of any regression analysis. The following data are therefore included, as
referenced in Table 1.
Table 1
Presence of Relevant Versus Available Data Befitting Inclusion Criteria
1998 2004
Education Self-
Esteem Job
Satisfaction Income Duncan
SEI Self-
Esteem Job
Satisfaction Income Duncan
SEI Included 681 681 681 681 681 681 681 681 681 Available 2,137 2,135 1,221 1,896 1,215 5,013 3,596 4,227 3,599 Note. Included = Respondents with populated response data across all variables under study, identified by a shared ID.
Holding to a minimum period of six years passing between the time when
respondents were initially surveyed, and the terminal year where data is extracted for
regression analysis, the period spanning 1998 and 2004 provided the largest reliable
dataset with which to work. Other date spans, such as 1996 to 2004 (576 records), 1998
to 2006 (77 records), and 1998 to 2008 (673 records) provided a lesser number of
responses to use reliably in analyzing trend.
Descriptive Statistics
Descriptive statistics often depict much more than merely the essential
characteristics of pre-existent data. Instead, descriptive statistics can also begin to lead
the researcher toward an efficacious direction for statistical analysis. As the data
collected for this study include survey responses for the years 1998 and 2004, Table 2
below depicts the descriptive statistics for this first year of data.
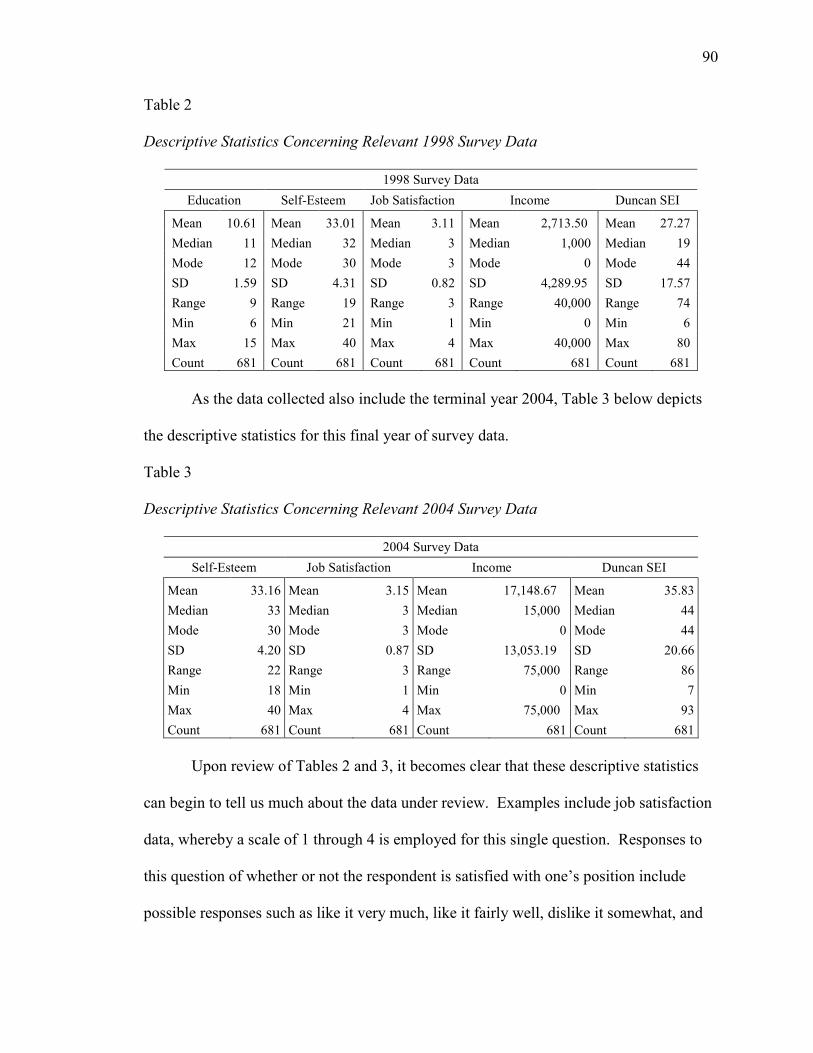
90
Table 2
Descriptive Statistics Concerning Relevant 1998 Survey Data
1998 Survey Data Education Self-Esteem Job Satisfaction Income Duncan SEI
Mean 10.61 Mean 33.01 Mean 3.11 Mean 2,713.50 Mean 27.27 Median 11 Median 32 Median 3 Median 1,000 Median 19 Mode 12 Mode 30 Mode 3 Mode 0 Mode 44 SD 1.59 SD 4.31 SD 0.82 SD 4,289.95 SD 17.57 Range 9 Range 19 Range 3 Range 40,000 Range 74 Min 6 Min 21 Min 1 Min 0 Min 6 Max 15 Max 40 Max 4 Max 40,000 Max 80 Count 681 Count 681 Count 681 Count 681 Count 681
As the data collected also include the terminal year 2004, Table 3 below depicts
the descriptive statistics for this final year of survey data.
Table 3
Descriptive Statistics Concerning Relevant 2004 Survey Data
2004 Survey Data Self-Esteem Job Satisfaction Income Duncan SEI
Mean 33.16 Mean 3.15 Mean 17,148.67 Mean 35.83 Median 33 Median 3 Median 15,000 Median 44 Mode 30 Mode 3 Mode 0 Mode 44 SD 4.20 SD 0.87 SD 13,053.19 SD 20.66 Range 22 Range 3 Range 75,000 Range 86 Min 18 Min 1 Min 0 Min 7 Max 40 Max 4 Max 75,000 Max 93 Count 681 Count 681 Count 681 Count 681
Upon review of Tables 2 and 3, it becomes clear that these descriptive statistics
can begin to tell us much about the data under review. Examples include job satisfaction
data, whereby a scale of 1 through 4 is employed for this single question. Responses to
this question of whether or not the respondent is satisfied with one’s position include
possible responses such as like it very much, like it fairly well, dislike it somewhat, and
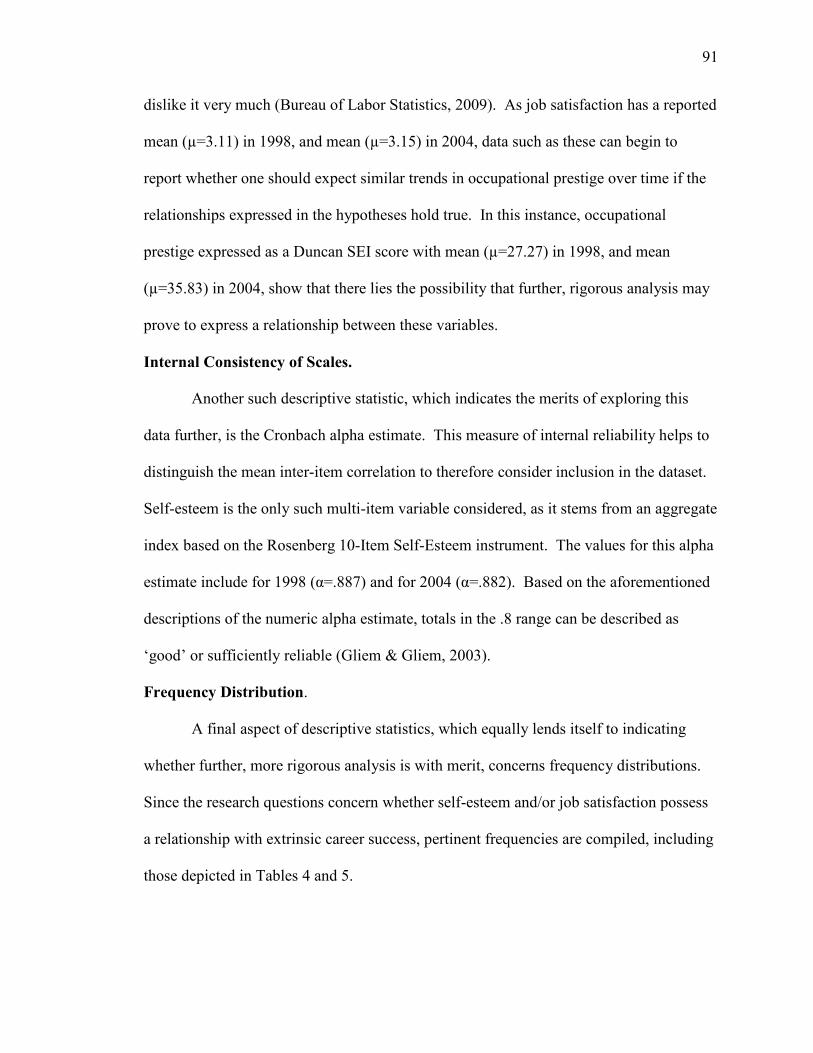
91
dislike it very much (Bureau of Labor Statistics, 2009). As job satisfaction has a reported
mean (µ=3.11) in 1998, and mean (µ=3.15) in 2004, data such as these can begin to
report whether one should expect similar trends in occupational prestige over time if the
relationships expressed in the hypotheses hold true. In this instance, occupational
prestige expressed as a Duncan SEI score with mean (µ=27.27) in 1998, and mean
(µ=35.83) in 2004, show that there lies the possibility that further, rigorous analysis may
prove to express a relationship between these variables.
Internal Consistency of Scales.
Another such descriptive statistic, which indicates the merits of exploring this
data further, is the Cronbach alpha estimate. This measure of internal reliability helps to
distinguish the mean inter-item correlation to therefore consider inclusion in the dataset.
Self-esteem is the only such multi-item variable considered, as it stems from an aggregate
index based on the Rosenberg 10-Item Self-Esteem instrument. The values for this alpha
estimate include for 1998 (α=.887) and for 2004 (α=.882). Based on the aforementioned
descriptions of the numeric alpha estimate, totals in the .8 range can be described as
‘good’ or sufficiently reliable (Gliem & Gliem, 2003).
Frequency Distribution.
A final aspect of descriptive statistics, which equally lends itself to indicating
whether further, more rigorous analysis is with merit, concerns frequency distributions.
Since the research questions concern whether self-esteem and/or job satisfaction possess
a relationship with extrinsic career success, pertinent frequencies are compiled, including
those depicted in Tables 4 and 5.
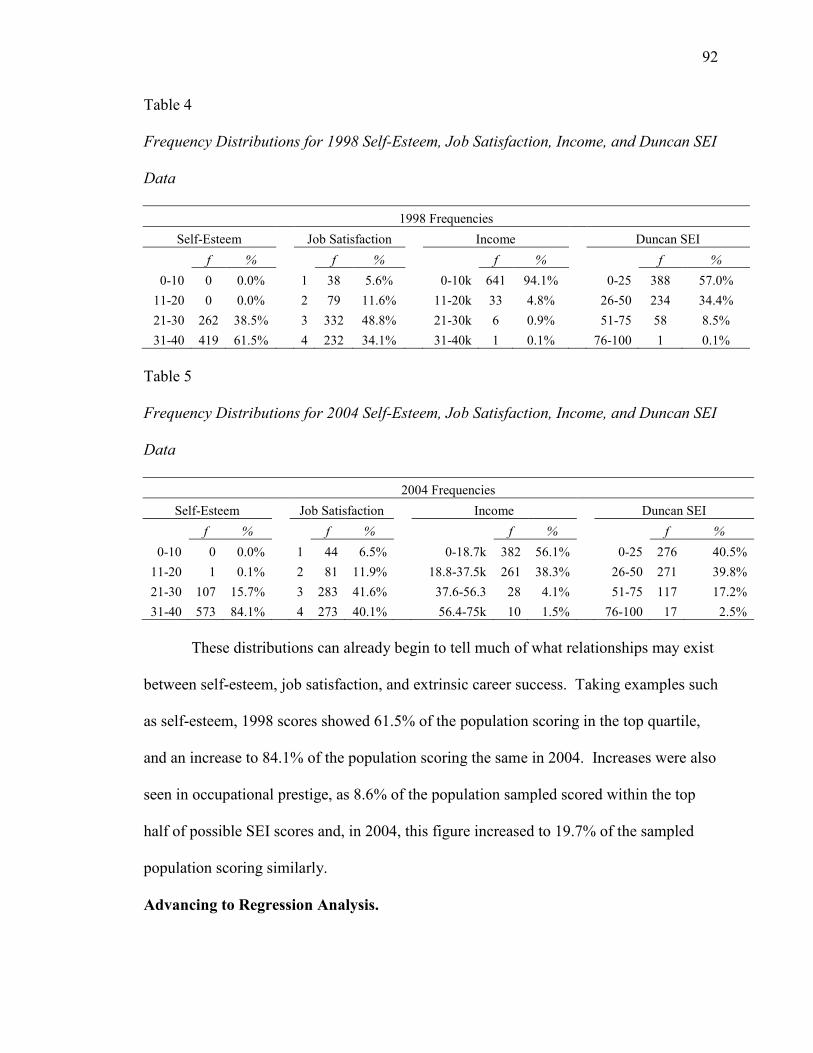
92
Table 4
Frequency Distributions for 1998 Self-Esteem, Job Satisfaction, Income, and Duncan SEI
Data
1998 Frequencies Self-Esteem Job Satisfaction Income Duncan SEI
f % f % f % f % 0-10 0 0.0% 1 38 5.6% 0-10k 641 94.1% 0-25 388 57.0%
11-20 0 0.0% 2 79 11.6% 11-20k 33 4.8% 26-50 234 34.4% 21-30 262 38.5% 3 332 48.8% 21-30k 6 0.9% 51-75 58 8.5% 31-40 419 61.5% 4 232 34.1% 31-40k 1 0.1% 76-100 1 0.1%
Table 5
Frequency Distributions for 2004 Self-Esteem, Job Satisfaction, Income, and Duncan SEI
Data
2004 Frequencies Self-Esteem Job Satisfaction Income Duncan SEI
f % f % f % f % 0-10 0 0.0% 1 44 6.5% 0-18.7k 382 56.1% 0-25 276 40.5%
11-20 1 0.1% 2 81 11.9% 18.8-37.5k 261 38.3% 26-50 271 39.8% 21-30 107 15.7% 3 283 41.6% 37.6-56.3 28 4.1% 51-75 117 17.2% 31-40 573 84.1% 4 273 40.1% 56.4-75k 10 1.5% 76-100 17 2.5%
These distributions can already begin to tell much of what relationships may exist
between self-esteem, job satisfaction, and extrinsic career success. Taking examples such
as self-esteem, 1998 scores showed 61.5% of the population scoring in the top quartile,
and an increase to 84.1% of the population scoring the same in 2004. Increases were also
seen in occupational prestige, as 8.6% of the population sampled scored within the top
half of possible SEI scores and, in 2004, this figure increased to 19.7% of the sampled
population scoring similarly.
Advancing to Regression Analysis.
93
Prior to performing additional statistical analysis, certain trends and groupings
already begin to become apparent. One such trend involves the distribution of clustered
self-esteem scores versus the distribution of job satisfaction scores. As these are both to
be considered independent variables in further analysis, care will be taken to ensure the
absence of multicollinearity where possible. Furthermore, as self-esteem continues to
increase over time, so did both income and occupational prestige as expressed in Duncan
SEI scores. While histograms alone only report the graphical relationship of value
clustering, this does indicate the potential for further meaningful analysis. Finally, steps
to control for education will be performed at the outset of analysis. Based on the above
descriptive statistics alone, it can be shown that a focus on these four variables can be
considered for pertinent research. This, as consistency at which subpopulations are
distributed among values, indicates a decreased likelihood of the involvement of such
intervening variables.
Regression Analysis
At the crux of answering the two research questions posed, there are four
hypotheses with pointed regression analyses prescribed for each. These are depicted in
Figure 7.
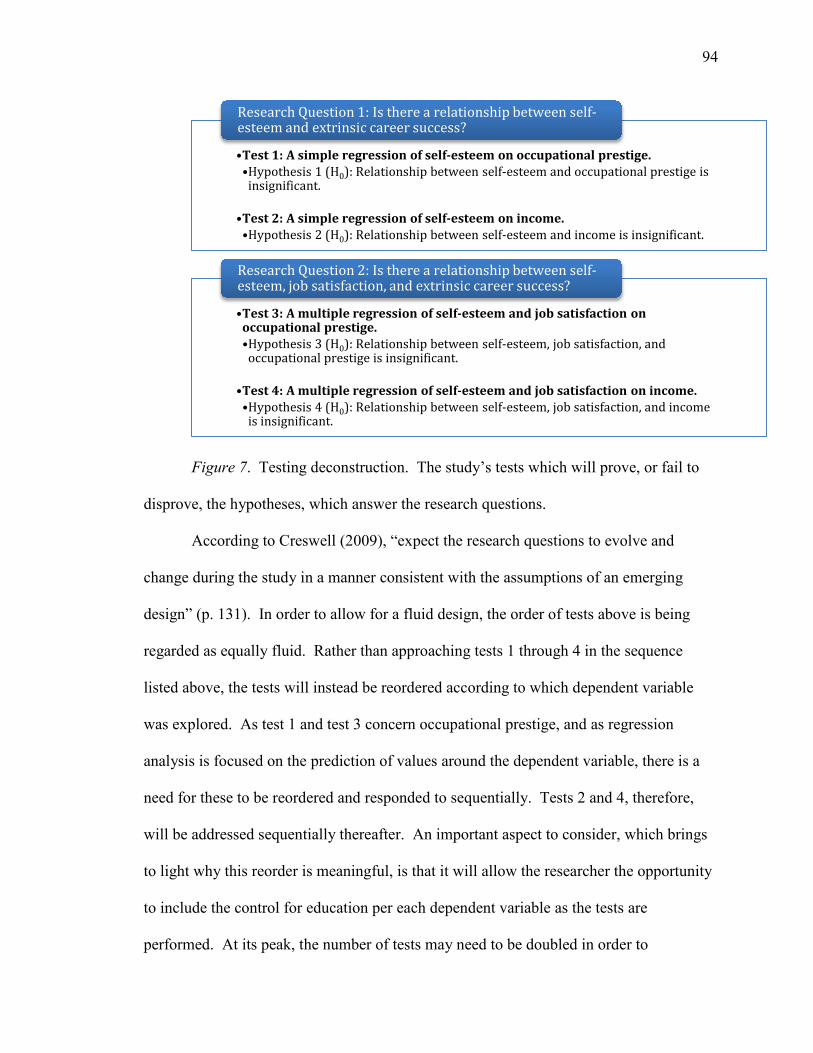
94
Figure 7. Testing deconstruction. The study’s tests which will prove, or fail to
disprove, the hypotheses, which answer the research questions.
According to Creswell (2009), “expect the research questions to evolve and
change during the study in a manner consistent with the assumptions of an emerging
design” (p. 131). In order to allow for a fluid design, the order of tests above is being
regarded as equally fluid. Rather than approaching tests 1 through 4 in the sequence
listed above, the tests will instead be reordered according to which dependent variable
was explored. As test 1 and test 3 concern occupational prestige, and as regression
analysis is focused on the prediction of values around the dependent variable, there is a
need for these to be reordered and responded to sequentially. Tests 2 and 4, therefore,
will be addressed sequentially thereafter. An important aspect to consider, which brings
to light why this reorder is meaningful, is that it will allow the researcher the opportunity
to include the control for education per each dependent variable as the tests are
performed. At its peak, the number of tests may need to be doubled in order to
•Test 1: A simple regression of self-esteem on occupational prestige. •Hypothesis 1 (H0): Relationship between self-esteem and occupational prestige is
insignificant. •Test 2: A simple regression of self-esteem on income. •Hypothesis 2 (H0): Relationship between self-esteem and income is insignificant.
Research Question 1: Is there a relationship between self-esteem and extrinsic career success?
•Test 3: A multiple regression of self-esteem and job satisfaction on occupational prestige. •Hypothesis 3 (H0): Relationship between self-esteem, job satisfaction, and
occupational prestige is insignificant. •Test 4: A multiple regression of self-esteem and job satisfaction on income. •Hypothesis 4 (H0): Relationship between self-esteem, job satisfaction, and income
is insignificant.
Research Question 2: Is there a relationship between self-esteem, job satisfaction, and extrinsic career success?
95
accommodate for the effects of this control on the data and its relationship to other
independent variables’ effect on the dependent variable.
Assumptions in Hypothesis Testing.
The first of these tests is Test 1, and it is a simple regression that takes self-esteem
and regresses on occupational prestige. This first test can be interpreted three ways based
on the data present alone. Are we to consider 1998 self-esteem and 1998 occupational
prestige? Are we to test 2004 self-esteem and 2004 occupational prestige? What about
1998 self-esteem and 2004 occupational prestige? Each derivation works to answer a
different question. If 1998 self-esteem was regressed on 1998 occupational prestige,
even in instances where a statistically significant relationship were expressed, this would
be at the expense of questions concerning whether this explains point-in-time values
only, and whether the direction of effect of the statistical relationship is an accurate one.
In the case of testing 2004 self-esteem regressed on 2004 occupational prestige, the same
holds true, as this would equally assess point-in-time values. Therefore, the two
guideposts synthesized from a review of the literature concerning which variables per
which time periods to use include the following:
1. In order to assess the predictive power of the independent variables as base
traits that have a future impact on the dependent variables, the dependent
variables must be based on a time period in the future.
2. As one’s career cannot be immediately impacted by either independent
variable, and instead must be affected over a longer period of time, changes to
income and occupational prestige cannot be assessed in the same time period
as the base trait and be expected to return immediate results.
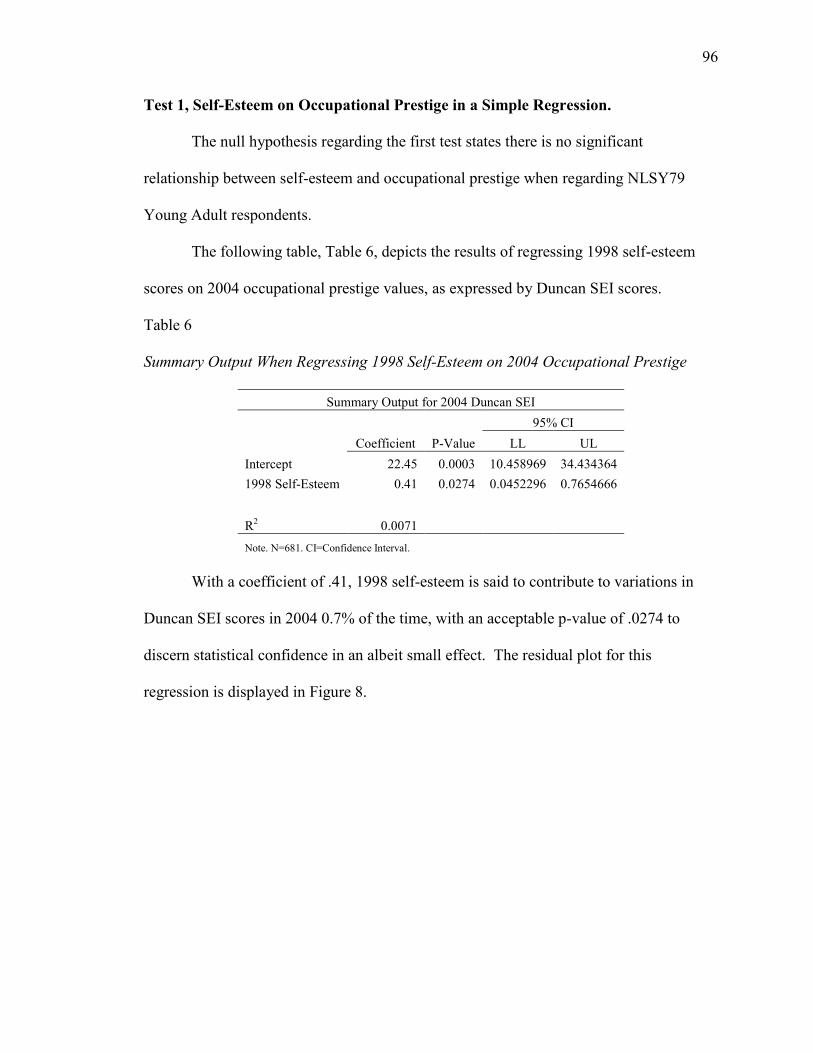
96
Test 1, Self-Esteem on Occupational Prestige in a Simple Regression.
The null hypothesis regarding the first test states there is no significant
relationship between self-esteem and occupational prestige when regarding NLSY79
Young Adult respondents.
The following table, Table 6, depicts the results of regressing 1998 self-esteem
scores on 2004 occupational prestige values, as expressed by Duncan SEI scores.
Table 6
Summary Output When Regressing 1998 Self-Esteem on 2004 Occupational Prestige
Summary Output for 2004 Duncan SEI 95% CI Coefficient P-Value LL UL Intercept 22.45 0.0003 10.458969 34.434364 1998 Self-Esteem 0.41 0.0274 0.0452296 0.7654666
R2 0.0071 Note. N=681. CI=Confidence Interval.
With a coefficient of .41, 1998 self-esteem is said to contribute to variations in
Duncan SEI scores in 2004 0.7% of the time, with an acceptable p-value of .0274 to
discern statistical confidence in an albeit small effect. The residual plot for this
regression is displayed in Figure 8.
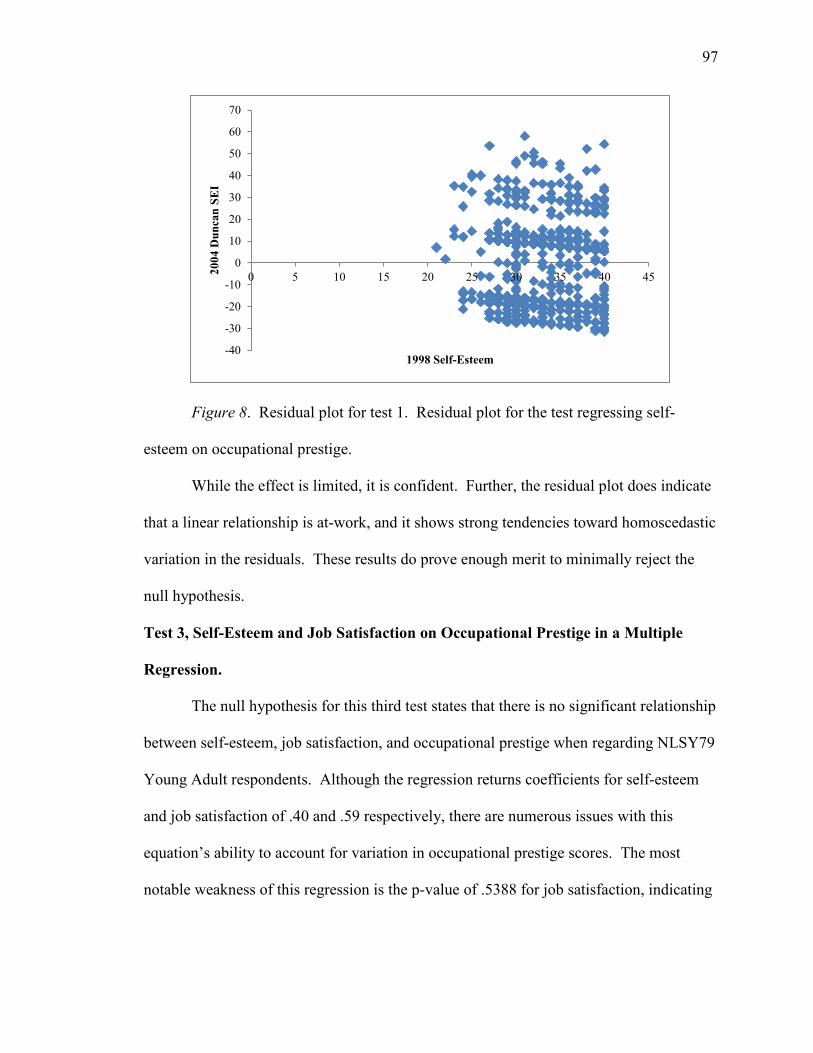
97
Figure 8. Residual plot for test 1. Residual plot for the test regressing self-
esteem on occupational prestige.
While the effect is limited, it is confident. Further, the residual plot does indicate
that a linear relationship is at-work, and it shows strong tendencies toward homoscedastic
variation in the residuals. These results do prove enough merit to minimally reject the
null hypothesis.
Test 3, Self-Esteem and Job Satisfaction on Occupational Prestige in a Multiple
Regression.
The null hypothesis for this third test states that there is no significant relationship
between self-esteem, job satisfaction, and occupational prestige when regarding NLSY79
Young Adult respondents. Although the regression returns coefficients for self-esteem
and job satisfaction of .40 and .59 respectively, there are numerous issues with this
equation’s ability to account for variation in occupational prestige scores. The most
notable weakness of this regression is the p-value of .5388 for job satisfaction, indicating
-40
-30
-20
-10
0
10
20
30
40
50
60
70
0 5 10 15 20 25 30 35 40 452004
Dun
can
SEI
1998 Self-Esteem
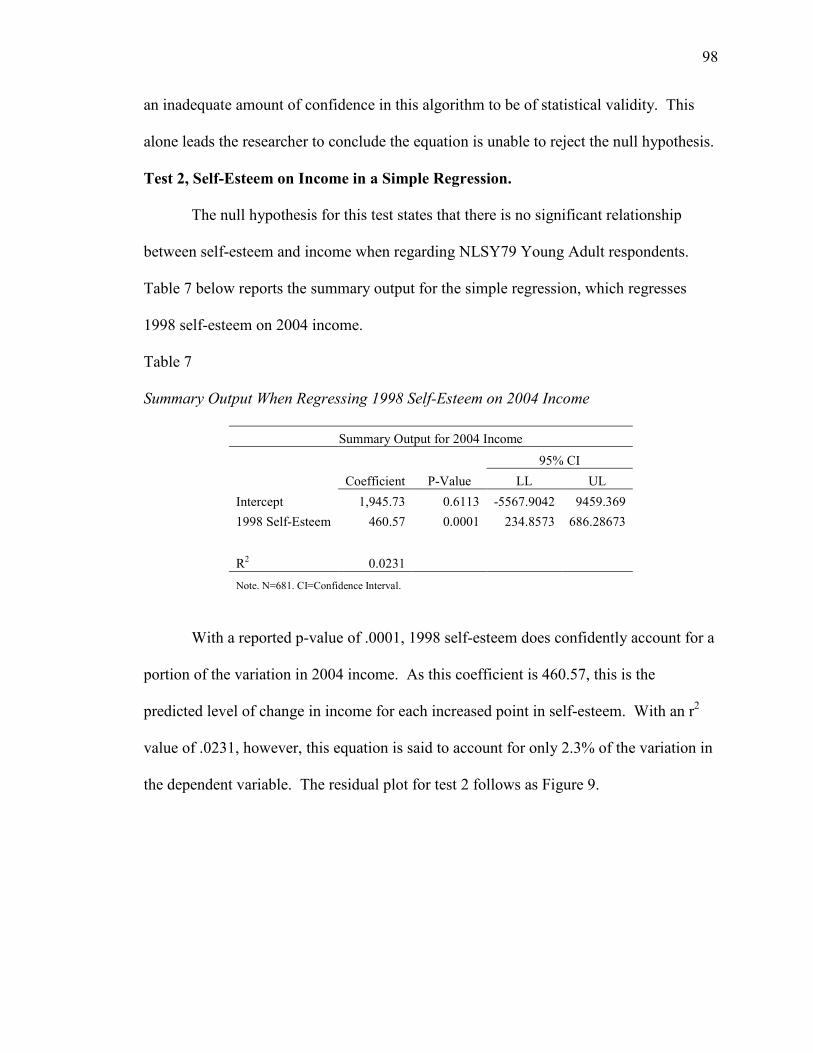
98
an inadequate amount of confidence in this algorithm to be of statistical validity. This
alone leads the researcher to conclude the equation is unable to reject the null hypothesis.
Test 2, Self-Esteem on Income in a Simple Regression.
The null hypothesis for this test states that there is no significant relationship
between self-esteem and income when regarding NLSY79 Young Adult respondents.
Table 7 below reports the summary output for the simple regression, which regresses
1998 self-esteem on 2004 income.
Table 7
Summary Output When Regressing 1998 Self-Esteem on 2004 Income
Summary Output for 2004 Income 95% CI Coefficient P-Value LL UL Intercept 1,945.73 0.6113 -5567.9042 9459.369 1998 Self-Esteem 460.57 0.0001 234.8573 686.28673
R2 0.0231 Note. N=681. CI=Confidence Interval.
With a reported p-value of .0001, 1998 self-esteem does confidently account for a
portion of the variation in 2004 income. As this coefficient is 460.57, this is the
predicted level of change in income for each increased point in self-esteem. With an r2
value of .0231, however, this equation is said to account for only 2.3% of the variation in
the dependent variable. The residual plot for test 2 follows as Figure 9.
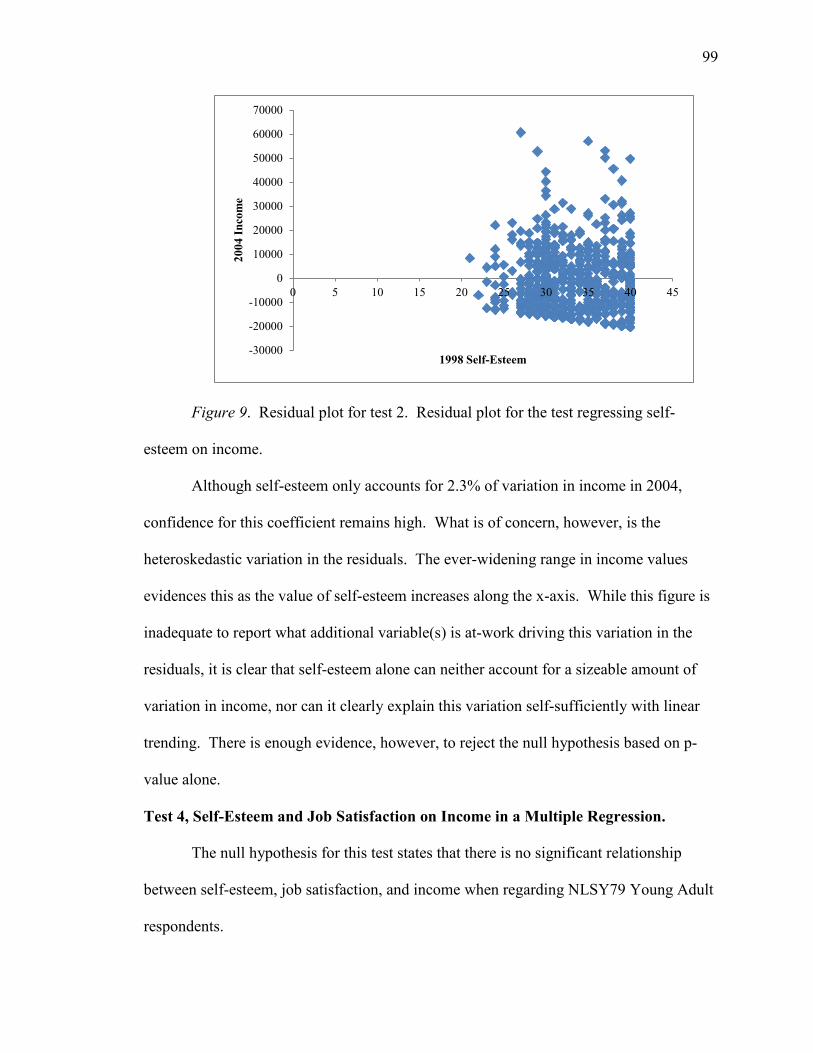
99
Figure 9. Residual plot for test 2. Residual plot for the test regressing self-
esteem on income.
Although self-esteem only accounts for 2.3% of variation in income in 2004,
confidence for this coefficient remains high. What is of concern, however, is the
heteroskedastic variation in the residuals. The ever-widening range in income values
evidences this as the value of self-esteem increases along the x-axis. While this figure is
inadequate to report what additional variable(s) is at-work driving this variation in the
residuals, it is clear that self-esteem alone can neither account for a sizeable amount of
variation in income, nor can it clearly explain this variation self-sufficiently with linear
trending. There is enough evidence, however, to reject the null hypothesis based on p-
value alone.
Test 4, Self-Esteem and Job Satisfaction on Income in a Multiple Regression.
The null hypothesis for this test states that there is no significant relationship
between self-esteem, job satisfaction, and income when regarding NLSY79 Young Adult
respondents.
-30000
-20000
-10000
0
10000
20000
30000
40000
50000
60000
70000
0 5 10 15 20 25 30 35 40 45
2004
Inco
me
1998 Self-Esteem
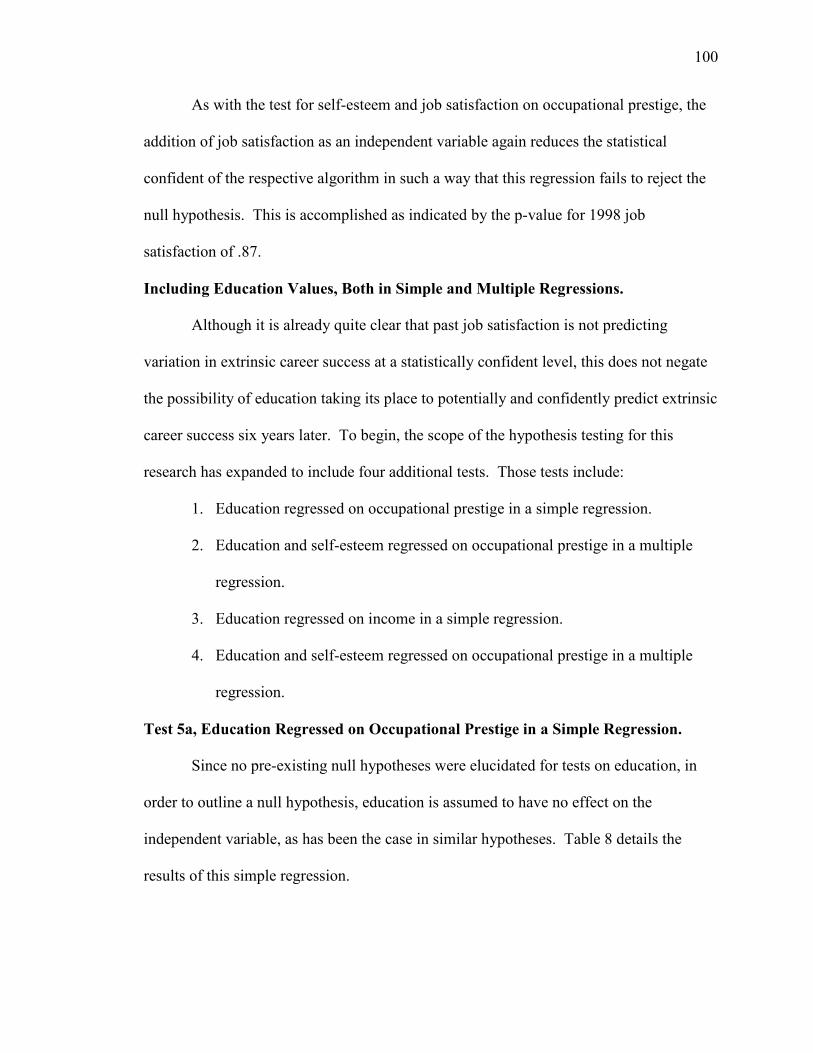
100
As with the test for self-esteem and job satisfaction on occupational prestige, the
addition of job satisfaction as an independent variable again reduces the statistical
confident of the respective algorithm in such a way that this regression fails to reject the
null hypothesis. This is accomplished as indicated by the p-value for 1998 job
satisfaction of .87.
Including Education Values, Both in Simple and Multiple Regressions.
Although it is already quite clear that past job satisfaction is not predicting
variation in extrinsic career success at a statistically confident level, this does not negate
the possibility of education taking its place to potentially and confidently predict extrinsic
career success six years later. To begin, the scope of the hypothesis testing for this
research has expanded to include four additional tests. Those tests include:
1. Education regressed on occupational prestige in a simple regression.
2. Education and self-esteem regressed on occupational prestige in a multiple
regression.
3. Education regressed on income in a simple regression.
4. Education and self-esteem regressed on occupational prestige in a multiple
regression.
Test 5a, Education Regressed on Occupational Prestige in a Simple Regression.
Since no pre-existing null hypotheses were elucidated for tests on education, in
order to outline a null hypothesis, education is assumed to have no effect on the
independent variable, as has been the case in similar hypotheses. Table 8 details the
results of this simple regression.
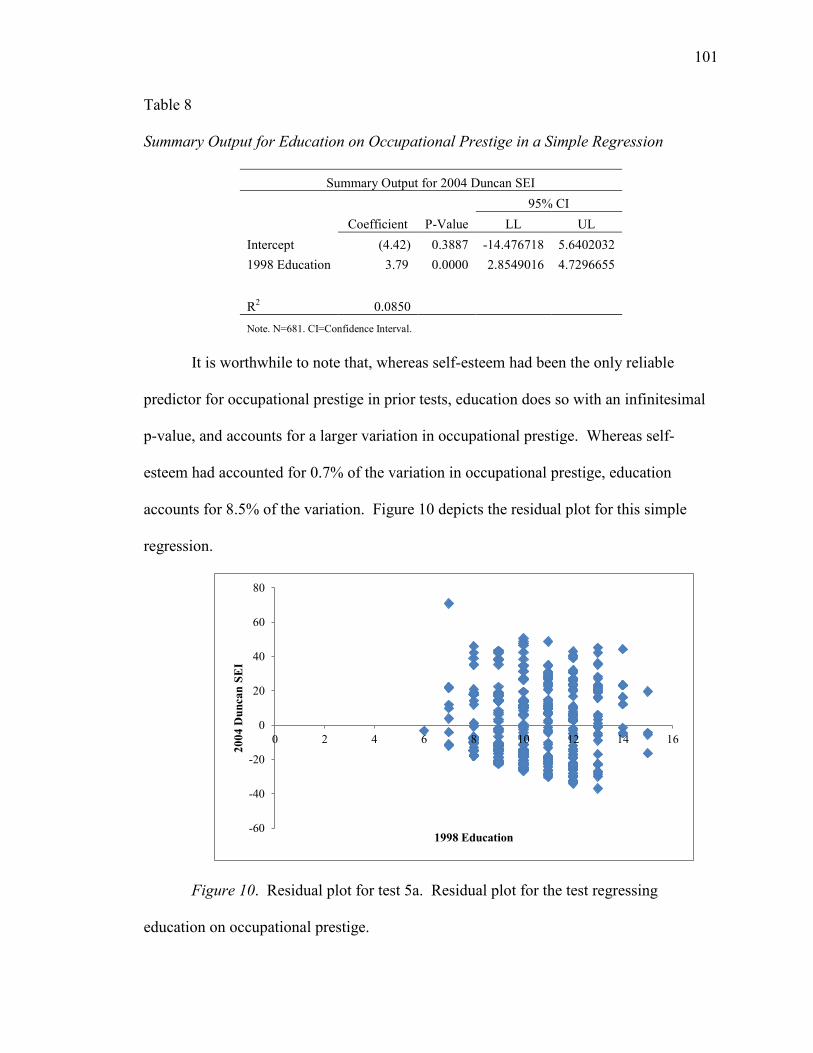
101
Table 8
Summary Output for Education on Occupational Prestige in a Simple Regression
Summary Output for 2004 Duncan SEI 95% CI Coefficient P-Value LL UL Intercept (4.42) 0.3887 -14.476718 5.6402032 1998 Education 3.79 0.0000 2.8549016 4.7296655
R2 0.0850 Note. N=681. CI=Confidence Interval.
It is worthwhile to note that, whereas self-esteem had been the only reliable
predictor for occupational prestige in prior tests, education does so with an infinitesimal
p-value, and accounts for a larger variation in occupational prestige. Whereas self-
esteem had accounted for 0.7% of the variation in occupational prestige, education
accounts for 8.5% of the variation. Figure 10 depicts the residual plot for this simple
regression.
Figure 10. Residual plot for test 5a. Residual plot for the test regressing
education on occupational prestige.
-60
-40
-20
0
20
40
60
80
0 2 4 6 8 10 12 14 16
2004
Dun
can
SEI
1998 Education
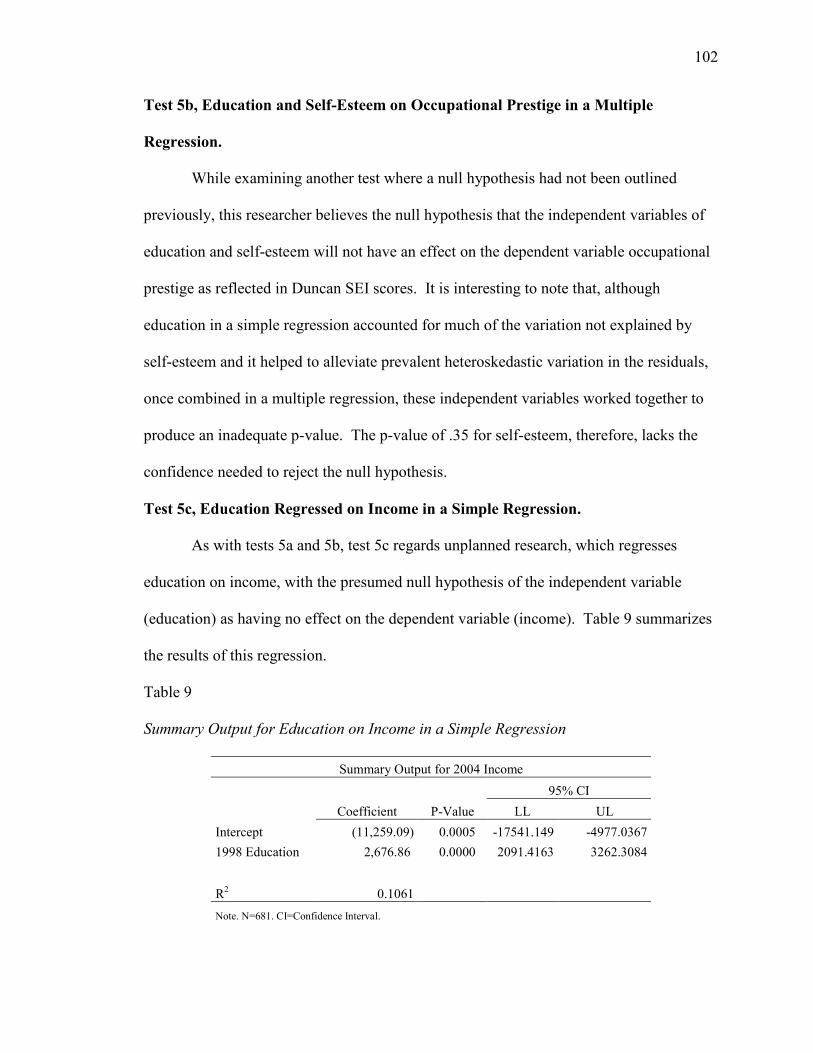
102
Test 5b, Education and Self-Esteem on Occupational Prestige in a Multiple
Regression.
While examining another test where a null hypothesis had not been outlined
previously, this researcher believes the null hypothesis that the independent variables of
education and self-esteem will not have an effect on the dependent variable occupational
prestige as reflected in Duncan SEI scores. It is interesting to note that, although
education in a simple regression accounted for much of the variation not explained by
self-esteem and it helped to alleviate prevalent heteroskedastic variation in the residuals,
once combined in a multiple regression, these independent variables worked together to
produce an inadequate p-value. The p-value of .35 for self-esteem, therefore, lacks the
confidence needed to reject the null hypothesis.
Test 5c, Education Regressed on Income in a Simple Regression.
As with tests 5a and 5b, test 5c regards unplanned research, which regresses
education on income, with the presumed null hypothesis of the independent variable
(education) as having no effect on the dependent variable (income). Table 9 summarizes
the results of this regression.
Table 9
Summary Output for Education on Income in a Simple Regression
Summary Output for 2004 Income 95% CI Coefficient P-Value LL UL Intercept (11,259.09) 0.0005 -17541.149 -4977.0367 1998 Education 2,676.86 0.0000 2091.4163 3262.3084
R2 0.1061 Note. N=681. CI=Confidence Interval.
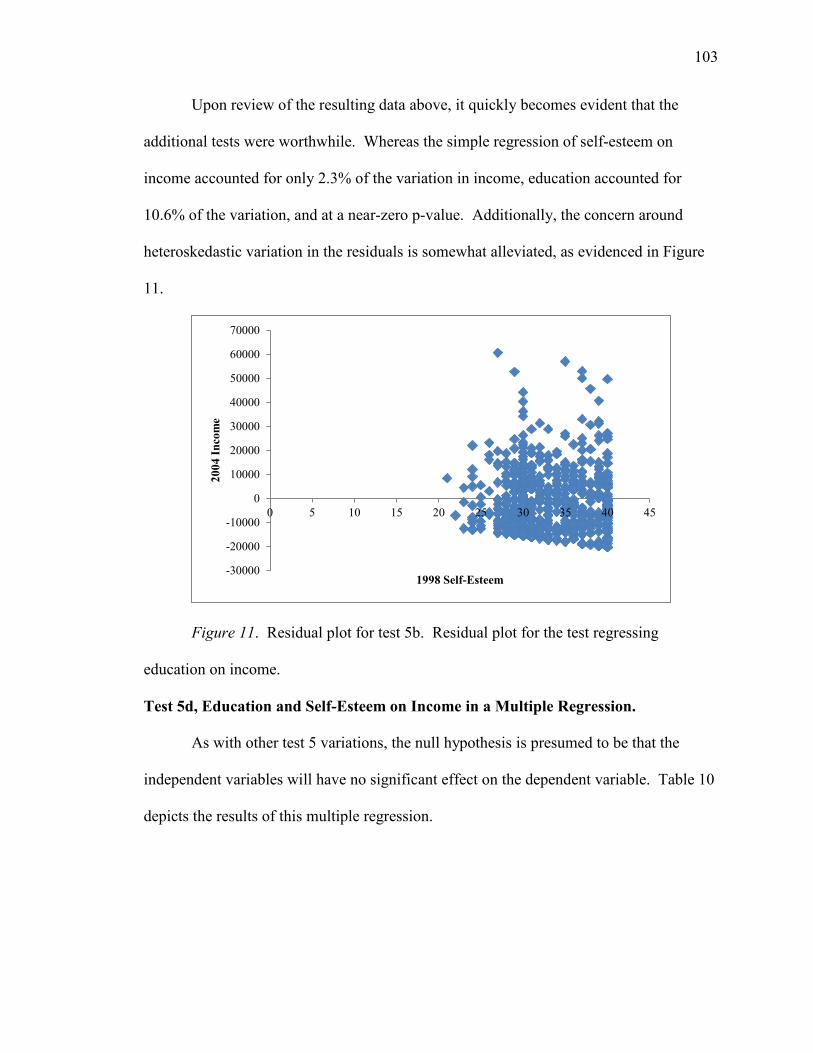
103
Upon review of the resulting data above, it quickly becomes evident that the
additional tests were worthwhile. Whereas the simple regression of self-esteem on
income accounted for only 2.3% of the variation in income, education accounted for
10.6% of the variation, and at a near-zero p-value. Additionally, the concern around
heteroskedastic variation in the residuals is somewhat alleviated, as evidenced in Figure
11.
Figure 11. Residual plot for test 5b. Residual plot for the test regressing
education on income.
Test 5d, Education and Self-Esteem on Income in a Multiple Regression.
As with other test 5 variations, the null hypothesis is presumed to be that the
independent variables will have no significant effect on the dependent variable. Table 10
depicts the results of this multiple regression.
-30000
-20000
-10000
0
10000
20000
30000
40000
50000
60000
70000
0 5 10 15 20 25 30 35 40 45
2004
Inco
me
1998 Self-Esteem
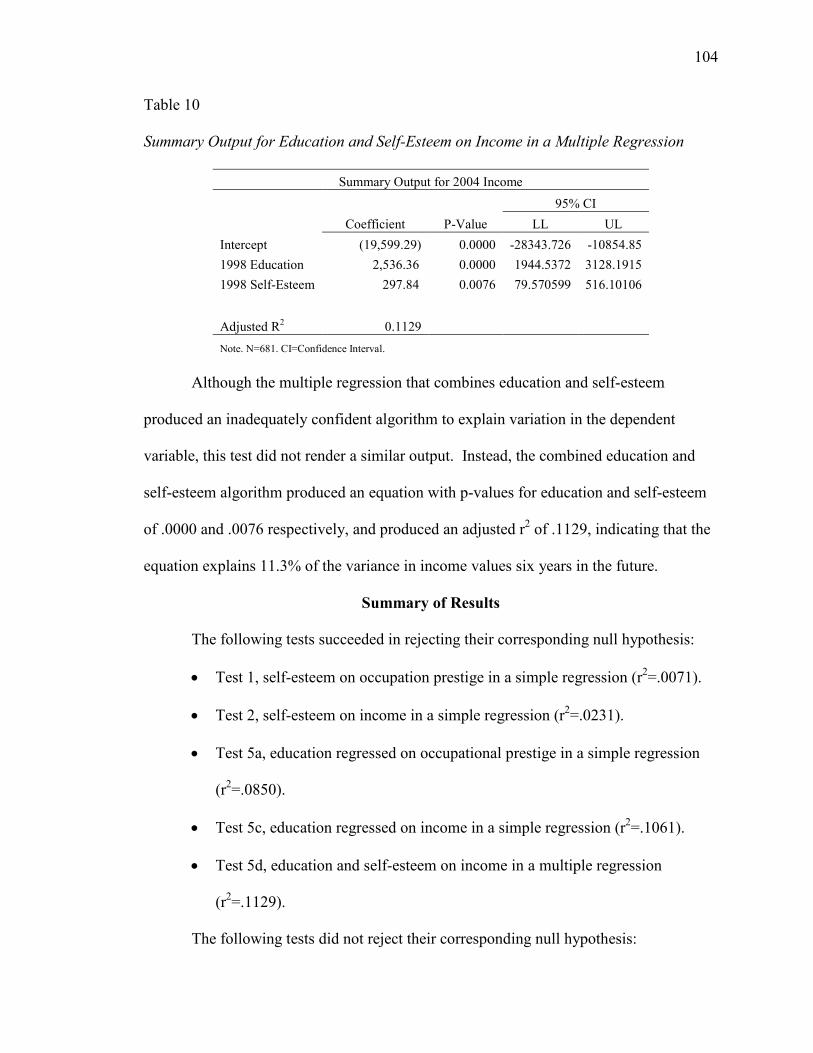
104
Table 10
Summary Output for Education and Self-Esteem on Income in a Multiple Regression
Summary Output for 2004 Income 95% CI Coefficient P-Value LL UL Intercept (19,599.29) 0.0000 -28343.726 -10854.85 1998 Education 2,536.36 0.0000 1944.5372 3128.1915 1998 Self-Esteem 297.84 0.0076 79.570599 516.10106
Adjusted R2 0.1129 Note. N=681. CI=Confidence Interval.
Although the multiple regression that combines education and self-esteem
produced an inadequately confident algorithm to explain variation in the dependent
variable, this test did not render a similar output. Instead, the combined education and
self-esteem algorithm produced an equation with p-values for education and self-esteem
of .0000 and .0076 respectively, and produced an adjusted r2 of .1129, indicating that the
equation explains 11.3% of the variance in income values six years in the future.
Summary of Results
The following tests succeeded in rejecting their corresponding null hypothesis:
• Test 1, self-esteem on occupation prestige in a simple regression (r2=.0071).
• Test 2, self-esteem on income in a simple regression (r2=.0231).
• Test 5a, education regressed on occupational prestige in a simple regression
(r2=.0850).
• Test 5c, education regressed on income in a simple regression (r2=.1061).
• Test 5d, education and self-esteem on income in a multiple regression
(r2=.1129).
The following tests did not reject their corresponding null hypothesis:
105
• Test 3, self-esteem and job satisfaction on occupational prestige in a multiple
regression (p>.05).
• Test 4, self-esteem and job satisfaction on income in a multiple regression
(p>.05).
• Test 5b, education and self-esteem on occupational prestige in a multiple regression (p>.05).
106
CHAPTER FIVE: DISCUSSION, CONCLUSIONS, AND RECOMMENDATIONS
Tantamount to an efficacious research process, is the preservation of parsimony.
This is also referred to among Physics scholars as being of an ‘elegant’ design or one that
exhibits no more effort or answer than is necessary. The current process is centered on
parsimony. What began by asking the fundamental questions about how the research
around self-esteem, job satisfaction, and extrinsic career success could come together, it
was invariably determined that greater specificity was needed. The purpose was later
elucidated so as to test the theory of self-esteem and extrinsic career success, which
relates self-esteem to occupational prestige and income, controlling for education, among
respondents of the Bureau of Labor Statistics' National Longitudinal Survey of Youth.
The research questions then asked whether self-esteem, and later self-esteem and
job satisfaction in combination, affected extrinsic career success. Longitudinal data over
a six-year span was collected, while employing inclusion criteria, which resulted in the
‘elegant’ review of only 681 survey respondents with education, self-esteem, and job
satisfaction data in 1998, and extrinsic career success data in 2004. These respondents
provided representation of the NLSY79 Young Adult respondent population with
statistical confidence when responding to the research questions.
Discussion of Results
The data depicted trends, which not only affect how this theory of self-esteem and
extrinsic career success is regarded when viewing this population, but also equally affects
how the theory’s variables and the individual impact of each are described. As indicants
for what occurred, three core themes emerged as precursors to that discussion. Education
was found to carry a far greater significance than merely acting as a variable in control
107
over the statistics alone. This was the case, as education explained four times the
variance self-esteem did, making it a better predictor of career success. Education and
self-esteem were also found to be complimentary, while education added predictive
power in addition to self-esteem. This occurred without tangible signs of
multicollinearity in the resulting algorithm. Finally, job satisfaction was found not to be
a predictor of extrinsic career success, as this variable failed to add to any regression's
predictive power of extrinsic career success with statistical confidence based on p-value
(p > .05).
Education is Not Merely a Control.
Throughout the literature review, and in the Kammeyer-Mueller et al. (2007)
study, education was regarded as something to control for in the statistics. Thus, the
originally planned, four hypothesis tests to answer the two research questions concerned
self-esteem and job satisfaction, while merely controlling for education. Yet, what has
become clear is the emergent role of education and its impact on the dependent variables.
In instances where self-esteem explained 2.3% of the variance in income six years later,
education accounted for 10.6%. Where self-esteem explained 0.7% of the variation in
occupational prestige six years in the future, education explained 8.5%.
Education and Self-esteem as Predominantly Complimentary
While the multiple regression, which regressed education and self-esteem on
occupational prestige and was unsuccessful, education and self-esteem on income did
indeed generate confident coefficients. No evidence was present of the two variables
exhibiting multicollinearity when regressed on occupational prestige or income, yet these
variables only contributed to predictions of income. As this combination did account for
108
11.3% of the variance in income, it is clear that their combined predictive power is with
merit.
Job Satisfaction Not a Predictor of Extrinsic Career Success.
Upon review of over 11,000 records as contained in the NLSY79 Young Adult
dataset, there was an abundance of available response data to use for analysis.
Significant time was spent isolating only those records which had existent values for all
variables in all time periods covered, and could accurately reflect values for education,
self-esteem, job satisfaction, income, and occupational prestige in unison across years
1998 and 2004. These combined records, which excluded all null, missing, and refused
values, brought 11,000 records to 681. Of those complete data, a confident trend for job
satisfaction’s effect on extrinsic career success did not emerge in the dataset.
Whether regarding job satisfaction in a multiple regression in order to explain
variance in income or occupational prestige, insufficient p-values were reached and those
algorithms possessed no predictive power. While other datasets may depict significant
trend when examining the relationship between self-esteem and extrinsic career success
among NLSY79 Young Adult respondents, job satisfaction played no role in adding
predictive power to any variations of the multiple regressions used to explore this
relationship.
With job satisfaction excluded as an independent variable of interest, it is instead
the relationships between education, self-esteem, and extrinsic career success that remain
germane for consideration.
109
Results Pertaining to Research Question 1.
The first research question was inspired by the work done by Kammeyer-Mueller,
Judge, & Piccolo, published in 2007. They provided proof for a dynamic model
depicting the relationship between self-esteem and extrinsic career success for Baby
Boomers who responded to the NLSY79 as commissioned by the Bureau of Labor
Statistics. Therefore, the first research question for this research was:
1. Is there a relationship between self-esteem and extrinsic career success among
respondents?
Taking data from the NLSY79 Young Adult, this research uses data collected
from respondents born into Generation X to see whether or not the previously established
relationship exists in a new population. To do so, two tests were performed. The first
test, test 1, regressed self-esteem on occupational prestige in a simple regression. With
an r2 of .7%, and a p-value of .0274 for the coefficient, this relationship exists with
statistical confidence. As reviewed in an aforementioned summary, the residual plot for
this simple regression also indicated homoscedastic variation in the residuals. This
indicates that, not only can this variable be considered by itself as having an effect on
occupational prestige, it is likely to be strongly linear as well. Furthermore, with a
coefficient of .41, and lower and upper limits at 95% of .045 and .765 respectively, an
individual’s self-esteem in 1998 can impact his/her occupational prestige value six years
later by just less than half a point for every point increase in self-esteem. Thus, what can
be seen is, not only is there a linear relationship between self-esteem and occupational
prestige, not only can self-esteem be a confident predictor for a portion of the variation in
occupational prestige six years later, but it equally allows for the answer to this research
110
question to be in the affirmative. That is to say that a relationship does exist between
self-esteem and extrinsic career success where occupational prestige is concerned.
Additional to test 1 was test 2, which regressed self-esteem on income across the
same date span. Upon regressing 1998 self-esteem scores on 2004 income values, this
algorithm produced an r2 score of 2.3%. Additionally, with a p-value of .0001, self-
esteem’s coefficient registered as 460.57. This is to say that with every point increase in
self-esteem in 1998, annual income increased by approximately $461 six years later.
With a confidence level registering a p-value of .01%, this other half of the research
question can be confirmed to say that self-esteem also exhibits a relationship with
extrinsic career success in its impact on income. Thus, the first research question is
answered in the affirmative in its entirety. That is to say that a relationship between self-
esteem and extrinsic career success among NLSY79 Young Adult respondents does exist.
For every point increase in self-esteem in the year, occupational prestige increases by .4
and income by approximately $461, both six years in the future.
Results Pertaining to Research Question 2.
Early in this research, one justification was provided that regarded a lack of
understanding as to the motivational factors that beget further inquiry about whether or
not elevating job satisfaction alone was sufficient to ensure organizational loyalty. The
research has also shown a tendency for Generation X workers to migrate between
organizations ‘with alacrity’. To begin to answer whether the two research focal points
of self-esteem and job satisfaction could merge, the second research question was
formed:
111
2. Is there a relationship between self-esteem, job satisfaction, and extrinsic
career success among respondents?
Tests 3 and 4 were performed to answer this very question. Both were multiple
regressions, where the first was a multiple regression of self-esteem and job satisfaction
on occupational prestige. The second test, test 4, was a multiple regression of self-esteem
and job satisfaction on income. Test 3, that of self-esteem and job satisfaction on
occupational prestige, failed to deliver reliable results. With a p-value of .5388, the job
satisfaction coefficient could never be confidently introduced into the algorithm. Test 4
was equally a failure, as the p-value for job satisfaction was .87 when regressing self-
esteem and job satisfaction on income. Therefore, test 4, as in test 3, was unsuccessful at
integrating a job satisfaction coefficient into the algorithm.
These tests failed to reject the null hypotheses that said there was no effect of self-
esteem and job satisfaction in combination when in relation to extrinsic career success.
While only applicable for the 681 respondents of the NLSY79 Young Adult, this
indicates a greatly decreased likelihood that job satisfaction can be regarded as a
predictor for long-term extrinsic career success. So, while self-esteem in simple
regressions can reliably impact income and occupational prestige six years in the future,
job satisfaction as a coefficient failed to express similar characteristics. Thus, the first
research question of whether a relationship exists between self-esteem and extrinsic
career success was answered in the affirmative. The second research question of self-
esteem and job satisfaction’s relationship with extrinsic career success was not.
112
Results Pertaining to Education’s Necessary Emphasis.
As mentioned in prior chapters, a research design must be tailored in a way that
allows for the at-times necessary ability to sense and adjust as patterns in the data
emerge. This was the case with education as a control. The theory of self-esteem and
extrinsic career success holds that there exists a relationship between self-esteem and
extrinsic career success when controlling for education. During the course of the analysis
above, it became clear that education provided much more than this. Rather than being a
factor with which to exercise control to report the net effect of self-esteem on the aspects
of extrinsic career success, education delivered far more pervasive predictive powers
when discussing both of the two aspects of extrinsic career success. As a result, four new
tests were performed. Tests were performed to regress education on income and on
occupational prestige. Tests were also performed to regress education and now proven
self-esteem in combination on income and on occupational prestige.
The two most successful tests were 5a and 5d, if by successful the criteria are
those tests which created the greatest predictive power per aspect of extrinsic career
success. Test 5a regressed education on occupational prestige in a simple regression.
The multiple regression form of this algorithm, which was to include self-esteem, did not
prove worthwhile, as the p-value for this algorithm failed to reach the minimum
confidence level for the self-esteem coefficient (p-value = .35). The simple regression,
however, produced an r2 of .085, predicting 8.5% of the variation in occupational prestige
six years later. With a coefficient of 3.79, it can be shown that, for every additional year
of completed education in 1998, it contributed an additional 3.79 points to a respondent’s
occupational prestige score in 2004.
113
Test 5d was equally successful in increasing the predictive power of 1998 data to
2004 outcome. Although a simple regression of education on income produced an
algorithm, which accounted for 10.6% of the variance in income in 2004, the multiple
regression to include self-esteem delivered a statistically confident adjusted r2 value of
.1129. This accounts for 11.3% of the variation in income in 2004, and it does so with
the highest p-value being .0076 between the two variables. There are two initial
conclusions that can be drawn from this. They include the statistical inability to account
for income using education alone for best fit and certainly not doing so based on self-
esteem alone.
Instead, the most pragmatic use of data appears instead to be to predict
occupational prestige using education data of six years past, while combining education
and self-esteem data instead to predict income six years in the future. Yet, prior to
reaching final implications with this data, the following are recommendations for further
research.
Recommendations for Further Research
Even at their most efficient states, the multiple regressions discussed above
account for less than 12% of the variance in extrinsic career success six years in the
future. Additional research to identify further predictors of this success from similar
longitudinal data would be advantageous for identifying a solution with which to predict
career path. Additionally, this research focuses on respondents of the NLSY79 Young
Adult survey. When answering questions regarding Generation X, further research can
be broadened to include a larger, more representative sample of this generation in order
to draw inference on the whole. Finally, while research in this area has been done on
114
NLSY79 respondent data, and now the NLSY79 Young Adult respondent data, there also
exists the NLSY97 data, which pertains to respondents otherwise classified as Generation
Y by birth. This could lead to inter-generational research where implications across
generations can be made with proper sampling and statistical analysis.
Conclusions in Relation to Modern Thinking
During the initial review of the literature, it was posited that succession planning
via the establishment of a Leadership Pipeline should drive the efforts of all who
contribute to an organization’s development. Yet, this can occur only after each level is
populated with those individuals who either feel befitting of that role, or who feel they
are on their way to a befitting role as potentially evidenced by the corollary relationship
between self-esteem and extrinsic career success over time. The evidence to support this
relationship is now in existence.
Evidence now exists of the relationship between self-esteem and extrinsic career
success among NLSY79 Young Adult respondents. Evidence also exists now of the
relationship between education and extrinsic career success among NLSY79 Young
Adult respondents. This research has elucidated a relationship between aspects of
personality and the stability of career paths, thus exhibiting the potential side effect of
compromises to organizational profitability when not in alignment. This impact is driven
by one’s self-esteem, and maintains a relationship with one’s income and one’s
occupational prestige. With every year of formal education completed, a person is likely
to earn an additional $2,700 per year, six years into the future. With every year of formal
education complete, an NLSY79 Young Adult respondent’s Duncan SEI score increased
by 3.79 points six years in the future. Self-esteem accounted for an additional $300 per
115
year when coupled with education and an additional $460 gross effect on income over the
same period. Job satisfaction, while perhaps otherwise meaningful, rendered no impact
and expressed no relationship to extrinsic career success among NLSY79 Young Adult
respondents.
Organizations are at a crossroads since they are in the midst of a shift in
leadership from members of the Baby Boomer population to members of Generation X.
The respondents of the NLSY79 cannot tell us all we need to know about Gen-X, but
they can provide us with a glimpse into the attitudes of members of this generation, while
serving to pilot for larger studies inclusive of a representative sample of Generation X
members.
The literature has shown a tendency for this up-and-coming generation to be
incentivized by merit, driven by individualism, while embracing a matrix organization
that puts ceremony aside and concentrates on action. The respondents of the NLSY79
Young Adult are guided by self-evaluation, and they exhibit heightened income and
prestige when self-esteem and education are heightened. The impact of education over
the impact of self-esteem speaks to the emphasis on individual merit, and organizations
of today would benefit from a keen focus on the Five Minds of the Future. While acting
on the research of Mintzberg and others in creating organizations that respond to shifting
environments, and acting on the research of Schein while creating organizations that
exhibit boundaryless operation, respondents of the NLSY79 Young Adult can find
themselves welcome among peers. This welcomed reception is not based on new hire
orientations, which present reams of training material and countless presentations from
numerous department heads. Instead, these are orientations where employees have had
116
self-perception assessed prior to hire, and they are put into roles befitting self and
organization-aligned expectations. They are given endless opportunities to move
forward, to find true passion, and to expand current skillset at a pace set by each one
individually, while serving a responsive and open organization. When Gen-X entered the
workforce, companies were blindsided. Employers never expected Xers to behave
differently from Baby Boomers or that they would have their own unique expectations
about the workplace (Lancaster & Stillman, 2010). The research detailed herein of the
NLSY79 Young Adult Respondents, contributes to the literature by serving as a pilot on
which to base a larger study of the theory of self-esteem and extrinsic career success, and
its impact on a representative sample of the Generation X population.
117
REFERENCES
Abadzi, H. (1984). Ability grouping effects on academic achievement and self-esteem in
a southwestern school district. Journal of Educational Research, 77(5), 287.
Retrieved from Psychology and Behavioral Sciences Collection database.
Abadzi, H. (1985). Ability grouping effects on academic achievement and self-esteem:
Who performs in the long run as expected. Journal of Educational Research,
79(1), Retrieved from Academic Search Elite database.
Abele, A., & Spurk, D. (2009). How do objective and subjective career success
interrelate over time?. Journal of Occupational & Organizational Psychology,
82(4), 803-824. Retrieved from Psychology and Behavioral Sciences Collection
database.
Abele, A., & Wiese, B. (2008). The nomological network of self-management strategies
and career success. Journal of Occupational & Organizational Psychology, 81(4),
733-749. Retrieved from Psychology and Behavioral Sciences Collection
database.
Alves-Martins, M., Peixoto, F., Gouveia-Pereira, M., Amaral, V., & Pedro, I. (2002).
Self-esteem and academic achievement among adolescents. Educational
Psychology, 22(1), 51-62. doi:10.1080/01443410120101242.
Anding, J. (2009). Opting in: The experiences, pathways, and meaning of successful,
professional, Generation X women making intentional career transitions. Ph.D.
dissertation, Fielding Graduate University, United States -- California. Retrieved
November 4, 2010, from Dissertations & Theses: Full Text.(Publication No. AAT
3357406).
118
Arthur, M.B., Khapova, S.N., & Wilderom, C.P. (2005). Career success in a boundaryless
career world. Journal of Organizational Behavior, 26(2), 177-202. Retrieved
November 7, 2010, from ABI/INFORM Global. (Document ID: 792935081).
Ballout, H.I. (2007). Career success: The effects of human capital, person-environment
fit and organizational support. Journal of Managerial Psychology, 22(8), 741-
765. Retrieved November 7, 2010, from ABI/INFORM Global. (Document
ID: 1380999171).
Ballout, H.I. (2008). Work-family conflict and career success: the effects of domain-
specific determinants. The Journal of Management Development, 27(5), 437-466.
Retrieved November 7, 2010, from ABI/INFORM Global. (Document
ID: 1487910201).
Baoshan, Z., Jun-Yan, Z., & Guoliang, Y. (2009). The influence of concealing academic
achievement on the self-esteem of adolescents with low achievement. Social
Behavior & Personality: An International Journal, 37(6), 805-810. Retrieved
from SPORTDiscus with Full Text database.
Beckett, B. (2010). Mentorship is key to career success. Strategic Finance, 92(4), 21-22.
Retrieved November 7, 2010, from ABI/INFORM Global. (Document
ID: 2163915891).
Belden, S. (2009). Constructing career scripts: How members of Generation X make
sense of their careers in business. Ed.D. dissertation, Harvard University, United
States -- Massachusetts. Retrieved November 4, 2010, from Dissertations &
Theses: Full Text.(Publication No. AAT 3385007).
119
Bergh, A., & Fink, G. (2008). Higher education policy, enrollment, and income
inequality. Social Science Quarterly (Blackwell Publishing Limited), 89(1), 217-
235. doi:10.1111/j.1540-6237.2008.00529.x.
Beutell, N. & Wittig-Berman, U. (2008). Work-family conflict and work-family synergy
for generation X, baby boomers, and matures: Generational differences,
predictors, and satisfaction outcomes. Journal of Managerial Psychology, 23(5),
507-523. doi:10.1108/02683940810884513.
Blake, D. (2009). Creating generationally specific engagement strategies based on need
satisfaction. Ph.D. dissertation, Capella University, United States -- Minnesota.
Retrieved November 4, 2010, from Dissertations & Theses: Full Text.(Publication
No. AAT 3360065).
Bolton, S. (2009). Career motivation theory: Generational differences and their impact
on organizations. Ph.D. dissertation, Walden University, United States --
Minnesota. Retrieved November 4, 2010, from Dissertations & Theses: Full
Text.(Publication No. AAT 3391445).
Bower, P. (2008, February). Generation me: Why today's young americans are more
confident, assertive, entitled - and more miserable than ever before. New Oxford
Review, 75(2), 47-48. Retrieved November 7, 2010, from ProQuest Religion.
(Document ID: 1432365291).
Bretz Jr., R., Boudreau, J., & Judge, T. (1994). Job search behavior of employed
managers. Personnel Psychology, 47(2), 275-301. Retrieved from Psychology and
Behavioral Sciences Collection database.
120
Burnes, P.T. (2006). A study of voluntary turnover among Generation X information
technology professionals. D.M. dissertation, University of Phoenix, United States
-- Arizona. Retrieved November 4, 2010, from Dissertations & Theses: Full
Text.(Publication No. AAT 3220543).
Calabro, A. (2010). Study finds work values between millennial and previous generations
differ. O&P Business News, 19(6), 34. Retrieved from SPORTDiscus with Full
Text database.
Carden, L. (2007). Pathways to success for moderately defined careers: A study of
relationships among prestige/autonomy, job satisfaction, career commitment,
career path, training and learning, and performance as perceived by project
managers. Ph.D. dissertation, Texas A&M University, United States -- Texas.
Retrieved November 4, 2010, from Dissertations & Theses: Full Text.(Publication
No. AAT 3270713).
Carlson, E. (2009). 20th-century US generations. Population Bulletin, 64(1), 1-18.
Retrieved from Academic Search Elite database.
Carver, L., & Candela, L. (2008). Attaining organizational commitment across different
generations of nurses. Journal of Nursing Management, 16(8), 984-991.
doi:10.1111/j.1365-2834.2008.00911.x.
Cary, S. (2008). Mentoring generations today for tomorrow's leaders. Nephrology
Nursing Journal, 35(2), 118-119. Retrieved from Academic Search Elite
database.
Catalyst. (2005). Exploding generation x myths. Journal of Accountancy, 200(2), 38-40.
Retrieved from Business Source Elite database.
121
Chan, D.S. (2005). Relationship between generation-responsive leadership behaviors and
job satisfaction of generations X and Y professionals. D.M. dissertation,
University of Phoenix, United States -- Arizona. Retrieved November 4, 2010,
from Dissertations & Theses: Full Text.(Publication No. AAT 3194291).
Charan, R., Drotter, S., & Noel, J. (2001). The leadership pipeline: how to build the
leadership-powered company. San Francisco, CA: John Wiley & Sons, Inc.
Clark, A. (2007). The new reality: Using benefits to attract and retain talent. Employment
Relations Today (Wiley), 34(3), 47-53. doi:10.1002/ert.20164.
Covin, R., Donovan, L., & MacIntyre, P. (2003). The relationship between self-esteem
and performance when information regarding others' performance is available.
Journal of Social Psychology, 143(4), 541-544. Retrieved from SPORTDiscus
with Full Text database.
Crespo, M.R. (2007). Intelligence and personality as antecedents to leadership
effectiveness and extrinsic career success: The predictive power of individual
differences. Ph.D. dissertation, Columbia University, United States -- New York.
Retrieved November 4, 2010, from Dissertations & Theses: Full Text.(Publication
No. AAT 3249071).
Creswell, J.W. (2009). Research design: Qualitative, quantitative, and mixed methods
approaches. Thousand Oaks, CA: Sage Publications, Inc.
Crickenberger, L. (2010). The effect of generations and occupations on job satisfaction:
Examination of the NLSY archival data. Ph.D. dissertation, Walden University,
United States -- Minnesota. Retrieved November 4, 2010, from Dissertations &
Theses: Full Text.(Publication No. AAT 3398577).
122
Crocker, J., Brook, A., Niiya, Y., & Villacorta, M. (2006). The pursuit of self-esteem:
Contingencies of self-worth and self-regulation. Journal of Personality, 74(6),
1749-1772. doi:10.1111/j.1467-6494.2006.00427.x.
Curry, C. (2007). Predicting the effects of extrinsic and intrinsic job factors on overall
job satisfaction for Generation X and Baby Boomers in a regional healthcare
organization. Ph.D. dissertation, Georgia State University, United States --
Georgia. Retrieved November 4, 2010, from Dissertations & Theses: Full
Text.(Publication No. AAT 3292702).
De Vos, A., De Clippeleer, I., & Dewilde, T. (2009). Proactive career behaviors and
career success during the early career. Journal of Occupational & Organizational
Psychology, 82(4), 761-777. Retrieved from Psychology and Behavioral Sciences
Collection database.
Deeken, J., Webb, P., & Taffurelli, V. (2008). We are all winners: Training silents to
millennials to work as a team. Serials Librarian, 54(3/4), 211-216. Retrieved
from Academic Search Elite database.
DeMarco, D. (2008). Creating a gen-x friendly workplace to retain key talent. Contract
Management, 48(2), 10-13. Retrieved from Business Source Elite database.
Demo, D., & Parker, K. (1987). Academic achievement and self-esteem among black and
white college students. Journal of Social Psychology, 127(4), 345. Retrieved from
SPORTDiscus with Full Text database.
Dols, J., Landrum, P., & Wieck, K. (2010). Leading and managing an intergenerational
workforce. Creative Nursing, 16(2), 68-74. doi:10.1891/1078-4535.16.2.68.
123
Dries, N., Pepermans, R., & De Kerpel, E. (2008). Exploring four generations' beliefs
about career: Is "satisfied" the new "successful"?. Journal of Managerial
Psychology, 23(8), 907-928. Retrieved November 7, 2010, from ABI/INFORM
Global. (Document ID: 1591442691).
Eaton, D. (2008). An investigation of generational differences in job satisfaction in a
bureaucratic environment. D.B.A. dissertation, St. Ambrose University, United
States -- Iowa. Retrieved November 4, 2010, from Dissertations & Theses: Full
Text.(Publication No. AAT 3338478).
El-Anzi, F. (2005). Academic achievement and its relationship with anxiety, self-esteem,
optimism, and pessimism in kuwaiti students. Social Behavior & Personality: An
International Journal, 33(1), 95-103. Retrieved From Sportdiscus With Full Text
Database.
Engelman, E. (2009). Generation y vs. baby boomers: How workplace commitment levels
affect recruitment and retention of generation y within corporate America. Ph.D.
dissertation, Capella University, United States -- Minnesota. Retrieved November
4, 2010, from Dissertations & Theses: Full Text.(Publication No. AAT 3368749).
Erickson, T. (2010). The leaders we need now (cover story). Harvard Business Review,
88(5), 62-66. Retrieved from Business Source Elite database.
Eriksen, K., & Kress, V. (2006). The dsm and the professional counseling identity:
Bridging the gap. Journal of Mental Health Counseling, 28(3), 202-217.
Retrieved from Academic Search Elite database.
124
Feick, D., & Rhodewalt, F. (1997). The double-edged sword of self-handicapping:
Discounting, augmentation, and the protection and enhancement of self-esteem.
Motivation & Emotion, 21(2), 147-163. Retrieved from Psychology and
Behavioral Sciences Collection database.
Fernandez, S. (2009). Comparing generation x to generation y on work-related
beliefs. M.S. dissertation, San Jose State University, United States -- California.
Retrieved November 4, 2010, from Dissertations & Theses: Full Text.(Publication
No. AAT 1484300).
Financial Planning Association. (2009). Serving the next generation. Journal of Financial
Planning, 22(3), 1-7. Retrieved from Business Source Elite database.
Fismer, E.C. (2005). Generation x leadership styles and job satisfaction in the
information technology consulting industry. D.M. dissertation, University of
Phoenix, United States -- Arizona. Retrieved November 4, 2010, from
Dissertations & Theses: Full Text.(Publication No. AAT 3172511).
Forbes, J. (1987). Early intraorganizational mobility: Patterns and influences. Academy
Of Management Journal, 30(1), 110-125. Retrieved From Business Source Elite
Database.
Forsyth, D., Lawrence, N., Burnette, J., & Baumeister, R. (2007). Attempting to improve
the academic performance of struggling college students by bolstering their self-
esteem: An intervention that backfired. Journal Of Social & Clinical Psychology,
26(4), 447-459. Retrieved From Psychology And Behavioral Sciences Collection
Database.
125
Francis, L. (1997). Coopersmith's model of self-esteem: Bias toward the stable extravert?.
Journal of Social Psychology, 137(1), 139-142. Retrieved from SPORTDiscus
with Full Text database.
Gardner, H. (2006) Five minds for the future. Harvard Business School Press: Boston,
MA.
Giancola, F. (2006). The generation gap: More myth than reality. Human Resource
Planning, 29(4), 32-37. Retrieved from Business Source Elite database.
Gibelman, M. (1999). The search for identity: Defining social work--past, present, future.
Social Work, 44(4), 298-310. Retrieved from Academic Search Elite database.
Glass, A. (2007). Understanding generational differences for competitive success.
Industrial & Commercial Training, 39(2), 98-103.
doi:10.1108/00197850710732424.
Glenn, N., & Taylor, P. (1984). Education and family income: A comparison of white
married men and women in the U.S. Social Forces, 63(1), 169-183. Retrieved
from SPORTDiscus with Full Text database.
Gliem, J.A. & Gliem, R.R. (2003). Calculating, interpreting, and reporting cronbach’s
alpha reliability coefficient for likert-type scales. Retrieved from
http://hdl.handle.net/1805/344
Goldseker, S. (2009). Beyond duty and obligation: Engaging the next generation. Journal
of Jewish Communal Service, 84(1/2), 115-120. Retrieved from Psychology and
Behavioral Sciences Collection database.
126
Gunz, H.P. & Heslin, P.A. (2005). Reconceptualizing career success. Journal of
Organizational Behavior, 26(2), 105. Retrieved November 7, 2010, from
ABI/INFORM Global. (Document ID: 792935051).
Guppy, L. (1982). On intersubjectivity and collective conscience in occupational prestige
research: A comment on balkwell--bates--garbin and kraus--schild--hodge. Social
Forces, 60(4), 1178-1182. Retrieved from Psychology and Behavioral Sciences
Collection database.
Hahn, J. (2009). Effectively manage a multigenerational staff. Nursing Management,
40(9), 8-10. Retrieved from Academic Search Elite database.
Hair, E., & Graziano, W. (2003). Self-esteem, personality and achievement in high
school: A prospective longitudinal study in texas. Journal of Personality, 71(6),
971. doi:10.1111/1467-6494.7106004.
Harvard Business Publishing. (2010). Quantitative methods. Retrieved from Lecture
Notes Online Web site: http://elearninghome.hbsp.org/Saba/Web/Main
Helm, C. (2007). Teacher dispositions affecting self-esteem and student performance.
Clearing House, 80(3), 109-110. Retrieved from Academic Search Elite database.
Heslin, P.A. (2005). Conceptualizing and evaluating career success. Journal of
Organizational Behavior, 26(2), 113-136. Retrieved November 7, 2010, from
ABI/INFORM Global. (Document ID: 792935041).
Hollman, P. (2008). Generational membership and organizational commitment in a
Fortune 100 firm. D.B.A. dissertation, University of Phoenix, United States --
Arizona. Retrieved November 4, 2010, from Dissertations & Theses: Full
Text.(Publication No. AAT 3324078).
127
Hoydicz, J. (2007). Bridging the generation gap. O&P Business News, 16(17), 30-32.
Retrieved from SPORTDiscus with Full Text database.
Johnston, K. (2006). Gaining perspective on mentoring Generation X. Medical
Education, 40(8), 824. doi:10.1111/j.1365-2929.2006.02523.x.
Judge, T. (2009). Core self-evaluations and work success. Current Directions in
Psychological Science (Wiley-Blackwell), 18(1), 58-62. doi:10.1111/j.1467-
8721.2009.01606.x.
Judge, T., & Higgins, C. (1999). The big five personality traits, general mental ability,
and career success across the life span. Personnel Psychology, 52(3), 621-652.
Retrieved From Business Source Elite Database.
Judge, T., & Hurst, C. (2008). How the rich (and happy) get richer (and happier):
Relationship of core self-evaluations to trajectories in attaining work success.
Journal of Applied Psychology, 93(4), 849-863. doi:10.1037/0021-9010.93.4.849.
Kammeyer-Mueller, J., Judge, T., & Piccolo, R. (2008). Self-Esteem and extrinsic career
success: Test of a dynamic model. Applied Psychology: An International Review,
57(2), 204-224. doi:10.1111/j.1464-0597.2007.00300.x.
Kara, A. (2007). Discrete stochastic dynamics of income inequality in education: An
applied stochastic model and a case study. Discrete Dynamics in Nature &
Society, 20071-15. doi:10.1155/2007/71742.
Kennedy, E. (2008). Generational diversity as a catalyst to change. M.A. dissertation,
Royal Roads University (Canada), Canada. Retrieved November 4, 2010, from
Dissertations & Theses: Full Text.(Publication No. AAT MR37592).
128
Kern, M., Friedman, K.M., H., Martin, L., Reynolds, C., & Luong, G. (2009).
Conscientiousness, career success, and longevity: A lifespan analysis. Annals of
Behavioral Medicine, 37(2), 154-163. doi:10.1007/s12160-009-9095-6.
Kim, K. (2009). The determinants of successful school-to-work transitions and their
impact on labor market outcomes. Ph.D. dissertation, The Pennsylvania State
University, United States -- Pennsylvania. Retrieved July 10, 2010, from
Dissertations & Theses: Full Text.(Publication No. AAT 3380936).
Kim, N. (2005). Organizational interventions influencing employee career development
preferred by different career success orientations. International Journal of
Training & Development, 9(1), 47-61. doi:10.1111/j.1360-3736.2005.00221.x.
Kleiner, A & Von Post, R (2011). A corporate climate of mutual help. Strategy+business.
Spring 2011 (Issue 62). 5.
Klun, S. (2008). Work-life balance is a cross-generational concern—and a key to
retaining high performers at Accenture. Global Business & Organizational
Excellence, 27(6), 14-20. doi:10.1002/joe.20229.
Kovacs, M. (2007). Psychophysiological profile of career success. Ph.D. dissertation,
The University of Alabama, United States -- Alabama. Retrieved November 4,
2010, from Dissertations & Theses: Full Text.(Publication No. AAT 3286156).
Kowske, B., Rasch, R., & Wiley, J. (2010). Millennials’ (lack of) attitude problem: An
empirical examination of generational effects on work attitudes. Journal of
Business & Psychology, 25(2), 265-279. doi:10.1007/s10869-010-9171-8.
129
Kwak, C. (2009). An exploratory study of Generation X business leaders' core
values. Ed.D. dissertation, Pepperdine University, United States -- California.
Retrieved November 4, 2010, from Dissertations & Theses: Full Text.(Publication
No. AAT 3356393).
Kyles, D. (2005). Managing your multigenerational workforce. Strategic Finance, 87(6),
52-55. Retrieved from Business Source Elite database.
Lancaster, L.C. & Stillman, D. (2010). The m-factor: How the millennial generation is
rocking the workplace. New York, NY: HarperCollins Publishers.
Lancaster, L.C. & Stillman, D. (2005). The generational divide. Pediatrics, 115(2), 314.
Retrieved from Psychology and Behavioral Sciences Collection database.
Lane, J., Lane, A., & Kyprianou, A. (2004). Self-efficacy, self-esteem and their impact
on academic performance. Social Behavior & Personality: An International
Journal, 32(3), 247-256. Retrieved From Sportdiscus With Full Text Database.
Lee, D. (2007). Recruitment and retention of generation x accountants: An analysis of
motivational factors and their influence. Ph.D. dissertation, Capella University,
United States -- Minnesota. Retrieved November 4, 2010, from Dissertations &
Theses: Full Text.(Publication No. AAT 3274580).
Levit, A. (2009). The future world of work: A gen xer's perspective. Futurist, 43(5), 39.
Retrieved from Academic Search Elite database.
Lieber, L. (2010). How hr can assist in managing the four generations in today's
workplace. Employment Relations Today (Wiley), 36(4), 85-91.
doi:10.1002/ert.20278.
130
Lindborg, H. (2008). A booming voice. Quality Progress, 41(9), 58-59. Retrieved from
Academic Search Elite database.
Lindsay, R. (1995). Reconsidering the status of tests of significance: An alternative
criterion of adequacy. Accounting, Organizations & Society, 20(1), 35-53.
Retrieved From Business Source Elite Database.
Littau, M. (2009). The millennials: An investigation of their organizational commitment,
work values, and person-work environment fit. M.A. dissertation, Carleton
University (Canada), Canada. Retrieved November 4, 2010, from Dissertations &
Theses: Full Text.(Publication No. AAT MR58454).
Love, K. (2005). Generational impacts on organizational commitment: An examination
of the Baby Boom Generation and Generation X at work. M.B.A. dissertation,
Carleton University (Canada), Canada. Retrieved November 4, 2010, from
Dissertations & Theses: Full Text.(Publication No. AAT MR10113).
Lower, J. (2008). Brace yourself here comes generation y. Critical Care Nurse, 28(5),
80-85. Retrieved from Academic Search Elite database.
Ludwick, P. (2007). The boomers are already gone. Journal of Housing & Community
Development, 64(1), 22-26. Retrieved from Academic Search Elite database.
Lyons, S., Higgins, C., & Duxbury, L. (2007). An empirical assessment of generational
differences in basic human values. Psychological Reports, 101(2), 339-352.
doi:10.2466/PR0.101.2.339-352.
131
Mackey, J. (2005). Transitioning to a generation x and generation next workforce. M.A.
dissertation, The College of St. Scholastica, United States -- Minnesota. Retrieved
November 4, 2010, from Dissertations & Theses: Full Text.(Publication No. AAT
1464885).
Martin, C. (2005). From high maintenance to high productivity. Industrial & Commercial
Training, 37(1), 39-44. Retrieved from Business Source Elite database.
Masi, F. (2010). The correlation of retention: An investigation of the relationship
between what is important to employees and what is perceived to be important to
their managers. Ph.D. dissertation, Capella University, United States --
Minnesota. Retrieved November 4, 2010, from Dissertations & Theses: Full
Text.(Publication No. AAT 3397667).
McGuire, D., By, R., & Hutchings, K. (2007). Towards a model of human resource
solutions for achieving intergenerational interaction in organisations. Journal of
European Industrial Training, 31(8), 592-608. Retrieved from Business Source
Elite database.
McMullin, J., Duerden Comeau, T., & Jovic, E. (2007). Generational affinities and
discourses of difference: a case study of highly skilled information technology
workers. British Journal of Sociology, 58(2), 297-316. doi:10.1111/j.1468-
4446.2007.00152.x.
Meister, J. C. & Willyerd, K. (2010). The 2020 workplace: How innovative companies
attract, develop, and keep tomorrow’s employees today. New York, NY:
HarperCollins Publishers.
132
Meriac, J., Woehr, D., & Banister, C. (2010). Generational differences in work ethic: An
Examination of measurement equivalence across three cohorts. Journal of
Business & Psychology, 25(2), 315-324. doi:10.1007/s10869-010-9164-7.
Midkiff, J., & Griffin, F. (1992). The effects of self-esteem and expectancies for success
on affective reactions to achievement. Social Behavior & Personality: An
International Journal, 20(4), 273-282. Retrieved From Sportdiscus With Full
Text Database.
Miller, E.J. (2006). The effect of rewards, commitment, organizational climate and work
values on intentions to leave: Is there a difference among generations? Ph.D.
dissertation, State University of New York at Albany, United States -- New York.
Retrieved November 4, 2010, from Dissertations & Theses: Full Text.(Publication
No. AAT 3249953).
Mintzberg, H., Ahlstrand, B., & Lampel, J. (1998). Strategy safari: A guided tour
through the wilds of strategic management. The Free Press: New York, NY.
Mitchell, M., & Fandt, P. (1993). Confident role for tomorrow's classrooms: The self-
esteem of education majors. Education, 113(4), 556. Retrieved from Academic
Search Elite database.
Mitchell, M., McLean, P., & Turner, G. (2005). Understanding generation x… boom or
bust introduction. Business Forum, 27(1), 26-30. Retrieved from Business Source
Elite database.
Morvitz, E., & Motta, R. (1992). Predictors of self-esteem: The roles of parent-child
perceptions, achievement, and class placement. Journal of Learning Disabilities,
25(1), Retrieved from Academic Search Elite database.
133
Morvitz, E., & Motta, R.W. (1992). Factors affecting self-esteem. Adapted Physical
Activity Quarterly, 9(4), 355-356. Retrieved from SPORTDiscus with Full Text
database.
Mouchayleh, T. (2009). Recruiting and retaining new generations of community college
faculty. Ph.D. dissertation, The University of Texas at Austin, United States --
Texas. Retrieved November 4, 2010, from Dissertations & Theses: Full
Text.(Publication No. AAT 3390926).
Murphy, W. (2007). Individual and relational dynamics of ambition in careers. Ph.D.
dissertation, Boston College, United States -- Massachusetts. Retrieved November
4, 2010, from Dissertations & Theses: Full Text.(Publication No. AAT 3254831).
Newman, L., & Wadas, R. (1997). When the stakes are higher: Self-esteem instability
and self-handicapping. Journal of Social Behavior & Personality, 12(1), 217-232.
Retrieved from SPORTDiscus with Full Text database.
Ng, T., & Feldman, D. (2010). Human capital and objective indicators of career success:
The mediating effects of cognitive ability and conscientiousness. Journal of
Occupational & Organizational Psychology, 83(1), 207-235. Retrieved from
Psychology and Behavioral Sciences Collection database.
Ng, T.W., Eby, L.T., Sorensen, K.L., & Feldman, D.C. (2005). Predictors of objective
and subjective career success: A meta-analysis. Personnel
Psychology, 58(2), 367-408. Retrieved November 7, 2010, from ABI/INFORM
Global. (Document ID: 851499911).
134
Norem-Hebeisen, A., & Johnson, D. (1981). The relationship between cooperative,
competitive, and individualistic attitudes and differentiated aspects of self-esteem.
Journal of Personality, 49(4), 415-426. doi:10.1111/1467-6494.ep7379489.
Paeske, M. (2007, September). Give next generation a chance. Journal of Property
Management, p. 31. Retrieved from Business Source Elite database.
Patalano, C. (2008). A study of the relationship between generational group identification
and organizational commitment: Generation X vs. Generation Y. D.B.A.
dissertation, Nova Southeastern University, United States -- Florida. Retrieved
November 4, 2010, from Dissertations & Theses: Full Text.(Publication No. AAT
3301306).
Pitzl, J. (2010). Building bridges between generations. Journal of Financial Planning,
28-30. Retrieved from Business Source Elite database.
Poindexter, K. (2008). Passing the torch but not just yet. Public Manager, 37(2), 11-14.
Retrieved from Academic Search Elite database.
Price, J. (2010). Risk assessment in the work environment of adolescents and their
attainment of occupational injury or illness as young adult workers. Ph.D.
dissertation, Northeastern University, United States -- Massachusetts. Retrieved
December 18, 2010, from Dissertations & Theses: Full Text.(Publication No.
AAT 3398833).
Quigley, N.R. & Tymon Jr., W.G. (2006). Toward an integrated model of intrinsic
motivation and career self-management. Career Development
International, 11(6), 522-543. Retrieved November 7, 2010, from ABI/INFORM
Global. (Document ID: 1143421841).
135
Ramaswami, A., Dreher, G., Bretz, R., & Wiethoff, C. (2010). Gender, mentoring, and
career success: The importance of organizational context. Personnel Psychology,
63(2), 385-405. doi:10.1111/j.1744-6570.2010.01174.x.
Randle, J. (2003). Changes in self-esteem during a 3-year pre-registration Diploma in
Higher Education (Nursing) programme. Journal of Clinical Nursing, 12(1), 142-
143. doi:10.1046/j.1365-2702.2003.00679.x.
Rea, L.M. & Parker, R.A. (2005). Designing & conducting survey research: A
comprehensive guide. San Francisco, CA: John Wiley & Sons, Inc.
Rehme, G. (2007). Education, Economic Growth and Measured Income Inequality.
Economica, 74(295), 493-514. doi:10.1111/j.1468-0335.2006.00555.x.
Renfro-Michel, E., Burlew, L., & Robert, T. (2009). The interaction of work adjustment
and attachment theory: employment counseling implications. Journal of
Employment Counseling, 46(1), 18-26. Retrieved November 7, 2010, from
ABI/INFORM Global. (Document ID: 1658675111).
Riescher, J. (2009). Management across time: A study of generational workforce groups
(Baby Boomer and Generation X) and leadership. Ph.D. dissertation, Capella
University, United States -- Minnesota. Retrieved November 4, 2010, from
Dissertations & Theses: Full Text.(Publication No. AAT 3355469).
Riketta, M., & Ziegler, R. (2007). Self-ambivalence and reactions to success versus
failure. European Journal of Social Psychology, 37(3), 547-560.
doi:10.1002/ejsp.376.
136
Rouse, D. (2000, August). Managing generation x: How to bring out the best in young
talent. The Booklist, 96(22), 2088. Retrieved November 7, 2010, from Research
Library. (Document ID: 58566626).
Rousseau, P. (2007). Turnover, retention, and generation x: The workplace
relationship. M.A. dissertation, State University of New York Empire State
College, United States -- New York. Retrieved November 4, 2010, from
Dissertations & Theses: Full Text.(Publication No. AAT 1448668).
Sari, R., & Soytas, U. (2006). Income and education in turkey: A multivariate analysis.
Education Economics, 14(2), 181-196. doi:10.1080/09645290600622921.
Shaul, C. (2007). The attitude toward money as a reward system between the age groups
corresponding to the Boomers, Generation X, and Generation Y
employees. Psy.D. dissertation, Alliant International University, Fresno, United
States -- California. Retrieved November 4, 2010, from Dissertations & Theses:
Full Text.(Publication No. AAT 3262880).
Shepard, S., Nicpon, M., & Doobay, A. (2010). Early entrance to college and self-
concept: Comparisons across the first semester of enrollment. Journal of
Advanced Academics, 22(1), 40-57. Retrieved from Academic Search Elite
database.
Sherrod, B. (2007). Using technology to attract the next generation. Nursing
Management, 38(12), 8. Retrieved from Academic Search Elite database.
Simons, N. (2010). Leveraging generational work styles to meet business objectives.
Information Management (15352897), 44(1), 28-33. Retrieved from Academic
Search Elite database.
137
Smith, D., & Strube, M. (1991). Self-protective tendencies as moderators of self-
handicapping impressions. Basic & Applied Social Psychology, 12(1), 63-80.
Retrieved from Psychology and Behavioral Sciences Collection database.
Smulyan, L. (2004). Redefining self and success: Becoming teachers and doctors. Gender
& Education, 16(2), 225-245. doi:10.1080/09540250310001690591.
Spear, Q. (2009). Generation xers' perceptions: Developing generation xers for executive
leadership in the federal government. Ph.D. dissertation, Capella University,
United States -- Minnesota. Retrieved November 4, 2010, from Dissertations &
Theses: Full Text. (Publication No. AAT 3369477).
Starks, G. (2007). The effect of person-job fit on the retention of top college graduates in
federal agencies. Review of Public Personnel Administration, 27(1), 59-70.
Retrieved from Business Source Elite database.
Sutin, A., Costa Jr., P., Miech, R., & Eaton, W. (2009). Personality and career success:
Concurrent and longitudinal relations. European Journal of Personality, 23(2),
71-84. doi:10.1002/per.704.
Taylor, L. (2008). A study of the relationship of three social activities and an individual's
extrinsic career success. Ph.D. dissertation, Capella University, United States --
Minnesota. Retrieved November 4, 2010, from Dissertations & Theses: Full
Text.(Publication No. AAT 3296770).
Teulings, C., & Van Rens, T. (2008). Education, growth, and income inequality. Review
Of Economics & Statistics, 90(1), 89-104. Retrieved From Business Source Elite
Database.
138
Timmermann, S. (2007). What a difference a generation makes: How our life experiences
shape our viewpoints and behaviors. Journal of Financial Service Professionals,
61(3), 25-28. Retrieved from Business Source Elite database.
Twenge, J.M., Campbell, S.M., Hoffman, B.J., & Lance, C.E. (2010). Generational
differences in work values: Leisure and extrinsic values increasing, social and
intrinsic values decreasing. Journal of Management, 36(5), 1117-1142. Retrieved
November 6, 2010, from ABI/INFORM Global. (Document ID: 2113323391).
UCLA Academic Technology Services. (2010). SPSS FAQ: What does cronbach’s alpha
mean. Retrieved from http://www.ats.ucla.edu/stat/spss/faq/alpha.html.
U.S. Department of Labor, Bureau of Labor Statistics. (2006). The nls handbook 2005.
Retrieved from http://www.bls.gov/nls/handbook/nlshndbk.htm.
Vialle, W., Heaven, P., & Ciarrochi, J. (2007). On being gifted, but sad and
misunderstood: Social, emotional, and academic outcomes of gifted students in
the wollongong youth study. Educational Research & Evaluation, 13(6), 569-586.
doi:10.1080/13803610701786046.
Vidal, F.M. (2010). Essays on education and labor supply. Ph.D. dissertation, Boston
University, United States -- Massachusetts. Retrieved December 18, 2010, from
Dissertations & Theses: Full Text.(Publication No. AAT 3430417).
Wagner, K. (2007). Filling the gap. Journal of Property Management, 72(5), 29-35.
Retrieved from Business Source Elite database.
Woo, T., & Mix, P. (1997). Self-enhancing reactions to performance feedback in an
academic setting. Journal of Social Behavior & Personality, 12(2), 481-500.
Retrieved from SPORTDiscus with Full Text database.
139
Yang, K., & Jolly, L. (2008). Age cohort analysis in adoption of mobile data services:
gen xers versus baby boomers. Journal of Consumer Marketing, 25(5), 272-280.
Retrieved from Business Source Elite database.
Zaino, J. (2005). Disparate generations: Intergenerational accord and aging policy – a
preliminary data review. Journal of Pastoral Counseling, 408-27. Retrieved from
Academic Search Elite database.
Zhang, Z., & Arvey, R. (2009). Effects of personality on individual earnings: Leadership
role occupancy as a mediator. Journal of Business and Psychology, 24(3), 271-
280. Retrieved November 7, 2010, from ABI/INFORM Global. (Document
ID: 1821258391).

140
APPENDICES

141
APPENDIX A
Codebook of Selected Variables
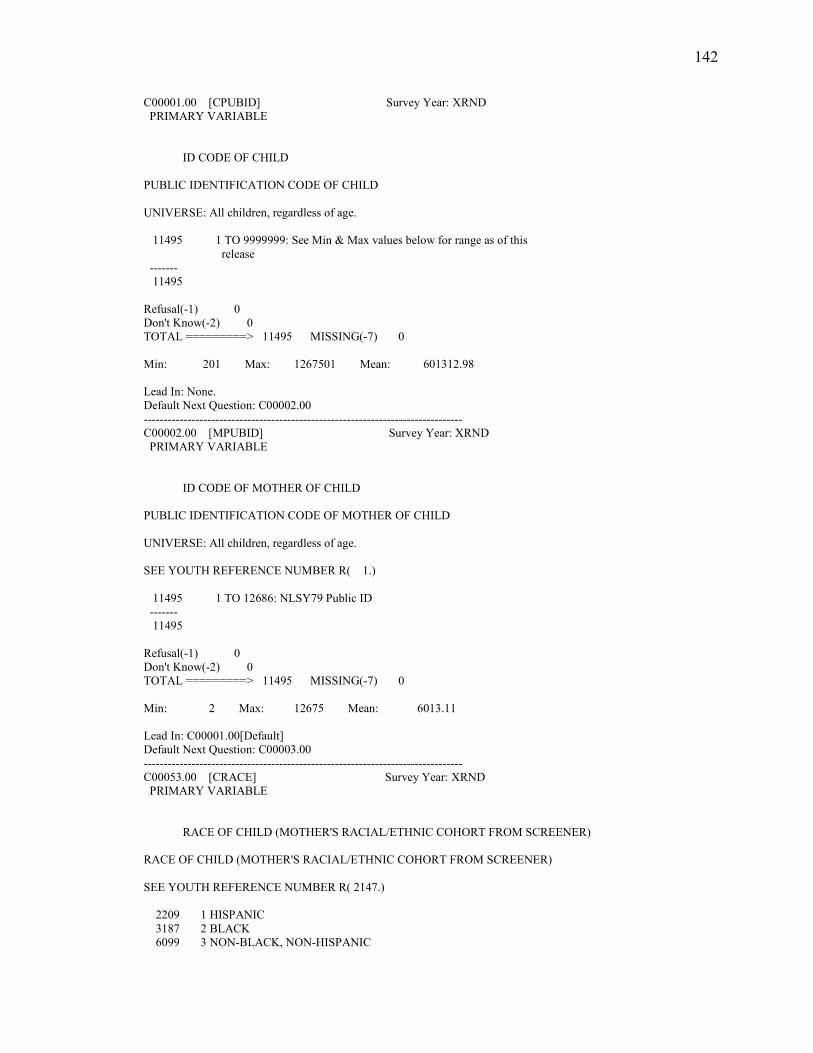
142
C00001.00 [CPUBID] Survey Year: XRND PRIMARY VARIABLE ID CODE OF CHILD PUBLIC IDENTIFICATION CODE OF CHILD UNIVERSE: All children, regardless of age. 11495 1 TO 9999999: See Min & Max values below for range as of this release ------- 11495 Refusal(-1) 0 Don't Know(-2) 0 TOTAL =========> 11495 MISSING(-7) 0 Min: 201 Max: 1267501 Mean: 601312.98 Lead In: None. Default Next Question: C00002.00 -------------------------------------------------------------------------------- C00002.00 [MPUBID] Survey Year: XRND PRIMARY VARIABLE ID CODE OF MOTHER OF CHILD PUBLIC IDENTIFICATION CODE OF MOTHER OF CHILD UNIVERSE: All children, regardless of age. SEE YOUTH REFERENCE NUMBER R( 1.) 11495 1 TO 12686: NLSY79 Public ID ------- 11495 Refusal(-1) 0 Don't Know(-2) 0 TOTAL =========> 11495 MISSING(-7) 0 Min: 2 Max: 12675 Mean: 6013.11 Lead In: C00001.00[Default] Default Next Question: C00003.00 -------------------------------------------------------------------------------- C00053.00 [CRACE] Survey Year: XRND PRIMARY VARIABLE RACE OF CHILD (MOTHER'S RACIAL/ETHNIC COHORT FROM SCREENER) RACE OF CHILD (MOTHER'S RACIAL/ETHNIC COHORT FROM SCREENER) SEE YOUTH REFERENCE NUMBER R( 2147.) 2209 1 HISPANIC 3187 2 BLACK 6099 3 NON-BLACK, NON-HISPANIC
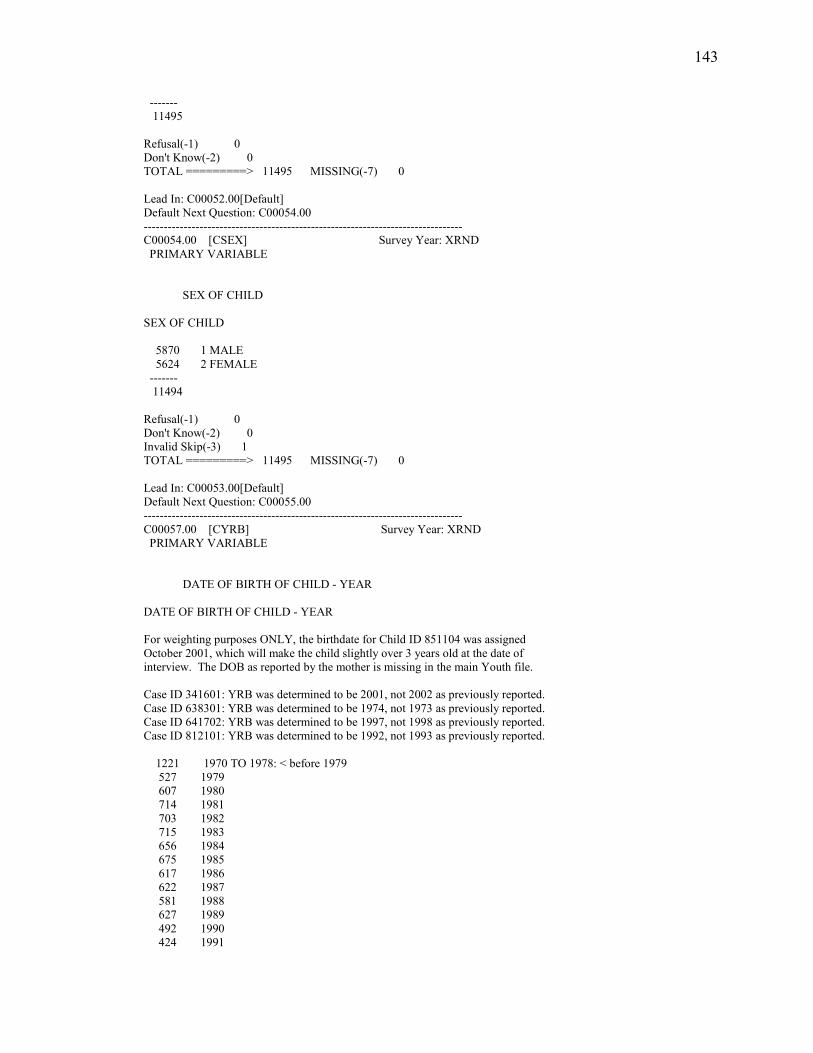
143
------- 11495 Refusal(-1) 0 Don't Know(-2) 0 TOTAL =========> 11495 MISSING(-7) 0 Lead In: C00052.00[Default] Default Next Question: C00054.00 -------------------------------------------------------------------------------- C00054.00 [CSEX] Survey Year: XRND PRIMARY VARIABLE SEX OF CHILD SEX OF CHILD 5870 1 MALE 5624 2 FEMALE ------- 11494 Refusal(-1) 0 Don't Know(-2) 0 Invalid Skip(-3) 1 TOTAL =========> 11495 MISSING(-7) 0 Lead In: C00053.00[Default] Default Next Question: C00055.00 -------------------------------------------------------------------------------- C00057.00 [CYRB] Survey Year: XRND PRIMARY VARIABLE DATE OF BIRTH OF CHILD - YEAR DATE OF BIRTH OF CHILD - YEAR For weighting purposes ONLY, the birthdate for Child ID 851104 was assigned October 2001, which will make the child slightly over 3 years old at the date of interview. The DOB as reported by the mother is missing in the main Youth file. Case ID 341601: YRB was determined to be 2001, not 2002 as previously reported. Case ID 638301: YRB was determined to be 1974, not 1973 as previously reported. Case ID 641702: YRB was determined to be 1997, not 1998 as previously reported. Case ID 812101: YRB was determined to be 1992, not 1993 as previously reported. 1221 1970 TO 1978: < before 1979 527 1979 607 1980 714 1981 703 1982 715 1983 656 1984 675 1985 617 1986 622 1987 581 1988 627 1989 492 1990 424 1991
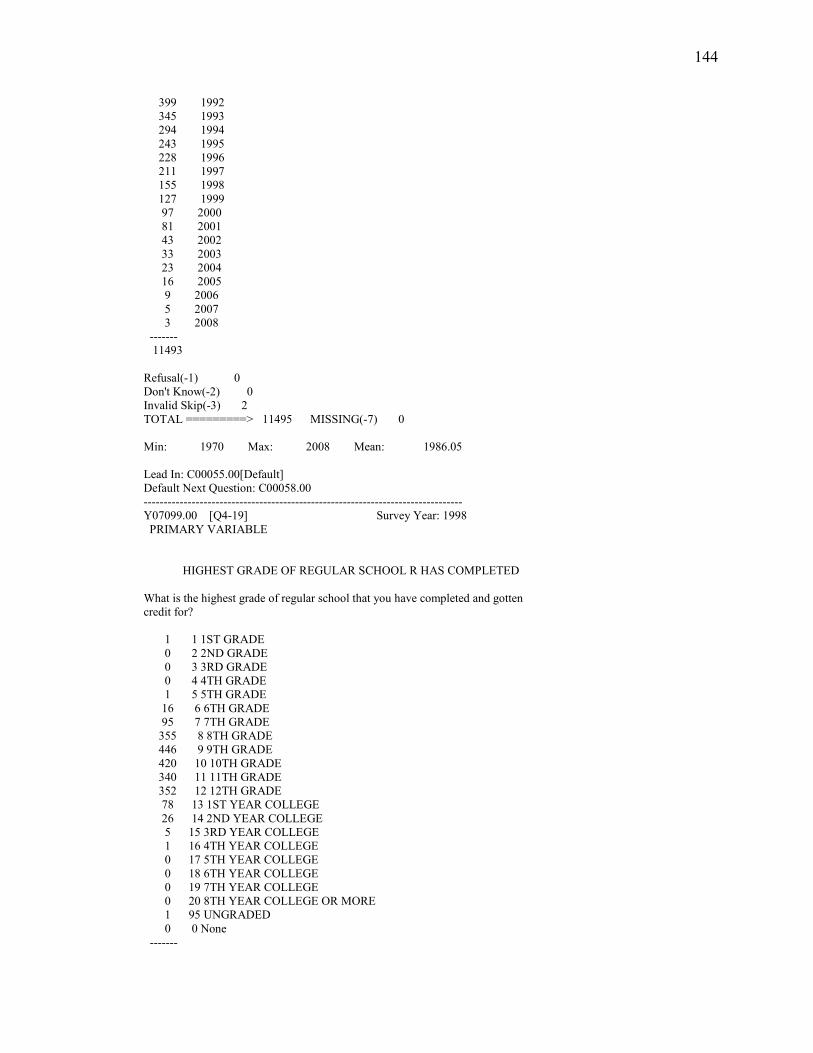
144
399 1992 345 1993 294 1994 243 1995 228 1996 211 1997 155 1998 127 1999 97 2000 81 2001 43 2002 33 2003 23 2004 16 2005 9 2006 5 2007 3 2008 ------- 11493 Refusal(-1) 0 Don't Know(-2) 0 Invalid Skip(-3) 2 TOTAL =========> 11495 MISSING(-7) 0 Min: 1970 Max: 2008 Mean: 1986.05 Lead In: C00055.00[Default] Default Next Question: C00058.00 -------------------------------------------------------------------------------- Y07099.00 [Q4-19] Survey Year: 1998 PRIMARY VARIABLE HIGHEST GRADE OF REGULAR SCHOOL R HAS COMPLETED What is the highest grade of regular school that you have completed and gotten credit for? 1 1 1ST GRADE 0 2 2ND GRADE 0 3 3RD GRADE 0 4 4TH GRADE 1 5 5TH GRADE 16 6 6TH GRADE 95 7 7TH GRADE 355 8 8TH GRADE 446 9 9TH GRADE 420 10 10TH GRADE 340 11 11TH GRADE 352 12 12TH GRADE 78 13 1ST YEAR COLLEGE 26 14 2ND YEAR COLLEGE 5 15 3RD YEAR COLLEGE 1 16 4TH YEAR COLLEGE 0 17 5TH YEAR COLLEGE 0 18 6TH YEAR COLLEGE 0 19 7TH YEAR COLLEGE 0 20 8TH YEAR COLLEGE OR MORE 1 95 UNGRADED 0 0 None -------
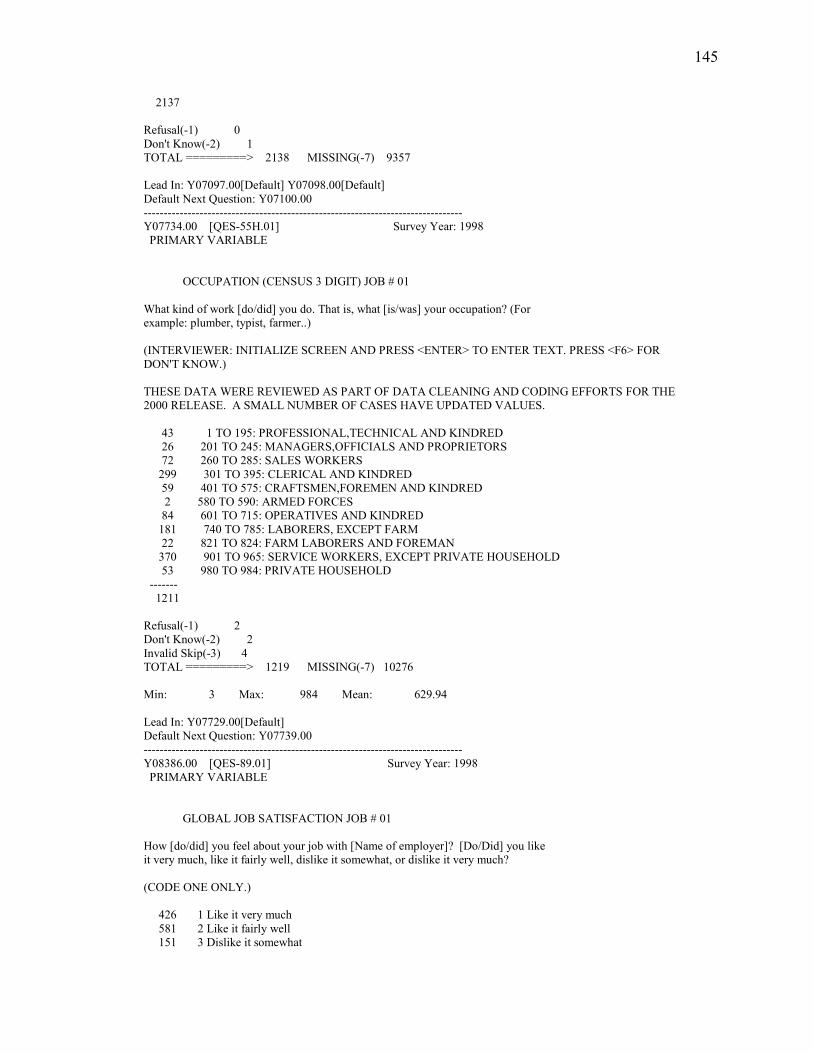
145
2137 Refusal(-1) 0 Don't Know(-2) 1 TOTAL =========> 2138 MISSING(-7) 9357 Lead In: Y07097.00[Default] Y07098.00[Default] Default Next Question: Y07100.00 -------------------------------------------------------------------------------- Y07734.00 [QES-55H.01] Survey Year: 1998 PRIMARY VARIABLE OCCUPATION (CENSUS 3 DIGIT) JOB # 01 What kind of work [do/did] you do. That is, what [is/was] your occupation? (For example: plumber, typist, farmer..) (INTERVIEWER: INITIALIZE SCREEN AND PRESS <ENTER> TO ENTER TEXT. PRESS <F6> FOR DON'T KNOW.) THESE DATA WERE REVIEWED AS PART OF DATA CLEANING AND CODING EFFORTS FOR THE 2000 RELEASE. A SMALL NUMBER OF CASES HAVE UPDATED VALUES. 43 1 TO 195: PROFESSIONAL,TECHNICAL AND KINDRED 26 201 TO 245: MANAGERS,OFFICIALS AND PROPRIETORS 72 260 TO 285: SALES WORKERS 299 301 TO 395: CLERICAL AND KINDRED 59 401 TO 575: CRAFTSMEN,FOREMEN AND KINDRED 2 580 TO 590: ARMED FORCES 84 601 TO 715: OPERATIVES AND KINDRED 181 740 TO 785: LABORERS, EXCEPT FARM 22 821 TO 824: FARM LABORERS AND FOREMAN 370 901 TO 965: SERVICE WORKERS, EXCEPT PRIVATE HOUSEHOLD 53 980 TO 984: PRIVATE HOUSEHOLD ------- 1211 Refusal(-1) 2 Don't Know(-2) 2 Invalid Skip(-3) 4 TOTAL =========> 1219 MISSING(-7) 10276 Min: 3 Max: 984 Mean: 629.94 Lead In: Y07729.00[Default] Default Next Question: Y07739.00 -------------------------------------------------------------------------------- Y08386.00 [QES-89.01] Survey Year: 1998 PRIMARY VARIABLE GLOBAL JOB SATISFACTION JOB # 01 How [do/did] you feel about your job with [Name of employer]? [Do/Did] you like it very much, like it fairly well, dislike it somewhat, or dislike it very much? (CODE ONE ONLY.) 426 1 Like it very much 581 2 Like it fairly well 151 3 Dislike it somewhat
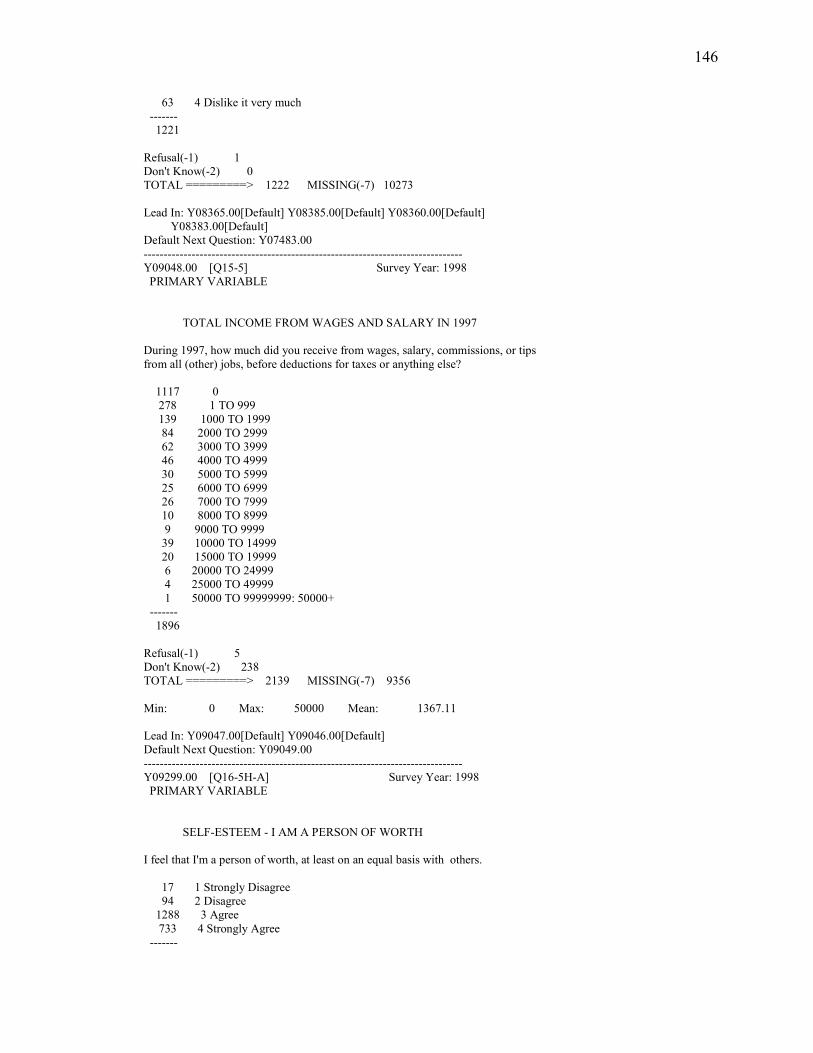
146
63 4 Dislike it very much ------- 1221 Refusal(-1) 1 Don't Know(-2) 0 TOTAL =========> 1222 MISSING(-7) 10273 Lead In: Y08365.00[Default] Y08385.00[Default] Y08360.00[Default] Y08383.00[Default] Default Next Question: Y07483.00 -------------------------------------------------------------------------------- Y09048.00 [Q15-5] Survey Year: 1998 PRIMARY VARIABLE TOTAL INCOME FROM WAGES AND SALARY IN 1997 During 1997, how much did you receive from wages, salary, commissions, or tips from all (other) jobs, before deductions for taxes or anything else? 1117 0 278 1 TO 999 139 1000 TO 1999 84 2000 TO 2999 62 3000 TO 3999 46 4000 TO 4999 30 5000 TO 5999 25 6000 TO 6999 26 7000 TO 7999 10 8000 TO 8999 9 9000 TO 9999 39 10000 TO 14999 20 15000 TO 19999 6 20000 TO 24999 4 25000 TO 49999 1 50000 TO 99999999: 50000+ ------- 1896 Refusal(-1) 5 Don't Know(-2) 238 TOTAL =========> 2139 MISSING(-7) 9356 Min: 0 Max: 50000 Mean: 1367.11 Lead In: Y09047.00[Default] Y09046.00[Default] Default Next Question: Y09049.00 -------------------------------------------------------------------------------- Y09299.00 [Q16-5H-A] Survey Year: 1998 PRIMARY VARIABLE SELF-ESTEEM - I AM A PERSON OF WORTH I feel that I'm a person of worth, at least on an equal basis with others. 17 1 Strongly Disagree 94 2 Disagree 1288 3 Agree 733 4 Strongly Agree -------
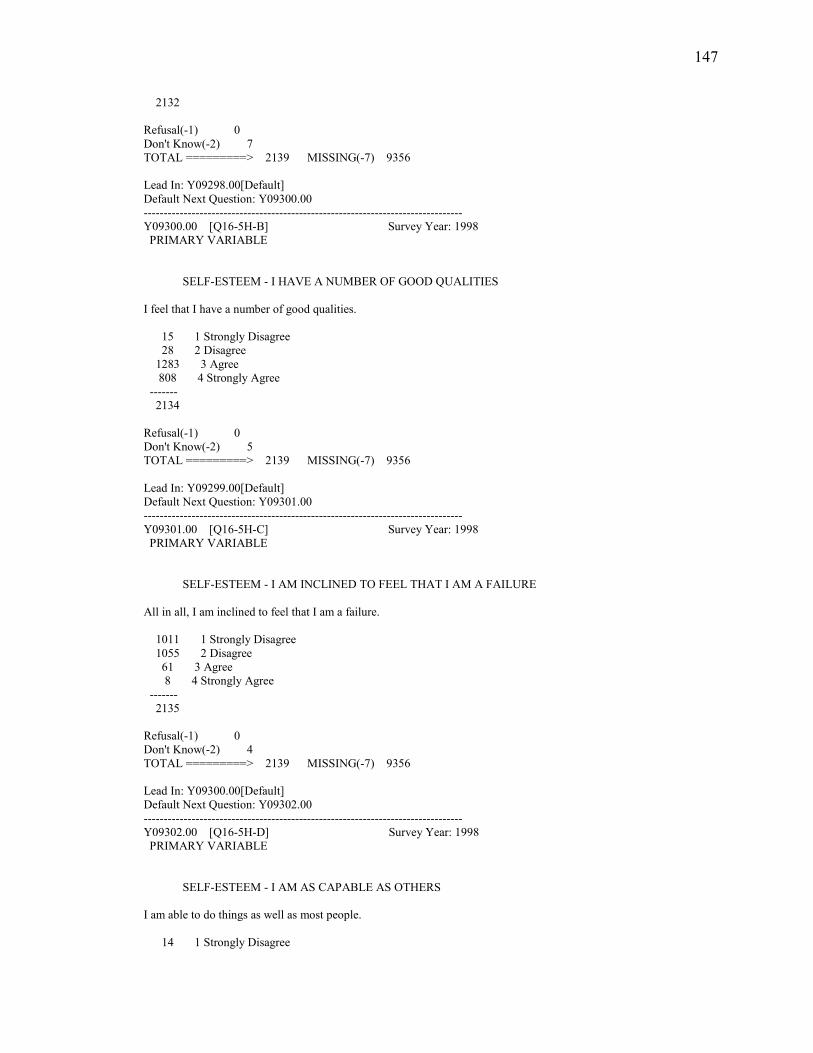
147
2132 Refusal(-1) 0 Don't Know(-2) 7 TOTAL =========> 2139 MISSING(-7) 9356 Lead In: Y09298.00[Default] Default Next Question: Y09300.00 -------------------------------------------------------------------------------- Y09300.00 [Q16-5H-B] Survey Year: 1998 PRIMARY VARIABLE SELF-ESTEEM - I HAVE A NUMBER OF GOOD QUALITIES I feel that I have a number of good qualities. 15 1 Strongly Disagree 28 2 Disagree 1283 3 Agree 808 4 Strongly Agree ------- 2134 Refusal(-1) 0 Don't Know(-2) 5 TOTAL =========> 2139 MISSING(-7) 9356 Lead In: Y09299.00[Default] Default Next Question: Y09301.00 -------------------------------------------------------------------------------- Y09301.00 [Q16-5H-C] Survey Year: 1998 PRIMARY VARIABLE SELF-ESTEEM - I AM INCLINED TO FEEL THAT I AM A FAILURE All in all, I am inclined to feel that I am a failure. 1011 1 Strongly Disagree 1055 2 Disagree 61 3 Agree 8 4 Strongly Agree ------- 2135 Refusal(-1) 0 Don't Know(-2) 4 TOTAL =========> 2139 MISSING(-7) 9356 Lead In: Y09300.00[Default] Default Next Question: Y09302.00 -------------------------------------------------------------------------------- Y09302.00 [Q16-5H-D] Survey Year: 1998 PRIMARY VARIABLE SELF-ESTEEM - I AM AS CAPABLE AS OTHERS I am able to do things as well as most people. 14 1 Strongly Disagree
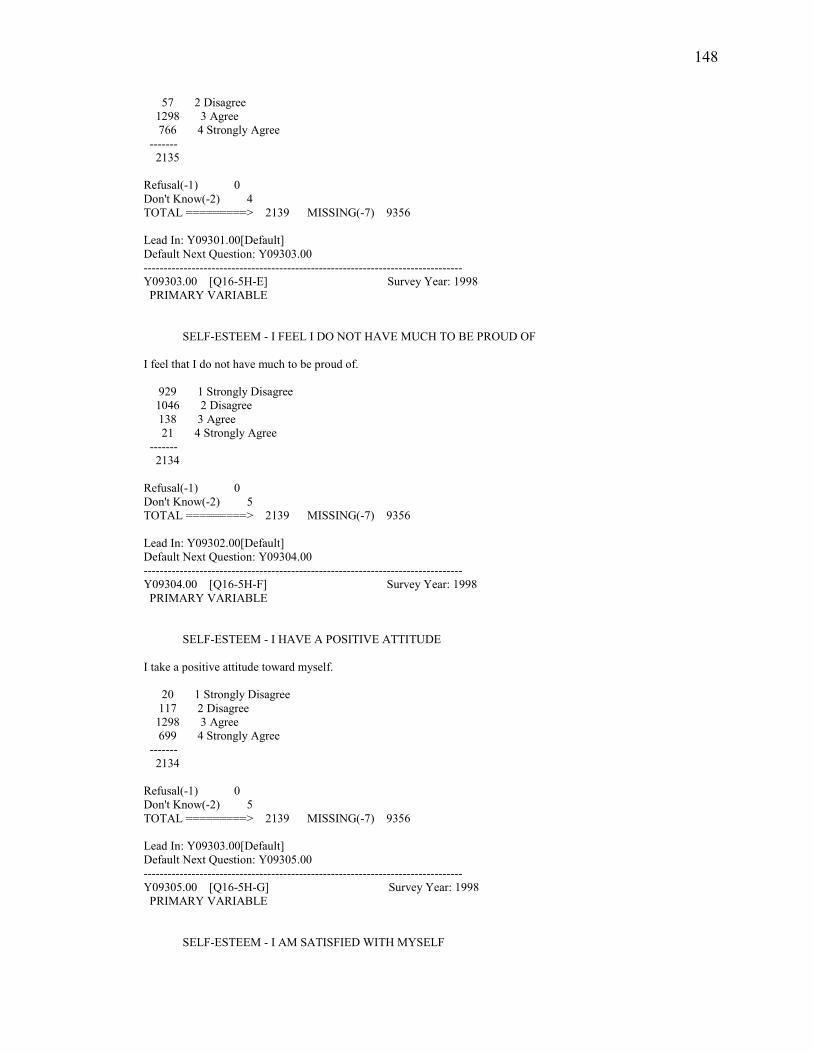
148
57 2 Disagree 1298 3 Agree 766 4 Strongly Agree ------- 2135 Refusal(-1) 0 Don't Know(-2) 4 TOTAL =========> 2139 MISSING(-7) 9356 Lead In: Y09301.00[Default] Default Next Question: Y09303.00 -------------------------------------------------------------------------------- Y09303.00 [Q16-5H-E] Survey Year: 1998 PRIMARY VARIABLE SELF-ESTEEM - I FEEL I DO NOT HAVE MUCH TO BE PROUD OF I feel that I do not have much to be proud of. 929 1 Strongly Disagree 1046 2 Disagree 138 3 Agree 21 4 Strongly Agree ------- 2134 Refusal(-1) 0 Don't Know(-2) 5 TOTAL =========> 2139 MISSING(-7) 9356 Lead In: Y09302.00[Default] Default Next Question: Y09304.00 -------------------------------------------------------------------------------- Y09304.00 [Q16-5H-F] Survey Year: 1998 PRIMARY VARIABLE SELF-ESTEEM - I HAVE A POSITIVE ATTITUDE I take a positive attitude toward myself. 20 1 Strongly Disagree 117 2 Disagree 1298 3 Agree 699 4 Strongly Agree ------- 2134 Refusal(-1) 0 Don't Know(-2) 5 TOTAL =========> 2139 MISSING(-7) 9356 Lead In: Y09303.00[Default] Default Next Question: Y09305.00 -------------------------------------------------------------------------------- Y09305.00 [Q16-5H-G] Survey Year: 1998 PRIMARY VARIABLE SELF-ESTEEM - I AM SATISFIED WITH MYSELF
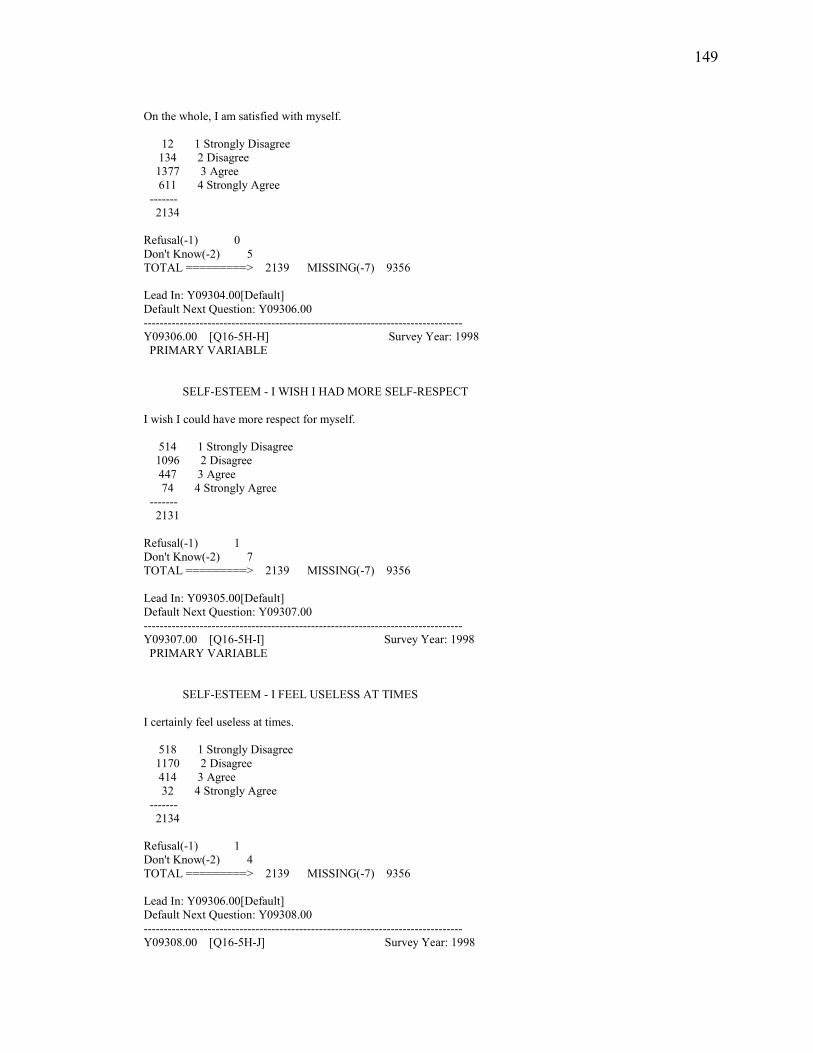
149
On the whole, I am satisfied with myself. 12 1 Strongly Disagree 134 2 Disagree 1377 3 Agree 611 4 Strongly Agree ------- 2134 Refusal(-1) 0 Don't Know(-2) 5 TOTAL =========> 2139 MISSING(-7) 9356 Lead In: Y09304.00[Default] Default Next Question: Y09306.00 -------------------------------------------------------------------------------- Y09306.00 [Q16-5H-H] Survey Year: 1998 PRIMARY VARIABLE SELF-ESTEEM - I WISH I HAD MORE SELF-RESPECT I wish I could have more respect for myself. 514 1 Strongly Disagree 1096 2 Disagree 447 3 Agree 74 4 Strongly Agree ------- 2131 Refusal(-1) 1 Don't Know(-2) 7 TOTAL =========> 2139 MISSING(-7) 9356 Lead In: Y09305.00[Default] Default Next Question: Y09307.00 -------------------------------------------------------------------------------- Y09307.00 [Q16-5H-I] Survey Year: 1998 PRIMARY VARIABLE SELF-ESTEEM - I FEEL USELESS AT TIMES I certainly feel useless at times. 518 1 Strongly Disagree 1170 2 Disagree 414 3 Agree 32 4 Strongly Agree ------- 2134 Refusal(-1) 1 Don't Know(-2) 4 TOTAL =========> 2139 MISSING(-7) 9356 Lead In: Y09306.00[Default] Default Next Question: Y09308.00 -------------------------------------------------------------------------------- Y09308.00 [Q16-5H-J] Survey Year: 1998
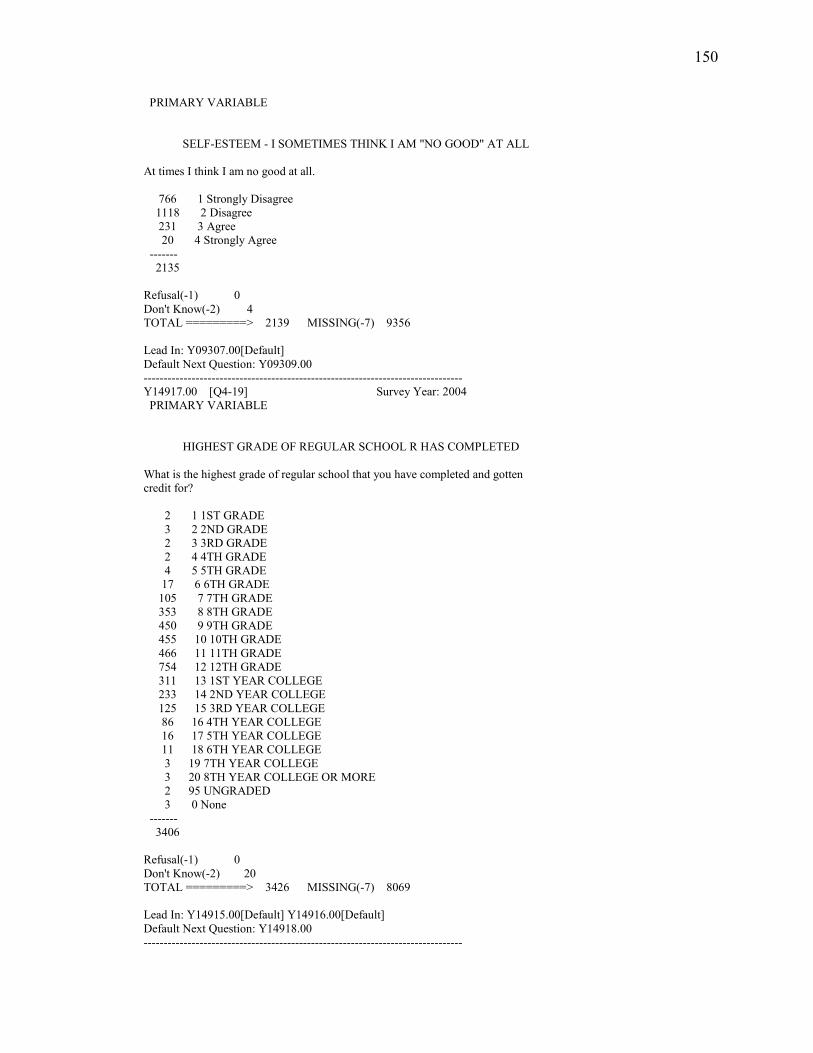
150
PRIMARY VARIABLE SELF-ESTEEM - I SOMETIMES THINK I AM "NO GOOD" AT ALL At times I think I am no good at all. 766 1 Strongly Disagree 1118 2 Disagree 231 3 Agree 20 4 Strongly Agree ------- 2135 Refusal(-1) 0 Don't Know(-2) 4 TOTAL =========> 2139 MISSING(-7) 9356 Lead In: Y09307.00[Default] Default Next Question: Y09309.00 -------------------------------------------------------------------------------- Y14917.00 [Q4-19] Survey Year: 2004 PRIMARY VARIABLE HIGHEST GRADE OF REGULAR SCHOOL R HAS COMPLETED What is the highest grade of regular school that you have completed and gotten credit for? 2 1 1ST GRADE 3 2 2ND GRADE 2 3 3RD GRADE 2 4 4TH GRADE 4 5 5TH GRADE 17 6 6TH GRADE 105 7 7TH GRADE 353 8 8TH GRADE 450 9 9TH GRADE 455 10 10TH GRADE 466 11 11TH GRADE 754 12 12TH GRADE 311 13 1ST YEAR COLLEGE 233 14 2ND YEAR COLLEGE 125 15 3RD YEAR COLLEGE 86 16 4TH YEAR COLLEGE 16 17 5TH YEAR COLLEGE 11 18 6TH YEAR COLLEGE 3 19 7TH YEAR COLLEGE 3 20 8TH YEAR COLLEGE OR MORE 2 95 UNGRADED 3 0 None ------- 3406 Refusal(-1) 0 Don't Know(-2) 20 TOTAL =========> 3426 MISSING(-7) 8069 Lead In: Y14915.00[Default] Y14916.00[Default] Default Next Question: Y14918.00 --------------------------------------------------------------------------------
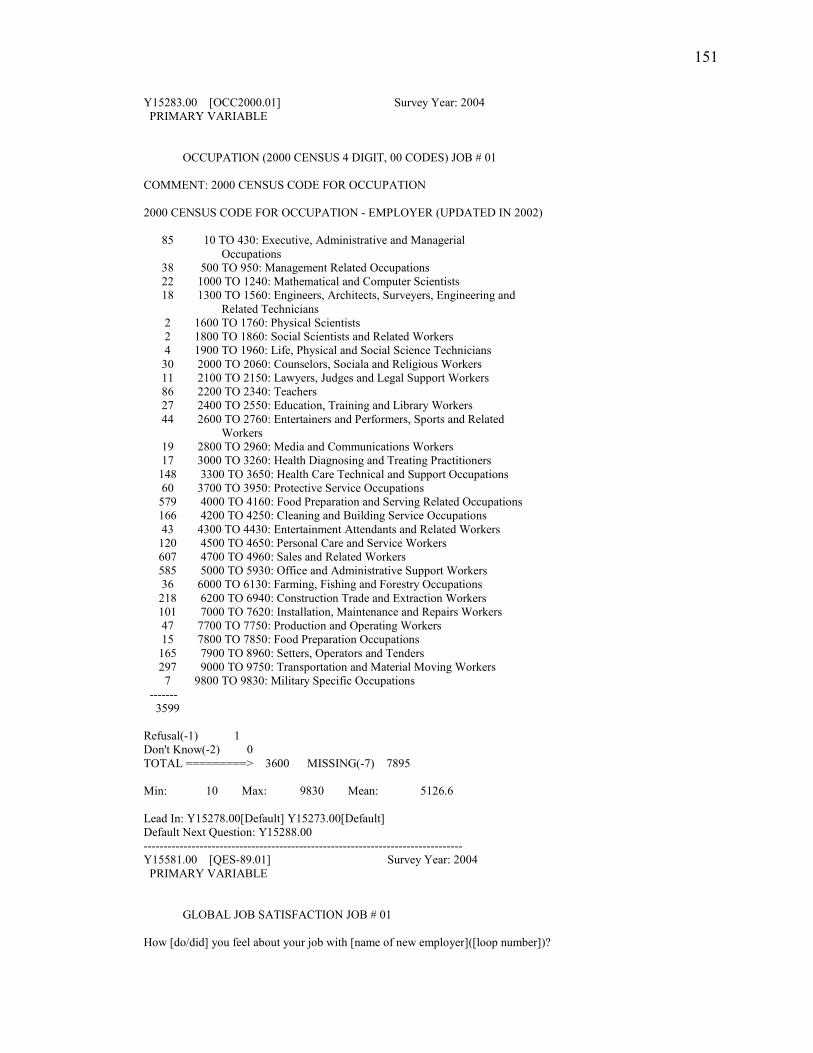
151
Y15283.00 [OCC2000.01] Survey Year: 2004 PRIMARY VARIABLE OCCUPATION (2000 CENSUS 4 DIGIT, 00 CODES) JOB # 01 COMMENT: 2000 CENSUS CODE FOR OCCUPATION 2000 CENSUS CODE FOR OCCUPATION - EMPLOYER (UPDATED IN 2002) 85 10 TO 430: Executive, Administrative and Managerial Occupations 38 500 TO 950: Management Related Occupations 22 1000 TO 1240: Mathematical and Computer Scientists 18 1300 TO 1560: Engineers, Architects, Surveyers, Engineering and Related Technicians 2 1600 TO 1760: Physical Scientists 2 1800 TO 1860: Social Scientists and Related Workers 4 1900 TO 1960: Life, Physical and Social Science Technicians 30 2000 TO 2060: Counselors, Sociala and Religious Workers 11 2100 TO 2150: Lawyers, Judges and Legal Support Workers 86 2200 TO 2340: Teachers 27 2400 TO 2550: Education, Training and Library Workers 44 2600 TO 2760: Entertainers and Performers, Sports and Related Workers 19 2800 TO 2960: Media and Communications Workers 17 3000 TO 3260: Health Diagnosing and Treating Practitioners 148 3300 TO 3650: Health Care Technical and Support Occupations 60 3700 TO 3950: Protective Service Occupations 579 4000 TO 4160: Food Preparation and Serving Related Occupations 166 4200 TO 4250: Cleaning and Building Service Occupations 43 4300 TO 4430: Entertainment Attendants and Related Workers 120 4500 TO 4650: Personal Care and Service Workers 607 4700 TO 4960: Sales and Related Workers 585 5000 TO 5930: Office and Administrative Support Workers 36 6000 TO 6130: Farming, Fishing and Forestry Occupations 218 6200 TO 6940: Construction Trade and Extraction Workers 101 7000 TO 7620: Installation, Maintenance and Repairs Workers 47 7700 TO 7750: Production and Operating Workers 15 7800 TO 7850: Food Preparation Occupations 165 7900 TO 8960: Setters, Operators and Tenders 297 9000 TO 9750: Transportation and Material Moving Workers 7 9800 TO 9830: Military Specific Occupations ------- 3599 Refusal(-1) 1 Don't Know(-2) 0 TOTAL =========> 3600 MISSING(-7) 7895 Min: 10 Max: 9830 Mean: 5126.6 Lead In: Y15278.00[Default] Y15273.00[Default] Default Next Question: Y15288.00 -------------------------------------------------------------------------------- Y15581.00 [QES-89.01] Survey Year: 2004 PRIMARY VARIABLE GLOBAL JOB SATISFACTION JOB # 01 How [do/did] you feel about your job with [name of new employer]([loop number])?
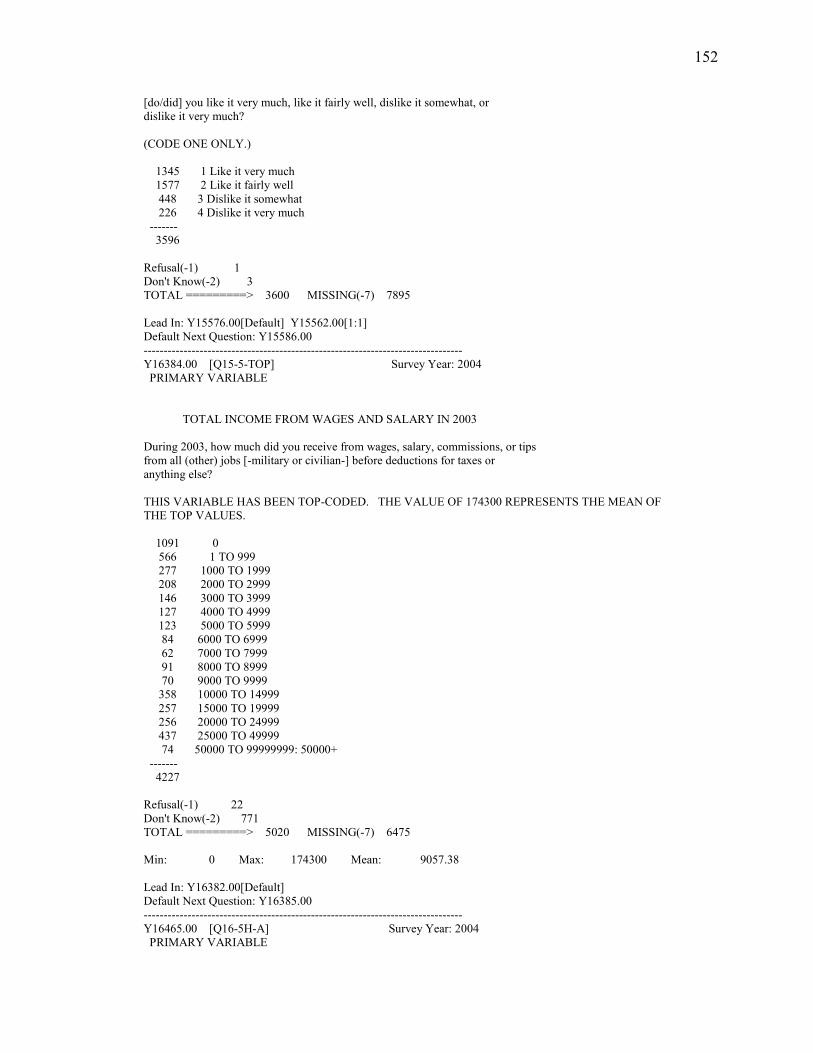
152
[do/did] you like it very much, like it fairly well, dislike it somewhat, or dislike it very much? (CODE ONE ONLY.) 1345 1 Like it very much 1577 2 Like it fairly well 448 3 Dislike it somewhat 226 4 Dislike it very much ------- 3596 Refusal(-1) 1 Don't Know(-2) 3 TOTAL =========> 3600 MISSING(-7) 7895 Lead In: Y15576.00[Default] Y15562.00[1:1] Default Next Question: Y15586.00 -------------------------------------------------------------------------------- Y16384.00 [Q15-5-TOP] Survey Year: 2004 PRIMARY VARIABLE TOTAL INCOME FROM WAGES AND SALARY IN 2003 During 2003, how much did you receive from wages, salary, commissions, or tips from all (other) jobs [-military or civilian-] before deductions for taxes or anything else? THIS VARIABLE HAS BEEN TOP-CODED. THE VALUE OF 174300 REPRESENTS THE MEAN OF THE TOP VALUES. 1091 0 566 1 TO 999 277 1000 TO 1999 208 2000 TO 2999 146 3000 TO 3999 127 4000 TO 4999 123 5000 TO 5999 84 6000 TO 6999 62 7000 TO 7999 91 8000 TO 8999 70 9000 TO 9999 358 10000 TO 14999 257 15000 TO 19999 256 20000 TO 24999 437 25000 TO 49999 74 50000 TO 99999999: 50000+ ------- 4227 Refusal(-1) 22 Don't Know(-2) 771 TOTAL =========> 5020 MISSING(-7) 6475 Min: 0 Max: 174300 Mean: 9057.38 Lead In: Y16382.00[Default] Default Next Question: Y16385.00 -------------------------------------------------------------------------------- Y16465.00 [Q16-5H-A] Survey Year: 2004 PRIMARY VARIABLE
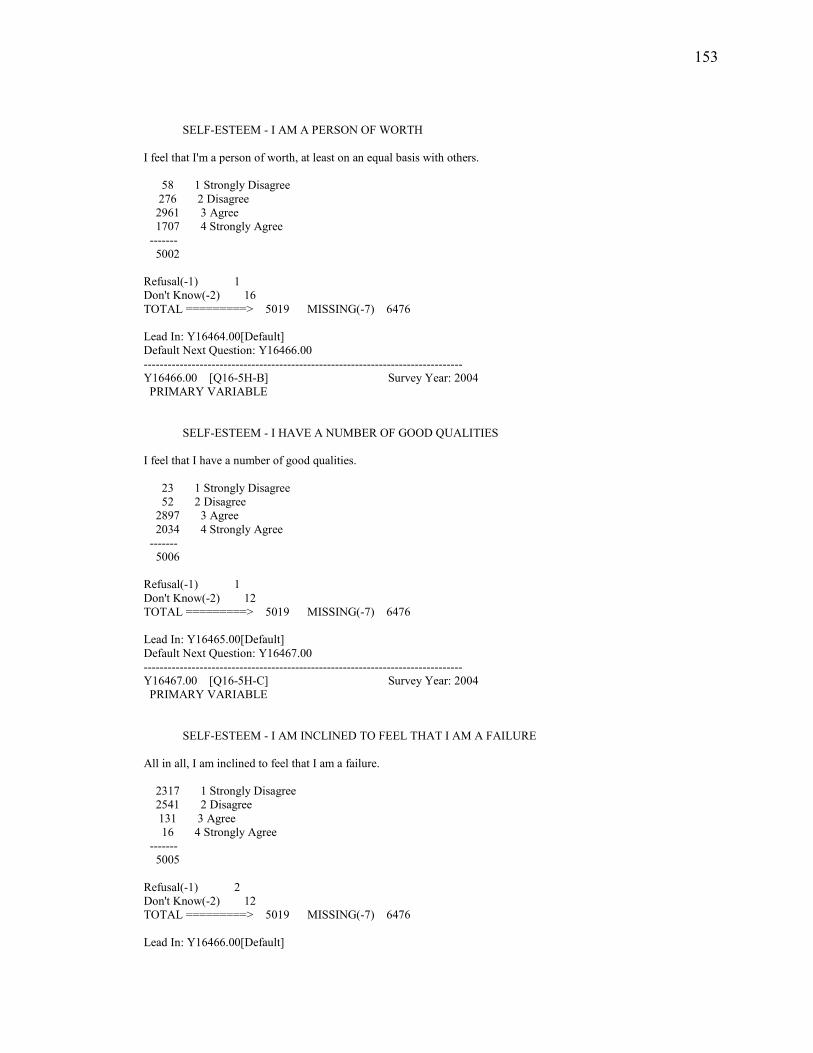
153
SELF-ESTEEM - I AM A PERSON OF WORTH I feel that I'm a person of worth, at least on an equal basis with others. 58 1 Strongly Disagree 276 2 Disagree 2961 3 Agree 1707 4 Strongly Agree ------- 5002 Refusal(-1) 1 Don't Know(-2) 16 TOTAL =========> 5019 MISSING(-7) 6476 Lead In: Y16464.00[Default] Default Next Question: Y16466.00 -------------------------------------------------------------------------------- Y16466.00 [Q16-5H-B] Survey Year: 2004 PRIMARY VARIABLE SELF-ESTEEM - I HAVE A NUMBER OF GOOD QUALITIES I feel that I have a number of good qualities. 23 1 Strongly Disagree 52 2 Disagree 2897 3 Agree 2034 4 Strongly Agree ------- 5006 Refusal(-1) 1 Don't Know(-2) 12 TOTAL =========> 5019 MISSING(-7) 6476 Lead In: Y16465.00[Default] Default Next Question: Y16467.00 -------------------------------------------------------------------------------- Y16467.00 [Q16-5H-C] Survey Year: 2004 PRIMARY VARIABLE SELF-ESTEEM - I AM INCLINED TO FEEL THAT I AM A FAILURE All in all, I am inclined to feel that I am a failure. 2317 1 Strongly Disagree 2541 2 Disagree 131 3 Agree 16 4 Strongly Agree ------- 5005 Refusal(-1) 2 Don't Know(-2) 12 TOTAL =========> 5019 MISSING(-7) 6476 Lead In: Y16466.00[Default]
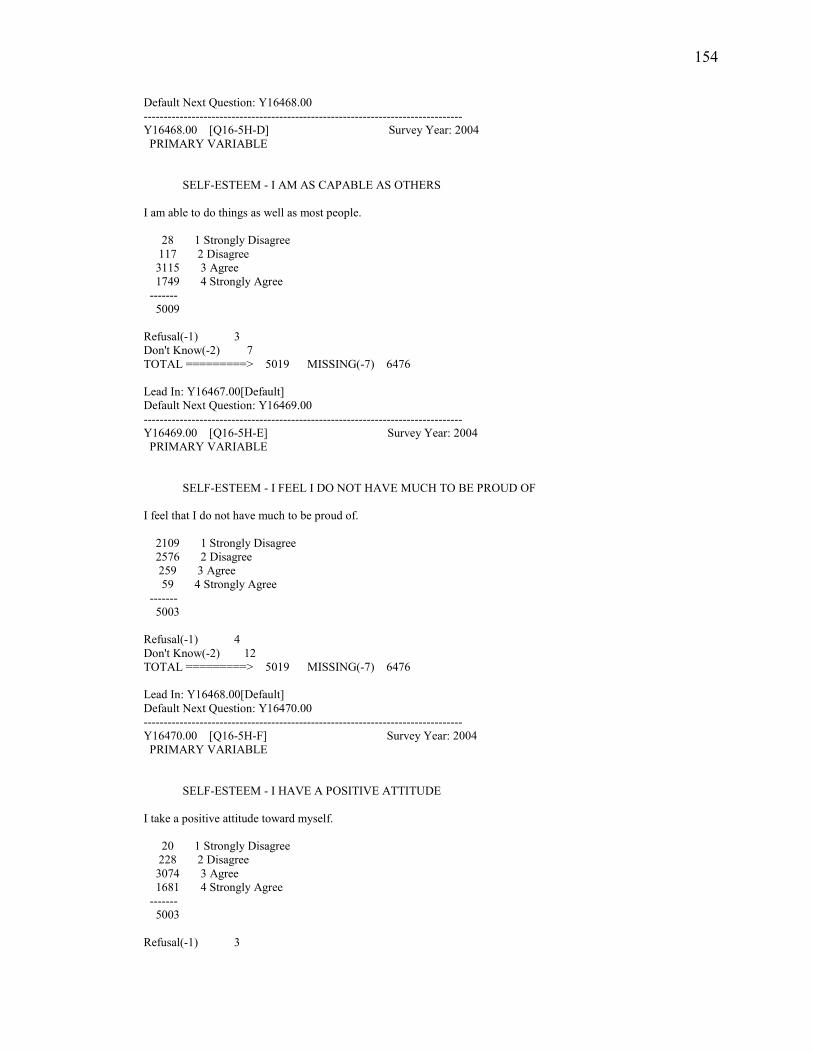
154
Default Next Question: Y16468.00 -------------------------------------------------------------------------------- Y16468.00 [Q16-5H-D] Survey Year: 2004 PRIMARY VARIABLE SELF-ESTEEM - I AM AS CAPABLE AS OTHERS I am able to do things as well as most people. 28 1 Strongly Disagree 117 2 Disagree 3115 3 Agree 1749 4 Strongly Agree ------- 5009 Refusal(-1) 3 Don't Know(-2) 7 TOTAL =========> 5019 MISSING(-7) 6476 Lead In: Y16467.00[Default] Default Next Question: Y16469.00 -------------------------------------------------------------------------------- Y16469.00 [Q16-5H-E] Survey Year: 2004 PRIMARY VARIABLE SELF-ESTEEM - I FEEL I DO NOT HAVE MUCH TO BE PROUD OF I feel that I do not have much to be proud of. 2109 1 Strongly Disagree 2576 2 Disagree 259 3 Agree 59 4 Strongly Agree ------- 5003 Refusal(-1) 4 Don't Know(-2) 12 TOTAL =========> 5019 MISSING(-7) 6476 Lead In: Y16468.00[Default] Default Next Question: Y16470.00 -------------------------------------------------------------------------------- Y16470.00 [Q16-5H-F] Survey Year: 2004 PRIMARY VARIABLE SELF-ESTEEM - I HAVE A POSITIVE ATTITUDE I take a positive attitude toward myself. 20 1 Strongly Disagree 228 2 Disagree 3074 3 Agree 1681 4 Strongly Agree ------- 5003 Refusal(-1) 3
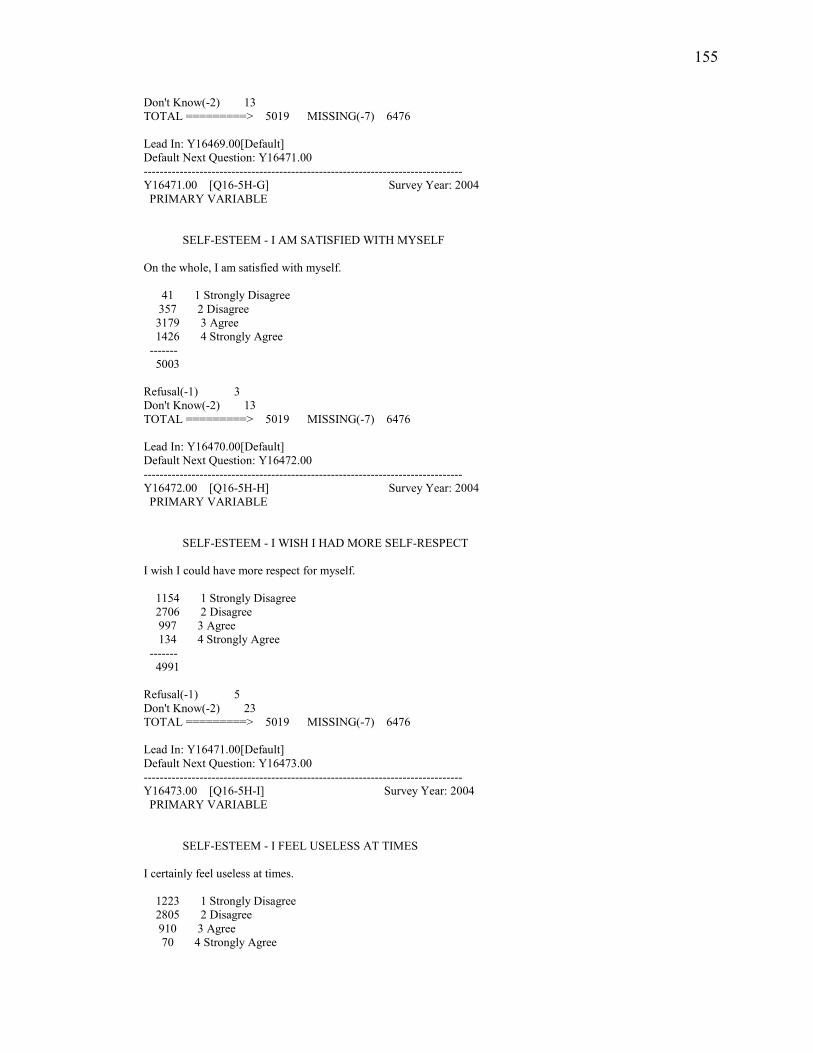
155
Don't Know(-2) 13 TOTAL =========> 5019 MISSING(-7) 6476 Lead In: Y16469.00[Default] Default Next Question: Y16471.00 -------------------------------------------------------------------------------- Y16471.00 [Q16-5H-G] Survey Year: 2004 PRIMARY VARIABLE SELF-ESTEEM - I AM SATISFIED WITH MYSELF On the whole, I am satisfied with myself. 41 1 Strongly Disagree 357 2 Disagree 3179 3 Agree 1426 4 Strongly Agree ------- 5003 Refusal(-1) 3 Don't Know(-2) 13 TOTAL =========> 5019 MISSING(-7) 6476 Lead In: Y16470.00[Default] Default Next Question: Y16472.00 -------------------------------------------------------------------------------- Y16472.00 [Q16-5H-H] Survey Year: 2004 PRIMARY VARIABLE SELF-ESTEEM - I WISH I HAD MORE SELF-RESPECT I wish I could have more respect for myself. 1154 1 Strongly Disagree 2706 2 Disagree 997 3 Agree 134 4 Strongly Agree ------- 4991 Refusal(-1) 5 Don't Know(-2) 23 TOTAL =========> 5019 MISSING(-7) 6476 Lead In: Y16471.00[Default] Default Next Question: Y16473.00 -------------------------------------------------------------------------------- Y16473.00 [Q16-5H-I] Survey Year: 2004 PRIMARY VARIABLE SELF-ESTEEM - I FEEL USELESS AT TIMES I certainly feel useless at times. 1223 1 Strongly Disagree 2805 2 Disagree 910 3 Agree 70 4 Strongly Agree
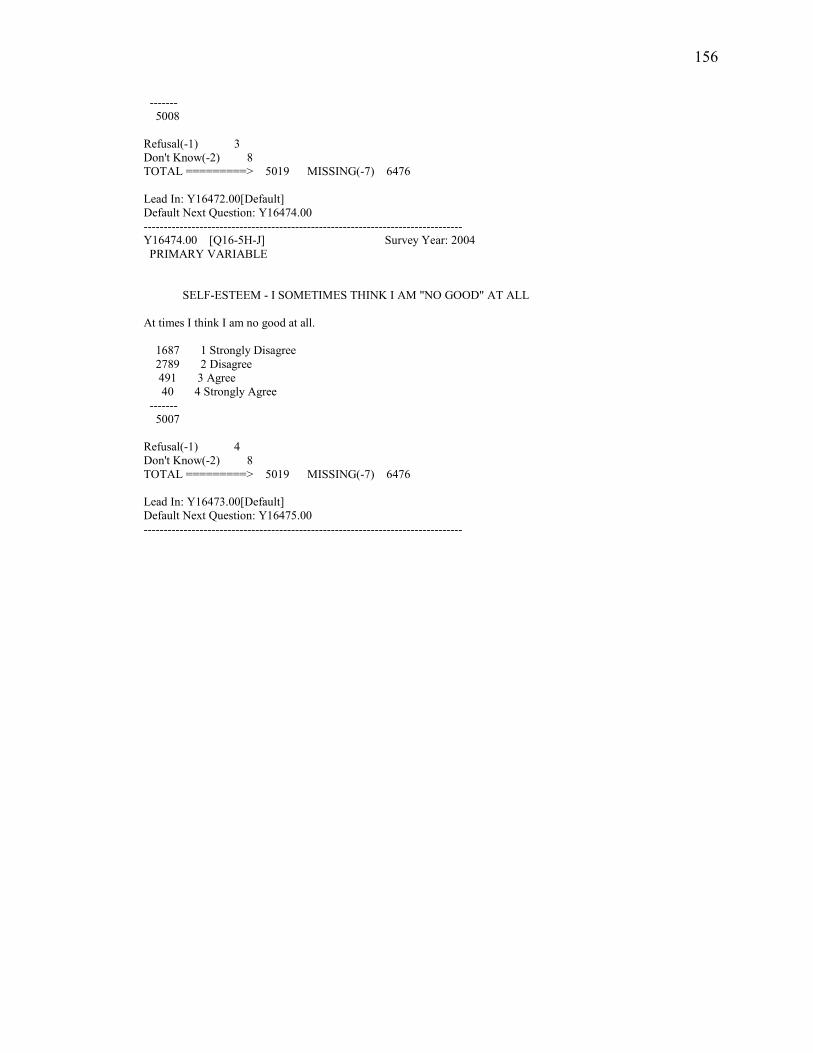
156
------- 5008 Refusal(-1) 3 Don't Know(-2) 8 TOTAL =========> 5019 MISSING(-7) 6476 Lead In: Y16472.00[Default] Default Next Question: Y16474.00 -------------------------------------------------------------------------------- Y16474.00 [Q16-5H-J] Survey Year: 2004 PRIMARY VARIABLE SELF-ESTEEM - I SOMETIMES THINK I AM "NO GOOD" AT ALL At times I think I am no good at all. 1687 1 Strongly Disagree 2789 2 Disagree 491 3 Agree 40 4 Strongly Agree ------- 5007 Refusal(-1) 4 Don't Know(-2) 8 TOTAL =========> 5019 MISSING(-7) 6476 Lead In: Y16473.00[Default] Default Next Question: Y16475.00 --------------------------------------------------------------------------------

157
APPENDIX B
Comprehensive Variable Histograms
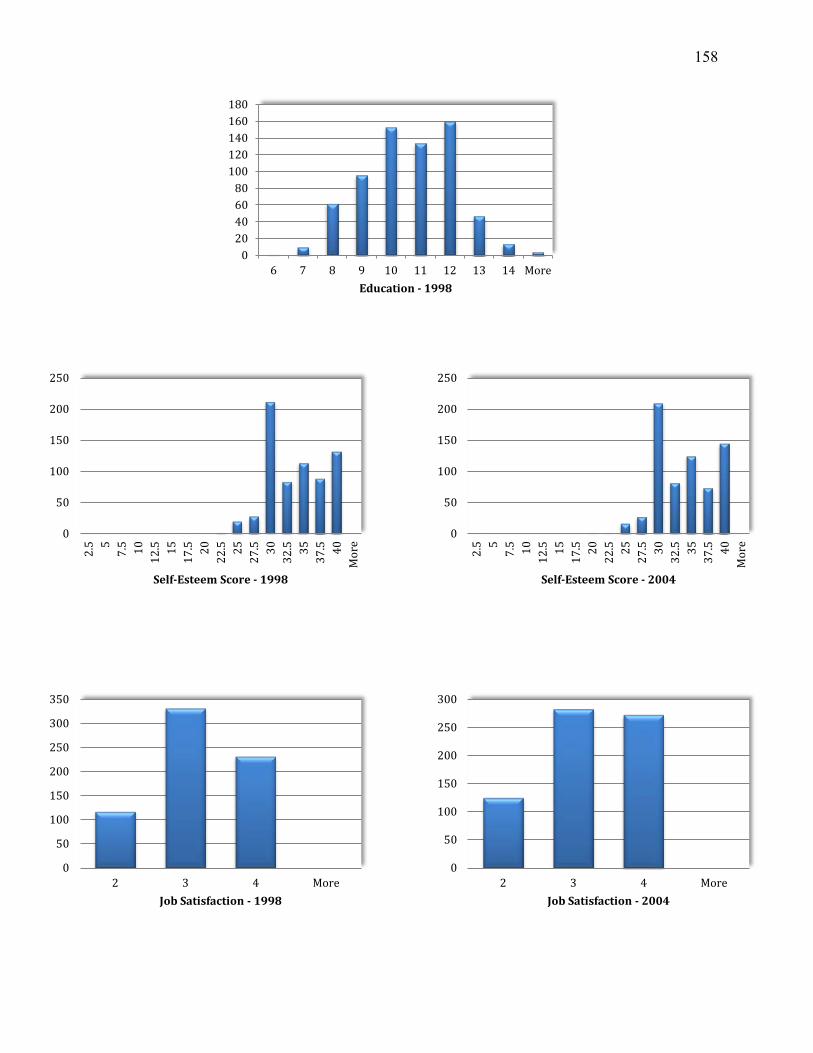
158
020406080
100120140160180
6 7 8 9 10 11 12 13 14 MoreEducation - 1998
0
50
100
150
200
250
2.5 5
7.5 10
12.5 15
17.5 20
22.5 25
27.5 30
32.5 35
37.5 40
Mor
e
Self-Esteem Score - 2004
0
50
100
150
200
250
2.5 5
7.5 10
12.5 15
17.5 20
22.5 25
27.5 30
32.5 35
37.5 40
Mor
e
Self-Esteem Score - 1998
0
50
100
150
200
250
300
2 3 4 MoreJob Satisfaction - 2004
0
50
100
150
200
250
300
350
2 3 4 MoreJob Satisfaction - 1998
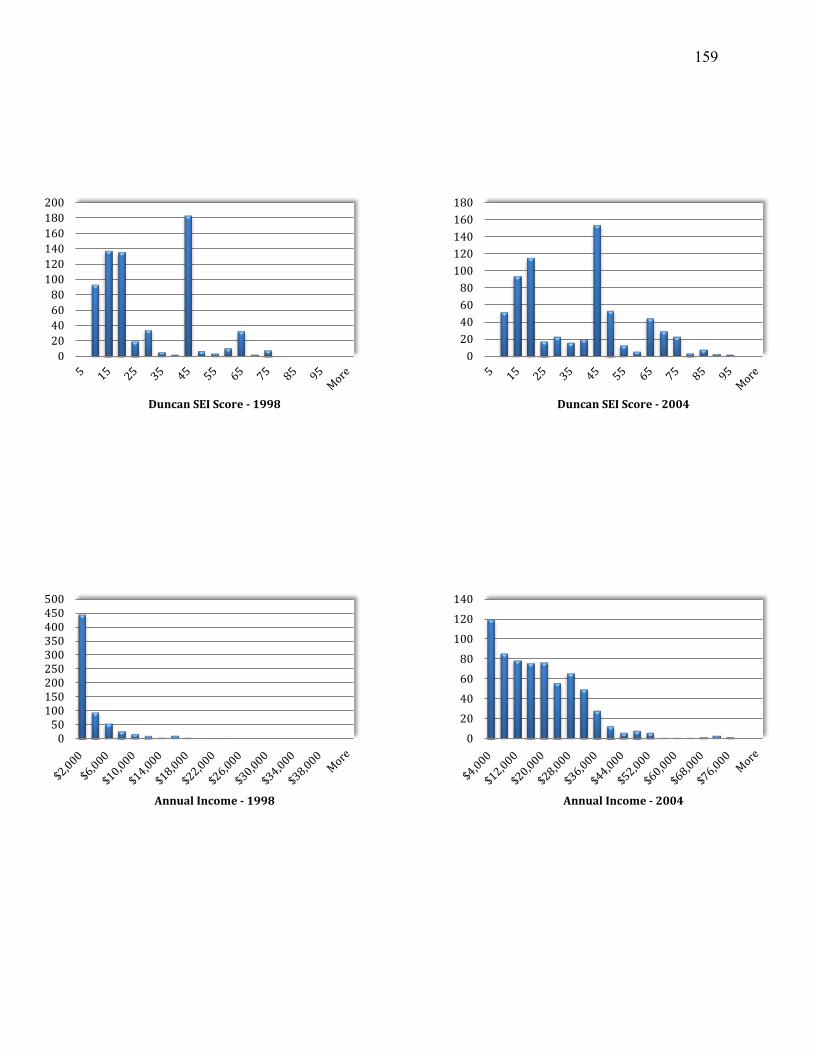
159
020406080
100120140160180
Duncan SEI Score - 2004
020406080
100120140160180200
Duncan SEI Score - 1998
050
100150200250300350400450500
Annual Income - 1998
020406080
100120140
Annual Income - 2004

160
APPENDIX C
Regression Summary Outputs
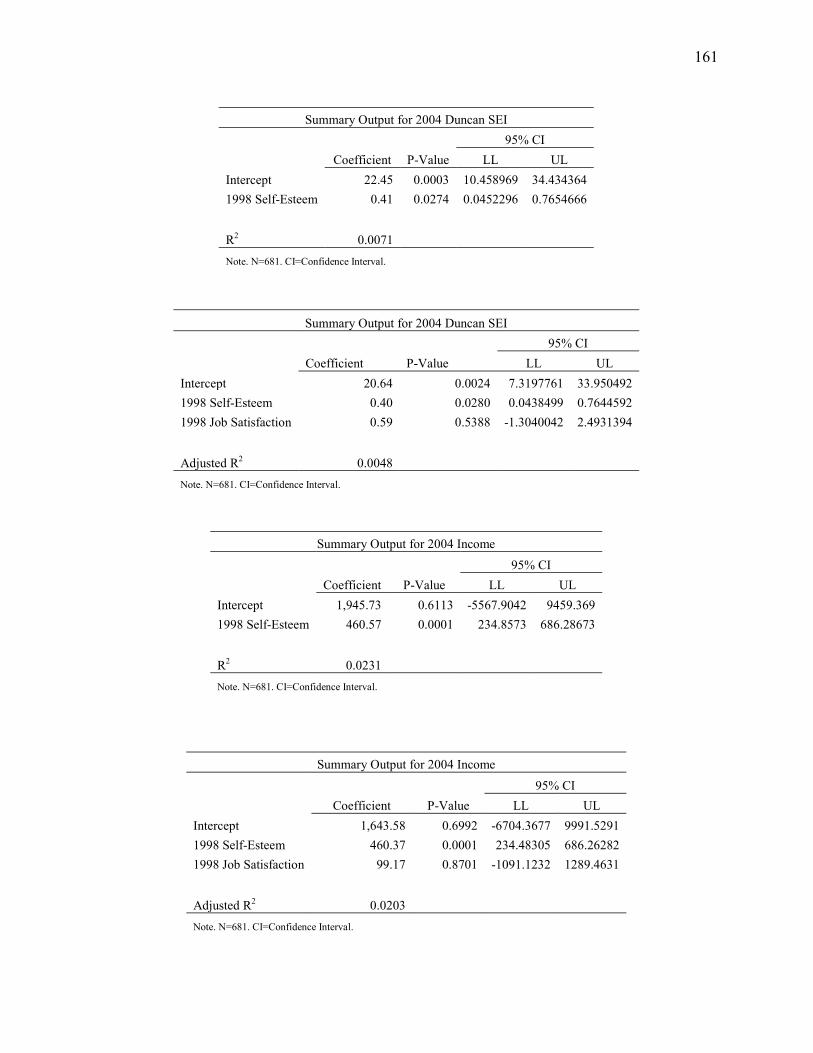
161
Summary Output for 2004 Duncan SEI
95% CI
Coefficient P-Value LL UL
Intercept 22.45 0.0003 10.458969 34.434364 1998 Self-Esteem 0.41 0.0274 0.0452296 0.7654666
R2 0.0071 Note. N=681. CI=Confidence Interval.
Summary Output for 2004 Duncan SEI
95% CI
Coefficient P-Value LL UL
Intercept 20.64 0.0024 7.3197761 33.950492 1998 Self-Esteem 0.40 0.0280 0.0438499 0.7644592 1998 Job Satisfaction 0.59 0.5388 -1.3040042 2.4931394
Adjusted R2 0.0048 Note. N=681. CI=Confidence Interval.
Summary Output for 2004 Income
95% CI
Coefficient P-Value LL UL
Intercept 1,945.73 0.6113 -5567.9042 9459.369 1998 Self-Esteem 460.57 0.0001 234.8573 686.28673
R2 0.0231 Note. N=681. CI=Confidence Interval.
Summary Output for 2004 Income
95% CI
Coefficient P-Value LL UL
Intercept 1,643.58 0.6992 -6704.3677 9991.5291 1998 Self-Esteem 460.37 0.0001 234.48305 686.26282 1998 Job Satisfaction 99.17 0.8701 -1091.1232 1289.4631
Adjusted R2 0.0203 Note. N=681. CI=Confidence Interval.
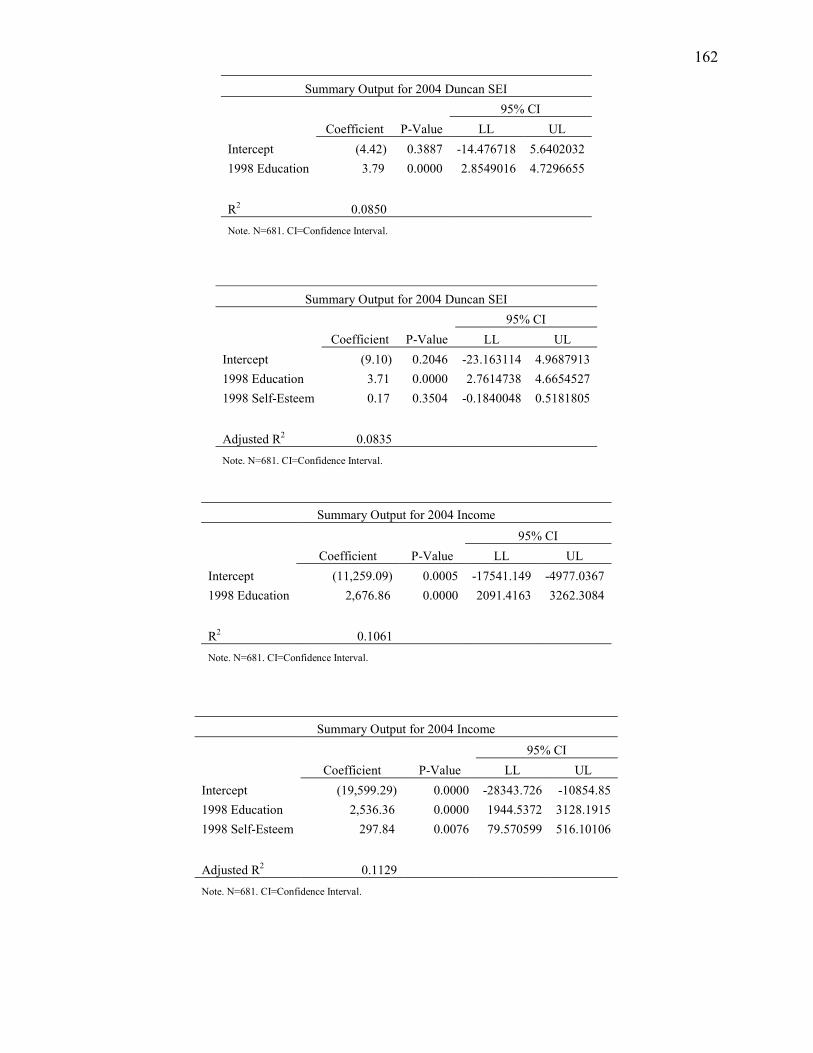
162
Summary Output for 2004 Duncan SEI
95% CI
Coefficient P-Value LL UL
Intercept (4.42) 0.3887 -14.476718 5.6402032 1998 Education 3.79 0.0000 2.8549016 4.7296655
R2 0.0850 Note. N=681. CI=Confidence Interval.
Summary Output for 2004 Duncan SEI
95% CI
Coefficient P-Value LL UL
Intercept (9.10) 0.2046 -23.163114 4.9687913 1998 Education 3.71 0.0000 2.7614738 4.6654527 1998 Self-Esteem 0.17 0.3504 -0.1840048 0.5181805
Adjusted R2 0.0835 Note. N=681. CI=Confidence Interval.
Summary Output for 2004 Income
95% CI
Coefficient P-Value LL UL
Intercept (11,259.09) 0.0005 -17541.149 -4977.0367 1998 Education 2,676.86 0.0000 2091.4163 3262.3084
R2 0.1061 Note. N=681. CI=Confidence Interval.
Summary Output for 2004 Income
95% CI
Coefficient P-Value LL UL
Intercept (19,599.29) 0.0000 -28343.726 -10854.85 1998 Education 2,536.36 0.0000 1944.5372 3128.1915 1998 Self-Esteem 297.84 0.0076 79.570599 516.10106
Adjusted R2 0.1129 Note. N=681. CI=Confidence Interval.


