Embed Size (px)
Citation preview

Experimental determination of REE partition coefficients
between zircon, garnet and melt: a key to understanding high-temperature crustal processes
Journal: Journal of Metamorphic Geology
Manuscript ID: JMG-14-0026.R2
Manuscript Type: Original Article
Date Submitted by the Author: n/a
Complete List of Authors: Taylor, Richard; Curtin University, Applied Geology
Harley, Simon; University of Edinburgh, School of Geosciences Hinton, Richard; University of Edinburgh, School of Geosciences Elphick, Stephen; University of Edinburgh, School of Geosciences Clark, Chris; Curtin University of Technology, Applied Geology Kelly, Nigel; University of Colorado, Boulder, Department of Geological Sciences
Keywords: zircon, garnet, rare earth elements, strain-modelling, UHT metamorphism

1
Experimental determination of REE partition coefficients 1
between zircon, garnet and melt: a key to understanding 2
high-temperature crustal processes 3
R.J.M. TAYLOR,1* S.L. HARLEY,2 R.W. HINTON,2 S. ELPHICK2, C. CLARK1 AND N.M. 4
KELLY3 5
1 Department of Applied Geology, Curtin University, GPO Box U1987, Perth WA 6845, Australia 6
2 School of GeoSciences, University of Edinburgh, Edinburgh EH9 3JW, UK 7
3 Department of Geological Sciences, University of Colorado, Boulder CO, USA 8
9
*Corresponding Author- email: [email protected] phone: +61(0) 8 9266 7625 10
11
Page 1 of 47

2
ABSTRACT 12
The partitioning of rare earth elements (REE) between zircon, garnet and silicate melt 13
was determined using synthetic compositions designed to represent partial melts 14
formed in the lower crust during anatexis. The experiments, performed using 15
internally heated gas pressure vessels at 7 kbar and 900–1000 °C represent 16
equilibrium partitioning of the middle to heavy REE between zircon and garnet 17
during high-grade metamorphism in the mid to lower crust. The DREE (zircon/garnet) 18
values show a clear partitioning signature close to unity from Gd to Lu. Because the 19
light REE have low concentrations in both minerals, values are calculated from strain 20
modelling of the middle to heavy REE experimental data; these results show that 21
zircon is favoured over garnet by up to two orders of magnitude. The resulting general 22
concave-up shape to the partitioning pattern across the REE reflects the preferential 23
incorporation of middle REE into garnet, with DGd (zircon/garnet) ranging from 0.7–24
1.1, DHo (zircon/garnet) from 0.4–0.7, and DLu (zircon/garnet) from 0.6–1.3. There is 25
no significant temperature dependence in the zircon-garnet REE partitioning at 7 kbar 26
and 900–1000 °C, suggesting that these values can be applied to the interpretation of 27
zircon-garnet equilibrium and timing relationships in the UHT metamorphism of low-28
Ca pelitic and aluminous granulites. 29
30
31
Key words: zircon; garnet; rare earth elements; strain modelling; UHT 32
metamorphism 33
34
Page 2 of 47

3
35
INTRODUCTION 36
One of the most challenging applications of zircon geochronology is to define the 37
ages of events in high-grade metamorphic terranes, most of which have experienced 38
complex and polyphase P–T histories. Linking zircon growth and modification zones 39
to specific metamorphic events is, in principle, achievable by identifying and using 40
reliable chemical signatures. For example, the Ti content and REE patterns of zircon 41
can be tied to temperature and equilibration with coexisting minerals and which are 42
independent of the U-Pb system (e.g. Rubatto, 2002; Kelly & Harley, 2005; Tomkins 43
et al., 2005; Harley & Kelly, 2007; Harley et al., 2007; Rubatto & Hermann, 2007b; 44
Baldwin & Brown, 2008; Clark et al., 2009; Hermann & Rubatto, 2009; Kotková & 45
Harley, 2010; Schoene et al., 2010; Marsh et al., 2012; Jiao et al., 2013; Korhonen et 46
al., 2013; Harley & Nandakumar, 2014; Taylor et al., 2014). 47
As a modally abundant and important sink for trace elements such as Y and 48
the heavy REE (e.g. Bea et al., 1994; Hermann, 2002; Rubatto & Hermann, 2003), 49
garnet also acts as a key competitor with zircon for the middle to heavy REE in high-50
grade metamorphism and anatexis, with many studies using textural relationships 51
between these minerals to infer equilibrium trace element signatures (Harley et al., 52
2001; Rubatto, 2002; Rubatto & Hermann, 2003; Whitehouse & Platt, 2003; Hokada 53
& Harley, 2004; Kelly & Harley, 2005; Buick et al., 2006). However, at granulite 54
facies conditions there remains some uncertainty as to the temperature dependence 55
and magnitude of the equilibrium distribution coefficient of the REE (DREE) between 56
zircon and garnet, with two possibilities being proposed based on combinations of 57
empirical and experimental observations as follows. 58
Page 3 of 47

4
(a) The distribution of MREE–HREE describes a flat pattern with values 59
remaining at unity, or slightly favouring garnet throughout the middle and heavy 60
REE, both for UHT (T>900 °C) conditions (Harley et al., 2001; Hokada & Harley, 61
2004; Kelly & Harley, 2005) and more typical granulite facies temperatures (750-62
900C: Whitehouse & Platt, 2003; Harley & Kelly, 2007). This interpretation of D is 63
based principally on zircon-garnet REE determinations from granulite facies mineral 64
assemblages in pelites and leucogranitic rock types. 65
(b) The distribution of MREE–HREE describes a steep pattern with 66
approximately an order of magnitude increase in D values towards the HREE, which 67
strongly favours zircon over the typical range of granulite facies temperatures (750–68
900 °C) (Rubatto, 2002; Hermann & Rubatto, 2003; Buick et al., 2006). This model, 69
proposed on the basis of zircon-garnet REE measurements from granulite migmatites 70
and eclogite, has found some support in the experimental results of Rubatto and 71
Hermann (2007a), the only experiments so far performed to address this problem. 72
Those experiments indicated that near-equipartitioning of the MREE–HREE between 73
zircon and garnet (DHREE near unity and DGd = DYb) under UHT conditions (1000 °C), 74
whereas steep HREE distribution patterns (DHREE >5 and increasing from Dy to Lu) 75
reflect equilibrium at more normal granulite temperatures of 800–850 °C. However, 76
although the Rubatto and Hermann (2007a) experiments are significant in 77
demonstrating the importance of understanding the distribution of REE between 78
zircon and garnet, they are not directly applicable to the granulite facies and UHT 79
metamorphism of pelites and pelitic migmatites in the middle crust (800–1000 °C and 80
6–12 kbar: (e.g. Harley, 1989; Brown, 2007) as they were conducted at 20 kbar and 81
involved garnets with appreciable Ca contents. 82
Page 4 of 47

5
In the present communication we report the results of experiments carried out 83
to fill this gap between the natural rock studies and laboratory-based determinations 84
of DREE (zircon/garnet). Experiments have been conducted in internally heated gas 85
pressure vessels using synthetic starting materials based on realistic mineral and melt 86
compositions to produce DREE (zircon/garnet) values from measured mineral REE 87
concentrations. The P-T conditions of these experiments, 900°C–1000 °C and 7 kbar, 88
complement the previous 20 kbar experiments of Rubatto and Hermann (2007a) and 89
are highly relevant to the interpretation of zircon–garnet mineral and zircon–garnet–90
melt relationships during mid- to deep-crustal metamorphism and partial melting of 91
pelites under UHT conditions. 92
Several tests are applied to the experimental and analytical methodology to 93
ensure the dataset is a robust and accurate determination of zircon–garnet partitioning. 94
The experimental data are evaluated using a strain modelling approach (Blundy & 95
Wood, 1994) which produces an excellent fit for the middle to heavy REE with 96
realistic values of the crystallographic site parameters. The strain model allows 97
estimation of the partition coefficients of LREE between the phases, which are not 98
determined from the experiments directly. 99
100
EXPERIMENTAL METHODS 101
Choice of bulk compositions and experimental conditions 102
The experiments have been designed to simulate, garnet–melt and zircon–garnet–melt 103
trace element relationships established during melting of fertile pelite protoliths in the 104
middle to deep crust during high-grade metamorphism and anatexis. Hence, the 105
experiments have been run at 900 °C, 950 °C and 1000 °C at 7 kbar in internally 106
heated gas apparatus and the melt composition has been chosen to be appropriate to 107
Page 5 of 47

6
these conditions. An initial pilot study at 5 kbar was run to determine the most 108
reliable method for determining trace element compositions of zircon (Appendix S1). 109
This pilot study also included two experiments carried out at different run durations 110
(45 hours and 468 hours) to evaluate the effect of experimental run time on the 111
zircon–melt partitioning results and hence allow an assessment of whether 112
equilibrium was approached in the main set of experiments. 113
The experimental protocol of Carrington & Harley (1995), who determined 114
biotite-bearing phase equilibria and related melt compositions in the KFMASH 115
system, were followed in the selection of the melt composition. A model 116
peraluminous granitic NKFMASH melt composition reflecting that formed from the 117
partial melting of pelitic rocks with intermediate Fe–Mg ratios during anatexis 118
(Harley & Carrington, 2001), has been used here as the basis for the starting gel 119
compositions (XMg = 0.31–0.52; ASI = 1.3–1.8). The major-element composition of 120
the starting materials is reported in Table 1. Water was added to the experimental 121
charges in order to produce H2O-undersaturated melts with a range of water contents 122
(3–4 wt% H2O) comparable to those produced during the anatexis of pelitic rocks. 123
Starting materials 124
All experiments used mixtures of two gels as starting materials (Gels G3 and G4, 125
Table 1). Gel starting materials were produced using the ‘co-precipitation gel’ method 126
(Hamilton & Henderson, 1968; Biggar & O'Hara, 1969) using reagent grade materials 127
for major and trace elements. Gels have several advantages over other starting 128
materials such as sintered oxides or rock powders such as their very fine grain size 129
(~10 times smaller than sintered oxides) and their flexibility in making customised 130
compositions involving many major and trace components. Gels also have the 131
advantage of creating a homogenous starting material without the need for multiple 132
Page 6 of 47

7
fusions and grinding (Hamilton & Henderson, 1968). Further details on the use of 133
starting materials can be found in Appendix S1. 134
Experimental setup 135
A total of 8 experimental runs were performed for this study, each containing 3–6 136
capsules, using the internally heated gas pressure vessels at The NERC Recognised 137
Experimental Geoscience Facility, University of Edinburgh. Experiments were 138
performed at 7 kbar and 900–1000 °C and run for 220–264 hours. Internally heated 139
gas pressure vessel procedures follow those described by Carrington & Harley (1995), 140
leading to precisions in temperature of ±10 °C and in pressure of ±0.1 kbar. Internally 141
heated gas pressure vessels allow ƒO2 to be maintained constant over the long 142
durations of this type of experiment (e.g. Burnham & Berry, 2012). 143
Runs used 20 mg of starting material, including 3–4 wt% H2O loaded into 144
Ag50Pd50 metal capsules with 2mm external diameters. This capsule material is highly 145
resistant to the absorption of Fe from the experimental charge. Up to six 2 mm 146
diameter capsules were placed within a Mo container in the furnace vessel with two 147
thermocouples placed 1/3 and 2/3 of the way along the length of the capsule to 148
monitor temperature gradients. Tantalum chips were placed in the Mo container to 149
help maintain an oxygen fugacity appropriate for melting under reducing conditions 150
during the runs, close to 1 log unit below QFM (Carrington, 1993; Carrington & 151
Harley, 1995). An initial test on promoting garnet growth demonstrated the best 152
results if the starting material had been further reduced prior to the experiments. 153
Therefore gel starting materials for garnet-bearing experiments were reduced to one 154
log unit above iron-wustite (IW+1) at 900 °C in a H2–CO2 1 atm gas-mixing furnace 155
prior to loading into experimental capsules. Care was taken to ensure the tantalum did 156
Page 7 of 47

8
not interfere with either the thermocouples or the capsules. Full details on the run 157
conditions for these experiments can be found in Table 2. 158
The 5 kbar pilot study included short duration runs, single-stage runs at 1050 159
°C as well as runs with simple, stepped and sawtooth temperature drops. These tests 160
demonstrated that a single down-temperature stepped approach was highly successful 161
in ensuring nucleation of abundant acicular zircon, but could not generate zircon 162
coarse enough for analysis by SIMS as single grains. Following these results, the 7 163
kbar experiments involved a two-stage heat-settling process in which all experiments 164
were heated to 1050 °C for at least 2 hours at the start of the experiment, then brought 165
down to the run temperature over a period of approximately 10 minutes. After this 166
short-term pre-equilibration stage the experiments were held at the required run 167
temperature for the remaining duration of the experiment (220–264 hours). This 168
initial temperature overstep/heat-settling approach was adopted in order to ensure that 169
all Zr is initially dissolved in melt (in the case of the low-Zr gel) and promote 170
dissolution of any early-nucleated zircon, and encourage zircon crystallisation 171
through oversaturation (Watson & Harrison, 1983) as temperature is decreased to the 172
final run temperature. 173
RUN PRODUCTS 174
Full details on the imaging and analytical techniques used for experimental and 175
natural samples in this study can be found in Appendix S1. Experimental run products 176
were imaged on the SEM prior to analysis using the Back Scattered Electron (BSE) 177
detector to examine textures and select areas for analysis. Glass formed from the 178
quenching of the granitic melt comprises ~80% of the run product, the remainder 179
generally being zircon and garnet grains crystallised during the experiment, and minor 180
orthopyroxene (<5 vol%) inferred from its textural relations to have formed in the 181
Page 8 of 47

9
glass as the experiments are quenched. Figure 1 shows BSE images of typical run 182
products, and high resolution EDS images for Fe and Mg of garnet and glass. 183
Zircon crystals, easily recognised by their high BSE response compared to the 184
glass (Fig. 1), form approximately 7–15% by volume of the experimental charge. 185
Experiments consistently produced zircon grains up to 15 µm in length and up to 3–5 186
µm in diameter, with some larger grains, variably distributed throughout the 187
experimental capsule. No zoning is visible in the grains using BSE imagery, though 188
the small grain size may make any zoning difficult to detect. Although the usual grain 189
size of the zircon produced in the experiments is too small for a single spot analysis 190
with the ion microprobe the variable spatial distribution, density and clustering of 191
crystals makes them ideal for the production of zircon–melt mixing lines. The REE 192
composition of the average zircon in each run can be extrapolated by linear regression 193
of these mixing lines for each trace element, following the approach adopted by 194
Rubatto and Hermann (2007a). Rubatto & Hermann (2007a) demonstrated that this 195
approach is a viable method for constraining experimental zircon REE concentrations, 196
even when extrapolating from considerably lower zircon contents (1–5 vol%) than 197
those achieved here (up to 25%, 7 kbar; up to 50%, 5 kbar pilot study). The linear 198
regression approach was developed during the 5 kbar pilot study and subsequently 199
adopted for zircon REE analysis in this study. 200
Up to 12% of the volume of the capsule is composed of newly formed garnet 201
(Alm47-60Pyp39-52; XMg = 0.40–0.47) with grain sizes up to 40 µm. The largest 202
variation in garnet chemistry is between the two 900 °C runs (run z26-1: XMg = 0.40; 203
run z26-4: XMg = 0.47; Table 4). Oxide values based on 12 oxygens and calculated 204
assuming full site occupancy suggest that there is some Fe2O3 component in garnet 205
from experiment z26-4, potentially elevating the XMg value in this experiment. If the 206
Page 9 of 47
10
average of the garnet values for these two runs is used (XMg = 0.44) then almost no 207
variation in garnet chemistry is evident in this study. There was a variation in the 208
modal proportion of garnet in the runs, with the higher temperature runs (1000 °C) 209
containing a larger number of garnets grains that were also the largest in size (Fig. 1). 210
This is considered to reflect more favourable growth kinetics in granitic melts at 211
higher temperature. 212
213
EXPERIMENTAL RESULTS 214
Melt (glass) compositions 215
In all experiments clean, zircon-free melt patches or areas were analysed for the REE, 216
Zr, Hf, Y, P and Li contents, referenced against Si. Clean melt analyses are important 217
in anchoring one end of the mixing line for zircon REE regression. These areas were 218
also analysed by electron microprobe for their major-element compositions so that the 219
SIMS REE and Zr measurements could be correctly converted into ppm. These trace-220
element contents are reported along with major-element compositions of the 221
experimental glasses in Table 3. 222
Melts (glass) from all experiments at 900 °C, 950 °C and 1000 °C have similar 223
major-element compositions, with SiO2 contents ~65–66%. These melts also have 224
very similar REE concentrations (Table 3) with Yb at 1.7–2.8 ppm (in zircon–garnet 225
runs), a strong negative Eu anomaly (as dictated by the Eu-depleted starting material 226
composition), and LREE increasing from 5.7–8.0 ppm at Sm to 34–42 ppm at La. The 227
compositions are close to those predicted from modelling of the initial starting 228
compositions and expected abundances of crystallised zircon. Errors on these analyses 229
are based on propagation of the analytical uncertainties (< 5–15% error on each 230
Page 10 of 47

11
element) along with the point-to-point variations in concentration (2–4 melt analyses 231
in each experiment). 232
The Zr contents of the zircon-saturated melts produced in these experiments is 233
compared with previous experimental and modelling studies (Watson & Harrison, 234
1983; Boehnke et al., 2013) that demonstrate a consistent and systematic variation of 235
saturation Zr content with temperature. This comparison is depicted in terms of 236
ln(DZr) plotted against inverse temperature (10000/T) in Fig. 2. The melt Zr data from 237
this study vary systematically with inverse temperature, as required by zircon–melt 238
equilibrium, but are slightly offset in Zr concentration to higher values than those 239
given by the predictive model of Watson & Harrison (1983) and its updated 240
calibration by Boehnke et al. (2013). This offset (to higher ln(DZr) at a given T) may 241
be an effect of the Ca-free chemistry of the model granitic melts in our runs. 242
Melt compositions in all experiments approximate those of granitic minimum 243
melts in near-haplogranitic systems (NKFMASH), and lie near the model melt 244
composition of Carrington & Harley (1995) for their intermediate XMg composition 245
[XMg = 0.31–0.52]. Melt REE contents are similar to HREE-depleted granite 246
compositions and differ from the starting gel granite composition in being depleted in 247
HREE following the growth of HREE-bearing phases, as expected and inherent in the 248
experimental design. 249
Zircon compositions and zircon/melt distribution coefficients (DREE) 250
Between 30 and 45 SIMS analyses of zircon-melt mix areas with differing 251
proportions of zircon were used to calculate the REE contents of the average zircon 252
produced in each experiment. Each zircon REE (e.g. Dy, Yb) was estimated 253
individually using linear regression of ppm (REE) against Zr wt% in the analyses, and 254
the zircon REE patterns then established collectively from all of the element-specific 255
Page 11 of 47

12
regressions (see Appendix S1 for further details and example regressions). Maximum 256
Zr contents for the zircon–melt mix regression lines used to reconstruct these zircon 257
MREE–HREE compositions were between 75,000–130,000 ppm (approx. 15–25% 258
zircon). Values for the zircon REE concentrations are presented in Table 4 and Fig. 259
3a. 260
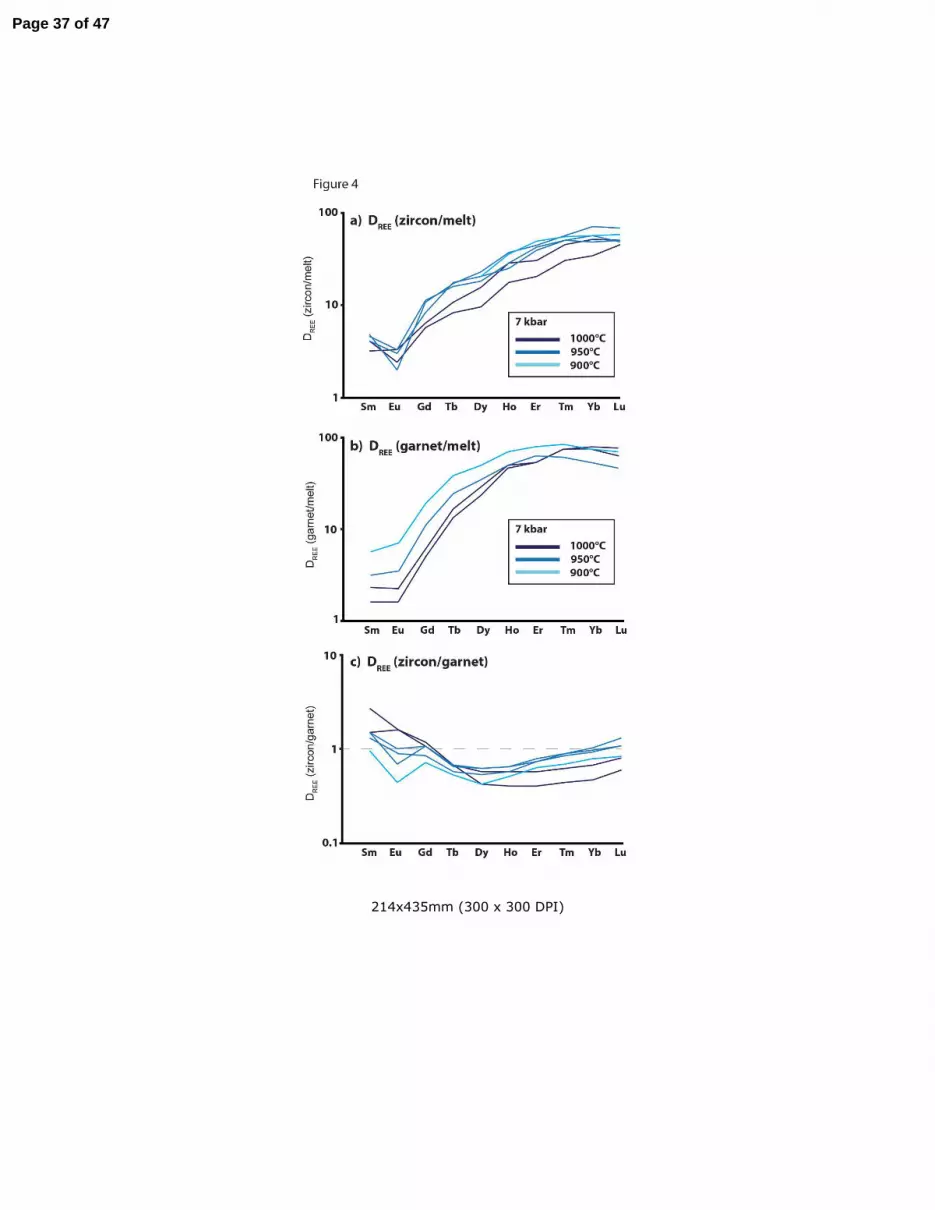
DREE (zircon/melt) values are presented in Table 5 and Fig. 4a. DREE are 4–5 at 261
Sm, decrease to near unity at Eu (though this is difficult to measure with high 262
precision given the low concentrations in each phase) and then increase towards the 263
HREE (DHREE), with DGd 8–14, and DLu 52–68. These DREE are comparable to those 264
obtained in previous experimental studies (e.g. Dickinson et al., 1981; Okano et al., 265
1987; Rubatto & Hermann, 2007a) and are very similar to the natural rock study of 266
zircon and related melt inclusions by Thomas et al. (2002). 267
Garnet/melt distribution coefficients (DREE) 268
Garnet and melt major element and REE compositions are presented in Tables 3 and 269
4. DREE (garnet/melt) values are presented in Table 5 and Fig. 4b. The XMg values for 270
each phase are close to those expected from the initial bulk composition, and define 271
Kd (Fe–Mg) values (0.83–1.87) that conform to previous equilibrium experiments in 272
KFMASH and related systems (Ellis, 1986; Carrington & Harley, 1995). All garnet 273
REE analyses were on areas of grains large enough for single spots using SIMS 274
analysis with a field aperture in the secondary column. A test study of garnet–melt 275
partitioning was performed in a zircon-absent run (z26-1, 900 °C, 7 kbar), to enable 276
the determination of DREE (garnet/melt) in a simple, single-mineral experiment based 277
on multiple garnet and glass analyses. DREE (garnet/melt) values show the LREE 278
partition into the melt, while the middle to heavy REE partition strongly into the 279
garnet, with DGd ~10 and DHREE ~100. The glass was analysed using the electron 280
Page 12 of 47

13
microprobe to determine major element compositions along with Zr and Y. The 281
analyses showed that there was no significant or consistent zoning in the glass 282
surrounding the garnet in these runs, with variations within 2% being smaller than 283
analytical error. High resolution EDS images of Fe and Me (Fig. 1e–f; run z33, 1000 284
°C, 7 kbar) show flat profiles in both the garnet and the surrounding melt in terms of 285
major element composition. A close approach to major element equilibrium is 286
therefore suggested, supported by the measured Grt/melt Fe–Mg KD values that are 287
consistent with the results of Ellis (1986) and Carrington & Harley (1995). The 288
systematic variation of XMg in garnet relative to melt with temperature is consistent 289
with previous experimental data (e.g. Ellis, 1986) and also reported by Rubatto & 290
Hermann (2007a) as supporting garnet growth during the final run temperature (not 291
the cooling step). Care had to be taken in the garnet analyses, as zircon inclusions 292
were often present at or just beneath the surface (e.g. Fig. 1b, d). Careful selection of 293
target areas from BSE images combined with attention to Zr content in the analysis 294
was used to discriminate zircon-contaminated analyses. The very shallow depth of 295
analysis pits from the ion microprobe decreases the likelihood of intersecting zircon 296
inclusions beneath the surface. 297
Four runs, ranging from 900–1000 °C, produced clean garnet analyses, free 298
from contamination by zircon grains or glass. DREE (garnet/melt) values for the 299
zircon-bearing runs (DGd 5–19, DHREE ~ 40–80) closely match those from the zircon-300
absent run (z26-1), despite very different total REE concentrations, showing that the 301
presence of zircon has not prevented the garnet grains from achieving REE 302
equilibrium with the melt. Whilst D (garnet/melt) values for the HREE are very 303
similar across the temperature range studied, D (garnet/melt) values for the MREE 304
Page 13 of 47

14
show a tendency to decrease with increasing temperature, consistent with the trends 305
reported by Nicholls & Harris (1980). 306
Zircon/garnet distribution coefficients (DREE) at 7 kbar 307
The garnet REE concentrations from ion microprobe analysis, combined with zircon 308
REE concentrations produced from regression analysis in the same run can be used to 309
determine DREE (zircon/garnet) values for 900–1000 °C and 7 Kbar. This was done 310
for all four experiments that produced clean garnet data (900 °C, z26-4; 950°C, z31-2; 311
1000 °C, z33-2 & z33-4). Two further experiments at 950 °C (z31-1 & z31-3) 312
produced zircon data, but the garnet analyses were contaminated by small melt 313
inclusions, identified by an increased LREE content without any increase in measured 314
Zr. The DREE (zircon/melt) data for these two capsules was combined with the DREE 315
(garnet/melt) for run z31-2 to produce two additional DREE (zircon/garnet) datasets for 316
950 °C. This was deemed a valid approach as all three experimental capsules were 317
from the same run, using the same starting material and run conditions. Data for the 318
DREE (zircon/garnet) is presented in Table 5 and Fig. 4c. Errors on calculated DREE 319
(zircon/garnet) are based on the 95% confidence limits for the regressed zircon 320
composition and the analytical error on the glass and garnet compositions from ion 321
microprobe analysis, leading to typical errors in DHREE of ±0.1–0.3 at Lu and ± 0.1 at 322
Dy, and of ± 0.2–0.7 at Sm. 323
All DREE (zircon/garnet) results show the same general pattern, broadly a 324
‘concave up’ shape with Sm favouring zircon, the MREE favouring garnet and the 325
HREE approximately equipartitioned (i.e. DHREE (zircon/garnet) = 1). DSm shows 326
moderate variation, probably as a consequence in the errors in extrapolation of zircon 327
Sm values from the mixing lines when D (zircon/melt) is close to unity. Although D 328
values for Eu are also variable, due to the low concentrations present in the 329
Page 14 of 47
15
experiments, the average DEu is ~1. Eu therefore appears to mark the ‘pivot’ where 330
the REE change from favouring zircon, in the LREE (see later modeling) and Sm, to 331
favouring garnet for Gd and beyond through the HREE. For the majority of runs the 332
strongest partitioning into garnet occurs at Dy, with DDy (zircon/garnet) ranging from 333
0.5–0.7 ± 0.1–0.2. DHREE approach values around unity at Er and beyond, e.g. DLu 334
varies from 0.6–1.3 ± 0.1–0.3. One run at 1000 °C (z33-2) recorded DMREE-HREE 335
values favouring garnet (~0.4–0.6; Fig. 4c), whilst the other 1000 °C run, which had 336
lower REE in zircon, resulted in a similar DMREE–HREE (zircon/garnet) pattern but at 337
slightly higher D values (0.6–0.8). 338
The experimental design employed allows for these DMREE-HREE 339
(zircon/garnet) results to be tested by analysis of zircon inclusions in garnet. If there is 340
an order of magnitude variation in the DMREE–HREE values for these elements, 341
increasing towards the heavier HREE such as Yb (e.g. Rubatto, 2002; Hermann & 342
Rubatto, 2003; Buick et al., 2006), then garnet analyses with large numbers of zircon 343
inclusions, as monitored by image analysis and total Zr content, would show 344
significant increases in the HREE compared to inclusion-free garnet analyses. The 345
capsules that had large numbers of garnet grains were analysed with the deliberate 346
aim of sampling inclusion-bearing garnets for comparison with the ‘clean’ analyses 347
(examples of zircon inclusions can be seen in Fig. 1d). 348
Garnet analyses from capsule z33-2 (1000 °C) had Zr contents ranging from 349
~1000 ppm (inclusion poor) to over 20,000 ppm (many inclusions: estimated to be 350
equivalent to ~4 wt% zircon) covering over an order of magnitude variation in the 351
amount of zircon in the analysis. The HREE contents of the garnets only vary by 352
approximately 10% (<10% for the MREE), and show no correlation with Zr content, 353
Page 15 of 47

16
supporting the conclusion that the distribution of the HREE between zircon and 354
garnet is very close to 1:1 at 1000 °C. 355
356
DISCUSSION 357
Tests and limitations of experimental method 358
The methodology for determining DREE has been checked and assessed using the 359
alternative technique of estimating DREE based on modal analysis and mass balance. 360
The approach to equilibrium in these experiments has then been assessed as a group 361
using a comparison of the main DREE (zircon/melt) set with DREE determined from an 362
experiment with a different effective melt composition; a time study of zircon REE 363
compositional change using results from a short-duration run and one longer-duration 364
run; and a determination of the effects of texturally recognizable disequilibrium, in 365
the form of microlite crystallization in melt, on resultant DREE. The short duration run 366
and textural disequilibrium runs are described in the 5 kbar pilot study (Appendix S1). 367
Zircon REE estimation: modal mass balance test of the mixing line approach 368
The zircon–melt mixing lines produced by spatially targeted microanalysis of 369
domains with differing zircon modes and hence wt% Zr can be compared, in simple 370
zircon–melt experiments, with zircon REE concentrations estimated based on image 371
analysis of the analysed ion microprobe pits, which are typically 20–25 µm in 372
diameter and 2–3 µm deep. As these pits are no deeper than the typical thickness of 373
the zircon grains the only material being analysed is that which was visible at the 374
surface of the original sample. 375
Appendix S1, Fig. 2 is a ‘before and after’ image showing the shallow depth 376
of the pits and their size in relation to the experimental zircons. The experimental run 377
Page 16 of 47

17
products were re-imaged using the SEM after they had been analysed on the ion 378
microprobe in order to pinpoint the exact location of the pits. The high BSE response 379
of zircon compared to the host glass enabled straightforward digital image review of 380
each area analysed and from that calculation of the modal proportion of zircon in each 381
data point on the regression line. This modal proportion data, regressed to 100%, 382
plotted against each REE provides a separate method for extrapolating zircon REE 383
concentration that is independent of the measured Zr concentration of each analysis 384
spot. The resultant zircon REE patterns based on this modal proportion method are 385
very similar to those determined using the mixing line approach (Appendix S1, Fig. 386
3). 387
Initial tests of approach to MREE–HREE equilibrium 388
Initial attempts at producing garnet resulted in an experiment (z26-6, conducted at 389
900 °C with 9 wt% H2O) that crystallised zircon and orthopyroxene (XMg = 0.35–0.5; 390
Al2O3 = 11–13%; up to 1 mm x 100 µm in size) instead of zircon and garnet. The 391
crystallization of orthopyroxene resulted in a melt chemistry that differed from the 392
zircon–garnet experiments in having an upward-sloping normalized HREE pattern, 393
consistent with mass balance considerations. The zircon HREE pattern calculated 394
using the mixing-line approach for this garnet-absent run was also upward sloping to 395
the heaviest HREE (LuN/GdN ~4). As a consequence, the resultant zircon/melt DHREE 396
values are identical to those calculated for the garnet-bearing experiments, DGd = 3.6 397
and DLu = 33.9. The maintenance of the same DHREE values despite the difference in 398
zircon and melt HREE contents provides good evidence in support of the attainment 399
of zircon–melt MREE–HREE equilibrium in the experiments as a whole. 400
Page 17 of 47

18
Further assessment of equilibrium 401
The validity of experimental approach to determining mineral/melt distribution 402
coefficients relies on both the zircon and garnet grains being in trace-element 403
equilibrium with the melt in which they form. 404
Zircon 405
The consistency of the zircon MREE–HREE data produced, despite whether they are 406
processed using chemical Zr mixing line or physical modal abundance criteria, shows 407
that the methodology is reliable, but does not in itself demonstrate equilibrium. A first 408
chemical test for equilibrium is whether the melt coexisting with zircon has a Zr 409
content consistent with zircon saturation at the experiment run conditions (Watson & 410
Harrison, 1983). The Zr contents of melts in our experiments vary systematically with 411
inverse temperature, consistent with a good approach to equilibrium (Fig. 2). 412
Apparent run temperatures calculated using our melt compositions and the Zr 413
saturation thermometer of Watson & Harrison (1983) and its updated re-calibration 414
(Boehnke et al., 2013) lie close to those of the experiments in this study (Fig. 2). The 415
reason for the positive offset in the values from this study compared to the modelled 416
values is unclear. The calculated ‘M’ values for the melts (0.8–1.1) fall outside the 417
range for which the Boehnke et al. (2013) model is calibrated (1.1–2.0). It is possible 418
that the lack of Ca in the bulk compositions used in our experiments is responsible for 419
this deviation from the expected model values, as Ca has twice the effect of the other 420
network modifiers when calculating the parameter ‘M’ (Watson & Harrison, 1983; 421
Boehnke et al., 2013). Rubatto & Hermann (2007a) demonstrated a negative offset in 422
Zr saturation data compared to the models (with a similar magnitude of variation as 423
that seen in this study), attributed to a possible pressure effect on the calibration that 424
is unlikely to be the case in this study. As well as a deviation from the expected model 425
Page 18 of 47

19
values there is also some variation between samples at the same temperature in this 426
study. The electron probe technique analyses a sample volume greater than that which 427
can be seen at the sample surface, potentially incorporating some minor proportion of 428
sub-surface zircon. 429
One source of disequilibrium lies in the very slow intracrystalline diffusion of 430
cations in zircon (Cherniak et al., 1997; Cherniak & Watson, 2003). For example, 431
Luo & Ayers (2009) and Burnham & Berry (2012) reported obvious sector and 432
asymmetric zoning using CL imaging in run product zircons of up to 50 µm diameter. 433
However, zircon grains produced in this study have maximum thicknesses of 5 µm 434
(more typically 1–2 µm), and in any one zircon–melt microanalysis spot there are 435
numerous of these fine grains, which would average out any potential sub-micron 436
scale zoning. In addition to the issues of zoning within larger zircon grains, Luo & 437
Ayers (2009) also highlighted the possibility of zones of REE-depleted melt around 438
large zircon grains due to slow REE3+ diffusion in the melt. However, this problem 439
has been largely discounted in light of the study of Burnham & Berry (2012), who 440
noted that because Zr diffusion is an order of magnitude slower than the REE3+ in a 441
silicate melt (Koepke & Behrens, 2001) it will be the rate-limiting step in zircon 442
growth, and therefore REE3+ in zircon should be in equilibrium with the melt. 443
Diffusion of P is expected to occur at a very similar rate to the REE within the melt 444
(e.g. Rapp & Watson, 1986) and therefore P, an important charge balancing ion in 445
zircon REE substitution, is also not considered to be rate limiting in terms of REE 446
equilibrium. This is consistent with the results of our short-duration time study 447
experiment, in which anomalously high MREE in the zircon can be attributed to 448
retarded zircon growth relative to REE availability. Furthermore, the mixing line 449
regression technique used in this study and that of Rubatto & Hermann (2007a) is less 450
Page 19 of 47

20
susceptible to localized melt REE depletion. If the melt was REE-depleted due to 451
zircon growth then the analyses sampling a small zircon volume would measure a 452
different melt composition to those sampling a large proportion of zircon, resulting in 453
a curved or kinked mixing line. There is no such curvature in zircon–melt mixing 454
lines in this study, which extend up to 45 wt% zircon in some 5 kbar pilot study 455
experiments, suggesting no REE depletion in melt proximal to growing zircon has no 456
impact on the results. The similarity of the zircon MREE–HREE estimated from 457
modal mass balance methods (Appendix S1) with those determined using the mixing 458
line approach supports this conclusion. 459
The arguments made above for equilibrium REE contents in zircon apply only 460
to the MREE–HREE, which are clearly partitioned into zircon relative to melt and so 461
lead to statistically significant mixing lines. As the LREE do not partition strongly 462
into the zircon structure (e.g. Hoskin & Schaltegger, 2003) mixing line fits are not 463
statistically significant from these elements. These, and Sm, are instead estimated in 464
the next section using strain modelling anchored by our experimental zircon–melt 465
DREE determined from the REE from Sm to Lu. 466
Garnet 467
The attainment of garnet–melt equilibrium can be evaluated by considering the extent 468
of zoning within the product garnet crystals. Only minor zoning in XMg was observed 469
in the experimental garnets, with the most significant zoning observed (experiment 470
z33-2) amounting to variation in XMg of only 0.02, with no observable core to rim 471
variation. The EDS images of Fe and Mg seen in Fig. 1e–f highlight the absence of 472
zoning within the experimental garnets. The zoning in HREE was assessed using 473
electron microprobe analysis of Y. Under the EMPA analytical conditions Y could be 474
measured to ± 8% relative, for total concentrations of ~1400 ppm. Variation of Y 475
Page 20 of 47

21
within a grain was within or similar to analytical error, less than 10% relative, and no 476
pattern of variation from core to rim was observed. Combined with the absence of 477
zoning in the experimental glasses, this evidence suggests that the garnets grown in 478
this study closely approach chemical equilibrium with the melt. 479
In some experiments garnets contain fine inclusions of zircon. Whilst imaging 480
was used to avoid obvious inclusions there nevertheless is some potential for zircon 481
inclusions to occur below the polished surface in the garnet and so affect the resultant 482
DREE (zircon/garnet) values. The 1000 °C experiments (z33-2, z33-4) contained 483
enough garnet to determine statistically consistent Zr contents using the electron 484
probe. The resulting Zr content, ~930 ± 32 ppm, was lower than the lowest Zr content 485
recorded from SIMS analysis (~1300 ± 20 ppm). This suggests that at least some 486
zircon, equivalent to 0.1 wt% of the analysed spot, may have been included in even 487
the best SIMS analysis. As a ‘worst case scenario’ test the data was modelled with all 488
the Zr in the SIMS analyses assumed to be due to zircon inclusions. The REE content 489
representing this proportion of zircon was removed from the garnet data to produce a 490
model zircon-free, ‘pure’ garnet and the DREE (zircon/garnet) values recalculated for 491
this new, modelled garnet composition. One experiment (z31-2, 950 °C) produced 492
‘model’ DREE (zircon/garnet) values that were ~1% (relative) different from the 493
measured data, while in the other 3 experiments the differences were less than 1%. 494
These calculations demonstrate that any unrecognized zircon inclusions in apparently 495
clean garnet analyses only influence the DMREE–HREE (zircon/garnet) data well within 496
their uncertainties and are therefore ignored. 497
Strain modelling of mineral–melt DREE 498
The measured zircon/melt and garnet/melt MREE–HREE distribution coefficients 499
have been plotted on Onuma Diagrams (Onuma et al., 1968)(e.g. Fig. 5a–d), which 500
Page 21 of 47

22
show the dependence of DREE values on ionic radius of the partitioning cation. The 501
logarithm of the distribution coefficients defines a parabolic shape on these diagrams, 502
with the apex of the parabola being at the optimal cation size. 503
Zircon–melt 504
In the case of zircon the distribution coefficients for the HREE from Lu to the MREE 505
at Sm, with the exception of Eu, show a strong dependence on ionic radius that fits 506
this parabolic shape, with a systematic increase in DREE value towards the smaller 507
ionic radii HREE. This is consistent with the ionic radius of the Zr4+ site being 508
smaller than the REE3+ cations. Ionic radii are obtained from Shannon (1976). 509
The experimental data has been evaluated using the mineral–melt partitioning 510
model developed by Blundy & Wood (1994)(Equation 1) which links the parabolic 511
shape of the Onuma diagram to the elastic properties of the site into which the cation 512
is substituting. The key variables in this modelling are the idealised ‘strain free’ site 513
radius (r03+) and the elastic response parameter (E
3+), for which fitted D0 values are 514
defined from the height of the Onuma parabola at the radius r03+, 515
516
Di = D0(M )
n+ × exp−4πNAEM
n+ 1
2r0(M )
n+ ri − r0(M )
n+( )2
+1
3ri − r0(M )
n+( )3
RT
. (1) 517
518
In this study the elastic strain model has been fitted assuming a relationship 519
between r0 and E (e.g. Draper & van Westrenen, 2007; van Westrenen & Draper, 520
2007), which for zircon-melt systems is anchored by the study of (Hanchar et al., 521
2001), rather than constraining r0 to the radius of Zr (e.g. Luo & Ayers, 2009). This 522
method (referred to in Table 6 as Hanchar and van Westrenen method) is preferred 523
Page 22 of 47

23
over a fixed r0, as many recent studies (e.g. van Westrenen & Draper, 2007) have 524
shown that r0 in almost all minerals is rarely identical to the radius of the site into 525
which the ion is partitioning, and can also vary with pressure and temperature (van 526
Westrenen & Draper, 2007). It is essential to fit the strain model to the zircon–melt 527
experiments in this study using this method, because of the absence of Sc, which 528
would constrain the other (low ionic radius) side of the parabola. As with the 529
measured DREE values the modelled values show no statistical variation with 530
temperature when examined using this approach. 531
Deviations of DEu from this simple one site strain model are systematic, and 532
can be explained by the Eu being dominantly present in the divalent state in the 533
experimental zircons. The values used to fit the parameters of the strain modelling 534
equation can be found in Table 6, with D0 representing the partition coefficient for an 535
ideally sized cation, E represents the elastic response of the site, and r0 the ionic 536
radius of the site. 537
The strain model approach anchored by our MREE–HREE zircon–melt data 538
allow estimates to be made for the LREE in zircon. The resultant values (Table 7) are 539
lower than all experimental and some empirical studies (e.g. Hinton & Upton, 1991; 540
Thomas et al., 2002), but lie close to the values of Sano et al. (2002). The 541
combination of the statistically reliable DMREE–HREE values obtained in the 542
experiments with the DLREE values calculated from strain modelling as fitted to those 543
MREE–HREE data is considered to provide the most reliable and internally consistent 544
set of DREE that can be extracted from this study (Table 7). 545
Garnet–melt 546
The measured DREE (garnet/melt) values show a very good correlation with ionic 547
radius, with peak D values occurring in the middle to heavy REE (Fig. 4b). Attempts 548
Page 23 of 47

24
to fit these measured DREE (garnet/melt) values to the strain model using 549
thermodynamic constraints and predictive modelling (Draper & van Westrenen, 2007; 550
van Westrenen & Draper, 2007) did not provide a good match with the measured 551
values, as the ‘best fit’ r0 values are too small. The predictive model produced from 552
those studies is particularly suited for anhydrous melting experiments typically at 2–3 553
GPa with garnets comprising a majorite component, and the authors state that it 554
poorly represents H2O-bearing experiments, and studies in lower pressure systems 555
with pyropic garnet (Draper & van Westrenen, 2007). In contrast, unconstrained 556
modelling of the lattice strain parameters (Blundy & Wood, 1994) yields a very good 557
fit to the experimental DREE (garnet/melt) data, aided by the ideal cation size (r03+ = 558
0.93– 0.98) being within the range for the MREE. 559
DREE (zircon/garnet) values (Fig. 6 and Table 7) have been produced from the 560
strain modelling equations by dividing the DREE (zircon/melt) by the DREE 561
(garnet/melt) modelled data. The key variables/parameters fitted to the experimental 562
results are summarised in Table 6. The derived DMREE–HREE lie near unity or slightly 563
favour garnet (<1), as expected from the measured experimental zircon/garnet data. 564
The 1000 °C modelled data are lower through the HREE and display a flatter DHREE 565
(zircon/garnet) pattern favouring garnet compared with the lower-T modelled data, 566
features attributable to a slightly smaller modelled D0 for garnet–melt at this 567
temperature. Whilst, as expected, the strain modelled data are very similar to the 568
measured values for the MREE–HREE, the modelled fits provide the only realistic set 569
of DREE values for the LREE due to the difficulty in measuring these elements using 570
the methods in this study. Therefore the strain-modelled values extracted here provide 571
the best evaluation of DREE (zircon/garnet) values for the whole suite of REE at 7 kbar 572
and 900–1000 °C and for Fe–Mg garnets with intermediate XMg. 573
Page 24 of 47

25
Comparison to other experimental data 574
There is only one other experimental dataset constraining DREE (zircon/garnet) 575
partition coefficients. Rubatto & Hermann (2007a) performed a series of piston 576
cylinder experiments at 20 kbar and 800–1000 °C, and pioneered the use of the 577
mixing line method to determine the composition of zircon within the runs. Zircon 578
REE were obtained from mixing lines with maximum Zr contents equivalent to ~5% 579
zircon, compared with up to 45% in this study. Rubatto & Hermann (2007a) applied 580
several lines of argument to support equilibrium growth of the main mineral phases, 581
including Kd (Fe–Mg) between garnet and melt consistent with previous studies (e.g. 582
Ellis, 1986), and systematic variation of Zr with temperature in the melt (Watson & 583
Harrison, 1983). As demonstrated in previous sections, these lines of argument also 584
apply to this experimental study. 585
The results from Rubatto & Hermann (2007a) show the DREE (zircon/garnet) 586
values as being temperature-dependent (Fig. 7a). The DMREE–HREE (zircon/garnet) 587
pattern was close to unity for their high temperature runs (1000 °C), but at lower 588
temperatures the HREE increasingly favoured zircon over garnet, with a steep 589
partitioning pattern (Lu/Gd up to 10) being obtained at 850–800 °C. A direct 590
comparison between this study and the equivalent T range (900–1000 °C) in the 591
Rubatto & Hermann (2007a) experiments (Fig. 7a) shows that the latter has generally 592
higher DHREE (zircon/garnet) values, e.g. Yb always favours zircon (DYb = 1–3) The 593
results from Rubatto & Hermann (2007a) can be interpreted to explain the large range 594
of DREE (zircon/garnet) values from the literature (e.g. Harley et al., 2001; Rubatto, 595
2002; Rubatto & Hermann, 2003; Whitehouse & Platt, 2003; Hokada & Harley, 2004; 596
Kelly & Harley, 2005; Buick et al., 2006) as reflecting equilibrium at different 597
temperatures in different terranes, with the steeper DREE patterns being recorded from 598
Page 25 of 47

26
lower-T granulites and migmatites and the flat and near-equipartitioned DREE recorded 599
from UHT regions. However, this attractive explanation does not fit with known P–T 600
conditions of some of the studied areas. For example, the granulites described by 601
Whitehouse & Platt (2003) formed at 750–800 °C, but would require temperatures of 602
950–1000 °C in order for the measured DREE (zircon/garnet), if representing 603
equilibrium, to be consistent with the Rubatto & Hermann (2007a) experimental DREE 604
(zircon/garnet) values. The present study shows no significant correlation between 605
DMREE–HREE (zircon/garnet) and temperature for the T range 900–1000 °C. Over a 606
comparable T range Rubatto & Hermann (2007a) found a 3- to 4-fold increase in 607
DMREE–HREE for Dy, Er, Yb and Lu, and at 800–900 °C the HREE favoured zircon 608
very strongly over garnet (e.g. DYb(900 °C) = 4; DYb(800 °C) = 10). These differences 609
in DREE between the two experimental studies may reflect the different pressures 610
under which the experiments were conducted (7 kbar vs. 20 kbar). Alternatively or 611
additionally, the differences in DREE behavior may arise from variations in garnet 612
chemistry. The steep DREE (zircon/garnet) values obtained at 800 °C in the Rubatto & 613
Hermann (2007a) experiments involved garnets with >20% grossular component, 614
whereas their DREE (zircon/garnet) values that lie closer to unity (950–1000 °C) 615
involved garnets with 7–8% grossular. These lower-Ca garnet DREE data are more 616
comparable with the present study that involves Ca-free garnet. 617
CONCLUSIONS 618
The experiments show a clear signature for the equilibrium distribution of the REE 619
between coexisting zircon and Fe–Mg garnet, DREE (zircon/garnet), relevant to high-620
grade crustal metamorphism at UHT P–T conditions of 900–1000 °C. The 621
experimentally-determined DREE (zircon/garnet) for MREE–HREE provide a robust 622
basis for site-strain based modelling that enable extension of the results to include the 623
Page 26 of 47
27
LREE. DREE (zircon/garnet) are therefore defined for all REE over the P–T range 624
relevant to granulite/UHT crustal metamorphism and anatexis of low-Ca pelites. 625
The experimental DREE (zircon/garnet) values determined in this study 626
describe a flat or concave-up pattern with DMREE–HREE near unity or slightly favouring 627
garnet (i.e. DREE<1). This distribution pattern is similar to that observed in a number 628
of natural rock studies from both UHT (Harley et al., 2001; Whitehouse & Platt, 629
2003; Hokada & Harley, 2004; Kelly & Harley, 2005; Harley & Kelly, 2007) and 630
800–900 °C granulite areas (Whitehouse & Platt, 2001)(Fig. 7b). 631
These experiments, and their modelling, do not result in the steep and 632
fractionated DMREE-HREE (zircon/garnet) patterns similar to those reported from other 633
studies of granulites (Rubatto, 2002; Hermann & Rubatto, 2003; Buick et al., 2006), 634
or evidence for any statistically significant temperature dependence of DREE 635
(zircon/garnet) values over the 900–1000 °C temperature range, in contrast to the 636
higher-pressure and Ca-bearing experiments of Rubatto and Hermann (2007a). The 637
reasons for these differences are difficult to evaluate, but may include disequilibrium 638
or non-equilibrium between zircon and garnet in some of the studied natural rock 639
examples, the effects of garnet Ca–Fe–Mg compositional variations, and/or the 640
influence of pressure on DREE in the case of experimental and some natural rock 641
studies. 642
643
Acknowledgements 644
This study was supported by the Natural Environment Research Council 645
(NERC Grant NE/B504157/1, S.L. Harley). We thank the members of the NERC 646
recognised Experimental Geoscience Facility and the Ion Microprobe Facility 647
(EMMAC) at the University of Edinburgh. We would like to acknowledge Mike 648
Page 27 of 47

28
Brown for editorial support, and Daniella Rubatto and one anonymous reviewer for 649
their constructive comments on the manuscript. Thanks also go to Ian Butler, Nic 650
Odling and Stephan Klemme for help with experimental techniques and John Craven 651
for analytical support. We acknowledge the Centre for Materials Research at Curtin 652
University. 653
654
References 655
656 Baldwin, J. A. & Brown, M., 2008. Age and duration of ultrahigh-temperature 657
metamorphism in the Anápolis-Itauçu Complex, Southern Brasília Belt, 658
central Brazil - Constraints from U-Pb geochronology, mineral rare earth 659 element chemistry and trace-element thermometry. Journal of Metamorphic 660 Geology, 26(2), 213-233. 661
Bea, F., Pereira, M. D. & Stroh, A., 1994. Mineral/leucosome trace-element 662 partitioning in a peraluminous migmatite (a laser ablation-ICP-MS study). 663 Chemical Geology, 117(1-4), 291-312. 664
Biggar, G. M. & O'Hara, M. J., 1969. A comparison of gel and glass starting materials 665 for phase equilibrium studies. Mineralogical Magazine, 36, 198-205. 666
Blundy, J. & Wood, B., 1994. Prediction of crystal-melt partition coefficients from 667 elastic moduli. Nature, 372(6505), 452-454. 668
Boehnke, P., Watson, E. B., Trail, D., Harrison, T. M. & Schmitt, A. K., 2013. Zircon 669 saturation re-revisited. Chemical Geology, 351, 324-334. 670
Brown, M., 2007. Metamorphic conditions in orogenic belts: A record of secular 671 change. International Geology Review, 49(3), 193-234. 672
Buick, I. S., Hermann, J., Williams, I. S., Gibson, R. L. & Rubatto, D., 2006. A 673 SHRIMP U-Pb and LA-ICP-MS trace element study of the petrogenesis of 674 garnet-cordierite-orthoamphibole gneisses from the Central Zone of the 675 Limpopo Belt, South Africa. Lithos, 88(1-4), 150-172. 676
Burnham, A. D. & Berry, A. J., 2012. An experimental study of trace element 677 partitioning between zircon and melt as a function of oxygen fugacity. 678
Geochimica et Cosmochimica Acta, 95, 196-212. 679 Carrington, D. P., 1993. Partial melting and phase relations in metapelitic granulites. 680 Carrington, D. P. & Harley, S. L., 1995. Partial melting and phase relations in high-681
grade metapelites: an experimental petrogenetic grid in the KFMASH system. 682 Contributions to Mineralogy and Petrology, 120(3-4), 270-291. 683
Cherniak, D. J., Hanchar, J. M. & Watson, E. B., 1997. Rare-earth diffusion in zircon. 684 Chemical Geology, 134(4), 289-301. 685
Cherniak, D. J. & Watson, E. B., 2003. Diffusion in zircon. In: Hanchar JM, Hoskin, 686 PWO (eds) Zircon. Reviews in Mineralogy 53, Mineralogical Society of 687 America, 113-143. 688
Clark, C., Collins, A. S., Santosh, M., Taylor, R. & Wade, B. P., 2009. The P-T-t 689 architecture of a Gondwanan suture: REE, U-Pb and Ti-in-zircon 690
Page 28 of 47

29
thermometric constraints from the Palghat Cauvery shear system, South India. 691 Precambrian Research, 174(1-2), 129-144. 692
Dickinson, J. E., Hess, P. C. & Rutherford, M. J., 1981. Zircon saturation and REE 693 partition coefficients in lunar basalts and granites. Lunar Planet. Sci., 12, 229-694 231. 695
Draper, D. S. & van Westrenen, W., 2007. Quantifying garnet-melt trace element 696 partitioning using lattice-strain theory: Assessment of statistically significant 697 controls and a new predictive model. Contributions to Mineralogy and 698 Petrology, 154(6), 731-746. 699
Ellis, D. J., 1986. Garnet-liquid Fe2+-Mg equilibria and implications for the 700 beginning of melting in the crust and subduction zones. American Journal of 701 Science, 286(10), 765-791. 702
Hamilton, D. L. & Henderson, C. M. B., 1968. The preparation of silicate 703 compositions by a gelling method. Mineralogical Magazine, 36, 832-838. 704
Hanchar, J. M., Finch, R. J., Hoskin, P. W. O., Watson, E. B., Cherniak, D. J. & 705 Mariano, A. N., 2001. Rare earth elements in synthetic zircon: Part 1. 706 Synthesis, and rare earth element and phosphorus doping. American 707 Mineralogist, 86(5-6), 667-680. 708
Harley, S. L., 1989. The origins of granulites: a metamorphic perspective. Geological 709
Magazine, 126(3), 215-247. 710 Harley, S. L. & Carrington, D. P., 2001. The distribution of H2O between cordierite 711
and granitic melt: H2O incorporation in cordierite and its application to high-712 grade metamorphism and crustal anatexis. Journal of Petrology, 42(9), 1595-713 1620. 714
Harley, S. L. & Kelly, N. M., 2007. The impact of zircon-garnet REE distribution 715 data on the interpretation of zircon U-Pb ages in complex high-grade terrains: 716 An example from the Rauer Islands, East Antarctica. Chemical Geology, 717 241(1-2), 62-87. 718
Harley, S. L., Kelly, N. M. & Möller, A., 2007. Zircon behaviour and the thermal 719
histories of moutain chains. Elements, 3(1), 25-30. 720 Harley, S. L., Kinny, P., Snape, I. & Black, L. P., 2001. Zircon chemistry and the 721
definition of events in Archean granulite terrains. In: Fourth International 722 Archean Symposium, Extended Abstract Volume, AGSO Geoscience Australia 723 Record, 2001/37, 511-513. 724
Harley, S. L. & Nandakumar, V., 2014. Accessory Mineral Behaviour in Granulite 725 Migmatites: a Case Study from the Kerala Khondalite Belt, India. Journal of 726 Petrology, 55(10), 1965-2002. 727
Hermann, J., 2002. Allanite: Thorium and light rare earth element carrier in subducted 728 crust. Chemical Geology, 192(3-4), 289-306. 729
Hermann, J. & Rubatto, D., 2003. Relating zircon and monazite domains to garnet 730 growth zones: Age and duration of granulite facies metamorphism in the Val 731 Malenco lower crust. Journal of Metamorphic Geology, 21(9), 833-852. 732
Hermann, J. & Rubatto, D., 2009. Accessory phase control on the trace element 733 signature of sediment melts in subduction zones. Chemical Geology, 265(3-4), 734 512-526. 735
Hinton, R. W. & Upton, B. G. J., 1991. The chemistry of zircon: Variations within 736 and between large crystals from syenite and alkali basalt xenoliths. 737 Geochimica et Cosmochimica Acta, 55(11), 3287-3302. 738
Hokada, T. & Harley, S. L., 2004. Zircon growth in UHT leucosome: Constraints 739
from zircon-garnet rare earth elements (REE) relations in Napier Complex, 740
Page 29 of 47

30
East Antarctica. Journal of Mineralogical and Petrological Sciences, 99(4), 741 180-190. 742
Hoskin, P. W. O. & Schaltegger, U., 2003. The composition of zircon and igneous 743 and metamorphic petrogenesis. Reviews in Mineralogy and Geochemistry, 53, 744 27-62. 745
Jiao, S., Guo, J., Harley, S. L. & Peng, P., 2013. Geochronology and trace element 746 geochemistry of zircon, monazite and garnet from the garnetite and/or 747 associated other high-grade rocks: Implications for Palaeoproterozoic 748 tectonothermal evolution of the Khondalite Belt, North China Craton. 749
Precambrian Research, 237, 78-100. 750 Kelly, N. M. & Harley, S. L., 2005. An integrated microtextural and chemical 751
approach to zircon geochronology: Refining the Archaean history of the 752 Napier Complex, east Antarctica. Contributions to Mineralogy and Petrology, 753 149(1), 57-84. 754
Koepke, J. & Behrens, H., 2001. Trace element diffusion in andesitic melts: An 755 application of synchrotron X-ray fluoresence analysis. Geochimica et 756 Cosmochimica Acta, 65(9), 1481-1498. 757
Korhonen, F. J., Clark, C., Brown, M., Bhattacharya, S. & Taylor, R., 2013. How 758 long-lived is ultrahigh temperature (UHT) metamorphism? Constraints from 759
zircon and monazite geochronology in the Eastern Ghats orogenic belt, India. 760 Precambrian Research, 234, 322-350. 761
Kotková, J. & Harley, S. L., 2010. Anatexis during high-pressure crustal 762 metamorphism: Evidence from garnet-whole-rock REE relationships and 763 zircon-rutile Ti-Zr thermometry in leucogranulites from the Bohemian Massif. 764 Journal of Petrology, 51(10), 1967-2001. 765
Luo, Y. & Ayers, J. C., 2009. Experimental measurements of zircon/melt trace-766 element partition coefficients. Geochimica et Cosmochimica Acta, 73(12), 767 3656-3679. 768
Marsh, J. H., Gerbi, C. C., Culshaw, N. G., Johnson, S. E., Wooden, J. L. & Clark, C., 769
2012. Using zircon U-Pb ages and trace element chemistry to constrain the 770 timing of metamorphic events, pegmatite dike emplacement, and shearing in 771 the southern Parry Sound domain, Grenville Province, Canada. Precambrian 772 Research, 192-195(1), 142-165. 773
Nicholls, I. A. & Harris, K. L., 1980. Experimental rare earth element partition 774 coefficients for garnet, clinopyroxene and amphibole coexisting with andesitic 775 and basaltic liquids. Geochimica et Cosmochimica Acta, 44(2), 287-308. 776
Okano, O., Watson, E. B. & Tatsumoto, M., 1987. Partition coefficients for REE and 777 Hf between zircon and liquid: Inferences for lunar granite petrogenesis. Lunar 778 planet. Sci., 74, 740-741. 779
Onuma, N., Higuchi, H., Wakita, H. & Nagasawa, H., 1968. Trace element partition 780 between two pyroxenes and the host lava. Earth and Planetary Science 781 Letters, 5(C), 47-51. 782
Rapp, R. P. & Watson, E. B., 1986. Monazite solubility and dissolution kinetics: 783 implications for the thorium and light rare earth chemistry of felsic magmas. 784 Contributions to Mineralogy and Petrology, 94(3), 304-316. 785
Rubatto, D., 2002. Zircon trace element geochemistry: Partitioning with garnet and 786 the link between U-Pb ages and metamorphism. Chemical Geology, 184(1-2), 787 123-138. 788
Page 30 of 47

31
Rubatto, D. & Hermann, J., 2003. Zircon formation during fluid circulation in 789 eclogites (Monviso, Western Alps): Implications for Zr and Hf budget in 790 subduction zones. Geochimica et Cosmochimica Acta, 67(12), 2173-2187. 791
Rubatto, D. & Hermann, J., 2007a. Experimental zircon/melt and zircon/garnet trace 792 element partitioning and implications for the geochronology of crustal rocks. 793 Chemical Geology, 241(1-2), 38-61. 794
Rubatto, D. & Hermann, J., 2007b. Zircon behaviour in deeply subducted rocks. 795 Elements, 3(1), 31-35. 796
Sano, Y., Terada, K. & Fukuoka, T., 2002. High mass resolution ion micropobe 797
analysis of rare earth elements in silicate glass, apatite and zircon: Lack of 798 matrix dependency. Chemical Geology, 184(3-4), 217-230. 799
Schoene, B., Latkoczy, C., Schaltegger, U. & Günther, D., 2010. A new method 800 integrating high-precision U-Pb geochronology with zircon trace element 801 analysis (U-Pb TIMS-TEA). Geochimica et Cosmochimica Acta, 74(24), 802 7144-7159. 803
Shannon, R. D., 1976. Revised effective ionic radii and systematic studies of 804 interatomic distances in halides and chalcogenides. Acta Crystallogr., 32, 751-805 767. 806
Taylor, R. J. M., Clark, C., Fitzsimons, I. C. W., Santosh, M., Hand, M., Evans, N. & 807
McDonald, B., 2014. Post-peak, fluid-mediated modification of granulite 808 facies zircon and monazite in the Trivandrum Block, southern India. 809 Contributions to Mineralogy and Petrology, 168(2). 810
Thomas, J. B., Bodnar, R. J., Shimizu, N. & Sinha, A. K., 2002. Determination of 811 zircon/melt trace element partition coefficients from SIMS analysis of melt 812 inclusions in zircon. Geochimica et Cosmochimica Acta, 66(16), 2887-2901. 813
Tomkins, H. S., Williams, I. S. & Ellis, D. J., 2005. In situ U-Pb dating of zircon 814 formed from retrograde garnet breakdown during decompression in Rogaland, 815 SW Norway. Journal of Metamorphic Geology, 23(4), 201-215. 816
van Westrenen, W. & Draper, D. S., 2007. Quantifying garnet-melt trace element 817
partitioning using lattice-strain theory: New crystal-chemical and 818 thermodynamic constraints. Contributions to Mineralogy and Petrology, 819 154(6), 717-730. 820
Watson, E. B. & Harrison, T. M., 1983. Zircon saturation revisited: temperature and 821 composition effects in a variety of crustal magma types. Earth and Planetary 822 Science Letters, 64(2), 295-304. 823
Whitehouse, M. J. & Platt, J. P., 2003. Dating high-grade metamorphism - Constraints 824 from rare-earth elements in zircon and garnet. Contributions to Mineralogy 825 and Petrology, 145(1), 61-74. 826
827
Supporting Information 828
Additional supporting information can be found in the online version of this article: 829
Appendix S1. Analytical techniques used in this study, and 5 kbar pilot study 830
describing the method for producing zircon-melt mixing lines and the calculation of 831
zircon REE concentrations. 832
Page 31 of 47

32
Please note: Wiley are not responsible for the content or functionality of any 833
supporting materials supplied by the authors. Any queries (other than missing 834
material) should be directed to the corresponding author for this article. 835
Figure captions 836
Fig 1. Images of run products showing the major phases present in the 837
experimental capsules during 7 kbar zircon-garnet experiments. a–d) BSE 838
images showing major phases present in the runs. Zircon is distinguished by its 839
acicular habit and bright BSE response. Glass, formed from the quench 840
crystallization of granitic melt has the lowest BSE response. Garnet is present as 841
equant grains up to 40μm often containing small inclusions of both zircon and 842
glass. Minor orthopyroxene is present in the glass and interpreted to have 843
formed during quenching of the experiments. e–f) EDS images of Fe and Mg in 844
garnet and melt showing no zonation in either phase. 845
846
Fig 2. Zr saturation in melt for the experiments in this study (symbols larger 847
than errors). Values are compared to calculated values from Watson and 848
Harrison (1983) and the updated melt model (Boehnke et al., 2013). Model 849
values based on calculated melt parameter ‘M’ for melt compositions used in this 850
study. 851
852
Fig 3. Experimentally derived REE concentrations from Sm to Lu in major phases 853
in this study at 900–1000 °C and 7 kbar. a) REE in zircon. b) REE in garnet. c) 854
REE in glass. 855
856
Fig 4. Experimental DREE values from Sm to Lu calculated for all 7 kbar 857
experiments in this study. a) DREE (zircon/melt). b) DREE (garnet/melt. c) DREE 858
(zircon/garnet). 859
860
Fig 5. Example Onuma diagrams with strain modeling parameters and fits for 861
zircon–melt and garnet–melt partitioning data from this study based on REE 862
from Sm to Lu. Zircon strain model fits based on Hanchar and van Westrenen 863
method (see text), garnet modelling based on unconstrained fits. a) z26-4 zircon-864
melt. b) z31-2 zircon-melt. c) z26-4 garnet-melt. d) z31-2 garnet-melt. 865
866
Fig 6. DREE (zircon/garnet) produced by strain modelling using modelled D 867
values for zircon/melt and garnet/melt. DREE (zircon/melt) modelling is pinned 868
by the work of Hanchar et al. (2001). DREE (garnet/melt) values are produced 869
using unconstrained fits of good quality based on Blundy and Wood (1994). 870
871
Fig 7. a) Comparison of the strain modelled data produced from this study with 872
the DREE (zircon/garnet) experiments of Rubatto and Hermann (2007a). There is 873
a strong similarity between this study with the highest temperature results of 874
Rubatto and Hermann (2007a), which also contain garnets with the closest 875
composition to this study in terms of being low in Ca content. b) Comparison of 876
the strain modelled data produced from this study with empirically determined 877
Page 32 of 47

33
DREE (zircon/garnet) values interpreted to represent zircon-garnet equilibrium 878
(Harley et al., 2001; Rubatto, 2002; Hermann & Rubatto, 2003; Whitehouse & 879
Platt, 2003; Hokada & Harley, 2004; Kelly & Harley, 2005; Buick et al., 2006). 880
881 882
Page 33 of 47

140x177mm (300 x 300 DPI)
Page 34 of 47

136x133mm (300 x 300 DPI)
Page 35 of 47

214x421mm (300 x 300 DPI)
Page 36 of 47
214x435mm (300 x 300 DPI)
Page 37 of 47

150x188mm (300 x 300 DPI)
Page 38 of 47

154x115mm (300 x 300 DPI)
Page 39 of 47

175x256mm (300 x 300 DPI)
Page 40 of 47

Table 1. Starting material compositions
Gel 3 (G3) Granite + Garnet Gel 4 (G4) Granite + Garnet + Zircon
Wt% oxide ppm REE ppm (n) Wt% oxide ppm REE ppm (n)
SiO2 65.5 Si 305803 SiO2 60.0 Si 279438
Al2O3 16.2 Al 85632 Al2O3 14.0 Al 73821
FeO 6.7 Fe 52009 FeO 6.2 Fe 48010
MgO 3.1 Mg 18668 MgO 2.9 Mg 17421
Na2O 3.4 Na 25191 Na2O 2.8 Na 20695
K2O 5.1 K 42278 K2O 4.2 K 34732
ZrO2 0.0 Zr 200 ZrO2 9.9 Zr 73213
P 649.1 P 647.5
Y 89.9 Y 149.4
Hf 3.0 Hf 2393.9
Li 144.8 Li 119.5
La 41.4 La 176.3 La 41.3 La 175.8
Ce 91.9 Ce 152.3 Ce 91.6 Ce 151.9
Pr 9.3 Pr 104.1 Pr 9.3 Pr 103.8
Nd 34.4 Nd 76.0 Nd 34.3 Nd 75.8
Sm 8.6 Sm 58.7 Sm 8.6 Sm 58.6
Eu 0.6 Eu 11.1 Eu 0.6 Eu 11.1
Gd 16.0 Gd 81.2 Gd 19.2 Gd 97.8
Tb 2.8 Tb 76.5 Tb 3.6 Tb 98.2
Dy 17.9 Dy 73.6 Dy 23.8 Dy 98.1
Ho 3.7 Ho 66.3 Ho 5.3 Ho 94.6
Er 11.3 Er 70.8 Er 16.3 Er 102.8
Tm 1.7 Tm 70.0 Tm 2.6 Tm 108.1
Yb 11.2 Yb 68.7 Yb 18.2 Yb 111.9
Lu 1.6 Lu 66.7 Lu 2.5 Lu 101.0
Page 41 of 47

Table 2. Run Conditions and major phases
Run No. z33-2 z33-4 z31-1 z31-2 z31-3 z26-4 z26-1 z26-6
T (°C) 1000 1000 950 950 950 900 900 900
P (kbar) 7 7 7 7 7 7 7 7
Length (hrs) 225 225 220 220 220 264 264 264
% H2O 3.1 3.4 3.0 3.3 3.1 3.1 3.1 9.4
Run product phases
Glass x x x x x x x x
Zircon x x x x x x x
Garnet x x x x x x x
Opx x x
Page 42 of 47

Table 3. Glass major element and REE compositions
Run No. z33-2 z33-4 z31-1 z31-2 z31-3 z26-4 z26-1
T (°C) 1000°C 1000°C 950°C 950°C 950°C 900°C 900°C
P (kbar) 7 7 7 7 7 7 7
1σ 1σ 1σ 1σ 1σ 1σ 1σ
Major Elements
SiO2 72.0 ± 1.6 70.8 ± 1.0 72.1 ± 1.5 70.7 ± 1.7 70.1 ± 0.4 68.6 ± 2.4 71.7 ± 0.4
Al2O3 14.6 ± 0.4 14.2 ± 0.9 14.0 ± 0.5 13.7 ± 0.2 14.2 ± 0.8 13.8 ± 0.4 14.6 ± 0.3
FeO 3.1 ± 0.6 4.1 ± 0.6 2.2 ± 1.3 3.3 ± 1.4 3.8 ± 1.5 5.0 ± 1.7 1.7 ± 0.2
MgO 0.8 ± 0.7 1.6 ± 0.1 0.6 ± 1.2 1.6 ± 1.1 1.7 ± 1.5 3.0 ± 1.5 0.4 ± 0.1
Na2O 2.8 ± 1.0 3.3 ± 0.1 3.9 ± 0.5 3.7 ± 0.2 3.7 ± 0.3 3.2 ± 0.3 4.1 ± 0.0
K2O 3.4 ± 0.4 3.4 ± 0.1 3.7 ± 0.3 3.5 ± 0.2 3.5 ± 0.2 3.4 ± 0.3 4.2 ± 0.0
Total 96.6 97.4 96.5 96.4 96.9 97.0 96.7
XMg 0.16 0.23 0.17 0.27 0.26 0.32 0.16
ASI 1.8 1.6 1.4 1.4 1.4 1.5 1.3
AFM 0.7 0.6 0.8 0.6 0.6 0.5 0.8
Zr (ppm) 310 447 270 214 287 175 129
REE ppm 1σ 1σ 1σ 1σ 1σ 1σ 1σ
La 34.4 ± 0.1 34.0 ± 0.6 39.9 ± 0.9 38.9 ± 0.5 40.2 ± 0.6 34.2 ± 0.3 41.7 ± 1.9
Ce 76.1 ± 2.0 76.6 ± 3.3 89.0 ± 2.5 87.9 ± 1.6 92.0 ± 1.5 77.2 ± 0.6 97.7 ± 2.2
Pr 6.9 ± 0.2 6.9 ± 0.4 8.4 ± 0.4 7.8 ± 0.2 8.5 ± 0.2 6.9 ± 0.1 9.0 ± 0.7
Nd 27.5 ± 0.1 27.9 ± 0.6 35.3 ± 0.4 31.1 ± 0.9 34.9 ± 1.0 27.4 ± 0.9 36.8 ± 0.6
Sm 5.7 ± 0.1 6.0 ± 0.5 6.4 ± 0.3 6.8 ± 0.4 6.4 ± 0.4 6.0 ± 0.4 8.0 ± 0.1
Eu 0.5 ± 0.03 0.5 ± 0.04 0.6 ± 0.03 0.6 ± 0.1 0.7 ± 0.1 0.5 ± 0.1 0.8 ± 0.03
Gd 9.6 ± 0.1 9.4 ± 0.1 9.1 ± 0.2 8.1 ± 0.3 8.7 ± 0.4 7.2 ± 0.3 17.1 ± 0.5
Tb 1.6 ± 0.2 1.4 ± 0.1 0.9 ± 0.1 1.2 ± 0.1 1.1 ± 0.1 1.1 ± 0.1 3.0 ± 0.1
Dy 7.7 ± 0.9 6.0 ± 0.8 5.1 ± 0.6 6.0 ± 0.6 5.2 ± 0.6 5.3 ± 0.3 16.6 ± 0.1
Ho 1.2 ± 0.03 0.9 ± 0.2 1.1 ± 0.1 1.0 ± 0.1 0.8 ± 0.1 0.9 ± 0.1 3.5 ± 0.2
Er 3.5 ± 0.02 2.8 ± 0.4 2.4 ± 0.4 2.1 ± 0.2 2.2 ± 0.2 1.9 ± 0.2 9.2 ± 0.8
Tm 0.5 ± 0.1 0.3 ± 0.04 0.3 ± 0.1 0.3 ± 0.1 0.3 ± 0.1 0.3 ± 0.03 1.5 ± 0.05
Yb 2.8 ± 0.4 2.1 ± 0.1 2.0 ± 0.8 2.3 ± 0.3 1.7 ± 0.3 2.0 ± 0.2 9.8 ± 2.0
Lu 0.3 ± 0.1 0.3 ± 0.04 0.3 ± 0.1 0.3 ± 0.1 0.2 ± 0.1 0.3 ± 0.03 1.2 ± 0.2
Y 27.8 ± 1.2 22.8 ± 0.1 16.6 ± 1.0 17.1 ± 0.6 17.5 ± 0.8 18.5 ± 0.7 11.7 ± 0.9
Hf 15.8 ± 5.6 15.2 ± 2.3 8.3 ± 3.8 6.7 ± 3.2 8.7 ± 4.6 13.0 ± 3.1 8.2 ± 3.8
P 1130.7 ± 27.3 1148.4 ± 2.5 1104.3 ± 7.7 1234.5 ± 11.0 1105.5 ± 17.9 1008.0 ± 9.9 636.9 ± 12.4
Trace element errors calculated from multiple SIMS analyses of glass
XMg = Mg/(Fe+Mg) (molar) ASI = Al/(Na+K) (molar) AFM = Al/(Al+Fe+Mg) (molar)
Page 43 of 47

Table 4. Zircon REE and garnet major element & REE composition
REE composition (ppm and ±1σ) of zircon
Run No. z33-2 z33-4 z31-1 z31-2 z31-3 z26-4
T (°C) 1000°C 1000°C 950°C 950°C 950°C 900°C
P (kbar) 7 7 7 7 7 7
REE ppm
La 21.7 ± 10.5 28.4 ± 7.0 29.3 ± 10.2 39.2 ± 11.9 29.5 ± 17.0 32.6 ± 23.9
Ce 68.5 ± 22.2 83.3 ± 18.8 85.0 ± 21.8 105.9 ± 28.5 84.1 ± 37.6 98.3 ± 55.6
Pr 5.9 ± 2.5 9.5 ± 2.0 8.8 ± 1.8 11.9 ± 2.2 8.5 ± 3.2 8.9 ± 4.9
Nd 38.1 ± 11.3 43.1 ± 10.2 50.1 ± 9.6 65.1 ± 12.2 52.9 ± 16.7 58.8 ± 20.4
Sm 24.9 ± 4.5 20.0 ± 4.3 27.2 ± 4.4 32.7 ± 3.0 32.2 ± 3.8 32.9 ± 5.7
Eu 1.3 ± 0.6 1.8 ± 0.6 1.8 ± 0.6 2.0 ± 0.5 1.4 ± 0.5 1.5 ± 0.8
Gd 57.3 ± 11.4 62.2 ± 15.8 77.3 ± 16.4 94.6 ± 15.0 97.6 ± 14.6 99.6 ± 12.2
Tb 13.3 ± 2.9 15.3 ± 3.6 17.0 ± 3.8 19.9 ± 3.7 20.0 ± 3.5 21.0 ± 3.5
Dy 76.0 ± 19.3 95.9 ± 21.5 109.9 ± 22.3 113.1 ± 24.5 124.6 ± 26.6 112.4 ± 37.3
Ho 22.4 ± 5.6 27.0 ± 5.4 28.3 ± 5.4 29.0 ± 6.3 31.9 ± 7.1 31.8 ± 6.4
Er 73.6 ± 14.3 86.7 ± 14.6 97.2 ± 13.7 92.6 ± 19.5 98.8 ± 21.4 94.4 ± 21.1
Tm 14.4 ± 2.7 16.4 ± 2.4 17.8 ± 2.7 16.8 ± 3.2 17.9 ± 3.7 16.2 ± 3.6
Yb 99.2 ± 15.4 111.9 ± 17.6 116.7 ± 15.3 115.2 ± 20.3 124.5 ± 24.2 115.3 ± 24.6
Lu 14.4 ± 2.5 15.4 ± 2.4 15.1 ± 2.3 14.8 ± 2.8 17.2 ± 3.1 15.0 ± 3.1
Y 536 ± 97 625 ± 103 667 ± 106 710 ± 111 381 ± 131 716 ± 127
Hf 17241 ± 356 16964 ± 690 19015 ± 237 17770 ± 373 17530 ± 1171 19759 ± 305
P 2084 ± 227 1656 ± 123 2046 ± 143 2232 ± 747 1181 ± 614 1789 ± 476
Errors on zircon trace elements calculated as 95% confidence limits on linear regression
Major element (Wt% oxide and ±1σ) REE composition (ppm and ±1σ) of garnet
Run No. z33-2 z33-4 z31-1* z31-2 z31-3*§
z26-4 z26-1§
T (°C) 1000°C 1000°C 950°C 950°C 950°C 900°C 900°C
P (kbar) 7 7 7 7 7 7 7
Major Elements 1σ 1σ 1σ 1σ 1σ 1σ 1σ
SiO2 39.5 ± 0.9 39.5 ± 0.3 39.4 ± 0.1 40.3 ± 0.8 40.2 ± 1.3 37.9 ± 0.6 39.6 ± 0.7
Al2O3 22.6 ± 0.5 22.5 ± 0.2 22.3 ± 0.1 21.7 ± 0.3 22.8 ± 0.4 21.6 ± 0.2 22.1 ± 0.3
FeO 26.0 ± 0.3 26.0 ± 0.3 26.2 ± 0.2 26.5 ± 0.4 25.4 ± 0.6 26.4 ± 0.4 27.3 ± 0.3
MgO 12.2 ± 0.5 11.4 ± 0.3 11.4 ± 0.1 11.2 ± 0.5 11.0 ± 0.8 13.2 ± 0.4 10.3 ± 0.3
Na2O 0.01 ± 0.01 ± 0.01 ± 0.04 ± 0.1 0.18 ± 0.2 0.03 ± 0.1 0.09 ± 0.1
K2O 0.02 ± 0 ± 0.02 ± 0.08 ± 0.1 0.14 ± 0.2 0.02 ± 0.1 0.05 ± 0.1
Total 100.3 99.27 99.34 99.85 99.67 99.17 99.36
XMg 0.46 0.44 0.44 0.43 0.44 0.47 0.40
S/FM 0.99 1.02 1.01 1.04 1.07 0.90 1.04
AFM 0.25 0.25 0.25 0.25 0.26 0.23 0.25
REE ppm 1σ 1σ 1σ 1σ 1σ
La 1.0 ± 0.9 0.3 ± 1.0 5.8 ± 1.5 2.8 ± 1.0 11.0 0.8 ± 0.5 0.7
Ce 2.5 ± 1.4 1.5 ± 1.6 13.8 ± 2.9 7.3 ± 1.6 24.3 3.4 ± 0.8 4.0
Pr 0.5 ± 0.3 0.6 ± 0.3 1.6 ± 0.3 1.2 ± 0.3 2.6 1.4 ± 0.2 1.2
Nd 5.4 ± 1.5 8.5 ± 1.7 12.0 ± 0.7 12.5 ± 1.7 13.5 18.4 ± 1.4 17.0Sm 9.1 ± 0.8 13.3 ± 0.9 16.7 ± 0.0 20.7 ± 0.9 13.4 33.4 ± 0.8 30.7
Eu 0.8 ± 0.1 1.1 ± 0.2 1.5 ± 0.2 2.0 ± 0.2 1.3 3.6 ± 0.1 2.4
Gd 47.8 ± 1.2 56.8 ± 1.3 70.2 ± 3.8 89.6 ± 1.3 53.5 135.6 ± 1.4 196.7
Tb 20.5 ± 0.3 22.5 ± 0.3 23.7 ± 1.5 29.5 ± 0.3 17.7 40.8 ± 0.3 80.7
Dy 176.8 ± 1.9 170.0 ± 1.9 166.7 ± 11.4 203.9 ± 1.9 125.2 259.3 ± 1.9 736.3
Ho 56.9 ± 0.4 46.3 ± 0.4 41.6 ± 2.2 48.7 ± 0.4 32.9 61.1 ± 0.4 237.3
Er 182.9 ± 1.4 147.4 ± 1.4 112.6 ± 5.1 128.7 ± 1.4 92.8 146.7 ± 1.4 808.8
Tm 33.1 ± 0.3 25.6 ± 0.3 18.4 ± 0.6 19.5 ± 0.3 15.5 23.5 ± 0.3 151.9
Yb 213.7 ± 1.4 162.9 ± 1.4 113.7 ± 2.7 121.5 ± 1.5 97.5 148.3 ± 1.4 1055.4
Lu 24.1 ± 0.2 19.0 ± 0.2 12.4 ± 0.8 13.3 ± 0.2 11.0 17.8 ± 0.2 130.9
*high LREE values are the result of unavoidable melt inclusions incorporated in garnet analysis
§ Garnet REE analyses based on single SIMS analysis for this sample, therefore have not propogated error for the composition
XMg = Mg/(Fe+Mg) (molar) S/FM = Si/(Fe+Mg) (molar) AFM = Al/(Al+Fe+Mg) (molar)
Page 44 of 47

Table 5. Experimentally determined partition coefficients
Experimentally determined DREE (zircon/melt)
Run No. z33-2 z33-4 z31-1 z31-2 z31-3 z26-4
T (°C) 1000°C 1000°C 950°C 950°C 950°C 900°C
P (kbar) 7 7 7 7 7 7
La 0.6 ± 0.3 0.8 ± 0.2 0.9 ± 0.3 1.0 ± 0.3 0.9 ± 0.5 1.0 ± 0.7
Ce 0.9 ± 0.3 1.1 ± 0.3 1.1 ± 0.3 1.2 ± 0.3 1.1 ± 0.5 1.3 ± 0.7
Pr 0.9 ± 0.4 1.4 ± 0.3 1.3 ± 0.3 1.5 ± 0.3 1.2 ± 0.5 1.3 ± 0.7
Nd 1.4 ± 0.5 1.6 ± 0.4 1.8 ± 0.4 2.1 ± 0.4 1.9 ± 0.7 2.1 ± 0.8
Sm 4.2 ± 1.0 3.4 ± 0.9 4.6 ± 1.0 4.8 ± 0.7 5.4 ± 1.0 5.5 ± 1.3
Eu 2.6 ± 1.5 3.6 ± 1.5 3.6 ± 1.5 3.5 ± 1.2 2.7 ± 1.2 3.0 ± 1.8
Gd 8.0 ± 1.9 8.7 ± 2.5 10.8 ± 2.7 11.6 ± 2.2 13.6 ± 2.5 13.9 ± 2.2
Tb 12.4 ± 3.3 14.3 ± 4.1 15.9 ± 4.3 16.4 ± 3.7 18.7 ± 4.2 19.7 ± 4.2
Dy 14.4 ± 4.4 18.2 ± 5.0 20.9 ± 5.3 18.9 ± 4.9 23.7 ± 6.3 21.4 ± 6.4
Ho 26.0 ± 8.1 31.3 ± 8.2 32.8 ± 8.2 29.5 ± 8.0 36.9 ± 10.5 36.8 ± 9.7
Er 39.5 ± 11.3 46.5 ± 12.1 52.2 ± 12.6 43.7 ± 12.7 53.0 ± 16.3 50.7 ± 16.0
Tm 50.0 ± 14.9 56.8 ± 14.7 61.9 ± 16.3 51.4 ± 14.7 62.3 ± 19.7 56.3 ± 18.6
Yb 49.8 ± 11.6 56.2 ± 13.2 58.6 ± 12.2 50.8 ± 12.4 62.5 ± 17.0 57.9 ± 16.8
Lu 57.0 ± 16.1 60.8 ± 16.3 59.5 ± 15.5 51.6 ± 14.6 68.0 ± 19.6 59.2 ± 18.9
Y 19.3 ± 4.3 27.4 ± 4.6 40.1 ± 8.8 41.4 ± 8.0 21.8 ± 8.5 38.6 ± 8.4
Hf 1089.4 ± 465 1116.9 ± 217 2299.8 ± 1365 2652.8 ± 1729 2006.5 ± 1620 1521.3 ± 405
P 1.84 ± 0.25 1.44 ± 0.11 1.85 ± 0.14 1.81 ± 0.62 1.07 ± 0.57 1.77 ± 0.49
Experimentally determined DREE (garnet/melt)
Run No. z33-2 z33-4 z31-1* z31-2 z31-3* z26-4
T (°C) 1000°C 1000°C 950°C 950°C 950°C 900°C
P (kbar) 7 7 7 7 7 7
La 0.03 ± 0.9 0.01 ± 1.8 0.1 ± 2.0 0.1 ± 1.3 0.1 ± 1.7 0.02 ± 1.3
Ce 0.03 ± 1.9 0.02 ± 2.4 0.1 ± 2.1 0.1 ± 1.1 0.1 ± 1.6 0.04 ± 1.1
Pr 0.07 ± 1.8 0.08 ± 2.2 0.1 ± 2.3 0.1 ± 1.5 0.1 ± 1.8 0.2 ± 1.5
Nd 0.2 ± 1.2 0.3 ± 1.6 0.4 ± 1.5 0.4 ± 1.8 0.4 ± 1.9 0.7 ± 1.8
Sm 1.6 ± 2.2 2.2 ± 2.8 3.3 ± 2.5 3.1 ± 2.6 3.3 ± 2.7 5.6 ± 2.6
Eu 1.6 ± 1.5 2.2 ± 1.6 3.4 ± 1.6 3.5 ± 1.7 3.1 ± 1.8 7.0 ± 1.7
Gd 5.0 ± 2.5 6.1 ± 2.5 9.9 ± 2.6 11.0 ± 2.6 10.3 ± 2.7 19.0 ± 2.6
Tb 13.2 ± 3.5 16.4 ± 3.2 31.8 ± 3.4 24.3 ± 3.1 26.1 ± 3.3 38.3 ± 3.1
Dy 23.0 ± 3.3 28.2 ± 3.3 40.0 ± 3.2 34.0 ± 2.9 39.1 ± 3.1 49.2 ± 2.9
Ho 46.1 ± 2.8 49.5 ± 3.2 44.1 ± 3.1 49.6 ± 2.8 58.2 ± 2.9 70.8 ± 2.8
Er 52.6 ± 3.0 53.4 ± 3.3 54.0 ± 3.4 60.7 ± 3.1 58.8 ± 3.2 78.8 ± 3.1
Tm 71.6 ± 3.8 73.5 ± 3.5 55.9 ± 3.6 59.6 ± 3.5 63.6 ± 3.7 81.8 ± 3.5
Yb 75.5 ± 3.3 77.4 ± 3.0 60.4 ± 3.7 53.6 ± 3.1 71.1 ± 3.3 74.5 ± 3.1
Lu 76.3 ± 3.6 64.2 ± 3.3 43.0 ± 3.7 46.2 ± 3.2 54.0 ± 3.4 70.2 ± 3.2
Experimentally determined DREE (zircon/garnet)
Run No. z33-2 z33-4 z31-1* z31-2 z31-3* z26-4
T (°C) 1000°C 1000°C 950°C 950°C 950°C 900°C
P (kbar) 7 7 7 7 7 7.00
La 21.6 ± 12.3 95.4 ± 55.4 10.4 ± 3.8 13.9 ± 4.6 10.5 ± 6.4 43.4 ± 37.2
Ce 27.6 ± 10.6 55.1 ± 17.9 11.6 ± 3.2 14.5 ± 4.2 11.5 ± 5.4 28.7 ± 17.5
Pr 11.9 ± 6.5 17.1 ± 5.3 7.6 ± 1.9 10.3 ± 2.3 7.3 ± 3.1 6.4 ± 3.7
Nd 7.1 ± 2.8 5.1 ± 1.5 4.0 ± 0.9 5.2 ± 1.2 4.2 ± 1.5 3.2 ± 1.2
Sm 2.7 ± 0.7 1.5 ± 0.4 1.3 ± 0.3 1.6 ± 0.2 1.6 ± 0.2 1.0 ± 0.2
Eu 1.6 ± 0.9 1.6 ± 0.6 0.9 ± 0.3 1.0 ± 0.3 0.7 ± 0.3 0.4 ± 0.2
Gd 1.2 ± 0.3 1.1 ± 0.3 0.9 ± 0.2 1.1 ± 0.2 1.1 ± 0.2 0.7 ± 0.1
Tb 0.6 ± 0.1 0.7 ± 0.2 0.6 ± 0.1 0.7 ± 0.1 0.7 ± 0.1 0.5 ± 0.1
Dy 0.4 ± 0.1 0.6 ± 0.1 0.5 ± 0.1 0.6 ± 0.1 0.6 ± 0.1 0.4 ± 0.1
Ho 0.4 ± 0.1 0.6 ± 0.1 0.6 ± 0.1 0.6 ± 0.1 0.7 ± 0.2 0.5 ± 0.1
Er 0.4 ± 0.1 0.6 ± 0.1 0.8 ± 0.1 0.7 ± 0.2 0.8 ± 0.2 0.6 ± 0.1
Tm 0.4 ± 0.1 0.6 ± 0.1 0.9 ± 0.2 0.9 ± 0.2 0.9 ± 0.2 0.7 ± 0.2
Yb 0.5 ± 0.1 0.7 ± 0.1 1.0 ± 0.1 0.9 ± 0.2 1.0 ± 0.2 0.8 ± 0.2
Lu 0.6 ± 0.1 0.8 ± 0.1 1.1 ± 0.2 1.1 ± 0.2 1.3 ± 0.3 0.8 ± 0.2
* garnet/melt and zircon/garnet D values produced using z31-2 garnet composition due to contamination of z31-1 & z31-3 garnet by melt inclusions
Page 45 of 47

Table 6. Strain modelling fit parameters
Strain modelled DREE (zircon/melt) - Hanchar and van Westrenen model
Run No. z33-2 z33-4 z31-1 z31-2 z31-3 z26-4
T (°C) 1000°C 1000°C 950°C 950°C 950°C 900°C
P (kbar) 7 7 7 7 7 7
1σ 1σ 1σ 1σ 1σ 1σ
R0 0.96 ± 0.004 0.94 ± 0.009 0.96 ± 0.005 0.96 ± 0.005 0.95 ± 0.006 0.97 ± 0.003
E (GPa) 430 ± 45 410 ± 52 449 ± 15 441 ± 21 463 ± 18 440 ± 35
D0 42 ± 1 69 ± 5 68 ± 2 65 ± 2 91 ± 3 67 ± 1
Strain modelled DREE (garnet/melt) - unconstrained fits
Run No. z33-2 z33-4 z31-1* z31-2 z31-3* z26-4
T (°C) 1000°C 1000°C 950°C 950°C 950°C 900°C
P (kbar) 7 7 7 7 7 7
R0 0.985 0.986 1.000 1.000 1.000 1.000
E (GPa) 1150 1040 1150 1150 1150 1050
D0 77 75 63 63 63 90
Page 46 of 47
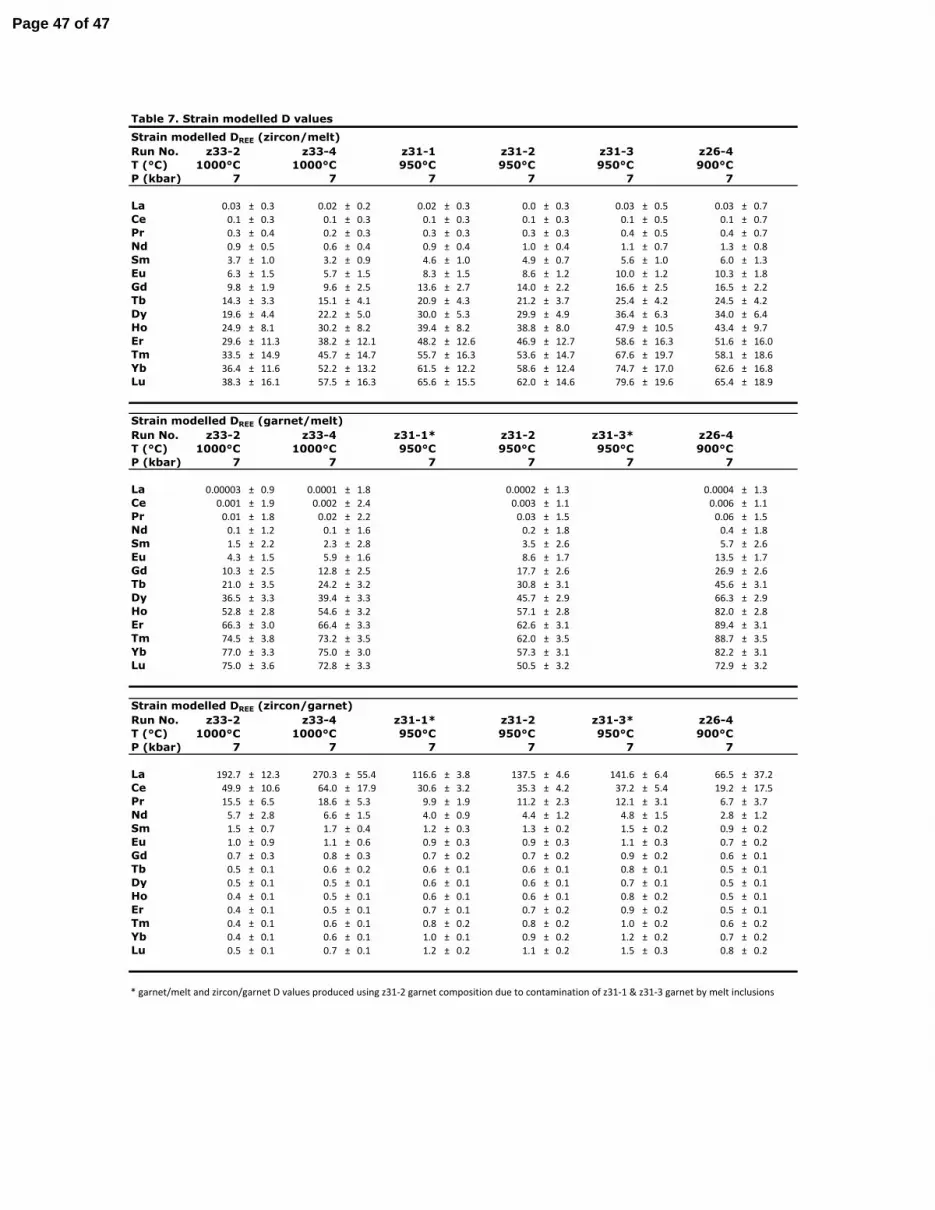
Table 7. Strain modelled D values
Strain modelled DREE (zircon/melt)
Run No. z33-2 z33-4 z31-1 z31-2 z31-3 z26-4
T (°C) 1000°C 1000°C 950°C 950°C 950°C 900°C
P (kbar) 7 7 7 7 7 7
La 0.03 ± 0.3 0.02 ± 0.2 0.02 ± 0.3 0.0 ± 0.3 0.03 ± 0.5 0.03 ± 0.7
Ce 0.1 ± 0.3 0.1 ± 0.3 0.1 ± 0.3 0.1 ± 0.3 0.1 ± 0.5 0.1 ± 0.7
Pr 0.3 ± 0.4 0.2 ± 0.3 0.3 ± 0.3 0.3 ± 0.3 0.4 ± 0.5 0.4 ± 0.7
Nd 0.9 ± 0.5 0.6 ± 0.4 0.9 ± 0.4 1.0 ± 0.4 1.1 ± 0.7 1.3 ± 0.8
Sm 3.7 ± 1.0 3.2 ± 0.9 4.6 ± 1.0 4.9 ± 0.7 5.6 ± 1.0 6.0 ± 1.3
Eu 6.3 ± 1.5 5.7 ± 1.5 8.3 ± 1.5 8.6 ± 1.2 10.0 ± 1.2 10.3 ± 1.8
Gd 9.8 ± 1.9 9.6 ± 2.5 13.6 ± 2.7 14.0 ± 2.2 16.6 ± 2.5 16.5 ± 2.2
Tb 14.3 ± 3.3 15.1 ± 4.1 20.9 ± 4.3 21.2 ± 3.7 25.4 ± 4.2 24.5 ± 4.2
Dy 19.6 ± 4.4 22.2 ± 5.0 30.0 ± 5.3 29.9 ± 4.9 36.4 ± 6.3 34.0 ± 6.4
Ho 24.9 ± 8.1 30.2 ± 8.2 39.4 ± 8.2 38.8 ± 8.0 47.9 ± 10.5 43.4 ± 9.7
Er 29.6 ± 11.3 38.2 ± 12.1 48.2 ± 12.6 46.9 ± 12.7 58.6 ± 16.3 51.6 ± 16.0
Tm 33.5 ± 14.9 45.7 ± 14.7 55.7 ± 16.3 53.6 ± 14.7 67.6 ± 19.7 58.1 ± 18.6
Yb 36.4 ± 11.6 52.2 ± 13.2 61.5 ± 12.2 58.6 ± 12.4 74.7 ± 17.0 62.6 ± 16.8
Lu 38.3 ± 16.1 57.5 ± 16.3 65.6 ± 15.5 62.0 ± 14.6 79.6 ± 19.6 65.4 ± 18.9
Strain modelled DREE (garnet/melt)
Run No. z33-2 z33-4 z31-1* z31-2 z31-3* z26-4
T (°C) 1000°C 1000°C 950°C 950°C 950°C 900°C
P (kbar) 7 7 7 7 7 7
La 0.00003 ± 0.9 0.0001 ± 1.8 0.0002 ± 1.3 0.0004 ± 1.3
Ce 0.001 ± 1.9 0.002 ± 2.4 0.003 ± 1.1 0.006 ± 1.1
Pr 0.01 ± 1.8 0.02 ± 2.2 0.03 ± 1.5 0.06 ± 1.5
Nd 0.1 ± 1.2 0.1 ± 1.6 0.2 ± 1.8 0.4 ± 1.8
Sm 1.5 ± 2.2 2.3 ± 2.8 3.5 ± 2.6 5.7 ± 2.6
Eu 4.3 ± 1.5 5.9 ± 1.6 8.6 ± 1.7 13.5 ± 1.7
Gd 10.3 ± 2.5 12.8 ± 2.5 17.7 ± 2.6 26.9 ± 2.6
Tb 21.0 ± 3.5 24.2 ± 3.2 30.8 ± 3.1 45.6 ± 3.1
Dy 36.5 ± 3.3 39.4 ± 3.3 45.7 ± 2.9 66.3 ± 2.9
Ho 52.8 ± 2.8 54.6 ± 3.2 57.1 ± 2.8 82.0 ± 2.8
Er 66.3 ± 3.0 66.4 ± 3.3 62.6 ± 3.1 89.4 ± 3.1
Tm 74.5 ± 3.8 73.2 ± 3.5 62.0 ± 3.5 88.7 ± 3.5
Yb 77.0 ± 3.3 75.0 ± 3.0 57.3 ± 3.1 82.2 ± 3.1
Lu 75.0 ± 3.6 72.8 ± 3.3 50.5 ± 3.2 72.9 ± 3.2
Strain modelled DREE (zircon/garnet)
Run No. z33-2 z33-4 z31-1* z31-2 z31-3* z26-4
T (°C) 1000°C 1000°C 950°C 950°C 950°C 900°C
P (kbar) 7 7 7 7 7 7
La 192.7 ± 12.3 270.3 ± 55.4 116.6 ± 3.8 137.5 ± 4.6 141.6 ± 6.4 66.5 ± 37.2
Ce 49.9 ± 10.6 64.0 ± 17.9 30.6 ± 3.2 35.3 ± 4.2 37.2 ± 5.4 19.2 ± 17.5
Pr 15.5 ± 6.5 18.6 ± 5.3 9.9 ± 1.9 11.2 ± 2.3 12.1 ± 3.1 6.7 ± 3.7
Nd 5.7 ± 2.8 6.6 ± 1.5 4.0 ± 0.9 4.4 ± 1.2 4.8 ± 1.5 2.8 ± 1.2
Sm 1.5 ± 0.7 1.7 ± 0.4 1.2 ± 0.3 1.3 ± 0.2 1.5 ± 0.2 0.9 ± 0.2
Eu 1.0 ± 0.9 1.1 ± 0.6 0.9 ± 0.3 0.9 ± 0.3 1.1 ± 0.3 0.7 ± 0.2
Gd 0.7 ± 0.3 0.8 ± 0.3 0.7 ± 0.2 0.7 ± 0.2 0.9 ± 0.2 0.6 ± 0.1
Tb 0.5 ± 0.1 0.6 ± 0.2 0.6 ± 0.1 0.6 ± 0.1 0.8 ± 0.1 0.5 ± 0.1
Dy 0.5 ± 0.1 0.5 ± 0.1 0.6 ± 0.1 0.6 ± 0.1 0.7 ± 0.1 0.5 ± 0.1
Ho 0.4 ± 0.1 0.5 ± 0.1 0.6 ± 0.1 0.6 ± 0.1 0.8 ± 0.2 0.5 ± 0.1
Er 0.4 ± 0.1 0.5 ± 0.1 0.7 ± 0.1 0.7 ± 0.2 0.9 ± 0.2 0.5 ± 0.1
Tm 0.4 ± 0.1 0.6 ± 0.1 0.8 ± 0.2 0.8 ± 0.2 1.0 ± 0.2 0.6 ± 0.2
Yb 0.4 ± 0.1 0.6 ± 0.1 1.0 ± 0.1 0.9 ± 0.2 1.2 ± 0.2 0.7 ± 0.2
Lu 0.5 ± 0.1 0.7 ± 0.1 1.2 ± 0.2 1.1 ± 0.2 1.5 ± 0.3 0.8 ± 0.2
* garnet/melt and zircon/garnet D values produced using z31-2 garnet composition due to contamination of z31-1 & z31-3 garnet by melt inclusions
Page 47 of 47


