Embed Size (px)
Citation preview

Mkango Resources Limited
Songwe REE Project
Malawi
NI 43-101 Pre-feasibility Report
Prepared By The MSA Group (Pty) Ltd for:
Mkango Resources Limited
Prepared By:
Effective Date: 19 September 2014
Report Date: 06 November 2014
MSA Project No.: J2897
Rob Croll Fellow SAIMM
Scott Swinden P.Geo
Michael Hall Pr. Sci.Nat., MAusIMM
Clive Brown Pr.Eng., Fellow SAIMM
Gavin Beer (Ext.Met) MAusIMM (CP)
Jansen Scheepers Pr.Eng.
Tinus Redelinghuys Pr.Eng.
Guy Wild Pr.Eng
Graham Errol Trusler P.Eng
J2897 Mkango Songwe Hill PFS November 2014 Page: ii
TABLE OF CONTENTS
1 SUMMARY ............................................................................................................................................... 1
1.1 Property Description and Location ..................................................................................................................... 1
1.2 History and Ownership ............................................................................................................................................ 1
1.3 Geology and Mineralization .................................................................................................................................. 2
1.4 Status of Exploration................................................................................................................................................. 3
1.5 Mineral Resources ..................................................................................................................................................... 3
1.6 Mineral Reserves ........................................................................................................................................................ 4
1.7 Mining ............................................................................................................................................................................ 5
1.8 Process Overview ....................................................................................................................................................... 9
1.8.1 Processing plant capital cost estimate ........................................................................................... 10
1.8.2 Processing plant operating cost estimate .................................................................................... 10
1.9 Tailings ........................................................................................................................................................................ 11
1.10 Environmental Aspects ......................................................................................................................................... 14
1.10.1 Legal framework ..................................................................................................................................... 14
1.10.2 Potential environmental risks ............................................................................................................ 15
1.11 Market Studies and Contracts............................................................................................................................ 16
1.12 Capital and Operating Cost Estimates ............................................................................................................ 18
1.12.1 Capital Costs ............................................................................................................................................. 18
1.12.2 Operating Costs ...................................................................................................................................... 19
1.13 Financial Valuation ................................................................................................................................................. 19
2 INTRODUCTION .................................................................................................................................... 23
2.1 Scope of Work .......................................................................................................................................................... 23
2.2 Principal Sources of Information ...................................................................................................................... 23
2.3 Qualifications, Experience and Independence ............................................................................................ 23
3 RELIANCE ON OTHER EXPERTS .......................................................................................................... 25
4 PROPERTY DESCRIPTION AND LOCATION ...................................................................................... 26
4.1 Location ...................................................................................................................................................................... 26
4.2 Mineral Tenure, Permitting, Rights and Agreements ............................................................................... 28
4.2.1 Exclusive Prospecting Licenses in Malawi ..................................................................................... 28
4.2.2 EPL 0284/10R Phalombe ...................................................................................................................... 28
4.2.3 General Provisions .................................................................................................................................. 30

J2897 Mkango Songwe Hill PFS November 2014 Page: iii
4.2.4 Overlapping EPLs .................................................................................................................................... 31
4.3 Environmental Liabilities ...................................................................................................................................... 31
5 ACCESSIBILITY, CLIMATE, LOCAL RESOURCES, INFRASTRUCTURE AND PHYSIOGRAPHY ...... 33
5.1 Accessibility ............................................................................................................................................................... 33
5.2 Climate and Physiography................................................................................................................................... 34
5.2.1 Climate and meteorological Overview ........................................................................................... 34
5.2.2 Physiography ............................................................................................................................................ 42
5.3 Local Resources and Infrastructure .................................................................................................................. 43
6 HISTORY................................................................................................................................................. 45
6.1 Ownership History .................................................................................................................................................. 45
6.2 Historical Exploration ............................................................................................................................................ 45
6.2.1 Pre-1981 Programmes .......................................................................................................................... 45
6.2.2 Post-1981 Programmes ....................................................................................................................... 46
6.2.3 Japan International Cooperation Agency and Metal Mining Agency of Japan, 1986
- 1988 .......................................................................................................................................................... 46
7 GEOLOGICAL SETTING AND MINERALIZATION .............................................................................. 52
7.1 Regional Geology.................................................................................................................................................... 52
7.2 Geology of the Songwe Carbonatite Vent .................................................................................................... 54
7.2.1 Carbonatite ............................................................................................................................................... 54
7.2.2 Fenite ........................................................................................................................................................... 57
7.2.3 Breccia ......................................................................................................................................................... 57
7.2.4 Silicate-rich dykes ................................................................................................................................... 58
7.3 Mineralization ........................................................................................................................................................... 58
7.3.1 Geological domains ............................................................................................................................... 58
7.3.2 Geometry of the Mineralization ........................................................................................................ 64
7.3.3 Thorium ...................................................................................................................................................... 66
7.3.4 Mineralogy ................................................................................................................................................ 67
8 DEPOSIT TYPES ..................................................................................................................................... 76
9 EXPLORATION ....................................................................................................................................... 79
9.1 Litho-geochemical Sampling.............................................................................................................................. 79
9.2 Ground Geophysical Programme ..................................................................................................................... 82
9.2.1 Magnetic survey ...................................................................................................................................... 82
9.2.2 Radiometric survey ................................................................................................................................ 83
9.2.3 Gravity survey ........................................................................................................................................... 84

J2897 Mkango Songwe Hill PFS November 2014 Page: iv
9.3 Geological Mapping .............................................................................................................................................. 85
9.4 Surface Channel Sampling .................................................................................................................................. 86
9.5 Research Programmes .......................................................................................................................................... 88
10 DRILLING ............................................................................................................................................... 91
10.1 Historical Diamond Drilling (1988) ................................................................................................................... 91
10.2 Stage 1 and Stage 2 Diamond Drilling (2011 – 2012) .............................................................................. 91
10.3 Core Recovery .......................................................................................................................................................... 94
10.4 Collar Surveys ........................................................................................................................................................... 94
10.5 Downhole Surveys .................................................................................................................................................. 94
10.6 Drilling Logistics and Procedures ..................................................................................................................... 95
10.7 Results of Drilling .................................................................................................................................................... 96
10.7.1 Drill Objectives ......................................................................................................................................... 96
10.7.2 Mineralized Lithologies ........................................................................................................................ 96
10.7.3 Orientation and Spatial Distribution of Mineralization ........................................................... 97
11 SAMPLE PREPARATION, ANALYSES AND SECURITY .................................................................... 102
11.1 Sample Preparation .............................................................................................................................................. 102
11.1.1 Core Handling ........................................................................................................................................ 102
11.1.2 Core Logging .......................................................................................................................................... 102
11.1.3 Core Sampling ....................................................................................................................................... 103
11.1.4 Density measurements ....................................................................................................................... 105
11.2 Sample Analyses .................................................................................................................................................... 106
11.2.1 Primary Laboratory .............................................................................................................................. 106
11.2.2 Umpire Laboratory ............................................................................................................................... 107
11.3 Sample Security and Dispatch ......................................................................................................................... 107
11.4 Quality Assurance and Quality Control ........................................................................................................ 108
11.4.1 Blanks ........................................................................................................................................................ 109
11.4.2 Certified Reference Material ............................................................................................................ 110
11.4.3 Duplicates ................................................................................................................................................ 110
11.4.4 Umpire Laboratory Samples ............................................................................................................. 110
11.5 Adequacy of Sample Preparation, Security and Analytical Procedures .......................................... 110
12 DATA VERIFICATION.......................................................................................................................... 112
13 MINERAL PROCESSING AND METALLURGICAL TESTING ............................................................ 113
13.1 Introduction ............................................................................................................................................................ 113

J2897 Mkango Songwe Hill PFS November 2014 Page: v
13.2 Metallurgical Testwork Samples ..................................................................................................................... 113
13.3 Mineralogy ............................................................................................................................................................... 115
13.3.1 Mineral associations ............................................................................................................................ 115
13.4 Metallurgical Testing ........................................................................................................................................... 116
13.4.1 Background ............................................................................................................................................. 116
13.4.2 Comminution ......................................................................................................................................... 116
13.4.3 Beneficiation ........................................................................................................................................... 122
13.4.4 Leaching ................................................................................................................................................... 126
13.5 Flowsheet Development ..................................................................................................................................... 130
13.5.1 Sample Selection .................................................................................................................................. 130
13.5.2 Concentrate Generation..................................................................................................................... 131
13.5.3 Calcite Leaching .................................................................................................................................... 133
13.5.4 Rare Earth Leaching ............................................................................................................................. 134
13.5.5 Caustic Conversion and Redissolution ......................................................................................... 135
13.5.6 Purification .............................................................................................................................................. 136
13.5.7 Raw RE Hydroxide Precipitation ..................................................................................................... 137
13.5.8 Hot Caustic Wash ................................................................................................................................. 138
13.5.9 Cerium Rejection................................................................................................................................... 138
13.5.10 Selective Dissolution ........................................................................................................................... 138
13.5.11 Residue Leaching .................................................................................................................................. 139
13.5.12 Product Precipitation .......................................................................................................................... 139
13.6 Flowsheet Selection ............................................................................................................................................. 139
13.7 Stage Recoveries for Basis of Design ............................................................................................................ 141
14 MINERAL RESOURCE ESTIMATES .................................................................................................... 142
14.1 Previous Mineral Resource Estimates ........................................................................................................... 142
14.2 Mineral Resource Estimate ................................................................................................................................ 142
14.3 Known issues that materially affect Mineral Resources ......................................................................... 142
14.4 Assumptions, Estimation Methods and Parameters ............................................................................... 144
14.4.1 Input Database Validation and Preparation............................................................................... 144
14.4.2 Geological Modeling ........................................................................................................................... 152
14.4.3 Block Model Creation ......................................................................................................................... 157
14.4.4 Input Data Exploratory Data Analysis ........................................................................................... 157
14.4.5 Individual REO Proportions .............................................................................................................. 162

J2897 Mkango Songwe Hill PFS November 2014 Page: vi
14.4.6 Density ...................................................................................................................................................... 163
14.4.7 Variogram modeling and grade continuity ................................................................................ 163
14.4.8 Estimation Parameters and Grade Estimation ........................................................................... 164
14.4.9 Geological Losses ................................................................................................................................. 169
14.4.10 Mineral Resource Classification ...................................................................................................... 169
14.5 Mineral Resource Statement ............................................................................................................................ 170
14.5.1 Songwe Hill Mineral Resources ....................................................................................................... 170
14.6 Conclusions ............................................................................................................................................................. 175
15 MINERAL RESERVE ESTIMATES ........................................................................................................ 176
15.1 Mineral Reserve Estimation Process .............................................................................................................. 176
15.2 Modifying factors .................................................................................................................................................. 176
15.2.1 Cut-off grade .......................................................................................................................................... 176
15.2.2 Dilution ..................................................................................................................................................... 177
15.2.3 Ore loss ..................................................................................................................................................... 177
15.2.4 Metallurgical recovery ........................................................................................................................ 177
15.2.5 Metal prices ............................................................................................................................................ 177
15.2.6 Other factor affecting the Mineral Reserve estimate ............................................................. 178
15.3 Mineral Reserves summary ............................................................................................................................... 178
16 MINING METHODS ............................................................................................................................ 179
16.1 Introduction ............................................................................................................................................................ 179
16.2 Geotechnical Analysis .......................................................................................................................................... 179
16.2.1 Geotechnical logging .......................................................................................................................... 180
16.2.2 Material properties .............................................................................................................................. 181
16.2.3 Open pit design and slope geometry .......................................................................................... 181
16.2.4 Slope Configuration ............................................................................................................................ 183
16.3 Pit optimisation study ......................................................................................................................................... 186
16.4 Pit Design ................................................................................................................................................................. 190
16.5 Open pit mining equipment ............................................................................................................................. 193
16.6 Open pit Mining Schedule ................................................................................................................................ 194
17 RECOVERY METHODS ........................................................................................................................ 196
17.1 Process Overview .................................................................................................................................................. 196
17.2 Process Facilities .................................................................................................................................................... 199
17.2.1 Ore receiving and crushing plant ................................................................................................... 199

J2897 Mkango Songwe Hill PFS November 2014 Page: vii
17.2.2 Stockpile ................................................................................................................................................... 199
17.2.3 Milling ....................................................................................................................................................... 199
17.2.4 Flotation ................................................................................................................................................... 199
17.2.5 Concentrate thickening ...................................................................................................................... 200
17.2.6 Concentrate filtration .......................................................................................................................... 200
17.2.7 Tailings thickener .................................................................................................................................. 200
17.2.8 Tailings transfer ..................................................................................................................................... 200
17.2.9 Plant utilities (water) ............................................................................................................................ 201
17.2.10 Plant utilities (air) .................................................................................................................................. 201
17.2.11 Flotation reagents ................................................................................................................................ 201
17.2.12 Calcite leach ............................................................................................................................................ 201
17.2.13 Rare earth leach .................................................................................................................................... 202
17.2.14 Caustic conversion 1 ........................................................................................................................... 202
17.2.15 Rare earth dissolution ......................................................................................................................... 202
17.2.16 Hydrochloric acid regeneration 1, 2 and 3 ................................................................................. 203
17.2.17 Purification .............................................................................................................................................. 204
17.2.18 Raw rare earth precipitation ............................................................................................................. 205
17.2.19 Caustic conversion 2 ........................................................................................................................... 205
17.2.20 Cerium removal ..................................................................................................................................... 205
17.2.21 Residue leaching ................................................................................................................................... 205
17.2.22 Final rare earth precipitation ............................................................................................................ 206
17.2.23 Waste neutralization ........................................................................................................................... 206
17.3 Sulphuric Acid Production ................................................................................................................................. 206
18 PROJECT INFRASTRUCTURE ............................................................................................................. 207
18.1 Access ........................................................................................................................................................................ 207
18.2 Processing Plant Site Infrastructure ............................................................................................................... 207
18.3 Electrical Site Infrastructure .............................................................................................................................. 211
18.4 Tailings Storage Facility ...................................................................................................................................... 211
18.4.1 Design criteria ........................................................................................................................................ 211
18.4.2 Selection of the preferred site for the establishment of the tailings storage facility 217
18.4.3 Tailings storage facility design ........................................................................................................ 219
18.4.4 Seepage and slope stability analyses ........................................................................................... 222
18.4.5 Development, operation and closure of the TSF, RWD and SWD .................................... 223

J2897 Mkango Songwe Hill PFS November 2014 Page: viii
18.4.6 Estimates of capital, operating and closure costs ................................................................... 229
19 MARKET STUDIES AND CONTRACTS .............................................................................................. 232
19.1 Rare Earth Elements Overview ......................................................................................................................... 232
19.1.1 Rare Earths .............................................................................................................................................. 232
19.2 Production and Supply ....................................................................................................................................... 233
19.2.1 International trade in Rare Earths .................................................................................................. 235
19.2.2 Supply Outlook ...................................................................................................................................... 236
19.2.3 Consumption and Demand .............................................................................................................. 237
19.2.4 Demand outlook ................................................................................................................................... 239
19.2.5 Prices for Rare Earths .......................................................................................................................... 240
19.2.6 World Trade Organisation Finding ................................................................................................ 240
19.2.7 Price Projection...................................................................................................................................... 241
19.3 Contracts .................................................................................................................................................................. 242
20 ENVIRONMENTAL STUDIES, PERMITTING AND SOCIAL OR COMMUNITY IMPACT .............. 243
20.1 Dust Fallout ............................................................................................................................................................. 245
20.1.1 Dust Monitoring Results .................................................................................................................... 248
20.2 Topography ............................................................................................................................................................. 251
20.2.1 Phalombe-Chilwa Plain ...................................................................................................................... 251
20.2.2 Mauze and Songwe Hills ................................................................................................................... 251
20.2.3 Mass movements (Landslides) ........................................................................................................ 253
20.3 Fauna.......................................................................................................................................................................... 254
20.4 Flora ............................................................................................................................................................................ 254
20.4.1 Endangered Flora ................................................................................................................................. 255
20.4.2 National Red List species versus IUCN Red List ....................................................................... 255
20.5 Soils ............................................................................................................................................................................ 257
20.5.1 Soil erosion and sedimentation ...................................................................................................... 259
20.6 Surface Water ......................................................................................................................................................... 259
20.7 Groundwater ........................................................................................................................................................... 261
20.7.1 Groundwater Occurrence .................................................................................................................. 263
20.7.2 Groundwater Levels ............................................................................................................................. 263
20.8 Radiation .................................................................................................................................................................. 264
20.9 Social and Community ........................................................................................................................................ 265
20.9.1 Stakeholder Engagement .................................................................................................................. 265

J2897 Mkango Songwe Hill PFS November 2014 Page: ix
20.9.2 People and Socio-economics .......................................................................................................... 267
20.9.3 Proposed Corporate Social Responsibility (CSR) Projects .................................................... 268
20.9.4 Resettlement Consideration ............................................................................................................. 269
20.10 Potential Environmental Impacts .................................................................................................................... 270
21 CAPITAL AND OPERATING COSTS .................................................................................................. 271
21.1 Capital Costs ........................................................................................................................................................... 271
21.1.1 Mining Capital Expenditure .............................................................................................................. 271
21.1.2 Processing plant and infrastructure capital cost ...................................................................... 274
21.1.3 Tailings Storage Facility Capital costs........................................................................................... 279
21.1.4 Summary of initial capital expenditure ........................................................................................ 281
21.2 Operating Costs ..................................................................................................................................................... 281
21.2.1 Mining Operating Costs ..................................................................................................................... 281
21.2.2 Processing plant operating cost ..................................................................................................... 287
21.2.3 Tailings Storage Facility Operating costs .................................................................................... 291
21.2.4 Operating cost summary ................................................................................................................... 291
21.3 Environmental Closure Cost Estimate ........................................................................................................... 292
22 ECONOMIC ANALYSIS ....................................................................................................................... 294
22.1 Introduction ............................................................................................................................................................ 294
22.2 Financial Model Inputs ........................................................................................................................................ 294
22.2.1 Metal prices ............................................................................................................................................ 294
22.2.2 Malawian taxes ...................................................................................................................................... 295
22.2.3 Capital expenditure and operating costs .................................................................................... 295
22.3 Economic Analysis ................................................................................................................................................ 295
22.3.1 Mineral Resource and Mineral Reserve Estimates ................................................................... 295
22.3.2 Financial Valuation ............................................................................................................................... 296
22.3.3 Sensitivity analysis ................................................................................................................................ 299
22.4 Mine Life ................................................................................................................................................................... 302
22.5 Discounted cash flow model ............................................................................................................................ 302
23 ADJACENT PROPERTIES .................................................................................................................... 305
24 OTHER RELEVANT DATA AND INFORMATION ............................................................................. 306
24.1 Legal Framework ................................................................................................................................................... 306
24.1.1 Malawian Legislation ........................................................................................................................... 306
24.1.2 IFC and Equator Principles ................................................................................................................ 319
J2897 Mkango Songwe Hill PFS November 2014 Page: x
25 INTERPRETATION AND CONCLUSIONS .......................................................................................... 326
25.1 Mining ....................................................................................................................................................................... 326
25.2 Process Design ....................................................................................................................................................... 327
25.3 Tailings Storage Facility ...................................................................................................................................... 327
25.4 Environmental ........................................................................................................................................................ 328
26 RECOMMENDATIONS ........................................................................................................................ 329
26.1 Drilling programme .............................................................................................................................................. 329
26.2 Mining ....................................................................................................................................................................... 329
26.3 Mineral Processing and Metallurgical Testwork ....................................................................................... 329
26.3.1 Flotation ................................................................................................................................................... 329
26.3.2 Cerium Rejection................................................................................................................................... 329
26.3.3 Fluorine Deportment ........................................................................................................................... 330
26.3.4 Radionuclide Deportment ................................................................................................................. 330
26.3.5 Lanthanum Removal............................................................................................................................ 330
26.3.6 Rare Earth Separation ......................................................................................................................... 330
26.3.7 Piloting ...................................................................................................................................................... 330
26.4 Recovery Methods ................................................................................................................................................ 331
26.5 Tailings ...................................................................................................................................................................... 331
26.6 Environmental ........................................................................................................................................................ 332
26.6.1 Management of impacts and issues ............................................................................................. 332
26.6.2 Risks and recommendations ............................................................................................................ 332
26.7 Proposed Budget for the Definitive Feasibility Study ............................................................................. 333
27 REFERENCES ........................................................................................................................................ 334
27.1 Websites consulted .............................................................................................................................................. 338
LIST OF TABLES
Table 1-1 In situ Indicated Mineral Resources for Songwe Hill: All domains at a 1% TREO cut-off as at 30th
September 2012 ........................................................................................................................................................................ 3
Table 1-2 In situ Inferred Mineral Resources for Songwe Hill: All domains at a 1% TREO cut-off as at 30th
September 2012 ........................................................................................................................................................................ 4
Table 1-3 Modifying factors used in the Mineral Reserve Estimate ................................................................................ 5
Table 1-4 Estimated Mineral Reserve ........................................................................................................................................... 5

J2897 Mkango Songwe Hill PFS November 2014 Page: xi
Table 1-5 Summary of geotechnical properties for the material at Songwe Hill REE .............................................. 6
Table 1-6 Slope configurations for Songwe Hill Project ....................................................................................................... 6
Table 1-7 Techno-economic data set for pit optimisation. ................................................................................................. 8
Table 1-8 Summary of process plant capital cost estimate ............................................................................................. 10
Table 1-9 Capital cost estimate split between concentrate and hydrometallurgy processing plants ............ 10
Table 1-10 Summary of operating cost estimate ................................................................................................................. 11
Table 1-11 Summary of estimated capital costs ................................................................................................................... 13
Table 1-12 Summary of initial capital expenditure .............................................................................................................. 19
Table 1-13 Estimated total cash cost summary .................................................................................................................... 19
Table 1-14 Projected prices for REE and Yttrium ................................................................................................................. 20
Table 1-15 Mining and Processing Inputs and Results ...................................................................................................... 21
Table 1-16 Processing recoveries ............................................................................................................................................... 21
Table 1-17 Summary of Valuation Results (Nominal) – Post Tax valuation ............................................................... 22
Table 2-1 Contributing Authors .................................................................................................................................................. 24
Table 4-1 History of tenure of EPL 0284/10 (Phalombe) ................................................................................................... 29
Table 4-2 Coordinates of the current EPL 0284/10 as valid until January 20, 2015 ............................................... 30
Table 4-3 Summary of closure costs for Songwe ................................................................................................................. 32
Table 5-1 Diurnal variability in wind fields .............................................................................................................................. 36
Table 6-1 Ranges and averages of REE, Sr, Nb and Th for 89 geochemical samples from Songwe collected
during Phase 1 ........................................................................................................................................................................ 47
Table 6-2 Phase 2 and 3 investigations on Songwe Hill .................................................................................................... 48
Table 7-1 Mineral abundances of six samples by QEMSCAN ......................................................................................... 67
Table 7-2 Summary of samples for mineralogical studies ................................................................................................ 68
Table 7-3 Average REO distribution of Synchysite, analysed by EMP, in Songwe carbonatites (excluding
outliers) ...................................................................................................................................................................................... 70
Table 7-4 Average REO distribution of Apatite, analysed by LA-ICP-MS, in Songwe carbonatites (excluding
outliers) ...................................................................................................................................................................................... 71
Table 9-1 Average REO distribution of Apatite, analysed by LA-ICP-MS, in Songwe carbonatites (excluding
outliers) ...................................................................................................................................................................................... 80
Table 9-2 Summary of assay results for the 5 channel sample lines ............................................................................ 88

J2897 Mkango Songwe Hill PFS November 2014 Page: xii
Table 9-3 Representative assay results for carbonatite, fenite and breccia from the 5 channel sample lines90
Table 10-1 Details of 38 diamond drillholes on Songwe Hill .......................................................................................... 92
Table 10-2 Summary of Significant Mineralized Intersections from Stage 1 drilling campaign ....................... 98
Table 10-3 Summary of Significant Mineralized Intersections from Stage 2 drilling campaign ..................... 100
Table 13-1 Drill core samples used for testwork ................................................................................................................ 114
Table 13-2 Typical Mineralogy of Songwe Hill .................................................................................................................... 115
Table 13-3 SMC test results ........................................................................................................................................................ 118
Table 13-4 Classification of ore hardness in terms of A*b parameter ....................................................................... 118
Table 13-5 Bond abrasion index test results ........................................................................................................................ 119
Table 13-6 Typical classification of ore abrasiveness based on Bond abrasion index ........................................ 119
Table 13-7 Results summary for Bond rod work index .................................................................................................... 120
Table 13-8 Typical classificaiton of ore hardness based Bond ball and rod work indices ................................. 120
Table 13-9 Results summary for Bond ball work index tests ......................................................................................... 122
Table 13-10 Mintek flotation results on Composite A ..................................................................................................... 124
Table 13-11 Selected flotation results on Composite B .................................................................................................. 125
Table 13-12 Leach recoveries based on a whole rock composite ............................................................................... 127
Table 13-13 Leach recoveries based on a flotation concentrate ................................................................................. 128
Table 13-14 Bulk leach, gangue leach and RE leach on concentrate ......................................................................... 129
Table 13-15 Leach, Caustic Conversion and Overall Recoveries on a Flotation Concentrate .......................... 129
Table 13-16 Sample Composition ............................................................................................................................................ 130
Table 13-17 Ground Master Composite Size by Analysis ............................................................................................... 132
Table 13-18 Master Composite Bulk Float Product Mix (Test 5) .................................................................................. 132
Table 13-19 Comparison of Flotation Test 5 and Combined Concentrates ............................................................ 133
Table 13-20 Calcite Leach ............................................................................................................................................................ 134
Table 13-21 Rare Earth Leach on Calcite Leach Residue ................................................................................................. 135
Table 13-22 HCl Dissolution of Caustic Conversion Residue ........................................................................................ 136
Table 13-23 Purification of RE Leach Solution..................................................................................................................... 137
Table 13-24 Raw RE Hydroxide Precipitation....................................................................................................................... 138
Table 13-25 Selective dissolution of mixed RE hydroxide .............................................................................................. 139

J2897 Mkango Songwe Hill PFS November 2014 Page: xiii
Table 13-26 Rare Earth Recovery by Stage ........................................................................................................................... 141
Table 14-1 Drilling and Channel input data Songwe Hill: Mineral Resource Estimation .................................... 145
Table 14-2 Core recovery in percent per depth interval below surface .................................................................... 146
Table 14-3 Checklist for Mineral Resource Reporting (CIM 2010) .............................................................................. 148
Table 14-4 Individual REO proportions at Songwe Hill ................................................................................................... 163
Table 14-5 Variogram parameters ........................................................................................................................................... 164
Table 14-6 Search parameters ................................................................................................................................................... 165
Table 14-7 In-situ Indicated Mineral Resources for Songwe Hill: Carbonatite domain as at 30th
September
2012 ........................................................................................................................................................................................... 170
Table 14-8 In-situ Inferred Mineral Resources for Songwe Hill: Carbonatite domain as at 30th
September
2012 ........................................................................................................................................................................................... 170
Table 14-9 In-situ Indicated Mineral Resources for Songwe Hill: Fenite domain as at 30th
September 2012
..................................................................................................................................................................................................... 171
Table 14-10 In-situ Inferred Mineral Resources for Songwe Hill: Fenite domain as at 30th
September 2012
..................................................................................................................................................................................................... 171
Table 14-11 In-situ Indicated Mineral Resources for Songwe Hill: Mixed domain as at 30th
September 2012
..................................................................................................................................................................................................... 171
Table 14-12 In-situ Inferred Mineral Resources for Songwe Hill: Mixed domain as at 30th
September 2012
..................................................................................................................................................................................................... 171
Table 14-13 In-situ Indicated Mineral Resources for Songwe Hill: All domains at a 1% TREO cut-off as at 30th
September 2012 ................................................................................................................................................................... 172
Table 14-14 In-situ Inferred Mineral Resources for Songwe Hill: All domains at a 1% TREO cut-off as at 30th
September 2012 ................................................................................................................................................................... 172
Table 14-15 In-situ Indicated Mineral Resources: Individual REO contents at Songwe Hill at the 1% TREO cut
off as at 30th
September 2012 ......................................................................................................................................... 173
Table 14-16 In-situ Inferred Mineral Resources: Individual REO contents at Songwe Hill at the 1% TREO cut
off as at 30th
September 2012 ......................................................................................................................................... 173
Table 14-17 In-situ Indicated Mineral Resources: Individual REO proportions at Songwe Hill at the 1% TREO
cut off as at 30th
September 2012 ................................................................................................................................. 174
Table 14-18 In-situ Inferred Mineral Resources: Individual REO proportions at Songwe Hill at the 1% TREO
cut off as at 30th
September 2012 ................................................................................................................................. 174

J2897 Mkango Songwe Hill PFS November 2014 Page: xiv
Table 15-1 Pay limit grade estimate ........................................................................................................................................ 177
Table 15-2 Mineral Reserve Estimate summary .................................................................................................................. 178
Table 16-1 Summary of geotechnical properties for the material at Songwe Hill REE ....................................... 181
Table 16-2 MRMR adjustment factors, Songwe Hill REE ................................................................................................. 183
Table 16-3 Adjustments for weathering ................................................................................................................................ 183
Table 16-4 Slope configurations for Songwe Hill REE ...................................................................................................... 185
Table 16-5 Techno-economic data set for pit optimisation. ......................................................................................... 187
Table 16-6 Summary of Whittle pit shells ............................................................................................................................. 188
Table 16-7 Summary of optimised pit shell.......................................................................................................................... 189
Table 16-8 Mining equipment fleet. ........................................................................................................................................ 193
Table 16-9 Summary of open pit mining schedule ........................................................................................................... 195
Table 17-1 Key design parameters........................................................................................................................................... 196
Table 18-1 Summary tailings production plan .................................................................................................................... 212
Table 18-2 Design criteria associated with the TSF ........................................................................................................... 213
Table 18-3 Average rainfall ......................................................................................................................................................... 215
Table 18-4 Rainfall depth as a function of event duration and recurrence interval ............................................. 215
Table 18-5 Summary of stoage capacity calculations for proposed TSF .................................................................. 219
Table 18-6 Inputs to water balance calculations for the Musolo TSF ........................................................................ 221
Table 18-7 Selected results from water balance calculations for Musolo TSF........................................................ 221
Table 18-8 Expected runoof to TSF decant pool as a function of event duration and recurrence interval 222
Table 18-9 Key parameters associated with the Musolo RWD / SWD facility ........................................................ 227
Table 18-10 Summary of estimated capital costs .............................................................................................................. 229
Table 19-1 Export quotas for the Chinese REE Industry .................................................................................................. 236
Table 19-2 Principal applications of REE ................................................................................................................................ 238
Table 19-3 Projected prices for REE and Yttrium ............................................................................................................... 241
Table 20-1 Acceptable dust fall rates as measured ........................................................................................................... 245
Table 20-2 Dust fallout rates observed at Songwe ........................................................................................................... 249
Table 20-3 Comparison of National Red List plant species found on Songwe with the IUCN Red List; (IUCN
2012. IUCN Red List of Threatened Species) ............................................................................................................. 256

J2897 Mkango Songwe Hill PFS November 2014 Page: xv
Table 21-1 Contractor responsibility matrix ......................................................................................................................... 271
Table 21-2 Contractor mobilisation fee ................................................................................................................................. 273
Table 21-3 Mining capital cost .................................................................................................................................................. 274
Table 21-4 Currency exchange rates and equipment supply foreign exposure .................................................... 275
Table 21-5 Process plant capital estimate cost summary ............................................................................................... 276
Table 21-6 Acid plant capital cost estimate summary ..................................................................................................... 277
Table 21-7 Process plant infrastructure capital cost estimate summary .................................................................. 278
Table 21-8 Total process plants and infrastructure estimate cost, by cost type ................................................... 279
Table 21-9 Summary of estimated capital costs - TSF ..................................................................................................... 280
Table 21-10 Summary of initial capital expenditure ......................................................................................................... 281
Table 21-11 Estimated mining contractor costs ................................................................................................................. 282
Table 21-12 Labour summary .................................................................................................................................................... 283
Table 21-13 Owners team............................................................................................................................................................ 284
Table 21-14 Basis of mining fleet operating cost............................................................................................................... 284
Table 21-15 Summary of mining operating costs .............................................................................................................. 285
Table 21-16 Estimated milling/flotation operating costs ................................................................................................ 286
Table 21-17 Estimated hydrometallurgical costs ............................................................................................................... 286
Table 21-18 Estimated G&A and other costs ....................................................................................................................... 286
Table 21-19 Operating cost summary – processing plant .............................................................................................. 288
Table 21-20 Estimated total cash cost summary ................................................................................................................ 292
Table 21-21 Summary of closure costs for Songwe .......................................................................................................... 292
Table 22-1 Projected prices for REE and Yttrium ............................................................................................................... 294
Table 22-2 Indicated and Inferred Mineral Resource Estimate ..................................................................................... 296
Table 22-3 Probable Mineral Reserve Estimate .................................................................................................................. 296
Table 22-4 Summary of mining and processing inputs and results ........................................................................... 297
Table 22-5 Summary of selected financial inputs and corresponding results - Capital ..................................... 297
Table 22-6 Summary of selected financial inputs and corresponding results - costs ......................................... 298
Table 22-7 Summary of selected financial inputs and corresponding results (Nominal)– post tax valuation
..................................................................................................................................................................................................... 298

J2897 Mkango Songwe Hill PFS November 2014 Page: xvi
Table 22-8 NPVs of the Project ................................................................................................................................................. 299
Table 22-9 Sensitivity of NPV (Nominal) to changes in metal prices (all metals), Capex and Opex. ............. 301
Table 22-10 Sensitivity of NPV @ 10 % (nominal) to two way variation in Opex and Capex. ......................... 302
Table 22-11 Cash Flow Model – Mkango Project .............................................................................................................. 303
Table 22-12 Cash Flow Model – Mkango Project .............................................................................................................. 304
Table 24-1 Cross Sector Licences Required for project ................................................................................................... 313
Table 24-2 Licence Required and Applicable Authority .................................................................................................. 313
Table 26-1 Estimated techncial costs – Definitive Feasibility Study ............................................................................ 333
LIST OF FIGURES
Figure 1-1 Diagram showing slope configuration, Songwe Hill Project ........................................................................ 7
Figure 1-2 NPV @ 10 % (Nominal) Sensitivity Analysis ..................................................................................................... 22
Figure 4-1 Location of the Songwe Hill (red square) southeast of Zomba ................................................................ 27
Figure 4-2 Location of EPL 0284/10 and access roads ....................................................................................................... 29
Figure 5-1 Regional geography and road access to the Songwe Hill Project area ................................................ 33
Figure 5-2 Period surface wind rose for Songwe Hill modelled data, 01 January 2010 – 31 December 201235
Figure 5-3 Average monthly temperature derived from the Songwe Hill modelled data (2010-2012) ......... 37
Figure 5-4 Daily Mean, Minimum and Maximum temperature extracted from the LocClim database for study
area .............................................................................................................................................................................................. 38
Figure 5-5 Average Monthly Relative Humidity derived from the Songwe Hill modelled data (2010-2012)39
Figure 5-6 Average Monthly Precipitation derived from the Songwe Hill modelled data (2010-2012) ........ 40
Figure 5-7 Monthly precipitation and Potential Evapotranspiration extracted from the LocClim database for
study area .................................................................................................................................................................................. 41
Figure 5-8 Monthly Sunshine Hours, Day-length and Sunshine Fraction extracted from the LocClim
database for study area ....................................................................................................................................................... 41
Figure 5-9 Physio-geographical map of the Phalombe district ...................................................................................... 42
Figure 5-10 Songwe Hill carbonatite abutting against Mauze Hill ............................................................................... 43
Figure 5-11 View from Songwe Hill onto Mkango’s exploration camp ...................................................................... 44

J2897 Mkango Songwe Hill PFS November 2014 Page: xvii
Figure 6-1 Geological map with borehole and trench locations.................................................................................... 49
Figure 6-2 Geological map with geochemical sample locations.................................................................................... 50
Figure 6-3 Drill holes with drill intersections exceeding 1 % REO ................................................................................. 51
Figure 7-1 Distribution of Chilwa Province alkaline intrusions in southern Malawi and Mozambique .......... 52
Figure 7-2 Surface Geological Map of Songwe Hill ............................................................................................................ 55
Figure 7-3 Examples of the three major rock types at Songwe Hill .............................................................................. 56
Figure 7-4 Examples of geological domains in two southern cross section ............................................................. 60
Figure 7-5 Examples of mineralized rock types .................................................................................................................... 61
Figure 7-6 Examples of geological domains in two northern cross section .............................................................. 62
Figure 7-7 Examples of the various domains in two cross section ............................................................................... 65
Figure 7-8 Example of contact between fenite and calcite carbonatite ...................................................................... 66
Figure 7-9 Thorium versus Cerium from 2011-2012 drill programme samples ...................................................... 67
Figure 7-10 SEM images of synchysite in the Songwe carbonatite .............................................................................. 72
Figure 7-11 SEM images of apatite in the Songwe carbonatite ..................................................................................... 73
Figure 7-12 Chondrite-normalized REE pattern for apatite in Songwe carbonatite .............................................. 74
Figure 7-13 Chondrite-normalized late-stage apatite from Songwe carbonatites ................................................ 74
Figure 7-14 Florencite-rich groundmass of carbonatite breccia .................................................................................... 75
Figure 8-1 General model for an alkali silicate-carbonate intrusive complex .......................................................... 76
Figure 9-1 Geological map of Songwe Hill with sample localities of JICA (1988) and Mkango (2010) samples
....................................................................................................................................................................................................... 81
Figure 9-2 Geological map of Songwe Hill with assay results for Mkango samples ............................................. 82
Figure 9-3 Modified analytical signal of TMI over Songwe Hill ...................................................................................... 83
Figure 9-4 Thorium radiometric survey over Songwe Hill ................................................................................................ 84
Figure 9-5 Ground gravity survey over Songwe Hill ........................................................................................................... 85
Figure 9-6 Geological map with location and TREO of the 5 channel sample lines .............................................. 86
Figure 9-7 Example of Channel sampling programme on Songwe Hill ...................................................................... 87
Figure 10-1 Diamond core drill rig on Songwe Hill ............................................................................................................. 93
Figure 10-2 Geological map with Stage 1 and Stage 2 drill collars and traces ........................................................ 93
Figure 10-3 Examples of borehole beacon ............................................................................................................................. 96

J2897 Mkango Songwe Hill PFS November 2014 Page: xviii
Figure 11-1 Examples of drillcore marking before and after core splitting ............................................................. 103
Figure 11-2 Core logging and core tray storage facilities .............................................................................................. 105
Figure 13-1 Location of drill holes used for metallurgical testwork ........................................................................... 114
Figure 13-2 BSE image of fine acicular synchysite in a screened -1.7 mm sample .............................................. 116
Figure 13-3 JK Tech Drop weight testing machine ............................................................................................................ 117
Figure 13-4 Batch rod mill grind-ability test equipment ................................................................................................. 120
Figure 13-5 Batch ball mill grind-ability test equipment ................................................................................................ 121
Figure 13-6 Hydrometallurgical Flowsheet ........................................................................................................................... 140
Figure 14-1 Drilling plan for Songwe Hill .............................................................................................................................. 143
Figure 14-2 Void or cavity in carbonatite: void is 20 cm in diameter rimmed with calcite ............................... 147
Figure 14-3 Scattergram of core recoveries versus grade for Songwe Hill ............................................................. 147
Figure 14-4 Sub-vertical fenite carbonatite contact at Songwe Hill ........................................................................... 154
Figure 14-5 Borehole sectional views ..................................................................................................................................... 155
Figure 14-6 Example of an horizontal sectional interpretation at Songwe Hill: 300 m amsl ............................ 156
Figure 14-7 Oblique view of Songwe Hill Carbonatite and Mixed lithology wireframes cut by topographic
surface looking south west .............................................................................................................................................. 157
Figure 14-8 Borehole TREO in the Carbonatite Domain at Songwe Hill ................................................................... 158
Figure 14-9 Borehole TREO in the Fenite Domain at Songwe Hill .............................................................................. 159
Figure 14-10 Borehole TREO in the Mixed Domain at Songwe Hill ............................................................................ 159
Figure 14-11 Songwe Hill Carbonatite Borehole TREO Log probability plot .......................................................... 160
Figure 14-12 Songwe Hill Fenite Borehole TREO Log probability plot...................................................................... 160
Figure 14-13 Songwe Hill Mixed Borehole TREO Log probability plot ..................................................................... 161
Figure 14-14 Songwe Hill Carbonatite Q-Q Plot: Boreholes versus Channels ........................................................ 161
Figure 14-15 Songwe Hill Fenite Q-Q Plot: Boreholes versus Channels ................................................................... 162
Figure 14-16 Songwe Hill Mixed Q-Q Plot: Boreholes versus Channels ................................................................... 162
Figure 14-17 Block model view looking south west: All Domains ............................................................................... 166
Figure 14-18 Block model view looking south west: All domains TREO % .............................................................. 167
Figure 14-19 Surface expression of TREO grades at Songwe Hill ............................................................................... 167
Figure 14-20 Surface expression of LREO grades at Songwe Hill ................................................................................ 168

J2897 Mkango Songwe Hill PFS November 2014 Page: xix
Figure 14-21 Surface expression of HREO grades at Songwe Hill............................................................................... 168
Figure 14-22 Surface expression of Th grades at Songwe Hill ..................................................................................... 169
Figure 16-1 Photograph of proposed area for Songwe Hill open pit mine ............................................................ 179
Figure 16-2 Photograph showing split core from Songwe Hill .................................................................................... 180
Figure 16-3 Adjusted MRMR chart showing overall slope angles, Songwe Hill REE ........................................... 182
Figure 16-4 Slope configurations, Songwe Hill REE .......................................................................................................... 186
Figure 16-5 Dimensional view of pit shell number 15...................................................................................................... 189
Figure 16-6 Section through open pit shell number 15, showing block model coloured by grade .............. 190
Figure 16-7 Plan view showing pit pushbacks..................................................................................................................... 191
Figure 16-8 Plan view of final pit .............................................................................................................................................. 192
Figure 16-9 Section A-A through final pit, looking East .................................................................................................. 192
Figure 17-1 Process flow sheet .................................................................................................................................................. 197
Figure 17-2 HCL regeneration process flowsheet .............................................................................................................. 204
Figure 18-1 General mine site layout ...................................................................................................................................... 209
Figure 18-2 General arrangement of the process plant .................................................................................................. 210
Figure 18-3 Wind rose for Songwe: 01 January 2010 to 31 December 2012 ......................................................... 216
Figure 18-4 Candidate sites for the tailings storage facility .......................................................................................... 217
Figure 18-5 Earthquake hazard map of Malawi .................................................................................................................. 223
Figure 18-6 Capital cost breakdown in US$ millions ........................................................................................................ 230
Figure 19-1 Periodic table of elements .................................................................................................................................. 232
Figure 19-2 Global REE production from 1985 to 2012 .................................................................................................. 233
Figure 19-3 Rest of World REE production 2013 ................................................................................................................ 234
Figure 19-4 REE production from 1994 - 2012 ................................................................................................................... 235
Figure 19-5 Estimated uses of Rare Earth Metals for 2013 (USA) ................................................................................ 239
Figure 20-1 Study Area for Specialists .................................................................................................................................... 244
Figure 20-2 An installed dust sampler, Songwe Hill ......................................................................................................... 246
Figure 20-3 Dust Fallout Sampler locations ......................................................................................................................... 247
Figure 20-4 Dust fallout rates observed at Songwe .......................................................................................................... 250
Figure 20-5 Topography of the study area ........................................................................................................................... 252

J2897 Mkango Songwe Hill PFS November 2014 Page: xx
Figure 20-6 Boulder-strewn depositional area of an old landslide in the study area ......................................... 253
Figure 20-7 Grass and shrub mosaic on Songwe Hill ....................................................................................................... 255
Figure 20-8 An aloe growing on the Songwe hilltop ....................................................................................................... 256
Figure 20-9 Main soil types of the study area (modified from data from Land Husbandry Dept., Lilongwe
Malawi) ..................................................................................................................................................................................... 258
Figure 20-10 Gully erosion in the study area ....................................................................................................................... 259
Figure 20-11 A view down a rivulet to the Mpoto Lagoon ............................................................................................ 260
Figure 20-12 A spring on the south face of Songwe Hill ................................................................................................ 261
Figure 20-13 Groundwater sampling points ........................................................................................................................ 262
Figure 20-14 Village meeting at Maone Group Village Headman .............................................................................. 266
Figure 20-15 The Proposed Four Levels of Stakeholder Engagement....................................................................... 267
Figure 21-1 Capital cost breakdown in US$ millions - TSF ............................................................................................ 281
Figure 21-2 Mining contract supervisory structure ........................................................................................................... 282
Figure 21-3 Operating cost summary ..................................................................................................................................... 289
Figure 22-1 NPV @ 10 % nominal sensitivy analysis ........................................................................................................ 299
Figure 22-2 Annual cash flow (nominal) ................................................................................................................................ 300
Figure 22-3 Cumulative annual cash flow (nominal) ......................................................................................................... 300
LIST OF APPENDICES
Appendix 1 : Glossary of Abbreviations, Acronyms and Terms
Appendix 2 : QP Certificates
Appendix 3 : QA/QC Summaries
Appendix 4 : Histograms of 3 Domains
Appendix 4 : Variograms of 3 Domains
Appendix 6 : Individual REO concentrations
Appendix 7 : Individual REO distribution

J2897 Mkango Songwe Hill PFS November 2014 Page: 1
1 SUMMARY
This Technical Report has been prepared by the MSA Group (Pty) Ltd, SNC-Lavalin (Pty) Ltd, Met-
Chem Consultants (Pty) Ltd, Epoch Resources (Pty) Ltd, and Digby Wells Environmental
(collectively the Consultants) on behalf of Mkango Resources Limited (Mkango). The Consultants
were commissioned to prepare a Technical Report for a Pre-feasibility Study (PFS) on the Songwe
Hill Rare Earth Element Property (the Project) located in the Republic of Malawi. Mkango is a
Canadian mineral exploration and development company listed on the TSX Venture Exchange
(TSXV) under the symbol “MKA”. The Songwe Hill Rare Earth Element Project (the Project) is 100 %
owned by Mkango through its wholly owned subsidiary Lancaster Exploration Limited. The Project
is located within the 100 % owned Exclusive Prospecting Licence (EPL) 0284/10R (the Phalombe
Licence) in southeast Malawi.
This Technical Report has been prepared in accordance with the disclosure and reporting
requirements set forth in the Canadian National Instrument 43-101 Standards of Disclosure for
Mineral Projects (NI 43-101), the corresponding Companion Policy 43-101 CP, the corresponding
Form 43-101F1 (Form F1), and the CIM Definition Standards – For Mineral Resources and Mineral
Reserves (2014).
Unless specified otherwise, all costings have been undertaken at an accuracy level of +/- 25 %.
1.1 Property Description and Location
The Project is located within the 100 % owned Phalombe Licence, in the Phalombe District of the
Southern Region of Malawi, approximately 70 km southeast of the city of Zomba and
approximately 90 km east-northeast of the capital city of Blantyre. All-weather roads link these
centres with the town of Migowi, approximately 15 km from Songwe Hill, and these are currently
being upgraded. Secondary gravel roads provide vehicle access to the exploration camp.
The Songwe Hill area has a sub-tropical climate. Maximum monthly rainfall is between 125 cm
and 218 cm during the rainy season of December to March.
The deposit lies on the north-facing slopes of Songwe Hill, a steep-sided conical hill with a
diameter of approximately 800 m that rises to a summit elevation of 990 m. Songwe Hill abuts the
slopes of the adjacent and larger Mauze Hill which rises above the alluvial plains south of Lake
Chilwa and straddles the border with Mozambique. The slopes of Songwe Hill are densely
vegetated with elephant grass following the rainy season but in other times of the year,
vegetation does not hinder access.
1.2 History and Ownership
Early investigations of mineral occurrences in the license area date from the 1930s through the
1950s. The first significant evaluation of rare earth elements (REE) in this area was a surface
exploration and drill program carried out in the late 1980s by the Japan International Cooperation
Agency (JICA) and the Metal Mining Agency of Japan (MMAJ), in conjunction with the Geological
Survey of Malawi. Little further work was reported until Mkango Resources Ltd. was granted the
license in January 2010. A comprehensive exploration and research program ensued, which
included a two phase drill program totaling approximately 6,850 metres. Upon completion of the
J2897 Mkango Songwe Hill PFS November 2014 Page: 2
drill campaign and a detailed REE mineralogical program, Mkango announced a Maiden Mineral
Resource Estimate comprised of an in situ Indicated Mineral Resource of
13.2 Mt, grading 1.62 % and an in situ Inferred Mineral Resource of 18.6 Mt, grading 1.38 % at
1 % TREO cut-off grade. The NI 43-101 Technical Report and Mineral Resource Estimate for the
Songwe Hill REE Project was filed on November 22, 2012.
1.3 Geology and Mineralization
Basement rocks in the Songwe Hill area are Precambrian charnockitic granulites and gneiss.
During the Jurassic/Cretaceous period (206 Ma to 65 Ma), these were intruded by a variety of
alkalic intrusions referred to as the Chilwa Alkaline Province. In the area of Songwe Hill, there are a
number of large alkaline intrusions as well as many small plugs and dykes. The dominant
lithologies are alkaline syenitic rocks with locally associated carbonatites.
Songwe Hill is interpreted as a volcanic vent that is expressed as a steep-sided hill approximately
800 m in diameter. The carbonatite is best exposed along the north- eastern slope of Songwe Hill
and, together with a somewhat smaller area along its north western edge, is tentatively
interpreted to form a ring structure. Information from surface mapping and drill core indicates
that the vent complex consists of a multi-phase intrusion characterized by diverse carbonatites
and breccias exhibiting a range of alteration from potassic fenitisation to low temperature
hydrothermal / carbo-hydrothermal overprinting. The vent complex cuts the western end of the
large Mauze nepheline syenite intrusion, but the external contacts on the western and
northwestern sides of the vent are hidden beneath recent surficial eluvial deposits.
The principal lithologies that comprise the Songwe Hill vent complex are carbonatite, fenite and
breccia. The carbonatites are dominantly grey calcic carbonatites, although subordinate ferro-
carbonatites are present. The fenites comprise dominantly K-feldspar rocks and appear to form an
aureole around the carbonatite. They are interpreted to have formed through metasomatism
related to the carbonatite intrusion. The breccias range from clearly abraded pebble-sized
fragments (pebble dykes) to angular blocks that are metres in diameter and include significant
volumes of breccia in which the fragments appear to have undergone little or no movement. The
breccias can essentially be divided into two types: feldspathic-rich breccias and carbonatite-rich
breccias and are interpreted to be related to high level explosive processes during the formation
of the vent complex.
The principal zone of REE mineralization outcrops along the northeastern slope of Songwe Hill.
REE mineralization is present in carbonatites, fenites and breccias, which are exposed
intermittently over a surface area of approximately 350 m by 100 m. The REE mineralization is
untested to the northeast and southwest beyond the limits of the present drilling and below the
deepest vertical intersection of approximately 350 m below the surface of Songwe Hill and there
is additional regional exploration potential in the Songwe and other carbonatites. The mineralized
body is interpreted to be a carbonatite plug with essentially sub-vertical margins. In plan view, it is
elongate in a northeast-southwest direction.
For the purposes of the Mineral Resource definition, three geological domains have been
identified in the Songwe Hill deposit: a carbonatite domain; a fenite domain; and a 'mixed'
domain consisting of breccia and/or finely intermixed carbonatite and fenite. REE mineralization is

J2897 Mkango Songwe Hill PFS November 2014 Page: 3
dominantly within the carbonatites, but locally also occurs within the fenite and mixed domains.
The dominant REE-bearing minerals are synchysite and apatite. The apatite is anomalously
enriched in the heavy rare earth oxides (HREO) compared to apatites in most carbonatite
deposits. The REE mineralization is closely associated with strontianite and baryte and is
interpreted to have formed through sub-solidus hydrothermal alteration following the carbonatite
intrusion.
1.4 Status of Exploration
Mkango has compiled an extensive exploration database over Songwe Hill, comprising geological,
geochemical and geophysical data. The quality of exposure on Songwe Hill has allowed detailed
geological mapping and surface sampling which helped identify the outcrop extent of the
carbonatite. Surface radiometric surveys have been useful in better defining the areas of
carbonatite exposure. Systematic outcrop stripping and channel sampling along the surface trace
of the diamond drill lines has helped to characterize the mineralized zone at surface and connect
it with mineralization identified by diamond drilling.
A total of 38 inclined and vertical diamond drill holes totaling 6,852.28 m have been drilled in a
series of fences spaced approximately 25 m apart to obtain different depth intersections of the
mineralization. The outcropping position of the mineralized zone on each drill fence was
constrained by channel sampling. The channels and drill core were sampled at a nominal interval
of one metre and the assay results together with the bulk density measurements were
incorporated into the Project database.
1.5 Mineral Resources
The following an in situ Mineral Resource Estimate for Total Rare Earth Oxides (TREO), Total Heavy
Rare Earth Oxides (HREO) and Total Light Rare Earth Oxides (LREO) have been declared from
Songwe Hill and represent 100 % of the estimated Mineral Resources defined to date over the
Project effective September 30, 2012 (Table 1-1 and Table 1-2). A cut-off of 1 % TREO is currently
considered to be appropriate. All references to rare earths in this Technical Report include yttrium
as a heavy rare earth.
Table 1-1
In situ Indicated Mineral Resources for Songwe Hill: All domains at a 1% TREO cut-off as at
30th
September 2012
Domain Million
Tonnes
LREO
%
HREO
%
TREO
%
TREO
Tonnes
HREO
Proportion
Carbonatite 11.10 1.50 0.12 1.62 179,499 7.3 %
Fenite 1.37 1.51 0.10 1.61 22,145 6.5 %
Mixed 0.69 1.58 0.07 1.65 11,454 4.5 %
Totals 13.16 1.50 0.11 1.62 213,098 7.1 %
Source: Hall (2012)

J2897 Mkango Songwe Hill PFS November 2014 Page: 4
Table 1-2
In situ Inferred Mineral Resources for Songwe Hill: All domains at a 1% TREO cut-off as at
30th
September 2012
Domain Million
Tonnes
LREO
%
HREO
%
TREO
%
TREO
Tonnes
HREO
Proportion
Carbonatite 8.64 1.24 0.11 1.35 116,967 8.2 %
Fenite 8.27 1.24 0.10 1.35 111,318 7.5 %
Mixed 1.68 1.59 0.06 1.65 27,863 3.8 %
Totals 18.59 1.28 0.10 1.38 256,149 7.4 %
Source: Hall (2012)
1.6 Mineral Reserves
The process followed in converting the Mineral Resources to Mineral Reserves was as follows:
a pit optimisation and design exercise/analysis was completed
only the Indicated Mineral Resources were considered in the pit optimisation and design
exercise ;
input criteria were developed for the pit optimisation analysis;
a practical pit design was completed using the optimum pit shell generated by the pit
optimisation. The practical pit design includes ramps, safety berms and other aspects not
considered by the optimisation software;
a production schedule was generated from the pit design, based on the mine owner’s
stated production target;
capital and operating costs were estimated for the construction and operation of the mine;
and
the production schedule and cost estimates were used in a discounted cash flow model,
together with the expected realised product prices and plant recoveries. The result of the
financial modelling was positive showing that, based on the assumptions and estimations
made in this study, the Project is viable.
The modifying factors used in converting the Mineral Resource to a Mineral Reserve are shown in
Table 1-3.

J2897 Mkango Songwe Hill PFS November 2014 Page: 5
Table 1-3
Modifying factors used in the Mineral Reserve Estimate
Factor Unit Quantity Comment
Cut-off grade % TREO 1 Higher than pay limit of 0.57 %
Mining recovery % 95 5 % ore loss expected during mining
Mining Dilution % 5 Dilution assumed to carry zero grade
Plant recovery % 34 Accounts for the portion of Ce which is removed
by the metallurgical process and is not sold
Product price US$/kg 55.01 Average recovered basket price per kg of
recovered rare earth oxides
Operating Cost US$/tonne
processed
96.42 Average Life of Mine operating cost per tonne
processed
Operating Cost US$/kg 16.95 Average Life of Mine operating cost per kg of
REO recovered
Table 1-4 shows a summary of the Estimated Mineral Reserves.
Table 1-4
Estimated Mineral Reserve
Category Tonnes TREO (%) TREO Content (t)
Probable Mineral Reserves 8,482,603 1.60 136,139
Proven Mineral Reserves - - -
Total Mineral Reserves 8,482,603 1.60 136,139
Note: TREO – total rare earth oxides including yttrium
1.7 Mining
A geotechnical study was undertaken which included:
a site visit;
the geotechnical logging of core;
the collation of geotechnical data; and
the analysis of the data and assimilation to determine the mine design criteria.
Table 1-5 shows a summary of geotechnical properties of the deposit at Songwe Hill.

J2897 Mkango Songwe Hill PFS November 2014 Page: 6
Table 1-5
Summary of geotechnical properties for the material at Songwe Hill REE
Material properties Nepheline
Syenite
Weathered
fenite and
carbonatite /
Breccias?
Fresh
Carbonatite
Fresh
Fenite
Mixed
carbonatite
and fenite
Feldspathic
breccia
Inferred thickness for
a ±200m slope (m)
15.00 20.00 60.00 50.00 60.00 20.00
Average RMR89 58.00 45.00 63.13 63.13 54.50 45.00
Average GSI 58.00 48.00 65.00 65.00 60.38 48.00
UCS (Range) 100 - 300 30 - 100 100 - 300 100 - 300 100 - 300 30 - 100
Disturbance factor (D) 0.70 0.70 0.70 0.70 0.70 0.70
Density ρ (kg/m3) 2700.00 2000 - 2700 2700 - 3000 2700 2700 - 3000 2000 - 2700
Cohesion (kPa) 5000 - 15000 700 - 5000 5000 - 15000 5000 -
15000
5000 -
15000
700 - 5000
Friction angle φ (°) 25 - 30 20 - 25 25 - 30 25 - 30 25 - 30 20 - 25
Note: RMR89 = Rock Mass Rating (Bieniawski, 1989)
Based on this data, design criteria were developed for the open pit. Table 1-6 shows the
recommended slope design and Figure 1-1 shows a diagram of the recommended slope
configuration.
Table 1-6
Slope configurations for Songwe Hill Project
Threshold Safety Factor 150 m slope height 200 m slope height 250 m slope height
Overall Slope Angles (degrees)
Moderate
design
1.30 45.67 41.17 36.67
Based on a moderate design using empirical methods, an overall slope angle of 41° was selected
for the open pit.

J2897 Mkango Songwe Hill PFS November 2014 Page: 7
Figure 1-1
Diagram showing slope configuration, Songwe Hill Project
A pit optimisation exercise was completed using the geotechnical design criteria and the techno-
economic data shown in Table 1-7.

J2897 Mkango Songwe Hill PFS November 2014 Page: 8
Table 1-7
Techno-economic data set for pit optimisation.
Item Amount Units
Operating Costs
Mining Cost 4.24 US$/t rock mined
Processing Cost 58.20 US$/t milled
General and Administration cost 8.73 US$/t milled
Capital Cost
Mining Capital 1.657 US$ million
Plant Capital 135.5 US$ million
Infrastructure 41.4 US$ million
Other Project Capital 30.1 US$ million
Sustaining Capital 1.0 US$ million per year
Technical Factors
Mining Dilution 5 %
Mining Loss 5 %
Metallurgical Recovery 34% %
Cut-off Grade 1.00 % TREO
Production Rate 500,000 tpa
Geotechnical
Overall Slope Angle uphill (high) side of pit 41 Degrees
Overall Slope Angle downhill (low) side of pit 46 Degrees
Economic
Royalties 5 %
Discount Factor 10 %
TREO Price 43,100 US$/tonne TREO
Note: 1) It is specifically noted that data used in this evaluation is preliminary in nature and it may not exactly
match the final data used in the Project evaluation elsewhere in this document.
2) The mining costs are quoted as per tonne of rock mined and will be applied to ore and waste.
3) TREO recovery is quoted excluding cerium, i.e. cerium is extracted as a waste product and attracts no
value.
4) The TREO price used is the forecast price realised after toll treatment and transport.
The optimum pit shell, which produced the maximum NPV, was selected as a base for the
practical open pit design.
The open pit mining method that will be employed is a standard drill, blast, truck and shovel
method.
Loading and hauling of waste will be a 24 hour operation. Ore mining will only be carried out
during the day shift to ensure effective grade control.

J2897 Mkango Songwe Hill PFS November 2014 Page: 9
A pit design was complete using the DeswickCad suite of mine design software. The overall
dimensions of the final open pit will be approximately 650 m north to south, 450 m east to west,
and at its deepest will be 300m deep when measured from the highest point of the pit on the
southern side of the pit. The upper most bench is on an elevation of 945 m and the final pit floor
is on 645 m elevation.
The pit will be mined in a series of five push backs, with the mining of pushback 1 commencing
on the 775 m elevation with the initial ramp. There is no pre-strip required as the initial mining is
in ore with strip ratio of less than 1.5:1 in the first year of mining. The overall strip ratio of the final
pit is 4.5:1 (tonne:tonne).
Mining will be undertaken by a mining contractor. A mining contractor was consulted during the
study and provided budget mining costs. The contractor visited the site and has an operational
base in Tete Province of Mozambique.
A mining schedule was developed, based on the pit design. The annual plant throughput is
500,000 tonnes per year. In order to optimise the grade of material processed, particularly in the
early years, the mining rate was increased and lower grade material is stockpiled until later in the
mine life.
No Inferred Mineral Resources were included in the production schedule. The life of mine
production is 8.483 million tonnes of ore at a grade of 1.60 % TREO, delivered to the plant. The
exclusion of Inferred Mineral Resources also allows for some upside, either in mine life or in
increasing the annual production rate, in the future if the Inferred Mineral Resources can be
upgraded to Measured or Indicated Mineral Resources. The current pit design includes 3.877
million tonnes of Inferred Mineral Resources at an average grade of 1.50 % TREO (in-situ grade),
which has not been considered as ore in this study.
The mining capital cost consists mainly of contractor mobilisation, site preparation and security
arrangements around the pit and amounts to US$ 1.657 million.
Mining operating costs were estimated based on a budget quote of $4.24/tonne mined received
from the mining contractor.
1.8 Process Overview
The process flow sheet consists of the beneficiation plant and the recovery plant.
The beneficiation plant comprises of the comminution and flotation circuits. The purpose of the
comminution circuit is to reduce the size of solid ore particles and thus increase the surface area
of solids to enable the liberation of valuable materials that are locked within the gangue minerals.
This is achieved by means of crushing and milling. Flotation is used to upgrade the mineralized
material. Flotation is a method of separation, which uses the differing surface properties of the
various minerals in the ore. It involves the selective attachment of mineral particles to air bubbles
generated in the flotation cell which float to the surface of the slurry and then flow over the lip of
the cells into the launders. A selective flotation reagent regime is used to separate rare earth
oxide minerals from gangue minerals.

J2897 Mkango Songwe Hill PFS November 2014 Page: 10
The recovery process flow sheet comprises a two stage selective hydrochloric acid leach process.
The hydrochloric acid is recycled via calcium sulphate precipitation with sulphuric acid. The
process flow sheet also includes caustic conversion, rare earth dissolution, purification, cerium
rejection and rare earth hydroxide precipitation. This approach offers advantages including a
significant reduction in acid costs as well as a further concentration of the rare earths thus
providing a reduction in downstream capital and operating costs.
1.8.1 Processing plant capital cost estimate
The capital cost estimate for the process plant, acid plant and associated infrastructure is
summarised in Table 1-8 and Table 1-9.
Table 1-8
Summary of process plant capital cost estimate
Description Direct Costs
(US$)
Indirect Costs1
(US$)
Other Costs2
(US$)
Total (US$)
Process plant (0.5 Mtpa ROM) 61,253,018 18,260,235 22,790,216 102,303,469
270 TPD acid plant 24,394,339 2,195,491 6,128,956 32,718,786
Plant complex infrastructure 23,336,896 4,871,793 7,947,096 36,155,785
TOTAL 171,178,040
Note: 1 Indirect costs include commissioning spares, construction camp facilities and services, vendor
assistance and engineering, procurement, construction and management (EPCM) costs; 2 Other costs include estimating allowance and owner’s costs
Table 1-9
Capital cost estimate split between concentrate and hydrometallurgy processing plants
Description Total (US$)
Milling and flotation processing plant 45,160,352
Hydrometallurgy processing plant 57,143,117
TOTAL 102,303,469
1.8.2 Processing plant operating cost estimate
The cash operating costs include the costs of milling, flotation, leaching, purification and
precipitation in addition to other costs associated with the operation of the facilities.
The operating cost estimate for both the beneficiation plant and hydrometallurgical plant is
summarised in Table 1-10.

J2897 Mkango Songwe Hill PFS November 2014 Page: 11
Table 1-10
Summary of operating cost estimate
Description US$/annum
Beneficiation plant 10,580,561
Hydrometallurgical plant 21,736,678
TOTAL 32,317,240
Note: The annual processing capacity was assumed at 500,000 tonnes per year of ore with a view to producing
an average of approximately 2,840 tonnes per annum of REO in mixed chemical concentrate with the majority
of Cerium removed as per the hydrometallurgical flow sheet. Cerium is currently considered to be a low value
REO.
1.9 Tailings
The design of the tailings storage facility (TSF) and related infrastructure includes:
a TSF constructed using the self-raising day wall deposition method at a depositional rate
of 41,667 tpm;
a Return Water Dam (RWD) and Storm Water Dam (SWD) associated with the TSF; and
the associated infrastructure for the TSF (i.e. perimeter slurry deposition pipeline, storm
water diversion trenches, access roads etc.).
The key design features of the TSF and related infrastructure are:
a compacted earth starter embankment wall, constructed with suitable material sourced
from within the RWD/SWD/TSF basins, with the following dimensions:
o 9 m high (i.e. crest elevation at 672 mamsl);
o 6 m wide crest;
o 1V:2H internal side slope; and
o 1V:3H external side slope;
a compacted bund wall, constructed with suitable material sourced from within the
RWD/SWD/TSF basin, with the following dimensions:
o 1 m high (i.e. from elevation 671 mamsl);
o 4 m wide crest;
o 1V:2H internal side slope; and
o 1V:3H external side slope;
the supply and installation of a liner to the tailings dam basin and inside slope of the starter
walls comprising (from top to base):
o a 1,500 micron High Density Polyethylene (HDPE) liner; and
o A6 Kaymat geotextile;
the self-rising portion of the TSF is battered at an overall side slope of 1V:3H;

J2897 Mkango Songwe Hill PFS November 2014 Page: 12
a 5 m wide elevated toe drain positioned along the inside toe of the starter wall
embankment;
a 3 m wide Natural Ground Level (NGL) toe drain extending the length of the inside
perimeter alongside the bund wall toe of the TSF;
160 ND non-slotted HDPE drainex piping, spaced at 50 m intervals and positioned along
the perimeter of the elevated and NGL toe drains. Seepage water emanating from the
drains is collected and channelled into the solution trench;
20 m wide toe catchment paddocks extending the perimeter of the tailings dam;
a solution trench around the TSF from which seepage and catchment paddock runoff water
is directed to the silt traps and, subsequently, into the RWD;
an energy dissipater for the collection of supernatant water from the penstock as well as
seepage water from the toe drains;
a two compartment reno-mattress/basket silt trap;
a clean storm water diversion channel with its associated cut-to-fill berm upstream of the
TSF;
a seepage cut-off trench downstream of the TSF, on the western and eastern side, to an
average depth of 5 m below NGL, from which possible collected seepage water is pumped
into the RWD;
a 450 ID HDPE, PE 100, PN 8 reinforced concrete encased penstock outfall pipe
compromising double intermediate and final vertical 510 ID precast concrete penstock ring
inlets. The penstock pipeline is fully encased in reinforced concrete along its entire length
and has an average gradient of 1V:65H;
wooden catwalks shall be constructed along the penstock pipeline with platforms at the
intermediate and final intakes to allow access to the penstocks during operation of the TSF;
and
a 120 mm ID HDPE slurry distribution pipeline along the perimeter length of the TSF starter
wall embankment.
The key design features of the RWD and SWD are:
the RWD/SWD combined capacity caters for the three day, 1 in 100 year storm event (307.6
mm of rainfall);
an integrated design approach whereby the RWD is situated inside the SWD;
the RWD storage capacity is equivalent to seven days of slurry return water (4,600 m3) for
day to day operations; and
the storage capacity in the SWD (50,209 m3) is for the accommodation of the high rainfall
storm events.
The total capital cost associated with the TSF is estimated at US$ 12.65 million and is summarised
in Table 1-11.

J2897 Mkango Songwe Hill PFS November 2014 Page: 13
Table 1-11
Summary of estimated capital costs
Item Description Amount (US$
millions)
Tailings Storage Facility
1 Schedule B: Site clearance and topsoil stripping 1.10
2 Schedule C: TSF starter embankment 1.70
3 Schedule D: drainage system to TSF starter embankment 0.23
4 Schedule E: decant penstock, drainage collection sumps and
access platform
0.62
5 Schedule F; Slurry delivery system 0.46
6 Schedule G: Surface water management works 0.17
7 Schedule H: miscellaneous 0.13
8 Schedule I: liner 2.64
Total Measured Works 7.06
Storm Water and Return Water Dam
9 Schedule B: site clearance and topsoil stripping 0.06
10 Schedule C: TSF starter embankment 0.48
11 Schedule D: miscellaneous 0.03
12 Schedule I: liner 0.16
Total Measured Works 0.73
Total Cost Calculation
Unmeasured Items @ 25 % 1.95
P & Gs @ 30 % 2.92
TOTAL COST 12.65
The following qualifications apply to the above mentioned capital cost estimate associated with
the TSF:
unmeasured items are estimated at 25 % of the measured works; and
preliminary and general (P & G) have been estimated at 30 % of the total works.
The TSF operational cost has been estimated based on current prices for similar TSF operations
operated by specialist contractors elsewhere in Africa. In the case of low tailings depositional
rates, the operating costs are dictated by the costs associated with establishing and maintaining
the staff and equipment necessary to manage the facility. The operating cost for the Project is
estimated at US$ 1 per tonne of tailing deposition (at 500 ktpa the cost shall be US$ 0.5 million
per annum). The total operational cost associated with the TSF is estimated at US$ 0.59 million
per annum and comprises:
US$ 1 per tonne of tailing deposition management (500 ktpa amounts to US$ 0.5 million
per annum);
US$ 45,700 per annum for pipe and valve replacements per annum; and
quarterly inspections and annual reviews of the facility at US$ 40,000 per annum.

J2897 Mkango Songwe Hill PFS November 2014 Page: 14
In addition to the capital costs associated with the construction of the TSF, provision has been
made for engineering design and construction site supervision. The total initial cost up to the
completion of construction of the TSF is estimated at US$ 13.29 million and comprises the
following:
construction of the TSF at US$ 12.65 million;
engineering Definitive Feasibility Study at US$ 160,000;
engineering detailed design at US$ 180,000; and
engineering construction supervision at US$ 300,000.
The cost for the rehabilitation and closure of the TSF is not included in the above LoM
expenditure estimate. It is accounted for in Section 4.3.
1.10 Environmental Aspects
Pre-feasibility Study environmental and social baseline studies were conducted in 2013 in
collaboration with Malawian specialists. These studies were conducted in line with the
requirements of the Equator Principles, International Finance Corporation (IFC) Performance
Standards as well as specific requirements and interpretations of Malawian Legislation as
provided by the Malawian Department of Environmental Affairs (DEA).
A Project Brief for the proposed environmental and social studies for the Environmental, Social
and Health Impact Assessment (ESHIA) was submitted to the DEA in the fourth quarter of 2013.
The DEA has responded with a suggested Terms of Reference which will be addressed in the
ESHIA which is planned for the Definitive Feasibility Study.
1.10.1 Legal framework
Several Acts regulate the minerals sector in Malawi. Amongst these are the Mines and Minerals
Act 1981 (and regulations), the Petroleum (Exploration and Production) Act 1983, and the
Explosives Act 1968. Once Mkango has completed its’ Pre-feasibility and Definitive Feasibility
Studies, it will be in a position to convert the current Exclusive Prospecting License (EPL) into a
Mining License, in terms of the Malawi Mines and Minerals Act 1981.
The Malawi Mines and Minerals Act 1981 is expected to be reviewed and modified within the next
two years to bring it in line with current international standards. This may have a bearing on the
Project going forward, but the effect is currently unknown.
The Malawian authorities issued a Mines and Mineral Policy in 2013. Through this Policy, the
Government seeks to guide and direct mineral resource development by stressing private sector
initiatives and involvement and the need to attract modern technology and investment capital.
The National Environmental Policy (1996) provides an overall structure against which
environmental policies can be assessed to ensure that the policies are consistent with the
principles of sustainable development, while the Environment Management Act (1996) contains
sections that specifically deal with the protection and management of the environment. Section
24 of the Environment Management Act outlines the requirements for projects, for which an
Environmental Impact Assessment (EIA) is needed.

J2897 Mkango Songwe Hill PFS November 2014 Page: 15
Developers of exploration and mining projects are required to submit an initial environmental
assessment known as a Project Brief to the DEA, which may lead to the authorities requiring an
EIA study. As mentioned above, a Project Brief for the proposed environmental and social studies
for the ESHIA was submitted to the DEA in the fourth quarter of 2013. The DEA has responded
with a Terms of Reference which is planned to be addressed in the ESHIA phase to be carried out
in conjunction with the Definitive Feasibility Study.
A number of permits and licences dealing with environmental issues will be required for the
Project, most of which will be required prior to the commencement of mining.
A comprehensive legal review, detailing the permits required and the applicable laws and
regulations, is available in Section 24.1.
1.10.2 Potential environmental risks
The risk assessment carried out as part of the PFS was aimed at identifying the main
environmental and social risks to the Project so that these could be managed through the project
development cycle. While it is not possible to have a totally risk-free environment, it should be
possible to avoid, reduce, eliminate or transfer some of the risks.
It is believed that all the risks identified and discussed below can be effectively mitigated or
managed and that they are not significant enough to be considered fatal flaws to the Project.
Similar risks have been effectively managed on similar mining and processing projects.
1.10.2.1 Reputational risk
There are various examples in Malawi where a mining company has suffered severe reputational
damage due to miscommunication, failure to address certain issues, not complying with local
legislation and raising expectations unduly. Often the consequences are so severe that the
company cannot proceed with the project due to opposition from local communities and NGOs’.
1.10.2.2 Approvals and timeframes
Mkango will have to go through a number of administrative processes in order to ensure it is
legally compliant before proceeding with the Project. The timeframes involved in obtaining all of
the necessary permits and authorisations should be taken into account in Project plans.
1.10.2.3 Institutional constraints
Although Malawi‘s environmental legal and regulatory framework follows good international
practice, in reality environmental and social management is constrained by an acute lack of
capacity within Government structures. Unless this situation is addressed, a significant expansion
of the mineral sector could result in wider risk of environmental degradation and an increase in
social conflicts and social marginalization.
1.10.2.4 Potential contaminant
REE milling and processing has potential for environmental contamination when not controlled
and managed properly due to constituents in the orebody and chemicals used in processing.
Contaminants are usually heavy metals, radionuclides and the processing chemicals.

J2897 Mkango Songwe Hill PFS November 2014 Page: 16
1.10.2.5 Water provision
Water for processing and potable use is likely to be sourced from groundwater. The exact water
requirements for the Project and potential impacts which the groundwater abstraction could have
on other water users still needs to determined.
1.10.2.6 Closure and rehabilitation
The mine facilities will need to be appropriately designed, constructed and monitored to ensure
compliance with environmental standards. In order to do this, Mkango needs to ensure there is
adequate funding to provide for on-going rehabilitation, closure and long term monitoring in
accordance with these standards.
1.10.2.7 Resettlement
Resettlement of some communities and land users will be required for the Project. Resettlement
needs to be undertaken with extreme sensitivity and through a well-defined process. If not
undertaken effectively, resettlement can cause fear, resentment and unhappiness and has the
ability to delay the Project. The policy and framework applied will have cost implications.
1.10.2.8 Perceptions and expectations
A project of this nature has the ability to raise expectations, particularly with regards to the
number of jobs available and the benefits that the Project will bring. If expectations are not met,
the communities could become disgruntled and oppose the Project.
1.10.2.9 Civil society and community liaison
There have been several examples in Malawi where Community and Civil Society Organisations
(CSO) have opposed a mining development. CSOs have the ability to cause confusion and
mistrust amongst the local communities, which ultimately breaks down the relationships formed
between the Project owners and the local communities.
1.10.2.10 Radiological Concerns
Concerns over radiation have the potential to create concerns, even where not substantiated by
facts. Further investigation is required to facilitate effective communication with the communities
on the actual risks involved and to ensure that the baseline levels are well understood.
1.11 Market Studies and Contracts
The market review was based on public domain sources, as well as Metal Pages, Asian Metal,
Technology Metals Research, Statistica, Industrial Minerals, US Geological Survey, research
publications by Roskill Consulting Group Ltd and equity analysts who have published research on
the REO sectors.
Prior to the 1990s, the Mountain Pass mine in the US was the world’s major rare earth supplier.
This changed rapidly after 1995 when China became the dominant global supplier. In 2013, China
was estimated to have accounted for about 90 % of global rare earth supply. The U.S. Geological
Survey (U.S. Geological Survey, 2014) reported total world mine production at approximately

J2897 Mkango Songwe Hill PFS November 2014 Page: 17
112,000 t REO in 2013, of which China accounted for 100,000 t REO. Production and exports of
Chinese rare earths are controlled by the Chinese Central Government. Outside of China, rare
earths are produced in the United States, Russia, Australia and India, with relatively minor
amounts also produced in Malaysia, Brazil and Vietnam.
The United States was a significant producer until 2002 when low-priced materials being sold by
China forced mines in the United States and other countries out of operation. As China limited
exports and prices increased rapidly in 2009 and 2010, mines in Australia and the United States
became active again with the USA producing 7,000 t of REE in 2012.
The main factor affecting international trade in rare earths over the past decade has been the
Chinese Government’s trade policy. Exports of rare earth ores and concentrates were restricted
and the Chinese Government started to introduce a form of export quota in 2000 with a view to
ensuring a stable domestic supply and for environmental reasons. The policies also had the effect
of supporting the development of downstream industries in China, encouraging foreign
companies to establish their processing operations in China and increasing the potential value of
exports.
The combination of reduced export quotas imposed on Chinese suppliers and increasing
resources taxes, resulting in increased prices, improved the potential for rare earth production
outside China leading to a surge in exploration and development activity.
Roskill (Merriman, 2013) identified more than 200 projects exploring for rare earths outside of
China as at the end of 2012. The majority of the exploration projects are located in Canada,
although projects are being explored in Angola, Argentina, Ireland, USA, Australia, Malawi, South
Africa and other countries. Roskill also estimates that market demand could potentially sustain six
to eight new rare earth producers by 2018, mainly HREE exploration projects (Merriman, 2013).
Roskill has estimated that China will account for 74 % of global REE production in 2015 and that
Chinese dominance looks likely to fall to 61 % by 2018. Supply from the rest of the world is
expected to have a much larger impact on LREEs than on HREEs (Merriman, 2013).
Rare earths have a variety of end uses and are not equal in terms of demand, production or price.
They therefore cannot be considered as a single commodity and the individual elements have
their own demand drivers.
The market for rare earths has traditionally been divided between relatively high volume
applications for the LREE (e.g. magnets, petroleum cracking catalysts and glass polishing) and
relatively low volume applications for high purity HREE (phosphors, dopants and speciality alloys).
The demand for rare earth metals has been influenced by a number of global trends such as
miniaturization of electronic goods, increased pressure on governments to control automobile
exhaust emissions and the need for greater energy generation efficiencies. In 2011 China
overtook the USA as the world’s largest producer of manufactured goods. The demand for rare
earths within China itself has increased greatly over the past 10 years as more goods, previously
manufactured in the USA, Europe and Japan, are now being manufactured in China.
Roskill (Shaw and Chegwidden, 2012) projected that global rare earth demand will grow at around
6% to 7% per annum over the next five years as global economic conditions improve and

J2897 Mkango Songwe Hill PFS November 2014 Page: 18
increasing quantities of rare earths are required in new and existing applications. As was the case
in the past decade, demand is expected to continue to grow faster in China than in the rest of the
world, driven by increased domestic consumption and an increased number of foreign companies
relocating manufacturing to China.
China announced on 20 May 2014 the possibility of raising export taxes on rare earth resources
and a formal document on the new tax rates was to be released in the second half of 2014.
However, the World Trade Organisation (WTO) ruling in August has overtaken this.
On 7 August 2014 the WTO Appellate Body affirmed the original finding that China’s restrictions
on exports of REEs were contrary to the Country’s international trade obligations. The WTO ruled
that China had used export restrictions on rare earths to control key markets, push prices higher,
and force the global industry to move operations to China.
This ruling, coupled with broader reforms to the rare earth industry initiated by the Chinese
Government, will likely lead to dramatic changes in its’ domestic rare earths industry. These may
include the potential removal of export taxes on rare earths which were levied at 15 % to 20 %, a
re-evaluation of the tax system in relation to the mining and processing of rare earths, and the
potential implementation of additional resource taxes. The latter, in combination with tighter
environmental controls being implemented, could potentially result in an increase in rare earth
prices as the cost base of domestic producers’ increases.
In essence, the Chinese Government’s focus is likely to shift from controlling exports to
controlling production. The Chinese Government is forcing consolidation in the industry and
many of the smaller, unproductive operations (mines, recycling operations, and processors) may
be shut down or put on care and maintenance. It was reported by the Shanghai Metals Market
that nine rare earth companies had been shut down and production equipment at five of them,
representing 21,910 tpa in capacity, had been removed by the end of September 2014. Equipment
at the remaining four companies was planned to be demolished by the end of October 2014. The
Chinese Government is also clamping down on illegal rare earth production in China. Illegal
production has had a negative impact on rare earth prices so this initiative is also anticipated to
have a positive impact on the price outlook.
1.12 Capital and Operating Cost Estimates
Unless specified otherwise, costings have been undertaken at an accuracy level of ±25 %.
1.12.1 Capital Costs
The capital cost estimate is based upon an engineering, procurement and construction
management (EPCM) approach where the owner assumes the builder’s risk.
Table 1-12 is a summary of the initial capital expenditure of the Project.

J2897 Mkango Songwe Hill PFS November 2014 Page: 19
Table 1-12
Summary of initial capital expenditure
Description Amount (US$ millions)
Site Facilities, Infrastructure and Power Supply 36.2
Mining 1.7
Beneficiation Plant 45.2
Hydrometallurgical Plant 57.1
Sulphuric Acid Plant 32.7
Tailings Storage Facility 12.7
Other 12.0
Total Initial Capital Expenditure 197.5
Contingency 19.8
Total Initial Capital Expenditure including Contingency 217.3
Sustaining capital and reclamation capital costs are estimated to be US$ 24 million.
1.12.2 Operating Costs
The mining of the open pit will be conducted by a mining contractor. The mining contractor’s
costs are US$ 4.24/t.
The operating costs are summarised in Table 1-13 below.
Table 1-13
Estimated total cash cost summary
Item LOM US$/kg
REO
LOM US$/t
processed
2017 – 2-12
US$/kg
2017-2021 US$/t
processed
Mining Operating 4.1 23.5 3.0 21.1
Mill/Flotation 3.7 21.3 3.0 21.2
Hydrometallurgical 7.7 43.5 6.1 43.5
G & A and Other 1.5 8.4 1.3 9.3
Cash Operating Costs 17.0 96.7 13.4 95.1
Tolling/Concentrate Sales 10.0 56.9 10.0 70.9
Total Cash Costs 27.0 153.6 23.4 166.0
1.13 Financial Valuation
A financial valuation has been conducted on the Project using a cash flow model based on the
mining and processing schedules and the estimated costs.
Long term rare earth price assumptions were based on an average of those included in Feasibility
Studies and Pre-feasibility Studies announced by peer group companies in the rare earth sector in
2013 and 2014, resulting in the equivalent price for a total rare earth basket for Songwe Hill of
US$ 55.01 per kg REO. Prices are assumed to remain flat in real terms over the life of the mine.

J2897 Mkango Songwe Hill PFS November 2014 Page: 20
The main revenue drivers are neodymium (37 %), dysprosium (14 %), praseodymium (13 %) and
europium (18 %) as illustrated in Table 1-14.
Table 1-14
Projected prices for REE and Yttrium
Rare Earth Oxide REO Price
Assumption
(US$/kg)
REO in
conc1
(tonnes)
REO in
concentrate
split
REO in
concentrate
(US$/kg)
REO in
concentrate
Split by value
Lanthanum La2O3 7.7 1,075 37.8 % 2.9 5.3 %
Cerium CeO2 5.9 341 12.0 % 0.7 1.3 %
Praseodymium Pr6O11 91.4 227 8.0 % 7.3 13.3 %
Neodymium Nd2O3 77.3 756 26.6 % 20.6 37.4 %
Samarium Sm2O3 7.9 114 4.0 % 0.3 0.6 %
Europium Eu2O3 1,066.0 27 0.9 % 10.0 18.3 %
Gadolinium Gd2O3 49.0 62 2.2 % 1.1 1.9 %
Terbium Tb4O7 912.0 7 0.3 % 2.3 4.3 %
Dysprosium Dy2O3 627.9 35 1.2 % 7.8 14.2 %
Yttrium Y2O3 32.9 165 5.8 % 1.9 3.5 %
Holmium2 Ho2O3 6 0.2 %
Erbium2 Er2O3 13 0.5 %
Thulium2 Tm2O3 2 0.1 %
Ytterbium2 Yb2O3 10 0.3 %
Lutetium2 Lu2O3 1 0.0 %
Average annual production REO in concentrate 2,841 100.0 % 55.0 100.0 %
Average heavy rare earth production in
concentrate
328 11.5 % 23.2 42.1 %
Note: 1 Average annual at full capacity excluding first and last years
2 No value currently attributed to these rare earths in the financial evaluation
Table 1-15 and Table 1-16 summarises the mining and processing inputs and results.

J2897 Mkango Songwe Hill PFS November 2014 Page: 21
Table 1-15
Mining and Processing Inputs and Results
Item Unit Value
Life of Model Years 18
MINING
Total life-of-model ore production 000’t 8,483
Waste mined 000’t 38,442
Strip ratio W:O 4.5
Total LoM Plant feed 000’t 8,483
Average yearly Plant Feed 000’t 500
PROCESSING
Tonnes to hydrometallurgical plant 000’t 8,483
Contained REOs in product 000’t 48.3
Average annual production Of REOs (excl. 1st and last year) tpa 2,841
Table 1-16
Processing recoveries
Rare Earth Oxide Overall recovery to
concentrate
REO production in
concentrate2
Lanthanum La2O3 55 % 1,075
Cerium CeO2 9 % 341
Praseodymium Pr6O11 57 % 227
Neodymium Nd2O3 57 % 756
Samarium Sm2O3 60 % 114
Europium Eu2O3 59 % 27
Gadolinium Gd2O3 58 % 62
Terbium Tb4O7 56 % 7
Dysprosium Dy2O3 58 % 35
Yttrium Y2O3 58 % 165
Holmium2 Ho2O3 57 % 6
Erbium2 Er2O3 57 % 13
Thulium2 Tm2O3 56 % 2
Ytterbium2 Yb2O3 56 % 10
Lutetium2 Lu2O3 53 % 1
Average annual production REO in concentrate Tonnes 2,841
Average heavy rare earth production in concentrate Tonnes 328
The key outcomes of the economic evaluation for 100 % of the Project pre any financing
costs are summarized in Table 1-17.

J2897 Mkango Songwe Hill PFS November 2014 Page: 22
Table 1-17
Summary of Valuation Results (Nominal) – Post Tax valuation
Item Unit Value
Post Tax Valuation
Project cash flow post-tax (including royalty) US$ million 935
Payback period from Project start Years 4.7
Payback period from start of production Years 2.7
Post-tax NPV @ 10 % (Nominal) discount rate US$ million 293
Post-tax IRR (Nominal) % 36 %
The valuation model was used to test the Project’s robustness to changes in the key value driver
assumptions. A sensitivity analysis, as summarized in Figure 1-2, indicates that the Project is most
sensitive to metal prices (or ore grade) fluctuations, followed by operating cost fluctuations, and
then capital cost fluctuations.
Figure 1-2
NPV @ 10 % (Nominal) Sensitivity Analysis
0
50
100
150
200
250
300
350
400
450
500
-20.0% -15.0% -10.0% -5.0% 0.0% 5.0% 10.0% 15.0% 20.0%
NP
V @
1
0%
(U
S$
millio
n)
% Change in Variable
Revenue/grade Capex Opex
J2897 Mkango Songwe Hill PFS November 2014 Page: 23
2 INTRODUCTION
2.1 Scope of Work
This Technical Report has been prepared by the MSA Group (Pty) Ltd, SNC-Lavalin (Pty) Ltd, Met-
Chem Consultants (Pty) Ltd, Epoch Resources (Pty) Ltd, and Digby Wells Environmental
(collectively the Consultants) on behalf of Mkango Resources Limited (Mkango). The Consultants
were commissioned to prepare a Technical Report for a Pre-feasibility Study (PFS) on the Songwe
Hill Rare Earth Element Property located in the Republic of Malawi. Mkango is a Canadian mineral
exploration and development company listed on the TSX Venture Exchange (TSXV) under the
symbol “MKA”. The Songwe Hill Rare Earth Element Project (the Project) is 100 % owned by
Mkango through its wholly owned subsidiary Lancaster Exploration Limited. The Project is located
within the 100 % owned Exclusive Prospecting Licence (EPL) 0284/10R (the Phalombe Licence) in
southeast Malawi.
This Technical Report has been prepared in accordance with the disclosure and reporting
requirements set forth in the Canadian National Instrument 43-101 Standards of Disclosure for
Mineral Projects (NI 43-101), the corresponding Companion Policy 43-101 CP, the corresponding
Form 43-101F1 (Form F1), and the CIM Definition Standards – For Mineral Resources and Mineral
Reserves (2014).
Unless specified otherwise, all costings have been undertaken at an accuracy level of ±25 %.
All monetary figures expressed in this PFS are in US$ unless otherwise stated. This PFS uses metric
measurements unless otherwise stated.
2.2 Principal Sources of Information
The review of the Project has been on information provided by
Mkango Resources Limited,
The MSA Group (Pty) Ltd: overall co-ordination of the Technical Report, Mining, Market
Studies and Financial Valuation;
SNC-Lavalin (Pty) Ltd: process design and cost estimation for the integrated processing
plant for the PFS; and design and cost estimation for the infrastructure associated with the
integrated processing plant for the PFS;
Met-Chem Consulting (Pty) Ltd: scientific and technical information contained in relation to
metallurgical testwork;
Epoch Resources (Pty) Ltd: Tailings Storage Facility; and
Digby Wells Environmental: Environmental, social and health impact assessment.
2.3 Qualifications, Experience and Independence
This Technical Report has been compiled by a number of contributing authors, who have the
appropriate relevant qualifications, experience, competence and independence to provide a
review and analysis for the preparation of this PFS in accordance with the requirements of

J2897 Mkango Songwe Hill PFS November 2014 Page: 24
National Instrument 43-101 (Standards of Disclosure for Mineral Projects) (NI 43-101). The
contributing authors are set out below in Table 2-1.
Table 2-1
Contributing Authors
Qualified Person /
Contributing Author
Employer Date of Site Visit Area of Technical
Responsibility
Sections of this PFS
Rob Croll (QP) MSA 19th
May 2014 Project Supervisor,
QP
1-5, 18, 19, 21-27
Dr Scott Swinden
(QP)
21st-25
th April 2012
11th
-16th
October 2012
History, Geology,
Exploration
1, 4-11, 23, excl. 4.3
and 5.2
Michael Hall (QP) MSA 1st-3
rd September 2012 History, Geology,
Mineral Resource
Estimation
1, 12, 14,
Clive Brown (QP) MSA 19th
May 2014 Mineral Reserve
Estimation, Mining
1, 15, 16, 21, 22, 25
26
Gavin Beer (QP) Met-Chem
Consulting
Mineral Processing,
Metallurgical
testwork
1, 13, 26
Jansen Scheepers
(QP)
SNC Lavalin - Recovery Methods,
Infrastructure
1, 17, 21, 22, 25, 26
Thinus Redelinghuys
(QP)
SNC Lavalin - Recovery Methods,
Infrastructure
1, 18, 21, 22, 25, 26
Nick Dempers
(Contributing Author)
SNC Lavalin 19th
May 2014 Recovery Methods,
Infrastructure
1, 17, 18, 21, 22, 25,
26
Craig de Jager
(Contributing Author)
SNC Lavalin Recovery Methods,
Infrastructure
1, 17, 18, 21, 22, 25,
26
Guy Wiid (QP) Epoch Resources - Tailings 1, 18, 21, 22, 25, 26
George
Papageorgiou
(Contributing Author)
Epoch Resources 19th
May 2014 Tailings 1, 18, 21, 22, 25, 26
Dirk Loots
(Contributing Author)
Epoch Resources 19th
May 2014 Tailings 1, 18, 25, 26
John Sexton
(Contributing Author)
MSA - Market Review,
Economic Analysis,
Financial Model
19, 21, 22
Graham Errol Trusler
(QP)
Digby Wells
Environmental
20th
June 2012 Environmental 1, 4.3, 5.2, 20, 21, 22,
24-26
Bradly Thornton
(Contributing Author)
Digby Wells
Environmental
23rd
– 26th
April 2013
19th
May 2014
20th
-21st June 2014
Environmental 1, 4.3, 5.2, 20, 21, 22,
24-26
None of the Consultants or any associates employed in the preparation of this Technical Report
has any beneficial interest in Mkango. The Consultants are not insiders, associates or affiliates of
Mkango. The Consultants are being paid a fee for their work in accordance with normal
professional consulting practice.

J2897 Mkango Songwe Hill PFS November 2014 Page: 25
3 RELIANCE ON OTHER EXPERTS
The disclosure of information relating to land, legal, title and related issues relies on the following
document:
a legal opinion from Blantyre’s law firm, Gustave and Company, that Lancaster is the legal
holder of 100 % interest in EPL 0284/10R which is valid and existing as of the date of this
opinion, October 30, 2014. The opinion further states that the EPL is unencumbered and in
good standing.
The Consultants are not responsible for such information, which is found in Section 4 of this
Technical Report, but have assumed it to be accurate for the purposes of this Technical Report.

J2897 Mkango Songwe Hill PFS November 2014 Page: 26
4 PROPERTY DESCRIPTION AND LOCATION
4.1 Location
Songwe Hill is located in southeastern Malawi, between Lake Chilwa and the Mulanje Massif and
close to the eastern border of Malawi with Mozambique (Figure 4-1). It lies within Exclusive
Prospecting License (EPL) 0284/10 which Mkango refers to as the “Phalombe License".
EPL 0284/10 lies entirely within the Southern Region of Malawi and Songwe Hill is within the
Phalombe administrative district. It lies approximately 70 km in a straight line SE from the former
capital of Zomba and approximately 90 km in a straight line ENE of the commercial centre of
Blantyre. Songwe Hill can be reached from these centres via national highways S144 and S145,
respectively. The S145 passes within 15 km of Songwe Hill.

J2897 Mkango Songwe Hill PFS November 2014 Page: 27
Figure 4-1
Location of the Songwe Hill (red square) southeast of Zomba
Source: Background map – Nations Online (2014)

J2897 Mkango Songwe Hill PFS November 2014 Page: 28
4.2 Mineral Tenure, Permitting, Rights and Agreements
4.2.1 Exclusive Prospecting Licenses in Malawi
The search for, the mining of, and the disposal of minerals in Malawi is governed by the Mines
and Minerals Act (1981). The administration of the Act is the responsibility of the Commissioner
for Mines and Minerals in the Ministry of Energy and Mining.
It is the objective of Malawi’s mining policy to maximize the economic benefits to the Nation by
exploiting the Nation's mineral resources. The Government encourages investors to explore,
delineate, evaluate, and where, viable exploit the country's mineral resources.
The rights to carry out a programme of prospecting operations for specified minerals over a
particular area are conveyed by way of an EPL. On application for an EPL, a detailed programme
of exploration and expected expenditures is presented by the applicant together with a proposal
for the training and employment of Malawi citizens.
4.2.2 EPL 0284/10R Phalombe
Mkango, through its 100 % owned subsidiary Lancaster Exploration Ltd (Lancaster), holds a 100 %
interest in EPL 0284/10 (the Phalombe License or Permit) which includes the Songwe Hill REE
deposit. The EPL covers an area of 1,283 km2 and was originally granted to Lancaster on January
21, 2010 for three years> It was then renewed for a further two years, until 20th
January 2015, by
the Minister of Natural Resources, Mines and Energy under the Malawi Mines and Minerals Act
from 1981 (Cap. 61:01). Mkango is in receipt of a legal opinion from Blantyre’s law firm, Gustave
and Company, that Lancaster is the legal holder of 100 % interest in EPL 0284/10R which is valid
and existing as of the date of this opinion, October 30, 2014. The opinion further states that the
EPL is unencumbered and in good standing.
The EPL is valid for a period of two years and may be renewed upon application for a further
period of two years provided that the terms and conditions of the license have been met (Table
4-1). The EPL allows Mkango to explore for "rare earth metals, strontium, niobium, iron ore,
manganese, fluorite, phosphate, uranium, thorium, monazite and associated minerals".
The boundaries of the EPL are determined by reference to the Universal Transverse Mercator
(UTM) Grid using the ARC1950 Datum in Zone 36 (Southern Hemisphere). The coordinates of the
corner points of the EPL are given in Table 4-2 and its location is shown in Figure 4-2.
Mkango expects that the next renewal of EPL 0284/10R for a further two year period, ending
January 20, 2017, will be tabled and approved by the Ministry at the next scheduled license
meeting which is expected to occur before the expiry of the current license in January, 2015.

J2897 Mkango Songwe Hill PFS November 2014 Page: 29
Table 4-1
History of tenure of EPL 0284/10 (Phalombe)
Application Applied Granted Validity Comment
Original Nov 16, 2009 Jan 21, 2010 Jan 20, 2013 1,283 km2; work program of
prospecting, geochemical,
geophysical work and drilling
totalling MWK 43,500,000
1st Renewal Oct 15, 2012
Jan 09, 2013 Jan 20, 2015
Proposed work program
totalling MWK 150,000,000
with no size reduction
Figure 4-2
Location of EPL 0284/10 and access roads
Note: The Songwe carbonatite abuts against Mauze Hill on its northwestern flank and is entirely within the
Republic of Malawi. UTM Zone 36S and WGS84 Datum
Source: Base map sourced from Microsoft Bing (2012)

J2897 Mkango Songwe Hill PFS November 2014 Page: 30
Table 4-2
Coordinates of the current EPL 0284/10 as valid until January 20, 2015
Corner Point Easting Northing
A 760000 8275700
B 790500 8275700
C 799900 8282900
D 799900 8280000
E 802000 8280000
F 802000 8282900
G 805400 8282900
H 801800 8247300
I 760000 8247300
Note: The line between points G and H follows the international boundary between Malawi and Mozambique.
Co-ordinates based on the Blantyre Map Sheet, 1:250,000. Coordinates in Table 4-2 use ARC1950 Datum
The expenditure commitment for 2013 and 2014 of the EPL amounted to 150,000,000 Malawian
Kwacha (MWK) (In United States Dollars (US$) approximately US$ 322,504.354 as at October 29th
2012 based on the Standard Bank Mid rate (MWK 465.11/US$) exchange rate) and this
expenditure has already been met by Mkango.
4.2.3 General Provisions
Except for the general rights of the local communities to graze livestock or to cultivate the land,
which rights may not interfere with the prospecting operations, there are no restrictions on
surface access to the area pertaining to the Permit.
Under existing legislation the holder of an EPL may apply for the renewal of the Permit over an
area which is not greater in extent than half of the originally granted prospecting area, unless
otherwise approved by the Minister. If the application for the renewal of an EPL meets the set
criteria, the Minister shall renew the License for a period not exceeding two years. The legislation
provides for only two renewals of two years each and any further extension of the License is
subject to Ministerial discretion.
The Government of Malawi has no rights or options to acquire any interest in the License save
that the Government would be entitled to cancel or suspend the License if the holder of the
Permit:
1. fails to use in good faith the land subject to the Permit for the purpose for which the
relevant Permit was granted;
2. uses that land for any purpose other than the purpose for which the Permit was granted;
3. fails to comply with any requirement of the Mines and Minerals Act;
4. fails to comply with a condition of the Permit;

J2897 Mkango Songwe Hill PFS November 2014 Page: 31
5. fails to comply with a direction lawfully given under the Mines and Minerals Act or with a
condition on which any certificate of surrender is issued or on which any exemption or
consent is given under the Mines Act;
6. fails to comply with the conditions, relating to the exercise of its rights under the Permit,
which are contained in a relevant agreement entered between the Government and the
holder of the Permit; and/or
7. fails to pay any amount payable by it under the Mines and Minerals Act within one month
after the amount becomes due.
As far as is known, there has been no commercial exploitation of minerals within the License area
and thus there are no existing mine workings, tailing ponds or waste dumps. There are no known
legal encumbrances to the License area and no environmental liabilities, apart from the
obligations of the Permit holder, as outlined in the Terms and Conditions of the EPL.
All necessary permits, approvals, consent, endorsements and permissions have been made in
order to permit the company to conduct exploration work of the type contemplated by the
Permit, including geochemical sampling, geophysical surveying, diamond drilling and core
sampling in the area covered by the EPL.
There are no known significant factors or risks that may affect access, title, or the right or ability to
perform work on the property as contemplated by the EPL.
4.2.4 Overlapping EPLs
There are no overlapping EPLs, or other factors or risks known to the authors that might affect
Mkango’s right or ability to perform work on EPL 0284/10.
4.3 Environmental Liabilities
Currently the environmental liabilities on the site are minimal as only exploration has taken place
and it is a greenfields project. Should the Project not proceed to construction, the site will need to
be closed and rehabilitated. Current liabilities would include the removal of the tented
construction camp, the closure of boreholes and the rehabilitation of access and drilling roads.
Closure and Rehabilitation financial requirements for the Project have been calculated to provide
an indication of what it could cost to close and rehabilitate the site once mining has been
completed. These costs need to be updated as the Project advances.
The preliminary planned closure cost estimate was calculated using the block plan provided by
SNC Lavalin. The estimated total cost for the closure of the Songwe REE Project is US$ 7,108,000.
Table 4-3 below provides a summary of the costs.

J2897 Mkango Songwe Hill PFS November 2014 Page: 32
Table 4-3
Summary of closure costs for Songwe
Summary of liability costs – Life of Mine
No. Description Amount (US$)
1 Demolition 4,410,000
2 Rehabilitation 1,196,000
Subtotal 5,606,000
3 Groundwater Monitoring 213,000
4 Vegetation Maintenance 53,000
5 Vegetation Monitoring 2,000
6 Project Management (12%) 673,000
7 Contingency (10%) 561,000
Total 7,108,000
The following key assumptions were used for the closure cost estimate:
the block plan is representative of the infrastructure and liabilities associated with the
proposed mine;
the closure estimate excludes potential liabilities associated with social obligations to
surrounding communities, retrenchment payments and long term water management;
a contingency of 10 % has been included to allow for areas which may have been
undervalued or which may have been overlooked;
for the post-closure period, monitoring of groundwater and surface water has been
assumed to take place for a period of five years, with sampling taking place on a quarterly
basis. Vegetation monitoring and maintenance will take place for three years.
It is recommended that:
an environmental obligations register be compiled during the ESHIA process to ensure that
all environmental obligations related to rehabilitation and closure are recorded;
the closure cost estimate be updated once the Definitive Feasibility Study is completed; and
a preliminary closure plan be developed to guide the closure cost estimate in terms of
likely closure actions and methodologies.
These recommendations should be actioned in the ESHIA phase of the Project.

J2897 Mkango Songwe Hill PFS November 2014 Page: 33
5 ACCESSIBILITY, CLIMATE, LOCAL RESOURCES, INFRASTRUCTURE AND
PHYSIOGRAPHY
5.1 Accessibility
Migowi, approximately 15 km from Songwe Hill, is the nearest town to the Project area
(Figure 5-1). Phalombe, the largest nearby town, is located approximately 25 km from Songwe Hill
(Figure 5-1). All-weather roads connect Migowi and Phalombe to Zomba, the former capital, and
Blantyre, the principal commercial city of Malawi, which are both approximately 55 km from
Migowi.
Figure 5-1
Regional geography and road access to the Songwe Hill Project area
Source: Mkango (2014); background base map supplied by the Department of Surveys, Blantyre, Malawi (1991)
and modified by Mkango in 2014.
The S144 national road connecting Zomba and Phalombe and the S145 connecting Blantyre with
Phalombe via Migowi are currently being upgraded from all-weather gravel to Class 1 bitumen
roads (Figure 5-1). Local gravel roads provide access from Migowi to the exploration camp at the
base of Songwe Hill. Total travel time from Zomba is approximately 1.5 hours, which will reduce as
the roads continue to be upgraded.

J2897 Mkango Songwe Hill PFS November 2014 Page: 34
The closest airports to the Project area are located at Zomba and Blantyre which are
approximately 70 km to the northwest and to the west-southwest respectively. South African
Airways (SAA) operates regular flights and an air cargo service from Johannesburg to Blantyre.
5.2 Climate and Physiography
5.2.1 Climate and meteorological Overview
Malawi is located between two climatic mega-zones, equatorial Africa and southern Africa. The
climate in Malawi is largely dictated by the oscillations of the Inter-Tropical Convergence Zone
(ITCZ), i.e., the converging of, and interaction between the zonal Congo air mass and the
meridional southeastern trade winds and monsoonal northeastern winds. The ITCZ, which
provides Malawi with a typically tropical bimodal seasonal pattern, moves over the country in late
October and ranges south throughout November, reaching the likes of Mulanje in late November.
It begins its journey back north in late March to April, leaving the country to its dry season, which
is subdivided into cool (May-August) and hot (September–October) periods. Malawi is said to
experience three seasons: wet, cool dry and hot dry. The climatic conditions are not expected to
impact on the operation of the mine, which has been planned to operate all year round.
This seasonal pattern is further influenced by the Indian Ocean’s southwestern cyclonic weather
patterns, i.e., by a cool, dry westerly frontal system and by the ocean’s surface temperature
variability. The latter is especially responsible for annual variations leading to abnormal weather
effects, particularly the effects of the El Nino Southern Oscillation. In the north of Malawi and in
common with the experience of east African countries, El Nino leads to increased precipitation
and risk of flooding, while in the south of Malawi, in line with its effects on southern African
countries, El Nino has the opposite effect with less rain and an increased risk of drought. In the
event of the ocean’s surface temperatures decreasing (La Nina), the reverse picture is true, with
the north drier, and the south wetter.
Malawi’s climate is moderated by a high percentage of surface water, and by the fact that it
possesses an altitudinal range from 500 mamsl (Lake Malawi and Limonde) to peaks over
3,000 mamsl high (Mt Mulanje). Spatially, precipitation levels increase south to north, with patches
receiving 600 mm to 750 mm per annum, the majority of the country between 750 mm and
1,000 mm per annum and much of the coastal lake plains, the north and the highlands garnering
between 1,000 mm and 2,500 mm per annum. Winter temperatures average from 18 °C to 19 °C,
and summer temperatures between 22 °C and 27 °C.
A weather station was installed on site during August 2014 and data capture has commenced. In
the absence of detailed site meteorological data, the site specific MM5 modelled meteorological
data set for three full calendar years (2010 – 2012) was obtained from Lakes Environmental
Consultants Inc., based in Canada, to determine local weather conditions. The MM5 data is
gathered from virtual weather locations developed using data from a variety of government and
other public sources, such as airports, ocean or river buoys, aircraft and satellite readings. A
physics model is then used to generate predicted data for the region being considered. This
dataset consists of surface data, as well as upper air meteorological data that is required to run
dispersion models.

J2897 Mkango Songwe Hill PFS November 2014 Page: 35
Data was also extracted from the LocClim database which is an online database capable of
producing climate maps of the average monthly climate conditions (eight variable) taken from the
agroclimatic database of the Agromet Group of the Food and Agriculture Organisation of the
United Nations (http://www.fao.org/nr/climpag/pub/en0201_en.asp). This database is also
compiled by interpolative techniques, based on data from nearby weather stations in Malawi.
5.2.1.1 Wind Speed and Direction
The predominant wind direction is from the south-southeast and southeast (Figure 5-2). Over a
three year period (2010 – 2012), the frequency of occurrence was 48.2 % from the south-
southeast and 18.5 % from the southeast sector. Calm conditions (wind speeds < 0.5 m/s)
occurred for 2.73 % of the time. The average wind speed during the period was 3.73 m/s.
Figure 5-2
Period surface wind rose for Songwe Hill modelled data, 01 January 2010 – 31 December
2012
An analysis of information over the three year period from 2010 to 2012 indicates that although
the wind speeds were generally moderate at an average of 3.73 m/s, wind speeds of between
3.6 m/s and 5.4 m/s occurred 47 % of the time. Wind speeds of greater than 5.4 m/s, which have
the ability to generate fugitive dust from open areas, waste rock dumps and the TSF, occurred 13
% of the time. Diurnal variability in the wind fields was also assessed (Table 5-1). During the night,

J2897 Mkango Songwe Hill PFS November 2014 Page: 36
wind field conditions from the south southeast prevail for 67.4 % of the time and from the
southeast direction for 14.7 % of the time. Wind speeds of between 3.6 m/s and 5.4 m/s and
between 5.4 m/s and 8.8 m/s occurred 68 % and 10 % of the time respectively.
The morning time is dominated by wind fields from the south southeast and southeast directions.
Wind speeds between 3.6-5.4 m/s and 5.4-8.8 m/s occurred 63 % and 11 % of the time
respectively, with secondary components from the south (8%).
In the afternoon, the direction remained the same as wind from the south southeast (30%) and
southeast (26%) dominated. Secondary components were observed from the north and north
north-west. The evening wind field conditions were similar to the afternoon, with winds from the
south southeast (62%) and southeast (18%) directions respectively. Wind speeds between 3.6-5.4
m/s and 5.4-8.8 m/s occurred 67 % and 9 % of the time.
Table 5-1
Diurnal variability in wind fields
Period Prevailing wind fields Wind speeds of
3.6 m/s to 5.4
m/s
Wind speeds of
5.4 m/s to 8.8
m/s
Night From south-southeast (67.4 % of the
time) and from southeast (14.7 % of
the time)
68 % of the time 10 % of the time
Morning From south-southeast and southeast
predominantly; secondary components
from the south (8 % of the time)
63 % of the time 11 % of the time
Afternoon From south-southeast (30 % of the time)
and southeast (26 % of the time) with
secondary components from north and
northwest
Evening From south-southeast (62 % of the time)
and southeast (18 % of the time)
67 % of the time 9 % of the time
5.2.1.2 Temperature
The Project area is hot and humid from September to April, with average daytime maxima around
26 °C. The average monthly maximum temperatures range from 17.1 °C in July to 25.9 °C in
January, with monthly average minima ranging from 16.5 °C in July to 25.1 °C in November
(Figure 5-3). The annual mean temperature for Songwe Hill is given as 21.6 °C.
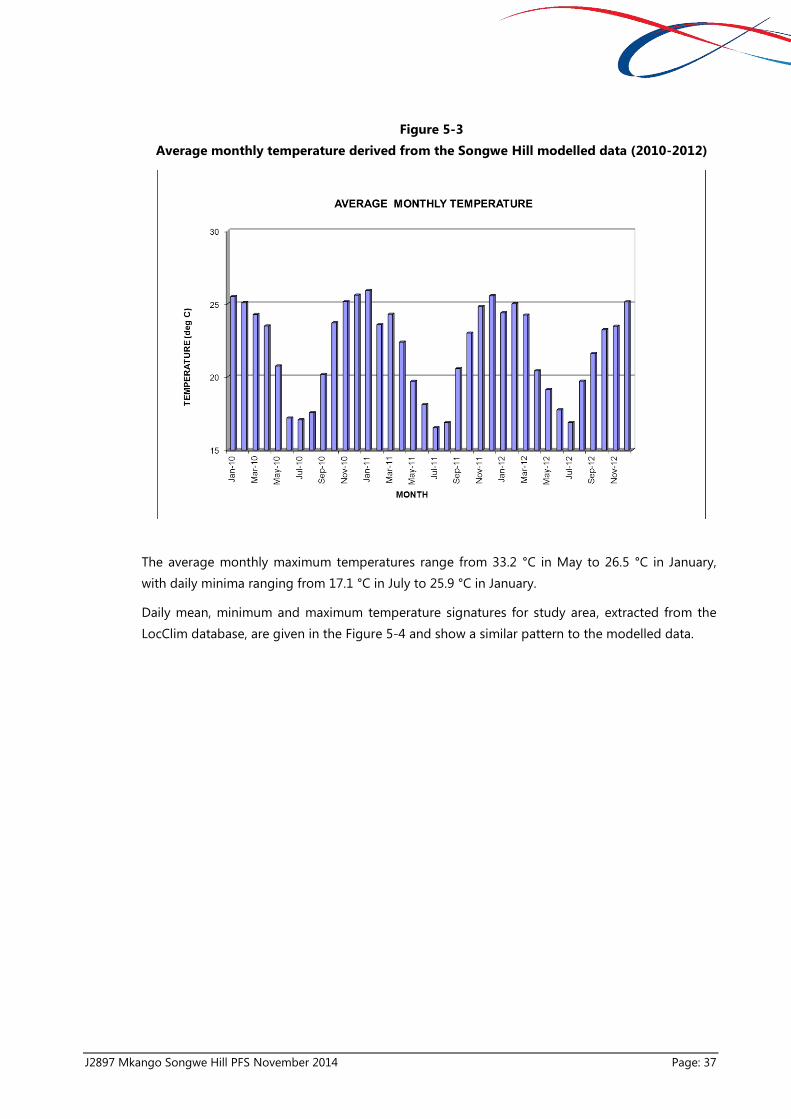
J2897 Mkango Songwe Hill PFS November 2014 Page: 37
Figure 5-3
Average monthly temperature derived from the Songwe Hill modelled data (2010-2012)
The average monthly maximum temperatures range from 33.2 °C in May to 26.5 °C in January,
with daily minima ranging from 17.1 °C in July to 25.9 °C in January.
Daily mean, minimum and maximum temperature signatures for study area, extracted from the
LocClim database, are given in the Figure 5-4 and show a similar pattern to the modelled data.

J2897 Mkango Songwe Hill PFS November 2014 Page: 38
Figure 5-4
Daily Mean, Minimum and Maximum temperature extracted from the LocClim database for
study area
5.2.1.3 Relative Humidity
The annual maximum, minimum and mean relative humidity is 74 %, 70 % and 72 % respectively.
The monthly maximum relative humidity (Figure 5-5) remains above 65 % for the whole year and
ranges from 65 % in December to 83 % in July. The monthly minimum relative humidity on the
other hand is above 60 % throughout the year, reaching highs of 78 % in June and August.

J2897 Mkango Songwe Hill PFS November 2014 Page: 39
Figure 5-5
Average Monthly Relative Humidity derived from the Songwe Hill modelled data (2010-
2012)
5.2.1.4 Precipitation
The rainy season is from November to April, with the highest monthly rainfall in January with a
maximum of 304 mm recorded. Much of the study area receives little to no rainfall from May to
September (Figure 5 6).
The three year annual maximum, minimum and mean monthly precipitation rates for the Project
area are 78 mm, 12 mm and 38 mm per month, respectively. The rate decreases to its lowest in
June and July.

J2897 Mkango Songwe Hill PFS November 2014 Page: 40
Figure 5-6
Average Monthly Precipitation derived from the Songwe Hill modelled data (2010-2012)
Figure 5-7 gives the monthly average precipitation (blue line) and average estimated
evapotranspiration (red line) extracted from the LocClim database. This shows that the potential
evapotranspiration is higher than precipitation for the months April to October (the dry season).
The opposite is true for November to March.
Figure 5-8 shows average monthly sunshine hours and day-length hours extracted from the
LocClim database.

J2897 Mkango Songwe Hill PFS November 2014 Page: 41
Figure 5-7
Monthly precipitation and Potential Evapotranspiration extracted from the LocClim
database for study area
Figure 5-8
Monthly Sunshine Hours, Day-length and Sunshine Fraction extracted from the LocClim
database for study area

J2897 Mkango Songwe Hill PFS November 2014 Page: 42
5.2.2 Physiography
To the north of Songwe Hill the physiography comprises an alluvial plain immediately south of
Lake Chilwa, which passes southwards into a more elevated region characterized by numerous
hills and mountains (Figure 5-9). Some mountains are marked by steep cliffs and areas of bare
rock, while other hills are completely wooded, varying from dense tropical forest to a more open
acacia forest.
The vegetation changes significantly between the rainy and dry seasons. Following the rainy
season the higher ground is covered by a dense growth of elephant grass which can reach three
metres in height in open areas. In the dry season the grass cover withers and is commonly burnt
back to expose bare ground and rock. The lower lying areas, apart from a zone adjacent to Lake
Chilwa, are prone to flooding in the rainy season and support occasional villages with the land
intensively farmed for tobacco, maize, cassava and sweet potatoes.
Figure 5-9
Physio-geographical map of the Phalombe district
Source: Mkango (2012); background base map supplied by the Department of Surveys, Blantyre, Malawi (1991)
and modified by Mkango in 2012.
The Songwe carbonatite forms a moderate- to steep-sided conical hill with a diameter of about
800 m and a summit elevation of 990 m which is approximately 230 m above the plain. On the

J2897 Mkango Songwe Hill PFS November 2014 Page: 43
south-eastern side, Songwe Hill abuts against the higher Mauze Mountain (Figure 5-10) which
rises to an elevation of 1,592 m.
Figure 5-10
Songwe Hill carbonatite abutting against Mauze Hill
Source: Brady (2012)
5.3 Local Resources and Infrastructure
Exploration activities are conducted from a semi-permanent camp (Figure 5-11) situated at the
base of Songwe Hill. Migowi, the nearest town (approximately 15 km from the Project area), is
connected to the national electricity grid. The district administration centre is currently being
relocated from Phalombe to Migowi. A large surface water resource is located at Mpoto Lagoon,
approximately 5 km from the Project site. There is an on-site water borehole, established in 2011,
which currently supplies water for all Project operations. Cellular/digital telephone coverage is
available at the Project through the telecommunication service providers TNM and Airtel Malawi.

J2897 Mkango Songwe Hill PFS November 2014 Page: 44
Figure 5-11
View from Songwe Hill onto Mkango’s exploration camp
Source: Photograph courtesy of Dr F. Reichhardt (taken 2012)
There is a moderately dense population in the Project area with the majority of the people living
in small villages and relying on subsistence farming for their livelihoods, with limited production
of cash crops. The residents of the area provide a relatively large but generally unskilled labour
force.
Fuel and some food supplies could be obtained from the nearest town, Migowi. All other
materials and equipment are obtained from the cities of Zomba or Blantyre.

J2897 Mkango Songwe Hill PFS November 2014 Page: 45
6 HISTORY
6.1 Ownership History
There are no public records documenting the history of mineral tenure in the Project area. The
Geological Survey Department of Malawi (GSDM) has no record of any exploration being carried
out in the Project area since the late 1980s.
6.2 Historical Exploration
Historical work, referenced below to Dixey et al. (1937), Garson (1962, 1965), Garson and Wooley
(1969), and Hunting Geology and Geophysics Limited (1985), was regional in nature and included
work outside the boundaries of the current Phalombe license. Work referenced to Lewis (1958)
and the Japan International Cooperation Agency and Metal Mining Agency of Japan (1989) was
conducted within the boundaries of the current Phalombe license.
6.2.1 Pre-1981 Programmes
The geological sequence in the southern Chilwa Province was originally defined and referred to as
‘The Chilwa Series’ by Dixey et al. (1937) in a monograph which is notably important for
identifying and describing carbonatites in Africa for the first time. Dixey et al. (1937) recognized
11 occurrences of carbonatite in Malawi which at that time more than doubled the global total of
known carbonatites. Two localities within the License area, Songwe and Tundulu, were
investigated by Dixey et al. (1937) who described the Songwe occurrence as a volcanic vent
comprising limestone, feldspar rock and agglomerate. The authors produced a simple sketch map
along with photographs of hand specimens of agglomerate and feldspathic breccia and
concluded that the limestone found at Songwe and other localities in the Chilwa Province is of
magmatic origin and comparable to the carbonatites of the Fen complex in Norway.
The Songwe Ring structure was the subject of a brief unpublished report for the Nyasaland
Mining Corporation Ltd. in 1953 (Lewis, 1953).
Significant new work on the carbonatites of Malawi was conducted in the early 1950s. Of
particular interest is Garson’s work with the Nyasaland Geological Survey. Building on earlier
descriptions of specific occurrences in the area (e.g. Garson, 1962), he provided a comprehensive
account of the carbonatites of Malawi including a detailed description of Songwe (Garson, 1965)
with a geological map indicating a volcanic vent filled with feldspathic breccia and agglomerate
and cut by arcuate sheets of carbonatite. He showed that rocks of the Precambrian basement are
fenitised in the vicinity of the vent and interpreted the calcite-silicate rocks on the eastern margin
to be the product of the reaction between carbonatite and nepheline syenite. Garson (1965) also
noted that the agglomeritic rocks at Songwe resemble feldspathic fenites of the Nkalonje vent
and the Tundulu carbonatite complex. He provided mineralogical descriptions of the latter
occurrences and noted the presence of accessory minerals including apatite, pyrochlore,
synchysite, bastnäsite and fluorite.

J2897 Mkango Songwe Hill PFS November 2014 Page: 46
In a later publication, Garson and Walshaw (1969) outlined the geology of the Mulanje area,
including a description of the "Songwe Carbonatite Vent". The authors noted the presence of REE-
bearing minerals at Tundulu but did not describe them from Songwe.
6.2.2 Post-1981 Programmes
6.2.2.1 Aeromagnetic survey
The GSDM compiled and published total field aeromagnetic survey data at 1:250,000, 1:100,000
and 1:50,000 scales. The data, covering the whole of Malawi, were acquired in 1984 by Hunting
Geology and Geophysics Ltd (Hunting) under contract to the United Nations (Project MLW/
80/030) (Hunting Geology and Geophysics Limited, 1985).
The data were obtained, dependent on the terrain, from fixed wing and helicopter aeromagnetic
surveys flown with a flight line spacing of 1,000 m at mean sensor elevations of 120 m and 50 m,
respectively. The data were corrected for diurnal variations and gridded at a cell size of 250 m
prior to contouring for the paper-based maps. Topographic information was reproduced from the
1:50,000 scale map series published by the Government of Malawi using a Universal Transverse
Mercator (UTM) coordinate grid.
6.2.2.2 Gravity survey
Gravity data were acquired during 1984 together with the aeromagnetic data. The gravity survey
covered the entire country and maps with scales of 1:250,000, 1:100,000 and 1:50,000 were
compiled and published by the GSDM.
6.2.2.3 Radiometric survey
Country-wide radiometric data was also acquired during 1984 (Hunting Geology and Geophysics
Limited, 1985) and published by the GSDM as a series of 1:250,000, 1:100,000 and 1:50,000 scale
maps. The maps show total counts, uranium, potassium and thorium counts and ternary colour
plots are available at scales of 1:100,000 and 1:250,000.
6.2.2.4 Airborne electromagnetic survey
The GSDM compiled 1:100,000 map sheets of the interpreted anomaly coverage from
electromagnetic (EM) survey data acquired during 1984 and 1985 by Hunting Geology and
Geophysics Ltd. The data were obtained using a Geonics EM33-3 helicopter-based EM system
with a nominal sensor elevation of 30 m and a flight line spacing of 1,000 m. The anomalies were
selected from the analogue profiles in the field and interpreted using either vertical thin dyke or
uniform half-space models, as appropriate. The data were presented on 1:100,000 scale base
maps with topographic detail reproduced from the 1:50,000 scale topographic maps.
6.2.3 Japan International Cooperation Agency and Metal Mining Agency of Japan, 1986 - 1988
In response to a request from the Government of the Republic of Malawi, the Government of
Japan conducted a mineral exploration programme in the Chilwa Alkaline Province from 1986 to
1988. The work was overseen by the Japan International Cooperation Agency (JICA) and operated

J2897 Mkango Songwe Hill PFS November 2014 Page: 47
by the Metal Mining Agency of Japan (MMAJ) working together with the GSDM. JICA and MMAJ
completed a detailed investigation of the potential for REE mineralization in southern Malawi
including the Songwe Hill deposit. Following the first phase of the programme, which comprised
geological and geochemical surveys, JICA and MMAJ concluded that Songwe Hill, as well as other
occurrences within and adjacent to the present License area, had ‘high potentiality’ for a
“carbonatite deposit”’.
The programme was divided into three phases corresponding to the work carried out from 1986
to 1988 and the results have been compiled in the “JICA and MMAJ Report on the Cooperative
Mineral Exploration in the Chilwa Alkaline Area, Republic of Malawi, Phases I, II and III;
Consolidated Report, 1989”.
The first Phase involved a “Route Survey” (geological field survey) of 13 km, the collection of 89
geochemical samples (Table 6-1), the completion of a single whole-rock chemical analysis and a
single thin section for mineralogical purposes. The sampling programme largely focused on
carbonatite and related rocks with analysis for REE comprising lanthanum, cerium, neodymium,
samarium, europium, terbium, dysprosium, ytterbium and yttrium as well as strontium, niobium
and thorium. The reports contain no information on the method of REE analysis or any QA/QC
protocols that may have been implemented.
Table 6-1
Ranges and averages of REE, Sr, Nb and Th for 89 geochemical samples from Songwe
collected during Phase 1
Element Range of concentration Average concentration
La2O3 (ppm) 87 – 8,102 3,036
Ce2O3 (ppm) 330 – 14,688 5,774
Nd2O3 (ppm) 412 – 4,609 2,162
Sm2O3 (ppm) 75 – 4,664 325
Eu2O3 (ppm) 7 – 931 80
Tb2O3 (ppm) 0 – 64 26
Dy2O3 (ppm) 2 – 261 88
Yb2O3 (ppm) 2 – 82 33
Y2O3 (ppm) 55 – 1,411 508
Sr (ppm) 516 – 21,207 7,467
Nb (ppm) 21 – 1,307 381
Th (ppm) 0 – 813 257
TREO (%) 0.3 - 2.9 1.2
Note: TREO includes oxides of lanthanum, cerium, neodymium, samarium, europium, terbium, dysprosium,
ytterbium and yttrium
Source: JICA and MMAJ (1989)
Following the positive Phase 1 results, the work programme proceeded to Phases 2 and 3 in 1987
and 1988, respectively. As outlined in Table 6-2, Phases 2 and 3 were much more comprehensive
and included the drawing of a detailed geological map (Figure 6-1), further collection of surface
geochemical samples (Figure 6-2) and two drilling programmes.

J2897 Mkango Songwe Hill PFS November 2014 Page: 48
The geological map distinguishes carbonatite and agglomerate/feldspathic breccia and in this
respect does not differ from Garson’s 1965 map. However, it does show a much more complex
distribution for the carbonatite and notably indicates the presence of two large, continuous areas
of carbonatite on the northern slope and a somewhat smaller occurrence on the lower north-
eastern side of the hill. The location of the 19 drill holes completed during Phases 2 and 3 and
some of the trenches are also shown superimposed on the geological map (Figure 6-1) which was
digitized by Mkango from the original map by JICA and MMAJ (1989).
Table 6-2
Phase 2 and 3 investigations on Songwe Hill
Type of survey Unit Drilling Unit
Area mapped (km2) 3.2 Number of drill holes 19
Route survey (km) 9 Total length of drill holes 960.15 m
Trench survey (m) 600 Inclination Vertical
Rock samples collected and assayed 151 Drillcore samples assayed 191
Microscope thin sections 13 Elements assayed for La, Ce, Nd, Sm, Eu, Tb,
Y, Nb, Sr, P
Microscope polished sections 20 Elements assayed for La, Ce, Nd, Sm, Eu, Tb,
Y, Nb, Sr, P
X-ray diffraction analyses 14 Elements assayed for La, Ce, Nd, Sm, Eu, Tb,
Y, Nb, Sr, P
EPMA 1 Elements assayed for La, Ce, Nd, Sm, Eu, Tb,
Y, Nb, Sr, P
Source: JICA and MMAJ (1989)

J2897 Mkango Songwe Hill PFS November 2014 Page: 49
Figure 6-1
Geological map with borehole and trench locations
Note: UTM Zone 36S and WGS84 Datum
Source: Mkango after JICA and MMAJ (1989)

J2897 Mkango Songwe Hill PFS November 2014 Page: 50
Figure 6-2
Geological map with geochemical sample locations
Note: UTM Zone 36S and WGS84 Datum
Source: Mkango after JICA and MMAJ (1989)
The 1987 Phase 2 drilling programme comprised 11 diamond drill holes totalling 558 m and
defined a number of mineralized zones (Figure 6-3). Drilling was performed with a YBM-05DA drill
rig using a 73 mm diameter drill bit and BW casing through unconsolidated surface material
followed by a 56 mm diameter diamond bit to the bottom of the hole. Average core recovery,
excluding the unconsolidated soils, was 94 %.
The subsequent Phase 3 drilling programme in 1988 was aimed to better define the extent and
grade of the mineralized zone on the northern side of Songwe Hill which was intersected during
Phase 2. Two rigs were used to drill eight holes totalling 401.2 m with a maximum vertical
borehole depth of 55 m. The drilling followed the same procedures as in Phase 2 and the average
core recovery (excluding soils) was 95 % during Phase 3.
There is no information on the sampling methods used in the JICA and MMAJ drilling
programmes, other than that the drillcore was halved prior to chemical analyses of 191 core
samples. A total of 109 core samples with an average length of 2.3 m were analysed from the first
phase of drilling, while the samples from the second phase had an average length of 4.6 m. The
reports do not detail the analytical methods or any QA/QC protocols that JICA and MMAJ may
have adopted for the sample preparation or chemical analyses. It has not proved possible to
identify the locations of any of these drill collars in the field.

J2897 Mkango Songwe Hill PFS November 2014 Page: 51
Figure 6-3
Drill holes with drill intersections exceeding 1 % REO
Note: UTM Zone 36S and WGS84 Datum; REO includes the oxides of La, Ce, Nd, Sm, Eu, Tb and Y
Source: Mkango, after JICA and MMAJ (1989)
The Phase 2 and 3 drill core samples were assayed for seven rare earth elements namely
lanthanum, cerium, neodymium, samarium, europium, terbium and yttrium as well as strontium,
niobium and phosphorous. The geological logs of the drillcore indicate broad intersections of
carbonatite in a number of boreholes, including JMS 14 (46 m at 1.3 % REO), JMS 16 (50 m at
1.5 % REO) and JMS 18 (50 m at 3.1 % REO) and were used to assess the three-dimensional
distribution of the individual carbonatite bodies to a vertical borehole depth of 50 m. The holes
were drilled with a nominal length of 50 m but the collars were positioned at various elevations
near the top of Songwe Hill and northwards down the slope with the result that only the outer
“shell” of the deposit was drill-tested.
The principal REE-bearing minerals identified by JICA and MMAJ, using thin section, polished
section, XRF and EMPA analysis, included synchysite, bastnäsite, parisite, strontianite, monazite,
pyrochlore and apatite.
JICA and MMAJ noted (Phase 3 Report, page 53, 1989) that “samples from Songwe sector are
more enriched in medium REE than those from Tundulu, Kangankunde and Chilwa Island sectors
[in Malawi]”. JICA and MMAJ defined the medium rare earth elements as samarium, europium and
terbium.

J2897 Mkango Songwe Hill PFS November 2014 Page: 52
7 GEOLOGICAL SETTING AND MINERALIZATION
7.1 Regional Geology
The Songwe Hill Project is located within the Chilwa Alkaline Province (CAP), which is centred in
southern Malawi and extends into adjacent areas of Mozambique (Figure 7-1).
Figure 7-1
Distribution of Chilwa Province alkaline intrusions in southern Malawi and Mozambique
Source: Modified from Woolley (2001)
Rocks in southern Malawi range in age from Precambrian to Cretaceous and are in many areas
covered by Tertiary to Recent lacustrine sediments. A comprehensive description of all rock units
can be found in Garson and Walshaw (1969). The oldest rocks in the area are assigned to a
Precambrian Basement Complex that consists of charnockitic granulites and gneiss. The gneiss
around the Songwe Hill area is typically paragneiss but orthogneiss is found elsewhere in the

J2897 Mkango Songwe Hill PFS November 2014 Page: 53
region. The Basement Complex was intruded during the Jurassic by a dolerite dyke swarm of the
Stormberg Series. The latter are genetically linked to the basaltic lavas of the Karoo Supergroup
which occur throughout southern Africa.
The geological units of significance with respect to REE mineralization in the Songwe Hill area are
intrusions and lavas of the Jurassic/Cretaceous Chilwa Alkaline Province. The Chilwa Alkaline
Province is comprised of large alkaline intrusions ranging from Mulanje, which is a massif that
covers approximately 640 km2 and rises some 3,000 m above the Phalombe Plain (750 m), to the
Michese intrusion with a diameter of 8 km, to the smaller Machemba intrusions and minor plugs
and dykes measuring only a few tens of metres in length. These intrusive centres, mainly early
Jurassic in age, comprise a variety of alkaline silica-saturated and silica under-saturated lithologies
locally associated with carbonatites and are unrelated to the modern rift system. A general
account of the tectonic setting has been given by Woolley and Garson (1970).
Although the Chilwa Province is dominantly intrusive at the present level of exposure, there are
locally minor remnants of extrusive rocks. A comparison with alkaline provinces along the East
African Rift to the north suggests that volcanic rocks at Chilwa Island may have originally been
very extensive. The Chilwa Province is remarkable for the diversity of rock types which include
granites, quartz syenites, syenites and trachytes, nepheline syenites and phonolites, ijolites and
nephelinites, and a plethora of dykes and carbonatites with associated fenites. Three principal
lithological associations have been identified on the basis of field relationships (Woolley, 1987),
geochemistry (Woolley and Jones, 1987), and K-Ar age dating (Eby et al., 1995):
nephelinitic lavas and nepheline syenite coeval with carbonatite (133 Ma);
nepheline syenite and syenite (126 Ma); and
syenite and peralkaline granite (123 Ma).
Carbonatites are widely present throughout the Chilwa Alkaline Province. There are 17
documented carbonatites in southern Malawi and adjacent Mozambique at the junction of the
north-south-trending fault system of the East African Rift and east-west-trending fault system of
the Zambezi Rift (Garson, 1965, 1966). In addition to the large carbonatitic vent at Songwe Hill,
there are three other substantial carbonatite complexes within the Province: Chilwa Island,
Kangankunde and Tundulu. Numerous smaller carbonatites occur throughout the Province and
include dykes, sheets, small plugs and a carbonatitic volcanic vent at Nkalonje. Igneous silicate
rocks comprise only a few small dykes and sheets of nephelinite, ijolite, trachyte and alnöite at the
Chilwa Island carbonatite centre whilst there are no igneous silicate rocks associated with the
Kangankunde carbonatites. However, there are significant intrusions of nepheline syenite, ijolite
and feldspathoid-bearing carbonate-silicate rocks associated with the carbonatite at Tundulu. The
four large carbonatite complexes have metasomatic aureoles characterized by the presence of
fenites, which extend up to 2 km from the margins of the carbonatite. The fenites are mostly
sodium-rich and comprised essentially of sodic pyroxenes and amphiboles. In addition, there are
domains of potassic fenite which are intimately associated with the carbonatite, consisting mainly
of K-feldspar reflecting a potassium rather than sodium metasomatism.
The largest intrusions of the Chilwa Province in Malawi, notably Mulanje and Zomba, are
comprised of peralkaline granite and quartz syenite similar to the large intrusion of Michese

J2897 Mkango Songwe Hill PFS November 2014 Page: 54
which occurs immediately north of Mulanje. Some of the nepheline syenite and syenite intrusions
have a considerable size. For instance the four overlapping nepheline syenites north of Zomba
extend nearly 40 km in an east-west line. Most of the igneous centres include swarms of dykes
and there are a number of volcanic vents including the six that make up the Malombe vents in the
north of the Chilwa Province (Figure 7-1). In the Phalombe license area, the vent in the Nkalonje
complex is filled with breccia and agglomerate while the Namangale occurrence contains
feldspathic and phonolitic breccias. The Songwe centre comprises a large volcanic vent choked
with fragmental rocks.
Intrusions in the northern part of the Chilwa Province span ages from about 98 Ma to 137 Ma,
making it the oldest igneous province associated with the eastern branch of the East African Rift.
This relatively old age, in terms of the general rift volcanism, explains the typically intrusive nature
of the province and paucity of extrusive rocks. Reviews of the general geology are provided by
Woolley and Garson (1970) and Woolley (1991), while Woolley (2001) presents brief accounts of
all the individual carbonatite occurrences.
7.2 Geology of the Songwe Carbonatite Vent
Songwe Hill is interpreted as a volcanic vent that is expressed as a steep-sided hill (see
Figure 5-11) with a diameter of approximately 800 m. Information from recent surface mapping
and drill core indicates that the vent complex consists of a multi-phase intrusion characterized by
diverse carbonatites and breccias exhibiting a range of alteration from potassic fenitisation to low
temperature hydrothermal/ carbohydrothermal overprinting. The vent abuts against the western
slope of the large Mauze nepheline syenite intrusion, but the outer contacts on the western and
north- western sides of the vent are hidden beneath recent surficial deposits. It is possible that
the carbonatite complex is in contact with Precambrian gneisses in this area because Chenga Hill,
which is located less than 200 m west of the probable western margin of the Songwe vent,
includes fenitised gneisses and breccias. A nearby remnant of Precambrian gneiss north and
northwest of the vent complex is also fenitised, although a screen of nepheline syenite intervenes
between the gneiss and the vent lithologies. The fenitisation is interpreted to be the result of
carbonatite intrusion in the Songwe vent, although it is also possible that the Mauze nepheline
syenite had some role in the fenitisation process. The occurrence of carbonate-silicate rocks along
the eastern margin of the vent was interpreted by Garson (1965) to be the product of
metamorphism of the nepheline syenite by the Songwe carbonatite.
7.2.1 Carbonatite
The carbonatite is best exposed along the north-eastern slope of Songwe Hill and, together with a
somewhat smaller area along its north western edge, is tentatively interpreted to form a ring
structure (Figure 7-2). There are essentially two REE- mineralized carbonatite end members,
namely a light-grey, fine-grained, relatively homogenous calcite carbonatite and a darker, fine-
grained, heterogeneous Fe-rich carbonatite.

J2897 Mkango Songwe Hill PFS November 2014 Page: 55
Figure 7-2
Surface Geological Map of Songwe Hill
Note: UTM Zone 36S and WGS84 Datum; Contour lines at 2 m intervals
Source: Modified from Mkango (2012)
7.2.1.1 Calcite carbonatite
The calcite carbonatite (Figure 7-3) constitutes by far the largest proportion of exposed
carbonatite and forms irregular, massive bodies that appear to have been emplaced in several
phases. The grey carbonatite probably represents the closest composition to the primary
carbonatite liquid. Petrographic studies have shown that calcite carbonatite consists
predominantly of Fe- and Mn-rich calcite, with varying proportions of Mn-bearing ankerite,
apatite, Fe-Mn-oxides, pyrite, fluorite and alkali (K-) feldspar.

J2897 Mkango Songwe Hill PFS November 2014 Page: 56
Figure 7-3
Examples of the three major rock types at Songwe Hill
Source: Brady (2012)
7.2.1.2 Fe-rich carbonatite
The Fe-rich carbonatite is dominated by Fe- and Mn-rich carbonates and Fe- and Mn-oxides with
apatite and minor amounts of alkali (K-) feldspar. Typically, carbonatites are multi-phase
intrusions evolving from early magmatic calcite compositions to late magmatic and/or
metasomatic Fe-rich compositions, and petrographic and field evidence at Songwe suggest that
the more Fe-rich carbonatite varieties may have intruded and partially replaced/overprinted some
of the earlier calcite carbonatite.
Subordinate ferrocarbonatite, ranging from late-stage breccias and thin dykes to pervasive, cross-
cutting veins, represents the final stages of carbonatite activity at Songwe Hill. Examination of drill

J2897 Mkango Songwe Hill PFS November 2014 Page: 57
core reveals that veining is extensive throughout the carbonatite, cross-cutting all lithologies
including fenite and breccias. The veining can broadly be divided into two types: Fe-rich
carbonatite veins and black Fe- Mn-rich ‘wad’ veins which are porous, highly weathered, poorly
consolidated intrusions that have undergone extensive alteration (supergene?) and replacement
by a range of Mn and Fe oxides. The two types are easily distinguished in the field: the carbonate
bearing veins react with hydrochloric acid (HCl), while there is no reaction with the ‘wad’ type
veins.
7.2.2 Fenite
Fenites appear to form an aureole around the carbonatite intrusion and in plan view surround the
carbonatite outcrop area on Songwe Hill. The fenites are characteristically light red in colour
(Figure 7-3) and mineralogical work has shown that they are composed essentially of alkali (K-)
feldspar. Surface mapping and drill core assays show that the fenites in the immediate area of
Songwe Hill are potassic (up to 14.99 wt. % K2O) confirming Garson’s (1965) observation that the
feldspar is potassic and that these rocks resemble feldspathic fenites elsewhere in Malawi.
Breccias in the more easterly parts of the vent commonly contain pseudomorphs after large
prismatic feldspars which would seem to substantiate a nepheline syenite parentage. However,
textures observed elsewhere on surface outcrops and particularly in drill core suggest that at least
some of the potassic fenites were formed by metasomatism of earlier phonolitic intrusions and
Precambrian basement rocks.
No vertical zonation of fenitisation has been observed in the drill core at Songwe with potassic
fenites extending from surface to deeper levels. However, the fenites that occur on Chenga Hill,
north of Songwe Hill, are sodic in nature. Garson (1965) described them as containing aegirine,
aegirine-augite, a blue sodic amphibole and albite. This is consistent with the fenitisation pattern
at other carbonatite complexes in Malawi (see Section 7.1), where potassic fenites are intimately
associated with carbonatite while sodic fenites occur at some distance from the carbonatite
margin.
The fenite on Songwe Hill appears to be generally in situ, although some blocks and small
fragments are highly abraded and indicate some degree of movement during the emplacement
history. On the upper reaches of the hill fenite appears to roof the carbonatite with black Fe- and
Mn-rich carbonate veins, which appear to originate in the carbonatite, penetrating upwards
through the fenite. The Songwe vent complex is interpreted to represent the preserved roof zone
of the intrusion and many of the fenite blocks seem to have been stoped into the former magma
chamber. This model is further supported by the pervasive occurrence of highly mixed carbonatite
and fenite material.
7.2.3 Breccia
The Songwe vent complex includes a considerable variety of breccias that range from clearly
abraded pebble-sized fragments (pebble dykes) to metre-sized angular blocks as well as
significant volumes of breccias in which the fragments appear to have undergone little or no
movement. The breccias can essentially be divided into two types: feldspathic-rich breccias and
carbonatite-rich breccias.

J2897 Mkango Songwe Hill PFS November 2014 Page: 58
7.2.3.1 Feldspar-rich breccia
The feldspathic-rich breccias consist mainly of light red alkali-feldspar rich (orthoclase or sanidine;
Garson, 1965) fenite clasts and fragments, partially fenitised nepheline syenite and minor clasts of
calcite carbonatite. The matrix is fine-grained, carbonatitic in nature and composed of abundant
Fe- and Mn-oxides, Fe-rich carbonates and alkali feldspar with occasional pyrochlore. In some
cases the matrix can have a relatively high silica content reflecting the comminution of fenite
during formation of the breccias.
7.2.3.2 Carbonatite-rich breccia
Carbonatite-rich breccias contain an abundance of light grey, fine-grained calcite carbonatite
clasts, with subordinate fenite clasts in a similarly fine-grained carbonate-rich matrix. Gradational
relationships can be observed from one variety of breccia into another indicating a complex
process of intrusion, fragmentation and continuous movement of a carbonatite-breccia mixture.
The breccias, regardless of type are invariably cross cut by numerous late-stage black Fe- and Mn-
rich carbonate veins.
7.2.4 Silicate-rich dykes
Late-stage silicate-rich dykes have been identified in drillcore but rarely outcrop at surface. The
dykes are mainly phonolitic in composition, aphanitic or porphyritic in texture and exhibit a wide
degree of alteration ranging from minimal modification to extensive alteration and fenitisation.
Syn-intrusion and post-intrusion faulting is evident across Songwe Hill although displacements
appear to be relatively small.
7.3 Mineralization
7.3.1 Geological domains
The principal zone of REE mineralization outcrops along the north eastern slope of Songwe Hill.
REE mineralization is present in carbonatite, fenite and breccias, which are exposed intermittently
over a surface area of approximately 350 m by 100 m. The REE mineralization is untested to the
northeast and southwest beyond the limits of the present drilling and below the deepest vertical
intersection of approximately 350 m below the surface of the hill.
The mineralized body at Songwe Hill is dominantly a carbonatite intrusion that has incorporated
variable amounts of potassic fenite and diverse vent breccias. Lithology appears to be the main
control on the REE mineralization which occurs dominantly in the carbonatite but is also found in
both fenites and breccias. Carbonatite and fenite form separate geological domains and are easily
distinguished visually in core and geochemically. However in some areas, carbonatite and fenite
occur together in breccias, or are intimately mixed which complicates the spatial correlation on
maps and cross sections.
For the purposes of resource definition, three geological domains have been identified namely a
carbonatite domain, a fenite domain, and a 'mixed' domain consisting of breccia and/or finely
intermixed carbonatite and fenite. In their respective domains, carbonatite and fenite form the

J2897 Mkango Songwe Hill PFS November 2014 Page: 59
dominant rock type and usually contain small and variable proportions of the other rock types.
Each domain has specific geological characteristics which are described in the following Sections.
7.3.1.1 Carbonatite Domain
Calcite carbonatite is the most abundant carbonatite type by volume and surface area and is the
principal host of REE mineralization.
Carbonatite contacts with the adjacent fenite are typically sharp and are characterized
geochemically by an abrupt increase in potassium, silica and aluminium and a coinciding decrease
in calcium. Calcite carbonatite outcrops at various elevations of Songwe Hill and has been traced
in drill holes to depths of approximately 350 m below the surface of the hill (Figure 7-4 (a)). The
carbonatite can generally be correlated from section to section particularly in the south of the
complex (Figure 7-4 (a) and (b)).
Carbonatite is typically fine-grained and light grey to pinkish white in colour (Figure 7-5 (a) and
(b)). Sulphides, mainly pyrite, are abundant and occur as disseminations, patches and veins.
Fluorite is present as locally abundant patches or blebs and can impart a purple hue to the rock.
REE mineralization in the calcite carbonatite is not readily identifiable by texture and the
similarities in colour of carbonatite and mineralization. Several phases of narrow ferro-carbonatite
veins are common along with occasional late-stage calcite veining.
The calcite carbonatite unit includes zones of Fe- and Mn-rich carbonatite (Mn/Fe carbonatite in
Figure 7-4 (a) and (b). The contact between the two types of carbonatite is typically irregular and
can range from sharp to gradational. This Fe- and Mn-rich carbonatite is typically dark brown-
black in colour and visibly oxidized. It is often vuggy in nature and characterized by a range of
late-stage low temperature (supergene?) patchy or brown striped textures. Mineralization is easily
recognized in the dark Fe-Mn- rich carbonatite by the pervasive streaks of orange pink to white
rare earth fluorocarbonate minerals and apatite.

J2897 Mkango Songwe Hill PFS November 2014 Page: 60
Figure 7-4
Examples of geological domains in two southern cross section
Note: (a) illustrates the continuity of carbonatite to depth at Songwe Hill in Section 8263457 (b) illustrates the geometry of carbonatite and fenite domains in Section
8263423N. Detailed geological logs are illustrated in the centre colour bar together with geological domains in the colour bar on the right

J2897 Mkango Songwe Hill PFS November 2014 Page: 61
Figure 7-5
Examples of mineralized rock types
Black carbonatite contains the highest REE grades (average 3.8 % TREO) and occurs as a distinct
zone located in the north eastern part of Songwe Hill (Figure 7-2). It can be traced at surface for
approximately 50 m in a north-south direction and to a depth of approximately 40 m beneath the
surface of the hill (Figure 7-6 (a) and (b)). The black carbonatite is texturally more complex than
the calcite carbonatite. The rocks are heterogeneous on the local scale ranging in colour from
black to light grey with a highly variable fabric comprising various late-stage cross-cutting Fe-
carbonatite veins. The carbonatite is characterized at surface and at depth by a distinctive white to
orange and pink-coloured, streaky mineralization which comprises fluorocarbonates, apatite and
carbonates (Figure 7-5 (c)). The higher TREO content in the black carbonatite does not reflect
differences in REE mineralogy compared to the calcite carbonatite but a greater abundance of the
REE-bearing minerals.

J2897 Mkango Songwe Hill PFS November 2014 Page: 62
Figure 7-6
Examples of geological domains in two northern cross section
Note: Section 8263667N (a) and Section 8263646N (b) illustrate the sharp contact between fenite and carbonatite domains in the north east (PX003 and PX013) and
intersections of carbonatite (PX031 and PX001) dipping towards and underneath the boulder field
Source: Brady (2012)

J2897 Mkango Songwe Hill PFS November 2014 Page: 63
7.3.1.2 Fenite Domain
Potassium fenite, comprising variably carbonatized potassium feldspars which are visible in the
core, surrounds the mineralized carbonatite body in plan view and is present in virtually all drill
holes. Fenite is typically light orange to red in colour (Figure 7-5 (d)) and is interpreted to roof and
partially surround the carbonatite at the present level of erosion. In drill holes fenite occupies the
areas marginal to the carbonatite and also occurs as discrete bodies within the carbonatite that
are presently interpreted as stoped blocks.
Fenite is variably mineralized and the degree of mineralization is a function of the degree of
carbonatization of the fenite. Along the north-western and eastern side of Songwe Hill, the fenite
is relatively uncarbonatized, geochemically characterized by consistently low CaO (~ 7 wt. %) and
high SiO2 and K2O concentrations (averages of 17 wt. % and 7 wt. %, respectively), and can be
traced in drill holes from surface to depth with consistent values of less than 0.5 % TREO (Figure
7-6 (a) and (b)).
Well-defined lithological and geochemical contacts are observed between the fenite and
carbonatite at the north-western side of Songwe Hill (Figure 7-6 (a) and (b)). Further south the
fenite becomes more intimately associated with the carbonatite and is variably carbonatized and
cross-cut by multiple generations of late-stage ferro-carbonatite. In these areas, the fenite
contains lower concentrations of SiO2 and K2O but higher concentrations of CaO and
consequently REE concentrations exceed 1 % TREO (Figure 7-7 (a) and (b)).
7.3.1.3 Mixed Domain
The geologically mixed domain in drill core consists of intimately intermixed carbonatite and
fenite, often on a centimetre scale, such that the lithologies cannot be easily separated or
correlated across sections. In many areas, this intimate intermixing reflects the presence of vent
breccias with variable proportions of carbonatite and fenite clasts on centimetre and metre scale
in a predominantly carbonate matrix. In other areas, the mixed domain may include small stoped
blocks of fenite occasionally intruded by carbonatite. The domain is characterized by highly
variable concentrations of CaO, SiO2 and K2O reflecting the high level of intermixing between
carbonatite and fenite. The mixed domain is variably mineralized and the degree of mineralization
is a function of the proportion of carbonatite.
Broad zones of mineralized breccias have been recognized in several drill holes interspersed with
the carbonatite. Locally the breccia and carbonatite appear to grade in and out of each other in
drill core. The breccias are widely exposed at surface along the western side of Songwe Hill but
are highly irregular in shape and difficult to correlate in drill holes. The surface breccia exposures
are represented in drill core by zones of highly mixed carbonatite and fenite (e.g. PX008 and
PX016) (Figure 7-7 (a) and (b)). The calcite carbonatite breccias are light grey to orange-red in
colour depending on the proportions of calcite carbonatite and fenite fragments. Typically,
carbonatite breccias contain abundant angular to sub-angular calcite carbonatite fragments in a
fine-grained grey carbonatitic to feldspathic matrix (Figure 7-5 (e)). Similar to the main calcite
carbonatite lithology, fluorite and sulphides are abundant and occur as disseminations, patches
and veins.

J2897 Mkango Songwe Hill PFS November 2014 Page: 64
Black carbonatite breccias consist of a mixture of fenite and carbonatite fragments with varying
shapes from rounded to angular and typically have spotted, striped and patchy late-stage low
temperature (supergene?) textures. The level of rare earth mineralization in the breccias is more
variable than in the carbonatites and directly related to the proportion of carbonatite to fenite
fragments and the amount of carbonatitic matrix.
7.3.2 Geometry of the Mineralization
The orientation of the mineralized body within the Songwe carbonatite vent system is not well
constrained due to the fact that only a few drill holes have penetrated the intrusive contacts of
the carbonatite which appears to extend beyond the limits of drilling to the northeast, southwest,
and at depth.
Lithological contacts and structural features are generally at shallow angles to the core axis
(Figure 7-8) and suggest that the intrusion has sub-vertical to vertical margins and flow patterns.
However, the body as a whole has an irregular shape which can be expected from an intrusive
plug. In plan view, the body has an elongate shape in a northeast-southwest direction and
borehole evidence from the eastern portion is interpreted to suggest an overall dip to the east.
Along the eastern side of Songwe Hill, the calcite carbonatite appears to dip steeply underneath
the fenite and nepheline syenite boulder field. Intersections of mineralized calcite carbonatite
have been encountered in drillholes which extended to depths below the boulder field (e.g.
PX001; Figure 7-6 (b)) and also in drill-holes collared in the boulder field (e.g. PX031;
Figure 7-6 (a)). To date no major off-setting structures have been identified within the main
carbonatite bodies
The internal geometric relationships of the different mineralized geological domains are not yet
well defined. While the carbonatite domains can typically be correlated between drillhole sections,
the fenite and mixed domains occur as isolated blocks within the carbonatite and cannot readily
be correlated between sections. The boundaries between the carbonatite and fenite domains are
relatively sharp but contacts with the mixed domains tend to be gradational (see PX016; Figure
7-7) and not well defined.

J2897 Mkango Songwe Hill PFS November 2014 Page: 65
Figure 7-7
Examples of the various domains in two cross section
Note: Section 8263568N (a) and 8263600N (b) highlight the mixed domains of Songwe Hill and the complex relationships between the three domains
Source: Brady (2012)

J2897 Mkango Songwe Hill PFS November 2014 Page: 66
Figure 7-8
Example of contact between fenite and calcite carbonatite
Source: Brady (2012)
7.3.3 Thorium
The occurrence of thorium can be problematic for some carbonatite-associated REE deposits.
Songwe Hill carbonatite is marked by a radiometric anomaly in thorium and this feature provided
an important prospecting tool. The concentration levels in individual REE minerals have not been
fully quantified and will be addressed as part of further metallurgical test work.
Examination of the assay data from drillcore samples reveals that thorium concentrations in the
Songwe Hill deposit are typically relatively low (Figure 7-9). Almost 90 % of the samples contained
less than 500 ppm Th. The overall values calculated for the Mineral Resource at various cut-off
grades typically range between 240 ppm and 430 ppm (Table 14-7 to Table 14-12).
Electron microprobe analyses carried out by SGS Lakefield, Canada indicate that between 84 %
and 97 % of the Th is carried by REE-bearing fluorocarbonates. As illustrated in Figure 7-9 there is
a diffuse positive geochemical relationship between Ce and Th that probably reflects the presence
of Th in synchysite.

J2897 Mkango Songwe Hill PFS November 2014 Page: 67
Figure 7-9
Thorium versus Cerium from 2011-2012 drill programme samples
Source: Swinden (2012)
7.3.4 Mineralogy
Mineralogical studies were initially carried out on six rock samples from the 2010 field sampling
campaign using x-ray diffraction (XRD), Quantitative Evaluation of Minerals by Scanning Electron
Microscopy (QEMSCAN) and electron microprobe (“EMP”) analyses at the mineralogy department
of SGS Inc. in Lakefield, Canada (SGS), previously described in detail by Scott and Wells (2010).
All samples are dominated by calcite with minor to trace amounts of iron and manganese oxides
and carbonates, K-feldspar, strontianite and barite. REE-bearing phases are dominated by
synchysite and apatite, with minor to trace amounts of parisite, monazite and ancylite. The
abundance of the principal minerals in the 6 rock samples from QEMSCAN whole rock analysis for
sub-samples (80 % powderized to less than 150 micron) is given in Table 7-1.
Table 7-1
Mineral abundances of six samples by QEMSCAN
Mineral Range of abundance (%)
Calcite (CaCO3) 32.6 - 81.6
Ankerite (CaFe(CO3)2) 3.9 - 41.9
Strontianite (SrCO3) 0.1 - 5.9
Barite (BaSO4) 1.1 - 5.2
Apatite (Ca5(PO4)3(F,Cl,OH)) 0 - 8.3
Parisite (CaCe1.1La0.9(CO3)3F2) 1
2.5 - 6.7
1 = parisite, for the purposes of QEMSCAN analyses, includes bastnäsite, synchysite, and parisite

J2897 Mkango Songwe Hill PFS November 2014 Page: 68
A comprehensive mineralogical study of REE-enriched lithologies was carried out on core material
from the 2011-2012 drill campaign by Dr. Aoife Brady, Mkango senior geologist, using scanning
electron microscopy (SEM), EMP and laser ablation inductively coupled mass spectrometry
(LA-ICP-MS). For this purpose a total of 33 samples were selected from drillcore material of nine
boreholes and different depths from the three main carbonatite lithologies, namely calcite
carbonatite, black carbonatite and carbonatite breccia (Table 7-2).
Table 7-2
Summary of samples for mineralogical studies
Borehole Depth (m) Sample ID Lab ID Lithological description
PX001 191.00 - 192.00 V3383 P17593 Calcite carbonatite/fenite mixture
PX001 239.00 - 240.00 V3452 P17835 Calcite carbonatite
PX001 247.00 - 248.00 V3464 P17836 Calcite carbonatite
PX001 255.00 - 256.00 V3474 P17837 Calcite carbonatite
PX001 257.00 - 257.49 V3476 P17592 Calcite carbonatite
PX001 294.26 - 295.00 V3532 P17595 Calcite carbonatite
PX003 3.49 - 4.00 V1206 P17598 Stripy black carbonatite
PX003 8.00 - 9.00 V1212 P17586 Very dark carbonatite
PX003 16.39 - 17.00 V1226 P17585 Mixed stripy black-to-grey carbonatite
PX003 31.00 - 32.00 V1237 P17584 Brown/grey/black stripy carbonatite
PX003 34.00 - 35.00 V1240 P17826 Black carbonatite
PX003 37.00 - 38.00 V1246 P17583 Calcite carbonatite
PX003 39.00 - 40.00 V1248 P17827 Black carbonatite
PX004 53.00 - 53.9 V3984 P17600 Calcite carbonatite
PX004 81.00 - 82.00 V1025 P17601 Calcite carbonatite crosscut by black carbonatite veining
PX004 163.24 - 164.00 V1138 P17602 Black carbonatitic vein? with late-stage brown stripy/spotted
textures
PX005 7.00 - 8.00 V3682 P17599 Calcite carbonatite crosscut by black carbonatitic veins
PX005 27.00 - 27.72 V3702 P17834 Calcite carbonatite
PX005 38.58 - 39.00 V3719 P17833 Calcite carbonatite
PX005 59.00 - 60.00 V3747 P17596 Calcite carbonatite
PX005 64.0 - 65.00 V3753 P17597 Weathered black carbonatite
PX009 40.00 - 41.00 V1825 P17828 Carbonatite breccia
PX009 98.00 - 99.00 V1889 P17829 Carbonatite breccia
PX011 4.00 - 5 .00 V1673 P17589 Mixed carbonatite and fenite
PX011 51.00 - 52.00 V1729 P17587 Mn- Fe-rich black carbonatitic vein
PX011 23.00 - 24.00 V1692 P17588 Mn- Fe-rich carbonatitic vein containing fine-grained light red
fenite
PX012 37.72 - 38.00 V1465 P17830 Calcite carbonatite
PX012 61.00 - 62.00 V1501 P17831 Mn/Fe carbonatite
PX012 81.70 - 82.00 V1532 P17832 Calcite carbonatite
PX018 190.36 - 191.00 X3982 P18140 Carbonatite
PX018 308.00 - 308.56 Y4139 P18139 Carbonatite
PX020 313.00 - 314.00 Y2189 P17990 Calcite-rich breccia
PX020 313.00 - 314.00 Y2189 P17991 Calcite-rich breccia
Source: Mkango (2012)

J2897 Mkango Songwe Hill PFS November 2014 Page: 69
REE analyses and imaging of the samples were performed using a Cameca SX100 electron
microprobe and a JEOL 5900LV scanning electron microscope, equipped with an Oxford
Instruments INCA energy dispersive X-ray microanalysis system and a Gatan
cathodoluminescence detector at the Natural History Museum (NHM) London, England.
Quantitative analyses of apatite were carried out on selected samples at the Institute of
Geography and Earth Sciences, Aberystwyth University (AU), Wales, using a Laser Ablation
Inductively Coupled Plasma Mass Spectrometer (LA-ICP-MS).
The SEM, EMP and LA-ICP-MS analytical work shows that the REE mineral assemblage at Songwe,
regardless of lithology, is dominated by fluorocarbonates, principally synchysite with very minor
parisite, apatite and occasional florencite. Average rare earth oxide (REO) concentrations in
synchysites from several drillholes are presented in Table 7-3. The synchysite crystals are
homogeneous, typically occurring as randomly oriented laths or tabular crystals and/or fibro-
radial to plumose aggregates (Figure 7-10 (a) and (b)). Crystal size varies but laths typically range
in length from 10 µm to 60 µm and crystal aggregates can reach up to 400 µm.
Synchysite is invariably associated with strontianite and/or baryte either as inclusions and/or
intergrowths and together they form distinctive vein-like aggregates or segregations (Figure 7-10
and Figure 7-11). In addition to these two phases, synchysite is locally associated with calcite,
fluorite, alkali (K) feldspar, pyrochlore and titanite. The mineral association of synchysite with
strontianite and baryte in the Songwe carbonatites and their textural relationships is typical of
sub-solidus hydrothermal REE mineralization and has been reported from other carbonatites e.g.
Amba Dongar Carbonatite Complex, India (Doroshkevich et al., 2009).
Apatite in the Songwe carbonatites is anomalously enriched in yttrium and heavy rare earth
oxides (HREO). The HREO enrichment factor of Songwe apatite, defined here as the sum of all
HREO from Eu2O3 to Lu2O3 and Y2O3/TREO (Table 7-4), ranges from 40 % to 85 % compared to
2 % to 11 % in apatite from other carbonatites (Hornig-Kjarsgaard, 1998). It is rare for apatite in
carbonatite deposits to display heavy rare earth enrichment. At Songwe however, apatite formed
at a late stage and does not have the characteristic ‘lozenge’ shape which is typical of early
crystallized apatite in carbonatites.
Apatite in the Songwe carbonatite lithologies is often visibly recrystallized and occurs as stringers
and groundmass anhedral crystals, or as large bands (Figure 7-11 (a)) and veins which frequently
contain entrained groundmass material, typically carbonate. In samples from the black carbonatite
apatite invariably forms large bands and veins (PX003 sample V1206; Figure 7-11 (b)) and is
closely associated with the Fe carbonate.
Chondrite normalized REE patterns for apatite (Figure 7-12) illustrate the anomalous enrichment
of HREE+Y. Figure 7-13 compares representative analyses of the Songwe late-stage apatite to
typical LREE-enriched unaltered magmatic carbonatite from other carbonatite complexes, Oka in
Canada and Jacupiranga in Brazil (Hornig-Kjarsgaard, 1998).
Florencite is particularly abundant in the groundmass of the carbonatite breccias forming narrow
acicular crystals (< 20 µm in width) and is associated with various Fe- and Mn-bearing oxides
(Figure 7-14). Occasionally, florencite is also found as small anhedral crystals along the edges of

J2897 Mkango Songwe Hill PFS November 2014 Page: 70
entrained carbonate crystals in apatite veins and most likely formed as a replacement/alteration
product of apatite.
Xenotime in association with apatite was identified in a calcite- and apatite-rich breccia in bore
hole PX020 but this is to date the only xenotime occurrence at Songwe Hill.
Table 7-3
Average REO distribution of Synchysite, analysed by EMP, in Songwe carbonatites
(excluding outliers)
Borehole La2O3 Ce2O3 Pr2O3 Nd2O3 Sm2O3 Eu2O3 Gd2O3 Dy2O3 Y2O3 REO1
wt. % wt. % wt. % wt. % wt. % wt. % wt. % wt. % wt. % wt. %
PX001
Median 14.50 23.39 2.16 7.45 1.04 0.26 0.63 0.21 0.54 50.18
Average 14.39 23.11 2.13 7.38 1.03 0.25 0.60 0.22 0.55 49.66
PX003
Median 15.84 26.52 2.39 7.45 0.58 0.04 0.00 0.06 0.24 53.12
Average 16.13 26.78 2.40 7.17 0.55 0.05 0.01 0.07 0.27 53.43
PX005
Median 11.42 24.70 2.72 9.42 0.99 0.10 0.17 0.14 0.50 50.16
Average 10.98 24.19 2.55 8.94 0.98 0.12 0.20 0.14 0.61 48.71
PX011
Median 13.65 24.43 2.38 6.63 0.65 0.11 0.16 0.21 0.84 49.06
Average 13.73 23.99 2.31 6.57 0.64 0.11 0.17 0.24 0.92 48.68
Borehole La2O3 Ce2O3 Pr2O3 Nd2O3 Sm2O3 Eu2O3 Gd2O3 Dy2O3 Y2O3 REO1
% % % % % % % % % %
PX001
Median 28.92 46.44 4.32 15.10 2.11 0.51 1.23 0.43 1.07 100.0
Average 28.97 46.53 4.29 14.86 2.08 0.50 1.21 0.44 1.12 100.0
PX003
Median 29.88 49.65 4.58 13.81 1.09 0.08 0.00 0.11 0.45 100.0
Average 30.23 50.12 4.50 13.39 1.02 0.09 0.01 0.13 0.51 100.0
PX005
Median 22.75 49.21 5.36 18.65 1.93 0.24 0.38 0.28 1.17 100.0
Average 22.45 49.80 5.21 18.33 2.00 0.25 0.41 0.29 1.26 100.0
PX011
Median 28.66 49.09 4.78 13.55 1.30 0.23 0.32 0.45 1.78 100.0
Average 28.20 49.30 4.75 13.50 1.31 0.23 0.33 0.48 1.87 100.0
1 REO = La2O3, Ce2O3, Pr2O3, Nd2O3, Sm2O3, Eu2O3, Gd2O3, Dy2O3 and Y2O3
Source: NHM and Brady

J2897 Mkango Songwe Hill PFS November 2014 Page: 71
Table 7-4
Average REO distribution of Apatite, analysed by LA-ICP-MS, in Songwe carbonatites (excluding outliers)
Borehole La2O3 Ce2O3 Pr2O3 Nd2O3 Sm2O3 Eu2O3 Gd2O3 Tb2O3 Dy2O3 Ho2O3 Er2O3 Tm2O3 Yb2O3 Lu2O3 Y2O3 TREO HREO
+Y2O3/TREO
ppm ppm ppm ppm ppm ppm ppm ppm ppm ppm ppm ppm ppm ppm ppm ppm %
PX001
Median 1,195 3,521 555 2,809 859 303 991 161 1,034 185 465 60 314 37 5,304 17,793 49.76
Average 1,124 3,242 513 2,695 799 284 917 150 944 168 420 55 291 33 4,792 16,427 49.03
PX003
Median 1,419 3,956 688 3,233 1,006 359 1,157 194 1,237 211 482 48 211 21 5,680 19,902 48.24
Average 1,638 5,700 631 3,058 914 325 1,071 183 1,151 203 458 47 201 20 5,276 20,876 42.80
PX005
Median 270 922 170 949 429 199 806 177 1,323 259 619 66 305 28 8,101 14,623 81.26
Average 258 929 168 950 420 199 843 187 1,407 281 680 71 321 31 8,649 15,394 82.30
PX012
Median 423 1,414 275 1,561 668 305 1,214 231 1,601 296 703 76 303 28 9,364 18,462 76.49
Average 479 1,463 263 1,493 650 290 1,106 211 1,443 270 632 67 288 27 8,150 16,832 74.17
Borehole La2O3 Ce2O3 Pr2O3 Nd2O3 Sm2O3 Eu2O3 Gd2O3 Tb2O3 Dy2O3 Ho2O3 Er2O3 Tm2O3 Yb2O3 Lu2O3 Y2O3 TREO
% % % % % % % % % % % % % % % %
PX001
Median 6.7% 19.8% 3.1% 15.8% 4.8% 1.7% 5.6% 0.9% 5.8% 1.0% 2.6% 0.3% 1.8% 0.2% 29.8% 100%
Average 6.8% 19.7% 3.1% 16.4% 4.9% 1.7% 5.6% 0.9% 5.7% 1.0% 2.6% 0.3% 1.8% 0.2% 29.2% 100%
PX003
Median 7.1% 19.9% 3.5% 16.2% 5.1% 1.8% 5.8% 1.0% 6.2% 1.1% 2.4% 0.2% 1.1% 0.1% 28.5% 100%
Average 7.8% 27.3% 3.0% 14.6% 4.4% 1.6% 5.1% 0.9% 5.5% 1.0% 2.2% 0.2% 1.0% 0.1% 25.3% 100%
PX005
Median 1.8% 6.3% 1.2% 6.5% 2.9% 1.4% 5.5% 1.2% 9.0% 1.8% 4.2% 0.5% 2.1% 0.2% 55.4% 100%
Average 1.7% 6.0% 1.1% 6.2% 2.7% 1.3% 5.5% 1.2% 9.1% 1.8% 4.4% 0.5% 2.1% 0.2% 56.2% 100%
PX012
Median 2.3% 7.7% 1.5% 8.5% 3.6% 1.6% 6.6% 1.3% 8.7% 1.6% 3.8% 0.4% 1.6% 0.1% 50.7% 100%
Average 2.8% 8.7% 1.6% 8.9% 3.9% 1.7% 6.6% 1.3% 8.6% 1.6% 3.8% 0.4% 1.7% 0.2% 48.4% 100%
1 REO = La2O3, Ce2O3, Pr2O3, Nd2O3, Sm2O3, Eu2O3, Gd2O3, Dy2O3 and Y2O3
Source: AU and Brady

J2897 Mkango Songwe Hill PFS November 2014 Page: 72
Figure 7-10
SEM images of synchysite in the Songwe carbonatite
Note: (a): Sample V3702 from borehole PX005 (V3702) with tabular/lath-shaped synchysite crystals;
(b): Sample V3532 from borehole PX001 showing fibro-radial aggregates of synchysite in strontianite
Source: NHM and Brady (2012)

J2897 Mkango Songwe Hill PFS November 2014 Page: 73
Figure 7-11
SEM images of apatite in the Songwe carbonatite
Note: (a): Sample V364 from borehole PX001showing band of apatite containing entrained carbonate with
aggregates of synchysite, strontianite and baryte along its edge and
(b) Sample V1240 from borehole PX003 with apatite and Fe-rich carbonate bands with large vein-like
aggregate of synchysite, strontianite and baryte
Source: NHM and Brady (2012)

J2897 Mkango Songwe Hill PFS November 2014 Page: 74
Figure 7-12
Chondrite-normalized REE pattern for apatite in Songwe carbonatite
Note: Chondrite normalization after Sun and McDonough (1989)
Source: Brady (2012)
Figure 7-13
Chondrite-normalized late-stage apatite from Songwe carbonatites
Note: Chondrite-normalized HREE pattern of Songwe apatite compared to typical LREE-enriched unaltered
magmatic carbonatite from the Oka and Jacupiranga carbonatites. Chondrite normalization after Sun and
McDonough (1989)
Source: Broom (2012)

J2897 Mkango Songwe Hill PFS November 2014 Page: 75
Figure 7-14
Florencite-rich groundmass of carbonatite breccia
Source: NHM and Brady (2012)
7.3.4.1 Genetic Model for REE Mineralization
The mineralogical work to date indicates that the light and heavy rare earth mineralization in the
Songwe Hill vent system is late- to post-magmatic hydrothermal in origin and, regardless of
lithology, is hosted primarily by fluorocarbonates (principally synchysite) and apatite with minor
florencite.
The complex, multi-phase geological evolution of the Songwe carbonatite complex is tentatively
interpreted as follows: 1) intrusion of the Mauze nepheline syenites and phonolites, 2) fenitisation
of the host nepheline syenites, 3) intrusion(s) of REE-bearing calcite carbonatite in a ring type
structure and concomitant incorporation/stoping of fenite blocks, 4) pulses of Fe-bearing
carbonatite magma emplacement and replacement of calcite carbonatite, 5) intrusion of thin Fe-
rich carbonatite dykes/veins in the calcite and Fe-bearing carbonatites, 6) multiple later stage
episodes of brecciation, and finally 7) extensive hydrothermal/carbohydrothermal activity
resulting in REE enrichment of the various carbonatite and related lithologies.
The mineral association of REE-rich fluorocarbonates and apatite, with strontianite, baryte,
ankerite and fluorite at Songwe strongly suggests that the REE mineralization formed by re-
equilibration and recrystallisation of primary (early-crystallized) minerals (e.g. calcite) in the
various carbonatite lithologies. REEs are known to concentrate into the late-stage carbonatite-
related (deuteric) fluids (e.g. Doroshkevich et al., 2009) and it is therefore most likely that certain
elements were introduced and/or re-distributed by hydrothermal/carbohydrothermal solutions.
The presence of REE in the fenites demonstrates the mobility of the REE in the
hydrothermal/carbohydrothermal fluids at Songwe Hill.

J2897 Mkango Songwe Hill PFS November 2014 Page: 76
8 DEPOSIT TYPES
The target deposit type at Songwe Hill is a REE-enriched carbonatite. Carbonatites are
traditionally defined as intrusive and extrusive igneous rocks that contain in excess of 50% modal
carbonate minerals (Woolley and Kempe, 1989). The most recent classification by Mitchell (2005)
defines carbonatites as “containing greater than an arbitrary 30 vol. % primary igneous carbonate
regardless of silica content”. Carbonatites can be named according to their carbonate mineralogy
(e.g. calcite carbonatite, dolomite carbonatite and ankerite carbonatite) and chemically they can
be divided into the three main varieties: calcio-, magnesio- and ferro-carbonatite. Figure 8-1 is a
generalized and widely accepted schematic illustration of the intrusion of a carbonatite complex.
Figure 8-1
General model for an alkali silicate-carbonate intrusive complex
Source: after Le Bas (1987)
Carbonatites usually occur as plugs or pipe-like bodies within zoned alkalic intrusive complexes,
or as dykes, sills, breccias, and veins, and are almost exclusively associated with continental rift-
related tectonic settings. They are characterized by an aureole of metasomatically altered country
rocks which are usually referred to as fenites. Carbonatites are typically associated with silicate
rocks of which the seven key carbonatite-silicate rock associations are in decreasing order of
abundance: 1) nephelinite-ijolite, 2) phonolite-feldspathoidal syenite, 3) trachyte-syenite, 4)
melilitite-melilitolite, 5) lamprophyre, 6) kimberlite, and 7) basanite-alkali gabbro (Woolley &
Kjarsgaard, 2008). The carbonatite deposit at Songwe Hill is spatially associated with the large
nepheline syenite intrusion of Mauze and is therefore interpreted to belong to the phonolite-
feldspathoidal syenite association.

J2897 Mkango Songwe Hill PFS November 2014 Page: 77
Carbonatites can be generated by:
a low degree of partial melting in the mantle (e.g. Wallace & Green, 1988);
extreme crystal fractionation (e.g. Watkinson and Wyllie, 1971); or
liquid immiscibility (e.g. Kjarsgaard and Hamilton, 1989) from carbonated silicate magma.
It is possible that all three mechanisms may play a part in carbonate magma evolution.
Carbonatites typically consist of multiple phases of intrusions and characteristically evolve, by
crystal fractionation within the intrusion, from early magmatic calcite-rich carbonatite to
magnesium-rich dolomite carbonatites and finally with decreasing temperature to late-stage iron-
rich carbonatite phases. As a result of their petrogenesis, carbonatites tend to be anomalously
enriched in the highly incompatible REE and high field strength elements (HFSE) and such
enrichment can lead to economic concentrations of REE (Chakhmouradian and Zaitsev, 2012).
The REE profile of carbonatite-associated mineralization is typically LREE-dominated.
Concentrations of REE tend to increase with fractionation from calcio- to magnesio- to ferro-
carbonatites and the REE distribution and profile in carbonatites is typically modified by late stage
hydrothermal activity (Mariano, 1989; Giere, 1996; Wall and Mariano, 1996; Doroshkevich et. al.,
2009). Carbonatite deposits may also contain economic or anomalous concentrations of
magnetite, apatite, baryte, sulphides and vermiculite and are characterized by elevated
concentrations of some or all of phosphorous, niobium, tantalum, uranium, thorium, copper, iron,
titanium, vanadium, barium, fluorine, zirconium, and other rare or incompatible elements.
REE-enriched carbonatite hosted deposits may be divided in to three types: magmatic,
hydrothermal, and residual / supergene (Mariano, 1989). Rare earth mineral deposits produced by
primary crystallization from carbonatite magma are very rare and at the present time, the
Mountain Pass deposit in the USA is the only well documented example. Late-stage rare earth
mineralization produced by magmatic hydrothermal fluids is much more common, resulting in the
precipitation of rare earth minerals, such as bastnäsite-(Ce), parisite-(Ce), synchysite-(Ce) and
monazite-(Ce) in fractures or voids in the host carbonatite rock. Alternatively, hydrothermal
mineralization may be present as disseminated, fine grained, polycrystalline aggregates of rare
earth minerals overprinting or replacing earlier-formed minerals. Examples of hydrothermal
deposits include Bayan Obo in China (Chao et al., 1992; Smith and Henderson, 2000) and
Karonge/Gakara in Burundi (Lehmann et al., 1994).
Laterites, overlying deeply weathered carbonatites and alkaline rocks, are also an important
source of REE enrichment and examples of supergene mineralization include the Mount Weld
deposit in Western Australia. However, the rare earth deposit at Songwe Hill is not a laterite and is
best described as a magmatic/hydrothermal REE deposit.
The target at Songwe Hill is a large body of intrusive calcic carbonatite with related breccias and
fenites that appears to be part of a ring complex in a high level vent system. The REE
mineralization is lithologically-controlled and the highest concentrations and greatest volumes of
mineralization occur specifically within the carbonatite bodies. The carbonatites are believed to
have been REE-enriched when they were intruded and the REE have apparently been redistributed

J2897 Mkango Songwe Hill PFS November 2014 Page: 78
and enhanced by late-stage hydrothermal/carbohydrothermal activity and are now principally
residing in synchysite and apatite.
Vent breccias are also variably mineralized, locally to potentially economic values, and the level of
REE concentrations is a function of the relative abundance of carbonatite fragments.
Adjacent fenites are also variably mineralized, although typically at lower volumes and
concentrations than carbonatites, and the intensity of mineralization is related to the degree of
carbonate alteration overprinting the fenite suggesting that these rocks have also been
mineralized by late-stage hydrothermal activity.
J2897 Mkango Songwe Hill PFS November 2014 Page: 79
9 EXPLORATION
Mkango has been exploring and evaluating the Songwe Hill rare earth deposit since January 2010.
Following confirmation of the enriched zones, previously investigated by JICA and MMAJ (see
Section 6), exploration focused on identifying the nature and extent of the REE-mineralized
carbonatites and related rocks. Mkango’s exploration activities consisted of litho-geochemical
sampling, soil sampling, channel sampling, geological mapping, ground magnetic, density and
radiometric surveys, and petrographic/ mineralogical analyses and culminated in two diamond
drilling campaigns in 2011 and 2012, the results of which are described in Section 10. Geological
observations and interpretations and procedures related to exploration methodology were
implemented and overseen by the Mkango geological team in Malawi led by Dr. Aoife Brady.
9.1 Litho-geochemical Sampling
Fieldwork undertaken by Mkango on Songwe Hill during March 2010 and May 2010 consisted
primarily of litho-geochemical sampling to confirm the nature and extent of the mineralization
identified by JICA and MMAJ. Outcrops were systematically scanned with a Thermo-Scientific
Niton® XLP handheld X-ray fluorescence analyzer calibrated for the semi-quantitative analysis of
rare earth elements. This work indicated that all lithologies on Songwe Hill contain anomalous
amounts of REE and that there are variations between the different lithologies. In general, the
contents of total REE in the fenites were lower than the carbonatites.
Two principal types of carbonatite were identified: a relatively homogeneous, medium grey rock,
which appeared flow banded in places and a much blacker type which was characteristically
heterogeneous. The black carbonatite appeared to form zones of various widths that cut or
replace the grey homogeneous carbonatite. A total of 88 representative grab samples were taken
from outcrop (62 carbonatites, 14 fenites, 11 Fe-rich and related rocks) and assayed for a full suite
of rare earth and related elements. The sample locations are shown on Figure 9-1 and the assay
results for the various rock types are presented in Table 9-1 and Figure 9-2. The samples were
considered to be representative of the outcrop distribution of the mineralization. Care was taken
to sample fresh rock and no sample biases were identified beyond the fact that there may have
been minor modification of the concentration of REE in some samples by weathering effects.
The new results generally compared well with the data from JICA and MMAJ and confirmed broad
zones of carbonatite at surface. The 62 carbonatite grab samples produced total rare earth
element oxide (TREO) concentrations between 0.4% and 5.3% TREO with an average of 1.5 %
TREO. The proportion of HREO, defined as the sum of oxides of Eu, Gd, Tb, Dy, Ho, Er, Tm, Yb, Lu
and Y, for these samples averaged 8 % of TREO. The average TREO concentration of samples
exceeding 1 % TREO is 1.84 % TREO.
The results of this work confirmed the REE enrichment, initially identified by JICA and MMAJ and
suggested that the mineralized carbonatites are more widespread than originally identified. This
led to a broadening of the exploration focus to include most of the north-facing slopes of
Songwe Hill.

J2897 Mkango Songwe Hill PFS November 2014 Page: 80
Table 9-1
Average REO distribution of Apatite, analysed by LA-ICP-MS, in Songwe carbonatites (excluding outliers)
Borehole Rock Type La2O3 Ce2O3 Pr2O3 Nd2O3 Sm2O3 Eu2O3 Gd2O3 Tb2O3 Dy2O3 Y2O3 Other1 TREO
2
ppm ppm ppm ppm ppm ppm ppm ppm ppm ppm ppm %
H0101 Carbonatite 8,704 13,232 1,126 3,218 343 85 238 23 102 385 66 2.75
H0102 Carbonatite 2,100 4,661 569 1,866 269 75 183 24 116 547 104 1.05
H0103 Carbonatite 10,135 15,691 1,310 3,626 326 77 228 20 88 370 76 3.19
H0117 Carbonatite 2,721 6,277 715 2,600 364 95 225 24 103 428 112 1.37
H0118 Carbonatite 10,979 16,043 1,369 3,999 448 108 309 30 142 749 155 3.43
H0119 Carbonatite 4,481 9,309 1,013 3,696 592 160 380 41 171 635 128 2.06
H0125 Carbonatite 2,064 4,754 517 1,842 261 68 166 22 118 655 130 1.06
H0126 Carbonatite 2,933 6,663 766 2,775 416 117 292 34 135 466 91 1.47
H0127 Carbonatite 11,343 16,511 1,369 3,731 458 122 326 39 180 720 131 3.49
H0917 Carbonatite 5,396 10,047 1,062 3,964 686 167 395 47 200 711 131 2.28
H0003 Fenite 1,408 3,244 314 1,259 264 68 146 13 46 183 41 0.70
H0004 Fenite 1,021 1,792 185 749 152 38 75 6 22 112 26 0.42
H0901 Fenite 903 1,265 228 1,056 220 62 137 15 63 271 57 0.43
H0902 Fenite 1,325 1,405 298 1,178 182 48 105 12 56 262 57 0.49
H0134 Fenite 745 1,522 199 802 200 61 156 19 88 395 68 0.43
H0909 Fe-rich rock 2,018 4,625 524 2,110 281 63 130 11 35 121 23 0.99
H0911 Fe-rich rock 1,279 2,916 339 1,411 213 52 118 13 49 179 30 0.66
H0913 Fe-rich rock 3,202 7,834 940 3,790 488 103 211 15 51 174 26 1.68
H0109 Fe-rich rock 5,501 8,115 741 1,912 216 66 203 27 119 538 95 1.75
H0002 Fe-rich rock 555 2,764 496 3,090 1,070 299 641 67 228 598 102 0.99
Note: 1
Other comprises Ho2O3, Er2O3, Tm2O3, Yb2O3 and Lu2O3;
2 TREO = total rare earth oxides including yttrium
Source: Mkango (2010)

J2897 Mkango Songwe Hill PFS November 2014 Page: 81
Figure 9-1
Geological map of Songwe Hill with sample localities of JICA (1988) and Mkango (2010)
samples
Note: UTM Zone 36S and WGS84 Datum
Source: Mkango after JICA / MMAJ (1989)

J2897 Mkango Songwe Hill PFS November 2014 Page: 82
Figure 9-2
Geological map of Songwe Hill with assay results for Mkango samples
Note: Assay results are shown for various rock types sampled; UTM Zone 36S and WGS84 Datum
Source: Mkango (2010)
9.2 Ground Geophysical Programme
In October 2010 and January 2011, Remote Exploration Services (Pty) Ltd. (“RES”) from South
Africa, conducted magnetic, radiometric and gravity surveys over Songwe Hill. The objective of
the geophysical programme was to determine the geophysical characteristics of the geological
units as an aid to mapping the extent of the carbonatite over Songwe Hill (Remote Exploration
Services Ltd., 2010). A digital terrain model (DTM) was prepared as part of the geophysical
programme. All data was processed by RES.
9.2.1 Magnetic survey
The ground-magnetic survey was conducted using GEM Overhauser Magnetometers. Magnetic
data was collected in “Walk Mode” at one second intervals along 1 km long lines spaced 50 m
apart, while a fixed GEM base magnetometer enabled each day’s magnetic data to be corrected
for diurnal variations by recording magnetic field readings at 10 second intervals. Field data
spatial positioning was accomplished with the use of a Garmin handheld GPS. The magnetic data
define the vent aureole as a zone of demagnetization around the mapped fenite and depicts the
vent as magnetically zoned. A NE-trending major fault cross-cutting the centre of the vent could
be the cause for this magnetic zoning. The data showed no clear correlation between magnetic

J2897 Mkango Songwe Hill PFS November 2014 Page: 83
anomalies and the mapped carbonatite outcrops. The magnetic survey also identified several
faults/lineaments which could have played an important role in carbonatite emplacement as well
as radioelement mobility (Figure 9-3).
Figure 9-3
Modified analytical signal of TMI over Songwe Hill
Note: Analytical signal showing magnetic zone and structures; geological map, drill collars and traces
superimposed
Source: RES and Mkango (2011)
9.2.2 Radiometric survey
A calibrated 4-channel spectrometer was used for the radiometric survey. Total count,
potassium (K), thorium (Th) and uranium (U) counts were recorded for 60 s at 50 m station
intervals along 1 km long lines spaced 50 m apart. An additional infill survey was conducted over
part of the survey area with a known carbonatite occurrence. The radiometric survey data showed
the existence of significant thorium and potassium anomalies and demonstrated a good
correlation between the Th response and the mapped carbonatite (Figure 9-4).

J2897 Mkango Songwe Hill PFS November 2014 Page: 84
Figure 9-4
Thorium radiometric survey over Songwe Hill
Note: Thorium radiometric survey; geological map, drill collars and borehole traces superimposed
Source: RES and Mkango (2011)
9.2.3 Gravity survey
The ground gravity survey was conducted using a Scintrex CG3 micro-gravimeter, capable of
taking readings with an accuracy of +/- 0.001 mGal. Gravimetric measurements were made at 50
m station intervals along 1 km long lines spaced 50 m apart. Readings were stacked for 60 s and
averaged at each station so as to minimize random noise and were also kept within a standard
deviation of +/- 0.050 mGal. Base readings were taken at the “gravity base” at the beginning and
end of each survey day in order to correct field measurements for instrument drift. Elevation and
positional control was accomplished initially with the use of a Trimble Differential GPS (DGPS)
unit. This had to be abandoned due to a technical fault within the DGPS system and a Garmin
60CSX handheld GPS unit was adopted for the remainder of the survey. The hill was resurveyed in
January, 2011 (Remote Exploration Services Ltd., 2011) in order to better constrain the digital
terrain model and the gravity survey data was reinterpreted on the basis of the revised DTM.
Interpretation of the gravity data, based on in-field observations undertaken on hand specimen
grab samples, assumed a high density contrast between the carbonatites and the surrounding
rocks.
Due to inherent errors in the gravity data emanating from imprecise elevation measurements
using a handheld GPS as well as the coarse nature of the data, it is likely that an accurate
assessment of the density distribution within the vent has not been achieved. A central gravity

J2897 Mkango Songwe Hill PFS November 2014 Page: 85
high was identified (Figure 9-5) but it is inconclusive as to whether it relates to carbonatite or
basement geology.
Figure 9-5
Ground gravity survey over Songwe Hill
Note: Ground gravity survey over Songwe Hill showing a central gravity high; geological map, drill collars and
borehole traces superimposed
Source: RES and Mkango (2011)
9.3 Geological Mapping
Detailed geological mapping of Songwe Hill was carried out during March, 2010 in conjunction
with the surface litho-geochemical sampling program and between May and July, 2011. All
outcrops on the north-facing slopes of Songwe Hill were systematically recorded and their
locations determined with a handheld GPS (Garmin 60CSX). Mapping was aimed to provide better
detail on the distribution of carbonatite, fenite and breccia across Songwe Hill and to delineate
the zones of rare earth mineralization (see Figure 7-2). The mapping programme demonstrated
that carbonatite outcrops over a significantly larger area than had previously been recognized by
JICA and MMAJ. Mapping further achieved a more precise delineation of the distribution of
breccia and fenite. The mapping broadened the surface area of known rare earth mineralization
significantly beyond the areas identified in previous exploration and identified new areas of rare-
earth enriched carbonatite on the western slope of the hill.

J2897 Mkango Songwe Hill PFS November 2014 Page: 86
9.4 Surface Channel Sampling
A channel sampling programme was undertaken during November and December 2011 following
the Stage 1 drill campaign. The objective was to help constrain the geological model and provide
continuous surface sampling along the drill section lines in order to constrain the Mineral
Resource Estimation. Outcrops were exposed by cleaning off overburden and soil as continuously
as possible along 5 lines with an east-west orientation that followed the approximate surface
projections of existing and planned boreholes. In detail, the location of the channel sampling lines
was dictated by the availability of outcrop along each E-W line. Where outcrop could not be
exposed directly on the line, sampling was offset to the outcrop nearest to the line, irrespective of
lithology (Figure 9-6). To the extent possible, continuous channel samples were cut along each of
these lines.
Figure 9-6
Geological map with location and TREO of the 5 channel sample lines
Source: Mkango (2012)
Channels were cut in the exposed outcrop using a Stihl TS 700 saw fitted with a diamond saw
blade (Figure 9-7) and connected to a Stihl 10L pressurized water tank. All channels were cut to an
approximate width of 4 cm to 5 cm and a depth of 10 cm to 12 cm. A single channel was defined
by the start and end of a continuous cut. There were many breaks in the cutting due to the
uneven topography and distribution of outcrop and overburden. As a result, although the

J2897 Mkango Songwe Hill PFS November 2014 Page: 87
channels follow the planned surface lines as closely as possible, they are not continuous and
locally deviate from the line.
Figure 9-7
Example of Channel sampling programme on Songwe Hill
Note: Left: a single channel cut through carbonatite; Right: Channel cutting with a Stihl TS 700 saw
Source: Armitage (2012)
On completion of cutting, the channels and an area approximately 50 cm to either side of the
channels were cleaned of sludge using water and a stiff brush if necessary. When the rock surface
had dried after cleaning, metre marks across the channels were painted together with unique
sample numbers (sample ticket book number) adjacent to the metre marks on the left side of the
channel viewed in the direction of sequential sampling.
Samples were broken and chipped out of the channels using a tapered masonry chisel and a club
hammer. As slabs and chips of rock were liberated, they were placed immediately into pre-
prepared sampling bags containing sample tickets and marked with sample numbers on the
outside. Before sampling each metre, the geologist checked that the sample number of the bag
corresponded to the number spray-painted alongside the channel. Channels were sampled at
1 m intervals and if there was a change of lithology within the sampling interval, then each
lithology was sampled separately, using a minimum of 20 cm channel length and a maximum of
130 cm.
On completion of sampling, all channels were photographed, viewed in the direction of sequential
sample numbering, and clearly showing the sample numbers.
The channel sampling logging and sampling technique employed during the channel sampling
programme followed strict internal quality assurance and quality control (QA/QC) procedures.
Each channel sample line was geologically logged and sampled observing the same procedures
used during the drilling programmes. Sample preparation and analytical work was carried out by

J2897 Mkango Songwe Hill PFS November 2014 Page: 88
Intertek-Genalysis Laboratory Services (Johannesburg, South Africa and Perth, Australia)
employing ICP-MS analytical procedures and following strict internal QA/QC procedures including
the insertion of duplicates, blanks and certified standards. Detailed information on logging,
sampling and geochemical analysis is presented in Section 11.
A summary of the channel sampling programme, as illustrated in Figure 9-6, is presented in Table
9-2. The results were broadly consistent with the current geological mapping, litho-geochemical
sampling and portable XRF sampling results and further confirm the continuity of rare earth
mineralization at surface in carbonatite, carbonatite breccia and fenite on Songwe Hill.
Representative assay data for the channel samples are given in Table 9-3.
Table 9-2
Summary of assay results for the 5 channel sample lines
E-W line
(approximate
length)
Aggregated
length of
channel samples
Aggregated
length of
carbonatite1 in
channel samples
Weighted
average
TREO in
carbonatite1
Aggregated
length of
fenite in
channel
samples
Weighted
average TREO
in fenite
m m m % TREO2 m % TREO
2
SGW-01 (200 m) 152 119 1.75 33 0.73
SGW-02 (150 m) 106 79 1.44 27 1.20
SGW-03 (110 m) 66 53 1.70 14 0.67
SGW-04 (120 m) 63 33 2.83 31 0.94
SGW-05 (55 m) 37 31 1.37 6 1.28
Note: 1 Includes both carbonatite and carbonatite breccia;
2 TREO = total rare earth oxides including yttrium
Source: Mkango (2012)
9.5 Research Programmes
Post-graduate studies on the middle and heavy REE mineralization at Songwe Hill are underway
at Camborne School Mines (“CSM”), University of Exeter, UK in conjunction with the British
Geological Survey (“BGS”). This Project is investigating HREE concentration levels in alkaline and
carbonatite complexes which are typically light rare earth dominated.
This research is focused on two principle questions: (1) under what conditions are the HREE
preferentially removed from a carbonatite and deposited in hydrothermal veins and (2) how does
the REE distribution evolve through the carbonatite intrusion phases and into late stage
hydrothermal remobilization. This work is being carried out at the mineralogical labs at CSM using
cathodoluminescence, electron microscopy and an electron microprobe and at the BGS utilizing
laser-ablation inductively coupled plasma mass spectrometry (“LA-ICP-MS”) and a fluid inclusion
heating and cooling stage.
The study is in progress and the results are expected to aid in targeting and exploring REE-
enriched carbonatites elsewhere in the license area.

J2897 Mkango Songwe Hill PFS November 2014 Page: 89
A further research project is underway at CSM entitled “Resource efficiency in phosphate
deposits” in collaboration with Mkango. The research, in relation to Songwe, is focused on
mineralogy, geochemistry and mineral processing.
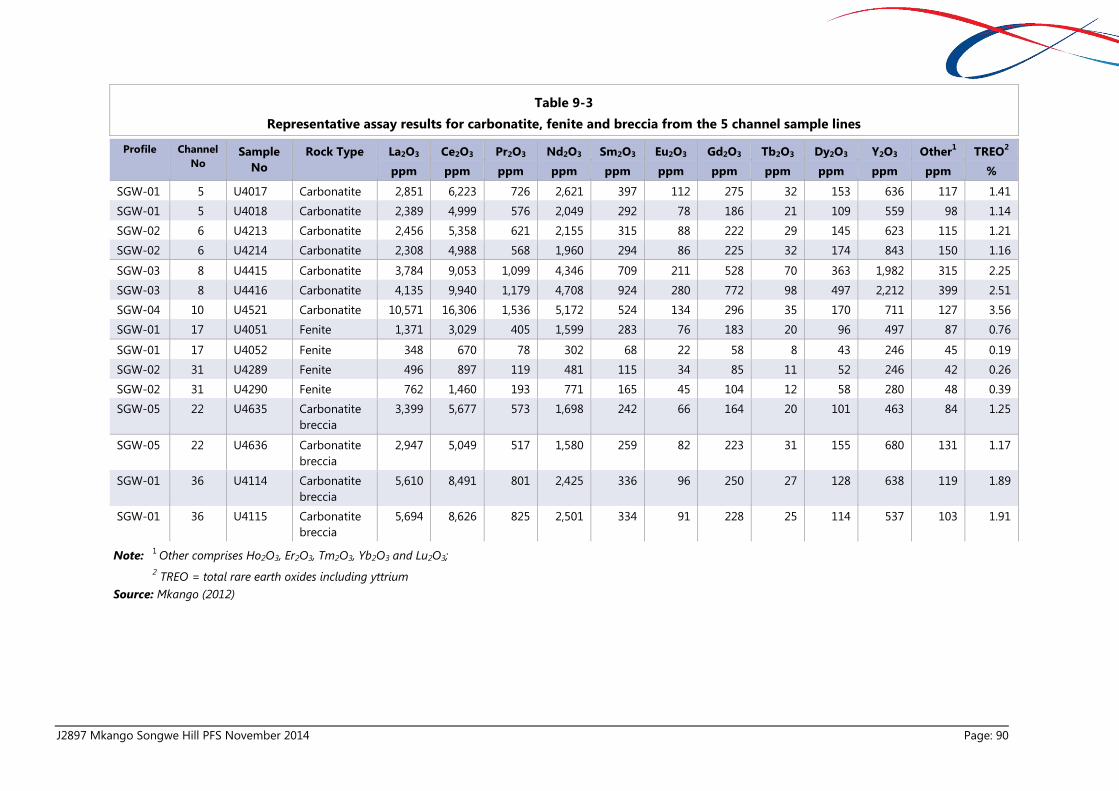
J2897 Mkango Songwe Hill PFS November 2014 Page: 90
Table 9-3
Representative assay results for carbonatite, fenite and breccia from the 5 channel sample lines
Profile Channel
No Sample
No
Rock Type La2O3 Ce2O3 Pr2O3 Nd2O3 Sm2O3 Eu2O3 Gd2O3 Tb2O3 Dy2O3 Y2O3 Other1 TREO
2
ppm ppm ppm ppm ppm ppm ppm ppm ppm ppm ppm %
SGW-01 5 U4017 Carbonatite 2,851 6,223 726 2,621 397 112 275 32 153 636 117 1.41
SGW-01 5 U4018 Carbonatite 2,389 4,999 576 2,049 292 78 186 21 109 559 98 1.14
SGW-02 6 U4213 Carbonatite 2,456 5,358 621 2,155 315 88 222 29 145 623 115 1.21
SGW-02 6 U4214 Carbonatite 2,308 4,988 568 1,960 294 86 225 32 174 843 150 1.16
SGW-03 8 U4415 Carbonatite 3,784 9,053 1,099 4,346 709 211 528 70 363 1,982 315 2.25
SGW-03 8 U4416 Carbonatite 4,135 9,940 1,179 4,708 924 280 772 98 497 2,212 399 2.51
SGW-04 10 U4521 Carbonatite 10,571 16,306 1,536 5,172 524 134 296 35 170 711 127 3.56
SGW-01 17 U4051 Fenite 1,371 3,029 405 1,599 283 76 183 20 96 497 87 0.76
SGW-01 17 U4052 Fenite 348 670 78 302 68 22 58 8 43 246 45 0.19
SGW-02 31 U4289 Fenite 496 897 119 481 115 34 85 11 52 246 42 0.26
SGW-02 31 U4290 Fenite 762 1,460 193 771 165 45 104 12 58 280 48 0.39
SGW-05 22 U4635 Carbonatite
breccia
3,399 5,677 573 1,698 242 66 164 20 101 463 84 1.25
SGW-05 22 U4636 Carbonatite
breccia
2,947 5,049 517 1,580 259 82 223 31 155 680 131 1.17
SGW-01 36 U4114 Carbonatite
breccia
5,610 8,491 801 2,425 336 96 250 27 128 638 119 1.89
SGW-01 36 U4115 Carbonatite
breccia
5,694 8,626 825 2,501 334 91 228 25 114 537 103 1.91
Note: 1 Other comprises Ho2O3, Er2O3, Tm2O3, Yb2O3 and Lu2O3;
2 TREO = total rare earth oxides including yttrium
Source: Mkango (2012)

J2897 Mkango Songwe Hill PFS November 2014 Page: 91
10 DRILLING
10.1 Historical Diamond Drilling (1988)
Historic drilling from the JICA and MMAJ programme is described in Section 6 and Figure 6-1
shows the location of the historic drill holes on the property. The historic drilling does not have
adequate geodetic or procedural information to be incorporated in the evaluation of the Songwe
Hill deposit and does not form part of the database for the current Mineral Resource Estimate.
10.2 Stage 1 and Stage 2 Diamond Drilling (2011 – 2012)
Mkango undertook two diamond drill campaigns totalling 38 drill holes at Songwe Hill during
2011 (Stage 1) and 2012 (Stage 2) to evaluate the REE potential of the Songwe Hill deposit and
develop a Mineral Resource Estimate. The drilling programmes were undertaken following strict,
industry standard QA/QC protocols which were part of a comprehensive set of standard operating
procedures (“SOP”). The implementation of all protocols was independently monitored by MSA.
The Stage 1 drilling programme, from April 2011 to June 2011 was conducted by OX Drilling of
Zambia using HQ/NQ (63.55 mm / 47.6 mm) core barrels on a track mounted Boart Longyear drill
rig. The objectives were to confirm the extent and tenor of mineralization that had previously
been identified during the JICA and MMAJ drill campaigns and to test whether the mineralization
extends beyond the boundaries of the previously established mineralized areas.
The programme totalled 13 drill holes, two vertical holes and 11 inclined holes drilled on 90° and
270° azimuths at inclinations of -60° and -70°, and one hole (PX002) drilled at 045° azimuth at -
70° inclination. Borehole depths ranged from a minimum of 86 m to a maximum of 302.2 m. Table
10-1 provides the location and attitude information for each drill hole. A total of 1,987.38 m were
drilled, and 2118 samples were collected for geochemical analyses.
The Stage 2 diamond core drilling programme was carried out between January, 2012 and May,
2012. The drill contractor was Cartwright Drilling Inc. of Goose Bay, Canada, and the core diameter
for all boreholes was HQ (63.5 mm) for the upper part and NQ (47.6 mm) to the end of hole. The
core diameter of one drillhole (PX022a) was further reduced from NQ to BTW (41.7 mm) size. The
track-mounted rig (Figure 10-1) was moved into place on each drill pad using a Caterpillar 329D
hydraulic excavator.
The Stage 2 programme focused on infill drilling and expanding the area of known mineralization
identified during Stage 1, particularly at depth. A total of 25 holes comprising four vertical holes
and 21 inclined holes drilled on 90° and 270° azimuths at inclinations of -60°, -65°, -70°, or -80°
(Table 10-1 and Figure 10-2). Borehole depths ranged from a minimum of 21 m to a maximum of
363 m. Table 10-1 shows location and attitude information for each drill hole. A total of 4,864.90
m were drilled and 5,116 samples for assays were collected. Drilling was conducted during day
and night shifts.
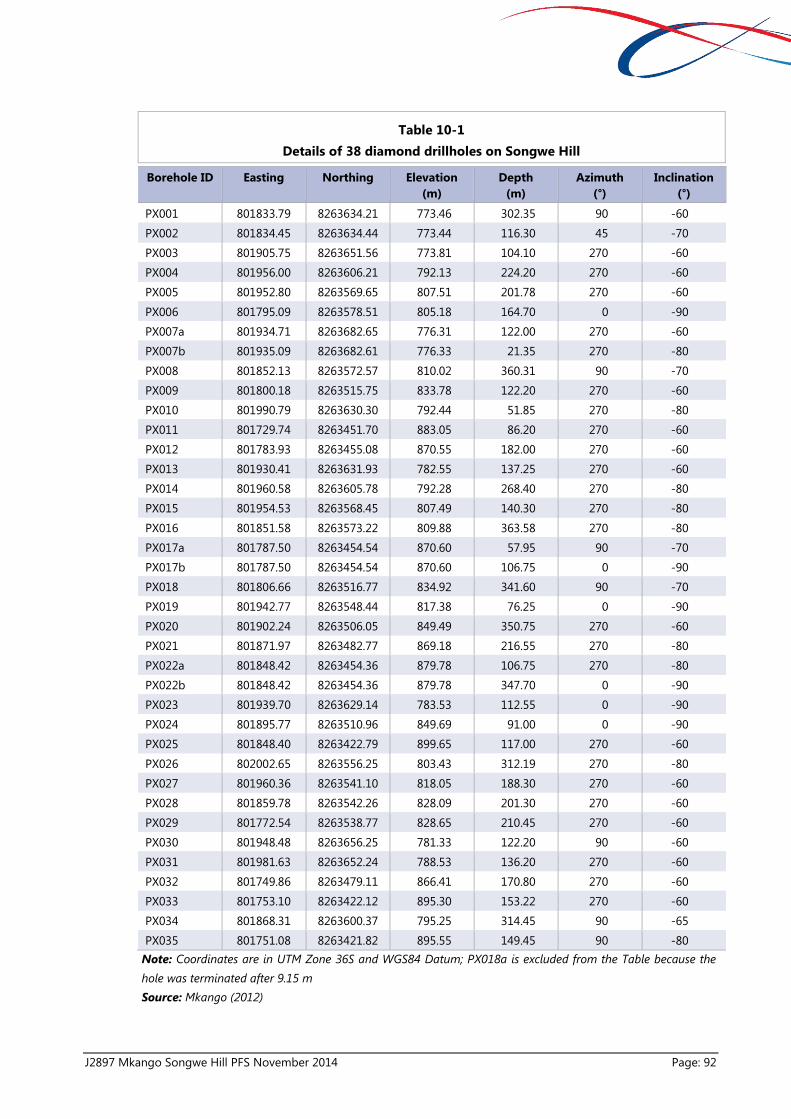
J2897 Mkango Songwe Hill PFS November 2014 Page: 92
Table 10-1
Details of 38 diamond drillholes on Songwe Hill
Borehole ID Easting Northing Elevation
(m)
Depth
(m)
Azimuth
(°)
Inclination
(°)
PX001 801833.79 8263634.21 773.46 302.35 90 -60
PX002 801834.45 8263634.44 773.44 116.30 45 -70
PX003 801905.75 8263651.56 773.81 104.10 270 -60
PX004 801956.00 8263606.21 792.13 224.20 270 -60
PX005 801952.80 8263569.65 807.51 201.78 270 -60
PX006 801795.09 8263578.51 805.18 164.70 0 -90
PX007a 801934.71 8263682.65 776.31 122.00 270 -60
PX007b 801935.09 8263682.61 776.33 21.35 270 -80
PX008 801852.13 8263572.57 810.02 360.31 90 -70
PX009 801800.18 8263515.75 833.78 122.20 270 -60
PX010 801990.79 8263630.30 792.44 51.85 270 -80
PX011 801729.74 8263451.70 883.05 86.20 270 -60
PX012 801783.93 8263455.08 870.55 182.00 270 -60
PX013 801930.41 8263631.93 782.55 137.25 270 -60
PX014 801960.58 8263605.78 792.28 268.40 270 -80
PX015 801954.53 8263568.45 807.49 140.30 270 -80
PX016 801851.58 8263573.22 809.88 363.58 270 -80
PX017a 801787.50 8263454.54 870.60 57.95 90 -70
PX017b 801787.50 8263454.54 870.60 106.75 0 -90
PX018 801806.66 8263516.77 834.92 341.60 90 -70
PX019 801942.77 8263548.44 817.38 76.25 0 -90
PX020 801902.24 8263506.05 849.49 350.75 270 -60
PX021 801871.97 8263482.77 869.18 216.55 270 -80
PX022a 801848.42 8263454.36 879.78 106.75 270 -80
PX022b 801848.42 8263454.36 879.78 347.70 0 -90
PX023 801939.70 8263629.14 783.53 112.55 0 -90
PX024 801895.77 8263510.96 849.69 91.00 0 -90
PX025 801848.40 8263422.79 899.65 117.00 270 -60
PX026 802002.65 8263556.25 803.43 312.19 270 -80
PX027 801960.36 8263541.10 818.05 188.30 270 -60
PX028 801859.78 8263542.26 828.09 201.30 270 -60
PX029 801772.54 8263538.77 828.65 210.45 270 -60
PX030 801948.48 8263656.25 781.33 122.20 90 -60
PX031 801981.63 8263652.24 788.53 136.20 270 -60
PX032 801749.86 8263479.11 866.41 170.80 270 -60
PX033 801753.10 8263422.12 895.30 153.22 270 -60
PX034 801868.31 8263600.37 795.25 314.45 90 -65
PX035 801751.08 8263421.82 895.55 149.45 90 -80
Note: Coordinates are in UTM Zone 36S and WGS84 Datum; PX018a is excluded from the Table because the
hole was terminated after 9.15 m
Source: Mkango (2012)

J2897 Mkango Songwe Hill PFS November 2014 Page: 93
Figure 10-1
Diamond core drill rig on Songwe Hill
Source: Mkango (2012)
Figure 10-2
Geological map with Stage 1 and Stage 2 drill collars and traces
Source: Brady (2012)

J2897 Mkango Songwe Hill PFS November 2014 Page: 94
10.3 Core Recovery
Core recovery was determined prior to logging and sampling and standard core recovery forms,
prepared by MSA, were completed for each hole by the geologist at the drill. Core recovery was
typically very good, usually >90 % within the carbonatite, carbonatite breccia and fenite
lithologies. However, in zones that contained significant void space/cavities, recoveries were
locally very poor (<50 %) and in a few cases, very little material (<10 %) was returned to the
surface. The cavities/void spaces are the likely result from karst-type dissolution of matrix
carbonate in the host carbonatite.
Large cavity/void areas were not included in assay intervals, but were tabulated as voids. Poor
recoveries were also encountered close to and within the boulder field on the north eastern side
of the hill. This area is a palaeo-drainage system and interaction with flowing water has resulted in
the formation of a zone of highly weathered, friable and void-filled fenite and carbonatite that
tends to fracture and disaggregate easily during drilling. Consequently, recoveries were poor in
this zone.
10.4 Collar Surveys
The 2011 Stage 1 borehole collars were surveyed by Digital Surveying based in South Africa. The
2012 Stage 2 channel sample lines and borehole collars were surveyed by a licensed land
surveyor, Land Management Consultants, of Blantyre, Malawi using a Real Time Kinematics (RTK)
Differential GPS system with sub-centimetre accuracy. The Stage 1 drill-collars were also re-
surveyed by Land Management Consultants for verification purposes and all collar locations are
reported using the Land Management Consultants survey data. The UTM Zone 36 South and
WSG84 Datum were used for all survey measurements.
10.5 Downhole Surveys
The 2011 Stage 1 drill-holes were surveyed by Digital Surveying based in South Africa using a
Reflex GYRO tool with station readings every 5 m. The surveys were carried out using a winch
inside plastic casing placed down the hole to ensure hole integrity.
During the Stage 2 programme 14 holes (PX007a, PX008, PX014, PX015, PX016, PX018, PX020,
PX021, PX026, PX028, PX029, PX032, PX034, and PX035) were surveyed using a Reflex GYRO tool,
with station readings every 5 m. The Reflex GYRO tool has an integrated Azimuth Pointing System
(APS) that indicates True North azimuth, a GPS position and degree of inclination. The APS is not
affected by magnetic interference and thus during the Stage 2 programme the surveys were
carried out inside the drill rods. The Reflex GYRO was set up and controlled by the site geologist
using the Toughbook field PC supplied with the system. Several parameters, including
temperature, were continuously recorded in the on-board memory throughout the survey to track
the path of the drill-hole. Once the survey was finished and the instrument brought to the surface,
the data was transferred from the Reflex GYRO’s on-board memory to the field PC.
The remaining 10 holes of the Stage 2 programme were surveyed using a Reflex EZ-AQ
instrument with station readings every 5 m. The EZ-AQ surveys were carried out using a hand
winch inside plastic casing placed down the hole to ensure hole integrity. The EZ-AQ instrument,

J2897 Mkango Songwe Hill PFS November 2014 Page: 95
which is sensitive to magnetic interference, measured the inclination and direction of the drill-
hole, together with magnetic and gravity field components. A handheld device was used to
communicate with the instrument which allowed the site geologist to view the orientation of the
borehole path immediately. The survey data was transferred from the EZ-AQ instrument via an
infra-red data link. Both the Reflex GYRO and the EZ-AQ tools worked effectively.
In general, very minor dip deflections were recorded in both the Stage 1 and Stage 2 drillholes.
Azimuth deviation was typically less than 5 degrees for all holes, but for a number of deep holes
deviation could range up to 10 degrees over 300 m.
10.6 Drilling Logistics and Procedures
Drill access on Songwe Hill was via a network of roads constructed for that purpose. Water for
drilling was supplied from a borehole at the Songwe Hill exploration camp site. Water was
pumped from the borehole into a 30,000 litre aqua-dam at the base of Songwe Hill and then
pumped through heavy-duty pipes to a second 30,000 litre aqua-dam at the top of the Hill and
then gravity fed to the drill rig.
All boreholes were sited by a geologist from Mkango’s exploration team with a handheld
GARMIN GPS unit using UTM Zone 36S projection and WGS84 Datum. The planned collar
positions were marked with wooden pegs and the azimuth outlined using spray paint. Prior to
drilling, the alignment of the rig was checked by the site geologist to ensure correct rig setup. The
inclination was measured on the derrick using a Brunton compass. Azimuths were checked by the
geologist using a compass clinometer corrected for local magnetic declination. After the
completion of each drilling programme all holes were re-surveyed using DGPS equipment.
Drilling was monitored on a continuous basis by Mkango geologists to ensure maximum
recovery. Core was obtained using wire-line methods and was washed by a member of the drill
crew prior to placement in a steel core tray. Core trays were labelled in advance with the borehole
name and box number and placed near the drill rig, Drill core was consistently packed left to
right, pointing down hole, in each tray. Plastic depth marker blocks were inserted at the end of
every run and the actual drill depth, according to the number of rods in the ground, and the
length of the recovered core were recorded on the depth blocks. Detailed core recovery
measurements were completed by the site geologist before the trays were transferred to the
exploration camp.
Filled core trays were removed from the drill site twice a day under the supervision of the site
geologist. Trays were covered with blankets and then secured by straps with ratchets in Mkango’s
pick-up truck and transported to the exploration camp site.
Following completion of the holes, drill collars were capped and marked with a concrete slab with
the relevant information recorded on a metal plate (Figure 10 3Figure 10 3).

J2897 Mkango Songwe Hill PFS November 2014 Page: 96
Figure 10-3
Examples of borehole beacon
Source: Swinden and Reichardt (2012)
10.7 Results of Drilling
10.7.1 Drill Objectives
The Stage 1 drill programme was successful in confirming the presence of REE mineralization first
outlined by the JICA and MMAJ work. Eleven of the thirteen holes intersected significant zones of
rare earth mineralization. Having confirmed the presence of the mineralization, the Stage 1
drilling was expanded to areas not previously tested and demonstrated the extension of rare
earth mineralization both laterally and vertically.
The Stage 2 drilling focused on expanding the area of known mineralization, infilling between
existing holes and testing the mineralization at depth. All boreholes intersected REE
mineralization and the maximum depth at which REE mineralization was encountered was 350 m
below the surface of the hill.
Table 10 2Table 10 2 and Table 10 3Table 10 3 summarize significant intersections from the Stage
1 and Stage 2 drilling campaigns.
10.7.2 Mineralized Lithologies
The drilling demonstrated that the mineralized body at Songwe Hill is geologically complex. It is
best interpreted as a carbonatite plug that has intruded and partially assimilated a carapace of
fenite. The explosive nature of the intrusion is demonstrated by the widespread occurrence of
carbonatite and fenite breccias. The following 3 lithological domains were used to guide the
Mineral Resource Estimate.

J2897 Mkango Songwe Hill PFS November 2014 Page: 97
10.7.2.1 Carbonatite
Carbonatite is the dominant lithology, ranges from grey to black in colour and hosts the bulk of
the mineralization. Assay data show that the carbonatite is widely and uniformly mineralized.
Mineralogical observations suggest that the mineralization is dominantly hosted by synchysite
and apatite. The latter is generally anomalously rich in heavy rare earths compared to apatites in
many other carbonatite complexes. This feature is interpreted to be the result of sub-solidus
hydrothermal redistribution of the REE during the final stages of the evolution of the carbonatite
body.
10.7.2.2 Fenite
Fenite is present throughout the carbonatite body and is intimately intermixed with the
carbonatite. The fenites comprise dominantly potassium feldspar and are interpreted to have
formed through metasomatism related to the intrusion of the carbonatite, although fenitization
related to intrusion of the earlier nepheline syenites cannot be ruled out. At least some of the
fenites are interpreted to be blocks stoped into the carbonatite magma. The fenites are variably
carbonatized and mineralization in the fenite appears to be related to the degree of
carbonatization, In other words, relatively pure fenites typically do not contain significant REE
concentrations, while increasingly carbonatized fenites carry anomalous quantities of REE.
10.7.2.3 Mixed Lithologies
The mixed lithologies form a relatively small part of the Songwe Hill Mineral Resource. They
include breccias with carbonatite and fenite components, as well as finely intermixed carbonatite
and fenite that cannot be separated into distinct units and correlated at the scale of mapping. The
mixed geological domain tends to carry similar amounts of TREO to the carbonatite and fenite,
but tends to be lower in overall HREO.
10.7.3 Orientation and Spatial Distribution of Mineralization
The orientation of mineralization at Songwe Hill is not yet well constrained because of the limited
understanding of the geometry of the carbonatite intrusion and related lithologies. The
mineralized body is a carbonatite plug which is part of a larger volcanic vent system and has
incorporated variable amounts of surrounding lithologies. The mineralization appears to be the
result of hydrothermal processes that acted within the carbonatite as well as in the related
lithologies (fenite, breccia) and produced a relatively uniformly mineralized body. As such, the
mineralization does not have a well-defined strike or geometric shape although the drilling
suggests that in plan view, it is elongate in a NE-SW direction. Mineralization remains untested by
drilling beyond the NE and SW extent of the current drill sections (Figure 10 2Figure 10 2) as well
as at depth (e.g. Figure 7 4Figure 7 4). Structural observations in the drill core suggest that
contacts and other fabrics are very steep and this supports the interpretation that the overall
contacts of the body may be sub-vertical and the carbonatite body may, therefore, extend to
considerable depths below the surface. However, the overall geometry is not well enough
constrained to allow a determination of the extent to which intersections represent true width.

J2897 Mkango Songwe Hill PFS November 2014 Page: 98
Table 10-2
Summary of Significant Mineralized Intersections from Stage 1 drilling campaign
Carbonatite Domain
Drill Hole From To Interval La2O3 Ce2O3 Pr2O3 Nd2O3 Sm2O3 Eu2O3 Gd2O3 Tb2O3 Dy2O3 Y2O3 Other1 TREO
2 % HREO
3
m m m ppm ppm ppm ppm ppm ppm ppm ppm ppm ppm ppm % + Y2O3
PX001 2.4 302.2 299.8 2,464 4,539 474 1,593 237 71 172 22 100 460 85 1.0 8.9
including 184.83 302.2 117.4 3,743 7,037 736 2,478 355 102 241 31 143 710 128 1.6 8.6
225.6 262.1 36.5 4,287 8,515 911 3,145 449 128 298 38 176 893 179 1.9 8.9
268.0 290.7 22.7 3,481 7,581 849 2,960 452 130 293 41 192 1,066 215 1.7 11.1
PX003 3.5 61.2 57.7(i) 11,773 17,145 1,727 5,179 606 152 357 44 198 844 161 3.8 4.6
including 3.5 23.2 19.7 10,987 16,016 1,607 4,803 543 134 309 38 173 751 145 3.6 4.4
23.2 30.6 7.4(ii)
20,290 29,449 2,945 8,761 1,058 272 650 82 383 1,717 333 6.6 5.2
30.6 50.0 19.4 9,735 14,375 1,472 4,475 527 131 303 36 158 645 120 3.2 4.4
50.0 58.0 8.0(iii)
12,851 17,948 1,751 5,162 606 153 366 46 203 823 156 4.0 4.4
58.0 61.2 3.2 6,777 10,466 1,115 3,466 428 110 269 35 157 646 119 2.4 5.7
PX004 14.6 42.0 27.2(iv)
4,630 8,988 1,033 3,562 513 149 381 51 249 1,117 324 2.1 10.4
78.0 117.8 39.8 7,438 10,953 1,065 3,261 389 103 249 30 133 585 122 2.4 5.0
PX005 2.5 102 99.53(v)
2,393 4,399 476 1,609 230 62 157 21 104 484 97 1.0 9.2
including 2.5 30.9 28.5(v)
2,695 5,231 581 2,000 285 78 206 29 163 804 164 1.2 11.8
34.4 70.0 35.6 2,670 5,069 566 1,953 285 75 192 24 118 522 104 1.2 8.9
PX009 2.3 116.2 113.9(vii)
4,762 8,320 847 2,860 399 108 246 28 125 590 107 1.8 6.5
including 37.0 51.9 14.9 5,881 9,938 982 3,236 417 113 261 31 154 754 134 2.2 6.6
68.3 110.2 41.9 (viii)
5,775 9,997 1,015 3,380 465 120 254 23 81 246 56 2.1 3.6
PX011 1.32 86.2 84.9(ix)
2,081 4,359 524 1,894 314 89 224 27 130 631 110 1.0 11.7
including 1.3 29.0 27.7 (x)
3,068 6,219 726 2,555 386 106 262 32 151 738 129 1.4 9.9
PX012 2.1 91.8 89.7 3,764 7,273 811 2,771 394 103 245 30 142 697 123 1.6 8.2
including 22.0 79.0 57.0 4,538 8,537 934 3,127 422 110 260 32 153 731 129 1.9 7.5
PX023 2.0 11.0 9.0 2,346 4,632 485 1,660 250 71 180 25 126 604 107 1.0 10.6
29.0 41.0 12.0 2,058 4,477 493 1,724 249 68 166 21 103 463 85 1.0 9.1
54.4 60.4 6.0 2,772 5,717 608 2,069 286 78 188 24 120 585 105 1.3 8.8
PX024 2.0 91.0 89.0 (xi) 3,412 6,576 724 2,442 386 103 237 29 141 722 123 1.5 9.1
including 13.0 23.0 10.0 7,381 11,465 1,132 3,516 590 167 390 48 224 1,072 185 2.6 8.0
PX027 43 101.8 58.75 3,397 7,078 784 2,712 374 99 231 28 136 606 112 1.6 7.8
80.0 98.7 18.7 4,575 9,723 1,090 3,842 516 130 295 34 155 689 125 2.1 6.7
170.0 188.3 18.3 3,811 6,778 725 2,478 359 92 202 22 95 390 69 1.5 5.8
PX031 68.0 81.0 13.00 2,828 6,009 665 2,414 338 96 230 29 151 705 126 1.4 9.8
Fenite Domain
PX004 42.0 66.0 24.0 (xiii)
1,805 3,653 424 1,469 218 64 165 22 112 533 109 0.9 11.7
PX005 116.0 173.0 57.0 4,340 7,553 747 2,335 311 83 185 22 90 426 90 1.6 5.5
Note: P.T.O.

J2897 Mkango Songwe Hill PFS November 2014 Page: 99
(i) Includes 1m cavity not sampled in addition to a cumulative 14.4 m with core returns < 90 %. If the latter is excluded average grade is 3.3 %
(ii) Poor core returns. Peak value 11.5 % TREO
(iii) Poor core returns. Includes 1 m cavity not sampled
(iv) Includes 4.5 m cavity not sampled in addition to a cumulative 13 m with core returns <90 %. If the latter is excluded average grade is 1.6 %
(v) Includes 5m cavity not sampled
(vi) Poor core returns. Borehole ends in solid core grading 3.3 % TREO
(vii) Includes a cumulative 26 m with core returns < 90 %. If this is excluded there is no major impact on the grade
(viii) Includes a cumulative 11 m with core returns < 90 %. If this is excluded there is no major impact on the grade
(ix) Includes 3 m cavity not sampled in addition to a cumulative 9 m with core returns < 90 %. If this is excluded there is no major impact on the grade
(x) Includes 3 m cavity not sampled in addition to a cumulative 8 m with core returns < 90 %
(xi) Includes 0.9m cavity not sampled in addition to a cumulative 18 m with core returns < 90 %. If this is excluded average grade is 1.4 %
(xiii) Includes 0.50 m cavity not sampled
1Other comprises Ho2O3, Er2O3, Tm2O3, Yb2O3 and Lu2O3
2 TREO: total rare earth oxides including yttrium
3 HREO defined here as oxides of Eu, Gd, Tb, Dy, Ho, Er, Tm, Yb and Lu
Note: Drill intercepts do not necessarily represent true widths
Source: Mkango (2011)

J2897 Mkango Songwe Hill PFS November 2014 Page: 100
Table 10-3
Summary of Significant Mineralized Intersections from Stage 2 drilling campaign
Carbonatite Domain
Drill Hole From To Interval La2O3 Ce2O3 Pr2O3 Nd2O3 Sm2O3 Eu2O3 Gd2O3 Tb2O3 Dy2O3 Y2O3 Other1 TREO
2 % HREO
3
m m m ppm ppm ppm ppm ppm ppm ppm ppm ppm ppm ppm % + Y2O3
PX007a 51.9 97.3 45.5(i) 3,615 7,916 930 3,392 475 133 312 39 194 847 163 1.8 9.4
PX008 257.0 291.0 34.0 4,108 8,137 900 3,208 457 108 223 22 93 452 77 1.8 5.5
318.9 339.0 20.1 6,002 9,220 912 2,944 378 99 230 29 152 807 152 2.1 7.0
PX013 5.7 72.2 66.5(ii)
6,924 10,801 1,005 2,978 319 85 196 24 117 514 93 2.3 4.5
including 21.1 39.2 18.1 9,950 15,126 1,375 3,980 404 106 236 28 133 593 109 3.2 3.8
44.6 54.8 10.2 12,157 17,333 1,491 4,132 395 102 225 26 114 466 83 3.7 2.8
PX015 20.1 97.8 77.8 2,687 5,048 522 1,793 248 71 183 25 135 652 131 1.1 10.4
including 82.0 92.0 10.0 5,957 8,954 803 2,557 309 88 211 28 136 611 123 2.0 6.1
PX017a 0.00 39.1 39.1 5,353 8,445 846 2,676 373 107 249 32 147 659 134 1.9 7.0
including 0.00 13.5 13.5 11,170 16,233 1,536 4,562 594 165 379 44 190 804 155 3.6 4.8
PX017b 10.4 25.6 15.3 4,825 8,378 903 3,310 507 129 288 29 137 701 129 1.9 7.3
42.3 100.8 58.4 3,780 6,895 746 2,697 379 97 215 23 110 551 109 1.6 7.1
including 77.3 97.8 20.5 5,213 8,973 927 3,246 424 113 261 31 155 752 149 2.0 7.2
PX018 9.0 56.3 47.3 6,290 10,224 1,028 3,209 420 118 278 31 146 540 98 2.2 5.4
102.8 116.4 13.6 5,608 9,136 941 3,208 487 141 318 37 160 611 111 2.1 6.6
125.6 225.4 99.8 2,745 5,378 603 2,137 303 79 169 18 75 328 63 1.2 6.2
including 125.6 164.3 38.7 3,444 6,490 718 2,569 382 105 228 25 106 442 86 1.5 6.8
236.0 260.2 24.2 2,928 5,421 586 2,032 291 75 163 16 71 343 68 1.2 6.1
PX020 4.2 100.0 95.8 3,918 7,432 795 2,800 409 110 248 28 127 556 107 1.7 7.1
147.2 195.2 48.0 4,127 6,883 686 2,318 330 89 215 23 101 389 70 1.5 5.8
215.0 347.0 132.0 2,984 5,845 656 2,327 371 103 245 28 124 575 121 1.3 8.9
PX021 5.7 106.5 100.8 3,742 7,295 804 2,894 436 120 274 35 165 792 149 1.7 9.2
117.0 171.0 54.0 3,935 7,380 788 2,726 392 104 220 24 116 508 92 1.6 6.5
184.9 211.5 26.5 2,861 5,817 688 2,551 385 111 254 29 144 703 124 1.4 10.0
PX022a 11.6 73.2 61.7(iii)
2,671 5,933 700 2,700 419 116 258 32 162 774 143 1.4 10.7
including 37.0 68.0 31.0(iii)
3,362 7,274 825 3,068 441 123 281 37 193 930 175 1.7 10.4
88.0 103.7 15.7 3,576 7,919 904 3,394 514 135 296 34 161 731 142 1.8 8.4
PX022b 15.0 347.7 332.7 3,224 6,190 690 2,510 357 96 219 26 124 590 122 1.4 8.3
including 49.1 89.5 40.4 2,776 6,069 719 2,652 381 109 258 34 172 831 162 1.4 11.1
112.5 195.0 82.5 3,901 7,133 768 2,745 385 102 223 25 119 566 122 1.6 7.2
202.0 229.0 27.0 4,363 8,148 856 3,096 414 110 259 32 142 659 135 1.8 7.3
235.5 347.7 112.2 3,627 6,710 741 2,665 370 100 229 27 124 572 124 1.5 7.7
PX025 89.4 117.0 27.6 3,724 7,801 895 3,308 455 124 280 33 159 692 127 1.8 8.0
PX026 163.6 190.1 26.5 2,409 4,702 537 1,919 341 101 249 28 132 544 95 1.1 10.4
243.0 271.9 28.9 3,071 5,753 610 2,140 309 79 171 17 74 316 59 1.3 5.7

J2897 Mkango Songwe Hill PFS November 2014 Page: 101
Carbonatite Domain
Drill Hole From To Interval La2O3 Ce2O3 Pr2O3 Nd2O3 Sm2O3 Eu2O3 Gd2O3 Tb2O3 Dy2O3 Y2O3 Other1 TREO
2 % HREO
3
m m m ppm ppm ppm ppm ppm ppm ppm ppm ppm ppm ppm % + Y2O3
PX028 21.35 145.0 123.7 5,191 8,309 823 2,711 365 99 234 27 116 475 86 1.8 5.6
40.3 108.0 67.7 6,668 10,344 1,018 3,337 437 116 265 30 130 531 94 2.3 5.1
159.0 188.0 29.0 2,621 5,290 604 2,189 363 106 256 29 138 686 137 1.2 10.9
PX029 4.6 117.3 112.7 4,568 7,728 791 2,621 357 94 212 25 124 548 114 1.7 6.5
including 5.6 30.2 24.6 7,052 10,968 1,054 3,265 398 100 226 26 128 541 114 2.4 4.8
PX032 2.54 167 164.5 2,567 5,021 576 2,024 311 85 205 26 125 630 130 1.2 10.3
including 2.5 48.6 46.1 3,548 6,809 781 2,715 398 108 267 37 188 1,015 217 1.6 11.4
PX033 4.2 101.0 96.8(iv)
4,005 7,004 731 2,539 379 103 247 30 136 596 114 1.6 7.7
including 42.0 84.3 42.3 5,920 9,323 914 2,968 411 110 258 30 132 552 102 2.1 5.7
PX034 89.0 102.2 13.2 9,108 13,724 1,256 3,861 451 120 282 38 192 945 181 3.0 5.8
PX035 0.00 96.3 96.3(v)
3,390 6,589 731 2,570 373 107 254 32 156 741 158 1.5 9.6
including 41.5 66.5 25.0 3,940 7,877 890 3,165 465 130 303 37 176 810 162 1.8 9.0
72.3 95.0 22.7 4,204 8,368 930 3,222 428 121 285 35 160 611 130 1.8 7.3
Mixed Domain
Drill Hole From To Interval La2O3 Ce2O3 Pr2O3 Nd2O3 Sm2O3 Eu2O3 Gd2O3 Tb2O3 Dy2O3 Y2O3 Other1 TREO
2 % HREO
3
m m m ppm ppm ppm ppm ppm ppm ppm ppm ppm ppm ppm % + Y2O3
PX008 26.13 128.1 102.0 3,708 5,949 591 1,839 240 63 148 17 77 380 77 1.3 5.8
PX034 24.0 64.0 40.0 3,312 5,446 521 1,674 223 63 154 20 96 420 80 1.2 6.9
Fenite Domain
Drill Hole From To Interval La2O3 Ce2O3 Pr2O3 Nd2O3 Sm2O3 Eu2O3 Gd2O3 Tb2O3 Dy2O3 Y2O3 Other1 TREO
2 % HREO
3
m m m ppm ppm ppm ppm ppm ppm ppm ppm ppm ppm ppm % + Y2O3
PX006 100.0 130.4 30.4 3,255 7,318 859 3,096 531 154 382 47 217 883 159 1.7 10.9
PX014 142.0 181.1 39.1 4,481 7,605 770 2,535 336 92 222 27 128 534 103 1.7 6.6
PX019 6.1 76.3 70.2 2,457 4,878 533 1,853 269 81 206 30 162 784 156 1.1 12.4
PX016 322.7 363.6 40.9 3,681 7,705 874 3,125 435 121 281 37 191 1,001 223 1.8 10.5
PX034 13.0 24.0 11 5,603 9,145 880 2,837 373 107 272 36 165 638 117 2.0 6.6
155.0 199.9 44.9 4,024 6,669 697 2,354 311 85 210 26 132 580 116 1.5 7.6
241.4 269.0 27.6 2,356 4,603 479 1,663 251 73 186 27 142 663 130 1.1 11.5
Note: (i) Includes two cavities totaling 9.4 m not sampled;
(ii) Includes 5.3 m cavity not sampled;
(iii) Includes 5.7 m cavity not sampled;
(iv) Includes 2.2 m cavity not sampled;
(v) Includes 2.6m cavity not sampled.
1 Other comprises Ho2O3, Er2O3, Tm2O3, Yb2O3 and Lu2O3;
2 TREO: total rare earth oxides including yttrium;
3 HREO defined here as oxides of Eu, Gd, Tb, Dy, Ho, Er, Tm, Yb and Lu. Drill intercepts do not necessarily represent true widths
Source: Mkango (2012)

J2897 Mkango Songwe Hill PFS November 2014 Page: 102
11 SAMPLE PREPARATION, ANALYSES AND SECURITY
Channel sampling and core drilling programmes were carried out in accord with written Standard
Operating Procedures (SOP) developed by MSA and reviewed during site visits. Logging and
sampling procedures described for the drill core were also applied to the channel sampling
program. All core cutting, sampling, bagging and dispatch procedures were undertaken at the
Songwe exploration camp by Mkango personnel.
SOP for geological and geotechnical logging, core splitting and sampling were compiled by MSA
to ensure that the various activities are carried out in a consistent, transparent, auditable and
appropriate manner in accordance with industry standards.
11.1 Sample Preparation
11.1.1 Core Handling
drillcore was placed by the drill crew in pre-labeled steel core trays together with plastic
depth blocks indicating the start and end of each run. A down hole orientation line was
then marked on the core immediately with a red china marker by the site geologist;
geotechnical logging was carried out at the drill site by a geologist who measured the core
from each run to determine the accuracy of the drillers’ recoveries. The core was marked
incrementally every metre with a red china marker perpendicular to the core axis;
core trays were transported twice daily under the supervision of the site geologist to the
core logging and sampling facility at the exploration camp; and
the core trays were laid out at the camp and the tray labels and the metre markings
checked for accuracy by a geologist.
11.1.2 Core Logging
geological logging of the core was carried out using customized logging sheets designed
by MSA. The logging sheets captured the borehole number, collar position, date drilled,
‘from-to’ data, weathering, grain size, colour, dominant rock type, subordinate rock type
and quantity, mineralization, reaction with acid, rock type description and lithological
codes;
the core was logged on paper forms and the logs were subsequently captured in project
specific MS Excel spreadsheets. All original paper drill logs are kept on file;
semi-quantitative geochemical analyses were undertaken by the logging geologist using a
handheld Thermo-Scientific Niton® XLP analyzer. This was used as a guide to areas of
mineralization which are not always easily identified visually;
the magnetic susceptibility and gamma radiation (average reading over 30 seconds) for
each metre of core were measured using a handheld magnetic susceptibility meter (SM30)
and a RadEye Personal Radiation Detector (PRD); and
after core observations and measurements were completed, and prior to splitting, the core
was photographed wet (Figure 11-1) using a hand-held digital camera. The borehole

J2897 Mkango Songwe Hill PFS November 2014 Page: 103
number and interval of each core tray are clearly marked and each tray was photographed
separately
Figure 11-1
Examples of drillcore marking before and after core splitting
Source: Brady (2012)
11.1.3 Core Sampling
The entire length of each borehole was sampled for chemical analyses. Core was generally
sampled in 1 metre long intervals. Where a change of lithology occurred within the
sampling interval, then each lithology was sampled separately, using a minimum and
maximum core length of 20 cm and 130 cm, respectively. A black line marked the start and
end of each sample interval.
The sampling interval and a unique, sequential sample number (from sample ticket book)
were clearly marked by the logging geologist above the red orientation line and below the

J2897 Mkango Songwe Hill PFS November 2014 Page: 104
core cutting line. The core cutting line (yellow china marker) was marked on the core below
and parallel to the red core orientation line. Sample numbers were marked with pink
permanent marker on each individual piece of core.
The sample ticket number for each interval was recorded in the sampling sheet prior to
sampling. The borehole number and the sampled interval were also recorded on the stub
of the sample ticket book.
The core was cut in half using a commercial core cutter with a 2.2 mm wide diamond
cutting blade. If any part of the core was friable or difficult to handle it was taped with
masking tape prior to cutting. Once sawn, both halves of the core were returned to the core
tray. After each sample, the saw blade was cleaned with water. The upper half of the core
was used for sampling and the lower half of the core retained in the core tray (Figure 11-1)
for future reference or additional test work.
Each sample was double bagged with two sample number tags in extra strength plastic
sample bags. The sample and the number tag were first placed in a pre-labeled sample bag
and securely sealed a with cable tie. This bag was then placed in a second plastic bag along
with the corresponding sample number tag and closed with a stapler.
Core that had been logged, cut and sampled was stored in locked and secure, company-
owned, storage containers at the Songwe Hill exploration camp (Figure 11-2).

J2897 Mkango Songwe Hill PFS November 2014 Page: 105
Figure 11-2
Core logging and core tray storage facilities
Source: Brady and Reichhardt (2012)
11.1.4 Density measurements
Rock density measurements using the Archimedes principle (dry & wet mass and water
displacement) were taken for every sample of core, after splitting and sampling. Each sample is
approximately 15 to 20 cm long. The density device comprised a 3 kg electronic scale, below
which a water container was placed. Attached to the balance was a core sample holder used to
immerse core in water in the container. The density method is as follows:
the balance is always reset to 0.00 g before each reading;
place a dry length of core in the core holder and record the mass of the core in air;
fill the container with water to submerge the sample (If the core was weathered it was
wrapped in cling wrap). Mark and maintain the same level of water in the container for each
reading;
determine the mass of the sample under water;
the formula used for calculating the density (specific gravity = SG) is simply:

J2897 Mkango Songwe Hill PFS November 2014 Page: 106
SG = Mass in Air = W
Mass in Air – Mass in Water = V
All information was recorded on density measurement sheets for the core samples. No
measurements were carried out for the channel samples.
The sampling database was maintained at the camp site and regularly transmitted and backed up
at Mkango’s office in Zomba and at the head office in the UK.
11.2 Sample Analyses
11.2.1 Primary Laboratory
Intertek-Genalysis Laboratory (Genalysis) Services Pty Ltd. in Johannesburg, South Africa, and
Perth, Australia, was the primary laboratory for the sample preparation and analysis of drill core
and channel samples. Genalysis is an independent laboratory that performs geochemical analyses
on a commercial basis. Genalysis has no relationship with Mkango other than the provision of
analytical services for fee.
Samples were prepared at Genalysis in Johannesburg prior to chemical analyses in Perth, using
the following procedures:
samples were weighed, checked and job registered on the laboratory information
management system (LIMS). Any discrepancies between the samples received and the
sample submission sheets were conveyed to Mkango and resolved immediately;
after weighing of the samples, if required, the material was dried in a drying oven at 110°C
for 8 hours
the samples were then crushed in a jaw crusher. If a sample was >3 kg it was split through a
riffle splitter to provide a 1.5 kg sub-sample. If the material was <3 kg then the entire
sample was used;
the samples were milled and pulverized in a swing mill to 85 % passing 75 micron; and
a portion of 150 g was split from the pulp material and submitted to Perth for assays.
The samples were analysed in Perth using digestion method FP6 and Inductively Coupled Plasma
Mass Spectrometry (ICP-MS) and Inductively Coupled Plasma Optical Emission Spectrometry
(ICP-OES). The FP6 fusion digest ensures complete dissolution of the sample including the
refractory mineral component. Each sample is weighed at 0.25 g, mixed with an alkaline flux
(Na2O2) and placed in a nickel crucible. This is fused in a muffle with precautions to retain sulphur
and the fusion product is dissolved in hydrogen chloride (HCl). Once digestion is accomplished
the sample is diluted appropriately and analysed with an ICP-MS, ideally suited to the analysis of
trace elements in the ppm or ppb range.
For major element analysis, once digestion is accomplished, the sample is diluted appropriately
and read on the ICP-OES. Calibration is effected using standard solutions of known concentration.
Corrections are made, where applicable, for emission line overlaps and scattered light and the

J2897 Mkango Songwe Hill PFS November 2014 Page: 107
overall dilution and catch weights used in the digestion process. Internal standards are used to
correct for drift, viscosity effects and plasma fluctuations.
Genalysis is accredited by The National Association of Testing Authorities Australia (NATA) to
operate in accordance with ISO/IEC 17025, which includes the management requirements of ISO
9001: 2000. The Perth facility is accredited in the field of Chemical Testing for the tests shown in
the Scope of Accreditation issued by NATA (Date of Accreditation: 20 September 1991).
The analytical results were e-mailed to Mkango in MS Excel format followed by the issuing of
signed assay certificates in pdf format.
11.2.2 Umpire Laboratory
Activation Laboratories (Actlabs) in Ancaster, Ontario, Canada was selected as the umpire
laboratory. Actlabs is an independent laboratory that performs geochemical analyses on a
commercial basis. Actlabs has no relationship with Mkango other than the provision of analytical
services for fee.
Pulps split from the original samples were provided to Actlabs directly from Genalysis. Actlabs’
digestion involved a lithium metaborate / tetraborate fusion with subsequent analysis by ICP and
ICP-MS (Code 8-REE Assay Package Major Elements Fusion ICP (WRA) / Trace Elements Fusion
ICP-MS (WRA4B2/OE)). Mass balance was required as an additional quality control technique to
ensure elemental totals of the oxides between 98 % and 101%. If samples contained > 0.3 %
Nb2O5 then the ICP-MS technique was replaced by fusion XRF for Nb2O5 because ICP-MS results
tend to be very low as a result of the Nb falling out of solution.
Actlabs quality system is accredited to international quality standards through the International
Organization for Standardization / International Electrotechnical Commission (ISO/IEC) 17025,
which includes ISO 9001 and ISO 9002 specifications, with CAN-P-1758 (Forensics), CAN-P-1579
(Mineral Analysis) and CAN-P-1585 (Environmental) for specific registered tests by the Standards
Council of Canada (SCC). Actlabs is also accredited by the National Environmental Laboratory
Accreditation Conference (NELAC) program and Health Canada.
The analytical results were e-mailed to Mkango in MS Excel format followed by the issuing of
signed assay certificates in pdf format.
11.3 Sample Security and Dispatch
Strict security protocols were employed for the handling of samples. All samples were prepared
and transported in such a manner that a secure and auditable chain-of-custody from the field to
the laboratory was ensured according to the following procedures:
once an entire hole was sampled, the bagged and securely closed samples were placed in
woven PVC bags, approximately 10 samples per bag. The drill-hole number and
corresponding sample numbers were recorded on the exterior of each bag. The bags were
then stored inside locked and secured, company-owned, storage containers at the
exploration camp until dispatchment;

J2897 Mkango Songwe Hill PFS November 2014 Page: 108
all samples submitted for analysis were accompanied by standard sample submission
documents carrying sample details and analytical instructions;
the woven bags were transported by road using a contract commercial carrier to the
company office in Zomba. Samples were physically accompanied from the exploration
camp to Zomba by a senior geologist from Mkango’s exploration team;
upon receipt at Mkango’s office in Zomba, samples were inspected, weighed and sealed by
a senior geologist of the Malawian Geological Survey Department. A certificate of
inspection which was signed by the Director of the Malawian Geological Survey or his
representative was prepared and issued. The certificate of inspection contains the name of
rocks, EPL certificate number, total number and weight of samples inspected, estimated
sample value, port of exit and name and address of the consignee;
samples were then delivered by a senior Mkango geologist to SDV Malawi Ltd (SDV) in
Blantyre for shipment by commercial carrier South African Airlines (SAA) to Genalysis in
Johannesburg, South Africa. Samples were weighed by SDV and compared with the weights
supplied by the company. In most cases, sample transport was timed so that samples
proceeded directly from camp to Zomba and then to the carrier. In rare instances, where
SDV was unable to receive the samples the same day, the bags were stored in a secure,
locked room at Mkango’s offices in Zomba until they could be delivered to SDV;
SDV was responsible for the shipment and tracking of the samples from Malawi to
Genalysis in Johannesburg, South Africa. All shipping paperwork was sent to Mkango
personnel and once shipment was confirmed by SDV, notification along with sample
submission sheets were emailed to Genalysis; and
when the sample batches were received by Genalysis, the sample numbers were checked,
recorded and a job number assigned on the LIMS. Sample receipt verification was then e-
mailed to Mkango staff, including the principal geologist. Following sample preparation,
the samples were couriered by Genalysis to their analytical facilities in Perth, Australia
11.4 Quality Assurance and Quality Control
Appropriate quality assurance and quality control (QA/QC) monitoring is a critical aspect of the
sampling and assaying process in any exploration programme. Monitoring the quality of
laboratory analyses is fundamental to ensuring the highest degree of confidence in the analytical
data and providing the necessary confidence to make informed decisions when interpreting all
the available information. Quality assurance (QA) may be defined as information collected to
demonstrate that the data used further in the Project are valid. Quality control (QC) comprises
procedures designed to maintain a desired level of quality in the assay database. Effectively
applied, QC leads to identification and corrections of errors or changes in procedures that
improve overall data quality. Appropriate documentation of QC measures and regular scrutiny of
quality control data are important as a safeguard for project data and form the basis for the
quality assurance program implemented during exploration.

J2897 Mkango Songwe Hill PFS November 2014 Page: 109
In order to ensure quality standards are met and maintained, planning and implementation of a
range of external quality control measures is required. Such measures are essential for minimizing
uncertainty and improving the integrity of the assay database and are aimed to provide:
an integrity check on the reliability of the data;
quantification of accuracy and precision;
confidence in the sample and assay database; and
the necessary documentation to support database validation.
Mkango adopted an industry standard QA/QC program and inserted Certified Reference Material
(CRM) and blanks each at a frequency of 1 in 20 (5 %) into the batches prior to submission to
Genalysis. These control samples were inserted as part of a continuous sample number sequence
and the QA/QC samples were not obviously different from routine samples after the pulverization
process. In order to create the required 5% duplicate samples, Genalysis were requested in the
sample submission sheet to split the pulp of predetermined samples (1 in 20) and insert the
material into empty and pre-numbered bags, supplied by Mkango together with the other
samples. Genalysis in Perth were unaware which samples were QA/QC samples and what their
composition was. This allowed for monitoring of the sample preparation procedure as well as
monitoring the accuracy and precision of analyses.
An additional 5 % of the total samples were couriered by Genalysis to the umpire laboratory
Actlabs in Canada. Hence the overall number of control samples constituted approximately 20%
of the samples analysed which is in line with best practice procedures to ensure integrity of data
and is independent from the internal QA/QC methods applied by the laboratory.
Gaps in the sample sequence were left for standards, blanks and duplicates in the course of the
sampling and bagging process conducted at the Songwe camp. The standards and blanks were
only packed after the main sampling process was completed to minimize the possibility that
sample numbers are inadvertently swapped between routine and control samples.
11.4.1 Blanks
To monitor inadvertent contamination of samples, a blank sample containing negligible REE
concentrations was included in every batch of 20 samples. The blank sample material used during
the Stage 1 drill programme was REE-barren Magaliesberg quartzite chips. During the Stage 2
campaign AMIS0305 from African Mineral Standards (AMIS) and Magaliesberg quartzite were
used. The blanks were inserted into the sample stream with a normal, sequential sample number.
Slightly elevated REE concentrations in 4 blank samples from 4 separate batches were queried
with Genalysis which re-analysed the samples with acceptable results. No further action was taken
or required and the results of the blank analyses are interpreted to indicate that there was no
contamination or systematic analytical issues during the period of sample submission and
analyses.

J2897 Mkango Songwe Hill PFS November 2014 Page: 110
11.4.2 Certified Reference Material
For independent assessment of the accuracy of laboratory analyses, certified reference materials
were inserted using a frequency of 5 % (1 in 20). Each CRM was assigned a sample number within
the normal sample sequence. CRMs comprised AMIS0185 and SARM 40 during the Stage 1
programme and AMIS0185 and Geostats GRE-04 during the Stage 2 campaign. The performance
of the CRMs during the two Stages is acceptable and occasional values outside the recommended
range have no material effect on the overall data quality. Rare earth elements Tb, Dy, Gd and Y
show a systematic under-reporting for AMIS185 which is not considered critical due to their very
low concentration levels in this light rare earth standard. Representative results from the 2 CRMs
are presented in Appendix 3.
11.4.3 Duplicates
Duplicate samples were not used during the Stage 1 drilling programme. However, they were
inserted during the channel sampling and Stage 2 drilling programmes at a rate of one in every
20 samples (5 % frequency) to assess the precision of the analyses. Duplicates were placed as an
empty numbered bag into the sample stream. Samples were split at the laboratory following
pulverization and the pulp of the sub-sample was inserted in the empty sample bag. The
instructions on the sample submission sheet to Genalysis specified which samples were to be split
for duplicates.
The duplicates indicate a very high level of precision except for 3 duplicate pairs where the
problem was traced to a sample number issue at the laboratory. Genalysis re-analysed these
samples with acceptable results and no further action was taken or deemed necessary. A summary
of duplicate results and representative plots are shown in Appendix 3.
11.4.4 Umpire Laboratory Samples
In order to check the quality of analyses from the primary laboratory, a duplicate of the pulps was
sent by Genalysis to Actlabs. Umpire samples were sent at a frequency of approximately 5 %
(1 in 20). The results of these analyses were plotted graphically against the original analysis. In 2
cases the umpire results differed substantially from the primary data and this problem was
subsequently rectified through re-analysis and attributed to a sample mix-up. The vast majority of
samples show a discrepancy between the two laboratories of less than 10% and less than 1 % of
the 405 sample pairs exceeded 20 %. Representative plots of the umpire results are presented in
Appendix 3.
11.5 Adequacy of Sample Preparation, Security and Analytical Procedures
All aspects of core handling, marking, logging, cutting, bagging, labeling and sample submission
to Genalysis preparation facilities at Johannesburg are covered by well-designed protocols to
ensure that all routine activities are conducted with maximum consistency and followed industry
standards.
Mkango followed an auditable chain-of-custody which ensured greatest security and integrity of
the results. MSA believes that there was little or no opportunity for an outside agent to temper
with the sample material.

J2897 Mkango Songwe Hill PFS November 2014 Page: 111
MSA is of the opinion that the sampling and analytical procedures and number of QA/QC samples
inserted into the sample stream are appropriate for the current level of the Project, the type of the
deposit and for the analytical techniques used. The CRMs and blanks show acceptable
performance for the elements analysed over the period of the sampling campaign. The duplicate
samples reported acceptable precision for all relevant concentration levels.
The analytical results from the primary and the umpire laboratories show a very good correlation
and therefore confirm the element concentrations determined by the primary laboratory. The
observed negative bias at generally low concentration levels of certain elements of the CRMs is
within acceptable analytical limits and has no effect on the overall adequacy of the data.
The quality control procedures have been effective in demonstrating the quality of the analytical
results and any issues that were identified were quickly dealt with and resolved.
Based on these results, it is concluded that the sampling and assay data from the drilling and
channel sampling programmes are acceptable for use in a Mineral Resource Estimate.
J2897 Mkango Songwe Hill PFS November 2014 Page: 112
12 DATA VERIFICATION
Verification activities were conducted by the Qualified Persons during site visits to the Songwe
Project and at the MSA office and included:
the inspection of the drilling and trenching programs;
the review of core handling and core sampling procedures;
the review of borehole data collection protocols and QA/QC systems;
checks of the database against the original borehole logs;
checks of database against original Assay Certificates; and
the examination of the database used for the Mineral Resource estimation.
Data from duplicates, internal standards, CRMs and blanks were examined on a batch by batch
basis to check for analytical data confidence. Data was examined numerically and graphically to
determine the repeatability of the duplicate analyses, the precision of the standard analyses with
respect to the accepted values, and the levels of REE present in the blanks. MSA undertook audits
on the database and all identified errors were addressed by Mkango’s database manager.
The assay data display industry standard levels of precision and accuracy through the adoption of
a stringent QA/QC program. The database has therefore been declared in the opinion of MSA and
the authors as an accurate representation of the original data collected and to meet the
requirements for use in a Mineral Resource estimation.
Overall MSA and the authors are of the opinion that all exploration activities have been
conducted and recorded in an appropriate manner and that all analytical issues have been
identified and suitable remedial action taken. Industry standard practices have been followed and
the quality of the Project database meets or exceeds NI 43-101 standards and CIM best practice
guidelines.

J2897 Mkango Songwe Hill PFS November 2014 Page: 113
13 MINERAL PROCESSING AND METALLURGICAL TESTING
13.1 Introduction
Most rare earth projects follow a three stage metallurgical process of:
beneficiation – crushing and grinding (comminution) of the run of mine (ROM) ore
followed by physical techniques to separate and upgrade the rare earth host minerals by
rejecting the gangue minerals. Techniques used include gravity separation, magnetic
separation and froth flotation;
hydrometallurgical recovery – comprising of chemical dissolution of the rare earth host
minerals using acidic or alkaline processing steps often at elevated temperatures. This is
followed by purification steps in order to remove the unwanted elements that dissolved
along with the rare earths during the dissolution step. The resultant solution can either be
fed directly to a separation stage if this is located on site or precipitated to give a high
purity, mixed rare earth chemical concentrate that will be transported to a remotely located
separation facility; and
separation – the separation of the individual or groups of rare earths into saleable products
as determined by the particular end users. Methods typically include selective oxidation
and solvent extraction (SX).
The first two stages tend to vary significantly across different projects, largely due to the highly
variable mineralogy of rare earth deposits. It is thus essential that appropriate time and resources
be devoted to understanding the mineralogy in order to guide the development of the
beneficiation and hydrometallurgy phases.
The scope of the PFS encompasses the beneficiation and hydrometallurgical stages.
13.2 Metallurgical Testwork Samples
Metallurgical testwork has been undertaken exclusively on diamond drill core samples.
Table 13-1 outlines the drill core samples that were used across the entire testwork program. The
locations of the collars are shown on Figure 13-1. Subsample composites were used for specific
test programs and these are noted within the descriptions for each program.

J2897 Mkango Songwe Hill PFS November 2014 Page: 114
Table 13-1
Drill core samples used for testwork
Drill Hole No. Sampled Interval (m) Sampled Length (m)
PX001 218.0 - 300.0 82.0
PX003 2.2 – 59.0 56.8
PX005 2.0 – 64.0 62.0
PX009 0.0 – 116.2 116.2
PX012 2.1 – 91.0 88.9
PX013 6.8 – 52.8 46.0
PX015 22.3 – 97.8 75.5
PX021 41.0 – 105.0 64.0
123.1 – 204.0 80.9
PX022b 119.0 – 186.1 67.1
200.0 – 295.0 95.0
PX033 4.2 – 95.7 91.5
PX035 0.0 – 95.3 95.3
Figure 13-1
Location of drill holes used for metallurgical testwork

J2897 Mkango Songwe Hill PFS November 2014 Page: 115
The composites used for metallurgical testwork are considered to be representative and typical of
the mineral deposit as a whole.
13.3 Mineralogy
In order to obtain a detailed understanding of the REE host and gangue minerals present at
Songwe Hill, a comprehensive mineralogical study was undertaken by Mkango utilizing
techniques including X-ray diffraction (XRD), QEMSCAN (quantitative evaluation of materials by
scanning electron microscopy), electron microprobe analysis (EMPA), scanning electron
microscopy (SEM), and laser ablation – inductively coupled plasma - mass spectrometry (LA-ICP-
MS).
The study confirmed that the REE mineral assemblage at Songwe, regardless of rock type, is
dominated by the fluorocarbonate mineral synchysite (with very minor parasite occurrences) and
the phosphate mineral apatite with minor occurrences of florencite. Overall, the REE host minerals
account for around 6 % to 7 % of the mass of the sample. It was also noted that the heavy rare
earth elements (HREE), europium to lutetium, are localised more within the apatite rather than the
synchysite. The gangue minerals content consists mainly of the carbonates ankerite and calcite
with minor occurrences of iron oxides and K-feldspar. Typical mineral occurrences are given in
Table 13-1. For further detailed mineralogical information see Section 7.3.4.
Table 13-2
Typical Mineralogy of Songwe Hill
Mineral Formula Mass*
Calcite CaCO3 Major
Ankerite Ca(Fe,Mg,Mn)(CO3)2 Intermediate
Apatite Ca5(PO4)3(F,Cl,OH) Minor
Synchysite CaCO3.CeFCO3 Minor
Feldspar KAlSi3O8 Minor
Mica KAl2(Si3Al)O10(OH,F)2 Minor
Note: * predominant (>50 mass%), major (25-50 mass%), intermediate (15-25 mass%), minor (5-15 mass%),
trace (< 5 mass%). REE host minerals shown in bold.
13.3.1 Mineral associations
Apatite is mainly associated with ankerite and calcite and to a lesser degree with K-feldspar, iron
oxides and strontianite. Synchysite/parisite is mainly associated with calcite followed by ankerite
and to a lesser degree with strontianite and barite. Florencite and a mixture of intergrown
apatite/florencite, although very poorly liberated, have a strong association with other REE host
minerals. Some of these associations are evident in Figure 13-2.

J2897 Mkango Songwe Hill PFS November 2014 Page: 116
Figure 13-2
BSE image of fine acicular synchysite in a screened -1.7 mm sample
13.4 Metallurgical Testing
13.4.1 Background
Metallurgical testing commenced at Mintek in South Africa in 2012 and at Nagrom in Western
Australia in 2013. Both organisations are well regarded as experts in the field of mineral
processing, hydrometallurgy and associated testwork with experience in rare earths.
The primary objective of the testwork carried out at Mintek has been to develop a beneficiation
flowsheet to concentrate and maximize recovery of the principal rare earth element bearing
minerals, synchysite and apatite. Synchysite is a fluorocarbonate mineral in the same mineral
group as bastnäsite the principal ore mineral in several REE deposits. Some initial leach testwork
on whole of ore was also undertaken by Mintek at this time. Later work by Mintek (2014) included
the determination of comminution characteristics of the ore.
Nagrom was engaged to undertake hydrometallurgical testwork under the direction of a specialist
rare earth metallurgist, Mr Gavin Beer. The focus was to develop a robust hydrometallurgical
flowsheet that maximised rare earth recovery whilst minimising reagent costs.
13.4.2 Comminution
As part of the Pre-feasibility Study, Mintek was tasked with completing bench scale comminution
test work in order to provide, engineering data for the plant design and costing. The tests

J2897 Mkango Songwe Hill PFS November 2014 Page: 117
conducted were SAG mill comminution (SMC), Bond abrasion index (AI), Bond rod work index
(BRWI) and Bond ball work index (BBWI).
13.4.2.1 Sample Preparation
Quarter NQ drill core samples were chosen from diamond drill holes PX015, PX021, PX022b,
PX033 and PX035.
After selecting material for SMC testing from the main composite sample, each sub-sample was
individually staged crushed to 100 per cent passing 1.7 mm. The first stage involved crushing to
100 per cent passing 20 mm. After individual crushing to 100 per cent passing 20 mm, a single
characteristic composite sample of 50 kg was made up from individual 16 sub-samples for bench
scale comminution test work. The entire 50 kg composite sub-sample was screened at 12 mm to
produce material of -20+12 mm for Bond abrasion index test. Material retained on this size range
was blended and a characteristic 10 kg was extracted for Bond abrasion index test. The remaining
40 kg was crushed to 100 per cent passing 13.2 mm. 20 kg of material at 100 per cent passing
13.2 mm was sub-sampled for Bond rod work index test. The remaining 20 kg was further crushed
down to 100 per cent passing 3.35 mm for two Bond ball work index tests.
13.4.2.2 SAG Mill Comminution (SMC) Test
The SMC test was developed as a lower cost precision technique to determine the impact
breakage characteristics of ores. The SMC test generates a Drop weight index (DWI), which is a
measure of the rock strength when broken under impact. The SMC test uses the same device as
the JK-Tech drop weight testing.
Figure 13-3
JK Tech Drop weight testing machine
The parameters obtained from the testing are used in the JK SAG mill models to predict
throughput, power draw and product size distribution with the aid of their database of
information on the performance of continuously fed pilot and production scale mills.

J2897 Mkango Songwe Hill PFS November 2014 Page: 118
The SMC test was performed at Mintek in accordance with the procedure specified by JK Tech.
The cut-core method was utilised as opposed to broken rock method. After completion of the
test, the data was submitted to JK Tech for analysis. Test results for the SMC are summarised in
Table 13-3. Typical classification of ore hardness on the basis of A*b parameter is presented in
Table 13-4.
A useful indicator of the resistance to impact breakage is given by a product of the two
parameters (i.e. A*b); the smaller the value of A*b, the higher the resistance to impact breakage.
The A*b value for Songwe REE ore sample was found to be 31.7. This result indicates that in terms
of A*b, the ore sample could be classified as being hard ore with high resistance to impact
breakage.
Table 13-3
SMC test results
Sample ID DWi DWi Mia Mih Mic A b A*b
kWh/m3 % kWh/t kWh/t kWh/t
Songwe REE 9.75 90 23 18.3 9.5 85.7 0.37 31.7
Table 13-4
Classification of ore hardness in terms of A*b parameter
Hardest 10 % (A*b range ~ 0 – 28) Very Hard
10 % to 30 % (A*b range ~ 28 to 37) Hard
30 % to 40 % (A*b range ~ 37 to 41) Moderately Hard
40 % to 60 % (A*b range ~ 41 to 54) Medium
60 % to 70 % (A*b range ~ 54 to 63) Moderately Soft
70 % to 90 % (A*b range ~ 63 to 116) Soft
90 % to 100 % (A*b range ~ 116 and greater) Very Soft
13.4.2.3 Bond Abrasion Index (Ai) Test
The Bond abrasion index test is used to obtain an indication of the relative abrasiveness of an ore
on a standard metal sample. A flat paddle 76 mm x 25 mm x 6 mm of chrome-nickel-
molybdenum steel hardened to 500 Brinell is inserted into an impeller or rotor that is 108 mm in
diameter, which rotates on a horizontal shaft at 632 rpm through falling ore particles. Part of the
paddle surface is exposed to wear or abrasion and the paddle tip has a linear speed of 7.16 m/s,
sufficient for good impact blow. The impeller is enclosed by a concentric drum 305 mm in
diameter and 108 mm in length, which rotates at 70 rpm (90 % of critical speed), in the same
direction as the paddle. The drum is lined with a perforated steel plate to furnish a rough surface
for continuously elevating the ore particles and showering them through the path of the rotating
paddle. Metal wear is usually the second largest single item of expense in conventional grinding,
and in wet grinding installations it may approach or even exceed the power cost.

J2897 Mkango Songwe Hill PFS November 2014 Page: 119
The Bond abrasion index test was conducted on the ore sample in the -20+12 mm size range. 10
kilograms of material in this size range was prepared and used for testing. Duplicate abrasion
index tests were conducted to measure the abrasiveness of the ore. The test results are given in
Table 13-5.
Table 13-5
Bond abrasion index test results
Sample ID Paddle Mass Paddle Mass Abrasion
Before Test After Test Index
(g) (g) Ai
Songwe REE 92.9928 92.9365 0.0563
Songwe REE 92.9365 92.8782 0.0583
Songwe REE Average 0.0573
Abrasion indices of 0.0563 and 0.0583 were obtained from the two tests conducted with an
average value of 0.0573. It can be seen from the typical classification of ore abrasiveness in terms
of Bond abrasion index presented in Table 13-6, that this ore could be classified as being of low
abrasiveness.
Table 13-6
Typical classification of ore abrasiveness based on Bond abrasion index
Abrasion Index Range Classification
<0.2 Low
0.2 - 0.5 Medium
0.5 - 0.75 Abrasive
0.75 - 1 Very abrasive
>1 Extremely abrasive
13.4.2.4 Bond Rod Work Index (BRWI) Test
The aim of the test is to provide information that will quantify the energy requirements for open
circuit rod milling, it is also used to predict and continually evaluate the performance of
commercial rod mills.
A special tilting Bond rod mill is used for this test with an effective length of 610 mm and an
internal diameter of 305 mm (Figure 13-4). The mill is fitted with a wave-type liner. Feed for the
tests must be prepared by careful stage crushing of ore to produce a feed material with a
maximum mesh size of 13.2 mm and a natural size distribution with minimal fines. The same basic
locked cycle procedure described for the Bond ball mill test is applied to the ore, but at a
circulating load ratio of 100 per cent. A closing screen mesh size should be chosen to yield a
product with a similar 80 per cent passing size to that envisaged for the production plant. For this
scope of work, the test was conducted with a 1.18 mm limiting screen.

J2897 Mkango Songwe Hill PFS November 2014 Page: 120
One standard BRWI test was conducted on the ore at a closing screen size of 1.18 mm. The test
results are summarised in Table 13-7.
Figure 13-4
Batch rod mill grind-ability test equipment
Table 13-7
Results summary for Bond rod work index
Sample ID Limiting Screen
(µm)
F80 (µm) P80
(µm)
Net Production
(g/rev)
Work Index
(kWh/metric ton)
Songwe REE 1180 9528.06 809.43 7.49 15.32
Table 13-8 gives the typical classification of ore hardness in terms of BRWI and BBWI.
Table 13-8
Typical classificaiton of ore hardness based Bond ball and rod work indices
Bond work index (kWh/t) 7 - 9 10 - 14 15 - 20 > 20
Classification Soft Medium Hard Very hard
The BRWI of the ore was found to be 15.32 kWh/t. This indicates that in terms of the typical
classification based on the Bond rod work index, the ore could be characterised as being hard.
13.4.2.5 Bond Ball Work Index (BBWI) Test
The test is aimed at providing useful information for the design of grinding circuits, and in
particular, to estimate the energy requirements for closed circuit ball milling. It is also used to

J2897 Mkango Songwe Hill PFS November 2014 Page: 121
predict and continually evaluate the performance of commercial ball mills. The Bond ball work
index (BBWI) test involves locked cycle dry milling in a ball mill with an inside diameter and length
of 305 x 305 mm, with no lifters, an example of which is shown in Figure 13-5.
A dry locked-cycle standard Bond grind-ability test with several cycles is performed until steady-
state conditions or equilibrium is reached which involves up to about seven cycles.
Figure 13-5
Batch ball mill grind-ability test equipment
The tests are conducted to simulate a circulating load ratio of 250 per cent. The mill is operated at
70 rpm and is equipped with a revolution counter. The ball charge consists of 285 steel balls
weighing 20.125 kg corresponding to a ball charge filling of 19.2 % by volume. For these tests
feed sample must be prepared by careful stage-crushing of ore to produce a feed material with a
maximum mesh size of 3.35 mm ensuring that minimal fines are generated during stage crushing.
A closing screen mesh size should be chosen to yield a product with a similar 80 per cent passing
size to that envisaged for the production plant. For the purpose of this test work two tests were
conducted using 75 and 106 microns limiting screens.
Two BBWI tests were conducted at closing screen sizes of 75 and 106 microns. The test results for
the two closing screens are summarised in Table 13-9.

J2897 Mkango Songwe Hill PFS November 2014 Page: 122
Table 13-9
Results summary for Bond ball work index tests
Sample ID Limiting Screen
(µm)
F80 (µm) P80 (µm) Net Production
(g/rev)
Work Index
(kWh/metric ton)
Songwe REE 75 2580.70 52.02 1.63 10.26
Songwe REE 106 2580.70 76.32 1.95 10.26
The Bond ball work index was found to be 10.26 kWh/t at both closing screen sizes of 75 and 106
microns. It follows from the typical classification of hardness in terms of Bond ball work index that
the ore could be classified as being medium.
13.4.3 Beneficiation
While initial test work tested gravity and magnetic separation, the majority of beneficiation test
work comprised numerous flotation tests encompassing differing conditions in order to identify
the optimal flotation regime.
13.4.3.1 Sample Preparation
Drill core samples PX001, PX003, PX005, PX009, and PX012 were delivered to Mintek, with the
corresponding drill cores weighing 117, 120, 102, 125 and 171 kg, respectively, derived from the
sample intervals in Table 13-1.
An initial composite (Composite A) was made up of equal proportions of PX001, PX003, PX005
and PX012 with PX009 excluded, being from an atypical weathered zone in the deposit.
Following completion of further drilling and availability of further drill core, a second composite
(Composite B) was made up of equal proportions derived from new drill holes PX013, PX022b,
PX021, PX033, PX035, from a combination of PX005 and new drill hole PX015, and from PX012, i.e.
seven equal sub-samples, to further support the test work. The relevant sample intervals are
shown in Table 13-1.
13.4.3.2 Shaking Table Testwork
Shaking table test work was conducted by Mintek on a Wilfley 8-product shaking table to
evaluate the possibility of separating the rare earth minerals from gangue minerals according to
density. The separation process of a shaking table is dependent mainly on the difference in
specific gravity between the minerals and to a lesser degree on the shape and size of the particles.
It was envisaged that the rare earth minerals would separate from the lighter gangue minerals,
largely by gravitational and drag forces encountered on a shaking table.
Tests were conducted on individual ground samples of PX001, PX 003, PX 005, PX 009, and PX 012
at a p80 of -300 µm and an additional test on the PX003 sample at the finer grind size of p80 -
150µm.
For all ore types at a coarser grind, the mass pull ranged between 3 % and 6 %, at corresponding
average REE recovery of 6 %. The higher recoveries were obtained at a higher mass pull. On

J2897 Mkango Songwe Hill PFS November 2014 Page: 123
average, 1.5 times REE upgrade was obtained for all samples thus it was concluded that shaking
table test work was not optimal as an upfront concentration step.
At a finer grind of 80 %-150μm, mass pull, grade and recovery to the shaking table concentrate
were similar to coarse grind results, thus there was no benefit in fine grinding.
13.4.3.3 Magnetic Separation
The main rare earth minerals comprise paramagnetic synchysite in a diamagnetic matrix of
calcite/dolomite, barite and strontianite, hence magnetic separation was attempted on the
premise of differences in magnetic susceptibility. Mintek undertook testwork early on Composite
A at grind sizes of P80 -53 and 38μm but no selectivity was obtained at various magnetic
strengths.
Mass pulled to the magnetic fraction increased with increasing magnetic strength but the overall
REE recovery to this fraction was very poor. This was attributed to poor liberation of synchysite
hence sequential WHIMS test work at higher intensities was conducted at a finer grind of 80 %
-38 μm. There was poor selectivity between the REE and gangue minerals calcite and ankerite.
Iron was seen to upgrade to the magnetic fraction and gave the highest recovery. Recovery trend
of Ca and REE was similar overall showing intricate association between synchysite and calcite.
The lack of susceptibility to upgrade by magnetic separation was subsequently confirmed at
Nagrom.
13.4.3.4 Flotation
An extensive amount of flotation test work has been undertaken at Mintek with later verification
work carried out at Nagrom.
Previous mineralogical work had indicated that the main REE carrier was synchysite but it was
intergrown with calcite and ankerite and intimately associated with apatite, barite and strontianite.
Apatite was demonstrated to be a significant carrier for a large proportion of the heavy REE, Eu
and Y.
Mintek’s initial work on Composite A targeted the selective flotation of apatite given the heavy
rare earth content. Flotation at a coarse grind of 80 % -300 µm using various reagents resulted in
a two-fold upgrade of the REE with relatively low REE recoveries. Similar results were obtained at a
finer grind of 80 % -150 µm on both “as milled” and de-slimed ore feed. Since the majority of the
REE reported to the tails, direct REE flotation was attempted on these tailings using various
reagents after further milling to p80 -15 µm to ensure liberation of synchysite. The rare earth
minerals did not float and low mass pulls were obtained at REE low recoveries.
Apatite flotation tests on the Composite A sample under a range of reagent and grind conditions
showed marginal apatite upgrading with barite, strontianite, calcite and ankerite being major
mineral diluents of the concentrate. REE recoveries were lower than the target and were found to
be mass pull dependent. As it was apparent that apatite was not upgrading, and consequently the
desired REE recovery was not achieved, the mineralogy of the milled (p80 – 150 µm) was
characterized. Fine apatite and synchysite grains were found to be intricately inter-grown within

J2897 Mkango Songwe Hill PFS November 2014 Page: 124
calcite, and were associated with barite, strontianite and ankerite. It was concluded that only fine
milling would liberate the rare earth minerals.
The next phase of the Mintek test work therefore targeted bulk flotation of both synchysite and
apatite, again using Composite A. This was initially to be done at a fine grind of p80 -25µm to
liberate the synchysite, however because flotation at fine grinds poses challenges due to high
slimes content it was decided that scoping work would be conducted at coarser grinds and only
be done at finer grinds if a promising route had been identified. Various reagents such as
succinamates, amines, hydroxamic acids and phosphoric acid esters at different dosages were
used to float apatite and REE associated with it, at different grinds. The possibility of calcite
removal up front using fatty acids while apatite was depressed with phosphoric acid was also
evaluated.
Mintek subsequently completed significant further optimisation test work, a large proportion of
which was completed within the scope of a Mintek research project entitled "Developing
beneficiation procedures for upgrading rare earth minerals from carbonatitic deposits".
This culminated in the results announced by Mkango in July 2013 using a reagent regime and
conditions previously utilised at the Mountain Pass rare earth mine. A mineral concentrate
grading 4.6 % into a mass pull of 25.7 % was produced, giving an approximate 2.6 times upgrade
in rare earth grade was achieved. Individual recoveries for the principal rare earths ranged from
54 % to 70 % as per Table 13-10 below.
Table 13-10
Mintek flotation results on Composite A
Rare Earth Flotation Recovery (%)
Lanthanum 69.6
Cerium 68.2
Praseodymium 66.8
Neodymium 66.0
Samariam 63.4
Europium 62.4
Gadolinium 59.9
Terbium 58.9
Dysprosium 56.1
Yttrium 53.5
Mintek achieved the above results using soda ash, sodium fluorosilicate and lignin sulphonate as
dispersant/depressant system and a fatty acid as a collector. The grind size used was P80 of -
53μm with extended conditioning times and elevated temperatures.
Subsequent work at Mintek focused on repeating the results for the second composite
(Composite B), improving overall recoveries and in particular heavy rare earth recoveries.
Test work showed that Composite B demonstrated similar flotation behaviour and results to
Composite A as summarised in Table 13-11 (Mintek Test 14 – (1)).

J2897 Mkango Songwe Hill PFS November 2014 Page: 125
Furthermore, Mintek found that by increasing sodium carbonate dosages, it was possible to
increase apatite and HREE recoveries to levels similar to LREE recoveries as summarised in Table
13-11 (Mintek Test SV 63). This is potentially due to its role as an apatite activator in the flotation
process whereby increased dosages enhance apatite and therefore HREE recovery to the
concentrate.
In parallel with continued optimisation work at Mintek, Mkango then commenced a number of
confirmatory test work programs at Nagrom in Australia, with a view to demonstrating
repeatability in different laboratories, examining further options for optimisation and producing a
bulk mineral concentrate for hydrometallurgical test work.
Using the same reagent regime as Mintek, similar results were obtained (Nagrom Bulk Test 5), as
summarised in Table 13-11, based on selected results with similar mass pulls.
Table 13-11
Selected flotation results on Composite B
Rare Earth Mintek Flotation
Recovery (%)1
Mintek Flotation
Recovery (%)2
Nagrom Flotation
Recovery (%)3
Lanthanum 67.8 69.1 67.4
Cerium 67.3 68.0 66.5
Praseodymium 66.6 67.5 66.3
Neodymium 66.1 67.5 66.2
Samarium 65.1 67.2 66.4
Europium 64.6 67.7 66.9
Gadolinium 64.3 68.6 68.0
Terbium 62.3 69.3 68.2
Dysprosium 60.9 69.4 67.8
Yttrium 57.6 68.6 67.5
Mass Pull 23.1 24.8 23.9
Note: 1Report 6884 Test 14 (1) 2Report 6884 Test SV63
3Report T1636 – Bulk Test 5
In contrast to Mintek, Nagrom consistently achieved HREE recoveries similar to LREE recoveries
using the same conditions used at Mintek, with the lower sodium carbonate dosages, indicating
that other factors are coming into play, and that base case flotation parameters are not capturing
all of the significant variables affecting performance. Similarly, it has been demonstrated at
Nagrom, and now subsequently at Mintek, that it is possible to reduce conditioning times
significantly without impacting flotation performance.
Variability in test work results has been attributed at this stage to different conditioning devices
utilised at different facilities. During future optimisation work, effort will be put into
understanding the various parameters affecting flotation process and investigate design of

J2897 Mkango Songwe Hill PFS November 2014 Page: 126
conditioners that can be used in the lab and up-scaled to pilot. This will be a focus of further
investigation during the Definitive Feasibility Study and Mintek are continuing refinement and
optimisation of the flotation process.
The assumption for the Pre-feasibility Study and financial model is a recovery of 67 % for both
light and heavy rare earths and a mass pull of 23.05 %, based on the results of extensive flotation
test work at Mintek and Nagrom, selected results of which are summarised in Table 13-10 and
Table 13-11 above and Table 13-18 and Table 13-19 below.
13.4.4 Leaching
Leaching conditions need to take into account the presence of calcium contained within the REE
host minerals of apatite and synchysite as well as any residual calcite not rejected by the flotation
process. Generally, sulphuric acid is deemed unsuitable for use in leaching high calcium content
material as the REE tend to co-precipitate during the formation of gypsum (CaSO4). Alternative
routes such as hydrochloric acid (HCl) leaching or nitric acid leaching are generally applied in
these cases.
Most of the recent leach test work has been conducted at Nagrom in Western Australia.
13.4.4.1 Whole Rock Leaching
HCl leach test work was undertaken by Nagrom on a ground whole rock composite, comprising
equal proportions of material from diamond drill holes PX012, PX001, PX003 and PX005 the
results of which were announced in July 2013. Leach tests using HCl were undertaken at varying
temperatures and acid strengths. H2SO4 leaching at elevated temperature was also trialled to
quantify the effect of REE loss to gypsum precipitation. Although optimal dissolution of rare
earths occurred at 30 % w/w HCl at elevated temperature, high dissolution values were also
achieved using 20 % w/w HCl at ambient temperature. Leaching in H2SO4 gave reduced recoveries
to solution as expected. The leach conditions and results are summarised in Table 13-12.

J2897 Mkango Songwe Hill PFS November 2014 Page: 127
Table 13-12
Leach recoveries based on a whole rock composite
Rare Earth Classification Leach Recovery
30 % HCl 1
Leach Recovery
20 % HCl 2
Leach Recovery
25 % H2SO4 3
Lanthanum LREE 84.7 % 78.0 % 65.9 %
Cerium LREE 87.3 % 82.9 % 64.9 %
Praseodymium LREE 89.6 % 85.5 % 63.3 %
Neodymium LREE 91.3 % 87.8 % 63.4 %
Samarium LREE 93.7 % 91.2 % 66.4 %
Europium HREE 94.5 % 92.3 % 70.0 %
Gadolinium HREE 96.2 % 94.4 % 74.9 %
Terbium HREE 95.8 % 94.5 % 75.5 %
Dysprosium HREE 94.9 % 94.4 % 77.5 %
Yttrium HREE 93.4 % 93.0 % 65.9 %
Notes: 1 30 % w/w pulp density, 30 % w/w HCl, 82 ºC, 2 hours leach time
2 20 % w/w pulp density, 20 % w/w HCl, 35 ºC, 2 hours leach time
3 10 % w/w pulp density, 25 % w/w H2SO4, 89 ºC, 4 hours leach time
The results indicate a clear trend whereby light rare earth recoveries were lower than heavy rare
earth recoveries. It is speculated that this is due to preferential leaching of the HREE biased
apatite over synchysite.
13.4.4.2 Concentrate Leaching
A flotation concentrate was generated at Mintek and provided to Nagrom to undertake a series of
leach optimisation tests the results of which were announced by Mkango in October 2013. A total
of 20 leach tests were undertaken at varying conditions. Again, although a slightly better result
was achieved at a higher HCl strength of 25%, an almost comparable result at 20% w/w acid
strength was obtained. It was determined that a reduced leach time of 30 minutes could be
applied without adversely affecting leach results. The leach was carried out on a bulk sample of
concentrate at 20% w/w pulp density and ambient temperature. The results are presented for this
leach in Table 13-13. As per the whole rock leaching results, there is a notable difference in the
leach recoveries between LREE and HREE.

J2897 Mkango Songwe Hill PFS November 2014 Page: 128
Table 13-13
Leach recoveries based on a flotation concentrate
Rare Earth Bulk Leach Recovery
Lanthanum 75.01 %
Cerium 79.48 %
Praseodymium 83.30 %
Neodymium 85.79 %
Samariam 89.42 %
Europium 90.91 %
Gadolinium 92.12 %
Terbium 92.56 %
Dysprosium 92.58 %
Yttrium 89.83 %
13.4.4.3 Multiple Stage Leaching
Gangue Leaching
Mintek evaluated the concept of an initial selective HCl leach targeting the calcite in order to
reduce excessive frothing in subsequent processing stages. This was done on a ground composite
of drill core samples. By controlling the pH to around 3, a 60 % mass reduction was achieved,
mainly due to calcite dissolution. REE “loss” to the solution was less than 1 % for the HREE and
less than 5 % for the LREE excluding Ce (12 %) and La (7.6 %).
Mintek repeated this approach on a flotation concentrate controlling the pH to between 3 and
3.5. All REE losses were below 2 % with a mass loss of 63 %, again due mainly to calcite
dissolution (Ca extraction was 80.3 %).
Nagrom also leached a flotation concentrate with restricted acid addition, resulting in a minimum
pH of 3. Confirmatory results to previous findings were obtained with a 67 % mass loss and a
74 % Ca extraction. REE losses to solution, with the exception of Y, were modest.
Of particular note is how pure the leach solution was, consisting of mainly of Ca (55g/L), Sr (3.7
g/L) and Mn (1.2 g/L) in a chloride solution. All other metals combined were less than 1 g/L. This
solution is highly amenable for recycling HCl as discussed in the Acid Recycle section below.
Rare Earth Leaching
The residue from the Nagrom gangue leach was subjected to a second, more intensive HCl leach
as per the initial concentrate bulk leach conditions. The recoveries of REE to solution met or
exceeded the single stage bulk leach and are reported in Table 13-14 below.

J2897 Mkango Songwe Hill PFS November 2014 Page: 129
Table 13-14
Bulk leach, gangue leach and RE leach on concentrate
Rare Earth Bulk Leach
Dissolution
Gangue Leach
Dissolution
RE Leach
Dissolution
Combined
Dissolution
Lanthanum 75.01 % 2.93 % 71.09 % 74.02 %
Cerium 79.48 % 2.69 % 75.97 % 78.66 %
Praseodymium 83.30 % 2.91 % 80.76 % 83.67 %
Neodymium 85.79 % 3.03 % 83.46 % 86.49 %
Samarium 89.42 % 2.27 % 87.93 % 90.20 %
Europium 90.91 % 2.87 % 89.52 % 92.39 %
Gadolinium 92.12 % 3.17 % 90.90 % 94.07 %
Terbium 92.56 % 3.49 % 91.19 % 94.68 %
Dysprosium 92.58 % 3.91 % 91.02 % 94.93 %
Yttrium 89.83 % 6.53 % 87.80 % 94.33 %
13.4.4.4 Caustic Conversion of Leach Residue
Mineralogical studies identified the presence of LREE host minerals such as florencite and
monazite, albeit in minor quantities, which are known or suspected to be refractory with regards
to ambient temperature acid leaching. The presence of fluorine within the mineral composition of
synchysite can also provide a mechanism for precipitation of insoluble rare earth fluorides during
the leach stage. Either or a combination of these mechanisms may account for the REE remaining
in the residue post leaching.
To test this proposition, a caustic conversion was undertaken on the leach residue from the bulk
leach reported in Table 13-13 and announced by Mkango in May 2014. The residue was
contacted with 50% w/w sodium hydroxide solution at 100 ºC for a 4 hour period. Upon cooling,
the solids were filtered, washed and then dissolved in 5 % w/w HCl. The original leach recoveries
along with the additional caustic conversion and calculated overall recoveries are reported in
Table 13-15.
Table 13-15
Leach, Caustic Conversion and Overall Recoveries on a Flotation Concentrate
Rare Earth Bulk Leach Dissolution Additional Dissolution
via Caustic Conversion
Overall Dissolution
Lanthanum 75.01 % 18.51 % 93.52 %
Cerium 79.48 % 12.44 % 91.92 %
Praseodymium 83.30 % 12.68 % 95.98 %
Neodymium 85.79 % 10.8 % 96.68 %
Samarium 89.42 % 7.96 % 97.38 %
Europium 90.91 % 6.72 % 97.63 %
Gadolinium 92.12 % 5.66 % 97.78 %
Terbium 92.56 % 4.68 % 97.24 %
Dysprosium 92.58 % 3.97 % 96.55 %
Yttrium 89.83 % 3.82 % 93.65 %

J2897 Mkango Songwe Hill PFS November 2014 Page: 130
Of note is that the recoveries not only improved, they were somewhat “normalised” between LREE
and HREE deportment.
13.5 Flowsheet Development
As the preceding work was done on limited sample quantities, a dedicated program of flowsheet
development was scoped and undertaken at Nagrom in 2014. The sample preparation and
flotation concentrate generation is reported in Nagrom report T1636 and the hydrometallurgical
flowsheet development is reported in T1737.
13.5.1 Sample Selection
The samples supplied to Nagrom are presented in Table 13-16.
Table 13-16
Sample Composition
Sample Weight (kg)
Mkango PX013 4.882
Mkango PX012 0.746
Mkango PX05 + PX015 0.746
Mkango PX022b 0.746
Mkango PX021 0.746
Mkango PX033 0.746
Mkango PX035 0.746
M066:M JR003 Master Comp1 4.681
M066: Mkango JR003 Master Comp1 5.032
Mkango JR003 M066 Master Comp1 5.034
Mkango JR003 M066 Master Comp1 5.034
Mkango JR003 M066 Master Comp1 5.035
Total 34.014
Note: 1 these each comprise equal proportions derived from PX022b, PX021, PX033 and PX035, from a
combination of PX005 and PX015, and from PX012, i.e. six equal sub-samples. These were then combined with
sufficient quantities of PX013 and other samples such that the overall composite corresponds to the
composition of Composite B.
These samples were stage crushed, wet screened and stage ground to a p80 of 38µm.
The Master Composite was wet screened at 53µm. The oversize fraction then underwent staged
grinding to produce a P80 of 53µm. The natural and generated fractions were recombined before
the sample was submitted for size by analysis. A summary is presented in Table 13-17.
More than half of the mass (52.11 %) exists in the -25µm size fraction. Most of the mineral species
also exist within the fines with 48.44 % of the P2O5, 60.48% of the Nd2O3, 56.15 % of the Dy2O3,
52.85 % of the Fe2O3 and 60.64 % of the TREO also reporting to the -25µm size fraction.

J2897 Mkango Songwe Hill PFS November 2014 Page: 131
13.5.2 Concentrate Generation
A total of twenty seven (27) bulk rougher flotation tests were undertaken on 0.9 kg charges of the
ground Master Composite sample. As the objective of the testwork was for sample generation
rather than flotation optimisation, only Bulk Float Tests 4, 5 and 6 underwent a full concentrate
and tailings analysis, whilst the other tests were analysed for Nd203 and Dy2O3 only. As an
example, a summary of the mass yields, grades and recoveries achieved from the Bulk Rougher
Flotation Test 5 is presented in Table 13-18.

J2897 Mkango Songwe Hill PFS November 2014 Page: 132
Table 13-17
Ground Master Composite Size by Analysis
Yield P2O5 Nd2O3 Dy2O3 Fe2O3 TREO
Size (µm) % % dist. ppm dist. ppm Size (µm) % % dist. ppm
+75 7.94% 2.06 9.90% 2228 6.74% 143 +75 7.94% 2.06 9.90% 2228
+63 7.39% 2.01 9.00% 2106 5.93% 135 +63 7.39% 2.01 9.00% 2106
+53 4.82% 1.90 5.54% 2044 3.75% 125 +53 4.82% 1.90 5.54% 2044
+45 9.02% 1.71 9.36% 2161 7.42% 127 +45 9.02% 1.71 9.36% 2161
+38 9.86% 1.64 9.77% 2181 8.20% 123 +38 9.86% 1.64 9.77% 2181
+25 8.87% 1.49 7.99% 2214 7.48% 119 +25 8.87% 1.49 7.99% 2214
-25 52.11% 1.53 48.44% 3046 60.48% 151 -25 52.11% 1.53 48.44% 3046
Calculated
Head 100.00% 1.65 100.00% 2624 100.00% 140 100.00% 15.59 100.00% 1.71 100.00%
Table 13-18
Master Composite Bulk Float Product Mix (Test 5)
Yield P2O5 Nd2O3 Dy2O3 Fe2O3 TREO
% % dist. ppm dist. ppm % % dist. ppm dist.
Rougher Concentrate 23.9 5.16 77.1 6993 66.2 385 67.8 12.3 18.4 4.65 66.7
Rougher Tailing 76.1 0.48 22.9 1123 33.8 57 32.2 17.2 81.6 0.73 33.3
Calculated Head 100.0 1.60 100.0 2526 100.0 136 100.0 16.0 100.0 1.66 100.0

J2897 Mkango Songwe Hill PFS November 2014 Page: 133
The results show that a total of 66.2 % of the Nd2O3, 67.8 % of the Dy2O3 and 66.7 % of the TREO
reported to the combined Rougher Concentrate which represented 23.9% of the original mass. As
expected, a considerable amount (77.1 %) of P2O5 floated with significantly less (18.4 %) of the
Fe2O3 reporting to the combined rougher concentrate. The combined rougher concentrate from
Test 5 had an overall TREO upgrade of 2.8 times.
Rougher concentrates were selected from all 27 float tests to form a single combined concentrate
composite. Rare earth and P2O5 grades were slightly higher than the Test 5 composite whilst the
Fe2O3 grade was slightly lower as shown in Table 13-21. Overall the composite is deemed typical
of what would be expected from an optimised flotation process.
Table 13-19
Comparison of Flotation Test 5 and Combined Concentrates
P2O5 Fe2O3 Nd2O3 Dy2O3 TREO
% % ppm ppm %
Test 5 5.2 12.3 6993 385 4.7
Combined (Tests 1-27) 5.7 12.0 7732 426 5.1
This concentrate composite was used for the hydrometallurgical development work.
13.5.3 Calcite Leaching
Sighter calcite leach (calcite being the targeted gangue mineral) testwork was undertaken on
subsamples of the concentrate composite to determine optimal leach conditions.
The remainder of the concentrate composite then underwent a bulk calcite leach at the following
conditions to produce a leach residue, leach liquor and two leach wash fractions:
Pulp density: 20 % w/w;
Target pH: 3.5 (maintained w/ HCl);
Leach time: 2hr; and
Temperature: ambient (21 °C)
The results are reported in Table 13-20.

J2897 Mkango Songwe Hill PFS November 2014 Page: 134
Table 13-20
Calcite Leach
Element Deportment to Solution
P 0.05 %
Mn 29.47 %
Mg 25.66 %
Ca 56.19 %
La 1.07 %
Ce 0.81 %
Pr 0.88 %
Nd 0.94 %
Sm 0.76 %
Eu 0.00 %
Gd 1.17 %
Tb 1.26 %
Dy 1.29 %
Ho 1.55 %
Er 2.02 %
Tm 0.00 %
Yb 3.10 %
Lu 0.00 %
Y 1.92 %
Source: Nagrom test T1737 – Bulk Calcite Leach
56.19 % of the Ca was recovered to the combined liquor and wash fractions with only 0.95% of
the REE solubilizing.
13.5.4 Rare Earth Leaching
The bulk calcite leach residue was dried in preparation for bulk rare earth leaching. The bulk rare
earth leach was conducted at the following conditions to produce a leach residue, leach liquor
and two leach wash fractions:
Pulp density: 20 % w/w;
Acid concentration: 20 % w/w HCl;
Leach time: 0.5hr;
Temperature: Ambient (31.5 °C); and
Staged acid addition.
The results of the bulk rare earth leach are presented in Table 13-21.

J2897 Mkango Songwe Hill PFS November 2014 Page: 135
Table 13-21
Rare Earth Leach on Calcite Leach Residue
Element Deportment to Solution
P 93.18 %
Ca 88.66 %
La 73.91 %
Ce 79.16 %
Pr 82.99 %
Nd 85.98 %
Sm 91.42 %
Eu 92.94 %
Gd 94.20 %
Tb 94.26 %
Dy 93.41 %
Ho 92.19 %
Er 90.41 %
Tm 88.41 %
Yb 87.46 %
Lu 82.14 %
Y 91.17 %
TREE 80.30 %
Source: Nagrom test T1737 – Bulk RE Leach
80.30 % of the TREEs were solubilized along with almost all of the remaining P and Ca indicating
the apatite host mineral has been attacked. On note is the preferential leaching of the heavy rare
earths over the light rare earths. This further supports the premise that the apatite host minerals
contain a biased proportion on these rare earths.
13.5.5 Caustic Conversion and Redissolution
A subsample of the and bulk rare earth leach residue was subjected to caustic conversion at the
following conditions to produce one a residue, liquor and two wash fractions:
Pulp density: 30 % w/w;
NaOH concentration: 50 % w/w;
Leach time: 4 hr; and
Temperature: 100 °C.
Analysis was conducted on all fractions which reported less than 0.01% Total REE loss to the
combined liquor and wash fractions.
A hydrochloric acid redissolution was conducted on the caustic conversion residue at the
following conditions to produce a residue, liquor and two wash fractions:
Pulp Density: 20 % w/w;
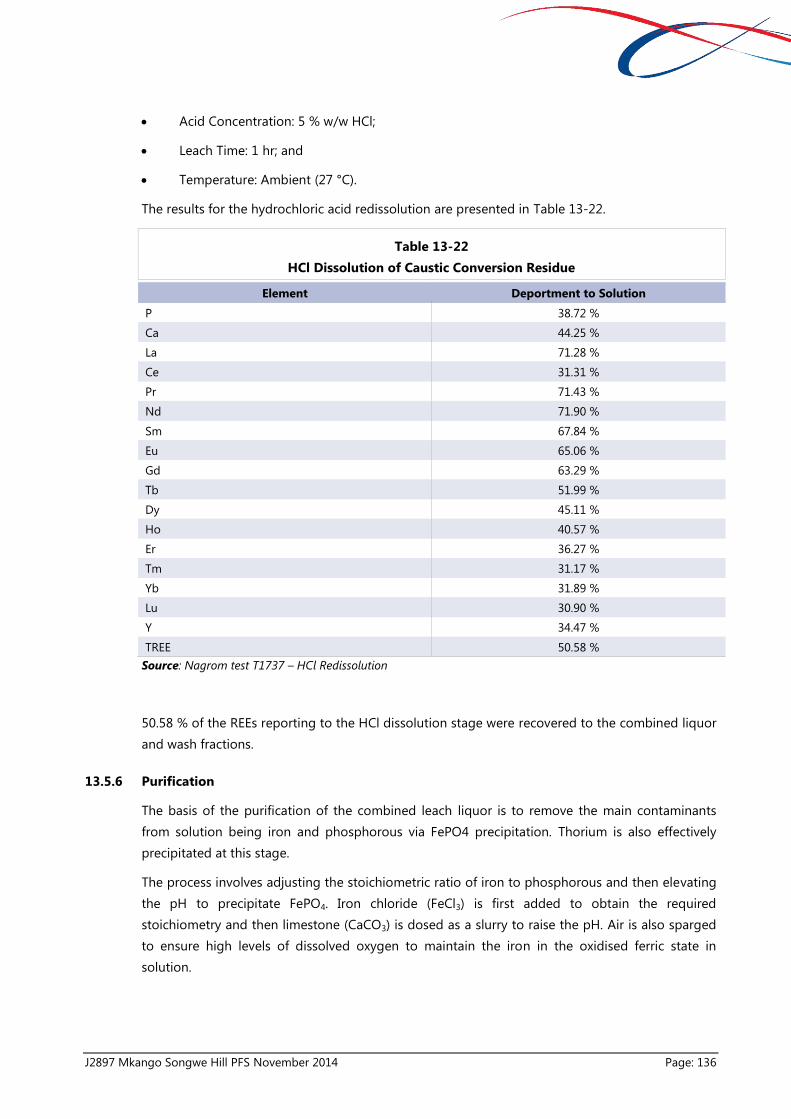
J2897 Mkango Songwe Hill PFS November 2014 Page: 136
Acid Concentration: 5 % w/w HCl;
Leach Time: 1 hr; and
Temperature: Ambient (27 °C).
The results for the hydrochloric acid redissolution are presented in Table 13-22.
Table 13-22
HCl Dissolution of Caustic Conversion Residue
Element Deportment to Solution
P 38.72 %
Ca 44.25 %
La 71.28 %
Ce 31.31 %
Pr 71.43 %
Nd 71.90 %
Sm 67.84 %
Eu 65.06 %
Gd 63.29 %
Tb 51.99 %
Dy 45.11 %
Ho 40.57 %
Er 36.27 %
Tm 31.17 %
Yb 31.89 %
Lu 30.90 %
Y 34.47 %
TREE 50.58 %
Source: Nagrom test T1737 – HCl Redissolution
50.58 % of the REEs reporting to the HCl dissolution stage were recovered to the combined liquor
and wash fractions.
13.5.6 Purification
The basis of the purification of the combined leach liquor is to remove the main contaminants
from solution being iron and phosphorous via FePO4 precipitation. Thorium is also effectively
precipitated at this stage.
The process involves adjusting the stoichiometric ratio of iron to phosphorous and then elevating
the pH to precipitate FePO4. Iron chloride (FeCl3) is first added to obtain the required
stoichiometry and then limestone (CaCO3) is dosed as a slurry to raise the pH. Air is also sparged
to ensure high levels of dissolved oxygen to maintain the iron in the oxidised ferric state in
solution.

J2897 Mkango Songwe Hill PFS November 2014 Page: 137
Tight pH and oxidation/reduction potential (ORP) control is required to ensure good rejection of
iron and phosphorous with minimal loss of REs via co-precipitation. Approximately 20 laboratory
tests were undertaken to determine the optimal combination of conditions.
The summary results of the contaminant rejection and RE losses are given in Table 13-23.
Table 13-23
Purification of RE Leach Solution
Element Deportment to Precipitate
P 79.93 %
Fe 64.65 %
Th 98.94 %
La 1.63 %
Ce 1.96 %
Pr 1.81 %
Nd 1.63 %
Sm 2.21 %
Eu 2.09 %
Gd 1.89 %
Tb 1.94 %
Dy 1.48 %
Ho 1.27 %
Er 1.20 %
Tm 1.65 %
Yb 1.51 %
Lu 1.30 %
Y 3.76 %
TREE 1.88 %
Source: Nagrom test T1737 – Bulk Purification (6)
13.5.7 Raw RE Hydroxide Precipitation
The purified leach solution is dosed with caustic soda (NaOH) to raise the pH to just beyond
neutral (pH 7.5) and precipitate a raw, mixed rare earth hydroxide. This process recovers more
than 99% of the critical and heavy rare earths to a precipitate which is filtered and washed.
The results are given in Table 13-24.

J2897 Mkango Songwe Hill PFS November 2014 Page: 138
Table 13-24
Raw RE Hydroxide Precipitation
Element Deportment to Precipitate
La 94.63 %
Ce 98.57 %
Pr 99.04 %
Nd 98.92 %
Sm 100.00 %
Eu 100.00 %
Gd 100.00 %
Tb 100.00 %
Dy 100.00 %
Ho 100.00 %
Er 100.00 %
Tm 100.00 %
Yb 100.00 %
Lu 100.00 %
Y 99.72 %
Total REE+Y 97.86 %
Source: Nagrom test T1737 – Bulk Hydroxide Precipitate
13.5.8 Hot Caustic Wash
Experimentation identified that a hot caustic wash (or mild caustic conversion) improved
downstream recovery of the rare earths. It is speculated that this converts any insoluble rare earth
fluorides present into soluble hydroxides. There is no loss of rare earths to solution at this stage.
Testwork was undertaken using a concentrated caustic soda solution at near boiling point. Further
testwork should be undertaken to ascertain if reduced strengths and temperatures are also
effective.
13.5.9 Cerium Rejection
Cerium can be rejected by converting it to the +4 oxidation state which makes it much less
soluble than the other rare earths that generally only occur in the +3 state. In an alkaline
environment (such as a wet rare earth hydroxide precipitate), this can be achieved by hot air
drying. The solid from the hot caustic wash was dried at 150⁰C with regular turning to ensure
good exposure to the air.
13.5.10 Selective Dissolution
With the cerium now oxidised, the mixed RE hydroxide can be leached in a mild strength acid to
reject the majority of cerium along with residual iron and thorium.
With limited sample available, only a few tests could be undertaken, however it was determined
that an HCl solution at a pH of 1 at ambient temperature and 2 hour leach time gave the best
selectivity between cerium and impurity rejection and rare earth dissolution. Further optimisation

J2897 Mkango Songwe Hill PFS November 2014 Page: 139
is expected to give greater selectivity against cerium and other contaminants whilst improving
rare earth recovery.
The deportment of elements to the solution is given in Table 13-25.
Table 13-25
Selective dissolution of mixed RE hydroxide
Element Deportment to Solution
P 0.97 %
Fe 2.19 %
Th 0.00 %
La 83.69 %
Ce 11.09 %
Pr 72.19 %
Nd 71.07 %
Sm 72.44 %
Eu 69.98 %
Gd 71.73 %
Tb 66.43 %
Dy 71.32 %
Ho 70.87 %
Er 72.32 %
Tm 73.88 %
Yb 76.70 %
Lu 76.89 %
Y 85.40 %
Source: Nagrom test T1737 – Redissolution Sighter 7 Subsample #2
13.5.11 Residue Leaching
Because of the appreciable amounts (between 15 to 30%) of the desired (non-cerium) rare earth
content remaining unleached from above, the solid undergoes another stronger leach in 5% HCl.
This “scavenges” approximately 80% of the remaining non-cerium rare earths and a much lesser
amount, around 40%, of the remaining cerium. As some iron is solubilized and in order to
maximise cerium rejection and non-cerium recoveries, this stream is recycled back to the
purification stage.
13.5.12 Product Precipitation
The solution from the selective dissolution stage is treated with caustic soda solution to raise the
pH and precipitate all of the rare earths from solution.
13.6 Flowsheet Selection
Based on the preceding test work, a hydrometallurgical flowsheet has been developed. This is
presented in Figure 13-6.

J2897 Mkango Songwe Hill PFS November 2014 Page: 140
Figure 13-6
Hydrometallurgical Flowsheet

J2897 Mkango Songwe Hill PFS November 2014 Page: 141
13.7 Stage Recoveries for Basis of Design
From the preceding testwork, stage and overall rare earth recoveries through the process have
been determined. These are summarised in Table 13-26.
Table 13-26
Rare Earth Recovery by Stage
Rare Earth Flotation
Recovery
Calcite, RE Leach
and Residue
Leach Recovery
Purification and
Precipitation
Recovery
Overall Recovery
La 67.0 % 92.3 % 88.2 % 54.5 %
Ce 67.0 % 85.2 % 15.9 % 9.1 %
Pr 67.0 % 94.9 % 90.1 % 57.3 %
Nd 67.0 % 95.8 % 89.3 % 57.3 %
Sm 67.0 % 97.0 % 91.8 % 59.7 %
Eu 67.0 % 97.5 % 90.5 % 59.1 %
Gd 67.0 % 97.5 % 89.2 % 58.2 %
Tb 67.0 % 96.7 % 86.0 % 55.7 %
Dy 67.0 % 95.7 % 90.4 % 58.0 %
Y 67.0 % 93.1 % 93.4 % 58.2 %
Ho 67.0 % 94.5 % 89.9 % 56.9 %
Er 67.0 % 92.7 % 91.0 % 56.5 %
Tm 67.0 % 92.0 % 90.3 % 55.7 %
Yb 67.0 % 89.6 % 92.7 % 55.7 %
Lu 67.0 % 87.7 % 91.0 % 53.4 %

J2897 Mkango Songwe Hill PFS November 2014 Page: 142
14 MINERAL RESOURCE ESTIMATES
14.1 Previous Mineral Resource Estimates
JICA and MMAJ conducted a core drilling programme on Songwe Hill in the late 1980s but did
not produce a code-compliant Mineral Resource.
In 2010 Mkango commenced an extensive exploration programme over Songwe Hill culminating
in a maiden Mineral Resource Estimate for the Project, covering an up to 200 m wide north-east
trending section of Songwe Hill.
The location of the Phalombe license, including Songwe Hill is shown in Figure 5-10. A geological
map of the Songwe Hill area is shown in Figure 7-2.
14.2 Mineral Resource Estimate
The current Mineral Resource estimation exercise is based on a Microsoft Access database
compiled by MSA containing borehole and surface channel sampling data (Figure 14-1) supplied
by Mkango, from two exploration programmes covering Songwe Hill. Drilling and channel
sampling were conducted between April 2011 and May 2012. MSA verified all data received from
Mkango upon receipt and requested Mkango to rectify errors where these were identified.
This Technical Report includes total rare earth oxides (TREO), heavy rare earth oxides (HREO) and
light rare earth oxides (LREO) Mineral Resource Estimates for three domains defined as each of
the dominant lithological units identified at Songwe Hill. These are Carbonatite-, Fenite- and a
combination roughly of equal proportions of these two, termed the Mixed Domain.
14.3 Known issues that materially affect Mineral Resources
All geological data were acquired in terms of the Standard Operating Procedures (SOP) as
supplied by MSA at the Project outset. These SOP were designed to address all aspects of the CIM
Exploration Best Practices Guidelines. MSA undertook audits and reviews of the exploration data
as and when supplied by Mkango. The Project Access database was evaluated for use in Mineral
Resource estimation by the application of an internal checklist for the assessment of data quality
and integrity.
MSA exported the Access database into Microsoft Excel spread sheets and applied an internal
checklist for the assessment of data quality and integrity. Final data verification was undertaken
upon import into Datamine software, this being the selected 3-D modelling software package.
Any errors and, or omissions identified at each interrogation stage were communicated to
Mkango who then rectified the data accordingly.
No material issues were identified with respect to the finalized Mkango exploration database
which would negatively impact on the declaration of the Mineral Resources. No material issues
were identified by which the Mineral Resource Estimates could be materially affected by
environmental, permitting, legal, title, taxation, socio-economic, marketing economic, marketing,
political, or other factors.

J2897 Mkango Songwe Hill PFS November 2014 Page: 143
Figure 14-1
Drilling plan for Songwe Hill
Source: Hall (2012)
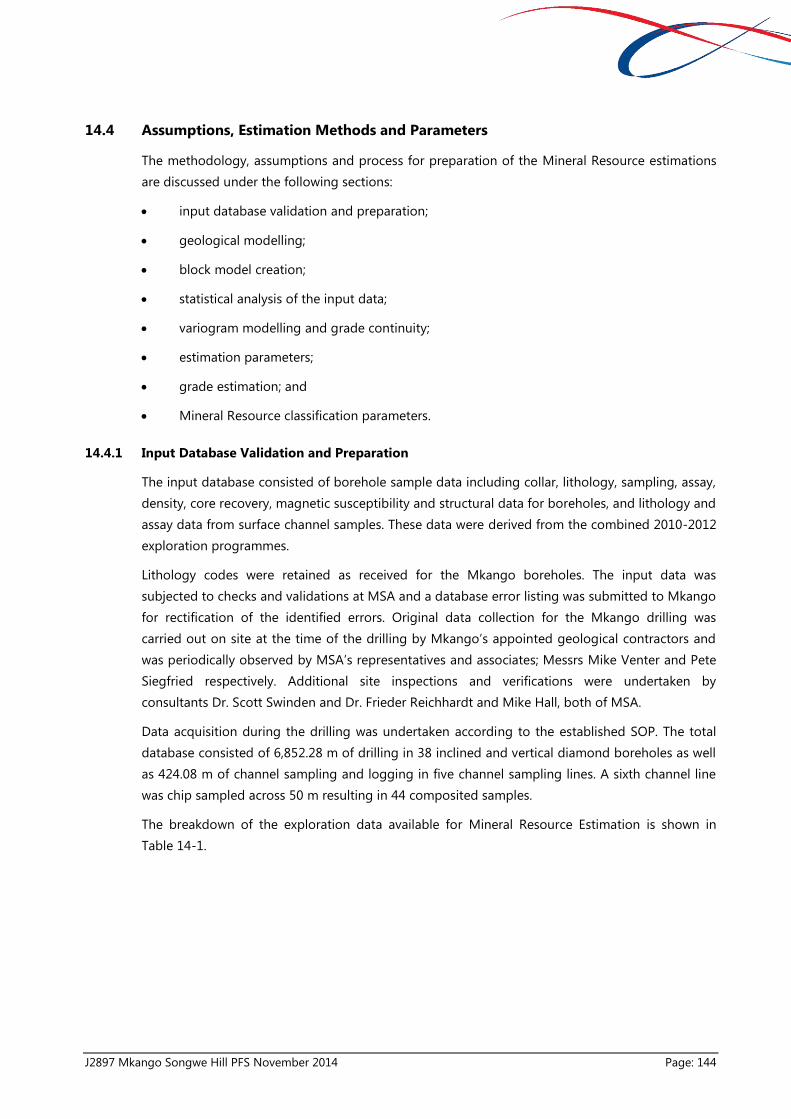
J2897 Mkango Songwe Hill PFS November 2014 Page: 144
14.4 Assumptions, Estimation Methods and Parameters
The methodology, assumptions and process for preparation of the Mineral Resource estimations
are discussed under the following sections:
input database validation and preparation;
geological modelling;
block model creation;
statistical analysis of the input data;
variogram modelling and grade continuity;
estimation parameters;
grade estimation; and
Mineral Resource classification parameters.
14.4.1 Input Database Validation and Preparation
The input database consisted of borehole sample data including collar, lithology, sampling, assay,
density, core recovery, magnetic susceptibility and structural data for boreholes, and lithology and
assay data from surface channel samples. These data were derived from the combined 2010-2012
exploration programmes.
Lithology codes were retained as received for the Mkango boreholes. The input data was
subjected to checks and validations at MSA and a database error listing was submitted to Mkango
for rectification of the identified errors. Original data collection for the Mkango drilling was
carried out on site at the time of the drilling by Mkango’s appointed geological contractors and
was periodically observed by MSA’s representatives and associates; Messrs Mike Venter and Pete
Siegfried respectively. Additional site inspections and verifications were undertaken by
consultants Dr. Scott Swinden and Dr. Frieder Reichhardt and Mike Hall, both of MSA.
Data acquisition during the drilling was undertaken according to the established SOP. The total
database consisted of 6,852.28 m of drilling in 38 inclined and vertical diamond boreholes as well
as 424.08 m of channel sampling and logging in five channel sampling lines. A sixth channel line
was chip sampled across 50 m resulting in 44 composited samples.
The breakdown of the exploration data available for Mineral Resource Estimation is shown in
Table 14-1.

J2897 Mkango Songwe Hill PFS November 2014 Page: 145
Table 14-1
Drilling and Channel input data Songwe Hill: Mineral Resource Estimation
Sample Type Number1 Drill and Channel Metres Sampled Metres
Boreholes 38 6,852.28 6,696.91
Surface Channels 5 424.08 424.08
Surface Chip sampling2 1 50.00 50.00
Total 45 7,326.36 7,170.99
Note: 1
includes two boreholes at each of sites 7, 17 and 22;
2 comprises 50 m of sampled outcrop comprising chips from only 44 samples.
14.4.1.1 Collar and Downhole Survey
All borehole collars and all channel sample end points were surveyed using a Differential GPS
system by a qualified and certificated Land Surveyor.
Drilling fence lines were aligned in an east to west direction, in order to intersect the depth
extension to the mapped carbonatite outcrops. Fence lines were spaced at 25 m apart north to
south. The down-dip borehole spacing varies between 50 m and 100 m. All fence lines contain
more than one borehole.
All boreholes were surveyed down-the-hole with the exception of eight boreholes (PX003,
PX007b, PX010, PX011, PX012, PX023, PX024 and PX027). The collared dip and direction readings
for these eight were however accepted as the final borehole dip and direction considering both
their relatively shallow depths and the minor deviations exhibited by those boreholes that had
been surveyed. The coordinates of all channels were surveyed at the start, end and at each of the
sample centre points along their length using a Differential GPS system.
Borehole data is spread evenly across the 400 m strike of the identified Songwe Hill carbonatite
mineralization for which Mineral Resource Estimates were undertaken (Figure 14-1).
A total of 7,230 borehole samples and 454 channel samples are contained in the current database,
amounting to 7,164.99 m of sample length. The nominal sample interval was 1 m. Average
borehole sample length was 0.93 m and average channel sample length was 1.04 m.
A detailed topographic surface was supplied by Mkango for the Project area. The supplied
borehole collar elevations were matched to this surface.
14.4.1.2 Density
Density measurements were undertaken at site using the Archimedes principle of weight in water
versus weight in air. Density readings for 6,420 core samples, representing 5,690 m or
approximately 80 % of the assayed sample length, were taken. Average core length for density
determinations was 17 cm, with a maximum of 21 cm and a minimum of 8 cm, covering all
lithologies intersected at Songwe. No density data were determined from the channel samples.

J2897 Mkango Songwe Hill PFS November 2014 Page: 146
14.4.1.3 Core recoveries
Core recoveries for the Mkango diamond drilling were included in the supplied database. The
length-weighted average core recovery is 88.2 % in the data set. There is a broad depth-core
recovery relationship as shown in Table 14-2, showing increasing core recovery with increasing
depth, this being assigned to the decreasing degree of weathering with increasing depth. The
average depth of weathering is 20 m below surface at Songwe Hill.
Table 14-2
Core recovery in percent per depth interval below surface
Depth Interval (m) 0-10 0-20 0-30 0-40 0-50 Overall
Songwe Hill 57.5 66.5 72.5 77.4 79.3 88.2 %
Source: Hall (2012)
The core recovery data shown in Table 14-2 reflect the effects of a lower recovery rate during
Phase 1 drilling. This was subsequently improved upon as documented in boreholes drilled during
Phase 2 at the same collars as phase 1 drilling.
Voids or cavities have been intersected in several boreholes at Songwe Hill. These voids may
attain lengths of up to 15 m (in borehole PX007a), as intersected in the drilling database. They
occur at varying depths (9.15 m in borehole PX015 to 181.93 m in borehole PX008), mostly within
carbonatite or carbonatite-dominant intervals. There is a total of 113.13 m in intervals reported as
voids in the drilling database, representing 1.7 % of the drilled metres. This figure may be over-
stated as it is partially a result of the sub-standard drilling practices in the first phase. An example
of a void is shown in Figure 14-2.
Figure 14-3, which represents the complete drillhole database core recovery data, shows that
there is no discernible relationship between grade and core recovery. This illustrates that there is
no assay bias introduced as a result of core loss or enrichment in the REO concentration
associated with cavities, supporting the incorporation of all borehole assay data in the Mineral
Resource Estimate. In the disseminated style of mineralization, such as that found at Songwe Hill
it is not expected that any relationship should exist between core recovery and grade.
It is recommended that studies of core recovery versus grade, lithology and depth be continued
in future drilling programs. Once suitable information is available it is possible that a slight
discount on the tonnages in some lithologies in certain depth intervals may be considered as a
result of voids.

J2897 Mkango Songwe Hill PFS November 2014 Page: 147
Figure 14-2
Void or cavity in carbonatite: void is 20 cm in diameter rimmed with calcite
Source: Hall (2012)
Figure 14-3
Scattergram of core recoveries versus grade for Songwe Hill
Source: Hall (2012)
14.4.1.4 Quality Control Quality Assurance
The assay data quality control and quality assurance is described in Section 11. MSA believes the
levels of assay precision and assay accuracy are sufficient for use in Mineral Resource Estimations
at the current level of confidence.

J2897 Mkango Songwe Hill PFS November 2014 Page: 148
14.4.1.5 Checklist for Mineral Resource Estimation
Table 14-3 lists the parameters assessed for reporting the Songwe Hill Mineral Resource. These
parameters are based on the Canadian Institute for Mining, Metallurgy and Petroleum (CIM)
Guidelines for Disclosure of Mineral Resource estimates and are made in accordance with industry
standard definitions approved by the CIM, which have been incorporated by reference into
NI 43-101.
Table 14-3
Checklist for Mineral Resource Reporting (CIM 2010)
Checklist for Mineral Resource Reporting
Drilling techniques Inclined and vertical diamond drilling of both NQ and HQ diameter.
Inclined boreholes were drilled at angles between -60 and -80 degrees to
the west and east.
Channel samples were cut from outcrops using a diamond saw. Two
parallel grooves 5 cm apart were cut, from which samples were removed
using a chisel.
Logging All boreholes and channels were geologically logged by qualified
geologists. The logging was of an appropriate standard for Mineral
Resource Estimation
Drill sample recovery Core recoveries are documented for the Mkango diamond boreholes and
are an average of approximately 88%. Channel sample recoveries were
not documented
Sampling methods Core samples were collected using a nominal sample length of 1 m while
making the appropriate adjustments to honour geological variability.
Channels were also sampled at 1 m intervals. MSA observed that the
routine sampling methods were of a high standard and suitable for
Mineral Resource Estimation purposes
Quality of assay data and
laboratory tests
The assay database displays industry standard levels of precision and
accuracy and meets the requirements for use in Mineral Resource
Estimation
Verification of sampling and
assaying
Internal data verification is carried out as a standard. This incorporated
approximately 5% blanks, 5% certified reference materials and 5%
duplicates. An external verification of approximately 5% of the assay data
was carried out using an umpire laboratory. Assay QAQC was found to be
acceptable
Location of data points All Mkango borehole collars were surveyed by a qualified surveyor using
a differential GPS system. All except eight boreholes were downhole
surveyed. Those not downhole surveyed were, with one exception less
than 104 m in length and were assumed to have been drilled as collared.
One borehole was 182 m in length and was also accepted to have drilled
as collared.
Channel samples were also surveyed using a differential GPS system, at
each sample point and at the channel start and end points
Tonnage factors (in-situ bulk
densities)
Density determinations were made for approximately 80% of the drilling
database’ samples using the Archimedes method of weight in air versus
weight in water
Data density and distribution Diamond drilling was carried out along fence lines at 25 m apart north-
south and at between 50 m and 100 m east-west along these fences

J2897 Mkango Songwe Hill PFS November 2014 Page: 149
Checklist for Mineral Resource Reporting
Drilling techniques Inclined and vertical diamond drilling of both NQ and HQ diameter.
Inclined boreholes were drilled at angles between -60 and -80 degrees to
the west and east.
Channel samples were cut from outcrops using a diamond saw. Two
parallel grooves 5 cm apart were cut, from which samples were removed
using a chisel.
Logging All boreholes and channels were geologically logged by qualified
geologists. The logging was of an appropriate standard for Mineral
Resource Estimation
Drill sample recovery Core recoveries are documented for the Mkango diamond boreholes and
are an average of approximately 88%. Channel sample recoveries were
not documented
Sampling methods Core samples were collected using a nominal sample length of 1 m while
making the appropriate adjustments to honour geological variability.
Channels were also sampled at 1 m intervals. MSA observed that the
routine sampling methods were of a high standard and suitable for
Mineral Resource Estimation purposes
Quality of assay data and
laboratory tests
The assay database displays industry standard levels of precision and
accuracy and meets the requirements for use in Mineral Resource
Estimation
Verification of sampling and
assaying
Internal data verification is carried out as a standard. This incorporated
approximately 5% blanks, 5% certified reference materials and 5%
duplicates. An external verification of approximately 5% of the assay data
was carried out using an umpire laboratory. Assay QAQC was found to be
acceptable
Location of data points All Mkango borehole collars were surveyed by a qualified surveyor using
a differential GPS system. All except eight boreholes were downhole
surveyed. Those not downhole surveyed were, with one exception less
than 104 m in length and were assumed to have been drilled as collared.
One borehole was 182 m in length and was also accepted to have drilled
as collared.
Channel samples were also surveyed using a differential GPS system, at
each sample point and at the channel start and end points
Tonnage factors (in-situ bulk
densities)
Density determinations were made for approximately 80% of the drilling
database’ samples using the Archimedes method of weight in air versus
weight in water
Database integrity Data were supplied to MSA at regular intervals in Excel spreadsheets and
were captured into a dedicated Microsoft Access database. These were
subsequently exported as separate Microsoft Excel spreadsheets for
import into Mineral Resource modelling software. MSA undertook audits
on the database and Mkango addressed all identified inconsistencies and
errors. The original Access database and the exported Excel spreadsheets
have been declared as an accurate representation of the original data
collected.
Dimensions The Mineral Resource at Songwe Hill has been drilled over a length of 250
m in a north easterly direction and across a 100 m width in a westerly
direction. The Mineral Resource occurs from surface and has been
constrained by the depths of the boreholes. However, in some cases the
resource has been extended an additional 25 m to 30 m below the
borehole depth after consideration was given to the depths of adjacent
boreholes.
Geological interpretation The current geological model comprises a vertically dipping intrusive
plug. The confidence in this interpretation is considered appropriate for
Indicated Mineral Resource classification where supported by the data.

J2897 Mkango Songwe Hill PFS November 2014 Page: 150
Checklist for Mineral Resource Reporting
Drilling techniques Inclined and vertical diamond drilling of both NQ and HQ diameter.
Inclined boreholes were drilled at angles between -60 and -80 degrees to
the west and east.
Channel samples were cut from outcrops using a diamond saw. Two
parallel grooves 5 cm apart were cut, from which samples were removed
using a chisel.
Logging All boreholes and channels were geologically logged by qualified
geologists. The logging was of an appropriate standard for Mineral
Resource Estimation
Drill sample recovery Core recoveries are documented for the Mkango diamond boreholes and
are an average of approximately 88%. Channel sample recoveries were
not documented
Sampling methods Core samples were collected using a nominal sample length of 1 m while
making the appropriate adjustments to honour geological variability.
Channels were also sampled at 1 m intervals. MSA observed that the
routine sampling methods were of a high standard and suitable for
Mineral Resource Estimation purposes
Quality of assay data and
laboratory tests
The assay database displays industry standard levels of precision and
accuracy and meets the requirements for use in Mineral Resource
Estimation
Verification of sampling and
assaying
Internal data verification is carried out as a standard. This incorporated
approximately 5% blanks, 5% certified reference materials and 5%
duplicates. An external verification of approximately 5% of the assay data
was carried out using an umpire laboratory. Assay QAQC was found to be
acceptable
Location of data points All Mkango borehole collars were surveyed by a qualified surveyor using
a differential GPS system. All except eight boreholes were downhole
surveyed. Those not downhole surveyed were, with one exception less
than 104 m in length and were assumed to have been drilled as collared.
One borehole was 182 m in length and was also accepted to have drilled
as collared.
Channel samples were also surveyed using a differential GPS system, at
each sample point and at the channel start and end points
Tonnage factors (in-situ bulk
densities)
Density determinations were made for approximately 80% of the drilling
database’ samples using the Archimedes method of weight in air versus
weight in water
Domains The deposit has been sub-divided into domains comprising the two
dominant lithologies and a domain comprising a mixture of the two
lithologies
Compositing Borehole core sample data were composited into 1 m lengths within the
modelled domains.
Statistics and variography Isotropic variograms were used to model the spatial continuity separately
for each domain.
Top or bottom cuts for grades Statistical analysis of the composited data demonstrated that no capping
of the data was necessary, there being no isolated outlier values.
Data clustering Boreholes were drilled on an approximately regular grid across the Project
area. These holes have been drilled to varying depths in some areas,
which has resulted in Mineral Resource classifications of lower confidence
in those areas informed by fewer drillhole data at varying depths.
Block size A three dimensional block model composed of 50 m E by 50 m N by 5 m
RL cells was constructed for each domain

J2897 Mkango Songwe Hill PFS November 2014 Page: 151
Checklist for Mineral Resource Reporting
Drilling techniques Inclined and vertical diamond drilling of both NQ and HQ diameter.
Inclined boreholes were drilled at angles between -60 and -80 degrees to
the west and east.
Channel samples were cut from outcrops using a diamond saw. Two
parallel grooves 5 cm apart were cut, from which samples were removed
using a chisel.
Logging All boreholes and channels were geologically logged by qualified
geologists. The logging was of an appropriate standard for Mineral
Resource Estimation
Drill sample recovery Core recoveries are documented for the Mkango diamond boreholes and
are an average of approximately 88%. Channel sample recoveries were
not documented
Sampling methods Core samples were collected using a nominal sample length of 1 m while
making the appropriate adjustments to honour geological variability.
Channels were also sampled at 1 m intervals. MSA observed that the
routine sampling methods were of a high standard and suitable for
Mineral Resource Estimation purposes
Quality of assay data and
laboratory tests
The assay database displays industry standard levels of precision and
accuracy and meets the requirements for use in Mineral Resource
Estimation
Verification of sampling and
assaying
Internal data verification is carried out as a standard. This incorporated
approximately 5% blanks, 5% certified reference materials and 5%
duplicates. An external verification of approximately 5% of the assay data
was carried out using an umpire laboratory. Assay QAQC was found to be
acceptable
Location of data points All Mkango borehole collars were surveyed by a qualified surveyor using
a differential GPS system. All except eight boreholes were downhole
surveyed. Those not downhole surveyed were, with one exception less
than 104 m in length and were assumed to have been drilled as collared.
One borehole was 182 m in length and was also accepted to have drilled
as collared.
Channel samples were also surveyed using a differential GPS system, at
each sample point and at the channel start and end points
Tonnage factors (in-situ bulk
densities)
Density determinations were made for approximately 80% of the drilling
database’ samples using the Archimedes method of weight in air versus
weight in water
Grade estimation Metal grades were estimated using ordinary kriging. Grades were
interpolated within a search ellipse representing the ranges of the
isotropic variograms for each domain.
Mineral Resource Classification The classification incorporated the confidence in the borehole data, the
current geological interpretation, data distribution and variogram ranges.
Blocks informed within the first search radius were classified as Indicated.
The remainder were classified as Inferred Mineral Resources.
Cut-off grades A series of cut-off grades have been selected for the purposes of Mineral
Resource reporting on the Project. These were selected based on bench-
marking of similar deposits. A base cut-off grade of 1% TREO was
selected for the reported Mineral Resource.
Mining cuts No mining cuts have been applied
Metallurgical factors or
assumptions
No metallurgical test work had been completed at the time of the Mineral
Resource Estimation.

J2897 Mkango Songwe Hill PFS November 2014 Page: 152
Checklist for Mineral Resource Reporting
Drilling techniques Inclined and vertical diamond drilling of both NQ and HQ diameter.
Inclined boreholes were drilled at angles between -60 and -80 degrees to
the west and east.
Channel samples were cut from outcrops using a diamond saw. Two
parallel grooves 5 cm apart were cut, from which samples were removed
using a chisel.
Logging All boreholes and channels were geologically logged by qualified
geologists. The logging was of an appropriate standard for Mineral
Resource Estimation
Drill sample recovery Core recoveries are documented for the Mkango diamond boreholes and
are an average of approximately 88%. Channel sample recoveries were
not documented
Sampling methods Core samples were collected using a nominal sample length of 1 m while
making the appropriate adjustments to honour geological variability.
Channels were also sampled at 1 m intervals. MSA observed that the
routine sampling methods were of a high standard and suitable for
Mineral Resource Estimation purposes
Quality of assay data and
laboratory tests
The assay database displays industry standard levels of precision and
accuracy and meets the requirements for use in Mineral Resource
Estimation
Verification of sampling and
assaying
Internal data verification is carried out as a standard. This incorporated
approximately 5% blanks, 5% certified reference materials and 5%
duplicates. An external verification of approximately 5% of the assay data
was carried out using an umpire laboratory. Assay QAQC was found to be
acceptable
Location of data points All Mkango borehole collars were surveyed by a qualified surveyor using
a differential GPS system. All except eight boreholes were downhole
surveyed. Those not downhole surveyed were, with one exception less
than 104 m in length and were assumed to have been drilled as collared.
One borehole was 182 m in length and was also accepted to have drilled
as collared.
Channel samples were also surveyed using a differential GPS system, at
each sample point and at the channel start and end points
Tonnage factors (in-situ bulk
densities)
Density determinations were made for approximately 80% of the drilling
database’ samples using the Archimedes method of weight in air versus
weight in water
Audits and reviews The following audit and review work was completed by MSA:
a comparison of the database against the original borehole logs and
interpreted geological sections
a review of borehole data collection protocols and QA/QC systems
a site based review of the borehole data.
QA/QC audits by Dr S. Swinden, independent consultant to Mkango
and by Dr Frieder Reichhardt of MSA
Source: CIM (2010)
14.4.2 Geological Modeling
Datamine Studio 3 was utilized for the three-dimensional modeling. Snowden Supervisor software
was used for the univariate and geostatistical analysis.
REE mineralization at Songwe Hill deposit occurs within a vertically intruded carbonatite plug. The
drilling to date has investigated only the north eastern portion of the plug. Within this portion,
surface exposures show that the carbonatite is the dominant domain, which comprises

J2897 Mkango Songwe Hill PFS November 2014 Page: 153
carbonatite breccias and mixtures of carbonatite and fenite, with carbonatite accounting for
>60 % of the rock mass.
The relationships of the various lithologies and structural features within the carbonatite plug are
difficult to establish. Rarely are contacts observed between the major lithologies. A sub-vertical
dip was viewed between fenite and carbonatite at a single locality, shown in Figure 14-4. This
single data point may however, not represent the overall orientation of the various lithologies
with the plug.
Mkango supplied detailed logging section views along drill fence lines. These incorporated
lithology and TREO data. An example illustrating the high level of logging detail is shown in the
left-hand image in Figure 14-5. Lithological logging and associated assay data is highly variable
between one sample and the next, often alternating between fenite and carbonatite on a scale of
less than one metre. Such complex relationships are depicted in the insert in Figure 14-5.
In order to carry out mineral resource modeling some simplification of the lithological information
was required. Upon request by MSA, Mkango provided geological logs that identified zones of
carbonatite or fenite dominant lithologies that were correlated with the broad lithological zones
mapped in surface exposures. The simplified equivalent of the section through PX004 and PX014
is shown in the right-hand image in Figure 14-5. Criteria used to create broad zones included
potassium and silica contents (as indications of fenitisation) and higher grade TREO and CaCO3 as
indications of carbonatite dominance. A number of simplified sections were provided by Mkango,
which were used in the generation of the rock type envelopes. Furthermore, the simplified
lithological intervals were entered into a separate field in the geological database and these were
used to enable broad scale geological modelling.

J2897 Mkango Songwe Hill PFS November 2014 Page: 154
Figure 14-4
Sub-vertical fenite carbonatite contact at Songwe Hill
Source: Hall (2012)

J2897 Mkango Songwe Hill PFS November 2014 Page: 155
Figure 14-5
Borehole sectional views
Note: (a): secondary lithology annotated on left hand side of borehole, TREO% on right hand side
(b): TREO% annotated on left hand side of borehole
(a) and (b): Red: Fenite; Blue: Carbonatite Light green: Mixed; Orange: Fenitized Phonolite Insert: Fenite
(pink) in carbonatite at outcrop (detailed borehole legend is shown in Section 7.3.2)
(c) Fenite (pink) in carbonatite at outcrop
Source: after Brady (2012)

J2897 Mkango Songwe Hill PFS November 2014 Page: 156
The surface geological mapping provided the basis for the geological modelling. Consistent with
the interpreted emplacement morphology of the plug, the geological contacts from the mapping
were translated vertically downwards at 50 m intervals and adjusted with the intersection data in
the boreholes. This enabled construction of the Carbonatite and Mixed Domain envelopes. An
example of a horizontal sectional view of the wireframes is shown in Figure 14-6.
The modelled envelopes were extended 50 m horizontally away from the extents of the borehole
intersections. The entire geological model was extended to 350 m below the topographic surface
which resulted in the geological model being approximately 25 m below the deepest borehole
intersections.
Figure 14-6
Example of an horizontal sectional interpretation at Songwe Hill: 300 m amsl
Note: Light blue = carbonatite envelope and carbonatite intersections in boreholes; turquoise = mixed
envelope and mixed intersections in boreholes; grey = planar surface is -300 m above mean sea level
(amsl)
Source: Hall (2012)
14.4.2.1 Topographic surface
A topographic survey including DGPS point data was provided by Mkango and the surveyed
borehole collars were matched with this surface to produce a combined topographic surface
(Figure 14-7). The channel sample data were draped onto the combined topographic surface. The
orebody wireframe extents were constrained by the surface topography model. MSA notes that
the acquisition of an updated topographic surface is planned for the next phase of exploration.

J2897 Mkango Songwe Hill PFS November 2014 Page: 157
Figure 14-7
Oblique view of Songwe Hill Carbonatite and Mixed lithology wireframes cut by
topographic surface looking south west
Note: Light blue = carbonatite envelope and carbonatite intersections in boreholes; turquoise = mixed envelop
and mixed intersections in boreholes; grey = topography cut-off domains; green surface = 350 m below
topography plane
Source: Hall (2012)
14.4.3 Block Model Creation
Block models were generated within the modelled mineralization wireframes for each domain
using 50 m by 50 m blocks in the X (easting) and Y (northing) directions with exact wireframe
edge fitting in the Z (elevation) direction. Cell splitting was applied to better fit the modelled
wireframes, resulting in sub-cells of a minimum of 5 m x 5 m in the X and Y directions.
The common origin for the un-rotated block models is (UTM Zone 36 South, WGS84):
Easting (X): 801 500 m
Northing (Y): 8 263 000 m
Elevation (Z): 300 m above mean sea level (amsl).
14.4.4 Input Data Exploratory Data Analysis
Snowden Supervisor software was used for univariate and geostatistical analyses. These were
carried out by domain. The input data for each domain were separated using the wireframe
envelopes and then composited to approximately 1 m ensuring that all of the sample lengths
were included in composites and that there were no residual lengths omitted. Statistical analysis
was carried out on the 1 m composites.

J2897 Mkango Songwe Hill PFS November 2014 Page: 158
14.4.4.1 Songwe Hill TREO Statistics
Statistics for TREO for the Carbonatite, Fenite and Mixed Domains are depicted in Figure 14-8 to
Figure 14-10. The log histograms of the Carbonatite and Fenite Domains are negatively skewed.
The number of inflection points in the log probability plots indicate several distributions with each
domain (Figure 14-11 to Figure 14-13), which may be a result of the imperfect nature of creating
the generalized lithological zones. The histogram of the mixed domain clearly shows the
difference between the fenite data and the carbonatite data within this domain.
The HREO proportion of the TREO is less than 9 %. In addition, Th and U contents at Songwe are
low. Statistics for other constituents of each domain including HREO, Th, U and density are
included in Appendix 4.
The individual domain TREO population coefficients of variation are all low indicating low
variability overall and therefore it is acceptable to use Ordinary Kriging (OK) as the estimation
technique
Figure 14-8
Borehole TREO in the Carbonatite Domain at Songwe Hill
Source: Hall (2012

J2897 Mkango Songwe Hill PFS November 2014 Page: 159
Figure 14-9
Borehole TREO in the Fenite Domain at Songwe Hill
Source: Hall (2012
Figure 14-10
Borehole TREO in the Mixed Domain at Songwe Hill
Source: Hall (2012

J2897 Mkango Songwe Hill PFS November 2014 Page: 160
Figure 14-11
Songwe Hill Carbonatite Borehole TREO Log probability plot
Source: Hall (2012
Figure 14-12
Songwe Hill Fenite Borehole TREO Log probability plot
Source: Hall (2012

J2897 Mkango Songwe Hill PFS November 2014 Page: 161
Figure 14-13
Songwe Hill Mixed Borehole TREO Log probability plot
Source: Hall (2012
The borehole and channel data were compared for compatibility for use in the mineral resource
estimates. Q-Q plots comparing the populations are shown in Figure 14-14 to Figure 14-16. These
comparisons show that the channel sample grades for all domains are higher than the boreholes,
suggesting they are from a different population, which may be a result of weathering and surface
enrichment. As such the channel samples were excluded from the estimation database.
Figure 14-14
Songwe Hill Carbonatite Q-Q Plot: Boreholes versus Channels
Source: Hall (2012

J2897 Mkango Songwe Hill PFS November 2014 Page: 162
Figure 14-15
Songwe Hill Fenite Q-Q Plot: Boreholes versus Channels
Source: Hall (2012
Figure 14-16
Songwe Hill Mixed Q-Q Plot: Boreholes versus Channels
Source: Hall (2012
14.4.5 Individual REO Proportions
The drilling database was interrogated to yield proportions of the individual REOs as shown in
Table 14-4 which represent the global proportions per domain. These data were subsequently
applied per domain to assign proportions at differing cut offs.

J2897 Mkango Songwe Hill PFS November 2014 Page: 163
Table 14-4
Individual REO proportions at Songwe Hill
REO Carbonatite % Fenite % Mixed %
Light Rare Earth Oxides (LREO)
La2O3 24.23 23.88 26.85
Ce2O3 44.21 43.40 45.61
Pr2O3 4.75 4.68 4.60
Nd2O3 16.41 16.07 14.69
Sm2O3 24.23 23.88 26.85
Total LREO 91.97 90.45 93.74
Heavy Rare Earth Oxides (HREO)
Eu2O3 0.65 0.69 0.53
Gd2O3 1.52 1.69 1.25
Tb2O3 0.18 0.21 0.15
Dy2O3 0.86 1.05 0.67
Ho2O3 0.14 0.17 0.11
Er2O3 0.33 0.42 0.25
Tm2O3 0.04 0.05 0.03
Yb2O3 0.24 0.29 0.19
Lu2O3 0.03 0.04 0.03
Y2O3 4.02 4.93 3.06
Total HREO 8.03 9.55 6.26
Source: Hall (2012)
14.4.6 Density
Density was interpolated into the block models for each domain similarly to a grade variable.
Density values exist for 80 % of the samples used in the grade estimation. Histograms of density
data are contained in Appendix 4.
14.4.7 Variogram modeling and grade continuity
Variograms for TREO and HREO borehole data were modeled for each domain.
14.4.7.1 Songwe Hill variography detail
The omni-directional variograms for each domain are shown in Appendix 5. Heavy rare earths, as
defined in this Technical Report comprise europium, gadolinium, terbium, dysprosium, holmium,
erbium, thulium, ytterbium, lutetium and yttrium. The poor structure of the variograms models
may be a function of the mixed data in the generalized lithological domains.
The omni-directional variogram parameters are tabulated in Table 14-5.

J2897 Mkango Songwe Hill PFS November 2014 Page: 164
Table 14-5
Variogram parameters
Variable Nugget Range
structure 1
Variance
structure 1
Range
structure 2
Variance
structure 2
TREO Carbonatite 0.42 29 m 0.58 - -
HREO Carbonatite 0.41 35.5 m 0.59 - -
Th Carbonatite 0.38 30 m 0.62 - -
U Carbonatite 0.33 8.5 m 0.46 50.5 m 0.21
Density Carbonatite 0.48 73.5 m 0.52 - -
TREO Fenite 0.23 23.5 m 0.77 - -
HREO Fenite 0.11 10 m 0.57 52 m 0.32
Th Fenite 0.08 7.5 m 0.92 - -
U Fenite 0.21 24 m 0.79 - -
Density Fenite 0.29 24.5 m 0.71 - -
TREO Mixed 0.36 11 m 0.27 26 m 0.37
HREO Mixed 0.10 6 m 0.77 33 m 0.13
Th Mixed 0.21 20.5 m 0.79 - -
U Mixed 0.32 6.5 m 0.18 34 m 0.50
Density Mixed 0.30 6 m 0.29 25 m 0.41
Source: Hall (2012
Grade interpolation was carried out for TREO, HREO, Th and U. The final LREO estimate was
derived by deduction of the HREO estimate from the TREO estimate.
14.4.8 Estimation Parameters and Grade Estimation
Ordinary Kriging was used for the grade and density estimation for TREO and HREO. The
estimation search parameters are shown in Table 14-6.

J2897 Mkango Songwe Hill PFS November 2014 Page: 165
Table 14-6
Search parameters
Variable Direction Search Distance
TREO Carbonatite omni-directional 29 m
HREO Carbonatite omni-directional 35.5 m
Th Carbonatite omni-directional 30 m
U Carbonatite omni-directional 50.5 m
Density Carbonatite omni-directional 73.5 m
TREO Fenite omni-directional 23.5 m
HREO Fenite omni-directional 52 m
Th Fenite omni-directional 7.5 m
U Fenite omni-directional 24 m
Density Fenite omni-directional 24.5 m
TREO Mixed omni-directional 26 m
HREO Mixed omni-directional 33 m
Th Mixed omni-directional 20.5 m
U Mixed omni-directional 34 m
Density Mixed omni-directional 25 m
Source: Hall (2012
A minimum of 5 and a maximum of 10 samples were selected by the search ellipse in order to
estimate a block. The number of samples selected was limited so that local outliers were limited in
influence to adjacent areas. The first search selected samples within the variogram range. The
search was expanded by up to nine times the variogram range so that all of the model cells were
estimated with grade and density. Those blocks that were estimated with the expanded search are
considered to be low confidence estimates, they being largely confined to the peripheries of the
block model. Parent cell estimation was undertaken.
A view of the combined block model, coloured by domain is presented in Figure 14-17 and the
same view is presented in Figure 14-18 coloured by TREO grade.
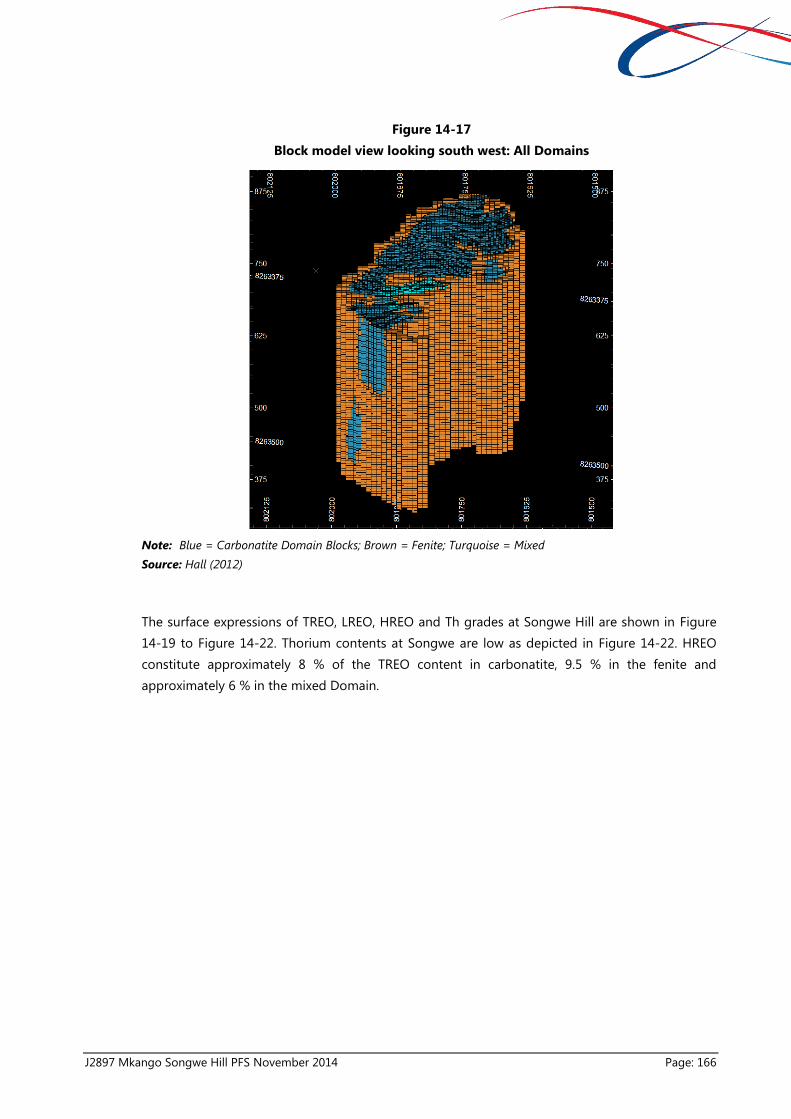
J2897 Mkango Songwe Hill PFS November 2014 Page: 166
Figure 14-17
Block model view looking south west: All Domains
Note: Blue = Carbonatite Domain Blocks; Brown = Fenite; Turquoise = Mixed
Source: Hall (2012)
The surface expressions of TREO, LREO, HREO and Th grades at Songwe Hill are shown in Figure
14-19 to Figure 14-22. Thorium contents at Songwe are low as depicted in Figure 14-22. HREO
constitute approximately 8 % of the TREO content in carbonatite, 9.5 % in the fenite and
approximately 6 % in the mixed Domain.

J2897 Mkango Songwe Hill PFS November 2014 Page: 167
Figure 14-18
Block model view looking south west: All domains TREO %
Source: Hall (2012)
Figure 14-19
Surface expression of TREO grades at Songwe Hill
Source: Hall (2012)
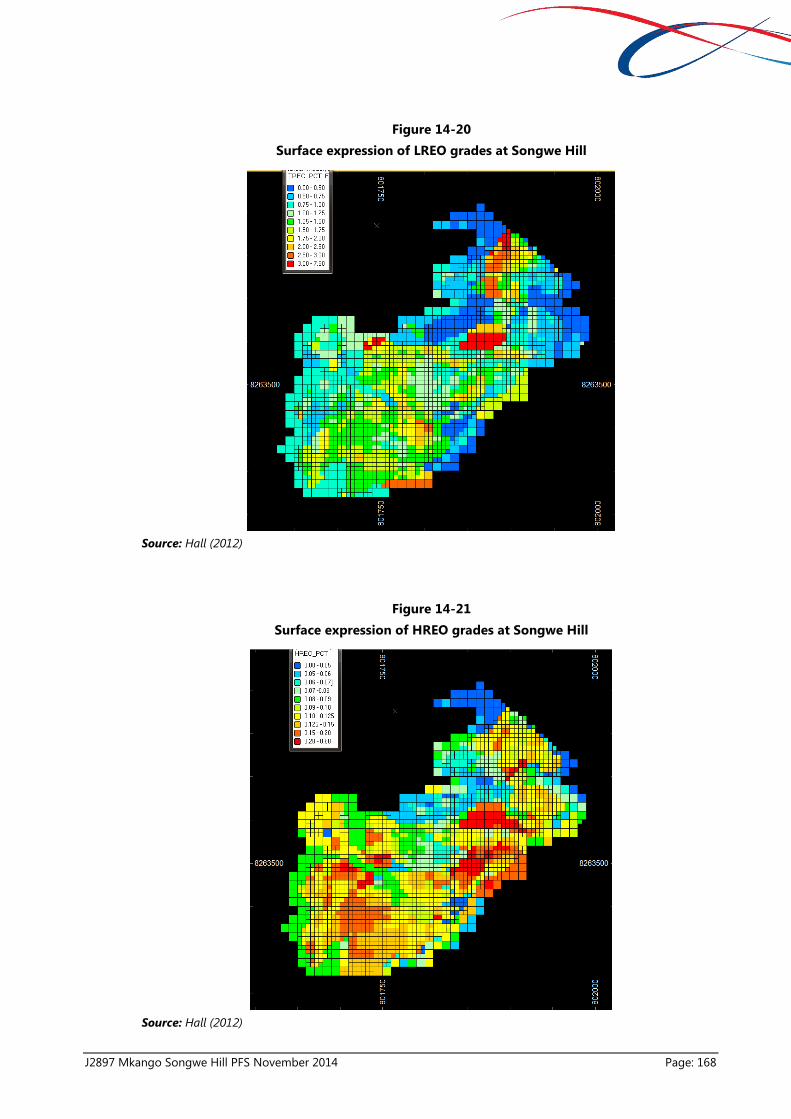
J2897 Mkango Songwe Hill PFS November 2014 Page: 168
Figure 14-20
Surface expression of LREO grades at Songwe Hill
Source: Hall (2012)
Figure 14-21
Surface expression of HREO grades at Songwe Hill
Source: Hall (2012)

J2897 Mkango Songwe Hill PFS November 2014 Page: 169
Figure 14-22
Surface expression of Th grades at Songwe Hill
Source: Hall (2012)
14.4.9 Geological Losses
No geological losses were applied for the current Mineral Resource Estimates. Geological features
such as faults and dykes are not known to occur within the Mineral Resource. The reported voids
represent a consideration for discounting the Mineral Resource by 1.7 % but this has not been
applied due to a degree of uncertainty regarding the currently documented void data.
14.4.10 Mineral Resource Classification
Blocks that were estimated by samples within the variogram range were classified as Indicated
Mineral Resources and the remainder of the block model estimates were classified as Inferred
Mineral Resources.
The interpreted geological model at Songwe is of a vertically-intruded plug. Dips of the margins
and of the internal lithological contacts have been interpreted as vertical in this model but there is
limited data to support this.
Drilling data is considered to be of an appropriate level of detail and reliability and is spread
evenly across the study area. It is considered that drilling data adequately covers the Mineral
Resource to attain Indicated classification in those areas covered by the regular grid.
The geological breakdown into domains is not currently well enough defined in order to classify
the Mineral Resource with more confidence than Indicated. It is noted that the grade continuity is

J2897 Mkango Songwe Hill PFS November 2014 Page: 170
a function of the lithological domains and that more confidence in the estimates may result from
better definitions of the domains.
An overall assessment of the above factors limits the current Mineral Resource to the Indicated
category.
14.5 Mineral Resource Statement
14.5.1 Songwe Hill Mineral Resources
The Songwe Hill Mineral Resource has been classified as Indicated and Inferred for each of the
Carbonatite, Fenite and Mixed domains in accordance with CIM guidelines. These are shown in
Table 14-7 to Table 14-12. Comparisons are made at a number of cut off grades for TREO in 0.5 %
increments from 0.5 % to 2.0 %, although the base case cut-off grade was assigned as 1.0 % TREO
at 30th
September 2012, which is highlighted in the various tabulations of the Mineral Resource.
Table 14-7
In-situ Indicated Mineral Resources for Songwe Hill: Carbonatite domain as at 30th
September 2012
TREO %
Cut Off
Million
Tonnes
DENSITY TREO
%
LREO
%
HREO
%
Th
ppm
U
ppm
TREO
Tonnes
LREO
Tonnes
HREO
Tonnes
0.5 16.31 2.79 1.35 1.24 0.11 322 12 219,978 202,724 17,255
1.0 11.10 2.80 1.62 1.50 0.12 351 12 179,499 166,429 13,071
1.5 5.26 2.79 2.03 1.91 0.13 385 12 106,886 100,185 6,699
2.0 1.85 2.78 2.63 2.50 0.13 429 12 48,572 46,193 2,379
Source: Hall (2012)
Table 14-8
In-situ Inferred Mineral Resources for Songwe Hill: Carbonatite domain as at 30th
September 2012
TREO %
Cut Off
Million
Tonnes
DENSITY TREO
%
LREO
%
HREO
%
Th
ppm
U
ppm
TREO
Tonnes
LREO
Tonnes
HREO
Tonnes
0.5 17.09 2.82 1.07 0.97 0.09 304 12 182,866 166,637 16,226
1.0 8.64 2.87 1.35 1.24 0.11 324 11 116,967 107,335 9,629
1.5 1.90 2.87 1.85 1.72 0.12 349 11 35,045 32,709 2,335
2.0 0.39 2.89 2.50 2.38 0.12 358 11 9,849 9,383 466
Source: Hall (2012)

J2897 Mkango Songwe Hill PFS November 2014 Page: 171
Table 14-9
In-situ Indicated Mineral Resources for Songwe Hill: Fenite domain as at 30th
September
2012
TREO %
Cut Off
Million
Tonnes
DENSITY TREO
%
LREO
%
HREO
%
Th
ppm
U
ppm
TREO
Tonnes
LREO
Tonnes
HREO
Tonnes
0.5 2.71 2.81 1.18 1.09 0.09 288 13 31,912 29,504 2,408
1.0 1.37 2.85 1.61 1.51 0.10 301 11 22,145 20,704 1,441
1.5 0.59 2.87 2.11 1.98 0.12 334 10 12,460 11,735 726
2.0 0.24 2.84 2.59 2.45 0.14 378 10 6,313 5,972 341
Source: Hall (2012)
Table 14-10
In-situ Inferred Mineral Resources for Songwe Hill: Fenite domain as at 30th
September
2012
TREO %
Cut Off
Million
Tonnes
DENSITY TREO
%
LREO
%
HREO
%
Th
ppm
U
ppm
TREO
Tonnes
LREO
Tonnes
HREO
Tonnes
0.5 17.47 2.82 1.06 0.97 0.09 271 13 184,819 169,732 15,086
1.0 8.27 2.86 1.35 1.24 0.10 295 13 111,318 102,935 8,381
1.5 1.73 2.83 1.88 1.75 0.12 331 11 32,477 30 ,74 2,104
2.0 0.41 2.75 2.41 2.27 0.14 350 11 9,875 9,313 562
Source: Hall (2012)
Table 14-11
In-situ Indicated Mineral Resources for Songwe Hill: Mixed domain as at 30th
September
2012
TREO %
Cut Off
Million
Tonnes
DENSITY TREO
%
LREO
%
HREO
%
Th
ppm
U
ppm
TREO
Tonnes
LREO
Tonnes
HREO
Tonnes
0.5 1.01 2.79 1.38 1.31 0.07 318 12 13,993 13,266 727
1.0 0.69 2.80 1.65 1.58 0.07 335 12 11,454 10,941 513
1.5 0.31 2.72 2.19 2.11 0.08 387 14 6,719 6,469 250
2.0 0.15 2.65 2.68 2.60 0.08 420 17 3,924 3,806 118
Source: Hall (2012)
Table 14-12
In-situ Inferred Mineral Resources for Songwe Hill: Mixed domain as at 30th
September
2012
TREO %
Cut Off
Million
Tonnes
DENSITY TREO
%
LREO
%
HREO
%
Th
ppm
U
ppm
TREO
Tonnes
LREO
Tonnes
HREO
Tonnes
0.5 1.90 2.86 1.56 1.50 0.06 251 11 29,614 28,430 1,184
1.0 1.68 2.87 1.65 1.59 0.06 248 11 27,863 26,815 1,049
1.5 1.43 2.87 1.74 1.68 0.06 243 11 24,890 24,005 885
2.0 0.11 2.94 2.36 2.29 0.07 255 11 2,595 2,521 73
Source: Hall (2012)

J2897 Mkango Songwe Hill PFS November 2014 Page: 172
The totals per Mineral Resource category for the combined domains at the base case cut-off
grade of 1 % TREO are shown in Table 14-13 and Table 14-14.
The total Indicated Mineral Resource for all domains at Songwe Hill is 13.16 million tonnes at a
TREO grade of 1.62 % which equates to 213,098 tonnes of TREO at a 1 % TREO cut-off.
The total Inferred Mineral Resource for all domains at Songwe Hill is 18.59 million tonnes at a
TREO grade of 1.3 8 %, which equates to 256,149 tonnes of TREO at a 1 % TREO cut-off.
Table 14-13
In-situ Indicated Mineral Resources for Songwe Hill: All domains at a 1% TREO cut-off as at
30th
September 2012
Domain Million
Tonnes
LREO
%
HREO
%
TREO
%
TREO
Tonnes
HREO
Proportion
Carbonatite 11.10 1.50 0.12 1.62 179,499 7.3 %
Fenite 1.37 1.51 0.10 1.61 22,145 6.5 %
Mixed 0.69 1.58 0.07 1.65 11,454 4.5 %
Totals 13.16 1.50 0.11 1.62 213,098 7.1 %
Source: Hall (2012)
Table 14-14
In-situ Inferred Mineral Resources for Songwe Hill: All domains at a 1% TREO cut-off as at
30th
September 2012
Domain Million
Tonnes
LREO
%
HREO
%
TREO
%
TREO
Tonnes
HREO
Proportion
Carbonatite 8.64 1.24 0.11 1.35 116,967 8.2%
Fenite 8.27 1.24 0.10 1.35 111,318 7.5%
Mixed 1.68 1.59 0.06 1.65 27,863 3.8%
Totals 18.59 1.28 0.10 1.38 256,149 7.4%
Source: Hall (2012)
The individual REO contents at the 1 % TREO cut off are shown in Table 14-15 (Indicated Mineral
Resources) and Table 14-16 (Inferred Mineral Resources).

J2897 Mkango Songwe Hill PFS November 2014 Page: 173
Table 14-15
In-situ Indicated Mineral Resources: Individual REO contents at Songwe Hill at the 1% TREO cut off as at 30th
September 2012
Domain Tonnes La2O3 Ce2O3 Pr2O3 Nd2O3 Sm2O3 LREO Eu2O3 Gd2O3 Tb2O3 Dy2O3 Ho2O3 Er2O3 Tm2O3 Yb2O3 Lu2O3 Y2O3 HREO TREO Th U
million ppm ppm ppm ppm ppm ppm ppm ppm ppm ppm ppm ppm ppm ppm ppm ppm ppm ppm ppm ppm
Carbonate 11.10 3,951 7,208 775 2,676 387 14,997 95 223 27 127 21 48 6 36 5 590 1,178 16,175 351 12
Fenite 1.37 3,980 7,235 779 2,679 404 15,077 76 186 24 116 19 46 6 32 4 542 1,050 16,127 301 11
Mixed 0.69 4,520 7,678 774 2,473 335 15,780 63 148 17 79 13 29 4 22 3 362 739 16,519 335 12
Source: Hall (2012)
Table 14-16
In-situ Inferred Mineral Resources: Individual REO contents at Songwe Hill at the 1% TREO cut off as at 30th
September 2012
Domain Tonnes La2O3 Ce2O3 Pr2O3 Nd2O3 Sm2O3 LREO Eu2O3 Gd2O3 Tb2O3 Dy2O3 Ho2O3 Er2O3 Tm2O3 Yb2O3 Lu2O3 Y2O3 HREO TREO Th U
million ppm ppm ppm ppm ppm ppm ppm ppm ppm ppm ppm ppm ppm ppm ppm ppm ppm ppm ppm ppm
Carbonate 8.64 3,275 5,974 642 2,218 321 12,430 90 211 25 120 19 46 6 34 5 559 1,115 13,545 324 11
Fenite 8.27 3,286 5,973 643 2,212 333 12,448 73 180 23 112 18 44 5 31 4 523 1,014 13,462 295 12
Mixed 1.68 4,559 7,746 781 2,495 338 15,918 53 125 14 66 11 25 3 19 3 304 622 16,541 248 11
Source: Hall (2012)
The tabulations per cut-off grade and per domain are included in Appendix 6
The proportions of the individual REOs at the 1 % TREO cut off are presented in Table 14-17 and Table 14-18.

J2897 Mkango Songwe Hill PFS November 2014 Page: 174
Table 14-17
In-situ Indicated Mineral Resources: Individual REO proportions at Songwe Hill at the 1% TREO cut off as at 30th
September 2012
Domain Tonnes La2O3 Ce2O3 Pr2O3 Nd2O3 Sm2O3 Eu2O3 Gd2O3 Tb2O3 Dy2O3 Ho2O3 Er2O3 Tm2O3 Yb2O3 Lu2O3 Y2O3 Total
million % % % % % % % % % % % % % % % %
Carbonate 11.10 24.43 44.56 4.79 16.54 2.39 0.59 1.38 0.17 0.78 0.13 0.30 0.04 0.22 0.03 3.65 100
Fenite 1.37 24.68 44.86 4.83 16.61 2.50 0.47 1.15 0.15 0.72 0.12 0.28 0.04 0.20 0.03 3.36 100
Mixed 0.69 27.36 46.48 4.69 14.97 2.03 0.38 0.90 0.10 0.48 0.08 0.18 0.02 0.13 0.02 2.19 100
Source: Hall (2012)
Table 14-18
In-situ Inferred Mineral Resources: Individual REO proportions at Songwe Hill at the 1% TREO cut off as at 30th
September 2012
Domain Tonnes La2O3 Ce2O3 Pr2O3 Nd2O3 Sm2O3 Eu2O3 Gd2O3 Tb2O3 Dy2O3 Ho2O3 Er2O3 Tm2O3 Yb2O3 Lu2O3 Y2O3 Total
million % % % % % % % % % % % % % % % %
Carbonate 8.64 24.18 44.11 4.74 16.37 2.37 0.67 1.56 0.19 0.89 0.14 0.34 0.04 0.25 0.03 4.12 100
Fenite 8.27 24.41 44.37 4.78 16.43 2.48 0.54 1.33 0.17 0.83 0.14 0.33 0.04 0.23 0.03 3.89 100
Mixed 1.68 27.56 46.83 4.72 15.08 2.04 0.32 0.75 0.09 0.40 0.06 0.15 0.02 0.11 0.02 1.84 100
Source: Hall (2012)
The individual REO proportions do not vary greatly between the different cut-off grades. The tabulations of individual REO per cut-off grade and per
domain are included in Appendix 7.
Indicated Mineral Resources are inclusive of Mineral Reserves. Mineral Resources that are not Mineral Reserves do not have demonstrated economic
viability.

J2897 Mkango Songwe Hill PFS November 2014 Page: 175
14.6 Conclusions
This is the maiden Mineral Resource reported for Songwe Hill.
The combined domain Indicated Mineral Resource for Songwe Hill is 13.16 million tonnes at a
TREO grade of 1.62 % which equates to 213,098 tonnes of TREO at a 1 % TREO cut-off.
The combined domain Inferred Mineral Resource for Songwe Hill is 18.59 million tonnes at a
TREO grade of 1.38 % equating to 256,149 tonnes of TREO at a 1 % TREO cut-off.
The HREO constitute 8.03 % of the TREO content in the Carbonatite domain, 9.55 % of the TREO
in the Fenite and 6.26 % of the TREO in the Mixed domain.
The current Mineral Resource Estimate only covers an area in the north eastern portion of Songwe
Hill. There is potential to identify additional mineral resources, both immediately to the northeast
and southwest of the drilled area as well as at depth.
The remainder of Songwe Hill may also have additional REO mineral resource potential, the
testing of which could involve step-out drilling to the north east and south west on a 25 m fence
line spacing. In addition, there is potential to extend the mineralization through shallow depth
drilling into other carbonatite outcrop areas at Songwe Hill.
The apparent difference between the borehole and channel sample TREO grades should be
investigated in order to understand this bias. Following this, inclusion of the channel sample data
into the estimation database could be considered.

J2897 Mkango Songwe Hill PFS November 2014 Page: 176
15 MINERAL RESERVE ESTIMATES
The Mineral Reserve Estimate reported here is based on the mine design and processing methods
discussed in later Sections of this Technical Report. The Mineral Reserves were estimated by
applying the modifying factors developed as part of the mine design to the portion of the
Indicated Mineral Resources contained in the final pit design. The Mineral Resources are
summarised in Table 14-13.
15.1 Mineral Reserve Estimation Process
The process followed in converting the Mineral Resources to Mineral Reserves was as follows:
a pit optimisation exercise was completed and is discussed in Section 16.2;
only Indicated Mineral Resources were considered for the pit optimisation and design
exercise;
input criteria were developed for the pit optimisation (See table 16-5);
a practical pit design was completed using the optimum pit shell generated by the pit
optimisation exercise as a base. The practical pit design includes ramps, safety berms and
other aspects not considered by the optimisation software and is discussed in Section 16.3;
a production schedule was generated from the pit design, based on the mine owner’s
stated production target and is discussed in Section 16.4;
capital and operating costs were estimated for the construction and operation of the mine
(Section 21); and
the production schedule and cost estimates were used in a discounted cash flow model,
together with the expected realised product prices and plant recoveries. The result of the
financial modelling was positive showing that, based on the assumptions and estimations
made in this PFS, the Mineral Resources can be profitably mined.
15.2 Modifying factors
15.2.1 Cut-off grade
Based on the life of mine average operating cost a breakeven grade was calculated. The
calculation of the breakeven grade is shown in Table 15-1.
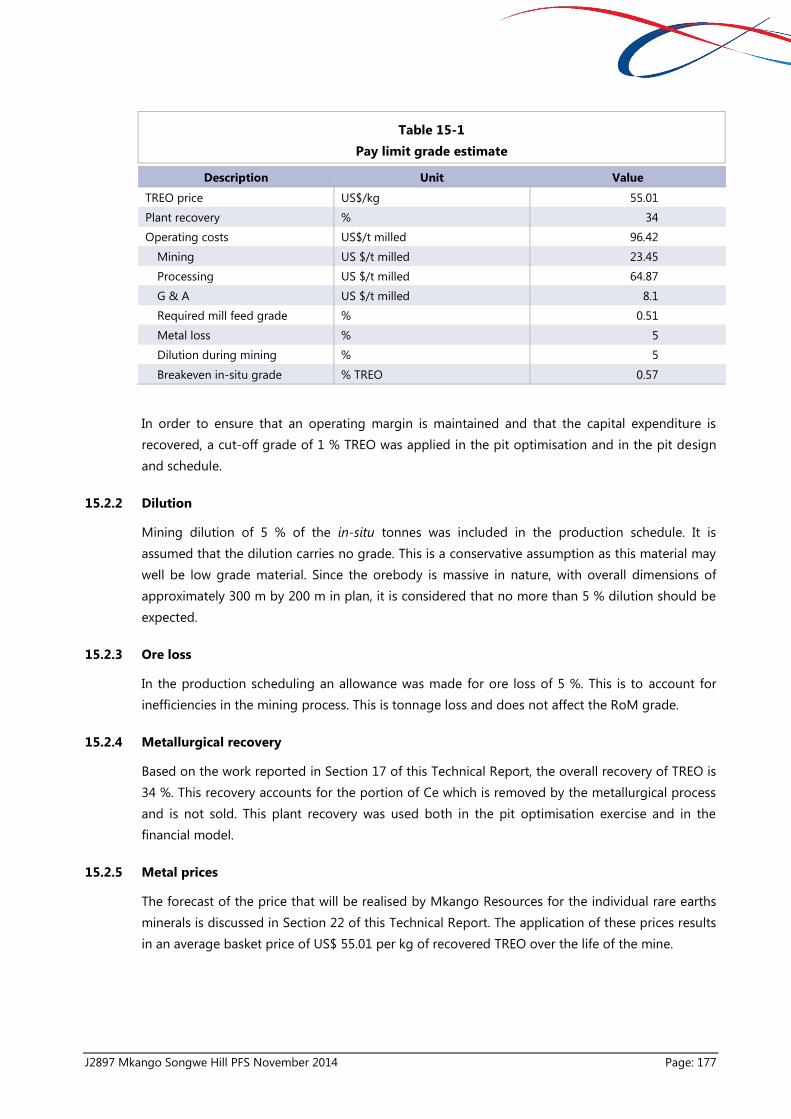
J2897 Mkango Songwe Hill PFS November 2014 Page: 177
Table 15-1
Pay limit grade estimate
Description Unit Value
TREO price US$/kg 55.01
Plant recovery % 34
Operating costs US$/t milled 96.42
Mining US $/t milled 23.45
Processing US $/t milled 64.87
G & A US $/t milled 8.1
Required mill feed grade % 0.51
Metal loss % 5
Dilution during mining % 5
Breakeven in-situ grade % TREO 0.57
In order to ensure that an operating margin is maintained and that the capital expenditure is
recovered, a cut-off grade of 1 % TREO was applied in the pit optimisation and in the pit design
and schedule.
15.2.2 Dilution
Mining dilution of 5 % of the in-situ tonnes was included in the production schedule. It is
assumed that the dilution carries no grade. This is a conservative assumption as this material may
well be low grade material. Since the orebody is massive in nature, with overall dimensions of
approximately 300 m by 200 m in plan, it is considered that no more than 5 % dilution should be
expected.
15.2.3 Ore loss
In the production scheduling an allowance was made for ore loss of 5 %. This is to account for
inefficiencies in the mining process. This is tonnage loss and does not affect the RoM grade.
15.2.4 Metallurgical recovery
Based on the work reported in Section 17 of this Technical Report, the overall recovery of TREO is
34 %. This recovery accounts for the portion of Ce which is removed by the metallurgical process
and is not sold. This plant recovery was used both in the pit optimisation exercise and in the
financial model.
15.2.5 Metal prices
The forecast of the price that will be realised by Mkango Resources for the individual rare earths
minerals is discussed in Section 22 of this Technical Report. The application of these prices results
in an average basket price of US$ 55.01 per kg of recovered TREO over the life of the mine.

J2897 Mkango Songwe Hill PFS November 2014 Page: 178
15.2.6 Other factor affecting the Mineral Reserve estimate
In the geotechnical study a range of slope angles for the open pit design are recommended,
namely (Table 16-4):
aggressive design;
conservative design; and
moderate design.
The initial pit optimisation and mine design, on which the Mineral Reserve Estimate is based, used
the moderate estimate, with a safety factor of 1.3. In order to understand the effect of a change in
slope design, should further detailed work show that the slope design needs to be revised, a pit
optimisation run was also done using the conservative design slope angles, with a safety factor of
1.5.
15.3 Mineral Reserves summary
The Mineral Reserves for the Songwe Hill Project, estimated as a result of this study, are
summarised in Table 15-2 below.
Table 15-2
Mineral Reserve Estimate summary
Category Tonnes TREO % TREO content (t)
Probable Mineral Reserves 8,482,603 1.60 136,139
Proven Mineral Reserves - - -
Total Mineral Reserves 8,482,603 1.60 136,139
Note: TREO – total rare earth oxides including yttrium.

J2897 Mkango Songwe Hill PFS November 2014 Page: 179
16 MINING METHODS
16.1 Introduction
The Mineral Resource models and grade estimates are considered to be appropriate as a basis for
a PFS.
The Songwe Hill Project will be mined using an open pit mining method. An earthmoving
contractor will be engaged to carry out the mining operations. Both the deposit and waste
mineralization will require drilling and blasting. A standard excavator and haul truck mining fleet
will be utilised, together with the requisite auxiliary equipment (graders, water trucks, etc).
16.2 Geotechnical Analysis
The objective of the geotechnical work carried out was to:
provide geotechnical design elements for the total mine design at an appropriate level of
confidence; and
evaluate and provide open pit slope design and layout.
A two-day site visit was conducted on the 6th and 7th May 2014. A site-walkover survey was
carried out to gain an understanding of the geological terrain of the proposed Songwe Hill open
pit mine (Figure 16-1). In addition, MSA conducted a review of the borehole cores that were
available at the core yard to obtain indicative data on the quality of the weathered, transitional
and fresh material.
Figure 16-1
Photograph of proposed area for Songwe Hill open pit mine
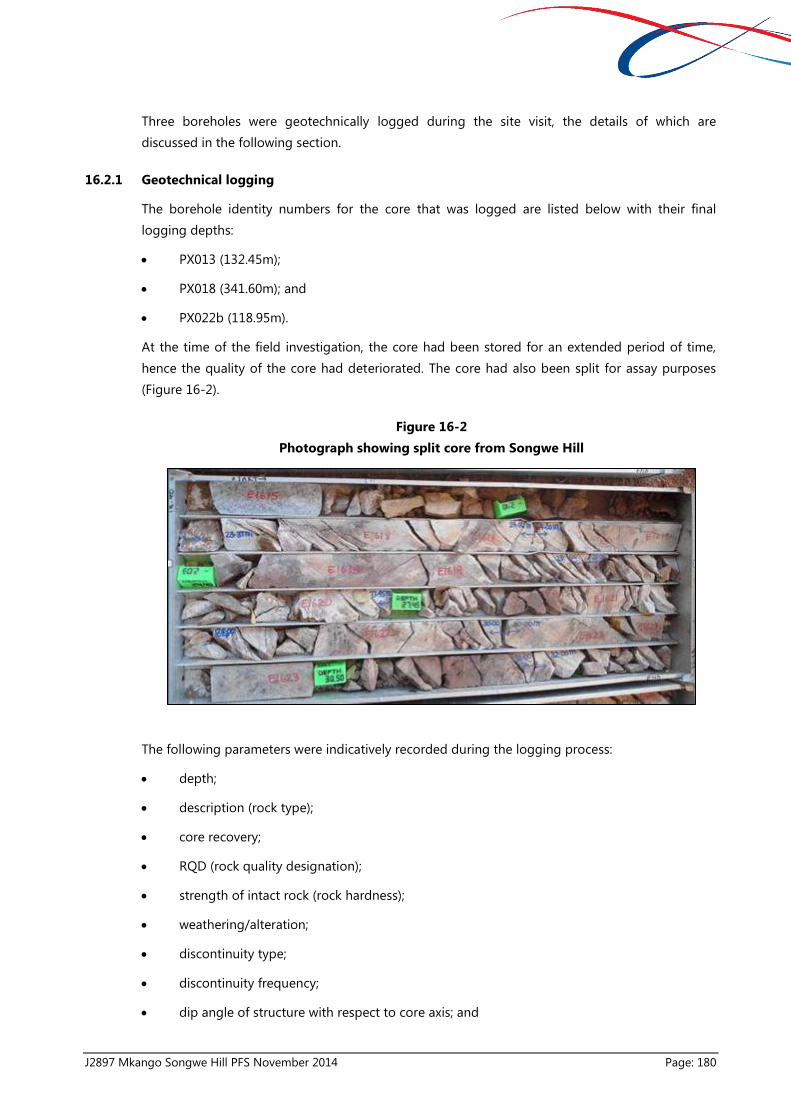
J2897 Mkango Songwe Hill PFS November 2014 Page: 180
Three boreholes were geotechnically logged during the site visit, the details of which are
discussed in the following section.
16.2.1 Geotechnical logging
The borehole identity numbers for the core that was logged are listed below with their final
logging depths:
PX013 (132.45m);
PX018 (341.60m); and
PX022b (118.95m).
At the time of the field investigation, the core had been stored for an extended period of time,
hence the quality of the core had deteriorated. The core had also been split for assay purposes
(Figure 16-2).
Figure 16-2
Photograph showing split core from Songwe Hill
The following parameters were indicatively recorded during the logging process:
depth;
description (rock type);
core recovery;
RQD (rock quality designation);
strength of intact rock (rock hardness);
weathering/alteration;
discontinuity type;
discontinuity frequency;
dip angle of structure with respect to core axis; and
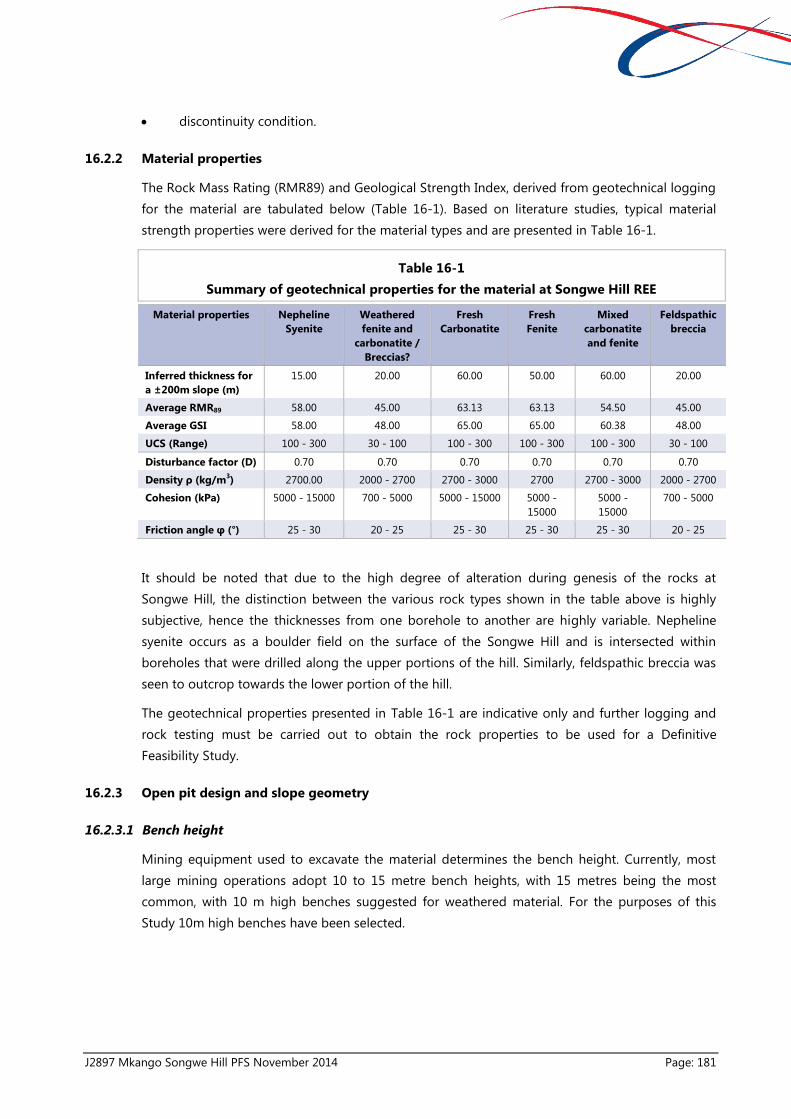
J2897 Mkango Songwe Hill PFS November 2014 Page: 181
discontinuity condition.
16.2.2 Material properties
The Rock Mass Rating (RMR89) and Geological Strength Index, derived from geotechnical logging
for the material are tabulated below (Table 16-1). Based on literature studies, typical material
strength properties were derived for the material types and are presented in Table 16-1.
Table 16-1
Summary of geotechnical properties for the material at Songwe Hill REE
Material properties Nepheline
Syenite
Weathered
fenite and
carbonatite /
Breccias?
Fresh
Carbonatite
Fresh
Fenite
Mixed
carbonatite
and fenite
Feldspathic
breccia
Inferred thickness for
a ±200m slope (m)
15.00 20.00 60.00 50.00 60.00 20.00
Average RMR89 58.00 45.00 63.13 63.13 54.50 45.00
Average GSI 58.00 48.00 65.00 65.00 60.38 48.00
UCS (Range) 100 - 300 30 - 100 100 - 300 100 - 300 100 - 300 30 - 100
Disturbance factor (D) 0.70 0.70 0.70 0.70 0.70 0.70
Density ρ (kg/m3) 2700.00 2000 - 2700 2700 - 3000 2700 2700 - 3000 2000 - 2700
Cohesion (kPa) 5000 - 15000 700 - 5000 5000 - 15000 5000 -
15000
5000 -
15000
700 - 5000
Friction angle φ (°) 25 - 30 20 - 25 25 - 30 25 - 30 25 - 30 20 - 25
It should be noted that due to the high degree of alteration during genesis of the rocks at
Songwe Hill, the distinction between the various rock types shown in the table above is highly
subjective, hence the thicknesses from one borehole to another are highly variable. Nepheline
syenite occurs as a boulder field on the surface of the Songwe Hill and is intersected within
boreholes that were drilled along the upper portions of the hill. Similarly, feldspathic breccia was
seen to outcrop towards the lower portion of the hill.
The geotechnical properties presented in Table 16-1 are indicative only and further logging and
rock testing must be carried out to obtain the rock properties to be used for a Definitive
Feasibility Study.
16.2.3 Open pit design and slope geometry
16.2.3.1 Bench height
Mining equipment used to excavate the material determines the bench height. Currently, most
large mining operations adopt 10 to 15 metre bench heights, with 15 metres being the most
common, with 10 m high benches suggested for weathered material. For the purposes of this
Study 10m high benches have been selected.

J2897 Mkango Songwe Hill PFS November 2014 Page: 182
16.2.3.2 Bench width
Minimum bench widths of 6.5 to 7.5 m are suggested based on the empirical relationships used
to optimise bench width for containment and catching failure volumes: Bench Width (m)=0.2
×Bench Height+4.5, recommended by the SME Mine Engineering Handbook (1992).
16.2.3.3 Overall slope angle
The overall slope angle (osa) was determined using the empirical slope design chart proposed by
Haines and Terbrugge (1991). The design chart relates the height of the slope and the Adjusted
Mining Rock Mass Rating (MRMR) value of the material to a stable slope angle (Figure 16-3).
Overall slope angles are shown for slope heights of 150 m, 200 m and 250 m.
Figure 16-3
Adjusted MRMR chart showing overall slope angles, Songwe Hill REE
The adjusted MRMR was calculated by multiplying the RMR89 by adjustment factors for blasting,
weathering, orientation and mining induced stresses. The adjustment factors used are shown in
Table 16-2.

J2897 Mkango Songwe Hill PFS November 2014 Page: 183
Table 16-2
MRMR adjustment factors, Songwe Hill REE
Domain RMR89 Adjustments to calculate MRMR Adjusted
MRMR Blasting Weathering Orientation Mining-induced
stresses
Nepheline Syenite 58.00 0.85 0.86 0.80 1.00 33.92
Weathered fenite and
carbonatite
45.00 0.85 0.74 1.00 1.00 28.31
Fresh Carbonatite 63.13 0.85 0.94 0.80 1.00 40.35
Fresh Fenite 63.13 0.85 0.94 0.80 1.00 40.35
Mixed carbonatite and
fenite
54.50 0.85 0.82 0.80 1.00 30.39
Feldspathic breccia 45.00 0.85 0.74 1.00 1.00 28.31
Average Adjusted MRMR 33.60
It is anticipated that regular drilling and blasting will produce poor side walls. An average of three
joint sets was recorded during core logging in fresh rock, while circular failure will be dominant
within the weathered material and breccia. Mining induced stresses will be negligible. Weathering
adjustments were determined using Table 16-3.
Table 16-3
Adjustments for weathering
Domain Potential weathering and adjustments (%)
0.5 years 1 year 2 years 3 years 4 years 4+ years
Fresh 100 100 100 100 100 100
Slight 88 90 92 94 94 96
Moderate 82 84 86 88 88 90
High 70 72 74 76 76 78
Complete 54 56 58 60 60 62
Residual soil 30 32 34 36 36 38
Source: Laubscher (1990)
16.2.3.4 Bench face angles
The individual bench face angles (BFA) were calculated mathematically after the stack angles and
overall slope angles were determined. Bench face angles for a slope height of 200 m were
determined. Further investigations will need to be carried out to determine more accurate domain
thicknesses for varying slope heights.
16.2.4 Slope Configuration
Based on the analysis conducted by MSA, MSA’s experience on similar types of orebodies and
rock types, and adopting a moderate approach, the following slope angles have been assumed
for the purposes of this PFS. During the next stage of Study, in order to confirm MSA’s
assumptions in this regard, more detailed work will need to be carried out.

J2897 Mkango Songwe Hill PFS November 2014 Page: 184
Stack angles and overall slope angles for slope heights of 150 m, 200 m and 250 m were
determined using the empirical slope design chart (Figure 16-3). The concept slope geometrical
configurations for Songwe Hill are presented in Table 16-4 and illustrated in Figure 16-4.

J2897 Mkango Songwe Hill PFS November 2014 Page: 185
Table 16-4
Slope configurations for Songwe Hill REE
Domain Threshold
Safety Factor
Stack Angles (degrees) Bench Face Angles and No. of
Benches for 200 m Slope
SME Guidelines Width of catch
bench between
stacks (m) 150 m
slope
height
200 m
slope
height
250 m
slope
height
BFA for 200 m
slope (degrees)
No. of
benches
required
Maximum
bench height
(m)
Minimum
bench width
(m)
Nepheline Syenite
1.20
49.00 44.50 39.50 44.50 1.00 15 7.5
15
Weathered fenite
& carbonatite
46.00 42.00 37.50 52.00 2.00 10 6.5
Fresh Carbonatite 52.00 47.00 42.00 61.00 4.00 15 7.5
Fresh Fenite 52.00 47.00 42.00 60.00 4.00 15 7.5
Mixed carbonatite
and fenite
47.50 43.00 38.50 55.00 4.00 15 7.5
Feldspathic breccia 46.00 42.00 37.50 52.00 2.00 10 6.5
Overall Slope Angles (degrees)
Aggressive design 1.20 49.00 44.50 40.00
Conservative
design
1.50 39.00 34.50 30.00
Moderate design 1.30 45.67 41.17 36.67
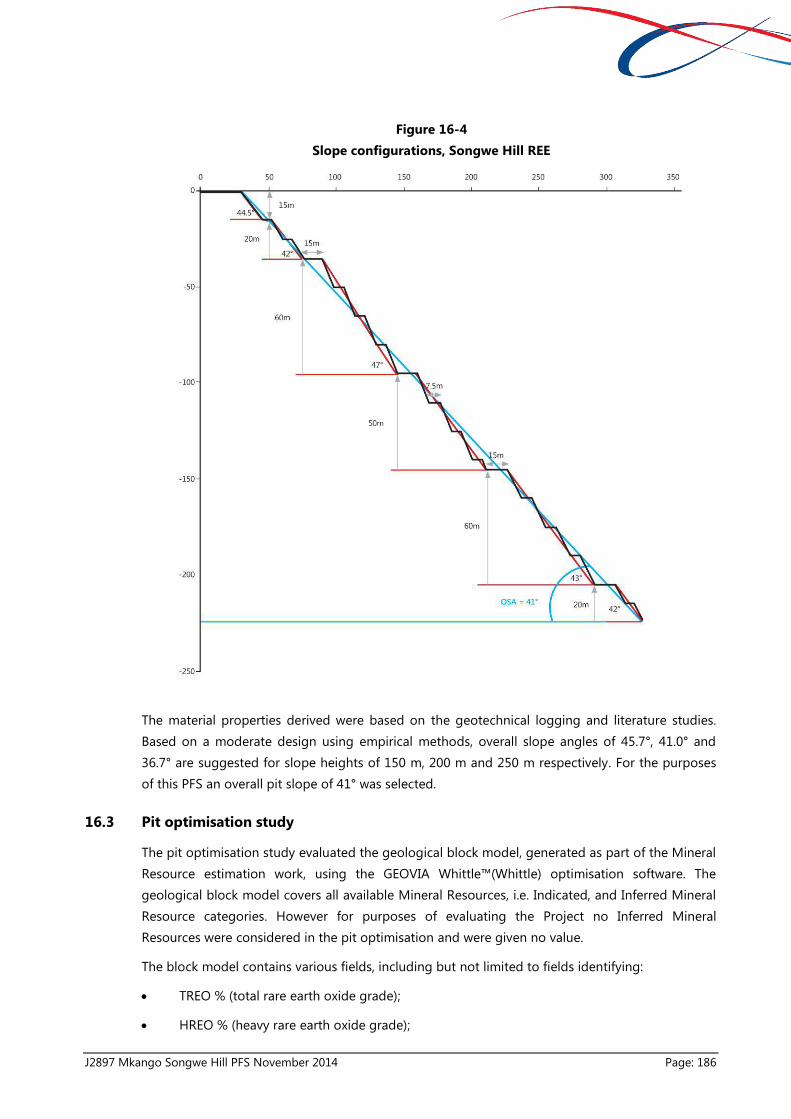
J2897 Mkango Songwe Hill PFS November 2014 Page: 186
Figure 16-4
Slope configurations, Songwe Hill REE
The material properties derived were based on the geotechnical logging and literature studies.
Based on a moderate design using empirical methods, overall slope angles of 45.7°, 41.0° and
36.7° are suggested for slope heights of 150 m, 200 m and 250 m respectively. For the purposes
of this PFS an overall pit slope of 41° was selected.
16.3 Pit optimisation study
The pit optimisation study evaluated the geological block model, generated as part of the Mineral
Resource estimation work, using the GEOVIA Whittle™(Whittle) optimisation software. The
geological block model covers all available Mineral Resources, i.e. Indicated, and Inferred Mineral
Resource categories. However for purposes of evaluating the Project no Inferred Mineral
Resources were considered in the pit optimisation and were given no value.
The block model contains various fields, including but not limited to fields identifying:
TREO % (total rare earth oxide grade);
HREO % (heavy rare earth oxide grade);

J2897 Mkango Songwe Hill PFS November 2014 Page: 187
LREO % (light rare earth oxide grade); and
Mineral Resource category (Measured, Indicated or Inferred).
The TREO grade was used as the primary grade field in the pit optimisation study. The sales price
used in the model was stated per kg of TREO produced. A set of techno-economic data was
generated against which to evaluate the Mineral Resource model (Table 16-5).
Table 16-5
Techno-economic data set for pit optimisation.
Item Amount Units
Operating Costs
Mining Cost 4.24 US$/t rock mined
Processing Cost 58.20 US$/t milled
General and Administration cost 8.73 US$/t milled
Capital Cost
Mining Capital 1.657 US$ million
Plant Capital 135.5 US$ million
Infrastructure 41.4 US$ million
Other Project Capital 30.1 US$ million
Sustaining Capital 1.0 US$ million per year
Technical Factors
Mining Dilution 5 %
Mining Loss 5 %
Metallurgical Recovery 34% %
Cut-off Grade 1.00 % TREO
Production Rate 500,000 tpa
Geotechnical
Overall Slope Angle uphill (high) side of pit 41 Degrees
Overall Slope Angle downhill (low) side of pit 46 Degrees
Economic
Royalties 5 %
Discount Factor 10 %
TREO Price 43,100 US$/tonne TREO
Note: 1) It is specifically noted that data used in this evaluation is preliminary in nature and it may not exactly
match the final data used in the Project evaluation later in this document.
2) The mining costs are quoted as per tonne of rock mined and will be applied to ore and waste.
3) TREO recovery is quoted excluding cerium, i.e. cerium is extracted as a waste product and attracts no
value.
4) The TREO price used is the forecast price realised after toll treatment and transport.
Table 16-6 summarises the results from the Whittle optimisation runs, based on the dataset
defined above.

J2897 Mkango Songwe Hill PFS November 2014 Page: 188
Table 16-6
Summary of Whittle pit shells
Pit Shell NPV at 10% Ore tonnes Waste tonnes Mine Life
(Years)
IRR (%)
1 -113,451,152 431,553 514,356 0.86311 0
2 -99,275,166 513,021 661,005 1.02604 0
3 -74,130,736 689,501 847,990 1.379 0
4 -1,143,712 1,378,387 1,443,585 2.75677 9.25
5 52,524,687 2,019,158 2,139,439 4.03832 19.15
6 75,711,522 2,348,164 2,536,834 4.69633 21.21
7 166,277,142 4,054,877 6,140,806 8.10975 25.43
8 201,613,042 4,904,446 8,816,471 9.80889 25.98
9 246,752,239 6,218,360 13,993,607 12.43672 26.55
10 254,905,957 6,581,914 15,324,217 13.16383 26.44
11 268,739,341 7,329,179 19,155,177 14.65836 26.07
12 275,444,010 7,833,928 22,102,544 15.66786 25.78
13 278,052,609 8,225,458 24,468,028 16.45092 25.34
14 278,594,817 8,519,898 26,836,293 17.0398 24.96
15 278,783,905 8,536,295 26,930,290 17.07259 24.96
16 278,626,978 8,736,128 29,097,118 17.47226 24.67
17 277,639,277 8,874,357 30,624,264 17.74871 24.42
18 275,703,179 9,120,084 33,107,825 18.24017 24.03
19 275,285,852 9,142,020 33,415,473 18.28404 23.96
20 275,148,042 9,157,644 33,520,410 18.31529 23.94
21 275,149,624 9,165,683 33,701,245 18.33137 23.94
22 269,788,442 9,514,857 37,893,421 19.02971 23.35
23 269,539,088 9,547,083 38,126,375 19.09417 23.32
24 269,513,169 9,551,451 38,184,161 19.1029 23.32
25 262,359,211 9,912,900 45,405,113 19.8258 22.64
From Table 16-6 it can be seen that the NPV peaks at pit shell number 15. Consequently pit shell
15 was selected as the optimum pit shell used to develop the detailed pit design.
Table 16-7 is a summary of the material contained in the optimised pit shell.

J2897 Mkango Songwe Hill PFS November 2014 Page: 189
Table 16-7
Summary of optimised pit shell
Waste 26.930 million tonnes
Ore 8.536 million tonnes
Strip ratio (Waste tonne : ore tonne) 3.15
TREO grade (RoM) 1.616 %
Contained TREO (RoM) 137,989 tonnes
The figures below (Figure 16-5 and Figure 16-6) show the extent of the open pit generated by
Whittle and a typical cross section through pit shell number 15.
Figure 16-5
Dimensional view of pit shell number 15

J2897 Mkango Songwe Hill PFS November 2014 Page: 190
Figure 16-6
Section through open pit shell number 15, showing block model coloured by grade
16.4 Pit Design
The open pit mining method that will be employed is a standard drill, blast, truck and shovel
method. Mining will take place in the following manner:
soft topsoil and overburden will be removed using a dozer and stockpiled separately;
10 m benches will be drilled and blasted with a typical blast size of 40 m by 40 m by 10 m
bench height;
controlled blasting will be employed to ensure minimal movement of the blasted muck pile;
drill hole sampling will be employed to delineate the ore and waste, which will be marked
separately by the mine geologist, before loading commences; and
waste and ore will be loaded into haul trucks with ore being delivered to the ROM stockpile
and waste being delivered to a waste dump adjacent to the open pit.
Loading and hauling of waste will be a 24 hour operation. Ore mining will only be carried out
during the day shift to ensure effective grade control.
A practical pit design was carried out using the optimum pit shell as a guide. The pit design
considers practical mining constraints and requirements such as in-pit ramps, minimum pit room
required and practical pit geometry. Consequently the final pit design has a higher strip ratio than
the optimised pit shell. The overall dimensions of the final open pit will be approximately 650 m

J2897 Mkango Songwe Hill PFS November 2014 Page: 191
north to South, by 450 m East to West and at its deepest will be 300 m deep when measured from
the highest point of the pit on the southern side of the pit. The upper most bench is at an
elevation of 945 m and the final pit floor is at 645 m elevation.
The pit will be mined in a series of five push backs, with the mining of pushback 1 commencing
on the 775 m elevation with the initial ramp. There is no pre-strip required as the initial mining is
in ore with strip ratio of less than 1.5:1 in the first year of mining. The overall strip ratio of the final
pit is 4.5:1 (tonne:tonne).
Figure 16-7 below shows the five pushbacks making up the final pit. Figure 16-8 shows a plan
view of the final pit design and Figure 16-9 a section through Section Line A-A as indicated on the
plan view.
Figure 16-7
Plan view showing pit pushbacks

J2897 Mkango Songwe Hill PFS November 2014 Page: 192
Figure 16-8
Plan view of final pit
Figure 16-9
Section A-A through final pit, looking East
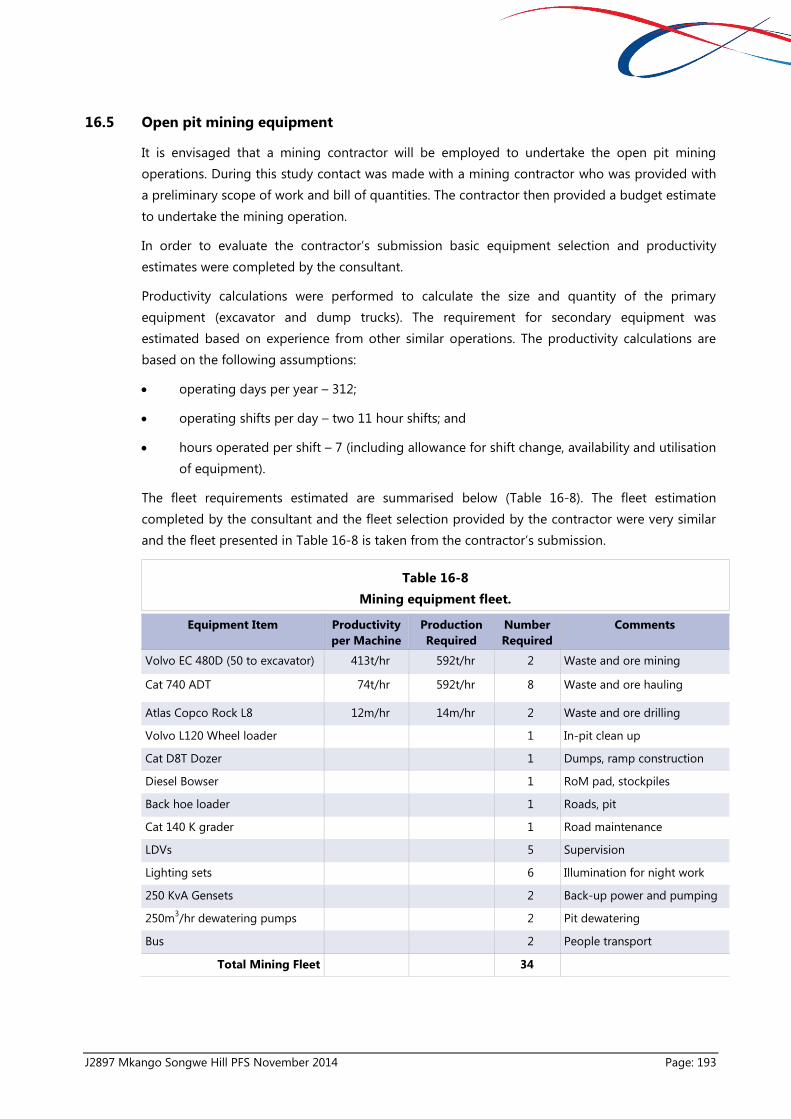
J2897 Mkango Songwe Hill PFS November 2014 Page: 193
16.5 Open pit mining equipment
It is envisaged that a mining contractor will be employed to undertake the open pit mining
operations. During this study contact was made with a mining contractor who was provided with
a preliminary scope of work and bill of quantities. The contractor then provided a budget estimate
to undertake the mining operation.
In order to evaluate the contractor’s submission basic equipment selection and productivity
estimates were completed by the consultant.
Productivity calculations were performed to calculate the size and quantity of the primary
equipment (excavator and dump trucks). The requirement for secondary equipment was
estimated based on experience from other similar operations. The productivity calculations are
based on the following assumptions:
operating days per year – 312;
operating shifts per day – two 11 hour shifts; and
hours operated per shift – 7 (including allowance for shift change, availability and utilisation
of equipment).
The fleet requirements estimated are summarised below (Table 16-8). The fleet estimation
completed by the consultant and the fleet selection provided by the contractor were very similar
and the fleet presented in Table 16-8 is taken from the contractor’s submission.
Table 16-8
Mining equipment fleet.
Equipment Item Productivity
per Machine
Production
Required
Number
Required
Comments
Volvo EC 480D (50 to excavator) 413t/hr 592t/hr 2 Waste and ore mining
Cat 740 ADT 74t/hr 592t/hr 8 Waste and ore hauling
Atlas Copco Rock L8 12m/hr 14m/hr 2 Waste and ore drilling
Volvo L120 Wheel loader 1 In-pit clean up
Cat D8T Dozer 1 Dumps, ramp construction
Diesel Bowser 1 RoM pad, stockpiles
Back hoe loader 1 Roads, pit
Cat 140 K grader 1 Road maintenance
LDVs 5 Supervision
Lighting sets 6 Illumination for night work
250 KvA Gensets 2 Back-up power and pumping
250m3/hr dewatering pumps 2 Pit dewatering
Bus 2 People transport
Total Mining Fleet 34

J2897 Mkango Songwe Hill PFS November 2014 Page: 194
16.6 Open pit Mining Schedule
An open pit mining schedule was developed based on the open pit mine design described
Section 16.4 above and the optimum pit shell generated in the pit optimisation. The production
rate target was set to 500,000 tonnes per year of ore. The production rate was selected by the
Mine Owner based on their assessment of the market and their strategic intent. The production
rate of 500,000 tpa, which requires total material movement of an average of 2.6 million tonnes
per year, is low for a pit of these dimensions. A production rate significantly higher than this could
be maintained from this pit, and may be considered as the Project progresses.
The production schedule that was developed provides for the mining and processing of high
grade material early in the life of the mine. An overall cut-off grade of 1.00 % TREO was applied to
determine if material is treated as ore or waste. In addition to this, ore is categorised as high
grade or low grade based on a cut-off of 1.40 % TREO. Material between with an in-situ grade of
between 1.00 % and 1.40 % TREO will be marked as low grade and stockpiled in the initial years.
The low grade stockpile will grow to a maximum of 4 million tonnes during the mine life. The
average grade of the high grade material delivered to the plant is 1.85 % TREO and the low grade
1.14 % TREO.
All waste material will be delivered by truck to the waste dump and no backfilling of the open pit
is planned.
No Inferred Mineral Resources were included as ore in the production schedule. Only material
sourced from Indicated Mineral Resources was included as ore. There are no Measured Mineral
Resources in the current Mineral Resource Estimation. The exclusion of Inferred Mineral Resources
also allows for some upside, either in mine life or in the annual production rate, in the future if the
Inferred Mineral Resources can be upgraded to Measured or Indicated Mineral Resources. The
current pit design includes 3.877 million tonnes of Inferred Mineral Resources at an average grade
of 1.50 % TREO (in situ grade), which has not been considered as ore in this study.
Table 16-9 shows a summary of the mining schedule.

J2897 Mkango Songwe Hill PFS November 2014 Page: 195
Table 16-9
Summary of open pit mining schedule
Description Total / Average Unit Year 1 Year 2 Year 3 Year 4 Year 5 Year 6 Year 7 Year 8 Year 9 Year 10 Year 11 Year 12 Year 13 Year 14 Year 15 Year 16 Year 17 Year 18
Waste tonnes mined 1,068,865 1,528,326 1,040,988 2,064,652 1,842,227 1,917,310 1,868,717 1,469,575 1,596,984 2,394,980 3,067,241 2,603,481 3,021,995 3,283,584 3,223,874 2,775,661 2,788,040 885,228
Ore mined 734,831 440,201 1,357,370 333,705 562,700 481,045 529,640 928,782 807,944 3,376 216,344 500,012 268,161 180,092 59,711 507,924 502,116 68,650
Total mined tonnes 1,803,696 1,968,526 2,398,358 2,398,357 2,404,927 2,398,355 2,398,357 2,398,358 2,404,928 2,398,356 3,283,585 3,103,493 3,290,156 3,463,676 3,283,585 3,283,585 3,290,155 953,878
ROM Production
High Grade
Tonnage 5,245,160 tonnes 539,695 240,554 949,790 189,458 401,232 153,337 294,072 646,556 532,274 2,521 133,550 288,428 188,978 103,885 47,288 233,265 263,073 37,202
TREO % 1.89 % 2.25 2.23 1.85 1.57 2.07 1.71 1.76 1.80 1.74 1.79 2.12 1.76 1.71 1.75 2.79 1.82 1.84 1.53
Content 99,033 tonnes 12,143 5,359 17,571 2,983 8,316 2,625 5,169 11,655 9,238 45 2,827 5,082 3,238 1,822 1,320 4,239 4,831 568
Low Grade
Tonnage 3,237,443 tonnes 195,136 199,647 407,580 144,246 161,469 327,707 235,568 282,226 275,670 855 82,793 211,584 79,183 76,207 12,422 274,659 239,042 31,448
TREO % 1.15 % 1.13 1.11 1.15 1.16 1.15 1.12 1.15 1.14 1.15 1.06 1.12 1.15 1.13 1.15 1.08 1.17 1.20 1.12
Content 37 107 tonnes 2,211 2,214 4,693 1,675 1,852 3,660 2,711 3,215 3,161 9 928 2,428 895 874 135 3,221 2,872 352
Total
Tonnage 8 ,482,603 tonnes 734,831 440,201 1,357,370 333,705 562,700 481,045 529,640 928,782 807,944 3,376 216,344 500,012 268,161 180,092 59,711 507,924 502,116 68,650
TREO % 1.60 % 1.95 1.72 1.64 1.40 1.81 1.31 1.49 1.60 1.53 1.61 1.74 1.50 1.54 1.50 2.44 1.47 1.53 1.34
Content 136,139 tonnes 14,355 7,573 22,264 4,658 10,168 6,285 7,880 14,870 12,399 54 3,754 7,510 4,133 2,697 1,455 7,460 7,704 920
Stock Pile and Processing
High Grade
Opening Balance
Tonnage 64,624 tonnes - 339,695 80,249 530,039 219,498 120,729 - - 146,556 178,830 - - - - - - - -
TREO % 1.95 % - 2.25 2.24 1.88 1.80 1.98 - - 1.80 1.75 - - - - - - - -
Content 1,261 tonnes - 7,643 1,798 9,967 3,951 2,386 - - 2,642 3,130 - - - - - - - -
Closing Balance
Tonnage 64,624 tonnes 339,695 80,249 530,039 219,498 120,729 - - 146,556 178,830 - - - - - - - - -
TREO % 1.95 % 2.25 2.24 1.88 1.80 1.98 - - 1.80 1.75 - - - - - - - - -
Content 1,261 tonnes 7,643 1,798 9,967 3,951 2,386 - - 2,642 3,130 - - - - - - - - 0
Processing
Tonnage 5,245,160 tonnes 200,000 500,000 500,000 500,000 500,000 274,067 294,072 500,000 500,000 181,351 133,550 288,428 188,978 103,885 47,288 233,265 263,073 37,202
TREO % 1.89 % 2.25 2.24 1.88 1.80 1.98 1.83 1.76 1.80 1.75 1.75 2.12 1.76 1.71 1.75 2.79 1.82 1.84 1.53
Content 99,033 tonnes 4,500 11,204 9,402 8,999 9,881 5,011 5,169 9,013 8,750 3,175 2,827 5,082 3,238 1,822 1,320 4,239 4,831 568
Low Grade
Opening Balance
Tonnage 612,996 - 195,136 394,783 802,362 946,609 1,108,077 1,209,852 1,239,491 1,521,718 1,797,388 1,479,593 1,195,937 1,195,949 964,110 644,202 203,913 211,837 213,953
TREO% 1.14 - 1.13 1.12 1.14 1.14 1.14 1.14 1.14 1.14 1.14 1.14 1.14 1.14 1.14 1.14 1.14 1.16 1.18
Content 6,983 - 2,211 4,425 9,118 10,793 12,645 13,739 14,107 17,321 20,482 16,860 13,616 13,633 10,984 7,343 2,322 2,454 2,527
Closing Balance
Tonnage 612,996 195,136 394,783 802,362 946,609 1,108,077 1,209,852 1,239,491 1,521,718 1,797,388 1,479,593 1,195,937 1,195,949 964,110 644,202 203,913 211,837 213,953 -
TREO % 1.14 1.13 1.12 1.14 1.14 1.14 1.14 1.14 1.14 1.14 1.14 1.14 1.14 1.14 1.14 1.14 1.16 1.18 -
Content 6,983 2,211 4,425 9,118 10,793 12,645 13,739 14,107 17,321 20,482 16,860 13,616 13,633 10,984 7,343 2,322 2,454 2,527 -
Processing
Tonnage 3,237,443 - - - - - 225,933 205,928 - - 318,649 366,450 211,572 311,022 396,115 452,712 266,735 236,927 245,401
TREO % 1.15 - - - - - 1.14 1.14 - - 1.14 1.14 1.14 1.14 1.14 1.14 1.16 1.18 1.17
Content 37,107 - - - - - 2,566 2,344 - - 3,631 4,172 2,412 3,544 4,515 5,156 3,090 2,799 2,880
Total Processing
Tonnage 8,482,603 tonnes 200,000 500,000 500,000 500,000 500,000 500,000 500,000 500,000 500,000 500,000 500,000 500,000 500,000 500,000 500,000 500,000 500,000 282,603
TREO % 1.60 % 2.25 2.2 1.88 1.80 1.98 1.52 1.50 1.80 1.75 1.36 1.40 1.50 1.36 1.27 1.30 1.47 1.53 1.22
Content 136,139 tonnes 4,500 11,204 9,402 8,999 9,881 7,577 7,513 9,013 8,750 6,806 6,999 7,494 6,781 6,338 6,476 7,329 7,630 3,447

J2897 Mkango Songwe Hill PFS November 2014 Page: 196
17 RECOVERY METHODS
17.1 Process Overview
The process design is based on a comprehensive testwork program which is discussed in more
detail in Section 13. Mkango is targeting a high grade critical and heavy rare earth enriched,
mixed rare earth hydroxide product that is cerium depleted. The key design parameters for the
processing plant are summarised in Table 17-1.
Table 17-1
Key design parameters
Description Value
Plant feed ROM (t/a) 500,000
Head grade (TREO - %) 1.6
Concentrate grade (TREO - %) 4.7
Concentrate mass pull (% of ROM feed) 23.1
Concentrate recovery (TREO - %) 67
Dry hydrometallurgy plant feed solids (t/a) 115,250
Plant availability (%) 91
The process flow sheet as illustrated in Figure 17-1 consists of:
the Beneficiation Plant which functionally includes for the physical concentration of the rare
earth host minerals and the rejection of gangue minerals; and
the Recovery Plant which functionally includes for the chemical recovery, purification and
concentration of the rare earths employing a simple hydrochloric acid leach process.
The beneficiation plant comprises the comminution and flotation circuits. The purpose of the
comminution circuit is to reduce the size of solid ore particles and thus increase the surface area
of solids to enable the liberation of valuable materials that are locked within the gangue minerals.
This is achieved by means of crushing and milling.
Flotation is used to upgrade the mineralized material. Flotation is a method of separation, which
uses the differing surface properties of the various minerals in the ore. It involves the selective
attachment of mineral particles to air bubbles generated in the flotation cell which float to the
surface of the slurry and then flow over the lip of the cells into the launders. A selective flotation
reagent regime is used to separate rare earths oxide minerals from gangue minerals.

J2897 Mkango Songwe Hill PFS November 2014 Page: 197
Figure 17-1
Process flow sheet

J2897 Mkango Songwe Hill PFS November 2014 Page: 198
The beneficiation process plant comprises:
ore receiving and crushing;
stockpile;
milling;
flotation;
thickening;
filtration;
tailings;
tailings transfer;
plant utilities;
air; and
flotation reagents.
The recovery process flow sheet comprises a two stage selective hydrochloric acid leach process.
The hydrochloric acid is recycled via calcium sulphate precipitation with sulphuric acid. The
process flow sheet also includes caustic conversion, rare earth dissolution, purification, cerium
rejection and rare earth hydroxide precipitation (Figure 17-1). This approach offers advantages
including a significant reduction in acid costs as well as a further concentration of the rare earths
thus providing a reduction in downstream capital and operating costs.
The recovery process plant comprises the following:
calcite leach;
HCl rare earth leach;
caustic conversion 1;
rare earth dissolution;
waste neutralization;
HCl Regeneration 1,2, and 3;
solution adjustment and purification;
raw rare earth hydroxide precipitation;
Cerium removal;
final rare earth hydroxide precipitation;
reagents;
emergency power;
caustic conversion 2; and
residue leaching.

J2897 Mkango Songwe Hill PFS November 2014 Page: 199
17.2 Process Facilities
17.2.1 Ore receiving and crushing plant
ROM ore with a maximum particle size of 750 mm will be delivered to the ROM bin via mine haul
trucks. The ROM bin is fitted with an inclined static 750 mm aperture grizzly to prevent oversize
material entering the ROM bin. The bin discharges through a feed chute onto a vibrating grizzly
feeder with an opening of 150 mm. Undersize material discharges via a chute onto the sacrificial
conveyor. Oversize material discharges into the primary jaw crusher. The primary crusher is a
single toggle with a 110 kW motor installed. Jaw crusher product, discharges and combines with
the vibrating grizzly feeder undersize onto a sacrificial conveyor.
The sacrificial conveyor discharges onto the secondary crusher feed conveyor. The secondary
crusher feed conveyor discharges onto the double deck crusher feed screen. The screen (bottom
deck) undersize material discharges onto the screen undersize conveyor. The material is
transferred through a chute onto the stockpile feed tripper conveyor. The top deck screen
oversize discharges onto the secondary crusher feed conveyor and the bottom deck screen
oversize discharges onto the tertiary crusher feed conveyor.
The secondary crusher is a standard head cone crusher with an installed motor power of 90 kW.
Secondary crusher product is recycled to the double deck screen. The tertiary crusher is a short
head cone crusher with an installed motor power of 132 kW. Tertiary crusher product is also
recycled to the double deck screen.
17.2.2 Stockpile
The mill feed stockpile conveyor discharges onto the mill feed stockpile. The mill feed stockpile
has a nominal capacity of 2,283 tonnes, equivalent to 24 hours of milling capacity. Crushed ore is
drawn off this stockpile using withdrawal vibrating feeders. Each feeder discharges onto the ball
mill feed conveyor. Ball mill feed rate control is achieved using the variable speed vibrating
feeders.
17.2.3 Milling
The ball mill operates in a closed circuit with a cyclone cluster to produce a product size P80 of
53 µm in the cyclone overflow which provides the necessary degree of liberation for recovery. The
ball mill has an installed power of 1,200 kW. The ball mill discharges into the mill discharge sump
then the slurry is transferred into the cyclone cluster. The ball mill re-circulating load is designed
at 230 %. The cyclone underflow is designed to operate at a density of 70 % solids and will be
recycled to the mill feed hopper via launders. The cyclone overflow with a density of 30 % solids
will gravitate into the Conditioning Feed Tank A.
17.2.4 Flotation
The cyclone overflow serves as the feed to the flotation circuit. The conditioning tanks are fed
from the bottom and overflow from the top to the next tank to maximise conditioning by the
flotation reagents. The flotation feed conditioning consists of three 200 m3 agitated tanks in
series, designed to give the flotation feed slurry an overall staged conditioning residence time of

J2897 Mkango Songwe Hill PFS November 2014 Page: 200
three hours (one hour per stage) prior to flotation. Steam will be injected into the conditioning
tanks to raise the slurry temperature to 55 °C for conditioning. The modifier and activator are
added into Conditioning Tank A, the depressant is added to Conditioning Tank B and the
collector will be added to Conditioning Tank C. Conditioned slurry from the third conditioning
tank overflows into conditioning tank overflow sump and is pumped by the variable speed
flotation feed pumps to the flotation cells.
The rougher flotation circuit consists of 6x50 m3 forced draught tank cells in series to give an
effective pulp residence time of 20 minutes. Each tank is maintained under independent level and
air flow control, with air supplied by flotation blowers. Conditioned slurry from the conditioning
tank overflow sump is pumped by one of the pumps to the rougher flotation cells through a
rougher feed sampler for metallurgical accounting. Additional collector will also be added as
required to the Flotation Cell A. Tailings from Flotation Cell C will gravitate into an agitated
Rougher D feed conditioning tank where the collector is added for further conditioning prior to
feeding Flotation Cell D.
Tailings from the last rougher tank cell F gravitates into the rougher tailings sump through a tails
sampler for metallurgical accounting and control purposes. Tails slurry is pumped by one of the
rougher tails pumps into the tailings thickener for thickening prior to disposal to the tails storage
facility.
Rougher concentrate gravitates through launders to the common concentrate sump. Concentrate
is then pumped by one of the rougher concentrate pumps into the concentrate thickener.
17.2.5 Concentrate thickening
Final concentrate from the flotation circuit is pumped to a single concentrate thickener. Thickener
overflow gravitates into the overflow sump and is pumped by one of the overflow pumps to the
process water tank, while thickener underflow is withdrawn from the cone by one of the
underflow pumps and pumped forward at a density of 55 % solids (m/m – mass fraction) to the
concentrate filter feed tank.
17.2.6 Concentrate filtration
Concentrate slurry is pumped from the filter feed tank to the concentrate filter press. The filter has
been sized to accommodate a nominal solids feed rate of 14.7 t/h. Filter cake discharges onto the
filter product conveyor at 85 % solids (m/m). The filtrate flows into the filtrate sump and is then
pumped to the process water tank.
17.2.7 Tailings thickener
Rougher flotation tailings are pumped into a tailings thickener. Thickener overflow gravitates into
the overflow sump and is pumped to the process water tank. Thickener underflow is withdrawn
from the cone by one of the underflow pumps and pumped forward at design density of 55%
solids to the tailings transfer sump ahead of the tailings storage facility.
17.2.8 Tailings transfer
Final tails are pumped to the tailings storage facility by either of the two tailings transfer pumps.
J2897 Mkango Songwe Hill PFS November 2014 Page: 201
17.2.9 Plant utilities (water)
The water reticulation system is designed to provide the following water services:
raw water;
filtered water;
fire water;
potable water; and
process water.
Raw water is pumped from source into the raw water tank. The raw water tank overflows into the
process water tank for make-up water. In addition the raw water is pumped through the sand
filter plant into the filtered water tank. Filtered water is distributed to the reagents make-up,
gland services, potable water treatment plant and fire systems. Process water is stored in a
process water tank and is distributed to the plant by process water pumps.
17.2.10 Plant utilities (air)
Plant instrument air is provided by two compressors and the air quality is maintained by filters.
Instrument air is dried using a drier. Two receivers are provided namely; plant air receiver and
instrument air receiver, to allow for surges in demand. Low pressure air is supplied to the flotation
plant by fixed speed blowers. The blower manifold pressure is controlled by a modulating valve
on an exhaust line.
17.2.11 Flotation reagents
Make-up and distribution systems have been included for the following flotation reagents:
sodium fluorosilicate (activator);
sodium carbonate (pH modifier);
Pionerra F220 (depressant);
Betacol CKF30B (collector); and
flocculant.
17.2.12 Calcite leach
The concentrate filter cake is re-pulped with a portion of the calcite thickener overflow and calcite
filtrate. The slurry from the repulp tank is pumped to the first agitated fibreglass reinforced plastic
(FRP) tank thereafter the slurry cascades to agitated FRP tanks where calcite leaching occurs using
10 % (v/v – volume concentration) HCl. The purpose of the calcite leach is to remove/solubilise
the calcium contained within the rare earth element host minerals of apatite and synchesite as
well as residual calcite not rejected by the flotation process.
The leach slurry is thickened and filtered. The majority of the solution (thickener overflow and
filtrate) is pumped to the HCl regeneration circuit while a small amount is recycled and used for
the flotation concentrate repulp. The calcite leach residue from the filter is repulped with rare

J2897 Mkango Songwe Hill PFS November 2014 Page: 202
earth leach thickener overflow before being pumped to the rare earth leach section. The slurry
from tank is pumped to the rare earth leaching circuit.
17.2.13 Rare earth leach
Repulped slurry from the calcite leach circuit is pumped into a series of cascading agitated FRP
tanks and leaching is done with 20 % (v/v) HCl. The rare earth leach slurry is fed to the rare earth
thickener via pump. Flocculant will be added to assist in the flocculation and settlement of the
solids. The thickener overflow and rare earth filtrate gravitates into an overflow tank and is
pumped by one of the overflow pumps to the purification circuit.
The thickener underflow at 50 % (m/m) solids is withdrawn via one of the underflow pumps (and
pumped forward to the rare earth filter feed tank.
Slurry from the thickener underflow tank is pumped by centrifugal feed pumps to the HCl rare
earth filter. The filter cake is re-pulped with sodium hydroxide (NaOH) solution prior to the caustic
conversion of the filtered solids.
17.2.14 Caustic conversion 1
The slurry from the rare earth leach is pumped into a series of cascading agitated FRP tanks for
caustic conversion with 50 % (v/v) sodium hydroxide (NaOH). The purpose of the caustic
conversion step is to decompose the impurities, surrounding the rare earth minerals which were
not dissolved during the acid leaching process. Mineralogical studies identified the presence of
light rare earth element host minerals such as florencite and monazite which are known or
suspected to be refractory with regards to ambient temperature acid leaching.
The caustic conversion slurry is fed to the caustic conversion 1 thickener. The thickener overflow
and caustic conversion 1 filtrate are recycled back to the caustic conversion process for repulping
and consumption of excess NaOH while the thickener slurry underflow is pumped to the caustic
conversion 1 filter. The filter cake is re-pulped with recycled HCl solution from the rare earth
dissolution step prior to the rare earth dissolution circuit.
17.2.15 Rare earth dissolution
The slurry from the caustic conversion 1 is pumped into a series of cascading agitated FRP tanks
for leaching with 20 % (v/v) HCl. The purpose of the rare earth dissolution circuit is to solubilise
the rare earth minerals that had been liberated in the caustic conversion section.
The rare earth dissolution slurry is fed to the rare earth dissolution thickener. The thickener
overflow and rare earth dissolution filtrate gravitates into an overflow tank and is pumped by one
of the overflow pumps to the Purification circuit while the thickener underflow is pumped to the
rare earth dissolution filter. The filter cake is re-pulped with process water then pumped to the
tails facility.

J2897 Mkango Songwe Hill PFS November 2014 Page: 203
17.2.16 Hydrochloric acid regeneration 1, 2 and 3
The HCl regeneration circuits (HCl Regeneration 1, 2 and 3) involves contacting high strength
calcium chloride (CaCl2) with 98% concentrated sulphuric acid (H2SO4) to produce high strength
HCl and insoluble gypsum (CaSO4).
The HCL regeneration process flowsheet developed for the Songwe Hill rare earths Project is
shown in Figure 17-2.
The calcite thickener overflow and calcite filtrate solution together with the waste neutralization
thickener overflow solution are pumped to the HCl regeneration holding tank. Calcium Chloride
(CaCl2) is added to the HCl regeneration circuit. The slurry is pumped to a series of cascading
agitated FRP tanks into which 2/3 of the full stoichiometric amount of 98 % H2SO4 solution is
added. The slurry is pumped to a thickener. The thickener overflow gravitates into an overflow
tank and is pumped by the overflow pump to a second set of cascading agitated FRP tanks into
which 98 % H2SO4 solution is again added. The slurry is pumped to a thickener. The thickener
overflow is pumped by to a final set of cascading agitated FRP tanks into which 98 % H2SO4
solution is added. The slurry exiting the final set of agitated FRP tanks is pumped to a thickener.
The thickener overflow is pumped to a concentrated HCl tank. HCl is then distributed for plant
usage.
The thickener underflow for each circuit is withdrawn and pumped to the HCl regeneration filter.
The filter cake (predominantly gypsum) is re-pulped with water and pumped to a tailings facility.

J2897 Mkango Songwe Hill PFS November 2014 Page: 204
Figure 17-2
HCL regeneration process flowsheet
17.2.17 Purification
The pregnant liquor from the rare earth leach thickener overflow, the rare earth dissolution
thickener over flow and the residue leaching thickener overflow is pumped to a mixing tank in the
purification circuit. The pH in the purification circuit is adjusted to 1.5-2 by the addition of
limestone (CaCO3) slurry while the Fe:PO4 (iron:phosphate) ratio is controlled at 1.2 times the
stoichiometric molar ratio by the addition of trisodium phosphate or ferric chloride. Thereafter the
slurry and reagents cascade to agitated FRP tanks. The purpose of the purification circuit is to
remove residual impurities predominantly iron and phosphate that have passed through the
circuit.
The slurry from the last agitated FRP tank is fed to the purification thickener. The thickener
overflow and purification filter filtrate is pumped to the raw rare earth precipitation circuit while

J2897 Mkango Songwe Hill PFS November 2014 Page: 205
the thickener underflow is filtered. The filter cake is re-pulped with water and pumped to the
waste neutralisation circuit.
17.2.18 Raw rare earth precipitation
The resultant pregnant liquor from the purification thickener overflow is pumped to the raw rare
earth precipitation circuit. The solution containing rare earths is subjected to a sequential
precipitation step where the pH is increased at a controlled rate by the addition of sodium
hydroxide (NaOH) in a series cascading, agitated FRP tanks.
The slurry from the final agitated FRP tank is fed to the raw rare earth precipitation thickener. The
thickener overflow and raw rare earth precipitate filtrate is pumped to the waste neutralization
circuit. The thickener underflow is pumped to the raw rare earth precipitation filter. The filter cake
is repulped with recycled caustic solution then pumped to the caustic conversion #2 circuit.
17.2.19 Caustic conversion 2
The repulped slurry from the raw rare earth precipitation circuit is pumped into a series of
cascading, agitated FRP tanks for caustic conversion with 50 % (v/v) sodium hydroxide (NaOH)
reagent.
The caustic conversion slurry is fed to the caustic conversion 2 thickener. The thickener overflow
and caustic conversion 2 filtrate is recycled while a bleed stream is pumped to the Waste
Neutralization circuit. The thickener underflow is filtered and the filter cake is discharged onto a
conveyor and conveyed to the cerium Cerium Removal Dryer.
17.2.20 Cerium removal
The filter cake is transferred to the dryer by the filter product conveyor. The cake is then dried at
150 °C where Ce (III) is oxidised to Ce (IV). Ce (IV) is less soluble than the trivalent REO therefore
it’s possible to remove the Ce (IV) by selective dissolution of the trivalent RE oxides thus allowing
for the Ce (IV) oxides to remain in solid form and can then be removed by solid/liquid separation.
The dried cake is fed into a series of cascading agitated FRP tanks where selective leaching of the
RE oxides (excluding Ce) occurs using 20 % (v/v) HCl.
The slurry from the agitated FRP tanks is fed to the thickener. The thickener overflow and filtrate is
pumped to the final rare earth precipitation circuit. The thickener underflow is filtered and the
cake is repulped and pumped to the residue leaching circuit.
17.2.21 Residue leaching
Repulped slurry from the selective leaching circuit is pumped into a series of cascading agitated
FRP tanks and selective leaching is done again on the residue.
The residue leach slurry is fed to the residue leach thickener. The thickener overflow and residue
leach filtrate is recycled to the purification circuit. The thickener underflow is filtered then
discharged as a waste cerium product.

J2897 Mkango Songwe Hill PFS November 2014 Page: 206
17.2.22 Final rare earth precipitation
The resultant liquor solution from the cerium removal thickener overflow is pumped to the final
rare earth precipitation circuit. The solution containing rare earth chlorides (minimal Ce) is
subjected to a final precipitation step where the pH is increased by the addition of NaOH in a
series of cascading, agitated FRP tanks.
The slurry from the agitated FRP tanks is fed to the final rare earth precipitation thickener. The
thickener overflow and final rare earth precipitate filtrate is recycled to the raw rare earth
precipitation circuit. The thickener underflow is filtered then the filter cake is dried, cooled and
bagged for shipping.
17.2.23 Waste neutralization
The raw rare earth precipitation thickener overflow and filtrate from the raw rare earth
precipitation filter are pumped to the waste neutralization circuit. The solution is neutralised with
hydrated lime in a series of cascading agitated FRP tanks. Solid/liquid separation is accomplished
in the waste neutralisation thickener and waste neutralisation filter
The waste neutralization slurry is fed to the waste neutralization thickener. The thickener overflow
and waste neutralization filtrate is pumped to the HCl regeneration circuit. The thickener
underflow is pumped as waste to the tailings facility.
17.3 Sulphuric Acid Production
Sulphur is recovered from the stockpile by front end loader and fed by conveyor to the sulphur
smelter. Molten sulphur overflows to the dirty sulphur pit. Filter aid is added to the dirty sulphur
pit before pumping the molten sulphur through a pressure leaf filter. Clean sulphur is stored in
the clean sulphur storage tank. Clean molten sulphur is pumped to the furnace.
Molten sulphur is burnt in the furnace producing a hot gas flow containing about 11 % SO2
(sulphur dioxide). The hot gas passes through a fire tube boiler generating 40 bar steam in the
process of cooling the gas. The cooled gas is ducted to and from a multi-pass catalyst reactor
where the SO2 is converted to SO3 (sulphur trioxide). The gas is passed through absorption towers
that absorb the SO3 to form sulphuric acid. This product acid is cooled and pumped to storage.
Steam from the boiler is passed through a super heater. Part of the steam is sent to drive the
main air blower using a steam turbine. The steam is condensed in a turbo-generator producing
the power required.

J2897 Mkango Songwe Hill PFS November 2014 Page: 207
18 PROJECT INFRASTRUCTURE
18.1 Access
Migowi, approximately 15 km from Songwe Hill, is the nearest town to the Project area (Figure
5-1). Access from Migowi to the Project is by an all-weather bitumen road for some 2.5 km.
Thereafter a local gravel road of 13 km provides access to the Project area. This road will have to
be upgraded in order to service the Project, and a total of 9 culverts will need to be constructed
as part of this upgrade.
18.2 Processing Plant Site Infrastructure
Various surface engineering and infrastructure designs for the Songwe Hill mine were undertaken
by SNC-Lavalin. The proposed Songwe Hill mine and process plant site plans are presented in
Figure 18-1 and Figure 18-2.
The following infrastructure and services will be provided at the processing plant site:
water reservoir;
storm water dam;
tailings disposal facility ;
explosives bunker;
mine contractors area including bulk water and electricity supply at the fence and storm
water and clean effluent return from the fence;
contractors camp area;
laydown area for construction phase;
electrical incoming power including Electricity Supply Corporation of Malawi (ESCOM) sub-
station and internal 11 kV substation;
fencing around the plant;
water and waste treatment plants;
diesel storage tanks;
the following vehicles will be required at the processing plant:
o two 4x4 utility truck;
o three 4x2 utility trucks;
o two 50-seater buses;
o one 4x2 Fire truck;
o one ambulance;
o one 15 t mobile crane;
o two forklifts; and

J2897 Mkango Songwe Hill PFS November 2014 Page: 208
o one Bobcat;
buildings:
o offices including training room and boardroom with 15 offices;
o paving, parking, landscaping;
o workshops (mechanical and electrical);
o wash bay;
o stores including fenced outside laydown area;
o ablution / change rooms;
o Motor Control Centres (MCCs);
o Medium voltage (MV) / low voltage (LV) conversion room;
o security office / gatehouse;
o weighbridge office;
o mess; and
o laboratory building;
accommodation
o on-site housing facilities are not planned for the mine site. However, it has been
assumed that the EPCM camp will be used during the operational phase for senior
management;
o all other staff will be sourced from surrounding towns and villages where they will
reside. It is assumed that these staff members will be transported by bus from the
towns in the area on a daily basis prior to their shifts; and
road infrastructure:
o roads into/out of plant (1.2 km gravel road, plus one culvert);
o internal service roads, including the roads required to service the open pit
operations;
o access road to tailings disposal facility;
o weighbridge; and
o vehicle wash bay.

J2897 Mkango Songwe Hill PFS November 2014 Page: 209
Figure 18-1
General mine site layout

J2897 Mkango Songwe Hill PFS November 2014 Page: 210
Figure 18-2
General arrangement of the process plant
J2897 Mkango Songwe Hill PFS November 2014 Page: 211
18.3 Electrical Site Infrastructure
The electrical system allowed for is based on a 10 MVA utility incomer at 132 kV and the electrical
power distribution around the site is based on an 11 kV infrastructure system. From the
distribution board a 22 kV overhead line (OHL) will feed power to the tailings disposal facility,
construction camp and the contractor’s yard.
A second overhead line will be used to reticulate to the following areas:
main office;
construction mini sub;
sewage plant;
raw material MCC;
stockpile ROM;
security mini sub;
storm water MCC; and
raw water MCC
18.4 Tailings Storage Facility
18.4.1 Design criteria
The criteria for the design of the proposed Musolo TSF are summarised below and includes the
following:
the terms of reference;
the battery limits;
the expected production rate of tailings;
characteristics of the tailings material;
climatic data; and
applicable legislation.
18.4.1.1 Terms of reference
The terms of reference for the PFS that Epoch were responsible for, include:
the design of the TSF and related infrastructure, namely:
o a self-raising or full containment Tailings Dam that can accommodate 41 667 tpm of
tailings for a LoM of 22 years;
o a Return Water Dam (RWD) and Storm Water Dam (SWD) associated with the TSF;
and

J2897 Mkango Songwe Hill PFS November 2014 Page: 212
o the associated infrastructure for the TSF (i.e. perimeter slurry deposition pipeline,
storm water diversion trenches, access roads etc.);
an estimate of the capital costs associated with the TSF to an accuracy of ±25 percent; and
an estimate of the operation costs associated with the TSF to an accuracy of ±25 percent.
18.4.1.2 Battery limits
The battery limits for the TSF PFS are as follows:
the perimeter fence around the TSF;
downstream of the point where the slurry delivery pipeline intersects the TSF starter wall;
and
upstream of the first flange exiting the RWD/SWD outlet pipes, prior to the RWD/SWD
pump station.
18.4.1.3 Tailings production plan
It is expected that the mining and processing operations shall result in the production of a total of
11 million tons of tailings over a LoM of 22 years, at a rate of 500 dry ktpa as summarised in
Table 18-1.
Table 18-1
Summary tailings production plan
Parameter Units Musolo TSF
Life Of Mine years 22
Run Of Mine Feed ktpa 500
Tailings Deposition Rate ktpa 500
Total Tailings kt 11,000
18.4.1.4 Characterisation of tailings
Geochemical and Geotechnical characterisation of the tailings is necessary in order to produce an
appropriate TSF design solution. The characteristics of the tailings for the PFS design are
unknown, and have thus been based on similar rare earth tailings products from other projects at
this stage.
Design criteria for the design of the TSF
The design of the TSF is based on the design criteria shown in Table 18-2.
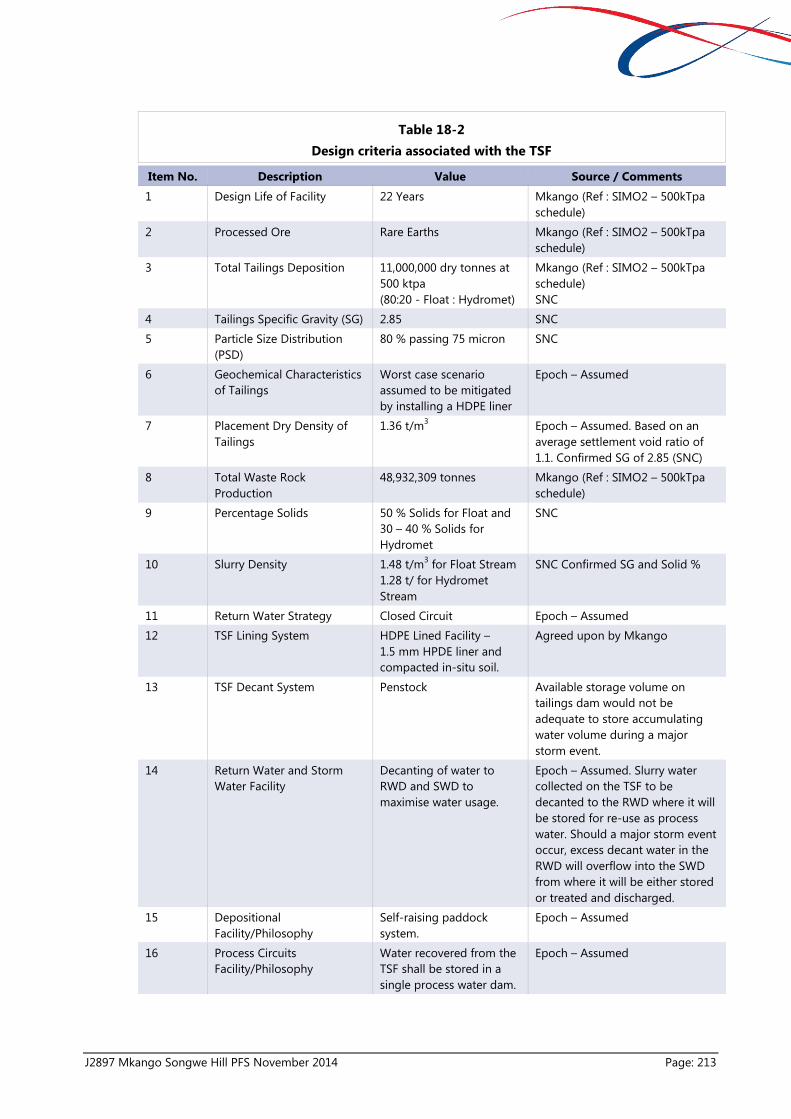
J2897 Mkango Songwe Hill PFS November 2014 Page: 213
Table 18-2
Design criteria associated with the TSF
Item No. Description Value Source / Comments
1 Design Life of Facility 22 Years Mkango (Ref : SIMO2 – 500kTpa
schedule)
2 Processed Ore Rare Earths Mkango (Ref : SIMO2 – 500kTpa
schedule)
3 Total Tailings Deposition 11,000,000 dry tonnes at
500 ktpa
(80:20 - Float : Hydromet)
Mkango (Ref : SIMO2 – 500kTpa
schedule)
SNC
4 Tailings Specific Gravity (SG) 2.85 SNC
5 Particle Size Distribution
(PSD)
80 % passing 75 micron SNC
6 Geochemical Characteristics
of Tailings
Worst case scenario
assumed to be mitigated
by installing a HDPE liner
Epoch – Assumed
7 Placement Dry Density of
Tailings
1.36 t/m3 Epoch – Assumed. Based on an
average settlement void ratio of
1.1. Confirmed SG of 2.85 (SNC)
8 Total Waste Rock
Production
48,932,309 tonnes Mkango (Ref : SIMO2 – 500kTpa
schedule)
9 Percentage Solids 50 % Solids for Float and
30 – 40 % Solids for
Hydromet
SNC
10 Slurry Density 1.48 t/m3 for Float Stream
1.28 t/ for Hydromet
Stream
SNC Confirmed SG and Solid %
11 Return Water Strategy Closed Circuit Epoch – Assumed
12 TSF Lining System HDPE Lined Facility –
1.5 mm HPDE liner and
compacted in-situ soil.
Agreed upon by Mkango
13 TSF Decant System Penstock Available storage volume on
tailings dam would not be
adequate to store accumulating
water volume during a major
storm event.
14 Return Water and Storm
Water Facility
Decanting of water to
RWD and SWD to
maximise water usage.
Epoch – Assumed. Slurry water
collected on the TSF to be
decanted to the RWD where it will
be stored for re-use as process
water. Should a major storm event
occur, excess decant water in the
RWD will overflow into the SWD
from where it will be either stored
or treated and discharged.
15 Depositional
Facility/Philosophy
Self-raising paddock
system.
Epoch – Assumed
16 Process Circuits
Facility/Philosophy
Water recovered from the
TSF shall be stored in a
single process water dam.
Epoch – Assumed

J2897 Mkango Songwe Hill PFS November 2014 Page: 214
Item No. Description Value Source / Comments
17 Climatic Data Extract from Digby Wells
Environmental and Social
PFS Report and also
sourced from CantyMedia,
2004
Digby Wells input and
Epoch – Assumed
18 Survey Data Lidar data provided by
Mkango
Mkango
In addition to the above, it has been assumed, at this stage of the study, that sufficient and
suitable construction material, for the preparatory earthworks associated with the TSF, can be
sourced from within the RWD/SWD/TSF basins.
Tailings geochemistry and pollution potential
For the purposes of the PFS, it has been assumed that the tailings shall require containment in a
HDPE lined TSF with the provision for leakage detection. This is to be investigated further and
revised during the next stage of the study work by means of geochemical laboratory testing of
the tailings product.
18.4.1.5 Climatic data
The proposed mine is situated in the southern part of Malawi in the Phalombe district 61 km
South East of the town of Zomba. It is located approximately 300 km from the Indian Ocean and
has an elevation of 700 mamsl. Historical rainfall data for the mine site could not be obtained and
alternative data had to be considered. Typical rainfall data for the city of Zomba, Blantyre and
Phalombe was considered in order to estimate the typical monthly rainfall and Mean Annual
Precipitation (MAP) in the area. The site has an estimated MAP of 1 279 mm, refer to Table 18-3.
The mean annual evaporation for the site was sourced from the FAO LocClim database and
equates to 1,415 mm, refer to Table 18-3.

J2897 Mkango Songwe Hill PFS November 2014 Page: 215
Table 18-3
Average rainfall
Month Average monthly Rainfall (mm) Evaporation
for Lake
Chilwa City of Zomba City of
Blantyre
City of
Phalombe
Average
Jan 300.0 200.0 308.9 269.6 131.0
Feb 250.0 200.0 294.7 248.2 114.0
Mar 250.0 160.0 286.2 232.1 118.0
Apr 60.0 40.0 153.0 84.3 106.0
May 10.0 0.0 56.8 22.3 96.0
Jun 10.0 0.0 53.6 21.2 79.0
Jul 0.0 0.0 45.2 15.1 87.0
Aug 0.0 0.0 31.9 10.6 109.0
Sep 0.0 0.0 22.1 7.4 131.0
Oct 20.0 20.0 63.5 34.5 163.0
Nov 100.0 80.0 143.3 107.8 148.0
Dec 270.0 130.0 277.6 225.9 133.0
Total 1,270.0 830.0 1,736.8 1,278.9 1,415.0
Source: CantyMedia (2004)
The expected magnitude of rainfall events as a function of duration and recurrence interval was
estimated by using data for an area similar to Mkango but situated in South Africa. The main
characteristics compared in order to establish a similar site were elevation and distance from the
ocean. Various weather stations were compared and the station with storm intensities that tends
to be conservatively high was assumed applicable to the Mkango site. The weather station
selected is situated in the North Eastern part of South Africa and according to the Surface Water
Resources of South Africa, 1990 the station is named The Knoll (SAWS no. 0556143, co-ordinates
25˚23’S latitude, 31˚5’E longitude). The station is located at an elevation 743 mamsl and is
approximately 250 km from the ocean. The expected magnitude of rainfall events as a function of
event duration and recurrence interval are shown in Table 18-4.
Table 18-4
Rainfall depth as a function of event duration and recurrence interval
Event
duration
(days)
Recurrence interval (years)
2 5 10 20 50 100
P (occurrence) based on planned Life of Mine
100 % 99 % 90 % 68 % 36 % 20 %
1 74.1 103.1 125.1 148.8 183.4 212.7
2 89.8 125.8 153.4 183.4 227.8 265.8
3 103.5 145.4 177.7 212.4 263.8 307.6
4 108.3 151.9 185.1 220.7 272.8 316.9
5 113.3 158.1 191.6 226.8 277.8 320.0
7 118.7 165.3 199.9 236.2 288.2 331.2

J2897 Mkango Songwe Hill PFS November 2014 Page: 216
During the next phase of the study a hydrological study for the Mkango site would be required
from which more applicable storm events may be adopted in the design of the TSF and other
infrastructure.
Wind data was obtained from the Environmental and Social Pre-Feasibility Report, September
2013 (prepared by Digby Wells Environmental). The wind rose was determined using data
recorded on site over a three year period with the results shown in Figure 18-3. From the figure,
the predominant wind direction is south-southeasterly.
Figure 18-3
Wind rose for Songwe: 01 January 2010 to 31 December 2012
Source: Digby Wells Environmental
18.4.1.6 Legislation applicable to the mine tailings storage facilities
The TSF design has been based on best design practices, and South African TSF design
codes/standard where applicable, e.g. South African National Standards (SANS) code of practice
for mine residue (SANS 0286: 1998).

J2897 Mkango Songwe Hill PFS November 2014 Page: 217
18.4.2 Selection of the preferred site for the establishment of the tailings storage facility
The area available for the development of the proposed Project is shown in Figure 18-4 which
also shows three candidate sites for the establishment of the TSF. The preferred TSF area is one
defined by:
reasonable population densities that can be economically relocated;
the location and extent of the open pit; and
drainage and flood lines.
Figure 18-4
Candidate sites for the tailings storage facility
18.4.2.1 Summary comparison of candidate sites for the tailings storage facility
Tailings storage facility Option A
The characteristics of TSF Option A are:
this site has the available storage capacity to store the tailings that shall be produced over
the LoM. Potential for expansion is limited due to the surrounding ridges and steep
gradient of the mountain to the South;
it is situated upgrade of a densely populated area which falls inside the Zone of Influence
(SANS, 1988) of the TSF. The number of households that fall inside a 500m radius of the
TSF amounts to 253;

J2897 Mkango Songwe Hill PFS November 2014 Page: 218
large volumes of waste rock/earth is required for the construction of the containment walls;
and
this option is the furthest site from Mpoto lagoon. To a lesser extent the distance from the
TSF to the Mpoto lagoon shall also minimise the pollution potential/impact of the TSF on
the Mpoto lagoon.
Wahiya tailings storage facility option
The features of Wahiya TSF option are as follows:
this site has the available storage capacity to store the tailings that shall be produced over
the LoM. There is potential for expansion to the North East should the LoM be extended or
the deposition rate increased;
it is situated upgrade of a densely populated area which falls inside the Zone of Influence
(SANS, 1988) of the TSF. The number of households that fall inside a 500m radius of the
TSF amounts to 422;
the volume of waste rock required for the construction of the starter walls is minimal,
reducing the cost associated with the construction thereof;
this option is intersected by a primary drainage line; and
this option is the second furthest site from the Mpoto lagoon.
Musolo tailings storage facility option
The features of Musolo TSF Option are as follows:
this site has the available storage capacity to store the tailings that shall be produced over
the LoM. There is potential for expansion to the East, West and South should the LoM be
extended or the deposition rate increased;
it is situated upgrade of a densely populated area which falls inside the Zone of Influence
(SANS, 1988) of the TSF. The number of households that fall inside a 500m radius of the
TSF amounts to 356;
the volume of waste rock required for the construction of the starter walls is minimal,
reducing the cost associated with the construction thereof; and
this option is the closest to the Mpoto lagoon.
18.4.2.2 Selection of preferred site for tailings storage facility
Based on the available information the Musolo TSF Option was selected as the preferred location
for the establishment of the TSF. This is based predominantly on the aspects that the available
area allows for a safe self-raising rate of rise whilst minimising the cost associated with the
construction of the starter walls.
The Wahiya TSF option was not seen as a viable due to the fact that it intersects a main drainage
line. In terms of an environmental and social perspective it would also have the biggest impact on
the surrounding area due to the dense population within its vicinity.

J2897 Mkango Songwe Hill PFS November 2014 Page: 219
TSF Option A also intersects a main drainage line and due to the high volume of waste rock/earth
material required for the construction of the starter walls this option is not economically viable.
18.4.3 Tailings storage facility design
The prefeasibility design of the TSF is described below in terms of the stage capacity calculations,
the proposed TSF development strategy and the works required to ensure the facility performs as
required.
The TSF comprises:
a HDPE lined self-raised TSF;
a HDPE lined RWD;
a HDPE lined SWD; and
associated infrastructure (i.e. slurry delivery infrastructure, storm water diversion trenches
etc.).
18.4.3.1 Stage capacity calculations
The TSF has been designed taking cognisance of the following aspects:
the monthly tonnage rate of 41,667 tpm;
the average placed dry density of tailings at 1.36 tonnes/m3; and
a rate of rise restricted to less than 3 m/year once above the starter wall.
Stage capacity analyses have been carried out in order to provide the basis for the staged
development of the TSF and are summarised in Table 18-5. The calculations show that the facility
has the capacity to store the expected tailings production. The facility is to be developed to a
maximum height of 48 m above datum with the final rate of rise being 2.8 m/yr.
Table 18-5
Summary of stoage capacity calculations for proposed TSF
Parameter Units Musolo Option
Life of Mine years 22
Deposition Rate Dry ktpa 500
Total Tailings Production Dry kt 11 000
Tailings Storage Volume Required 106 m
3 8.11
Datum Level mamsl 663
TSF Crest Elevation mamsl 711
Storage Capacity kt 11 033
Deposition Area at Final Elevation ha 13.21
Terminal Rate of Rise (Tailings) m/a 2.79
J2897 Mkango Songwe Hill PFS November 2014 Page: 220
18.4.3.2 Site development strategy and construction of impoundment walls
Construction of the starter wall to an elevation 672 mamsl shall allow contained storage for the
first year of LoM. The datum elevation for the starter wall is 663 mamsl and for the 9 m lift to
672 mamsl 100,000 m3 of borrow material excavated from the RWD/SWD/TSF basins and within a
2 km haul distance shall be required for its construction. The rate of rise of the facility decreases
to 2.5 m/year from the datum to the crest elevation of the starter wall. Thereafter the TSF shall be
developed by means of the self-raising depositional methodology to a final elevation of
711 mamsl which is 48 m above datum level. Terminal rate of rise of the TSF is 2.8 m/year.
18.4.3.3 Tailings storage facility zone of influence
The Zone of Influence for a TSF is the area likely to be affected by a flow slide emanating from the
facility. In terms of the guidelines (SANS 0286:1998) the zone of influence is defined as the area:
upstream of any point on the perimeter of the TSF, the lesser of a distance of 5h from the
toe (where h is the height of the deposit at the point under consideration); and the distance
to the point where the ground level exceeds h/2 above the elevation of the toe at the point
on the perimeter;
on sides of the TSF parallel to the ground slope – a distance of 10h from the toe; and
downstream of the lowest point on the perimeter of the TSF, a distance of 100h
The area most likely to be affected by a flow slide from the TSF could potentially impact on:
the adjacent drainage lines; and
Mpoto lagoon.
18.4.3.4 Water balance for Musolo TSF
The average monthly deterministic water balance calculation are based on a range of inputs
including estimates of the release of slurry water upon deposition, losses to evaporation and
runoff associated with monthly average rainfall. The calculation of slurry water return volumes and
the contribution of storm water runoff to the water balance are based on:
the solids : liquid ratio of the slurry (50:50);
the estimated void ratio of the deposited slurry immediately after deposition;
the basin areas of the facilities (TSF, SWD and RWD);
monthly average rainfall for the site;
a minimum decant pool volume on the tailings dam
a RWD pool volume based on an assumed retention period for slurry decant water of 7
days;
a Beach slope of 1V:200H for the TSF basin area;
estimates of average and storm event runoff coefficients; and

J2897 Mkango Songwe Hill PFS November 2014 Page: 221
estimates of evaporation losses based on the RWD/SWD configuration and monthly
average evaporation rates.
The inputs to the water balance calculations are summarised in Table 18-6.
Table 18-6
Inputs to water balance calculations for the Musolo TSF
Description Units Musolo TSF
Particle SG t/m3 2.85
Basin Area Ha 33
Slurry Deposition m3/month 56,287
Solids Volume m3/month 14,620
Volume of Water m3/month 41,667
% Solids in Slurry (by mass) % 50
Void Ratio at Initial Settlement 1.4 – 1.5
RWD Normal Operation Capacity m3 4,600
Selected results from the water balance calculations are summarised in Table 18-7 and show that:
between 19,726 m³ and 21,189 m³ of slurry water is expected to report to RWD each
month;
the available slurry water return is supplemented by rainfall water falling on the TSF and is
also subjected to evaporation losses. It is estimated that between 18,486 m³ and 71,451 m³
of return water is available as return water for pumping back to the plant each month;
during the wet season (December to April) 100 % of the plant water requirement may be
supplied by return water from the TSF; and
during the dry season (May to October) up to 19,164 m³ of makeup water is required by
the plant from sources other than the TSF.
Table 18-7
Selected results from water balance calculations for Musolo TSF
Description
Unit Musolo TSF
Min Max
Slurry Water Released to Decant Pool m³/month 19,726 21,189
Rainfall Contribution to Return Water m³/month 394 30,778
Evaporation Losses From Decant Pool m³/month 498 3,775
Estimated total Return Water Available m³/month 18,486 71,451
Total Plant Slurry Water Requirement m³/month 41,667 41,667
Clean Water Make-Up Requirement m³/month 4,167 4,167
Required Make-Up Water m³/month 0 19,164
Return water generated during a storm event
Estimates of the volumes of runoff expected to report to the TSF for different storm events are
presented in Table 8. It is estimated that up to 56,901m3 of storm water may report to the SWD

J2897 Mkango Songwe Hill PFS November 2014 Page: 222
during a 1 in 100 year 7 day storm event. It is expected that there shall be a build-up of return
water in the SWD during the wet season which would be absorbed back into the plant during the
dry season based on the estimated makeup water requirements.
Table 18-8
Expected runoof to TSF decant pool as a function of event duration and recurrence interval
Event Duration
(Days)
Recurrence Interval (years)
2 5 10 20 50 100
Probability (Occurrence) Based on Planned Life of Mine
100 % 99 % 90 % 68 % 36 % 20 %
Catchment Runoff Coefficients
0.5 0.5 0.5 0.5 0.5 0.5
1 12,095 16,829 20,420 24,288 29,936 34,719
2 14,658 20,534 25,039 29,936 37,183 43,386
3 16,894 23,733 29,006 34,670 43,060 50,209
4 17,678 24,794 30,214 36,024 44,529 51,727
5 18,494 25,806 31,274 37,020 45,345 52,233
6 19,375 26,982 32,629 38,554 47,042 54,061
7 20,485 28,434 34,359 40,578 49,507 56,901
Operating procedures for the TSF should make provision for managing fluctuations in the decant
pool level especially after periods of intense rainfall. The quantities of runoff are not such that
they should pose long term problems to the TSF.
18.4.4 Seepage and slope stability analyses
Seepage and slope stability analyses have not been carried out for the prefeasibility design.
Detailed analysis of the proposed TSF are to be carried out as part of the next study stage and
based on the expected geotechnical characteristics of the tailings and foundation materials. The
objectives of these analyses are to determine the seepage regimes and the position of the
phreatic surface within the TSF during the various phases of development. The stability of the side
slope of the TSF during the different phases is also to be assessed under static and dynamic
condition.
18.4.4.1 Seepage analyses
It has been assumed that the toe drain along the inside toe of the starter embankment is
adequate in drawing dawn the phreatic surface within the TSF.
18.4.4.2 Slope stability analysis
For the purposes of the prefeasibility design an overall design slope of 1V:3H has been adopted
which is sufficient for a stable outer TSF wall. During static conditions the location of the phreatic
surface and material strength parameters (tailings, foundation and embankment) would normally
have the biggest influence on the on the Factor of Safety (FOS) against failure. Seismic activity
would contribute to instability lowering the FOS against failure. It is therefore recommended that

J2897 Mkango Songwe Hill PFS November 2014 Page: 223
dynamic conditions also be considered during the next stage of the study as the Mkango site falls
inside a medium seismic active zone as depicted in Figure 18-5.
Figure 18-5
Earthquake hazard map of Malawi
Source: WHO (2010)
18.4.5 Development, operation and closure of the TSF, RWD and SWD
18.4.5.1 Tailings Storage Facility design
This section of the Technical Report explains the preparatory and operational works associated
with the construction of the TSF.
Tailings dam preparatory works
The construction of the TSF shall have to be completed to coincide with the commissioning of the
metallurgical plant and comprises:
topsoil stripping to a depth of 300 mm over the entire TSF footprint area;
a box cut to a depth of 500 mm beneath the starter wall embankment;
a compacted earth starter embankment wall, constructed with suitably borrow material
sourced from within the RWD/SWD/TSF basins, with the following dimensions:
o 9 m high (i.e. crest elevation of 672 mamsl);

J2897 Mkango Songwe Hill PFS November 2014 Page: 224
o 6 m wide crest;
o 1V:2H internal side slope; and
o 1V:3H external side slope;
a compacted bund wall, constructed with suitably borrow material sourced from within the
RWD/SWD/TSF basins, with the following dimensions:
o 1 m high (i.e. from elevation 671 mamsl);
o 6 m wide crest;
o 1V:2H internal side slope; and
o 1V:3H external side slope;
the supply and installation of a HDPE liner to the tailings dam basin and inside slope of the
starter walls comprising (from top to bottom):
o a 1,500 micron HDPE liner; and
o A6 Kaymat geotextile;
the self-rising portion of the TSF is battered at an overall side slope of 1V:3H;
a 5 m wide elevated toe drain. The toe drain is positioned along the inside toe of the starter
wall embankment and comprises:
o 160ND slotted HDPE drainex pipe;
o suitably graded filter sand;
o 6.7 mm stone;
o 19 mm stone; and
o non-woven geo-fabric;
a 3 m wide Natural Ground Level (NGL) toe drain extending the length of the inside
perimeter toe of the bund wall above elevation 671 mamsl The toe drain comprises:
o 160ND slotted HDPE Drainex pipe;
o suitably graded filter sand;
o 6.7 mm stone;
o 19 mm stone; and
o non-woven geo-fabric;
a 160 ND non-slotted HDPE Drainex pipe, spaced at 50 m intervals and positioned along
the perimeter of the elevated and NGL toe drain. Seepage water emanating from the drains
is collected and channelled into the solution trench;
a 20 m wide toe catchment paddocks extending the perimeter of the tailings dam. The
paddock walls have a crest width of 1 m, a height of 1 m and side slopes of 1V:1.5H. The

J2897 Mkango Songwe Hill PFS November 2014 Page: 225
cross-walls have a crest width of 1 m, a height of 0.75 m and side slopes of 1V:1.5H. The
paddocks collect runoff from the tailings dam side slopes;
a solution trench around the TSF from which seepage and catchment paddock runoff water
is directed to the silt traps and subsequently into the RWD. The trapezoidal solution trench
has the following dimensions:
o 1 m deep;
o 1 m wide base; and
o 1V:1.5H side slopes;
an energy dissipater for the collection of supernatant water from the penstock as well as
seepage water from the toe drains;
a two compartment reno-mattress/basket silt trap;
a clean storm water diversion channel, upstream of the TSF, with its associated cut-to-fill
berm wall with the following dimensions:
o 1 m deep;
o 4 m wide base; and
o 1V:1.5H side slopes;
a seepage cut-off trench downstream of the TSF, on the western and eastern side, to an
average depth of 5 m below NGL, from which collected seepage water is pumped into the
RWD;
a 450 ID PE 100 PN 8 reinforced concrete encased penstock outfall pipe compromising
double intermediate and final vertical 510 ID precast concrete penstock ring inlets. The
penstock pipeline is fully encased in reinforced concrete along its entire length and has an
average gradient of 1V:65H;
wooden catwalks along the penstock pipeline with platforms at the intermediate and final
intakes to allow access to the penstocks; and
a 120 mm ID HDPE slurry distribution pipeline along the perimeter length of the TSF starter
wall embankment.
The sands and stones specified in the preparatory works shall be externally sourced.
The specified size of the penstock pipeline and the slurry distribution pipeline has been based on
preliminary design calculations and is to be re-evaluated during the next phase of the project.
Tailings dam depositional and operational methodology
Deposition of tailing shall initially take place behind the constructed starter embankment. Once
the tailings elevation reaches the top crest elevation of the starter wall the TSF shall be developed
as a conventional self-raising day wall / night paddock facility with an overall outer slope of 1V:3H
Routine operational aspects of the facility entail:

J2897 Mkango Songwe Hill PFS November 2014 Page: 226
operating of the slurry delivery system to ensure the even distribution of tailings within the
TSF so as to enable the lifting of the day wall and control of the decant pond;
dismantling, relocation and reassembly of the slurry delivery system from time to time as
required;
operating of the decant system, return water dam and pumps; and
routine inspections and maintenance of the facility and associated infrastructure.
Deposition is to be controlled as to ensure that the day wall being constructed is always 2 m
higher than the tailings in the basin of the dam.
Supernatant and storm water collected on the TSF shall be decanted through vertical penstock
inlets and the penstock pipeline to the RWD/SWD.
18.4.5.2 Return water dam and storage water dam system
This section of the Technical Report explains the preparatory and operational works associated
with the construction of the RWD and SWD.
Return water dam and storm water dam design philosophy
The RWD and SWD associated with the TSF have been designed to contain runoff water arising
from the TSF footprint area and to ensure that “dirty water” storage dams are:
designed, constructed, maintained and operated so that they are not likely to spill into any
clean water system more than once in 50 years; and
designed, constructed, maintained and operated to have a minimum freeboard of 0.8 m
above full supply level.
RWDs and SWDs are potential sources of large losses of decant water from a TSF in terms of
seepage through the base and evaporation from the surface. In order to minimise these losses,
the following measures have been incorporated into the design:
division of the TSF return water storage into:
o a HDPE lined, smaller capacity RWD catering for the day-to-day operational
decanting of water from the TSF; and
o an HDPE lined, larger capacity SWD catering for the high rainfall/storm event decant
water;
the RWD/SWD combined capacity caters for the 3 day, 1 in 100 year storm event. Given the
site and the desire to optimise the design, an integrated approach has been adopted
whereby the RWD is situated inside the SWD. The RWD storage capacity stores 7 days of
slurry return water (4 600 m3) for day to day operations, the balance of the storage
capacity (50 209 m3) in the SWD is to accommodate the high rainfall storm events. Such a
facility reduces:
o the potential water surface area exposed to evaporation (as half the facility is utilized
for the day to day operations) and, thus, evaporation losses;

J2897 Mkango Songwe Hill PFS November 2014 Page: 227
o the base and side slope area of the RWD/SWD are lined, preventing seepage losses
through the footprint area; and
o the potential impact on the ground water arising from the RWD/SWD since the TSF
decant water is contained within the HDPE lined facility.
Based on the above the combined storage capacity of the RWD/SWD is in the order of 54 809 m3
and based on a 3 day 1 in 100 year design storm rainfall depth of 307.6 mm.
Return water dam/ storm water dam details and preparatory works
The RWD/SWD embankment is to be constructed using material sourced from within its own
basin. A combined RWD/SWD facility has been adopted whereby the RWD is contained within a
portion of the SWD basin. Water entering into the system reports to the RWD from where it can
be pumped back to the plant for re-use as process water. In the event of high rainfall, the RWD
fills up first and thereafter spills over into the remaining SWD basin. An emergency spillway shall
be incorporated into the design, on the North Eastern embankment of the SWD. In the event that
the RWD/SWD system is unable to accommodate additional storage above full supply level; this
additional water may be released into the downstream environment. The key design features are
summarised in Table 18-9.
Table 18-9
Key parameters associated with the Musolo RWD / SWD facility
Description Unit Value
Footprint area of RWD ha 0.46
Footprint area of SWD ha 2.36
Storage Capacity of the RWD m3 4,600
Storage Capacity of the SWD m3 50,209
Thickness of HDPE Liner mm 1.5
The preparatory works associated with the RWD/SWD comprise:
topsoil stripping to a depth 300 mm beneath the entire RWD/SWD footprint area;
a box cut to a depth of 500 mm beneath the embankment wall;
a compacted earth embankment wall with the following dimensions:
o 6 m wide crests;
o 1V:3H external side slopes; and
o 1V:2H internal side slopes;
800 mm of freeboard at full supply level;
a maximum excavation to elevation 651 mamsl in the basin of the combined facility, in
order to satisfy the storage capacity requirements;
a spillway on the North Eastern embankment of the SWD, discharging into the downstream
environment;

J2897 Mkango Songwe Hill PFS November 2014 Page: 228
a 1,500 micron HDPE liner overlying both the basin and the inner side slopes of both the
RWD and the SWD;
a non-woven geotextile placed between the HDPE liner and the in-situ soil to provide a
protective layer for the HDPE liner; and
4 No 300 ND HDPE, outlet pipes connecting to the RWD/SWD pump station.
The specified size of the spillway has been based on preliminary design calculations and is to be
re-evaluated during the next phase of the Project.
18.4.5.3 Rehabilitation, closure and aftercare works
A rehabilitation, closure and aftercare plan for the TSF RWD and SWD has been developed by the
environmental consultant to the Project as part of the development of the environmental
management plan for the proposed mine. It is envisaged that the rehabilitation and closure of the
Musolo TSF would, in concept, comprise:
ensuring the construction of the final outer slope of the TSF to the specified configuration
of a 1 in 3 slope with 8m step-ins every 15m in height of the TSF;
the placement of a layer of sub-soil and topsoil to the outer face of the TSF in preparation
for the establishment of vegetation;
sealing of the penstock intake and outlet structures;
dismantling and removal from site of all pipes, pumps, valves and fittings;
the establishment of a vegetative cover to the outer slopes of the facility;
the placement of a layer of waste material to the basin of the TSF to create a capillary break
layer;
the covering of the crest area with a layer of sub-soil and topsoil in preparation for
vegetation establishment;
the establishment of a vegetative cover to the crest of the TSF; and
the establishment and maintenance of vegetation to the final landform cover until such
time as it is self-sustaining.
Aftercare and maintenance of the site is expected to comprise the repair of localised erosion
gullies and the maintenance of vegetation for a period of 3 to 5 years after completion of the
rehabilitation and closure works.
18.4.5.4 Engineering Management
The estimate of costs associated with the development, operation and rehabilitation and closure
of the TSF includes provision for quarterly inspections of the facility by a suitably qualified person
and the compilation of annual reports on the on gong development and operation of the facility.
The focus of the quarterly inspections and annual reporting on the facility is to ensure that the
TSF is being constructed and operated in accordance with the design requirements.

J2897 Mkango Songwe Hill PFS November 2014 Page: 229
18.4.6 Estimates of capital, operating and closure costs
An estimate of costs associated with the construction, development, operating and closure of the
Musolo TSF have been compiled based on the proposed TSF development strategy and the LoM
design criteria as described earlier in this Technical Report.
18.4.6.1 Capital Costs
The total capital cost associated with the TSF has been estimated at US$ 12.65 million
(Table 18-10)
Table 18-10
Summary of estimated capital costs
Item Description Amount (US$
millions)
Tailings Storage Facility
1 Schedule B: Site clearance and topsoil stripping 1.10
2 Schedule C: TSF starter embankment 1.70
3 Schedule D: drainage system to TSF starter embankment 0.23
4 Schedule E: decant penstock, drainage collection sumps and
access platform
0.62
5 Schedule F; Slurry delivery system 0.46
6 Schedule G: Surface water management works 0.17
7 Schedule H: miscellaneous 0.13
8 Schedule I: liner 2.64
Total Measured Works 7.06
Storm Water and Return Water Dam
9 Schedule B: site clearance and topsoil stripping 0.06
10 Schedule C: TSF starter embankment 0.48
11 Schedule D: miscellaneous 0.03
12 Schedule I: liner 0.16
Total Measured Works 0.73
Total Cost Calculation
Unmeasured Items @ 25 % 1.95
P & Gs @ 30 % 2.92
TOTAL COST 12.65
The following qualifications are made with regards to the above mentioned capital costs
associated with the TSF:
unmeasured items are estimated at 25 % of the measured works; and
P & Gs have been allowed for, accounting for 30 % of the total works.
The above cost estimate excludes:
pumps;
mechanical and electrical components;
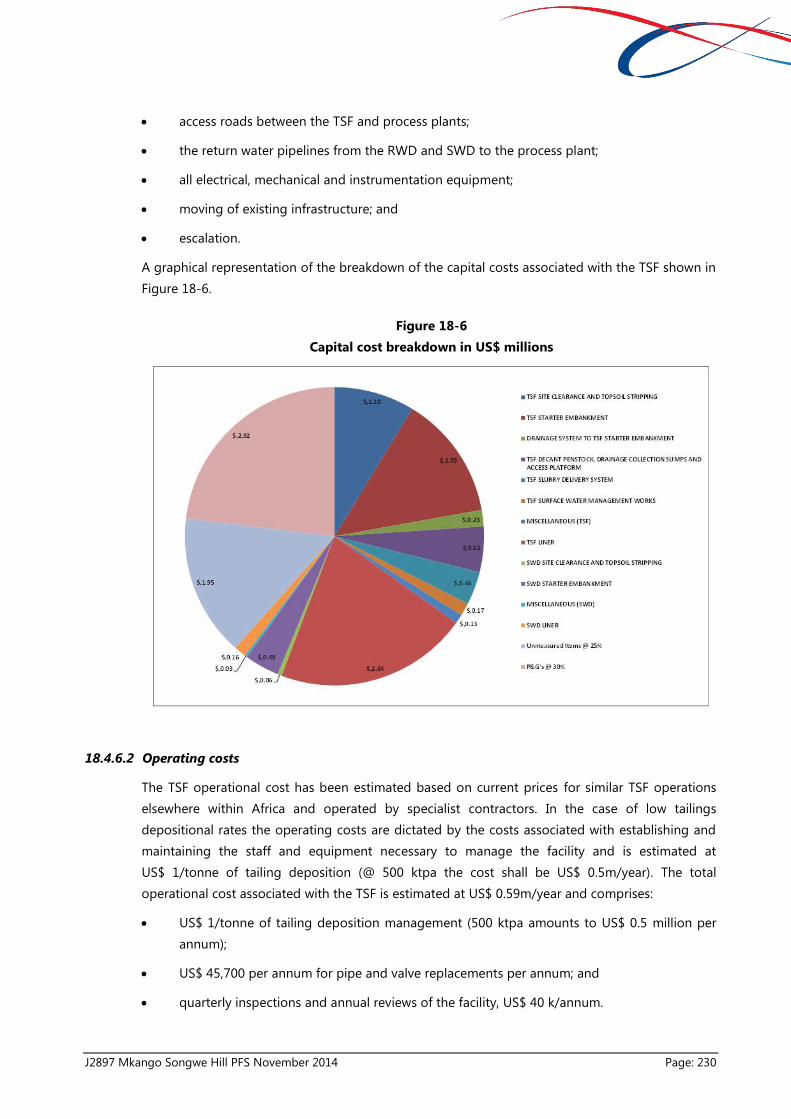
J2897 Mkango Songwe Hill PFS November 2014 Page: 230
access roads between the TSF and process plants;
the return water pipelines from the RWD and SWD to the process plant;
all electrical, mechanical and instrumentation equipment;
moving of existing infrastructure; and
escalation.
A graphical representation of the breakdown of the capital costs associated with the TSF shown in
Figure 18-6.
Figure 18-6
Capital cost breakdown in US$ millions
18.4.6.2 Operating costs
The TSF operational cost has been estimated based on current prices for similar TSF operations
elsewhere within Africa and operated by specialist contractors. In the case of low tailings
depositional rates the operating costs are dictated by the costs associated with establishing and
maintaining the staff and equipment necessary to manage the facility and is estimated at
US$ 1/tonne of tailing deposition (@ 500 ktpa the cost shall be US$ 0.5m/year). The total
operational cost associated with the TSF is estimated at US$ 0.59m/year and comprises:
US$ 1/tonne of tailing deposition management (500 ktpa amounts to US$ 0.5 million per
annum);
US$ 45,700 per annum for pipe and valve replacements per annum; and
quarterly inspections and annual reviews of the facility, US$ 40 k/annum.

J2897 Mkango Songwe Hill PFS November 2014 Page: 231
18.4.6.3 Engineering design
In addition to the capital costs associated with the construction of the TSF provision has been
made for engineering design and construction site supervision. The total cost up to the
completion of the construction of the TSF is estimated at US$ 13.29 million and comprises:
construction of the TSF US$ 12.65 million;
engineering Definitive Feasibility Study at US$ 160,000;
engineering detailed design at US$ 180,000; and
engineering construction supervision at US$ 300,000.
18.4.6.4 Rehabilitation and closure costs
The cost for rehabilitation and closure of the TSF has been compiled by the appointed
environmental consultant and is thus not included in the above LoM expenditure estimate, but
included in elsewhere within the overall Technical Report.

J2897 Mkango Songwe Hill PFS November 2014 Page: 232
19 MARKET STUDIES AND CONTRACTS
This market review is based on public domain sources, as well as Metal Pages, Asian Metal,
Technology Metals Research, Statistica, Industrial Minerals, US Geological Survey, research
publications by Roskill Consulting Group Ltd and equity analysts who have published research on
the REO sectors.
19.1 Rare Earth Elements Overview
19.1.1 Rare Earths
According to The Geological Society (2011), the REE are a group of metals also known as the
lanthanides, comprising the 15 elements in the periodic table with atomic numbers 57 to 71
(Figure 19-1). Yttrium, atomic number 39, is often included with the lanthanides as it has similar
chemical and physical characteristics and often occurs associated with them in nature. The 15
lanthanide elements are lanthanum, cerium, praseodymium, neodymium, promethium, samarium,
europium, gadolinium, terbium, dysprosium, holmium, erbium, thulium, ytterbium, and lutetium.
Scandium (atomic number 21) is found in most REE deposits and is sometimes classified as a REE.
Figure 19-1
Periodic table of elements
Image courtesy of: Alodia Gosiengfiao Modern Periodic Table of Elements

J2897 Mkango Songwe Hill PFS November 2014 Page: 233
The 15 lanthanide elements are commonly divided into two groups: the light rare earth elements
(LREE) are those with atomic numbers 57 through 62 (lanthanum to samarium); and the ‘heavy’
elements (HREE) are those with atomic numbers from 63 to 71 (europium to lutetium) (Figure
19-1). Generally, the LREE are more common and more easily extracted than the so-called
‘heavies’. In spite of its low atomic weight, yttrium has properties more similar to the heavy
lanthanides and is included within this group. Promethium, atomic number 61, does not occur
naturally in nature.
The REE are all metals and are often referred to as the rare earth metals. All of these metals have
many similar properties and often occur together in geologic deposits. The REE are also referred
to as rare earth oxides (REO) as many of them are typically sold as oxide equivalent or REO.
Chemical concentrates are mostly traded within China, but this has declined with the increasing
consolidation of control of rare earth resources and integration into downstream products within
the country.
19.2 Production and Supply
Prior to the 1990s, the Mountain Pass mine in the US was the world’s major RE supplier. This
changed rapidly after 1995 when China became the dominant global supplier (Figure 19-2).
Figure 19-2
Global REE production from 1985 to 2012
Source: Merriman (2013)

J2897 Mkango Songwe Hill PFS November 2014 Page: 234
In 2013, China is estimated to have accounted for 89.5 % of global rare earth supply. The U.S.
Geological Survey (U.S. Geological Survey, 2014) reported total world mine production at
approximately 112,000 t REO in 2013, of which China accounted for 100,000 t REO. Figure 19-3
shows the sources of rare earth supply from the rest of the world (ROW) in 2013. Both production
and exports of Chinese rare earths are controlled by the Chinese Central Government. Outside of
China, rare earths are produced in the United States, Russia, Australia and India, with relatively
minor amounts also produced in Malaysia, Brazil and Vietnam.
Figure 19-3
Rest of World REE production 2013
Figure 19-4 shows China's dominance in the production of REE between 1994 and 2012. The
United States was a significant producer until 2002 when low-priced materials being sold by China
forced mines in the United States and other countries out of operation. As China limited exports
and prices increased rapidly in 2009 and 2010, mines in Australia and the United States became
active again with the USA producing 7,000 t of REE in 2012 (Geology.com, 2014).
Malaysia, 0.1% Brazil, 0.1%
Vietnam, 0.2%
Australia, 1.8%
Russia, 2.1%
India, 2.6%
United States, 3.6%
Rest of World RE Production in 2013
ROW production represents
10.5% of total global
output, i.e 11,800t

J2897 Mkango Songwe Hill PFS November 2014 Page: 235
Figure 19-4
REE production from 1994 - 2012
Source: Graph by Geology.com (2014) using data from the United States Geological Survey
19.2.1 International trade in Rare Earths
China is the main consumer of rare earths, accounting for approximately 70 % of total rare earth
usage. The largest consumer outside of China is Japan.
The main factor affecting international trade in rare earths over the past decade has been the
Chinese Government trade policy. Exports of rare earth ores and concentrates were restricted and
the Government started to introduce a form of export quota in 2000 with a view to ensuring a
stable domestic supply and for environmental reasons. The policies also had the effect of
supporting the development of downstream industries in China, encouraging foreign companies
to establish their processing operations in China and increasing the potential value of exports.
This announcement triggered panic buying and some rare earth prices increased exponentially.
Prices soared again in 2010 after China cut export quotas by about 40 %, to just over 30,000
tonnes, on the assertion that the restrictions were necessary because mining rare earths creates
many environmental hazards.
The total Chinese rare earth export quota has fallen by over 50 % from 65 kt in 2005 to 30 kt in
2011. In reality the actual decline has been greater, as the range of rare earth products included

J2897 Mkango Songwe Hill PFS November 2014 Page: 236
within the quota was expanded in 2011 to include some metal alloys with a rare earth component
above 10 %.
The change in quotas from 2009 to 2014 is shown in Table 19-1.
Table 19-1
Export quotas for the Chinese REE Industry
Year Chinese-owned
(tonnes)
Chinese / Non-Chinese
JV (tonnes)
Total (tonnes)
2009 33,000 16,845 50,145
2010 22,512 7,746 30,258
2011 22,983 7,263 30,246
2012 22,406 8,590 30,996
2013 22,299 8,700 30,999
2014 (H1) 10,756 4,354 15,110
Source: Chinese Ministry of Commerce (Hatch, 2014)
In setting the 2014 quotas in December 2013, the quota for the first half of 2014 was 2.5 % lower
than for the corresponding period in 2013.
19.2.2 Supply Outlook
The combination of reduced export quotas imposed on Chinese suppliers and increasing
resources taxes resulting in increased prices, improved the potential for rare earth production
outside China leading to a surge in exploration and development activity. Mining companies and
major rare earth consumers are considering ways of achieving this objective.
Molycorp, Uralkali and IREL are the major established producers outside China, and plan to
increase production, expected to total approximately 45,000 to 50,000 t/a REO by 2020 according
to a Roskill report.
Roskill (Merriman, 2013) has identified a number of rare earth companies which are affiliated with
chemical companies including:
Molycorp (Silmet, Neo Material Technology);
Lynas Corp. (Solvay/Rhodia);
SARECO (Sumitomo); and
Alkane (Shin-Etsu).
Roskill (Merriman, 2013) identified more than 200 projects exploring for rare earths outside of
China as at the end of 2012. The majority of the exploration projects are located in Canada,
although projects are being explored in Angola, Argentina, Ireland, USA, Australia, Malawi and
other countries. Roskill also estimate that market demand could potentially sustain six to eight
new rare earth producers by 2018, mainly HREE exploration projects (Merriman, 2013).
Roskill (Merriman, 2013) has estimated that China will account for 74 % of global REE production
in 2015 and that Chinese dominance looks likely to fall to 61 % by 2018. Supply from the rest of

J2897 Mkango Songwe Hill PFS November 2014 Page: 237
the world (ROW) is expected to have a much larger impact on LREEs than on HREEs (Merriman,
2013).
19.2.3 Consumption and Demand
The LREE, i.e. lanthanum, cerium, praseodymium, neodymium, promethium and samarium, are
relatively more abundant than the HREEs and easier and less costly to separate.
Rare earths have a variety of end uses and are not equal in terms of demand, production or price.
They therefore cannot be considered as a single commodity and the individual elements have
their own demand drivers.
Rare earth producers will need to sign memorandums of understanding (MOU) that will lead to
the signing of one or more off-take agreements in order to sell their product. All deposits contain
the 15 (or 17 including promethium and scandium) REE in varying proportions. Because of these
varying proportions, the supply/demand equation for individual REOs is not synchronized.
The market for rare earths has traditionally been divided between relatively high volume
applications for the LREE (magnets, petroleum cracking catalysts and glass polishing, for example)
and relatively low volume applications for high purity HREE (phosphors, dopants and specialty
alloys).
High growth rates for the applications in which neodymium and HREEs are used emphasise the
lack of connection between the natural occurrence of the rare earth elements and the ratios in
which they are consumed. Inevitably, there will be periods in which some rare earth elements are
in surplus while others are in deficit.
The principal end-use sectors are shown in Table 19-2 with summary comments on the principal
rare earth elements used in each. Components which use rare earths, such as magnets, display
screens and phosphors, are then incorporated in the manufacture of finished consumer or
industrial products.
Roskill (Shaw and Chegwidden, 2012) estimated that metallurgical applications, magnets and
catalysts each accounted for approximately 20 % of total demand for rare earths in 2012.
Polishing compounds accounted for a further 15 %. Ceramics, phosphors and glass each
accounted for between 5 % and 10 % of the total with the balance in a wide range of relatively
minor applications.

J2897 Mkango Songwe Hill PFS November 2014 Page: 238
Table 19-2
Principal applications of REE
Application Comments
Magnets
Neodymium is the key component in high strength magnets. The properties of these
magnets are that they can be of low mass, small volume with high magnetic fields.
Applications are in microphones and speaker systems and computer hard drives.
Magnets on a larger scale are used in hybrid and electrical vehicles. On an industrial
scale, magnets are used in wind turbines where approximately one tonne of
neodymium is required for every megawatt of electricity generated. Praseodymium,
which has similar properties to Neodymium, is also used as a component in the
manufacture of high strength magnets.
Phosphors
Terbium is a critical element in low consumption lighting bulbs and is the largest use
of the metal worldwide. Terbium together with europium and yttrium are used in the
manufacture of glass or other devices where visual displays give off different colours.
Yttrium enhances the strength of alloys and europium is used to make control rods
for nuclear reactors.
Batteries
Lanthanum is mainly used in nickel metal hydride (NiMh) batteries and other battery
systems like lithium–ion batteries. Another significant use of lanthanum is industrial
lighting which consumes a large percentage of the material. Lanthanum oxides and
components are used in semi-conductors.
Catalysts
Cerium is used mainly in catalytic converters for motor vehicles and in conjunction
lanthanum is used in catalysts for the petroleum industry to control pollution and for
refining of crude oil.
Polishing
Cerium based polishing powders are highly desirable for precision glass polishing.
It is also used in iron, magnesium and aluminium alloys, magnets, certain types of
electrodes, and carbon-arc lighting.
Alloys
Uses of cerium-rich mischmetal (mixed metal: an alloy of rare earth elements in
various naturally occurring proportions) include metallurgy, glass and glass polishing,
ceramics, catalysts, and in phosphors.
Glass
Cerium oxide is used to polish glass as well as in the manufacture of glass and
enamels. It is used in conjunction with other rare earths as additives to colour glass
and as a component of UV absorption for solar panels.
Sources: Rare Earth Investing News, Rare Earths: Common Applications, M Montgomery; Rare Earth
Technology Alliance: What are Rare Earths; Avalon Rare Metals Inc.: Applications of Cerium.
Uses of rare earth metals in 2013 in the United States of America (USA) have been estimated as
shown in Figure 19-5.
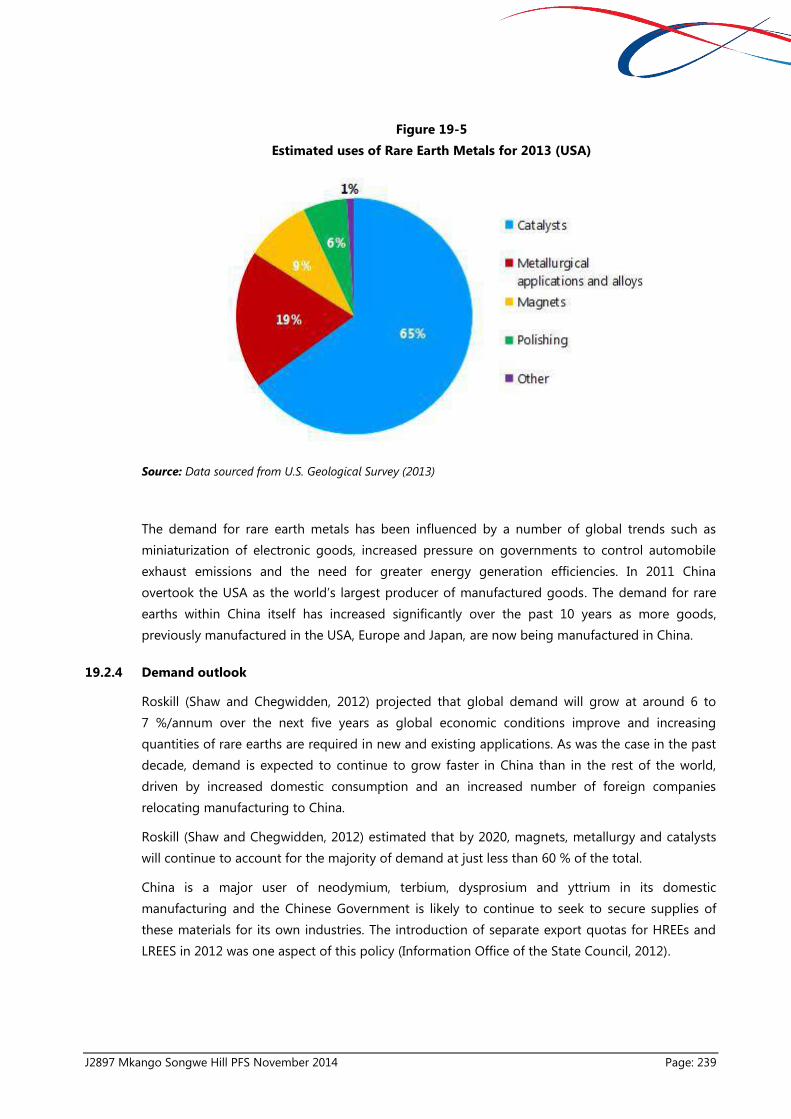
J2897 Mkango Songwe Hill PFS November 2014 Page: 239
Figure 19-5
Estimated uses of Rare Earth Metals for 2013 (USA)
Source: Data sourced from U.S. Geological Survey (2013)
The demand for rare earth metals has been influenced by a number of global trends such as
miniaturization of electronic goods, increased pressure on governments to control automobile
exhaust emissions and the need for greater energy generation efficiencies. In 2011 China
overtook the USA as the world’s largest producer of manufactured goods. The demand for rare
earths within China itself has increased significantly over the past 10 years as more goods,
previously manufactured in the USA, Europe and Japan, are now being manufactured in China.
19.2.4 Demand outlook
Roskill (Shaw and Chegwidden, 2012) projected that global demand will grow at around 6 to
7 %/annum over the next five years as global economic conditions improve and increasing
quantities of rare earths are required in new and existing applications. As was the case in the past
decade, demand is expected to continue to grow faster in China than in the rest of the world,
driven by increased domestic consumption and an increased number of foreign companies
relocating manufacturing to China.
Roskill (Shaw and Chegwidden, 2012) estimated that by 2020, magnets, metallurgy and catalysts
will continue to account for the majority of demand at just less than 60 % of the total.
China is a major user of neodymium, terbium, dysprosium and yttrium in its domestic
manufacturing and the Chinese Government is likely to continue to seek to secure supplies of
these materials for its own industries. The introduction of separate export quotas for HREEs and
LREES in 2012 was one aspect of this policy (Information Office of the State Council, 2012).

J2897 Mkango Songwe Hill PFS November 2014 Page: 240
19.2.5 Prices for Rare Earths
There is no terminal market for rare earth products and sales are arranged between buyer and
seller.
Spot prices for the principal rare earth oxides, Free on Board (FOB) China, are reported by
Industrial Minerals, www.indmin.com, and prices for a full range of Chinese rare earth products
are reported by Asian Metal, www.asianmetal.com and Metal-Pages Ltd., www.metal-pages.com.
19.2.6 World Trade Organisation Finding
China announced on 20 May 2014 the possibility of raising export taxes on rare earth resources
and a formal document on the new tax rates was to be released in the second half of 2014.
However, the WTO ruling in August has overtaken this.
On 7 August 2014 the World Trade Organisation (WTO) Appellate Body affirmed the original
finding that China’s restrictions on exports of REEs were contrary to the Country’s international
trade obligations. The WTO ruled that China had used export restrictions on rare earths to control
key markets, push prices higher, and force the global industry to move operations to China.
This ruling, coupled with broader reforms to the rare earth industry initiated by the Chinese
Government, will likely lead to dramatic changes in its domestic rare earths industry. These may
include the potential removal of export taxes on rare earths which were levied at 15 % to 20, a re-
evaluation of the tax system in relation to the mining and processing of rare earths, and the
potential implementation of additional resource taxes. The latter, in combination with tighter
environmental controls being implemented, could potentially result in an increase in rare earth
prices as the cost base of domestic producers’ increases.
Roskill Information Services noted that scrapping the export taxes could affect non-Chinese
producers as FOB REE prices could potentially be reduced, thereby bringing them more into line
with Chinese domestic prices. However, prices would be expected to increase after this initial
period of weakness as the cost base of Chinese domestic producers’ increases..
In essence, the Chinese Government’s focus is likely to shift from controlling exports to
controlling production. The Chinese Government is forcing consolidation in the industry and
many of the smaller, unproductive operations (mines, recycling operations, and processors) may
be shut down or put on care and maintenance. It was reported by the Shanghai Metals Market,
that the Chinese had eliminated 21,910 tpa of rare earth capacity by the end of September 2014
out of a total of 34,610 tpa of rare earth capacity at nine companies targeted for elimination in
2014 according to a list released by Baotou’s Commission of Economy & Information Technology.
It was reported that the nine rare earth companies have been shut down and production
equipment at five of them, representing 21,910 tpa in capacity, had been removed by the end of
September 2014. Equipment at the remaining four companies was planned to be demolished by
the end of October 2014.
This step will help solve the overcapacity in China’s industry. Chinese government data shows that
utilization rates in the smelting and separation segment stood between 25 % and
35 % in the first half of 2014.

J2897 Mkango Songwe Hill PFS November 2014 Page: 241
The Chinese Government is also clamping down on illegal rare earth production in China. Illegal
production has had a negative impact on rare earth prices so this initiative is also anticipated to
have a positive impact on the price outlook.
Also positive will be the Chinese Government’s purchase of over 10,000 metric tons of rare earths
metal, which was already being implemented in August. The Chinese Government, paying more
than the prevailing price, is stockpiling these strategic metals for future use.
19.2.7 Price Projection
Long term rare earth price assumptions were based on an average of those included in Feasibility
Studies and Pre-feasibility Studies announced by peer group companies in the rare earth sector in
2013 and 2014, resulting in the equivalent price for a total rare earth basket for Songwe Hill of
US$ 55.01 per kg REO. Prices are assumed to remain flat in real terms over the life of the mine.
The main revenue drivers are neodymium (37 %), dysprosium (14 %), praseodymium (13 %) and
europium (18 %) as illustrated in Table 19-3.
Table 19-3
Projected prices for REE and Yttrium
Rare Earth Oxide REO Price
Assumption
(US$/kg)
REO in
conc1
(tonnes)
REO in conc
split
REO in conc
(US$/kg)
REO in conc
Split by value
Lanthanum La2O3 7.7 1,075 37.8 % 2.9 5.3 %
Cerium CeO2 5.9 341 12.0 % 0.7 1.3 %
Praseodymium Pr6O11 91.4 227 8.0 % 7.3 13.3 %
Neodymium Nd2O3 77.3 756 26.6 % 20.6 37.4 %
Samarium Sm2O3 7.9 114 4.0 % 0.3 0.6 %
Europium Eu2O3 1,066.0 27 0.9 % 10.0 18.3 %
Gadolinium Gd2O3 49.0 62 2.2 % 1.1 1.9 %
Terbium Tb4O7 912.0 7 0.3 % 2.3 4.3 %
Dysprosium Dy2O3 627.9 35 1.2 % 7.8 14.2 %
Yttrium Y2O3 32.9 165 5.8 % 1.9 3.5 %
Holmium2 Ho2O3 6 0.2 %
Erbium2 Er2O3 13 0.5 %
Thulium2 Tm2O3 2 0.1 %
Ytterbium2 Yb2O3 10 0.3 %
Lutetium2 Lu2O3 1 0.0 %
Average annual production REO in concentrate 2,841 100.0 % 55.0 100.0 %
Average heavy rare earth production in
concentrate
328 11.5 % 23.2 42.1 %
Note: 1 Average annual at full capacity excluding first and last years
2 No value currently attributed to these rare earths in the financial evaluation

J2897 Mkango Songwe Hill PFS November 2014 Page: 242
19.3 Contracts
Mkango is pursuing opportunities for strategic alliances and off-take agreements.
At the time of writing, there are no other contracts or agreements in place.

J2897 Mkango Songwe Hill PFS November 2014 Page: 243
20 ENVIRONMENTAL STUDIES, PERMITTING AND SOCIAL OR COMMUNITY
IMPACT
Pre-feasibility (Scoping level) environmental and social baseline studies were conducted in 2013
by Digby Wells Environmental in collaboration with Malawian specialists. These studies were
aligned with the requirements of the Equator Principles, International Finance Corporation (IFC)
Performance Standards as well as specific requirements and interpretations of Malawian
Legislation as provided by the Department of Environmental Affairs (DEA).
A Project Brief for the proposed environmental and social studies for the Environmental, Social
and Health Impact Assessment (ESHIA) was submitted to the DEA in the fourth quarter of 2013,
the DEA has responded with a suggested Terms of Reference which will be addressed in the
ESHIA prior to the Definitive Feasibility Study.
The following chapter is a summary of the environmental and social status in the study area. This
Project is a Greenfields development and as such, only exploration has taken place at the site to
date using geophysical techniques, trenching and drilling to delineate the ore body. There is
limited infrastructure on site including a tented exploration camp and a core shed.
The study area is shown in Figure 20-1. The study area for the Pre-feasibility environmental and
social studies was determined by evaluating the areas which could be subjected to mining
disturbance and the construction of infrastructure including the north and east flank of Songwe
Hill and the Mkango Resources exploration camp. The study area was then extended by
approximately 500m in each direction from these areas. Mpoto Lagoon was also assessed,
predominantly for the potential indirect impacts on the fauna and water quality.

J2897 Mkango Songwe Hill PFS November 2014 Page: 244
Figure 20-1
Study Area for Specialists

J2897 Mkango Songwe Hill PFS November 2014 Page: 245
Some impacts may, however, occur further than the study area. There is also the potential for
cross-border impacts into Mozambique. The boundaries of the study area are determined roughly
by the Mozambican border to the east, Mount Mulanje to the south, Phalombe River to the east
and the north bank of Mpoto Lagoon to the north.
20.1 Dust Fallout
Currently, monthly dust fallout monitoring is in progress to monitor ambient dust deposition
rates in the study area. Sites considered to be sensitive receptors around the proposed mining
infrastructure were selected as positions for capturing dust fallout measurements. The monitoring
of fall-out dust utilising the bucket collection system is internationally recognised and
documented as an accepted method of determining dust fallout deposition rates. Since there is
very little on methodology and standards with regards to dust fallout monitoring in the IFC
documents, the robust South African approach was adopted.
The National Dust fallout standard (South African Department of Environmental Affairs) given in
the Table 20-1 was used to guide the project data.
Table 20-1
Acceptable dust fall rates as measured
Restriction Areas Dust fall rate (mg/m2/day,
30-day average)
Permitted Frequency of exceeding dust
fall rate
Residential Area D < 600 Two within a year, not sequential months
Non-Residential Area 600 < D < 1200 Two within a year, not sequential months
Source: South African Department of Environmental Affairs (2013)
The dust bucket samplers were installed in March 2013 (Figure 20-2). There are eight single dust
monitoring units. The locations of these monitoring units are displayed in Figure 20-3.

J2897 Mkango Songwe Hill PFS November 2014 Page: 246
Figure 20-2
An installed dust sampler, Songwe Hill

J2897 Mkango Songwe Hill PFS November 2014 Page: 247
Figure 20-3
Dust Fallout Sampler locations

J2897 Mkango Songwe Hill PFS November 2014 Page: 248
In line with the IFC guideline: “…Before a project is developed, baseline air quality monitoring at
and in the vicinity of the site should be undertaken to assess background levels of key pollutants,
in order to differentiate between existing ambient conditions and project-related impacts“ dust
fallout monitoring records have been collected to establish background conditions.
The main pollutants of concern will be associated with the operational phase of the mine. The
process of drilling and blasting, vehicle travel over unpaved dry and dusty roads, coupled with the
activities of excavators and bulldozers and the presence of overburden, stockpiles and crushers
and tailings piles subject to wind erosion exacerbate the generation of fugitive dust. Since the
mine is likely to rely on its own power source (diesel generators); emissions of SO2, NOX, CO, CO2,
VOCs, and particulates will need to be assessed.
20.1.1 Dust Monitoring Results
Sixteen months of dust deposition data have been collected at the time of the compilation of this
Technical Report.
The monthly dust deposition rates are illustrated in Table 20-2 and Figure 20-4. The results for
two samples (in October and December 2013) have been omitted from this figure as a result of
exceptionally high rates, at 6,199 and 17,190 mg/m2/day respectively. The occurrence of rates of
this magnitude is highly unlikely without interference, and they are flagged as anomalous.

J2897 Mkango Songwe Hill PFS November 2014 Page: 249
Table 20-2
Dust fallout rates observed at Songwe
Dust levels measured in mg/m2/day
Monitoring
site
Apr-
13
May-
13
Jun-
13
Jul-
13
Aug-
13
Sep-
13
Oct-13 Nov-
13
Dec-13 Jan-
14
Feb-
14
Mar-
14
Apr-
14
May-
14
Jun-
14
Jul-
14
MKANGO 01 2,923 538 1,002 646 369 3,617 1,234 1,569 3,557 108 221 216 291 362 257 311
MKANGO 02 237 319 354 474 369 446 841 1,145 1,205 49 111 240 97 494 150 386
MKANGO 03 239 74 96 234 85 85 288 305 510 78 11 151 19 169 192 148
MKANGO 04 195 68 46 105 93 369 6,199* 238 256 41 14 121 55 93 77 190
MKANGO 05 426 742 196 473 3,617 228 573 1,496 2,993 121 857 8 150 2,839 113 429
MKANGO 06 140 81 38 327 446 369 328 502 1,279 68 136 465 197 748 78 282
MKANGO 07 312 232 167 167 228 93 566 791 17,190* 105 67 247 190 347 257 151
MKANGO 08 139 15 42 55 206 206 172 580 669 45 30 49 7 50 63 118
Note: * Anomalies

J2897 Mkango Songwe Hill PFS November 2014 Page: 250
Figure 20-4
Dust fallout rates observed at Songwe

J2897 Mkango Songwe Hill PFS November 2014 Page: 251
There is a good accumulation of dust fallout data, which in the ESHIA, will be further analysed and
benchmarked. Dispersion modelling will also take place to establish what potential impacts the
Project will have on the receiving environment. An outcome of the ESHIA will be a
recommendation on whether PM10 (particulate matter up to 10 micrometres in size) monitoring
will be required.
20.2 Topography
To the north of Songwe Hill the topography comprises an alluvial plain immediately south of Lake
Chilwa, which passes southwards into a more elevated region characterized by numerous hills and
mountains. The Songwe Hill has moderate to steep sides with a summit elevation of 990 m which
is approximately 230 m above the surrounding plain. On the south-eastern side, Songwe Hill
abuts against the higher Mauze Hill which rises to an elevation of 1,592 masl.
Two main physiographic units are evident in the study area comprising the Phalombe-Chilwa
plain to the north and the Mauze-Songwe Hills to the south.
20.2.1 Phalombe-Chilwa Plain
To the north of Songwe Hill the physiography comprises an alluvial plain immediately south of
Lake Chilwa, which passes southwards into a more elevated region characterized by numerous
hills and mountains. This plain of Miocene age forms the flat topography from 700 m to about
800masl. It is made up of colluvial material and isolated inselbergs. The colluvial material
represents the former extents of Lake Chilwa.
20.2.2 Mauze and Songwe Hills
This zone rises from the Phalombe plain to elevations of nearly 1,600 masl. These mountains
belong to the Chilwa Alkaline Province and have some general similarities in rock composition
and geomorphology with the nearby Mulanje-Michesi massifs to the south. The Songwe Hill has
moderate to steep sides with a summit elevation of 990m which is approximately 230 m above
the plain. On the south-eastern side, Songwe Hill abuts against the higher Mauze Mountain that
rises to an elevation of 1,592 masl. The slopes surrounding Songwe hill range from flat to in
excess of 35 degrees. Figure 20-5 indicates the topography of the study area.

J2897 Mkango Songwe Hill PFS November 2014 Page: 252
Figure 20-5
Topography of the study area
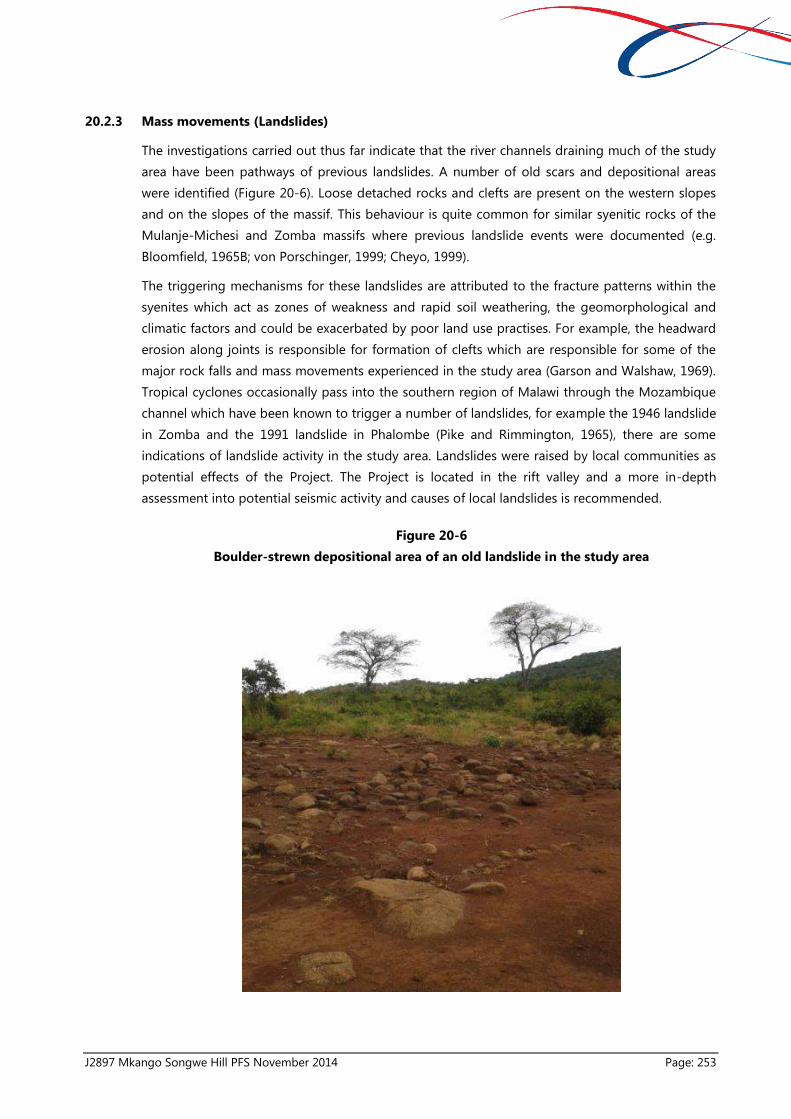
J2897 Mkango Songwe Hill PFS November 2014 Page: 253
20.2.3 Mass movements (Landslides)
The investigations carried out thus far indicate that the river channels draining much of the study
area have been pathways of previous landslides. A number of old scars and depositional areas
were identified (Figure 20-6). Loose detached rocks and clefts are present on the western slopes
and on the slopes of the massif. This behaviour is quite common for similar syenitic rocks of the
Mulanje-Michesi and Zomba massifs where previous landslide events were documented (e.g.
Bloomfield, 1965B; von Porschinger, 1999; Cheyo, 1999).
The triggering mechanisms for these landslides are attributed to the fracture patterns within the
syenites which act as zones of weakness and rapid soil weathering, the geomorphological and
climatic factors and could be exacerbated by poor land use practises. For example, the headward
erosion along joints is responsible for formation of clefts which are responsible for some of the
major rock falls and mass movements experienced in the study area (Garson and Walshaw, 1969).
Tropical cyclones occasionally pass into the southern region of Malawi through the Mozambique
channel which have been known to trigger a number of landslides, for example the 1946 landslide
in Zomba and the 1991 landslide in Phalombe (Pike and Rimmington, 1965), there are some
indications of landslide activity in the study area. Landslides were raised by local communities as
potential effects of the Project. The Project is located in the rift valley and a more in-depth
assessment into potential seismic activity and causes of local landslides is recommended.
Figure 20-6
Boulder-strewn depositional area of an old landslide in the study area

J2897 Mkango Songwe Hill PFS November 2014 Page: 254
20.3 Fauna
Field assessments were carried out which included the recording of species within the study area.
Mammals recorded included monkeys, baboons, mole rats, rodents and a member of the
subfamily Viverrinae. Reptilian species that were sighted and recorded in the study area included
two species types of skinks, and two species of agama lizards. A number of snakes and frogs were
also recorded. Up to nine species of fish were recorded in the Mpoto lagoon. Various
invertebrates were also recorded. None of the recorded taxa in the study area are listed in the
IUCN red list, CITES or protected according to the national legislation. At the study area the
majority of the bird species recorded are seed eaters, nectar feeders, and birds of prey. Further
studies will be undertaken to confirm species present and their protection status.
Results from the survey show that reptiles, mostly skinks and agama lizards, inhabit the
shrub/grass mosaic habitat, as well as the fields of cultivation and in human habitations. The
shrub/grass mosaic habitat is a preferred habitat for the lizards due to of the presence of the
rocks and boulders. This habitat is also suitable for insects, which forms a greater part of lizards’
diet. Skinks were also common on the walls of dwelling houses, and on rocks in the fields of
cultivation. These habitats are suitable for skinks as they easily get food and shelter.
Signs of rodents were mainly found in the grassy and shrub/grass mosaic habitat. This habitat is
suitable for the rodents as it is nearby their food sources, i.e. grasses and insects can easily be
collected (De Graaff, 1981). Baboons and monkeys occasionally, during crop seasons, visit the
fields of cultivation. During the crop season the monkeys and baboons descend from the nearby
forests in search for food in people’s gardens.
Frogs were confined to water pools in the dambo areas and along Mpoto lagoon. Frogs depend
on water mainly for breeding and to keep their skins moist to avoid desiccation (Hickman, 2011).
Bats were also detected in some trees and banana leaves in the dambo areas. The banana
plantation is a preferred habitat for fruit bats as they easily feed on the ripening bananas (Martin,
2001). The dambo habitat is also a preferred habitat for insectivorous bats since insects which
form part of their food are associated with the water bodies.
20.4 Flora
The field assessments show that the study area is relatively rich in plant species diversity,
considering that the area was most likely forested in the past, but has been deforested by people
over time. About 160 plant species were identified within the study area. There was no one clearly
dominating species. Some species found on the hill top were not found on the hill slopes and
vice-versa. On the flat land (which is under cultivation) lying between Songwe Hill and Mpoto
lagoon, there exists a complex mix of native species. On this flatland there are patches of
dominating native plant species populations. Communities derive fuel wood, construction
materials, wild fruits, and plant based medicines from the study area.
Vegetation types on Songwe Hill can be crudely divided into three classes. These are:
savanna woodland - this vegetation type comprise of mainly tree species punctuated by
grass species that include Pennisetum spp, Melinis repens, Setaria sphacelata, and
Hyparrhenia rufa. Herbs are rare in the understory due to the domination of grasses;

J2897 Mkango Songwe Hill PFS November 2014 Page: 255
grassland vegetation - this vegetation type found in aggregates of uniform stands.
Common species include Pennisetum spp, Melinis repens, Setaria sphacelata, and
Hyparrhenia rufa. Melinis repens is rare on the hill top but relatively common on lower
cultivated slopes of the hill; and
shrub/herbaceous vegetation (found on cultivated land) - common species include
Markhamia acuminata, Combretum microphylum, Senna petersiana, Vitex buchananii,
Vernonia glabra, and Diospyros squarrosa. These species form uniform herbaceous mixes or
exit as monocultures in cultivated fields.
Figure 20-7 shows an example of the type of vegetation found on Songwe Hill.
Figure 20-7
Grass and shrub mosaic on Songwe Hill
20.4.1 Endangered Flora
As of 1996, Malawi reported about 26 species of endangered tree species (FAO,1996). Of these,
six species are found on Songwe Hill. These are: Afzelia quanzensis, Brachystegia microphylla,
Pterocarpus angolensis, Terminalia sericea, and Aloe spp. Another national Red List species,
Dalbergia melanoylon, was claimed to present on in the study area by local communities. This
species was however not spotted during the survey. None of the National Red List species
numbered more than five individuals. The six species mentioned here have become endangered
as a result of overharvesting due to their value in home construction, curio making, high value
charcoal, and medicine; uses that date back to pre-colonial times (Topham, 1930). The
endangered flora are not seen as a fatal flaw, and mitigation measures can be put in place to
conserve these species.
20.4.2 National Red List species versus IUCN Red List
Of the six species on the national Red List, only two (Dalbergia melanoxylon and Pterocarpus
angolensis) are listed on the IUCN Red List. Afzelia quanzensis Brachystegia microphylla,
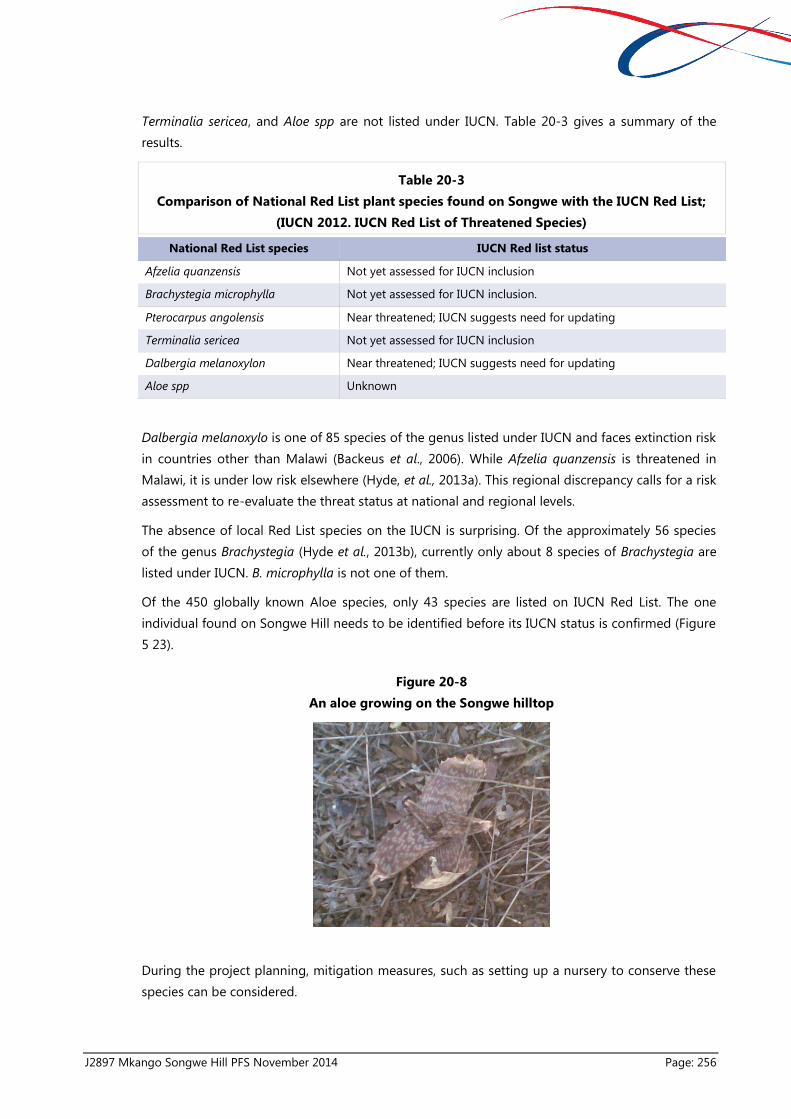
J2897 Mkango Songwe Hill PFS November 2014 Page: 256
Terminalia sericea, and Aloe spp are not listed under IUCN. Table 20-3 gives a summary of the
results.
Table 20-3
Comparison of National Red List plant species found on Songwe with the IUCN Red List;
(IUCN 2012. IUCN Red List of Threatened Species)
National Red List species IUCN Red list status
Afzelia quanzensis Not yet assessed for IUCN inclusion
Brachystegia microphylla Not yet assessed for IUCN inclusion.
Pterocarpus angolensis Near threatened; IUCN suggests need for updating
Terminalia sericea Not yet assessed for IUCN inclusion
Dalbergia melanoxylon Near threatened; IUCN suggests need for updating
Aloe spp Unknown
Dalbergia melanoxylo is one of 85 species of the genus listed under IUCN and faces extinction risk
in countries other than Malawi (Backeus et al., 2006). While Afzelia quanzensis is threatened in
Malawi, it is under low risk elsewhere (Hyde, et al., 2013a). This regional discrepancy calls for a risk
assessment to re-evaluate the threat status at national and regional levels.
The absence of local Red List species on the IUCN is surprising. Of the approximately 56 species
of the genus Brachystegia (Hyde et al., 2013b), currently only about 8 species of Brachystegia are
listed under IUCN. B. microphylla is not one of them.
Of the 450 globally known Aloe species, only 43 species are listed on IUCN Red List. The one
individual found on Songwe Hill needs to be identified before its IUCN status is confirmed (Figure
5 23).
Figure 20-8
An aloe growing on the Songwe hilltop
During the project planning, mitigation measures, such as setting up a nursery to conserve these
species can be considered.

J2897 Mkango Songwe Hill PFS November 2014 Page: 257
20.5 Soils
A soils assessment was undertaken to determine the type of soils present which will be important
when planning infrastructure and assessing impacts. The main soil groups in the study area can
be categorised into three main groups of cambisols, eutrisols, gleysols, fluvisols with some
(compositional) variants among them e.g. gleyic cambisols, eutric fluvisols, etc. Figure 20-9 shows
a generalised soil map of the study area.

J2897 Mkango Songwe Hill PFS November 2014 Page: 258
Figure 20-9
Main soil types of the study area (modified from data from Land Husbandry Dept.,
Lilongwe Malawi)
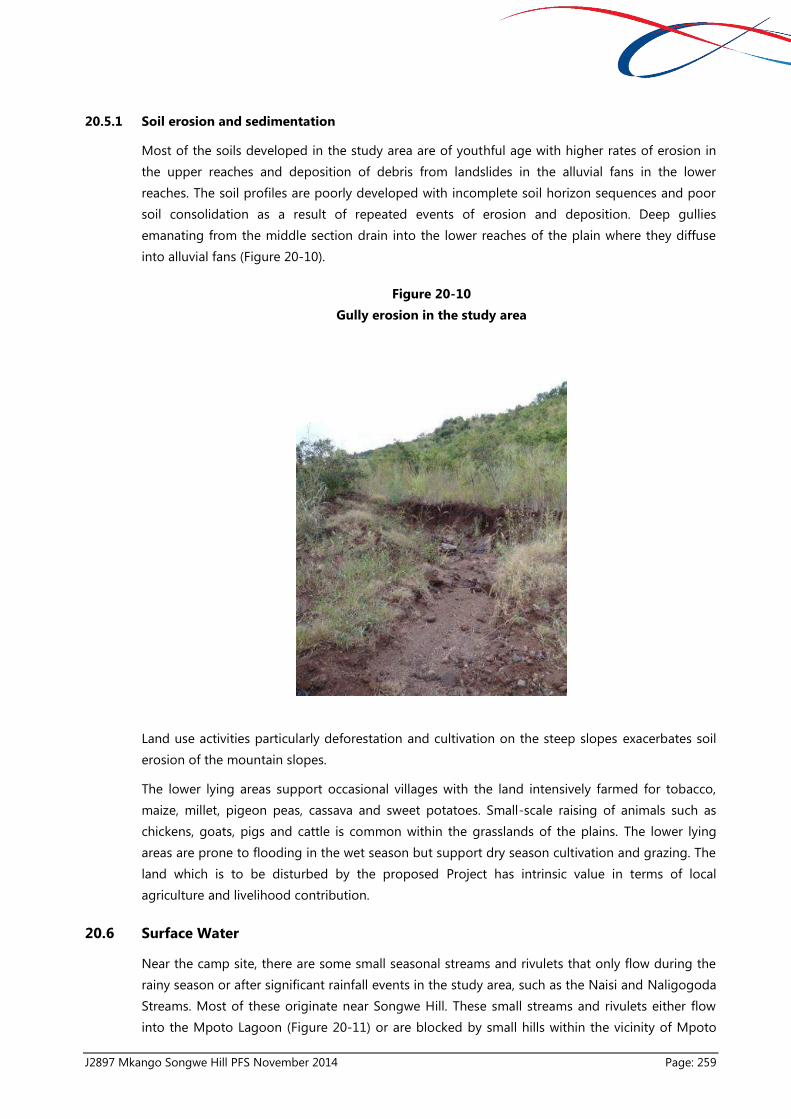
J2897 Mkango Songwe Hill PFS November 2014 Page: 259
20.5.1 Soil erosion and sedimentation
Most of the soils developed in the study area are of youthful age with higher rates of erosion in
the upper reaches and deposition of debris from landslides in the alluvial fans in the lower
reaches. The soil profiles are poorly developed with incomplete soil horizon sequences and poor
soil consolidation as a result of repeated events of erosion and deposition. Deep gullies
emanating from the middle section drain into the lower reaches of the plain where they diffuse
into alluvial fans (Figure 20-10).
Figure 20-10
Gully erosion in the study area
Land use activities particularly deforestation and cultivation on the steep slopes exacerbates soil
erosion of the mountain slopes.
The lower lying areas support occasional villages with the land intensively farmed for tobacco,
maize, millet, pigeon peas, cassava and sweet potatoes. Small-scale raising of animals such as
chickens, goats, pigs and cattle is common within the grasslands of the plains. The lower lying
areas are prone to flooding in the wet season but support dry season cultivation and grazing. The
land which is to be disturbed by the proposed Project has intrinsic value in terms of local
agriculture and livelihood contribution.
20.6 Surface Water
Near the camp site, there are some small seasonal streams and rivulets that only flow during the
rainy season or after significant rainfall events in the study area, such as the Naisi and Naligogoda
Streams. Most of these originate near Songwe Hill. These small streams and rivulets either flow
into the Mpoto Lagoon (Figure 20-11) or are blocked by small hills within the vicinity of Mpoto

J2897 Mkango Songwe Hill PFS November 2014 Page: 260
Lagoon, forming small patches of dambos. Most of the channels for these rivulets are not well
defined and this is a major cause of localised flooding during rainfall events. Mpoto Lagoon varies
in size according to season. The people in the study area utilise the lagoon’s remnant moisture
during the recession period for horticulture.
All of these small rivulets and streams were not flowing during the field visits except some trace
flows that were observed from a spring that marks the headwaters of the Msongwe River to the
south west of the camp on Songwe Hill (Figure 20-12). In addition, there are no observed gauge
records at the Ministry of Irrigation and Water Development for any of the streams and rivulets.
Figure 20-11
A view down a rivulet to the Mpoto Lagoon

J2897 Mkango Songwe Hill PFS November 2014 Page: 261
Figure 20-12
A spring on the south face of Songwe Hill
Lake Chilwa is located approximately 24km from the study area and is joined to Mpoto lagoon via
a rivulet. It is noted that this wetland area was designated a RAMSAR site in 1996.
20.7 Groundwater
The groundwater specialist study was undertaken to a higher level of detail than some of the
other studies due to the importance of quantifying whether groundwater was a viable water
supply option. A summary of the detailed groundwater findings is given below.
Groundwater is the main source of potable water for the population in the area as surface water
flows are erratic. The most prevalent hydraulic infrastructure in the study area consists of
boreholes for domestic water supplies. Most of the people use communal borehole points for
their domestic water requirements. In addition, there are gravity fed standpipes from Michesi
which are rarely operational for domestic water supply. A total of 14 boreholes and 1 spring were
identified within the study area. These are shown in Figure 20-13.

J2897 Mkango Songwe Hill PFS November 2014 Page: 262
Figure 20-13
Groundwater sampling points
J2897 Mkango Songwe Hill PFS November 2014 Page: 263
A total of three boreholes totalling 170 m were drilled under the supervision of Digby Wells for
groundwater testing. Borehole yields varied between 0.89 ℓ/s and 1.8 ℓ/s. Higher yielding
boreholes are usually associated with fractured geological formations or linear features, as well as
deep weathered formations. The drilling and aquifer testing data indicates that the East-West
trending fault extending from the east of the proposed pit yielded the most water.
20.7.1 Groundwater Occurrence
The occurrence and movement of groundwater, as well as the groundwater quality, are functions
of the geological formations in which the groundwater occurs, including the alteration thereof as
a result of human activities, such as mining. The natural groundwater system within the proposed
Songwe Hill pit area consists primarily of weathered and fractured aquifers.
Preferential groundwater flow zones are usually associated with highly weathered or fractured
formations, as well as along fault zones or intrusive features. The drilling programme at Songwe
Hill confirmed that a fractured aquifer exists 40 m to 45 m below surface. The aquifer seems to
have a moderate yield (1 to 4 ℓ/s), but is considered to be a vital water resources for domestic use
and stock watering.
The first 25 m to 35 m in the study area consists mostly of highly weathered coarse-grained
syenite. An upper aquifer could be associated with this weathered horizon. The sustainability of
the shallow weathered aquifer is dependent on seasonal recharge from rainfall. The weathered
zone is generally low yielding (less than 0.1ℓ/s) because of its insignificant thickness. These
aquifers are typically unconfined to semi-confined aquifer systems and therefore susceptible to
any surface activities or impacts.
The deeper aquifers below the weathered zone yield significant quantities of water. Although
there are a number of fractures in the syenite, a yield of 1 to 2 ℓ/s could be expected. All
groundwater movement is along secondary structures such as fractures, dykes, faults, cracks and
joints in the rock. The contact between the syenite and gneiss generally yield low to medium
groundwater yields.
The groundwater storage and potential yielding capacity of the carbonatite is still unknown. The
carbonatite units within the proposed mining pit area and could contribute to groundwater influx
into the pit area; requiring extensive dewatering.
20.7.2 Groundwater Levels
The current groundwater levels in the study area ranges from 33 to 34 metres below ground level
(mbgl); based on measurements obtained from the new boreholes. The deeper groundwater level
(51 mbgl) at the exploration camp borehole can possibly be related to its higher elevation.
It is assumed that the groundwater table in the study area would generally follow the local
topography, mirroring the local surface drainage pattern.
On a regional scale it is assumed that the groundwater flow will be in a northerly direction, from
the study area towards the Lagoon. Localised, smaller variations can be expected within the study
area and especially around the exploration camp area where groundwater might flow from all
directions towards the north and northwest. Seasonal monitoring of the boreholes in the study

J2897 Mkango Songwe Hill PFS November 2014 Page: 264
area will assist with an assessment of the groundwater level fluctuation and gradient in close
proximity. Initially summer and winter monitoring is recommended, but quarterly is preferable.
The current level measurements or monitoring sites are insufficient to provide an accurate local
groundwater flow map. All of the community boreholes were sealed and did not allow for
groundwater level measurements. All groundwater level monitoring stations (springs and
boreholes) to be used for this study and future groundwater level monitoring should be surveyed
with an accurate differential GPS system to ensure accurate reporting and groundwater level
contour mapping.
20.7.2.1 Water Quality
The groundwater in the study area is predominantly sodium/calcium-bicarbonate (Na/Ca - HCO3)
type waters. The samples indicate recently recharged groundwater exposure to their host
geological environment evident in boreholes ManBH1, NBH1, MolBH1 and MHBH1, as well as the
spring close to the camp site. These boreholes indicate dynamic groundwater flow within an
aquifer, with the sodium replacing calcium and magnesium in solution.
The groundwater sampled from the exploration camp borehole is fit for human consumption
based on the Malawian water quality standards, as well as the World Health Organisations limits
for drinking water. The fluoride concentration was higher than the limit defined by the WHO, but
is still within the Malawian Standards range.
20.8 Radiation
The purpose of the radiological study was to provide a baseline of the radiological status of the
Songwe Hill deposit, the current Mkango Resources exploration camp and the study area which is
inhabited and cultivated by the local community.
A Gamma Spectrometric survey and a Gamma Dose-rate survey was performed. This survey
provided data on the natural existing background radionuclide concentrations and background
gamma radiation levels in the study area.
In the context of the natural environment, radiation can occur from natural sources such as
cosmic and terrestrial radiation. The average range of dose rates measured in most places in the
world falls between 0.06 – 0.20 µSv/h (millisieverts/hour). Preliminary baseline external dose rates
(at one metre height) on the pre-operational study area indicate significantly higher than average
global dose rates.
Critically, the current background radiation levels are in line with the airborne gamma ray
spectrometer surveys flown in 1984 by Hunting Geology & Geophysics Ltd (UK) under contract to
the United Nations and would be expected from an ore body such as this.
There will need to be regulatory control with regards to exposure to radiation and radioactive
contamination (at least requiring safety assessments for workers and members of the public).
Adequate mitigation measures can be put in place to minimise this risk.

J2897 Mkango Songwe Hill PFS November 2014 Page: 265
20.9 Social and Community
20.9.1 Stakeholder Engagement
For a study of this nature to be implemented successfully, it is imperative that stakeholders
(persons or groups who may be directly or indirectly affected by the Project, including those who
may have interests in the Project/or ability to influence its outcome) be consulted at every stage
of the process. Stakeholders include:
individuals;
communities;
business leaders;
elected officials;
Government entities;
non-governmental organisations;
community-based organisations;
international community; and
academic society.
Stakeholders also add value to the study process by providing local knowledge on culture, social
dynamics and environmental conditions.
During the Pre-feasibility Studies, different stakeholders at international, regional, national, district
and local levels have been identified and a more textured understanding has been created
regarding their roles and responsibilities.
It is recommended that Mkango implement a Stakeholder Engagement Plan (SEP) in support of
the ESHIA and on-going operations. This will also provide guidance as to the management of
information flow between the developer and its stakeholders. This chapter details the process of
engagement undertaken thus far, identification of issues and a proposed SEP recommended for
the next phase of engagement.
The Environment Management Act, the National Environmental Policy, Guidelines for
Environmental Impact Assessment (EIA) in Malawi, Mines and Minerals Act and the Mining Policy
are the main pieces of legislation and guidance that are considered at national level in addition to
the guidelines of the IFC on Social and Environmental engagement.
Expectations for stakeholder engagement during the ESHIA are included in Performance Standard
1 (PS1): Social and Environmental Assessment and Management System, and Performance
Standard 5 (PS 5): Land Acquisition and Involuntary Resettlement.
IFC Policy requires Project owners to engage with affected communities through disclosure of
information, consultation, and informed participation, in a manner commensurate with the risks to
and impacts on the affected communities. Since the Project is categorised as a category A

J2897 Mkango Songwe Hill PFS November 2014 Page: 266
development, it is vital that consultation be thorough and timeous to ensure all parties are given
an opportunity to get involved.
An initial round of meetings was held to gather preliminary issues and concerns on the Project.
The result of the consultation was the development of a Stakeholder Engagement Plan (SEP) for
the next phase of the Project.
Site visits were undertaken and local authorities and communities were engaged through
meetings. The meetings held included:
one meeting with members of Phalombe District Executive Committee at Nambiro Primary
School Teachers Development Centre Hall;
one village meeting in Group Village Headman Maone which was attended by villagers in
all villages under the group village headman Maone (Figure 20-14). The attendees included
men, women and children; and
one meeting with members of the Village Development Committee (VDC) which was held
at the Headquarters of Traditional Authority (TA) Nazombe.
Figure 20-14
Village meeting at Maone Group Village Headman
The SEP should ensure that further stakeholder engagement is transparent, also defining the
formal grievance/complaint procedure. The SEP will provide guidance that will enable that timely,
relevant, accessible and easily understandable information is provided to stakeholders in an
appropriate non-technical format (Figure 20-15).
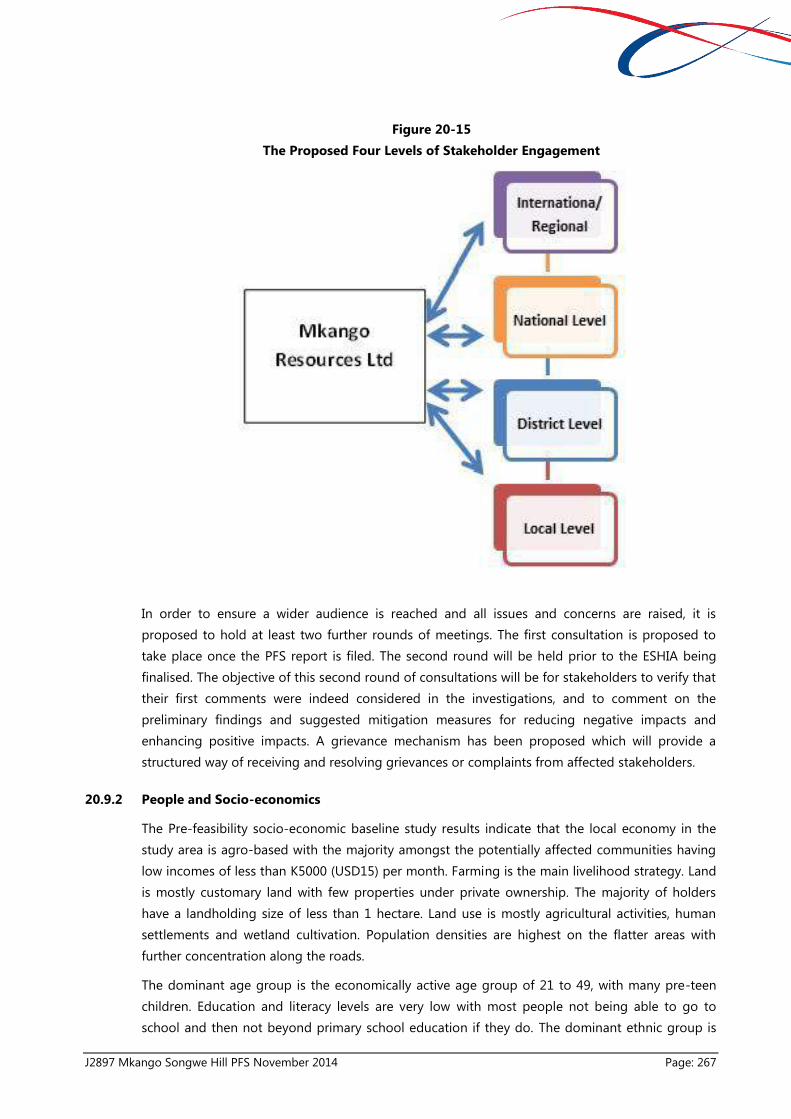
J2897 Mkango Songwe Hill PFS November 2014 Page: 267
Figure 20-15
The Proposed Four Levels of Stakeholder Engagement
In order to ensure a wider audience is reached and all issues and concerns are raised, it is
proposed to hold at least two further rounds of meetings. The first consultation is proposed to
take place once the PFS report is filed. The second round will be held prior to the ESHIA being
finalised. The objective of this second round of consultations will be for stakeholders to verify that
their first comments were indeed considered in the investigations, and to comment on the
preliminary findings and suggested mitigation measures for reducing negative impacts and
enhancing positive impacts. A grievance mechanism has been proposed which will provide a
structured way of receiving and resolving grievances or complaints from affected stakeholders.
20.9.2 People and Socio-economics
The Pre-feasibility socio-economic baseline study results indicate that the local economy in the
study area is agro-based with the majority amongst the potentially affected communities having
low incomes of less than K5000 (USD15) per month. Farming is the main livelihood strategy. Land
is mostly customary land with few properties under private ownership. The majority of holders
have a landholding size of less than 1 hectare. Land use is mostly agricultural activities, human
settlements and wetland cultivation. Population densities are highest on the flatter areas with
further concentration along the roads.
The dominant age group is the economically active age group of 21 to 49, with many pre-teen
children. Education and literacy levels are very low with most people not being able to go to
school and then not beyond primary school education if they do. The dominant ethnic group is

J2897 Mkango Songwe Hill PFS November 2014 Page: 268
the Lomwe tribe, with a few Chewa, Nyanja and Mang'anja. The majority speak and write
Chichewa and the dominant religion is Christianity with a few being non-religious and ancestral
worship is still practised by some.
The traditional governance institutions are still respected in the communities and the study area is
under General Village Headman (GVH) Maone with 10 Village Headmen and GVH Namalima with
4 Village headmen all under Traditional Authority Nazombe.
The most common staple food was maize and main source of animal protein is fish followed by
beef, then poultry and lastly bush meat. In addition, legumes (mostly pigeon peas) are a source of
plant protein. The potentially affected communities were mostly experiencing public health
problems that included Malaria, HIV/AIDS, diarrhoea and pneumonia/coughs. In terms of social
services and facilities such as education, health and water and sanitation seems to be inadequate
with no health facility nearby.
Infrastructure is in a very poor condition in the study area. There are only earth roads that need
continuous maintenance, particularly after rains. There is no electricity or post office centres.
A cave is located on Songwe Hill which will be investigated with regard to archaeology.
It has been realized that poverty in Malawi is one of the root causes of environmental
degradation. Some of the environmental problems in Malawi include soil erosion, deforestation,
water resources degradation, fisheries depletion, loss of biodiversity, air pollution, and human
habitat degradation (Kosamu, 2010). It is therefore vital to understand the social dynamics of the
study area, potential issues and concerns and how the Project will impact on the local
communities, in both a positive and negative manner.
20.9.3 Proposed Corporate Social Responsibility (CSR) Projects
Mineral sector activity has the potential to generate significant direct and indirect economic
benefits for Malawi and; if managed wisely, can contribute to social development.
For the study area specifically, the Songwe REE Project has the potential to create local
employment, most likely for the unskilled sector, as well as improve skills transfer over the life of
the Project. Mkango will investigate any community based initiatives which could be supported in
terms of the corporate social responsibility and community development initiatives. These could
potentially include investment into health care facilities, upgrading infrastructure, stimulating
economic growth via small businesses and education.
During the stakeholder engagement, the stakeholder groups will be invited to participate in order
to determine their needs. Through these meetings, Mkango must evaluate possible community
development initiatives, as it is only by working with the community that projects are successful.
Community initiatives must not to infringe on any responsibilities of the government or create
reliance and dependency of communities on the mine. These programmes should be self-
sustaining and aim at practical ways to improve the local community.
One of the outcomes of the stakeholder meetings is to have a reliable and well-constructed
community forum. The affected communities will ultimately have a large say in what projects are
of importance in the study area and how the money will be allocated.

J2897 Mkango Songwe Hill PFS November 2014 Page: 269
Once the community and conservation development initiatives have been identified, proposals
can be compiled with costs and benefits. These costs can be derived as a percentage of profit or
estimated as an annual capital expense.
Mkango has already achieved in the field of CSR projects. Mkango has developed and established
close relationships with the local communities surrounding Songwe Hill. Since 2010 Mkango has
provided employment in the local area in the form of fieldwork, road construction and on-site
security. In addition, Mkango has provided a training program for Malawian graduate geologists,
training to local people to become sampling assistants and made donations of educational and
sporting equipment to surrounding local schools. Over the past three years the company has also
helped improve the following infrastructure within the local community:
construction of a new bridge and refurbishment of existing bridges and ongoing
maintenance;
refurbishment of the road to local village, Namalamba, and to Songwe Hill;
a new water borehole drilled to supply Namalamba school and village; and
refurbishment of three other water boreholes in the surrounding area
As the Project advances, Mkango has begun implementing successful early-stage social
responsibility initiatives, including a tree planting program and soya bean seed growing project,
which are focused on empowerment and reducing poverty and hunger. The soya bean project has
to date, donated soya bean seeds for planting to over 100 families in 10 villages within the
Phalombe district.
During November 2013 a new pigeon pea (Manolo) growing project was initiated to replace the
Soya Bean programme to help alleviate hunger and community within the 10 village communities
close to the Songwe Project. 3,400 kg of high yield hybrid seed was distributed to communities
surrounding the Songwe Hill Project. Each farmer was given 4 kg of seed and the chiefs were
given 6 kg, based on the size of their land. At harvest, twice the amount of seed will be returned
back the Company, to keep for the following season so that it can be distributed to new recipient
farmers. This would ensure that in the following season three times the original number of famers
would participate. The Company is working with the National Smallholder Farmers Association of
Malawi (NASFAM) who are the leading smallholder-owned business and development
organization in Malawi producing economic and social benefits for members, their communities
and the country whose mission is to improve the livelihoods of smallholder farmers. Through a
sustainable network of smallholder-owned business organizations, NASFAM promotes farming as
a business in order to develop the commercial capacity of its members, and delivers programs
which enhance member productivity.
20.9.4 Resettlement Consideration
Involuntary resettlement is often a consequence of large scale developments such as mining.
There are generally several impacts associated with involuntary resettlement, over and above that
obvious loss of assets. The Songwe REE Project is expected to result in some degree of
involuntary resettlement.

J2897 Mkango Songwe Hill PFS November 2014 Page: 270
20.10 Potential Environmental Impacts
Some of the activities are likely to result in environmental impacts, both positive and negative. At
this stage the studies indicate that the following impacts need to be considered:
creation of tailing dumps and pollution control dams;
employment and skills development;
investment in local economy and social responsibility programmes;
altered topography;
visual aspect to local land users;
habitat degradation and contamination;
soil erosion, contamination and sedimentation;
eco-system functioning of Mpoto Lagoon;
increase in dust and noise;
stormwater control, containment of polluted water and impact on stream flow;
dewatering of local aquifer and groundwater contamination;
safety concerns along transportation routes;
direct and indirect employment opportunities;
development of local businesses;
in-migration and disturbance to livelihoods;
increase in spread of diseases and social pathologies; and
potential for local economic development and improvement in services.
In most cases the negative impacts can be mitigated and will be discussed as part of the various
management plans developed for the ESHIA. The Project is at a phase where impacts and risks
can be assessed; and where necessary the Project can be adjusted or re-structured to avoid or
reduce the impact.

J2897 Mkango Songwe Hill PFS November 2014 Page: 271
21 CAPITAL AND OPERATING COSTS
21.1 Capital Costs
21.1.1 Mining Capital Expenditure
The mining of the open pit will be conducted by a mining contractor. During the PFS a mining
contractor was approached to submit a cost for the complete mining operation. The contractor
visited site and met with the relevant Consultants and client team members. The contractor
submitted a budget estimate for the mining operation, based on the responsibility matrix shown
in Table 21-1.
Table 21-1
Contractor responsibility matrix
Sl No. Work Details Mkango Responsibility Contractor’s Responsibility
1 Workshop and stores To be provided by
Mkango
To bring tools for use in workshop
2 Power and permanent lighting To be provided by
Mkango
Nil
3 Mobile illumination at mines to
include faces, dumps and haul
roads
Nil To be provided by the contractor
4 Accommodation for expats and
locals
To be provided by
Mkango fully furnished
accommodation
Nil
5 Offices To be provided by
Mkango fully furnished
Nil
6 Local medical facilities / clinic To be provided by
Mkango
Nil
7 Security, both at camp and
offices
To be provided by
Mkango
Nil
8 Messing infrastructure for Expats
and locals
To be provided by
Mkango
To be operated and maintained by
contractor
9 Fencing of mines and
establishment
To be provided by
Mkango
Nil
10 Basic communication and
internet infrastructure
To be provided by
Mkango
Nil
11 Potable drinking water To be provided by
Mkango at Central Take-
off point
Take-off by contractor
12 Water for mining purposes To be provided by
Mkango at Central Take-
off point
Take-off by contractor
13 Major pumping Mkango should install
one main pumping
station
Operation and maintenance by
contractor
14 Training Centre Facilities should be
provided by Mkango
Contractor to operate training by
providing training equipment, aids and
instructor for operation and soft
training

J2897 Mkango Songwe Hill PFS November 2014 Page: 272
Sl No. Work Details Mkango Responsibility Contractor’s Responsibility
15 Sewerage To be provided by
Mkango
Nil
16 Explosive magazine To be provided by
Mkango
Contractor should provide sized and
capacity requirements
17 Diesel and explosive Storage facility and
supply by Mkango
Receipt of quantity and ensure quality
18 Mines de-watering Nil In contractor scope of work
19 Haul road maintenance Nil In contractor scope of work
20 Mine plan and work schedule To be provided by
Mkango
Production as per mine plan and
schedule y deploying requisite
equipment and man power
21 Rehabilitation and CSR activities To be provided by
Mkango
Nil
22 Facilitation for Visa, DIRE, Work
Permit, etc. for expats
To be organised by
Mkango
To follow as per Mkango instructions
23 Mining laws and legislation
enforcement
To be done by Mkango Contractor to follow as per direction of
Mkango
24 Drainage system in mines Nil Contractors scope of work
25 Waste dump management Nil Contractors scope of work
The mining fleet will be owned and operated by the contractor. Table 21-2 shows the make-up of
the contractor’s mobilisation fee.

J2897 Mkango Songwe Hill PFS November 2014 Page: 273
Table 21-2
Contractor mobilisation fee
Details No. of
Machine(s)
Mobilization cost
(US$)
Mobilization for Equipment
AC ROC L6 Drill Machine 2 80,000
Volvo EC 480 Excavator 2 83,500
Volvo FMX / CAT 740 ADT 8 200,000
CAT D6 Dozer 1 40,000
Cat 140K grader 1 40,000
Volvo L120 1 30,000
Fuel Service Truck 1 12,500
Backhoe Loader 1 20,000
Volvo Water Truck 2 25,000
Light Sets 6 10,000
250 KVA Gensets 2 8,000
Water Pumps 2 8,000
Pick-up Van 5 18,000
Bus 2 25,000
Sub Total 36 600,000
a) Total Cost of Equipment Mobilization (US$) 600,000
b) Mobilization for Containers (10 Nos.)* (US$) 50,000
c) Mobilization for Expats (20 Nos.)** (US$) 100,000
d) Work shop Tools and Tackles 100,000
Total (A+B+C) (US$) 850,000
Allowance has been made for site preparation, bush and top soil clearing for the waste dump
area. Perimeter fencing around the pit has also been included.
The capital cost of other infrastructure required to support the mining operation was included in
the overall site infrastructure and included the following items:
storm water control;
security and access control;
workshops;
offices;
change houses;
stores and warehousing;
water supply and storage; and
fuel and explosives storage facilities.
The capital expenditure associated with the mining operation is made up predominantly by the
contactor establishment cost.

J2897 Mkango Songwe Hill PFS November 2014 Page: 274
The mining capital costs are shown in Table 21-3.
Table 21-3
Mining capital cost
Item Cost (US$)
Contractor mobilisation 850,000
Pit fencing 60,000
Bush clearing and top soils removal 747,000
Total 1,657,000
21.1.2 Processing plant and infrastructure capital cost
The capital cost estimate was generated based on a block flow diagram and preliminary process
flow diagrams (PFDs) which formed the basis of the mechanical equipment list. Based on the
mechanical equipment list, mechanical equipment costs were derived from the SNC-Lavalin
database and budgetary quotations obtained from vendors. Other Project discipline costs
including bulk materials, construction materials, spares, labour costs, vendor supervision, freight,
contingency and EPCM costs are determined by a statistical relationship to the major mechanical
equipment cost.
The PFS capital estimate is specific to the construction of a new greenfield rare earth minerals
processing facility and defined on-site infrastructure, including a sulphuric acid plant located in
Malawi. The process plant is designed to treat a nominal 0.5 million tonnes per annum (Mtpa) of
run of mine (ROM) ore.
The plant battery limits are as follows:
top of ROM bin;
product from hydrometallurgy process;
tailings pipeline outlet to tailings dam;
storm water dam; and
boreholes.
In brief, the processing plant scope of work includes the following facilities and services:
0.5 Mtpa beneficiation process plant;
hydrometallurgical plant;
270 tpd acid plant and storage;
plant complex infrastructure covering:
o 2.5 MW Diesel Power supply/generation and distribution;
o contribution to ESCOM for provision of grid power to site;
o fuel storage;

J2897 Mkango Songwe Hill PFS November 2014 Page: 275
o gravel roads within the plant complex totalling approximately 4.4 km;
o plant earthworks;
o pre-fabricated construction camp;
o plant architectural buildings and workshops totalling approximately 3,480 m2;
o main access road is excluded;
ancillary facilities and utilities:
o water reticulation;
o laboratory;
o plant utilities; and
associated engineering, procurement, project management and construction management
services.
The capital cost estimate is based on the Project being implemented as an EPCM reimbursable
contract.
21.1.2.1 Processing Plant and Infrastructure Estimate Parameters
The base date is the 1st July 2014 with no provision included for escalation beyond this date. The
capital cost estimate is presented in US$ (base currency), based on the exchange rates defined in
Table 21-4 below. The exchange rates were determined by SNC-Lavalin’s estimating department
and have been used as the basis for developing the capital estimate.
Table 21-4
Currency exchange rates and equipment supply foreign exposure
Currency Factor Equipment Foreign Exposure
(US$)
Percentage (%)
EURO 1.3565 3,627,241 2.3
US$ 1.0000 21,115,850 12.3
ZAR 0.09520 146,434,929 85.5
171,178,020 100
Note: The cost for diesel supply was converted at 1 MWK = 0.00271 US$ where MWK is Malawian Kwacha.
The estimate is a Pre-feasibility Estimate with an overall weighted accuracy of +25 to -20 %.
The estimate excludes project risk or any project management reserves. Estimating contingency is
included in the estimate and is factored on all costs. Estimating contingency takes into account
the current level of engineering and is intended to cover items which are included in the scope of
work as described in this Study, but which cannot be adequately defined at the time due to lack
of accurate, detailed design information and to account for the normal variability of productivity
and bids received during the execution stage. Contingency is not intended to cover items which
are listed in the exclusions section of this Technical Report.

J2897 Mkango Songwe Hill PFS November 2014 Page: 276
21.1.2.2 Capital expenditure summary
Capital cost estimates were generated for the process plant, sulphuric acid plant and the
associated plant infrastructure. The capital cost estimates are presented in Table 21-5 to Table
21-7.
Table 21-5
Process plant capital estimate cost summary
Description Supply and
delivery (US$)
Transport
(US$)
Installation
(US$)
Total (US$)
Direct Costs
Earthworks 1,695,816 1,695,816
Civil 6,781,360 6,781,360
Structural 4,794,415 527,386 2,560,560 7,882,360
Architectural
Mechanical 18,111,107 1,992,222 3,929,655 24,032,984
Platework 884,080 97,249 883,017 1,864,345
Piping 3,252,500 368,664 1,770,389 5,391,553
Electrical 3,400,787 374,087 1,378,503 5,153,377
Control and instruments 2,887,117 317,583 866,135 4,070,834
First fills 4,380,388 4,380,388
Direct costs Subtotal 61,253,018
Indirect Costs
Field indirects – site offices, camp
and feeding
4,900,241 4,900,241
Vendor assistance during
construction
543,333 543,333
Commissioning spares 487,980 78,077 566,057
EPCM costs 12,250,604 12,250,604
Indirect costs Subtotal 18,260,235
Other Costs
Estimating contingency 16,097,466 16,097,466
Owner’s costs 6,692,750 6,692,750
Owner’s risk/contingency Excluded
Escalation Excluded
Other costs Subtotal 22,790,216
Total Estimation Costs 102,303,469
The below line estimate of the mill feed stockpile enclosure is US$ 1,222,126 and is not included
in the estimate. The base case design for the stockpile is an open stockpile.
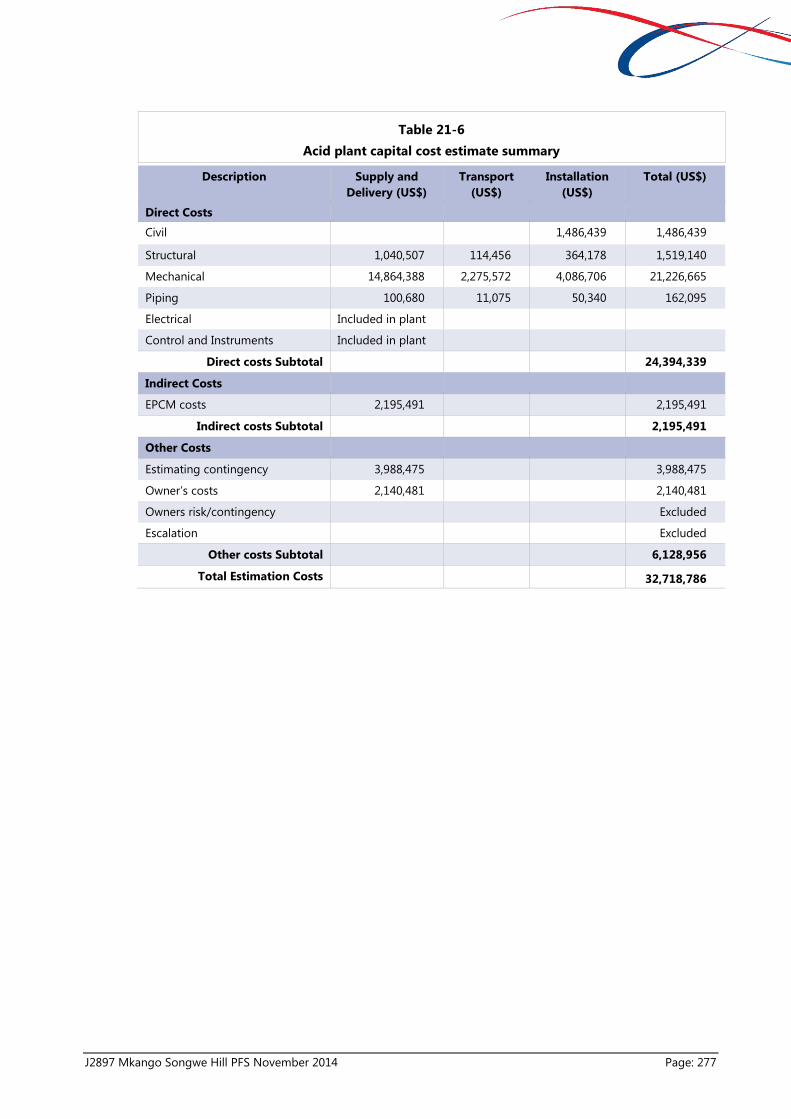
J2897 Mkango Songwe Hill PFS November 2014 Page: 277
Table 21-6
Acid plant capital cost estimate summary
Description Supply and
Delivery (US$)
Transport
(US$)
Installation
(US$)
Total (US$)
Direct Costs
Civil 1,486,439 1,486,439
Structural 1,040,507 114,456 364,178 1,519,140
Mechanical 14,864,388 2,275,572 4,086,706 21,226,665
Piping 100,680 11,075 50,340 162,095
Electrical Included in plant
Control and Instruments Included in plant
Direct costs Subtotal 24,394,339
Indirect Costs
EPCM costs 2,195,491 2,195,491
Indirect costs Subtotal 2,195,491
Other Costs
Estimating contingency 3,988,475 3,988,475
Owner’s costs 2,140,481 2,140,481
Owners risk/contingency Excluded
Escalation Excluded
Other costs Subtotal 6,128,956
Total Estimation Costs 32,718,786

J2897 Mkango Songwe Hill PFS November 2014 Page: 278
Table 21-7
Process plant infrastructure capital cost estimate summary
Description Supply and
Delivery (US$)
Transport
(US$)
Installation
(US$)
Total (US$)
Direct Costs
Earthworks – plant complex
roads excluding main access road
2,236,874 2,236,874
Civil 1,183,360 1,183,360
Structural
Architectural – plant complex
buildings
1,894,764 1,894,764
Mechanical – mobile equipment
and weigh bridge
787,439 91,657 49,357 928,453
Platework 0 0 0 0
Piping – tailings, return water,
distribution
427,960 88,463 751,844 1,268,267
Electrical – 2.5 MW power
generation plant and 2 off x 1.5
km HT distribution line, plus
ESCOM power supply
8,662,357 528,731 5,595,077 14,786,165
Control and instrumentation 0 0 0 0
First fills diesel – 20 days 1,039,014 1,039,014
Direct costs Subtotal 23,336,896
Indirect Costs
Field indirects – site offices, camp
and feeding
1,998,003 1,998,003
Vendor assistance during
construction
376,286 376,286
Commissioning spares - -
EPCM costs 2,497,504 2,497,504
Indirect costs Subtotal 4,871,793
Other Costs
Estimating contingency
Owner’s costs 5,581,764 5,581,764
Owners risk/contingency 2,365,332 2,365,332
Escalation Excluded
Other costs Subtotal Excluded
Total Estimation Costs 7,947,096
Total plant infrastructure
Capex
36,155,785
The cost type for the total process plant, acid plant and infrastructure is summarised in Table
21-8.

J2897 Mkango Songwe Hill PFS November 2014 Page: 279
Table 21-8
Total process plants and infrastructure estimate cost, by cost type
Cost Category Total Cost (US$
million)
Percentage of
Directs
Direct cost general 109.0 63.9 %
Direct cost camp 6.9 4.0 %
EPCM 16.9 9.8 %
Vendor support during construction 0.9 0.5 %
Other indirect costs 0.6 0.3 %
Owners 11.2 6.5 %
Estimating allowance 25.7 15.0 %
TOTAL 171.2
21.1.3 Tailings Storage Facility Capital costs
Capital costs associated with the TSF have been determined to an accuracy of ± 25%. The total
capital cost associated with the TSF has been estimated at US$ 12.65 million (Table 21-9). For the
purpose of the PFS, rates from a previous project based in the DRC have been utilised.
The estimated cost is inclusive of a provision for the Contractors Preliminary and General Costs at
30 % of the value of the measured works. No allowance has been made for contingencies. It is
expected an overall contingency allowance for the Project shall be provided for by Mkango.

J2897 Mkango Songwe Hill PFS November 2014 Page: 280
Table 21-9
Summary of estimated capital costs - TSF
Item Description Amount (US$
millions)
Tailings Storage Facility
1 Schedule B: Site clearance and topsoil stripping 1.10
2 Schedule C: TSF starter embankment 1.70
3 Schedule D: drainage system to TSF starter embankment 0.23
4 Schedule E: decant penstock, drainage collection sumps and
access platform
0.62
5 Schedule F; Slurry delivery system 0.46
6 Schedule G: Surface water management works 0.17
7 Schedule H: miscellaneous 0.13
8 Schedule I: liner 2.64
Total Measured Works 7.06
Storm Water and Return Water Dam
9 Schedule B: site clearance and topsoil stripping 0.06
10 Schedule C: TSF starter embankment 0.48
11 Schedule D: miscellaneous 0.03
12 Schedule I: liner 0.16
Total Measured Works 0.73
Total Cost Calculation
Unmeasured Items @ 25 % 1.95
P & Gs @ 30 % 2.92
TOTAL COST 12.65
The following qualifications are made with regards to the above mentioned capital costs
associated with the TSF:
unmeasured items are estimated at 25% of the measured works; and
P & Gs have been allowed for, accounting for 30 % of the total works.
The above cost estimate excludes:
pumps;
mechanical and electrical components;
access roads between the TSF and process plants;
the return water pipelines from the RWD and SWD to the process plant;
all electrical, mechanical and instrumentation equipment;
moving of existing infrastructure; and
escalation.
A graphical representation of the breakdown of the capital costs associated with the TSF shown in
Figure 21-1.

J2897 Mkango Songwe Hill PFS November 2014 Page: 281
Figure 21-1
Capital cost breakdown in US$ millions - TSF
21.1.4 Summary of initial capital expenditure
Table 21-10 is a summary of the initial capital expenditure of the Project.
Table 21-10
Summary of initial capital expenditure
Description Amount (US$ millions)
Site Facilities, Infrastructure and Power Supply 36.2
Mining 1.7
Beneficiation Plant 45.2
Hydrometallurgical Plant 57.1
Sulphuric Acid Plant 32.7
Tailings Storage Facility 12.7
Other 12.0
Total Initial Capital Expenditure 197.5
Contingency 19.8
Total Initial Capital Expenditure including Contingency 217.3
21.2 Operating Costs
21.2.1 Mining Operating Costs
The operating cost estimate for open pit mining is based on the budget estimate submitted by
the mining contractor who was approached during this study.

J2897 Mkango Songwe Hill PFS November 2014 Page: 282
In order to evaluate the contractor’s submission the operating cost was estimated by MSA
(Sections 21.2.1.2 to 21.2.1.4) and the results of this operation were compared to the contractor
cost. The costs and equipment fleet selected proved to be similar so the contractor cost estimate
was accepted and used as the operating cost in the study.
A detailed breakdown of the cost was not provided by the contractor. The rate quoted for drill,
blast and haul of ore to the plant site and waste to the designated waste dump is US$ 4.24 per
tonne mined. This rate was stated to be in 2014 money and an inflation related increase will be
negotiated and applied annually.
Table 21-11 summarises the quoted rate of US$ 4.24 per tonne mined translated into rates per
kilogram and per tonne processed.
Table 21-11
Estimated mining contractor costs
Item LoM US$/kg LoM US$/tonne milled
Contract mining cost 4.12 23.45
21.2.1.1 Labour Cost
The contractor provided an organogram of the Project supervisory team. This is shown in
Figure 21-2 below.
Figure 21-2
Mining contract supervisory structure
Based on the fleet size and a labour complement determined by MSA a labour cost estimate was
completed. Part of this labour cost is included in the contractor cost and part of it will be incurred
by the mine owner as an owner’s team cost. A summary of the labour cost estimate is shown in
Table 21-12 below.
Project / Production Head
3 x Mining Engineers
1 X Drill & Blasting Supervisor
HR & Admin Manager
1 x Admin Supervisor
1 x HR Assistant
1 x SHEQ
Finance Manager
1 x Tally Clerk cum Cashier
Mechanical Manager
4 x Mechanics & Electricians
1 x Stores Assistant
1 x Fuel Supervisor

J2897 Mkango Songwe Hill PFS November 2014 Page: 283
Table 21-12
Labour summary
Category Complement Cost/Year (US$)
Owners Team
Management 3 475,000
Technical Services 10 341,000
Administration 7 244,000
Camp 18 233,200
Security 49 496,000
Subtotal: Owners Team 87 1,789,200
Mining Contractor
Mining 90 Included in contractor cost
Maintenance 21
Administration 17
Allowance for leave 16
Subtotal Contractor 144
Total Mine Site 231 1,789,200
The following functions will be performed by the owner’s team:
general management – a general manager will be required to oversee the entire mining
and processing operation;
contract management - the mining contractor will need to be managed by a mining
professional;
engineering management – a site engineer will be required to manage the infrastructure on
site;
technical services – mining technical services will be required. This includes mine planning,
geology, grade control and survey;
administration – general administration and contract administration will be done by the
mine owner;
camp management – the residential camp on site will need to be run and managed.
Although it is possible to outsource this function, the costs for this have been included in
the owners cost in the study; and
security – the mine owner will be responsible for overall site security and although this can
be outsourced he costs have been allowed for in the owners, operating cost.
Table 21-13 shows a summary of the labour complement for the owner’s team.

J2897 Mkango Songwe Hill PFS November 2014 Page: 284
Table 21-13
Owners team
Position Number Cost to Company (US$) Annual Cost (US$)
Management
Mine Manager 1 240,000 240,000
Engineering
Manager
1 160,000 160,000
Pit Superintendent 1 75,000 75,000
Technical services
Senior geologist 1 75,000 75,000
Geologist 1 52,000 52,000
Grade controllers 4 14,000 56,000
Mine planner 1 75,000 75,000
Surveyor 1 75,000 75,000
Survey assistants 2 4,000 8,000
Administration
Admin Manager 1 160,000 160,000
Clerks 4 14,000 56,000
Drivers 2 14,000 28,000
Camp
Camp Manager 1 130,000 130,000
Chef 1 52,000 52,000
Kitchen assistants 6 4,000 24,000
Cleaners 6 2,400 14,400
Gardeners 2 2,400 4,800
Laundry assistants 2 4,000 8,000
Security
Security Manager 1 160,000 160,000
Shift supervisor 3 52,000 156,000
Guards 45 4,000 180,000
21.2.1.2 Mining Equipment Operating Cost
Operating costs per hour were estimated for the mining fleet. These costs were based on a fuel
cost of US$ 1.62 per litre. The required hours for each type of machine was calculated from the
mining schedule and multiplied by the hourly cost to estimate the cost per month. The hourly
cost and productivity used for each machine type are shown in Table 21-14.
Table 21-14
Basis of mining fleet operating cost
Equipment type Productivity per unit US$/hr
Drills 25 m/hr 185
Excavator 814 t/hr 193
Trucks 180 t/hr 134
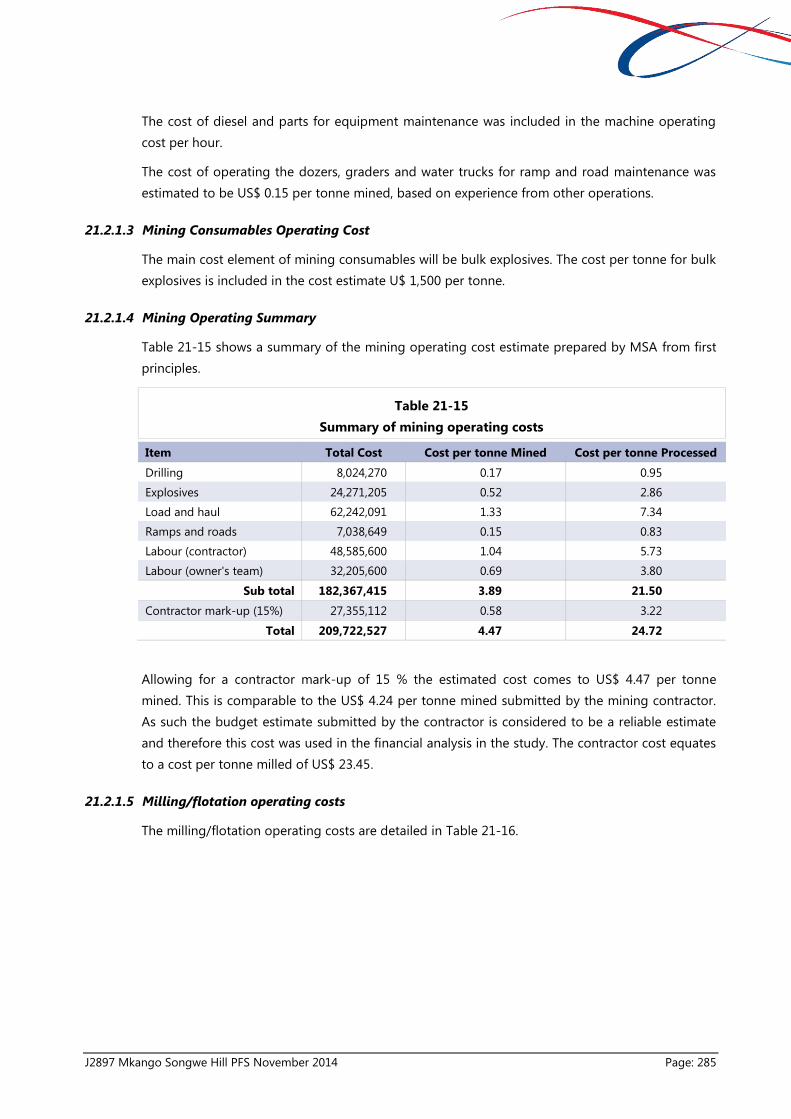
J2897 Mkango Songwe Hill PFS November 2014 Page: 285
The cost of diesel and parts for equipment maintenance was included in the machine operating
cost per hour.
The cost of operating the dozers, graders and water trucks for ramp and road maintenance was
estimated to be US$ 0.15 per tonne mined, based on experience from other operations.
21.2.1.3 Mining Consumables Operating Cost
The main cost element of mining consumables will be bulk explosives. The cost per tonne for bulk
explosives is included in the cost estimate U$ 1,500 per tonne.
21.2.1.4 Mining Operating Summary
Table 21-15 shows a summary of the mining operating cost estimate prepared by MSA from first
principles.
Table 21-15
Summary of mining operating costs
Item Total Cost Cost per tonne Mined Cost per tonne Processed
Drilling 8,024,270 0.17 0.95
Explosives 24,271,205 0.52 2.86
Load and haul 62,242,091 1.33 7.34
Ramps and roads 7,038,649 0.15 0.83
Labour (contractor) 48,585,600 1.04 5.73
Labour (owner's team) 32,205,600 0.69 3.80
Sub total 182,367,415 3.89 21.50
Contractor mark-up (15%) 27,355,112 0.58 3.22
Total 209,722,527 4.47 24.72
Allowing for a contractor mark-up of 15 % the estimated cost comes to US$ 4.47 per tonne
mined. This is comparable to the US$ 4.24 per tonne mined submitted by the mining contractor.
As such the budget estimate submitted by the contractor is considered to be a reliable estimate
and therefore this cost was used in the financial analysis in the study. The contractor cost equates
to a cost per tonne milled of US$ 23.45.
21.2.1.5 Milling/flotation operating costs
The milling/flotation operating costs are detailed in Table 21-16.

J2897 Mkango Songwe Hill PFS November 2014 Page: 286
Table 21-16
Estimated milling/flotation operating costs
Item LoM US$/kg LoM US$/tonne processed
Labour (fixed) 0.73 4.13
Maintenance spares (fixed) 0.32 1.81
Miscellaneous (fixed) 0.26 1.46
Utilities - power (variable) 0.31 1.78
Utilities - water (variable) 0.02 0.11
Hydrometallurgical (variable) 2.08 11.81
Mill liners (variable) 0.04 0.22
Total 3.75 21.33
21.2.1.6 Hydrometallurgical costs
The hydrometallurgical costs are show in Table 21-17.
Table 21-17
Estimated hydrometallurgical costs
Item LoM US$/kg LoM US$/tonne processed
Labour (fixed) 0.30 1.69
Utilities - power (variable) 0.21 1.19
Utilities - water (variable) 0.03 0.16
Utilities - diesel fuel (variable) 0.49 2.80
Maintenance spares (fixed) 0.29 1.68
Miscellaneous (fixed) 0.02 0.12
Consumables (variable) 6.31 35.92
Total Leaching / precipitation / purification cost 7.65 43.54
21.2.1.7 General and administration and other costs
The estimated general and administration (G&A) and other costs are summarised in Table 21-18.
Table 21-18
Estimated G&A and other costs
Item LoM US$/kg LoM US$/tonne processed
G&A 0.67 3.80
Ongoing social development 0.28 1.57
TSF 0.21 1.21
Provision for reclamation 0.15 0.84
Other environmental costs 0.05 0.27
Concentrate transport 0.12 0.70
Total G&A & other costs 1.47 8.38

J2897 Mkango Songwe Hill PFS November 2014 Page: 287
21.2.1.8 Power and water costs
An allowance of US$ 0.11 per cubic metre of water has been provided for in the operating cost
estimate and power costs have been estimated at US$ 0.07684 per kWh. It has been assumed that
power will be sourced from the Malawian power grid.
21.2.1.9 Tolling and concentrate sales costs
The LoM tolling costs are estimated at US$ 10.00 per kilogram or US$ 56.90 per tonne processed.
21.2.2 Processing plant operating cost
The cash operating cost estimate includes the estimated costs of crushing, milling, flotation,
leaching, purification and precipitation in addition to other costs associated with the operation of
the processing plant.
The operating expenditure (Opex) estimate includes a cost for the operation of the 270 t/d
sulphuric acid plant and the stand-by diesel plant.
21.2.2.1 Basis of operating expenditure estimate
The following sources, general data and assumptions were used as the basis for estimating the
operating cost for the processing plant:
the base is the 1st July 2014 (no provision is included for escalation beyond this date);
this PFS assumes that ROM throughput is 500,000 tpa, with a TREO production capacity of
approximately 2,840 tpa excluding a large proportion of the Cerium;
all operating costs are expressed in US$ unless otherwise specified. Exchange rates adopted
at the time of study were:
o US$ 1.00 = 404 MWK;
o US$ 1.00 = 11.5 ZAR;
labour costs are estimated based on the current reasonable labour market rates in the area
of Malawi project sites as provided by Mkango;
the proposed sulphuric acid plant at the mine site is assumed to be capable of co-
generating up to 60 % of the required power for the mine site operations – the total
demand being 6 MW. The Opex estimate of the sulphuric acid plant is included in the
hydrometallurgical plant Opex estimate;
since natural gas is not readily available at Songwe Hill, diesel has been selected as the
alternative fuel for the dryers;
maintenance costs are estimated at 5 % of the supply and delivery direct mechanical cost
from the Capex estimation for the process plant and acid plant;
reagent consumption is based on the preliminary mass balance and stoichiometry;
reagent prices vary according to source of supply, market fluctuation and amount required.
The selected reagent prices were either verified by, or in some cases, directly supplied by

J2897 Mkango Songwe Hill PFS November 2014 Page: 288
Mkango. In cases where multiple prices for the same reagent were obtained, the higher unit
cost was selected; and
no project contingency has been provided for.
21.2.2.2 Opex summary
Table 21-19 summarizes the operating cost estimate for the Songwe Hill Project processing plant.
The results illustrate that the reagent cost constitutes more than 70% of the total operating cost
estimate.
Table 21-19
Operating cost summary – processing plant
Category Annual cost Fixed cost Variable cost Fixed cost Variable cost
US$ US$ US$ US$/t ROM US$/t ROM
Labour
Beneficiation plant 2,002,650 2,002,650 4.01
Hydrometallurgical plant 816,802 816,802 1.63
Total 2,819,453 2,819,453 5.64
Utilities – Power
Beneficiation plant 918,807 918,807 1.84
Hydrometallurgical plant 614,192 614,192 1.23
Total 1,532,998 1,532,998 3.07
Utilities – Water
Beneficiation plant 53,900 53,900 0.11
Hydrometallurgical plant 78,139 78,139 0.16
Total 132,039 132,039 0.26
Utilities – Diesel Fuel
Beneficiation plant
Hydrometallurgical plant 1,400,422 1,400,422 2.80
Total 1,400,422 1,400,422 2.80
Maintenance spares
Beneficiation plant 877,633 877,633 1.76
Hydrometallurgical plant 812,147 812,147 1.62
Total 1,689,779 1,689,779 3.38
Miscellaneous
Beneficiation plant 709,608 709,608 1.42
Hydrometallurgical plant 55,843 55,843 0.11
Total 765,351 765,351 1.53
Consumables
Beneficiation plant 5,907,184 5,907,184 11.81
Hydrometallurgical plant 17,959,134 17,959,134 35.92
Total 23,866,318 23,866,318 47.73
Mill liners
Beneficiation plant 110,880 110,880 0.22
Hydrometallurgical plant
Total 110,880 110,880 0.22

J2897 Mkango Songwe Hill PFS November 2014 Page: 289
Category Annual cost Fixed cost Variable cost Fixed cost Variable cost
US$ US$ US$ US$/t ROM US$/t ROM
Cost
Beneficiation plant 10,580,561 3,589,791 6,990,770
Hydrometallurgical plant 21,736,678 1,684,792 20,051,886
Total 32,317,240 5,274,583 27,042,657
21.2.2.3 Cost elements
Figure 21-3 below illustrates each individual cost elements’ contribution to the total operating
cost estimate.
Figure 21-3
Operating cost summary
Labour cost
Labour costs are estimated by applying typical salary costs, inclusive of benefits, to a proposed
organization. Annual salary for each position is estimated based on the current reasonable labour
market rates in the area of the Songwe Hill Project sites in Malawi and it is based on a total cost
to company.
Reagent cost
Based on results of test work, a suite of flotation reagents and their corresponding consumptions
were used for the operating cost analysis. Selection of reagents for the separation plant was
based on testwork and the consumption was based on a preliminary mass balance and
stoichiometric calculations.

J2897 Mkango Songwe Hill PFS November 2014 Page: 290
Reagent cost for the Beneficiation Plant is estimated at US$ 5,907,184 and for the
Hydrometallurgical Plant is estimated at US$ 17,959,134. Since reagent prices vary significantly
and contribute more than 70 % of the total operating cost, it would be beneficial to obtain a
negotiated price for a more accurate future operating cost estimate.
Power, water and fuel cost
The electricity price for the Project is assumed to be 0.07684 US$/kWh, as supplied by the
Mkango. The annual electricity cost is estimated at US$ 1,532,998. The proposed sulphuric acid
plant has the potential to generate up to 60 % of the required power for the plant.
Fuel cost is estimated at US$ 1,400,422 per annum for the drying operations at the
hydrometallurgical plant and for the sulphuric acid plant start-up.
Transportation cost
The reagent cost estimate includes the transportation costs. Based on Mkango’s discussions to
date in Malawi, it is assumed that the rail cost from Nacala to Blantyre is of the order of
US$ 50 per tonne. The shipping cost to Nacala port is estimated at US$ 80 per tonne based on
quotations received from chemical suppliers.
Sulphuric acid plant operating cost
The proposed sulphuric acid plant burns sulphur to produce sulphuric acid and generates
electricity from the waste heat. The plant will be capable of producing all of the required sulphuric
acid and a portion of the power for the mine site.
The operating cost for the sulphuric acid plant is estimated at US$ 6,032,489 per annum. This cost
mainly comprises the cost of sulphur, with an assumed cost of US$ 262 per tonne, based on a
quote to SNC-Lavalin by an Indian chemical distributor in May 2014.
Maintenance cost
Maintenance costs for equipment, piping, electrical, instrumentation and other associated utilities
are estimated at 5 % of the supply and delivery direct mechanical cost.
The total maintenance cost for the Project is estimated at US$ 1,689,779 per annum, comprising
US$ 877,633 for the Beneficiation Plant and US$ 812,147 for the Hydrometallurgical Plant.
Contingency
Contingency has not been included in the operating cost estimate.
Exclusions
The operating cost estimate excludes all operating costs not directly associated with the
processing facility. These include the following:
mining and exploration costs;
tailings disposal costs;
environmental, social and closure costs;
value added taxes and duties on operating supplies and transportation costs;

J2897 Mkango Songwe Hill PFS November 2014 Page: 291
organic, aqueous or solid waste disposal fees, should there be any; and
general and administrative costs, including marketing, insurance, communications,
procurement services, accounting, safety, auditing, travel, consultants’ fees and external
analytical services.
21.2.3 Tailings Storage Facility Operating costs
The TSF operational cost has been estimated based on current prices for similar TSF operations
elsewhere within Africa and operated by specialist contractors. In the case of low tailings
depositional rates the operating costs are dictated by the costs associated with establishing and
maintaining the staff and equipment necessary to manage the facility and is estimated at
US$ 1/tonne of tailing deposition (@ 500 ktpa the cost shall be US$ 0.5 million per annum). The
total operational cost associated with the TSF is estimated at US$ 0.59 million per annum and
comprises:
US$ 1/tonne of tailing deposition management (500 ktpa amounts to US$ 0.5 million per
annum);
US$ 45,700 per annum for pipe and valve replacements per annum; and
quarterly inspections and annual reviews of the facility, US$ 40,000 per annum.
21.2.3.1 Engineering design
In addition to the capital costs associated with the construction of the TSF provision has been
made for engineering design and construction site supervision. The total cost up to the
completion of the construction of the TSF is estimated at US$ 13.29 million and comprises:
construction of the TSF US$ 12.65 million;
engineering Definitive Feasibility Study at US$ 160,000;
engineering detailed design at US$ 180,000; and
engineering construction supervision at US$ 300,000.
21.2.3.2 Rehabilitation and closure costs
The cost for rehabilitation and closure of the TSF has been compiled by the appointed
environmental consultant and is thus not included in the above LoM expenditure estimate, but
included in elsewhere within the overall Technical Report.
21.2.4 Operating cost summary
The operating costs described in the sections above are summarised in Table 21-20.
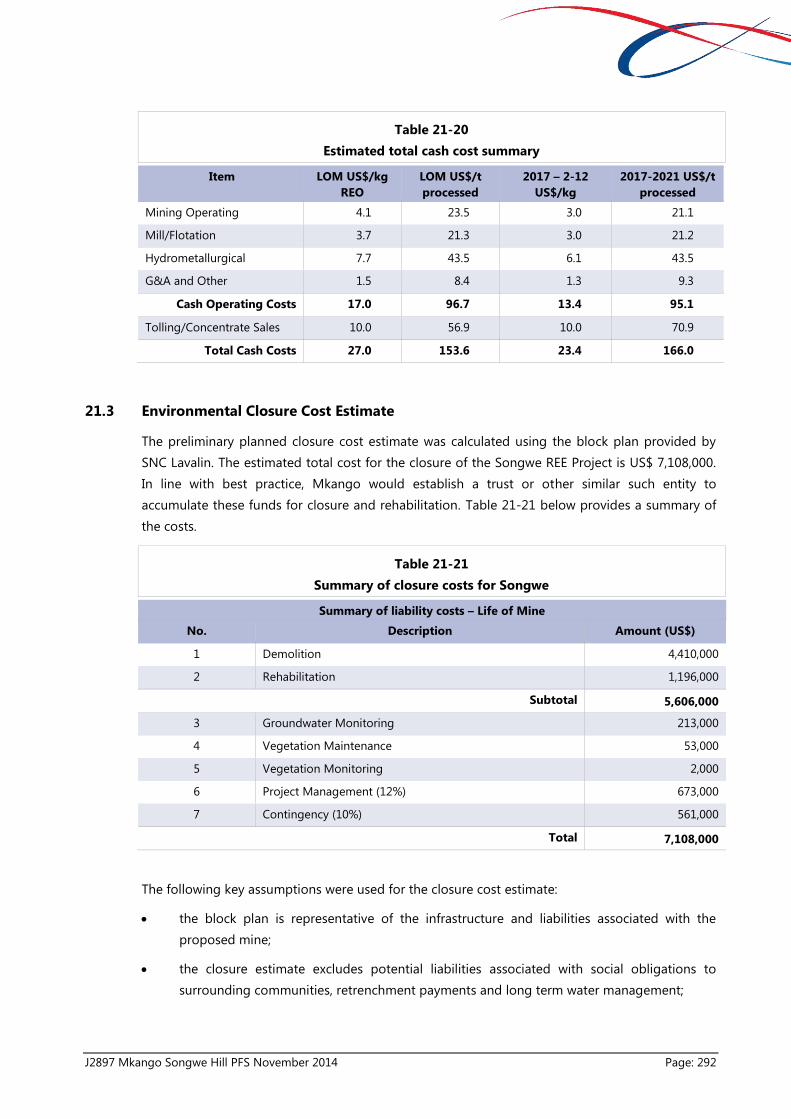
J2897 Mkango Songwe Hill PFS November 2014 Page: 292
Table 21-20
Estimated total cash cost summary
Item LOM US$/kg
REO
LOM US$/t
processed
2017 – 2-12
US$/kg
2017-2021 US$/t
processed
Mining Operating 4.1 23.5 3.0 21.1
Mill/Flotation 3.7 21.3 3.0 21.2
Hydrometallurgical 7.7 43.5 6.1 43.5
G&A and Other 1.5 8.4 1.3 9.3
Cash Operating Costs 17.0 96.7 13.4 95.1
Tolling/Concentrate Sales 10.0 56.9 10.0 70.9
Total Cash Costs 27.0 153.6 23.4 166.0
21.3 Environmental Closure Cost Estimate
The preliminary planned closure cost estimate was calculated using the block plan provided by
SNC Lavalin. The estimated total cost for the closure of the Songwe REE Project is US$ 7,108,000.
In line with best practice, Mkango would establish a trust or other similar such entity to
accumulate these funds for closure and rehabilitation. Table 21-21 below provides a summary of
the costs.
Table 21-21
Summary of closure costs for Songwe
Summary of liability costs – Life of Mine
No. Description Amount (US$)
1 Demolition 4,410,000
2 Rehabilitation 1,196,000
Subtotal 5,606,000
3 Groundwater Monitoring 213,000
4 Vegetation Maintenance 53,000
5 Vegetation Monitoring 2,000
6 Project Management (12%) 673,000
7 Contingency (10%) 561,000
Total 7,108,000
The following key assumptions were used for the closure cost estimate:
the block plan is representative of the infrastructure and liabilities associated with the
proposed mine;
the closure estimate excludes potential liabilities associated with social obligations to
surrounding communities, retrenchment payments and long term water management;

J2897 Mkango Songwe Hill PFS November 2014 Page: 293
a contingency of 10 % has been included to allow for areas which may have been
undervalued or which have been overlooked; and
for the post-closure period, monitoring of groundwater and surface water has been
assumed to take place for a period of five years, with sampling taking place on a quarterly
basis. Vegetation monitoring and maintenance will take place for three years.

J2897 Mkango Songwe Hill PFS November 2014 Page: 294
22 ECONOMIC ANALYSIS
22.1 Introduction
A discounted cash flow model prepared by Mkango Resources was reviewed by MSA which
incorporates the LoM Plan figures, economic assumptions as to USA inflation rates and rare earth
oxide prices as outlined in other Sections of this PFS. The escalation/de-escalation technique has
been employed to ensure the quantum and timing of any taxes payable is calculated correctly.
The financial evaluation has been undertaken on an after-tax, un-leveraged, real rate of return
basis.
All production, costs and revenues are based on calendar fiscal years and all cash inflows and
outflows are assumed to occur in the middle of each year, i.e. June of each year.
A range of discount rates was used to determine the Net Present Values (NPV); the NPVs are at
1st July 2014, in the same money terms.
A sensitivity analysis shows the impact on the NPVs and IRRs to changes in the metal prices,
capex and opex.
22.2 Financial Model Inputs
22.2.1 Metal prices
Long term rare earth price assumptions were based on an average of those included in Feasibility
Studies and Pre-feasibility Studies announced by peer group companies in the rare earth sector in
2013 and 2014, resulting in the equivalent price for a total rare earth basket for Songwe Hill of
US$ 55.01 per kg REO. Prices are assumed to remain flat in real terms over the life of the mine.
The main revenue drivers are neodymium (37 %), dysprosium (14 %), praseodymium (13 %) and
europium (18 %) as illustrated in Table 22-1.
Table 22-1
Projected prices for REE and Yttrium
Rare Earth Oxide REO Price
Assumption
(US$/kg)
REO in
conc1
(tonnes)
REO in conc
split
REO in conc
(US$/kg)
REO in conc
Split by value
Lanthanum La2O3 7.7 1,075 37.8 % 2.9 5.3 %
Cerium CeO2 5.9 341 12.0 % 0.7 1.3 %
Praseodymium Pr6O11 91.4 227 8.0 % 7.3 13.3 %
Neodymium Nd2O3 77.3 756 26.6 % 20.6 37.4 %
Samarium Sm2O3 7.9 114 4.0 % 0.3 0.6 %
Europium Eu2O3 1,066.0 27 0.9 % 10.0 18.3 %
Gadolinium Gd2O3 49.0 62 2.2 % 1.1 1.9 %
Terbium Tb4O7 912.0 7 0.3 % 2.3 4.3 %
Dysprosium Dy2O3 627.9 35 1.2 % 7.8 14.2 %
Yttrium Y2O3 32.9 165 5.8 % 1.9 3.5 %
Holmium2 Ho2O3 6 0.2 %
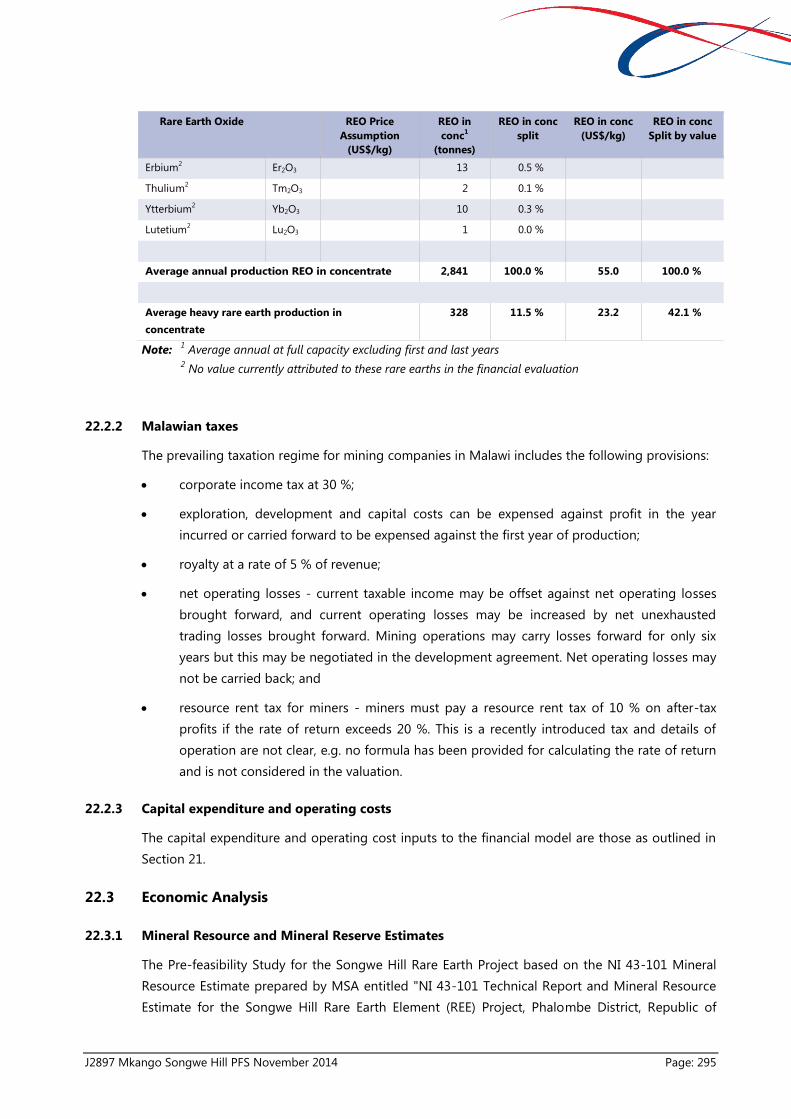
J2897 Mkango Songwe Hill PFS November 2014 Page: 295
Rare Earth Oxide REO Price
Assumption
(US$/kg)
REO in
conc1
(tonnes)
REO in conc
split
REO in conc
(US$/kg)
REO in conc
Split by value
Erbium2 Er2O3 13 0.5 %
Thulium2 Tm2O3 2 0.1 %
Ytterbium2 Yb2O3 10 0.3 %
Lutetium2 Lu2O3 1 0.0 %
Average annual production REO in concentrate 2,841 100.0 % 55.0 100.0 %
Average heavy rare earth production in
concentrate
328 11.5 % 23.2 42.1 %
Note: 1 Average annual at full capacity excluding first and last years
2 No value currently attributed to these rare earths in the financial evaluation
22.2.2 Malawian taxes
The prevailing taxation regime for mining companies in Malawi includes the following provisions:
corporate income tax at 30 %;
exploration, development and capital costs can be expensed against profit in the year
incurred or carried forward to be expensed against the first year of production;
royalty at a rate of 5 % of revenue;
net operating losses - current taxable income may be offset against net operating losses
brought forward, and current operating losses may be increased by net unexhausted
trading losses brought forward. Mining operations may carry losses forward for only six
years but this may be negotiated in the development agreement. Net operating losses may
not be carried back; and
resource rent tax for miners - miners must pay a resource rent tax of 10 % on after-tax
profits if the rate of return exceeds 20 %. This is a recently introduced tax and details of
operation are not clear, e.g. no formula has been provided for calculating the rate of return
and is not considered in the valuation.
22.2.3 Capital expenditure and operating costs
The capital expenditure and operating cost inputs to the financial model are those as outlined in
Section 21.
22.3 Economic Analysis
22.3.1 Mineral Resource and Mineral Reserve Estimates
The Pre-feasibility Study for the Songwe Hill Rare Earth Project based on the NI 43-101 Mineral
Resource Estimate prepared by MSA entitled "NI 43-101 Technical Report and Mineral Resource
Estimate for the Songwe Hill Rare Earth Element (REE) Project, Phalombe District, Republic of

J2897 Mkango Songwe Hill PFS November 2014 Page: 296
Malawi" was filed on 22 November 2012. The Report's Mineral Resource Estimates, as previously
announced, are summarized in Table 22-2.
Table 22-2
Indicated and Inferred Mineral Resource Estimate
Cut-off Grade Indicated Mineral Resource Estimate Inferred Mineral Resource Estimate
1.0 % TREO 13.2 Mt grading 1.62 % TREO 18.6 Mt grading 1.38 % TREO
1.5 % TREO 6.2 Mt grading 2.05 % TREO 5.1 Mt grading 1.83 % TREO
Note: TREO – total rare earth oxides including yttrium; In situ – no geological losses applied; Mt – million
tonnes.
The Study supports the declaration of a Mineral Reserve Estimate for the Project as summarised in
Table 22-3.
Table 22-3
Probable Mineral Reserve Estimate
Cut-off Grade Probable Mineral Reserve Estimate
1.0 % TREO 8.5 Mt grading 1.60 % TREO
Note: TREO – total rare earth oxides including yttrium;
The following modifying factors were used to convert the Mineral Resource Estimate to the Mineral
Reserve Estimate: Mining recovery – 95 %; mining dilution – 5 %; plant recovery – 34 %; product price –
US$ 55.01 per kg TREO; operating cost – US$ 96.42 per tonne ore processed or US$ 16.95 per kg TREO
recovered.
Indicated Mineral Resources are inclusive of Mineral Reserves. Mineral Resources that are not
Mineral Reserves do not have demonstrated economic viability. The financial valuation is based
on the mining of the 8.5 Mt of estimated Mineral Reserves only.
22.3.2 Financial Valuation
The Project is economically viable with:
a NPV @ 10 % (nominal) of US$ 293 million as at 1st July 2014; and
an IRR of 36 % (nominal).
Table 22-4 through to Table 22-8 summarise selected financial inputs and the corresponding
results. All costs are quoted in real July 2014 United States Dollars (US$).

J2897 Mkango Songwe Hill PFS November 2014 Page: 297
Table 22-4
Summary of mining and processing inputs and results
Item Unit Value
Life of Model Years 18
MINING
Total life-of-model ore production 000’t 8,483
Waste mined 000’t 38,442
Strip ratio W:O 4.5
Total LoM Plant feed 000’t 8,483
Average yearly Plant Feed 000’t 500
PROCESSING
Tonnes to hydrometallurgical plant 000’t 8,483
Contained REOs in product 000’t 48.3
Average annual production Of REOs (excl. 1st and last year) tpa 2,841
Table 22-5
Summary of selected financial inputs and corresponding results - Capital
Item Unit Value
CAPITAL
Total Real Development Capital US$ million 198
Contingency US$ million 20
Total Real Development Capital incl. Contingency US$ million 217
Sustaining capital and reclamation US$ million 24
Total Real Capital Expenditure US$ million 241
Maximum Exposure US$ million (175)

J2897 Mkango Songwe Hill PFS November 2014 Page: 298
Table 22-6
Summary of selected financial inputs and corresponding results - costs
Item Unit Value
LoM Total Cash Cost Breakdown: US$/kg REO
Mining US$/kg 4.1
Beneficiation US$/kg 3.7
Hydrometallurgical US$/kg 7.7
G&A and Other US$/kg 1.5
Operating Cash Costs US$/kg 17.0
Tolling/concentrate sales US$/kg 10.0
Total Cash Costs US$/kg 27.0
LoM Total Cash Cost Breakdown: US$/t processed
Mining US$/t 23.5
Beneficiation US$/t 21.3
Hydrometallurgical US$/t 43.5
G&A and Other US$/t 8.4
Operating Cash Costs US$/t 96.7
Tolling/concentrate sales US$/t 56.9
Total Cash Costs US$/t 153.6
Table 22-7
Summary of selected financial inputs and corresponding results (Nominal)– post tax
valuation
Item Unit Value
Post Tax Valuation
Project cash flow post-tax (Nominal) (including royalty) US$ million 935
Payback period from Project start Years 4.7
Payback period from start of production Years 2.7
Post-tax NPV @ 10 % (Nominal) discount rate US$ million 293
Post-tax IRR (Nominal) % 36 %

J2897 Mkango Songwe Hill PFS November 2014 Page: 299
Table 22-8
NPVs of the Project
Financial Evaluation Nominal discount rate 1 Real discount rate Post-tax NPV (US$
million)
9.0 % 6.3 % 326
Base Case 10.0 % 7.3 % 293
11.0 % 8.3 % 262
12.0 % 9.3 % 234
13.0 % 10.2 % 210
14.0 % 11.2 % 188
Internal rate of return 36 % 32 %
Note: 1 Includes inflation at 2.5 %
22.3.3 Sensitivity analysis
The sensitivity chart, Figure 22-1 below, shows the nominal NPV @ 10 % variation due to changes
in revenue, capital and operating costs, holding all other inputs constant. The Project is most
sensitive to the metal prices and more sensitive to Opex than Capex. The revenue sensitivity
assumes that all rare earth metal prices change by the same percentage and that the tolling rate
does not change with rare earth prices.
Figure 22-1
NPV @ 10 % nominal sensitivy analysis
Figure 22-2 shows the nominal annual flows over the life of the Project.
0
50
100
150
200
250
300
350
400
450
500
-20.0% -15.0% -10.0% -5.0% 0.0% 5.0% 10.0% 15.0% 20.0%
NP
V @
1
0%
(US
$ m
illio
n)
% Change in Variable
Revenue/grade Capex Opex

J2897 Mkango Songwe Hill PFS November 2014 Page: 300
Figure 22-2
Annual cash flow (nominal)
Maximum negative cash flow of US$ 184 million occurs in 2017 as shown in the cumulative cash
flow graph (Figure 22-3).
Figure 22-3
Cumulative annual cash flow (nominal)
(200.0)
(175.0)
(150.0)
(125.0)
(100.0)
(75.0)
(50.0)
(25.0)
-
25.0
50.0
75.0
100.0
125.0
150.0
2014
2015
2016
2017
2018
2019
2020
2021
2022
2023
2024
2025
2026
2027
2028
2029
2030
2031
2032
2033
2034
2035
Ca
sh F
low
(U
S$
mil
lio
n)
(300)
(200)
(100)
-
100
200
300
400
500
600
700
800
900
1,000
2014
2015
2016
2017
2018
2019
2020
2021
2022
2023
2024
2025
2026
2027
2028
2029
2030
2031
2032
2033
2034
2035
Ca
sh F
low
(U
S$
mil
lio
n)

J2897 Mkango Songwe Hill PFS November 2014 Page: 301
Table 22-9 shows the matrices of the NPV for percentage variations in revenue (all metals), capital
and operating expenditure.
Table 22-9
Sensitivity of NPV (Nominal) to changes in metal prices (all metals), Capex and Opex.
Discount Rate: --> 293 0.0% 10.0% 11.0% 12.0% 13.0% 14.0%
20% 1,398 467 422 383 347 316
15% 1,282 423 382 346 313 284
10% 1,167 380 342 309 279 252
5% 1,051 336 302 272 245 220
0% 935 293 262 234 210 188
-5% 819 249 222 197 176 157
-10% 704 205 181 160 142 125
-15% 588 161 141 123 107 92
-20% 472 117 100 85 72 60
REVENUE
NPV (US$ million)
% C
han
ge i
n M
eta
l P
rice
s
Discount Rate: --> 293 0.0% 10.0% 11.0% 12.0% 13.0% 14.0%
20% 781 239 213 189 169 150
15% 819 252 225 201 179 160
10% 858 266 237 212 189 169
5% 896 279 249 223 200 179
0% 935 293 262 234 210 188
-5% 974 306 274 246 221 198
-10% 1,012 319 286 257 231 208
-15% 1,051 333 298 268 241 217
-20% 1,089 346 311 280 252 227
% C
han
ge i
n O
pex
OPEX
NPV (US$ million)
Discount Rate: --> 293 0.0% 10.0% 11.0% 12.0% 13.0% 14.0%
20% 898 262 232 205 181 160
15% 908 270 239 213 189 167
10% 917 277 247 220 196 174
5% 926 285 254 227 203 181
0% 935 293 262 234 210 188
-5% 944 300 269 242 217 195
-10% 953 308 276 249 225 203
-15% 963 315 284 256 232 210
-20% 972 323 291 264 239 217
% C
han
ge i
n C
ap
ex
CAPEX
NPV (US$ million)

J2897 Mkango Songwe Hill PFS November 2014 Page: 302
Table 22-10 below shows the effect on the NPV@10% for a two-way variation in Opex and Capex.
Table 22-10
Sensitivity of NPV @ 10 % (nominal) to two way variation in Opex and Capex.
22.4 Mine Life
The mine has an estimated operating life of 18 years based on the current mine plan tonnage.
22.5 Discounted cash flow model
Table 22-11 and Table 22-12 show the DCF model for the Mkango Project.
Capex
293 20% 15% 10% 5% 0% -5% -10% -15% -20%
20% 208 222 235 249 262 276 289 303 316
15% 216 229 243 256 270 283 297 310 324
10% 224 237 251 264 277 291 304 318 331
5% 231 245 258 272 285 298 312 325 339
0% 239 252 266 279 293 306 319 333 346
-5% 246 260 273 287 300 314 327 340 354
-10% 254 267 281 294 308 321 335 348 361
-15% 262 275 288 302 315 329 342 355 369
-20% 269 283 296 309 323 336 350 363 376
NPV @ 10% (Nominal)(US$ million)
% Change in Opex
% C
han
ge i
n C
ap
ex

J2897 Mkango Songwe Hill PFS October 2014 Page: 303
Table 22-11
Cash Flow Model – Mkango Project
DESCRIPTION UNIT TOTAL 2014 2015 2016 2017 2018 2019 2020 2021 2022 2023 2024 2025 2026 2027 2028 2029 2030 2031 2032 2033 2034 2035
MINING
Waste mined t 38,441,726 - - - 1,068,865 1,528,326 1,040,988 2,064,652 1,842,227 1,917,310 1,868,717 1,469,575 1,596,984 2,394,980 3,067,241 2,603,481 3,021,995 3,283,584 3,223,874 2,775,661 2,788,040 885,228
Strip Ratio W:O 4.53 - - - 1.45 3.47 0.77 6.19 3.27 3.99 3.53 1.58 1.98 709.40 14.18 5.21 11.27 18.23 53.99 5.46 5.55 12.89
ROM tonnes t 8,482,603 - - - 734,831 440,201 1,357,370 333,705 562,700 481,045 529,640 928,782 807,944 3,376 216,344 500,012 268,161 180,092 59,711 507,924 502,116 68,650
PROCESSING
Tonnes processed t 8,482,603 - - - 200,000 500,000 500,000 500,000 500,000 500,000 500,000 500,000 500,000 500,000 500,000 500,000 500,000 500,000 500,000 500,000 500,000 282,603
Grade processed % 1.60% - - - 2.25% 2.24% 1.88% 1.80% 1.98% 1.52% 1.50% 1.80% 1.75% 1.36% 1.40% 1.50% 1.36% 1.27% 1.30% 1.47% 1.53% 1.22%
Contained REO in feed t 136,139 4,500 11,204 9,402 8,999 9,881 7,577 7,513 9,013 8,750 6,806 6,999 7,494 6,781 6,338 6,476 7,329 7,630 3,447
Contained REO in mineral concentrate t 91,213 - - - 3,015 7,507 6,299 6,030 6,620 5,076 5,034 6,039 5,863 4,560 4,689 5,021 4,544 4,246 4,339 4,910 5,112 2,310
REO recovered to final mixed product t 48,275 - - - 1,596 3,973 3,334 3,191 3,504 2,687 2,664 3,196 3,103 2,413 2,482 2,657 2,405 2,247 2,296 2,599 2,706 1,222
OPERATING INCOME (Nominal)
Sales US$m 3,499.5 - - - 94.52 241.23 207.49 203.57 229.09 180.06 183.00 225.05 223.94 178.53 188.18 206.52 191.57 183.51 192.20 222.94 237.92 110.18
Less: Royalty US$m 175.0 - - - 4.73 12.06 10.37 10.18 11.45 9.00 9.15 11.25 11.20 8.93 9.41 10.33 9.58 9.18 9.61 11.15 11.90 5.51
Less: Tolling/separation costs US$m 636.2 - - - 17.18 43.86 37.72 37.01 41.65 32.73 33.27 40.91 40.71 32.46 34.21 37.55 34.83 33.36 34.94 40.53 43.25 20.03
NET REVENUE US$m 2,688.3 - - - 72.61 185.31 159.39 156.38 175.98 138.32 140.58 172.88 172.03 137.15 144.56 158.65 147.16 140.97 147.64 171.27 182.77 84.64
OPERATING EXPENDITURE (NOMINAL)
Mining opex
Contract mining cost US$m 269.6 - - - 8.2 9.2 11.5 11.8 12.1 12.4 12.7 13.0 13.4 13.7 19.2 18.6 20.2 21.8 21.2 21.7 22.3 6.6
Contract mining cost (Real) US$/t 4.24 4.24 4.24 4.24 4.24 4.24 4.24 4.24 4.24 4.24 4.24 4.24 4.24 4.24 4.24 4.24 4.24 4.24 4.24
Milling / flotation opex
Labour (fixed) US$m 47.2 - - - 1.1 2.2 2.3 2.3 2.4 2.4 2.5 2.6 2.6 2.7 2.8 2.8 2.9 3.0 3.0 3.1 3.2 3.3
Maintenance spares (fixed) US$m 20.7 - - - 0.5 1.0 1.0 1.0 1.0 1.1 1.1 1.1 1.2 1.2 1.2 1.2 1.3 1.3 1.3 1.4 1.4 1.4
Miscellaneous (fixed) US$m 16.7 - - - 0.4 0.8 0.8 0.8 0.8 0.9 0.9 0.9 0.9 1.0 1.0 1.0 1.0 1.1 1.1 1.1 1.1 1.2
Utilities - power (variable) US$m 20.3 - - - 0.2 1.0 1.0 1.1 1.1 1.1 1.1 1.2 1.2 1.2 1.3 1.3 1.3 1.4 1.4 1.4 1.5 0.5
Utilities - water (variable) US$m 1.2 - - - 0.0 0.1 0.1 0.1 0.1 0.1 0.1 0.1 0.1 0.1 0.1 0.1 0.1 0.1 0.1 0.1 0.1 0.0
Consumables (variable) US$m 134.4 - - - 2.5 6.5 6.7 6.9 7.0 7.2 7.4 7.6 7.8 7.9 8.1 8.3 8.6 8.8 9.0 9.2 9.4 5.5
Mill liners (variable) US$m 2.5 - - - 0.0 0.1 0.1 0.1 0.1 0.1 0.1 0.1 0.1 0.1 0.2 0.2 0.2 0.2 0.2 0.2 0.2 0.1
Subtotal US$m 243.0 - - - 4.7 11.7 12.0 12.3 12.6 12.9 13.2 13.5 13.9 14.2 14.6 15.0 15.3 15.7 16.1 16.5 16.9 12.0
Subtotal (real) US$/t 21.33 - - - 21.9 21.2 21.2 21.2 21.2 21.2 21.2 21.2 21.2 21.2 21.2 21.2 21.2 21.2 21.2 21.2 21.2 25.9
Leaching / precipitation / purification
Labour (fixed) US$m 19.3 - - - 0.4 0.9 0.9 0.9 1.0 1.0 1.0 1.0 1.1 1.1 1.1 1.2 1.2 1.2 1.2 1.3 1.3 1.3
Utilities - power (variable) US$m 13.6 - - - 0.1 0.7 0.7 0.7 0.7 0.7 0.8 0.8 0.8 0.8 0.8 0.9 0.9 0.9 0.9 1.0 1.0 0.3
Utilities - water (variable) US$m 1.8 - - - 0.0 0.1 0.1 0.1 0.1 0.1 0.1 0.1 0.1 0.1 0.1 0.1 0.1 0.1 0.1 0.1 0.1 0.1
Utilities - diesel fuel (variable) US$m 31.9 - - - 0.6 1.5 1.6 1.6 1.7 1.7 1.7 1.8 1.8 1.9 1.9 2.0 2.0 2.1 2.1 2.2 2.2 1.3
Maintenance spares (fixed) US$m 19.1 - - - 0.4 0.9 0.9 0.9 1.0 1.0 1.0 1.0 1.1 1.1 1.1 1.1 1.2 1.2 1.2 1.3 1.3 1.3
Miscellaneous (fixed) US$m 1.3 - - - 0.0 0.1 0.1 0.1 0.1 0.1 0.1 0.1 0.1 0.1 0.1 0.1 0.1 0.1 0.1 0.1 0.1 0.1
Consumables (variable) US$m 408.6 - - - 7.7 19.8 20.3 20.8 21.3 21.9 22.4 23.0 23.6 24.2 24.8 25.4 26.0 26.7 27.3 28.0 28.7 16.6
Total Leaching / precipitation / purification cost US$m 495.5 - - - 9.4 24.0 24.6 25.2 25.8 26.5 27.1 27.8 28.5 29.2 30.0 30.7 31.5 32.3 33.1 33.9 34.7 21.1
Leaching / precipitation / purification cost (Real) US$/t conc. 188.91 189.1 188.6 188.6 188.6 188.6 188.6 188.6 188.6 188.6 188.6 188.6 188.6 188.6 188.6 188.6 188.6 188.6 197.5
Total processing Costs US$m 738.5 - - - 14.1 35.7 36.6 37.5 38.4 39.4 40.4 41.4 42.4 43.5 44.5 45.7 46.8 48.0 49.2 50.4 51.7 33.1
Total processing Costs (Real) US$/t ore processed 64.88 65.4 64.6 64.6 64.6 64.6 64.6 64.6 64.6 64.6 64.6 64.6 64.6 64.6 64.6 64.6 64.6 64.6 71.4

J2897 Mkango Songwe Hill PFS October 2014 Page: 304
Table 22-12
Cash Flow Model – Mkango Project
G&A / Other
Total G&A & other costs US$m 95.0 - 0.0 0.1 3.5 4.9 4.8 4.8 5.1 4.8 4.9 5.3 5.4 5.2 5.4 5.6 5.6 5.6 5.8 6.1 6.4 5.5
Total G&A & other costs (real) US$/t 8.4 - - - 16.1 9.0 8.5 8.3 8.6 7.9 7.9 8.3 8.3 7.7 7.8 7.9 7.7 7.6 7.6 7.9 8.0 12.0
TOTAL CASH OPERATING COSTS (nominal) US$m 1,103.2 - 0.0 0.1 25.8 49.8 52.9 54.1 55.6 56.6 58.0 59.7 61.2 62.3 69.1 69.8 72.6 75.4 76.2 78.3 80.3 45.2
Total operating costs (Real) US$/t ore processed 96.7 - - - 119.8 90.3 93.4 93.3 93.6 92.9 92.9 93.3 93.3 92.7 100.3 98.9 100.2 101.6 100.1 100.3 100.5 97.7
Total operating costs ex tolling (Real) US$/kg 17.0 - - - 15.0 11.4 14.0 14.6 13.4 17.3 17.4 14.6 15.0 19.2 20.2 18.6 20.8 22.6 21.8 19.3 18.6 22.6
CAPITAL EXPENDITURE (Nominal)
Development Capex
Site facilities & infrastructure US$m 38.3 - - 26.6 11.7 - - - - - - - - - - - - - - - - -
Mining US$m 1.8 - - 1.3 0.4 - - - - - - - - - - - - - - - - -
Mill / concentrator US$m US$m 47.7 - - 35.6 12.2 - - - - - - - - - - - - - - - - -
Leach / purification plant US$m US$m 60.4 - - 45.0 15.4 - - - - - - - - - - - - - - - - -
Acid plant US$m 34.6 - - 25.8 8.8 - - - - - - - - - - - - - - - - -
Road US$m 5.5 - - 5.5 - - - - - - - - - - - - - - - - - -
Tailings US$m 13.4 - - 10.0 3.4 - - - - - - - - - - - - - - - - -
Other US$m 7.0 - 5.1 1.9 - - - - - - - - - - - - - - - - - - -
Total Development Capex (Nominal) US$m 208.7 - 5.1 151.7 51.8 - - - - - - - - - - - - - - - - -
Contingency US$m 20.9 - - 15.6 5.3 - - - - - - - - - - - - - - - - -
Total Development Capex incl Contingency US$m 229.5 - 5.1 167.3 57.2 - - - - - - - - - - - - - - - - -
Sustaining Capital US$m 23.0 - - - - 1.1 1.1 1.2 1.2 1.2 1.2 1.3 1.3 1.3 1.4 1.4 1.4 1.5 1.5 1.6 1.6 1.6
Total Capex (Nominal) US$m 252.6 - 5.1 167.3 57.2 1.1 1.1 1.2 1.2 1.2 1.2 1.3 1.3 1.3 1.4 1.4 1.4 1.5 1.5 1.6 1.6 1.6
Total Development Capex incl Contingency (Real) US$m 217.3 - 5.0 159.2 53.1 - - - - - - - - - - - - - - - - -
PRE-TAX CASH FLOW (NOMINAL)
Net Operating Income US$m 2,688.3 0.0 0.0 0.0 72.6 185.3 159.4 156.4 176.0 138.3 140.6 172.9 172.0 137.1 144.6 158.6 147.2 141.0 147.6 171.3 182.8 84.6
Less: Cash Costs US$m 1,103.2 0.0 0.0 0.1 25.8 49.8 52.9 54.1 55.6 56.6 58.0 59.7 61.2 62.3 69.1 69.8 72.6 75.4 76.2 78.3 80.3 45.2
EBITDA US$m 1,585.2 0.0 (0.0) (0.1) 46.8 135.5 106.5 102.3 120.3 81.7 82.6 113.2 110.8 74.8 75.5 88.8 74.6 65.6 71.5 93.0 102.4 39.4
Less: Depreciation US$m 252.6 0.0 5.1 167.3 57.2 1.1 1.1 1.2 1.2 1.2 1.2 1.3 1.3 1.3 1.4 1.4 1.4 1.5 1.5 1.6 1.6 1.6
EBIT US$m 1,332.6 0.0 (5.1) (167.4) (10.3) 134.4 105.4 101.1 119.2 80.5 81.3 111.9 109.5 73.5 74.1 87.4 73.1 64.1 70.0 91.5 100.9 37.8
Less: Taxation US$m 397.5 0.0 0.0 0.0 0.0 0.0 14.8 30.3 35.7 24.2 24.4 33.6 32.9 22.0 22.2 26.2 21.9 19.2 21.0 27.4 30.3 11.3
PROFIT AFTER TAX US$m 935.1 0.0 (5.1) (167.4) (10.3) 134.4 90.6 70.8 83.4 56.4 56.9 78.3 76.7 51.4 51.9 61.2 51.2 44.9 49.0 64.0 70.6 26.4
Add: Depreciation US$m 252.6 0.0 5.1 167.3 57.2 1.1 1.1 1.2 1.2 1.2 1.2 1.3 1.3 1.3 1.4 1.4 1.4 1.5 1.5 1.6 1.6 1.6
Less: Capital Expenditure US$m 252.6 0.0 5.1 167.3 57.2 1.1 1.1 1.2 1.2 1.2 1.2 1.3 1.3 1.3 1.4 1.4 1.4 1.5 1.5 1.6 1.6 1.6
Change in Working Capital US$m - 0.0 (0.0) (0.0) 1.4 2.7 (0.9) (0.1) 0.5 (1.2) 0.0 0.9 (0.1) (1.1) 0.0 0.4 (0.4) (0.3) 0.2 0.6 0.3 (1.9) (1.2)
Post Tax Cash Flow (Nominal) US$m 935.1 0.0 (5.1) (167.4) (11.8) 131.7 91.4 70.9 82.9 57.5 56.9 77.4 76.7 52.5 51.8 60.8 51.6 45.1 48.8 63.4 70.3 28.3 1.2
Post Tax Cash Flow (Real) US$m 687.8 0.0 (5.0) (159.3) (10.9) 119.3 80.8 61.1 69.7 47.2 45.6 60.5 58.5 39.0 37.6 43.0 35.6 30.4 32.1 40.6 44.0 17.3 0.7

J2897 Mkango Songwe Hill PFS November 2014 Page: 305
23 ADJACENT PROPERTIES
No information from any adjacent properties is incorporated in this Technical Report and no
interpretations or results regarding the Songwe Hill property have utilized information from
adjoining properties.

J2897 Mkango Songwe Hill PFS November 2014 Page: 306
24 OTHER RELEVANT DATA AND INFORMATION
24.1 Legal Framework
The Project will be operating within Malawi and will therefore need to comply with all mining,
processing and operating laws in the host country. In addition to local legislation, the Project may
seek funding from private institutions that may require the Project to be complaint with
international standards and protocols. The Project will therefore also seek to be compliant with
the Equator Principles and the International Finance Corporation’s Performance Standards and
Environmental Health and Safety Guidelines.
The following legal review focusses on the legislation and requirements that are pertinent to the
environmental aspects of the Project, including any processes, permits or licences required prior
to obtaining a mining licence. The legal framework will be updated and detailed further during
the feasibility phase.
24.1.1 Malawian Legislation
Several Acts regulate the minerals sector in Malawi. Amongst these are the Mines and Minerals
Act 1981 (and regulations), the Petroleum (Exploration and Production) Act 1983, and the
Explosives Act 1968. In addition to the mining legislation there are also various environmental
Acts and policies which will apply. A summary of the main laws, regulations and policies is
presented here.
24.1.1.1 The Malawi Constitution
After Malawi’s transition to a democratic disposition in 1994 and the adoption of a new
constitution in 1995 a review of the existing environmental situation was undertaken. The Malawi
Constitution (1995) lays a strong foundation for policy and legal reform in environmental
governance, and also establishes the improvement of rural standards as a national policy
objective. Section 13 of Chapter III (Fundamental Principles) declares:
“The State shall actively promote the welfare and development of the people of Malawi by
progressively adopting and implementing policies and legislation aimed at achieving the following
goals:
(1) To manage the environment responsibly in order to:
Prevent the degradation of the environment;
Provide a healthy living and working environment for people of Malawi;
Accord full recognition to the rights of future generations by means of environmental
protection and sustainable development of natural resources; and conserve and enhance the
biological diversity of Malawi; and
Conserve the biological diversity of Malawi;
(2) To enhance the quality of life in rural communities and to recognise rural standards of living as a
key indicator of the success of Government Policies.”

J2897 Mkango Songwe Hill PFS November 2014 Page: 307
Environmental provisions were subsequently inserted in the Mines and Minerals Act including the
stipulation that an Environmental Impact Assessment (EIA) be submitted to the Department of
Research and Environmental Affairs for review with each mineral rights application. However, the
existing pieces of the legislation were reviewed and amended in a piecemeal manner. In other
words, the Mines and Minerals Act was amended merely to include a semblance of environmental
concern but no fundamental substantive changes were made to reflect new developments and
realities both domestic and international.
24.1.1.2 Mining Legislation
The Mines and Minerals Act defines the rules under which players in the minerals sector conduct
business. It outlines the rights, duties and obligations of Government and of the exploration and
mining investors as well as the applicable restrictions (Ministry of Minerals, 2013). Once Mkango
have completed its Pre-feasibility studies and Feasibility studies, it will be in a position to convert
its current Prospecting Licence into a Mining Licence, under the Mines and Minerals Act.
Conversion of Prospect Licence to Mining licence
Mkango is a limited company having been granted rights in the form of an exclusive prospective
licence. The company qualifies to be granted such a licence under section 13 of the Mines and
Minerals Act. All that remains for the Company to acquire the Mining Licence is to submit an
application to the Minister under section 38 of the Act for a Mining Licence. The following extracts
from the Mines and Mineral Act are of relevance to converting into a Mining Licence:
“37. Application for mining licence
(1) An application for the grant of a mining licence may be made by the holder of an exclusive
prospecting licence or by a person who is not such a holder.
(2) Where an application for the grant of a mining licence is made by the holder of an exclusive
prospecting licence, the application shall be made—
(a) only in respect of land subject to the exclusive prospecting licence;
(b) only if the holder has given notice to the Minister of the discovery in commercial
quantities of any mineral to which his licence relates; and
(d) not later than two months, or such further period as the Minister may allow, after that
notice was given to the Minister.
(3) An application for the grant of a mining licence—
(a) shall give information of the kind referred to in section 16 (a);
(b) shall identify the minerals which it is proposed to mine;
(c) shall state the number of the exclusive prospecting licence (if any) held by the applicant
and shall give details of any exclusive prospecting licence held by the applicant, or by any
person controlling, controlled by or under joint or common control with, the applicant, during
the preceding four years;

J2897 Mkango Songwe Hill PFS November 2014 Page: 308
(d) shall be accompanied by a plan of the area over which the licence is sought drawn in such
manner as the Minister may require and showing—
(i) the name of each lawful occupier of a holding in, or partly in, that area and, in the case
of more than one such holding, the boundaries within that area of each such holding; and
(ii) such other particulars as the Minister may require;
(e) shall state the period for which the licence is sought;
(f) shall give or be accompanied by a statement giving details of the mineral deposits in the
area of land over which the licence is sought, including details of all known minerals proved,
estimated or inferred, ore reserves and mining conditions;
(g) shall be accompanied by a technological report on mining and treatment possibilities and
the intention of the applicant in relation thereto;
(h) shall give or be accompanied by a statement giving particulars of the programme of
proposed mining operations including a statement of—
(i) the estimated date by which the applicant intends to work for profit;
(ii) the estimated capacity of production and scale of operations;
(iii) the estimated overall recovery of ore and mineral products;
(iv) the nature of the products;
(v) proposals for the prevention of pollution, the treatment of wastes, the safeguarding of
natural resources, the progressive reclamation and rehabilitation of land disturbed by
mining and for the minimization of the effects of mining on surface water and ground
water and on adjoining or neighbouring lands;
(vi) the residual effects on the environment of the mining operations and proposals for
their minimization;
(vii) any particular risks (whether to health or otherwise) involved in mining the mineral,
and proposals for their control or elimination; and
(viii) any significant effect which the carrying out of the programme would be likely to
have on the environment and on any monument or relic in the area over which the licence
is sought and proposals for eliminating or controlling that effect;
(i) shall give or be accompanied by a statement giving a detailed forecast of capital
investment, operating costs and revenues and the anticipated type and source of financing;
(j) shall be accompanied by a report on the goods and services required for the mining
operations which can be obtained within Malawi and the applicant’s proposals with respect to
the procurement of those goods and services;
(k) shall give or be accompanied by a statement giving particulars of the applicant’s proposals
with respect to the employment and training of citizens of Malawi;

J2897 Mkango Songwe Hill PFS November 2014 Page: 309
(l) shall be accompanied by a statement giving particulars of expected infrastructure
requirements; and
(m) may set out any other matter which the applicant wishes the Minister to consider
39. Restriction on grant of Mining Licence
(4) Subject to any relevant agreement of a kind referred to in section 10, no mining licence shall be
granted to an applicant unless—
(a) the programme of proposed mining operations—
(i) takes proper account of environmental and safety factors; and
(ii) will ensure the most efficient and beneficial use of the mineral resources concerned;
(b) the area of land over which the licence is sought is not in excess of the area reasonably
required to carry out that programme;
(c) the applicant has adequate financial resources, technical competence and experience to
carry on effective mining operations;
(d) the applicant’s proposals for the employment and training of citizens of Malawi are
adequate;
(e) the applicant’s proposals with respect to the procurement of goods and services obtainable
within Malawi are satisfactory;
(f) any relevant option given pursuant to section 31 has been exercised and given effect to or
satisfactory arrangements have been made for that purpose; and
(g) the applicant is not in default.”
Mines and Minerals Policy
The Malawian Mines and Mineral Policy (2013) has the following objectives:
(i) To promote the development of the mining sector;
(ii) To contribute to socio-economic development of the country including poverty reduction and
sustainable development;
(iii) To contribute to the country’s foreign exchange base;
(iv) To optimise mining activities within Malawi so as to enhance “value added” elements of the
sector and promote linkages with other sectors of the economy;
(v) To expand employment opportunities in Malawi;
(vi) To foster the needed economic diversification;
(vii) To promote artisanal and small scale mining; and
(viii) To promote women in mining

J2897 Mkango Songwe Hill PFS November 2014 Page: 310
Through this Policy, Government seeks to guide and direct mineral resource development by
stressing private sector initiatives and involvement and the need to attract modern technology
and investment capital.
24.1.1.3 Environmental Legislation
With the advent of multiparty democracy in 1994, a new Constitution was promulgated and
provisions on environment generally were provided for. The National Environmental Policy (1996)
provides an overall structure against which relevant sectoral environmental policies can be
reviewed to ensure that the policies are consistent with the principles of sustainable development,
while the Environment Management Act (1996) and the Mines and Minerals Act (1981) contain
sections that specifically deal with the protection and management of the environment. Section
24 of the Environment Management Act outlines the requirements for projects, for which an
Environmental Impact Assessment (EIA) is needed (Ministry of Minerals, 2013).
Although the Mines and Minerals Act predates the environmental legislation, its provisions on
environmental protection do not appear to have generated difficulties in implementing the ESHIA
framework. The Act states that in granting mineral rights the Minister should consider the need to
conserve natural resources in or on the land over which mineral rights are sought. This gives the
Minister the power to integrate environmental conditions in mineral rights, including the
requirement to lodge a security for the performance of rehabilitation of explored or mined areas.
It is in the application of this mandate that licensees for minerals prospecting and exploration
prepare a mitigation and rehabilitation plan for their activities which is included in their license.
Importantly, these requirements respect and do not appear to have given rise to conflicts with the
obligations that arise under an EIA approval. Mining activity, from mine construction to mine
closure are covered by the EIA process. Notwithstanding this, there would be merit in better
harmonizing the provisions of future mining legislation with environmental legislation to remove
any potential conflict or contradiction between them (Land et al, 2009).
Environmental Management Act (1996)
EIA provisions in the Environment Management Act (EMA) are found in sections 24, 25, 26, 27, 29,
63, 69 and 76. An EIA is mandatory under Part V in sections 24 – 26 of the EMA for projects that
will have adverse impacts on the environment. The EMA is the key piece of legislation for EIA as it
establishes an administrative process and key players including the Technical Committee on the
Environment (TCE) which is instrumental in the EIA process. The EMA is the instrument through
which the National Environment Policy is implemented. It is the paramount law on environment to
the extent that in Section 7 it establishes that any legislation that is inconsistent with it is
considered irrelevant to the extent of the inconsistency.
One aim of the EMA is to prevent government departments and authorities operating
independently and provides through the TCE, a coordinated approach to environmental
protection with all relevant government departments playing an active role. The EMA established
a process of environmental assessment and has precedence over other legislation where
approvals may be required or licenses are required under other Acts.

J2897 Mkango Songwe Hill PFS November 2014 Page: 311
The Act further provides for comprehensive management of the environment that ranges from
pollution and how to manage waste and the requirement of permits and licences.
Pollution Control.
Section 42 of the Act prohibits anyone to discharge or emit any pollutant into the environment
except in accordance with this Act.
1. Air Pollution
This falls under section 43 of the Act whereby no person shall discharge effluent or emit any gas
or other gaseous substance into the environment except under a licence issued by the Minister
subject to the conditions as the Minister shall determine.
2. Waste Licence
This is dealt with under section 38 where it is prohibited for anyone to handle, store, transport,
classify or destroy waste save for domestic waste without the license issued under the Act.
Section 38(1) reads as follows:
No person shall handle, store, transport, classify or destroy waste other than domestic waste or
operate a waste disposal site or plan, or generate waste except in accordance with the licence
issued under this section.
3. Hazardous Waste Licence
This is covered under section 39 where a permit is required for any person to import or export
and transport any hazardous waste or substance in Malawi.
Section 39 reads as follows:
“1. Notwithstanding the Control of Goods Act, no person shall import or export any hazardous waste
or substance except under the permit issued by the Minister subject to such conditions as the
Minister may determine, and in case of exportation the exporter shall before a permit is issued
produce to the Minister written confirmation from the appropriate authority or the receiving country
that the hazardous waste or substance may be exported to that country.
2. No person shall transport within Malawi hazardous waste or substance except under a permit
issued by the Minister subject to such conditions as the Minister may impose.”
Environmental Standards
Malawi, like other developing countries in Africa, lags behind in developing its own environmental
quality standards for: air, water, soil, noise, vibrations, radiation, effluent and solid waste.
Meanwhile the Authority can use the powers provided by the Environment Management Act No.
23 of 1996 under Section 43 (1 3) to grant licences, regulate and enforce for the discharge of
pollutants into the environment.
Also, in Part VI, under environmental quality standards, section 30 (1 3) provides:
“(1) The Minister may, on the advice of the council, prescribe environmental quality standards
generally and, in particular, for air, water, soil, noise, vibrations, radiation, effluent and solid waste.
J2897 Mkango Songwe Hill PFS November 2014 Page: 312
(2) The prescription of the environmental quality standards under subsection (1) shall be based on
scientific and environmental principles and shall take into account the practicability and availability
of appropriate technology for ensuring compliance with such standards.
(3) The Minister may prescribe different environmental quality standards to apply in different areas
of Malawi with respect to different segments of the environment and the Minister may, from time to
time, vary such standards.”
Despite the aforementioned, the non-availability of National Standards in Malawi resulted in the
use of stricter WHO guidelines that the World Bank Group and the International Finance
Corporation (IFC) subscribe to, in assessing possible impacts associated with any project.
Guidelines for EIA
The Guidelines for EIA in Malawi were developed with the purpose of facilitating compliance with
Malawi’s EIA requirements by Government, project developers, donors and the general public
(Government of Malawi, 1997). These guidelines help to integrate environmental concerns in
national development. According to section 1.5 of the guidelines, if an EIA is deemed necessary, it
is timed to coincide with Feasibility studies and detailed design when the information it provides
is most useful to the project planners. A prescribed list of projects for which EIA is mandatory in
Malawi has been drawn up and published in the government gazette (Government of Malawi
Gazette Notice No 28 of 1998). The guidelines also have chapters on preparation of EIA reports,
public consultation and evaluation of the adequacy of EIA reports.
The mining of minerals is an activity that requires a full EIA to be compiled.
National Environmental Policy
National Environmental Policy (2004) elaborates the rights and responsibilities of communities in
the management of the environment; states Government’s responsibilities in environmental
planning, impact assessment, audit and monitoring, and outlines primary policy objectives and
strategies in a number of key sectors (Environmental Affairs Department, 2004).
24.1.1.4 Process of EIA in Malawi
Developers of exploration and mining projects have to submit an initial environmental assessment
known as a project brief that may lead to the requirement of an EIA study. An approved EIA study
comprises an environmental management plan which is incorporated into the exploration or
mining license. It is expected that social considerations to benefit local communities would be
incorporated in the EIA study following good corporate social responsibility practices. Because of
limited experience with EIAs for the mineral sector in Malawi, these expectations are mainly based
in the experience of the Kayelekera uranium project which is sponsored by a foreign publicly
listed mining company. The domestic industry has neither the legal obligation nor corporate
practice to employ global standards of good practice (Land et al, 2009).

J2897 Mkango Songwe Hill PFS November 2014 Page: 313
24.1.1.5 Licences and Permits Required
A number of permits and licences will be required for Mkango, most of which will be required
prior to mining taking place. It is important that the process or application for these permits and
licences are initiated as early as possible in order not to delay the project.
The tables (Table 24-1 and Table 24-2) below highlight the main permits required, however this
list will be reviewed and updated, where required, during the Feasibility phase.
Table 24-1
Cross Sector Licences Required for project
Act, Regulation or
Byelaw
Permit or Licence Requirements Implementing
Agency
Water Resources Act
CAP72.03
Water Right Permit is required to use
and/or abstract water, build
dams
Water Resources Board:
Water
Abstraction Control Sub-
committee
Water Resources (Water
Pollution Control)
Regulations
Effluent Discharge
Consent
To control water pollution.
Effluent must conform with
standards set by the Malawi
Bureau of Standards
Pollution Control Sub-
committee
Environment
Management Act, No 23
of 1996, s.42
Air Pollution Licence Licence is required to emit
any gas or other pollutants
into the atmosphere
Environmental Affairs
Department
Environment
Management Act, No 23
of 1996, s.38
Waste Licence A licence is required to
handle, store, transport,
classify or destroy waste
other than domestic waste,
or operate a waste disposal
site
Environmental Affairs
Department
Environment
Management Act, No 23
of 1996, s.39.
Hazardous Waste
Licence
A permit is required to
import or export and
transport any hazardous
waste in Malawi
Environmental Affairs
Department
Table 24-2
Licence Required and Applicable Authority
Category of Licence Authority to Apply to
Mining Licence Ministry of Energy
Air Pollution Licence The Minister of Environmental and Climate Change
Waste Licence The Minister of Environmental and Climate Change

J2897 Mkango Songwe Hill PFS November 2014 Page: 314
Hazardous Waste Licence The Minister of Environmental and Climate Change
Permit to discharge waste or effluent Minister of Environmental and Climate Change
Explosive Import Permit Registrar of Firearms
Storage licence Chief Inspector of Explosives
Dealers license Chief Inspector of Explosives
Permit to possess Chief Inspector of Explosives
Blasting license Chief Inspector of Explosives
24.1.1.6 Other Applicable Malawi Legislation
A number of other Acts, policies and standards will apply to the project. Incorporated in this
section are some of the more important laws and regulations. These will be reviewed and updated
during the Feasibility stage.
Water Resources and Legislation
Upon commencement of the project, out of the many resources that will require protection and
proper permits and licensing is Water Resource. In the process of the project particular elements
of pollution cannot be ruled out. Thus the Water Resources and the Water Polluting Control
Regulations were promulgated to manage such a resource.
Water Resources Act
1. Pollution of Public Water
Section 16 of the Act criminalizes any act that interferes with or alters the flow of or pollutes or
fouls any public water save for where one has the authority under the Act or any other written
law.
Section 16 reads:
“1. Any person who, save under the authority of this Act or any other written law, interferes with or
alters the flow of or pollutes or fouls any public water, shall be guilty of an offence.
2. For purposes of this section the pollution of fouling of public water means the discharge into, or in
the vicinity of public or in a place where public water is likely to flow, of any matter or substance
likely to cause injury whether directly or indirectly to public health, livestock, animal life. Crops,
orchards or gardens which are irrigated by such water or any product in the processing of which
such water is used or which occasion or which is likely to occasion, a nuisance.”
Water Resources (Water Pollution Control) Regulations
Regulation 6 provides as follows:
Any person may apply for the Minister’s consent to discharge any waste or effluent specified in
regulation 4. Regulation 4 reads as follows:

J2897 Mkango Songwe Hill PFS November 2014 Page: 315
1. Except with the prior written consent of the Minister granted in accordance with these
Regulations, no person shall discharge or cause to be discharged into public water;
a. Any water or effluent resulting from;
i. Any sewage treatment works
ii. Any water-borne sanitation system; or
iii. The use of water for any manufacturing, mining or other industrial process
2. The provision of sub regulation (1)
a. shall in respect of the waste or effluent specify in paragraph (a) thereof, apply whether the
discharge of such waste or effluent is by seepage or drainage; and
b. Shall not apply where any waste or effluent specified therein has been accepted into a local
authority sewer.
Heritage and Archaeological Legislation
Malawi legislation is quite clear on heritage safeguarding. Before any land altering development
activity is undertaken, an archaeological impact assessment is mandatory. Section 29 of the
Monuments & Relics Act of 1990 (Cap. 29:01 Laws of Malawi) reads:
“(1) A person in charge of any survey, excavation, exploration, construction or new development
shall, at the earliest stages of planning for such activities, give notice to the Minister to enable,
where necessary, rescue archaeology to be carried out (…)
(2) (…) the cost of such work shall … be borne by the person in charge of any survey, excavation,
exploration, construction or other development.”
A Malawi Heritage Safeguarding Policy which is to give guidance to the implementation and
enforcement of this Act has recently been drafted and awaits formal adoption. As it is, permits
need to be obtained from the Deputy Director of Culture (Antiquities) in Lilongwe for all Cultural
Heritage Impact Assessment activities and subsequent safeguarding work, including rescue
archaeology. The consultant is to be accompanied in his/her work by two Antiquities Officers.
Reports have to be submitted 14 days after conclusion of the work.
International Conventions for Culture and Heritage
ICOMOS, UNESCO’s advisory body on cultural issues, has developed relevant guidelines for
implementation of the Convention with reference to impact assessment (ICOMOS 2011). These
have been adhered to in the study at hand. Malawi is a signatory to the WHC. Malawi is equally a
signatory to the 2003 UNESCO Convention on Intangible Cultural Heritage.
Land Use
The land policy (2000) stipulates that the Government has a duty to protect the free enjoyment of
legally acquired property rights in land. For that reason, a landholder is entitled to compensation
if the owner’s property happens to be acquired by the Government for public use. In most cases
landowners voluntarily allow their land to be used to fulfil the government’s development

J2897 Mkango Songwe Hill PFS November 2014 Page: 316
obligations. However, to be made whole, the amount of compensation paid must be fair and
adequate. It is obvious that people in the project area have to benefit in full from this provision.
Some of the people in the project area enjoy freehold tenure system of land. Land policy explains
that freehold tenure has some unique features that provide security of tenure and exclusive user
rights:
A freeholder has exclusive possession of the land in perpetuity. There are no term limits
placed on the title of the owner.
Subject to land use planning, the owner has the right to subdivide or lease the land, etc.,
without seeking the government’s approval.
No development conditions are imposed on the owner if the land in question lies outside
the boundary of a planning area.
The Government has no legal right to interfere with the occupational right to land.
Land in the project area is mostly customary land with a few pockets under private ownership and
the majority have a landholding size of less than 1 hectare. No land acquisition programmes are
going on in the area. However, the new government policy of co-management of natural
resources between government and the local communities may lead to co-ownership of land and
associated resources.
The core areas are administered under the legal powers of the Local Government Act (1998)
section 22.
The National Physical Development Plan
The National Physical Development Plan was prepared to guide the preservation of the nation’s
agricultural land potential, particularly the best arable lands. The Plan also formulates land use
measures to facilitate agricultural and other sectoral developments. It provides a spatial
framework for the co-ordination of sectoral development projects and balances space
requirements for all competing uses of land. The Land policy further highlights that:
“(a) In conformity with NPDP and support to Malawi’s economic base, rural physical development
planning will ensure the promotion of efficient use of land to meet the demands of the future
population.
(b) To prevent the development of serious land population problems in areas with high population
concentrations, land use plans will be prepared with specific guidelines for each rural district.
(c) To ensure that traditional fishing communities have adequate access to lakeshore areas for
fishing operations, special areas will be reserved on the lakeshore for this purpose. Similarly, land
use plans will contain guidelines for the location of livestock grazing consistent with agricultural
land use.
(d) Villagers will be sensitized during the land use planning process to provide and establish fuel-
wood plantations to meet the demands for wood energy. Fragile areas such as steep slopes,
wetlands and areas susceptible to flooding will be zoned to prevent or minimize the adverse
environmental impact of cultivation and other developments.

J2897 Mkango Songwe Hill PFS November 2014 Page: 317
(e) To prevent the undesirable impact of haphazard urban expansion onto prime agricultural land,
deliberate controls will be applied to discourage urban expansion to such areas.”
Forestry Act
The Forestry Act (9 May, 1997) lists 12 purposes in section 3 of Part I. The relevant ones are:
To identify and manage areas of permanent forest cover as protection or production forest
in order to maintain environmental stability; to prevent resource degradation and to
increase social and economic benefits;
To augment, protect and manage trees and forest on customary land in order to meet basic
fuel wood and forest produce needs of local communities and for conservation of soil and
water;
Control trafficking in wood and other forestry produce including exportation and
importation, and
Protect fragile areas such as steep slopes, river banks, water catchments and to conserve
and enhance biodiversity.
Gender Policy
The Gender Policy seeks to strengthen gender mainstreaming in the natural resources and
environment sector in order to achieve equality and sustainable environmental development.
Consequently it also aims at promoting the increased participation of women in the sound
management, conservation and utilisation of natural resources and the environment, increased
access to and control over natural resources and benefits by women in the sector and to improve
access to and control by women over technology relating to natural resources management. The
desired output of the policy is to achieve sustainable and equitable development. Malawi's natural
resources and environment are being rapidly depleted and degraded due to the combined effects
of rapid population growth, poor land management practices and poverty. Women are hardest hit
by effects of environmental mismanagement because of the gender roles, which they play in
resource utilisation. Strategically, these objectives are to be fulfilled through the facilitation of
women and girls’ participation in population and environment decision making, resource
ownership and management especially during compensation for loss of gardens.
HIV/AIDS Policy
Section 3.2 of the HIV policy (2008) calls for HIV prevention strategies which include the provision
of information and education, condoms, sterile injection equipment, voluntary counselling and
testing (VCT), antiretroviral (ARV) medicines (e.g., to prevent mother-to-child transmission or to
provide post-exposure prophylaxis (PEP)) and, once developed, safe and effective microbicides
and vaccines. The policy is related to the project in that in section 3.2.3.1 emphasises on the use
of condoms for prevention of HIV, unwanted pregnancies and STIs. The project could bring in a
number of temporary workers who will have money and some will have left their families and may
be tempted to engage in sexual activities and will have to use preventive against various illnesses.
People in the impact area, particularly women and adolescent girls, will have to be routinely

J2897 Mkango Songwe Hill PFS November 2014 Page: 318
provided accurate, targeted and relevant information and knowledge regarding the epidemic and
be motivated to adopt and sustain new behaviours within their cultural setting. Routine HIV/AIDS
counselling and testing will be encouraged as an essential tool for tracking and safeguarding
positive behaviour.
Decentralisation Policy
Section 22 of the Decentralisation Policy (1998) lists the functions of the central government that
will be transferred and shall be under the control of district assemblies. Of special interest is that
Zomba district assembly shall assist government to preserve the environment through prevention
of environmental degradation in general.
Environmental and Social Management Guidelines in the Road Sector
The guidelines of 2007 have been produced with an aim of providing guidelines for integrating
environmental issues in the overall road project cycle (planning, design, and implementation). The
National Roads Authority (NRA) was established through an Act of Parliament No. 13 of 16th May,
1997 whose vision is to have the Malawi public road network developed and maintained up to a
standard where all motorized and non-motorized traffic can reach every society of the country in
adequate, safe, reliable, efficient, economic and environmentally friendly manner at all times of
the year. The guidelines contain 8 checklists which must be used during road projects.
Occupational Safety, Health and Welfare Act
This Act No. 21 of 1997, entry into force 29 August 1997, repeals the Factories Act. This Act
provides for occupational safety and health, responsibilities of employers, welfare facilities and
workplaces. It also has provisions for accident investigation, dangerous substances, explosion
protection, fire protection, first-aid organization, housekeeping, information of personnel, labour
inspectors, law, lifting of loads, lighting, machinery guarding regulations, medical examinations,
noise and vibration control, notification of accidents and diseases, penalties, protective clothing,
radiation protection, ventilation. Appropriate protective wear would be needed.
Malawi Bureau of Standards
The Malawi Bureau of Standards (MBS) is responsible for checking that standards are adhered to
by all sectors. Several standards have been developed and of relevance to this project are MS 539:
Industrial effluents – Tolerance limits for discharge into inland surface waters, MS 214: Drinking
water – specification, MS 733: Borehole and shallow well quality – specification, MS 676: Water
quality – chemical methods of test, MS677: Water quality – Microbiological methods, MS 676:
Water quality – chemical methods of test, MS 677: Water quality – Microbiological methods, MS
678: Drinking water quality – Control and surveillance of water in public supply networks.
Areas of Conservation Status
The Lake Chilwa wetland, located north of the project, is an internationally recognised area under
the Ramsar Convention which is an international accord. Through this Convention the
government of Malawi has delegated the responsibility of management of Ramsar sites in Malawi
to the National Parks and Wildlife Department under the National Parks & Wildlife Act (1992)(GN.

J2897 Mkango Songwe Hill PFS November 2014 Page: 319
NO 89 OF 30/3/94). There is supposed to be a Lake Chilwa Basin Authority to which management
responsibilities will be delegated from the Department of Parks and Wildlife but this is not yet in
place. The wetland falls under the recently formulated Lake Chilwa wetland management plan.
There is no legal protection for the area where the mine will be located. However, these are
managed by several groups. The National Wetlands Committees oversees the activities of Lake
Chilwa as a Ramsar site. The Bird Hunters Association (BHA) has established hot spots for
breeding of birds around Lake Chilwa and these areas are protected by the communities around
those spots.
24.1.2 IFC and Equator Principles
In terms of compliance of the project with World Bank criteria and making an evaluation of the
project against International Finance Corporation (IFC) standards, it is pertinent to note that there
is still no comprehensive Mineral Legislation in Malawi that would by itself satisfy the
requirements of the World Bank and the IFC. This can be discerned from the various laws and
policies that are applicable. Mkango and the project consultants will therefore have to ensure that
the project complies with both the Malawi legislation, and the latest IFC guidelines.
One of the subtle differences between the host country and IFC requirements is the actual
document produced. In Malawi an EIA is compiled, and for IFC an Environmental and Social
Impact Assessment (ESIA) is compiled (in projects where health is a major issue, the term
Environment, Social and Health Impact Assessment (ESHIA) could also be used). The IFC places
emphasis on the incorporation of social and health issues into the project, hence the slight
change in the term used. Essentially the documents are very similar; however, the ESIA tends to
include more detail and is a more rigorous process to follow.
24.1.2.1 Equator Principles
The Equator Principles are a set of voluntary guidelines which a number of financial institutions
(EPFIs) have adopted with the intention of creating an industry standard for assessing and
managing environmental and social issues in the project finance sector.
The Equator Principles are based on the policies and guidelines of the IFC which is the private
sector development arm of the World Bank. The project ESHIA must therefore comply with the
following requirements:
applicable IFC environmental, social and disclosure policies;
IFC Safeguard Policies for environmental and social issues;
sectoral guidelines (environmental, health and safety guidelines specific to particular
industries, sectors, or types of projects;
General Environmental, Health and Safety Guidelines); and
host country laws, regulations and permits required by the project.
The requirements as set out in the policies and guidelines listed above are discussed in more
detail in the body of this report. First, the main requirements applicable to the project as
contained in principles 1 to 10 of the Equator Principles are discussed below.
J2897 Mkango Songwe Hill PFS November 2014 Page: 320
Principle 1: Review and Categorization
When a project is proposed for financing, the relevant EPFI will, as part of its internal social and
environmental review and due diligence, categorise such project based on the magnitude of its
potential impacts and risks in accordance with the environmental and social screening criteria of
the IFC (Exhibit I).
Proposed projects may be categorised as one of the following:
Category A: Projects with potential significant adverse social or environmental impacts that
is diverse, irreversible or unprecedented;
Category B: Projects with potential limited adverse social or environmental impacts that are
few in number, generally site-specific, largely reversible and readily addressed through
mitigation measures; and
Category C: Projects with minimal or no social or environmental impacts.
The Project falls within a Category A project and all commitments relevant to Category A projects
as set out in principles 2 throughout 10 must be complied with. The category of the project may
be downgraded once more detail on the project is confirmed.
Principle 2: Social and Environmental Assessment
An ESIA process must be completed to address the relevant social and environmental impacts and
risks of the project. The ESIA will include all relevant issues included in Exhibit II of the Equator
Principles. The ESIA will also propose mitigation and management measures relevant and
appropriate to the nature and scale of the proposed project.
Principle 3: Applicable Social and Environmental Standards
The ESIA will make reference to and comply with the applicable IFC Performance Standards and
the applicable Industry Specific Environmental Health and Safety Guidelines (EHS Guidelines). The
relevant IFC Performance Standards and Guidelines are dealt with in more detail below.
The ESIA will establish the project's overall compliance with, or justified deviation from, the
respective Performance Standards and EHS Guidelines.
The ESIA will address compliance with relevant host country laws, regulations and permits that are
applicable to social and environmental aspects of the project.
Principle 4: Action Plan and Management System
Outcomes of the ESIA will be the development of Management Plans and an Action Plan (AP)
which addresses the relevant findings, and draws on the conclusions of the Assessment. The AP
will describe and prioritise the actions needed to implement mitigation measures, corrective
actions and monitoring measures necessary to manage the impacts and risks identified in the
Assessment.
Mkango will be required to establish a Social and Environmental Management System (SEMS) that
addresses the management of these impacts, risks, and corrective actions required to comply with

J2897 Mkango Songwe Hill PFS November 2014 Page: 321
applicable host country social and environmental laws and regulations, and requirements of the
applicable Performance Standards and EHS Guidelines, as defined in the AP.
Principle 5: Consultation and Disclosure
Consultations with communities affected by a project should be undertaken by the government,
the developer or third party expert in a structured and culturally appropriate manner. The public
participation process will ensure that project affected communities are provided free, prior and
informed consultation and will facilitate their informed participation as a means to establish, to
the satisfaction of the EPFI, whether a project has adequately incorporated affected communities’
concerns.
In order to accomplish this, the ESIA documentation and AP, or non-technical summaries thereof,
will be made available to the public by Mkango for a reasonable minimum period in the relevant
local language and in a culturally appropriate manner. The results of the public participation
process will be documented; including any actions agreed resulting from the consultations.
Disclosure will occur early in the ESIA process, before the project construction commences, and
on an on-going basis.
Principle 6: Grievance Mechanism
To ensure that consultation, disclosure and community engagement continues throughout
construction and operation of the project, Mkango must establish a grievance mechanism as part
of the Social and Environmental Management System (SEMS) which will be scaled to the risks and
adverse impacts of the project. This will allow Mkango to receive and facilitate resolution of
concerns and grievances about the project’s social and environmental performance raised by
individuals or groups from among project-affected communities.
Mkango must inform the affected communities about the mechanism in the course of its
community engagement process and ensure that the mechanism addresses concerns promptly
and transparently, in a culturally appropriate manner, and is readily accessible to all segments of
the affected communities.
Principle 7: Independent Review
The ESIA, AP and consultation process documentation will be reviewed by an independent social
or environmental expert not directly associated with project, in order to assist EPFIs due diligence,
and assess Mkango’s compliance with the Equator Principles.
Principle 8: Covenants
The following covenants will be included in the financing documentation:
to comply with all relevant host country social and environmental laws, regulations and
permits in all material respects;
to comply with the AP (where applicable) during the construction and operation of the
project in all material respects;

J2897 Mkango Songwe Hill PFS November 2014 Page: 322
to provide periodic reports in a format agreed with EPFIs (with the frequency of these
reports proportionate to the severity of impacts, or as required by law, but not less than
annually), prepared by in-house staff or third party experts, that documents compliance
with the AP (where applicable);
to provide representation of compliance with relevant local, state and host country social
and environmental laws, regulations and permits; and
to decommission the facilities, where applicable and appropriate, in accordance with an
agreed decommissioning plan.
Where a borrower is not in compliance with its social and environmental covenants, EPFIs will
work with the borrower to bring it back into compliance to the extent feasible, and if the borrower
fails to re-establish compliance within an agreed grace period, EPFIs reserve the right to exercise
remedies, as they consider appropriate.
Principle 9: Independent Monitoring and Reporting
To ensure on-going monitoring and reporting over the life of the loan, EPFIs will require the
appointment of an independent environmental and/or social expert, or require that the borrower
retain qualified and experienced external experts to verify its monitoring information which would
be shared with EPFIs.
Principle 10: EPFI Reporting
Each EPFI commits to report publicly at least annually about its Equator Principles implementation
processes and experience, taking into account appropriate confidentiality considerations.
As mentioned above under Principle 3 the EP requires that the ESIA makes reference to and
complies with the applicable IFC Performance Standards and the applicable Industry Specific EHS
Guidelines.
24.1.2.2 IFC Performance Standards
The IFC has launched a new set of business standards for managing environmental and social
risks for project finance, which came into effect on 1st January 2012. The IFC Performance
Standards comprise a collection of eight quality standards which Mkango will be required to meet
throughout the life of an investment by the EPFI. The performance standards should be read in
conjunction with their guidance notes.
The relevant IFC Performance Standards are summarised based on information from the IFC
website.
Performance Standard 1: Social and Environmental Assessment and Management System
Performance Standard 1 underscores the importance of managing environmental and social
performance throughout the life of a project. An effective Environmental and Social Management
System (ESMS) is a dynamic and continuous process initiated and supported by management, and
involves engagement between the client, its workers, local communities directly affected by the
project (the Affected Communities) and, where appropriate, other stakeholders. Drawing on the

J2897 Mkango Songwe Hill PFS November 2014 Page: 323
elements of the established business management process of “plan, do, check, and act,” the ESMS
entails a methodological approach to managing environmental and social risks and impacts in a
structured way on an on-going basis. A good ESMS appropriate to the nature and scale of the
project promotes sound and sustainable environmental and social performance, and can lead to
improved financial, social, and environmental outcomes.
Performance Standard 2: Labour and Working Conditions
Performance Standard 2 recognizes that the pursuit of economic growth through employment
creation and income generation should be accompanied by protection of the fundamental1 rights
of workers. For any business, the workforce is a valuable asset, and a sound worker-management
relationship is a key ingredient in the sustainability of a company. Failure to establish and foster a
sound worker-management relationship can undermine worker commitment and retention, and
can jeopardize a project. Conversely, through a constructive worker-management relationship,
and by treating the workers fairly and providing them with safe and healthy working conditions,
clients may create tangible benefits, such as enhancement of the efficiency and productivity of
their operations.
Performance Standard 3: Pollution Prevention and Abatement
Performance Standard 3 recognizes that increased economic activity and urbanization often
generate increased levels of pollution to air, water, and land, and consume finite resources in a
manner that may threaten people and the environment at the local, regional, and global levels.
There is also a growing global consensus that the current and projected atmospheric
concentration of greenhouse gases (GHG) threatens the public health and welfare of current and
future generations. At the same time, more efficient and effective resource use and pollution
prevention and GHG emission avoidance and mitigation technologies and practices have become
more accessible and achievable in virtually all parts of the world. These are often implemented
through continuous improvement methodologies similar to those used to enhance quality or
productivity, which are generally well known to most industrial, agricultural, and service sector
companies.
Performance Standard 4: Community Health, Safety and Security
Performance Standard 4 recognizes that project activities, equipment, and infrastructure can
increase community exposure to risks and impacts. In addition, communities that are already
subjected to impacts from climate change may also experience an acceleration and/or
intensification of impacts due to project activities. While acknowledging the public authorities’
role in promoting the health, safety, and security of the public, this Performance Standard
addresses the client’s responsibility to avoid or minimize the risks and impacts to community
health, safety, and security that may arise from project related-activities, with particular attention
to vulnerable groups.
Performance Standard 5: Land Acquisition and Involuntary Resettlement
Performance Standard 5 recognizes that project-related land acquisition and restrictions on land
use can have adverse impacts on communities and persons that use this land. Involuntary

J2897 Mkango Songwe Hill PFS November 2014 Page: 324
resettlement refers both to physical displacement (relocation or loss of shelter) and to economic
displacement (loss of assets or access to assets that leads to loss of income sources or other
means of livelihood) as a result of project-related land acquisition and/or restrictions on land use.
Resettlement is considered involuntary when affected persons or communities do not have the
right to refuse land acquisition or restrictions on land use that result in physical or economic
displacement. This occurs in cases of (i) lawful expropriation or temporary or permanent
restrictions on land use and (ii) negotiated settlements in which the buyer can resort to
expropriation or impose legal restrictions on land use if negotiations with the seller fail.
Performance Standard 6: Biodiversity Conservation and Sustainable Natural Resource
Management
Performance Standard 6 recognizes that protecting and conserving biodiversity, maintaining
ecosystem services, and sustainably managing living natural resources are fundamental to
sustainable development. The requirements set out in this Performance Standard have been
guided by the Convention on Biological Diversity, which defines biodiversity as “the variability
among living organisms from all sources including, inter alia, terrestrial, marine and other aquatic
ecosystems and the ecological complexes of which they are a part; this includes diversity within
species, between species, and of ecosystems.”
Performance Standard 7: Indigenous Peoples
Performance Standard 7 recognizes that Indigenous Peoples, as social groups with identities that
are distinct from mainstream groups in national societies, are often among the most marginalized
and vulnerable segments of the population. In many cases, their economic, social, and legal status
limits their capacity to defend their rights to, and interests in, lands and natural and cultural
resources, and may restrict their ability to participate in and benefit from development.
Indigenous Peoples are particularly vulnerable if their lands and resources are transformed,
encroached upon, or significantly degraded. Their languages, cultures, religions, spiritual beliefs,
and institutions may also come under threat. As a consequence, Indigenous Peoples may be more
vulnerable to the adverse impacts associated with project development than non-indigenous
communities. This vulnerability may include loss of identity, culture, and natural resource-based
livelihoods, as well as exposure to impoverishment and diseases.
Performance Standard 8: Cultural Heritage
Performance Standard 8 recognizes the importance of cultural heritage for current and future
generations. Consistent with the Convention Concerning the Protection of the World Cultural and
Natural Heritage, this Performance Standard aims to ensure that clients protect cultural heritage
in the course of their project activities. In addition, the requirements of this Performance Standard
on a project’s use of cultural heritage are based in part on standards set by the Convention on
Biological Diversity.
24.1.2.3 IFC Environmental Guidelines
The following IFC Guidelines are specifically relevant to the project (numbered as in the
Guidelines).

J2897 Mkango Songwe Hill PFS November 2014 Page: 325
1.1 Environmental
1.2 Air Emissions and Ambient Air Quality
1.3 Energy Conservation
1.4 Wastewater and Ambient Water Quality
1.5 Water Conservation
1.6 Hazardous Materials Management
1.7 Waste Management
1.8 Noise
24.1.2.4 IFC Community Health and Safety Guidelines
The following IFC Guidelines are specifically relevant to the project (numbered as in the
Guidelines).
3.1 Water Quality and Availability
3.2 Structural Safety of Project Infrastructure
3.3 Life and Fire Safety
3.4 Traffic Safety
3.5 Transport of Hazardous Materials
3.6 Disease Prevention
3.7 Emergency Preparedness and Response
24.1.2.5 IFC Construction and Decommissioning Guidelines
The following IFC Guidelines are specifically relevant to the project (numbered as in the
Guidelines).
4.1 Environment
4.2 Occupational Health and Safety
4.3 Community Health and Safety

J2897 Mkango Songwe Hill PFS November 2014 Page: 326
25 INTERPRETATION AND CONCLUSIONS
The discounted cash flow model that has been developed, based on
the Indicated Mineral Resource,
the capital expenditure and operating cost estimates developed as part of this PFS, and
rare earth oxide prices equivalent to a total rare earth basket price for the Project of
US$ 55.0 per kg REO (this basket price reflects the selective removal of a large proportion
of the cerium during the hydrometallurgical process, which enhances the value of the
product mix),
indicates that the Project is economically viable under the assumptions made in the PFS.
The PFS has indicated that the Songwe Hill Project has a US$293 million after-tax net present
value, using a 10% nominal discount rate, and a 36% after-tax internal rate of return.
25.1 Mining
This work has shown that the Songwe Hill Rare Earths Project can be developed into a viable
mining operation. The mine will be a conventional open pit mine with the rock being drilled and
blasted, loaded by diesel powered excavator and hauled from the pit to the plant site by rigid
bodied dump trucks. The mine has a life of 18 years at the planned production rate of 500,000
tonnes per annum of ore. The open pit will have a strip ratio of 4.5 tonnes of waste to 1 tonne of
ore and will reach a final depth of 300m, measured from the pit bottom to the highest point on
the pit rim.
The mining operating cost is estimated to be US$ 23.45 per tonne milled.
The mining plan is based on the current Mineral Resource estimate which includes only Indicated
and Inferred Mineral Resources. The Inferred Mineral Resources, although included in the pit shell,
were treated as waste material and therefore were excluded from the ore production schedule
and financial model. There is considerable upside potential, both in mine life and in reduction in
operating costs, to be gained from increasing the Mineral Resource confidence to re-categorise
all or part of these Inferred Mineral Resources into either Indicated and/or Measured Mineral
Resources. If the size of the orebody, within the pit shell can be increased it will allow the mining
rate to be reduced while maintaining the same ore production schedule, thereby decreasing
operating costs and increasing mine life.
There are no Measured Mineral Resources in the current Mineral Resource statement and
therefore confidence in the entire mining plan is commensurate with the level of confidence in
Indicated Mineral Resources only.
There was limited core available for geotechnical logging and analysis. In order to mitigate
against the risk of misinterpretation of the geotechnical parameters and possible inaccuracy in the
geotechnical design as a result of low data volume, the pit design was tested against a range of
slope angles to test the sensitivity of the Project to variations in slope design. The mine design
was found to be tolerant of variation of the slope angle due to the low strip ratio, without the
viability of the Project being compromised.

J2897 Mkango Songwe Hill PFS November 2014 Page: 327
25.2 Process Design
The process flow sheet consists of the beneficiation plant and the recovery plant.
The beneficiation plant comprises of the comminution and flotation circuits. The purpose of the
comminution circuit is to reduce the size of solid ore particles and thus increase the surface area
of solids to enable the liberation of valuable materials that are locked within the gangue minerals.
This is achieved by means of crushing and milling. Flotation is used to upgrade the mineralized
material. Flotation is a method of separation, which uses the differing surface properties of the
various minerals in the ore. It involves the selective attachment of mineral particles to air bubbles
generated in the flotation cell which float to the surface of the slurry and then flow over the lip of
the cells into the launders. A selective flotation reagent regime is used to separate rare earths
oxide minerals from gangue minerals.
The recovery process flow sheet comprises a two stage selective hydrochloric acid leach process.
The hydrochloric acid is recycled via calcium sulphate precipitation with sulphuric acid. The
process flow sheet also includes caustic conversion, rare earth dissolution, purification, cerium
rejection and rare earth hydroxide precipitation. This approach offers advantages including a
significant reduction in acid costs as well as a further concentration of the rare earths thus
providing a reduction in downstream capital and operating costs.
The current process design includes the use of sodium hydroxide (NaOH) for the raw rare earths
precipitation. The use of lime (Ca(OH)2) instead of sodium hydroxide (NaOH) for raw rare earth
precipitation should be investigated because lime is far cheaper than sodium hydroxide and the
use of lime will also reduce the calcium chloride (CaCl2) requirements.
The total estimated capital expenditure for the process plant section of the Songwe Hill Project is
US$ 171 million;
The total estimated operating expenditure for the process plant section of the Songwe Hill Project
is estimated to be US$ 64.88 per tonne milled.
25.3 Tailings Storage Facility
The following is deduced from the work conducted during the PFS:
an cost estimate of the TSF has been undertaken to determine:
o capital costs to an accuracy of ±25 percent; and
o operating costs to an accuracy of ±25 percent.
the preferred site for the establishment of the TSF has been designed to accommodate a
volumetric storage capacity of 11 million dry tonnes over a 22 year LoM and comprises the
following:
o a HDPE lined TSF;
o a HDPE lined RWD/SWD system; and
o associated infrastructure (i.e. slurry delivery infrastructure, storm water diversion
trenches, etc.);

J2897 Mkango Songwe Hill PFS November 2014 Page: 328
there is uncertainty regarding the geochemical and geotechnical nature of the tailings,
which shall be clarified in the subsequent phases of the Project. For the purposes of the PFS
design it is assumed that the worst case scenario shall be mitigated by the installation of a
HDPE liner to the facility;
the initial capital cost is estimated at US$ 13.29 million and comprises:
o construction of the TSF US$ 12.65 million;
o engineering Definitive Feasibility Study at US$ 160,000;
o engineering detailed design at US$ 180,000; and
o engineering construction supervision at US$ 300,000;
the total operational cost associated with the TSF is estimated at US$ 0.59m/year and
comprises:
o US$ 1/tonne of tailing deposition management (500 ktpa amounts to
US$ 0.5 million per annum);
o US$ 45,700/annum for pipe and valve replacements; and
o quarterly inspections and annual reviews of the facility, US$ 40,000/annum.
25.4 Environmental
A significant amount of environmental and social baseline studies have already been undertaken
to date and the project team already has a good understanding of the current environmental
baseline. Ongoing dust monitoring and the installation of a weather station are providing data
which will feed into the ESHIA. There is a good understanding of the environmental risks as well
as the current legislative environment.
A SEP is proposed which will form the backbone to engagement with affected stakeholders.
At this stage there is no environmental or social reason not to continue with the Project into
feasibility phase. There are, however, a number of recommendations that should be followed in
order to undertake the Project in a manner that is socially acceptable and results in a process
acceptable to the developer, authorities and relevant stakeholders.
Complying with IFC guidelines and policies is a major benefit to the Project as it ensures that the
process is undertaken in a globally acceptable manner. Furthermore the benefits for the local
community, industry and country as a whole need to be emphasised to indicate that the Project is
committed to ensuring it leaves a positive legacy.

J2897 Mkango Songwe Hill PFS November 2014 Page: 329
26 RECOMMENDATIONS
Based on the outcomes of the PFS, it is recommended that consideration be given by Mkango to
continue with an additional, more advanced technical and economic study at the Definitive
Feasibility Study level, so as to increase the level of confidence in the viability of the Project.
26.1 Drilling programme
A drilling programme would be undertaken to provide additional information as follows:
improvement in confidence of the Mineral Resource;
upgrading of the Inferred Mineral Resources within the potential pit outline to at least
Indicated Mineral Resources; and
upgrading a significant part of the Indicated Mineral Resources to Measured Mineral
Resources, so as to increase confidence in the overall viability of the Project; and
additional, suitably orientated borehole cores to provide
o additional geotechnical information and
o samples of both the ore and waste for rock strength tests, so that
the geotechnical designs would then be updated with this additional information, which
will in-turn inform a new and revised open pit design.
26.2 Mining
The additional information gained for the drilling programme outlined above would
facilitate the development of an updated mining plan. This updated plan would then be
used to develop a “bill of quantities” so as to obtain firm quotations from a number of
mining contractors This will increase confidence in the mining operating costs to well within
the required confidence levels for a Definitive Feasibility Study.
26.3 Mineral Processing and Metallurgical Testwork
26.3.1 Flotation
Flotation has played a significant role in reducing downstream costs by rejecting acid consuming
gangue minerals such as calcite. The resultant concentrate still contains significant proportions of
calcite as well as the iron carbonate, ankerite. It is recommended that priority be given to
implementing a program focusing on increasing recovery, reducing mass pull and improving the
concentrate grade.
26.3.2 Cerium Rejection
Cerium is rejected during the process, however a recycle stage is required to ensure minimal
losses of the desired other rare earths. Literature reviews suggest that the separation can be
improved through better purification of the solution prior to cerium rejection. Mixed rare earth

J2897 Mkango Songwe Hill PFS November 2014 Page: 330
hydroxide precipitation and oxidation are also reported to be critical steps where cerium rejection
can be compromised and these need to be optimised further.
26.3.3 Fluorine Deportment
Fluorine is suspected of causing rare earth losses during leaching and precipitation redissolution
due to the formation of refractory rare earth fluorides. Analysis of solids and leach residues during
the testwork program added some weight to this theory. Fluorine analysis is costly and requires
special equipment that is not carried by all analytical facilities, however. Nevertheless, it is
recommended in future programs that fluorine is tracked through the process to quantify the
degree it plays in rare earth losses through the flowsheet.
26.3.4 Radionuclide Deportment
Although the “head of chain” radioactive elements thorium and uranium were tracked through
the testwork program, there were insufficient quantities of intermediate and final products
available to send to specialised facilities for a full radionuclide deportment analysis. This is
particularly through the hydrometallurgical process where the “decay chain daughters” can be
separated and concentrated due to their variable chemical properties. It is recommended that
radionuclide deportment be undertaken during the next test program.
26.3.5 Lanthanum Removal
At the time of writing, lanthanum prices were continuing to fall in a similar trend to cerium.
Lanthanum can be partially rejected via precipitation or more effectively via solvent extraction
techniques if desired. It is recommended that the options of lanthanum rejection be evaluated
during future testwork programs.
26.3.6 Rare Earth Separation
Rare earth separation to high purity products (99.9 % or better REO) should be evaluated. It is
recommended that this work be done subsequent to operation of a hydrometallurgical pilot plant
where sufficient quantities of feed will be produced.
26.3.7 Piloting
Moving into Definitive Feasibility and Detailed Design phases, piloting of the beneficiation and
hydrometallurgical flowsheets is essential once the processes have been optimised. Consideration
should be given to:
Required outcomes of the pilot plants
Pilot plant host facilities – equipment, staff, expertise and analysis capabilities
Pilot plant location - accessibility to equipment vendors, engineering companies etc
Sample size – size of equipment available and length of time of operation
It is recommended that the engineers chosen for the detailed design of the commercial plant be
involved with the design and operation of the pilot plant.
J2897 Mkango Songwe Hill PFS November 2014 Page: 331
As mentioned previously, the pilot plant should also deliver a product of appropriate quantity and
quality for separation test work.
26.4 Recovery Methods
A large amount of reagents will be consumed during normal operation. Furthermore, more types
of reagents will be needed for the rare earth project than a typical mining project. There may be
some supply chain and logistical issues as a consequence and securing reliable reagent suppliers
or distributors is recommended.
Reagent prices vary significantly according to source of supply, market fluctuations, and amount
required. Since reagent cost contributes to more than 70 % of the estimated total Opex, it will be
necessary to investigate opportunities to negotiate prices in order to optimise operating costs.
The process design is quite complex and it is critical to the success of the Project so additional
optimisation testwork is recommended. A pilot scale testwork campaign is essential to prove and
optimise the process design.
26.5 Tailings
Based on the design and supporting information available at the time of the TSF design, it is
recommended that subsequent design work focuses on the following:
detailed characterisation of the proposed tailings material(s) with specific emphasis on:
o determining the geochemical characteristics and pollution potential of the tailings
materials; and
o confirmation of the geotechnical characteristics of the tailings based on laboratory
testing of representative samples, focussing on determining its strength, settling and
consolidation characteristics;
a hydrological study for the Mkango Project so that more applicable storm event data is
used in the design of the TSF other infrastructure;
a geotechnical investigation of the TSF site in order to confirm the type, extent and
characteristics of the in situ materials as well as available construction materials;
an assessment of the need for additional contamination control measures such as liners,
dewatering and/or contaminated water treatment;
optimisation of the costs associated with the construction, operation and closure of the
TSF, namely:
o the earthworks associated with the construction of the facility which has the potential
to be more economical if the waste rock obtained from the open pit is used and not
borrowed from the basin of the TSF, RWD and SWD;
o possible further optimisation of the TSF preparatory works in terms of layout,
footprint extent, etc.; and

J2897 Mkango Songwe Hill PFS November 2014 Page: 332
compilation of a more detailed schedule of quantities describing the proposed preparatory
works and the pricing of the schedules to a greater level of accuracy.
26.6 Environmental
Detailed Specialist studies will need to be undertaken for the ESHIA, which need to be compliant
with both the Malawian legislation and IFC requirements.
26.6.1 Management of impacts and issues
The Project is at a phase where high impacts and risks that can be assessed and where necessary,
the Project can be adjusted or re-structured to avoid or reduce the impact.
26.6.2 Risks and recommendations
The following risks and recommendations for work to be undertaken in the Definitive
Feasibility Study have been identified:reputational risk recommendation:
o prepare as much project information as possible and disseminate it to the
Government, TA’s, GVH’s and communities;
institutional constraint recommendation:
o provide regular feedback and results of monitoring to authorities;
dealing with contaminants recommendation:
o due to its location on a hillside, the Project will have to ensure that the containment
facilities are highly engineered and compliant with the relevant regulations.
Management Plans which deal with potential spillages and containment issues will
be developed as part of the ESHIA;
o water control measures will need to be well designed, constructed and managed
including berms, trenches, dams and security measures;
water provision recommendation:
o the use of groundwater as a potential water supply source needs to be further
investigated;
resettlement recommendation:
o the process and framework for resettlement should be discussed between Mkango
and social consultants in order to establish possible options for alternative land and
resources and a Resettlement Action Plan proposed;
radiological concerns recommendation:
o there will be a need to investigate further the regulatory control with regards to
radiation;
perceptions and expectations recommendation:
o develop programmes for clearly explaining:

J2897 Mkango Songwe Hill PFS November 2014 Page: 333
o the Project to the communities,
o the Project implementation processes; and
o the ESHIA processes
in a way that will dispel most of the misconceptions and fears they have about the
Project;
o by undertaking a thorough Stakeholder Engagement Process, many of the
unanswered questions, fears and perceptions can be clarified and it will open up the
channels of communication;
o develop a Grievance Mechanism as early as possible so that any grievances lodged
are dealt with adequately; and
Community and Civil Society Organisations (CSO) Recommendation:
o best practices will need to be employed.
26.7 Proposed Budget for the Definitive Feasibility Study
A provisional, indicative budget has been prepared for the currently envisaged scope for the
preparation and completion of a Definitive Feasibility Study for the Project, based on the work
streams identified above (Table 26-1). It represents the minimum anticipated costs required to
complete the Feasibility Study, and may change as the work streams and associated costs are
refined in preparation for the execution of the Definitive Feasibility Study.
Table 26-1
Estimated techncial costs – Definitive Feasibility Study
Description Amount (US$)
Mining and other studies 550,000
Processing plant and infrastructure 1,050,000
Metallurgical optimisation and pilot testwork 1,250,000
Geotechnical and resource drilling 1,000,000
Environmental, social, health impact assessment 800,000
Contingency 465,000
Total 5,115,000

J2897 Mkango Songwe Hill PFS November 2014 Page: 334
27 REFERENCES
BBC, 2011: Weather Lilongwe. Available at: http://www.bbc.co.uk/weather/927967. [Accessed 22
October 2012]
BingTM, 2012: Harris Corp, Earthstar Geographics LLC © Microsoft Corporation;
http://www.bing.com/maps
Chakhmouradian, A. and Zaitsev, A.N., 2012: Rare earth mineralization in igneous rocks: sources
and processes. Elements, 8, 347-353.
Chao, E.C.T., Back, J.M., Minkin, J.A., and Yinchen, R., 1992: Host-rock controlled eipgenetic
hydrothermal metasomatic origin of the Bayan Obo REE-Fe-Nb ore deposit, Inner Mongolia. P.R.C.
Applied Geochemistry, 7, 443-458.
CITES. “Convention on International Trade in Endangered Species of Wild Fauna and Flora ” 2013.
http://www.cites.org/eng/resources/pub/checklist11/Appendices.pdf.
De Graaff, G., 1981.The Rodents of Southern Africa. Durban: Butterworths.
Dixey, F., Campell Smith, W. and Bissett , C.B., 1937: (revised edition 1955). The Chilwa Series of
southern Nyasaland. Bulletin, Geological Survey Department, Nyasaland, 5, 1-71.
Doroshkevich, A.G., Viladkar, S., Ripp, G.S., Burtseva, M.V., 2009: Hydrothermal REE Mineralization
in the Amba Dongar Carbonatite Complex, Gujarat, India. Canadian Mineralogist, 47, 1105-1116.
Eby, G.N., Roden-Tice, M., Krueger, H.L., Ewing, W., Faxon, E.H., and Woolley, A.R., 1995:
Geochronology and cooling history of the northern part of the Chilwa Alkaline Province, Malawi.
Journal of African Earth Sciences, 20, 257-288.
Environmental Affairs Department, 2002. Environmental and Natural Resources Management
Policies, Laws and Institutional Framework in Malawi, Volume 1: A Resource Book for District Level
Managers. Ministry of Mines, Natural Resources and Environment, Government of Malawi. ISBN
Number: 99908-26-23-4
FAO, 1996. Malawi: Country report to the FAO International Technical Conference on Plant
Genetic Resource
Garson, M.S., 1962: The Tundulu carbonatite ring-complex in southern Nyasaland. Memoir,
Geological Survey Department, Nyasaland, 2, 1-248.
Garson, M.S., 1965: Carbonatites in southern Malawi. Bulletin of the Geological Survey of Malawi,
15, 1-128.
Garson, M.S., 1966: Carbonatites in Malawi. In: Tuttle, O.F. and Gittins, J. (Eds.), Carbonatites. John
Wiley, New York, 33-71
Garson, M.S. and Walshaw, R.D., 1969: The geology of the Melanje area. Bulletin of the Geological
Survey of Malawi, 21, 1-157.
Geology.com, 2014. REE – Rare Earth Elements and their Uses. Accessed September 2014 on
http://geology.com/articles/rare-earth-elements/.

J2897 Mkango Songwe Hill PFS November 2014 Page: 335
Giere, R., 1996: Formation of rare earth minerals in hydrothermal systems. In Rare Earth Minerals:
Chemistrym Origin and Ore Deposits. In Jones, A.P.,Wall, F., and Williams, C.T., (Eds.). Rare Earth
Minerals: Chemistry Origin and Ore Deposits. Chapman and Hall. 105-150.
Hatch, G., 2014. The Second Round of Chinese Rare-Earth Export-Quota Allocations for 2014, 19
July 2014. Accessed September 2014 on http://www.techmetalsresearch.com/2014/07/the-
second-round-of-chinese-rare-earth-export-quota-allocations-for-2014/.
Hickman, C.P., Keen, S., Larson, A., and Eisenhour, D. (2011). Integrated Principles of Zoology, 15th
ed. New York: McGraw-Hil Companies, Inc., 121 Avenue of the Americas, New York, NY 10020. 928
pp.
Hornig-Kjarsgaard, I., 1998: Rare earth elements in sovitic carbonatites and their mineral phases.
Journal of Petrology, 39, 2105-2121.
Hunting Geology and Geophysics Limited, 1985: Airborne Geophysical Survey: Government of
Malawi: Report on Field Operations and Processing; Hunting Geology and Geophysics Limited,
1985.
Hyde, M.A., Wursten, B.T. and Ballings, P., 2013. Flora of Zimbabwe: Species information: Afzelia
quanzensis. Accessed June 2013 on
http://www.zimbabweflora.co.zw/speciesdata/species.php?species_id=126760.
Hyde, M.A., Wursten, B.T. and Ballings, P., 2013. Flora of Zimbabwe: Genus page: Brachystegia.
http://www.zimbabweflora.co.zw/speciesdata/genus.php?genus_id=682, retrieved 27 June 2013.
IFC, 2007. Stakeholder Engagement: A Good Practice. Handbook for Companies Doing Business in
Emerging Markets.
IFC, 2007. Environmental, Health, and Safety Guidelines - General EHS Guidelines: Environmental
Air Emissions and Ambient Air Quality. Accessed November 2012 on
http://www.ifc.org/ifcext/enviro.nsf/content/.
Information Office of the State Council, 2012. Situation and Policies of China’s Rare Earth Industry,
Information Office of the State Council, The People’s Republic of China, June 2012, Beijing.
IUCN, 2012. IUCN Red List of Threatened Species. Version 2012.2. Accessed August 2014 on
www.iucnredlist.org.
IUCN, 2013. The IUCN Red List of Threatened Species. Accessed August 2014 at
http://www.iucnredlist.org/.
Japan International Cooperation Agency and Metal Mining Agency of Japan, 1989: Report on the
Cooperative Mineral Exploration in the Chilwa Alkaline Area Republic of Malawi, Phases I (March
1987), II (March 1988), III (March 1989), Consolidated Report (March 1989).
Kjarsgaard, B.A., and Hamilton, D.L., 1989: The genesis of carbonatites by immiscibility. In: Bell, K.
(Editor), Carbonatites: Genesis and Evolution. Unwin Hyman, London, pp. 388-404.
Kosamu, I., 2010. EIA Application in Infrastructural Projects in Malawi. Accessed 2014 at
http://el.trc.gov.om:4000/htmlroot/ENGG/tcolon/e_references/Consolidated/Chemical%20Enginee

J2897 Mkango Songwe Hill PFS November 2014 Page: 336
ring/Articles/Environmental%20impact%20assessment%20application%20in%20infrastructural%2
0projects%20in%20Malawi.pdf.
LeBas, M.J., 1987: Carbonatite magmas. Mineral. Mag., 44, 133-40
LeCouteur, P., 2010: Geological Report on the Chambe Basin Area, of Exclusive Prospecting
Licence EPL 03225/11, Mulanje Massif, Southern Malawi, East Africa. Unpublished report to Gold
Canyon Resources Inc. 73 pages and appendices. Accessed on www.SEDAR.com, Nov. 5, 2012
Lehmann, B., Nakai, S., Höhndorf, A., Brinckmann, J., Dulski, P., Hein, U.F. and Masuda, A., 1994:
REE mineralization at Gakara, Burundi: Evidence for anomalous upper mantle in the western Rift
Valley. Geochimica et Cosmochimica Acta, 58: 985-992
Lewis, T.A., 1953: Geological report on Songwe ring-structure (E.P.L.2/1952). London Nyasaland
Mining Corporation, Ltd. (unpublished)
Malawi Meteorological Services, 2006: Climate of Malawi. [online]. Available at:
http://www.metmalawi.com/climate/climate.php. [Accessed 22 October 2012].
Mariano, A.N., 1989: Nature of economic mineralization in carbonatites and related rocks. In Bell,
K., (Ed), Carbonatites: Genesis and Evolution. Unwin Hyman, London. 149-176.
Merriman, D., (2013). A Review of the Global Supply of Rare Earths. Roskill Consulting Group Ltd.
Presentation to the Royal Society of Chemistry, Environmental Chemistry Group 2013. Accessed
October 2014 at http://www.rsc.org/images/David-Merriman_tcm18-230229.pdf and
http://www.roskill.com/reports/minor-and-light-metals/news/download-roskills-paper-on-the-
global-supply-of-rare-earths/?searchterm=global%20supply%20of%20rare%20earths.
MINING.com, 2014. Canada wants 20% of global rare earth market by 2018. Frik Els, January 8,
2014. Accessed October 2014 on http://www.mining.com/canada-wants-20-of-global-rare-earth-
market-by-2018-27834/.
Mitchell, R.H., 2005: Carbonatites and Carbonatites and Carbonatites. The Canadian Mineralogist,
43, 2049-2068.
Nations Online Project ©, 2012: http://www.nationsonline.org/oneworld/maps.htm
Peak Resources Limited, 2014. Peak Resources Delivers Robust PFS for Ngualla, ASX Release 19
March 2014. Accessed October 2014 on
http://www.peakresources.com.au/IRM/Company/ShowPage.aspx/PDFs/2599-
10000000/PeakResourcesDeliversRobustPFSforNgualla.
Pike, J. G., Rimmington, G.T., 1965. Malawi: a geographical study. Oxford University Press, London.
Remote Exploration Services Ltd., 2010: Results Report: Songwe Geophysical Surveys, Songwe Hill,
Malawi. Unpublished Report for Mkango Resources Ltd.
Remote Exploration Services Ltd., 2011: Updated Songwe digital elevation model and geophysical
investigation, Unpublished Report for Mkango Resources Ltd.

J2897 Mkango Songwe Hill PFS November 2014 Page: 337
Rodrigues, A.S.L., Pilgrim, J.D., Lamoreux, J.F., Hoffmann, M., and Brooks, T.M., 2006. The value of
the IUCN Red List for conservation. TRENDS in Ecology and Evolution, 21 (2), pp. 71-76.
Roskill Consulting Group Limited, 2013a. Quest Rare Minerals, Marketing study update for rare
earths and niobium, January 2013.
Scott, N. and Wells, A., 2010: Technical Report on the Songwe Rare Earth Element (REE) project,
Republic of Malawi. Unpublished report by Saint Barbara LLP for Lancaster Exploration Ltd.,
Report E1243, 141p.
Shaw, S. and Chegwidden, J., 2012. Global drivers for rare earth demand, Roskill Information
Services, August 2012. Accessed September 2014 on http://www.roskill.com/news/4th-baotou-
china-rare-earth-industry-forum/?searchterm=rare%20earths.
Smith, M.P., Henderson, P., 2000: Preliminary fluid inclusion constraints on fluid evolution in the
Bayan Obo Fe-REE-Nb deposit, Inner Mongolia, China. Economic Geology, 95. 1371-1388.
Sun, S., and McDonough, W. F., 1989: Chemical and isotopic systematics of oceanic basalts:
implications for mantle composition and processes, In Saunders, A.D. and Norry, M.J., eds.,
Magmatism in the Ocean Basins.Geological Soc. Special Publ. 42, 313-345.
Tasman Metals Limited, 2014. Principal Uses of Rare Earth Elements. Accessed October 2014 on
http://www.tasmanmetals.com/s/PrincipalUses.asp.
The Geological Society, 2011. Geological Society Briefing Note: Rare Earth Elements. Accessed
October 2014 on:
https://www.geolsoc.org.uk/~/~/media/shared/documents/policy/ree%20briefing%20note%20fin
alv2.ashx.
Topham, P., 1930. The Genus Brachystegia in Nyasaland. Bulletin of Miscellaneous Information,
Royal Gardens, Kew. Vol. 1930, No. 8. ,pp. 348-364.
UNEP. Convention on International Trade in Endangered Species of Wild Fauna and Flora. Geneva,
Switzerland: International Development House, 2013. Accessed 2014 on
http://www.cites.org/eng/app/appendices.php.
U.S. Geological Survey, 2013. Mineral Commodity Summaries 2013. U.S. Geological Survey,
January 2013, pp. 128-129
U.S. Geological Survey, 2014. Mineral Commodity Summaries 2014. U.S. Geological Survey,
February 2014, pp. 128-129.
Wall, F. and Mariano, A.N., 1996: Rare earth minerals in carbonatites: a discussion on the
Kangankunde Carbonatite, Malawi. In: Jones, A.P., Wall, F., and Williams, C.T., (Eds.) Rare Earth
Minerals: Chemistry, Origin and Ore Deposits. Chapman and Hall, 193-225.
Wallace, M.E. and Green, D.H., 1988: An experimental determination of primary carbonatite
magma composition. Nature, 335, 343-346.

J2897 Mkango Songwe Hill PFS November 2014 Page: 338
Watkinson, D.H., and Wyllie, P.J., 1971: Experimental study of the join NaAlSiO4-CaCO3-H2O and
the genesis of alkalic rock-carbonatite complexes. Journal of Petrology, 12, 357-378.
Woolley, A.R. and Garson, M.S., 1970: Petrochemical and tectonic relationship of the Malawian
carbonatite-alkaline province and the Lupata-Lebombo volcanics. In: T.N. Clifford and I.G. Gass
(Eds.), African Magmatism and Tectonics. Oliver and Boyd, Edinburgh. 237-262.
Woolley, A.R., 1987: Lithosphere metasomatism and petrogenesis of the Chilwa Province of
alkaline igneous rocks and carbonatites, Malawi. Journal of African Earth Sciences, 6, 891
Woolley, A.R. and Jones, G.C., 1987: The petrochemistry of the northern part of the Chilwa alkaline
province, Malawi. Geological Society, London, Special Publications, 30, 335.
Woolley, A.R. and Kempe, D.R.C., 1989: Carbonatites: nomenclature, average chemical
compositions, and element distribution. In: Bell, K. (Editor), Carbonatites: Genesis and Evolution.
Unwin Hyman, London, pp. 1–14.
Woolley, A.R., 1991: The Chilwa Alkaline Igneous Province of Malawi: a review. In: Kampunzu, A.B.
and Lubala, R.T. (Eds.), Magmatism in Extensional Structural Settings: the Phanerozoic African
Plate. Springer-Verlag, Berlin, 377-409.
Woolley, A.R., 2001: Alkaline Rocks and Carbonatites of the World Part 3: Africa. The Geological
Society, London. 372 pp.
Woolley, A.R., and Kjarsgaard, B.A., 2008: Paragenetic types of carbonatite as indicated by the
diversity and relative abundances of associated silicate rocks: evidence from a global database.
Canadian Mineralogist, 46 (4), 741-752.
27.1 Websites consulted
Geology.com – accessed October 2014 on http://geology.com/articles/rare-earth-elements/
MINING.com – accessed June to October 2014 on http://www.mining.com/canada-wants-20-of-
global-rare-earth-market-by -2018-27834/

J2897 Mkango Songwe Hill PFS November 2014 Page: 339
APPENDIX 1:
Glossary of Abbreviations, Acronyms
and Technical Terms

J2897 Mkango Songwe Hill PFS November 2014 Page: 340
Glossary of Abbreviations, Acronyms and Technical Terms
Abbreviations and Acronyms
φ Friction angle
1V:3H; 1V:2H Slope ratios are expressed in metres as 1V:3H; 1V:2H where the
first number represents the vertical distance and the second
represents the horizontal distance
Actlabs Activation Laboratories
AMIS African Mineral Standards
BFA Bench Face Angle
CaCl2 Calcium chloride
CaCO3 Calcite
CAD Canadian Dollars
(CaFe(CO3)2) Ankerite
CAP Chilwa Alkaline Province
CaSO4 Gypsum
Ce Cerium
Ce2O3 Cerium Oxide
CRM Certified Reference Material
CSO Civil Society and Community Liaison
D Disturbance Factor
DEA Malawian Department of Environmental Affairs
Dy2O3 Dysprosium Oxide
EIA Environmental Impact Assessment
EM Electromagnetic
EMP Electron microprobe
EMPA
EPCM Engineering, procurement, construction and management costs
EPL Exclusive Prospecting Licence
Epoch Epoch Resources (Pty) Ltd
ESHIA Environmental, Social and Health Impact Assessment
Eu Europium
Eu2O3 Europium Oxide
Fe Iron
Fe:PO4 Iron to phosphate ratio
FOB Free on Board
FRP Fibreglass reinforced plastic

J2897 Mkango Songwe Hill PFS November 2014 Page: 341
G&A General and Administration
Genalysis Intertek-Genalysis Laboratory
GSDM Geological Survey Department of Malawi
GSI Geological Strength Index
GVH General Village Headman
H1 First half of the year (beginning January to end June)
HCl Hydrochloric Acid
HDPE High density polyethylene
HREE Heavy Rare Earth Elements
HREO Heavy Rare Earth Oxides
H2SO4 Sulphuric Acid
IFC International Finance Corporation
ICP-MS Inductively coupled plasma mass spectrometry
ICP-OES Inductively coupled plasma optical emission spectrometry
IRR
ITCZ Inter-Tropical Convergence Zone
JICA Japan International Cooperation Agency
k Potassium
kg/m3 Kilogram per cubic metre (density)
km kilometre
km2 Square kilometre
K2O Potassium Oxide
kPa kilopascal
ktpa Kilo tonnes per annum
kV Kilovolt
kW Kilo Watt
La Lanthanum
Lancaster Lancaster Exploration Ltd
La2O3 Lanthanum Oxide
LIMS Laboratory information management system
LoM Life of Mine
LREE Light Rare Earth Elements
LREO Light Rare Earth Oxides
m Metres
m3 Cubic metres
mamsl Metres above mean sea level
MCCs Motor Control Centres

J2897 Mkango Songwe Hill PFS November 2014 Page: 342
Mkango Mkango Resources Limited
mm millimetres
m/m Mass fraction
MMAJ Metal Mining Agency of Japan
Mn Manganese
MRMR Mining Rock Mass Rating
MOU Memorandum of Understanding
m/h Metre per hour
m/s Metre per second
Mt Million tonnes
Mtpa Million tonnes per annum
MVA Megavolt amperes (one million volt amperes)
MWK Malawian Kwacha
NaOH Sodium hydroxide
NATA The National Association of Testing Authorities Australia
Nb Niobium
Nd Neodymium
Nd2O3 Neodymium Oxide
NELAC National Environmental Laboratory Accreditation Conference
NGL Natural ground level
NI 43-101 National Instrument 43-101 Standards of Disclosure for Mineral
Projects
NPV Net Present Value
OHL Overhead line
OSA Overall slope angle
P Phosphorus
P & G Preliminary and General
PFS Pre-Feasibility Study
ppm Parts per million
QA Quality assurance
QA/QC Quality assurance and quality control
QC Quality control
QEMSCAN Quantitative Evaluation of Minerals by Scanning Electron
Microscopy
QP Qualified Person
REE Rare Earth Elements
RMR89 Rock Mass Rating (Bieniawski, 1989)

J2897 Mkango Songwe Hill PFS November 2014 Page: 343
ROM Run of mine
ROW Rest of the World
RQD Rock quality designation
RWD Return Water Dam
SAA South African Airways
SCC Standards Council of Canada
SDV SDV Malawi Ltd
SGS SGS Inc. Lakefield, Canada
Sm Samarium
SME Society for Mining, Metallurgy and Exploration
Sm2O3 Samarium Oxide
SO2 Sulphur dioxide
SO3 Sulphur trioxide
Sr Strontium
SrCO3 Strontianite
SWD Storm Water Dam
SX Solvent extraction
t tonne
TA Traditional Authority
Tb Terbium
Tb2O3 Terbium Oxide
Th Thorium
tpa Tonnes per annum
tpd Tonnes per day
t/h Tonnes per hour
tpm Tonnes per month
TREO Total Rare Earth Oxides
TSF Tailings storage facility
TSXV Toronto Stock Exchange Venture or TSX Venture Exchange
UCS Uniaxial compressive strength
US$ United States Dollars
US$/kg United States Dollars per kilogram
US$/t United States Dollars per tonne
US$/tonne United States Dollars per tonne
USA United States of America
USGS United States Geological Survey
UTM Universal Transverse Mercator

J2897 Mkango Songwe Hill PFS November 2014 Page: 344
v/v Volume concentration
wt% Weight per cent
WTO World Trade Organisation
XRD X-ray diffraction
Y Yttrium
Y2O3 Yttrium Oxide
Yb2O3 Ytterbium Oxide
ZAR South African Rand
Technical Terms
Airborne magnetic surveys Surveys flown by helicopter or fixed wing aircraft to measure the
magnetic susceptibility of rocks at or near the earth’s surface
Alkaline rocks Rocks containing an excess of sodium and/or potassium
Amphibolite A metamorphic rock comprised mainly of amphibole
amsl Elevation above mean sea level
Apatite A mineral Ca5(F,Cl)(PO4)3 found in igneous rocks which is a
source of phosphate and locally contains significant amounts of
rare earth elements
Archean The third oldest of four geological eons in the history of the
earth. It extends from 2,500 million years back to approximately
3,800 million years
Baryte A mineral consisting of barium sulphate BaSO4
Basement The igneous and metamorphic crust of the earth, underlying
sedimentary deposits
Bastnäsite A family of rare-earth carbonate-fluoride minerals
Brecciated A body of rock that has been intensely fractured
Calcite A mineral consisting of calcium carbonate CaCO3
Carbonate A rock, usually of sedimentary origin, composed primarily of
calcium, magnesium or iron and CO3 or a mineral characterized
by presence of the carbonate ion (CO32-
)
Carbonatite An igneous intrusive or extrusive rock that consists of more than
50% carbonate minerals. Calcitic carbonatite is dominantly
calcium carbonate, dolomitic carbonatite is dominantly
magnesium carbonate, ankeritic carbonatite is dominantly iron
carbonate
Ce Cerium, a LREE
Channel sample A sample taken by cutting a shallow “channel’ across an outcrop
surface permitting a continuous sampling of the outcrop and
providing assay results that are representative of a specified
width across the outcrop
Chondrite Stony meteorites that have not been modified due to melting or
differentiation of the parent body, and are considered to have
very primitive compositions
Craton Large, ancient mass of the earth’s crust comprised of various
crustal blocks amalgamated by tectonic processes
Diamond Drilling Method of obtaining a cylindrical core of rock by drilling with a

J2897 Mkango Songwe Hill PFS November 2014 Page: 345
diamond impregnated bit
Dolomite A carbonate mineral composed of calcium and magnesium
carbonate, CaMg(CO3)2; a rock predominantly comprised of this
mineral is also referred to as dolomite or dolostone
Dy Dysprosium, a HREE
Dyke A tabular body of intrusive igneous rock, crosscutting the host
strata at an oblique angle
Eluvial geological deposits and soils that are derived by in situ
weathering or weathering plus gravitational movement
EPL (Exclusive Prospecting
License)
A mineral right granted by the Government of Malawi that allows
the holder to carry on prospecting operations related to the
mineral or group of minerals specified in the prospecting license
Er Erbium, a HREE
Fabric The orientation in space of the elements of which a rock is
composed
Fault A fracture or fracture zone in the earth’s crust, along which
displacement of opposing sides has occurred
Fenitisation A distinctive alkali metasomatic alteration of host rocks
surrounding a carbonatite intrusion
Fluorite A mineral composted of calcium fluoride (CaF2); a.k.a. fluorspar
Fold A planar sequence of rocks or a feature bent about an axis
Ga Billion years
Gd Gadolinium, a HREE
GPS (global positioning system) A satellite-based navigation system that provides reliable
location information anywhere on Earth when there is an
unobstructed line of sight to four or more GPS satellites
Gneiss A foliated metamorphic rock that has a banded appearance
Grab samples Rock samples taken from outcrop in non-systematic manner
Ho Holmium, a HREE
HREE Heavy Rare Earth Elements – Eu, Gd, Tb, Dy, Ho, Er, Tm, Yb, and
Lu
Hydrothermal Processes that involve heated water
ICP-OES Inductively Coupled Plasma Optical Emission Spectroscopy, an
analytical method used for elemental analyses
ICP-MS Inductively Coupled Plasma Mass Spectrometry, an analytical
method used for elemental analyses, particularly trace elements
including the rare earth elements
La Lanthanum, a LREE
Lacustrine formed at the bottom or along the shore of lakes, as geological
strata
Lithogeochemical Study involving the chemical composition of rocks
LOI Loss on ignition. The amount of volatile substances that are
driven out of a sample by heating, reported as part of an
elemental or oxide analyses of a rock or mineral
LREE Light Rare Earths – La, Ce, Pr, Nd and Sm
Lu Lutetium, a HREE
Ma Million years
Magnetometer An instrument for measuring the intensity of the earth’s

J2897 Mkango Songwe Hill PFS November 2014 Page: 346
magnetic field
Magnetic susceptibility The degree of magnetization of a material in response to an
applied magnetic field
Magnetite An important iron oxide mineral Fe3O4
Mafic Pertaining to or composed dominantly of magnesium and iron
rock-forming silicates. Typically synonymous with “dark minerals”
Metamorphism Changes to rocks and minerals generally as a result of changes in
pressure and/or temperature
Metasomatic A metamorphic change in the rock which involves the
introduction of material from another source
Monazite A rare earth and thorium phosphate mineral found as an
accessory mineral in felsic igneous rocks, pegmatite dykes and
heavy mineral sands
mt Million metric tonnes
Muscovite A potassium-bearing white mica
Nd Neodymium, a LREE
Nepheline A rock-forming feldspathoid mineral with composition
Na3KAl4Si4O16, that occurs in low-silica intrusive and volcanic
rocks
Orogen A belt of rocks characterized by folding, faulting, metamorphism
and intrusion recording active ancient tectonic regimes that
culminated in mountain-building
Orogeny A deformation and/or magmatic event in the earth’s crust,
usually caused by collision between tectonic plates
Paragneiss Banded metamorphic rock derived from sedimentary rocks
Parisite A rare earth-bearing fluor-carbonate mineral
Phonolite Fine-grained to porphyritic igneous rocks that are rich in
nepheline and potash feldspar
Plug A near vertical, more or less cylindrical, intrusion that appears
more or less circular in plan
Porphyritic Igneous rock containing larger crystals of one or more minerals
in a dominantly fine grained groundmass
Pm Promethium, a LREE
Pr Praseodymium, a LREE
Precambrian Informal name for the geological time periods that predate the
Paleozoic (older than ca. 545 million years)
Radiometrics A measure of the natural radiation in the earth’s surface
(sometimes referred to as Gamma-Ray Spectrometry)
Rare Earth Elements 15 elements of the Lanthanide Series ranging from atomic
number 57 (Lanthanum) to atomic number 71 (Lutetium)
REO Rare Earth Oxides
Shear zone A tabular to sheet-like, planar or curvi-planar zone composed of
rocks that are more highly strained than rocks adjacent to the
zone, typically zones of much more intense foliation,
deformation, and folding
THREE Total Heavy Rare Earth Elements (includes yttrium)
TREE Total Rare Earth Elements
TREO Total Rare Earth Oxides
Schist A crystalline metamorphic rock having a foliated or parallel fabric
resulting from the alignment of platy (micaceous) minerals
Scintillometer An instrument that measures the intensity of ionizing radiation

J2897 Mkango Songwe Hill PFS November 2014 Page: 347
SEM (scanning electron
microscope)
A type of electron microscope that images a sample by scanning
it with a high-energy beam of electrons
Sill A tabular intrusion that is parallel to the layering in the host
rocks
Sm Samarium, a LREE
Spectrometer (gamma ray) An instrument capable of detecting and analyzing the spectrum
of the intensity of gamma radiation. Specifically, it can measure
the relative intensity of radiation resulting from uranium, thorium
and potassium
Sövite The coarse-grained variety or facies of a carbonatite intrusive.
Sövite is often a medium to coarse grained calcite carbonatite
with variable accessory amphibole, biotite, pyrite, pyrochlore and
fluorite
Strontianite A mineral consisting of strontium carbonatite SrCO3
Subsolidus Refers to chemical reactions in rocks that take place under
pressures and temperatures at which the magmatic liquids have
completely solidified
Supergene Process involving circulation of surface waters throughout an
orebody, which can result in remobilization and enrichment of
metals and minerals
Strike Horizontal direction or trend of a geological structure, defined as
the intersection of a horizontal plane with the plane of the
structure
Syenite An intrusive igneous rock composed dominantly of alkali
feldspar, with little or no quartz and ferromagnesian minerals
Synchysite A rare earth-bearing fluor-carbonate mineral
Tb Terbium, a HREE
Tectonic Pertaining to the forces involved in, or the resulting structures of,
movement in the earth’s crust
Thorite An accessory mineral of composition (Th,U)SiO4, the most
common mineral of thorium
Tm Thulium, a HREE
Trenching The process of digging shallow linear pits in the shallow
overburden to provide access to a more or less continuous
section of bedrock
Xenotime A rare earth-bearing phosphate mineral of composition YPO4 in
which the heavy rare earths are expressive secondary
components
XRF (X-Ray Fluorescence) A routine non-destructive analytical method to determine major
and trace element concentrations in geological materials
Y Yttrium. An element with atomic number 39, which behaves
chemically in a similar fashion to the HREE and is typically
included with the HREE for purposes of economic valuation
Yb Ytterbium, a HREE
Zircon A mineral consisting of zirconium silicate (ZrSiO4)

J2897 Mkango Songwe Hill PFS November 2014 Page: 348
APPENDIX 2:
Certificate of Author(s)

CERTIFICATE OF QUALIFIED PERSON
I, Robert Charles Croll, FSAIMM, do hereby certify that:
1. I am the Principal Consultant of:
The MSA Group (Pty) Ltd
20B Rothesay Avenue
Craighall Park, Gauteng, South Africa,
2196
2. This certificate applies to the Technical Report titled “Mkango Resources Limited; Songwe REE Project, Malawi – NI 43-101 Pre-
feasibility Report”, that has an effective date of 19 September 2014 and a report date of 06 November 2014 (the Technical
Report).
3. I graduated with a Bachelor of Science degree in Mining Engineering from the University of the Witwatersrand, Johannesburg,
South Africa in 1973. In addition, I graduated with a Master of Business Administration degree from the same university in
1977.
4. I am a Fellow of the Southern Africa Institute of Mining and Metallurgy.
5. I have worked in the mining industry for some 39 years. This period includes 12 years of operational experience; just under 4
years as a mining research analyst for stockbroking companies; just under 16 years associated with the assessment and due
diligence assessments of international mining projects; and 8 years as a Mining Consultant responsible for the management
and preparation of mining studies, due diligence reviews of mining projects, and other related tasks
6. I have read the definition of “qualified person” set out in National Instrument 43-101 (NI 43-101) and certify that by reason of
my education, affiliation with a professional association (as defined in NI 43-101) and past relevant work experience, I fulfil the
requirements to be a “qualified person” for the purposes of NI 43-101.
7. I visited the Songwe Hill property on 19th May 2014 for 1day.
8. I am responsible for, or co-responsible for, the preparation of sections 1 to 5, 18, 19, and 21 to 27 of the Technical Report.
9. I have not had prior involvement with the property that is the subject of the Technical Report.
10. At the effective date of the Technical Report, to the best of my knowledge, information and belief, the sections for which I am
responsible in the Technical Report contain all scientific and technical information that is required to be disclosed to make the
Technical Report not misleading.
11. I am independent of the issuer according to the definition of independence described in section 1.5 of National Instrument
43-101.
12. I have read National Instrument 43-101 and Form 43-101F1 and, as of the date of this certificate, to the best of my knowledge,
information and belief, those portions of the Technical Report for which I am responsible have been prepared in compliance
with that instrument and form.
13. I consent to the filing of the Technical Report with any stock exchange and other regulatory authority and any publication by
them for regulatory purposes, including electronic publication in the public company files on their websites accessible by the
public, of the Technical Report.
Dated this 6th Day of November, 2014.
“signed and stamped”
Robert Charles Croll
Fellow: Southern African Institute of Mining and Metallurgy

CERTIFICATE OF QUALIFIED PERSON
I, H. Scott Swinden, Ph.D. P.Geo, do hereby certify that:
1. I am the Principal Consultant of:
Swinden Geoscience Consultants Ltd.,
3 Crest Road,
Halifax, Nova Scotia B3M 2W1
CANADA
2. This certificate applies to the technical report titled “Mkango Resources Limited; Songwe REE Project, Malawi – NI 43-101 Pre-
feasibility Report”, that has an effective date of 19 September 2014 and a report date of 06 November 2014 (the Technical
Report).
3. I have the following academic qualifications:
Ph.D. (Earth Sciences), 1988 Memorial University of Newfoundland
M.Sc. (Geology), 1976 Memorial University of Newfoundland
B.Sc. (Honours in Geology), 1970 Dalhousie University.
4. I am a member in good standing of the Association of Professional Geoscientists of Nova Scotia (No. 085), Fellow of the
Geological Association of Canada, the Canadian Institute of Mining, Metallurgy and Petroleum, and the Society of Economic
Geologists and Adjunct Professor of Earth Sciences at Dalhousie University.
5. I have read the definition of “qualified person” set out in National Instrument 43-101 (NI 43-101) and certify that by reason of
my education, affiliation with a professional association (as defined in NI 43-101) and past relevant work experience, I fulfil the
requirements to be a “qualified person” for the purposes of NI 43-101.
6. I visited the Songwe Hill property on 21st to 25
th April 2012 and from the 11
th to 16
th October 2012.
7. I am responsible for, or co-responsible for, the preparation of Sections 1, 4 to 11 and Section 23, but excluding sections 4.3
and 5.2 of the Technical Report.
8. I have had prior involvement with the property that is the subject of the Technical Report. The nature of my prior involvement
is as an independent consultant to Mkango Resources Ltd since 2012.
9. At the effective date of the Technical Report, to the best of my knowledge, information and belief, the sections for which I am
responsible in the Technical Report contain all scientific and technical information that is required to be disclosed to make the
Technical Report not misleading.
10. I am independent of the issuer according to the definition of independence described in section 1.5 of National Instrument
43-101.
11. I have read National Instrument 43-101 and Form 43-101F1 and, as of the date of this certificate, to the best of my knowledge,
information and belief, those portions of the Technical Report for which I am responsible have been prepared in compliance
with that instrument and form.
12. I consent to the filing of the Technical Report with any stock exchange and other regulatory authority and any publication by
them for regulatory purposes, including electronic publication in the public company files on their websites accessible by the
public, of the Technical Report.
Dated this 6th Day of November, 2014.
“signed and stamped”
H. Scott Swinden
Ph.D. P.Geo

CERTIFICATE OF QUALIFIED PERSON
I, Michael Robert Hall, Pr.Sci.Nat. do hereby certify that:
1. I am a Mineral Resource Consultant of:
The MSA Group (Pty) Ltd
20B Rothesay Avenue
Craighall Park, Gauteng, South Africa,
2196
2. This certificate applies to the technical report titled ““Mkango Resources Limited; Songwe REE Project, Malawi – NI 43-101 Pre-
feasibility Report”, that has an effective date of 19 September 2014 and a report date of 06 November 2014 (the Technical
Report).
3. I graduated with a degree in BSc Eng (Mining Geology) from the University of the Leicester, England in 1980. In addition, I
obtained an MBA from the Business School at the University of the Witwatersrand in 2003.
4. I am a member in good standing with the South African Council of Natural and Scientific Professions (SACNASP) and the
Geological Society of South Africa (GSSA).
5. I have read the definition of “qualified person” set out in National Instrument 43-101 (NI 43-101) and certify that by reason of
my education, affiliation with a professional association (as defined in NI 43-101) and past relevant work experience, I fulfil the
requirements to be a “qualified person” for the purposes of NI 43-101.
6. I visited the Songwe Hill property on 1st to 3
rd September 2012.
7. I am responsible for, or co-responsible for, the preparation of Sections 1, 12, and 14 of the Technical Report.
8. I have not had prior involvement with the property that is the subject of the Technical Report.
9. At the effective date of the Technical Report, to the best of my knowledge, information and belief, the sections for which I am
responsible in the Technical Report contain all scientific and technical information that is required to be disclosed to make the
Technical Report not misleading.
10. I am independent of the issuer according to the definition of independence described in section 1.5 of National Instrument
43-101.
11. I have read National Instrument 43-101 and Form 43-101F1 and, as of the date of this certificate, to the best of my knowledge,
information and belief, those portions of the Technical Report for which I am responsible have been prepared in compliance
with that instrument and form.
12. I consent to the filing of the Technical Report with any stock exchange and other regulatory authority and any publication by
them for regulatory purposes, including electronic publication in the public company files on their websites accessible by the
public, of the Technical Report.
Dated this 6th Day of November, 2014.
“signed and stamped”
Michael Robert Hall
Pr.Sci.Nat.

CERTIFICATE OF QUALIFIED PERSON
I, Clive Wyndham Brown, Pr Eng, Bsc Eng Mining do hereby certify that:
1. I am Principal Mining Engineer Associate of:
The MSA Group (Pty) Ltd
20B Rothesay Avenue
Craighall Park, Gauteng, South Africa,
2196
2. This certificate applies to the technical report titled “Mkango Resources Limited; Songwe REE Project, Malawi – NI 43-101 Pre-
feasibility Report”, that has an effective date of 19 September 2014 and a report date of 06 November 2014 (the Technical
Report).
3. I graduated with a degree in Mining Engineering (Bsc Eng Mining) from the University of Witwatersrand in 1986.
4. I am a registered fellow of the Southern African Institute of Mining and Metallurgy.
5. I have worked as a mining engineer for a total of 25 years, during which time I have worked in underground and open pit
mines, both hard rock and coal, in the functions of production management and technical services. I have been a consultant to
the mining industry for 12 years assisting mining and exploration companies with feasibility and other technical studies.
6. I have read the definition of “qualified person” set out in National Instrument 43-101 (NI 43-101) and certify that by reason of
my education, affiliation with a professional association (as defined in NI 43-101) and past relevant work experience, I fulfil the
requirements to be a “qualified person” for the purposes of NI 43-101.
7. I visited the Songwe Hill property on 19th
May 2014 for 1 day.
8. I am responsible for, or co-responsible for, the preparation of Sections 1, 15, 16, 21, 22, 25 and 26 of the Technical Report.
9. I have not had prior involvement with the property that is the subject of the Technical Report.
10. At the effective date of the Technical Report, to the best of my knowledge, information and belief, the sections for which I am
responsible in the Technical Report contain all scientific and technical information that is required to be disclosed to make the
Technical Report not misleading.
11. I am independent of the issuer according to the definition of independence described in section 1.5 of National Instrument
43-101.
12. I have read National Instrument 43-101 and Form 43-101F1 and, as of the date of this certificate, to the best of my knowledge,
information and belief, those portions of the Technical Report for which I am responsible have been prepared in compliance
with that instrument and form.
13. I consent to the filing of the Technical Report with any stock exchange and other regulatory authority and any publication by
them for regulatory purposes, including electronic publication in the public company files on their websites accessible by the
public, of the Technical Report.
Dated this 6th Day of November, 2014.
“signed and stamped”
Clive Wyndham Brown
Pr. Eng., B.Sc. Eng (Mining)

C C M MET-CHEM CONSULTING Pty Ltd
A.B.N 34 152 694 212
Tel: +61 (0) 438 036 375
Email: [email protected]
16 Rowan Pl
Woodlands, 6018
Australia
CERTIFICATE OF QUALIFIED PERSON
I, Gavin Beer, BSc. (Ext. Met.) MAusIMM(CP) do hereby certify that:
1. I am Consultant Metallurgist of:
MET-CHEM CONSULTING Pty Ltd
16 Rowan Place
Woodlands, Western Australia,
6018
2. This certificate applies to the technical report titled “Mkango Resources Limited; Songwe REE Project, Malawi – NI 43-101 Pre-
feasibility Report”, that has an effective date of 19 September 2014 and a report date of 06 November 2014 (the Technical
Report).
3. I graduated with a Bachelor of Science degree in Extractive Metallurgy from Murdoch University, Perth, Western Australia 1989.
4. I am a Member of the Australian Institute of Mining and Metallurgy and a Chartered Professional (109895).
5. I have read the definition of “qualified person” set out in National Instrument 43-101 (NI 43-101) and certify that by reason of
my education, affiliation with a professional association (as defined in NI 43-101) and past relevant work experience, I fulfil the
requirements to be a “qualified person” for the purposes of NI 43-101.
6. I am responsible for, or co-responsible for, the preparation of Sections 1, 13 and 26 of the Technical Report.
7. I have had prior involvement with the property that is the subject of the Technical Report. The nature of my prior involvement
is scoping and management of metallurgical testwork since January 2013.
8. At the effective date of the Technical Report, to the best of my knowledge, information and belief, the sections for which I am
responsible in the Technical Report contain all scientific and technical information that is required to be disclosed to make the
Technical Report not misleading.
9. I am independent of the issuer according to the definition of independence described in section 1.5 of National Instrument
43-101.
10. I have read National Instrument 43-101 and Form 43-101F1 and, as of the date of this certificate, to the best of my knowledge,
information and belief, those portions of the Technical Report for which I am responsible have been prepared in compliance
with that instrument and form.
11. I consent to the filing of the Technical Report with any stock exchange and other regulatory authority and any publication by
them for regulatory purposes, including electronic publication in the public company files on their websites accessible by the
public, of the Technical Report.
Dated this 6th Day of November, 2014.
“signed and stamped”
Gavin Beer
BSc. (Ext. Met.); MAusIMM(CP); Consultant Metallurgist

SNCLAVALIN (PTY) LTD Block C, Cullinan Place 2 Cullinan Close, Morningside Sandton 2146 South Africa www.snclavalin.com Tel: +27 (0) 11 535 4900 Fax: +27 (0)11 535 4980 Registration No. 2009/0022727/07
Directors: D Clarke (Canada), JC Kuiken (The Netherlands), SK Misir (Canada),
JE du Rand (South Africa) Members of the SNC-LAVALIN Group
CERTIFICATE OF QUALIFIED PERSON
I, Jansen Scheepers, Pr Eng, Bsc Eng Extractive Metallurgy do hereby certify that:
1. I am the Business Development Manager of:
SNC Lavalin (Pty) Ltd
Block C, Cullinan Place, 2 Cullinan Close, Morningside,
P.O Box 784593
Sandton, Gauteng, South Africa,
2146
2. This certificate applies to the technical report titled ““Mkango Resources Limited; Songwe REE Project, Malawi – NI 43-101 Pre-
feasibility Report”, that has an effective date of 19 September 2014 and a report date of 06 November 2014 (the Technical
Report).
3. I graduated with a BEng Extractive Metallurgy Degree from the University of the Pretoria in 2000. In addition I have also
obtained an MBA from the University of Stellenbosch in 2008.
4. I am a Professional Engineer with the Engineering Council of South Africa (Reg. No. 20080185) and have been a member in
good standing since 2008.
5. I have worked as an engineer and a business development manager for a total of 13 years since my graduation.
6. I have read the definition of “qualified person” set out in National Instrument 43-101 (NI 43-101) and certify that by reason of
my education, affiliation with a professional association (as defined in NI 43-101) and past relevant work experience, I fulfil the
requirements to be a “qualified person” for the purposes of NI 43-101.
7. I am responsible for, or co-responsible for, the preparation of Sections 1, 17, 21, 22, 25 and 26 of the Technical Report.
8. I have not had prior involvement with the property that is the subject of the Technical Report.
9. At the effective date of the Technical Report, to the best of my knowledge, information and belief, the sections for which I am
responsible in the Technical Report contain all scientific and technical information that is required to be disclosed to make the
Technical Report not misleading.
10. I am independent of the issuer according to the definition of independence described in section 1.5 of National Instrument
43-101.
11. I have read National Instrument 43-101 and Form 43-101F1 and, as of the date of this certificate, to the best of my knowledge,
information and belief, those portions of the Technical Report for which I am responsible have been prepared in compliance
with that instrument and form.
12. I consent to the filing of the Technical Report with any stock exchange and other regulatory authority and any publication by
them for regulatory purposes, including electronic publication in the public company files on their websites accessible by the
public, of the Technical Report.
Dated this 6th Day of November, 2014.
“signed and stamped”
Jansen Scheepers
Pr. Eng., B.Sc. Eng. (Extractive Metallurgy)

SNCLAVALIN (PTY) LTD Block C, Cullinan Place 2 Cullinan Close, Morningside Sandton 2146 South Africa www.snclavalin.com Tel: +27 (0) 11 535 4900 Fax: +27 (0)11 535 4980 Registration No. 2009/0022727/07
Directors: D Clarke (Canada), JC Kuiken (The Netherlands), SK Misir (Canada),
JE du Rand (South Africa) Members of the SNC-LAVALIN Group
CERTIFICATE OF QUALIFIED PERSON
I, Hilgard Marthinus Redelinghuys, Pr.Tech.Eng., Incorporated Engineer – Eng. Council Namibia, do hereby certify that:
1. I am the Senior Mechanical Engineer of:
SNC Lavalin (Pty) Ltd
Block C, Cullinan Place, 2 Cullinan Close, Morningside,
P.O Box 784593
Sandton, Gauteng, South Africa,
2146
2. This certificate applies to the technical report titled “Mkango Resources Limited; Songwe REE Project, Malawi – NI 43-101 Pre-
feasibility Report”, that has an effective date of 19 September 2014 and a report date of 06 November 2014 (the Technical
Report).
3. I graduated with a BSc Operational Degree from the University of Potchefstroom in 1991. In addition I have also obtained a
National Diploma in Mechanical Engineering from the Vaal University of Technology in 1985 and a MBA from the University of
Potchefstroom in 2005.
4. I am a Professional Technologist Engineer with the Engineering Council of South Africa (Reg.No. 200970073), and I am
registered with the Engineering Council of Namibia as Incorporated Engineer (Reg.No IE 29008) and have been a member in
good standing since 2009.
5. I have worked as a technologist, operational manager and engineer for a total of 33 years since my graduation.
6. I have read the definition of “qualified person” set out in National Instrument 43-101 (NI 43-101) and certify that by reason of
my education, affiliation with a professional association (as defined in NI 43-101) and past relevant work experience, I fulfil the
requirements to be a “qualified person” for the purposes of NI 43-101.
7. I visited the Songwe Hill property on 19th
May 2014 for 1 day.
8. I am responsible for, or co-responsible for, the preparation of Sections 1, 18, 21, 22, 25 and 26 of the Technical Report.
9. I have not had prior involvement with the property that is the subject of the Technical Report.
10. At the effective date of the Technical Report, to the best of my knowledge, information and belief, the sections for which I am
responsible in the Technical Report contain all scientific and technical information that is required to be disclosed to make the
Technical Report not misleading.
11. I am independent of the issuer according to the definition of independence described in section 1.5 of National Instrument
43-101.
12. I have read National Instrument 43-101 and Form 43-101F1 and, as of the date of this certificate, to the best of my knowledge,
information and belief, those portions of the Technical Report for which I am responsible have been prepared in compliance
with that instrument and form.
13. I consent to the filing of the Technical Report with any stock exchange and other regulatory authority and any publication by
them for regulatory purposes, including electronic publication in the public company files on their websites accessible by the
public, of the Technical Report.
Dated this 6th Day of November, 2014.
“signed and stamped”
Hilgard Marthinus Redelinghuys
Pr.Tech.Eng., Incorporated Engineer – Eng. Council Namibia

Physical Address
Postal Address
Telephone
Facsimile
Web Address
Company Registration
Directors
Associate Consultant
Building 22A, The Woodlands, Woodlands Drive,
Woodmead, 2148, Johannesburg, South Africa
PO Box 6, The Woodland, 2080, South Africa
+27 (11) 656 0380/1
+27 (11) 802 3654
www.epochresources.co.za
Epoch Resources (Pty) Ltd, No 2005/007908/07
GJ Wiid, G Papageorgiou, A Savvas, SJP Coetzee
Prof G Heyman
CERTIFICATE OF QUALIFIED PERSON
I, Guy John Wiid Pr.Eng do hereby certify that:
1. I am a practising Professional Engineer and a Director of:
Epoch Resources (Pty) Ltd
Building 22A, The Woodlands Office Park
Woodlands Drive, Woodmead
Gauteng, South Africa, 2080
2. This certificate applies to the technical report “Mkango Resources Limited; Songwe REE Project, Malawi – NI 43-101 Pre-
feasibility Report”, that has an effective date of 19 September 2014 and a report date of 06 November 2014 (the Technical
Report).
3. I graduated with a B.Sc Degree in Civil Engineering from the University of the Witwatersrand in 1988. In addition, I have also
obtained an M.Sc Degree in Civil Engineering from the University of the Witwatersrand in 1995.
4. I am a Registered as a Professional Engineer with the Engineering Council of South Africa (ECSA) (Registration No. 940269). I
am also a Member of the American Society of Civil Engineers (Membership No. 9945778).
5. I have worked as a Civil Engineer for a total of 24 years, during which time I have worked in the fields of Mine Waste
Management, Mine Closure Planning and Environmental Management.
6. I have read the definition of “qualified person” set out in National Instrument 43-101 (NI 43-101) and certify that by reason of
my education, affiliation with a professional association (as defined in NI 43-101) and past relevant work experience, I fulfil the
requirements to be a “qualified person” for the purposes of NI 43-101.
7. The project site was visited on my behalf by Dr George Papageorgiou on the 18th
to the 20th
of May 2014.
8. I am responsible for, or co-responsible for, the preparation of sections 1, 18, 21, 22, 25 and 26 of the Technical Report.
9. I have not had prior involvement with the property that is the subject of the Technical Report.
10. At the effective date of the Technical Report, to the best of my knowledge, information and belief, the sections for which I am
responsible in the Technical Report contain all scientific and technical information that is required to be disclosed to make the
Technical Report not misleading.
11. I am independent of the issuer according to the definition of independence described in section 1.5 of National Instrument
43-101.
12. I have read National Instrument 43-101 and Form 43-101F1 and, as of the date of this certificate, to the best of my knowledge,
information and belief, those portions of the Technical Report for which I am responsible have been prepared in compliance
with that instrument and form.
13. I consent to the filing of the Technical Report with any stock exchange and other regulatory authority and any publication by
them for regulatory purposes, including electronic publication in the public company files on their websites accessible by the
public, of the Technical Report.
Dated this 6th
Day of November, 2014.
“signed and stamped”
GJ Wiid
Pr.Eng

Digby Wells and Associates (South Africa) (Pty) Ltd (Subsidiary of Digby Wells & Associates (Pty) Ltd). Co. Reg. No. 2010/008577/07. Fern Isle, Section 10, 359 Pretoria Ave Randburg Private Bag X10046, Randburg, 2125, South Africa
Tel: +27 11 789 9495, Fax: +27 11 789 9498, [email protected], www.digbywells.com
________________________________________________ Directors: A Sing*, AR Wilke, LF Koeslag, PD Tanner (British)*, AJ Reynolds (Chairman) (British)*, J Leaver*, GE Trusler (C.E.O)
*Non-Executive _________________________________________________
CERTIFICATE OF QUALIFIED PERSON
I, Graham Errol Trusler, P.Eng., do hereby certify that:
1. I am the CEO of:
Digby Wells & Associates (Pty) Ltd
Fern Isle
359 Pretoria Avenue
Randburg, Gauteng, South Africa,
2125
2. This certificate applies to the technical report titled “Mkango Resources Limited: Songwe REE Project, Malawi - NI 43-101 Pre-
feasibility Report”, that has an effective date of 19 September 2014 and a report date of 19 September 2014 (the Technical
Report).
3. I graduated with a degree in B.Sc (Chem.Eng.) from the University of Natal in 1986. In addition, I have obtained a M.Sc. (Eng.),
from the University of Natal in 1988 and a Batchelor of Commerce from the University of South Africa in 1993.
4. I am a Registered Professional Engineer with the Engineering Council of SA (Reg.No. 920088).
5. I have worked as an environmental consultant for a total of 23 years, during which time I have completed numerous specialist
investigations as well as managed the environmental aspects of brownfields and greenfields projects and get environmental
approvals for them. Countries in which these have been completed include South Africa, Mali, Zambia, Tanzania, Mozambique,
Sierra Leone, Zimbabwe, Botswana, China, Russia, Kosova, Peru and Indonesia. These projects have been in the industrial,
mining, metallurgical and water sectors.
6. I have read the definition of “qualified person” set out in National Instrument 43-101 (NI 43-101) and certify that by reason of
my education, affiliation with a professional association (as defined in NI 43-101) and past relevant work experience, I fulfil the
requirements to be a “qualified person” for the purposes of NI 43-101.
7. I visited the Songwe property on 20 June 2012 for 2 days.
8. I am responsible for, or co-responsible for, the preparation of section 4.3, 5.2, 20, 21, 22, and 24 to 26 of the Technical Report.
9. I have not had prior involvement with the property that is the subject of the Technical Report.
10. At the effective date of the Technical Report, to the best of my knowledge, information and belief, the sections for which I am
responsible in the Technical Report contain all scientific and technical information that is required to be disclosed to make the
Technical Report not misleading.
11. I am independent of the issuer according to the definition of independence described in section 1.5 of National Instrument
43-101.
12. I have read National Instrument 43-101 and Form 43-101F1 and, as of the date of this certificate, to the best of my knowledge,
information and belief, those portions of the Technical Report for which I am responsible have been prepared in compliance
with that instrument and form.
13. I consent to the filing of the Technical Report with any stock exchange and other regulatory authority and any publication by
them for regulatory purposes, including electronic publication in the public company files on their websites accessible by the
public, of the Technical Report.
Dated this 6th Day of November, 2014.
“signed and stamped”
Graham Errol Trusler
(P.Eng Reg.No. 920088)

J2897 Mkango Songwe Hill PFS November 2014 Page: 358
APPENDIX 3:
QA/QC Summaries

J2897 Mkango Songwe Hill PFS November 2014 Page: 359
Performance of selected light rare earth elements in 407 Blank samples:
BLANK : Lanthanum
0
50
100
150
200
250
La p
pm
BLANK : Cerium
0
100
200
300
400
500
Ce
ppm
BLANK : Neodymium
0
30
60
90
120
150
Nd
ppm
Phase 1 Phase 2

J2897 Mkango Songwe Hill PFS November 2014 Page: 360
Performance of selected heavy rare earth elements in 407 Blank samples:
BLANK : Gadolinium
0
3
6
9
12
15
Gd
ppm
BLANK : Terbium
0.0
0.5
1.0
1.5
2.0
2.5
Tb p
pm
BLANK : Yttrium
0
10
20
30
40
50
Y p
pm

J2897 Mkango Songwe Hill PFS November 2014 Page: 361
Accuracy of selected light rare earth elements in 242 samples of CRM AMIS185:
24000
28000
32000
36000
La p
pm
La -2SD La +2SD La Certified Value La
450
500
550
600
650
Sm p
pm
Sm -2SD Sm +2SD Sm Certified Value Sm
7000
8000
9000
10000
11000
12000
Nd
pp
m
Nd -2SD Nd +2SD Nd Certified Value Nd
Phase 2 Phase 1

J2897 Mkango Songwe Hill PFS November 2014 Page: 362
Accuracy of selected heavy rare earth elements in 242 samples of CRM AMIS185:
70
80
90
100
110
120
Eu p
pm
Eu -2SD Eu +2SD Eu Certified Value Eu
15
20
25
30
35
40
Dy
pp
m
Dy -2SD Dy +2SD Dy Certified Value Dy
40
50
60
70
80
Y p
pm
Y -2SD Y +2SD Y Certified Value Y

J2897 Mkango Songwe Hill PFS November 2014 Page: 363
Accuracy of selected light and heavy rare earth elements in 149 samples of CRM GRE-04:
5400
5800
6200
6600
Ce
pp
m
Ce -2SD Ce +2SD Ce Certified Value Ce
60
80
100
120
140
Eu p
pm
Eu -2SD Eu +2SD Eu Certified Value Eu
200
250
300
350
400
Y p
pm
Y -2SD Y +2SD Y Certified Value Eu

J2897 Mkango Songwe Hill PFS November 2014 Page: 364
Repeatability of selected light and heavy rare earth elements in 297 duplicate sample pairs
0
4000
8000
12000
16000
20000
0 4000 8000 12000 16000 20000Original: La ppm
Du
plic
ate
: La
pp
m
La 1:1 +20% -20%
y = 0.9934x
R2 = 0.9973
0
6000
12000
18000
24000
30000
0 6000 12000 18000 24000 30000Original: Ce ppm
Du
plic
ate
: Ce
pp
m
Ce 1:1 +20% -20%
y = 0.9965x
R2 = 0.9972
0
1000
2000
3000
4000
5000
6000
0 1000 2000 3000 4000 5000 6000Original: Nd ppm
Du
plic
ate
: Nd
pp
m
Nd 1:1 +20% -20%
y = 0.9973x
R2 = 0.9953
0
500
1000
1500
2000
2500
0 500 1000 1500 2000 2500Original: Y ppm
Du
plic
ate
: Y p
pm
Y 1:1 +20% -20%
y = 0.9956x
R2 = 0.9960

J2897 Mkango Songwe Hill PFS November 2014 Page: 365
Repeatability of selected light and heavy rare earth elements in 405 umpire laboratory sample pairs
0
4000
8000
12000
16000
20000
0 4000 8000 12000 16000 20000Primary Lab: La ppm
Um
pir
e L
ab: L
a p
pm
La 1:1 +20% -20%
y = 1.0072x
R2 = 0.9917
0
5000
10000
15000
20000
25000
0 5000 10000 15000 20000 25000Primary Lab: Ce ppm
Um
pir
e L
ab: C
e p
pm
Ce 1:1 +20% -20%
y =1.0025x
R2 = 0.9887
0
50
100
150
200
250
0 50 100 150 200 250Original: Eu ppm
Du
plic
ate
: Eu
pp
m
Eu 1:1 +20% -20%
y = 1.0021x
R2 = 0.9957
0
70
140
210
280
350
0 70 140 210 280 350Original: Dy ppm
Du
plic
ate
: Dy
pp
m
Dy 1:1 +20% -20%
y = 0.9993x
R2 = 0.9966

J2897 Mkango Songwe Hill PFS November 2014 Page: 366
APPENDIX 4:
Domain Histograms
Boreholes vs Channel Samples

J2897 Mkango Songwe Hill PFS November 2014 Page: 367
Carbonatite: Borehole samples
Log Histogram for HREO ppmDomain Carbonatite
HREO ppm
Weig
hted
Freq
uen
cy (%
of 4
33
4.8
9)
100 10000.00
0.75
1.50
2.25
3.00
3.75
4.50
5.25
6.00
6.75
7.50
8.25
9.00
9.75
25 50 75
Points:Weights:
Mean:Std Dev:Variance:
CV:
Maximum:75%:50%:25%:
Minimum:
43354334.89 (weighted)1006.892616.586380178.8890.612
5730.781309.068902.604575.04472.4687
Log Histogram for LREODomain Carbonatite
LREO
Weig
hted
Freq
uen
cy (%
of 4
20
6.9
)
1 10 100 1000 100000
2
4
6
8
10
12
14
16
18
25 50 75
Points:Weights:
Mean:Std Dev:Variance:
CV:
Maximum:75%:50%:25%:
Minimum:
42074206.9 (weighted)9408.9318352.89469770838.2860.888
63043.813436.2487767.0543379.8371
Log Histogram for TREO ppmDomain Carbonatite
TREO ppm
Weig
hted
Freq
uen
cy (%
of 3
51
5.9
3)
1000 100000
1
2
3
4
5
6
7
8
9
10
11
25 50 75
Points:Weights:
Mean:Std Dev:Variance:
CV:
Maximum:75%:50%:25%:
Minimum:
35163515.93 (weighted)11847.1778133.90266160356.0550.687
78244.915771.21810604.1106154.888614.871
Log Histogram for Th_ppmDomain Carbonatite
Th_ppm
Weig
hted
Freq
uen
cy (%
of 8
10
.96
2)
100 10000.0
2.5
5.0
7.5
10.0
12.5
25 50 75
Points:Weights:
Mean:Std Dev:Variance:
CV:
Maximum:75%:50%:25%:
Minimum:
811810.962 (weighted)315.216173.83830219.4890.551
1286402.500283.000190.50013.6
Log Histogram for U_ppmDomain Carbonatite
U_ppm
Weig
hted
Freq
uen
cy (%
of 4
33
4.8
9)
1 10 1000.0
2.5
5.0
7.5
10.0
12.5
25 50 75
Points:Weights:
Mean:Std Dev:Variance:
CV:
Maximum:75%:50%:25%:
Minimum:
43354334.89 (weighted)12.6577.92962.8670.626
118.70815.84811.0007.6400.4
Histogram for DENSITYDomain Carbonatite
DENSITY
Weig
hted
Freq
uen
cy (%
of 3
83
5.8
9)
2.00 2.25 2.50 2.75 3.00 3.25 3.50 3.75 4.00 4.25 4.50 4.750
2
4
6
8
10
12
14
16
18
20
25 50 75
Points:Weights:
Mean:Std Dev:Variance:
CV:
Maximum:75%:50%:25%:
Minimum:
38363835.89 (weighted)2.7940.2420.0590.087
4.93842.9192.7762.6351.8236

J2897 Mkango Songwe Hill PFS November 2014 Page: 368
Carbonatite: Channel samples
Log Histogram for HREO ppmDomain Carbonatite Channel
HREO ppm
Weighted Frequency (%
of 266)
10000.0
2.5
5.0
7.5
10.0
12.5
25 50 75
Points:Weights:
Mean:Std Dev:Variance:
CV:
Maximum:75%:50%:25%:
Minimum:
266266 (weighted)1406.786629.379396118.3730.447
42661744.0001332.000948.000261
Log Histogram for TREO ppmDomain Carbonatite Channel
TREO ppm
Weig
hted
Freq
uen
cy (%
of 2
66
)
100000
2
4
6
8
10
12
14
16
18
25 50 75
Points:Weights:
Mean:Std Dev:Variance:
CV:
Maximum:75%:50%:25%:
Minimum:
266266 (weighted)16059.4648694.31175591044.7500.541
6367818942.00014948.00011298.0001900
Log Histogram for Th ppmDomain Carbonatite Channel
Th ppm
Weigh
ted Frequency (% of 266)
100 10000.0
2.5
5.0
7.5
10.0
12.5
25 50 75
Points:Weights:
Mean:Std Dev:Variance:
CV:
Maximum:75%:50%:25%:
Minimum:
266266 (weighted)403.948180.78232682.0170.448
1207.5496.800362.600275.60073.7
Log Histogram for U ppmDomain Carbonatite Channel
U ppm
Weighted Frequency (%
of 266)
100.0
2.5
5.0
7.5
10.0
12.5
25 50 75
Points:Weights:
Mean:Std Dev:Variance:
CV:
Maximum:75%:50%:25%:
Minimum:
266266 (weighted)11.2446.05436.6540.538
38.213.30010.1007.3001.7

J2897 Mkango Songwe Hill PFS November 2014 Page: 369
Fenite: Boreholes samples
Log Histogram for HREODomain Fenite
HREO
Weigh
ted Frequency (% of 1727.44)
100 10000
1
2
3
4
5
6
7
8
9
10
11
25 50 75
Points:Weights:
Mean:Std Dev:Variance:
CV:
Maximum:75%:50%:25%:
Minimum:
17281727.44 (weighted)703.079469.911220816.3310.668
5670.81914.802601.389371.11854.3726
Log Histogram for LREODomain Fenite
LREO
Weig
hted
Freq
uen
cy (%
of 1
69
0.4
8)
1 10 100 1000 100000
2
4
6
8
10
12
14
25 50 75
Points:Weights:
Mean:Std Dev:Variance:
CV:
Maximum:75%:50%:25%:
Minimum:
16911690.48 (weighted)5567.6565674.80832203448.6371.019
59999.67696.3783821.6441904.7251
Log Histogram for TREO ppmDomain Fenite
TREO ppm
Weig
hted
Freq
uen
cy (%
of 1
72
7.4
4)
1000 100000.00
0.75
1.50
2.25
3.00
3.75
4.50
5.25
6.00
6.75
7.50
8.25
9.00
25 50 75
Points:Weights:
Mean:Std Dev:Variance:
CV:
Maximum:75%:50%:25%:
Minimum:
17281727.44 (weighted)7349.6076348.30040300907.1540.864
616909833.9415556.1182837.664322.533
Log Histogram for Th_ppmDomain Fenite
Th_ppm
Weighted Frequency (%
of 1727.44)
100 10000
2
4
6
8
10
12
14
16
25 50 75
Points:Weights:
Mean:Std Dev:Variance:
CV:
Maximum:75%:50%:25%:
Minimum:
17281727.44 (weighted)235.742184.82334159.5340.784
2967.4283.920207.900137.93910.7
Log Histogram for U_ppmDomain Fenite
U_ppm
Weig
hted
Freq
uen
cy (%
of 1
72
7.4
4)
1 10 1000
1
2
3
4
5
6
7
8
9
10
11
12
25 50 75
Points:Weights:
Mean:Std Dev:Variance:
CV:
Maximum:75%:50%:25%:
Minimum:
17281727.44 (weighted)15.21210.364107.4130.681
103.719.80012.8088.2740.56
Histogram for DENSITYDomain Fenite
DENSITY
Weig
hted
Freq
uen
cy (%
of 1
45
5.6
8)
2.2 2.4 2.6 2.8 3.0 3.2 3.4 3.6 3.8 4.00
2
4
6
8
10
12
14
16
25 50 75
Points:Weights:
Mean:Std Dev:Variance:
CV:
Maximum:75%:50%:25%:
Minimum:
14561455.68 (weighted)2.7560.2130.0450.077
4.02292.8572.7362.6192.0136

J2897 Mkango Songwe Hill PFS November 2014 Page: 370
Fenite: Channel samples
Log Histogram for HREO_PCTDomain Fenite Channel
HREO_PCT
Weig
hted
Freq
uen
cy (%
of 8
4)
0.10.0
2.5
5.0
7.5
10.0
12.5
15.0
25 50 75
Points:Weights:
Mean:Std Dev:Variance:
CV:
Maximum:75%:50%:25%:
Minimum:
8484 (weighted)0.0900.0490.0020.543
0.2550.1130.0730.0570.025
Log Histogram for HREO ppmDomain Fenite Channel
HREO ppmW
eigh
ted F
requ
ency
(% o
f 84
)1000
0
1
2
3
4
5
6
7
8
9
10
11
12
13
25 50 75
Points:Weights:
Mean:Std Dev:Variance:
CV:
Maximum:75%:50%:25%:
Minimum:
8484 (weighted)895.486486.181236371.7700.543
25561133.000732.000572.000249
Log Histogram for TREO ppmDomain Fenite Channel
TREO ppm
Weig
hted
Freq
uen
cy (%
of 8
4)
100000.0
2.5
5.0
7.5
10.0
12.5
15.0
25 50 75
Points:Weights:
Mean:Std Dev:Variance:
CV:
Maximum:75%:50%:25%:
Minimum:
8484 (weighted)12606.00210678.242114024842.4810.847
5793113855.00010021.0005338.0001728
Log Histogram for Th ppmDomain Fenite Channel
Th ppm
Weig
hted
Freq
uen
cy (%
of 8
4)
100 10000
2
4
6
8
10
12
14
25 50 75
Points:Weights:
Mean:Std Dev:Variance:
CV:
Maximum:75%:50%:25%:
Minimum:
8484 (weighted)328.855181.54932959.8900.552
1118.3440.500271.700186.50087.6
Log Histogram for U ppmDomain Fenite Channel
U ppm
Weig
hted
Freq
uen
cy (%
of 8
4)
100.0
2.5
5.0
7.5
10.0
12.5
15.0
25 50 75
Points:Weights:
Mean:Std Dev:Variance:
CV:
Maximum:75%:50%:25%:
Minimum:
8484 (weighted)12.9866.63343.9910.511
3015.60012.3007.6002.5

J2897 Mkango Songwe Hill PFS November 2014 Page: 371
Mixed: Borehole samples
Log Histogram for HREODomain Mixed
HREO
Weig
hted
Freq
uen
cy (%
of 4
38
.99
4)
10000
1
2
3
4
5
6
7
8
9
10
11
12
13
25 50 75
Points:Weights:
Mean:Std Dev:Variance:
CV:
Maximum:75%:50%:25%:
Minimum:
439438.994 (weighted)679.277351.146123303.4270.517
2347.91790.011611.573458.085161.437
Log Histogram for LREODomain Mixed
LREOW
eigh
ted F
requ
ency
(% o
f 43
8.9
94
)1000 10000
0.0
2.5
5.0
7.5
10.0
25 50 75
Points:Weights:
Mean:Std Dev:Variance:
CV:
Maximum:75%:50%:25%:
Minimum:
439438.994 (weighted)10168.1457309.21953424681.6570.719
47705.713646.1078610.7534697.775768.037
Log Histogram for TREO ppmDomain Mixed
TREO ppm
Weig
hted
Freq
uen
cy (%
of 4
38
.99
4)
100000
1
2
3
4
5
6
7
8
9
10
11
25 50 75
Points:Weights:
Mean:Std Dev:Variance:
CV:
Maximum:75%:50%:25%:
Minimum:
439438.994 (weighted)10847.4227464.99755726175.8020.688
48758.414389.4479356.8685310.7751066.4
Log Histogram for Th_ppmDomain Mixed
Th_ppm
Weighted Frequency (%
of 438.994)
1000.00
0.75
1.50
2.25
3.00
3.75
4.50
5.25
6.00
6.75
7.50
8.25
9.00
25 50 75
Points:Weights:
Mean:Std Dev:Variance:
CV:
Maximum:75%:50%:25%:
Minimum:
439438.994 (weighted)300.906172.70429826.8050.574
899.184422.918258.100160.10045.6
Log Histogram for U_ppmDomain Mixed
U_ppm
Weig
hted
Freq
uen
cy (%
of 4
38
.99
4)
100
2
4
6
8
10
12
14
25 50 75
Points:Weights:
Mean:Std Dev:Variance:
CV:
Maximum:75%:50%:25%:
Minimum:
439438.994 (weighted)11.7445.86234.3630.499
40.314.26410.5617.6001.4
Histogram for DENSITYDomain Mixed
DENSITY
Weig
hted
Freq
uen
cy (%
of 3
95
.09
3)
2.25 2.50 2.75 3.00 3.250.0
2.5
5.0
7.5
10.0
12.5
15.0
25 50 75
Points:Weights:
Mean:Std Dev:Variance:
CV:
Maximum:75%:50%:25%:
Minimum:
395395.093 (weighted)2.7700.2160.0470.078
3.492.9042.7572.6472.0829
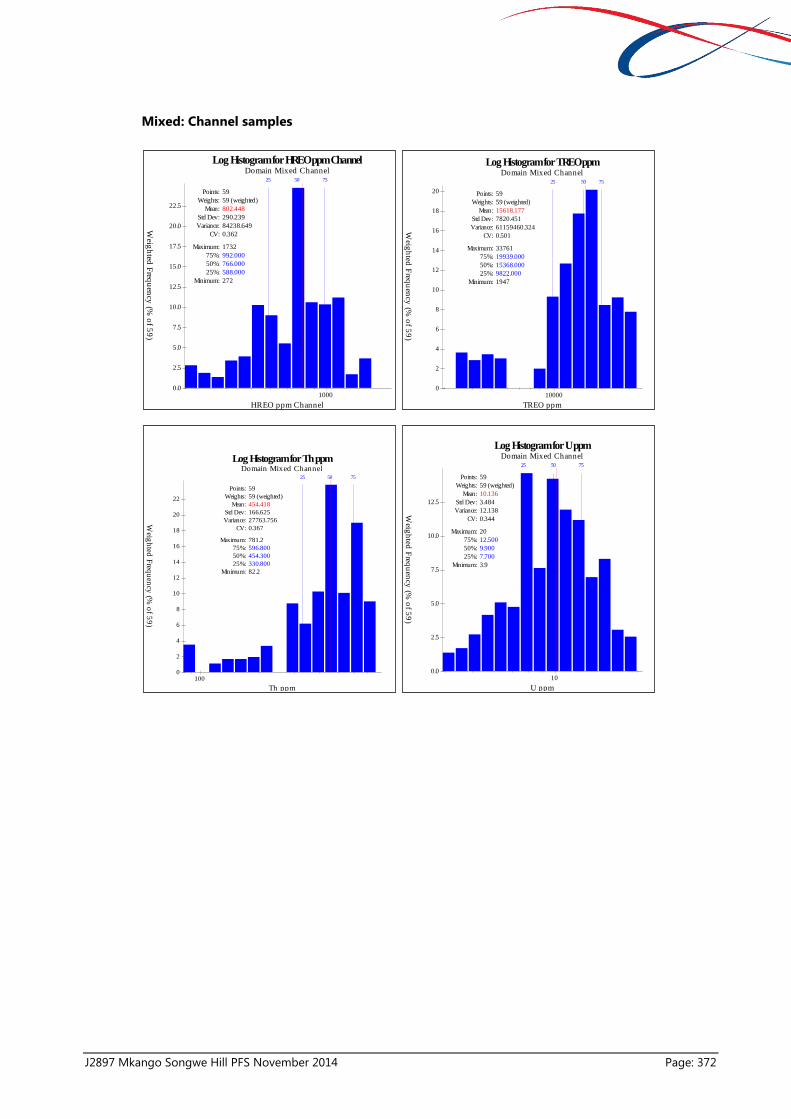
J2897 Mkango Songwe Hill PFS November 2014 Page: 372
Mixed: Channel samples
Log Histogram for HREO ppm ChannelDomain Mixed Channel
HREO ppm Channel
Weig
hted
Freq
uen
cy (%
of 5
9)
10000.0
2.5
5.0
7.5
10.0
12.5
15.0
17.5
20.0
22.5
25 50 75
Points:Weights:
Mean:Std Dev:Variance:
CV:
Maximum:75%:50%:25%:
Minimum:
5959 (weighted)802.448290.23984238.6490.362
1732992.000766.000588.000272
Log Histogram for TREO ppmDomain Mixed Channel
TREO ppm
Weig
hted
Freq
uen
cy (%
of 5
9)
100000
2
4
6
8
10
12
14
16
18
20
25 50 75
Points:Weights:
Mean:Std Dev:Variance:
CV:
Maximum:75%:50%:25%:
Minimum:
5959 (weighted)15618.1777820.45161159460.3240.501
3376119939.00015368.0009822.0001947
Log Histogram for Th ppmDomain Mixed Channel
Th ppm
Weighted Frequency (%
of 59)
1000
2
4
6
8
10
12
14
16
18
20
22
25 50 75
Points:Weights:
Mean:Std Dev:Variance:
CV:
Maximum:75%:50%:25%:
Minimum:
5959 (weighted)454.418166.62527763.7560.367
781.2596.800454.300330.80082.2
Log Histogram for U ppmDomain Mixed Channel
U ppm
Weig
hted
Freq
uen
cy (%
of 5
9)
100.0
2.5
5.0
7.5
10.0
12.5
25 50 75
Points:Weights:
Mean:Std Dev:Variance:
CV:
Maximum:75%:50%:25%:
Minimum:
5959 (weighted)10.1363.48412.1380.344
2012.5009.9007.7003.9

J2897 Mkango Songwe Hill PFS November 2014 Page: 373
APPENDIX 5:
Variograms of 3 Domains

J2897 Mkango Songwe Hill PFS November 2014 Page: 374
Carbonatite Domain
Omni-Directional for HREO ppmDomain Carbonatite
Sample Separation (m)
Gam
ma (3
80
17
8.8
89
)
Pair C
ou
nts
0.0 7.5 15.0 22.5 30.0 37.5 45.0 52.5 60.0 67.5 75.0 82.5 90.0 97.50.0
0.1
0.2
0.3
0.4
0.5
0.6
0.7
0.8
0.9
1.0
0
50000
100000
150000
200000
250000
300000
350000
400000
450000
500000
550000
N( 0.41 )
Sph( 0.59, 35.5 )
Lag15
Omni-Directional for Carbonatite TREO ppmDomain Carbonatite
Sample Separation (m)G
amm
a (66
16
03
56
.05
5)
Pair C
ou
nts
0.0 7.5 15.0 22.5 30.0 37.5 45.0 52.5 60.0 67.5 75.0 82.5 90.0 97.50.0
0.1
0.2
0.3
0.4
0.5
0.6
0.7
0.8
0.9
1.0
1.1
0
25000
50000
75000
100000
125000
150000
175000
200000
225000
250000
N( 0.42 )
Sph( 0.58, 29 )
Lag12
Omni-Directional for Th_ppmDomain Carbonatite
Sample Separation (m)
Gam
ma (3
02
19
.48
9)
Pair C
ou
nts
0 20 40 60 80 100 120 140 160 180 2000.0
0.1
0.2
0.3
0.4
0.5
0.6
0.7
0.8
0.9
1.0
1.1
1.2
1.3
0
2000
4000
6000
8000
10000
12000
14000
16000
18000
N( 0.38 )
Sph( 0.62, 30 )
Lag12
Omni-directional for U_ppmDomain Carbonatite
Sample Separation (m)
Gam
ma (6
2.8
67
)
Pair C
ou
nts
0.0 7.5 15.0 22.5 30.0 37.5 45.0 52.5 60.0 67.5 75.00.000
0.075
0.150
0.225
0.300
0.375
0.450
0.525
0.600
0.675
0.750
0.825
0.900
0.975
0
25000
50000
75000
100000
125000
150000
175000
200000
225000
250000
N( 0.33 )
Sph( 0.38, 9 )
Sph( 0.29, 53.5 )Lag9.0
Omni-directional for DENSITYDomain Carbonatite
Sample Separation (m)
Gam
ma (0
.05
9)
Pair C
ou
nts
0.0 7.5 15.0 22.5 30.0 37.5 45.0 52.5 60.0 67.5 75.00.000
0.075
0.150
0.225
0.300
0.375
0.450
0.525
0.600
0.675
0.750
0.825
0.900
0.975
0
2000
4000
6000
8000
10000
12000
14000
16000
18000
N( 0.3 )
Sph( 0.25, 9 )
Sph( 0.46, 73.5 )Lag5.0

J2897 Mkango Songwe Hill PFS November 2014 Page: 375
Fenite Domain
Omni-directional for HREO ppmDomain Fenite
Sample Separation (m)
Gam
ma (2
20
81
6.3
31
)
Pair C
ou
nts
0.0 7.5 15.0 22.5 30.0 37.5 45.0 52.5 60.0 67.5 75.00.00
0.25
0.50
0.75
1.00
1.25
1.50
0
2000
4000
6000
8000
10000
12000
14000
16000
18000
20000
22000
N( 0.11 )
Sph( 0.57, 10 )
Sph( 0.32, 52 )
Lag4.0
Omni-directional for Fenite TREO ppmDomain Fenite
Sample Separation (m)
Gam
ma (4
03
00
90
7.1
54
)
Pair C
ou
nts
0.0 7.5 15.0 22.5 30.0 37.5 45.0 52.5 60.0 67.5 75.00.000
0.075
0.150
0.225
0.300
0.375
0.450
0.525
0.600
0.675
0.750
0.825
0.900
0.975
0
750
1500
2250
3000
3750
4500
5250
6000
6750
7500
8250
9000
9750
N( 0.23 )
Sph( 0.77, 23.5 ) Lag7.0
Omni-directional for Th_ppmDomain Fenite
Sample Separation (m)
Gam
ma (3
41
59
.53
4)
Pair C
ou
nts
0.0 2.5 5.0 7.5 10.0 12.5 15.0 17.5 20.0 22.5 25.0 27.5 30.00.0
0.1
0.2
0.3
0.4
0.5
0.6
0.7
0.8
0.9
1.0
1.1
1.2
0
500
1000
1500
2000
2500
3000
3500
4000
4500
5000
5500
N( 0.08 )
Sph( 0.92, 7.5 )
Lag3.0
Omni-directional for U_ppmDomain Fenite
Sample Separation (m)
Gam
ma (1
07
.41
3)
Pair C
ou
nts
0.0 7.5 15.0 22.5 30.0 37.5 45.0 52.5 60.0 67.5 75.00.000
0.075
0.150
0.225
0.300
0.375
0.450
0.525
0.600
0.675
0.750
0.825
0.900
0.975
0
750
1500
2250
3000
3750
4500
5250
6000
6750
7500
8250
N( 0.21 )
Sph( 0.79, 24 ) Lag6.0
Omni-directional for DENSITYDomain Fenite
Sample Separation (m)
Gam
ma (0
.04
5)
Pair C
ou
nts
0.0 7.5 15.0 22.5 30.0 37.5 45.0 52.5 60.0 67.5 75.00.000
0.075
0.150
0.225
0.300
0.375
0.450
0.525
0.600
0.675
0.750
0.825
0.900
0.975
0
750
1500
2250
3000
3750
4500
5250
6000
6750
7500
8250
9000
9750
N( 0.29 )
Sph( 0.71, 34 ) Lag10

J2897 Mkango Songwe Hill PFS November 2014 Page: 376
Mixed Domain
Omni-directional for HREODomain Mixed
Sample Separation (m)
Gam
ma (1
23
30
3.4
27
)
Pair C
ou
nts
0 5 10 15 20 25 30 35 40 45 500.0
0.1
0.2
0.3
0.4
0.5
0.6
0.7
0.8
0.9
1.0
1.1
1.2
0
250
500
750
1000
1250
1500
N( 0.1 )
Sph( 0.77, 6 )
Sph( 0.13, 33 )
Lag2.0
Omni-directional for TREO ppmDomain Mixed
Sample Separation (m)
Gam
ma (5
57
26
17
5.8
02
)
Pair C
ou
nts
0.0 7.5 15.0 22.5 30.0 37.5 45.0 52.5 60.0 67.5 75.00.0
0.1
0.2
0.3
0.4
0.5
0.6
0.7
0.8
0.9
1.0
1.1
0
750
1500
2250
3000
3750
4500
5250
6000
6750
7500
8250
N( 0.36 )
Sph( 0.27, 11 )
Sph( 0.37, 26 )
Lag8.0
Omni-Directional for Th_ppmDomain Mixed
Sample Separation (m)
Gam
ma (2
98
26
.80
5)
Pair C
ou
nts
0.0 7.5 15.0 22.5 30.0 37.5 45.0 52.5 60.0 67.5 75.00.0
0.1
0.2
0.3
0.4
0.5
0.6
0.7
0.8
0.9
1.0
1.1
1.2
1.3
0
1000
2000
3000
4000
5000
6000
7000
8000
9000
10000
11000
N( 0.21 )
Sph( 0.79, 20.5 )
Lag10
Omni-Directional for U_ppmDomain Mixed
Sample Separation (m)
Gam
ma (3
4.3
63
)
Pair C
ou
nts
0.0 7.5 15.0 22.5 30.0 37.5 45.0 52.5 60.0 67.5 75.00.000
0.075
0.150
0.225
0.300
0.375
0.450
0.525
0.600
0.675
0.750
0.825
0.900
0.975
0
200
400
600
800
1000
1200
1400
1600
1800
2000
N( 0.32 )
Sph( 0.18, 6.5 )
Sph( 0.5, 34 ) Lag5.0
Omni-directional for DENSITYDomain Mixed
Sample Separation (m)
Gam
ma (0
.04
7)
Pair C
ou
nts
0.0 7.5 15.0 22.5 30.0 37.5 45.0 52.5 60.0 67.5 75.00.0
0.1
0.2
0.3
0.4
0.5
0.6
0.7
0.8
0.9
1.0
1.1
1.2
0
250
500
750
1000
1250
1500
N( 0.3 )
Sph( 0.29, 6 )
Sph( 0.41, 25 )
Lag5.0

J2897 Mkango Songwe Hill PFS November 2014 Page: 377
APPENDIX 6:
Individual REO Concentrations

J2897 Mkango Songwe Hill PFS November 2014 Page: 378
REO Concentrations by Domain
In-situ Indicated Carbonatite Mineral Resource
Cut-Off Tonnes La2O3 Ce2O3 Pr2O3 Nd2O3 Sm2O3 LREO Eu2O3 Gd2O3 Tb2O3 Dy2O3 Ho2O3 Er2O3 Tm2O3 Yb2O3 Lu2O3 Y2O3 HREO TREO Th U
%TREO Million % % % % % % % % % % % % % % % % % % ppm ppm
0.5 16.31 0.3274 0.5973 0.0642 0.2217 0.0321 1.2426 0.0085 0.0200 0.0024 0.0114 0.0018 0.0044 0.0006 0.0032 0.0004 0.0530 0.1058 1.3484 322 12
1 11.10 0.3951 0.7208 0.0775 0.2676 0.0387 1.4997 0.0095 0.0223 0.0027 0.0127 0.0021 0.0048 0.0006 0.0036 0.0005 0.0590 0.1178 1.6175 351 12
1.5 5.26 0.5022 0.9163 0.0985 0.3401 0.0492 1.9063 0.0103 0.0241 0.0029 0.0137 0.0022 0.0052 0.0007 0.0039 0.0005 0.0639 0.1275 2.0338 385 12
2 1.85 0.6582 1.2008 0.1291 0.4457 0.0645 2.4982 0.0104 0.0244 0.0029 0.0138 0.0022 0.0053 0.0007 0.0039 0.0005 0.0645 0.1286 2.6269 429 12
In-situ Inferred Carbonatite Mineral Resource
Cut-Off Tonnes La2O3 Ce2O3 Pr2O3 Nd2O3 Sm2O3 LREO Eu2O3 Gd2O3 Tb2O3 Dy2O3 Ho2O3 Er2O3 Tm2O3 Yb2O3 Lu2O3 Y2O3 HREO TREO Th U
%TREO Million % % % % % % % % % % % % % % % % % % ppm ppm
0.5 17.09 0.2568 0.4686 0.0504 0.1739 0.0252 0.9748 0.0077 0.0180 0.0022 0.0102 0.0017 0.0039 0.0005 0.0029 0.0004 0.0476 0.0949 1.0698 304 12
1 8.64 0.3275 0.5974 0.0642 0.2218 0.0321 1.2430 0.0090 0.0211 0.0025 0.0120 0.0019 0.0046 0.0006 0.0034 0.0005 0.0559 0.1115 1.3545 324 11
1.5 1.90 0.4539 0.8281 0.0890 0.3074 0.0445 1.7228 0.0099 0.0233 0.0028 0.0132 0.0021 0.0051 0.0006 0.0037 0.0005 0.0616 0.1230 1.8458 349 11
2 0.39 0.6280 1.1457 0.1232 0.4253 0.0615 2.3837 0.0096 0.0224 0.0027 0.0127 0.0021 0.0049 0.0006 0.0036 0.0005 0.0593 0.1183 2.5020 358 11
In-situ Indicated Mixed Mineral Resource
Cut-Off Tonnes La2O3 Ce2O3 Pr2O3 Nd2O3 Sm2O3 LREO Eu2O3 Gd2O3 Tb2O3 Dy2O3 Ho2O3 Er2O3 Tm2O3 Yb2O3 Lu2O3 Y2O3 HREO TREO Th U
%TREO Million % % % % % % % % % % % % % % % % % % ppm ppm
0.5 1.01 0.3749 0.6369 0.0642 0.2051 0.0278 1.3088 0.0061 0.0144 0.0017 0.0076 0.0012 0.0029 0.0004 0.0022 0.0003 0.0351 0.0717 1.3805 318 12
1 0.69 0.4520 0.7678 0.0774 0.2473 0.0335 1.5780 0.0063 0.0148 0.0017 0.0079 0.0013 0.0029 0.0004 0.0022 0.0003 0.0362 0.0739 1.6519 335 12
1.5 0.31 0.6051 1.0280 0.1037 0.3311 0.0448 2.1127 0.0069 0.0163 0.0019 0.0087 0.0014 0.0032 0.0004 0.0025 0.0003 0.0399 0.0816 2.1943 387 14
2 0.15 0.7440 1.2640 0.1275 0.4071 0.0551 2.5977 0.0069 0.0162 0.0019 0.0086 0.0014 0.0032 0.0004 0.0024 0.0003 0.0395 0.0808 2.6784 420 17

J2897 Mkango Songwe Hill PFS November 2014 Page: 379
REO Concentrations by Domain
In-situ Inferred Mixed Mineral Resource
Cut-Off Tonnes La2O3 Ce2O3 Pr2O3 Nd2O3 Sm2O3 LREO Eu2O3 Gd2O3 Tb2O3 Dy2O3 Ho2O3 Er2O3 Tm2O3 Yb2O3 Lu2O3 Y2O3 HREO TREO Th U
%TREO Million % % % % % % % % % % % % % % % % % % ppm ppm
0.5 1.90 0.4289 0.7287 0.0735 0.2347 0.0318 1.4976 0.0053 0.0125 0.0015 0.0066 0.0011 0.0025 0.0003 0.0019 0.0003 0.0305 0.0624 1.5600 251 11
1 1.68 0.4559 0.7746 0.0781 0.2495 0.0338 1.5918 0.0053 0.0125 0.0014 0.0066 0.0011 0.0025 0.0003 0.0019 0.0003 0.0304 0.0622 1.6541 248 11
1.5 1.43 0.4802 0.8158 0.0823 0.2628 0.0356 1.6766 0.0053 0.0124 0.0014 0.0066 0.0011 0.0025 0.0003 0.0019 0.0003 0.0302 0.0618 1.7384 243 11
2 0.11 0.6573 1.1167 0.1126 0.3597 0.0487 2.2950 0.0057 0.0134 0.0016 0.0071 0.0011 0.0027 0.0003 0.0020 0.0003 0.0327 0.0668 2.3618 255 11
In-situ Indicated Fenite Mineral Resource
Cut-Off Tonnes La2O3 Ce2O3 Pr2O3 Nd2O3 Sm2O3 LREO Eu2O3 Gd2O3 Tb2O3 Dy2O3 Ho2O3 Er2O3 Tm2O3 Yb2O3 Lu2O3 Y2O3 HREO TREO Th U
%TREO Million % % % % % % % % % % % % % % % % % % ppm ppm
0.5 2.71 0.2876 0.5228 0.0563 0.1936 0.0292 1.0895 0.0064 0.0158 0.0020 0.0098 0.0016 0.0039 0.0005 0.0027 0.0004 0.0459 0.0889 1.1784 288 13
1 1.37 0.3980 0.7235 0.0779 0.2679 0.0404 1.5077 0.0076 0.0186 0.0024 0.0116 0.0019 0.0046 0.0006 0.0032 0.0004 0.0542 0.1050 1.6127 301 11
1.5 0.59 0.5236 0.9517 0.1025 0.3524 0.0531 1.9833 0.0088 0.0217 0.0028 0.0135 0.0022 0.0053 0.0007 0.0038 0.0005 0.0633 0.1226 2.1060 334 10
2 0.24 0.6478 1.1774 0.1268 0.4360 0.0657 2.4538 0.0101 0.0248 0.0032 0.0155 0.0025 0.0061 0.0008 0.0043 0.0006 0.0724 0.1402 2.5940 378 10
In-situ Inferred Fenite Mineral Resource
Cut-Off Tonnes La2O3 Ce2O3 Pr2O3 Nd2O3 Sm2O3 LREO Eu2O3 Gd2O3 Tb2O3 Dy2O3 Ho2O3 Er2O3 Tm2O3 Yb2O3 Lu2O3 Y2O3 HREO TREO Th U
%TREO Million % % % % % % % % % % % % % % % % % % ppm ppm
0.5 17.47 0.2564 0.4661 0.0502 0.1726 0.0260 0.9713 0.0062 0.0153 0.0019 0.0095 0.0016 0.0038 0.0005 0.0026 0.0004 0.0446 0.0863 1.0577 271 13
1 8.27 0.3286 0.5973 0.0643 0.2212 0.0333 1.2448 0.0073 0.0180 0.0023 0.0112 0.0018 0.0044 0.0005 0.0031 0.0004 0.0523 0.1014 1.3462 295 12
1.5 1.73 0.4631 0.8417 0.0907 0.3117 0.0470 1.7541 0.0088 0.0215 0.0027 0.0134 0.0022 0.0053 0.0007 0.0037 0.0005 0.0627 0.1215 1.8756 331 11
2 0.41 0.5998 1.0901 0.1174 0.4037 0.0608 2.2719 0.0099 0.0243 0.0031 0.0151 0.0025 0.0060 0.0007 0.0042 0.0006 0.0707 0.1370 2.4089 350 11

J2897 Mkango Songwe Hill PFS November 2014 Page: 380
APPENDIX 7:
Individual REO Distribution

J2897 Mkango Songwe Hill PFS November 2014 Page: 381
REO Distribution by Domain
In-situ Indicated Carbonatite Mineral Resource - REO Distributions at 0.5%, 1.0%, 1.5% and 2.0% TREO Cut-Offs
Cut-Off La2O3 Ce2O3 Pr2O3 Nd2O3 Sm2O3 Eu2O3 Gd2O3 Tb2O3 Dy2O3 Ho2O3 Er2O3 Tm2O3 Yb2O3 Lu2O3 Y2O3 Total
%TREO % % % % % % % % % % % % % % % %
0.5 24.28 44.29 4.76 16.44 2.38 0.63 1.49 0.18 0.84 0.14 0.32 0.04 0.24 0.03 3.93 100
1 24.43 44.56 4.79 16.54 2.39 0.59 1.38 0.17 0.78 0.13 0.30 0.04 0.22 0.03 3.65 100
1.5 24.69 45.05 4.84 16.72 2.42 0.51 1.19 0.14 0.67 0.11 0.26 0.03 0.19 0.03 3.14 100
2 25.06 45.71 4.91 16.97 2.45 0.40 0.93 0.11 0.53 0.09 0.20 0.03 0.15 0.02 2.45 100
In-situ Inferred Carbonatite Mineral Resource - REO Distributions at 0.5%, 1.0%, 1.5% and 2.0% TREO Cut-Offs
Cut-Off La2O3 Ce2O3 Pr2O3 Nd2O3 Sm2O3 Eu2O3 Gd2O3 Tb2O3 Dy2O3 Ho2O3 Er2O3 Tm2O3 Yb2O3 Lu2O3 Y2O3 Total
%TREO % % % % % % % % % % % % % % % %
0.5 24.01 43.80 4.71 16.26 2.35 0.72 1.68 0.20 0.95 0.15 0.37 0.05 0.27 0.04 4.45 100
1 24.18 44.11 4.74 16.37 2.37 0.67 1.56 0.19 0.89 0.14 0.34 0.04 0.25 0.03 4.12 100
1.5 24.59 44.86 4.82 16.65 2.41 0.54 1.26 0.15 0.72 0.12 0.27 0.04 0.20 0.03 3.34 100
2 25.10 45.79 4.92 17.00 2.46 0.38 0.90 0.11 0.51 0.08 0.19 0.02 0.14 0.02 2.37 100
In-situ Indicated Mixed Mineral Resource - REO Distributions at 0.5%, 1.0%, 1.5% and 2.0% TREO Cut-Offs
Cut-Off La2O3 Ce2O3 Pr2O3 Nd2O3 Sm2O3 Eu2O3 Gd2O3 Tb2O3 Dy2O3 Ho2O3 Er2O3 Tm2O3 Yb2O3 Lu2O3 Y2O3 Total
%TREO % % % % % % % % % % % % % % % %
0.5 27.15 46.13 4.65 14.86 2.01 0.44 1.04 0.12 0.55 0.09 0.21 0.03 0.16 0.02 2.54 100
1 27.36 46.48 4.69 14.97 2.03 0.38 0.90 0.10 0.48 0.08 0.18 0.02 0.13 0.02 2.19 100
1.5 27.58 46.85 4.72 15.09 2.04 0.32 0.74 0.09 0.40 0.06 0.15 0.02 0.11 0.02 1.82 100
2 27.78 47.19 4.76 15.20 2.06 0.26 0.60 0.07 0.32 0.05 0.12 0.02 0.09 0.01 1.47 100

J2897 Mkango Songwe Hill PFS November 2014 Page: 382
REO Distribution by Domain
In-situ Inferred Mixed Mineral Resource - REO Distributions at 0.5%, 1.0%, 1.5% and 2.0% TREO Cut-Offs
Cut-Off La2O3 Ce2O3 Pr2O3 Nd2O3 Sm2O3 Eu2O3 Gd2O3 Tb2O3 Dy2O3 Ho2O3 Er2O3 Tm2O3 Yb2O3 Lu2O3 Y2O3 Total
%TREO % % % % % % % % % % % % % % % %
0.5 27.50 46.71 4.71 15.05 2.04 0.34 0.80 0.09 0.43 0.07 0.16 0.02 0.12 0.02 1.96 100
1 27.56 46.83 4.72 15.08 2.04 0.32 0.75 0.09 0.40 0.06 0.15 0.02 0.11 0.02 1.84 100
1.5 27.62 46.93 4.73 15.12 2.05 0.30 0.71 0.08 0.38 0.06 0.14 0.02 0.11 0.02 1.74 100
2 27.83 47.28 4.77 15.23 2.06 0.24 0.57 0.07 0.30 0.05 0.11 0.01 0.09 0.01 1.38 100
In-situ Indicated Fenite Mineral Resource - REO Distributions at 0.5%, 1.0%, 1.5% and 2.0% TREO Cut-Offs
Cut-Off La2O3 Ce2O3 Pr2O3 Nd2O3 Sm2O3 Eu2O3 Gd2O3 Tb2O3 Dy2O3 Ho2O3 Er2O3 Tm2O3 Yb2O3 Lu2O3 Y2O3 Total
%TREO % % % % % % % % % % % % % % % %
0.5 24.41 44.36 4.78 16.43 2.48 0.54 1.34 0.17 0.83 0.14 0.33 0.04 0.23 0.03 3.89 100
1 24.68 44.86 4.83 16.61 2.50 0.47 1.15 0.15 0.72 0.12 0.28 0.04 0.20 0.03 3.36 100
1.5 24.86 45.19 4.87 16.73 2.52 0.42 1.03 0.13 0.64 0.11 0.25 0.03 0.18 0.02 3.01 100
2 24.97 45.39 4.89 16.81 2.53 0.39 0.96 0.12 0.60 0.10 0.24 0.03 0.17 0.02 2.79 100
In-situ Inferred Fenite Mineral Resource - REO Distributions at 0.5%, 1.0%, 1.5% and 2.0% TREO Cut-Offs
Cut-Off La2O3 Ce2O3 Pr2O3 Nd2O3 Sm2O3 Eu2O3 Gd2O3 Tb2O3 Dy2O3 Ho2O3 Er2O3 Tm2O3 Yb2O3 Lu2O3 Y2O3 Total
%TREO % % % % % % % % % % % % % % % %
0.5 24.25 44.07 4.75 16.32 2.46 0.59 1.45 0.18 0.90 0.15 0.36 0.04 0.25 0.03 4.21 100
1 24.41 44.37 4.78 16.43 2.48 0.54 1.33 0.17 0.83 0.14 0.33 0.04 0.23 0.03 3.89 100
1.5 24.69 44.88 4.83 16.62 2.50 0.47 1.15 0.15 0.71 0.12 0.28 0.04 0.20 0.03 3.34 100
2 24.90 45.26 4.88 16.76 2.53 0.41 1.01 0.13 0.63 0.10 0.25 0.03 0.17 0.02 2.93 100