Embed Size (px)
Citation preview
Journal of Alloys and Compounds 613 (2014) 132–138
Contents lists available at ScienceDirect
Journal of Alloys and Compounds
journal homepage: www.elsevier .com/locate / ja lcom
Comparison of solidification behavior between in situ observationand simulation of Fe–C–Si system
http://dx.doi.org/10.1016/j.jallcom.2014.05.1840925-8388/� 2014 Elsevier B.V. All rights reserved.
⇑ Corresponding author. Address: School of Mechanical and Mining Engineering,The University of Queensland, St. Lucia, Brisbane, Australia. Tel.: +61 7 32029725.
E-mail address: [email protected] (H.M. Henao).
Hector M. Henao a,⇑, Akira Sugiyama b, Kazuhiro Nogita a
a Nihon Superior Centre for the Manufacture of Electronic Materials, School of Mechanical and Mining Engineering, The University of Queensland, Australiab Department of Mechanical Engineering for Transportation, Osaka Sangyo University, Japan
a r t i c l e i n f o a b s t r a c t
Article history:Received 26 January 2014Received in revised form 24 May 2014Accepted 26 May 2014Available online 2 June 2014
Keywords:Metals and alloysCrystal growthKineticsComputer simulationsSynchrotron radiation
Over the last few years, important advances have been made in the understanding and modelling ofphase transformations of metallic alloys including (a) the coupling of phase equilibria and kinetics forcomputerised simulation of multicomponent alloys and (b) in situ time resolved X-ray imaging of phasetransformations in real time. Both techniques can be complementary. However the quality of the simu-lation relies to a large extent on the accuracy of phase equilibria and diffusion data obtained from existingexperimental studies. In situ X-ray techniques provide quantitative information on the evolution andproportion of phases, and can validate the thermodynamic/kinetic packages. This validation in-turnimproves the computational models and databases. In the present work, the phase transformation inthe Fe–C–Si system from liquid to c-Fe and the reaction liquid M c-Fe + Cementite was observed by usingX-ray imaging at SPring-8 synchrotron. The relationship between fraction solid and temperature wasobtained from the generated SPring-8 images. The results are compared with computer simulation usingThermo-Calc. and DICTRA. A critical analysis compares the results of the simulation with the real-timeobservations of the phase transformation.
� 2014 Elsevier B.V. All rights reserved.
1. Introduction pathway to alloy development is no longer the most efficient
Cast iron, represented by the Fe–C system, with Si as the mainalloying element is one of the basic materials of the metallurgyindustry. Its lower eutectic melting point of 1366 K [1], comparedto that of stainless of 1600–1800 K [2], facilitates the casting pro-cesses and as a consequence the production of complex shapedobjects. Although cast iron is sensitive to impact forces becauseof its brittleness and unsuitable for hot rolling or forging, low tem-perature casting has the potential to reduce the costs of productionrendering the alloy useful for home appliances and frames ofindustrial machines [3].
In cast iron, the distributed proportions and shape of c-Fe andgraphite (cementite) define the mechanical properties. Forinstance, the formation of a large proportion of flake shape graph-ite (cementite) plays a major role in the brittleness of the material[4]. Thus, in order to improve their mechanical properties, themicrostructure formed during cooling should be understood andcontrolled.
The conventional approach for studying and control of micro-structure during casting solely relying on experimentation as a
use of resources. The potential of alloy improvement throughcomputer simulation has motivated the development of coupledthermodynamic and kinetic packages over the past twenty years.Examples of specific software are Thermo-Calc. and DICTRA [5].These packages are based on the calculation of phase diagrams(CALPHAD), and on the finite difference simulation of diffusioncontrolled reactions in multicomponent alloys, respectively.
Alternatively, over the past decades, synchrotron based technol-ogy has been developed that enables direct observation of phasetransformations in metals in real time [6–8]. Using those tech-niques, the phase evolution can be observed by using X-ray trans-mission imaging technology and simulated using commercialthermodynamic and kinetic packages.
Among the phase transformation parameters able to beassessed during cooling of cast iron, the fraction of solids is oneof paramount relevance. The following three statements illustratethe importance of it:
� Their relationships with mechanical properties are able to beestimated.� It is an information easy to retrieve at condition of equilibria
using appropriate phase diagrams.� It is a parameter possible to control and evaluate during
casting.
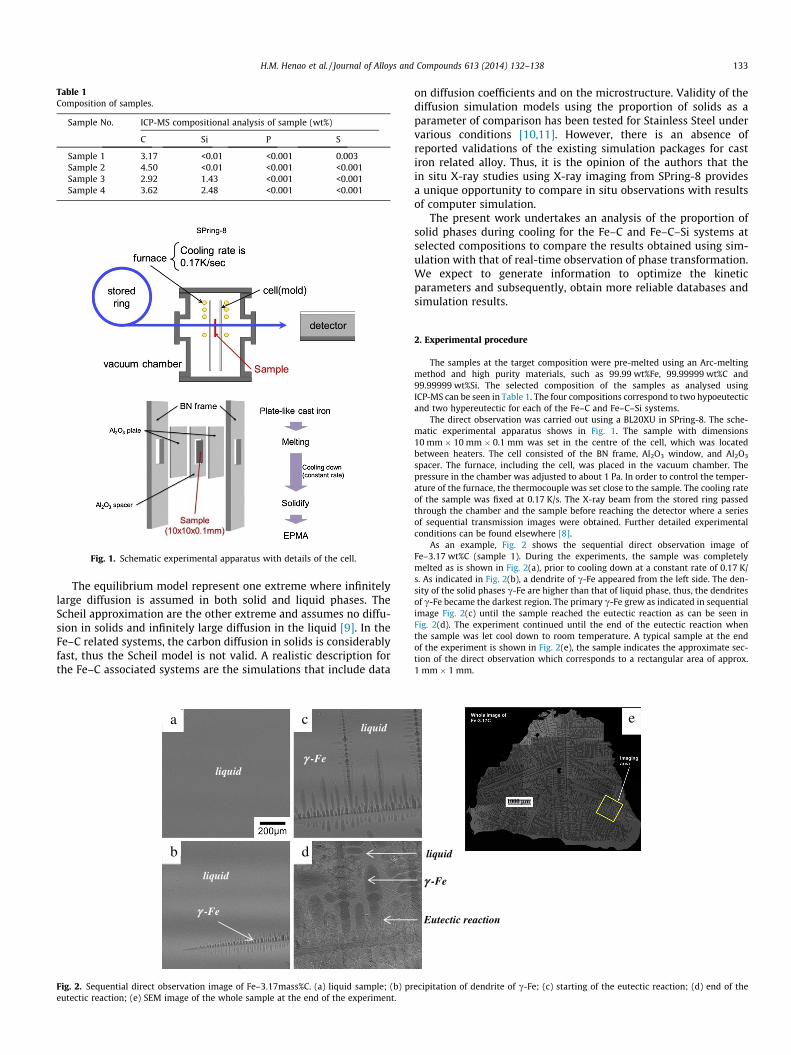
Table 1Composition of samples.
Sample No. ICP-MS compositional analysis of sample (wt%)
C Si P S
Sample 1 3.17 <0.01 <0.001 0.003Sample 2 4.50 <0.01 <0.001 <0.001Sample 3 2.92 1.43 <0.001 <0.001Sample 4 3.62 2.48 <0.001 <0.001
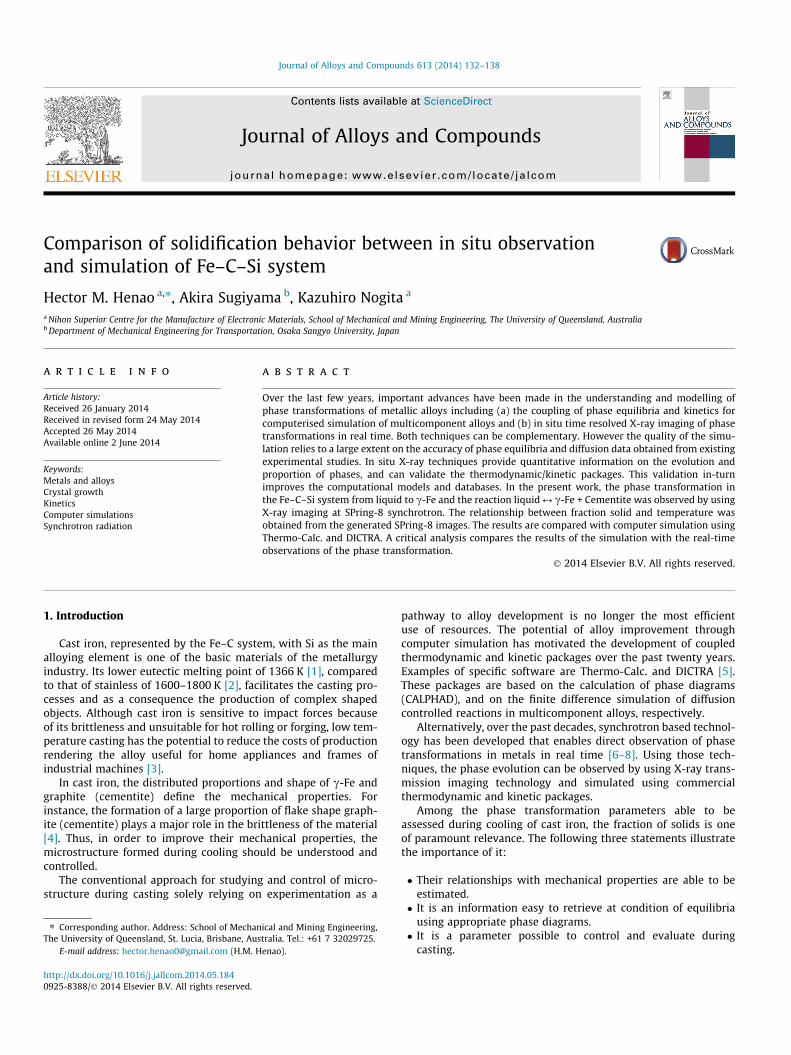
Fig. 1. Schematic experimental apparatus with details of the cell.
H.M. Henao et al. / Journal of Alloys and Compounds 613 (2014) 132–138 133
The equilibrium model represent one extreme where infinitelylarge diffusion is assumed in both solid and liquid phases. TheScheil approximation are the other extreme and assumes no diffu-sion in solids and infinitely large diffusion in the liquid [9]. In theFe–C related systems, the carbon diffusion in solids is considerablyfast, thus the Scheil model is not valid. A realistic description forthe Fe–C associated systems are the simulations that include data
Fig. 2. Sequential direct observation image of Fe–3.17mass%C. (a) liquid sample; (b) preutectic reaction; (e) SEM image of the whole sample at the end of the experiment.
on diffusion coefficients and on the microstructure. Validity of thediffusion simulation models using the proportion of solids as aparameter of comparison has been tested for Stainless Steel undervarious conditions [10,11]. However, there is an absence ofreported validations of the existing simulation packages for castiron related alloy. Thus, it is the opinion of the authors that thein situ X-ray studies using X-ray imaging from SPring-8 providesa unique opportunity to compare in situ observations with resultsof computer simulation.
The present work undertakes an analysis of the proportion ofsolid phases during cooling for the Fe–C and Fe–C–Si systems atselected compositions to compare the results obtained using sim-ulation with that of real-time observation of phase transformation.We expect to generate information to optimize the kineticparameters and subsequently, obtain more reliable databases andsimulation results.
2. Experimental procedure
The samples at the target composition were pre-melted using an Arc-meltingmethod and high purity materials, such as 99.99 wt%Fe, 99.99999 wt%C and99.99999 wt%Si. The selected composition of the samples as analysed usingICP-MS can be seen in Table 1. The four compositions correspond to two hypoeutecticand two hypereutectic for each of the Fe–C and Fe–C–Si systems.
The direct observation was carried out using a BL20XU in SPring-8. The sche-matic experimental apparatus shows in Fig. 1. The sample with dimensions10 mm � 10 mm � 0.1 mm was set in the centre of the cell, which was locatedbetween heaters. The cell consisted of the BN frame, Al2O3 window, and Al2O3
spacer. The furnace, including the cell, was placed in the vacuum chamber. Thepressure in the chamber was adjusted to about 1 Pa. In order to control the temper-ature of the furnace, the thermocouple was set close to the sample. The cooling rateof the sample was fixed at 0.17 K/s. The X-ray beam from the stored ring passedthrough the chamber and the sample before reaching the detector where a seriesof sequential transmission images were obtained. Further detailed experimentalconditions can be found elsewhere [8].
As an example, Fig. 2 shows the sequential direct observation image ofFe–3.17 wt%C (sample 1). During the experiments, the sample was completelymelted as is shown in Fig. 2(a), prior to cooling down at a constant rate of 0.17 K/s. As indicated in Fig. 2(b), a dendrite of c-Fe appeared from the left side. The den-sity of the solid phases c-Fe are higher than that of liquid phase, thus, the dendritesof c-Fe became the darkest region. The primary c-Fe grew as indicated in sequentialimage Fig. 2(c) until the sample reached the eutectic reaction as can be seen inFig. 2(d). The experiment continued until the end of the eutectic reaction whenthe sample was let cool down to room temperature. A typical sample at the endof the experiment is shown in Fig. 2(e), the sample indicates the approximate sec-tion of the direct observation which corresponds to a rectangular area of approx.1 mm � 1 mm.
ecipitation of dendrite of c-Fe; (c) starting of the eutectic reaction; (d) end of the
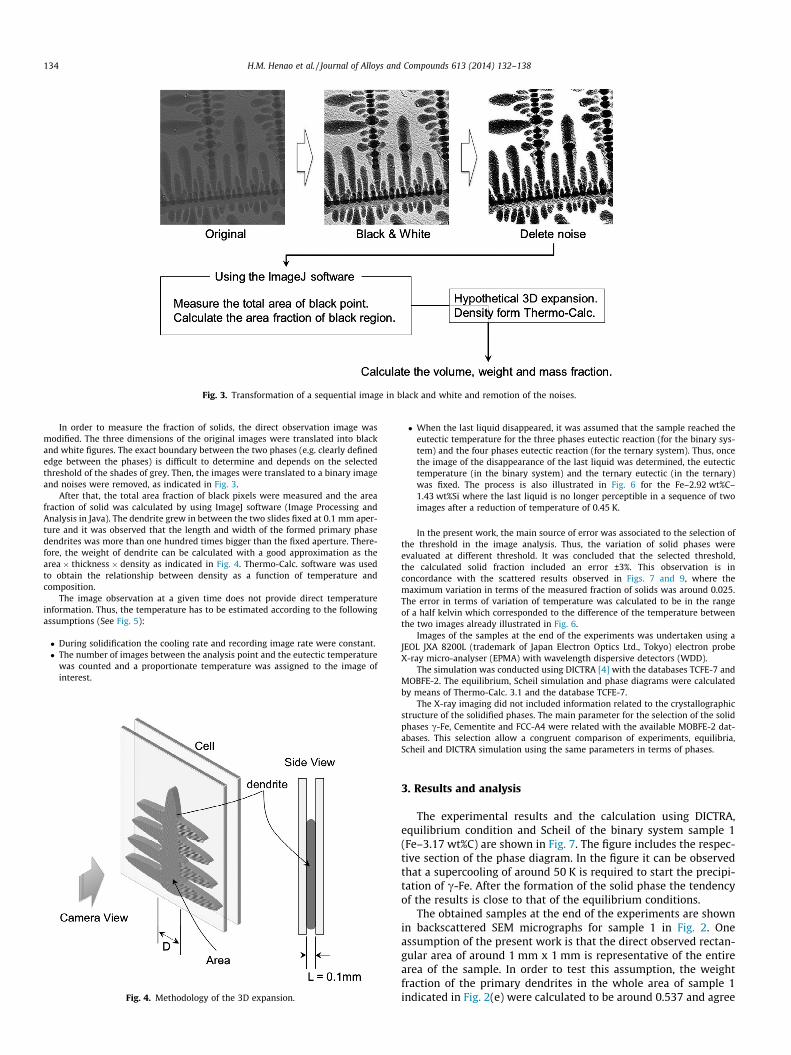
Fig. 3. Transformation of a sequential image in black and white and remotion of the noises.
134 H.M. Henao et al. / Journal of Alloys and Compounds 613 (2014) 132–138
In order to measure the fraction of solids, the direct observation image wasmodified. The three dimensions of the original images were translated into blackand white figures. The exact boundary between the two phases (e.g. clearly definededge between the phases) is difficult to determine and depends on the selectedthreshold of the shades of grey. Then, the images were translated to a binary imageand noises were removed, as indicated in Fig. 3.
After that, the total area fraction of black pixels were measured and the areafraction of solid was calculated by using ImageJ software (Image Processing andAnalysis in Java). The dendrite grew in between the two slides fixed at 0.1 mm aper-ture and it was observed that the length and width of the formed primary phasedendrites was more than one hundred times bigger than the fixed aperture. There-fore, the weight of dendrite can be calculated with a good approximation as thearea � thickness � density as indicated in Fig. 4. Thermo-Calc. software was usedto obtain the relationship between density as a function of temperature andcomposition.
The image observation at a given time does not provide direct temperatureinformation. Thus, the temperature has to be estimated according to the followingassumptions (See Fig. 5):
� During solidification the cooling rate and recording image rate were constant.� The number of images between the analysis point and the eutectic temperature
was counted and a proportionate temperature was assigned to the image ofinterest.
Fig. 4. Methodology of the 3D expansion.
� When the last liquid disappeared, it was assumed that the sample reached theeutectic temperature for the three phases eutectic reaction (for the binary sys-tem) and the four phases eutectic reaction (for the ternary system). Thus, oncethe image of the disappearance of the last liquid was determined, the eutectictemperature (in the binary system) and the ternary eutectic (in the ternary)was fixed. The process is also illustrated in Fig. 6 for the Fe–2.92 wt%C–1.43 wt%Si where the last liquid is no longer perceptible in a sequence of twoimages after a reduction of temperature of 0.45 K.
In the present work, the main source of error was associated to the selection ofthe threshold in the image analysis. Thus, the variation of solid phases wereevaluated at different threshold. It was concluded that the selected threshold,the calculated solid fraction included an error ±3%. This observation is inconcordance with the scattered results observed in Figs. 7 and 9, where themaximum variation in terms of the measured fraction of solids was around 0.025.The error in terms of variation of temperature was calculated to be in the rangeof a half kelvin which corresponded to the difference of the temperature betweenthe two images already illustrated in Fig. 6.
Images of the samples at the end of the experiments was undertaken using aJEOL JXA 8200L (trademark of Japan Electron Optics Ltd., Tokyo) electron probeX-ray micro-analyser (EPMA) with wavelength dispersive detectors (WDD).
The simulation was conducted using DICTRA [4] with the databases TCFE-7 andMOBFE-2. The equilibrium, Scheil simulation and phase diagrams were calculatedby means of Thermo-Calc. 3.1 and the database TCFE-7.
The X-ray imaging did not included information related to the crystallographicstructure of the solidified phases. The main parameter for the selection of the solidphases c-Fe, Cementite and FCC-A4 were related with the available MOBFE-2 dat-abases. This selection allow a congruent comparison of experiments, equilibria,Scheil and DICTRA simulation using the same parameters in terms of phases.
3. Results and analysis
The experimental results and the calculation using DICTRA,equilibrium condition and Scheil of the binary system sample 1(Fe–3.17 wt%C) are shown in Fig. 7. The figure includes the respec-tive section of the phase diagram. In the figure it can be observedthat a supercooling of around 50 K is required to start the precipi-tation of c-Fe. After the formation of the solid phase the tendencyof the results is close to that of the equilibrium conditions.
The obtained samples at the end of the experiments are shownin backscattered SEM micrographs for sample 1 in Fig. 2. Oneassumption of the present work is that the direct observed rectan-gular area of around 1 mm x 1 mm is representative of the entirearea of the sample. In order to test this assumption, the weightfraction of the primary dendrites in the whole area of sample 1indicated in Fig. 2(e) were calculated to be around 0.537 and agree
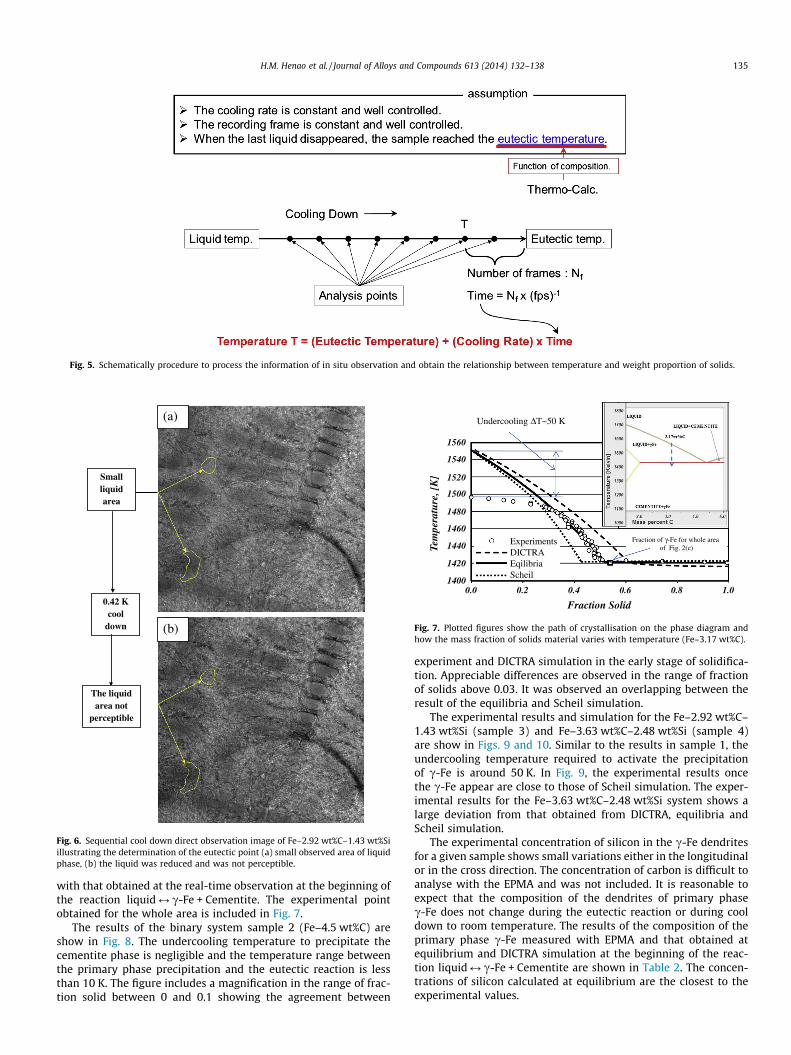
Fig. 5. Schematically procedure to process the information of in situ observation and obtain the relationship between temperature and weight proportion of solids.
(b)
(a)
Small liquid area
0.42 K cool
down
The liquid area not
perceptible
Fig. 6. Sequential cool down direct observation image of Fe–2.92 wt%C–1.43 wt%Siillustrating the determination of the eutectic point (a) small observed area of liquidphase, (b) the liquid was reduced and was not perceptible.
0.0 0.2 0.4 0.6 0.8 1.01400
1420
1440
1460
1480
1500
1520
1540
1560
Fraction Solid
ExperimentsDICTRAEqilibriaScheil
Tem
pera
ture
,[K
]Undercooling ΔT~50 K
Fraction of γ-Fe for whole area of Fig. 2(e)
Fig. 7. Plotted figures show the path of crystallisation on the phase diagram andhow the mass fraction of solids material varies with temperature (Fe–3.17 wt%C).
H.M. Henao et al. / Journal of Alloys and Compounds 613 (2014) 132–138 135
with that obtained at the real-time observation at the beginning ofthe reaction liquid M c-Fe + Cementite. The experimental pointobtained for the whole area is included in Fig. 7.
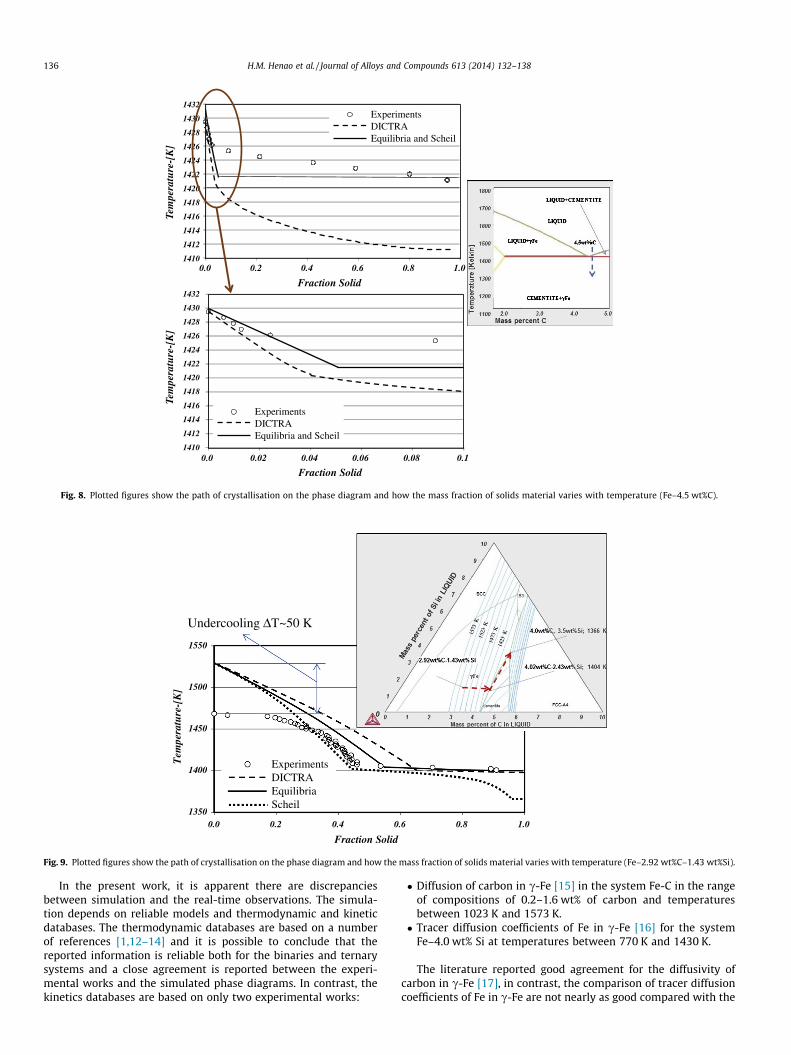
The results of the binary system sample 2 (Fe–4.5 wt%C) areshow in Fig. 8. The undercooling temperature to precipitate thecementite phase is negligible and the temperature range betweenthe primary phase precipitation and the eutectic reaction is lessthan 10 K. The figure includes a magnification in the range of frac-tion solid between 0 and 0.1 showing the agreement between
experiment and DICTRA simulation in the early stage of solidifica-tion. Appreciable differences are observed in the range of fractionof solids above 0.03. It was observed an overlapping between theresult of the equilibria and Scheil simulation.
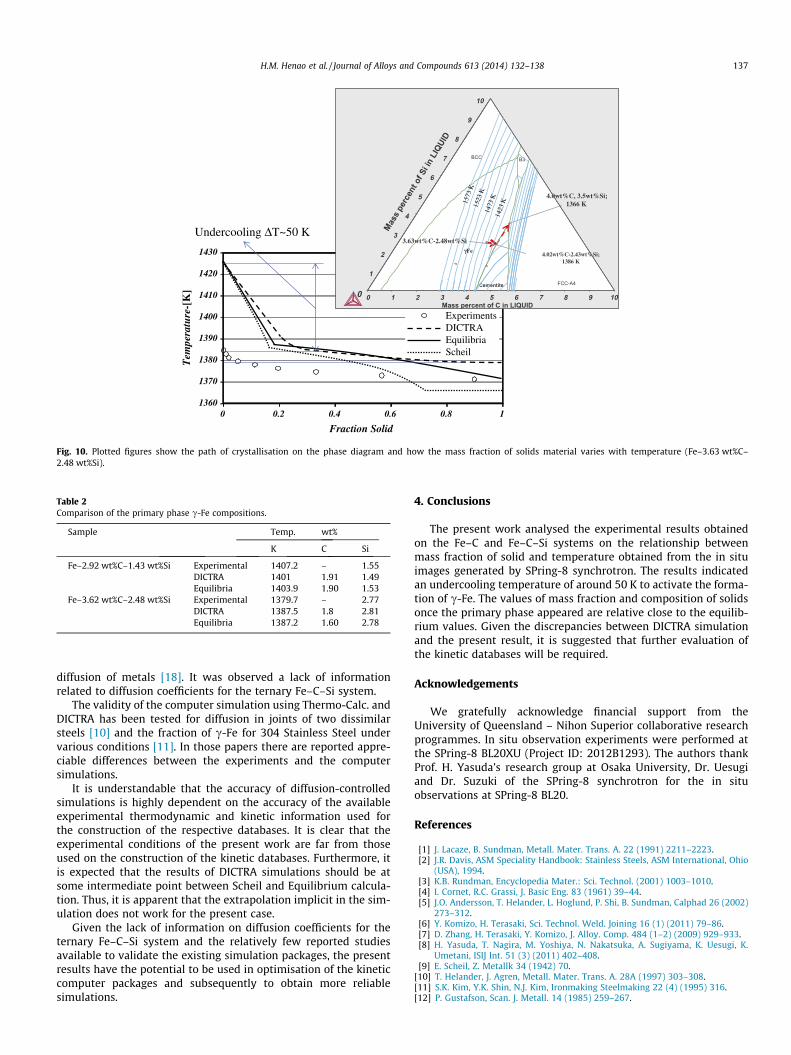
The experimental results and simulation for the Fe–2.92 wt%C–1.43 wt%Si (sample 3) and Fe–3.63 wt%C–2.48 wt%Si (sample 4)are show in Figs. 9 and 10. Similar to the results in sample 1, theundercooling temperature required to activate the precipitationof c-Fe is around 50 K. In Fig. 9, the experimental results oncethe c-Fe appear are close to those of Scheil simulation. The exper-imental results for the Fe–3.63 wt%C–2.48 wt%Si system shows alarge deviation from that obtained from DICTRA, equilibria andScheil simulation.
The experimental concentration of silicon in the c-Fe dendritesfor a given sample shows small variations either in the longitudinalor in the cross direction. The concentration of carbon is difficult toanalyse with the EPMA and was not included. It is reasonable toexpect that the composition of the dendrites of primary phasec-Fe does not change during the eutectic reaction or during cooldown to room temperature. The results of the composition of theprimary phase c-Fe measured with EPMA and that obtained atequilibrium and DICTRA simulation at the beginning of the reac-tion liquid M c-Fe + Cementite are shown in Table 2. The concen-trations of silicon calculated at equilibrium are the closest to theexperimental values.
1422
1424
1426
1428
1430
1410
1412
1414
1416
1418
1420
1432ExperimentsDICTRAEquilibria and Scheil
Tem
pera
ture
-[K
]
Fraction Solid
1410
1412
1414
1416
1418
1420
1422
1424
1426
1428
1430
1432
Fraction Solid
Tem
pera
ture
-[K
]
ExperimentsDICTRAEquilibria and Scheil
0.0 0.2 0.4 0.6 0.8 1.0
0.0 0.02 0.04 0.06 0.08 0.1
Fig. 8. Plotted figures show the path of crystallisation on the phase diagram and how the mass fraction of solids material varies with temperature (Fe–4.5 wt%C).
Tem
pera
ture
-[K
]
1350
1400
1450
1500
1550
1.00.40.20.0
ExperimentsDICTRAEquilibriaScheil
0.6 0.8
Fraction Solid
Undercooling ΔT~50 K
Fig. 9. Plotted figures show the path of crystallisation on the phase diagram and how the mass fraction of solids material varies with temperature (Fe–2.92 wt%C–1.43 wt%Si).
136 H.M. Henao et al. / Journal of Alloys and Compounds 613 (2014) 132–138
In the present work, it is apparent there are discrepanciesbetween simulation and the real-time observations. The simula-tion depends on reliable models and thermodynamic and kineticdatabases. The thermodynamic databases are based on a numberof references [1,12–14] and it is possible to conclude that thereported information is reliable both for the binaries and ternarysystems and a close agreement is reported between the experi-mental works and the simulated phase diagrams. In contrast, thekinetics databases are based on only two experimental works:
� Diffusion of carbon in c-Fe [15] in the system Fe-C in the rangeof compositions of 0.2–1.6 wt% of carbon and temperaturesbetween 1023 K and 1573 K.� Tracer diffusion coefficients of Fe in c-Fe [16] for the system
Fe–4.0 wt% Si at temperatures between 770 K and 1430 K.
The literature reported good agreement for the diffusivity ofcarbon in c-Fe [17], in contrast, the comparison of tracer diffusioncoefficients of Fe in c-Fe are not nearly as good compared with the
1360
1370
1380
1390
1400
1410
1420
1430
0 0.2 0.4 0.6 0.8 1
ExperimentsDICTRAEquilibriaScheil
Tem
pera
ture
-[K
]
Fraction Solid
Undercooling ΔT~50 K
0 1 2 3 4 5 6 7 8 9 10Mass percent of C in LIQUID
0
1
2
5
6
7
8
9
10
4.0wt%C, 3.5wt%Si; 1366 K
Cementite FCC-A4
B3
4.02wt%C-2.43wt%Si; 1386 K
BCC
γFe
3
4
3.63wt%C-2.48wt%Si
Fig. 10. Plotted figures show the path of crystallisation on the phase diagram and how the mass fraction of solids material varies with temperature (Fe–3.63 wt%C–2.48 wt%Si).
Table 2Comparison of the primary phase c-Fe compositions.
Sample Temp. wt%
K C Si
Fe–2.92 wt%C–1.43 wt%Si Experimental 1407.2 – 1.55DICTRA 1401 1.91 1.49Equilibria 1403.9 1.90 1.53
Fe–3.62 wt%C–2.48 wt%Si Experimental 1379.7 – 2.77DICTRA 1387.5 1.8 2.81Equilibria 1387.2 1.60 2.78
H.M. Henao et al. / Journal of Alloys and Compounds 613 (2014) 132–138 137
diffusion of metals [18]. It was observed a lack of informationrelated to diffusion coefficients for the ternary Fe–C–Si system.
The validity of the computer simulation using Thermo-Calc. andDICTRA has been tested for diffusion in joints of two dissimilarsteels [10] and the fraction of c-Fe for 304 Stainless Steel undervarious conditions [11]. In those papers there are reported appre-ciable differences between the experiments and the computersimulations.
It is understandable that the accuracy of diffusion-controlledsimulations is highly dependent on the accuracy of the availableexperimental thermodynamic and kinetic information used forthe construction of the respective databases. It is clear that theexperimental conditions of the present work are far from thoseused on the construction of the kinetic databases. Furthermore, itis expected that the results of DICTRA simulations should be atsome intermediate point between Scheil and Equilibrium calcula-tion. Thus, it is apparent that the extrapolation implicit in the sim-ulation does not work for the present case.
Given the lack of information on diffusion coefficients for theternary Fe–C–Si system and the relatively few reported studiesavailable to validate the existing simulation packages, the presentresults have the potential to be used in optimisation of the kineticcomputer packages and subsequently to obtain more reliablesimulations.
4. Conclusions
The present work analysed the experimental results obtainedon the Fe–C and Fe–C–Si systems on the relationship betweenmass fraction of solid and temperature obtained from the in situimages generated by SPring-8 synchrotron. The results indicatedan undercooling temperature of around 50 K to activate the forma-tion of c-Fe. The values of mass fraction and composition of solidsonce the primary phase appeared are relative close to the equilib-rium values. Given the discrepancies between DICTRA simulationand the present result, it is suggested that further evaluation ofthe kinetic databases will be required.
Acknowledgements
We gratefully acknowledge financial support from theUniversity of Queensland – Nihon Superior collaborative researchprogrammes. In situ observation experiments were performed atthe SPring-8 BL20XU (Project ID: 2012B1293). The authors thankProf. H. Yasuda’s research group at Osaka University, Dr. Uesugiand Dr. Suzuki of the SPring-8 synchrotron for the in situobservations at SPring-8 BL20.
References
[1] J. Lacaze, B. Sundman, Metall. Mater. Trans. A. 22 (1991) 2211–2223.[2] J.R. Davis, ASM Speciality Handbook: Stainless Steels, ASM International, Ohio
(USA), 1994.[3] K.B. Rundman, Encyclopedia Mater.: Sci. Technol. (2001) 1003–1010.[4] I. Cornet, R.C. Grassi, J. Basic Eng. 83 (1961) 39–44.[5] J.O. Andersson, T. Helander, L. Hoglund, P. Shi, B. Sundman, Calphad 26 (2002)
273–312.[6] Y. Komizo, H. Terasaki, Sci. Technol. Weld. Joining 16 (1) (2011) 79–86.[7] D. Zhang, H. Terasaki, Y. Komizo, J. Alloy. Comp. 484 (1–2) (2009) 929–933.[8] H. Yasuda, T. Nagira, M. Yoshiya, N. Nakatsuka, A. Sugiyama, K. Uesugi, K.
Umetani, ISIJ Int. 51 (3) (2011) 402–408.[9] E. Scheil, Z. Metallk 34 (1942) 70.
[10] T. Helander, J. Agren, Metall. Mater. Trans. A. 28A (1997) 303–308.[11] S.K. Kim, Y.K. Shin, N.J. Kim, Ironmaking Steelmaking 22 (4) (1995) 316.[12] P. Gustafson, Scan. J. Metall. 14 (1985) 259–267.

138 H.M. Henao et al. / Journal of Alloys and Compounds 613 (2014) 132–138
[13] J. Grobner, H.L. Lukas, F. Aldinger, Calphad 20 (1996) 247–254.[14] J. Miettinen, B. Hallstedt, Calphad 22 (1998) 231–256.[15] C. Wells, W. Batz, R.F. Mehl, Trans. AIME, J. Metals 188 (1950) 553.
[16] Mirandi et al., Phys. Status Solidi 29 (1975) 115–127.[17] J. Agren, Scripta Mater. 20 (1986) 1507–1510.[18] B. Jönsson, Z. Metallkunde 83 (1992) 349–355.


