Embed Size (px)
Citation preview
Metabolites 2021, 11, 326. https://doi.org/10.3390/metabo11050326 www.mdpi.com/journal/metabolites
Article
Exploration of Blood Lipoprotein and Lipid Fraction Profiles in
Healthy Subjects through Integrated Univariate, Multivariate,
and Network Analysis Reveals Association of Lipase Activity
and Cholesterol Esterification with Sex and Age
Yasmijn Balder 1, Alessia Vignoli 2,3, Leonardo Tenori 2,3, Claudio Luchinat 2,3 and Edoardo Saccenti 1,*
1 Laboratory of Systems and Synthetic Biology, Wageningen University & Research, Stippeneng 4,
6708 WE Wageningen, The Netherlands; [email protected] 2 Magnetic Resonance Center (CERM) and Department of Chemistry “Ugo Schiff”, University of Florence,
via Luigi Sacconi 6, 50019 Sesto Fiorentino, Italy; [email protected] (A.V.); [email protected] (L.T.);
[email protected] (C.L.) 3 Consorzio Interuniversitario Risonanze Magnetiche MetalloProteine (CIRMMP), via Luigi Sacconi 6,
50019 Sesto Fiorentino, Italy
* Correspondence: [email protected]
Abstract: In this study, we investigated blood lipoprotein and lipid fraction profiles, quantified
using nuclear magnetic resonance, in a cohort of 844 healthy blood donors, integrating standard
univariate and multivariate analysis with predictive modeling and network analysis. We
observed a strong association of lipoprotein and lipid main fraction profiles with sex and age. Our
results suggest an age-dependent remodulation of lipase lipoprotein activity in men and a change
in the mechanisms controlling the ratio between esterified and non-esterified cholesterol in both
men and women.
Keywords: analysis of biological networks; lipid metabolism; lipidomics; metabolomics; nuclear
magnetic resonance
1. Introduction
Lipids are the most abundant biological molecules in human plasma [1]. This group
of small molecular weight molecules shows large structural and functional variations:
they are fundamental building blocks of the cell wall and are key components of the cell
membrane and other cellular compartments, including the nuclear membrane, the
endoplasmic reticulum, and the Golgi apparatus, as well as trafficking vesicles such as
endosomes and lysosomes [2].
Mammalian cells express tens of thousands of different lipid species and use
hundreds of proteins to synthesize, metabolize, and transport them: the diversity of
lipids is of the same order of magnitude as that of proteins, but until recent years they
were not studied as much as proteins [2].
Lipids are transported in the blood by proteins; lipoproteins exist in different
densities: chylomicrons, very low-density lipoprotein (VLDL), low-density lipoprotein
(LDL), intermediate-density lipoprotein (IDL), and high-density lipoprotein (HDL).
These lipoproteins determine where the lipid is transported to, which contributes to the
wide functional variability of the lipidome.
It is widely recognized that variations in lipoprotein profiles and metabolism are
associated with metabolic diseases such as diabetes mellitus and cardiovascular
diseases, and can thus be used to monitor and assess the risk of such diseases. For
Citation: Balder, Y.; Vignoli, A.;
Tenori, L.; Luchinat, C.; Saccenti, E.
Exploration of Blood Lipoprotein and
Lipid Fraction Profiles in Healthy
Subjects through Integrated
Univariate, Multivariate, and Network
Analysis Reveals Association of Lipase
Activity and Cholesterol Esterification
with Sex and Age.
Metabolites 2021, 11, 326.
https://doi.org/10.3390/
metabo11050326
Academic Editor: Peter Meikle
Received: 29 April 2021
Accepted: 14 May 2021
Published: 18 May 2021
Publisher’s Note: MDPI stays neutral
with regard to jurisdictional claims in
published maps and institutional
affiliations.
Copyright: © 2021 by the authors.
Licensee MDPI, Basel, Switzerland.
This article is an open access article
distributed under the terms and
conditions of the Creative Commons
Attribution (CC BY) license
(http://creativecommons.org/licenses/b
y/4.0/).
Metabolites 2021, 11, 326 2 of 27
instance, elevated levels of LDL cholesterol [1] and triglycerides [3,4] increase the risk of
cardiovascular diseases, while high levels of HDL cholesterol are correlated with a low
risk of cardiovascular diseases [1,3,5]. Moreover, alterations of lipoprotein profiles have
been associated with different types of cancer [6–8] and autoimmune diseases [9–11].
Variations in the blood lipid profiles are associated not only with particular
pathophysiological statuses but also with sex and age: women tend to have higher levels
of triglyceride VLDL than men [12], whereas men have higher total triglycerides and
cholesterol levels [13], and the overall concentration of VLDL in men increases with age,
while it decreases in women [5].
Many more sex- and age- lipoprotein associations are being discovered [5,14–16]: in
the era of precision medicine, understanding how sex and age shape the lipidome can lead
to better diagnosis and treatment of conditions that occur more frequently in one of the
two sexes, present sex-specific symptoms and outcomes, or are characteristic of a specific
age group [17].
In this study, we investigate sex- and age-specific differences in the plasma lipidome
of 844 young and middle-aged healthy blood donors of both sexes who were analyzed for
their lipoprotein blood profiles via nuclear magnetic resonance (NMR) spectroscopy
[18,19].
We integrated standard univariate analysis, multivariate exploratory analysis, and
predictive modeling with systems biology tools to explore the relationships among
lipoprotein fractions using association networks and differential network analysis. Since
lipoprotein concentrations change in an orchestrated fashion, the patterns of associations
between lipoprotein fractions can be considered, to some extent, related to the underlying
structure of the biological networks [20]. Differences in lipoprotein associations which are
sex- and age-related can indeed point to affected molecular mechanisms since changes
can be more significant than levels alone [21,22], as shown in applications to health, sex,
and age phenotyping [17,23], cardiovascular risk [24–26], and bacterial infections [27,28].
Here, we report the findings of this integrated analysis describing how sex and age
affect both the concentration and the correlation patterns of lipoprotein profiles in healthy
subjects, and we suggest that lipids may be used as an early biomarker to monitor healthy
aging.
2. Results
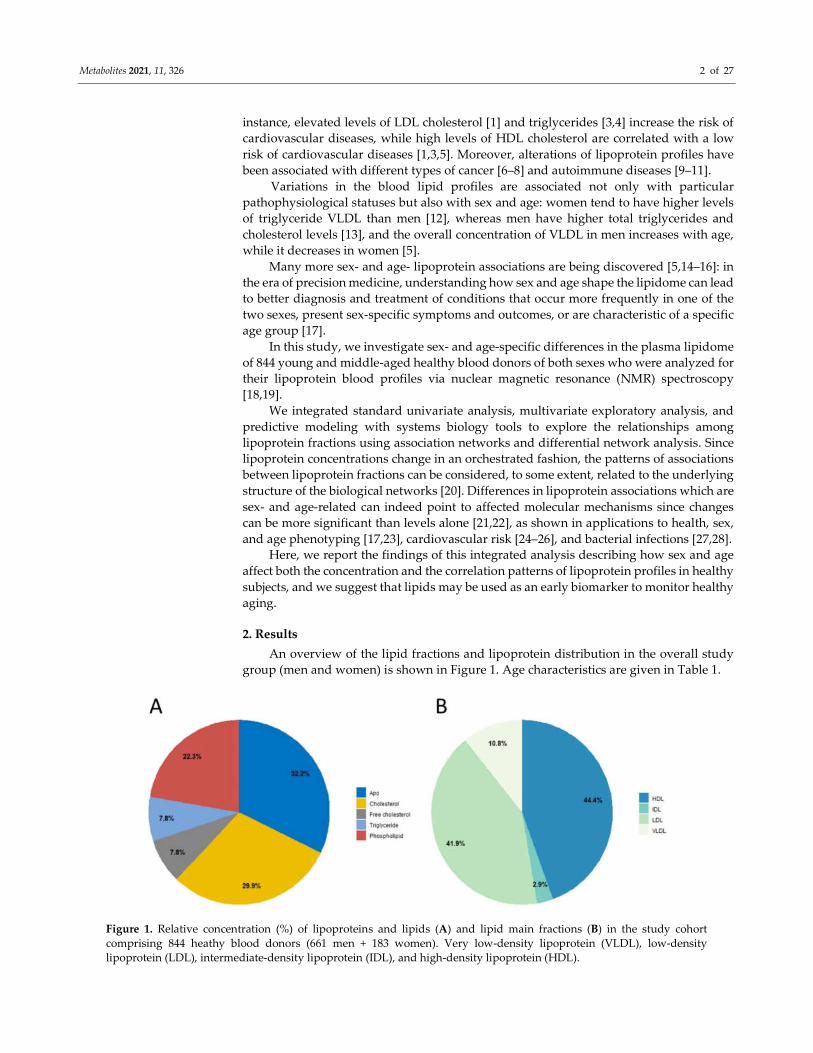
An overview of the lipid fractions and lipoprotein distribution in the overall study
group (men and women) is shown in Figure 1. Age characteristics are given in Table 1.
Figure 1. Relative concentration (%) of lipoproteins and lipids (A) and lipid main fractions (B) in the study cohort
comprising 844 heathy blood donors (661 men + 183 women). Very low-density lipoprotein (VLDL), low-density
lipoprotein (LDL), intermediate-density lipoprotein (IDL), and high-density lipoprotein (HDL).
Metabolites 2021, 11, 326 3 of 27
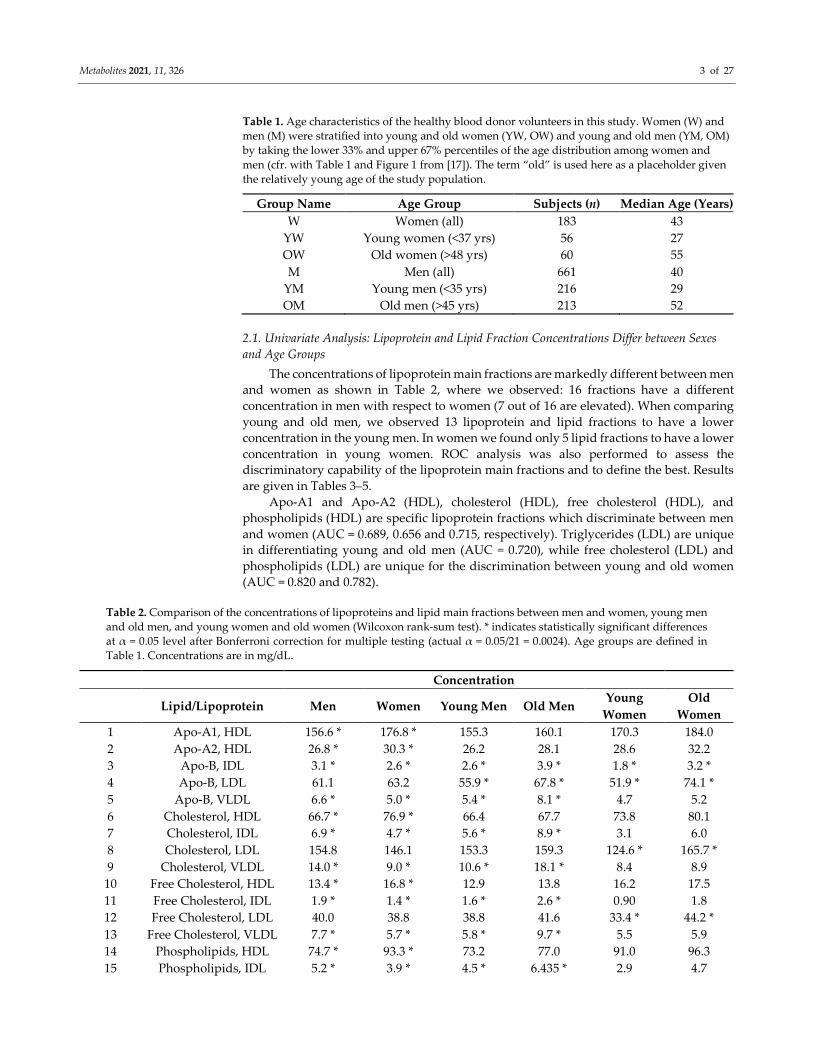
Table 1. Age characteristics of the healthy blood donor volunteers in this study. Women (W) and
men (M) were stratified into young and old women (YW, OW) and young and old men (YM, OM)
by taking the lower 33% and upper 67% percentiles of the age distribution among women and
men (cfr. with Table 1 and Figure 1 from [17]). The term “old” is used here as a placeholder given
the relatively young age of the study population.
Group Name Age Group Subjects (n) Median Age (Years)
W Women (all) 183 43
YW Young women (<37 yrs) 56 27
OW Old women (>48 yrs) 60 55
M Men (all) 661 40
YM Young men (<35 yrs) 216 29
OM Old men (>45 yrs) 213 52
2.1. Univariate Analysis: Lipoprotein and Lipid Fraction Concentrations Differ between Sexes
and Age Groups
The concentrations of lipoprotein main fractions are markedly different between men
and women as shown in Table 2, where we observed: 16 fractions have a different
concentration in men with respect to women (7 out of 16 are elevated). When comparing
young and old men, we observed 13 lipoprotein and lipid fractions to have a lower
concentration in the young men. In women we found only 5 lipid fractions to have a lower
concentration in young women. ROC analysis was also performed to assess the
discriminatory capability of the lipoprotein main fractions and to define the best. Results
are given in Tables 3–5.
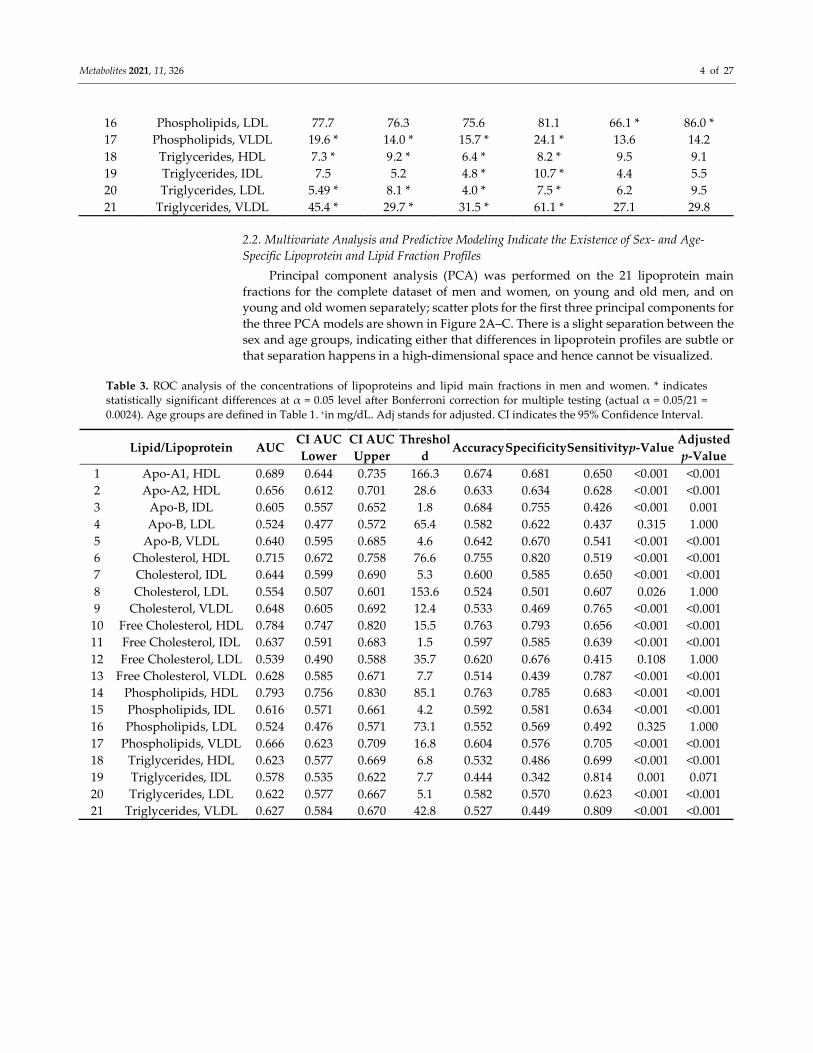
Apo-A1 and Apo-A2 (HDL), cholesterol (HDL), free cholesterol (HDL), and
phospholipids (HDL) are specific lipoprotein fractions which discriminate between men
and women (AUC = 0.689, 0.656 and 0.715, respectively). Triglycerides (LDL) are unique
in differentiating young and old men (AUC = 0.720), while free cholesterol (LDL) and
phospholipids (LDL) are unique for the discrimination between young and old women
(AUC = 0.820 and 0.782).
Table 2. Comparison of the concentrations of lipoproteins and lipid main fractions between men and women, young men
and old men, and young women and old women (Wilcoxon rank-sum test). * indicates statistically significant differences
at α = 0.05 level after Bonferroni correction for multiple testing (actual α = 0.05/21 = 0.0024). Age groups are defined in
Table 1. Concentrations are in mg/dL.
Concentration
Lipid/Lipoprotein Men Women Young Men Old Men Young
Women
Old
Women
1 Apo-A1, HDL 156.6 * 176.8 * 155.3 160.1 170.3 184.0
2 Apo-A2, HDL 26.8 * 30.3 * 26.2 28.1 28.6 32.2
3 Apo-B, IDL 3.1 * 2.6 * 2.6 * 3.9 * 1.8 * 3.2 *
4 Apo-B, LDL 61.1 63.2 55.9 * 67.8 * 51.9 * 74.1 *
5 Apo-B, VLDL 6.6 * 5.0 * 5.4 * 8.1 * 4.7 5.2
6 Cholesterol, HDL 66.7 * 76.9 * 66.4 67.7 73.8 80.1
7 Cholesterol, IDL 6.9 * 4.7 * 5.6 * 8.9 * 3.1 6.0
8 Cholesterol, LDL 154.8 146.1 153.3 159.3 124.6 * 165.7 *
9 Cholesterol, VLDL 14.0 * 9.0 * 10.6 * 18.1 * 8.4 8.9
10 Free Cholesterol, HDL 13.4 * 16.8 * 12.9 13.8 16.2 17.5
11 Free Cholesterol, IDL 1.9 * 1.4 * 1.6 * 2.6 * 0.90 1.8
12 Free Cholesterol, LDL 40.0 38.8 38.8 41.6 33.4 * 44.2 *
13 Free Cholesterol, VLDL 7.7 * 5.7 * 5.8 * 9.7 * 5.5 5.9
14 Phospholipids, HDL 74.7 * 93.3 * 73.2 77.0 91.0 96.3
15 Phospholipids, IDL 5.2 * 3.9 * 4.5 * 6.435 * 2.9 4.7
Metabolites 2021, 11, 326 4 of 27
16 Phospholipids, LDL 77.7 76.3 75.6 81.1 66.1 * 86.0 *
17 Phospholipids, VLDL 19.6 * 14.0 * 15.7 * 24.1 * 13.6 14.2
18 Triglycerides, HDL 7.3 * 9.2 * 6.4 * 8.2 * 9.5 9.1
19 Triglycerides, IDL 7.5 5.2 4.8 * 10.7 * 4.4 5.5
20 Triglycerides, LDL 5.49 * 8.1 * 4.0 * 7.5 * 6.2 9.5
21 Triglycerides, VLDL 45.4 * 29.7 * 31.5 * 61.1 * 27.1 29.8
2.2. Multivariate Analysis and Predictive Modeling Indicate the Existence of Sex- and Age-
Specific Lipoprotein and Lipid Fraction Profiles
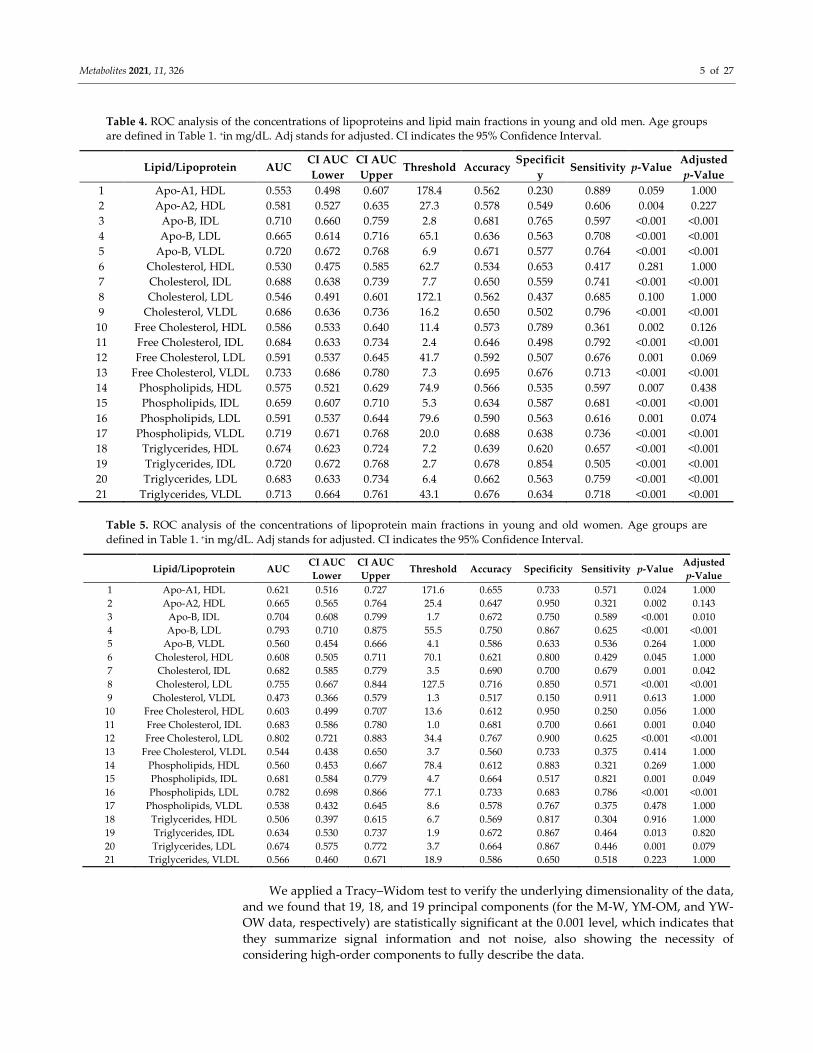
Principal component analysis (PCA) was performed on the 21 lipoprotein main
fractions for the complete dataset of men and women, on young and old men, and on
young and old women separately; scatter plots for the first three principal components for
the three PCA models are shown in Figure 2A–C. There is a slight separation between the
sex and age groups, indicating either that differences in lipoprotein profiles are subtle or
that separation happens in a high-dimensional space and hence cannot be visualized.
Table 3. ROC analysis of the concentrations of lipoproteins and lipid main fractions in men and women. * indicates
statistically significant differences at α = 0.05 level after Bonferroni correction for multiple testing (actual α = 0.05/21 =
0.0024). Age groups are defined in Table 1. +in mg/dL. Adj stands for adjusted. CI indicates the 95% Confidence Interval.
Lipid/Lipoprotein AUC CI AUC
Lower
CI AUC
Upper
Threshol
d Accuracy Specificity Sensitivity p-Value
Adjusted
p-Value
1 Apo-A1, HDL 0.689 0.644 0.735 166.3 0.674 0.681 0.650 <0.001 <0.001
2 Apo-A2, HDL 0.656 0.612 0.701 28.6 0.633 0.634 0.628 <0.001 <0.001
3 Apo-B, IDL 0.605 0.557 0.652 1.8 0.684 0.755 0.426 <0.001 0.001
4 Apo-B, LDL 0.524 0.477 0.572 65.4 0.582 0.622 0.437 0.315 1.000
5 Apo-B, VLDL 0.640 0.595 0.685 4.6 0.642 0.670 0.541 <0.001 <0.001
6 Cholesterol, HDL 0.715 0.672 0.758 76.6 0.755 0.820 0.519 <0.001 <0.001
7 Cholesterol, IDL 0.644 0.599 0.690 5.3 0.600 0.585 0.650 <0.001 <0.001
8 Cholesterol, LDL 0.554 0.507 0.601 153.6 0.524 0.501 0.607 0.026 1.000
9 Cholesterol, VLDL 0.648 0.605 0.692 12.4 0.533 0.469 0.765 <0.001 <0.001
10 Free Cholesterol, HDL 0.784 0.747 0.820 15.5 0.763 0.793 0.656 <0.001 <0.001
11 Free Cholesterol, IDL 0.637 0.591 0.683 1.5 0.597 0.585 0.639 <0.001 <0.001
12 Free Cholesterol, LDL 0.539 0.490 0.588 35.7 0.620 0.676 0.415 0.108 1.000
13 Free Cholesterol, VLDL 0.628 0.585 0.671 7.7 0.514 0.439 0.787 <0.001 <0.001
14 Phospholipids, HDL 0.793 0.756 0.830 85.1 0.763 0.785 0.683 <0.001 <0.001
15 Phospholipids, IDL 0.616 0.571 0.661 4.2 0.592 0.581 0.634 <0.001 <0.001
16 Phospholipids, LDL 0.524 0.476 0.571 73.1 0.552 0.569 0.492 0.325 1.000
17 Phospholipids, VLDL 0.666 0.623 0.709 16.8 0.604 0.576 0.705 <0.001 <0.001
18 Triglycerides, HDL 0.623 0.577 0.669 6.8 0.532 0.486 0.699 <0.001 <0.001
19 Triglycerides, IDL 0.578 0.535 0.622 7.7 0.444 0.342 0.814 0.001 0.071
20 Triglycerides, LDL 0.622 0.577 0.667 5.1 0.582 0.570 0.623 <0.001 <0.001
21 Triglycerides, VLDL 0.627 0.584 0.670 42.8 0.527 0.449 0.809 <0.001 <0.001
Metabolites 2021, 11, 326 5 of 27
Table 4. ROC analysis of the concentrations of lipoproteins and lipid main fractions in young and old men. Age groups
are defined in Table 1. +in mg/dL. Adj stands for adjusted. CI indicates the 95% Confidence Interval.
Lipid/Lipoprotein AUC CI AUC
Lower
CI AUC
Upper Threshold Accuracy
Specificit
y Sensitivity p-Value
Adjusted
p-Value
1 Apo-A1, HDL 0.553 0.498 0.607 178.4 0.562 0.230 0.889 0.059 1.000
2 Apo-A2, HDL 0.581 0.527 0.635 27.3 0.578 0.549 0.606 0.004 0.227
3 Apo-B, IDL 0.710 0.660 0.759 2.8 0.681 0.765 0.597 <0.001 <0.001
4 Apo-B, LDL 0.665 0.614 0.716 65.1 0.636 0.563 0.708 <0.001 <0.001
5 Apo-B, VLDL 0.720 0.672 0.768 6.9 0.671 0.577 0.764 <0.001 <0.001
6 Cholesterol, HDL 0.530 0.475 0.585 62.7 0.534 0.653 0.417 0.281 1.000
7 Cholesterol, IDL 0.688 0.638 0.739 7.7 0.650 0.559 0.741 <0.001 <0.001
8 Cholesterol, LDL 0.546 0.491 0.601 172.1 0.562 0.437 0.685 0.100 1.000
9 Cholesterol, VLDL 0.686 0.636 0.736 16.2 0.650 0.502 0.796 <0.001 <0.001
10 Free Cholesterol, HDL 0.586 0.533 0.640 11.4 0.573 0.789 0.361 0.002 0.126
11 Free Cholesterol, IDL 0.684 0.633 0.734 2.4 0.646 0.498 0.792 <0.001 <0.001
12 Free Cholesterol, LDL 0.591 0.537 0.645 41.7 0.592 0.507 0.676 0.001 0.069
13 Free Cholesterol, VLDL 0.733 0.686 0.780 7.3 0.695 0.676 0.713 <0.001 <0.001
14 Phospholipids, HDL 0.575 0.521 0.629 74.9 0.566 0.535 0.597 0.007 0.438
15 Phospholipids, IDL 0.659 0.607 0.710 5.3 0.634 0.587 0.681 <0.001 <0.001
16 Phospholipids, LDL 0.591 0.537 0.644 79.6 0.590 0.563 0.616 0.001 0.074
17 Phospholipids, VLDL 0.719 0.671 0.768 20.0 0.688 0.638 0.736 <0.001 <0.001
18 Triglycerides, HDL 0.674 0.623 0.724 7.2 0.639 0.620 0.657 <0.001 <0.001
19 Triglycerides, IDL 0.720 0.672 0.768 2.7 0.678 0.854 0.505 <0.001 <0.001
20 Triglycerides, LDL 0.683 0.633 0.734 6.4 0.662 0.563 0.759 <0.001 <0.001
21 Triglycerides, VLDL 0.713 0.664 0.761 43.1 0.676 0.634 0.718 <0.001 <0.001
Table 5. ROC analysis of the concentrations of lipoprotein main fractions in young and old women. Age groups are
defined in Table 1. +in mg/dL. Adj stands for adjusted. CI indicates the 95% Confidence Interval.
Lipid/Lipoprotein AUC CI AUC
Lower
CI AUC
Upper Threshold Accuracy Specificity Sensitivity p-Value
Adjusted
p-Value
1 Apo-A1, HDL 0.621 0.516 0.727 171.6 0.655 0.733 0.571 0.024 1.000
2 Apo-A2, HDL 0.665 0.565 0.764 25.4 0.647 0.950 0.321 0.002 0.143
3 Apo-B, IDL 0.704 0.608 0.799 1.7 0.672 0.750 0.589 <0.001 0.010
4 Apo-B, LDL 0.793 0.710 0.875 55.5 0.750 0.867 0.625 <0.001 <0.001
5 Apo-B, VLDL 0.560 0.454 0.666 4.1 0.586 0.633 0.536 0.264 1.000
6 Cholesterol, HDL 0.608 0.505 0.711 70.1 0.621 0.800 0.429 0.045 1.000
7 Cholesterol, IDL 0.682 0.585 0.779 3.5 0.690 0.700 0.679 0.001 0.042
8 Cholesterol, LDL 0.755 0.667 0.844 127.5 0.716 0.850 0.571 <0.001 <0.001
9 Cholesterol, VLDL 0.473 0.366 0.579 1.3 0.517 0.150 0.911 0.613 1.000
10 Free Cholesterol, HDL 0.603 0.499 0.707 13.6 0.612 0.950 0.250 0.056 1.000
11 Free Cholesterol, IDL 0.683 0.586 0.780 1.0 0.681 0.700 0.661 0.001 0.040
12 Free Cholesterol, LDL 0.802 0.721 0.883 34.4 0.767 0.900 0.625 <0.001 <0.001
13 Free Cholesterol, VLDL 0.544 0.438 0.650 3.7 0.560 0.733 0.375 0.414 1.000
14 Phospholipids, HDL 0.560 0.453 0.667 78.4 0.612 0.883 0.321 0.269 1.000
15 Phospholipids, IDL 0.681 0.584 0.779 4.7 0.664 0.517 0.821 0.001 0.049
16 Phospholipids, LDL 0.782 0.698 0.866 77.1 0.733 0.683 0.786 <0.001 <0.001
17 Phospholipids, VLDL 0.538 0.432 0.645 8.6 0.578 0.767 0.375 0.478 1.000
18 Triglycerides, HDL 0.506 0.397 0.615 6.7 0.569 0.817 0.304 0.916 1.000
19 Triglycerides, IDL 0.634 0.530 0.737 1.9 0.672 0.867 0.464 0.013 0.820
20 Triglycerides, LDL 0.674 0.575 0.772 3.7 0.664 0.867 0.446 0.001 0.079
21 Triglycerides, VLDL 0.566 0.460 0.671 18.9 0.586 0.650 0.518 0.223 1.000
We applied a Tracy–Widom test to verify the underlying dimensionality of the data,
and we found that 19, 18, and 19 principal components (for the M-W, YM-OM, and YW-
OW data, respectively) are statistically significant at the 0.001 level, which indicates that
they summarize signal information and not noise, also showing the necessity of
considering high-order components to fully describe the data.
Metabolites 2021, 11, 326 6 of 27
We built Random Forest classification models to investigate the predictive capability
of lipoprotein main profiles to distinguish between men and women and between the age
groups. Model quality measures are reported in Table 6. All models are statistically
significant at the α = 0.01 level, with relatively high AUC, indicating the presence of sex-
and age-specific blood lipoprotein signatures.
Table 6. Quality measures for the Random Forest classification models used to discriminate between the blood lipoprotein
main fraction profiles of the study groups. Statistical significance was assessed using a permutation test.
Random Forest Model Accuracy (p-Value) Specificity (p-Value) Sensitivity (p-Value) AUC (p-Value)
Women vs men 0.776 (0.001) 0.761 (0.001) 0.780 (0.001) 0.826 (0.001)
Young vs old men 0.746 (0.001) 0.741 (0.001) 0.751 (0.001) 0.810 (0.001)
Young vs old women 0.716 (0.001) 0.679 (0.002) 0.750 (0.001) 0.762 (0.005)
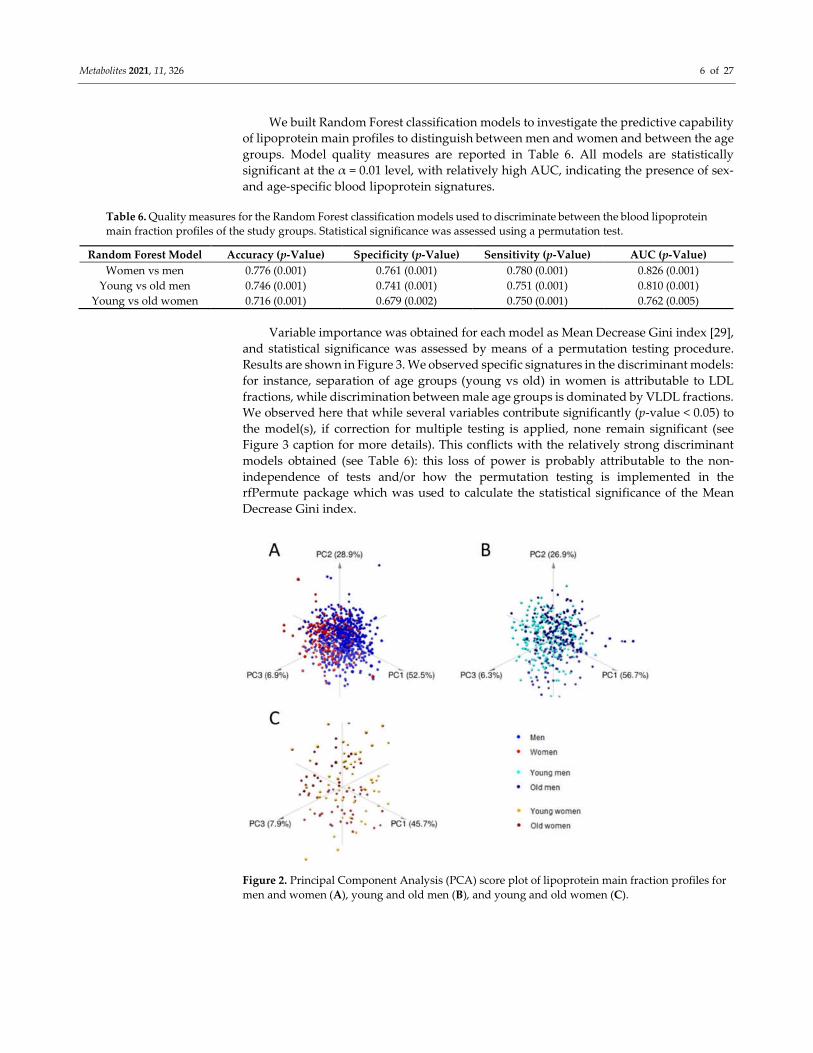
Variable importance was obtained for each model as Mean Decrease Gini index [29],
and statistical significance was assessed by means of a permutation testing procedure.
Results are shown in Figure 3. We observed specific signatures in the discriminant models:
for instance, separation of age groups (young vs old) in women is attributable to LDL
fractions, while discrimination between male age groups is dominated by VLDL fractions.
We observed here that while several variables contribute significantly (p-value < 0.05) to
the model(s), if correction for multiple testing is applied, none remain significant (see
Figure 3 caption for more details). This conflicts with the relatively strong discriminant
models obtained (see Table 6): this loss of power is probably attributable to the non-
independence of tests and/or how the permutation testing is implemented in the
rfPermute package which was used to calculate the statistical significance of the Mean
Decrease Gini index.
Figure 2. Principal Component Analysis (PCA) score plot of lipoprotein main fraction profiles for
men and women (A), young and old men (B), and young and old women (C).
Metabolites 2021, 11, 326 7 of 27
Figure 3. Importance of lipoprotein main fractions in the sex and age group classification models built with Random
Forest. (A) Men vs women, (B) young men vs old men, (C) young women vs old women. Variable importance is expressed
as Mean Decrease Gini index. Variables with p-value < 0.05 are highlighted in orange. p-values are not corrected (see
Results Section 2.2).
2.3. Network Inference and Analysis
There is a wealth of information contained in the relationships among plasma and
blood metabolites [28,30,31], which are better captured using correlation measures as an
index of association [32,33]. Lipoprotein main fraction association networks were built
using the PCLRC algorithm and a Gaussian Graphical Model approach to estimate the
pairwise partial correlations among the concentrations of the lipoprotein fractions.
Networks were built separately for men’s and women’s data and for the
corresponding age groups. Results are shown in Figure 3, for a total of six networks, each
comprising 21 nodes.
Partial correlations measure degree of association between two variables when
removing the effect of other controlling variables and were used in place of standard
correlation to avoid the risk of introducing indirect correlations in the network modeling.
Partial correlation networks allow the modeling of unique interaction among the variables
(lipoproteins) and can be indicative of potential causal pathways [34]: a non-zero partial
correlation would be expected if (i) A causes B, (ii) B causes A (iii) there is a reciprocal
relationship between A and B or (iv) both A and B cause a third variable in the network
[34–36]. Moreover, if variables covaries because of variables that are not present in the
network, it is expected that all these variables will be connected in the network, forming
a cluster [36].
Exploratory Analysis of Lipoprotein and Lipid Fractions Highlights Subtle
Remodulation of Correlation Patterns
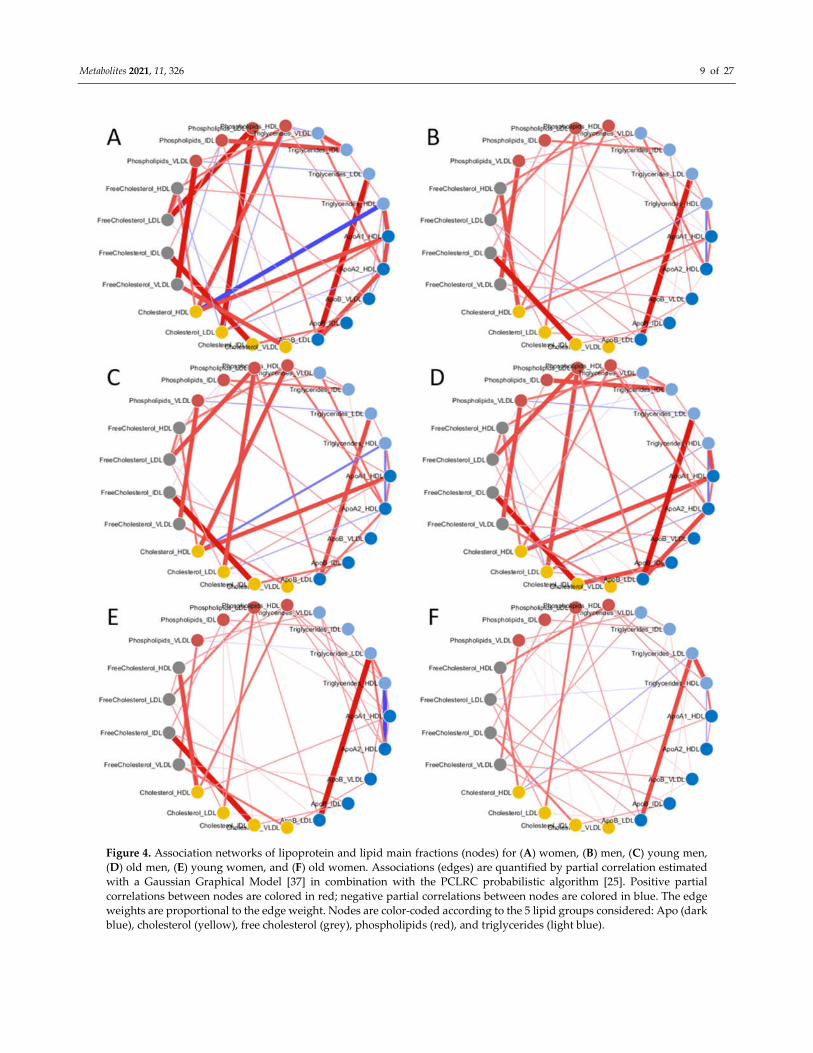
The overall structure of the networks is similar across the the study groups
(men/women, young/old) and differences most depends on variation of the strenght of
the associations: for instance, the correlation between cholesterol and triglycerides (HDL)
is stronger in the association network for men (Figure 4B) than in that for women (Figure
4A).
Metabolites 2021, 11, 326 8 of 27
To explore comprehensively the patterns of variation of the asociation strenght,
Covariance Simultanous Component Analysis was applied to analyze simultaneously the
six networks and to individuate which lipoprotein fractions show different correlation
patterns across the networks. The score plot of the COVSCA analysis is shown in Figure
5A and can be interpreted in a PCA-like fashion: points close in the COVSCA space share
similar characteristics. Since every point represents a network, this indicates network
similarities.
The association networks separate according to sex along the second COVSCA
dimension (note the in COVSCA, in contrast with PCA, the order of the dimensions is
arbitrary: dimensions can be swapped without changing the model), indicating the
existence of correlation patterns among lipoprotein fractions that are sex-specific.
Networks separate by age groups along the first COVSCA dimension, showing age-
dependent correlation patterns.
It is interesting to note that male age groups separate perfectly along the second
dimension, with the network built using all male subjects fallowing in-between the
networks for the young and old groups, and this is somehow expected. For women-
specific networks, the picture is slightly more complicated: the age groups separate along
the first dimension as for males, but the network obtained with all female samples
partially separate along the second component, suggesting a more complicate
remodulation of correlation patterns.
The COVSCA model was fitted with two rank 2 prototype matrices (as the best
compromise between model complexity and goodness of fit (38.2%), since COVSCA is an
exploratory approach) which results in two set of loadings for each dimension that are
shown in Figure 5B (first dimension) and Figure 5C (second dimension): as in PCA the
COVSCA loadings describe the importance of each variable/lipoprotein to the model.
Metabolites 2021, 11, 326 9 of 27
Figure 4. Association networks of lipoprotein and lipid main fractions (nodes) for (A) women, (B) men, (C) young men,
(D) old men, (E) young women, and (F) old women. Associations (edges) are quantified by partial correlation estimated
with a Gaussian Graphical Model [37] in combination with the PCLRC probabilistic algorithm [25]. Positive partial
correlations between nodes are colored in red; negative partial correlations between nodes are colored in blue. The edge
weights are proportional to the edge weight. Nodes are color-coded according to the 5 lipid groups considered: Apo (dark
blue), cholesterol (yellow), free cholesterol (grey), phospholipids (red), and triglycerides (light blue).
Metabolites 2021, 11, 326 10 of 27
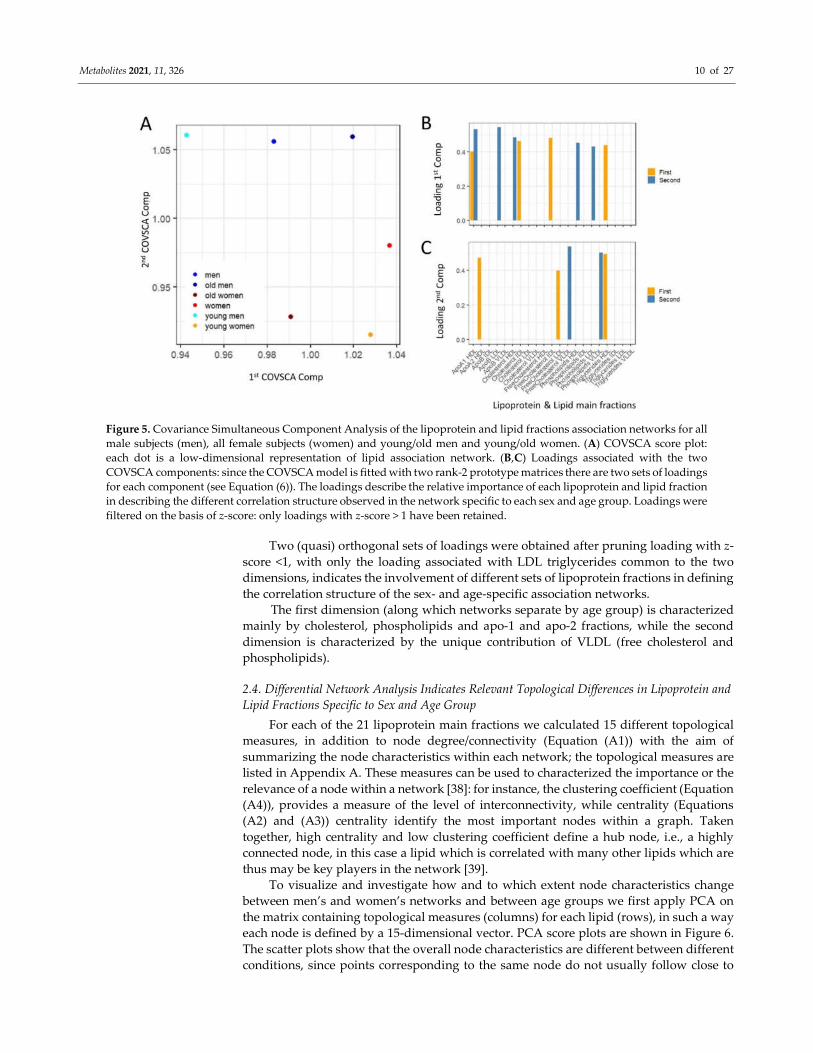
Figure 5. Covariance Simultaneous Component Analysis of the lipoprotein and lipid fractions association networks for all
male subjects (men), all female subjects (women) and young/old men and young/old women. (A) COVSCA score plot:
each dot is a low-dimensional representation of lipid association network. (B,C) Loadings associated with the two
COVSCA components: since the COVSCA model is fitted with two rank-2 prototype matrices there are two sets of loadings
for each component (see Equation (6)). The loadings describe the relative importance of each lipoprotein and lipid fraction
in describing the different correlation structure observed in the network specific to each sex and age group. Loadings were
filtered on the basis of z-score: only loadings with z-score > 1 have been retained.
Two (quasi) orthogonal sets of loadings were obtained after pruning loading with z-
score <1, with only the loading associated with LDL triglycerides common to the two
dimensions, indicates the involvement of different sets of lipoprotein fractions in defining
the correlation structure of the sex- and age-specific association networks.
The first dimension (along which networks separate by age group) is characterized
mainly by cholesterol, phospholipids and apo-1 and apo-2 fractions, while the second
dimension is characterized by the unique contribution of VLDL (free cholesterol and
phospholipids).
2.4. Differential Network Analysis Indicates Relevant Topological Differences in Lipoprotein and
Lipid Fractions Specific to Sex and Age Group
For each of the 21 lipoprotein main fractions we calculated 15 different topological
measures, in addition to node degree/connectivity (Equation (A1)) with the aim of
summarizing the node characteristics within each network; the topological measures are
listed in Appendix A. These measures can be used to characterized the importance or the
relevance of a node within a network [38]: for instance, the clustering coefficient (Equation
(A4)), provides a measure of the level of interconnectivity, while centrality (Equations
(A2) and (A3)) centrality identify the most important nodes within a graph. Taken
together, high centrality and low clustering coefficient define a hub node, i.e., a highly
connected node, in this case a lipid which is correlated with many other lipids which are
thus may be key players in the network [39].
To visualize and investigate how and to which extent node characteristics change
between men’s and women’s networks and between age groups we first apply PCA on
the matrix containing topological measures (columns) for each lipid (rows), in such a way
each node is defined by a 15-dimensional vector. PCA score plots are shown in Figure 6.
The scatter plots show that the overall node characteristics are different between different
conditions, since points corresponding to the same node do not usually follow close to
Metabolites 2021, 11, 326 11 of 27
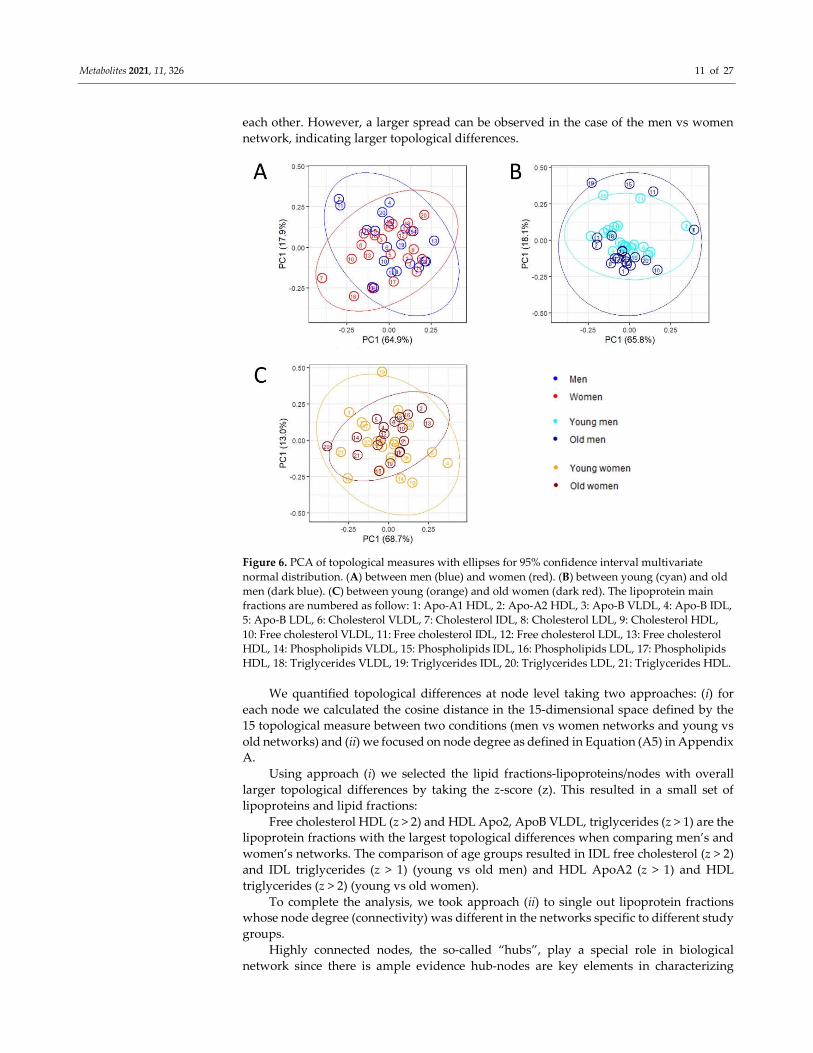
each other. However, a larger spread can be observed in the case of the men vs women
network, indicating larger topological differences.
Figure 6. PCA of topological measures with ellipses for 95% confidence interval multivariate
normal distribution. (A) between men (blue) and women (red). (B) between young (cyan) and old
men (dark blue). (C) between young (orange) and old women (dark red). The lipoprotein main
fractions are numbered as follow: 1: Apo-A1 HDL, 2: Apo-A2 HDL, 3: Apo-B VLDL, 4: Apo-B IDL,
5: Apo-B LDL, 6: Cholesterol VLDL, 7: Cholesterol IDL, 8: Cholesterol LDL, 9: Cholesterol HDL,
10: Free cholesterol VLDL, 11: Free cholesterol IDL, 12: Free cholesterol LDL, 13: Free cholesterol
HDL, 14: Phospholipids VLDL, 15: Phospholipids IDL, 16: Phospholipids LDL, 17: Phospholipids
HDL, 18: Triglycerides VLDL, 19: Triglycerides IDL, 20: Triglycerides LDL, 21: Triglycerides HDL.
We quantified topological differences at node level taking two approaches: (i) for
each node we calculated the cosine distance in the 15-dimensional space defined by the
15 topological measure between two conditions (men vs women networks and young vs
old networks) and (ii) we focused on node degree as defined in Equation (A5) in Appendix
A.
Using approach (i) we selected the lipid fractions-lipoproteins/nodes with overall
larger topological differences by taking the z-score (z). This resulted in a small set of
lipoproteins and lipid fractions:
Free cholesterol HDL (z > 2) and HDL Apo2, ApoB VLDL, triglycerides (z > 1) are the
lipoprotein fractions with the largest topological differences when comparing men’s and
women’s networks. The comparison of age groups resulted in IDL free cholesterol (z > 2)
and IDL triglycerides (z > 1) (young vs old men) and HDL ApoA2 (z > 1) and HDL
triglycerides (z > 2) (young vs old women).
To complete the analysis, we took approach (ii) to single out lipoprotein fractions
whose node degree (connectivity) was different in the networks specific to different study
groups.
Highly connected nodes, the so-called “hubs”, play a special role in biological
network since there is ample evidence hub-nodes are key elements in characterizing
Metabolites 2021, 11, 326 12 of 27
network behavior, as observed in the case of gene co-expression and regulatory networks
[40,41], metabolic networks, protein–protein interaction networks [42–44], and cell–cell
interaction networks [45], and it has been shown that in yeast, for instance, proteins that
are highly connected are essential for survival [40,42].
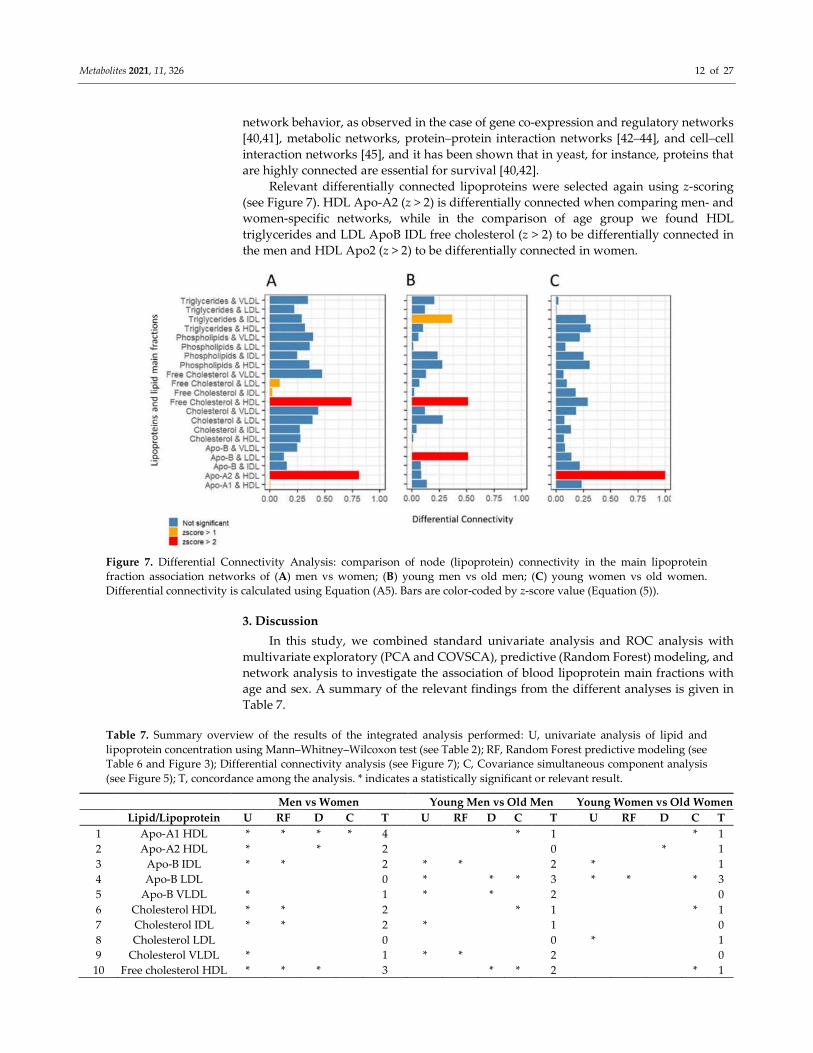
Relevant differentially connected lipoproteins were selected again using z-scoring
(see Figure 7). HDL Apo-A2 (z > 2) is differentially connected when comparing men- and
women-specific networks, while in the comparison of age group we found HDL
triglycerides and LDL ApoB IDL free cholesterol (z > 2) to be differentially connected in
the men and HDL Apo2 (z > 2) to be differentially connected in women.
Figure 7. Differential Connectivity Analysis: comparison of node (lipoprotein) connectivity in the main lipoprotein
fraction association networks of (A) men vs women; (B) young men vs old men; (C) young women vs old women.
Differential connectivity is calculated using Equation (A5). Bars are color-coded by z-score value (Equation (5)).
3. Discussion
In this study, we combined standard univariate analysis and ROC analysis with
multivariate exploratory (PCA and COVSCA), predictive (Random Forest) modeling, and
network analysis to investigate the association of blood lipoprotein main fractions with
age and sex. A summary of the relevant findings from the different analyses is given in
Table 7.
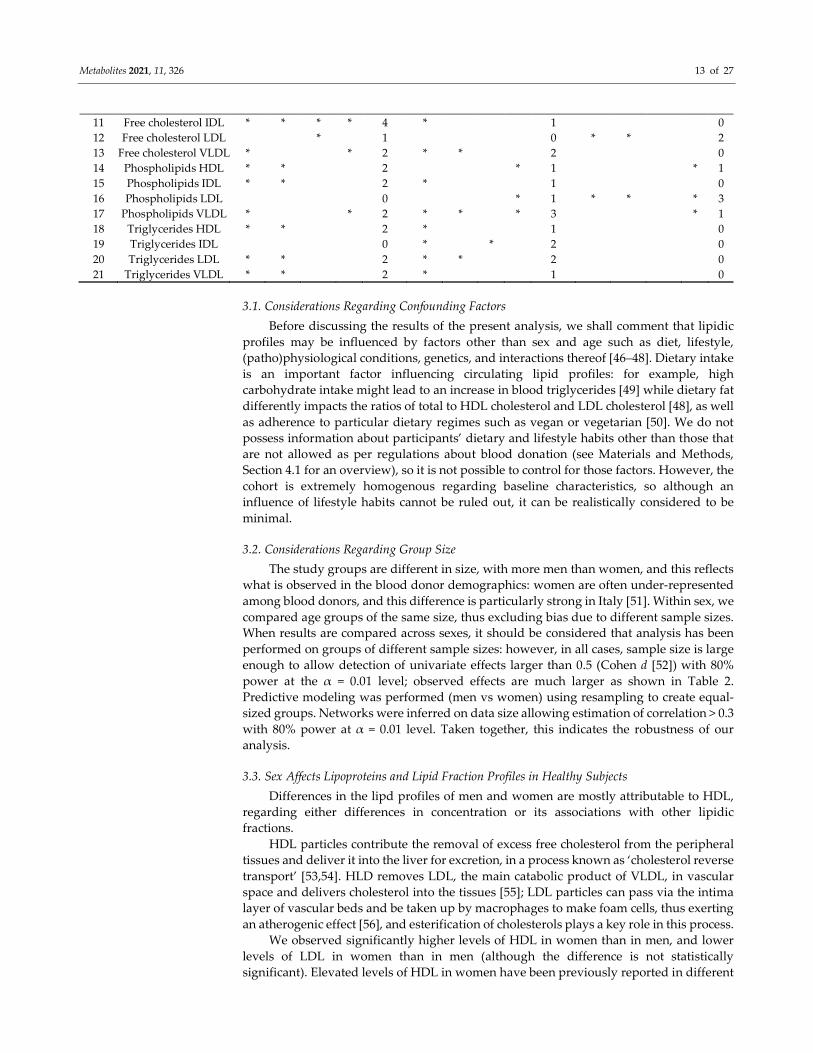
Table 7. Summary overview of the results of the integrated analysis performed: U, univariate analysis of lipid and
lipoprotein concentration using Mann–Whitney–Wilcoxon test (see Table 2); RF, Random Forest predictive modeling (see
Table 6 and Figure 3); Differential connectivity analysis (see Figure 7); C, Covariance simultaneous component analysis
(see Figure 5); T, concordance among the analysis. * indicates a statistically significant or relevant result.
Men vs Women Young Men vs Old Men Young Women vs Old Women
Lipid/Lipoprotein U RF D C T U RF D C T U RF D C T
1 Apo-A1 HDL * * * * 4 * 1 * 1
2 Apo-A2 HDL * * 2 0 * 1
3 Apo-B IDL * * 2 * * 2 * 1
4 Apo-B LDL 0 * * * 3 * * * 3
5 Apo-B VLDL * 1 * * 2 0
6 Cholesterol HDL * * 2 * 1 * 1
7 Cholesterol IDL * * 2 * 1 0
8 Cholesterol LDL 0 0 * 1
9 Cholesterol VLDL * 1 * * 2 0
10 Free cholesterol HDL * * * 3 * * 2 * 1
Metabolites 2021, 11, 326 13 of 27
11 Free cholesterol IDL * * * * 4 * 1 0
12 Free cholesterol LDL * 1 0 * * 2
13 Free cholesterol VLDL * * 2 * * 2 0
14 Phospholipids HDL * * 2 * 1 * 1
15 Phospholipids IDL * * 2 * 1 0
16 Phospholipids LDL 0 * 1 * * * 3
17 Phospholipids VLDL * * 2 * * * 3 * 1
18 Triglycerides HDL * * 2 * 1 0
19 Triglycerides IDL 0 * * 2 0
20 Triglycerides LDL * * 2 * * 2 0
21 Triglycerides VLDL * * 2 * 1 0
3.1. Considerations Regarding Confounding Factors
Before discussing the results of the present analysis, we shall comment that lipidic
profiles may be influenced by factors other than sex and age such as diet, lifestyle,
(patho)physiological conditions, genetics, and interactions thereof [46–48]. Dietary intake
is an important factor influencing circulating lipid profiles: for example, high
carbohydrate intake might lead to an increase in blood triglycerides [49] while dietary fat
differently impacts the ratios of total to HDL cholesterol and LDL cholesterol [48], as well
as adherence to particular dietary regimes such as vegan or vegetarian [50]. We do not
possess information about participants’ dietary and lifestyle habits other than those that
are not allowed as per regulations about blood donation (see Materials and Methods,
Section 4.1 for an overview), so it is not possible to control for those factors. However, the
cohort is extremely homogenous regarding baseline characteristics, so although an
influence of lifestyle habits cannot be ruled out, it can be realistically considered to be
minimal.
3.2. Considerations Regarding Group Size
The study groups are different in size, with more men than women, and this reflects
what is observed in the blood donor demographics: women are often under-represented
among blood donors, and this difference is particularly strong in Italy [51]. Within sex, we
compared age groups of the same size, thus excluding bias due to different sample sizes.
When results are compared across sexes, it should be considered that analysis has been
performed on groups of different sample sizes: however, in all cases, sample size is large
enough to allow detection of univariate effects larger than 0.5 (Cohen d [52]) with 80%
power at the α = 0.01 level; observed effects are much larger as shown in Table 2.
Predictive modeling was performed (men vs women) using resampling to create equal-
sized groups. Networks were inferred on data size allowing estimation of correlation > 0.3
with 80% power at α = 0.01 level. Taken together, this indicates the robustness of our
analysis.
3.3. Sex Affects Lipoproteins and Lipid Fraction Profiles in Healthy Subjects
Differences in the lipd profiles of men and women are mostly attributable to HDL,
regarding either differences in concentration or its associations with other lipidic
fractions.
HDL particles contribute the removal of excess free cholesterol from the peripheral
tissues and deliver it into the liver for excretion, in a process known as ‘cholesterol reverse
transport’ [53,54]. HLD removes LDL, the main catabolic product of VLDL, in vascular
space and delivers cholesterol into the tissues [55]; LDL particles can pass via the intima
layer of vascular beds and be taken up by macrophages to make foam cells, thus exerting
an atherogenic effect [56], and esterification of cholesterols plays a key role in this process.
We observed significantly higher levels of HDL in women than in men, and lower
levels of LDL in women than in men (although the difference is not statistically
significant). Elevated levels of HDL in women have been previously reported in different
Metabolites 2021, 11, 326 14 of 27
subpopulations [57–63], and lipid control by endogenous estrogens in women has been
proposed, which also explains the observation that pre-menopausal women have fewer
cardiovascular complications than men [12].
Lipids are mobilized between tissues mainly as fatty acids released by adipose tissue
or as lipoprotein produced by the liver and gut (chylomicrons and very low-density
lipoprotein (VLDL) for triglyceride (TG), and low-density lipoprotein (LDL) and high-
density lipoprotein (HDL) for cholesterol) [12]. Metabolism and catabolism of hepatic
fatty acid, triglyceride, and cholesterol is regulated by endogenous estrogens and
androgens. It is understood that estrogens mediate their effects through three receptors,
estrogen receptor alpha (ERα), estrogen receptor beta (ERβ), and G-protein coupled
estrogen receptor (GPER), but little is known about the role of androgens [12]. However,
it has been suggested that effects of progestogens and androgens mimic only in part the
differences in plasma lipids between men and women and that the factors mediating the
sex-specific regulation of plasma lipid kinetics and concentrations are still to be elucidated
[64].
Analysis of lipid association networks shows a negative association between HDL
cholesterol and HDL triglycerides (Figure 4A,B) which is physiologically consistent [65].
The ratio between HDL triglycerides and cholesterol (TG/HDL-C ratio) can be viewed as
an index of insulin resistance based on comparisons of the ratio to measures of insulin
resistance [66,67], and there is evidence for the association of high TG and low HDL-C
with resistance to insulin-stimulated glucose uptake by peripheral tissues independently
of body habitus and physical fitness, and that insulin resistance has an effect on plasma
insulin, TG, and HDL concentrations [68].
Comparison of the lipid association networks shows that the TG and HDL cholesterol
association is stronger in women than in men (despite the smaller number of women in
the study): reduction or modification in the correlation between the concentration profiles
may indicate remodulation or rewiring of metabolic or biochemical processes involving
these molecules [33]. Reduced correlation of HDL triglycerides and cholesterol in men
may reflect the well-known sexual dimorphism of insulin resistance and sensitivity [69–
71]: women show higher insulin sensitivity (hence lower resistance) than men, and this
has also been confirmed by studies using animal models [69,72,73].
We also observed remodulation of the ratios between HDL free cholesterol and HDL
cholesterol and LD free cholesterol and LDL cholesterol, but the remodulations are more
pronounced when comparing the age groups and will be discussed later.
3.4. Consideration Regarding Age Groups
Conventionally, “elderly” has been defined as a chronological age of 65 years old or
older [74], and the World Health Organization uses this convenience thresholding [75,76].
Aging is a continuous process, and different functions are differentially affected by
aging: muscle mass decreases by approximately 3–8% per decade after the age of 30 [77];
the thymus shrinks from birth at a rate of approximately 3% per year until middle age,
and at a rate of 1% per year thereafter [78]; women fertility peaks around the late 20s and
then starts declining [79,80].
This study cohort is relatively young: 43 years for women and 40 years for men, as
reported in Table 1, and we have set the thresholds (see Table 1) based on the observed
age distributions in men and women [17], thus investigating the extremes of the
distribution, purposively excluding the middle age groups, to avoid combinatorial
increase in possible comparisons and to maximize the power of the analysis to investigate
what can be considered early effects of aging in a healthy population.
3.5. Age Affects Lipoproteins and Lipid Fraction Profiles in Healthy Subjects
The analysis of lipidome profiles of the young and old groups indicates that aging
(although this a relatively young study group) may affect men and women in a different
way; however, the landscape is much more nuanced.
Metabolites 2021, 11, 326 15 of 27
Overall, the lipid fractions responsible for the differences in the lipidomic profiles of
men’s and women’s age groups are vastly the same and are highlighted by several
analyses (see Table 7). We observed age effects on IDL triglycerides only in men, while
the LDL phospholipid fraction is affected only in women.
LDL, which is cholesterol-rich, is formed in the bloodstream through the catabolism
of VLDL at the surface of blood vessels, and the production of a cholesterol-rich
lipoprotein from a triglyceride-rich lipoprotein occurs by selective removal of triglyceride
from VLDL [81]. IDL can be cleared after uptake by the liver or can be processed to become
LDL, and inefficient clearance of IDL tends to lead to increased LDL production [81]. We
observed significantly increased concentration of all IDL fractions in old men with respect
to young men, in fact suggesting reduced IDL clearance; however, we observed only a
significant increase in LDL triglycerides.
Increased IDL concentrations may result from decreased clearance due to reduced
lipoprotein lipase (LPL, an enzyme that catalyzes the hydrolysis of triglycerides in
triglyceride-rich lipoproteins [82]) activity on the vascular endothelium, which, in turn,
may result from either decreased synthesis or inadequate binding of this enzyme by HSPG
(heparan sulphate proteoglycans, a class of glycoproteins, containing one or more
covalently attached heparan sulphate chains, a type of glycosaminoglycan [83]). The
lipoprotein lipase activity of adipose tissue has been found to decrease with age in male
rat and mouse models [84,85], and this reduction seems to be less prominent in female
animals [84,85]. Interestingly, network analysis reveals (Figures 4C,D and 7B)
remodulation of the correlation patterns of IDL triglycerides and in particular a marked
decrease in the correlation between IDL triglycerides and ILD phospholipids, which also
suggests remodulation of lipoprotein lipase activity. Taken together, our results indicate
possible age-dependent remodulation of lipase lipoprotein activity in men but not in
women. Several studies show that lipoprotein lipase activity is more stable in women than
in men: for instance, muscle and adipose tissue LPL activity was found to be increased
significantly in men but not in women after physical exercise [86] and to be higher in
women than in men [87]. Another study, while reporting no difference in LPL activity
between sexes, reported that LPL mRNA was 160% higher in women than in men [88],
which suggests enhanced regulation in women that could explain the higher resilience of
LPL in women with respect to external stimuli and aging.
We observed a significantly increased concentration of LDL (specifically cholesterol,
free cholesterol, phospholipids, and apo-B) in older women with respect to younger ones.
The increase in LDL levels is consistent with the observation that in women the transition
towards menopause results in a loss of the estrogen cardioprotective effect. Although the
study group is relatively young, the median age of the “old women” group is 55 years:
we cannot ascertain the menopausal status of the subjects (information missing in the
clinical records), but we should consider that in Italy the average menopausal age can be
placed around 49–51 years [89–91]; thus, the “old women” study group can probably be
considered to be in a peri-menopausal status.
Many mechanisms have been proposed by which endogenous estrogens may protect
against cardiovascular disease, including antioxidant effects [92], antiplatelet effects [93]
and, of course, remodulation of plasma lipid profiles [94,95]. During menopause,
endogenous estradiol (E2) levels decrease, accompanied by an increase in LDL cholesterol
with plasma levels that can exceed those of age-matched men [95], a trend that we also
observed in this study (Table 2).
As previously mentioned, differential network analysis suggests an age-dependent
remodulation of the association between HDL free cholesterol and HDL cholesterol and
LD free cholesterol and LDL cholesterol. This remodulation is present in both men’s and
women’s networks (Figure 4C–F).
Cholesterol is present as unesterified (free) and esterified portions in the body fluids,
and while free cholesterol is biologically active and has cytotoxic effects, the cholesteryl
ester (CE) is a protective form for storage in the cells and transporting in plasma [53,96].
Metabolites 2021, 11, 326 16 of 27
The free cholesterol is shielded by first being converted to acyl ester, which then binds to
proteins by taking part in lipoprotein structure [53]. LDL and HDL possess atherogenic
and antiatherogenic properties, respectively, and it has been suggested that the
atherogenicity may be determined by the ratio between unesterified (free) and esterified
cholesterol [53]. Unesterified cholesterol is mobilized from peripheral tissues and other
lipoproteins to HDL, with the help of transporters of ABC-A1, ABC-G1, and receptors of
SR-B1 [97]. In HDL, free cholesterol is esterified rapidly by LCAT (lecithin-cholesterol
acyltransferase) and cofactor of apoA I [98]. Esterification causes a concentration gradient
and draws in cholesterol from tissues or other lipoproteins. Finally, cholesteryl esters are
transferred to lighter fractions by CETP (cholesteryl ester transfer proteins) to deliver to
the liver for excretion [53].
We observed a reduction in the strength of the association between HDL free
cholesterol and HLD cholesterol in both old men and women, which suggests that
mechanisms controlling the ratio between the esterified and non-esterified cholesterol
may undergo a remodulation with age. Although altered activity of LCAT has been
observed in several diseases such as cancer [99] and diabetes [100], the relationship
between variations in plasma LCAT activity and subclinical atherosclerosis is unclear
[101]. Increased activity of LCAT has been observed in metabolic syndrome and suggested
to be a marker of subclinical atherosclerosis, indicating that elevated LCAT is not
necessarily beneficial for cardioprotection [101], and other studies on Type 2 diabetes
subjects indicate that increased LCAT activity may contribute to impaired or reduced
antioxidative functionality of HDL [102]. Lecithin-cholesterol acyltransferase mass was
found to be correlated with both enzyme activity and the molar cholesterol esterification
rate, and its mass to be positively correlated with age [103]: this leads us to speculate that
what is reflected in the modification of lipid association networks may be increased LCAT
activity leading to a reshaping of the ratios between esterified and non-esterified HDL
cholesterol.
4. Materials and Methods
4.1. Study Population
The study population includes 844 healthy volunteers, of which are 183 women and
661 men, with a median age of 43 ± 12 yrs and 40 ± 11 yrs, respectively. The participants
in this study were selected from the Tuscany section of the Italian Association of Blood
Donors (AVIS) in the Transfusion Service of the Pistoia Hospital.
Plasma samples were obtained according to the Italian guidelines for blood
donations (Annex III of the Decree of the Italian Ministry of Health of 2 November 2015
on “Provisions relating to the quality and safety requirements of blood and blood
components”), restricting donors to age 18−60 years, body weight >50 kg, systolic blood
pressure 110−148 mmHg, diastolic blood pressure 60−100 mmHg, hemoglobin >13.5 g/dL
for men and >12.5 g/dL for women; absence of (manifested) infectious diseases, absence
of chronic diseases, no current menstruation, no consumption of medicines within 1 week
before donation (bd) or according to the active substance and the pharmacokinetics of the
prescribed drug and the disease being treated, no common diseases (such as flu, cold,
bronchitis) within 2 weeks bd, no surgery within 3 months bd, no endoscopic exams
within 4 months bd, no pregnancy within 12 months bd, no abortion within 4 months bd,
no travel to tropical countries within 6 months bd, and, in particular, no sport activity
within 24 h bd. Further details can be found in previous publications [17,25,26].
4.2. Study Data
We made use of publicly available data [104]. NMR data used to quantify
lipoproteins and lipid main fractions are available in the Metabolights database [105] with
accession number MTBLS147 [25]. Full details on sample collection and NMR experiments
are given below for the reader’s convenience.
Metabolites 2021, 11, 326 17 of 27
4.3. Sample Collection and Handling
All samples were collected under a fasting condition. Ethylenediaminetetraacetic
acid (EDTA) plasma samples were collected and handled according to Standard
Operating Procedures as described in [106] and stored at −80 C until NMR analysis at the
time of the original study [104].
4.4. NMR Sample Preparation
Frozen plasma samples were thawed at room temperature and shaken before use
[106]. A total of 300 μL of a sodium phosphate buffer (10.05 g Na2HPO4·7H2O; 0.2 g NaN3;
0.4 g sodium trimethylsilyl [2,2,3,3-2H4] propionate (TMSP) in 500 mL of H2O with 20%
(v/v) 2H2O; pH 7.4) was added to 300 μL of each plasma sample, and the mixture was
homogenized by vortexing for 30 s. A total of 450 μL of this mixture was transferred to a
4.25 mm NMR tube (Bruker BioSpin srl, Rheinstetten, Germany) for analysis.
4.5. NMR Analysis and Lipoprotein Quantification
One-dimensional 1H NMR spectra for all plasma samples were acquired, at the time
of the original study [104], using a Bruker 600 MHz spectrometer (Bruker BioSpin)
operating at 600.13 MHz proton Larmor frequency and equipped with a 5 mm CPTCI 1H-13C-31P and 2H-decoupling cryoprobe including a z-axis gradient coil, automatic tuning-
matching (ATM), and an automatic sample changer. A BTO 2000 thermocouple served for
temperature stabilization within an uncertainty of ~0.1 K at the sample. Before
measurement, samples were kept for at least 3 min inside the NMR probehead for
temperature equilibration at 310 K. One-dimensional water-suppressed Nuclear
Overhauser Effect SpectroscopY pulse sequence (NOESY 1Dpresat) was used to obtain
NMR spectra in which signals of both low-molecular and high-molecular weight
components are present; 64 Free induction decays (FIDs) were collected into 98,304 data
points over a spectral width of 18,028 Hz, with an acquisition time of 2.7 s, a relaxation
delay of 4 s, and a mixing time of 0.01 s. FIDs were multiplied by an exponential function
equivalent to a 1.0 Hz line-broadening factor before applying Fourier transformation.
Transformed spectra were automatically corrected for phase and baseline distortions and
calibrated (glucose anomeric doublet at 5.24 ppm) using TopSpin 3.2 (Bruker Biospin srl).
Lipoprotein quantification was performed using the Bruker IVDr Lipoprotein
Subclass Analysis platform™ (Bruker Biospin). This approach utilizes a PLS regression
model to perform lipoprotein subclass analysis on 1H NMR NOESY spectra [107,108]. The
main VLDL, IDL, LDL and HDL classes, six VLDL subclasses VLDL-1 to VLDL-6, six LDL
sub-classes LDL-1 to LDL-6, four HDL-subclasses HDL-1 to HDL-4 were quantified. Only
the lipoprotein main fractions (Apo-A1 HDL, Apo-A2 HDL, Apo-B VLDL, Apo-B IDL,
Apo-B LDL, Cholesterol VLDL, Cholesterol IDL, Cholesterol LDL, Cholesterol HDL, Free
cholesterol VLDL, Free cholesterol IDL, Free cholesterol LDL, Free cholesterol HDL,
Phospholipids VLDL, Phospholipids IDL, Phospholipids LDL, Phospholipids HDL,
Triglycerides VLDL, Triglycerides IDL, Triglycerides LDL, Triglycerides HDL) were
taken into account in the present analysis.
The dataset is available at the NIH Common Fund’s National Metabolomics Data
Repository (NMDR) website, the Metabolomics Workbench,
www.metabolomicsworkbench.org where it has been assigned as Study ID ST001785.
Metabolites 2021, 11, 326 18 of 27
4.6. Definition of Age Groups
Study subjects were divided into young (Y) and old (O) using the same approach
used in [17], taking as boundaries the lower 33% and upper 67% percentiles of the age
distribution of men and women, separately. Since the two distributions are different, age
boundaries for the Y and O groups are also different for men and women. Percentiles and
group size are shown in Table 1.
4.7. Statistical Analysis
4.7.1. Data Pre-Processing
Data were adjusted for heteroscedasticity by taking the square root of concentrations
[109,110].
4.7.2. Univariate Analysis
The Mann–Whitney–Wilcoxon rank-sum test [111] was used to compare and assess
statistical significance of differences in lipid concentrations between the groups of interest:
men vs women, young men vs old men, and young women vs old women. Bonferroni
multiple testing correction [112] was applied to reduce the risk of false positives. An
adjusted p-value < 0.01 was deemed significant.
4.7.3. ROC Analysis
Analysis of receiver operating characteristic (ROC) curves [113] was performed to
assess the accuracy of the concentration of lipoproteins and lipid main fractions in
discriminating between subject groups (W-M, YM-OM, YW-OW). ROC analysis allows
testing of accuracy over the entire range of protein concentration, and it does not require
a predetermined cut-off point to distinguish between discrimination and non-
discriminating proteins; in addition, ROC analysis is not dependent on the group size.
The area under the ROC (AUC) was obtained for each lipoprotein and lipid main fraction
independently when comparing the study groups, with the associated 95% confidence
interval, the corresponding accuracy, specificity and sensitivity and the estimated best
concentration threshold; 95% CI were computed with 2000 stratified bootstrap replicates.
The statistical significance of the AUC was obtained as the p-value of the
corresponding Mann–Whitney–Wilcoxon test [111], since the U test statistic is equivalent
to the area under the receiver operating characteristic curve (AUC = U/n1n2 where n1 and
n2 are the size of the two groups) since the same Null Hypothesis is tested [114,115].
4.7.4. Multivariate Analysis
Exploratory Analysis
Principal Component Analysis (PCA) [116–118] was applied to explore data patterns.
Data were scaled to unit variance before analysis [110].
Dimensionality Assessment
Data dimensionality assessment, which is the determination of the number of
significant principal components needed to describe information but not noise in the data,
was performed testing the eigenvalues of the covariance data matrix using a testing
procedure based on the Tracy–Widom distribution [119–121]. Briefly, the test compares
the eigenvalues with the eigenvalue distribution that is expected under the null
hypothesis of all variables being uncorrelated. A significance threshold of α = 0.001 was
used. The test was applied on the (covariance matrix calculated from the) full men’s and
women’s datasets and on the young/old men and young/old women, separately.
Metabolites 2021, 11, 326 19 of 27
Predictive Modeling
The Random Forest (RF) algorithm [122,123] was employed for pairwise
classification of the lipid profiles of men and women, young men and old men, and young
women and old women. Predictive models were built using a repeated cross-validation:
the data were divided into a training set, with which the model was build based on the
lipoprotein main fractions, and a testing set, with which the model was validated.
Data unbalance was taken into account for the model comparing men’s and women’s
lipid profiles by using a stratified data sampling, sampling datasets of equal size from
both men’s and women’s datasets: the sample size is equal to that of 85% of the smallest
of the two groups; 100 resampling iterations were performed to take into account the
(re)sampling variability.
Accuracy, sensitivity, specificity, and the area under the receiver operating
characteristic were calculated according to the standard definitions [124]. Average values
and 95% confidence interval (CI) are calculated over the 100 resampling.
Significance of the model was determined using a permutation-test: Random Forest
predictive models were built after class labels were randomly permuted k = 1000 times to
build a null distribution Dperm for each model quality from which the corresponding p-
values were calculated as (for AUC):
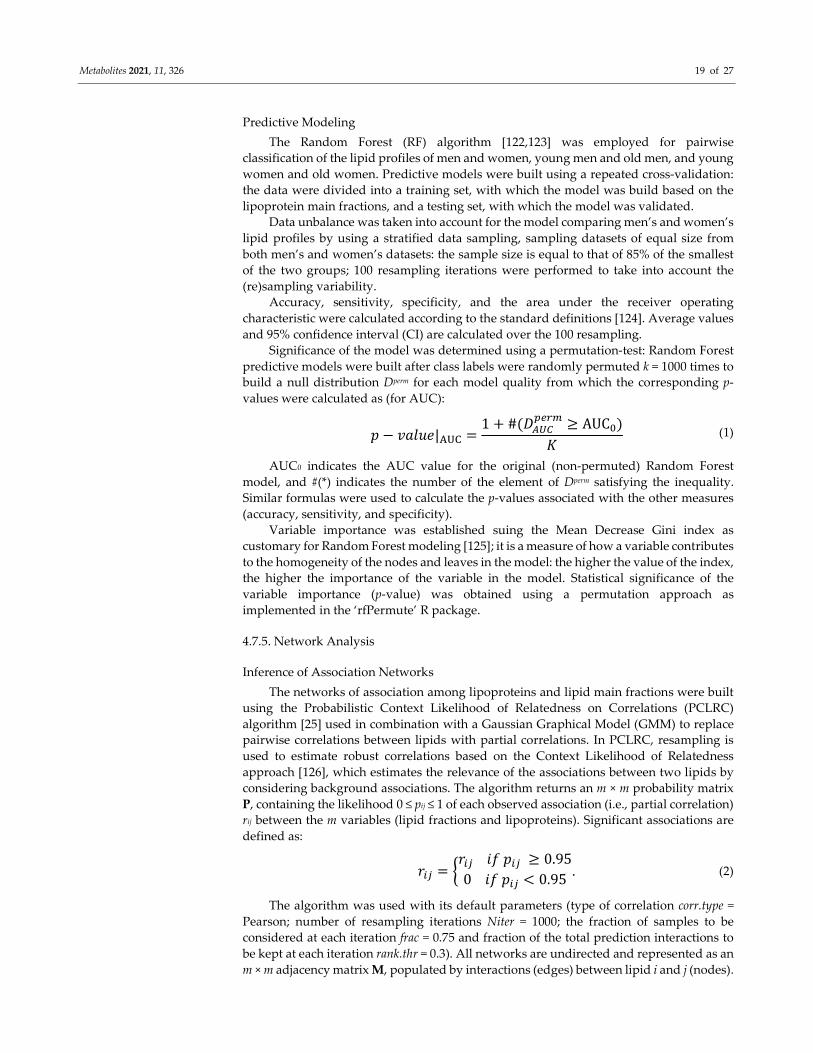
� − �����|��� =1 + #(����
����≥ AUC�)
� (1)
AUC0 indicates the AUC value for the original (non-permuted) Random Forest
model, and #(*) indicates the number of the element of Dperm satisfying the inequality.
Similar formulas were used to calculate the p-values associated with the other measures
(accuracy, sensitivity, and specificity).
Variable importance was established suing the Mean Decrease Gini index as
customary for Random Forest modeling [125]; it is a measure of how a variable contributes
to the homogeneity of the nodes and leaves in the model: the higher the value of the index,
the higher the importance of the variable in the model. Statistical significance of the
variable importance (p-value) was obtained using a permutation approach as
implemented in the ‘rfPermute’ R package.
4.7.5. Network Analysis
Inference of Association Networks
The networks of association among lipoproteins and lipid main fractions were built
using the Probabilistic Context Likelihood of Relatedness on Correlations (PCLRC)
algorithm [25] used in combination with a Gaussian Graphical Model (GMM) to replace
pairwise correlations between lipids with partial correlations. In PCLRC, resampling is
used to estimate robust correlations based on the Context Likelihood of Relatedness
approach [126], which estimates the relevance of the associations between two lipids by
considering background associations. The algorithm returns an m × m probability matrix
P, containing the likelihood 0 ≤ pij ≤ 1 of each observed association (i.e., partial correlation)
rij between the m variables (lipid fractions and lipoproteins). Significant associations are
defined as:
��� = ���� �� ��� ≥ 0.95
0 �� ��� < 0.95. (2)
The algorithm was used with its default parameters (type of correlation corr.type =
Pearson; number of resampling iterations Niter = 1000; the fraction of samples to be
considered at each iteration frac = 0.75 and fraction of the total prediction interactions to
be kept at each iteration rank.thr = 0.3). All networks are undirected and represented as an
m × m adjacency matrix M, populated by interactions (edges) between lipid i and j (nodes).
Metabolites 2021, 11, 326 20 of 27
Gaussian Graphical Modeling
Partial correlations were estimated using a Gaussian Graphical Model with the
GeneNet approach [37] as implemented in the GeneNet R package [37,127]. GeneNet
allows estimation of a GMM from a small sample of high-dimensional data in a
computationally and statistically efficient way. It uses an analytic shrinkage estimation of
covariance and partial correlation matrices and performs optimal model selection based
on local false discovery rate multiple testing. The edges (i.e., the associations) between
nodes (i.e., lipoproteins and lipid main fractions) to be included in the final association
network are selected using a computational algorithm depending on the relative values
of the pairwise partial correlations. For more details about the GeneNet algorithm
implementation, we refer to the original publication [37].
Differential Network Analysis
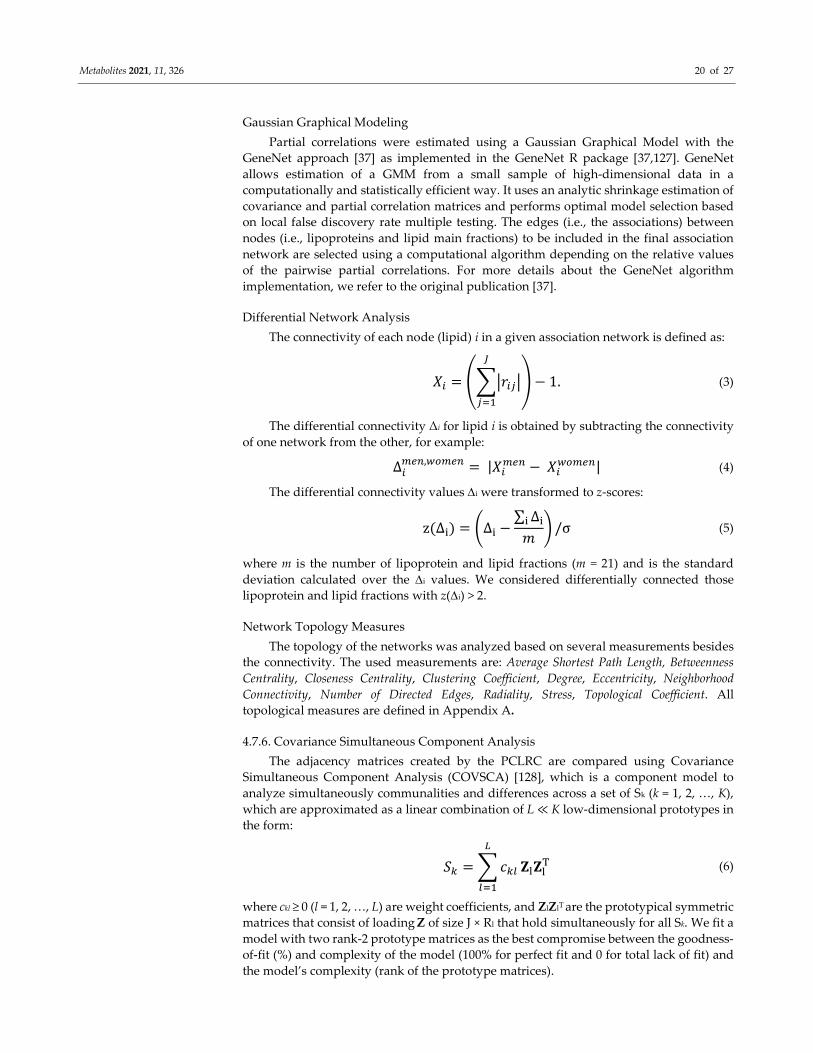
The connectivity of each node (lipid) i in a given association network is defined as:
�� = �������
�
���
� − 1. (3)
The differential connectivity Δi for lipid i is obtained by subtracting the connectivity
of one network from the other, for example:
����,����� = |��
��� − �������| (4)
The differential connectivity values i were transformed to z-scores:
z(∆�) = �∆� −∑ ∆��
�� /σ (5)
where m is the number of lipoprotein and lipid fractions (m = 21) and is the standard
deviation calculated over the i values. We considered differentially connected those
lipoprotein and lipid fractions with z(i) > 2.
Network Topology Measures
The topology of the networks was analyzed based on several measurements besides
the connectivity. The used measurements are: Average Shortest Path Length, Betweenness
Centrality, Closeness Centrality, Clustering Coefficient, Degree, Eccentricity, Neighborhood
Connectivity, Number of Directed Edges, Radiality, Stress, Topological Coefficient. All
topological measures are defined in Appendix A.
4.7.6. Covariance Simultaneous Component Analysis
The adjacency matrices created by the PCLRC are compared using Covariance
Simultaneous Component Analysis (COVSCA) [128], which is a component model to
analyze simultaneously communalities and differences across a set of Sk (k = 1, 2, …, K),
which are approximated as a linear combination of L ≪ K low-dimensional prototypes in
the form:
�� = � ���
�
���
����� (6)
where ckl ≥ 0 (l = 1, 2, …, L) are weight coefficients, and ZlZlT are the prototypical symmetric
matrices that consist of loading Z of size J × Rl that hold simultaneously for all Sk. We fit a
model with two rank-2 prototype matrices as the best compromise between the goodness-
of-fit (%) and complexity of the model (100% for perfect fit and 0 for total lack of fit) and
the model’s complexity (rank of the prototype matrices).
Metabolites 2021, 11, 326 21 of 27
Loadings were transformed to z-scores (see Method Section Differential network
analysis for details). Only loadings with z ≥ 1 were retained in the analysis.
4.7.7. Software
Calculations were performed in R [129] and Matlab 2019b (The MathWorks, Natick,
MA, USA, 2017). The function ‘prcomp’ from the R package ‘stats’ (version 4.0.1.) was
used for the Principal Components Analysis. The function ‘wilcox.test’ from the R
package ‘’stats’’ (version 4.0.1) was used for the Wilcoxon rank-sum test. The function
‘p.adjust’ from the package ‘stats’ native to R [129] was used for correcting the p-values
for multiple testing. The function ‘randomForest’ from the package ‘randomForest’ [130]
was used for the Random Forest. The ‘rfPermute’ function from the ‘rfPermute’ package
[131] was used to obtain p-values for the Mean Decrease Gini indexes.
ROC analysis was performed using the R package pROC [132].
The function ‘ggm.estimate.pcor’ from the package ‘GeneNet’ [127] (version 1.2.15)
was used for estimation of the partial correlations. For the Random Forest models, the
accuracy, sensitivity, and specificity were calculated using the ‘confusionMatrix’ function
from the ‘caret’ R package [133]. The AUC was calculated using the ‘colAUC’ function
from the ‘caTools’ R package.
Code for network inference using GMM, differential network analysis and
Covariance Simultaneous Component Analysis is available at systemsbiology.nl under
the software tab.
Cytoscape [134] (version 3.7.0) was used for network visualization; the Network
Analyzer [135] Cytoscape plugin [135] was used to calculate the topological measures.
5. Conclusions
In this study, we have identified relevant alterations in the levels and in the pattern
of association of lipoprotein fractions in relation to sex and age, using univariate and
multivariate statistics and differential network analysis. These observations from the
correlation networks, in turn, point to the underlying structure of metabolic mechanisms,
indicating a possible age-dependent remodulation of lipase lipoprotein activity in men
and a change in the mechanisms controlling the ratio between esterified and non-
esterified cholesterol (through the activity of LCAT) in both men and women. The present
article highlights the effectiveness of plasma lipidomics by NMR as a powerful (but still
underrated with respect to, e.g., metabolomics) discovery tool to explore individuals’
characteristics at the biochemical level. As such, it could rapidly evolve into new clinical
tools for clinical research and personalized medicine approaches. It is plausible that, in
the near future, plasma lipidomics will expand the common clinical paradigm (which
usually includes only TC, HDL, and LDL) to include a more comprehensive lipidomic
profile to provide a more accurate characterization of patients’ pathophysiological
conditions.
Author Contributions: Conceptualization, E.S., A.V., and L.T.; methodology, E.S.; software, E.S.;
formal analysis, Y.B.; investigation, E.S.; resources, A.V., L.T., and C.L.; data curation, A.V.;
writing—original draft preparation, Y.B.; writing—review and editing, E.S., A.V., L.T., and C.L.;
supervision, E.S. All authors have read and agreed to the published version of the manuscript.
Funding: This research received no external funding.
Institutional Review Board Statement: Not applicable. We made use of re-processed publicly
available data. No patient was involved in the present study, nor were new samples collected.
Informed Consent Statement: Informed consent was obtained from all subjects involved at the time
of the original study whose data are publicly available. No patient or sample collection was involved
in the present study.
Data Availability Statement: Lipoprotein and lipid fraction data are available at the NIH Common
Fund’s National Metabolomics Data Repository (NMDR) website, the Metabolomics Workbench,
Metabolites 2021, 11, 326 22 of 27
https://www.metabolomicsworkbench.org, where it has been assigned Project ID ST001785. The
data can be accessed directly via its Project https://doi.org/ST001785.
Acknowledgments: The authors acknowledge Instruct-ERIC, a Landmark ESFRI project, and
specifically the CERM/CIRMMP Italy Centre.
Conflicts of Interest: The authors declare no conflicts of interest.
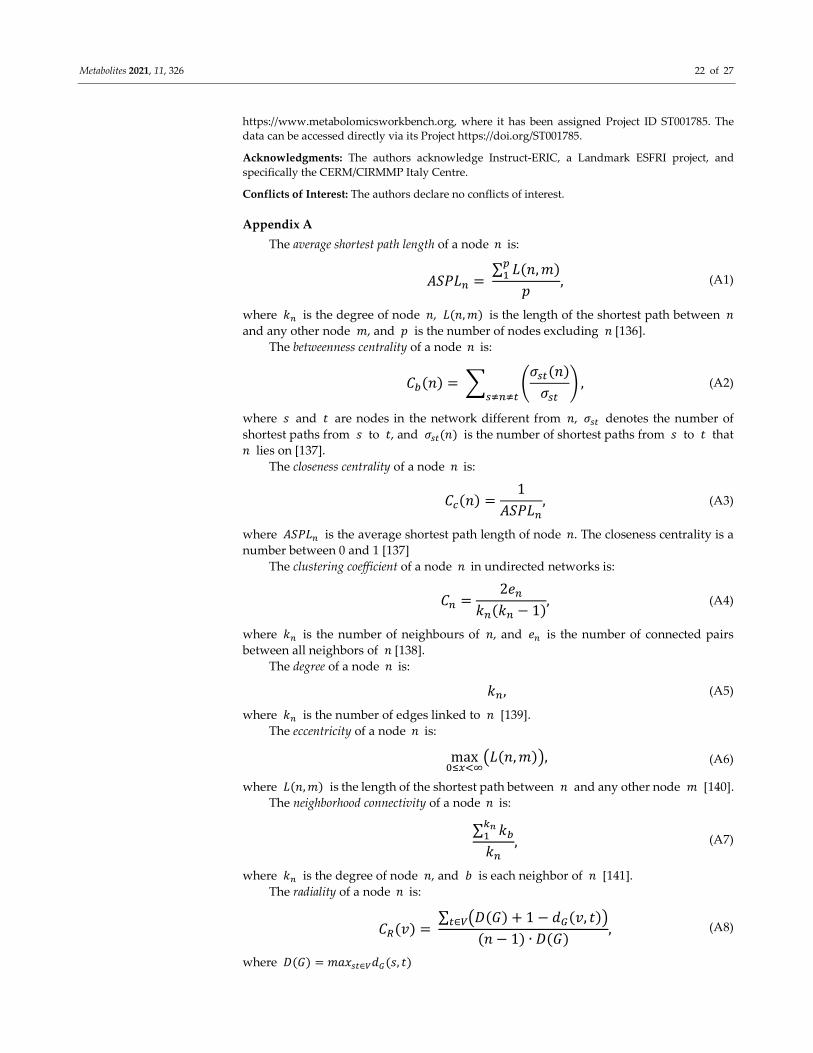
Appendix A
The average shortest path length of a node � is:
����� = ∑ �(�, �)�
�
�, (A1)
where �� is the degree of node �, �(�, �) is the length of the shortest path between �
and any other node �, and � is the number of nodes excluding � [136].
The betweenness centrality of a node � is:
��(�) = � ����(�)
���� ,
����� (A2)
where � and � are nodes in the network different from �, ��� denotes the number of
shortest paths from � to �, and ���(�) is the number of shortest paths from � to � that
� lies on [137].
The closeness centrality of a node � is:
��(�) =1
�����, (A3)
where ����� is the average shortest path length of node �. The closeness centrality is a
number between 0 and 1 [137]
The clustering coefficient of a node � in undirected networks is:
�� =2��
��(�� − 1), (A4)
where �� is the number of neighbours of �, and �� is the number of connected pairs
between all neighbors of � [138].
The degree of a node � is:
��, (A5)
where �� is the number of edges linked to � [139].
The eccentricity of a node � is:
max�����
��(�, �)�, (A6)
where �(�, �) is the length of the shortest path between � and any other node � [140].
The neighborhood connectivity of a node � is:
∑ �����
��, (A7)
where �� is the degree of node �, and � is each neighbor of � [141].
The radiality of a node � is:
��(�) = ∑ ��(�) + 1 − ��(�, �)��∈�
(� − 1) ∙ �(�), (A8)
where �(�) = �����∈���(�, �)
Metabolites 2021, 11, 326 23 of 27
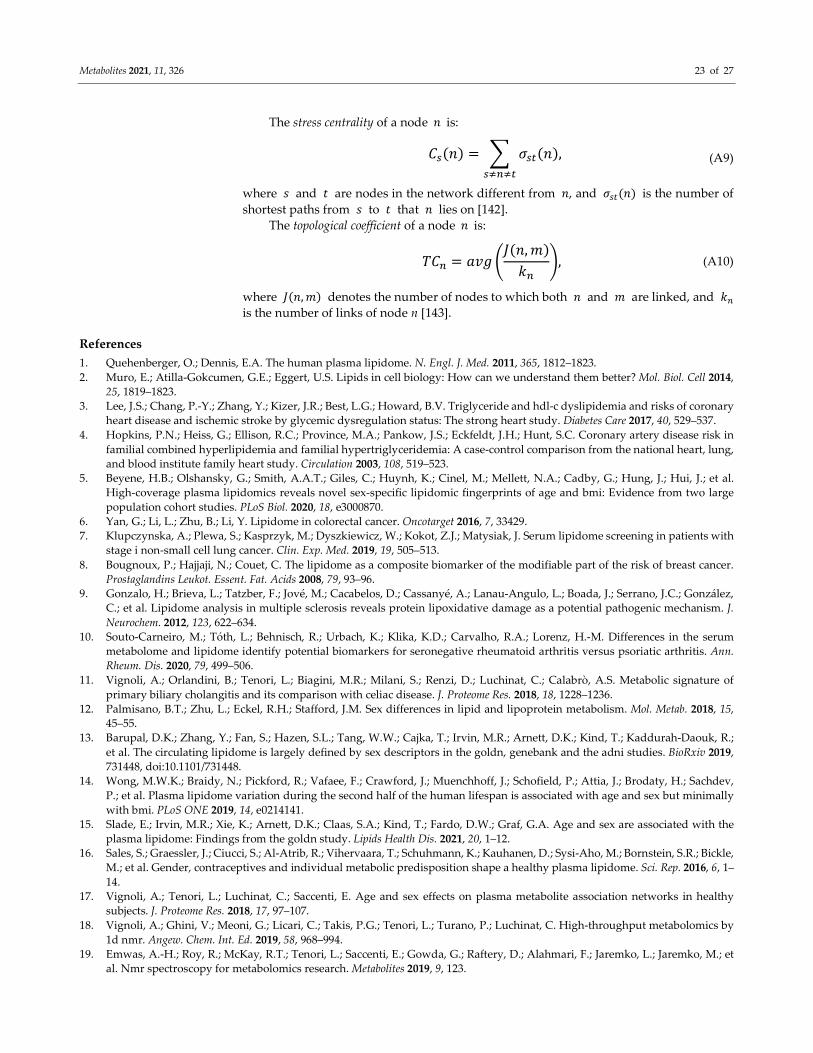
The stress centrality of a node � is:
��(�) = � ���(�)
�����
, (A9)
where � and � are nodes in the network different from �, and ���(�) is the number of
shortest paths from � to � that � lies on [142].
The topological coefficient of a node � is:
��� = ��� ��(�, �)
���, (A10)
where �(�, �) denotes the number of nodes to which both � and � are linked, and ��
is the number of links of node n [143].
References
1. Quehenberger, O.; Dennis, E.A. The human plasma lipidome. N. Engl. J. Med. 2011, 365, 1812–1823.
2. Muro, E.; Atilla-Gokcumen, G.E.; Eggert, U.S. Lipids in cell biology: How can we understand them better? Mol. Biol. Cell 2014,
25, 1819–1823.
3. Lee, J.S.; Chang, P.-Y.; Zhang, Y.; Kizer, J.R.; Best, L.G.; Howard, B.V. Triglyceride and hdl-c dyslipidemia and risks of coronary
heart disease and ischemic stroke by glycemic dysregulation status: The strong heart study. Diabetes Care 2017, 40, 529–537.
4. Hopkins, P.N.; Heiss, G.; Ellison, R.C.; Province, M.A.; Pankow, J.S.; Eckfeldt, J.H.; Hunt, S.C. Coronary artery disease risk in
familial combined hyperlipidemia and familial hypertriglyceridemia: A case-control comparison from the national heart, lung,
and blood institute family heart study. Circulation 2003, 108, 519–523.
5. Beyene, H.B.; Olshansky, G.; Smith, A.A.T.; Giles, C.; Huynh, K.; Cinel, M.; Mellett, N.A.; Cadby, G.; Hung, J.; Hui, J.; et al.
High-coverage plasma lipidomics reveals novel sex-specific lipidomic fingerprints of age and bmi: Evidence from two large
population cohort studies. PLoS Biol. 2020, 18, e3000870.
6. Yan, G.; Li, L.; Zhu, B.; Li, Y. Lipidome in colorectal cancer. Oncotarget 2016, 7, 33429.
7. Klupczynska, A.; Plewa, S.; Kasprzyk, M.; Dyszkiewicz, W.; Kokot, Z.J.; Matysiak, J. Serum lipidome screening in patients with
stage i non-small cell lung cancer. Clin. Exp. Med. 2019, 19, 505–513.
8. Bougnoux, P.; Hajjaji, N.; Couet, C. The lipidome as a composite biomarker of the modifiable part of the risk of breast cancer.
Prostaglandins Leukot. Essent. Fat. Acids 2008, 79, 93–96.
9. Gonzalo, H.; Brieva, L.; Tatzber, F.; Jové, M.; Cacabelos, D.; Cassanyé, A.; Lanau-Angulo, L.; Boada, J.; Serrano, J.C.; González,
C.; et al. Lipidome analysis in multiple sclerosis reveals protein lipoxidative damage as a potential pathogenic mechanism. J.
Neurochem. 2012, 123, 622–634.
10. Souto-Carneiro, M.; Tóth, L.; Behnisch, R.; Urbach, K.; Klika, K.D.; Carvalho, R.A.; Lorenz, H.-M. Differences in the serum
metabolome and lipidome identify potential biomarkers for seronegative rheumatoid arthritis versus psoriatic arthritis. Ann.
Rheum. Dis. 2020, 79, 499–506.
11. Vignoli, A.; Orlandini, B.; Tenori, L.; Biagini, M.R.; Milani, S.; Renzi, D.; Luchinat, C.; Calabrò, A.S. Metabolic signature of
primary biliary cholangitis and its comparison with celiac disease. J. Proteome Res. 2018, 18, 1228–1236.
12. Palmisano, B.T.; Zhu, L.; Eckel, R.H.; Stafford, J.M. Sex differences in lipid and lipoprotein metabolism. Mol. Metab. 2018, 15,
45–55.
13. Barupal, D.K.; Zhang, Y.; Fan, S.; Hazen, S.L.; Tang, W.W.; Cajka, T.; Irvin, M.R.; Arnett, D.K.; Kind, T.; Kaddurah-Daouk, R.;
et al. The circulating lipidome is largely defined by sex descriptors in the goldn, genebank and the adni studies. BioRxiv 2019,
731448, doi:10.1101/731448.
14. Wong, M.W.K.; Braidy, N.; Pickford, R.; Vafaee, F.; Crawford, J.; Muenchhoff, J.; Schofield, P.; Attia, J.; Brodaty, H.; Sachdev,
P.; et al. Plasma lipidome variation during the second half of the human lifespan is associated with age and sex but minimally
with bmi. PLoS ONE 2019, 14, e0214141.
15. Slade, E.; Irvin, M.R.; Xie, K.; Arnett, D.K.; Claas, S.A.; Kind, T.; Fardo, D.W.; Graf, G.A. Age and sex are associated with the
plasma lipidome: Findings from the goldn study. Lipids Health Dis. 2021, 20, 1–12.
16. Sales, S.; Graessler, J.; Ciucci, S.; Al-Atrib, R.; Vihervaara, T.; Schuhmann, K.; Kauhanen, D.; Sysi-Aho, M.; Bornstein, S.R.; Bickle,
M.; et al. Gender, contraceptives and individual metabolic predisposition shape a healthy plasma lipidome. Sci. Rep. 2016, 6, 1–
14.
17. Vignoli, A.; Tenori, L.; Luchinat, C.; Saccenti, E. Age and sex effects on plasma metabolite association networks in healthy
subjects. J. Proteome Res. 2018, 17, 97–107.
18. Vignoli, A.; Ghini, V.; Meoni, G.; Licari, C.; Takis, P.G.; Tenori, L.; Turano, P.; Luchinat, C. High-throughput metabolomics by
1d nmr. Angew. Chem. Int. Ed. 2019, 58, 968–994.
19. Emwas, A.-H.; Roy, R.; McKay, R.T.; Tenori, L.; Saccenti, E.; Gowda, G.; Raftery, D.; Alahmari, F.; Jaremko, L.; Jaremko, M.; et
al. Nmr spectroscopy for metabolomics research. Metabolites 2019, 9, 123.
Metabolites 2021, 11, 326 24 of 27
20. Rosato, A.; Tenori, L.; Cascante, M.; De Atauri Carulla, P.R.; Martins dos Santos, V.A.P.; Saccenti, E. From correlation to
causation: Analysis of metabolomics data using systems biology approaches. Metabolomics 2018, 14, 37.
21. Szymańska, E.; Bouwman, J.; Strassburg, K.; Vervoort, J.; Kangas, A.J.; Soininen, P.; Ala-Korpela, M.; Westerhuis, J.; van
Duynhoven, J.P.; Mela, D.J.; et al. Gender-dependent associations of metabolite profiles and body fat distribution in a healthy
population with central obesity: Towards metabolomics diagnostics. Omics J. Integr. Biol. 2012, 16, 652–667.
22. Jansen, J.J.; Szymańska, E.; Hoefsloot, H.C.; Smilde, A.K. Individual differences in metabolomics: Individualised responses and
between-metabolite relationships. Metabolomics 2012, 8, 94–104.
23. Saccenti, E.; Menichetti, G.; Ghini, V.; Remondini, D.; Tenori, L.; Luchinat, C. Entropy-based network representation of the
individual metabolic phenotype. J. Proteome Res. 2016, 15, 3298–3307.
24. Vignoli, A.; Tenori, L.; Giusti, B.; Valente, S.; Carrabba, N.; Balzi, D.; Barchielli, A.; Marchionni, N.; Gensini, G.F.; Marcucci, R.;
et al. Differential network analysis reveals metabolic determinants associated with mortality in acute myocardial infarction
patients and suggests potential mechanisms underlying different clinical scores used to predict death. J. Proteome Res. 2020, 19,
949–961.
25. Saccenti, E.; Suarez-Diez, M.; Luchinat, C.; Santucci, C.; Tenori, L. Probabilistic networks of blood metabolites in healthy subjects
as indicators of latent cardiovascular risk. J. Proteome Res. 2014, 14, 1101–1111.
26. Vignoli, A.; Tenori, L.; Luchinat, C.; Saccenti, E. Differential network analysis reveals molecular determinants associated with
blood pressure and heart rate in healthy subjects. J. Proteome Res. 2020, 19, 64–74.
27. Afzal, M.; Saccenti, E.; Madsen, M.B.; Hansen, M.B.; Hyldegaard, O.; Skrede, S.; Martins Dos Santos, V.A.P.; Norrby-Teglund,
A.; Svensson, M. Integrated univariate, multivariate, and correlation-based network analyses reveal metabolite-specific effects
on bacterial growth and biofilm formation in necrotizing soft tissue infections. J. Proteome Res. 2020, 19, 688–698,
doi:10.1021/acs.jproteome.1029b00565.
28. Jahagirdar, S.; Saccenti, E. Evaluation of single sample network inference methods for metabolomics-based systems medicine.
J. Proteome Res. 2021, 20, 932–949.
29. Gini, C. Variabilità e Mutuabilità. Contributo Allo Studio Delle Distribuzioni e Delle Relazioni Statistiche; Cuppini: Bologna, Italy,
1912.
30. Suarez-Diez, M.; Adam, J.; Adamski, J.; Chasapi, S.A.; Luchinat, C.; Peters, A.; Prehn, C.; Santucci, C.; Spyridonidis, A.;
Spyroulias, G.A.; et al. Plasma and serum metabolite association networks: Comparability within and between studies using
nmr and ms profiling. J. Proteome Res. 2017, 16, 2547–2559.
31. Yu, Z.; Kastenmüller, G.; He, Y.; Belcredi, P.; Möller, G.; Prehn, C.; Mendes, J.; Wahl, S.; Roemisch-Margl, W.; Ceglarek, U.; et
al. Differences between human plasma and serum metabolite profiles. PLoS ONE 2011, 6, e21230.
32. Jahagirdar, S.; Saccenti, E. On the use of correlation and mi as a measure of metabolite—metabolite association for network
differential connectivity analysis. Metabolites 2020, 10, 171.
33. Jahagirdar, S.; Suarez-Diez, M.; Saccenti, E. Simulation and reconstruction of metabolite-metabolite association networks using
a metabolic dynamic model and correlation based-algorithms. J. Proteome Res. 2019, 18, 1099–1113.
34. Pearl, J. Causality, 2nd ed.; Cambridge University Press: Cambridge, UK, 2009.
35. Koller, D.; Friedman, N. Probabilistic Graphical Models: Principles and Techniques; MIT Press: Cambridge, MA, USA, 2009.
36. Epskamp, S.; Fried, E.I. A tutorial on regularized partial correlation networks. Psychol. Methods 2018, 23, 617.
37. Opgen-Rhein, R.; Strimmer, K. From correlation to causation networks: A simple approximate learning algorithm and its
application to high-dimensional plant gene expression data. BMC Syst. Biol. 2007, 1, 1–10.
38. Junker, B.H.; Schreiber, F. Analysis of Biological Networks; John Wiley & Sons: Hoboken, NJ, USA, 2011; Volume 2.
39. He, X.; Zhang, J. Why do hubs tend to be essential in protein networks? PLoS Genet 2006, 2, e88.
40. Carter, S.; Brechbuhler, C.; Griffin, M.; Bond, A. Gene co-expression network topology provides a framework for molecular
characterization of cellular state. Bioinformatics 2004, 20, 2242–2250.
41. Stuart, J.; Segal, E.; Koller, D.; Kim, S. A gene-coexpression network for global discovery of conserved genetic modules. Science
2003, 302, 249–255.
42. Jeong, H.; Mason, S.; Barabasi, A.; Oltvai, Z. Lethality and centrality in protein networks. Nature 2001, 411, 41–42.
43. Rzhetsky, A.; Gomez, S.M. Birth of scale-free molecular networks and the number of distinct DNA and protein domains per
genome. Bioinformatics 2001, 17, 988–996.
44. Yook, S.H.; Oltvai, Z.N.; Barabási, A.L. Functional and topological characterization of protein interaction networks. Proteomics
2004, 4, 928–942.
45. Hartwell, L.; Hopfield, J.; Leibler, S.; Murray, A. From molecular to modular cell biology. Nature 1999, 402, C47–C52.
46. Zheng, Y.; Qi, L. Diet and lifestyle interventions on lipids: Combination with genomics and metabolomics. Clin. Lipidol. 2014, 9,
417–427.
47. Hegele, R.A. Plasma lipoproteins: Genetic influences and clinical implications. Nat. Rev. Genet. 2009, 10, 109–121.
48. Mensink, R.P.; Zock, P.L.; Kester, A.D.; Katan, M.B. Effects of dietary fatty acids and carbohydrates on the ratio of serum total
to hdl cholesterol and on serum lipids and apolipoproteins: A meta-analysis of 60 controlled trials. Am. J. Clin. Nutr. 2003, 77,
1146–1155.
49. Parks, E.J. Effect of dietary carbohydrate on triglyceride metabolism in humans. J. Nutr. 2001, 131, 2772S–2774S.
50. Schmidt, J.A.; Fensom, G.K.; Rinaldi, S.; Scalbert, A.; Gunter, M.J.; Holmes, M.V.; Key, T.J.; Travis, R.C. Nmr metabolite profiles
in male meat-eaters, fish-eaters, vegetarians and vegans, and comparison with ms metabolite profiles. Metabolites 2021, 11, 121.
Metabolites 2021, 11, 326 25 of 27
51. Bani, M.; Strepparava, M.; Giussani, B. Gender differences and frequency of whole blood donation in italian donors: Even
though I want to, I cannot? Transfus. Apher. Sci. 2014, 50, 81–86.
52. Cohen, J. A power primer. Psychol. Bull. 1992, 112, 155.
53. Bagheri, B.; Alikhani, A.; Mokhtari, H.; Rasouli, M. The ratio of unesterified/esterified cholesterol is the major determinant of
atherogenicity of lipoprotein fractions. Med. Arch. 2018, 72, 103.
54. Saku, K.; Zhang, B.; Ohta, T.; Arakawa, K. Quantity and function of high density lipoprotein as an indicator of coronary
atherosclerosis. J. Am. Coll. Cardiol. 1999, 33, 436–443.
55. Rasouli, M.; Trischuk, T.C.; Lehner, R. Calmodulin antagonist w-7 inhibits de novo synthesis of cholesterol and suppresses
secretion of de novo synthesized and preformed lipids from cultured hepatocytes. Biochim. Biophys. Acta (BBA) Mol. Cell Biol.
Lipids 2004, 1682, 92–101.
56. Steinberg, D. The ldl modification hypothesis of atherogenesis: An update. J. Lipid Res. 2009, 50, S376–S381.
57. Abbott, R.D.; Garrison, R.J.; Wilson, P.; Epstein, F.H.; Castelli, W.P.; Feinleib, M.; LaRue, C. Joint distribution of lipoprotein
cholesterol classes. The framingham study. Arterioscler. Off. J. Am. Heart Assoc. Inc. 1983, 3, 260–272.
58. Cohn, J.S.; McNamara, J.; Cohn, S.; Ordovas, J.; Schaefer, E. Postprandial plasma lipoprotein changes in human subjects of
different ages. J. Lipid Res. 1988, 29, 469–479.
59. Jalali, M.T.; Honomaror, A.M.; Rekabi, A.; Latifi, M. Reference ranges for serum total cholesterol, hdl-cholesterol, ldl-cholesterol,
and vldl-cholesterol and triglycerides in healthy iranian ahvaz population. Indian J. Clin. Biochem. 2013, 28, 277–282.
60. Hanai, K.; Babazono, T.; Yoshida, N.; Nyumura, I.; Toya, K.; Hayashi, T.; Bouchi, R.; Tanaka, N.; Ishii, A.; Iwamoto, Y. Gender
differences in the association between hdl cholesterol and the progression of diabetic kidney disease in type 2 diabetic patients.
Nephrol. Dial. Transplant. 2012, 27, 1070–1075.
61. Madsen, C.M.; Varbo, A.; Nordestgaard, B.G. Extreme high high-density lipoprotein cholesterol is paradoxically associated
with high mortality in men and women: Two prospective cohort studies. Eur. Heart J. 2017, 38, 2478–2486.
62. Kim, H.J.; Park, H.A.; Cho, Y.G.; Kang, J.H.; Kim, K.W.; Kang, J.H.; Kim, N.-R.; Chung, W.-C.; Kim, C.H.; Whang, D.H.; et al.
Gender difference in the level of hdl cholesterol in korean adults. Korean J. Fam. Med. 2011, 32, 173.
63. Balder, J.W.; de Vries, J.K.; Nolte, I.M.; Lansberg, P.J.; Kuivenhoven, J.A.; Kamphuisen, P.W. Lipid and lipoprotein reference
values from 133,450 dutch lifelines participants: Age-and gender-specific baseline lipid values and percentiles. J. Clin. Lipidol.
2017, 11, 1055–1064.e6.
64. Wang, X.; Magkos, F.; Mittendorfer, B. Sex differences in lipid and lipoprotein metabolism: It's not just about sex hormones. J.
Clin. Endocrinol. Metab. 2011, 96, 885–893.
65. Tian, L.; Fu, M. The relationship between high density lipoprotein subclass profile and plasma lipids concentrations. Lipids
Health Dis. 2010, 9, 1–9.
66. McLaughlin, T.; Reaven, G.; Abbasi, F.; Lamendola, C.; Saad, M.; Waters, D.; Simon, J.; Krauss, R.M. Is there a simple way to
identify insulin-resistant individuals at increased risk of cardiovascular disease? Am. J. Cardiol. 2005, 96, 399–404.
67. Abbasi, F.; Reaven, G.M. Comparison of two methods using plasma triglyceride concentration as a surrogate estimate of insulin
action in nondiabetic subjects: Triglycerides× glucose versus triglyceride/high-density lipoprotein cholesterol. Metabolism 2011,
60, 1673–1676.
68. Laws, A.; Reaven, G. Evidence for an independent relationship between insulin resistance and fasting plasma hdl-cholesterol,
triglyceride and insulin concentrations. J. Intern. Med. 1992, 231, 25–30.
69. Vital, P.; Larrieta, E.; Hiriart, M. Sexual dimorphism in insulin sensitivity and susceptibility to develop diabetes in rats. J.
Endocrinol. 2006, 190, 425–432.
70. Camporez, J.P.; Lyu, K.; Goldberg, E.L.; Zhang, D.; Cline, G.W.; Jurczak, M.J.; Dixit, V.D.; Petersen, K.F.; Shulman, G.I. Anti-
inflammatory effects of oestrogen mediate the sexual dimorphic response to lipid-induced insulin resistance. J. Physiol. 2019,
597, 3885–3903.
71. Geer, E.B.; Shen, W. Gender differences in insulin resistance, body composition, and energy balance. Gend. Med. 2009, 6, 60–75.
72. Grove, K.; Fried, S.; Greenberg, A.; Xiao, X.; Clegg, D. A microarray analysis of sexual dimorphism of adipose tissues in high-
fat-diet-induced obese mice. Int. J. Obes. 2010, 34, 989–1000.
73. Butruille, L.; Drougard, A.; Knauf, C.; Moitrot, E.; Valet, P.; Storme, L.; Deruelle, P.; Lesage, J. The apelinergic system: Sexual
dimorphism and tissue-specific modulations by obesity and insulin resistance in female mice. Peptides 2013, 46, 94–101.
74. Orimo, H.; Ito, H.; Suzuki, T.; Araki, A.; Hosoi, T.; Sawabe, M. Reviewing the definition of “elderly”. Geriatr. Gerontol. Int. 2006,
6, 149–158.
75. WHO. Women, Ageing and Health: Achieving Health Across the Life Span; World Health Organization: Geneva, Switzerland, 1998.
76. WHO. Men, Ageing and Health: Achieving Health Across the Life Span; World Health Organization: Geneva, Switzerland, 1999.
77. Holloszy, J.O. The biology of aging. In Mayo Clinic Proceedings; Elsevier: Amsterdam, The Netherlands, 2000; pp. S3–S9.
78. George, A.J.; Ritter, M.A. Thymic involution with ageing: Obsolescence or good housekeeping? Immunol. Today 1996, 17, 267–
272.
79. Fédération, C.; Schwartz, D.; Mayaux, M. Female fecundity as a function of age: Results of artificial insemination in 2193
nulliparous women with azoospermic husbands. N. Eng. J. Med. 1982, 306, 404–406.
80. Stovall, D.W.; Toma, S.K.; Hammond, M.G.; Talbert, L.M. The effect of age on female fecundity. Obstet. Gynecol. 1991, 77, 33–36.
81. Attie, A.D. Lipoprotein/cholesterol metabolism. In Encyclopedia of Physical Science and Technology, 3rd ed.; Meyers, R.A., Ed.;
Academic Press: New York, NY, USA, 2003; pp. 643–660.
Metabolites 2021, 11, 326 26 of 27
82. Mead, J.R.; Irvine, S.A.; Ramji, D.P. Lipoprotein lipase: Structure, function, regulation, and role in disease. J. Mol. Med. 2002, 80,
753–769.
83. Sarrazin, S.; Lamanna, W.C.; Esko, J.D. Heparan sulfate proteoglycans. Cold Spring Harb. Perspect. Biol. 2011, 3, a004952.
84. Mallov, S. Aortic lipoprotein lipase activity in relation to species, age, sex, and blood pressure. Circ. Res. 1964, 14, 357–363.
85. Carlile, S.I.; Lacko, A.G. Age-related changes in plasma lipid levels and tissue lipoprotein lipase activities of fischer-344 rats.
Arch. Gerontol. Geriatr. 1985, 4, 133–140.
86. Perreault, L.; Lavely, J.M.; Kittelson, J.M.; Horton, T.J. Gender differences in lipoprotein lipase activity after acute exercise. Obes.
Res. 2004, 12, 241–249.
87. Maehira, F.; Miyagi, I.; Eguchi, Y. Sex-and age-related variations in the in vitro heparin-releasable lipoprotein lipase from
mononuclear leukocytes in blood. Biochim. Biophys. Acta (BBA) Lipids Lipid Metab. 1990, 1042, 344–351.
88. Kiens, B.; Roepstorff, C.; Glatz, J.F.; Bonen, A.; Schjerling, P.; Knudsen, J.; Nielsen, J.N. Lipid-binding proteins and lipoprotein
lipase activity in human skeletal muscle: Influence of physical activity and gender. J. Appl. Physiol. 2004, 97, 1209–1218.
89. Meschia, M.; Pansini, F.; Modena, A.B.; De Aloysio, D.; Gambacciani, M.; Parazzini, F.; Campagnoli, C.; Maiocchi, G.; Peruzzi,
E.; Group, I.S. Determinants of age at menopause in italy: Results from a large cross-sectional study. Maturitas 2000, 34, 119–
125.
90. Cagnacci, A.; Pansini, F.S.; Bacchi-Modena, A.; Giulini, N.; Mollica, G.; De Aloysio, D.; Vadora, E.; Volpe, A. Season of birth
influences the timing of menopause. Hum. Reprod. 2005, 20, 2190–2193.
91. Parazzini, F.; Group, P.M.I.S. Determinants of age at menopause in women attending menopause clinics in italy. Maturitas 2007,
56, 280–287.
92. Borrás, C.; Gambini, J.; López-Grueso, R.; Pallardó, F.V.; Viña, J. Direct antioxidant and protective effect of estradiol on isolated
mitochondria. Biochim. Biophys. Acta (BBA) Mol. Basis Dis. 2010, 1802, 205–211.
93. Miller, V.M.; Lahr, B.D.; Bailey, K.R.; Heit, J.A.; Harman, S.M.; Jayachandran, M. Longitudinal effects of menopausal hormone
treatments on platelet characteristics and cell-derived microvesicles. Platelets 2016, 27, 32–42.
94. Guetta, V.; Cannon, R.O., III. Cardiovascular effects of estrogen and lipid-lowering therapies in postmenopausal women.
Circulation 1996, 93, 1928–1937.
95. Fåhraeus, L. The effects of estradiol on blood lipids and lipoproteins in postmenopausal women. Obstet. Gynecol. 1988, 72, 18S–
22S.
96. Rasouli, M.; Kiasari, A.M.; Arab, S. Indicators of dehydration and haemoconcentration are associated with the prevalence and
severity of coronary artery disease. Clin. Exp. Pharmacol. Physiol. 2008, 35, 889–894.
97. Rothblat, G.H.; Phillips, M.C. High-density lipoprotein heterogeneity and function in reverse cholesterol transport. Curr. Opin.
Lipidol. 2010, 21, 229.
98. Song, G.; Zong, C.; Liu, Q.; Si, Y.; Liu, J.; Li, W.; Zhu, P.; Qin, S. Sr-bi associates with abcg1 and inhibits abcg1-mediated
cholesterol efflux from cells to high-density lipoprotein 3. Lipids Health Dis. 2012, 11, 1–7.
99. Mihajlovic, M.; Gojkovic, T.; Vladimirov, S.; Miljkovic, M.; Stefanovic, A.; Vekic, J.; Zeljkovic, D.; Trifunovic, B.; Kotur-
Stevuljevic, J.; Spasojevic-Kalimanovska, V.; et al. Changes in lecithin: Cholesterol acyltransferase, cholesteryl ester transfer
protein and paraoxonase-1 activities in patients with colorectal cancer. Clin. Biochem. 2019, 63, 32–38.
100. Kiziltunç, A.; Akçay, F.; Polat, F.; Kuşkay, S.; Sahin, Y.N. Reduced lecithin: Cholesterol acyltransferase (lcat) and na+, k+, atpase
activity in diabetic patients. Clin. Biochem. 1997, 30, 177–182.
101. Dullaart, R.P.; Perton, F.; Sluiter, W.J.; de Vries, R.; van Tol, A. Plasma lecithin: Cholesterol acyltransferase activity is elevated
in metabolic syndrome and is an independent marker of increased carotid artery intima media thickness. J. Clin. Endocrinol.
Metab. 2008, 93, 4860–4866.
102. Kappelle, P.J.; de Boer, J.F.; Perton, F.G.; Annema, W.; de Vries, R.; Dullaart, R.P.; Tietge, U.J. Increased lcat activity and
hyperglycaemia decrease the antioxidative functionality of hdl. Eur. J. Clin. Investig. 2012, 42, 487–495.
103. Albers, J.J.; Chen, C.H.; Adolphson, J.L. Lecithin: Cholesterol acyltransferase (lcat) mass; its relationship to lcat activity and
cholesterol esterification rate. J. Lipid Res. 1981, 22, 1206–1213.
104. Bernini, P.; Bertini, I.; Luchinat, C.; Tenori, L.; Tognaccini, A. The cardiovascular risk of healthy individuals studied by nmr
metabonomics of plasma samples. J. Proteome Res. 2011, 10, 4983–4992.
105. Haug, K.; Salek, R.M.; Conesa, P.; Hastings, J.; de Matos, P.; Rijnbeek, M.; Mahendraker, T.; Williams, M.; Neumann, S.; Rocca-
Serra, P.; et al. Metabolights—an open-access general-purpose repository for metabolomics studies and associated meta-data.
Nucleic Acids Res. 2013, 41, D781–D786.
106. Bernini, P.; Bertini, I.; Luchinat, C.; Nincheri, P.; Staderini, S.; Turano, P. Standard operating procedures for pre-analytical
handling of blood and urine for metabolomic studies and biobanks. J. Biomol. NMR 2011, 49, 231–243.
107. Jiménez, B.; Holmes, E.; Heude, C.; Tolson, R.F.; Harvey, N.; Lodge, S.L.; Chetwynd, A.J.; Cannet, C.; Fang, F.; Pearce, J.T.; et al.
Quantitative lipoprotein subclass and low molecular weight metabolite analysis in human serum and plasma by 1h nmr
spectroscopy in a multilaboratory trial. Anal. Chem. 2018, 90, 11962–11971.
108. Monsonis Centelles, S.; Hoefsloot, H.C.; Khakimov, B.; Ebrahimi, P.; Lind, M.V.; Kristensen, M.; De Roo, N.; Jacobs, D.M.; Van
Duynhoven, J.; Cannet, C.; et al. Toward reliable lipoprotein particle predictions from nmr spectra of human blood: An
interlaboratory ring test. Anal. Chem. 2017, 89, 8004–8012.
109. Bartlett, M.S. The square root transformation in analysis of variance. Suppl. J. R. Stat. Soc. 1936, 3, 68–78.
Metabolites 2021, 11, 326 27 of 27
110. Van Den Berg, R.A.; Hoefsloot, H.C.J.; Westerhuis, J.A.; Smilde, A.K.; Van Der Werf, M.J. Centering, scaling, and
transformations: Improving the biological information content of metabolomics data. BMC Genom. 2006, 7, 142.
111. Mann, H.B.; Whitney, D.R. On a test of whether one of two random variables is stochastically larger than the other. Ann. Math.
Stat. 1947, 18, 50–60.
112. Bonferroni, C.E. Il calcolo delle assicurazioni su gruppi di teste. In Studi in Onore Del Professore Salvatore Ortu Carboni; Bardi:
Rome, Italy, 1935; pp. 13–60.
113. Søreide, K. Receiver-operating characteristic curve analysis in diagnostic, prognostic and predictive biomarker research. J. Clin.
Pathol. 2009, 62, 1–5.
114. Hanley, J.A.; McNeil, B.J. The meaning and use of the area under a receiver operating characteristic (roc) curve. Radiology 1982,
143, 29–36.
115. Mason, S.J.; Graham, N.E. Areas beneath the relative operating characteristics (roc) and relative operating levels (rol) curves:
Statistical significance and interpretation. Q. J. R. Meteorol. Soc. A J. Atmos. Sci. Appl. Meteorol. Phys. Oceanogr. 2002, 128, 2145–
2166.
116. Hotelling, H. Analysis of a complex of statistical variables into principal components. J. Educ. Psychol. 1931, 24, 417441.
117. Pearson, K. On lines and planes of closest fit to systems of points in space. Lond. Edinb. Dublin Philos. Mag. J. Sci. 1901, 2, 559–
572.
118. Jolliffe, I. Principal Component Analysis, 2nd ed.; Springer: New York, NY, USA, 2002.
119. Johnstone, I.M. On the distribution of the largest eigenvalue in principal components analysis. Ann. Stat. 2001, 29, 295–327.
120. Saccenti, E.; Timmerman, M.E. Considering horn’s parallel analysis from a random matrix theory point of view. Psychometrika
2017, 82, 186–209.
121. Saccenti, E.; Camacho, J. Determining the number of components in principal components analysis: A comparison of statistical,
crossvalidation and approximated methods. Chemom. Intell. Lab. Syst. 2015, 149, 99–116.
122. Breiman, L. Random forests. Mach. Learn. 2001, 45, 5–32.
123. Breiman, L.; Friedman, J.; Olshen, R.; Stone, C. Classification and regression trees Brooks/Cole Publishing, Monterey, 1984
124. Parikh, R.; Mathai, A.; Parikh, S.; Sekhar, G.C.; Thomas, R. Understanding and using sensitivity, specificity and predictive
values. Indian J. Ophthalmol. 2008, 56, 45.
125. Ishwaran, H. The effect of splitting on random forests. Mach. Learn. 2015, 99, 75–118.
126. Faith, J.J.; Hayete, B.; Thaden, J.T.; Mogno, I.; Wierzbowski, J.; Cottarel, G.; Kasif, S.; Collins, J.J.; Gardner, T.S. Large-scale
mapping and validation of escherichia coli transcriptional regulation from a compendium of expression profiles. PLoS Biol.
2007, 5, e8.
127. Schäfer, J.; Opgen-Rhein, R.; Strimmer, K. Reverse engineering genetic networks using the genenet package. Newsl. R Proj. 2006,
6, 50.
128. Smilde, A.K.; Timmerman, M.E.; Saccenti, E.; Jansen, J.J.; Hoefsloot, H.C.J. Covariances simultaneous component analysis: A
new method within a framework for modeling covariances. J. Chemom. 2015, 29, 277–288.
129. R Core Team. R: A Language and Environment for Statistical Computing v3. 1.0; The R Foundation for Statistical Computing:
Vienna, Austria. Available online: http://www. R-project. org (accessed on 21 January 2014).
130. Liaw, A.; Wiener, M. Classification and regression by randomforest. R News 2002, 2, 18–22.
131. Archer, E.; Archer, M.E. Package 'Rfpermute', https://cran.r-project.org/web/packages/rfPermute/index.html (accessed 21
January 2021).
132. Robin, X.; Turck, N.; Hainard, A.; Tiberti, N.; Lisacek, F.; Sanchez, J.-C.; Müller, M. Proc: An open-source package for r and s+
to analyze and compare roc curves. BMC Bioinform. 2011, 12, 1–8.
133. Kuhn, M. Building predictive models in r using the caret package. J. Stat. Softw. 2008, 28, 1–26.
134. Shannon, P.; Markiel, A.; Ozier, O.; Baliga, N.S.; Wang, J.T.; Ramage, D.; Amin, N.; Schwikowski, B.; Ideker, T. Cytoscape: A
software environment for integrated models of biomolecular interaction networks. Genome Res. 2003, 13, 2498–2504.
135. Assenov, Y.; Ramírez, F.; Schelhorn, S.-E.; Lengauer, T.; Albrecht, M. Computing topological parameters of biological networks.
Bioinformatics 2008, 24, 282–284.
136. Dezső, Z.; Barabási, A.-L. Halting viruses in scale-free networks. Phys. Rev. E 2002, 65, 055103.
137. Bavelas, A. Communication patterns in task-oriented groups. J. Acoust. Soc. Am. 1950, 22, 725–730.
138. Watts, D.J.; Strogatz, S.H. Collective dynamics of small-‘world’ networks. Nature 1998, 393, 440–442.
139. Diestel, R.; Schrijver, A.; Seymour, P. Graph theory. Oberwolfach Rep. 2010, 7, 521–580.
140. Wasserman, S.; Faust, K. Social Network Analysis: Methods and Applications; Cambridge University Press, Cambridge, UK, 1994.
141. Maslov, S.; Sneppen, K. Specificity and stability in topology of protein networks. Science 2002, 296, 910–913.
142. Shimbel, A. Structural parameters of communication networks. Bull. Math. Biophys. 1953, 15, 501–507.
143. Stelzl, U.; Worm, U.; Lalowski, M.; Haenig, C.; Brembeck, F.H.; Goehler, H.; Stroedicke, M.; Zenkner, M.; Schoenherr, A.;
Koeppen, S.; et al. A human protein-protein interaction network: A resource for annotating the proteome. Cell 2005, 122, 957–
968.


