Embed Size (px)
Citation preview

Extended Urinary Δ9-Tetrahydrocannabinol Excretion in ChronicCannabis Users Precludes Use as a Biomarker of New DrugExposure
Ross H. Lowe1, Tsadik T. Abraham1, William D. Darwin1, Ronald Herning2, Jean LudCadet2, and Marilyn A. Huestis1,*1Chemistry and Drug Metabolism, Intramural Research Program, National Institute on Drug Abuse,National Institutes of Health, Biomedical Research Center, 251 Bayview Blvd., Suite 05A721,Baltimore, Maryland, 21224 USA2Molecular Neuropsychiatry, Intramural Research Program, National Institute on Drug Abuse,National Institutes of Health, Biomedical Research Center, 251 Bayview Blvd., Suite 05A721,Baltimore, Maryland, 21224 USA
AbstractBackground—Generally, urinary 11-nor-9-carboxy-Δ9-Tetrahydrocannabinol (THCCOOH) afteralkaline hydrolysis is monitored to detect cannabis exposure, although last use may have been weeksprior in chronic cannabis users. Δ9-Tetrahydrocannabinol (THC) and 11-hydroxy-THC (11-OH-THC) concentrations in urine following E. coli β-glucuronidase hydrolysis were proposed asbiomarkers of recent (within 8 h) cannabis use.
Objective—To test the validity of THC and 11-OH-THC in urine as indicators of recent cannabisuse.
Methods—Monitor urinary cannabinoid excretion in 33 chronic cannabis smokers who resided ona secure research unit under 24 h continuous medical surveillance. All urine specimens were collectedindividually ad libidum for up to 30 days, were hydrolyzed with a tandem E. coli β-glucuronidase/base procedure, and analyzed for THC, 11-OH-THC and THCCOOH by 1- and 2-dimensional-cryotrap gas chromatography mass spectrometry (2D-GCMS) with limits of quantification of 2.5 ng/mL.
Results—Extended excretion of THC and 11-OH-THC in chronic cannabis users’ urine wasobserved during monitored abstinence; 14 of 33 participants had measurable THC in specimenscollected at least 24 h after abstinence initiation. Seven subjects had measurable THC in urine for 3,
*Address correspondence to this author at: Chemistry and Drug Metabolism, Intramural Research Program, National Institute on DrugAbuse, National Institutes of Health, Biomedical Research Center, 251 Bayview Blvd., Room 05A721, Baltimore, MD 21224, Telephone:(1) 443-740-2524, FAX: (1) 443-740-2823, [email protected] A. Huestis, Jean Lud Cadet, and Ronald Herning designed the clinical study and developed the protocol. Ross H. Lowe, TsadikT. Abraham, and William D. Darwin compiled and analyzed the data. Ross H. Lowe, Tsadik T. Abraham and Marilyn A Huestiscontributed to the manuscript and all authors have approved the final manuscript.Publisher's Disclaimer: This is a PDF file of an unedited manuscript that has been accepted for publication. As a service to our customerswe are providing this early version of the manuscript. The manuscript will undergo copyediting, typesetting, and review of the resultingproof before it is published in its final citable form. Please note that during the production process errors may be discovered which couldaffect the content, and all legal disclaimers that apply to the journal pertain.Conflict of InterestThe authors declare that they have no conflicts of interest. Authors are employed by the Chemistry and Drug Metabolism and MolecularNeuropsychiatry sections of the Intramural Research Program, National Institute on Drug Abuse, National Institutes of Health.
NIH Public AccessAuthor ManuscriptDrug Alcohol Depend. Author manuscript; available in PMC 2010 November 1.
Published in final edited form as:Drug Alcohol Depend. 2009 November 1; 105(1-2): 24–32. doi:10.1016/j.drugalcdep.2009.05.027.
NIH
-PA Author Manuscript
NIH
-PA Author Manuscript
NIH
-PA Author Manuscript

3, 4, 7, 7, 12, and 24 days after cannabis cessation. 11-OH-THC and THCCOOH were detectable inurine specimens from one heavy, chronic cannabis user for at least 24 days.
Conclusion—For the first time, extended urinary excretion of THC and 11-OH-THC isdocumented for at least 24 days, negating their effectiveness as biomarkers of recent cannabisexposure, and substantiating long terminal elimination times for urinary cannabinoids followingchronic cannabis smoking.
KeywordsTetrahydrocannabinol; Urine; Cannabinoids; Cannabis; THC; Chronic cannabis use
1. INTRODUCTIONCannabinoid detection times in urine depend upon pharmacological factors (e.g., drug dose,route of administration, duration and frequency of use, smoking topography and individualrates of absorption, metabolism and excretion), and methodological issues including analytesevaluated, matrix, type of hydrolysis, cut-off or threshold used, and sensitivity of the method.The primary psychoactive constituent of cannabis, Δ9-tetrahydrocannabinol (THC), is rapidlyabsorbed during smoking, and due to its high lipophilicity is widely distributed to adiposetissue, liver, lung, and spleen. Body stores of THC increase with increasing frequency andchronicity of cannabis use. THC is rapidly metabolized to the equally psychoactive 11-hydroxy-THC (11-OH-THC), and to the inactive 11-nor-9-carboxy-THC (THCCOOH)metabolite and its glucuronide and sulfate conjugates (Huestis and Smith, 2005). The slowrelease of THC from fat back into blood was demonstrated to be the rate limiting step incannabinoid elimination from the body (Hunt and Jones, 1980). Thus, THC was shown to havea long terminal elimination half-life in blood from chronic cannabis users (Johansson et al.,1989a).
Urine testing remains the most common means of drug monitoring in the United States. Thehighest numbers of positive urine drug tests in workplace drug testing are for cannabinoids,achieved by immunoassay screening and THCCOOH quantification in urine after alkalinehydrolysis. Urinary THCCOOH excretion patterns have been extensively studied (Smith-Kielland et al., 1999; Huestis et al., 1995; Johansson et al., 1990; Musshoff and Madea,2006). After occasional use, Huestis et al reported THCCOOH concentrations above 15 ng/mL by gas chromatography mass spectrometry (GCMS) after alkaline hydrolysis for up to 4days (Huestis et al., 1996; Huestis and Cone, 1998a). Urinary THCCOOH window of detectionranges from several days in infrequent users (Huestis and Cone, 1998b) to months in frequentusers (Ellis et al., 1985; Peat, 1989; Kelly and Jones, 1992; Fraser and Worth, 2003; Johanssonet al, 1989b). Thus, identification of THCCOOH in urine may not indicate recent cannabisexposure (Dackis et al., 1982; McBurney et al., 1986; Fraser and Worth, 2004).
Huestis and Cone developed and validated a model to differentiate new cannabis use fromresidual drug excretion in occasional cannabis users based on urine THCCOOH concentrations(Huestis and Cone, 1998b). However, this model may not be accurate in chronic cannabis usersduring the terminal elimination phase, when THCCOOH concentrations are low, below 20–50 ng/mL. In a search for new biomarkers of recent cannabis use, Kemp et al showed that THCand 11-OH-THC could be detected in urine after cannabis smoking if Escherichia coli (E. coli)β-glucuronidase hydrolysis was employed to break ether glucuronide bonds (Kemp et al.,1995a). They conducted a controlled cannabis smoking study quantifying THC and 11-OH-THC concentrations in urine specimens collected up to 8 h after cannabis smoking (Kemp etal, 1995b). The presence of THC or 11-OH-THC in urine was stated to indicate cannabis usewithin 8 h. In attempting to replicate this finding in our cannabinoid smoking studies, we
Lowe et al. Page 2
Drug Alcohol Depend. Author manuscript; available in PMC 2010 November 1.
NIH
-PA Author Manuscript
NIH
-PA Author Manuscript
NIH
-PA Author Manuscript
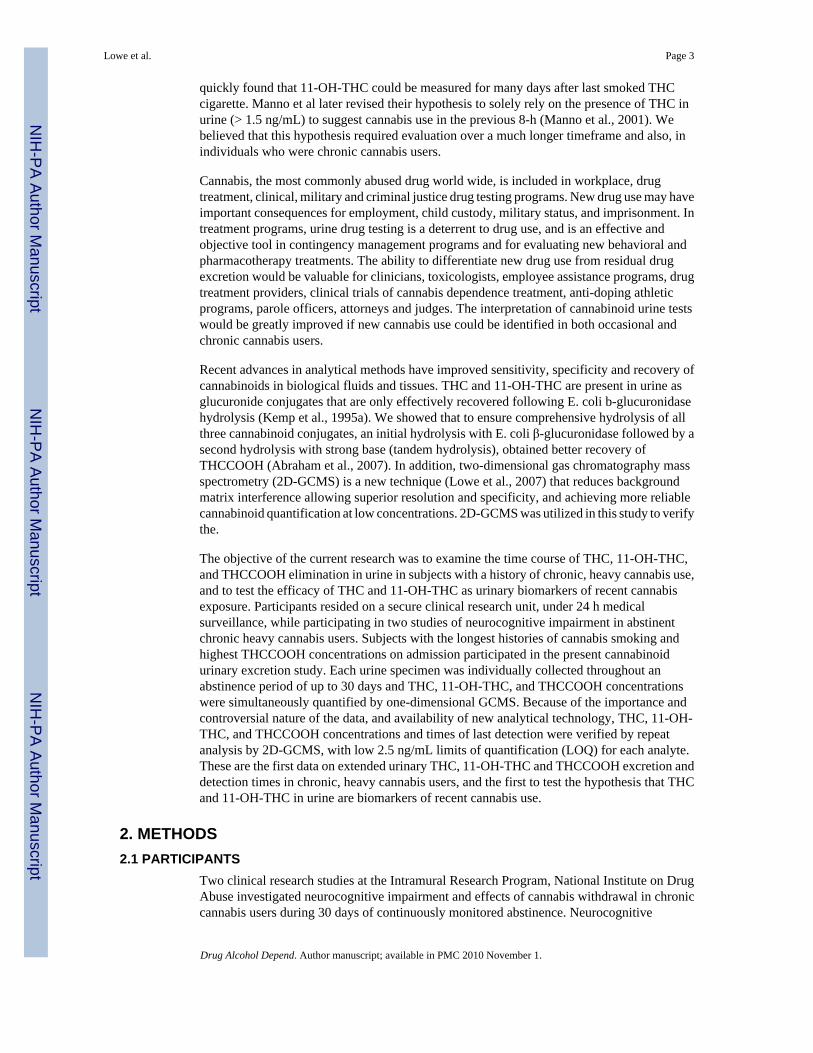
quickly found that 11-OH-THC could be measured for many days after last smoked THCcigarette. Manno et al later revised their hypothesis to solely rely on the presence of THC inurine (> 1.5 ng/mL) to suggest cannabis use in the previous 8-h (Manno et al., 2001). Webelieved that this hypothesis required evaluation over a much longer timeframe and also, inindividuals who were chronic cannabis users.
Cannabis, the most commonly abused drug world wide, is included in workplace, drugtreatment, clinical, military and criminal justice drug testing programs. New drug use may haveimportant consequences for employment, child custody, military status, and imprisonment. Intreatment programs, urine drug testing is a deterrent to drug use, and is an effective andobjective tool in contingency management programs and for evaluating new behavioral andpharmacotherapy treatments. The ability to differentiate new drug use from residual drugexcretion would be valuable for clinicians, toxicologists, employee assistance programs, drugtreatment providers, clinical trials of cannabis dependence treatment, anti-doping athleticprograms, parole officers, attorneys and judges. The interpretation of cannabinoid urine testswould be greatly improved if new cannabis use could be identified in both occasional andchronic cannabis users.
Recent advances in analytical methods have improved sensitivity, specificity and recovery ofcannabinoids in biological fluids and tissues. THC and 11-OH-THC are present in urine asglucuronide conjugates that are only effectively recovered following E. coli b-glucuronidasehydrolysis (Kemp et al., 1995a). We showed that to ensure comprehensive hydrolysis of allthree cannabinoid conjugates, an initial hydrolysis with E. coli β-glucuronidase followed by asecond hydrolysis with strong base (tandem hydrolysis), obtained better recovery ofTHCCOOH (Abraham et al., 2007). In addition, two-dimensional gas chromatography massspectrometry (2D-GCMS) is a new technique (Lowe et al., 2007) that reduces backgroundmatrix interference allowing superior resolution and specificity, and achieving more reliablecannabinoid quantification at low concentrations. 2D-GCMS was utilized in this study to verifythe.
The objective of the current research was to examine the time course of THC, 11-OH-THC,and THCCOOH elimination in urine in subjects with a history of chronic, heavy cannabis use,and to test the efficacy of THC and 11-OH-THC as urinary biomarkers of recent cannabisexposure. Participants resided on a secure clinical research unit, under 24 h medicalsurveillance, while participating in two studies of neurocognitive impairment in abstinentchronic heavy cannabis users. Subjects with the longest histories of cannabis smoking andhighest THCCOOH concentrations on admission participated in the present cannabinoidurinary excretion study. Each urine specimen was individually collected throughout anabstinence period of up to 30 days and THC, 11-OH-THC, and THCCOOH concentrationswere simultaneously quantified by one-dimensional GCMS. Because of the importance andcontroversial nature of the data, and availability of new analytical technology, THC, 11-OH-THC, and THCCOOH concentrations and times of last detection were verified by repeatanalysis by 2D-GCMS, with low 2.5 ng/mL limits of quantification (LOQ) for each analyte.These are the first data on extended urinary THC, 11-OH-THC and THCCOOH excretion anddetection times in chronic, heavy cannabis users, and the first to test the hypothesis that THCand 11-OH-THC in urine are biomarkers of recent cannabis use.
2. METHODS2.1 PARTICIPANTS
Two clinical research studies at the Intramural Research Program, National Institute on DrugAbuse investigated neurocognitive impairment and effects of cannabis withdrawal in chroniccannabis users during 30 days of continuously monitored abstinence. Neurocognitive
Lowe et al. Page 3
Drug Alcohol Depend. Author manuscript; available in PMC 2010 November 1.
NIH
-PA Author Manuscript
NIH
-PA Author Manuscript
NIH
-PA Author Manuscript

performance, fMRI and cerebral blood flow data from these studies have been previouslyreported (Bolla et al., 2002; Bolla et al., 2005; Bolla et al., 2008; Eldreth et al., 2004; Herninget al., 2003; Herning et al., 2005; Matochik et al., 2005). We recruited individuals with themost frequent and chronic self-reported cannabis use from January 2002 until July 2004 fromthese studies to participate in this secondary urinary cannabinoid excretion study. Males andfemales between 18–50 years of age, with cannabis dependence or abuse by DSM-IIIR criteria,and minimum cannabis use for the last two years were recruited. Participants were sequesteredon a secure clinical research unit throughout to prevent access to cannabis and other drugs, andto enable collection of all urine voids. This study was approved by the Institutional ReviewBoard (IRB) of the Intramural Research Program of the National Institute on Drug Abuse andparticipants provided written informed consent. There was no drug administration at any timeduring participation in the primary or secondary studies.
2.2 SPECIMENSEvery urine void was individually collected in a polypropylene bottle ad libidum fromadmittance to discharge from the clinical unit (up to 30 days) and immediately refrigerated.Total volume and specific gravity of each urine void was measured and aliquots of urinespecimens were stored in 3.5 mL polypropylene screw-cap tubes and 30 mL polypropylenebottles at −20°C prior to analysis. Urine specimens were analyzed by 1D-GCMS within threeyears of frozen storage. Due to the surprising extended excretion of THC and 11-OH-THC formultiple days, and the low concentrations quantified, we reanalyzed some urine specimens by2D-GCMS two to three years later in 2007–2008, when the technology became available inour laboratory. We utilized this new method to verify concentration and detection time data.
2.3 SPECIMEN PREPARATIONTandem hydrolysis and extraction of urinary THC, 11-OH-THC and THCCOOH wereperformed according to a previously published procedure (Abraham et al., 2007). To ensurecomplete hydrolysis of conjugates and capture total analyte content, urine specimens (2 mL)were hydrolyzed by two methods in series. The initial 16 h hydrolysis with E. coli β-glucuronidase (Type IX-A) was followed by alkaline hydrolysis with 10N NaOH. Bufferedhydrolysates (pH 4.0) were centrifuged and applied to preconditioned solid phase extraction(SPE) columns (Clean Screen® ZSTHC020 extraction columns, United ChemicalTechnologies). Concentrated extracts were derivatized with N,O-bis (trimethylsilyl)trifluoroacetamide (BSTFA) containing 1% trimethylchlorosilane (TMCS).
2.4 GCMSTrimethylsilyl derivatives of THC, 11-OH-THC, and THCCOOH were initially quantified by1D-GCMS on an Agilent 6890 GC/5973 MSD system. Capillary separation was achieved ona DB-35MS column (Agilent Technologies). The mass selective detector was operated inelectron impact-selected ion monitoring (SIM) mode. Three ions for each analyte and two foreach internal standard were acquired. Limit of quantification (LOQ) of the 1D-GCMS methodwas 2.5 ng/mL for all analytes. Decreasing concentrations of analytes were used to empiricallydetermine limit of detection (LOD) and LOQ. LOD was defined as the lowest concentrationwith a signal to noise ratio ≥ 3:1 for target and qualifier ions, ion ratios within 20% of averagequalifier ion ratios of calibrators, retention time within ± 2% and Gaussian peak shape. At theLOQ, all LOD criteria must be met, signal to noise ratio of the target ion is 10:1, and thecalibrator must quantify within 20% of target concentration. With these definitions, it ispossible for LOD to equal LOQ. LOQ of the 1D-GCMS method was 2.5 ng/mL for all analytes(Abraham et al., 2007). Method LOD was also established at 2.5 ng/mL due to inconsistentqualifier ion ratios at concentrations <2.5 ng/mL. THC, 11-OH-THC, and THCCOOHextraction efficiencies ranged from 57.0 – 59.3%, 68.3 – 75.5%, and 71.5 – 79.5%, respectively.
Lowe et al. Page 4
Drug Alcohol Depend. Author manuscript; available in PMC 2010 November 1.
NIH
-PA Author Manuscript
NIH
-PA Author Manuscript
NIH
-PA Author Manuscript

Inter-assay imprecision ranged from 2.6 to 7.4% (% relative standard deviation) and analyticalrecovery was 101.1 to 113.7% for all analytes. Specific ions were as follows (quantitative ionunderlined): THC 386, 371, 303; THC-d3 389, 374; 11-OH-THC 371, 474, 459; 11-OH-THC-d3 374, 477; THCCOOH 371, 488, 473; THCCOOH-d3 374, 491.
Due to the unexpected presence of THC and 11-OH-THC for extended periods of time, ourlaboratory developed a high selectivity 2D-GCMS assay for cannabinoids in urine to verifyanalyte identification and quantification. A subgroup of seven subjects (defined as thePersistent THC Group) with prolonged excretion of THC (≥ 2.5 ng/mL 72 h after cannabiscessation) was selected for repeat extraction and quantification of THC, 11-OH-THC, andTHCCOOH by 2D-GCMS to determine last detection times. Verified last detection times weredefined as after admission to the clinical unit. Actual detection times could be longer than thosepresented based on the times of last cannabis use prior to entry and initiation of 24 h continuousmonitoring. All urine specimens from all participants collected in the first 72 h were tested.Urine specimens from the Persistent THC Group were tested until THC was no longerdetectable (< 2.5 ng/mL) in three successive urine specimens.
The 2D-GCMS chromatographic method and parameters were adapted from a previouslydescribed method for determination of cannabinoids in plasma (Lowe et al., 2007). Primaryand secondary capillary columns were DB-1MS (Agilent Technologies) and ZB-50(Phenomenex). Three mL was introduced in splitless injection mode; following separation onthe primary column, “cuts” of the analyte elution bands, were released to the secondary GCcolumn for further resolution. The air-cooled cryogenic trap captured THC, 11-OH-THC, andTHCCOOH entering the head of the secondary column and then ramped to 275°C to re-vaporize analytes The mass selective detector was operated in electron impact-selected ionmonitoring (SIM) mode. Three ions for each analyte and two for each internal standard wereacquired. Both LOD and LOQ were 2.5 ng/mL for THC, 11-OH-THC and THCCOOH.Analytical recovery ranged from 87.6% to 102.1% and intra-and inter-assay imprecision, as%RSD, was less than 8.6 % for all analytes (Lowe, Abraham et al., 2008).
3.0 RESULTSA total of 1,271 urine specimens were analyzed by 1D-GCMS from 33 participants residingon the closed research unit during monitored abstinence for 3 to 30 days. All urine specimensfrom all participants individually collected during the first 72 h were quantified by 1D-GCMSto determine THC, 11-OH-THC, and THCCOOH elimination patterns. Demographiccharacteristics and self-reported drug use histories of the 33 participants are included in Table1. Twenty-six subjects’ (13 M, 13 F, 21 African American, 2 White, 1 American Indian and 2Unknown race) urine specimens were negative (< 2.5 ng/mL) within 72 h: 13 had no THCpositive specimens after admission to the clinical unit; 6 participants’ urine specimens werenegative by 24 h, and 7 more within 72 h. These participants had a mean ± SD age of 25.2 ±4.5 years, weighed 173.1 ± 33.2 lbs with a mean body mass index (BMI) of 27.0 ± 5.3; 6individuals were classified as obese with a BMI ≥30. These heavy, frequent cannabis usersself-reported first cannabis use at 15.7 ± 2.8 years, and currently smoked an average of 3.7 ±2.3 blunts/joints per day, on 12.5 ± 2.5 days in the last 14. A blunt is a hollowed out cigar filledwith cannabis plant material. The THC detection data clearly documented that finding THC inthe urine is not a biomarker of recent drug exposure. However, it was surprising to find thaturine specimens from the other 7 participants (4 M, 3 F, all African American) were still THCpositive ≥2.5 ng/mL 72 h after cannabis cessation. This group we defined as the PersistentTHC Group. Urine specimens collected up to 30 days after last cannabis use were evaluatedin this Group to characterize the duration of THC detection. Non-consecutive urine specimenswere analyzed for the presence of THC. If a specimen was negative for THC, previousspecimens were analyzed to pinpoint the time of last detection. The time of last THC detection
Lowe et al. Page 5
Drug Alcohol Depend. Author manuscript; available in PMC 2010 November 1.
NIH
-PA Author Manuscript
NIH
-PA Author Manuscript
NIH
-PA Author Manuscript

was defined as the time of the last positive urine specimen prior to at least three consecutivenegative specimens.
The Persistent THC Group was 29.1 ± 4.7 years old, weighed 174.1 ± 25.7 lbs, and had a meanBMI of 25.8 ± 3.4 with only one individual classified as obese. The Persistent THC Groupself-reported first use of cannabis at 15.0 ± 2.5 years, with current smoking of 2.3 ± 1.0 bluntsper day on average 11.4 ± 4.5 days out of the last 14. For this Group, a total of 1082 urinespecimens were analyzed by 1D-GCMS. Critical urine specimens (n = 161) at and followingthe times of last THC detection in the Persistent THC Group were subsequently re-extractedand verified by 2D-GCMS with cryotrapping to characterize cannabinoid detection times. Arepresentative comparison of 1- and 2D-GCMS results and excretion curves are shown inFigure 1. Two of these participants (Subjects A and B) chose to withdraw from the study priorto producing THC-negative urine specimens, preventing determination of the time of last THCdetection
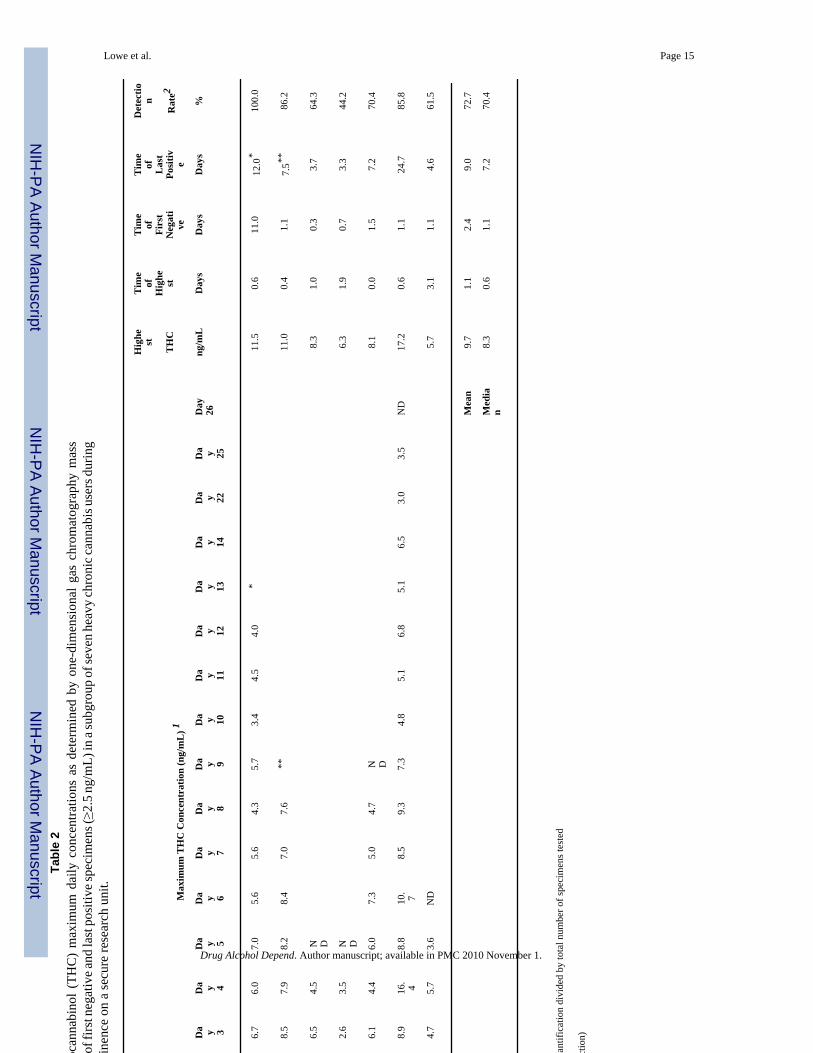
3.1 DETECTION TIMES – THCIn the Persistent THC Group, last THC detection times with a 2.5 ng/mL GCMS cutoff rangedfrom 3.3 – 24.7 days (Table 2) with a median of 7.2 days, including the two subjects who choseto withdraw from the study and leave the unit after 12.0 (Subject A) and 7.5 (Subject B) days,prior to producing consecutive THC negative urine specimens. Other subjects’ urine specimenswere THC positive for 3.3, 3.7, 4.6, 7.2 and 24.7 (Subject F) days (Table 2) after admission tothe study. Subject F who excreted THC in the urine for more than 24 days, produced THC-negative specimens for five days after last THC detection, clearly enabling an accuratedetermination of her THC detection times in urine.
3.2 THC CONCENTRATIONS IN URINETable 2 summarizes maximum daily urine THC concentrations after drug cessation in thePersistent THC Group over the entire collection period (1D-GCMS). Time of peak THC urineconcentrations ranged from 0.0 – 3.1 days (median 0.6 days) after abstinence initiation. Thehighest urine THC concentrations in this Group ranged from 5.7 – 17.2 ng/mL. In six of sevenparticipants in the Group, THC negative specimens were interspersed between THC-positivespecimens. Times of the first THC-negative specimen varied from 0.3 – 11.0 days.
Urinary THC excretion profiles confirmed by 2D-GCMS are shown in Figure 2 anddemonstrate varied excretion patterns. Twenty-three specimens collected from admission todischarge were tested for Subject A. All specimens were THC-positive (>2.5 ng/mL) withconcentrations ranging from 2.7 – 9.2 ng/mL. Specimens 11.0 and 12.0 days post admissionhad THC concentrations of 4.1 and 3.4 ng/mL, respectively. Sixteen of 18 specimens had THC>2.5 ng/mL (88.9% detection rate) ranging from 3.2 – 11.8 ng/mL. THC was not detected intwo specimens at 1.1 and 1.3 days. THC quantification in the final available specimen (7.5days) was 7.7 ng/mL. Subject C’s urine THC concentrations ranged from <2.5 – 7.3 ng/mLuntil day 3; all specimens after 88 hours were < 2.5 ng/mL. Three specimens quantifying <2.5ng/mL were interspersed among the 13 collected in the first 3.9 days. Subject D displayed thelowest THC detection rate in the Group (37.5%), with an entry concentration of 5.6 ng/mL andonly 6 of 16 specimens testing positive over 3.5 days. Subject E’s THC concentrations rangedfrom none detected to 7.7 ng/mL. Ten of the 35 specimens quantified by 2D-GCMS were<LOQ. Participant F had detectable THC concentrations for the longest time of any chronicfrequent user in this study. THC was detected in the urine 24.7 days after cessation, with laterspecimens (up to 30 days) negative for THC. Thirty-four of 43 specimens tested positive fora 79.1% detection rate over 25 days. Six specimens <LOQ (2.5 ng/mL) occurred within thefirst 7 days. THC concentrations in Subject G specimens ranged from <2.5 – 4.6 ng/mL withnegative specimens interspersed at regular intervals on each of the five testing days.
Lowe et al. Page 6
Drug Alcohol Depend. Author manuscript; available in PMC 2010 November 1.
NIH
-PA Author Manuscript
NIH
-PA Author Manuscript
NIH
-PA Author Manuscript

3.3 11-OH-THC AND THCCOOH CONCENTRATIONS IN URINEMaximum within-day urine concentrations of 11-OH-THC and THCCOOH metabolites by1D-GC/MS from the Persistent THC Group are shown in Table 3. 11-OH-THC was detectedin all of the specimens from 6 of 7 subjects and in 42 of 43 specimens from Subject D for anoverall detection rate of 99.7% (n = 336). Urine 11-OH-THC Cmax ranged from 41 – 204 ng/mL. Time of highest urine 11-OH-THC concentration (Tmax) ranged from 0.0 – 0.6 days.Mean peak concentration time was 0.2 days after cannabis cessation. Time of highestconcentration was within the first day following cessation for all subjects and mean maximum11-OH-THC concentrations were substantial at 51, 42, and 40 ng/mL during days 2, 3, and 4,respectively.
THCCOOH was measurable in all urine specimens with Cmax (range 324 – 851 ng/mL) within1.2 days (mean 0.6 + 0.42 days) of abstinence. Testing of all 33 participants was discontinuedwhen THC was no longer detectable (< 2.5 ng/mL) in three successive urine specimens;therefore, last detection of 11-OH-THC and THCCOOH in chronic users remains to bedetermined, although currently these analytes were detected in one subject’s urine for 24.7days of abstinence with continuous monitoring.
4.0 DISCUSSIONFor the first time, the hypothesis that THC and 11-OH-THC in urine indicated new cannabisuse was tested with these novel cannabinoid excretion data. Urinary concentrations of THCand 11-OH-THC in chronic, heavy cannabis smokers during extended supervised abstinenceand following tandem enzymatic and alkaline hydrolysis are presented. Subjects resided on asecure clinical research unit throughout to prevent access to cannabis and other drugs. Highestanalyte concentrations, times of first negative and last positive THC specimens, and detectionrates were determined to guide interpretation of urine cannabinoid tests in drug treatment,workplace, military and criminal justice programs.
Detection times of psychoactive THC and 11-OH-THC in these self-reported chronic userswere much longer than previously reported. Last THC detection times after admission to thestudy ranged from 3 – 24 days for the Persistent THC Group with extensive self-reportedcannabis histories of up to 22 years. To verify these findings, we applied a highly sensitive adselective 2D-GCMS method and demonstrated that results and excretion curves (Figure 1)showed good agreement between the 1- and 2D-GCMS methods. Inter-individual variationsin time of last THC detection and in THC detection rates were high. Detection rates variedfrom 37.5% to 100%, with negative specimens interspersed with positives in 6 of 7 subjects.Interspersed negative specimens are related to the slow release of THC from tissues andindividuals’ hydration state. This release may be variable and is poorly understood, but factorssuch as diet and exercise may be important. An important implication from the present studyis that a positive specimen for THC following a negative urine specimen cannot be attributedto new cannabis use.
Manno et al reported urinary THC concentrations in 8 participants after controlled dosing ofone 1.77% or 3.58% THC cigarette (Manno et al., 2001). THC concentrations were <1.5 ng/mL by 6 h and 11-OH-THC remained detectable up to 8 h. Subjects in the study were self-reported light users of 1–3 cannabis cigarettes per week. From these data, the authors concludedthat urinary THC and 11-OH-THC concentrations ≥ 1.5 ng/mL suggested cannabis use within8 hr. Although this may apply to infrequent cannabis users, the present research demonstratesthat urinary THC and 11-OH-THC can be quantified at concentrations above 2.5 ng/mL forweeks in subjects whose history includes frequent long-term cannabis use for extended periodsof time.
Lowe et al. Page 7
Drug Alcohol Depend. Author manuscript; available in PMC 2010 November 1.
NIH
-PA Author Manuscript
NIH
-PA Author Manuscript
NIH
-PA Author Manuscript

The extended duration of 11-OH-THC metabolite detection reported here is in agreement witha study of urinary 11-OH-THC metabolite excretion profiles in chronic users (Fraser andWorth, 2004). Substantial urinary 11-OH-THC concentrations, extended detection times, andan 81% positive rate for 11-OH-THC were reported in 4 subjects in an uncontrolled clinicalsetting (Fraser and Worth, 2004). Another study (Ellis et al., 1985) reported a mean lastdetection time of 27 days for cannabinoid metabolites by immunoassay, with 77 days requiredto drop below the cutoff calibrator for 10 consecutive days in some subjects.
Limitations of this study include the inability to complete elimination profiles and determinetimes of last detection for metabolites 11-OH-THC and THCCOOH, due to a 30-day residenceprotocol limitation. Primary studies monitored neurocognitive deficits and effects of cannabiswithdrawal in long-term cannabis users. The urinary cannabinoid excretion was conducted asa contemporaneous secondary study. Family and child-care responsibilities, lack of desire toreside on a closed unit without visitors for an extended period, and cost were all factors limitingresidential stay. An additional limitation is the lack of creatinine normalization of THCCOOHdata. The objective and focus of the study was evaluation of urinary THC and 11-OH-THC asindicators of recent cannabis use. These analytes are not routinely monitored in urine and arenot normalized to creatinine concentrations. We wanted to treat single urine specimens as theywould be evaluated in routine drug testing programs. However, attempts were made tocompensate for potentially dilute specimens; low LOQs of 2.5 ng/mL were much lower thanthe routine cutoff of 15 ng/mL THCCOOH used in most drug testing programs, and threeconsecutive negative urine specimens were required prior to defining the last THC positivespecimen.
Another limitation was the extended frozen storage time for urine specimens necessitated bythe large number of specimens analyzed, the time required to conduct the human subjectsstudies, and time required to verify these unexpected results with the second 2D-GCMSanalysis. Extended frozen storage could have degraded cannabinoids over time. Urinespecimens were tested by 1D-GCMS up to three years after collection and storage at −20°C.Specimens were retested by a validated 2D-GCMS method within the next two years, for atotal storage time of up to five years. Results are highly reliable and verified by 2D-GCMS. Itis possible that urinary concentrations and last detection times are underestimated due todegradation in frozen storage, but this would only lead to an underestimation of last detectiontime. The hypothesis that THC and 11-OH-THC are biomarkers of recent cannabis use wasdisproven.
These data demonstrate for the first time that following long-term frequent cannabis smoking,THC and 11-OH-THC can be measured in urine for up to 24 days (using a limit of quantificationof 2.5 ng/mL), negating their value as urinary biomarkers of recent cannabis use. These resultssupport the hypothesis of Hunt et al that the rate-limiting step in the terminal elimination ofTHC is the slow excretion of THC from tissue stores that may be extended following chroniccannabis exposure (Hunt and Jones, 1980).
AcknowledgementsThe authors wish to thank Allan Barnes for assistance with data interpretation and preparation of the manuscript andJennifer Runkle and Wesen Nebro for technical assistance.
Role of Funding Source
This research was supported by the National Institutes of Health Intramural Research Program of the National Instituteon Drug Abuse. This clinical study was approved by the Institutional Review Board (IRB) of the Intramural ResearchProgram of the National Institute on Drug Abuse.
Lowe et al. Page 8
Drug Alcohol Depend. Author manuscript; available in PMC 2010 November 1.
NIH
-PA Author Manuscript
NIH
-PA Author Manuscript
NIH
-PA Author Manuscript

REFERENCES1. Abraham TT, Lowe RH, Pirnay SO, Darwin WD, Huestis MA. Simultaneous GC-EI-MS determination
of Delta9-tetrahydrocannabinol, 11-hydroxy-Delta9-tetrahydrocannabinol, and 11-nor-9-carboxy-Delta9-tetrahydrocannabinol in human urine following tandem enzyme-alkaline hydrolysis. J AnalToxicol 2007;31:477–485. [PubMed: 17988462]
2. Bolla KI, Brown K, Eldreth D, Tate K, Cadet JL. Dose-related neurocognitive effects of marijuanause. Neurology 2002;59:1337–1343. [PubMed: 12427880]
3. Bolla KI, Eldreth D, Matochik JA, Cadet JL. Neural substrates of faulty decision-making in abstinentmarijuana users. Neuroimage 2005;26:480–492. [PubMed: 15907305]
4. Bolla KI, Lesage SR, Gamaldo CE, Neubauer DN, Funderburk FR, Cadet JL, David PM, Verdejo-Garcia A, Benbrook AR. Sleep disturbance in heavy marijuana users. Sleep 2008;31:901–908.[PubMed: 18548836]
5. Dackis CA, Pottash AIC, Annitto W, Gold MS. Persistence of urinary marijuana levels after supervisedabstinence. Am J Psychiatry 1982;139:1196–1198. [PubMed: 6287871]
6. Eldreth D, Matochik JA, Cadet JL, Bolla KI. Abnormal brain activity in prefrontal brain regions inabstinent marijuana users. Neuroimage 2004;23:914–920. [PubMed: 15528091]
7. Ellis GM, Mann MA, Judson BA, Schramm NT, Tashchian A. Excretion patterns of cannabinoidmetabolites after last use in a group of chronic users. Clin Pharmacol Ther 1985;38:572–578. [PubMed:3902318]
8. Fraser AD, Worth D. Urinary excretion profiles of 11-nor-9-carboxy-Delta9-tetrahydrocannabinol.Study III. A Delta-9-THC-COOH to creatinine ratio study. Forensic Sci Int 2003;137:196–202.[PubMed: 14609657]
9. Fraser AD, Worth D. Urinary excretion profiles of 11-nor-9-carboxydelta9-tetrahydrocannabinol and11-hydroxy-delta9-THC: cannabinoid metabolites to creatinine ratio study IV. Forensic Sci Int2004;143:147–152. [PubMed: 15240035]
10. Herning RI, Better W, Tate K, Cadet JL. EEG deficits in chronic marijuana abusers during monitoredabstinence - Preliminary findings. Neuroprotective Agents 2003;993:75–78.
11. Herning RI, Better W, Tate K, Cadet JL. Cerebrovascular perfusion in marijuana users during a monthof monitored abstinence. Neurology 2005;64:488–493. [PubMed: 15699380]
12. Huestis MA, Mitchell JM, Cone EJ. Detection times of marijuana metabolites in urine byimmunoassay and GC-MS. J Anal Toxicol 1995;19:443–449. [PubMed: 8926739]
13. Huestis MA, Mitchell JM, Cone EJ. Urinary excretion profiles of 11-nor-9-carboxy-9-tetrahydrocannabinol in humans after single smoked doses of marijuana. J Anal Toxicol1996;20:441–452. [PubMed: 8889681]
14. Huestis MA, Cone EJ. Urinary excretion half-life of 11-nor-9-carboxydelta-9-tetrahydrocannabinolin humans. Ther Drug Monit 1998a;20:570–576. [PubMed: 9780137]
15. Huestis MA, Cone EJ. Differentiating new marijuana use from residual drug excretion in occasionalmarijuana users. J Anal Toxicol 1998b;22:445–454. [PubMed: 9788519]
16. Huestis, MA.; Smith, ML. Human cannabinoid pharmacokinetics and interpretation of cannabinoidconcentrations in biological fluids and tissues. In: Elsohly, M., editor. Marijuana and theCannabinoids. New York: Humana Press; 2005. p. 205-235.
17. Hunt CA, Jones RT. Tolerance and disposition of tetrahydrocannabinol in man. J Pharmacol ExpTher 1980;215:35–44. [PubMed: 6256518]
18. Johansson E. Terminal elimination plasma half-life of delta-1-tetrahydrocannabinol (delta-1-THC)in heavy users of marijuana. European J Clin Pharmacol 1989a;37:273–277. [PubMed: 2558889]
19. Johansson E, Halldin MM. Urinary excretion half-life of delta1-tetrahydrocannabinol-7-oic acid inheavy marijuana users after smoking. J Anal Toxicol 1989b;13:218–223. [PubMed: 2550702]
20. Johansson E, Gillespie HK, Halldin MM. Human urinary excretion profile after smoking and oraladministration of [14C] delta-1-tetrahydrocannabinol. J Anal Toxicol 1990;14:176–180. [PubMed:2165199]
21. Kelly P, Jones RT. Metabolism of tetrahydrocannabinol in frequent and infrequent marijuana users.J Anal Toxicol 1992;16:228–235. [PubMed: 1323733]
Lowe et al. Page 9
Drug Alcohol Depend. Author manuscript; available in PMC 2010 November 1.
NIH
-PA Author Manuscript
NIH
-PA Author Manuscript
NIH
-PA Author Manuscript

22. Kemp PM, Abukhalaf IK, Manno JE, Manno BR, Alford DD, Abusada GA. Cannabinoids in humans.I. Analysis of delta-9-tetrahydrocannabinol and six metabolites in plasma and urine using GC-MS.J Anal Toxicol 1995a;19:285–291. [PubMed: 7500614]
23. Kemp PM, Abukhalaf IK, Manno JE, Manno BR, Alford DD, McWilliams ME, Nixon FE, FitzgeraldMJ, Reeves RR, Wood MJ. Cannabinoids in humans. II. The influence of three methods of hydrolysison the concentration of THC and two metabolites in urine. J Anal Toxicol 1995b;19:292–298.[PubMed: 7500615]
24. Lowe RH, Karschner EL, Schwilke EW, Barnes AJ, Huestis MA. Simultaneous quantification ofdelta-9-tetrahydrocannabinol (THC), 11-hydroxydelta-9-tetrahydrocannabinol (11-OH-THC), and11-nor-delta-9-tetrahydrocannabinol-9-carboxylic acid (THCCOOH) in human plasma using two-dimensional gas chromatography, cryofocusing, and electron impact-mass spectrometry. JChromatog A 2007;1163:318–327. [PubMed: 17640656]
25. Manno JE, Manno BR, Kemp PM, Alford DD, Abukhalaf IK, McWilliams ME, Hagaman FN,Fitzgerald MJ. Temporal indication of marijuana use can be estimated from plasma and urineconcentrations of delta-9-tetrahydrocannabinol, 11-hydroxy-delta-9-tetrahydrocannabinol, and 11-nor-delta-9-tetrahydrocannabinol-9-carboxylic acid. J Anal Toxicol 2001;25:538–549. [PubMed:11599597]
26. Matochik JA, Eldreth D, Cadet JL, Bolla KI. Altered brain tissue composition in heavy marijuanausers. Drug Alcohol Depend 2005;77:23–30. [PubMed: 15607838]
27. McBurney LJ, Bobbie BA, Sepp LA. GC/MS and Emit analyses for delta-9-tetrahydrocannabinolmetabolites in plasma and urine of human subjects. J. Anal. Tox 1986;10:56–64.
28. Musshoff F, Madea B. Review of biologic matrices (urine, blood, hair) as indicators of recent orongoing cannabis use. Ther Drug Monit 2006;28:155–163. [PubMed: 16628124]
29. Peat, MA. Distribution of delta-9-tetrahydrocannabinol and its metabolites. In: Baselt, RC., editor.Advances in Analytical Toxicology II. Chicago: Year Book Medical Publishers; 1989. p. 186-217.
30. Smith-Kielland A, Skuterud B, Morland J. Urinary Excretion of 11-nor-9-carboxy-delta-9-tetrahydrocannabinol and cannabinoids in frequent and infrequent drug users. J Anal Toxicol1999;23:323–332. [PubMed: 10488918]
Lowe et al. Page 10
Drug Alcohol Depend. Author manuscript; available in PMC 2010 November 1.
NIH
-PA Author Manuscript
NIH
-PA Author Manuscript
NIH
-PA Author Manuscript

Figure 1.One dimensional-gas chromatography mass spectrometry (1D-GCMS) and two dimensional-gas chromatography mass spectrometry (2D-GCMS) data from Participant A. Urine excretioncurves for Δ9-tetrahydrocannabinol (THC), 11-hydroxy-THC (11-OH-THC), and 11-nor-9-carboxyTHC (THCCOOH) are shown.
Lowe et al. Page 11
Drug Alcohol Depend. Author manuscript; available in PMC 2010 November 1.
NIH
-PA Author Manuscript
NIH
-PA Author Manuscript
NIH
-PA Author Manuscript

Figure 2.Urine Δ9-tetrahydrocannabinol (THC) excretion curves from seven chronic heavy cannabisusers with THC concentrations ≥2.5 ng/mL for more than 72 h while residing on a closedresearch unit. Quantification was by two-dimensional gas chromatography mass spectrometry.
Lowe et al. Page 12
Drug Alcohol Depend. Author manuscript; available in PMC 2010 November 1.
NIH
-PA Author Manuscript
NIH
-PA Author Manuscript
NIH
-PA Author Manuscript

NIH
-PA Author Manuscript
NIH
-PA Author Manuscript
NIH
-PA Author Manuscript
Lowe et al. Page 13Ta
ble
1Su
bjec
t cha
ract
eris
tics a
nd se
lf-re
porte
d dr
ug u
se h
isto
ries f
or 3
3 he
avy
chro
nic
cann
abis
use
rs.
Age
Ht.
Wt.
Dru
g of
Yea
rsC
anna
bis u
seA
ge o
fA
mou
ntL
ast
Oth
erT
ime
onse
cure
Subj
ect
Gen
der
Rac
e(y
r)(in
)(lb
s)B
MI
choi
ceus
edR
oute
last
14
days
first
use
used
/day
use
drug
sun
it, d
ays
A*
MA
A33
7522
027
.5C
anna
bis
10Sm
oke
715
1 bl
unt
Prev
ious
Day
A12
B*
FA
A29
6617
528
.2C
anna
bis
10Sm
oke
1412
2 bl
unts
Prev
ious
day
A, T
8
C*
MA
A36
7517
021
.2C
anna
bis
22Sm
oke
1414
0.25
oz
3 h
Prev
ious
A, C
,T
21
D*
MA
A29
6719
530
.5C
anna
bis
9Sm
oke
1420
2 bl
unts
3 h
Prev
ious
A, T
30
E*
MA
A28
7016
023
.0C
anna
bis
13Sm
oke
1414
2 bl
unts
Sam
eD
ayA
10
F*F
AA
2168
150
22.8
Can
nabi
s7
Smok
e3
144
blun
ts3
hPr
evio
usA
, T30
G*
FA
A28
6214
927
.2C
anna
bis
11Sm
oke
1416
3 bl
unts
2 h
Prev
ious
A, T
13
HM
AA
2173
208
27.4
Can
nabi
s9
Smok
e14
122
blun
ts2
dPr
evio
usA
, T21
IF
U38
6516
026
.6C
anna
bis
22Sm
oke
1416
2–3
blun
ts2
dPr
evio
usA
, C,
P, T
23
JM
AA
2770
169
24.2
Can
nabi
s9
Smok
e14
152
blun
tsPr
evio
usD
ayA
; T7
KM
AA
3367
170
26.6
Can
nabi
s11
Smok
e14
213
join
ts2
dPr
evio
usA
, T20
LM
W23
6714
021
.9To
bacc
o4
Smok
e13
161
ozPr
evio
usD
ayA
, T25
MM
AI
2374
145
18.6
Can
nabi
s5
Smok
e14
174
blun
ts2
dPr
evio
usA
22
NF
AA
2167
200
31.3
Toba
cco
12Sm
oke
149
0.5
oz10
hpr
evio
usA
, T27
OF
AA
1967
150
23.5
Can
nabi
s4
Smok
e14
152
blun
tsPr
evio
usD
ayT
7
PM
AA
2474
250
32.1
Toba
cco
10Sm
oke
1014
$10
Prev
ious
Day
A, T
30
QM
AA
2269
150
22.1
Can
nabi
s7
Smok
e6
142
blun
tsPr
evio
usD
ayA
, T23
RM
AA
3371
155
21.6
Can
nabi
s5
Smok
e8
171
blun
tPr
evio
usD
ayA
, T17
Drug Alcohol Depend. Author manuscript; available in PMC 2010 November 1.

NIH
-PA Author Manuscript
NIH
-PA Author Manuscript
NIH
-PA Author Manuscript
Lowe et al. Page 14
Age
Ht.
Wt.
Dru
g of
Yea
rsC
anna
bis u
seA
ge o
fA
mou
ntL
ast
Oth
erT
ime
onse
cure
Subj
ect
Gen
der
Rac
e(y
r)(in
)(lb
s)B
MI
choi
ceus
edR
oute
last
14
days
first
use
used
/day
use
drug
sun
it, d
ays
SM
U24
7217
423
.6To
bacc
o6
Smok
e10
182
blun
ts12
hpr
evio
usA
, T28
TM
AA
2672
200
27.1
Can
nabi
s13
Smok
e12
134
blun
ts15
hpr
evio
usA
, T30
UF
AA
2862
140
25.6
Can
nabi
s12
Smok
e14
151–
2 bl
unts
19 h
prev
ious
A, T
3
VF
AA
2260
125
24.4
Can
nabi
s8
Smok
e14
145
blun
ts5
hpr
evio
usA
, T30
WF
AA
2262
180
32.9
Can
nabi
s4
Smok
e14
1410
blu
nts
6 h
prev
ious
A, T
18
XF
AA
3063
130
23.0
Can
nabi
s12
Smok
e10
182
blun
tsPr
evio
usD
ayA
, T28
YM
AA
2567
150
23.5
Can
nabi
s9
Smok
e14
146
blun
ts12
hpr
evio
usA
, T30
ZM
AA
2273
195
25.7
Can
nabi
s4
Smok
e14
182
blun
tsPr
evio
usda
yA
, T29
AA
FW
2663
150
26.6
Can
nabi
s2
Smok
e11
217
join
tsSa
me
day
A, T
14
BB
MA
A30
7419
525
.0C
anna
bis
16Sm
oke
1414
1 ou
nce
Sam
eda
yA
, T30
CC
FA
A22
6316
028
.3C
anna
bis
8Sm
oke
1414
4–5
blun
tsPr
evio
usda
yA
, T21
DD
FA
A26
6114
727
.8C
anna
bis
9Sm
oke
1417
4 bl
unts
Prev
ious
day
A, T
29
EE
FA
A23
6322
039
.0C
anna
bis
8Sm
oke
1415
8 bl
unts
10 h
prev
ious
A, T
29
FFF
AA
2366
198
32.0
Can
nabi
s3
Smok
e14
204
blun
ts9
hpr
evio
usA
30
GG
FA
A23
6324
042
.5C
anna
bis
5Sm
oke
718
2 bl
unts
Prev
ious
day
A, T
29
* Pers
iste
nt T
HC
Gro
up w
ith T
HC
≥2.
5 ng
/mL
for m
ore
than
72
h
AA
: Afr
ican
-Am
eric
an; A
I: A
mer
ican
-Ind
ian;
U: U
nkno
wn;
W: W
hite
; A: A
lcoh
ol; C
: Coc
aine
; P: P
henc
yclid
ine;
T: T
obac
co
Drug Alcohol Depend. Author manuscript; available in PMC 2010 November 1.
NIH
-PA Author Manuscript
NIH
-PA Author Manuscript
NIH
-PA Author Manuscript
Lowe et al. Page 15Ta
ble
2U
rine Δ9
-tetra
hydr
ocan
nabi
nol (
THC
) m
axim
um d
aily
con
cent
ratio
ns a
s de
term
ined
by
one-
dim
ensi
onal
gas
chr
omat
ogra
phy
mas
ssp
ectro
met
ry, t
imes
of f
irst n
egat
ive a
nd la
st p
ositi
ve sp
ecim
ens (≥2
.5 n
g/m
L) in
a su
bgro
up o
f sev
en h
eavy
chro
nic c
anna
bis u
sers
dur
ing
24 h
mon
itore
d ab
stin
ence
on
a se
cure
rese
arch
uni
t.
Max
imum
TH
C C
once
ntra
tion
(ng/
mL
) 1
Hig
he st T
HC
Tim
eof
Hig
he st
Tim
eof Firs
tN
egat
ive
Tim
eof Las
tPo
sitiv e
Det
ectio
n R
ate2
Subj
ect
Ent
ry
Da y 1
Da y 2
Da y 3
Da y 4
Da y 5
Da y 6
Da y 7
Da y 8
Da y 9
Da y 10
Da y 11
Da y 12
Da y 13
Da y 14
Da y 22
Da y 25
Day
26ng
/mL
Day
sD
ays
Day
s%
A8.
811
. 58.
06.
76.
07.
05.
65.
64.
35.
73.
44.
54.
0*
11.5
0.6
11.0
12.0
*10
0.0
B7.
311
. 08.
28.
57.
98.
28.
47.
07.
6**
11.0
0.4
1.1
7.5**
86.2
C5.
88.
37.
66.
54.
5N D
8.3
1.0
0.3
3.7
64.3
D5.
25.
26.
32.
63.
5N D
6.3
1.9
0.7
3.3
44.2
E8.
18.
17.
86.
14.
46.
07.
35.
04.
7N D
8.1
0.0
1.5
7.2
70.4
F15
.417
. 210
. 18.
916
. 48.
810
. 78.
59.
37.
34.
85.
16.
85.
16.
53.
03.
5N
D17
.20.
61.
124
.785
.8
GN
D4.
83.
64.
75.
73.
6N
D5.
73.
11.
14.
661
.5
Mea
n9.
71.
12.
49.
072
.7
Med
ian
8.3
0.6
1.1
7.2
70.4
1 Hig
hest
TH
C c
once
ntra
tion
with
in d
ay
2 Num
ber o
f spe
cim
ens g
reat
er th
an li
mit
of q
uant
ifica
tion
divi
ded
by to
tal n
umbe
r of s
peci
men
s tes
ted
ND
= n
one
dete
cted
(<2.
5 ng
/mL
limit
of d
etec
tion)
* Spec
imen
col
lect
ion
term
inat
ed a
t 12.
0 da
ys
**Sp
ecim
en c
olle
ctio
n te
rmin
ated
at 7
.5 d
ays
Drug Alcohol Depend. Author manuscript; available in PMC 2010 November 1.

NIH
-PA Author Manuscript
NIH
-PA Author Manuscript
NIH
-PA Author Manuscript
Lowe et al. Page 16Ta
ble
3U
rine
11-h
ydro
xy-Δ
9 -te
trahy
droc
anna
bino
l (1
1-O
H-T
HC
) an
d 11
-nor
-9-c
arbo
xy-Δ
9 -te
trahy
droc
anna
bino
l (T
HC
CO
OH
) m
axim
umda
ily c
once
ntra
tions
by
one-
dim
ensi
onal
gas
chr
omat
ogra
phy
mas
s sp
ectro
met
ry q
uant
ifica
tion
in s
even
hea
vy c
hron
ic c
anna
bis
user
sdu
ring
24 h
mon
itore
d ab
stin
ence
on
a se
cure
rese
arch
uni
t.
Max
imum
With
in-D
ay 1
1-O
H-T
HC
and
TH
CC
OO
H C
once
ntra
tions
(ng/
mL
) 1H
ighe
stC
once
ntra
tion
Tim
e of
Hig
hest
Subj
ect
Day 1
Day 2
Day 3
Day 4
Day 5
Day 6
Day 7
Day 8
Day 9
Day 10
Day 11
Day 12
Day 13
Day 14
Day 22
Day 25
(ng/
mL
)(D
ays)
A11
-OH
-TH
C97
5334
3438
3737
3241
2516
3197
0.6
THC
CO
OH
620
484
178
180
253
212
225
128
148
139
137
5062
00.
6
B11
-OH
-TH
C14
478
8375
6767
6364
144
0.4
THC
CO
OH
401
182
204
172
207
189
161
118
401
0.9
C11
-OH
-TH
C41
3839
2641
0.2
THC
CO
OH
851
710
668
308
851
1.0
D11
-OH
-TH
C90
3421
3190
0.0
THC
CO
OH
489
468
133
197
489
0.0
E11
-OH
-TH
C71
4634
2731
3922
228
710.
0
THC
CO
OH
312
324
195
180
207
180
9912
666
324
1.2
F11
-OH
-TH
C20
486
6569
4752
3542
4129
3739
3226
1618
204
0.0
THC
CO
OH
581
303
121
141
126
105
123
119
105
6981
7588
6031
3858
10.
2
G11
-OH
-TH
C41
2321
2019
1641
0.4
THC
CO
OH
395
206
221
146
102
7939
50.
6
med
ian
time
of h
ighe
st 1
1-O
H-T
HC
0.2
med
ian
time
of h
ighe
stTH
CC
OO
H0.
6
1 Hig
hest
con
cent
ratio
n w
ithin
day
Drug Alcohol Depend. Author manuscript; available in PMC 2010 November 1.


