Embed Size (px)
Citation preview

Hindawi Publishing CorporationISRN Software EngineeringVolume 2013, Article ID 276105, 14 pageshttp://dx.doi.org/10.1155/2013/276105
Research ArticleExtension of Object-Oriented Metrics Suite forSoftware Maintenance
John Michura, Miriam A. M. Capretz, and Shuying Wang
Department of Electrical and Computer Engineering, Faculty of Engineering, The University of Western Ontario,London, ON, Canada N6A 5B9
Correspondence should be addressed to Miriam A. M. Capretz; [email protected]
Received 2 December 2012; Accepted 22 January 2013
Academic Editors: Y. Malaiya, A. Rausch, and C. Rolland
Copyright © 2013 John Michura et al. This is an open access article distributed under the Creative Commons Attribution License,which permits unrestricted use, distribution, and reproduction in any medium, provided the original work is properly cited.
Software developers require information to understand the characteristics of systems, such as complexity and maintainability. Inorder to further understand and determine characteristics of object-oriented (OO) systems, this paper describes research thatidentifies attributes that are valuable in determining the difficulty in implementing changes during maintenance, as well as thepossible effects that such changesmay produce. A set ofmetrics are proposed to quantify andmeasure these attributes.Theproposedcomplexity metrics are used to determine the difficulty in implementing changes through the measurement of method complexity,method diversity, and complexity density.The paper establishes impactmetrics to determine the potential effects ofmaking changesto a class and dependence metrics that are used to measure the potential effects on a given class resulting from changes in otherclasses. The case study shows that the proposed metrics provide additional information not sufficiently provided by the relatedexisting OOmetrics.Themetrics are also found to be useful in the investigation of large systems, correlating with project outcomes.
1. Introduction
Software metrics have been used to solve different problemssuch as predicting testing complexity [1], identifying errors[2], and promoting modularity [3]. The metrics proposedby Chidamber and Kemerer [4], now referred to as the CKmetrics, have become well known and widely accepted bythe software engineering community. The CK metrics can beused to measure some characteristics of OO systems such asclasses, message passing, inheritance, and encapsulation. Onthe other hand, the software maintenance phase requires thatchanges are made to the existing system. Although the exist-ing metrics, such as the CK metrics, can be used to predictoutcomes during software maintenance, such as effort anddefects, they do not provide sufficient information regardingthe difficulty in implementing such changes, as well as thepotential effects of those changes. It would also be beneficialif information is provided regarding the interaction of classesin an OO system in order to predict behavioral changes inthose classes during maintenance. Therefore, it is necessaryto develop new metrics for software maintainers to better
understand the complexity of classes as well as the potentialeffects of changing classes.
In order to develop new metrics, it is necessary to deter-mine the weaknesses present in the existing metrics. Weak-nesses include the loss of information when two classes aresaid to be coupled and the simultaneous measurement ofmultiple attributes. The coupling relationship also does notdisclose information regarding its direction or magnitude. Itis therefore imperative to identify attributes that are relevantin determining the difficulty in implementing changes as wellas the effects of such changes. However, only identifying suchattributes is not sufficient. It is important that such attributesare quantified in order for them to be effective. As a result,a suite of metrics is required to measure the relevant classattributes.
In this paper, we define the influence relationship, identifyclass attributes, and develop a proposed suite of metrics usedfor maintaining OO systems. The key contributions of theresearch presented in this paper are as follows.
(i) The complexity of a class has been shown to pre-dict the effort required to test and maintain it [4].

2 ISRN Software Engineering
Consequently, the difficulty in implementing changesonto a class will be determined by its complexity.Three attributes will be identified and measured bythe proposed set of complexity metrics: method com-plexity, method diversity, and complexity density.These attributes are associated with the difficulty inimplementing changes onto a class.
(ii) In addition, the effect of changes will be determinedby the use of instance variables and methods of agiven class in other classes. A relationship betweentwo classes, influence, will be defined. The influencerelationship will be used by a set of proposed metricstomeasure the effects ofmaking changes to particularclasses. Two attributes will be defined and measuredby the proposed set of metrics: impact and depen-dence. Impact is used to determine the potentialeffects of changes in a given class on the behavior ofthe system, while dependence is used to determinethe potential change in behavior in a given class thatresults from changes in other classes.
(iii) The metrics proposed in this research will be usedin conjunction with the CK metrics to provide addi-tional information regarding the maintenance of OOsystems.
The remainder of this paper is organized as follows. InSection 2, a literature review outlines various establishedmetrics. The CK metrics are discussed as well as researchconducted to investigate them. Section 3 identifies anddefines attributes associated with classes and presents a suiteof metrics intended to complement the CKmetrics discussedin Section 2. Results used to determine the effectiveness of thenewmetrics are presented in Section 4. Section 5 presents theconclusions and future work.
2. Literature Review
The goal of this section is to provide an overview of well-adopted works in software metrics. Although widely usedmetrics already existed, the arrival of the object-oriented(OO) approach required the development of new metrics.The majority of the established metrics are not designed forthe OO paradigm [5]. As a result, they are not sufficient inmeasuring properties of OO systems. Some established met-rics, such as cyclomatic complexity, are also thought to beinsufficient in desirable measurement properties [6], lacktheoretical basis [7], and are implementation dependent[8]. On the other hand, the CK metrics present a suite ofmetrics for OO systems that are claimed to be theoreticallysound, contained desired measurement characteristics, andare empirically validated [4].The suite comprises six metrics:Weighted Methods per Class (WMC), Coupling BetweenObjects (CBO), Depth of Inheritance Tree (DIT), Number ofChildren (NOC), Response For a Class (RFC), and Lack ofCohesion in Methods (LCOM).
There have been many studies conducted to investigatethe value of the CK metrics. The metrics have often beenassociated with product results such as fault-proneness [9,10], quality [11–15], complexitymeasurement [16], and project
results such asmaintenance effort [17, 18].We summarize fiveimprovements upon the CK Metrics as follows.
(1) Improving uponWMC. A criticism directed atWMCis that the metric is ambiguously defined [19]. It isthe sum of the complexities of the methods in theclass. However, the complexities can either be unity(equal to one) or some static complexity measuresuch as cyclomatic complexity as assumed in thisresearch [18].The value ofWMC is dependent on howcomplexity is defined. Li and Henry [18] solved thisproblem by defining a metric that counts the numberof methods declared in the class, called Number ofMethods (NOM). Li later modified NOM to countonly methods that are accessible by other classes[20]. This metric is called Number of Local Methods(NLM). Both metrics have their advantages and dis-advantages. NOM is a better measure of the sizeof the class while NLM is a better measure of thepotential effect the given class can have on otherclasses. Li also proposed another metric that wouldmeasure the overall complexity of the class [20]. ClassMethod Complexity (CMC) is equal to the sum ofthe complexities of the methods in the class. Thisdiffers from WMC in that the complexities used incalculating CMC cannot be defined as unity.
(2) Improving upon coupling. CK’s formulation of cou-pling has also been the subject of scrutiny. CK statesthat two classes are coupled if at least one methodin one class uses a method or an instance variable ofthe other class. The metric they devised to measurecoupling is CBO, a count of all classes the particularclass is coupled to. Li and Henry’s Message PassingCoupling (MPC) metric addresses both couplingstrength and coupling direction [18]. The MPC of aclass is equal to the number of messages sent out fromthe class. A possible shortcoming of MPC is that itassumes that instance variables are not accessed byother objects. Although the direct access of anotherclass instance variables is considered questionableprogramming practices, it should not be ignored.It is often used to access constants defined withinclasses. As a result, it is possible that changes madeto instance variables may affect other classes. Li’sCoupling Through Message Passing (CTM) [20] alsoaddresses both coupling strength and direction, butdoes not address instance variables in the count ofmessage passing.
(3) Improving upon inheritance. Researchers haveaddressed the inheritance metrics. Li states that theDIT metric is flawed in that it does not considercases where a class is inheriting from multiple roots[20]. She addresses this problem with the metricNumber of Ancestor Classes (NAC). NAC is a countof all classes the given class inherits from. It is moreaccurate in determining the number of classes thatcan change the behavior of the given class. Li alsostates that CK’s NOC is flawed by only consideringclasses that directly inherit from the given class. The
ISRN Software Engineering 3
Number of Descendent Classes (NDC) is a countof all classes that inherit from the given class. Li’sinheritance metrics are an accurate measure of a classinvolvement in inheritance. However, changes inancestor classes can affect the behavior of classes notbelonging to the same inheritance tree.
(4) Improving upon RFC (Response for a Class). TheRFC metric can also be criticized in its measurementof multiple attributes [21] and is found to be highlycorrelated with CBO [22]. RFC intends to measurethe number of different possible methods that can beexecuted by the class in response to a message. As aresult, RFC is a function of the number of methods inthe class as well as the number of different methodscalled within methods of the class. The criticismdirected at the metric is resolved by instead using acombination of other metrics such as Li and Henry’sNOM and MPC metrics.
(5) Improving upon LCOM (Lack of Cohesion in Meth-ods). Hitz and Montazeri [23] have commented thatvalues obtained from LCOM are difficult to explainas the value of the metric is influenced greatly by thenumber ofmethods the class contains. Chae et al. [24]also have commented that methods such as accessors(methods used to obtain the value of a class instancevariables) and mutators (methods used to alter thevalue of a class instance variables) increase the valueof the metric though they are considered soundprogramming practices. Many cohesion metrics havebeen developed by researchers to resolve the issuesconcerning LCOM [25, 26]. Such solutions includethe exclusion of special methods [24] and changingthe equation [14].
3. Software Metrics
The key contributions of this research are the definition ofcomplexity and influence, the identification of class attributesrelated to maintenance, and the proposal of a suite of metricsused to measure such attributes.
3.1. Class Complexity and Influence Relationship. The focusof this research is on changes to an existing software duringthe maintenance phase of the software’s life cycle. Theattributes described in this research are aimed at providingan understanding of the difficulty, as well as the effects, ofmaking changes to an existing system.
(i) Complexity is used to quantify the difficulty associatedwith implementing changes during the maintenancephase. Further, complexity is defined as the difficultyin understanding abstractions of software such asdesign documents and implementation code.
(a) Class complexity refers to the amount of effortrequired to understand a class. A class that ismore complex will require more effort to main-tain.
Class A
(a)
Class B
(b)
Figure 1: Method diversity.
(b) Method complexity refers to the amount ofeffort required to understand the method. Themethod complexity of a class refers to theamount of effort required to understand each ofits methods.
(ii) Complexity density is defined as the proportion ofthe class complexity not resulting frommethods withminimal complexity.
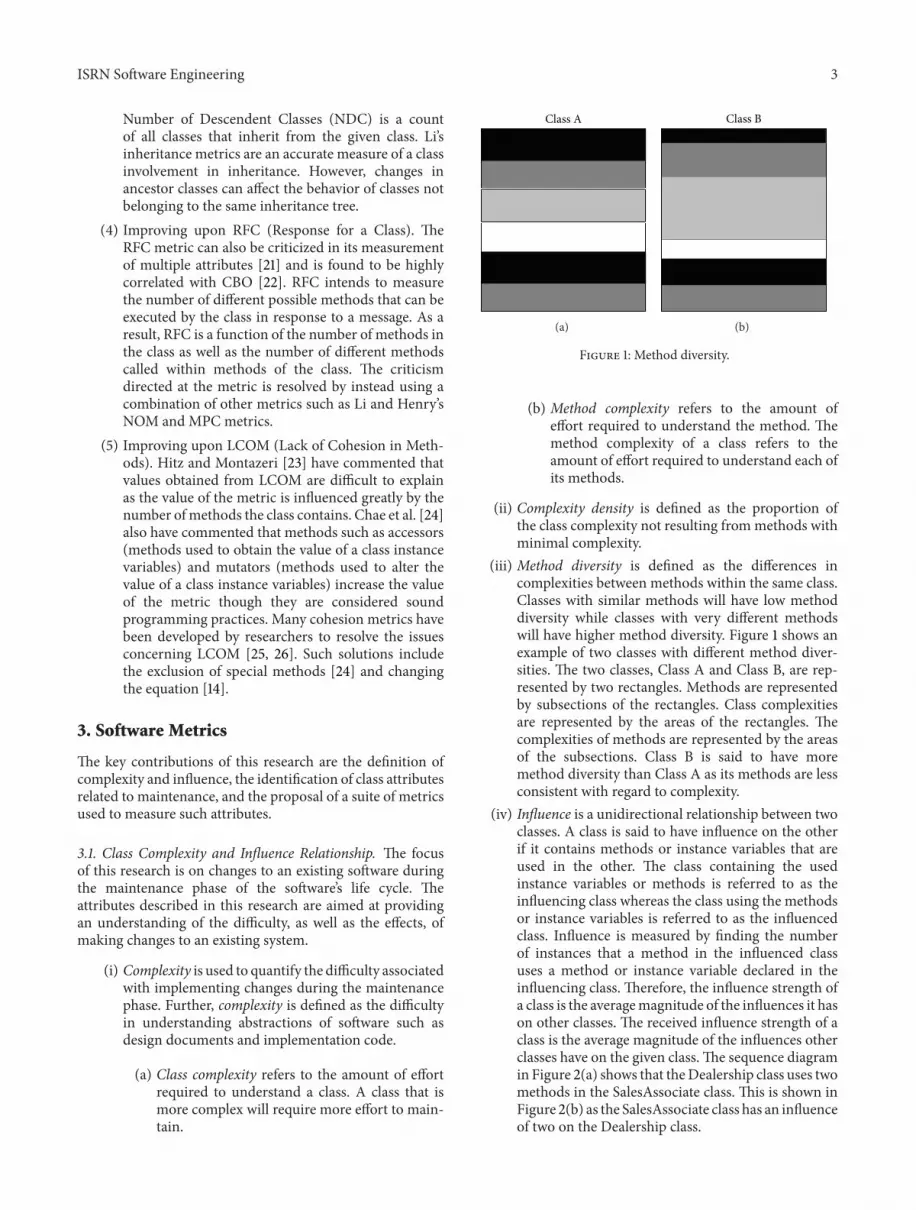
(iii) Method diversity is defined as the differences incomplexities between methods within the same class.Classes with similar methods will have low methoddiversity while classes with very different methodswill have higher method diversity. Figure 1 shows anexample of two classes with different method diver-sities. The two classes, Class A and Class B, are rep-resented by two rectangles. Methods are representedby subsections of the rectangles. Class complexitiesare represented by the areas of the rectangles. Thecomplexities of methods are represented by the areasof the subsections. Class B is said to have moremethod diversity than Class A as its methods are lessconsistent with regard to complexity.
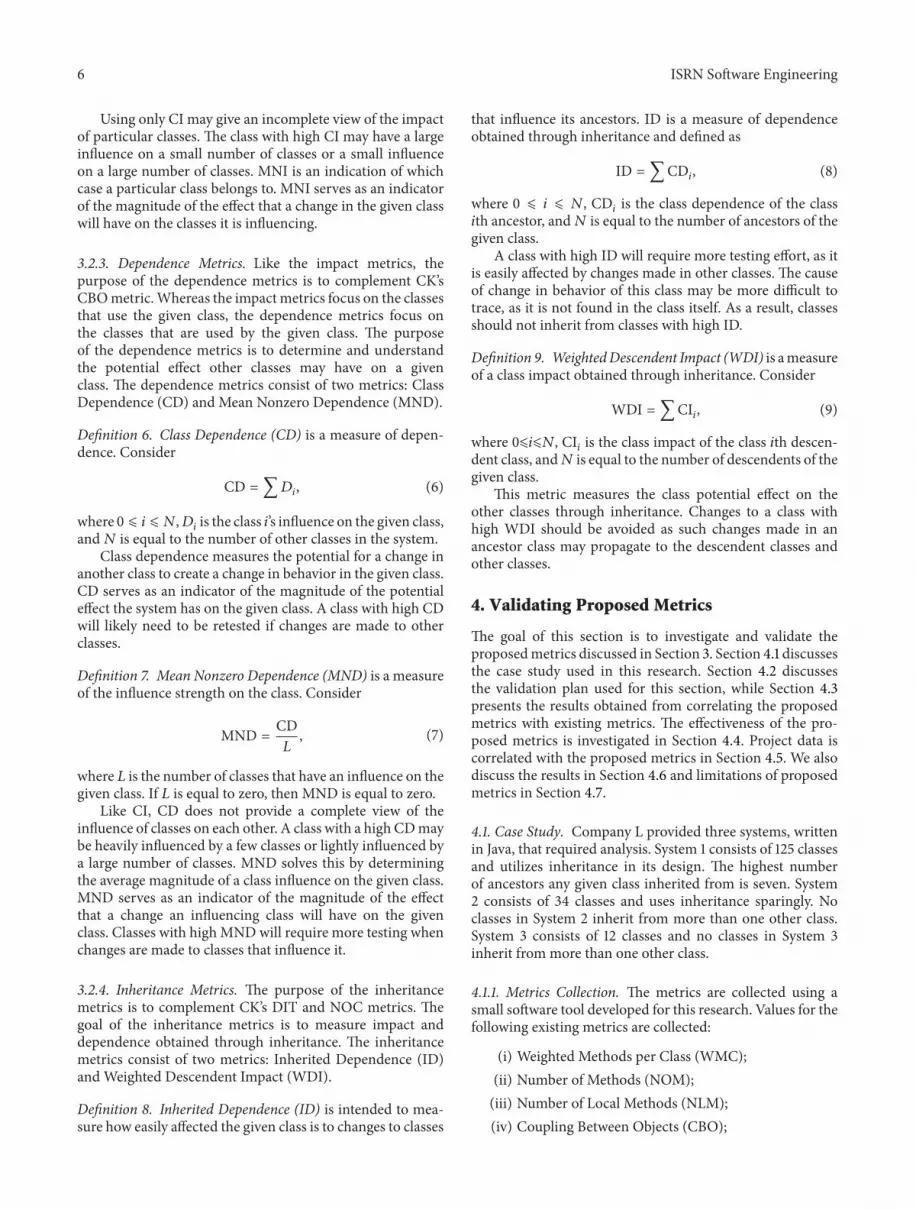
(iv) Influence is a unidirectional relationship between twoclasses. A class is said to have influence on the otherif it contains methods or instance variables that areused in the other. The class containing the usedinstance variables or methods is referred to as theinfluencing class whereas the class using the methodsor instance variables is referred to as the influencedclass. Influence is measured by finding the numberof instances that a method in the influenced classuses a method or instance variable declared in theinfluencing class. Therefore, the influence strength ofa class is the averagemagnitude of the influences it hason other classes. The received influence strength of aclass is the average magnitude of the influences otherclasses have on the given class.The sequence diagramin Figure 2(a) shows that theDealership class uses twomethods in the SalesAssociate class. This is shown inFigure 2(b) as the SalesAssociate class has an influenceof two on the Dealership class.

4 ISRN Software Engineering
Dealership:carDealer
SalesAssociate:salesAsst
getCarsSold()
updateInventory()
updateProfit()
getCarsSold()
getCarID()
getSalePrice()
getCarCost()
getOwner()
getCarID()
updateFiles()
Sequence diagram Influence relationships
SalesAssociate
SalesAssociate
SalesAssociate
Dealership
Dealership
Dealership
Car
Car
Car: sold Car
(a) (b)
1
2
3
4
Figure 2: Influence relationship.
(v) Impact is defined as a class potential to alter thebehavior of other classes when it is changed. Impactis a function of the class influence on other classes.Figure 3 shows the examples of impact of three classes:SalesAssociate, Dealership, and Car. The impact of aclass can be measured by the summation of its influ-ences. The SalesAssociate class has an impact of twosince it has an influence on the Dealership class oftwo.The Dealership class has an impact of three sinceit has an influence of three on the SalesAssociateclass. The Car class has an influence of four on theSalesAssociate class and one on the Dealership class.Therefore, its impact is equal to five.
(vi) Dependence is defined as a class potential to changein behavior when other classes are changed. It is usedto quantify the possible effects associated with imple-menting changes during maintenance. The depen-dence of a class can be measured by the summationof influences on it. Figure 4 shows examples ofdependence. Figure 4(b) shows the dependence oftwo classes: SalesAssociate and Dealership.The Deal-ership class has a dependence of three since the Carclass has an influence on it equal to one and theSalesAssociate class has an influence on it equal totwo. The SalesAssociate class has a dependence ofseven since the Car class has an influence on it equalto four and the Dealership class has an influence on itequal to three.TheCar class is said to have no depend-ence since it is not influenced by any other classes.
3.2. Proposed Metrics. In order to measure the attributesdescribed in Section 3.1, a suite of metrics is developed toquantify the attributes. The suite is comprised of four subsetsof metrics: complexity metrics, impact metrics, dependencemetrics, and inheritance metrics.
3.2.1. Complexity Metrics. The purpose of the complexitymetrics is to complement CK’sWMCmetric. SinceWMC is afunction of two different class attributes (number of methodsand class complexity), other metrics may be required tofully understand its results.The proposed complexity metricsconsist of three metrics: Mean Method Complexity (MMC),Standard Deviation Method Complexity (SDMC), and Pro-portion of Nontrivial Complexity (PNC).
Definition 1. Mean Method Complexity (MMC) is a measureof a class method complexity
MMC =∑ 𝑐𝑖
𝑛
, (1)
where 1 ⩽ 𝑖 ⩽ 𝑛, 𝑐𝑖is the cyclomatic complexity of the class
𝑖th method, and 𝑛 is equal to the number of methods in theclass.
MMC serves as an indicator of the complexity of the classmethods. MMC is similar to Etzkorn’s [27] Average MethodComplexity (AMC). The difference between the two metricsis their interpretation of 𝑐
𝑖. AMC specifies 𝑐
𝑖as the complexity
of the method according to any static complexity measurewhereas MMC specifies 𝑐
𝑖as the method’s cyclomatic com-
plexity. The purpose of this metric is to determine if a classWMC value is a result of low-complexity methods or high-complexity methods. High MMC is an indicator of classescomprised of methods with high cyclomatic complexity.
Definition 2. Standard Deviation Method Complexity(SDMC) is to measure the method diversity of a class.Consider
SDMC = √∑ (MMC − 𝑐
𝑖)
2
𝑛 − 1
,
(2)

ISRN Software Engineering 5
Influence relationships Impact
SalesAssociate
SalesAssociate
SalesAssociate
SalesAssociate
DealershipDealership
Dealership
Dealership
Car
Car
Car
(a) (b)
1
2
3
4
5
2
3
Figure 3: Influence relationships to impact.
Influence relationships
SalesAssociate
SalesAssociate
SalesAssociate
SalesAssociate
DealershipDealership
Dealership
Dealership
Car
Car
Dependence
(a)
1
2
3
4
7
3
(b)
Figure 4: Influence relationships to dependence.
where 1 ⩽ 𝑖 ⩽ 𝑛, 𝑐𝑖is the cyclomatic complexity of the class
𝑖th method, and 𝑛 is equal to the number of methods in theclass.
A class with low SDMC implies similarly complex meth-ods. A class with high SDMC indicates varying method com-plexities.
Definition 3. Proportion of nontrivial complexity (PNC)mea-sures the class complexity density as
PNC = 1 − 𝑇WMC, (3)
where 𝑇 is equal to the number of trivial methods in theclass, and WMC is the CK’s WMC metric that is the sumof complexities of local methods in the class. A method issaid to be trivial if its cyclomatic complexity is equal toone. Examples of trivial methods are accessor and mutatormethods, as well as empty methods.
A low PNC implies a large proportion of trivial methods.Trivial methods require less testing and maintenance as theyhave the lowest possible cyclomatic complexity. Classes withhigh PNC indicate a higher percentage of methods thatrequire rigorous testing.
3.2.2. ImpactMetrics. Thepurpose of the impactmetrics is tocomplement CK’s CBOmetric.The CBOmetric is a measure
of both the number of classes the given class uses and thenumber of classes that use the given class.The impact metricsfocus on classes that use the given class in order to determineand understand the potential effect a class may have on otherclasses. The proposed impact metrics consist of two metrics:Class Impact (CI) and Mean Nonzero Influence (MNI).
Definition 4. Class Impact (CI) measures the potential effectof making changes in the given class. Consider
CI = ∑𝐼𝑖, (4)
where 0 ⩽ 𝑖 ⩽ 𝑁, 𝐼𝑖is the class influence on class 𝐼, and𝑁 is
equal to the number of other classes in the system.CI serves as an indicator of themagnitude of the potential
effect that a change in the given class will have on the entiresystem. Classes with high CI should be tested carefully as itimplies a greater potential for affecting the behavior of otherclasses.
Definition 5. Mean Nonzero Influence (MNI) is a measure ofinfluence strength. Consider
MNI = CI𝑀
, (5)
where 𝑀 is the number of classes that the given class isinfluencing. If𝑀 is equal to zero, then MNI is valued at zero.
6 ISRN Software Engineering
Using only CI may give an incomplete view of the impactof particular classes. The class with high CI may have a largeinfluence on a small number of classes or a small influenceon a large number of classes. MNI is an indication of whichcase a particular class belongs to. MNI serves as an indicatorof the magnitude of the effect that a change in the given classwill have on the classes it is influencing.
3.2.3. Dependence Metrics. Like the impact metrics, thepurpose of the dependence metrics is to complement CK’sCBOmetric.Whereas the impactmetrics focus on the classesthat use the given class, the dependence metrics focus onthe classes that are used by the given class. The purposeof the dependence metrics is to determine and understandthe potential effect other classes may have on a givenclass. The dependence metrics consist of two metrics: ClassDependence (CD) and Mean Nonzero Dependence (MND).
Definition 6. Class Dependence (CD) is a measure of depen-dence. Consider
CD = ∑𝐷𝑖, (6)
where 0 ⩽ 𝑖 ⩽ 𝑁,𝐷𝑖is the class 𝑖’s influence on the given class,
and𝑁 is equal to the number of other classes in the system.Class dependence measures the potential for a change in
another class to create a change in behavior in the given class.CD serves as an indicator of the magnitude of the potentialeffect the system has on the given class. A class with high CDwill likely need to be retested if changes are made to otherclasses.
Definition 7. Mean Nonzero Dependence (MND) is a measureof the influence strength on the class. Consider
MND = CD𝐿
, (7)
where 𝐿 is the number of classes that have an influence on thegiven class. If 𝐿 is equal to zero, then MND is equal to zero.
Like CI, CD does not provide a complete view of theinfluence of classes on each other. A class with a high CDmaybe heavily influenced by a few classes or lightly influenced bya large number of classes. MND solves this by determiningthe average magnitude of a class influence on the given class.MND serves as an indicator of the magnitude of the effectthat a change an influencing class will have on the givenclass. Classes with high MNDwill require more testing whenchanges are made to classes that influence it.
3.2.4. Inheritance Metrics. The purpose of the inheritancemetrics is to complement CK’s DIT and NOC metrics. Thegoal of the inheritance metrics is to measure impact anddependence obtained through inheritance. The inheritancemetrics consist of two metrics: Inherited Dependence (ID)and Weighted Descendent Impact (WDI).
Definition 8. Inherited Dependence (ID) is intended to mea-sure how easily affected the given class is to changes to classes
that influence its ancestors. ID is a measure of dependenceobtained through inheritance and defined as
ID = ∑CD𝑖, (8)
where 0 ⩽ 𝑖 ⩽ 𝑁, CD𝑖is the class dependence of the class
𝑖th ancestor, and𝑁 is equal to the number of ancestors of thegiven class.
A class with high ID will require more testing effort, as itis easily affected by changes made in other classes. The causeof change in behavior of this class may be more difficult totrace, as it is not found in the class itself. As a result, classesshould not inherit from classes with high ID.
Definition 9. WeightedDescendent Impact (WDI) is ameasureof a class impact obtained through inheritance. Consider
WDI = ∑CI𝑖, (9)
where 0⩽𝑖⩽𝑁, CI𝑖is the class impact of the class 𝑖th descen-
dent class, and𝑁 is equal to the number of descendents of thegiven class.
This metric measures the class potential effect on theother classes through inheritance. Changes to a class withhigh WDI should be avoided as such changes made in anancestor class may propagate to the descendent classes andother classes.
4. Validating Proposed Metrics
The goal of this section is to investigate and validate theproposedmetrics discussed in Section 3. Section 4.1 discussesthe case study used in this research. Section 4.2 discussesthe validation plan used for this section, while Section 4.3presents the results obtained from correlating the proposedmetrics with existing metrics. The effectiveness of the pro-posed metrics is investigated in Section 4.4. Project data iscorrelated with the proposed metrics in Section 4.5. We alsodiscuss the results in Section 4.6 and limitations of proposedmetrics in Section 4.7.
4.1. Case Study. Company L provided three systems, writtenin Java, that required analysis. System 1 consists of 125 classesand utilizes inheritance in its design. The highest numberof ancestors any given class inherited from is seven. System2 consists of 34 classes and uses inheritance sparingly. Noclasses in System 2 inherit from more than one other class.System 3 consists of 12 classes and no classes in System 3inherit from more than one other class.
4.1.1. Metrics Collection. The metrics are collected using asmall software tool developed for this research. Values for thefollowing existing metrics are collected:
(i) Weighted Methods per Class (WMC);(ii) Number of Methods (NOM);(iii) Number of Local Methods (NLM);(iv) Coupling Between Objects (CBO);

ISRN Software Engineering 7
(v) Message Passing Coupling (MPC);(vi) CouplingThrough Message Passing (CTM);(vii) Depth in Inheritance Tree (DIT);(viii) Number of Ancestor Classes (NAC);(ix) Number of Children (NOC);(x) Number of Descendent Classes (NDC).
Values for the following proposed metrics are collected:
(i) Mean Method Complexity (MMC);(ii) Standard Deviation Method Complexity (SDMC);(iii) Proportion of Nontrivial Complexity (PNC);(iv) Class Impact (CI);(v) Mean Nonzero Influence (MNI);(vi) Class Dependence (CD);(vii) Mean Nonzero Dependence (MND);(viii) Weighted Descendent Impact (WDI);(ix) Inherited Dependence (ID).
The proposedmetrics are compared to values of the exist-ing metrics. This allows for the effectiveness of the proposedmetrics to be determined. It is also determined how thevalues of the proposed metrics correlated with project dataprovided by Company L in order to draw conclusions aboutthe relationships that exist between various class attributesand project outcomes.The values obtained from the proposedmetrics can also be used to obtain a better understandingregarding various characteristics of classes present in thesystems.
4.1.2. DataCollection. Theproject data used in this research iscollected using the Perforce software configuration manage-ment system (SCMS). The SCMS provides change historiesalongwith the description of the changes, the classes involvedin the changes, and the associated change ID number. Theoutputs of the SCMS provide the following project results foreach class.
(i) Number of Revisions (REV): the number of revisionsis investigated for multiple reasons as the number ofrevisions provides a clear and quantifiable measure ofmaintenance effort. It represents the number of timesthe class is changed.
(ii) Number of Defects (DEF): the number of defects isinvestigated for similar reasons. It is always beneficialto reduce the number of defects found in classes.
(iii) Number of Corrective Actions (COR): the number ofcorrections is investigated to determine the frequencyto correct mistakes in the classes such as defects. Notethat the number of corrections is not necessarily equalto the number of defects. It may take more than onecorrection to repair a defect as well as it may takeonly one correction to repair multiple defects. Forthis reason, it is determined that both defects andcorrections are to be investigated. Also the number
of revisions and the number of corrective actionsdiffer in that it may require more than one revisionto complete one corrective action.
4.2. Validation Plan. Pearson correlations are calculatedusing the Statistical Package for the Social Sciences (SPSS).The correlation values are an indication of how linearlyrelated two variables are with the lowest and highest possiblevalues being −1.0 and 1.0, respectively. A higher magnitudeindicates a stronger linear relationship between two variables.A positive correlation indicates a simultaneous increase ordecrease in the values of the two variables. A negative cor-relation indicates that as the values of one variable increase,the values for the other variable decreased and vice versa.Correlations are considered significant if there is a smallprobability that the correlation is found due to random error.A “∗” indicates that the probability that the correlation isfound due to random error is less than ten percent. Theexplanation of random error is beyond the scope of thisresearch. Metrics are considered to be highly correlated if themagnitude of the correlation is greater than 0.8.
We perform three validation tasks for the proposed met-rics as follows.
(i) The introduction of new metrics requires a series ofsteps to determine if they are necessary. Therefore itis important to investigate how the proposed metricscorrelate with similar existing CK metrics. Highcorrelations between proposed and existing metricsimply that the proposed metrics may not be required.These correlations are investigated in Section 4.3.
(ii) The proposed metrics must also provide additionalinformation at an acceptable frequency. The fre-quency at which the proposed metrics provide addi-tional information determines their effectiveness.Section 4.4 investigates the effectiveness of the pro-posed metrics. The values of the proposed metricsare compared to the values of the existing metrics todetermine how frequently the proposed metrics areable to provide additional information.
(iii) Once the proposed metrics are shown to provideadditional information, it must be shown that suchinformation is useful in solving problems such asthe reduction of maintenance effort, identificationof defect-prone classes, and reduction of necessarycorrective actions. In order to do this, the valuesobtained from the proposed metrics are correlatedwith project data. The results from this investigationare discussed in Section 4.5.
4.3. Correlating Metrics. The values extracted from the pro-posed metrics are correlated with the values extracted fromthe existing metrics. The purpose of finding these correla-tions is to provide the likelihood that the proposed metricsare providing additional information. A high correlation(< −0.8 or >0.8) between two metrics implies that only oneof the metrics may be necessary in providing informationconcerning the attribute they are measuring. As a result,

8 ISRN Software Engineering
high correlations between proposed and existing metricsneed to be justified in order to consider the proposed metricnecessary. Note that cells (“—”) in Tables 1, 2, and 3 representcases where a correlation could not be found.
4.3.1. Correlating Complexity Metrics. The proposed com-plexity metrics MMC, SDMC, and PNC are correlated withexisting related metricsWMC, NOM, and NLM as presentedin Table 1(a). It shows that high correlations (>0.8) arefound between MMC and WMC in System 2 and System3. However, MMC and NLM are only highly correlated(>0.8) in System 2. The system may have been designed suchthat classes with a large number of methods required suchmethods to bemore complex. No high correlations (>0.8) arefound for SDMC and PNC with the existing metrics.
4.3.2. Correlating Impact Metrics. The proposed impact met-rics, CI and MNI, are correlated with CBO. Table 1(b) showsno high correlations between CI and CBO as well as betweenMNI and CBO.
4.3.3. Correlating Dependence Metrics. The values for MPCand CTM were equal in all three systems provided, as meth-ods belonging to objects created in methods were not used.As a result, only correlations concerning MPC are discussedto avoid redundancy.
Table 1(c) shows that CD was highly correlated (>0.8)with both MPC and CTM. MND was also correlated withboth MPC and CTM. This is not unexpected, as CD differsfrom MPC and CTM mostly from its treatment of instancevariables. CD counts the use of instance variables while MPCand CTM do not. Table 1(c) also shows that CD and MPCare significantly correlated (∗) in all three systems. The twometrics are also highly correlated (>0.8) in all three systemsas CD and MPC only differ in the use of instance variables.CD counts the use of other classes’ instance variables as wellas methods while MPC only counts the use of methods. Thedirect use of instance variables is considered as questionableprogramming practices and therefore does not occur often.This results in the high correlation between the two metrics.Finally, Table 1(c) shows thatMNDandMPC are significantlycorrelated (∗) in all three systems. As the definitions of CDand MND show that they are proportional to each other, ifCD is highly correlated to MPC, it would follow that MND ishighly correlated to MPC.
4.3.4. Correlating Inheritance Metrics. From Table 1(d), ID isnot highly correlated (>0.8) with either DIT or NAC. Thisimplies that there is a substantial difference between the IDand the existing metrics. Multiple inheritance has not beenutilized in the first two systems and therefore the values ofDIT are equal to those of NAC. Correlations for the thirdsystem could not be found, as inheritance has not been usedin the development of the system. Also, Table 1(d) showsthat WDI and NDC are significantly correlated (∗) in System1. That system produces a high correlation (>0.8) betweenthe two metrics. As the number of descendents increase,so will the sum of the descendents’ impacts. Also note that
correlations for the third system could not be found, asinheritance has not been used in the development of thesystem.
4.4. Effectiveness of Proposed Metrics. The effectiveness of ametric is determined by the frequency at which it providesadditional information when compared to other metrics.Theadditional information can be detected when a case is foundwhere an existing metric cannot correctly measure someclass attributes. Therefore, the proposed metric is able toshow that the existing metric leads to incorrect conclusionsabout the attribute. An example is using WMC to measuremethod complexity because more complex classes generallyhave more complex methods. The effectiveness of MMCis determined by the frequency at which it can show thatthe conclusions drawn using WMC are false. Therefore thefrequency of disagreement determines the effectiveness of aproposed metric.
4.4.1. Effectiveness of Proposed Complexity Metrics. Table 2(a)shows the results of investigating the effectiveness of MMC,SDMC, and PNC when compared to the existing metricsWMC, NOM, and NLM.
(i) Effectiveness of MMC compared to WMC, NOM, andNLM—Method Complexity. Table 2(a) shows thatWMC is inaccurate in identifyingwhich of two classeshas higher method complexity in 19.1, 10.5, and 9.1percent of cases in Systems 1, 2, and 3, respectively.It also shows that NOM is inaccurate in identifyingwhich of two classes has highermethod complexity in28.6, 16.2, and 22.7 percent of cases in Systems 1, 2, and3, respectively. Furthermore, Table 2(a) indicates thatNLM is inaccurate in identifying which of two classeshas higher method complexity in 31.2, 16.8, and 36.4percent of cases in Systems 1, 2, and 3, respectively.Although MMC was shown to be correlated withthe existing complexity metrics discussed, the resultsshow that those metrics cannot accurately drawconclusions regarding method complexity. ThereforeMMC is shown to provide additional information.
(ii) Effectiveness of SDMC compared to WMC, NOM, andNLM—MethodDiversity. Table 2(a) shows thatWMCis inaccurate in identifying which of two classes hashighermethod diversity in 29.6, 18.9, and 24.2 percentof cases in Systems 1, 2, and 3, respectively. Also, itis observed that NOM is inaccurate in identifyingwhich of two classes has higher method diversity in38.3, 22.3, and 37.9 percent of cases in Systems 1, 2,and 3, respectively. In addition, NLM is inaccurate inidentifying which of two classes has higher methoddiversity in 40.2, 20.3, and 42.4 percent of cases insystems 1, 2, and 3 respectively. Although SDMC wascorrelated with the existing complexity metrics inmost cases, the results show that thosemetrics cannotaccurately draw conclusions regarding method diver-sity. Therefore SDMC is shown to provide additionalinformation.

ISRN Software Engineering 9
Table 1: Correlations between metrics.
(a) Correlations between complexity metrics
Metric MMC SDMC PNCSystem 1 System 2 System 3 System 1 System 2 System 3 System 1 System 2 System 3
WMC 0.794∗ 0.902∗ 0.873∗ 0.490∗ 0.436∗ 0.647∗ 0.417∗ 0.500∗ 0.620∗
NOM 0.422∗ 0.796∗ 0.615∗ 0.113 0.429∗ 0.315 0.348∗ 0.545∗ 0.448NLM 0.312∗ 0.888∗ 0.326 0.037 0.568∗ 0.129 0.291∗ 0.531∗ 0.232
(b) Correlations between impact metrics
Metric CI MNISystem 1 System 2 System 3 System 1 System 2 System 3
CBO 0.693∗ 0.660∗ 0.481 0.277∗ 0.713∗ 0.245
(c) Correlations between dependence metrics
Metric CD MNDSystem 1 System 2 System 3 System 1 System 2 System 3
CBO 0.346∗ 0.547∗ 0.442 0.257∗ 0.494∗ 0.435MPC 0.992∗ 0.939∗ 0.995∗ 0.797∗ 0.857∗ 0.974∗
CTM 0.992∗ 0.939∗ 0.995∗ 0.797∗ 0.857∗ 0.974∗
(d) Correlations between inheritance metrics
Metric ID WDISystem 1 System 2 System 3 System 1 System 2 System 3
DIT 0.550∗ 0.579∗ — — — —NAC 0.550∗ 0.579∗ — — — —NOC — — — 0.336∗ 0.186 —NDC — — — 0.886∗ 0.186 —
(iii) Effectiveness of PNC compared to WMC, NOM, andNLM—Method Density. It is shown in Table 2(a) thatWMC is inaccurate in identifyingwhich of two classeshas higher method density in 15.5, 18.8, and 23.6percent of cases in Systems 1, 2, and 3, respectively.Table 2(a) also shows that NOM is inaccurate inidentifying which of two classes has higher methoddensity in 27.8, 21.3, and 17.9 percent of cases inSystems 1, 2, and 3, respectively. It indicates thatNLM is inaccurate in identifying which of two classeshas higher method density in 31.0, 16.3, and 27.4percent of cases in Systems 1, 2, and 3 respectively.Although PNC was shown to be correlated with theexisting complexity metrics discussed in all but twocases, the results show that those metrics cannotaccurately draw conclusions regarding complexitydensity.Therefore PNC is shown to provide additionalinformation.
4.4.2. Effectiveness of the Proposed Impact Metrics. InTable 2(b), the effectiveness of CI when compared to CBO isinvestigated. CBO is a measure of the number of classes thatthe given class is coupled to.
The percentages shown in Table 2(b) represent the per-centage of classes in each system where coupling is due tothe sending of messages (measured by CD) as opposed tothe receiving of messages (measured by CI).The CBOmetric
is not able to distinguish between the sending and receivingof messages therefore drawing false conclusions regardinga class impact. CBO was shown to inaccurately determinethat a class has at least some impact and thus CI providesadditional information. Table 2(b) shows that CBO falselyidentified a class as having at least some amount of impactin 36.0 percent of classes in System 1, 20.5 percent of classesin System 2, and 33.3 percent of classes in System 3.
In Table 2(b), MNI is used to complement CI in orderto provide additional information. The definitions of CI andMNI show that MNI is more similar to CI than to CBO.Consequently, MNI is investigated with respect to CI asopposed to CBO. Table 2(b) shows that CI is inaccurate inidentifying which of two classes has higher influence strengthin 14.5 percent of cases in System 1, 10.6 percent of cases inSystem 2, and 30.0 percent of cases in System 3. The resultsshow that CI is not sufficient inmeasuring influence strength.Therefore, MNI is shown to provide additional information.
4.4.3. Effectiveness of Proposed Dependence Metrics.Table 2(c) shows the results from investigating the effective-ness of CD when compared to CBO, MPC, and CTM.CBO measures the number of classes that the given classis coupled to. It also shows CBO can falsely conclude thatthe class has at least some class dependence. Note that forthree investigated systems, MPC and CTM values are equal.This is not necessarily true for all systems as the systems we

10 ISRN Software Engineering
Table 2: Effectiveness of metrics.
(a) Effectiveness of complexity metrics
Metric MMC SDMC PNCSystem 1 System 2 System 3 System 1 System 2 System 3 System 1 System 2 System 3
WMC 19.1 10.5 9.1 29.6 18.9 24.2 15.5 18.8 23.6NOM 28.6 16.2 22.7 38.3 22.3 37.9 27.8 21.3 17.9NLM 31.2 16.8 36.4 40.2 20.3 42.4 31.0 16.3 27.4
(b) Effectiveness of impact metrics
Metric CI MNISystem 1 System 2 System 3 System 1 System 2 System 3
CBO 36.0 20.5 33.3 — — —CI — — — 14.5 10.6 30.0
(c) Effectiveness of dependence metrics
Metric CD MNDSystem 1 System 2 System 3 System 1 System 2 System 3
CBO 14.4 14.7 25.0 — — —MPC 18.4 32.4 8.3 — — —CTM 18.4 32.4 8.3 — — —CD — — — 15.8 11.0 0.0
(d) Effectiveness of inheritance metrics
Metric ID WDISystem 1 System 2 System 3 System 1 System 2 System 3
DIT 5.6 8.8 25.0 — — —NAC 5.6 8.8 25.0 — — —NOC — — — 5.6 11.8 8.3NDC — — — 5.6 11.8 8.3
investigated do not use methods of objects declared withinmethods. We also compare MND with CD. MND is used tocomplement CD in order to provide additional information.
4.4.4. Effectiveness of Proposed InheritanceMetrics. Table 2(d)shows that DIT, NAC, NOC, and NDC falsely identified aclass as having at least some amount of ancestor or descendentdependence in all three systems. In addition, although IDandWDI are shown to be correlated with the related existinginheritance metrics in System 1 and System 2, the resultsshow that those metrics cannot accurately draw conclusionsregarding ancestor or descendent dependence.
4.5. Correlating with Project Data. In order to determineif the additional information is useful, the results fromthe proposed metrics are correlated with the project datadescribed in Section 4.1. This will provide an understandingof the relationships that exist between the class attributesmeasured by the proposed metrics and the following projectoutcomes: the number of revisions (REV), number of defects(DEF), and number of corrective actions (COR).
4.5.1. Correlating Proposed Complexity Metrics with ProjectData. The relationship between complexity and project out-comes is determined by correlating the results of the pro-posed complexity metrics with project data. In System 1,Table 3(a) shows that MMC, SDMC, and PNC are signifi-cantly correlated (∗) to REV,DEF, andCOR.This implies that,in System 1, classes with higher method diversity and com-plexity density are likely to require more revisions, containmore defects, and require more corrective actions. A possibleexplanation for the correlations is that complex methods,classes withmethods that are significantly different from eachother lead to mistakes which cause revisions, defects, andcorrective actions.
In Systems 2 and 3, Table 3(a) shows that MMC, SDMC,and PNC are not significantly correlated (∗) to REV, DEF, orCOR. This implies that, in both systems, there is no relation-ship between complexity metrics and number of revisions,defects found, as well as required corrective actions. Thiscould be due to the size of the systems. Systems that consistof fewer classes are less likely to require revisions than largersystems.

ISRN Software Engineering 11
Table 3: Correlating metrics with project data.
(a) Correlating proposed complexity metrics with project data
Metric MMC SDMC PNCSystem 1 System 2 System 3 System 1 System 2 System 3 System 1 System 2 System 3
REV 0.444∗ 0.218 −0.315 0.190∗ 0.141 −0.369 0.307∗ 0.154 0.085DEF 0.573∗ 0.218 — 0.394∗ 0.141 — 0.230∗ 0.154 —COR 0.515∗ 0.218 — 0.307∗ 0.141 — 0.243∗ 0.154 —
(b) Correlating proposed impact metrics with project data
Metric CI MNISystem 1 System 2 System 3 System 1 System 2 System 3
REV 0.229∗ 0.001 −0.176 0.437∗ 0.097 −0.207DEF 0.174 0.001 — 0.436∗ 0.097 —COR 0.200∗ 0.001 — 0.491∗ 0.097 —
(c) Correlating proposed dependence metrics with project data
Metric CD MNDSystem 1 System 2 System 3 System 1 System 2 System 3
REV 0.624∗ 0.031 −0.038 0.495∗ 0.098 0.070DEF 0.745∗ 0.031 — 0.487∗ 0.098 —COR 0.703∗ 0.031 — 0.477∗ 0.098 —
(d) Correlating proposed inheritance metrics with project data
Metric ID WDISystem 1 System 2 System 3 System 1 System 2 System 3
REV 0.376∗ −0.047 — −0.025 0.032 —DEF 0.249∗ −0.047 — −0.025 0.032 —COR 0.256∗ −0.047 — 0.032 0.032 —
4.5.2. Correlating Proposed Impact Metrics with Project Data.Table 3(b) shows the relationship between impact and projectoutcomes. In System 1, CI and MNI are significantly corre-lated (∗) to REV and COR. This implies that, in System 1,classes with higher impact or influence are likely to requiremore revisions and require more corrective actions. A pos-sible explanation is that classes with high impact undergorevision and corrective action in order to repair the defect inclasses they influence.This would also explain why there is nosignificant correlation between CI and DEF.
In addition, in Systems 2 and 3, CI andMNI are not signif-icantly correlated (∗) to REV, DEF or COR.This implies that,in both systems, there is no relationship between impact andnumber of revisions, defects found, and required correctiveactions. This could also be due to system size.
4.5.3. Correlating Proposed Dependence Metrics with ProjectData. Table 3(c) shows that CD and MND are significantlycorrelated (∗) to REV,DEF, andCOR in System 1.This impliesthat, in System 1, classes with higher dependence and influ-ence strength are likely to require more revisions, containmore defects, and require more corrective actions. A possibleexplanation is that classes that heavily rely on other classes, asindicated by high dependence, are more difficult to compre-hend, leading to mistakes which cause revisions, defects, andcorrective actions. This also supports the conclusion offered
in Section 4.5.2 regarding CI and MNI. If high dependenceclasses are likelier to contain defects, they are likely candidatesfor revisions and corrective actions. Although the classes thatare influencing the high dependence classes may not containdefects, they may require revisions, as well as correctiveactions, to repair the defects in the high dependence classes.This would account for the significant correlation between CIand REV as well as CI and COR. It would also explain whyCI and DEF do not correlate. It is also possible that changesin other classes are introducing errors into high dependenceclasses. Such errorsmay be the cause of revisions, defects, andcorrective actions.
The low correlation in Systems 2 and 3 implies that in bothsystems there is no relationship between dependence andnumber of revisions, defects found, and required correctiveactions.
4.5.4. Correlating Proposed Inheritance Metrics with ProjectData. Table 3(d) shows the dependence metrics of ID andWDI. In System 1, ID is significantly correlated (∗) to REV,DEF, and COR. This implies that, in System 1, classes withhigher dependence are likely to require more revisions,contain more defects, and require more corrective actions. Itis possible that changes in other classes are introducing errorsinto high dependence classes. The errors are then inheritedby subclasses leading to revisions, defects, and corrective

12 ISRN Software Engineering
actions. In System 2, ID is not significantly correlated (∗) toREV, DEF, or COR.This implies that, in System 2, there is norelationship between inherited dependence and number ofrevisions, defects found, or required corrective actions. Thiscould also be due to system size as well as a lack of inheritancein the system. There are no cases of impact or dependencethrough inheritance in System 3.
There was no significant correlation between WDI andREV, DEF, or COR. The lack of significant correlations maybe due to system size and a lack of inheritance in System 2.However, this is not the case for System 1. System 1 consists of125 classes and utilizes inheritance in many of its classes.Thisimplies that there is no relationship between the impact of aclass descendents and project outcomes.
4.6. Discussion. The investigation of the metrics in thissection has two key objectives: to investigate the validity ofthe proposed metrics and to assess the maintainability of thethree systems.
Section 4.3 discussed the correlations between the pro-posed metrics and related existing metrics. Although theproposed metrics are shown to be correlated with the relatedexisting metrics, only a small subset of correlations, with theexception of the dependence metrics, are sufficiently high toraise concerns. High correlations (>0.8) raised concerns asthey serve as indications that two metrics may be providingsimilar information. An explanation is required in caseswhere two metrics are highly correlated to help ensure thatthe proposed metrics are providing additional information.In addition, with regard to the dependence metrics, the highcorrelations are expected as the proposed metric CD mostlydiffers from MPC and CTM just in their treatment of directaccess of other classes’ instance variables. It was thereforenecessary to investigate the frequency in which instancevariables are accessed by other classes.
Section 4.4 revealed that the existing metrics are notsufficient in measuring the attributes that the proposedmetrics are designed to measure. The existing metrics areinaccurate in their assessment of such attributes that it canbe concluded that the proposed metrics do in fact provideadditional information not otherwise available. The resultsfrom Section 4.4 show that the frequency at which CD pro-duces different results fromMPC and CTM is not negligible.This shows that instance variables are in fact accessed byother classes, although such a practice is not advised. Thecorrelation between CD and MPC can be used as a measureto determine the level of encapsulation in the class. A highercorrelation would imply that classes are being encapsulatedproperly with regards to hiding instance variables.
The results from Section 4.5 show that, for larger sys-tems, the attributes measured by the proposed metrics arein fact related to the project outcomes investigated. Theresults supported the notion that, for large systems, methodcomplexity, method diversity, and complexity density arerelated to number of revisions, defects found, and requiredcorrective actions.The results from Section 4.5 also suggestedthat, in large systems, it is important to pay close attentionto the complexity, impact, and dependence of classes as theycan lead to revisions, defects found, and required corrective
actions. The dependence of ancestor classes is shown to berelated to revisions, defects found, and required correctiveactions. One point of interest is that the impact of a classdescendent classes is not shown to be related to the projectoutcomes investigated. However, this does not mean that themetric used to measure this attribute should be discarded.It may be valuable to determine which classes have impactthrough inheritance. Such information may affect decisionsconcerning changes made during maintenance.
Another important note is that the results obtained fromthe values of the proposed metrics can be used to understandvarious attributes of classes present in the system. The valuesobtained from the proposed complexitymetrics will allow theunderstanding of method complexities, method diversities,and complexity densities of the classes in systems.The valuesfrom the proposed impact and dependencemetrics will allowbetter understanding of message passing in systems. Theinheritancemetrics will show how the classes interact beyonddirect message passing and inheritance.
4.7. Limitations. We consider the limitations of proposedmetrics as follows.
(i) The attributes identified and the metrics proposedare specific in its purpose: to determine the difficultyand the effects of change. The metrics are designedto provide very specific information. The values forthe metrics can only be extracted using source codeor very highly detailed design documents. As a result,the attributes may not be available in early phases of asystem’s life cycle.
(ii) The size of the systemmay be important in determin-ing the significance of the proposed metrics [28]. Theresults in Section 4 imply that small systems do notbenefit as readily from themetrics as larger systems. Itseems advantageous to use system size in conjunctionwith the proposed metrics. However, the size of thesystem is often not determinable until implementa-tion therefore restricting the use of metrics to theimplementation phase [29]. The project data is also adetermining factor in the value of the proposed met-rics. A lack in project data may provide poor resultsand little information may be gained from using themetrics. Also, low variances have shown to causea difficulty in finding relationships between metricvalues and project data [30]. More systems should beinvestigated to further validate the proposed metrics.
(iii) The proposed metrics do not consider the use ofclasses that are predefined in the programming lan-guage in their calculation. It is, however, possibleto overwrite such classes and doing so may causeunpredicted changes in the system. It may be worthinvestigating if the use of such classes should beconsidered in the metrics.
5. Conclusion
The objective of this research was to identify the classattributes that convey information regarding the mainte-nance of that class in order to develop a suite of metrics

ISRN Software Engineering 13
that measure such attributes. A suite of metrics has beendeveloped to provide additional information that will assistin the maintenance of object-oriented systems. The metricshave been designed to measure attributes that lead to thedifficulty in maintaining classes as well as attributes thatdescribe potential effects of class changes. The use of theproposed metrics will enable maintainers to better under-stand the complexity of classes as well as the potential effectsof changing classes.
One possible future work is the modification of existingmodeling languages in order to display values associatedwith the proposed metrics and convey information such asinfluence relationships between classes. If such work were tobe completed, it may be more valuable to be able to easilyvisualize the influence of classes as well as their complexities.It is also possible that the metrics be applied to methodsinstead of classes. Further, it is possible that providing infor-mation regarding influence at a method level is as useful,if not more useful, than at a class level. An application ofthe proposed metrics could be the development of predictivemodels. Neural networks and other data mining techniquesmay be used to predict project outcomes by using the valuesobtained from the proposed metrics, such as quality andmaintainability.
References
[1] I. Bluemke, “Object oriented metrics useful in the prediction ofclass testing complexity,” in Proceedings of the 27th EuromicroConference, pp. 130–136, 2001.
[2] V. R. Basili, L. C. Briand, and W. L. Melo, “A validationof object-oriented design metrics as quality indicators,” IEEETransactions on Software Engineering, vol. 22, no. 10, pp. 751–761, 1996.
[3] T. J. McCabe, “Complexity Measure,” IEEE Transactions onSoftware Engineering, vol. 2, no. 4, pp. 308–320, 1976.
[4] S. R. Chidamber and C. F. Kemerer, “Metrics suite for objectoriented design,” IEEE Transactions on Software Engineering,vol. 20, no. 6, pp. 476–493, 1994.
[5] M. Bundschuh and C. Dekkers, “Object-oriented metrics,” inThe IT Measurement Compendium, M. Bundschuh and C.Dekkers, Eds., pp. 241–255, Springer, Berlin, Germany, 2008.
[6] E. J. Weyuker, “Evaluating software complexity measures,” IEEETransactions on Software Engineering, vol. 14, no. 9, pp. 1357–1365, 1988.
[7] I. Vessey and R. Weber, “Research on structured programming:an wmpiricist’s evaluation,” IEEE Transactions on SoftwareEngineering, vol. 10, no. 4, pp. 397–407, 1984.
[8] T.Wand andR.Weber, “Toward a theory of the deep structure ofinformation systems,” inProceedings of International ConferenceInformation System, pp. 61–71, 1990.
[9] V. R. Basili andB. T. Perricone, “Software errors and complexity:an empirical investigatio,” Communications of the ACM, vol. 27,no. 1, pp. 42–52, 1984.
[10] M.H. Tang,M.H. Kao, andM.H. Chen, “An empirical study onobject-oriented metrics,” in Proceedings of the 6th InternationalSoftware Metrics Symposium, pp. 242–249, November 1999.
[11] S. Sarkar, A. C. Kak, and G. M. Rama, “Metrics for measuringthe quality of modularization of large-scale object-oriented
software,” IEEE Transactions on Software Engineering, vol. 34,no. 5, pp. 700–720, 2008.
[12] Y. Zhou, B. Xu, andH. Leung, “On the ability of complexitymet-rics to predict fault-prone classes in object-oriented systems,”Journal of Systems and Software, vol. 83, no. 4, pp. 660–674, 2010.
[13] H.M.Olague, L.H. Etzkorn, S. L.Messimer, andH. S.Delugach,“An empirical validation of object-oriented class complexitymetrics and their ability to predict error-prone classes in highlyiterative, or agile, software: a case study,” Journal of SoftwareMaintenance and Evolution, vol. 20, no. 3, pp. 171–197, 2008.
[14] L. C. Briand and J. W. Daly, “A unified framework for couplingmeasurement in object-oriented systems,” IEEE Transactions onSoftware Engineering, vol. 25, no. 1, pp. 91–121, 1999.
[15] L. C. Briand, J.Wust, J.W.Daly, andD.Victor Porter, “Exploringthe relationships between designmeasures and software qualityin object-oriented systems,” Journal of Systems and Software, vol.51, no. 1, pp. 245–273, 2000.
[16] F. T. Sheldon and H. Chung, “Measuring the complexity of classdiagrams in reverse engineering,” Journal of Software Mainte-nance and Evolution, vol. 18, no. 5, pp. 333–350, 2006.
[17] R. Shatnawi, W. Li, J. Swain, and T. Newman, “Finding softwaremetrics threshold values using ROC curves,” Journal of SoftwareMaintenance and Evolution, vol. 22, no. 1, pp. 1–16, 2010.
[18] W. Li and S. Henry, “Object-oriented metrics that predictmaintainability,” The Journal of Systems and Software, vol. 23,no. 2, pp. 111–122, 1993.
[19] N. I. Churcher and M. J. Shepperd, “‘Comments on’ a metricssuite for object oriented design,” IEEE Transactions on SoftwareEngineering, vol. 21, no. 3, pp. 263–265, 1995.
[20] W. Li, “Another metric suite for object-oriented programming,”Journal of Systems and Software, vol. 44, no. 2, pp. 155–162, 1998.
[21] T. Mayer and T. Hall, “A critical analysis of current OO designmetrics,” Software Quality Journal, vol. 8, no. 2, pp. 97–110, 1999.
[22] S. R.Chidamber,D. P.Darcy, andC. F.Kemerer, “Managerial useofmetrics for object-oriented software: an exploratory analysis,”IEEE Transactions on Software Engineering, vol. 24, no. 8, pp.629–639, 1998.
[23] M. Hitz and B. Montazeri, “Chidamber and kemerer’s metricssuite: a measurement theory perspective,” IEEE Transactions onSoftware Engineering, vol. 22, no. 4, pp. 267–271, 1996.
[24] H. S. Chae, Y. R. Kwon, and D. H. Bae, “A cohesion measure forclasses in object-oriented classes,” Software, vol. 30, no. 12, pp.1405–1431, 2000.
[25] J. A. Dallal, “Improving the applicability of object-oriented classcohesion metrics,”The Journal of Systems and Software, vol. 53,no. 9, pp. 914–928, 2011.
[26] K. A. M. Ferreira, M. A. S. Bigonha, R. S. Bigonha, L. F. O.Mendes, and H. C. Almeida, “Identifying thresholds for object-oriented software metrics,”The Journal of Systems and Software,vol. 85, no. 2, pp. 244–257, 2012.
[27] L. Etzkorn, J. Bansiya, and C. Davis, “Design and code com-plexity metrics for OO classes,” Journal of Object-OrientedProgramming, vol. 12, no. 1, pp. 35–40, 1999.
[28] K. El Emam, S. Benlarbi, N. Goel, and S. N. Rai, “The confound-ing effect of class size on the validity of object-orientedmetrics,”IEEE Transactions on Software Engineering, vol. 27, no. 7, pp.630–650, 2001.
[29] W. M. Evanco, “Comments on ‘The confounding effect ofclass size on the validity of object-oriented metrics’,” IEEETransactions on Software Engineering, vol. 29, no. 7, pp. 670–672,2003.

14 ISRN Software Engineering
[30] G. Succi, W. Pedrycz, S. Djokic, P. Zuliani, and B. Russo, “Anempirical exploration of the distributions of the Chidamberand Kemerer object-oriented metrics suite,” Empirical SoftwareEngineering, vol. 10, no. 1, pp. 81–103, 2005.


