Embed Size (px)
Citation preview
Extracting Coherent Emotion Elicited Segments from Physiological Signals
Chi-Keng Wu Pau-Choo (Julia) Chung Chi-Jen Wang Department of Electrical Engineering Department of Electrical Engineering Department of Nursing National Cheng Kung University National Cheng Kung University National Cheng Kung University Tainan, Taiwan Tainan, Taiwan Tainan, Taiwan [email protected] [email protected] [email protected]
Abstract— The feasibility of real life affective detection using physiological signals is usually limited by biosensor noise and artifact. This is challenging in extracting the representative emotion features. In this paper a quasi-homogeneous segmentation algorithm based on Top-Down homogeneous splitting and Bottom-Up Merging using Bhattacharyya distance is proposed to partition the signal and remove artifacts. Furthermore, since physiological responses may also vary within one emotion elicited period, features extracted from segmented segments can better describe recent physiological patterns. In this paper a constraint-based clustering analysis based on estimating best seed of K-means is developed to discover representative emotion-elicited segments at all cross subject partitions which include labeled and unlabelled feature vectors.
Keywords- affective detection, physiological signals, quasi-homogeneous segmentation, Bhattacharyya distance, constraint-based clustering analysis
I. INTRODUCTION Over the last decade, a growing amount of research has
been conducted into using physiological signals to judge emotions[1][3][4][10][6][14] in human computer interactions, and it has been found that up to eighty precents recognition rates can be achieved with regard to the discrimination of several emotions in single subject [2]. However, a number of problems still need to be resolved. One of these, also addressed by Kim [4], is that most biosensors using electrodes are very susceptible to motion artefacts. Moreover, Zeng’s survey of affect recognition [7] highlighted that ubiquitous computing environments with human-entered designs will require a detection algorithm that is capable of motion tolerance. Thus, for achieving ubiquitous computing it is necessary that the artefacts be removed for physiological based emotion recognition. The artefact belongs to low frequency interference; however, some kind of physiological signals also belongs to low frequency response such as respiration and GSR. Hence, it is hard to recover from the interfered signal to the original one.
To address this problem, this paper proposes Top-Down
homogeneous splitting and Bottom-Up Merging using Bhattacharyya distance to partition the periodic physiological signal sequence into quasi-homogeneous segments. With the segmentation, physiological signals with fluctuation during one emotion can be partitioned into segments. Artefacts,
which usually will be partitioned into small segments, will be removed. For the remaining (larger) segments, the feature extraction can be applied on the quasi-homogeneous period and more representative features can be obtained.
As such, a mining approach can be applied to analyse
emotion content segments from their features. In this paper, we proposed a self-adjusting clustering method to analyse feature vectors of all testing subjects’ physiological partitions. It is assumed that common emotional physiology features exist across individuals when experiencing the same induced emotion [3]. Therefore, this paper firstly estimates candidate seed numbers to K-means which are able to achieve the clustering result that there is one cluster containing at least one segment (feature vector) for all the subjects. For a seed number satisfying this condition, class separability is further applied for test. If this seed number also has good class separability, it will be regarded as one candidate seed number.
Once the candidate seed numbers have been selected, the
labelled data are fed to K-means using candidate seed numbers to discover emotion-elicited segments from all segmented partitions which contained most of labelled data. The others that are not in target cluster regard as artefact or un-representative of emotion segments.
The remaining parts of the paper are organized as follows.
Section II describes the proposed quasi-homogeneous segmentation algorithm. After that, self-adjusting clustering density analysis is presented in Section III. Section Ⅳ describes the experiment results on six emotions. Finally the conclusions are drawn in SectionⅤ.
II. A QUASI-HOMOGENEOUS SEGMENTATION
A. The Cumulative Sum of Absolute Gradient of Amplitude Square (CumGAS)
Initially, the original physiology time series nttn x 1:1 }{ ==χ is
transferred to the diagnostic sequence nttn sS 1:1 }{ == based on
the autocorrelation values with zero delay ( 0=τ ), that is, 2tttt xxxs =×= +τ [5][9]. Let n:1Ψ , where n
ttn 1:1 }{ ==Ψ ψ , be the Cumulative sum of Absolute Gradient of nS :1 (denoted as
CumGAS of n:1χ ) which is the measurement of the amplitude of differentiable diagnostic signal nS :1 . Based on this definition,
tψ is computed as
∑ ∑= =
Δ+
Δ=−=
ti tiiiiit sss
...1 ...1
~||ψ nt ,...,1= . (1)
Assume nS :1′ (the gradient of nS ) is second order stationary with a constant mean value denoted as
nS :1′μ . It was proved by
[6] that entropy defined by ∑∞=
−=...1
:1 log)(i
Ti
TiT PPSH of
},...,1|{:1 TisS iT == is equal to )log( TTψ . In a stationary random process, the entropy can simply be obtained as
)log()(:1:1 TSTSH ′= μ . (2)
Also,
TT SS :1:1 ′′ = μμ in a stationary process and
thus )()( :1:1 TT SHSH = , TT ≠ . Therefore, we can obtain that
)log()log(TT
TT ψψ = . (3)
Obviously, the ratio between tψ and t keeps a constant
value in a stationary signal; that is, the slope of n:1Ψ is invariable. In practice, a change in the value of the entropy corresponds to a change in the statistical properties of a signal. In other words, if the stationary state change at τ in a time series, this also causes the slope changes at τ . Based on this consideration, our problem focuses on change point detection with regard to CumGAS n:1Ψ (i.e. slope change detection).
B. Top-Down Homogeneous Splitting Assume a non-stationary (heterogeneity) time series
tS containing p numbers of stationary change points. Let n:1Ψ forms p+1 segments with different slope values. Also assume that the break points of n:1Ψ are },...,,...,{ 0 pj ϕϕϕ , where
0ϕ is set as the first point of n:1Ψ , as shown in Figure 1.
2ϕ1ϕ0ϕ
Ψ
t
nS :1
t
Figure 1. The left is a triangular wave time series
nS :1, right is its CumSAG
n:1Ψ .
Assume a straight line nttn lL 1:1 }{ == connecting the head
and tail of n:1Ψ , where n is the length in terms of the number of
points of sequence nΨ . This line function nL :1 can be defined as
( )11 ψψψ −×+= nt ntl nt ,...,1= . (4)
A break point jϕ , },...,2,1{ pj ∈ of n:1Ψ can then be obtained as the point having the maximum distance from n:1Ψ to nL :1 . That is, jϕ = t* with
|}{|maxarg*ttt
lt −= ψ nt ,...,1= . (5)
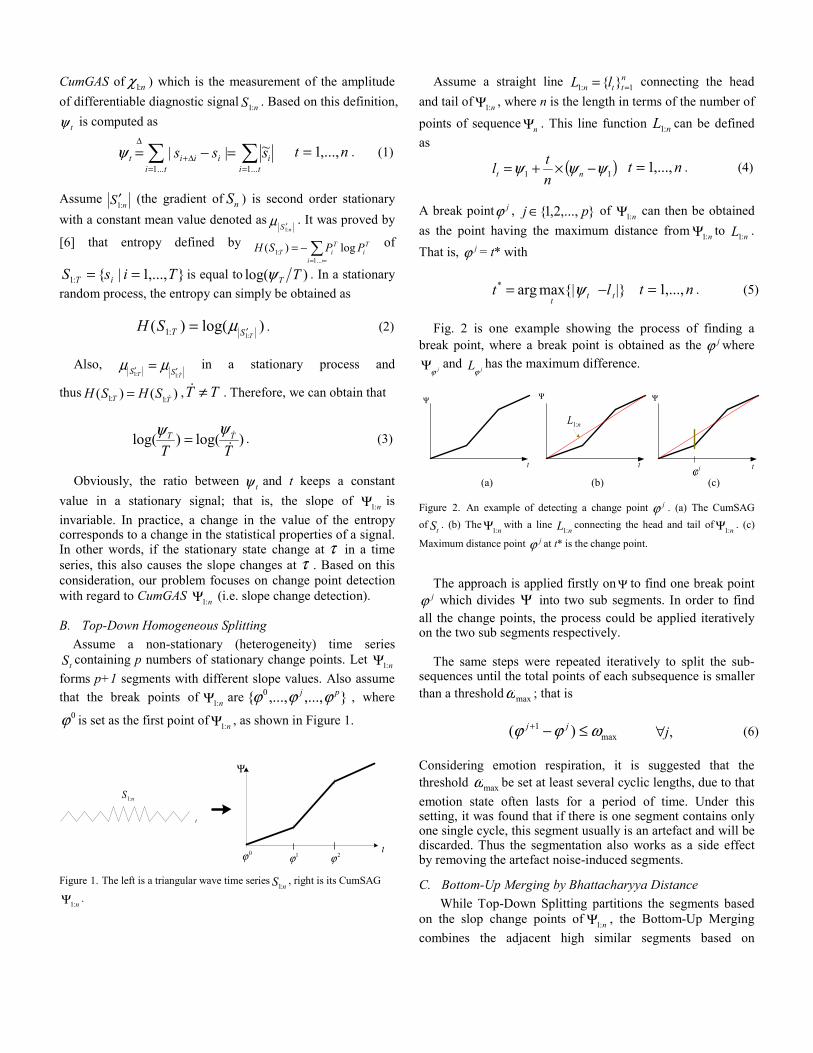
Fig. 2 is one example showing the process of finding a
break point, where a break point is obtained as the jϕ where
jϕΨ and jLϕhas the maximum difference.
Ψ
jϕt
nL :1
Ψ Ψ
t t
Figure 2. An example of detecting a change point jϕ . (a) The CumSAG of tS . (b) The
n:1Ψ with a line nL :1
connecting the head and tail ofn:1Ψ . (c)
Maximum distance point jϕ at t* is the change point.
The approach is applied firstly on Ψ to find one break point jϕ which divides Ψ into two sub segments. In order to find
all the change points, the process could be applied iteratively on the two sub segments respectively.
The same steps were repeated iteratively to split the sub-
sequences until the total points of each subsequence is smaller than a threshold maxω ; that is
max
1 )( ωϕϕ ≤−+ jj ,j∀ (6)
Considering emotion respiration, it is suggested that the threshold maxω be set at least several cyclic lengths, due to that emotion state often lasts for a period of time. Under this setting, it was found that if there is one segment contains only one single cycle, this segment usually is an artefact and will be discarded. Thus the segmentation also works as a side effect by removing the artefact noise-induced segments.
C. Bottom-Up Merging by Bhattacharyya Distance While Top-Down Splitting partitions the segments based
on the slop change points of n:1Ψ , the Bottom-Up Merging combines the adjacent high similar segments based on
(b) (a) (c)
Bhattacharyya distance which measures the distance from probability distributions (histogram). Bhattacharyya distance was reported to be superior in signal selection [11] and in defining a contrast parameter for signal segmentation [11] compared with KullBack-Leibler divergence. The normal form of Bhattacharyya is defined as
∑ ++ = )|~()|~(),( 1:1:11 jnjnjj XSpXSpXXρ (7)
where1... 1
~−+= jjSX j ϕϕ
. Clearly ρ lies between zero and unity. Several distance measurements are derived from Bhattacharyya coefficient. Traditionally, ρln−=B is commonly adopted. However the ob tained B may diverge as ρ is close to 0. In this application, another distance measure [11] is applied: ρ−−= 11B (8) which ranges between 0 and 1. If two measured distributions are very similar, B is close to 1. On the contrary, B is close to 0. Thus in our application, two consecutive segments will be merged if these two segments are similar enough such that the obtained B value is larger than a threshold, which is determined as follows.
For each adjacent-segment pair ),( 1+jj XX ,minω≥jX and
min1 ω≥+jX , where minω is a user-defined constant that
controls over noise-tolerance, their B values JB are computed. Let iniBμ and iniBδ be the mean value and standard
deviation of values of JB where },...,1,0{ pJ ′∈ . Without loss of generality, assume JB satisfies Gaussian distribution and
),( LU ZZ represents two percentile ranks in distribution of the
first estimated JB . The values of ),( LU ZZ was determined based on the highest clustering performance at SectionⅢ. The obtained ),( LU ZZ are then used to decide the merging conditions of Bottom-Up merging iterations on different individuals, as follows:
⎩⎨⎧
×+>×+>
LiniBiniBJ
UiniBiniBJ
ZBmeanZB
δμδμ
)()max( . (9)
If the pair which has the max value of JB satisfies both conditions in (9), the pair is merged. Then JB is updated by adding two new calculated B values computed from the merged segment with two consecutive segments. This process is iterated until either of the conditions of (9) was violated.
III. SELF-ADJUSTED CLUSTERING DENSITY ANALYSIS (SACDA)
Having partitioned the cyclic physiological signals obtained from multiple subjects experienced to the same emotion
elicited period, it was expected that coherence physiological response exist among each subject’s most of quasi-homogeneous segments. Despite human inherent diversity, it can be highly expected that there must be at least one segment for each subject having the same emotion characteristic. Based on this assumption, a self-adjusted cluster-density analysis (SACDA) is applied to select representative elicited segments, called Emotion Elicited Segments (EES), which will be defined later as the target cluster tC . The SACDA is developed based on the concept of cross-reference support. That is, given a group of data with labelled specific emotion, a truly representative cluster extracted from the group of data should reveal consistent feature to another cross-reference group.
Assume that there are two groups of quasi-homogeneous
segments in the same emotion elicited period, one group from the subjects which have triangular-reports labelled with emotion (referred as dataset I) and another group from the subjects which has no triangular-reports provision without no emotion labelling (referred as dataset II). Let NLF be a set containing all the feature vectors corresponding to un-labelled segments (dataset II) and LF be a set containing feature vectors corresponding to labelled segments (dataset I). Furthermore assume that NLF can be further decomposed as
1F ∪ 2F ∪ … nF where each iF is the set containing segments of subject i, and n is the total number of subjects in unlabelled group. Then the SACDA, which is based on K-means clustering, is applied to obtain EES as follows:
i. Initialize K to be N where N is the number of samples. ii. Perform the K-means on NLF and evaluate the clustering
results. If there is a cluster Cm such that ∀ iF , ∃ xj∈ iF , xj is in Cm, then go to step iii. Otherwise, decrease K by 1, and if 1>K , go to step ii; otherwise go to step iv.
iii. Calculate DBI (Davies Bouldin Index [8]) for the
resultant clusters, denoted as kD , and decrease K by 1. If 1≥K go to step ii, otherwise go to step iv.
iv. Let all the k’s with θ≤kD be the “Candidate Seed
Numbers” and numerated by ,..., 21 kk . v. For each ik , apply K-means cluster methods with K = ik
on LNL FFF ∪= to obtain a new cluster ikC which contains at least one unlabelled segment for all the subjects in dataset I while containing the most number of data points in labelled segments. Therefore, this cluster
ikC can be further divided into iii kL
kNL
k CCC ∪= , where NLk
NL FC i ⊂ and LkL FC i ⊂ . Then the target seed number
is defined as
)}({maxarg i
i
kL
k
t Csizek = . (10)
And the corresponding tkC is the target cluster as the best result which contains most coherent elicited segments among multi-subjects within one emotion.
IV. EXPERIMENTAL RESULTS
A. Data Description In our study, 33 voluntary individuals from NCKU Campus (18 males and 15 females) participated to watch movies in emotion eliciting experiments. Six emotion movies were conducted which were Love, Sad, Joy, Surprised, Anger and Fear for data collection, where dataset I consisted of 29 subjects without triangular-reports and the dataset II was made up of the remaining four subjects with triangular-reports which provided ground truth labelling on the data segments for validation. Four biosensors controlled by a commercialized Peripheral Nervous System (PNS) were introduced to measure the subjects’ physiological responses, which were muscle activity (EMG), blood volume pressure (BVP), respiration (Resp), and skin temperature (SKT). The PowerLab 16-channel A/D converter was used for signal recording. All sensor data samples were collected at 400 Hz and were down-sampled to 40 Hz. Owing to the baseline drift in respiration and in order to extract the pulse amplitude component in BVP signal, the 200 and 60 points median filters were used to estimate the baseline fluctuation to generate a baseline-removed signal on respiration and BVP [6]. This was followed by convoluting with a smoothing filter N
ttw 1}{ = ,where )/2cos(*46.054.0 Ntwt π−= . (11)
B. Measures for Physiological Time Series Two types of features are used. One is the statistics-based
features which are f1 : the mean value, f2 : the variance value, f3 : the mean of absolute values of the 1st difference order statistics, f4 : the mean of absolute value of the 2st difference order statistics, f5 : the root mean square value.
The other is physical-motivation features which include: f6: the zero-crossing rate. f7: the average pulse-to-pulse interval of BVP, which can
be used to estimate the heart rate. f8: the amplitude of periodic signal, which was estimated
by the distance from peak to valley in a periodic interval and was applied to Respiration and BVP.
f9: slop of a partition, which evaluates the slop of the line which connects head point to tail point of a partition in aperiodic signal (for SKT only).
f10: direction of a partition, which is set to 1 as the trend rising and -1 otherwise.
Consider that physiological responses vary significantly
across individuals which cause inter-individual affective analysis difficult. Each feature vector of a segment is standardized by subtracting the middle distance value ( cυ ) of feature vectors obtained during a rest period (i.e., a pause for relaxation before the presentation of external emotion movie stimuli), which is formulated as:
)])()[((minarg 2/1
,1∑
≠=
−−=o
ijjji
Tjic
i
υυυυυυ
(12)
where },...,{ 1 ουυ are feature vectors retrieved fromo segments from this rest period. The resulting standardized feature vectors were then transferred to z-score values by calculating their mean value and variance. Note that different physiological signals have different features used for experiments, as shown in TableⅠ.
TABLE I. THE EXTRACTED FEATURES FOR THE FOUR BIOSENSORS BASED ON STATISTICAL AND PHYSICAL MEASUREMENTS
Respiration EMG BVP SKT Statistical
based f1, f2, f3, f4, f5 f1, f2, f3, f5 f1, f2, f3 f1, f5
Physical motivation f6, f8 f6 f7, f8 f9, f10
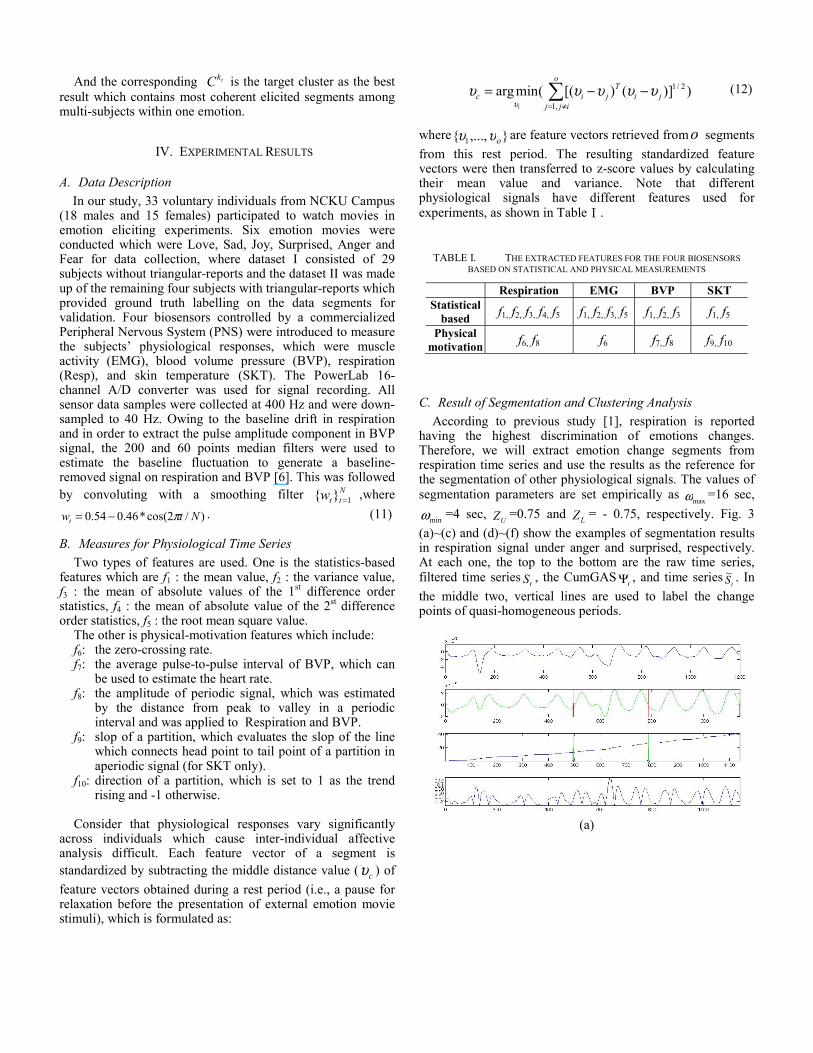
C. Result of Segmentation and Clustering Analysis According to previous study [1], respiration is reported having the highest discrimination of emotions changes. Therefore, we will extract emotion change segments from respiration time series and use the results as the reference for the segmentation of other physiological signals. The values of segmentation parameters are set empirically as
maxω =16 sec,
minω =4 sec, UZ =0.75 and LZ = - 0.75, respectively. Fig. 3
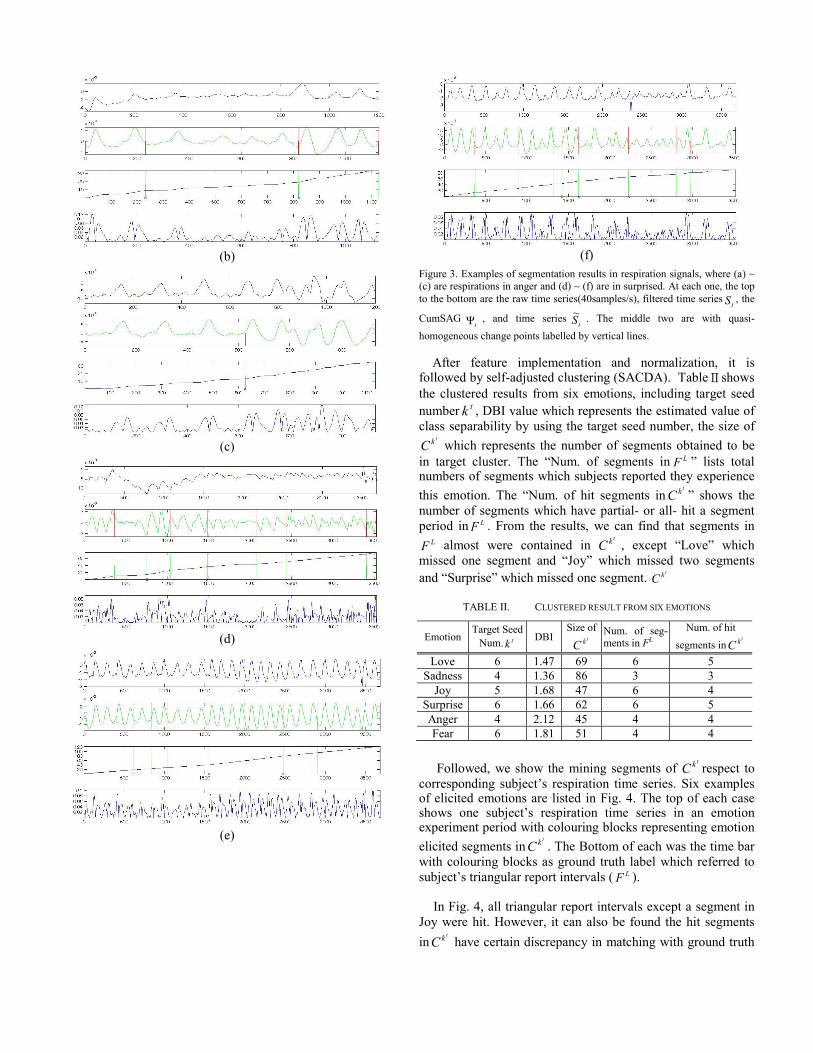
(a)~(c) and (d)~(f) show the examples of segmentation results in respiration signal under anger and surprised, respectively. At each one, the top to the bottom are the raw time series, filtered time series
tS , the CumGAStΨ , and time series
tS~ . In the middle two, vertical lines are used to label the change points of quasi-homogeneous periods.
(a)
(b)
(c)
(d)
(e)
(f)
Figure 3. Examples of segmentation results in respiration signals, where (a) ~ (c) are respirations in anger and (d) ~ (f) are in surprised. At each one, the top to the bottom are the raw time series(40samples/s), filtered time series
tS , the
CumSAGtΨ , and time series
tS~ . The middle two are with quasi-
homogeneous change points labelled by vertical lines.
After feature implementation and normalization, it is followed by self-adjusted clustering (SACDA). TableⅡshows the clustered results from six emotions, including target seed number tk , DBI value which represents the estimated value of class separability by using the target seed number, the size of
tkC which represents the number of segments obtained to be in target cluster. The “Num. of segments in LF ” lists total numbers of segments which subjects reported they experience this emotion. The “Num. of hit segments in
tkC ” shows the number of segments which have partial- or all- hit a segment period in LF . From the results, we can find that segments in
LF almost were contained in tkC , except “Love” which
missed one segment and “Joy” which missed two segments and “Surprise” which missed one segment. tkC
TABLE II. CLUSTERED RESULT FROM SIX EMOTIONS
Emotion Target Seed
Num. tk DBI Size of
tkC Num. of seg-ments in FL
Num. of hit
segments intkC
Love 6 1.47 69 6 5 Sadness 4 1.36 86 3 3
Joy 5 1.68 47 6 4 Surprise 6 1.66 62 6 5 Anger 4 2.12 45 4 4 Fear 6 1.81 51 4 4 Followed, we show the mining segments of
tkC respect to corresponding subject’s respiration time series. Six examples of elicited emotions are listed in Fig. 4. The top of each case shows one subject’s respiration time series in an emotion experiment period with colouring blocks representing emotion elicited segments in
tkC . The Bottom of each was the time bar with colouring blocks as ground truth label which referred to subject’s triangular report intervals ( LF ).
In Fig. 4, all triangular report intervals except a segment in
Joy were hit. However, it can also be found the hit segments in
tkC have certain discrepancy in matching with ground truth
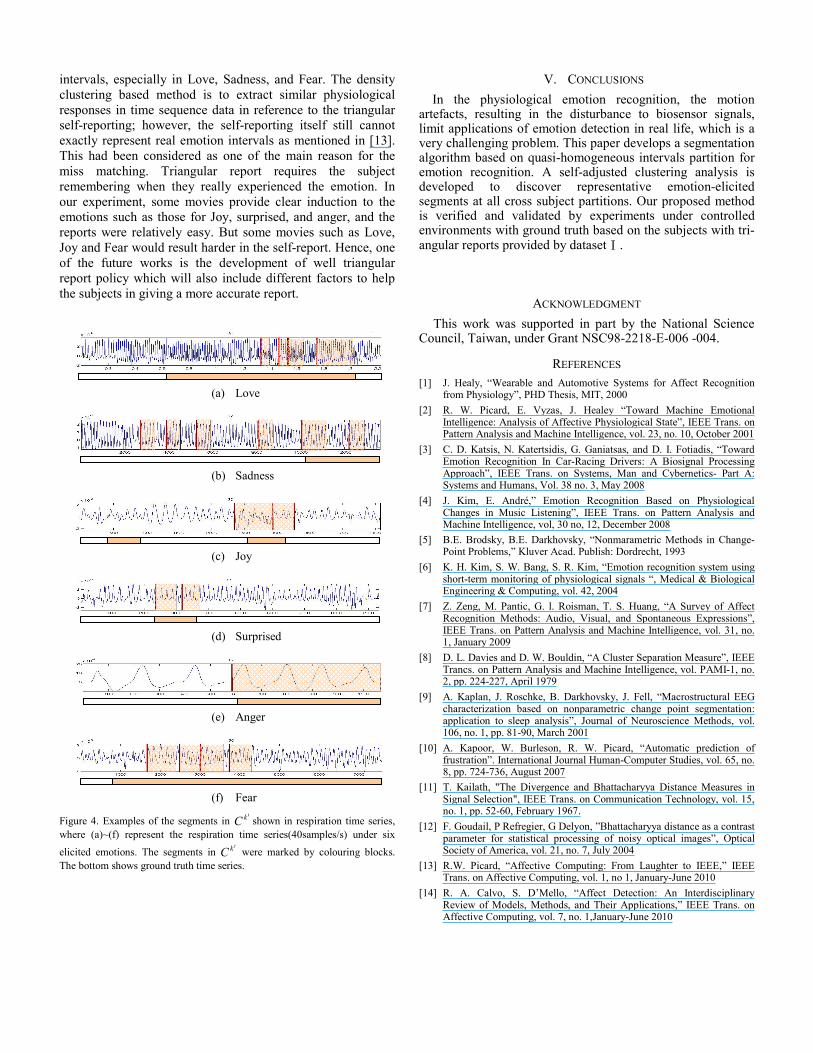
intervals, especially in Love, Sadness, and Fear. The density clustering based method is to extract similar physiological responses in time sequence data in reference to the triangular self-reporting; however, the self-reporting itself still cannot exactly represent real emotion intervals as mentioned in [13]. This had been considered as one of the main reason for the miss matching. Triangular report requires the subject remembering when they really experienced the emotion. In our experiment, some movies provide clear induction to the emotions such as those for Joy, surprised, and anger, and the reports were relatively easy. But some movies such as Love, Joy and Fear would result harder in the self-report. Hence, one of the future works is the development of well triangular report policy which will also include different factors to help the subjects in giving a more accurate report.
(a) Love
(b) Sadness
(c) Joy
(d) Surprised
(e) Anger
(f) Fear
Figure 4. Examples of the segments in tkC shown in respiration time series,
where (a)~(f) represent the respiration time series(40samples/s) under six
elicited emotions. The segments in tkC were marked by colouring blocks.
The bottom shows ground truth time series.
V. CONCLUSIONS In the physiological emotion recognition, the motion artefacts, resulting in the disturbance to biosensor signals, limit applications of emotion detection in real life, which is a very challenging problem. This paper develops a segmentation algorithm based on quasi-homogeneous intervals partition for emotion recognition. A self-adjusted clustering analysis is developed to discover representative emotion-elicited segments at all cross subject partitions. Our proposed method is verified and validated by experiments under controlled environments with ground truth based on the subjects with tri-angular reports provided by datasetⅠ.
ACKNOWLEDGMENT This work was supported in part by the National Science
Council, Taiwan, under Grant NSC98-2218-E-006 -004.
REFERENCES [1] J. Healy, “Wearable and Automotive Systems for Affect Recognition
from Physiology”, PHD Thesis, MIT, 2000 [2] R. W. Picard, E. Vyzas, J. Healey “Toward Machine Emotional
Intelligence: Analysis of Affective Physiological State”, IEEE Trans. on Pattern Analysis and Machine Intelligence, vol. 23, no. 10, October 2001
[3] C. D. Katsis, N. Katertsidis, G. Ganiatsas, and D. I. Fotiadis, “Toward Emotion Recognition In Car-Racing Drivers: A Biosignal Processing Approach”, IEEE Trans. on Systems, Man and Cybernetics- Part A: Systems and Humans, Vol. 38 no. 3, May 2008
[4] J. Kim, E. André,” Emotion Recognition Based on Physiological Changes in Music Listening”, IEEE Trans. on Pattern Analysis and Machine Intelligence, vol, 30 no, 12, December 2008
[5] B.E. Brodsky, B.E. Darkhovsky, “Nonmarametric Methods in Change-Point Problems,” Kluver Acad. Publish: Dordrecht, 1993
[6] K. H. Kim, S. W. Bang, S. R. Kim, “Emotion recognition system using short-term monitoring of physiological signals “, Medical & Biological Engineering & Computing, vol. 42, 2004
[7] Z. Zeng, M. Pantic, G. l. Roisman, T. S. Huang, “A Survey of Affect Recognition Methods: Audio, Visual, and Spontaneous Expressions”, IEEE Trans. on Pattern Analysis and Machine Intelligence, vol. 31, no. 1, January 2009
[8] D. L. Davies and D. W. Bouldin, “A Cluster Separation Measure”, IEEE Trancs. on Pattern Analysis and Machine Intelligence, vol. PAMI-1, no. 2, pp. 224-227, April 1979
[9] A. Kaplan, J. Roschke, B. Darkhovsky, J. Fell, “Macrostructural EEG characterization based on nonparametric change point segmentation: application to sleep analysis”, Journal of Neuroscience Methods, vol. 106, no. 1, pp. 81-90, March 2001
[10] A. Kapoor, W. Burleson, R. W. Picard, “Automatic prediction of frustration”. International Journal Human-Computer Studies, vol. 65, no. 8, pp. 724-736, August 2007
[11] T. Kailath, "The Divergence and Bhattacharyya Distance Measures in Signal Selection", IEEE Trans. on Communication Technology, vol. 15, no. 1, pp. 52-60, February 1967.
[12] F. Goudail, P Refregier, G Delyon, ”Bhattacharyya distance as a contrast parameter for statistical processing of noisy optical images”, Optical Society of America, vol. 21, no. 7, July 2004
[13] R.W. Picard, “Affective Computing: From Laughter to IEEE,” IEEE Trans. on Affective Computing, vol. 1, no 1, January-June 2010
[14] R. A. Calvo, S. D’Mello, “Affect Detection: An Interdisciplinary Review of Models, Methods, and Their Applications,” IEEE Trans. on Affective Computing, vol. 7, no. 1,January-June 2010


