Embed Size (px)
Citation preview

Fact Book 2014


2014 Fact Book III
Contents
Shanghai Securities Market.......................................................1
Historical Review .........................................................................................................................................1
Securities Products ......................................................................................................................................1
2013 Market Review....................................................................5
Overview ....................................................................................................................................................5
Securities Issuance and Listing ......................................................................................................................5
Major Events in the Securities Market 2013 ....................................................................................................6
Market Highlights .........................................................................................................................................8
Stock Market ..............................................................................13
Trading System ..........................................................................................................................................13
Trading Relations .......................................................................................................................................13
Margin Trading and Short Selling Business ......................................................................................................14
Table 1:Categories of Centralized Trading Business ..........................................................................................15
Table 2: Categories of Trading-related Services ...............................................................................................17
Table of Fees Charged and Taxes Withheld by SSE ..........................................................................................19
2013 Monthly Trading Volume, Trading Value and P/E Ratio ..............................................................................24
Top 20 Most Traded Stocks by Trading Volume ...............................................................................................25
Top 20 Most Traded Stocks by Trading Value ..................................................................................................26
Top 20 Gainers ..........................................................................................................................................27
Top 20 Losers ...........................................................................................................................................28
2013 Top 10 in Margin Trading ....................................................................................................................29
2013 Top 10 in Short Selling ......................................................................................................................29
Base Day, Base Period Index and Launch Date ...............................................................................................30
Number of Constituents in SSE Indices ..........................................................................................................34
Market Cap and Weight of Constituent Stocks in SSE 50 Index..........................................................................35
Market Cap and Weight of Constituent Stocks in SSE 180 Index........................................................................37
Market Cap and Weight of Constituent Stocks in SSE 380 Index........................................................................43
Trends of SSE Indices, SSE 180 Index and SSE 380 Index ...............................................................................55
Listed Companies .....................................................................65
Issuance Conditions for IPOs .......................................................................................................................65
Listing Conditions for IPOs ...........................................................................................................................69
SSE Guide to Securities Listing Procedures ....................................................................................................69
Documents to be Submitted When Applying for an IPO and Listing ....................................................................73
2014 Fact Book IV
Conditions for listed companies to issue securities to the public .........................................................................74
Share Placements of Listed Company ...........................................................................................................77
Additional Issuance by Listed Companies ......................................................................................................77
Risk Warnings ............................................................................................................................................78
If any of the following circumstances apply to a listed company, a delisting risk warning shall be implemented for trading
in the shares of the company: .......................................................................................................................79
Suspension and Termination of Listing ............................................................................................................80
If any of the following circumstances apply to a listed company, SSE shall terminate the listing of the company: .......81
Listing Agreements .....................................................................................................................................83
Listing Conditions for Convertible Corporate Bonds .........................................................................................83
Appendix: Listing Agreement of Securities ......................................................................................................83
Sector Distribution and Number of Companies ................................................................................................86
Geographical Distribution of Listed Companies ................................................................................................87
Newly Listed Stocks in 2013........................................................................................................................88
Rights Issues by Listed Companies in 2013 ...................................................................................................89
Equity Structure of Listed Companies (2013 year-end) .....................................................................................90
Top 50 Listed Companies by Market Capitalization (2013 year-end) ..................................................................91
Top 50 Listed Companies by Tradable Market Capitalization (2013 year-end) ......................................................93
Dividend Distribution by Listed Companies in 2013 .........................................................................................95
Table of Changes in Stock Short Names in 2013 ...........................................................................................120
Companies Subject to Delisting Risk Warnings in 2013 ...................................................................................121
Companies Subject to other risk warning in 2013...........................................................................................122
Companies Subject to Listing Termination in 2013..........................................................................................122
Companies Subject to Listing Termination in 2013..........................................................................................122
Companies Subject to Listing Resumption in 2013 .........................................................................................122
Companies Subject to Cancellation of Risk Warning in 2013 ............................................................................123
I Companies Subject to Withdrawal of Delisting Risk Warnings ..........................................................................123
II Companies Subject to Cancellation of Other Risk Warning .............................................................................123
Bond Market ..............................................................................127
Bond Market Overview of the Shanghai Stock Exchange in 2013 .....................................................................127
Conditions for Government Bond Listings ......................................................................................................129
Conditions for Enterprise Bond Listings .........................................................................................................129
Conditions for Corporate Bond Listings .........................................................................................................129
Applications for Corporate Bond Listings .......................................................................................................129
Approval for Corporate Bond Listings ............................................................................................................130
Conditions for SSE Bond Filing and Listings ...................................................................................................131
Profile of Government Bonds in 2013...........................................................................................................133
Summary of Corporate Bonds in 2013(Including Convertible Bond) ..................................................................145
Monthly Bond Repo Turnover in 2013 ..........................................................................................................215
Turnover of Government Bond in Each Month of 2013 ....................................................................................215
Turnover of Bond in Each Month of 2013 .....................................................................................................216

2014 Fact Book V
List of Convertible Corporate Bonds (CCB) Openly Issued by Listed Companies in 2013 ......................................217
Funds ........................................................................................221
Overview of the Fund Market in 2013...........................................................................................................221
Breakthroughs in Market Innovation ..............................................................................................................221
Record Highs in Market Size and Trading Volume ...........................................................................................222
Operation Mechanisms’ Optimization and Market Risks’ Prevention ...................................................................223
More Efforts on Market Promotion and Fund Investment Knowledge Dissemination .............................................223
Summary of Funds in 2013 ........................................................................................................................225
Members and Non-member Institutions ................................. 229
Overview of Members ................................................................................................................................229
Overview of Non-member Institutions ............................................................................................................229
Member's Required Qualifications ................................................................................................................229
The Administration of Member Seats and Trading Units ....................................................................................229
Overview of the Operation ...........................................................................................................................230
Geographical Distribution of SSE Members and Their Business Branches in 2013 ...............................................231
Membership (1990-2013) .........................................................................................................................232
Top 50 Members by Turnover in 2013 .........................................................................................................233
Top 50 Members by Registered Capital in 2013 ............................................................................................235
Top Lead Underwriters of IPOs in 2013 (by Number of Deals Underwritten) ........................................................237
Top Lead Underwriters of Rights Issues in 2013 (by Value of Fund Raised) .........................................................237
Top 20 in Turnover Value of Margin Trading and Short Selling 2013 .................................................................238
Top 20 in Amount Outstanding of Margin Trading and Short Selling 2013 ..........................................................239
Number of Trading Accounts with SSE 1991-2013 ........................................................................................240
Segmentation of B-share Investors by Jurisdiction ..........................................................................................241
Historical Statistics ..................................................................245
Earlier Share Turnover Value, 1991-2013 .....................................................................................................245
Historical Highs in Stock Turnover Value ........................................................................................................246
Daily All-time Highs in Turnover Value ............................................................................................................246
Monthly All-time Highs in Turnover Value ........................................................................................................246
Quarterly All-time Highs in Turnover Value ......................................................................................................247
Listed Shares on SSE, 1990-2013 .............................................................................................................248
Top 10 Increases and Decreases in SSE Index Series .....................................................................................249
Top 10 Increases in SSE 50 Index (in percentage) ..........................................................................................249
Top 10 Decreases in SSE 50 Index (in percentage) ........................................................................................249
Top 10 Increases in SSE 50 Index (in point) ..................................................................................................250
Top 10 Decreases in SSE 50 Index (in point) .................................................................................................250
Top 10 Increases in SSE 180 Index (in percentage) ........................................................................................251

2014 Fact Book VI
Top 10 Decreases in SSE 180 Index (in percentage) ......................................................................................251
Top 10 Increases in SSE 180 Index (in point) ................................................................................................252
Top 10 Decreases in SSE 180 Index (in point) ...............................................................................................252
Top 10 Increases in SSE Composite Index (in percentage) ...............................................................................253
Top 10 Decreases in SSE Composite Index (in percentage) .............................................................................253
Top 10 Increases in SSE Composite Index (in point) ........................................................................................254
Top 10 Decreases in SSE Composite Index (in point) ......................................................................................254
World Securities Markets .........................................................255
Statistics of Stock Exchanges Around the World (by the end of December 2013) ................................................255
Major Publications ....................................................................256
Registered Trademarks of Shanghai Stock Exchange ......... 257
Shanghai Securities Market
2013 Fact Book 1
Shanghai Securities Market
Historical Review
Shanghai was the first city in China to see stocks, stock trading and stock exchanges. Stock trading started in Shanghai
as early as 1860s. In 1891, the Shanghai Sharebrokers Association was established, which was regarded as the
primitive form of stock bourses in China. Later in 1920 and 1921, the Shanghai Security Goods Exchange and the
Shanghai Chinese Security Exchange commenced operations respectively. By the 1930s, Shanghai had emerged as the
financial center of the Far East, where both Chinese and foreign investors could trade stocks, debentures, government
bonds and futures. In 1946, Shanghai Securities Exchange Co., Ltd. was created on the basis of Chinese Security
Exchange, but ceased operations three years later in 1949.
Since 1980, China’s securities market has evolved in tandem with the country’s introduction of reform and opening up
policy and the development of socialist market economy. In 1981, trading in treasury bonds was resumed. In 1984,
stocks and enterprise bonds emerged in Shanghai and a few other cities. On November 26, 1990, Shanghai Stock
Exchange (SSE) came into existence, and on December 19 of the same year, it started formal operations.
After 23 years’ rapid development, SSE has entered into a new stage with rapidly enlarging market scale, more
enhanced fundamental facilities and continuous improved regulation level. After decades of development, SSE has
significantly enhanced its technological advantages. It has put into operation the world's most advanced new generation
trading system (NGTS), built the global largest stock exchange database, launched a powerful and robust new generation
website and established a first-class computer room. In addition, SSE has built a nation-wide securities-specific satellite
communication network with complete functions and the largest user base in China. SSE has established a robust and
real-time market monitoring system appropriate for market operations. It has put in place a self-regulatory framework
that focuses on supervision of listed companies, SSE members and the securities market.
Securities Products
Securities listed on SSE fall into three categories: stocks, bonds and funds.
Stocks are further divided into A Shares and B Shares, with A Shares limited to domestic investors as well as QFIIs
only while B Shares available to both domestic and foreign investors. In 1990, the first batch of 8 A Shares was listed.
In 1992, the first B Share was listed. With the listing of a large number of large, leading and high-quality enterprises,
SSE has begun playing its role as a barometer of the national economy. Bonds traded on SSE include treasury bonds
(T-bonds), local government bonds, enterprise bonds, corporate bonds, corporate bonds with detachable warrants,
convertible corporate bonds and private placed SME bonds. In addition, securities investment funds (including Exchange
Traded Fund -ETF) and warrants are available for trading on SSE. By Dec 31, 2013, there were 2,786 listed securities
in SSE.


Shanghai Securities Market
2013 Fact Book 3
2013
Market Review


2013 Market Review
2014 Fact Book 5
2013 Market Review
Overview
In 2013, the total turnover on SSE was RMB 86,509.83 billion, up 58.0% year-on-year. Stock transactions were RMB
23,026.60 billion, representing 26.62% of the total turnover. Bond transactions hit RMB 62,583.94 billion, accounting
for 72.34% of the total turnover. Fund transactions reached RMB 898.95 billion, making up 0.01% of the total. The
average daily stock transactions were RMB 96.75 billion, down 42.88% year-on-year; daily bond transactions stood at
RMB 262.96 billion, 68.24% higher than a year earlier; daily fund transactions hit RMB 3.78 billion, up 189.43% from
the previous year.
SSE 50 Index opened the year at 1,885.96 points and fell 15.23% to close the year at 1,574.78 points after touching
a yearly high of 2,088.45 points and a yearly low of 1,422.98 points. SSE 180 Index opened the year at 5,620.77
points and fell 9.19% to close the year at 5,040.27 points after touching a yearly high of 6,147.77 points and a yearly
low of 4,398.96 points. SSE Composite Index opened the year at 2,289.51 points and fell 6.75% to finish the year at
2,115.98 points after making a yearly high of 2,444.80 points and a yearly low of 1,849.65 points.
By the end of 2013, SSE recorded a total of 114.44 million trading accounts.
Securities Issuance and Listing
As at the end of 2013, there were 953 listed companies on SSE, with 1 new listings in 2013. By the end of the year,
there were 997 listed stocks on SSE with a total market capitalization of RMB 15,116.53 billion, decreasing by 4.75%
year-on-year, and free-float market capitalization of RMB 13,652.64 billion, up 1.66% from the previous year. The
year-end total share capital of all the listed companies reached 2,575.17 billion shares, of which 2,373.11 billion
shares or 92.15% were tradable.
In 2013, there was only 1 listed company on SSE. The total market value, capital raised and turnover of equity market
rank No.7, No.5 and No.6 in the world respectively.

2013 Market Review
2014 Fact Book 6
Major Events in the Securities Market 2013
Month Date Event
January 1SSE Risk Alert Board was opened to implement delisting supporting system. The 46 “Shares with Risk Alert" issued by 43 companies were traded on the Risk Alert Board.
January 7 SSE released “Guidelines for Cash Dividend Distribution of SSE-listed Companies”.
January 17 Hanzheng, Shanghai's Party chief, visited SSE.
January Shanghai Financial Administration Service Co. Ltd (SSE) started its operation.
February SSE took a stake in Liaoning Equity Exchange.
February 28SSE secured the approval from the Securities and Futures Commission (SFC) of Hong Kong to set up an office in Hong Kong.
February 28The pilot securities refinancing started smoothly, with 11 members and 90 underlying securities involved in the first batch.
March 25Turn-around trades of ETF started to be effected on the day of trading and ETF was included in the pilot collateralized repo business. Guotai SSE 5-year T-bond ETF, the first domestic ETF was launched and listed on SSE.
March 26 SSE released the “SSE Provisional Measures on Investor Suitability Management”.
March 28“Business Measures on Trading, Registration and Settlement of Collateralized Repo” was released jointly by SSE and CSDC, and the quotation-based repo business was included in the regular business of security companies.
April 9 SSE held the inaugural meeting and the first meeting of its Board of Supervisors.
May 24“Business Measures (trial) on Trading, Registration and Settlement of Collateralized Repo of Shares” was released jointly by SSE and CSDC. The collateralized repo of shares was launched officially.
June 20SSE released "SSE Measures for Implementation of Disciplinary Sanctions and Regulatory Measures”.
July 1SSE implemented its Direct Channel Mechanism, through which SSE carries out the aftermath regulation for the announcements without prerequisite form examinations and realizes the electronization for the information disclosure by listed companies simultaneously.
July 1 SSE initiated the all-day testing environment.
July 3The State Council executive meeting approved the “Overall Program of China (Shanghai) Pilot Free Trade Zone”.
July 5 SSE set up the first Advisory Committee for its Board of Governors.
July 19People’s Bank of China decided to remove the control of financial institutions' lending rates since 20 July.
August 9 The first “China - South African Capital Markets Forum” was successfully held.
August 12 SSE signed Memorandum of Understanding with Nairobi Stock Exchange.
August 16SSE cooperated with CSRC to take real-time monitoring and emergency measures for the Everbright Securities’ “Fat Finger” error.
August 19SSE released the “Notice of Providing Services for the Transfer of Shares of Asset Management Plans”. On 5 September, the first batch of 7 institutions listed 18 products on SSE and the transferred shares listed were around 5.4 billion in total.

2013 Market Review
2014 Fact Book 7
Month Date Event
September 4 Xiao Gang, the Chairman of CSRC, visited SSE for the first time after being in office.
September 16 The scope of underlying stocks for margin trading and short selling on SSE extended to 400.
September 27“The Measures for SSE and CSDC on the When-issued Trading, Registration and Clearing of Treasury Bonds (Pilot Program)” was implemented, with the first trial when-issued trading of treasury bonds cleared and delivered successfully in October.
November 28The fourth SSE Legal Forum was held successfully in Peking University, in which Xiao Gang, the Chairman of CSRC, gave a speech named “The Legal Principles and Logic of Securities Laws”.
November 28 SSE set up its first Listed Companies’ Information Disclosure Consultation Committee.
December 13 CSRC begun to solicit social opinions for the “Preferred Stock Pilot Administrative Measures”.
December 24SSE released "Announcement on Financial Bonds Issued by the National Development Bank". On December 27, CDB bonds, the first policy-based financial bonds, were issued in SSE for trial successfully.
December 26The mock trading system of single stock options was officially launched and put into operation by SSE.
December 27The “Opinions on Further Strengthening the Protection of Small and Medium-sized Investors’ Legitimate Rights and Interests in Capital Market” was released by the General Office of the State Council.
December 31Niuwei Shares published the Letter of Intention, marking its restart of IPO on SSE after more than 1 year.

2013 Market Review
2014 Fact Book 8
Market Highlights
2013 2012 2011
Listed Securities (as at year end)
No. of listed companies 953 954 931
No. of listed securities 2786 2098 1691
No. of listed stocks 997 998 975
No. of new listings 1 26 39
Share capital issued (100 million shares) 25751.69 24617.62 23466.65
Tradable shares (100 million shares) 23731.13 19521.34 17993.80
Total market capitalization (RMB100 million) 151165.27 158698.44 148376.22
Market capitalization of tradable shares (RMB100 million) 136526.38 134294.45 122851.36
Total capital raised (RMB100 million)
A Shares (RMB) 2515.72 2890.31 3199.69
B Shares (US dollar) 0 0 0
Transactions
Number of trading days 238 243 244
Annual turnover value (RMB100 million) 865098.34 547535.23 454651.56
Stock 230266.03 164545.01 237560.45
Fund 8989.48 3171.36 2901.41
T-bonds 625839.41 379818.85 210714.87
Warrants 0 0 3474.82
Others 3.42 0 0
Average daily turnover value (RMB100 million) 3634.87 2253.23 1863.33
Average daily stock turnover value (RMB100 million) 967.50 677.14 973.61
Annual stock turnover volume (100 million shares) 26718.85 18948.94 21193.87
Average daily stock turnover volume (100 million shares) 112.26 77.98 86.86
Total number of stock trades (10,000 deals) 115321.33 92554.96 127327.64
Average number of daily stock trades (10,000 deals) 484.54 380.89 521.84

2013 Market Review
2014 Fact Book 9
Stock Indices
SSE 180 Index yearly high 6147.77 5808.99 7149.05
SSE 180 Index yearly low 4398.96 4596.73 4852.71
SSE 180 Index year-end close 5040.27 5550.09 5009.29
SSE Composite Index yearly high 2444.80 2478.38 3067.46
SSE Composite Index yearly low 1849.65 1949.46 2134.02
SSE Composite Index year-end close 2115.98 2269.13 2199.42
Ratios
Average P/E ratio 10.99 12.30 13.40
Turnover rate 1 (market capitalization)% 105.56 78.57 93.72
Turnover rate 2 (tradable market capitalization)% 123.60 101.60 124.80


Stock Market


Stock Market
2014 Fact Book 13
Stock Market
Trading System
Trading business can be divided into two categories according to the business handling medium: trading system-
based business and non-trading system-based business; of these types of business, trading system-based business
can be further divided into two business types according to the business model employed: centralized trading business
and trading-related services; non-trading system-based business includes negotiated transfers, warrant creation and
cancellation, etc.
Centralized trading refers to stock exchange facilitated business in which securities ownership changes are realized
through a trading system by means of price inquiry, quotations, auction; trading-related services refers to offering, entitlement,
trading relations and other related forms of business provided by stock exchanges through a trading system that are closely
related to centralized securities trading business. Compared with similar services offered through over-the-counter market, the
above trading system-based business has the following major differences: (1) services are provided through the trading system;
(2) special securities codes are assigned; and (3) trading is conducted through a broker.
Trading Relations
SSE is open for trading from Monday to Friday. The morning market session starts with an call auction from 9:15 to
9:25, which is followed by a continuous auction from 9:30 to 11:30. In the afternoon market session, continuous
auction runs from 13:00 to 15:00. Intent orders for block trades are accepted between 9:30 and 11:30 and again
between 13:00 and 15:30, while execution orders for block trades are accepted from 15:00 to 15:30. Special block
trade business, which is undertaken on an ad hoc basis, is accepted between 15:00 and 17:00, and participants, who
are SSE qualified investors, may carry out spot trading in SSE trading room by way of auction, price inquiry, quotation,
or another trading method, with delivery being non-guaranteed. The market is closed on Saturdays, Sundays and other
public holidays announced by SSE.
Securities are traded on SSE on a market-driven and free auction basis. Limit orders and market orders are accepted
in line with market conditions. At present, trading in A shares, B shares and securities investment funds is subject to
a maximum daily price fluctuation limit of plus or minus 10%, except for the first trading day. Stocks subject to a risk
warning are subject to a maximum daily price fluctuation limit of plus or minus 5%. Price limits for warrant transactions
are determined on the basis of the price limit for the underlying securities by multiplying the warrant conversion ratio by a
SSE trading business
Trading system-based business
Centralized trading business: auction, price inquiry and quotation
Trading-related services: offering, entitlement or trading relationship
Non-trading system-based business: negotiated transfer, warrant creation and cancellation, etc.

Stock Market
2014 Fact Book 14
coefficient. The price of a block trade of securities with a price limit is determined by the buyer and seller within the price
limit applicable to such securities on the day of trading. The price of a block trade of securities without any price limit is
negotiated by the buyer and seller within 30% of the previous closing price or between the highest and lowest traded
prices on the day of trading. In the absence of any transaction for a particular stock, the closing price of the previous
trading day will be the execution price.
SSE has established a Risk Alert Board where stocks bearing significant risks or to be delisted are traded and their
trading information is separately displayed. Related stocks include: (1) stocks with the risks of being delisted (*ST); (2)
stocks that have been resumed from suspension for listing (ST); (3) stocks that have been relisted (ST); (4) stocks that
have suffered from other significant risks (ST). Stock to be delisted refers to the stock that has been decided by SSE to
be delisted but is still under disposal and yet to be delisted. Stocks bearing significant risks are subject to a maximum
daily price fluctuation limit of plus or minus 5%. Stocks to be listed are subject to a maximum daily price fluctuation limit
of plus or minus 10%.
Securities traded on SSE are conducted through designated brokers. All the investors that trade securities on SSE must
first designate a member of SSE as an agent and conclude a Designated Transactions Agreement with the agent for
trading and clearing securities on their behalf. No trading is allowed before the investor’s trading account is registered
with the member’s trading seat.
SSE has adopted a primary dealer system in warrant trading. Primary dealers are the securities firms that are designated
by SSE for providing bilateral quotations for warrant trading. In addition, institutional market participants recognized by
SSE may provide daily bilateral quotations for bonds traded on SSE’s block trading system, with the specific bonds and
the spreads to be determined at their discretion to the extent permitted by SSE rules.
SSE makes timely releases of trading data and information to members and investors. Daily real-time market quotations,
stock indices, clearing data, market reports and daily transaction data are transmitted to member’s counter terminals
via satellite communications system or optical fiber communications system. The transaction data is instantaneously
transmitted to each member via a two-way satellite system and optical fiber communications system. Since September
22, 2003, SSE has started disclosing five best quotations. Block trade data is published in SSE-designated media
and released simultaneously on the “quotations and transactions—disclosure of transaction information—block trade
information” section of SSE’s website (www.sse.com.cn). Apart from that, SSE also discloses more detailed information
about the daily top gainers and losers on the securities market according to the trading rules.
Margin Trading and Short Selling Business
Margin Trading and Short Selling, also known as securities credit trading, refers to the way that investors offer collaterals
to the securities with margin trading and short selling business license and borrow funds to buy listed securities (margin
trading) or borrow listed securities to sell (short selling). The margin trading and short selling business refers to the
operating activity that securities companies lend their clients to buy listed securities or securities for sale and receive
collateral.
Relending financing refers to the business activity that China Securities Finance Corporation lends its proprietary fund or
legally collected fund to securities companies for the operation of their margin trading and short selling business.
The margin trading and short selling business pilot started on March 31st, 2010 and was formally launched on
Stock Market
2014 Fact Book 15
November 25th, 2011. By the end of 2012, there had been 74 member securities companies with margin trading and
Short Selling license. Relending financing started on August 30th, 2012. By the end of January 2013, there have been
84 member companies qualified for relending financing.
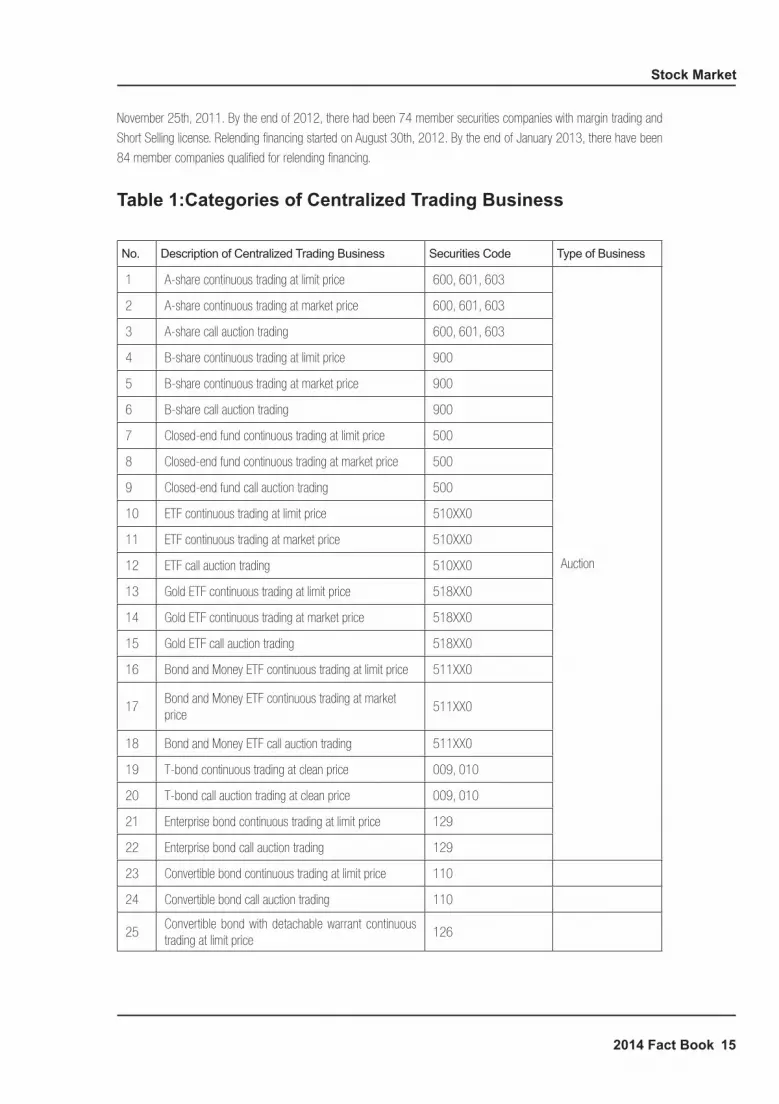
Table 1:Categories of Centralized Trading Business
No. Description of Centralized Trading Business Securities Code Type of Business
1 A-share continuous trading at limit price 600, 601, 603
Auction
2 A-share continuous trading at market price 600, 601, 603
3 A-share call auction trading 600, 601, 603
4 B-share continuous trading at limit price 900
5 B-share continuous trading at market price 900
6 B-share call auction trading 900
7 Closed-end fund continuous trading at limit price 500
8 Closed-end fund continuous trading at market price 500
9 Closed-end fund call auction trading 500
10 ETF continuous trading at limit price 510XX0
11 ETF continuous trading at market price 510XX0
12 ETF call auction trading 510XX0
13 Gold ETF continuous trading at limit price 518XX0
14 Gold ETF continuous trading at market price 518XX0
15 Gold ETF call auction trading 518XX0
16 Bond and Money ETF continuous trading at limit price 511XX0
17Bond and Money ETF continuous trading at market price
511XX0
18 Bond and Money ETF call auction trading 511XX0
19 T-bond continuous trading at clean price 009, 010
20 T-bond call auction trading at clean price 009, 010
21 Enterprise bond continuous trading at limit price 129
22 Enterprise bond call auction trading 129
23 Convertible bond continuous trading at limit price 110
24 Convertible bond call auction trading 110
25Convertible bond with detachable warrant continuous trading at limit price
126

Stock Market
2014 Fact Book 16
No. Description of Centralized Trading Business Securities Code Type of Business
26Convertible bond with detachable warrant call auction trading
126
Auction
27 Old pledge-style repo continuous trading 201
28 Old pledge-style repo call auction trading 201
29 New pledge-style repo continuous trading at limit price 204
30 New pledge-style repo call auction trading 204
31 Outright repo continuous trading at limit price 203
32 Outright repo call auction trading 203
33 Warrant continuous trading at limit price 580
34 Warrant continuous trading at market price 580
35 Warrant call auction trading 580
36 A-share block trading Same as A Shares
Price inquiry
37 B-share block trading Same as B Shares
38 Closed-end fund block trading Same as closed-end funds
39 ETF block trading Same as ETFs
40 Bond block trading Same as bonds
41 Bond repo block trading Same as bond repo
42 Asset securitization 121
43 Warrant bilateral quotation Same as warrants
Quotation
44 ETF purchase/redemption 510XX1, 510XX2
45 Gold ETF purchase/redemption 518XX1, 518XX2
46 Bond and Money ETF purchase/redemption 511XX1, 511XX2
47 Tender offer 706
48 T-bond distribution 751
49 T-bond firm quotation
019 (Electronic Platform)50 T-bond non-firm quotation
51 T-bond client enters into a transaction with primary dealer
52 T-bond price inquiry
53 Corporate bond firm quotation
122 (Electronic Platform)
54 Corporate bond non-firm quotation
55Corporate bond client enters into a transaction with primary dealer
56 Corporate bond price inquiry

Stock Market
2014 Fact Book 17
Table 2: Categories of Trading-related Services
Type of Securities No. Description of Trading-related
Services Securities Code Type of Business
Equities
1 Online fixed price offering7301 (corresponding to A-share 600),7802 (corresponding to A-share 601)7323 (corresponding to A-share 603)
Offering
2 Online price inquiry offering730 (corresponding to A-share 600),780 (corresponding to A-share 601)732 (corresponding to A-share 603)
Offering
3Online fixed-price follow-on offering
730 (corresponding to A-share 600),731 (corresponding to A-share 600),780 (corresponding to A-share 601),781 (corresponding to A-share 601)732 (corresponding to A-share 603)
Offering
4Online price inquiry follow-on offering
730 (corresponding to A-share 600),731 (corresponding to A-share 600),780 (corresponding to A-share 601),781 (corresponding to A-share 601)732 (corresponding to A-share 603)
Offering
5Placement proportional to the existing secondary market holdings
737 Offering
6 Rights issue
700 (corresponding to ordinary A-share 600),702 (corresponding to employee A-share 600),760 (corresponding to ordinary A-share 601),762 (corresponding to employee A-share 601)742 (corresponding to ordinary A-share 603)
Offering, entitlement
7 Online voting
738 (corresponding to A-share 600),788 (corresponding to A-share 601),752 (corresponding to A-share 603)938 (corresponding to B Shares)
Entitlement
8 Password service799988 (corresponding to A Shares),939988 (corresponding to B Shares)
Entitlement
9 Offline initial price inquirySame as the stock code Offering
10 Offline book-building
Bonds
11 Convertible bond offering7334 (corresponding to A-share 600),7835 (corresponding to A-share 601)7546 (corresponding to A-share 603)
Offering
12 Convertible bond placement704 (corresponding to A-share 600),764 (corresponding to A-share 601)753 (corresponding to A-share 603)
Entitlement
13Conversion of convertible bonds into shares
181 (corresponding to A-share 600),190 (corresponding to A-share 600),191 (corresponding to A-share 601),192 (corresponding to exchangeable corporate bond 128)
Offering, entitlement
14 Sell-back of convertible bonds 1009 Entitlement

Stock Market
2014 Fact Book 18
Type of Securities No. Description of Trading-related
Services Securities Code Type of Business
Bonds 15Transfer of collateral bonds to collateral vault
090 (corresponding to T-bond 010),099 (corresponding to T-bond 009),104 (corresponding to corporate bond 122),105000 – 105899 (corresponding to corporate bond with detachable warrant 126),105900 – 105999 (corresponding to enterprise bond 120, 129),106 (corresponding to local government bond130),107(corresponding to discount T-bond 020)
Trading relationship
Warrants 16 Exercise of warrants 582 Entitlement
Funds
17 Subscription for closed-end funds 7357 Offering
18 Expansion of closed-end funds 705 Offering
19 Subscription for open-end funds 521 Offering
20Purchase and redemption of open-end funds
519Offering, entitlement
21 Designation transfer of open-end funds 522Trading relationship
22Dividend distribution by open-end funds
523 Entitlement
23 Conversion of open-end funds 524Entitlement (business has not yet started)
24 ETF offering 510XX3 Offering
25 Gold ETF offering 518XX3 Offering
26 Bond and Money ETF offering 511XX3 Offering
Trading registration
27Designated registration/cancellation of designated trading
799998/799999Trading relationship
28Repurchase registration/repurchase cancellation
799997/799996Trading relationship
(Footnotes)
1. For any stock corresponding to the code 730 in the table, 740 and 741 are the codes assigned for the subscription funds or further
issue funds of the stock and the number allotted, respectively.
2. For any stock corresponding to the code 780 in the table, 790 and 791 are the codes assigned for the subscription funds or further
issue funds of the stock and the number allotted, respectively.
3. For any stock corresponding to the code 732 in the table, 734 and 736 are the codes assigned for the subscription funds or further
issue funds of the stock and the number allotted, respectively.
4. For any convertible bond corresponding to the code 733 in the table, 743 and 744 are the codes assigned for the bond issuance
funds of the convertible bond and the number allotted, respectively.
5. For any convertible bond corresponding to the code 783 in the table, 793 and 794 are the codes assigned for the bond issuance
funds of the convertible bond and the number allotted, respectively.
6. For any stock corresponding to the code 753 in the table, 755 and 756 are the codes assigned for the subscription funds or further
issue funds of the stock and the number allotted, respectively.
7. For any mutual fund corresponding to the code 735 in the table, 745 and 746 are the codes assigned for the purchase funds of the
mutual fund and the number allotted, respectively.

Stock Market
2014 Fact Book 19
Table of Fees Charged and Taxes Withheld by SSE
Category Fees Fee Standard Payer and Receiver
Transactions
A share
Handling fee 0.00696%% of trading value (bilateral)
Paid by SSE members, etc. to SSE
Securities management fee
0.002% of trading value (bilateral)
Paid by SSE members, etc. to CSRC (collected by SSE)
Stamp duty 0.1% of t rading value (unilateral)
Paid by investors to tax authorizes (collected by SSE)
B share
Handling fees 0.026% of trading value (bilateral)
Paid by SSE members, etc. to SSE
Securities management fee
0.002% of trading value (bilateral)
Paid by SSE members, etc. to CSRC (collected by SSE)
Securities investment fund(closed-end fund and ETF)
Handling fee 0.0045% of trading value (bilateral)
Paid by SSE members, etc. to SSE
Securities management fee
exempted
Warrants
Handling fee 0.0045% of trading value (bilateral)
Paid by SSE members, etc. to SSE
Securities management fee
exempted
Cash bonds( T-bond, enterprise bond, corporate bond, convertible corporate bond, detachable convertible corporate bond, etc.
Handling fee
0.0001% of tu rnover (b i l a te ra l ) (cash bond transaction on the fixed income platform and less than 100 yuan/ per deal at minimum)
Paid by SSE members, etc. to SSE
Securities management fee
exempted
Pledge-style repo
1 day Handling fee 0.00005% of t rad ing value (bilateral)
Temporary exemption
Paid by SSE members, etc. to SSE
2 days Handling fee 0.00010% of t rad ing value (bilateral)
Paid by SSE members, etc. to SSE
3 days Handling fee 0.00015% of t rad ing (bilateral)
Paid by SSE members, etc. to SSE
4 days Handling fee 0.00020% of t rad ing value (bilateral)
Paid by SSE members, etc. to SSE
7 days Handling fee 0.00025% of t rad ing value (bilateral)
Paid by SSE members, etc. to SSE
14 days Handling fee 0.00050% of t rad ing value (bilateral)
Paid by SSE members, etc. to SSE
28 days Handling fee 0.00100% of t rad ing value (bilateral)
Paid by SSE members, etc. to SSE
More than 28 days Handling fee 0.00150% of t rad ing value (bilateral)
Paid by SSE members, etc. to SSE
T-bond outright repurchase
7 days Handling fee 0.000625% of trading value (bilateral)
Paid by SSE members, etc. to SSE
28 days Handling fee 0.0025% of trading value (bilateral)
Paid by SSE members, etc. to SSE
91 days Handling fee 0.00375% of t rad ing value (bilateral)
Paid by SSE members, etc. to SSE

Stock Market
2014 Fact Book 20
Transactions
Block trading
A share ,B share and securities investment fund
Handling fee 30% lower than the fee rate of same product in auction market
Paid by SSE members, etc. to SSE
Securities management fee
The same as that in the auction transaction for the same product
Paid by SSE members, etc. to CSRC (collected by SSE)
Cash bonds( T-bonds, enterprise bonds, corporate bonds, convertible corporate bonds, detachable convertible corporate bonds, etc
Handling fee
90% of 0.01% of trading value and less than 100yuan/per deal at minimum(bilateral)
Paid by SSE members, etc. to SSE
Securities management fee
The same as in auction trading for the same product
Paid by SSE members, etc. to CSRC (collected by SSE)
Pledge-style repo and T-bond outright repo
Handling fee Temporary exemption Paid by SSE members, etc. to SSE
ETF subscription and redemption Handling fee Temporary exemption Paid by SSE members, etc. to SSE
Transfer of specific asset management scheme
Handling fee 0.00009% of amount transferred
Paid by SSE members, etc. to SSE
Issuance
New share subscription Handling fee 0.012% of trading value (unilateral) and subject to temporary exemption
Paid by SSE members, etc. to SSE
Convertible corporate bond subscription
Handling fee 0.01% of trading value (unilateral) and subject to temporary exemption
Paid by SSE members, etc. to SSE
Investment fund subscription Handling fee 0.0085% of trading value Paid by SSE members, etc. to SSE
Right issue, trans-right issue, employee shares allotment, state shares allotment, share allotment for convertible bond
Handling fee 0.012% of trading value (bilateral) and subject to temporary exemption
Paid by SSE members, etc. to SSE
Investment fund placement Handling fee 0.0085% of trading value (bilateral)
Paid by SSE members, etc. to SSE
Stock Market
2014 Fact Book 21
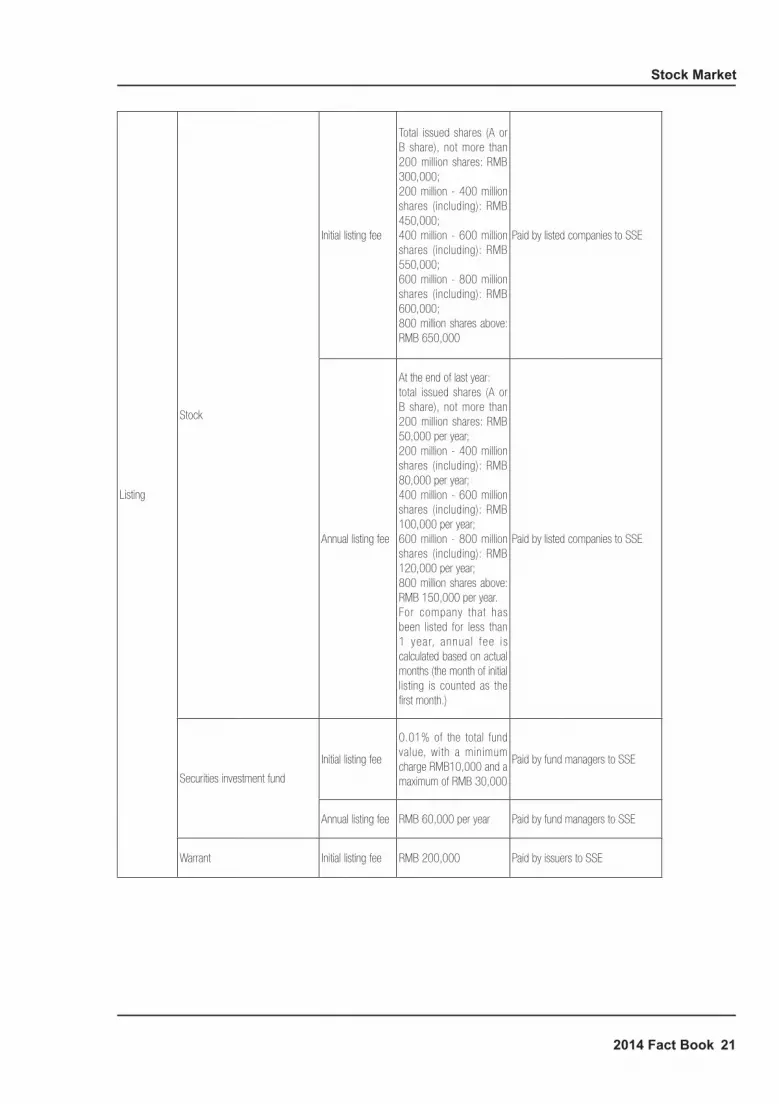
Listing
Stock
Initial listing fee
Total issued shares (A or B share), not more than 200 million shares: RMB 300,000;200 million - 400 million shares (including): RMB 450,000;400 million - 600 million shares (including): RMB 550,000;600 million - 800 million shares (including): RMB 600,000;800 million shares above: RMB 650,000
Paid by listed companies to SSE
Annual listing fee
At the end of last year:total issued shares (A or B share), not more than 200 million shares: RMB 50,000 per year;200 million - 400 million shares (including): RMB 80,000 per year;400 million - 600 million shares (including): RMB 100,000 per year;600 million - 800 million shares (including): RMB 120,000 per year;800 million shares above: RMB 150,000 per year.For company that has been listed for less than 1 yea r, annua l f ee i s calculated based on actual months (the month of initial listing is counted as the first month.)
Paid by listed companies to SSE
Securities investment fund
Initial listing fee
0.01% of the total fund value, with a minimum charge RMB10,000 and a maximum of RMB 30,000
Paid by fund managers to SSE
Annual listing fee RMB 60,000 per year Paid by fund managers to SSE
Warrant Initial listing fee RMB 200,000 Paid by issuers to SSE

Stock Market
2014 Fact Book 22
Listing
Enterprise bond
Initial listing fee
0.01% of the total listing amount, with a minimum charge of RMB 8000, and a maximum charge of RMB 40,000( subject to temporary exemption)
Paid by issuers to SSE
Annual listing fee
0.0096% of total listing amount, with a minimum charge of RMB 4800, and a maximum charge of RMB 24,000 ( subject to temporary exemption)
Paid by issuers to SSE
Convertible corporate bond
Initial listing fee
0.01% of total listed face value, with a minimum charge of RMB 10,000 and a maximum charge of RMB 30,000 ( subject to temporary exemption)
Paid by issuers to SSE
Annual listing feeRMB 6000 per year (subject to temporary exemption)
Paid by issuers to SSE
Seatnon-B-share seat Initial fee RMB 600,000 per seat Paid by SSE members to SSE
B share seat Initial fee US$ 75,000 per seat Paid by SSE members to SSE
Participant business unit (PBU)
PBU use fee
Institutions including SSE members can use one PBU for free for each seat they hold. For additional PBU, user fee of RMB50, 000 per year for each PBU is charged by SSE. (F rom Dec. 1 , 2010, PBU for bond spot and repo trading is subject to temporarily exemption of usage fee.)
Paid by SSE members to SSE
Flow rate fee
If the total f low rate of institution which connects to SSE trading system exceeds its free flow rate limit, for the excess flow rate, the fee is RMB10, 000 for each standard flow rate per year. (charged from Dec. 1, 2010, flow rate fee for PBUs of bond spot and repo t rading is sub ject temporar i l y exemption)

Stock Market
2014 Fact Book 23
Participant business unit (PBU) Flow rate fee
1. charge periods is from Dec. 1 of the previous year to Nov. 30 of the current year
2. flow rate fee= (total number of yearly trading orders of institution’s PBUs - 30,000 deals/year × number of seats held) × RMB0.10 + (total number o f yea r l y non- t rad ing orders of institution’s PBUs - 30,000 deals/year × number of seats held) × RMB0.01
3. For details, please refer to the Circular on Relevant Issues of Adjusting Annual Fee Charge Mode for SSE Seats and Circular on Collecting Annual Fee of Trading Units for 2010
4. From Dec. 1, 2010, all trading participants are temporarily exempted from flow rate fee for bond spot and repo trading.
5. From Jan.18, 2013, all trading participants are temporarily exempted from flow rate fee for currency market fund and bond fund trading.
Other servicesFees, standards and charging methods are pursuant to the provisions on relevant services.
1. This table only covers fees charged and taxes withheld by SSE, and excludes the commission paid to securities companies and the
fees charged by China Securities Depository and Clearing Co., Ltd.
2. For information on communications and information service fees, please contact Shanghai Stock Communication Co., Ltd.(http://
www.stocom.net,68664588) and SSE INFONET Ltd., Co.(68800098).
3. For the information on the reduction and exemption of ETF trading fees, please refer to the Circular on the Reduction and Exemption
of Trading Fees Related to Exchange Traded Fund (ETF) (SSE[2009] No.1).

Stock Market
2014 Fact Book 24
2013 Monthly Trading Volume, Trading Value and P/E Ratio
Month Trading Volume (10,000 shares) Trading Value (RMB 10,000) P/E Ratio (Times)
1 26878205.19 226887224.05 12.97
2 18365856.09 163485559.75 12.90
3 23418647.99 204888248.02 12.19
4 15067876.59 129096699.59 11.89
5 23167806.96 210198137.11 11.81
6 15683791.53 133763397.75 10.17
7 21825986.56 182876609.87 10.26
8 25137950.25 208095598.56 10.80
9 30230742.32 255271528.47 11.20
10 23955015.81 210696221.57 11.05
11 22117278.31 193585695.01 11.47
12 21339380.28 183815352.72 10.99

Stock Market
2014 Fact Book 25
Top 20 Most Traded Stocks by Trading Volume
Rank Code Short Name Trading Volume(10,000 shares)
Percentage in Total Market Trading Volume (%)
1 600016 Minsheng Bank 4426512.80 1.66
2 600000 Pudong Development Bank 3898650.37 1.46
3 600837 Haitong Securities 3066091.13 1.15
4 601288 Agricultural Bank of China 3022726.04 1.13
5 600030 CITIC Securities 2654073.91 0.99
6 601818 Everbright Bank 2597387.13 0.97
7 601166 Industrial Bank 2575414.00 0.96
8 601668 China State Construction Engineering 2443781.67 0.91
9 600050 China Unicom 2369956.06 0.89
10 601901 Founder Securities 2234482.61 0.84
11 600036 China Merchants Bank 2058871.49 0.77
12 601328 Bank of Communications 1935290.93 0.72
13 600839 Changhong 1917275.62 0.72
14 600795 GD Power Development 1682617.71 0.63
15 601398Industrial and Commercial Bank of China
1662053.93 0.62
16 600018 Shanghai International Port 1610533.84 0.60
17 600503 Deluxe Family 1552073.20 0.58
18 601989 China Shipbuilding Industry 1532475.20 0.57
19 600804 Dr. Peng Group 1503764.61 0.56
20 600383 Gemdale 1501107.94 0.56

Stock Market
2014 Fact Book 26
Top 20 Most Traded Stocks by Trading Value
Rank Code Short Name Trading Value(RMB 10,000)
Percentage in Total Market Turnover Value (%)
1 600016 Minsheng Bank 42256871.20 1.84
2 600000 Pudong Development Bank 39653476.81 1.72
3 601166 Industrial Bank 36507291.57 1.59
4 601318 Ping An Insurance 34838048.65 1.51
5 600837 Haitong Securities 34781008.43 1.51
6 600030 CITIC Securities 33349270.12 1.45
7 600036 China Merchants Bank 25021456.54 1.09
8 600111 Baogang Rare Earth 24754709.93 1.08
9 600804 Dr. Peng Group 20669356.76 0.90
10 600519 Kweichow Moutai 16673582.56 0.72
11 600048 Poly Real Estate 16465013.44 0.72
12 601901 Founder Securities 14864157.49 0.65
13 600880 B-ray media 13306674.64 0.58
14 600388 Fujian Longking 12935931.64 0.56
15 600256 Xinjiang Guanghui 11452913.84 0.50
16 600518 Kangmei Pharmaseutical 11061687.80 0.48
17 600104 SAIC Motor 11052734.12 0.48
18 600585 Anhui Conch Cement 10988774.30 0.48
19 600887 Yili Group 10977905.09 0.48
20 600765 AVIC Heavy Machinery 10706017.29 0.46

Stock Market
2014 Fact Book 27
Top 20 Gainers
Rank Code Short Name 2012 Year-end Close(RMB)
2013 Year-end Close (RMB) Change(%)
1 600536 China National Software and Service 10.570 37.670 258.26
2 600648Waigaoqiao Free Trade Zone Development
9.610 32.230 238.85
3 600119 Yangtze River Investment 5.320 17.830 238.73
4 900913 *ST Lianhua B 0.543 1.780 227.81
5 600388 Fujian Longking 21.900 33.520 208.23
6 600566 Hongcheng General Machinery 6.620 19.940 201.21
7 600485 Zhongchuang Telecom Test 7.160 20.510 186.45
8 600771 Shanxi Guangyuyuan 9.080 25.850 184.69
9 600389Jiangshan Agrochemical and Chemicals
14.190 39.130 177.34
10 900912Waigaoqiao Free Trade Zone Development B
0.810 2.153 171.92
11 600626 Shanghai Shenda 3.430 8.950 168.02
12 600620 Shanghai Tianchen 3.560 9.000 153.23
13 600872Jonjee Hi-Tech Industrial & Commercial Holding
4.600 11.370 148.75
14 600804 Dr. Peng Group 5.960 14.060 136.86
15 600387 Zhejiang Haiyue 8.620 20.160 134.66
16 600640 Besttone Holding 7.620 17.850 134.25
17 600433 Guanhao High-tech 9.140 10.640 133.70
18 600617 *ST Lianhua 8.980 20.980 133.63
19 600637 BesTV 15.870 36.970 132.96
20 600446 Kingdom Technology 6.680 15.450 132.04

Stock Market
2014 Fact Book 28
Top 20 Losers
Rank Code Short Name2012 Year-end Close(RMB)
2013 Year-end Close (RMB)
Change(%)
1 600395 Panjiang Refined Coal 17.020 7.260 -55.16
2 600547 Shangdong Gold 38.160 17.250 -54.57
3 600809 Shanxi Xinghuacun Fen Wine Factory 41.660 19.300 -52.31
4 600381 *ST Xiancheng 4.230 2.080 -50.83
5 600546 Shanxi Coal International Energy 20.350 4.950 -50.12
6 601699 Lu’an Environmental Energy 21.890 10.670 -49.84
7 600348 Yang Quan Coal Industry 14.530 7.060 -49.81
8 601268 *ST National Erzhong Group 5.060 2.540 -49.80
9 600188 Yanzhou Coal 18.230 8.880 -49.73
10 600489 Zhongjin Gold 16.630 8.550 -47.71
11 600702 Tuopai Shede Wine 28.810 15.040 -46.78
12 600779 SichunSwellfun 19.370 10.190 -46.58
13 600199 Golden Seed Winery 19.210 10.140 -46.05
14 600531 Yuguang Gold & Lead 17.130 9.280 -45.62
15 600961 *ST Zhuzhou Smelter 10.140 5.560 -45.17
16 600997 Kailuan Energy Chemical 10.220 5.570 -44.89
17 600123 Lanhua Sci-Tech Venture 20.290 10.670 -44.79
18 601101 Haohua Energy Resource 13.320 7.210 -44.35
19 600971 Hengyuan Coal-Electricity 12.880 7.130 -43.06
20 600432 Ji En Nickel Industry 13.500 7.730 -42.74

Stock Market
2014 Fact Book 29
2013 Top 10 in Margin Trading
Rank Code Short NameAmount of Purchase on Margin (RMB 10,000)
Amount of Selling the Securities to Return the Borrowed Loan(RMB 10,000)
Total (RMB 10,000)
1 600000Pudong Development Bank
5870356.15 3213260.92 9083617.07
2 600837 Haitong Securities 5673112.67 3033052.62 8706165.29
3 600030 CITIC Securities 5050455.23 2782887.82 7833343.05
4 601166 Industrial Bank 4835115.81 2808390.63 7643506.44
5 600016 Minsheng Bank 4614983.26 2747771.82 7362755.08
6 601318 Ping An Insurance 5003917.10 2169520.95 7173438.05
7 600804 Dr. Peng Group 3927166.18 2136267.35 6063433.53
8 600111 Baosteel Rare Earth 3163619.80 1785845.65 4949465.45
9 600256 Xinjiang Guanghui 2536312.47 1585386.22 4121698.69
10 510050 50ETF 2963241.56 955697.49 3918939.05
2013 Top 10 in Short Selling
Rank Code Short NameAmount of Purchase on Margin (RMB 10,000)
Amount of Selling the Securities to Return the Borrowed Loan(RMB 10,000)
Total (RMB 10,000)
1 510300 300ETF 6674159.45 3681327.82 10355487.27
2 510050 50ETF 2558852.35 895399.26 3454251.61
3 600016 Minsheng Bank 2287251.10 965175.46 3252426.56
4 601166 Industrial Bank 1826175.26 557040.74 2383216.00
5 600837 Haitong Securities 1778528.28 595968.29 2374496.57
6 600036 China Merchants Bank 1399378.59 676148.15 2075526.74
7 600030 CITIC Securities 1471839.70 601703.91 2073543.61
8 600000 Pudong Development Bank
1571819.69 421074.03 1992893.72
9 601318 Ping An Insurance 1401836.36 517125.84 1918962.20
10 600111 Baosteel Rare Earth 939221.43 191530.98 1130752.41

Stock Market
2014 Fact Book 30
Base Day, Base Period Index and Launch Date
SSE Index Series uses “point” as the unit of calculation.
Indices Base day Base period index Launch date
Composite Indices
SSE Composite Index 1990-12-19 100 1991-7-15
SSE New Composite Index 2005-12-30 1000 2006-1-4
SSE A-share Index 1990-12-19 100 1992-2-21
SSE B-share Index 1992-2-21 100 1992-8-17
SSE Sector Sub-indices 1993-4-30 1358.78 1993-5-3
SSE Medium Enterprise Composite Index 2007-12-28 1000 2008-5-12
SSE Free-float Index 2009-12-31 1000 2010-12-2
Market-size Indices
SSE 180 Index 2002-6-28 3299.06 2002-7-1
SSE 50 Index 2003-12-31 1000 2004-1-2
SSE Mega-cap Index 2003-12-31 1000 2009-4-23
SE Mid-cap Index 2003-12-31 1000 2009-7-3
SSE Small-cap Index 2003-12-31 1000 2009-7-3
SSE Small- & Mid-cap Index 2003-12-31 1000 2009-7-3
SSE All-share Index 2003-12-31 1000 2009-7-3
SSE 380 Index 2003-12-31 1000 2010-11-29
Sector Indices
SSE Sector Indices (10 Indices) 2003-12-31 1000 2009-1-9
SSE 380 Sector Indices (10 Indices) 2003-12-31 1000 2011-6-13
SSE 180 Sector Indices (10 Indices) 2003-12-31 1000 2012-6-29
Style Indices
SSE 180 Style Indices (4 Indices) 2002-6-28 1000 2009-1-9
SSE All-share Style Indices (4 Indices) 2003-12-31 1000 2010-1-4
SSE 380 Style Indices (4 Indices) 2003-12-31 1000 2011-10-18
Strategy Indices
SSE Sector Hierarchy Equal Weight Index (10 indices) 2003-12-31 1000 2010-8-18
SSE 50 Equal Weight Index 2003-12-31 1000 2011-1-4
SSE Wealth Mid-Small Index 2004-12-31 1000 2011-4-6
SSE 180 Equal Weight Index 2002-6-28 1000 2011-5-24
SSE 180 Sector Hierarchy Equal Weight Index 2002-6-28 1000 2011-5-24
SSE Fundamental 200 Index 2004-12-31 1000 2011-7-1

Stock Market
2014 Fact Book 31
Strategy Indices
SSE Fundamental 300 Index 2004-12-31 1000 2011-7-1
SSE Fundamental 500 Index 2004-12-31 1000 2011-7-1
SSE 380 Equal Weight Index 2003-12-31 1000 2011-8-12
SSE 50 Fundamental Weighted Index 2003-12-31 1000 2012-1-9
SSE 180 Fundamental Weighted Index 2002-6-28 1000 2012-1-9
SSE 380 Fundamental Weighted Index 2003-12-31 1000 2012-1-9
SSE 180 Volatility Weighted Index 2002-6-28 1000 2012-1-9
SSE 380 Volatility Weighted Index 2003-12-31 1000 2012-1-9
SSE 180 High Beta Index 2002-6-28 3299.06 2012-8-6
SSE 180 Low Beta Index 2002-6-28 3299.06 2012-8-6
SSE 380 High Beta Index 2003-12-31 1000 2012-8-6
SSE 380 Low Beta Index 2003-12-31 1000 2012-8-6
Thematic Indices
SSE Dividend Index 2004-12-31 1000 2005-1-4
SSE 180 Financial Index 2002-6-28 1000 2007-12-10
SSE Corporate Governance Index 2007-6-29 1000 2008-1-2
SSE 180 Corporate Governance Index 2007-6-29 1000 2008-9-10
SSE 180 Infrastructure/Natural Resource/Transportation Index
2002-6-28 1000 2008-12-15
SSE Central SOEs 50 Index 2008-12-31 1000 2009-3-30
SSE Social Responsibility Index 2009-6-30 1000 2009-8-5
SSE Private Enterprises 50 Index 2009-6-30 1000 2009-8-25
SSE Local SOEs 50 Index: 2009-6-30 1000 2010-1-4
SSE SOEs 100 Index: 2009-6-30 1000 2010-1-4
SSE Overseas-listing A Share Index 2006-12-29 1000 2010-1-4
SSE Shanghai Enterprises Index 2005-12-31 1000 2010-1-4
SSE Cyclical Industry 50 Index 2003-12-31 1000 2010-2-3
SSE Non-cyclical Industry 100 Index 2003-12-31 1000 2010-2-3
SSE Industry Top Index 2003-12-31 1000 2010-2-9
SSE Commodity Stock Index 2003-12-31 1000 2010-4-30
SSE New-emerging Industry Index 2003-12-31 1000 2010-4-30
SSE Natural Resources Index 2003-12-31 1000 2010-5-28
SSE Consumption 80 Index 2003-12-31 1000 2010-5-28
SSE Resource 50 Index 2003-12-31 1000 2011-5-10
SSE Industry Chain Series (3 Indices) 2003-12-31 1000 2011-5-10
SSE High-End Equipment Manufacturing 60 Index 2004-12-31 1000 2011-5-24

Stock Market
2014 Fact Book 32
Thematic Indices
SSE Investment Commodity Index 2003-12-31 1000 2011-6-13
SSE Consume Commodity Index 2003-12-31 1000 2011-6-13
SSE Sustainable Development Industry Index 2011-6-30 1000 2011-8-22
SSE Health Care Theme Index 2004-12-31 1000 2011-10-18
SSE Agriculture Theme Index 2011-6-30 1000 2011-10-18
SSE Consumer 50 Index 2004-12-31 1000 2011-12-9
SSE High and New Technology Enterprises Index 2011-06-30 1000 2012-2-10
SSE 100 Index 2003-12-31 1000 2012-4-20
SSE 150 Index 2003-12-31 1000 2012-4-20
SSE Bank Index 2007-12-31 1000 2012-5-28
SSE Competitive Industry Indices Series (3 indices) 2003-12-31 1000 2012-5-28
SSE Leading Consumption and Service Index 2004-12-31 1000 2012-5-28
SSE Market Value Top 100 Index 2003-12-31 1000 2012-7-20
SSE 180 Dividend Index 2004-12-31 1000 2012-7-20
SSE 380 Dividend Index 2004-12-31 1000 2012-7-20
SSE SOE Dividend Index 2009-6-30 1000 2012-7-20
SSE Central SOE Dividend Index 2008-12-31 1000 2012-7-20
SSE Private Enterprises Dividend Index 2009-6-30 1000 2012-7-20
SSE Environmental Protection Industry Index 2011-12-30 1000 2012-9-25
SSE Regional Industry Top Series (6 Indices) 2003-12-31 1000 2012-9-27
SSE Strategic Information Industry Index 2005-12-30 1000 2012-12-20
SSE 180 Dynamic/Stability Index (2 Indices) 2002-06-28 3299.06 2013-2-8
SSE 380 Dynamic/Stability Index (2 Indices) 2003-12-31 1000 2013-2-8
SSE Culture Industries Index 2012-06-29 1000 2013-3-26
SSE Dividend Return Index 2005-12-30 1000 2013-3-27
SSE Dividend Potential Index 2005-12-30 1000 2013-7-2
SSE Industrials Dividend Indices Series (10 Indices) 2005-12-30 1000 2013-7-2
SSE Urbanization Indices Series (7 Indices) 2012-06-29 1000 2013-8-26
SSE TMT(Technology, Media, Telecom) Industry Index 2011-06-30 1000 2013-12-25
SSE National Defense Industry Index 2004-12-31 1000 2013-12-26
SSE Dividend Low Volatility Index 2005-12-30 1000 2014-3-21
SSE Dividend Value Index 2005-12-30 1000 2014-3-21
Bond Indices
SSE T-bond Index 2002-12-31 100 2003-1-2
SSE Enterprise Bond Index 2002-12-31 100 2003-6-9
SSE Corporate Bond Index 2007-12-31 100 2008-11-19

Stock Market
2014 Fact Book 33
Bond Indices
SSE Detachable Bond Index 2007-12-31 100 2008-11-19
SSE Enterprise Bond Index 2003-12-31 100 2010-1-4
SSE Convertible Bond Index 2002-12-31 100 2012-9-12
SSE 5-year T-bond Index 2007-12-31 100 2012-9-12
SSE Credit Bond 100 Index 2007-12-31 100 2013-2-26
SSE 10-year T-bond Index 2008-12-31 100 2013-3-7
SSE 5-year T-bond Index 2007-12-31 100 2013-4-1
SSE Corporate Bond Indices Series (7 Indices) 2008-12-312009-12-31
100 2013-5-3
SSE Medium Term Medium-High Yield Cross Market Credit Bond Index
2008-12-31 100 2013-8-1
SSE Urban Construction Investment Bond Index 2008-12-31 100 2013-11-15
Fund Indices
SSE Fund Index 2000-5-8 1000 2000-6-9

Stock Market
2014 Fact Book 34
Number of Constituents in SSE Indices
Index Code Short Name Number of Constituents
000001 SSE Index 997
000002 A-share Index 944
000003 B-share Index 53
000004 Industrial Sub-index 637
000005 Commercial Sub-index 63
000006 Real Estate Sub-index 24
000007 Public Utilities Sub-index 102
000008 Conglomerates Index 171
000009 SSE 380 380
000010 SSE 180 180
000011 Fund Index 58
000012 T-Bond Index 134
000013 Enterprise Bond Index 1370
000015 Dividend Index 50
000016 SSE 50 50
000017 New Composite Index 938
000300 CSI 300 300
000901 Xiaokang Index 100
000902 China Securities Free Floating Index 2457
000903 China Securities 100 Index 100

Stock Market
2014 Fact Book 35
Market Cap and Weight of Constituent Stocks in SSE 50 Index
Code Short NameNumber of Tradable Shares (10,000 shares)
Market Cap of Tradable Shares (RMB 10,000)
Closing Price(RMB)
Weight in SSE 50 Index(%)
600000 Pudong Development Bank 1492278 14072179 9.43 4.59
600010 Baotou Steel 642364 2768590 4.31 0.56
600015 Hua Xia Bank 648769 5559948 8.57 1.66
600016 Minsheng Bank 2258819 17438085 7.72 7.62
600018 Shanghai International Port 2099080 11083142 5.28 1.07
600028 China Petroleum & Chemical 9105184 40791225 4.48 1.09
600030 CITIC Securities 981466 12513694 12.75 3.78
600031 Sany Heavy Industry 759371 4875159 6.42 0.87
600036 China Merchants Bank 2062894 22464920 10.89 7.79
600048 Poly Real Estate 713799 5888845 8.25 1.53
600050 China Unicom 2119660 6804107 3.21 1.20
600104 SAIC Motor 924242 13068784 14.14 2.06
600111 Baotou Steel Rare-earth 147947 3294779 22.27 1.41
600256 Guanghui Energy 304605 2662250 8.74 1.23
600332 Guangzhou Baiyunshan 103660 2867238 27.66 0.64
600362 Jiangxi Copper 207525 2942701 14.18 0.52
600383 Gemdale 447151 2986968 6.68 1.24
600406 Nari Technology 220575 3279956 14.87 1.01
600489 Zhongjin Gold 294323 2516461 8.55 0.56
600518 Kangmei Pharmaseutical 219871 3957686 18.00 1.21
600519 Kweichow Moutai 103818 13328155 128.38 2.30
600547 Shandong Hexi Gold 142307 2454800 17.25 0.55
600549 Xiamen Tungsten 68198 1639480 24.04 0.29
600585 Anhui Conch Cement 399970 6783496 16.96 1.50
600637 BesTV 83552 3088901 36.97 1.11
600837 Haitong Securities 809213 9160293 11.32 4.01
600887 Yili Industrial 158817 6206563 39.08 2.51
Stock Market
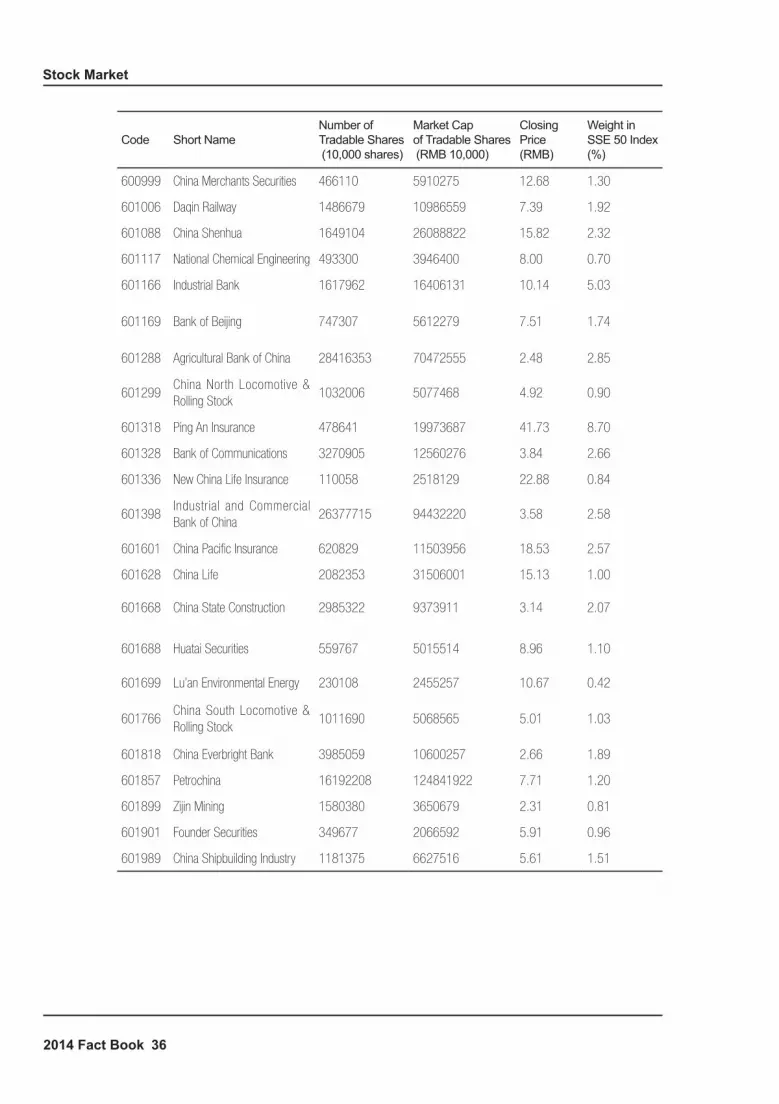
2014 Fact Book 36
Code Short NameNumber of Tradable Shares (10,000 shares)
Market Cap of Tradable Shares (RMB 10,000)
Closing Price(RMB)
Weight in SSE 50 Index(%)
600999 China Merchants Securities 466110 5910275 12.68 1.30
601006 Daqin Railway 1486679 10986559 7.39 1.92
601088 China Shenhua 1649104 26088822 15.82 2.32
601117 National Chemical Engineering 493300 3946400 8.00 0.70
601166 Industrial Bank 1617962 16406131 10.14 5.03
601169 Bank of Beijing 747307 5612279 7.51 1.74
601288 Agricultural Bank of China 28416353 70472555 2.48 2.85
601299China North Locomotive & Rolling Stock
1032006 5077468 4.92 0.90
601318 Ping An Insurance 478641 19973687 41.73 8.70
601328 Bank of Communications 3270905 12560276 3.84 2.66
601336 New China Life Insurance 110058 2518129 22.88 0.84
601398Industrial and Commercial Bank of China
26377715 94432220 3.58 2.58
601601 China Pacific Insurance 620829 11503956 18.53 2.57
601628 China Life 2082353 31506001 15.13 1.00
601668 China State Construction 2985322 9373911 3.14 2.07
601688 Huatai Securities 559767 5015514 8.96 1.10
601699 Lu’an Environmental Energy 230108 2455257 10.67 0.42
601766China South Locomotive & Rolling Stock
1011690 5068565 5.01 1.03
601818 China Everbright Bank 3985059 10600257 2.66 1.89
601857 Petrochina 16192208 124841922 7.71 1.20
601899 Zijin Mining 1580380 3650679 2.31 0.81
601901 Founder Securities 349677 2066592 5.91 0.96
601989 China Shipbuilding Industry 1181375 6627516 5.61 1.51

Stock Market
2014 Fact Book 37
Market Cap and Weight of Constituent Stocks in SSE 180 Index
Code Short NameNumber of Tradable Shares (10,000 shares)
Market Cap of Tradable Shares (RMB 10,000)
Closing Price (RMB)
Weight in 180 Index(%)
600000 Pudong Development Bank 1492278 14072179 9.43 2.91
600008 Beijing Capital 220000 1487200 6.76 0.21
600009 Shanghai Airport 109348 1565858 14.32 0.39
600010 Baotou Steel 642364 2768590 4.31 0.35
600011 Huaneng Power International 1050000 5313000 5.06 0.59
600015 Hua Xia Bank 648769 5559948 8.57 1.05
600016 Minsheng Bank 2258819 17438085 7.72 4.83
600018 Shanghai International Port 2099080 11083142 5.28 0.68
600019 Baoshan Iron & Steel 1647172 6736935 4.09 0.57
600027 Huadian Power 588006 1775777 3.02 0.20
600028 China Petroleum & Chemical 9105184 40791225 4.48 0.69
600029 China Southern Airlines 702265 1931229 2.75 0.27
600030 CITIC Securities 981466 12513694 12.75 2.40
600031 Sany Heavy Industry 759371 4875159 6.42 0.55
600036 China Merchants Bank 2062894 22464920 10.89 4.94
600048 Poly Real Estate 713799 5888845 8.25 0.97
600050 China Unicom 2119660 6804107 3.21 0.76
600058 Minmetals Development 107191 1453511 13.56 0.16
600060 Hisense Electric 130848 1509987 11.54 0.25
600064 Nanjing Gaoke 51622 568873 11.02 0.11
600066 Zhengzhou Yutong 122265 2146973 17.56 0.44
600067 Citychamp Dartong 119056 770291 6.47 0.15
600085 Beijing Tongrentang 131077 2805052 21.40 0.39
600089 Tebian Electric 263556 2825320 10.72 0.79
600094 Shanghai Greattown 19938 100686 5.05 0.04
600100 Tsinghua Tongfang 198770 2021492 10.17 0.45
600104 SAIC Motor 924242 13068784 14.14 1.31
600108 Yasheng Group 194692 1563373 8.03 0.35
600109 Sinolink Securities 129407 2196040 16.97 0.25
600111 Baotou Steel Rare-Earth 147947 3294779 22.27 0.89
600118 China Spacesat 118249 2191152 18.53 0.32
600123 Lanhua Sci-Tech Venture 114240 1218941 10.67 0.20
600141 Hubei Xingfa Chemicals 36548 456119 12.48 0.11

Stock Market
2014 Fact Book 38
Code Short NameNumber of Tradable Shares (10,000 shares)
Market Cap of Tradable Shares (RMB 10,000)
Closing Price (RMB)
Weight in 180 Index(%)
600143 Kingfa Sci. and Tech. 263440 1464726 5.56 0.25
600150 China State Shipbuilding 137812 3333666 24.19 0.37
600157 Wintime Energy 143395 772898 5.39 0.16
600158 China Sports 65750 502984 7.65 0.15
600160 Zhejiang Juhua 179147 962018 5.37 0.14
600162 Shenzhen Heungkong 76781 426136 5.55 0.06
600166 Foton Motor 253810 1294431 5.10 0.24
600170 Shanghai Construction 84589 526992 6.23 0.15
600177 Yongor 214361 1607704 7.50 0.33
600188 Yanzhou Coal 296000 2628480 8.88 0.15
600196 Fosun Pharmaceutical 190439 3730705 19.59 0.63
600199 Golden Seed Winery 55578 563556 10.14 0.11
600208 Xinhu Zhongbao 625726 2002322 3.20 0.22
600216 Zhejiang Medicine 93610 978228 10.45 0.19
600221 Hainan Airlines 1181206 2362413 2.00 0.33
600239 Yunnan City 82343 442181 5.37 0.09
600240 Homyear Realestate 142425 578247 4.06 0.10
600252 Zhongheng Group 109175 1489144 13.64 0.33
600256 Guanghui Industry 304605 2662250 8.74 0.78
600259 Rising Nonferrous Metals 24940 968919 38.85 0.13
600266 Beijing Urban Construction 88920 860746 9.68 0.12
600267 Hisun Pharmaceutical 83971 1244449 14.82 0.21
600271 Aisino 92340 1862498 20.17 0.32
600276 Hengrui Medicine 136022 5166120 37.98 0.73
600300 V V Food and Beverage 167200 799216 4.78 0.11
600309 Yantai Wanhua 216233 4476033 20.70 0.63
600315 Shanghai Jahwa 64968 2743589 42.23 0.56
600316 Hongdu Aviation Industry 71711 1246345 17.38 0.21
600325 Huafa 81705 608699 7.45 0.14
600332 Guangzhou Baiyunshan 103660 2867238 27.66 0.41
600340China Fortune Land Development
52317 1058371 20.23 0.30
600348 Yang Quan Coal Industry 240500 1697930 7.06 0.23
600352 Zhejiang Longsheng 151587 2003975 13.22 0.45
600362 Jiangxi Copper 207525 2942701 14.18 0.33
600366 Ningbo Yunsheng 51450 707949 13.76 0.14
600369 Southwest Securities 232255 2306297 9.93 0.32

Stock Market
2014 Fact Book 39
Code Short NameNumber of Tradable Shares (10,000 shares)
Market Cap of Tradable Shares (RMB 10,000)
Closing Price (RMB)
Weight in 180 Index(%)
600372 Aviation Electronics 90283 2154150 23.86 0.24
600376 Beijing Capital Development 224201 1127732 5.03 0.16
600383 Gemdale 447151 2986968 6.68 0.79
600395 Panjiang Refined Coal 165505 1201568 7.26 0.10
600406NARI Technology Development
220575 3279956 14.87 0.64
600415Zhejiang China Commodities City
272161 1597583 5.87 0.22
600418 JAC 106904 933270 8.73 0.22
600489 Zhongjin Gold 294323 2516461 8.55 0.36
600497 Chihong Zinc & Germanium 166756 1562505 9.37 0.22
600498Fiberhome Telecommunication Technologies
96572 1487208 15.40 0.21
600503 Deluxe Family 109948 458482 4.17 0.13
600516 FangDa Carbon New Material 153489 1168054 7.61 0.18
600518 Kangmei Pharmaceutical 219871 3957686 18.00 0.77
600519 Kweichow Moutai 103818 13328155 128.38 1.46
600535 Tasly Pharmaceutical 103284 4429862 42.89 0.74
600546Shanxi Coal Internat ional Energy
198246 981316 4.95 0.14
600547 Shangdong Gold 142307 2454800 17.25 0.35
600549 Xiamen Tungsten 68198 1639480 24.04 0.18
600583 Offshore Oil Engineering 388944 3018205 7.76 0.38
600585 Anhui Conch Cement 399970 6783496 16.96 0.95
600588 Yonyou Software 95925 1327597 13.84 0.19
600597 Bright Dairy & Food 122239 2713697 22.20 0.37
600598 Heilongjiang Agriculture 177768 2010556 11.31 0.22
600600 Tsingtao Brewery 69591 3406497 48.95 0.49
600633 Zhejiang Daily Meida 15205 461778 30.37 0.11
600637 BesTV 83552 3088901 36.97 0.70
600639 Shanghai Jinqiao 65665 772219 11.76 0.09
600643 AJ Trust & Investment 81792 928343 11.35 0.24
600649 Shanghai Chengtou 298752 2488607 8.33 0.35
600663 Lujiazui 135808 2307385 16.99 0.19
600674 Chuantou Energy 198187 2211764 11.16 0.31
600675 China Enterprise 155588 1075115 6.91 0.21
600684 Pearl River Enterprises 47414 342333 7.22 0.07

Stock Market
2014 Fact Book 40
Code Short NameNumber of Tradable Shares (10,000 shares)
Market Cap of Tradable Shares (RMB 10,000)
Closing Price (RMB)
Weight in 180 Index(%)
600690 Qingdao Haier 272084 5305630 19.50 0.89
600702 Tuopai Shede Wine 33730 507299 15.04 0.11
600703 Sanan Optoelectronics 134951 3345431 24.79 0.51
600705 AVIC Capital 74464 1264402 16.98 0.36
600736 Suzhou New District Hi-Tech 105788 427384 4.04 0.07
600739 Liaoning Chengda 136471 2393701 17.54 0.68
600741 Huayu Automotive 258320 2619365 10.14 0.29
600747Dalian Daxian Enterprises Holdings
106433 403380 3.79 0.11
600748Shanghai Industrial Development
108337 817945 7.55 0.09
600759 Zhenghe Industrial 121602 969170 7.97 0.14
600765 AVIC Heavy Machinery 77800 974060 12.52 0.16
600770 Jiangsu Zongyi 108210 910046 8.41 0.18
600773Tibet Urban Development and Investment
53964 514816 9.54 0.06
600795 GD Power 1539503 3617832 2.35 0.57
600804 Dr. Peng 133851 1881949 14.06 0.44
600809Shanxi Xinghuacun Fen Wine Factory
86585 1671087 19.30 0.13
600816 Anxin Trust and Investment 45385 646736 14.25 0.13
600823 Shimao Real Estate 117060 1051195 8.98 0.09
600832 Oriental Pearl 318633 3113049 9.77 0.43
600837 Haitong Securities 809213 9160293 11.32 2.54
600875 Dongfang Electric 166386 2091472 12.57 0.24
600880 B-ray media 41407 703093 16.98 0.20
600886 SDIC Electric Power 678602 2666907 3.93 0.37
600887 Yili Group 158817 6206563 39.08 1.59
600893 Aero-engine 108622 2077946 19.13 0.30
600895 Zhangjiang Hi-tech 154869 1163066 7.51 0.16
600900 Yangtze Power 974594 6159435 6.32 0.87
600970Sinoma International Engineering
109330 907437 8.30 0.10
600999 China Merchants Securities 466110 5910275 12.68 0.82
601006 Daqin Railway 1486679 10986559 7.39 1.22
601009 Bank of Nanjing 296893 2401867 8.09 0.47

Stock Market
2014 Fact Book 41
Code Short NameNumber of Tradable Shares (10,000 shares)
Market Cap of Tradable Shares (RMB 10,000)
Closing Price (RMB)
Weight in 180 Index(%)
601088 China Shenhua 1649104 26088822 15.82 1.47
601099 Pacific Ocean 165364 983919 5.95 0.19
601111 Air China 832927 3290062 3.95 0.19
601117 China National Chemical 493300 3946400 8.00 0.45
601118 Hainan Rubber Industry 98500 731855 7.43 0.24
601166 Industrial Bank 1617962 16406131 10.14 3.19
601168 Western Mining 238300 1284437 5.39 0.29
601169 Bank Of Beijing 747307 5612279 7.51 1.10
601186 China Railway Construction 1001625 4697619 4.69 0.40
601216 Junzheng Energy & Chemical 49836 581088 11.66 0.12
601288 Agricultural Bank of China 28416353 70472555 2.48 1.80
601299 China CNR 1032006 5077468 4.92 0.57
601318 Ping An Insurance 478641 19973687 41.73 5.51
601328 Bank of Communications 3270905 12560276 3.84 1.68
601336 New China Life Insurance 110058 2518129 22.88 0.53
601377 Industrial Securities 207936 1967075 9.46 0.41
601390 China Railway 1709251 4580793 2.68 0.38
601398Industrial and Commercial Bank of China
26377715 94432220 3.58 1.63
601555 Soochow Securities 122138 1050387 8.60 0.29
601588 Beijing North Star 266000 715540 2.69 0.12
601600 Chalco 958052 3257377 3.40 0.27
601601 China Pacific Insurance 620829 11503956 18.53 1.63
601607 Shanghai Pharmaceuticals 192294 2844021 14.79 0.40
601628 China Life 2082353 31506001 15.13 0.63
601633 Great Wall Motor 30424 1252568 41.17 0.47
601668 China State Construction 2985322 9373911 3.14 1.31
601669 Sinohydro 300300 921921 3.07 0.33
601688 Huatai Securities 559767 5015514 8.96 0.70
601699 Lu’an Environmental Energy 230108 2455257 10.67 0.26
601717Zhengzhou Coal Mining Machinery Group
137789 861180 6.25 0.15
601766China South Locomotive & Rolling Stock
1011690 5068565 5.01 0.65
601800China Communications Construction
134974 545293 4.04 0.27
601808 China Oilfield Services 291047 6496165 22.32 0.37

Stock Market
2014 Fact Book 42
Code Short NameNumber of Tradable Shares (10,000 shares)
Market Cap of Tradable Shares (RMB 10,000)
Closing Price (RMB)
Weight in 180 Index(%)
601818 Everbright Bank 3985059 10600257 2.66 1.20
601857 Petrochina 16192208 124841922 7.71 0.76
601888China International Travel Service
88000 3071200 34.90 0.29
601899 Zijin Mining 1580380 3650679 2.31 0.52
601901 Founder Securities 349677 2066592 5.91 0.61
601928 Phoenix Publishing and Media 65900 630004 9.56 0.21
601939 China Construction Bank 959366 3971774 4.14 1.11
601958 Jinduicheng Molybdenum 322660 2339288 7.25 0.20
601988 Bank of China 19552621 51227866 2.62 0.47
601989 China Shipbuilding Industry 1181375 6627516 5.61 0.96
601992 BBMG Corporation 126655 861254 6.80 0.23
601998 Citic Bank 3190516 12347298 3.87 0.32
603000 People’s website 11152 869543 77.97 0.18
603993 China Molybdenum 196842 1277505 6.49 0.04

Stock Market
2014 Fact Book 43
Market Cap and Weight of Constituent Stocks in SSE 380 Index
Code Short NameNumber of Tradable Shares (10,000 shares)
Market Cap ofTradable Shares (RMB 10,000)
Closing Price (RMB)
Weight in380 Index(%)
600004 Guangzhou Baiyun International Airport 115000 799250 6.95 0.24
600005 Wuhan Iron and Steel 1009378 2220632 2.20 0.65
600007 China World Trade Center 100728 1068727 10.61 0.16
600012 Anhui Expressway 116560 459246 3.94 0.10
600017 Rizhao Port 263063 668180 2.54 0.29
600020 Zhongyuan Expressway 224737 498917 2.22 0.15
600021 Shanghai Electric Power 213974 992839 4.64 0.22
600033 Fujian Expressway Development 133975 286706 2.14 0.21
600037 BGCTV 106037 826027 7.79 0.36
600038 Hafei Aviation Industry 33735 927375 27.49 0.36
600039 Sichuan Road & Bridge 54720 330509 6.04 0.20
600054 Huangshan Tourism Development 11762 120678 10.26 0.09
600056 China Medicine and Health Products 44223 964502 21.81 0.30
600059 Guyuelongshan Shaoxing Wine 63486 602479 9.49 0.27
600062China Resources Double-Crane Pharmaceutical
57170 1278884 22.37 0.56
600068 China Gezhouba Group 348746 1381034 3.96 0.61
600070 Zhejiang Furun 18288 146851 8.03 0.09
600073 Shanghai Maling Aquarius 77580 681153 8.78 0.33
600078 Chengxing Phosph-Chemicals 66257 384955 5.81 0.17
600079 Humanwell Healthcare 46135 1307927 28.35 0.80
600082 Hitech Development 62999 306805 4.87 0.18
600088 China Television Media 33142 514367 15.52 0.19
600096 Yuntianhua Group 36419 324131 8.90 0.29
600097 Kaichuang Marine International 11545 146506 12.69 0.09
600098 Guangzhou Development Industry 245340 1319929 5.38 0.32
600101 Mingxing Electric Power 32418 281712 8.69 0.14
600106 Chongqing Road & Bridge 90774 339496 3.74 0.20
600110 China-Kinwa High Technology 115031 700540 6.09 0.51
600112 Changzheng Electricv 50920 652801 12.82 0.32
600113 Zhejiang Dongri 31860 281324 8.83 0.12

Stock Market
2014 Fact Book 44
Code Short NameNumber of Tradable Shares (10,000 shares)
Market Cap ofTradable Shares (RMB 10,000)
Closing Price (RMB)
Weight in380 Index(%)
600114 Nbtm New Materials 10768 160333 14.89 0.14
600116Three Gorges Water Conservancy and Electric Power
26753 276094 10.32 0.14
600120 Zhejiang Orient Holdings 50547 634369 12.55 0.28
600121Zhengzhou Coal Industry & Electric Power
62914 317087 5.04 0.11
600122 Hongtu High Technology 113279 455381 4.02 0.27
600125 China Railway Tielong Container Logistics 130552 742842 5.69 0.38
600131 Minjiang Hydropower 39737 161728 4.07 0.09
600132 Chongqing Beer 48397 783549 16.19 0.34
600135 Lucky Film 34200 273600 8.00 0.14
600138 China CYTS Tours 41535 731847 17.62 0.53
600139 Western Resources 62971 464730 7.38 0.22
600153 Xiamen C & D 223775 1599992 7.15 0.70
600161 Tiantan Biological Products 51547 1095883 21.26 0.40
600167 Luenmei Holding 21100 214587 10.17 0.08
600171 Shanghai Belling 67381 608448 9.03 0.36
600172 Huanghe Whirlwind 49668 328304 6.61 0.18
600175 Meidu Holding 137128 651358 4.75 0.34
600176 China Fiberglass 64109 485304 7.57 0.19
600183 Shengyi Technology 140051 691851 4.94 0.31
600184 North Electro-optic 11765 251773 21.4 0.10
600185 Gree Real Estate 57759 483447 8.37 0.18
600190 Jinzhou Port 133898 507474 3.79 0.15
600193 Prosolar Resources Development 42537 280746 6.60 0.14
600195 China Animal Husbandry Industry 39000 613470 15.73 0.20
600197 Xinjiang Yilite Industry 44100 481131 10.91 0.17
600200 Jiangsu Wuzhong Industrial 52209 594660 11.39 0.52
600201 Jinyu Group 28081 723660 25.77 0.53
600210 Zijiang Enterprise Group 143674 466939 3.25 0.27
600219 Nanshan Aluminum 193415 1007694 5.21 0.44
600227 Guizhou Chitianhua 95039 260408 2.74 0.15
600230 Cangzhou Dahua Group 25933 299009 11.53 0.11
600236 Guiguan Electric Power 112823 353136 3.13 0.21

Stock Market
2014 Fact Book 45
Code Short NameNumber of Tradable Shares (10,000 shares)
Market Cap ofTradable Shares (RMB 10,000)
Closing Price (RMB)
Weight in380 Index(%)
600238 Hainan Yedao 44203 322683 7.30 0.24
600246 Wantong Realestate 121680 355306 2.92 0.13
600248 Yanchang Petroleum 29127 229233 7.87 0.10
600249 Liuzhou Liangmianzhen 45000 248850 5.53 0.14
600251 Guannong Fruit & Antler 36210 546771 15.10 0.24
600257 Dahu Aquaculture 42705 319433 7.48 0.19
600258 Beijing Capital Tourism 23140 333679 14.42 0.10
600260 Kaile Science and Technology 52764 402062 7.62 0.24
600261 Zhejiang Yankon Group 64538 896432 13.89 0.33
600262 North Hauler Joint Stock 6600 94182 14.27 0.07
600268 Guodian Nanjing Automation 63525 322070 5.07 0.12
600269 Ganyue Expressway 233541 681939 2.92 0.25
600270 Sinotrans Air Transportation Development 33084 337130 10.19 0.28
600277 Yili Energy 153329 1159167 7.56 0.23
600278 Orient International Enterprise 41600 469664 11.29 0.13
600280 Nanjing Central Emporium 57417 736083 12.82 0.16
600284Shanghai Pudong Road and Bridge Construction
49824 526640 10.57 0.32
600285 Lingrui Pharmaceutical 30108 289639 9.62 0.20
600287 Jiangsu Guoxin-Sainty Football Club 43680 291780 6.68 0.11
600289 Bright Oceans Inter-Telecom 56738 508371 8.96 0.30
600292 Jiulong Electric Power 33450 866021 25.89 0.40
600295 Eerduosi Resources 61200 544680 8.90 0.15
600298 Angel Yeast 31544 544773 17.27 0.25
600307 Jiu Steel Group Hongxing Iron and Steel 409136 1071936 2.62 0.24
600308 Huatai Paper 116756 330420 2.83 0.17
600310 Guidong Electric Power 27593 306001 11.09 0.11
600312 Pinggao Electric 81897 827156 10.10 0.48
600317 Ying Kou Port 109757 385248 3.51 0.16
600318 Chaodong Cement 24200 241516 9.98 0.10
600321 Guodong Construction 118088 243261 2.06 0.13
600322 Tianjin Reality Development 110570 367092 3.32 0.22
600323 Nanhai Development 48792 516711 10.59 0.32
600327 Wuxi Commercial Mansion Grand Orient 52171 261378 5.01 0.11

Stock Market
2014 Fact Book 46
Code Short NameNumber of Tradable Shares (10,000 shares)
Market Cap ofTradable Shares (RMB 10,000)
Closing Price (RMB)
Weight in380 Index(%)
600329 Zhongxin Pharmaceutical 53343 673193 12.62 0.20
600333 Changchun Gas 46152 371062 8.04 0.16
600335 Sinomach Automobile 27596 358468 12.99 0.16
600337 Markor International Furniture 63268 379608 6.00 0.17
600343 Aerospace Power Hi-Tech 23968 341309 14.24 0.13
600345 Yangtze Communication Industry 19800 264924 13.38 0.12
600350 Shandong Expressway 336380 1019231 3.03 0.21
600351 Yabao Pharmaceutical 63295 394962 6.24 0.25
600353 Xuguang Electronics 25825 172250 6.67 0.08
600363Lianchuang Optoelectronic Science and Technology
42281 324293 7.67 0.20
600367 Redstar Developing 29120 246064 8.45 0.11
600368 Wuzhou Communications 83380 383549 4.60 0.14
600371 WanXiang Doneed 20460 187209 9.15 0.06
600373 Chinese Media 56725 1014234 17.88 0.26
600375 Hualing Xingma Automobile 18748 194981 10.40 0.12
600377 Jiangsu Expressway 379276 2116357 5.58 0.31
600378 Tianyi Science & Technology 29719 307892 10.36 0.13
600380 Joincare Pharmaceutical 154584 745093 4.82 0.22
600382 Guangdong Mingzhu 34175 247083 7.23 0.14
600386 Beijing Bashi Media 40320 329818 8.18 0.12
600387 Zhejiang Haiyue 38571 777591 20.16 0.44
600388 Fujian Longking 42407 1421496 33.52 0.84
600389 Jiangshan Agrochemical & Chemicals 19800 774774 39.13 0.28
600391 Chengfa Aero-Science & Technology 33013 398466 12.07 0.18
600396 Kingsoft 34060 250000 7.34 0.13
600397 Anyuan Coal 64533 274267 4.25 0.12
600403 DaYou Energy 97845 696654 7.12 0.25
600409 Sanyou Chemical Industries 166972 776419 4.65 0.32
600410 Beijing Teamsun Technology 63745 430276 6.75 0.25
600420 Shanghai Modern Pharmaceutical 28773 468718 16.29 0.20
600422 Kunming Pharmaceutical 34057 803407 23.59 0.48
600425Qingsong Bu i ld ing Mater ia l s And Chemicals
137879 529455 3.84 0.19

Stock Market
2014 Fact Book 47
Code Short NameNumber of Tradable Shares (10,000 shares)
Market Cap ofTradable Shares (RMB 10,000)
Closing Price (RMB)
Weight in380 Index(%)
600426 Hualu-Hengsheng Chemical 95363 645604 6.77 0.33
600428 COSCO Shipping 169045 593347 3.51 0.22
600432 Ji En Nickel Industry 81112 626997 7.73 0.23
600433 Guanhao High-tech 110628 1177082 10.64 0.65
600435 China North Optical-Electrical Technology 74466 981462 13.18 0.36
600436 Pientzehuang Pharmaceutical 16088 1517303 94.31 0.56
600438 Tongwei 68752 615330 8.95 0.21
600439 Rebecca Hair Products 94332 473547 5.02 0.24
600446 Kingdom Technology 26261 405725 15.45 0.17
600449 Ningxia Building Materials 25077 195348 7.79 0.16
600458 Times New Material Technology 66142 660761 9.99 0.29
600459 Sino-Platinum Metals 19554 394398 20.17 0.18
600460 Silan Microelectronics 86816 520896 6.00 0.21
600467 Homey Aquatic Development 72002 401769 5.58 0.18
600468 Benefo Tejing Electric 45619 437032 9.58 0.13
600469 Aeolus Tyre 37494 303703 8.10 0.13
600470 Liuguo Chemical 52160 339040 6.50 0.19
600475 Huaguang Boiler 25600 313088 12.23 0.14
600478 Corun New Energy 31482 816652 25.94 0.48
600479 Qianjin Pharmaceutical 30482 383767 12.59 0.19
600480 Lingyun Industrial 36171 253200 7.00 0.13
600481 Shuangliang Eco-Energy Systems 81010 924329 11.41 0.27
600482 Fengfan 46100 472064 10.24 0.24
600486 Yangnong Chemical 17217 602409 34.99 0.27
600487 Hengtong Optic-electric 16612 351012 21.13 0.2
600488 Tianjin Tianyao Pharmaceutical 81434 343649 4.22 0.15
600491 Long Yuan Construction 94760 335450 3.54 0.15
600495 Jinxi Axle 30224 397443 13.15 0.20
600496 Changjiang & Jinggong Steel Building 58657 410596 7.00 0.21
600499 Keda Industrial 64094 1287642 20.09 0.80
600500 Sinochem International 143759 1092568 7.60 0.46
600501 Aerosun 38928 364759 9.37 0.16
600502 Anhui Water Resources Development 50193 417606 8.32 0.31
600507 Fangda Special Steel Technology 131072 481035 3.67 0.14

Stock Market
2014 Fact Book 48
Code Short NameNumber of Tradable Shares (10,000 shares)
Market Cap ofTradable Shares (RMB 10,000)
Closing Price (RMB)
Weight in380 Index(%)
600508 Shanghai Datun Energy Resources 72272 716214 9.91 0.21
600509 Tianfu Thermoelectric 65570 577669 8.81 0.23
600510 Black Peony 79552 484473 6.09 0.14
600511 China National Medicines 27764 523913 18.87 0.38
600513 Lianhuan Pharmaceutical 15210 163051 10.72 0.07
600517 Zhixin Electric 61871 915683 14.80 0.46
600521 Huahai Pharmaceutical 78088 1058090 13.55 0.47
600522 Zhongtian Technology 70450 769319 10.92 0.45
600523Guizhou Guihang Automotive Components
28860 349499 12.11 0.13
600525 Changyuan Group 86351 764206 8.85 0.39
600526Feida Environmental Science & Technology
14000 285740 20.41 0.15
600527 Jiangsu Jiangnan High Polymer Fiber 80209 559858 6.98 0.40
600528 China Railway Erju 145920 747110 5.12 0.27
600531 Yuguang Gold & Lead 29525 273993 9.28 0.11
600536 China National Software and Service 22569 850189 37.67 0.28
600545 Xinjiang Urban Construction 67579 430476 6.37 0.25
600548 Shenzhen Expressway 143327 483012 3.37 0.07
600551 Time Publishing & Media 50583 825001 16.31 0.25
600552 Fangxing Science&Technology 17550 330642 18.84 0.16
600557 Kanion Pharmaceutical 30711 934220 30.42 0.64
600559 Laobaigan Liquor 14000 363580 25.97 0.18
600560 Aritime Intelligent Control 22365 191217 8.55 0.09
600561 Jiangxi Changyun 18572 201511 10.85 0.11
600563 Xiamen Faratronic 22500 510975 22.71 0.19
600565 Chongqing Dima Industry 72000 245520 3.41 0.13
600567 Shanying Paper 149852 316187 2.11 0.23
600568 Zhongzhu Holding 18803 159823 8.5 0.14
600570 Hundsun Technologies 61781 1288742 20.86 0.76
600571 Sunyard System Engineering 20016 317858 15.88 0.15
600572 Conba Pharmaceutical 70096 946992 13.51 0.40
600575 Wuhu Port Storage & Transportation 142320 461117 3.24 0.24
600577 Jingda Special Magnet Wire 70957 273183 3.85 0.14

Stock Market
2014 Fact Book 49
Code Short NameNumber of Tradable Shares (10,000 shares)
Market Cap ofTradable Shares (RMB 10,000)
Closing Price (RMB)
Weight in380 Index(%)
600578 Beijing Jingneng Thermal Power 153477 557123 3.63 0.25
600580 Wolong Electric 68773 428455 6.23 0.25
600581 Bayi Iron & Steel 76645 316543 4.13 0.12
600582 Tiandi Science & Technology 121392 853386 7.03 0.25
600584 Changjiang Electronics Technology 85313 546006 6.40 0.41
600586 Jinjing Science and Technology 96711 305607 3.16 0.23
600587 Shinva Medical Instrument 17405 1216805 69.91 0.70
600589 Guangdong Rongtai Industry 60173 302670 5.03 0.16
600594 Yibai Pharmaceutical 35591 1160979 32.62 0.58
600595 Zhongfu Industry 151487 554444 3.66 0.23
600596 Xinan Chemical Indusyrial 67918 719257 10.59 0.42
600611 Dazhong Transportation 104221 644086 6.18 0.28
600612 Lao Feng Xiang 31711 739500 23.32 0.22
600614 Dingli Share 44676 465970 10.43 0.17
600616 JinFeng Wine 43867 377696 8.61 0.19
600618 Chlor-Alkali Chemical 74984 501643 6.69 0.11
600620 Shanghai Tianchen 45778 412006 9.00 0.23
600622 Shanghai Jiabao Industry and Commerce 51430 317325 6.17 0.18
600623 Double Coin Holdings 64637 620513 9.60 0.04
600624 Fudan Forward Science and Technology 34516 320304 9.28 0.18
600626 Shanghai Shenda 71024 635667 8.95 0.30
600628 Shanghai Shenda 53180 450434 8.47 0.26
600635 Dazhong Public Utilities 164487 901389 5.48 0.52
600636 New Huangpu Real Estate 38195 434660 11.38 0.22
600638 New Huang Pu Real Estate 56116 686865 12.24 0.40
600642 Shenergy 455204 2071177 4.55 0.75
600644 Leshan Electric Power 32648 263469 8.07 0.14
600648Waigaoqiao Free Trade Zone Development
81022 2611350 32.23 0.58
600651 Feilo Acoustics 73907 422006 5.71 0.31
600654 Shanghai Feilo 75504 551182 7.3 0.41
600655 Yuyuan Tourist Mart 143732 1115362 7.76 0.57
600657 Cinda Real Estate 152426 492336 3.23 0.14
600658Electronic Zone Investment and Development
58010 681034 11.74 0.15

Stock Market
2014 Fact Book 50
Code Short NameNumber of Tradable Shares (10,000 shares)
Market Cap ofTradable Shares (RMB 10,000)
Closing Price (RMB)
Weight in380 Index(%)
600660 Fuyao Glass Industry 200299 1660476 8.29 0.85
600662 Qiangsheng Holding 54904 249815 4.55 0.21
600664 Harbin Pharmaceutical 105339 645728 6.13 0.44
600666 Southwest Pharmaceutical 29015 201362 6.94 0.10
600667 Taiji Industry 119127 409798 3.44 0.21
600668 Jianfeng Group 34372 333412 9.7 0.23
600673 Dongyangguang Aluminum 82261 784772 9.54 0.17
600676 Shanghai Jiao Yun 78214 488056 6.24 0.19
600677 Aerospace Communications 32617 376729 11.55 0.25
600682 Nanjing Cenbest 35739 405995 11.36 0.15
600683 Metro Land 74078 325201 4.39 0.12
600685 Guangzhou Shipyard International 43846 741442 16.91 0.27
600686 King Long Motor 44260 386387 8.73 0.20
600687 Gangtai Group 12689 144145 11.36 0.09
600688 Sinopec Shanghai Petrochemical 162000 494100 3.05 0.49
600694 Dashang 29372 848259 28.88 0.62
600697 Chang Chun Eurasia 15516 290607 18.73 0.17
600704Zhejiang Material Industrial Zhongda Yuantong Group
79052 897235 11.35 0.45
600708 Haibo Shares 50838 379253 7.46 0.19
600712 Nanning Department Store 53773 213478 3.97 0.13
600717 Tianjin Port 167477 1431928 8.55 0.52
600718 Neusoft 122759 1506258 12.27 0.77
600720 Qilianshan Cement 77616 519253 6.69 0.30
600723 Beijing Capital Retailing 31788 207255 6.52 0.16
600724 Ningbo Fuda 144494 605431 4.19 0.13
600729 Chongqing Department Store 20305 442239 21.78 0.26
600742 FAWAY Automobile Components 21152 378838 17.91 0.22
600743 Huayuan Property 181766 463504 2.55 0.10
600750 Jiangzhong Pharmaceutical 31115 493484 15.86 0.22
600754 Jinjiang International Hotels Development 44724 716480 16.02 0.21
600755 Xiamen ITG Group 133084 722644 5.43 0.37
600756 Shandong Inspur software 27875 366274 13.14 0.22
600761 Anhui Heli 51401 621443 12.09 0.32

Stock Market
2014 Fact Book 51
Code Short NameNumber of Tradable Shares (10,000 shares)
Market Cap ofTradable Shares (RMB 10,000)
Closing Price (RMB)
Weight in380 Index(%)
600776 Eastern Communications 95600 588896 6.16 0.18
600778 Xinjiang Youhao 30939 286805 9.27 0.15
600780 Top Energy Company 87294 446946 5.12 0.17
600783 Luxin Venture Capital 74436 1526681 20.51 0.34
600784 Luyin Investment 49661 271648 5.47 0.20
600785 Yinchuan Xinhua Commercial 20743 244561 11.79 0.13
600787 CMST Development 84010 863626 10.28 0.35
600790 Light & Textile Industrial City 61878 392304 6.34 0.22
600794 Freetrade Science & Technology 42783 325580 7.61 0.13
600801 Huaxin Cement 55621 675241 12.14 0.27
600805 Yueda Investment 84920 931575 10.97 0.55
600811 Orient Group 166681 1048421 6.29 0.61
600815 Xiamen XGMA Machinery 93971 373065 3.97 0.17
600820 Shanghai Tunnel Engineering 88574 803363 9.07 0.35
600824 Yimin Group 87836 487488 5.55 0.25
600825 Shanghai Xinhua Media 104489 929950 8.90 0.34
600826 Shanghai Lansheng 42064 646107 15.36 0.23
600827 Shanghai Friendship Group 124038 1224258 9.87 0.55
600828 Chengshang Group 56898 302130 5.31 0.09
600829 Sanjing Pharmaceutical 57989 384466 6.63 0.08
600830 Sunny Loan Top 45432 438421 9.65 0.23
600831Shaanxi Broadcast & Tv Network Intermediary
56344 420325 7.46 0.22
600833 Shanghai No.1 Pharmacy 22309 190293 8.53 0.08
600835Shanghai Mechanical & Electrical Industry
80650 1423480 17.65 0.42
600839 Changhong 461000 1401439 3.04 0.83
600845 Shanghai Baosight Software 22652 566293 25.00 0.08
600846 Tongji Science & Technology Industrial 62476 355489 5.69 0.21
600850 East China Computer 17103 358140 20.94 0.14
600858 Silver Plaza Group 51755 391266 7.56 0.20
600859 Wangfujing Department Store 41764 758438 18.16 0.31
600863Inner Mongolia MengDian HuaNeng Thermal Power
175940 599956 3.41 0.48
600864 Harbin Hatou Investment 54638 542007 9.92 0.24

Stock Market
2014 Fact Book 52
Code Short NameNumber of Tradable Shares (10,000 shares)
Market Cap ofTradable Shares (RMB 10,000)
Closing Price (RMB)
Weight in380 Index(%)
600867 Tonghua Dongbao Pharmaceutical 93146 1426058 15.31 0.72
600869 Far East Cable 99004 707881 7.15 0.16
600872Jonjee Hi-tech Industrial and Commercial Holding
79664 905776 11.37 0.65
600873 Meihua Holdings Group 160755 1003110 6.24 0.42
600874Tianjin Capital Environmental Protection Group
108723 888266 8.17 0.26
600879 Aerospace Times Electronics 103954 973007 9.36 0.58
600881 Jilin Yatai 189473 742735 3.92 0.54
600882 Hualian Mining 28210 232449 8.24 0.12
600884 Ningbo Shanshan 41086 506177 12.32 0.26
600888 Xinjiang Joinworld 62742 371435 5.92 0.17
600897 Xiamen International Airport 29781 444630 14.93 0.14
600963 Yueyang Forest&Paper 84316 272340 3.23 0.17
600967 Beifang Chuangye 42946 740819 17.25 0.35
600971 Hengyuan Coal-Electricity 100000 713003 7.13 0.26
600975 New Wellful 23436 142960 6.10 0.07
600976 Wuhan Jianmin Pharmaceutical 15330 366997 23.94 0.21
600978 Yihua Timber Industry 114483 655989 5.73 0.39
600979 Guangan Aaa Public 59289 292296 4.93 0.13
600983 Hefei Rongshida Sanyo Electric 53280 800798 15.03 0.24
600987 Hangmin Stock 63531 358950 5.65 0.13
600990 Sun-Create Electronics 11760 331867 28.22 0.14
600993 MaYingLong Pharmaceutical Group 33088 573079 17.32 0.25
600995 Yunnan Wenshan Electric Power 47853 243091 5.08 0.14
600997 Kailuan Energy Chemical 123464 687694 5.57 0.25
600998 Jointown Pharmaceutical Group 142052 2129353 14.99 0.47
601000 Tangshan Port 203035 621288 3.06 0.18
601001 Datong Coal 167370 967399 5.78 0.28
601010 Wenfeng Great World 18420 125809 6.83 0.11
601011 Baotailong Coal and Coal Chemicals 12461 124856 10.02 0.11
601018 Ningbo Port 1280000 3123200 2.44 0.68
601038 YTO Group 15000 141000 9.40 0.13
601058 Sailun 19562 274260 14.02 0.23

Stock Market
2014 Fact Book 53
Code Short NameNumber of Tradable Shares (10,000 shares)
Market Cap ofTradable Shares (RMB 10,000)
Closing Price (RMB)
Weight in380 Index(%)
601098 China South Publishing & Media Group 179600 1973804 10.99 0.43
601100 Hengli Highpressure Oil Cylinder 15750 190418 12.09 0.17
601101 Haohua Energy Resource 120000 865199 7.21 0.25
601106 China First Heavy Industries 653800 1366442 2.09 0.40
601107 Sichuan Expressway 216274 618544 2.86 0.14
601113 Huading Nylon 30400 124336 4.09 0.06
601126 Sifang Automation 40484 779323 19.25 0.17
601137 Ningbo Powerway Alloy Material 9500 142405 14.99 0.07
601139 Shenzhen Gas 190458 1506522 7.91 0.23
601158 Chongqing Water Group 480000 2827200 5.89 0.41
601179 China XD Electric 435700 1424739 3.27 0.36
601208 EM Technology 31707 220366 6.95 0.13
601222 Linyang Electronics 11975 248729 20.77 0.22
601231 Universal Scientific Industrial 10680 224814 21.05 0.31
601233 Tongkun Group 52576 315983 6.01 0.13
601238 Guangzhou Automobile Group 60432 497957 8.24 0.52
601258 Pangda Automobile Trade 71344 357433 5.01 0.29
601311 Camel Group 30185 329017 10.9 0.27
601313 SJEC Elevators & Escalators 28191 230036 8.16 0.12
601333 Guangshen Railway 565224 1576974 2.79 0.69
601369 Shaangu Power 163877 1089782 6.65 0.32
601388 Ye Chiu Group 17119 157319 9.19 0.11
601515 Dongfeng Motor 8465 218482 25.81 0.21
601518 Jilin Expressway 121320 270544 2.23 0.08
601566 Joeone 12464 158663 12.73 0.16
601567 Sanxing Electric 13428 131192 9.77 0.09
601608 CITIC Heavy Industries 75268 253654 3.37 0.20
601618 Metallurgical Corp. of China 1623900 2841825 1.75 0.63
601636 Kibing Group 17050 135889 7.97 0.12
601666 Pingdingshan Tianan Coal 236117 1241973 5.26 0.45
601678 Befar Group 66000 510180 7.73 0.19
601700 Fengfan Power Equipment 16380 211793 12.93 0.17
601718 Jihua Group 385700 1068389 2.77 0.32
601727 Shanghai Electric Group 985071 3644764 3.70 0.54

Stock Market
2014 Fact Book 54
Code Short NameNumber of Tradable Shares (10,000 shares)
Market Cap ofTradable Shares (RMB 10,000)
Closing Price (RMB)
Weight in380 Index(%)
601777 Lifan Industry 95145 609876 6.41 0.14
601789 Ningbo Construction 11198 92831 8.29 0.09
601801 Anhui Xinhua Media 91000 1134770 12.47 0.17
601872 China Merchants Energy Shipping 377674 913970 2.42 0.33
601877 Chint Electrics 100802 2507949 24.88 0.53
601880 Dalian Port 336340 894664 2.66 0.19
601886 Jangho Curtain Wall 52067 408204 7.84 0.19
601890 Asian Star Anchor Chain 46800 316836 6.77 0.14
601898 China Coal Energy 900698 4296328 4.77 0.64
601908 Beijing Jingyuntong Technology 20752 170166 8.20 0.15
601918 Sdic Xinji Energy 259054 1031036 3.98 0.30
601929 Jishi Media 86622 726758 8.39 0.53
601933 Yonghui Superstores 153580 2041078 13.29 0.64
601965 China Automotive Engineering Research 19200 257280 13.40 0.19
601991 Datang International Power Generation 989436 4195209 4.24 0.93
601996 Fenglin Group 19619 142241 7.25 0.12
603001 Zhejiang Aokang Shoes 11695 173786 14.86 0.13
603077 Sichuan Hebang 15000 210000 14.00 0.18
603128 CTS International Logistics 16000 174720 10.92 0.10
603167 Bohai Ferry 30452 254271 8.35 0.09
603366 Solareast Corporation 14140 200364 14.17 0.17
603399 New China Dragon Electronic 8947 100743 11.26 0.08
603766 Loncin Industries 39262 369459 9.41 0.17

Stock Market
2014 Fact Book 55
0
500
1000
1500
2000
2500
1-4
1-252
-22
3-154
-95-3
5-24
6-19
7-10
7-31
8-21
9-11
10-11
11-1
11-22
12-1
3
0500
1000
1500
2000
2500
3000
Tren
ds o
f SSE
Com
posi
te In
dex
in 2
013
Turnover Value (RMB 100 million)
Closing Index
Turn
over
Val
ue
(RM
B 1
00 m
illio
n)SS
E C
ompo
site
Clo
sing
Inde
x

Stock Market
2014 Fact Book 56
His
toric
al T
rend
s of
SSE
Com
posi
te In
dex
0
2000
4000
6000
8000
10000
12000
14000
16000
1990
-12-
21
1991
-7-1
9
1992
-2-1
4
1992
-9-1
119
93-4
-9
1993
-11-
5
1994
-6-1
019
95-1
-6
1995
-8-1
1
1996
-3-2
2
1996
-10-
18
1997
-5-3
0
1997
-12-
2619
98-8
-7
1999
-3-1
9
1999
-10-
1520
00-6
-220
01-1
-5
2001
-8-1
720
02-4
-5
2002
-11-
8
2003
-6-2
0
2004
-1-1
6
2004
-8-2
720
05-4
-1
2005
-11-
11
2006
-6-2
3
2007
-1-2
6
2007
-8-3
120
08-4
-3
2008
-11-
7
2009
-6-1
220
10-1
-8
2010
-8-1
3
2011
-3-1
1
2011
-10-
14
2012
-5-1
8
2012
-12-
21
2013
-7-2
6
01000
2000
3000
4000
5000
6000
7000
Turnover Value (RMB 100 million)
Closing Index
Wee
kly
Tu
rno
ver
Val
ue
(RM
B 1
00
mil
lio
n)
SS
E C
om
po
site
Clo
sin
g I
nd
ex

Stock Market
2014 Fact Book 57
0
100
200
300
400
500
600
700
1-4
1-25
2-22
3-15
4-9
5-3
5-24
6-19
7-10
7-31
8-21
9-11
10-1
111
-111
-22
12-1
3
0500
1000
1500
2000
2500
Turnover Value (RMB 100 million)
Closing Index
Tren
ds o
f SSE
50
Inde
x in
201
3Tu
rnov
er V
alue
(R
MB
100
mill
ion)
SSE
50 C
losi
ng In
dex

Stock Market
2014 Fact Book 58
0
500
1000
1500
2000
2500
3000
3500
4000
4500
2004
-1-2
2004
-3-1
9
2004
-6-4
2004
-8-1
3
2004
-10-
22
2004
-12-
31
2005
-3-1
8
2005
-6-3
2005
-8-1
2
2005
-10-
2820
06-1
-6
2006
-3-2
4
2006
-6-9
2006
-8-1
8
2006
-11-
3
2007
-1-1
2
2007
-3-3
0
2007
-6-8
2007
-8-1
7
2007
-11-
2
2008
-1-1
1
2008
-3-2
1
2008
-5-3
0
2008
-8-8
2008
-10-
24
2008
-12-
31
2009
-3-2
0
2009
-5-2
7
2009
-8-7
2009
-10-
16
2009
-12-
25
2010
-3-1
2
2010
-5-2
1
2010
-7-3
0
2010
-10-
8
2010
-12-
17
2011
-2-2
5
2011
-5-6
2011
-7-1
5
2011
-9-2
3
2011
-12-
9
2012
-2-2
420
12-5
-4
2012
-7-1
3
2012
-9-2
1
2012
-12-
7
2013
-2-2
220
13-5
-3
2013
-7-1
2
2013
-9-1
8
2013
-11-
29
0500
1000
1500
2000
2500
3000
3500
4000
4500
5000
Turnover Value (RMB 100 million)
Closing Index
His
toric
al T
rend
s of
SSE
50
Inde
xW
eek
ly T
urn
ov
er V
alu
e
(RM
B 1
00
mil
lio
n)
SS
E 5
0 C
losi
ng
In
dex

Stock Market
2014 Fact Book 59
0
200
400
600
800
1000
1200
1-4
1-25
2-223
-15
4-9
5-35
-24
6-197
-107
-31
8-21
9-11
10-11
11-1
11-22
12-1
3
01000
2000
3000
4000
5000
6000
7000
Turnover Value (RMB 100 million)
Closing Index
Tren
ds o
f SSE
180
Inde
x in
201
3Tu
rnov
er V
alue
(R
MB
100
mill
ion)
SSE
180
Clo
sing
Inde
x
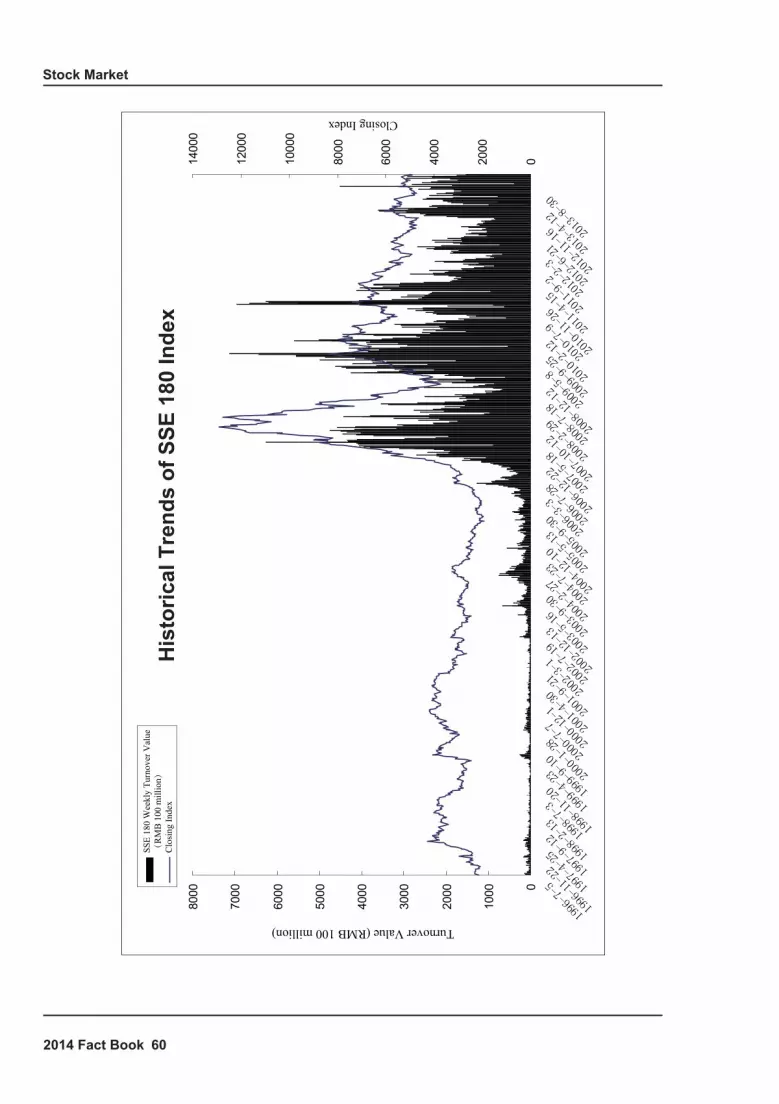
Stock Market
2014 Fact Book 60

Stock Market
2014 Fact Book 61
0
100
200
300
400
500
600
700
1-4
1-25
2-22
3-15
4-9
5-3
5-24
6-19
7-10
7-31
8-21
9-11
10-11
11-1
11-22
12-1
3
0500
1000
1500
2000
2500
3000
3500
4000
Turnover Value (RMB 100 million)
Closing Index
Tren
ds o
f SSE
380
Inde
x in
201
3Tu
rnov
er V
alue
(R
MB
100
mill
ion)
SSE
380
Clo
sing
Inde
x

Stock Market
2014 Fact Book 62
0
500
1000
1500
2000
2500
3000
3500
2011
-1-7
2011
-1-2
8
2011
-2-1
8
2011
-3-1
1
2011
-4-1
2011
-4-2
2
2011
-5-1
3
2011
-6-3
2011
-6-2
4
2011
-7-1
520
11-8
-5
2011
-8-2
6
2011
-9-1
6
2011
-10-
14
2011
-11-
4
2011
-11-
25
2011
-12-
16
2012
-1-6
2012
-2-3
2012
-2-2
4
2012
-3-1
6
2012
-4-6
2012
-4-2
7
2012
-5-1
8
2012
-6-8
2012
-6-2
9
2012
-7-2
0
2012
-8-1
0
2012
-8-3
1
2012
-9-2
1
2012
-10-
19
2012
-11-
9
2012
-11-
30
2012
-12-
21
2013
-1-1
1
2013
-2-1
2013
-3-1
2013
-3-2
2
2013
-4-1
2
2013
-5-3
2013
-5-2
4
2013
-6-1
420
13-7
-5
2013
-7-2
6
2013
-8-1
6
2013
-9-6
2013
-9-2
7
2013
-10-
18
2013
-11-
8
2013
-11-
29
2013
-12-
20
0500
1000
1500
2000
2500
3000
3500
4000
4500
5000
Turnover Value (RMB 100 million)
Closing Index
His
toric
al T
rend
s of
SSE
380
Inde
xW
eekl
y Tu
rnov
er V
alue
(R
MB
100
mill
ion)
SSE
380
Clo
sing
Inde
x

Listed Companies


Listed Companies
2014 Fact Book 65
Listed Companies
Issuance Conditions for IPOs
I. Entity Qualifications
1. The issuer shall be a joint-stock limited company established by law and legally existing by law.
When a limited liability company is lawfully converted into a joint-stock limited company pursuant to State Council
approval, it may issue shares to the public by way of a public share offer.
2. Unless otherwise approved by the State Council, the issuer shalloperate the joint-stock limited company for a
continuous period of three years or more after its establishment.
Where a limited liability company is wholly converted into a joint-stock limited company according to the original book
value of its net assets, the continuous operating period shall be calculated from the date the limited liability company is
established.
3. The registered capital of the issuer shall have been paid up in full, procedures for transferring the property right
attached to assets used as capital contributions by the promoter or shareholders shall have been completed, and there
shall beno material dispute over ownership of the issuer's major assets.
4. The business operations of the issuer shall comply with laws and administrative regulations, its articles of association,
and the state's industrial policies.
5. There shall have been no significant change in the issuer’s principal operations, directors and senior managementand
no change in its actual controller in the last three years.
6. The issuer’s equity structure shall be clear and there shall be no major dispute over the ownership of shares held by
the controlling shareholder, controlled shareholders and shareholders controlled by the actual controller.
II. Independence
1. The issuer shall have a complete business structure and the ability to deal directly with the market and operate
independently.
2. The issuer shall maintain theintegrity of its assets. Production-oriented enterprises shall have production systems,
auxiliary production systems and supporting facilities related to their business operations, legally hold the ownership or
use rights for land, plant, machinery, and equipment, as well as trademarks, patents, and non-patent technologies related
to their business operations, and shall have an independent system forpurchasing raw materials and selling products;
non-production-oriented enterprises shall have a business structure and relevant assets related to their business
operations.

Listed Companies
2014 Fact Book 66
3. The issuer shall maintain the independence of its personnel. The issuer’s general manager, deputy managers, financial
controller, secretary to the board of directors and other senior officers shall not serve its controlling shareholder, actual
controller or other enterprises under their control in a capacity other than director or supervisor, nor draw a salary from
said controlling shareholder, actual controller or other enterprises under their control; the issuer’s financial staff shall not
serve its controlling shareholder, actual controller or other enterprises under their control in any capacity.
4. The issuer shall maintain its financial independence. The issuer shall establish an independent financial accounting
system, be able to make financial decisions independently, and have appropriate financial and accounting systems and a
system for the financial management of its branches and subsidiaries; the issuer shall not use a common bank account
with its controlling shareholder, actual controller or any other enterprise under their control.
5. The issuer shall maintain the independence of its organizational structure. The issuer shall establish sound internal
business management departments to independently exercise business management authority, and shall not combine its
departments with those of its controlling shareholder, actual controller or any other enterprise under their control.
6. The issuer shall maintain the independence of its business. The issuer shall maintain its business independent of its
controlling shareholder, actual controller or any other enterprise under their control, and shall not compete horizontally
withor engage in any apparently unfair transaction its controlling shareholder, actual controller or any other enterprise
under their control.
7. The issuer shall not suffer from any other major defect in its independence.
III. Regular Operations
1. The issuer shall havelawfully established sound systems for general meetings, the board of directors, the board
of supervisors, independent directors and the secretary to the board of directors so that relevant departments and
personnel can perform their duties pursuant to the law.
2. The issuer’s directors, supervisors and senior officers shall understand laws and regulations related to the issuance
and listing of sharesand shall be aware of the statutory responsibilities and obligations of a listed company and its
directors, supervisors and senior officers.
3. The issuer’s directors, supervisors and senior officers shall have qualifications that conform to the law, regulations and
rules, and shall not be subject to any of the following circumstances:
(1) Banned from access to the securities market by the China Securities Regulatory Commission (CSRC), such ban not
having been lifted;
(2) Subject to an administrative penalty imposed by CSRC within the last 36 months or has publicly censured by the
Stock Exchange within the last 12 months; or
(3) Investigated by the judicial authorities because of a suspected criminal offence or investigated by CSRC as a result of
a suspected legal or regulatory violation, where no definitive and conclusive opinion has been issued;
4. The issuer’s system of internal controls shall be sound, have been implemented effectively, and reasonably becapable
of ensuring the reliability of its financial reports, the legitimacy of its business activities, and the efficiency and effects of

Listed Companies
2014 Fact Book 67
its operations.
5. The issuer shall not be subject to any of the following circumstances:
(1) Where it has issued securities to the public or in a disguised manner without the approval of the statutory authority
within the last 36 months; or relevant legal violations that occurred 36 months ago are nevertheless ongoing;
(2) Where it has been subject to administrative penalties within the last 36 months as a result of any violation of laws
and regulations related to, among other matters, industry and commerce, taxation, land, environmental protection, and
customs, and the circumstances are serious;
(3) Where it has submitted an application to CSRC within the last 36 months, but the application documents submitted
included any false records, misleading statements, or material omissions; or it has obtained issuance approval by
deceptive means while not meeting the issuance conditions; or it has interfered with the examination and verification
work of CSRC or its issuance examination and verification committee by improper means; or it has forged or altered the
signature or seal of the issuer or the issuer's directors, supervisors or senior officers;
(4) Where the issuance application documents it submits on this occasion include any false records, misleading
statements, or material omissions;
(5) Where it has been investigated by the judicial authorities because of a suspected criminal offence and no definite and
conclusive opinion has been issued; or
(6) Any other circumstances in which investors’ lawful rights and interests and the public interest are seriously damaged.
6. The issuer’s articles of association shallspecify the limits of authority for the examination and approval of external
guarantees and deliberation procedures for external guarantees, and no guarantee shall be improperly provided for its
controlling shareholder, actual controller or any other enterprise under their control.
7. The issuer shall have a strict fund management system and shall not have funds used by its controlling shareholder,
actual controller or any other enterprise under their control in the name of borrowings, debt repayments, advance
payments or any other means.
IV. Finance & Accounting
1. The issuer shall have good quality assets, a reasonable asset-liability structure, strong profitability, and normal cash
flows.
2. The issuer’s internal controls shall be effective in all material respects and the issuer shall have obtained an unqualified
internal control certification report issued by a certified public accountant (CPA).
3. The issuer’sbasic accounting work and the preparation of its financial statements shall comply with the Accounting
Standards for Business Enterprises and the Accounting Systems for Business Enterprises,and shall fairly reflect in all
material respects its financial position, the results of operations and cash flows, and the issuershall have obtained an
unqualified audit report issued by a CPA.
4. The issuer shall prepare financial statements on the basis of transactions or events which have actually occurred;
whenconfirming, measuring or submitting accounting records, it shall exercisedueprudence; for the same or similar
businesses, it shall select the same accounting policy and shall not change it randomly.

Listed Companies
2014 Fact Book 68
5. The issuer shall fully disclose relationships with associated parties and appropriately disclose associated relationships
based on the principle of importance. The pricing of associated transactions shall be fair and profits shall not be
manipulated through associated transactions.
6. The issuer shall meet the following conditions:
(1) Its net profit has been positive for the last three financial years, with the aggregate amount exceeding RMB 30
million, and net profits shall have been calculated as the lower of the amounts before and after deducting non-recurring
losses and profits;
(2) Its cumulative net cash flows from business activities for the last three financial years exceed RMB 50 million; or
cumulative business income for the last three years exceeds RMB 300 million;
(3) Its total stock capital before issuance is no less than RMB 30 million;
(4) Its intangible assets (excluding land use rights, marine cultivation rights and mining rights, etc.) do not exceed 20% of
net assets at the end of the latest period; and
(5) No loss has not been made up for in the latest period.
7. The issuer shall pay tax in accordance with the law and enjoy various tax concessions in accordance with the
provisions of relevant laws and regulations. The issuer’s business results shall not be heavily reliant on tax concessions.
8. The issuer shall not be subject to any major debt repayment risk or major contingent event such as a guarantee,
lawsuit or arbitration proceedings whichwill adversely affect its continuing operations.
9. The application documents the issuer submits shall not involve any of the following circumstances:
(1) Deliberately omitting or fabricating transactions, events or other important information;
(2) Misusing accounting policies or accounting estimates; or
(3) Manipulating, forging or tampering with accounting records or relevant vouchers on which financial statements are
based.
10. The issuer shall not be subject to any of the following circumstances which adversely affect its ongoing profitability:
(1) Wherethere have been or will be significant changes in the issuer’s business model and the variety and structure of
its products or services which will have a material adverse impact on the ongoingprofitability of the issuer;
(2) Where there have been or will be significant changesin the issuer’s position in the industry in which it operates or the
business environment of such industry which will have a material adverse impact on the ongoingprofitability of the issuer;
(3) Where the issuer’s business income or net profit for the latest financial year was heavily reliant on any associated
party or client for whicha materialdegree of uncertainty exists;
(4) Where the issuer’s net profit for the latest financial year was mainly derived from investment income outside the
scope of the consolidated financial statements;
(5) Where there is any risk of a material adverse change in the acquisition or use of major assets or technologies used
by the issuer such as trademarks, patents, proprietary techniques and franchise rights; or
(6) Any other circumstances likely to have a material adverse impact on the ongoingprofitability of the issuer.
V. Use of funds raised
1. The funds raised shall be used for clear purposes and shall in principle be used in the issuer’s main business.
Listed Companies
2014 Fact Book 69
Other than for financial enterprises,the funds raised shall not be used as held-for-trading financial assets or available-for-
sale financial assets, or for lending to others, third party managed investments or other financial investments, and shall
not be directly or indirectly invested in companies mainly engaged in the trading of securities.
2. The amount of funds raised and investment projects shall be commensurate with the issuer's current scale of
business operations, financial position, technical standards and management competence, etc.
3. Investment projects for which the funds raised are used shall comply with the state's industrial policies and with laws,
regulations and rules governing, among othermatters, investment management, environmental protection, and land
management.
4. The issuer’s board of directors shall carry out a detailed study on the feasibility of projects for which the funds raised
are to be used to ensure that such projects have good prospects and will be profitable, as well as to effectively guard
against investment risk and increase the efficiency with which the funds raised are utilized.
5. Projects for which the funds raised are used shall not, when implemented, result in horizontal competition or have any
adverse impact on the independence of the issuer.
6. The issuer shall establish a special reserve regime for the funds raised, which shall be deposited in a special
accountdetermined by the board of directors.
Listing Conditions for IPOs
If the issuer applies to list its shares on SSE after making an IPO, it shall meet the following conditions:
1. Its shares have been issued to the public pursuant to CSRC approval;
2. Its total capital stock is no less than RMB 50million;
3. Its publicly issued shares account for no less than 25% of its total shares; where its total capital stock is more than
RMB 400million, its publicly issued shares shall account for no less than 10% of its total shares;
4. It has no record of major legal violations within the last three years and its financial and accounting reports do not
contain any false records; and
5. Other conditions required by SSE.
SSE Guide to Securities Listing Procedures
The term “securities” refers to stock, corporate bonds, or convertible corporate bonds (hereinafter referred to as
convertible bonds) and other negotiable securities.
1. After the securities issuance application has been approved by CSRC issuance examination and verification

Listed Companies
2014 Fact Book 70
committee, the issuer and its sponsor and managing underwriter shall promptly contact the issuance and listing
department or the bond funding department of SSE to apply for a securities code and a securities trading abbreviation
and communicate over matters relating tosecurities issuance and a listing application.
2. After obtaining approval documents from CSRC for the securities issuance application, the issuer and its managing
underwriter shall promptly contact SSE to submit an issuance program and an issuance plan.
3. If the issuer gains approval documents from CSRC for the securities issuance application, SSE shall give priority to the
application that is submitted to SSE earlier. However, if the issuance plan is different from the agreed one, the issuer and
its managing underwriter shall consult with SSE and identify another listing date upon the approval of SSE.
If multiple issuers, after obtaining approval documents from CSRC for the securities issuance application, submit their
applications to SSE at the same time while cannot issue their stocks on the same day due to the market or technology
limits, SSE shall make arrangements for their issuances in the time order of their approval documents they gained from
CSRC. However, SSE shall give priority to the issuer whose prospectus and the latest accountingreports will expire and
meanwhile who applies to SSE late due to objective reasons.
SSE shall, according to the market condition, adjust the listing date after consulting with the issuer and the managing
underwriter.
4. If the issuer issues securities to the public and applies to list them on the trading market of SSE, it shall disclose its
issue announcement, the full text of its prospectus (letter of intention to offer shares, offering prospectus), inspection
documents and appendices thereto (hereinafter referred to as the“relevant documents”) on SSE website (www.sse.com.cn) and
be responsible for their content.
5. The issuer and its managing underwriter shall, before 15:30 (14:00 in the case of a corporate bond issue) on the
working day immediately before the day on which they intend to disclose the issue announcement, the full text of the
prospectus (letter of intention to offer shares, offering prospectus) and the relevant documents, and submit the following
materials to SSE:
(1) CSRC documents approving the public issuance of securities;
(2) The issuer’s application to issue securities through SSE system;
(3) The issue announcement and the full text of the prospectus (letter of intention to offer shares, offering prospectus)
and the relevant documents;
(4) The issuer and its managing underwriter’s letter of confirmation guaranteeing consistency between the electronic
and written versions of the issue announcement, the full text of the prospectus (letter of intention to offer shares, offering
prospectus) and the relevant documents, and assuming full responsibility for the same; and
(5) Other documents required by SSE.
6. During the securities issuance period, the issuer and its managing underwriter shall, before15:30 (14:00 in the case
of a corporate bond issue) on the same day, submit to SSE all announcements to be disclosed on the following day,
contact the designated disclosure mediaoutlets to confirm the release of such announcements, and shall be responsible
for the contents.

Listed Companies
2014 Fact Book 71
7. Where special circumstances prevent such announcements from being submitted before 15:30 (14:00 in the case
of a corporate bond issue), an application must be submitted to SSE half an hour before the deadline.
8. The issuer and its managing underwriter shall ensure the accuracy and completeness of issuance data included
in relevant materials submitted to SSE. Issuance data include the issue price, the number of shares to be issued, the
time of issuance, the subscription code, the placement ratio, the trading unit of the managing underwriter, the securities
account number of the managing underwriter, and other relevant data.
9. Unless otherwise approved by SSE, for IPOs, public issues of additional shares, or public issues of convertible bonds,
the online issuance period shall not exceed one trading day, the offline issuance period shall not exceed two trading
days, and the rights issuance period shall not exceed five trading days.
During the online issuance period for an IPO, public issues of additional shares, or public issues of convertible bonds, the
managing underwriter may, after the market close on T date (the online issuance date), apply to SSE to inquire about the
preliminary results of subscriptions for shares issued online. Where shares and convertible bonds of a listed company
are placed with existing shareholders, its managing underwriter may, after the market close on the first day immediately
following T date, independently inquire about the number of shares validly placed with existing shareholders through its
securities account.
For IPOs, the issuer and the managing underwriter may, after the market close on T+1 date, apply to SSE to inquire
about the subscription data of shares validly purchased and the table of success rate.
For public issues of additional shares or convertible bonds, the issuer and the managing underwriter may, after the
market close on T+2 date, apply to SSE to inquire about the subscription data of validly purchased and the table of
success rate.
10. Unless otherwise approved by SSE, for corporate bonds, the online issuance period shall not exceed one trading
day,and the offline issuance period shall not exceed five trading days. The deadline for offline issuance shall be at least
two trading days later than the online issuance deadline.
During the online issuance period for corporate bonds, SSE will, through its existing A-share real-time transaction data
interface, submit transaction data for the online issuance of corporate bonds to the Shanghai branch of China Securities
Depository and Clearing Corporation Limited. The Shanghai branch of China Securities Depository and Clearing
Corporation Limited shall conduct clearing operations at the end of each trading day. Registration results for valid
subscriptions may be checked at the end of the next trading day or on the second trading day for such subscriptions.
The securities code for registration data shall be the securities code for the corporate bonds issued online on this
occasion.
Before 10:30 on the trading day immediately after the offline issuance deadline, the managing underwriter shall submit
sales registration data to the bond funding department of SSE.
11. When making an IPO, the managing underwriter shall, before 11:00 on the first day immediately after T date, submit
tables for online and offline placements for which capital verification has not been undertaken to SSE as required; when

Listed Companies
2014 Fact Book 72
issuing additional shares and convertible bonds to the public, it shall, before 16:00 on the first day immediately after T
date, submit tables for online and offline placements for which capital verification has not been undertaken to SSE as
required.
Where the capital verification process indicates no abnormalities, the managing underwriter shall not adjust the online
and offline placement tables submitted; where any abnormality arises in the course of capital verification, the managing
underwriter may, according to the capital verification circumstances, adjust the online and offline placement tables
submitted, and shall immediately take action to coordinate and deal with any such abnormality and promptly report the
results to SSE.
Where the managing underwriter adjusts the online and offline placement tables when making an IPO, it shall, before
17:00 on the first day immediately after T date, submit the adjusted online and offline placement tables to SSE as
required;where the managing underwriter adjusts online and offline placement tables when issuing additional shares or
convertible bonds to the public, it shall, before 11:00 on the second day immediately after T date, submit the adjusted
online and offline placement tables to SSE as required.
12. When underwriting securities, the managing underwriter shall fully disclose the subscription time and subscription
procedures to price inquiry agencies and other investors. Price inquiry agencies and other investors shall not increase,
reduce or modify quotation or subscription data beyond the subscription time and subscription procedures specified
or announced, and the issuer and the managing underwriter shall not assist price inquiry agencies and other investors
in increasing, reducing or modifying quotation or subscription data beyond the subscription time and subscription
procedures specified or announced.
13. Aftera securities issue is completed, the issuer and its sponsor and managing underwriter shall, in accordance with
the requirements of the Share Listing Rules and the Corporate Bonds Rules of the Shanghai Stock Exchange, promptly
prepare and submit securities listing application documents.
14. The issuer, the sponsor and the managing underwriter shall ensure the accuracy and completeness of securities
listing data included in the listing application materials submitted to SSE. Securities listing data include the issue price (or
the opening reference price on the first listing day), the number of shares to be listed, the time of listing, the securities
code, the capital stock structure, and other relevant data.
15. Listing application documents for an IPO, a public issue of additional shares,a rights issue or a public issue of
convertible corporate bondsshall be submitted to SSE before 15:30 on the fifth day before L date.
Listing application documents for corporate bonds in existence after separately traded convertible corporate bonds
are split and listing application documents for warrants in existence after such a split shall be submitted to the listing
department of SSE as required before 15:30 on the fifth day before L date. Listing application documents for warrants
in existence after the split shall also be submitted to the management department of SSE for the record.
16. The listing committee of SSE shall examine matters relating to the initial listing of shares and corporate bonds.
SSE will, according to the examination opinions of the listing committee, decide whether or not to approve the listing
application.

Listed Companies
2014 Fact Book 73
17. Where the issuer’s securities listing application is approved after being examined by SSE, the issuer shall disclose
listing announcements prepared in accordance with relevant requirements and other documents required by SSE on
SSE website, and shall be responsible for their content.
18. SSE will determine the L date according to the issuer’s application, national laws and regulations, and SSE rules.
If multiple issuers, after obtaining approval documents from CSRC for the securities issuance application, submit their
applications to SSE at the same time while cannot issue their stocks on the same day due to the market or technology
limits, SSE shall make arrangements for their issuances in the time order of their approval documents they gained from
CSRC. However, SSE shall give priority to the issuer whose prospectus and the latest accounting reports will expire and
meanwhile who applies to SSE late due to objective reasons.
SSE shall, according to the market condition, adjust the listing date after consulting with the issuer and the managing
underwriter.
19. Where shares or convertible bonds meet listing conditions, the period from the day on which their issuance is
completed to L date (L date is the day on which securities are listed) shall not exceed seven trading days. Where
corporate bonds meet listing conditions, SSE will coordinate and make arrangements for the listing date after receiving
the issuer’s registration and custody evidential documents. SSE may adjust the securities listing date according to market
conditions.
The day on which an IPO, a public issue of additional shares, or a public issue of convertible corporate bonds is
completed shall be the day on which successful subscription results are announced. The day on which a rights issue is
completed shall be the ex-rights trading day.
20. Before securities are initially listed, the issuer shall, in accordance with the relevant requirements of the Administrative
Measures of the China Securities Regulatory Commission for International Securities Identification Numbers, apply for an
ISIN code for the newly listed securities through SSE website.
Documents to be Submitted When Applying for an IPO and Listing
The issuer and its sponsor shall, before applying for shares to be listed, submitthe following documents to the issuance
and listing department of the Shanghai Stock Exchange:
1. A share listing application;
2. China Securities Regulatory Commission documents approving the initial listing of the issuer’s shares;
3. Resolutions of the board of directors and the shareholders’ meeting related to the issuance and listing of the issuer’s
shares;
4. A photocopy of the issuer’s business licenses;

Listed Companies
2014 Fact Book 74
5. The issuer’s articles of association;
6. The issuer’s financial and accounting reports for the last three years lawfully audited by an accounting firm qualified to
engage in relevant securities and futures business;
7. Documents proving that all the issuer’s shares were in the custody of the Shanghai branch of China Securities
Depository and Clearing Corporation Limitedafter the IPO was completed;
8. A capital verification report issued by an accounting firm qualified to engage in relevant securities and futures business
after the IPO was completed;
9. A detailed description of shares in the issuer held by the directors, supervisors and senior officers and statements and
letters of commitment from the directors (supervisors and senior officers);
10. Relevant details on the secretary to the board of directors to be employed or already employed by the issuer;
11. A description of financial materials newly added pursuant to applicable provisions and major matters of relevance to
have occurred after the IPO and before the listing (if applicable);
12. The stock locking certification for one year since the IPO day of shareholders that have been holding before IPO;
13. Letters of commitment as specified in Articles 5.1.5 of the Rules Governing the Listing of Stocks on Shanghai Stock
Exchange;
14. The latest prospectus and the full set of issuance application materials examined and approved by CSRC;
15. A listing announcement prepared in accordance with relative rules of the Shanghai Stock Exchange;
16. The sponsor agreement and the listing sponsor letter issued by the sponsor;
17. The legal opinions issued by law firms; and
18. Other documents required by SSE.
Conditions for listed companies to issue securities to the public
To issue securities to the public, a listed company shall first meet the following general provisions:
I. The listed company shall have a complete and well-operated organization,sound operations, and meet the following requirements:
1. It has legally valid articles of association and a sound system for shareholders’ meetings, the board of directors, the
board of supervisors, independent directorswhich are able to perform their duties effectively in accordance with the law;

Listed Companies
2014 Fact Book 75
2. It has a sound system of internal controls, is able to effectively guarantee the efficiency of its operations, its
compliance with laws and regulations, and the reliability of its financial reports; there is no material defect in terms of the
completeness, reasonableness and effectiveness of its system of internal controls;
3. Its current directors, supervisors and senior officers have the corresponding qualifications, are able to perform their
duties with loyalty and diligence, have not violated the provisions of Articles 148 and 149 of the Company Law, have not
been subject to administrative penalties by CSRC within the last 36 months, and have not been publicly censured by a
stock exchange within the last 12 months;
4. The listed company is separate from its controlling shareholder or actual controller in terms of personnel, assets and
finance, has an independent structure and business, and is able to manage its business independently; and
5. It has not provided an improper external guarantee within the last 12 months.
II. The listed company shall be profitable on an ongoing basis and meet the following provisions:
1. It has been profitable for the last three financial years; the lower of net profit before or after non-recurring losses and
profits shall be used as the basis for calculation;
2. Its business and profit sources are relatively stable and do not rely heavily on its controlling shareholder or actual
controller;
3. Its current main business or investment directions can be developed sustainably, its business model and investment
plan are prudent, its main products or services have good market prospects, and no substantial adverse change in the
industry business environment or market demand is either currently in existence or foreseeable;
4. Its senior officers and core technical staff are stable and have not undergone any substantial adverse change within
the last 12 months;
5. Its major assets, core technologies and other substantial rights and interests have been obtained legally and can be
used sustainably without any substantial adverse change either currently in existence or foreseeable;
6. It is not affected by any guarantee, litigation, arbitration or other major event likely to materially affect its continuing
operation; and
7. Where it has issued securities to the public within the last 24 months, its business profit in the year in which the
securities were issued was more than 50% lower than in the previous year.
III. The listed company shall have sound finances and meet the following provisions:
1. Its basic accounting work is up to standard and strictly complies with the state's uniform accounting rules;

Listed Companies
2014 Fact Book 76
2. No certified public accountant has issued a qualified opinion, an adverse opinion or aopinion disclaimer in audit
reports for the last three years or on the latest financial statements. Where explanatory paragraphs are attached to
unqualified audit reports, the matters covered in the explanatory paragraphs have had no major adverse impact on the
issuer, or the major adverse impact has been eliminated before the issue;
3. Its assets are of sound quality. Non-performing assets shall not have a major adverse impact on the financial status of
the company;
4. Its business results are genuine and cash flows are normal. Confirmation of business income and costs and expenses
shall strictly comply with the provisions of relevant state accounting rules, and impairment provisions incurred in the last
three years shall be sufficient and reasonable, without any manipulation of business results; and
5. Cumulative profits distributed in the last three years in cash or stock represent no less than 20 percent of annual
distributable profits realized the last three years.
IV. The listed company's financial statements for the last 36 months shall contain no false records, and none of the following major unlawful acts shall have occurred:
1. Violations of laws, administrative rules and regulations on securities that have subjected the company to administrative
penalties or criminal penalties;
2. Violations of laws, administrative rules and regulations on industry and commerce, taxation, land, environmental
protection or customs that have subjected the company to administrative penalties and the circumstances of which have
been serious, or have subjected the company to criminal penalties; and
3. Violations of other laws, administrative rules and regulations in which the circumstances have been serious.
V. The amount of funds raised by listed companies and the use of such funds shall meet the following provisions:
1. The amount of funds raised shall not exceed what is needed for the proposed projects;
2. The funds raised shall be used for purposes that comply with national industrial policies and provisions of laws and
administrative rules concerning environmental protection and land administration;
3. Other than for financial enterprises, the funds raised on this occasion cannot be held for trading financial assets or
available for sale financial assets, lending to others, investments managed by third parties, or other financial investments;
nor can they be invested directly or indirectly in companies mainly engaged in the trading of securities;
4. The investment projects, when implemented, will not result in horizontal competition with the controlling shareholder(s)
or the actual controller(s), nor affect the independence of the company’s production and operating activities; and

Listed Companies
2014 Fact Book 77
5. A special reserve regime must be established for the funds raised, which shall be deposited in a special account
determined by the company's board of directors.
VI. The listed company shall be barred from offering securities to the public under any of the following circumstances:
1. The current application documents include any false records, misleading statements or major omissions;
2. The purposes for which funds raised in the previous public offer of securities have been used have been altered
without authorization and suchconduct has not been redressed;
3. The listed company has been subject to a public censure from a stock exchange within the last 12 months;
4. The listed company and its controlling shareholders or actual controllers have engaged in acts that havenot
honoredundertakings made to investors within the last 12 months;
5. The listed company or its incumbent directors or senior managers have been investigated by the judicial authorities
for suspected criminal offences or investigated by CSRC for suspected violations of laws or regulations; and
6.Other circumstances where the lawful rights and interests of investors and the public interest have been seriously
infringed.
Share Placements of Listed Company
Share placements to existing shareholders (hereinafter referred to as "share placements") shall, in addition to complying
with the preceding general provisions, also comply with the following provisions:
1. The number of shares to be placed shall not exceed 30 percent of the total value of capital stock before the current
placement;
2. Controlling shareholders shall make a public commitment on the number of shares to which they will subscribe before
the general meeting of shareholders is convened; and
3. They shall be sold by proxy as stipulated by the Securities Law.
Where the controlling shareholders fail to honor their share subscription commitments, or where the proxy sale period
expires but the amount of shares subscribed for by existing shareholders has not reached 70 percent of the shares to
be placed, the issuer shall give refunds to shareholders who have already subscribed according to the issue price plus
interest calculated at the bank deposit rate for the corresponding period.
Additional Issuance by Listed Companies
In a public offer of shares to unspecified targets (hereinafter referred to as an "additional issue"), in addition to the

Listed Companies
2014 Fact Book 78
preceding general provisions, the following provisions must also be complied with:
1. The average annual weighted net return on assets in the last three fiscal years shall be no less than 6 percent. Net
profits before or after deducting non-recurring profits and losses, whichever the lower, shall serve as the basis for
calculating the average weighted net return on assets;
2. Other than for financial enterprises, no significant amount shall have been held for trading financial assets or available
for sale financial assets, funds for lending to others, investments managed by third parties, or other financial investments
at the end of the latest accounting period; and
3. The issue price shall be no lower than the average price of the company's shares in the 20 trading days before
publication of the offering prospectus or than the average price on the previous trading day.
Risk Warnings
If a listed company is subject to abnormal financial conditions or other abnormal circumstances, thereby causing a risk
that the company will have its share listing terminated or making it difficult for investors to assess the prospects of the
company and potentially damaging their investment interests, a risk warning shall be implemented against trading in the
company’s shares.
Risk warnings are divided into risk warnings for listing termination risks (hereinafter referred to as "delisting risk
warnings") and others risk warnings indicating major risks.
The risk warnings for listing termination risks include:
1. Stocks of listed companies that are labeled “delisting risk warning” are marked "*ST" before the abbreviation for the
shares of the company to distinguish them from other shares;
2. The daily quote change limit for stocks is 5%.
3. The companies need to trade on the risk warning board.
Other risk warnings include:
1. Stocks of listed companies that are labeled “delisting risk warning” are marked "ST" before the abbreviation for the
shares of the company to distinguish them from other shares;
2. The daily quote change limit for stocks is 5%.
3. The companies need to trade on the risk warning board.

Listed Companies
2014 Fact Book 79
If any of the following circumstances apply to a listed company, a delisting risk warning shall be implemented for trading in the shares of the company:
1. Where the company has incurred losses in each of the last two financial years including retroactive adjustments
(based on the annually audited net profits disclosed in the two latest annual reports);
2. Where the company’s net asset is negative for the last financial year including retroactive adjustments (based on the
annually audited net profits disclosed in the latest annual report);
3. Where the company’s revenue is less than RMB 10 million for the last financial year including retroactive adjustments
(based on the annually audited net profits disclosed in the latest annual report);
4. Where the company’s financial report for the latest financial year is issued disclaimer of opinion or adverse opinion by
a CPA firm;
5. Where the company’s financial report contain significant accounting errors or false records and, under CSRC’s order,
the company fails to do restate the report within the statutory period; and the company’s stocks have been suspended
from listing for two months;
6. Where the company fails to disclose its annual report or interim report and the company’s stocks have been
suspended from listing for two months;
7. Where the company may be dissolved;
8. Where the court has accepted a case concerning the bankruptcy of the company and the company is likely to be
declared bankrupt according to law;
9. Where the company has submitted to SSE the plan for addressing the equity structure problem after the changes in
equity structure render the company unsuitable for listing for consecutive 20 trading days, and the plan is approved by
SSE; or
10. Other circumstances determined by SSE.
If any of the following circumstances apply to a listed company, other risking warnings shall be imposed on the shares of the company:
1. Where a company has not disclosed its annual report for the first year after its stocks are relisted from listing
suspension or termination;
2. Where a company’s main business has been affected seriously and cannot be resumed within three months;
3. Where the company’s main bank accounts are frozen;

Listed Companies
2014 Fact Book 80
4. Where the company’s board of directors is unable to convene meetings and make resolutions;
5. Where the company’s fund is occupied by its controlling shareholders and other related parties for non-operational
purposes or where the company provides external guarantee for others against the stated decision-making procedures,
and these situations are serious; or
6. Other circumstances determined by CSRC and SSE.
If the above circumstances do not exist, the company can apply to SSE for cancelling the risk warning.
Suspension and Termination of Listing
If any of the following circumstances apply to a listed company, SSE shall suspend the listing of the company:
1. Where the audit results for the latest financial year show that the company remains in the red after the company was
issued a delisting risk warning as a result of the occurrence of Circumstance 1 specified in “Implementation of Delisting
Risk Warning” hereof;
2. Where the audit results for the latest financial year show that the company remains in the red after the company was
issued a delisting risk warning as a result of the occurrence of Circumstance 1 specified in “Implementation of Delisting
Risk Warning” hereof;
3. Where the audit results for the latest financial year show that the company’s business income remains less than
RMB 10 million after the company was issued a delisting risk warning as a result of the occurrence of Circumstance 3
specified in “Implementation of Delisting Risk Warning” hereof;
4. Where the financial report for the latest financial year disclosed by the company is issued disclaimer of opinion or
adverse opinion by a CPA firm after the company was issued a delisting risk warning as a result of the occurrence of
Circumstance 4 specified in “Implementation of Delisting Risk Warning” hereof;
5. Where the company still fails to restate its financial report as required within two months after the company was issued
a delisting risk warning because the company fails to restate its financial report as required within the statutory period;
6. Where the company still fails to disclose its annual or interim report as required within two months after the company
was issued a delisting risk warning as a result of the occurrence of Circumstance 6 specified in “Implementation of
Delisting Risk Warning” hereof;
7. Where changes in the company’s total share capital render the company unsuitable for listing;
8. Where after the equity structure changes render the company unsuitable for listing for consecutive 20 trading days
and the listing of company has been suspended, the company still fails to provide a plan for addressing the equity
structure problems or has provided a plan that fails to be approved, or after the company was issued a delisting risk
warning as a result of the occurrence of Circumstance 9 specified in “Implementation of Delisting Risk Warning” hereof,
the company’s equity structure still does not meet the listing requirements within six months;

Listed Companies
2014 Fact Book 81
9. Where the company commits any serious illegal act; or
10. Other circumstances determined by SSE.
If any of the following circumstances apply to a listed company, SSE shall terminate the listing of the company:
1. Where the financial report for the latest financial year shows that the company has incurred losses in its net profit,
or in its net asset, or the company’s business income is less than RMB 10 million, or the company is issued qualified
opinion, disclaimer of opinion or adverse opinion by a CPA firm, after the company’s stocks were suspended from listing
as a result of the occurrence of Circumstance 1 - 4 specified in “Suspension of Listing” hereof;
2. Where the company fails to disclose its latest annual report within the statutory period, after the company’s stocks
were suspended from listing as a result of the occurrence of Circumstance 1 - 4 specified in “Suspension of Listing”
hereof;
3. Where the company still fails to restate its financial report as required within two months after company’s stocks were
suspended from listing because the company fails to restate its financial report as required within the statutory period or
as a result of the occurrence of Circumstance 5 specified in “Suspension of Listing” hereof;
4. Where the company still fails to disclose its annual or interim report as required within two months after the company’s
stocks were suspended from listing because the company fails to disclose its annual or interim report within the statutory
period or as a result of the occurrence of Circumstance 6 specified in “Suspension of Listing” hereof;
5. Where for the company that has only issued A-share on SSE, its accrual turnover for consecutive 120 trading days
(excluding the days when the company’s stocks were suspended from listing) through SSE trading system is less
than RMB 5 million, or the daily closing share price remains less than the per value for consecutive 20 trading days
(excluding the days when the company’s stocks were suspended from listing);
6. Where for the company that has only issued B-share on SSE, its accrual turnover for consecutive 120 trading days
(excluding the days when the company’s stocks were suspended from listing) through SSE trading system is less
than RMB 1 million, or the daily closing share price remains less than the per value for consecutive 20 trading days
(excluding the days when the company’s stocks were suspended from listing);
7. Where for the company that has issued both A-share B-share on SSE, its turnover of A-share or B-share or its daily
closing share price meet the requirements stated in the above Article 5 and 6 at the same time;
8. Where the changes in the company’s total share capital render the company unsuitable for listing within the statutory
period set by SSE;
9. Where the company’s equity structure still renders the company unsuitable for listing within six months after the
company’s stocks were suspended from listing as a result of the occurrence of Circumstance 8 specified in “Suspension
of Listing” hereof;

Listed Companies
2014 Fact Book 82
10. Where the company repurchases stocks or an acquirer makes a tender offer for the purpose of listing termination
and the implementation of relevant plan gives rise to changes in the company’s total share capital and equity structure
which render the company unsuitable for listing;
11. Where the company is merged by absorption;
12. Where during the period of listing suspension, the company’s shareholders’ general meeting adopts a resolution to
terminate listing;
13. Where the company is dissolved;
14. Where the company is declared bankrupt in accordance with law;
15. Where the company discloses its latest annual report but fails to apply to SSE for listing resumption within the
subsequent five trading days, after the company’s stocks were suspended from listing as a result of the occurrence of
Circumstance 1-4 specified in “Suspension of Listing” hereof;
16. Where the company disclose its restated financial report as required but fails to apply to SSE for listing resumption
within the subsequent five trading days, after the company’s stocks were suspended from listing as a result of the
occurrence of Circumstance 5 specified in “Suspension of Listing” hereof;
17. Where the company disclose its annual or interim report as required within two months but fails to apply to SSE for
listing resumption within the subsequent five trading days, after the company’s stocks were suspended from listing as a
result of the occurrence of Circumstance 6 specified in “Suspension of Listing” hereof;
18. Where the company’s total share capital or equity structure meets the listing requirements within six months but
fails to apply to SSE for listing resumption within the subsequent five trading days, after the company’s stocks were
suspended from listing as a result of the occurrence of Circumstance 7-8 specified in “Suspension of Listing” hereof;
19. Where the company’s application for listing restoration is not accepted;
20. Where the company’s application for listing restoration is not approved; or
21. Other circumstances determined by SSE.
According to CSRC rules, SSE Listing Committee shall review the relevant documents and make the decision whether or
not to terminate the company’s listing.
If a company meets other circumstances that may lead to the termination of the company’s listing, SSE shall terminate
the company’s listing in line with the decision made by CSRC.
Note: The rules related to the “implementation or cancellation of delisting risk warning or other warnings” and the
“suspension or termination of listing” are all subject to Rules Governing the Listing of Stocks on Shanghai Stock Exchange.

Listed Companies
2014 Fact Book 83
Listing Agreements
Any company that applies for its shares or derivatives to be listed and tradedon SSE shall be examined and approved by
SSE and shall sign a listing agreement with SSE before the listing takes effect to define the rights and obligations of both
parties and other relevant matters.
Listing Conditions for Convertible Corporate Bonds
Any listed company that applies for its convertible corporate bonds to be listed on SSE shall comply with the following
conditions:
1. The term of the convertible corporate bonds shall be no less than one year;
2. The value of convertible corporate bonds to be issued shall be no less than RMB 50 million; and
3. The statutory conditions for the issuance of corporate bonds shall still be met at the time of the listing application.
Appendix: Listing Agreement of Securities
The applications for the issuance of stocks and financial derivatives should be reviewed and approved by SSE. The
following agreement should be signed before the listing to identify mutual rights, responsibilities and other relative
matters.
Corporation / Limited Liability Company (hereinafter referred to as "Party B"), according to
(referring to the issue of approval) applies to the Shanghai Stock Exchange (hereinafter referred to as
"Party A") for the listing of the securities and derivatives that it issues publicly or manages (hereinafter referred to as “Party
B securities”).
In accordance with the Securities Law of the People's Republic of China, the Shanghai Stock Exchange Management
Measures, other relevant laws and regulations, the Shanghai Stock Exchange Listing Rules, the Shanghai Stock
Exchange Bond Listing Rules and other listing provisions and listing agreements of the Party A concerning convertible
bonds, corporate bonds (enterprise bonds), securities investment funds, warrants and other securities, the two sides
agree to enter into this Agreement and to abide by it.
Article 1 Party A agrees to list Party B’s securities and provides trading facilities and services to Party B. Below are the
information of Party B’s securities listed in Party A’s market:
Securities varieties: (referring to stocks, bonds, funds and other securities)
Securities name:
Securities Short name:
Securities code:
Listing date: (date of the listing)
Number of listed securities: (number of free flow securities on the initial listing)
Total number of the securities: (number of free flow and non-free flow securities on the initial listing)

Listed Companies
2014 Fact Book 84
Any change of Party B’s listed securities varieties or content should be submitted by Party B to and approved by Party A
in application documents, reports or certificates, and these papers should be included as part of this Agreement.
Article 2 In addition to the provisions of this agreement, provisions of relevant securities laws, rules, regulations and
relevant Party A’s rules, announcements, notices, shall also be abided by both parties. And the commitments made by
Party B and its directors, supervisors and senior management, as part of this Agreement, should also be complied with.
Article 3 Party B and its directors, supervisors and senior management agree to actively cooperate with Party A to
exercise their supervisory duties, and accept the punishment or discipline imposed by Party A in case of violation.
In case of amendments, the revised version of this article prevails.
Article 4 Party B shall pay listing fees to Party A according to the rates and payment requirements attached to this
Agreement. In case of rates adjustment in the future, the new rates should be adopted.
Article 5 In accordance with relevant laws and regulations, the Rules of SSE or other reasons that Party A deems
necessary, Party A can change the trading method of the listed securities or stop their trading provided the decision is
approved through relevant procedures; if Party A deems that Party B’s securities no longer meet the listing conditions,
may Party A suspend or terminate the listing of its securities.
Article 6 This Agreement comes into force since the IPO date of Party B’s securities on Party A’s market and expires
since the day on which Party B’s securities are delisted from Party A’s market.
Article 7 Party B agrees that after Party A terminates the listing of its stocks, the shares will enter the agent share transfer
system or other transfer system recognized by Party A to continue trading according to relevant provisions.
Article 8 After Party A suspends the listing of Party B’s stocks, Party B shall select a qualified securities company in
accordance with relevant provisions as its share transfer agent institution after the delisting (hereinafter referred to as
"agent institution") to provide Party B with share transfer agent and other services. Party B shall, within the prescribed
time, sign an agreement with the agent institution and promptly notify Party A about the signing. If Party B fails to choose
an agent institution within the given time, Party B shall accept the agent institution assigned by Party A to provide Party B
with share transfer agent and other services and related costs will be borne by Party B.
Article 9 The bonds whose issuance and listing in SSE are approved by CSRC must not be traded or transferred in other
places outside SSE.
Article 10 This Agreement has two identical copies, one for each party. Both copies have the same effect.
Party A: Shanghai Stock Exchange Party B:
(Seal) (Seal)
Address: 528 South Pudong Road, Address:

Listed Companies
2014 Fact Book 85
Shanghai
Representative Signature: Representative Signature:
Signature Date: Signature Date:

Listed Companies
2014 Fact Book 86
Sector Distribution and Number of Companies
Industry Code Number of Companies
Agriculture, forestry, animal husbandry and fishery A 14
Mining industry B 39
Manufacturing C 495
Electricity, heat, gas and water production and supply D 50
Building industry E 31
Wholesale and retail trade F 92
Transportation, storage and postal services G 58
Accommodation and catering industry H 2
Transmission of information, software and IT services industry I 25
Financial sector J 32
Real estate K 71
Leasing and Business Services L 9
Scientific research and technical services M 1
Water conservancy, environment and public facilities management industry
N 5
Education P 1
Health and social work Q 1
Culture, Sports and Entertainment R 11
Other S 16

Listed Companies
2014 Fact Book 87
Geographical Distribution of Listed Companies
Region Number ofListed Companies
Percentage (%)
New Listingsin 2013
Percentage (%)
Anhui 29 3.04 0 0.00
Beijing 97 10.18 0 0.00
Fujian 30 3.15 0 0.00
Gansu 11 1.15 0 0.00
Guangdong 43 4.51 0 0.00
Guangxi 12 1.26 0 0.00
Guizhou 10 1.05 0 0.00
Hainan 8 0.84 0 0.00
Hebei 18 1.89 0 0.00
Henan 25 2.62 0 0.00
Heilongjiang 23 2.41 0 0.00
Hubei 37 3.88 0 0.00
Hunan 20 2.10 0 0.00
Jilin 18 1.89 0 0.00
Jiangsu 79 8.29 0 0.00
Jiangxi 16 1.68 0 0.00
Liaoning 28 2.94 0 0.00
Inner Mongolia 16 1.68 0 0.00
Ningxia 4 0.42 0 0.00
Qinghai 7 0.73 0 0.00
Shandong 49 5.14 0 0.00
Shanxi 17 1.78 0 0.00
Shaanxi 18 1.89 0 0.00
Shanghai 148 15.53 0 0.00
Sichuan 36 3.78 0 0.00
Tianjin 19 1.99 0 0.00
Tibet 6 0.63 0 0.00
Xinjiang 21 2.20 0 0.00
Yunnan 12 1.26 0 0.00
Zhejiang 78 8.18 1 100.00
Chongqing 18 1.89 0 0.00

Listed Companies
2014 Fact Book 88
Newly Listed Stocks in 2013
Stock Code
Short Name Sector
Issue Price (RMB)
Issuing Date
Listing Date
Opening Price (RMB)
Closing Price (RMB)
Lead underwriter
600023Zheneng Electric Power
Industry 5.53 2013-11-7 2013-12-19 8.50 8.88China International Capital Co., Ltd.
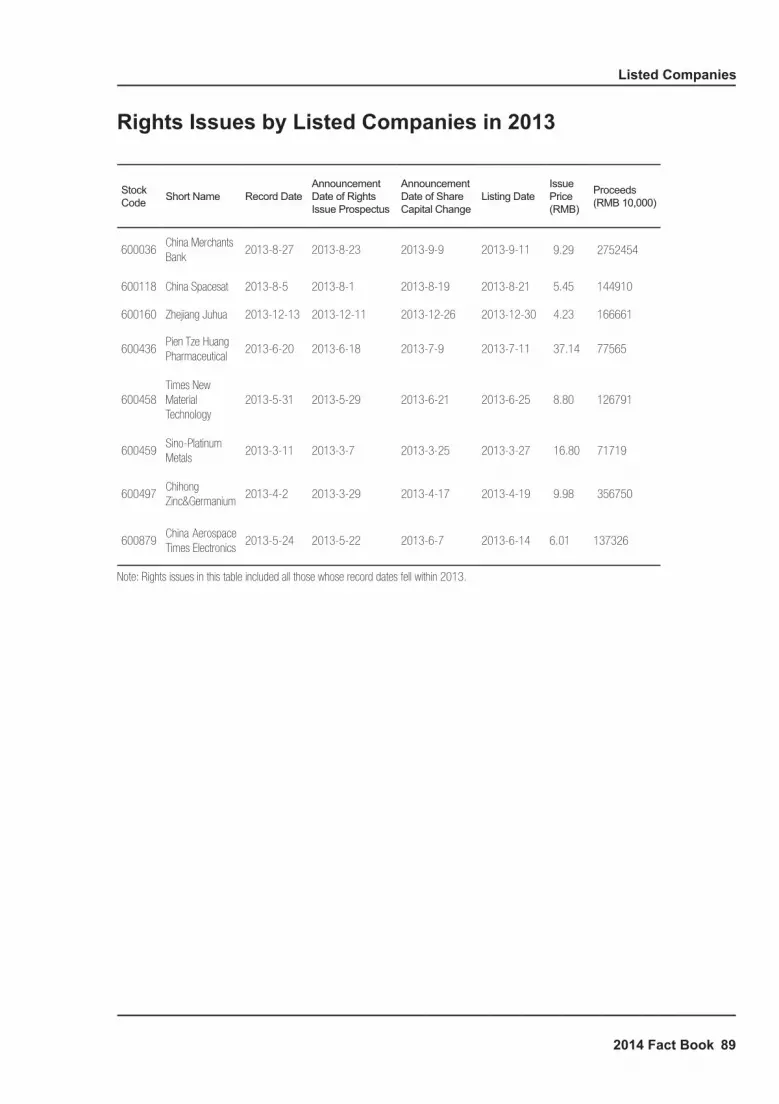
Listed Companies
2014 Fact Book 89
Rights Issues by Listed Companies in 2013
StockCode Short Name Record Date
Announcement Date of Rights Issue Prospectus
Announcement Date of Share Capital Change
Listing DateIssue Price (RMB)
Proceeds (RMB 10,000)
600036China Merchants Bank
2013-8-27 2013-8-23 2013-9-9 2013-9-11 9.29 2752454
600118 China Spacesat 2013-8-5 2013-8-1 2013-8-19 2013-8-21 5.45 144910
600160 Zhejiang Juhua 2013-12-13 2013-12-11 2013-12-26 2013-12-30 4.23 166661
600436Pien Tze Huang Pharmaceutical
2013-6-20 2013-6-18 2013-7-9 2013-7-11 37.14 77565
600458Times New Material Technology
2013-5-31 2013-5-29 2013-6-21 2013-6-25 8.80 126791
600459Sino-Platinum Metals
2013-3-11 2013-3-7 2013-3-25 2013-3-27 16.80 71719
600497Chihong Zinc&Germanium
2013-4-2 2013-3-29 2013-4-17 2013-4-19 9.98 356750
600879China Aerospace Times Electronics
2013-5-24 2013-5-22 2013-6-7 2013-6-14 6.01 137326
Note: Rights issues in this table included all those whose record dates fell within 2013.
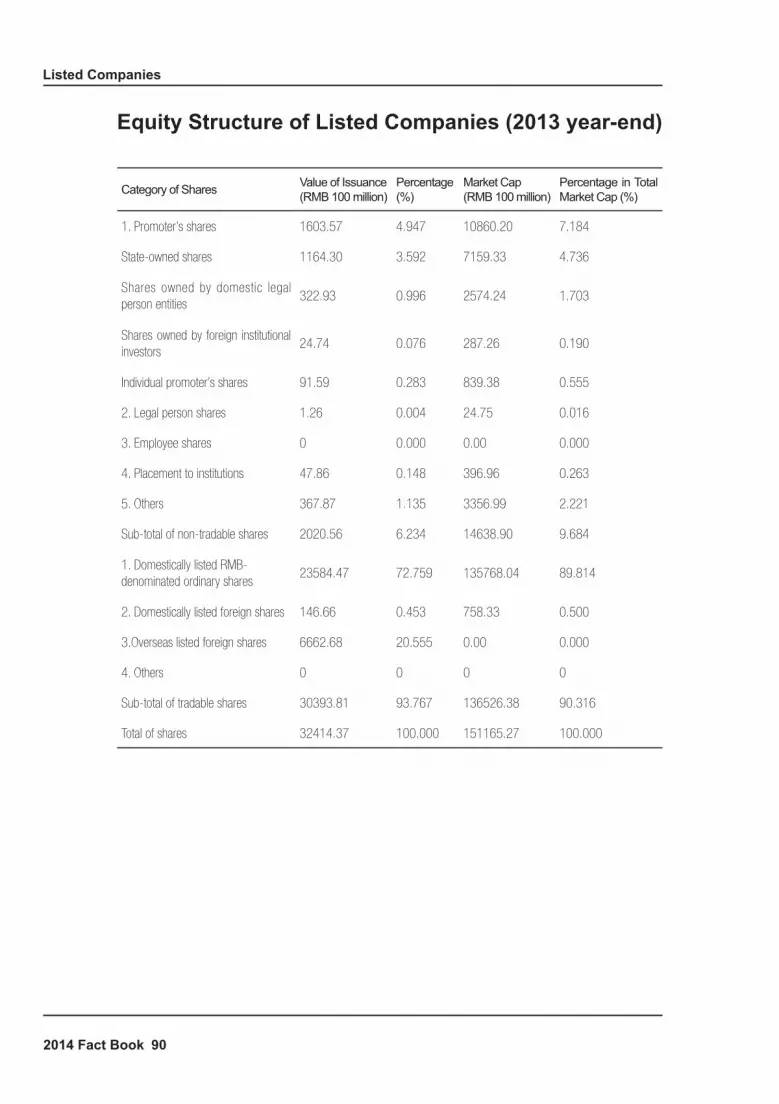
Listed Companies
2014 Fact Book 90
Equity Structure of Listed Companies (2013 year-end)
Category of Shares Value of Issuance(RMB 100 million)
Percentage(%)
Market Cap(RMB 100 million)
Percentage in Total Market Cap (%)
1. Promoter’s shares 1603.57 4.947 10860.20 7.184
State-owned shares 1164.30 3.592 7159.33 4.736
Shares owned by domestic legal person entities
322.93 0.996 2574.24 1.703
Shares owned by foreign institutional investors
24.74 0.076 287.26 0.190
Individual promoter’s shares 91.59 0.283 839.38 0.555
2. Legal person shares 1.26 0.004 24.75 0.016
3. Employee shares 0 0.000 0.00 0.000
4. Placement to institutions 47.86 0.148 396.96 0.263
5. Others 367.87 1.135 3356.99 2.221
Sub-total of non-tradable shares 2020.56 6.234 14638.90 9.684
1. Domestically listed RMB-denominated ordinary shares
23584.47 72.759 135768.04 89.814
2. Domestically listed foreign shares 146.66 0.453 758.33 0.500
3.Overseas listed foreign shares 6662.68 20.555 0.00 0.000
4. Others 0 0 0 0
Sub-total of tradable shares 30393.81 93.767 136526.38 90.316
Total of shares 32414.37 100.000 151165.27 100.000

Listed Companies
2014 Fact Book 91
Top 50 Listed Companies by Market Capitalization (2013 year-end)
Rank Short Name Code Market Cap(RMB10,000)
Percentage in Total Market Cap (%)
1 Petrochina 601857 124841922.00 8.26
2 ICBC 601398 94432220.36 6.25
3 Agricultural Bank of China 601288 72925712.89 4.82
4 Bank of China 601988 51227865.85 3.39
5 China Petroleum & Chemical 600028 40791225.24 2.70
6 China Life 601628 31506000.89 2.08
7 China Shenhua 601088 26088822.04 1.73
8 China Merchants Bank 600036 22464920.48 1.49
9 Ping An Bank 601318 19973687.41 1.32
10 Intustrial Bank 601166 19319069.47 1.28
11 Shanghai PuDong Development Bank 600000 17590223.54 1.16
12 Minsheng Bank 600016 17438084.93 1.15
13 Shang Automotive 600104 15590151.21 1.03
14 Bank of Communications 601328 15072331.78 1.00
15 Kweichow Moutai 600519 13328154.84 0.88
16 Citic Securities 600030 12544190.39 0.83
17 Citic Bank 601998 12347298.49 0.82
18 Shanghai International Port 600018 12014734.86 0.79
19 China Pacific Insurance 601601 11649255.10 0.77
20 Daqin Railway 601006 10986558.91 0.73
21 Everbright Bank 601818 10600256.94 0.70
22 Yangtze Power 600900 10428000.00 0.69
23 China Construction 601668 9420000.00 0.62
24 Haitong Securities China Coal Energy 600837 9160292.50 0.61

Listed Companies
2014 Fact Book 92
Rank Short Name Code Market Cap(RMB10,000)
Percentage in Total Market Cap (%)
25 China Heavy Industries 601989 8512342.72 0.56
26 Great Wall Motor 601633 8272053.43 0.55
27 Yili Industrial Group 600887 7983708.00 0.53
28 Hua Xia Bank 600015 7631279.49 0.50
29 China Unicom 600050 6804107.44 0.45
30 Conch Cement 600585 6783495.57 0.45
31 Baoshan Iron & Steel 600019 6736935.49 0.45
32 Bank of Beijing 601169 6608919.81 0.44
33 China Oilfield Services 601808 6607764.58 0.44
34 Zheneng Electric Power 600023 6155272.44 0.41
35 Merchants Securities 600999 5910274.58 0.39
36 China South Locomotive 601766 5901279.00 0.39
37 Poly Real Estate 600048 5888845.37 0.39
38 Baotou Steel Rare Earth 600111 5393891.99 0.36
39 Huaneng Power International 600011 5313000.00 0.35
40 Qingdao Haier 600690 5305630.08 0.35
41 Hengrui Medicine 600276 5166120.09 0.34
42 China CNR 601299 5077467.70 0.34
43 Huatai Securities 601688 5017600.00 0.33
44 Sany Heavy Industry 600031 4889795.59 0.32
45 China Railway Construction 601186 4812524.14 0.32
46 Xinhua Insurance 601336 4771485.21 0.32
47 China Communications Construction 601800 4745883.11 0.31
48 China Railway 601390 4580792.68 0.30
49 Guanghui energy 600256 4563525.17 0.30
50 Wanhua Chemical 600309 4476032.87 0.30
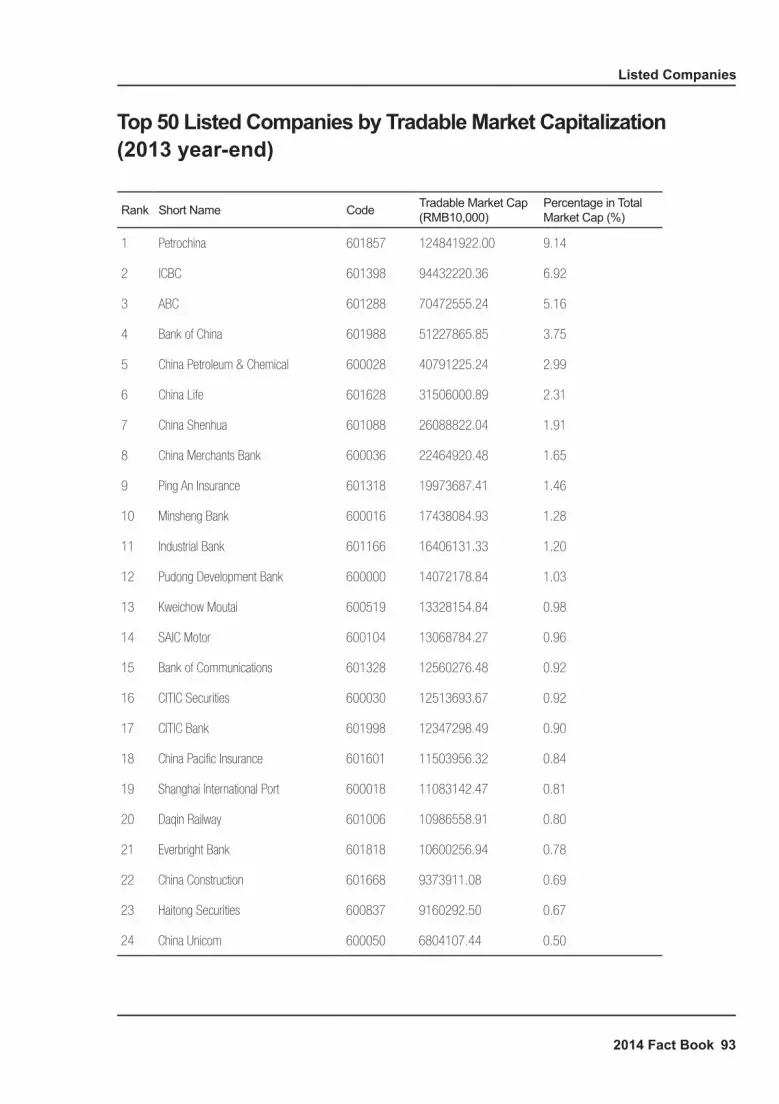
Listed Companies
2014 Fact Book 93
Top 50 Listed Companies by Tradable Market Capitalization (2013 year-end)
Rank Short Name Code Tradable Market Cap(RMB10,000)
Percentage in Total Market Cap (%)
1 Petrochina 601857 124841922.00 9.14
2 ICBC 601398 94432220.36 6.92
3 ABC 601288 70472555.24 5.16
4 Bank of China 601988 51227865.85 3.75
5 China Petroleum & Chemical 600028 40791225.24 2.99
6 China Life 601628 31506000.89 2.31
7 China Shenhua 601088 26088822.04 1.91
8 China Merchants Bank 600036 22464920.48 1.65
9 Ping An Insurance 601318 19973687.41 1.46
10 Minsheng Bank 600016 17438084.93 1.28
11 Industrial Bank 601166 16406131.33 1.20
12 Pudong Development Bank 600000 14072178.84 1.03
13 Kweichow Moutai 600519 13328154.84 0.98
14 SAIC Motor 600104 13068784.27 0.96
15 Bank of Communications 601328 12560276.48 0.92
16 CITIC Securities 600030 12513693.67 0.92
17 CITIC Bank 601998 12347298.49 0.90
18 China Pacific Insurance 601601 11503956.32 0.84
19 Shanghai International Port 600018 11083142.47 0.81
20 Daqin Railway 601006 10986558.91 0.80
21 Everbright Bank 601818 10600256.94 0.78
22 China Construction 601668 9373911.08 0.69
23 Haitong Securities 600837 9160292.50 0.67
24 China Unicom 600050 6804107.44 0.50

Listed Companies
2014 Fact Book 94
Rank Short Name Code Tradable Market Cap(RMB10,000)
Percentage in Total Market Cap (%)
25 Anhui Conch Cement 600585 6783495.57 0.50
26 Baoshan Iron & Steel 600019 6736935.49 0.49
27 China Heavy Industries 601989 6627515.79 0.49
28 China Oilfield Service 601808 6496164.58 0.48
29 :Inner Mongolia Yili Industrial Group 600887 6206562.57 0.45
30 Yangtze Power 600900 6159435.02 0.45
31 Merchants Securities 600999 5910274.58 0.43
32 Poly Real Estate 600048 5888845.37 0.43
33 Bank of Beijing 601169 5612278.77 0.41
34 Huaxia Bank 600015 5559947.60 0.41
35 Huaneng Power International 600011 5313000.00 0.39
36 Qingdao Haier 600690 5305630.08 0.39
37 Hengrui Medicine 600276 5166120.09 0.38
38 CNR 601299 5077467.70 0.37
39 CSR 601766 5068565.05 0.37
40 Huatai Securities 601688 5015514.48 0.37
41 Sany Heavy Industry 600031 4875159.34 0.36
42 China Railway Construction 601186 4697619.14 0.34
43 China Railway 601390 4580792.68 0.34
44 Wanhua Chemical Group 600309 4476032.87 0.33
45 Tasly 600535 4429862.14 0.32
46 China National Coal 601898 4296328.11 0.31
47 Datang International Power Generation 601991 4195208.64 0.31
48 China Construction Bank 601939 3971774.25 0.29
49 Kangmei Pharmaceutical 600518 3957686.07 0.29
50 China Chemical 601117 3946400.00 0.29

Listed Companies
2014 Fact Book 95
Div
iden
d D
istr
ibut
ion
by L
iste
d C
ompa
nies
in 2
013
Shar
e C
ode
Shor
t Nam
eD
istrib
utio
n D
ate
Div
iden
d (b
efor
e ta
x) (R
MB)
Div
iden
d (a
fter
tax)
(RM
B)Sh
are
Cod
eSh
ort N
ame
Dist
ribut
ion
Dat
eD
ivide
nd (b
efor
e ta
x) (R
MB)
Div
iden
d (a
fter
tax)
(RM
B)
6000
00Pu
dong
Dev
elop
men
t Ba
nk20
13-6
-30.
550
0.52
360
0004
Baiyu
n Ai
rpor
t20
13-7
-26
0.33
00.
314
6000
05W
uhan
Iron
and
Ste
el20
13-6
-21
0.01
00.
010
6000
06Do
ngfe
ng A
utom
obile
2013
-6-1
70.
003
0.00
3
6000
07Ch
ina
Wor
ld Tr
ade
Cent
er20
13-6
-40.
160
0.15
260
0008
Beijin
g Ca
pita
l20
13-5
-23
0.15
00.
143
6000
09Pu
dong
Dev
elop
men
t Ba
nk20
13-8
-16
0.37
00.
352
6000
10Ba
otou
Iron
&Ste
el20
13-7
-23
0.01
00.
010
6000
11Hu
anen
g Po
wer
Inte
rnat
iona
l20
13-7
-40.
210
0.20
060
0012
Wan
tong
Exp
ress
way
2013
-6-2
40.
200
0.19
0
6000
15Hu
a Xi
a Ba
nk20
13-7
-24
0.47
00.
447
6000
16M
insh
eng
Bank
2013
-6-2
70.
150
0.14
3
6000
16M
insh
eng
Bank
2013
-9-1
00.
158
0.15
060
0018
Shan
ghai
Int
erna
tiona
l Po
rt20
13-7
-24
0.13
40.
127
6000
19Ba
osha
n Iro
n &
Stee
l20
13-6
-18
0.13
80.
131
6000
20Zh
ongy
uan
Expr
ess
2013
-7-2
0.10
00.
095
6000
21Sh
angh
ai El
ectri
c20
13-7
-17
0.15
00.
143
6000
27Hu
adian
Pow
er
Inte
rnat
iona
l20
13-7
-22
0.06
50.
062
6000
28Ch
ina
Petro
leum
&
Chem
ical
2013
-6-1
90.
200
0.18
060
0028
Chin
a Pe
trole
um &
Ch
emica
l20
13-9
-12
0.09
00.
086
6000
29So
uth
Airlin
e20
13-7
-19
0.05
00.
048
6000
30CI
TIC
Secu
ritie
s20
13-8
-80.
300
0.28
5
6000
31Sa
ny H
eavy
Indu
stry
2013
-8-2
20.
250
0.23
860
0033
Fujia
n Ex
pres
s20
13-6
-14
0.10
00.
095

Listed Companies
2014 Fact Book 96
Shar
e C
ode
Shor
t Nam
eD
istrib
utio
n D
ate
Div
iden
d (b
efor
e ta
x) (R
MB)
Div
iden
d (a
fter
tax)
(RM
B)Sh
are
Cod
eSh
ort N
ame
Dist
ribut
ion
Dat
eD
ivide
nd (b
efor
e ta
x) (R
MB)
Div
iden
d (a
fter
tax)
(RM
B)
6000
35Ch
utian
Hig
hway
2013
-7-3
10.
070
0.06
760
0036
Chin
a M
erch
ants
Ban
k20
13-6
-13
0.63
00.
599
6000
37BG
CTV
2013
-6-2
80.
100
0.09
560
0038
Hafe
i Avia
tion
Indu
stry
2013
-6-1
40.
160
0.15
2
6000
39Si
chua
n Ro
ad&
Rrid
ge20
13-6
-18
0.15
00.
143
6000
48Po
ly Re
al Es
tate
2013
-6-3
0.23
20.
220
6000
50Ch
ina
Unico
m20
13-7
-10.
040
0.03
860
0051
Ning
bo U
nite
d Gr
oup
2013
-6-1
30.
100
0.09
5
6000
52Zh
ejian
g Gu
angs
ha
2013
-7-2
0.03
00.
029
6000
53Zh
ongj
iang
Real
Esta
te20
13-6
-19
0.02
00.
019
6000
54H
uang
shan
Tou
rism
De
velo
pmen
t20
13-7
-10
0.03
00.
029
6000
55Ch
ina
Reso
urce
s W
ando
ng M
edica
l Eq
uipm
ent
2013
-6-1
70.
050
0.04
8
6000
56Ch
ina
Meh
eco
2013
-5-9
0.35
00.
333
6000
59Gu
yuel
ongs
han
Shao
Win
e20
13-6
-18
0.10
00.
095
6000
60Hi
sens
e El
ectri
c20
13-5
-24
0.37
00.
352
6000
62Ch
ina
Reso
urce
s Do
uble
-Cra
ne
Phar
mac
eutic
al20
13-6
-28
0.32
30.
307
6000
64Na
njin
g Ga
oke
2013
-7-1
00.
250
0.23
860
0066
Zhen
gzho
u Yu
tong
Bus
2013
-5-1
50.
700
0.66
5
6000
67Ci
tych
amp
Darto
ng20
13-6
-21
0.21
20.
201
6000
68Ch
ina
Ge Z
hou
Ba
Grou
p20
13-6
-19
0.13
50.
128
6000
70Zh
ejian
g Fu
run
2013
-6-6
0.30
00.
285
6000
73Sh
angh
ai M
aling
Aq
uariu
s20
13-6
-50.
070
0.06
7
6000
77Su
ndy
Land
Inve
stmen
t20
13-5
-14
0.03
70.
035
6000
78Ch
engX
ing
Phos
ph-
Chem
icals
2013
-6-7
0.02
00.
019
6000
79Hu
man
well H
ealth
care
2013
-7-2
0.10
00.
095
6000
80Ji
nhua
Ent
erpr
ise20
13-7
-90.
030
0.02
9

Listed Companies
2014 Fact Book 97
Shar
e C
ode
Shor
t Nam
eD
istrib
utio
n D
ate
Div
iden
d (b
efor
e ta
x) (R
MB)
Div
iden
d (a
fter
tax)
(RM
B)Sh
are
Cod
eSh
ort N
ame
Dist
ribut
ion
Dat
eD
ivide
nd (b
efor
e ta
x) (R
MB)
Div
iden
d (a
fter
tax)
(RM
B)
6000
81D
ongf
eng
Elec
troni
c Te
chno
logy
2013
-6-2
50.
100
0.09
560
0085
Beijin
g To
ng R
en Ta
ng
Grou
p20
13-8
-90.
250
0.23
8
6000
88Ch
ina
Tele
visio
n M
edia
2013
-8-2
0.04
10.
039
6000
89Te
Bian
Ele
ctric
Ap
para
tus
2013
-5-3
10.
120
0.11
4
6000
97Sh
angh
ai K
aich
uang
M
arin
e In
tern
atio
nal
2013
-7-1
0.20
00.
190
6000
98Gu
angz
hou
Deve
lopm
ent I
ndus
try20
13-6
-70.
160
0.15
2
6001
00Ts
ingh
ua To
ngfa
ng20
13-6
-24
0.10
00.
095
6001
01Si
chua
n M
ingx
ing
Elec
tric
Powe
r20
13-8
-20.
050
0.04
8
6001
04Sh
angh
ai Au
tom
otive
2013
-7-1
10.
600
0.57
060
0105
Jian
g Su
Ete
rn20
13-7
-10.
100
0.09
5
6001
06Ch
ongq
ing
Road
&Brid
ge20
13-5
-28
0.08
00.
076
6001
08Ga
nsu
Yash
eng
Indu
stria
l20
13-7
-20.
025
0.02
4
6001
09Si
nolin
k Se
curit
ies
2013
-7-3
0.07
00.
067
6001
11Ba
otou
Ste
el R
are-
Earth
2013
-5-1
60.
200
0.19
0
6001
12Gu
izhou
Cha
ngzh
eng
Elec
tri20
13-3
-18
0.00
50.
005
6001
14N
btm
New
Mat
eria
ls
Grou
p20
13-4
-23
0.12
00.
114
6001
16Th
ree
Gor
ges
Wat
er
Cons
erva
ncy
2013
-5-3
10.
200
0.19
060
0117
Xini
ng S
pecia
l Ste
el20
13-6
-18
0.01
30.
012
6001
18 C
hina
Spa
cesa
t20
13-4
-30.
100
0.09
560
0119
Yang
tze R
iver
Inve
stm
ent I
ndus
try20
13-6
-30.
070
0.06
7
6001
20Zh
ejian
g Or
ient
Ho
ldin
gs20
13-6
-18
0.25
00.
238
6001
21Zh
engz
hou
Coal
Indu
stry
&
Electr
ic Po
wer
2013
-5-1
40.
130
0.12
4
6001
22Ho
ngtu
Hig
h Te
chno
logy
2013
-5-1
30.
021
0.02
060
0123
Shan
xi La
nhua
Sci
-Tec
h Ve
ntur
e20
13-7
-10.
600
0.57
0
6001
25Ti
elon
g Co
ntain
er
Logi
stics
2013
-6-1
70.
110
0.10
560
0128
Jian
gsu
Holly
2013
-6-2
00.
080
0.07
6
6001
31Si
chua
n M
injia
ng
Hydr
opow
er20
13-7
-16
0.05
00.
048
6001
32Ch
ongq
ing
Brew
ery
2013
-6-3
0.20
00.
190

Listed Companies
2014 Fact Book 98
Shar
e C
ode
Shor
t Nam
eD
istrib
utio
n D
ate
Div
iden
d (b
efor
e ta
x) (R
MB)
Div
iden
d (a
fter
tax)
(RM
B)Sh
are
Cod
eSh
ort N
ame
Dist
ribut
ion
Dat
eD
ivide
nd (b
efor
e ta
x) (R
MB)
Div
iden
d (a
fter
tax)
(RM
B)
6001
35Lu
ckyf
ilm20
13-6
-18
0.02
50.
024
6001
38Ch
ina
CYTS
Tour
s Ho
ldin
g20
13-7
-50.
150
0.14
3
6001
39Si
chua
n W
este
rn
Reso
urce
s Ho
ldin
g20
13-5
-22
0.40
00.
380
6001
41Hu
bei X
ingf
a Ch
emic
als
Grou
p20
13-6
-18
0.30
00.
285
6001
43Ki
ngfa
Scie
nce
and
tech
nolo
gy20
13-6
-26
0.20
00.
190
6001
50Ch
ina
Stat
e Sh
ipbu
ildin
g20
13-6
-60.
010
0.01
0
6001
53Xi
amen
Uni
ted
Deve
lopm
ent
2013
-7-9
0.15
00.
143
6001
57W
intim
e En
ergy
2013
-4-1
50.
300
0.28
5
6001
58Ch
ina
Spor
ts In
dust
ry
Grou
p20
13-6
-40.
028
0.02
760
0160
Zhej
iang
Juhu
a20
13-5
-20
0.15
00.
143
6001
62Sh
enzh
en H
eung
kong
Ho
ldin
g20
13-6
-21
0.01
50.
014
6001
66Fo
ton
Mot
or20
13-6
-17
0.16
00.
152
6001
67Lu
enm
ei H
oldi
ng20
13-7
-40.
160
0.15
260
0168
Wuh
an S
anzh
en
Indu
stry
Hol
ding
2013
-4-2
20.
035
0.03
3
6001
70Sh
angh
ai C
onst
ruct
ion
Grou
p20
13-7
-17
0.21
00.
200
6001
71Sh
angh
ai Be
lling
2013
-5-2
00.
015
0.01
4
6001
72Hu
angh
e W
hirlw
ind
2013
-6-1
70.
040
0.03
860
0173
Wol
ong
Real
Esta
te
Grou
p20
13-5
-16
0.05
00.
048
6001
75M
eidu
Hol
ding
2013
-6-3
0.00
80.
008
6001
76Ch
ina
Fibe
rglas
s20
13-6
-30.
100
0.09
5
6001
77Yo
ungo
r Gro
up20
13-5
-23
0.50
00.
475
6001
82Gi
ti Ti
re20
13-6
-27
0.16
00.
152
6001
83Sh
engy
i Tec
hnol
ogy
2013
-8-1
0.15
00.
143
6001
85Gr
ee R
eal E
stat
e20
13-7
-80.
200
0.19
0
6001
88Ya
nzho
u Co
al M
inin
g20
13-6
-21
0.36
00.
342
6001
89Ji
lin F
ores
t Tou
rism
Pr
oduc
ts20
13-7
-17
0.10
00.
095
6001
90Ji
nzho
u Po
rt20
13-5
-31
0.02
60.
025
6001
91Ba
otou
Hua
zi In
dust
ry20
13-7
-16
0.01
00.
010

Listed Companies
2014 Fact Book 99
Shar
e C
ode
Shor
t Nam
eD
istrib
utio
n D
ate
Div
iden
d (b
efor
e ta
x) (R
MB)
Div
iden
d (a
fter
tax)
(RM
B)Sh
are
Cod
eSh
ort N
ame
Dist
ribut
ion
Dat
eD
ivide
nd (b
efor
e ta
x) (R
MB)
Div
iden
d (a
fter
tax)
(RM
B)
6001
92Gr
eatw
all E
lect
rical
2013
-6-3
0.01
50.
014
6001
93Sh
angh
ai Pr
osola
r Re
sour
ces D
evelo
pmen
t20
13-1
1-5
0.04
00.
023
6001
95Ch
ina
Anim
al Hu
sban
dry
Indu
stry
2013
-7-1
20.
200
0.19
060
0196
Shan
ghai
Fosu
n Ph
arm
aceu
tical
2013
-8-1
90.
210
0.20
0
6001
97Xi
njian
g Yi
lite In
dust
ry20
13-8
-19
0.22
00.
209
6001
99An
hui G
olde
n Se
ed
Win
ery
2013
-6-2
50.
310
0.29
5
6002
00Ji
angs
u W
uzho
ng
Indu
stria
l20
13-5
-17
0.02
50.
024
6002
01In
ner
Mon
golia
Jin
yu
Grou
p20
13-7
-30.
160
0.15
2
6002
02Ha
rbin
Air
Cond
itioni
ng20
13-7
-10
0.01
70.
016
6002
08Xi
nhu
Zhon
gbao
2013
-7-8
0.06
10.
058
6002
09La
wton
Dev
elop
men
t20
13-7
-15
0.00
40.
004
6002
10Zi
Jian
g En
terp
rise
Grou
p20
13-7
-23
0.10
00.
095
6002
11Tib
et R
hodio
la Ph
arm
aceu
tical
Holdi
ng20
13-5
-28
0.07
00.
067
6002
15Ch
angc
hun
E&T
Deve
lopm
ent
2013
-7-1
60.
010
0.01
0
6002
16Zh
ejian
g M
edici
ne20
13-6
-17
0.50
00.
475
6002
18An
hui Q
uanc
hai E
ngin
e20
13-6
-25
0.05
00.
048
6002
19Sh
ando
ng N
ansh
an
Alum
iniu
m20
13-5
-22
0.12
00.
114
6002
21Ha
inan
Airli
nes
2013
-6-7
0.10
00.
095
6002
26Zh
ejian
g Sh
engh
ua
Biok
Bio
logy
2013
-6-6
0.05
00.
048
6002
27Gu
izhou
Chi
tianh
ua20
13-5
-70.
020
0.01
9
6002
30Ca
ngzh
ou D
ahua
20
13-4
-90.
120
0.11
460
0231
Ling
yuan
Iron
& S
teel
2013
-7-8
0.04
00.
038
6002
32Zh
ejian
g Go
lden
Eag
le20
13-6
-20
0.08
00.
076
6002
33Da
lian
Daya
ng Tr
ands
2013
-6-3
0.15
00.
143
6002
36Gu
angx
i Gui
guan
El
ectri
c Po
wer
2013
-7-1
70.
040
0.03
860
0237
Anhu
i Ton
gfen
g El
ectro
nics
2013
-7-9
0.02
00.
019
6002
38Ha
inan
Yed
ao20
13-7
-15
0.10
00.
095
6002
39Yu
nNan
Met
ropo
litan
Re
al Es
tate
Deve
lopm
ent
2013
-6-3
0.08
00.
076

Listed Companies
2014 Fact Book 100
Shar
e C
ode
Shor
t Nam
eD
istrib
utio
n D
ate
Div
iden
d (b
efor
e ta
x) (R
MB)
Div
iden
d (a
fter
tax)
(RM
B)Sh
are
Cod
eSh
ort N
ame
Dist
ribut
ion
Dat
eD
ivide
nd (b
efor
e ta
x) (R
MB)
Div
iden
d (a
fter
tax)
(RM
B)
6002
41Li
aoni
ng S
hida
i W
anhe
ng20
13-6
-60.
025
0.02
460
0246
Beijin
g Va
nton
e Re
al Es
tate
2013
-5-1
70.
070
0.06
7
6002
46Be
ijing
Van
tone
Rea
l Es
tate
2013
-9-1
70.
070
0.06
760
0248
Shaa
nxi y
anch
ang
petro
leum
che
mica
l co
nstru
ctio
n20
13-9
-16
0.10
00.
095
6002
49Li
uzho
u Li
angm
ianzh
en20
13-7
-15
0.05
00.
048
6002
51Xi
njia
ng G
uann
ong
Frui
t &
Antle
r Gro
up20
13-6
-20
0.21
00.
200
6002
52Zh
ongh
eng
Grou
p20
13-7
-10.
200
0.19
060
0253
Topf
ond
Phar
mac
eutic
al20
13-5
-13
0.03
00.
029
6002
56Gu
angh
ui E
nerg
y20
13-6
-24
0.05
00.
033
6002
57Da
hu A
quac
ultu
re20
13-7
-19
0.01
00.
010
6002
58Be
ijing
Capi
tal T
ouris
m
2013
-6-1
70.
250
0.23
860
0261
Yank
on L
ight
ing
2013
-6-3
0.12
00.
114
6002
62No
rth H
aule
r20
13-6
-40.
300
0.28
560
0266
Beijin
g Ur
ban
Cons
truct
ion
2013
-8-1
60.
370
0.35
2
6002
67Hi
sun
Phar
mac
eutic
al20
13-6
-18
0.11
00.
105
6002
68Gu
odian
Nan
jing
Auto
mat
ion
2013
-6-1
80.
100
0.09
5
6002
69Ga
nyue
Exp
ress
way
2013
-7-1
0.15
10.
143
6002
70Si
notra
ns20
13-6
-20
0.20
00.
190
6002
71Ai
sino
2013
-5-1
40.
430
0.40
960
0272
Shan
ghai
Kaika
i Indu
stry
2013
-6-2
70.
020
0.01
9
6002
73Hu
afan
g Te
xtile
2013
-7-1
00.
020
0.01
960
0276
Heng
rui M
edici
ne20
13-6
-70.
080
0.07
1
6002
77Yi
li Ene
rgy
2013
-6-1
80.
050
0.04
860
0278
Orie
nt In
tern
atio
nal
Ente
rpris
e20
13-6
-17
0.10
00.
095
6002
79Ch
ongq
ing
Gang
jiu20
13-5
-30
0.06
00.
057
6002
80Na
njin
g Ce
ntra
l Em
poriu
m20
13-5
-22
0.16
00.
152

Listed Companies
2014 Fact Book 101
Shar
e C
ode
Shor
t Nam
eD
istrib
utio
n D
ate
Div
iden
d (b
efor
e ta
x) (R
MB)
Div
iden
d (a
fter
tax)
(RM
B)Sh
are
Cod
eSh
ort N
ame
Dist
ribut
ion
Dat
eD
ivide
nd (b
efor
e ta
x) (R
MB)
Div
iden
d (a
fter
tax)
(RM
B)
6002
80Na
njin
g Ce
ntra
l Em
poriu
m20
13-9
-25
0.10
00.
060
6002
83Qi
anjia
ng W
ater
Re
sour
ces
2013
-7-4
0.10
00.
095
6002
84Pu
dong
Roa
d &
Brid
ge
Cons
truct
ion
2013
-6-1
80.
156
0.14
860
0285
Ling
rui P
harm
aceu
tial
2013
-7-1
0.10
00.
095
6002
87Ji
angs
u Sa
inty
2013
-6-3
0.04
00.
038
6002
88Da
heng
Sc
ienc
e&Te
chno
logy
2013
-7-2
90.
050
0.04
8
6002
89Br
ight
Oce
ans
Inte
r-Te
leco
m20
13-7
-40.
060
0.05
760
0290
Huay
i Ele
ctric
Pow
er
Auto
mat
ion
2013
-6-2
40.
020
0.01
9
6002
91Xi
shui
Stro
ng Y
ear
2013
-6-2
60.
054
0.05
160
0292
CPI Y
uand
a En
viron
men
tal-P
rote
ction
2013
-8-1
90.
080
0.07
6
6002
93Sa
nxia
New
Bui
ldin
g M
ater
ials
2013
-7-3
0.02
40.
023
6002
95Ee
rduo
si20
13-6
-40.
100
0.09
5
6002
97M
erro
Pha
rmac
eutic
al 20
13-8
-15
0.04
00.
038
6002
98An
gel Y
east
2013
-6-3
0.15
00.
143
6003
00V
V Fo
od &
Bev
erag
e20
13-6
-13
0.06
00.
057
6003
03SG
Aut
omot
ive20
13-4
-26
0.08
70.
083
6003
07Ho
ngxin
g Iro
n an
d St
eel
2013
-7-1
50.
030
0.02
960
0308
Huat
ai Pa
per
2013
-8-1
90.
020
0.01
9
6003
09Ya
ntai
Wan
hua
2013
-5-3
0.70
00.
665
6003
10Gu
idon
g El
ectri
c Po
wer
2013
-5-2
00.
300
0.28
5
6003
12Pi
ngga
o El
ectri
c20
13-5
-27
0.05
00.
048
6003
15Sh
angh
ai Ja
hwa
2013
-5-2
70.
700
0.64
0
6003
16Ho
ngdu
Avia
tion
Indu
stria
l20
13-7
-90.
010
0.01
060
0317
Ying
kou
Port
2013
-6-2
00.
024
0.02
3
6003
18Ch
aodo
ng S
hare
s20
13-7
-25
0.03
00.
029
6003
21Gu
odon
g Co
nstru
ctio
n 20
13-7
-50.
020
0.01
9
6003
22Ti
anjin
Rea
lity
Deve
lopm
ent
2013
-7-3
00.
075
0.07
160
0323
Nanh
ai De
velo
pmen
t20
13-8
-90.
100
0.09
5

Listed Companies
2014 Fact Book 102
Shar
e C
ode
Shor
t Nam
eD
istrib
utio
n D
ate
Div
iden
d (b
efor
e ta
x) (R
MB)
Div
iden
d (a
fter
tax)
(RM
B)Sh
are
Cod
eSh
ort N
ame
Dist
ribut
ion
Dat
eD
ivide
nd (b
efor
e ta
x) (R
MB)
Div
iden
d (a
fter
tax)
(RM
B)
6003
25Hu
afa
Indu
stria
l20
13-7
-20.
100
0.09
560
0327
Grea
t Orie
nt20
13-6
-17
0.08
00.
076
6003
29Zh
ongx
in
Phar
mac
eutic
als20
13-1
2-19
0.10
00.
095
6003
35Gu
oji A
uto
2013
-7-2
0.10
00.
095
6003
37M
arko
r Fur
nitu
re20
13-5
-20
0.03
00.
029
6003
40Ch
ina
Fortu
ne L
and
2013
-6-4
0.23
00.
219
6003
40Hu
axiax
ingf
u20
13-1
0-10
0.15
00.
118
6003
45Ya
ngtze
Com
mun
icatio
n20
13-7
-90.
200
0.19
0
6003
48Ya
ngqu
an C
oal In
dustr
y20
13-7
-50.
286
0.27
260
0350
Shan
dong
Exp
ress
way
2013
-7-2
30.
126
0.12
0
6003
51Ya
bao
Phar
mac
eutic
al20
13-6
-25
0.05
00.
048
6003
52Zh
ejian
g Lo
ngsh
eng
2013
-5-1
70.
170
0.16
2
6003
53 X
ugua
ng E
lect
roni
cs20
13-7
-11
0.13
00.
124
6003
56He
ngfe
ng P
aper
2013
-5-2
70.
118
0.11
2
6003
60Si
no-M
icroe
lect
roni
cs20
13-6
-24
0.02
00.
019
6003
61Hu
alian
Hyp
erm
arke
t20
13-6
-24
0.07
00.
067
6003
62Ji
angx
i Cop
per
2013
-7-2
40.
500
0.47
560
0363
Lian
chua
ng
Opto
elec
troni
c20
13-7
-19
0.01
80.
017
6003
66Ni
ngbo
Yun
shen
g20
13-7
-40.
300
0.28
560
0367
Reds
tar D
evel
opin
g20
13-7
-30.
035
0.03
3
6003
68W
uzho
u Co
mm
unica
tions
2013
-5-2
00.
030
0.02
960
0369
Sout
hwes
t Sec
uritie
s20
13-6
-13
0.10
00.
095
6003
70Sa
nfan
gxian
g20
13-5
-24
0.05
00.
048
6003
71W
anxia
ng D
onee
d20
13-7
-80.
200
0.18
0
6003
72Ch
ina
Avic
Elec
troni
cs20
13-8
-13
0.05
00.
048
6003
73Ch
ines
e Un
ivers
e Pu
blish
ing
and
Med
ia20
13-6
-19
0.10
00.
095
6003
75Hu
aling
Xin
gma
2013
-5-3
00.
350
0.33
360
0376
Beijin
g Ca
pita
l De
velo
pmen
t20
13-5
-20
0.24
00.
228

Listed Companies
2014 Fact Book 103
Shar
e C
ode
Shor
t Nam
eD
istrib
utio
n D
ate
Div
iden
d (b
efor
e ta
x) (R
MB)
Div
iden
d (a
fter
tax)
(RM
B)Sh
are
Cod
eSh
ort N
ame
Dist
ribut
ion
Dat
eD
ivide
nd (b
efor
e ta
x) (R
MB)
Div
iden
d (a
fter
tax)
(RM
B)
6003
77Sh
angh
ai-Na
njin
g Ex
pres
sway
2013
-7-5
0.36
00.
342
6003
78Ti
anke
Sha
res
2013
-5-1
50.
070
0.06
7
6003
79Ba
ogua
ng V
acuu
m
Elec
troni
c Ap
para
tus
2013
-7-1
80.
013
0.01
260
0380
Join
care
Pha
rmac
eutic
al 20
13-7
-25
0.04
00.
038
6003
82Gu
angd
ong
Min
gzhu
2013
-5-2
00.
030
0.02
960
0383
Gem
dale
2013
-6-1
80.
080
0.07
6
6003
86Be
ijing
Bash
i Med
ia20
13-5
-22
0.26
00.
247
6003
87Ha
iyue
2013
-7-1
10.
050
0.04
8
6003
88Lo
ngjin
g En
viron
men
tal
Prot
ectio
n20
13-6
-30.
400
0.38
060
0389
Jian
gsha
n Ag
roch
emic
al &
Chem
icals
2013
-5-2
40.
160
0.15
2
6003
91Ch
engf
a Sc
ienc
e&Te
chno
logy
2013
-5-2
00.
040
0.03
860
0393
Dong
hua
Ente
rpris
e20
13-6
-60.
050
0.04
8
6003
95Pa
njian
g Re
fined
Coa
l20
13-7
-11
0.45
00.
428
6003
96Ji
nsha
n Co
.20
13-7
-25
0.10
00.
095
6003
98Ca
nal S
ci &
Tech
2013
-7-1
0.05
00.
048
6003
99Fu
shun
Spe
cial S
teel
2013
-7-2
30.
020
0.01
9
6004
00Ho
ngdo
u In
dust
ry20
13-5
-16
0.02
00.
019
6004
01Ha
reon
Sol
ar Te
chno
logy
2013
-5-2
80.
740
0.70
3
6004
03Da
you
Ener
gy20
13-6
-17
0.45
00.
428
6004
06NA
RI Te
chno
logy
De
velo
pmen
t20
13-6
-60.
210
0.18
0
6004
09Sa
nyou
Che
mica
l In
dust
ries
2013
-7-2
20.
020
0.01
960
0410
Team
sun
2013
-7-3
0.10
00.
095
6004
15Zh
ejian
g Ch
ina
Com
mod
ities C
ity G
roup
2013
-6-2
50.
100
0.09
560
0418
Anhu
i Jian
ghua
i Au
tom
obile
2013
-7-1
80.
110
0.10
5
6004
22Ku
nmin
g Ph
arm
aceu
tical
2013
-5-2
70.
300
0.28
560
0423
Liuz
hou
Chem
ical
Indu
stry
2013
-6-2
50.
060
0.05
7

Listed Companies
2014 Fact Book 104
Shar
e C
ode
Shor
t Nam
eD
istrib
utio
n D
ate
Div
iden
d (b
efor
e ta
x) (R
MB)
Div
iden
d (a
fter
tax)
(RM
B)Sh
are
Cod
eSh
ort N
ame
Dist
ribut
ion
Dat
eD
ivide
nd (b
efor
e ta
x) (R
MB)
Div
iden
d (a
fter
tax)
(RM
B)
6004
25Qi
ngso
ng B
uildin
g M
ateria
ls an
d Ch
emica
ls20
13-6
-40.
100
0.09
560
0426
Hualu
-hen
gshe
ng
Chem
ical
2013
-7-4
0.15
00.
143
6004
33Gu
anha
o Hi
gh-te
ch20
13-4
-22
0.12
00.
114
6004
35No
rth N
avig
atio
n Co
ntro
l Te
chno
logy
2013
-6-4
0.10
00.
095
6004
36Pi
entze
huan
g20
13-6
-30.
800
0.76
060
0438
Tong
wei C
o., L
td.
2013
-5-2
20.
100
0.09
5
6004
39Re
becc
a20
13-6
-30.
080
0.07
660
0446
King
dom
Tech
nolo
gy20
13-4
-22
0.02
80.
027
6004
49Ni
ngxia
Bui
ldin
g M
ater
ials
2013
-5-2
00.
050
0.04
860
0456
Baoj
i Tita
nium
2013
-5-1
60.
050
0.04
8
6004
58Ti
mes
New
Mat
erial
s20
13-5
-10
0.10
00.
095
6004
59Si
no-p
latin
um m
etals
2013
-5-3
10.
045
0.04
3
6004
61Ji
angx
i Hon
gche
ng
Wat
erwo
rks
2013
-5-2
40.
100
0.09
560
0463
Airp
ort H
igh-
Tech
Par
k20
13-6
-17
0.10
00.
095
6004
67Sh
ando
ng H
omey
Aq
uatic
Dev
elop
men
t20
13-5
-90.
090
0.08
660
0468
Bene
fo Te
jing
Elec
tric
2013
-6-1
90.
020
0.01
9
6004
69Ae
olus
Tyr
e20
13-6
-18
0.10
00.
095
6004
70Li
uguo
Che
mica
l Indu
stry
2013
-6-2
00.
100
0.09
5
6004
75W
uxi H
uagu
ang
Boile
r20
13-6
-18
0.10
00.
095
6004
79Qi
anjin
Pha
rmac
eutic
al20
13-6
-24
0.25
00.
238
6004
80Li
ngyu
n In
dust
rial
2013
-6-1
70.
100
0.09
560
0481
Shua
nglia
ng A
ir-co
nditio
ning
2013
-6-2
40.
250
0.23
8
6004
82 F
engf
an S
tock
2013
-5-3
00.
055
0.05
260
0483
Fujia
n Na
nfan
g Te
xtile
2013
-7-1
60.
050
0.04
8
6004
86Ya
ngno
ng C
hem
ical
2013
-5-2
20.
340
0.32
360
0487
Heng
tong
Pho
toel
ectri
cal
2013
-5-2
80.
110
0.10
5
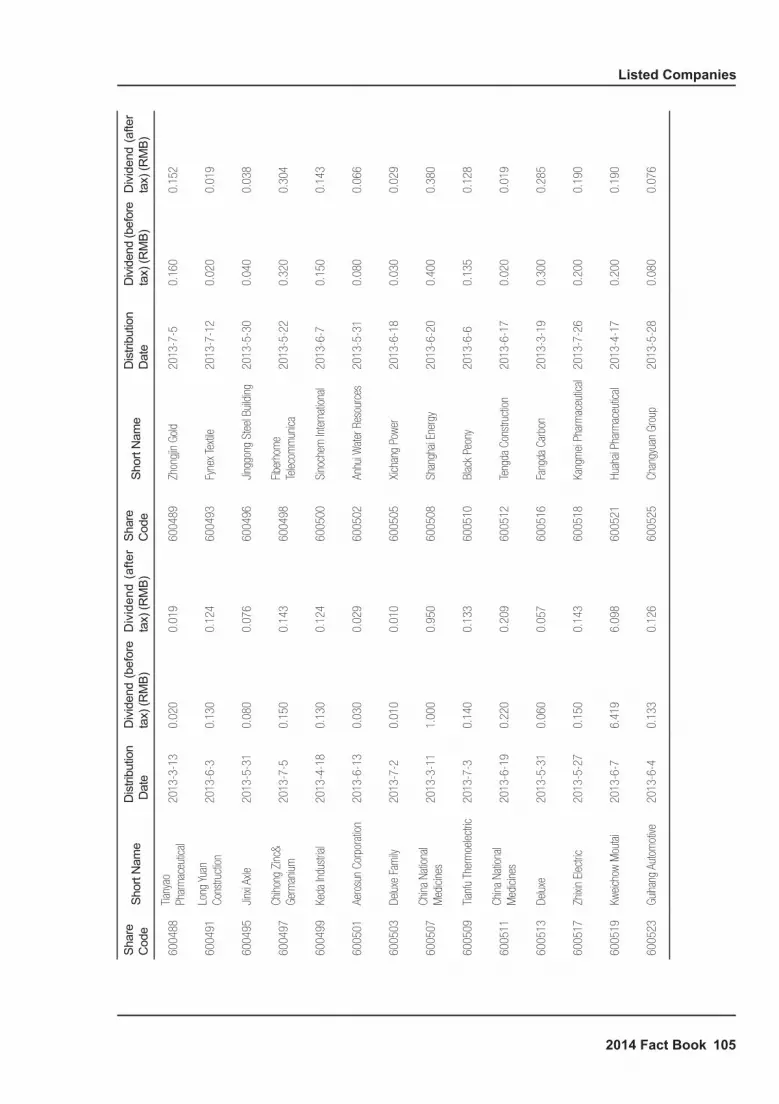
Listed Companies
2014 Fact Book 105
Shar
e C
ode
Shor
t Nam
eD
istrib
utio
n D
ate
Div
iden
d (b
efor
e ta
x) (R
MB)
Div
iden
d (a
fter
tax)
(RM
B)Sh
are
Cod
eSh
ort N
ame
Dist
ribut
ion
Dat
eD
ivide
nd (b
efor
e ta
x) (R
MB)
Div
iden
d (a
fter
tax)
(RM
B)
6004
88Ti
anya
o Ph
arm
aceu
tical
2013
-3-1
30.
020
0.01
960
0489
Zhon
gjin
Gol
d20
13-7
-50.
160
0.15
2
6004
91Lo
ng Y
uan
Cons
truct
ion
2013
-6-3
0.13
00.
124
6004
93Fy
nex
Text
ile20
13-7
-12
0.02
00.
019
6004
95Ji
nxi A
xle20
13-5
-31
0.08
00.
076
6004
96Ji
nggo
ng S
teel
Bui
ldin
g20
13-5
-30
0.04
00.
038
6004
97Ch
ihon
g Zi
nc&
Germ
aniu
m20
13-7
-50.
150
0.14
360
0498
Fibe
rhom
e Te
leco
mm
unica
2013
-5-2
20.
320
0.30
4
6004
99Ke
da In
dust
rial
2013
-4-1
80.
130
0.12
460
0500
Sino
chem
Inte
rnat
iona
l20
13-6
-70.
150
0.14
3
6005
01Ae
rosu
n Co
rpor
atio
n20
13-6
-13
0.03
00.
029
6005
02An
hui W
ater
Res
ourc
es20
13-5
-31
0.08
00.
066
6005
03De
luxe
Fam
ily20
13-7
-20.
010
0.01
060
0505
Xich
ang
Powe
r20
13-6
-18
0.03
00.
029
6005
07Ch
ina
Natio
nal
Med
icine
s20
13-3
-11
1.00
00.
950
6005
08Sh
angh
ai En
ergy
2013
-6-2
00.
400
0.38
0
6005
09Ti
anfu
The
rmoe
lect
ric20
13-7
-30.
140
0.13
360
0510
Blac
k Pe
ony
2013
-6-6
0.13
50.
128
6005
11Ch
ina
Natio
nal
Med
icine
s20
13-6
-19
0.22
00.
209
6005
12Te
ngda
Con
stru
ctio
n 20
13-6
-17
0.02
00.
019
6005
13De
luxe
2013
-5-3
10.
060
0.05
760
0516
Fang
da C
arbo
n 20
13-3
-19
0.30
00.
285
6005
17Zh
ixin
Elec
tric
2013
-5-2
70.
150
0.14
360
0518
Kang
mei
Pha
rmac
eutic
al20
13-7
-26
0.20
00.
190
6005
19Kw
eich
ow M
outa
i20
13-6
-76.
419
6.09
860
0521
Huah
ai Ph
arm
aceu
tical
2013
-4-1
70.
200
0.19
0
6005
23Gu
ihan
g Au
tom
otive
2013
-6-4
0.13
30.
126
6005
25Ch
angy
uan
Grou
p20
13-5
-28
0.08
00.
076

Listed Companies
2014 Fact Book 106
Shar
e C
ode
Shor
t Nam
eD
istrib
utio
n D
ate
Div
iden
d (b
efor
e ta
x) (R
MB)
Div
iden
d (a
fter
tax)
(RM
B)Sh
are
Cod
eSh
ort N
ame
Dist
ribut
ion
Dat
eD
ivide
nd (b
efor
e ta
x) (R
MB)
Div
iden
d (a
fter
tax)
(RM
B)
6005
26Ch
ina
Railw
ay E
rju20
13-6
-13
0.10
00.
095
6005
27Ji
angn
an H
igh
Polym
er20
13-6
-40.
090
0.08
6
6005
28Ch
ina
Railw
ay E
rju20
13-6
-70.
120
0.11
460
0529
Shan
dong
Ph
arm
aceu
tical
Glas
s20
13-7
-30.
140
0.13
3
6005
30Ji
aoda
Onl
ly20
13-6
-24
0.15
00.
143
6005
31Yu
guan
g Go
ld &
Lea
d20
13-6
-40.
050
0.04
8
6005
33Ch
ixia
Deve
lopm
ent
2013
-7-3
0.10
00.
095
6005
35Ta
sly20
13-5
-22
0.20
00.
140
6005
36Ch
ina
Natio
nal
Softw
are
2013
-5-3
10.
070
0.06
760
0543
Mog
ao In
dust
rial
Deve
lopm
ent
2013
-7-9
0.03
30.
031
6005
45Xi
njian
g Ur
ban
Cons
truct
ion
2013
-7-4
0.07
00.
067
6005
46Sh
anxi
Coal
Inte
rnat
iona
l En
ergy
Gro
up
2013
-8-5
0.30
00.
285
6005
47Sh
ando
ng G
old
2013
-7-1
0.16
00.
152
6005
48Sh
enzh
en E
xpre
sswa
y20
13-5
-28
0.13
00.
124
6005
49Xi
amen
Tung
sten
2013
-6-1
40.
250
0.23
860
0551
Tim
e Pu
blish
ing
and
Med
ia20
13-6
-28
0.18
50.
176
6005
52Fa
ngxin
g Sc
ienc
e &
Tech
nolo
gy20
13-5
-23
0.10
00.
095
6005
57Ka
nion
Pha
rmac
eutic
al20
13-5
-13
0.07
00.
067
6005
58At
lantic
Chi
na W
eldi
ng20
13-6
-60.
070
0.06
760
0559
Heng
shui
Lao
baig
an
Liqu
or20
13-7
-30
0.50
00.
475
6005
60Be
ijing
Aritim
e In
tellig
ent C
ontro
l20
13-5
-23
0.11
00.
105
6005
61Ji
angx
i Cha
ngyu
n20
13-8
-12
0.17
00.
162
6005
63Fa
ratro
nic
2013
-5-1
00.
600
0.57
060
0565
Dim
a In
dust
ry20
13-5
-31
0.03
00.
029
6005
70Hu
ndsu
n El
ectro
nics
2013
-5-1
40.
100
0.09
560
0571
Suny
ard
2013
-7-1
0.11
00.
105
6005
72Co
nba
Phar
mac
eutic
al20
13-6
-40.
120
0.11
460
0575
Wuh
u Po
rt20
13-4
-19
0.05
00.
038

Listed Companies
2014 Fact Book 107
Shar
e C
ode
Shor
t Nam
eD
istrib
utio
n D
ate
Div
iden
d (b
efor
e ta
x) (R
MB)
Div
iden
d (a
fter
tax)
(RM
B)Sh
are
Cod
eSh
ort N
ame
Dist
ribut
ion
Dat
eD
ivide
nd (b
efor
e ta
x) (R
MB)
Div
iden
d (a
fter
tax)
(RM
B)
6005
77Ji
ngda
Spe
cial M
agne
t W
ire20
13-5
-17
0.02
00.
019
6005
78Ji
ngne
ng T
herm
al Po
wer
2013
-10-
230.
100
0.09
5
6005
80W
olon
g El
ectri
c20
13-4
-23
0.05
50.
052
6005
81Ba
Yi S
teel
2013
-5-3
10.
070
0.06
7
6005
82Ti
andi
Tian
Di S
cienc
e an
d Te
chno
logy
2013
-7-2
40.
120
0.11
460
0583
Offs
hore
Oil E
ngin
eerin
g20
13-5
-22
0.03
00.
029
6005
85An
hui C
onch
Cem
ent
2013
-6-1
40.
250
0.23
860
0587
Xinh
ua M
edica
l In
stru
men
t20
13-6
-30.
100
0.09
5
6005
88Yo
nyou
Sof
twar
e20
13-5
-70.
200
0.19
060
0589
Guan
gdon
g Ro
ngta
i20
13-7
-12
0.05
50.
052
6005
90Te
llhow
Sci-
Tech
2013
-7-8
0.10
00.
095
6005
92Lo
ngxi
Bear
ing
2013
-7-1
90.
100
0.09
5
6005
94Gu
izhou
Yib
ai Ph
arm
aceu
tical
2013
-6-1
30.
150
0.14
360
0595
Zhon
gfu
Indu
stry
2013
-6-5
0.02
00.
019
6005
96Xi
nan
Chem
ical
2013
-6-3
0.12
00.
114
6005
97Br
ight
Dair
y20
13-5
-27
0.18
00.
171
6006
00Ts
ingt
ao B
rewe
ry20
13-7
-26
0.40
00.
380
6006
01Fo
unde
r Scie
nce
& Te
chno
logy
2013
-8-1
40.
012
0.01
1
6006
04Sh
ibei
Hi-t
ech
2013
-6-2
60.
028
0.02
760
0605
Huito
ng E
nerg
y20
13-6
-40.
015
0.01
4
6006
06Ji
nfen
g In
vest
men
t20
13-7
-30.
062
0.05
960
0611
Dazh
ong
Tran
spor
tatio
n20
13-7
-15
0.08
00.
076
6006
12La
o Fe
ng X
iang
2013
-8-8
0.60
00.
570
6006
14Di
ngli T
echn
olog
y De
velo
pmen
t20
13-7
-30.
040
0.03
8
6006
16Ji
nfen
g W
ine
2013
-7-9
0.10
00.
095
6006
19Sh
angh
ai Hi
ghly
2013
-7-1
0.12
00.
114

Listed Companies
2014 Fact Book 108
Shar
e C
ode
Shor
t Nam
eD
istrib
utio
n D
ate
Div
iden
d (b
efor
e ta
x) (R
MB)
Div
iden
d (a
fter
tax)
(RM
B)Sh
are
Cod
eSh
ort N
ame
Dist
ribut
ion
Dat
eD
ivide
nd (b
efor
e ta
x) (R
MB)
Div
iden
d (a
fter
tax)
(RM
B)
6006
20Sh
angh
ai Ti
anch
en20
13-6
-14
0.01
00.
010
6006
21Sh
angh
ai Ch
inaf
ortu
ne20
13-5
-31
0.11
00.
105
6006
22Ji
abao
Indu
stry
&
Com
mer
ce G
roup
2013
-7-2
50.
180
0.17
160
0623
Doub
le C
oin
2013
-6-1
40.
100
0.09
5
6006
24Fu
dan
Fuhu
a20
13-7
-26
0.03
60.
034
6006
26Sh
angh
ai Sh
enda
2013
-6-3
0.10
00.
095
6006
28Ne
w W
orld
2013
-8-2
20.
150
0.14
360
0633
Zhe
Jian
g Da
ily M
edia
2013
-5-3
10.
250
0.23
8
6006
35Da
zhon
g Pu
blic
Utilit
ies
2013
-7-1
60.
070
0.06
760
0636
3 F
new
Mat
erial
2013
-6-1
80.
110
0.10
5
6006
38Ne
w Hu
ang
Pu R
eal
Esta
te20
13-8
-90.
100
0.09
560
0639
Pudo
ng J
inqi
ao20
13-8
-90.
110
0.10
5
6006
41W
anye
Ent
erpr
ises
2013
-6-3
0.05
00.
048
6006
42Sh
ener
gy20
13-6
-17
0.12
00.
114
6006
44Le
shan
Ele
ctric
Pow
er20
13-8
-10.
050
0.04
860
0647
Tong
da V
entu
re C
apita
l20
13-8
-10.
065
0.04
7
6006
48W
aigao
qiao
2013
-7-9
0.14
00.
133
6006
49Sh
angh
ai Ch
engt
ou20
13-6
-18
0.15
00.
143
6006
50Ji
njian
g In
tern
atio
nal
Indu
stria
l Inve
stm
ent
2013
-6-2
40.
230
0.21
960
0651
Shan
ghai
Feile
Aco
ustic
s20
13-7
-90.
045
0.04
3
6006
52Sh
angh
ai AC
E20
13-7
-80.
107
0.10
260
0654
Shan
ghai
Feilo
2013
-6-2
60.
042
0.04
0
6006
55Yu
yuan
Tour
ist M
art
2013
-6-2
50.
203
0.19
360
0657
Xind
a Re
al Es
tate
2013
-6-1
90.
070
0.06
7
6006
58Be
ijing
Elec
troni
c Zo
ne20
13-5
-17
0.22
10.
210
6006
60Fu
yao
Glas
s20
13-6
-40.
500
0.47
5
6006
62Qi
angs
heng
Hol
ding
2013
-6-1
70.
100
0.09
560
0663
Lujia
zui
2013
-5-2
40.
163
0.15
5

Listed Companies
2014 Fact Book 109
Shar
e C
ode
Shor
t Nam
eD
istrib
utio
n D
ate
Div
iden
d (b
efor
e ta
x) (R
MB)
Div
iden
d (a
fter
tax)
(RM
B)Sh
are
Cod
eSh
ort N
ame
Dist
ribut
ion
Dat
eD
ivide
nd (b
efor
e ta
x) (R
MB)
Div
iden
d (a
fter
tax)
(RM
B)
6006
65Ta
nde
2013
-6-6
0.08
50.
081
6006
66So
uthw
est
Phar
mac
eutic
al20
13-6
-60.
011
0.01
0
6006
68Ji
anfe
ng G
roup
2013
-7-2
20.
150
0.14
360
0673
Dong
yang
guan
g Al
umin
um20
13-5
-21
0.10
00.
095
6006
74Ch
uant
ou E
nerg
y20
13-6
-40.
063
0.05
960
0675
Chin
a En
terp
rise
2013
-7-1
60.
120
0.11
4
6006
76Sh
angh
ai Ji
aoyu
n20
13-7
-10.
100
0.09
560
0677
Aero
spac
e Co
mm
unica
tions
Hol
ding
s20
13-9
-18
0.08
00.
076
6006
82Na
njin
g Xi
njie
kou
Depa
rtmen
t Sto
re20
13-7
-90.
100
0.09
560
0683
Jint
ou Y
inta
i20
13-7
-10.
065
0.06
2
6006
84Pe
arl R
iver I
ndus
trial
2013
-7-5
0.21
00.
175
6006
85G
uang
zhou
Shi
pyar
d In
tern
atio
nal
2013
-7-1
70.
120
0.11
4
6006
86Ji
nlon
g Au
to20
13-6
-24
0.15
00.
143
6006
87Ga
ngta
i Hol
ding
s20
13-4
-11
0.06
00.
057
6006
88Si
nope
c Sh
angh
ai Pe
troch
emica
l20
13-1
2-4
0.05
00.
039
6006
90Qi
ngda
o Ha
ier
2013
-6-7
0.37
00.
352
6006
94Da
shan
g Co
.20
13-6
-19
1.00
00.
950
6006
97Eu
rasia
Gro
up20
13-7
-20.
300
0.28
5
6007
01Go
ng D
a Hi
gh-te
ch20
13-8
-22
0.01
50.
014
6007
02Tu
opai
Shed
e W
ine
2013
-7-2
20.
330
0.31
4
6007
03Sa
nan
opto
elec
troni
cs20
13-7
-15
0.20
00.
190
6007
04Zh
ongd
a Gr
oup
2013
-6-1
90.
180
0.17
1
6007
05Av
ic Ca
pita
l20
13-7
-23
0.15
00.
143
6007
08Sh
angh
ai Ha
ibo
2013
-6-1
40.
100
0.09
5
6007
12N
anni
ng D
epar
tmen
t St
ore
2013
-6-1
80.
036
0.03
460
0717
Tian
jin P
ort
2013
-6-1
30.
180
0.17
1
6007
18 N
euso
ft20
13-6
-30.
150
0.14
360
0719
Dalia
n Th
erm
al Po
wer
2013
-6-7
0.00
50.
005

Listed Companies
2014 Fact Book 110
Shar
e C
ode
Shor
t Nam
eD
istrib
utio
n D
ate
Div
iden
d (b
efor
e ta
x) (R
MB)
Div
iden
d (a
fter
tax)
(RM
B)Sh
are
Cod
eSh
ort N
ame
Dist
ribut
ion
Dat
eD
ivide
nd (b
efor
e ta
x) (R
MB)
Div
iden
d (a
fter
tax)
(RM
B)
6007
20Qi
lians
han
2013
-7-1
50.
050
0.04
860
0723
Beijin
g Ca
pita
l Ret
ailin
g20
13-7
-15
0.25
00.
238
6007
24Ni
ngbo
Fud
a20
13-6
-40.
100
0.09
560
0729
Chon
gqin
g De
partm
ent
Stor
e20
13-5
-16
0.56
40.
536
6007
32Xi
nmei
Rea
l Est
ate
2013
-3-4
0.10
00.
055
6007
36Su
zhou
New
Dist
rict H
i-Te
ch20
13-5
-13
0.05
20.
049
6007
38 L
anzh
ou M
inba
i20
13-5
-29
0.12
00.
114
6007
41Hu
ayu
Auto
mot
ive
Syst
ems
2013
-7-8
0.37
00.
352
6007
42FA
WAY
Aut
omob
ile
Com
pone
nts
2013
-6-1
80.
560
0.53
260
0743
Huay
uan
Prop
erty
2013
-4-2
50.
050
0.04
0
6007
48Sh
angh
ai In
dust
rial
Deve
lopm
ent
2013
-7-1
20.
060
0.05
760
0749
Tib
et To
urism
2013
-7-2
90.
025
0.02
4
6007
50Ji
angz
hong
Ph
arm
aceu
tical
2013
-5-2
30.
300
0.28
560
0754
Jian
g In
tern
atio
nal H
otel
s20
13-6
-17
0.37
00.
352
6007
55Xi
amen
Inte
rnat
iona
l Tr
ade
2013
-7-2
0.10
00.
095
6007
56W
ave
softw
are
2013
-8-2
30.
043
0.04
1
6007
58Ho
ngya
ng E
nerg
y Re
sour
ce20
13-5
-24
0.03
00.
029
6007
59Ha
inan
Zhe
nghe
In
dust
rial G
roup
2013
-8-2
00.
093
0.08
8
6007
61An
hui H
eli
2013
-6-1
90.
210
0.20
060
0764
CEC
Core
Cast
2013
-6-1
40.
023
0.02
2
6007
65AV
IC H
eavy
Mac
hine
ry20
13-6
-19
0.04
00.
038
6007
70Ji
angs
u Zo
ngyi
Co.,
2013
-8-2
0.05
00.
048
6007
73Ti
bet D
evel
opm
ent
2013
-5-3
00.
018
0.01
760
0774
Hans
hang
Gro
up20
13-6
-19
0.04
00.
038
6007
75Na
njin
g Pa
nda
2013
-6-3
0.06
00.
057
6007
76Ea
stco
m20
13-7
-80.
080
0.07
6
6007
78Fr
iend
ship
Gro
up20
13-6
-26
0.33
00.
314
6007
79Sw
ellfu
n20
13-5
-27
0.23
00.
219

Listed Companies
2014 Fact Book 111
Shar
e C
ode
Shor
t Nam
eD
istrib
utio
n D
ate
Div
iden
d (b
efor
e ta
x) (R
MB)
Div
iden
d (a
fter
tax)
(RM
B)Sh
are
Cod
eSh
ort N
ame
Dist
ribut
ion
Dat
eD
ivide
nd (b
efor
e ta
x) (R
MB)
Div
iden
d (a
fter
tax)
(RM
B)
6007
80To
ngba
o En
ergy
2013
-6-2
80.
100
0.09
560
0783
Luxin
Ven
ture
Cap
ital
2013
-6-1
90.
150
0.14
3
6007
84Lu
yin In
vest
men
t20
13-6
-26
0.03
00.
029
6007
85Xi
nhua
Dep
artm
ent
2013
-7-1
50.
300
0.28
5
6007
87Zh
ongc
hu
Deve
lopm
ent
2013
-6-1
80.
050
0.04
860
0790
Ligh
t and
Texti
le In
dustr
ial
City
2013
-6-7
0.20
00.
190
6007
91Ji
ngne
ng P
rope
rty20
13-6
-24
0.05
00.
048
6007
94Zh
angj
iaga
ng F
reet
rade
Sc
ienc
e an
d Te
chno
logy
Co
2013
-3-1
40.
210
0.20
0
6007
95GD
Pow
er20
13-5
-23
0.13
00.
124
6008
01Hu
axin
Cem
ent
2013
-6-6
0.18
00.
171
6008
02Fu
jian
Cem
ent
2013
-7-9
0.03
00.
029
6008
04Dr
.Pen
g Te
chno
logy
2013
-7-4
0.05
00.
048
6008
05Yu
eda
2013
-6-1
40.
150
0.13
360
0807
Tyan
Hom
e20
13-8
-12
0.01
40.
013
6008
09Sh
anxi
Fen
Win
e20
13-6
-27
0.80
00.
760
6008
12No
rth C
hina
Ph
arm
aceu
tical
2013
-8-1
40.
037
0.03
5
6008
14Ha
ngzh
ou J
ieba
i20
13-5
-17
0.07
50.
071
6008
15Xi
amen
XGM
A M
achi
nery
2013
-7-1
00.
050
0.04
8
6008
16An
xin Tr
ust
2013
-6-2
40.
100
0.09
560
0818
Zhon
glu
2013
-5-2
90.
025
0.01
9
6008
19Ya
opi G
lass
2013
-7-2
30.
025
0.02
460
0820
Tunn
el E
ngin
eerin
g20
13-5
-23
0.27
00.
257
6008
23Sh
angh
ai Sh
imao
Co.
2013
-12-
60.
090
0.08
660
0824
Yim
in D
epar
tmen
t Sto
res
2013
-7-2
60.
065
0.05
2
6008
25Xi
nhua
Med
ia20
13-8
-12
0.03
20.
030
6008
26La
nshe
ng20
13-5
-27
0.04
00.
038

Listed Companies
2014 Fact Book 112
Shar
e C
ode
Shor
t Nam
eD
istrib
utio
n D
ate
Div
iden
d (b
efor
e ta
x) (R
MB)
Div
iden
d (a
fter
tax)
(RM
B)Sh
are
Cod
eSh
ort N
ame
Dist
ribut
ion
Dat
eD
ivide
nd (b
efor
e ta
x) (R
MB)
Div
iden
d (a
fter
tax)
(RM
B)
6008
27Yo
uyi S
hare
s20
13-7
-29
0.30
00.
285
6008
28Ch
engs
hang
Gro
up20
13-5
-80.
030
0.02
9
6008
30Su
nny
Loan
Top
2013
-6-1
70.
050
0.04
860
0831
Shaa
nxi B
road
cast
and
TV
Net
work
Inte
rmed
iary
2013
-6-3
0.04
00.
038
6008
32Sh
angh
ai Or
ient
al Pe
arl
2013
-8-1
90.
180
0.17
160
0833
No.1
Pha
rmac
y20
13-8
-20.
050
0.04
8
6008
34Sh
ento
ng M
etro
2013
-6-2
40.
070
0.06
760
0835
Shan
ghai
Shan
ghai
Mec
hani
cal a
nd E
lect
rical
Indu
stry
2013
-7-3
0.21
00.
200
6008
36Ji
elon
g In
dust
ry20
13-7
-17
0.03
00.
029
6008
37Ha
itong
Sec
uritie
s20
13-7
-17
0.12
00.
114
6008
38Sh
angh
ai Jo
in B
uy20
13-7
-26
0.02
00.
019
6008
39Si
chua
n Ch
angh
ong
Elec
tric
2013
-8-1
30.
010
0.01
0
6008
41Sh
angh
ai Di
esel
Engi
ne20
13-8
-12
0.07
10.
067
6008
45Ba
osig
ht S
oftw
are
2013
-5-2
90.
230
0.21
9
6008
46To
ngji
Scie
nce&
Tech
nolo
gy20
13-7
-80.
020
0.01
960
0850
Shan
ghai
East
-Chi
na
Com
pute
r20
13-6
-30.
200
0.19
0
6008
53Lo
ngjia
n Ro
ad &
Brid
ge20
13-7
-22
0.01
00.
010
6008
57HI
T Sh
ouch
uang
2013
-5-3
10.
050
0.04
8
6008
58Si
lver P
laza
Grou
p20
13-7
-25
0.07
00.
067
6008
59W
angf
ujin
g20
13-7
-19
0.70
00.
665
6008
61Be
ijing
Urba
n-Ru
ra20
13-5
-10
0.13
00.
124
6008
62Na
nton
g Sc
i & Te
ch20
13-7
-30
0.02
50.
024
6008
63In
ner M
ongo
lia
Men
gdia
n H
uane
ng
Ther
mal
Powe
r20
13-7
-80.
220
0.20
960
0864
Hato
u In
vest
men
t20
13-8
-12
0.25
00.
238
6008
67To
nghu
a Do
ngba
o Ph
arm
aceu
tical
2013
-5-2
40.
200
0.19
060
0869
Sanp
u m
edici
ne20
13-5
-30
0.20
00.
190

Listed Companies
2014 Fact Book 113
Shar
e C
ode
Shor
t Nam
eD
istrib
utio
n D
ate
Div
iden
d (b
efor
e ta
x) (R
MB)
Div
iden
d (a
fter
tax)
(RM
B)Sh
are
Cod
eSh
ort N
ame
Dist
ribut
ion
Dat
eD
ivide
nd (b
efor
e ta
x) (R
MB)
Div
iden
d (a
fter
tax)
(RM
B)
6008
72Jo
njee
Hi-T
ech
2013
-7-5
0.05
00.
048
6008
73M
eihu
a20
13-7
-50.
100
0.09
5
6008
74Ca
pita
l Env
ironm
enta
l Pr
otec
tion
2013
-7-8
0.06
00.
057
6008
75Do
ngfa
ng E
lect
ric20
13-7
-17
0.11
00.
105
6008
79Ae
rosp
ace
Tim
es
Elec
troni
cs20
13-3
-80.
100
0.09
560
0880
Boru
i com
mun
icatio
n20
13-4
-30.
230
0.21
9
6008
81Ya
tai G
roup
2013
-6-2
50.
100
0.09
560
0882
Huali
an M
inin
g20
13-9
-30
0.20
00.
190
6008
83Bo
win
Tech
nolo
gy20
13-6
-27
0.02
00.
019
6008
84Ni
ngbo
Sha
nsha
n20
13-6
-18
0.06
00.
057
6008
86SD
IC P
ower
2013
-5-2
20.
084
0.08
060
0887
Erie
2013
-5-3
10.
280
0.26
6
6008
88Xi
njian
g Jo
inwo
rld20
13-6
-13
0.10
00.
095
6008
91Ty
urin
Gro
up20
13-7
-15
0.05
00.
048
6008
93Ae
ro-e
ngin
e20
13-6
-30.
081
0.07
760
0895
Zhan
gjian
g Hi
gh
Tech
nolo
gy P
ark
2013
-8-2
0.08
00.
076
6008
97Xi
amen
Int
erna
tiona
l Ai
rpor
t20
13-6
-30.
390
0.37
160
0900
Yang
tze P
ower
2013
-7-1
0.33
20.
315
6009
60Bo
hai P
iston
2013
-7-2
20.
026
0.02
560
0962
SDIC
Zho
nglu
Fru
it Ju
ice20
13-5
-28
0.05
00.
048
6009
65Fo
rtune
Ng
Fung
2013
-5-2
80.
030
0.02
960
0966
Bohu
i Pap
er In
dust
ry20
13-6
-28
0.00
50.
005
6009
67Be
ifang
Chu
angy
e20
13-6
-27
0.10
00.
095
6009
69Ch
endi
an In
tern
atio
nal
2013
-6-5
0.16
60.
158
6009
70Si
nom
a In
tern
atio
nal
2013
-5-2
70.
210
0.20
060
0971
Heng
yuan
Coa
l Ind
ustry
an
d El
ectri
city
Powe
r20
13-6
-18
0.26
00.
247
6009
73Ba
oshe
ng S
cienc
e an
d Te
chno
logy
2013
-7-4
0.10
00.
095
6009
75Ne
w W
ellfu
l20
13-7
-15
0.05
00.
048

Listed Companies
2014 Fact Book 114
Shar
e C
ode
Shor
t Nam
eD
istrib
utio
n D
ate
Div
iden
d (b
efor
e ta
x) (R
MB)
Div
iden
d (a
fter
tax)
(RM
B)Sh
are
Cod
eSh
ort N
ame
Dist
ribut
ion
Dat
eD
ivide
nd (b
efor
e ta
x) (R
MB)
Div
iden
d (a
fter
tax)
(RM
B)
6009
76W
uhan
Jian
min
2013
-5-1
60.
380
0.36
160
0978
Wuh
an J
ianm
inYi
hua
Tim
ber
2013
-5-2
30.
080
0.07
6
6009
79Gu
anga
n Aa
a Pu
blic
2013
-5-2
30.
050
0.04
860
0981
Jian
gsu
High
Hop
e20
13-6
-13
0.03
00.
029
6009
82Ni
ngbo
The
rmal
2013
-7-1
00.
125
0.11
960
0983
Hefe
i Ron
gshi
da S
anyo
2013
-8-1
0.05
00.
048
6009
85Le
imin
gkeh
ua20
13-8
-20
0.10
00.
095
6009
86Ke
da G
roup
2013
-8-1
0.05
00.
048
6009
87Zh
ejian
g Ha
ngm
in20
13-6
-17
0.20
00.
190
6009
92Gu
izhou
Wire
2013
-6-1
70.
050
0.04
8
6009
93M
ayin
glon
g20
13-7
-15
0.16
00.
152
6009
95W
ensh
an E
lect
ric P
ower
2013
-6-1
80.
100
0.09
5
6009
97Ka
iluan
Cle
an C
oal
2013
-4-2
20.
120
0.11
460
0999
Chin
a M
erch
ants
Se
curit
ies
2013
-7-2
20.
142
0.13
5
6010
00Ta
ngsh
an P
ort
2013
-5-2
30.
050
0.04
860
1001
Dato
ng C
oal
2013
-8-8
0.01
20.
011
6010
06Da
qin
Railw
ay20
13-6
-50.
390
0.37
160
1007
Jinl
ing
Hote
l 20
13-8
-60.
115
0.10
9
6010
08Li
anyu
ngan
g Po
rt20
13-6
-30.
060
0.05
760
1009
Bank
of N
anjin
g20
13-7
-18
0.40
60.
386
6010
10W
enfe
ng20
13-5
-80.
500
0.47
560
1018
Ning
bo P
ort
2013
-6-1
90.
087
0.08
3
6010
28Yu
long
2013
-5-1
50.
250
0.23
860
1038
Firs
t Tra
ctor
2013
-7-1
50.
100
0.09
5
6010
58Sa
ilun
Co.
2013
-7-8
0.15
00.
143
6010
88Ch
ina
Shen
hua
2013
-7-8
0.96
00.
912
6010
98Ch
ina
Sout
h Pu
blish
ing&
Med
ia20
13-6
-14
0.18
00.
171
6010
99Pa
cific
Ocea
n20
13-7
-15
0.01
50.
014

Listed Companies
2014 Fact Book 115
Shar
e C
ode
Shor
t Nam
eD
istrib
utio
n D
ate
Div
iden
d (b
efor
e ta
x) (R
MB)
Div
iden
d (a
fter
tax)
(RM
B)Sh
are
Cod
eSh
ort N
ame
Dist
ribut
ion
Dat
eD
ivide
nd (b
efor
e ta
x) (R
MB)
Div
iden
d (a
fter
tax)
(RM
B)
6011
00He
ngli c
ylind
er20
13-4
-25
0.15
30.
145
6011
01Ha
ohua
Ene
rgy
2013
-6-2
70.
220
0.20
9
6011
06Ch
ina
Firs
t Hea
vy
Indu
strie
s20
13-7
-20.
001
0.00
160
1107
Chen
gdu-
Chon
gqin
g Hi
ghwa
y20
13-6
-17
0.08
00.
076
6011
11Ai
r Chi
na20
13-7
-10
0.05
90.
056
6011
13Ch
ina
Ting
nylo
n20
13-6
-70.
050
0.04
8
6011
16Sa
njian
g Sh
oppi
ng20
13-5
-23
0.20
00.
190
6011
17Ch
ina
Natio
nal C
hem
ical
Engi
neer
ing
2013
-7-1
00.
065
0.06
2
6011
18Ha
inan
Rub
ber
2013
-6-1
90.
050
0.04
860
1126
Sifa
ng A
utom
atio
n20
13-5
-30
0.25
00.
238
6011
37Bo
wei W
eldi
ng20
13-5
-31
0.18
00.
171
6011
39Sh
enzh
en G
as20
13-6
-24
0.13
60.
129
6011
58Ch
ongq
ing
Wat
er20
13-5
-20
0.26
20.
249
6011
66In
dust
rial B
ank
2013
-7-3
0.57
00.
517
6011
68W
este
rn M
inin
g20
13-5
-16
0.10
00.
095
6011
69Ba
nk o
f Bei
jing
2013
-7-2
20.
400
0.38
0
6011
77H
angz
hou
Adv
ance
Ge
arbo
x Gr
oup
2013
-6-3
0.02
00.
019
6011
86Ch
ina
Railw
ay
Cons
truct
ion
2013
-7-2
20.
110
0.10
5
6011
88He
ilong
jiang
Tr
ansp
orta
tion
Deve
lopm
ent
2013
-5-2
40.
011
0.01
060
1199
Jian
gnan
Wat
er20
13-5
-27
0.25
00.
238
6012
08Do
ngca
i Tec
hnol
ogy
2013
-5-7
0.20
00.
190
6012
16In
ner M
ongo
lia J
unzh
eng
2013
-8-2
10.
050
0.04
8
6012
22Li
n Ya
ng E
lect
roni
cs20
13-5
-16
0.35
00.
333
6012
31US
I Ele
ctro
nics
2013
-6-1
40.
192
0.18
2
6012
33To
ngku
n Gr
oup
2013
-4-2
30.
100
0.09
560
1238
Guan
gzho
u Au
tom
obile
Gr
oup
2013
-7-1
60.
020
0.01
9

Listed Companies
2014 Fact Book 116
Shar
e C
ode
Shor
t Nam
eD
istrib
utio
n D
ate
Div
iden
d (b
efor
e ta
x) (R
MB)
Div
iden
d (a
fter
tax)
(RM
B)Sh
are
Cod
eSh
ort N
ame
Dist
ribut
ion
Dat
eD
ivide
nd (b
efor
e ta
x) (R
MB)
Div
iden
d (a
fter
tax)
(RM
B)
6012
38Gu
angz
hou
Auto
mob
ile
Grou
p20
13-1
0-8
0.06
00.
057
6012
88Ag
ricul
tura
l Ban
k of
Ch
ina
2013
-6-2
80.
157
0.14
9
6012
99Ch
ina
North
Rail
way
2013
-7-2
50.
100
0.09
560
1311
Cam
el C
o.20
13-5
-29
0.17
00.
162
6013
13Ji
angn
an J
iajie
2013
-4-8
0.30
00.
285
6013
18Pi
ng A
n In
sura
nce
2013
-5-2
00.
300
0.28
5
6013
18Pi
ng A
n In
sura
nce
2013
-9-1
00.
200
0.19
060
1328
Bank
of C
omm
unica
tions
2013
-7-1
10.
240
0.22
8
6013
33Gu
angs
hen
Railw
ay20
13-7
-16
0.08
00.
076
6013
39Br
os E
aste
rn
2013
-6-2
70.
105
0.10
0
6013
69Xi
'an
Shaa
ngu
Powe
r20
13-4
-22
0.35
00.
333
6013
77In
dust
rial S
ecur
ities
2013
-4-1
10.
120
0.11
4
6013
88Ye
chiu
Met
al Re
cycli
ng20
13-6
-40.
100
0.09
560
1390
Chin
a Ra
ilway
2013
-8-5
0.05
20.
049
6013
98IC
BC20
13-6
-26
0.23
90.
227
6015
15Do
ngfe
ng A
uto
2013
-6-2
40.
380
0.36
1
6015
15Do
ngfe
ng A
uto
2013
-10-
100.
650
0.61
860
1518
Jilin
Exp
ress
way
2013
-7-3
0.06
40.
061
6015
55So
ocho
w Se
curit
ies
2013
-6-2
40.
050
0.04
860
1566
Joeo
ne20
13-6
-19
0.70
00.
665
6015
67Sa
nxin
g El
ectri
c20
13-7
-20.
500
0.47
560
1588
North
Sta
r Ind
ustri
al20
13-7
-80.
060
0.05
7
6015
99Lu
kang
Tech
nolo
gy20
13-5
-30
0.05
00.
048
6016
01Pa
cific
Insu
ranc
e20
13-7
-22
0.35
00.
333
6016
07Sh
angh
ai Ph
arm
aceu
tical
2013
-7-2
40.
240
0.22
860
1608
CITI
C He
avy
Indu
strie
s20
13-8
-16
0.05
60.
053
6016
16Sh
angh
ai G
uang
dian
El
ectri
c Gr
oup
2013
-5-2
40.
100
0.09
560
1628
Chin
a Li
fe20
13-6
-18
0.14
00.
133

Listed Companies
2014 Fact Book 117
Shar
e C
ode
Shor
t Nam
eD
istrib
utio
n D
ate
Div
iden
d (b
efor
e ta
x) (R
MB)
Div
iden
d (a
fter
tax)
(RM
B)Sh
are
Cod
eSh
ort N
ame
Dist
ribut
ion
Dat
eD
ivide
nd (b
efor
e ta
x) (R
MB)
Div
iden
d (a
fter
tax)
(RM
B)
6016
33Gr
eat W
all M
otor
2013
-5-2
40.
570
0.54
260
1636
Kibi
ng G
roup
2013
-4-1
90.
100
0.09
5
6016
66Pi
ngdi
ngsh
an T
ianan
Co
al20
13-6
-20
0.14
30.
136
6016
68Ch
ina
Stat
e Co
nstru
ctio
n20
13-7
-25
0.10
50.
100
6016
69Ch
ina
hydr
opow
er20
13-7
-40.
128
0.12
260
1677
Alph
a Al
umin
um20
13-7
-30.
100
0.09
5
6016
78Be
far
2013
-4-1
70.
150
0.14
360
1688
Huat
ai Se
curit
ies
2013
-6-1
30.
150
0.14
3
6016
99Lu
’An
Envir
onm
enta
l En
ergy
2013
-4-1
70.
336
0.31
960
1700
Feng
fan
Powe
r Eq
uipm
ent
2013
-4-2
0. 5
000.
475
6017
17Zh
engz
hou
Coal
Min
ing
Mac
hine
ry20
13-6
-26
0.30
00.
285
6017
18Ji
hua
Grou
p20
13-7
-80.
030
0.02
9
6017
27Sh
angh
ai El
ectri
c20
13-8
-16
0.06
40.
061
6017
66Ch
ina
Sout
h Lo
com
otive
&
Rollin
g20
13-7
-80.
090
0.08
6
6017
77Li
fan
2013
-6-2
00.
200
0.19
060
1788
Ever
brig
ht S
ecur
ities
2013
-4-2
60.
092
0.08
7
6017
89Ni
ngbo
Con
stru
ctio
n20
13-5
-24
0.10
00.
095
6017
98La
npec
Tech
nolo
gies
2013
-7-4
0.07
00.
067
6017
99Xi
ngyu
Aut
omot
ive20
13-6
-70.
655
0.62
260
1800
Chin
a Co
mm
unica
tions
Co
nstru
ctio
n Co
mpa
ny20
13-8
-21
0.18
50.
175
6018
01Ch
ina
Anhu
i Xin
hua
Med
ia20
13-6
-18
0.17
00.
162
6018
08Ch
ina
Oilfie
ld S
ervic
es20
13-6
-13
0.31
00.
295
6018
18Ev
erbr
ight
Ban
k20
13-6
-60.
058
0.05
560
1857
Petro
Chi
na
20
13-6
-60.
131
0.12
5
6018
57Pe
tro C
hina
2013
-9-1
20.
161
0.15
360
1872
Chin
a M
erch
ants
Ene
rgy
Ship
ping
2013
-7-1
90.
006
0.00
6
6018
77Zh
engt
ai El
ectri
c Ap
plian
ce20
13-5
-60.
600
0.57
060
1877
Zhen
gtai
Elec
tric
Appl
iance
2013
-9-2
60.
400
0.38
0

Listed Companies
2014 Fact Book 118
Shar
e C
ode
Shor
t Nam
eD
istrib
utio
n D
ate
Div
iden
d (b
efor
e ta
x) (R
MB)
Div
iden
d (a
fter
tax)
(RM
B)Sh
are
Cod
eSh
ort N
ame
Dist
ribut
ion
Dat
eD
ivide
nd (b
efor
e ta
x) (R
MB)
Div
iden
d (a
fter
tax)
(RM
B)
6018
80Da
lian
Port
2013
-8-1
20.
050
0.04
860
1886
Jang
ho C
urta
in20
13-5
-14
0.26
00.
247
6018
88Ch
ina
Inte
rnat
iona
l Tr
avel
Ser
vice
2013
-5-2
20.
350
0.33
360
1890
Yaxin
g an
chor
2013
-6-2
60.
060
0.05
7
6018
98Ch
ina
Coal
Ener
gy20
13-5
-27
0.21
00.
200
6018
99Zi
jin M
inin
g20
13-7
-50.
100
0.09
5
6019
01Fo
unde
r Sec
uritie
s20
13-7
-16
0.03
70.
035
6019
08Ji
ngyu
nton
g20
13-6
-14
0.03
00.
029
6019
18SD
IC X
inji
2013
-8-1
50.
100
0.08
560
1928
Phoe
nix
med
ia20
13-7
-15
0.10
00.
095
6019
28Ph
oeni
x m
edia
2013
-10-
280.
100
0.09
560
1929
Jish
i Med
ia20
13-5
-20
0.05
00.
048
6019
33Yo
nghu
i Sup
erm
arke
t20
13-5
-10
0.30
00.
285
6019
39Ch
ina
Cons
truct
ion
Bank
2013
-6-2
10.
268
0.25
5
6019
58Ji
ndui
chen
g M
olyb
denu
m20
13-5
-28
0.16
00.
152
6019
65Ch
ina
Auto
mot
ive
Engi
neer
ing
Res
earc
h In
stitu
te
2013
-6-4
0.10
00.
095
6019
88Ba
nk o
f Chi
na20
13-6
-18
0.17
50.
166
6019
89Ch
ina
Ship
build
ing
Indu
stry
2013
-7-4
0.06
50.
061
6019
91Da
tang
Inte
rnat
iona
l Po
wer G
ener
atio
n20
13-8
-90.
100
0.09
560
1992
BBM
G20
13-7
-10
0.07
10.
067
6019
96Fe
nglin
Gro
up20
13-5
-17
0.05
00.
048
6019
98Ci
tic B
ank
2013
-7-1
80.
150
0.14
3
6019
99Pu
blish
ing
and
Med
ia20
13-8
-50.
037
0.03
560
3000
Peop
le.cn
2013
-7-1
20.
550
0.52
3
6030
01Ao
kang
Inte
rnat
iona
l20
13-5
-31
0.40
00.
380
6030
02Ho
ngch
ang
Elec
troni
cs20
13-6
-20
0.03
60.
034

Listed Companies
2014 Fact Book 119
Shar
e C
ode
Shor
t Nam
eD
istrib
utio
n D
ate
Div
iden
d (b
efor
e ta
x) (R
MB)
Div
iden
d (a
fter
tax)
(RM
B)Sh
are
Cod
eSh
ort N
ame
Dist
ribut
ion
Dat
eD
ivide
nd (b
efor
e ta
x) (R
MB)
Div
iden
d (a
fter
tax)
(RM
B)
6030
03Lo
nyer
Fue
ls20
13-7
-18
0.05
00.
048
6030
08Xi
linm
en F
urni
ture
2013
-6-1
40.
180
0.17
1
6030
77He
bang
2013
-4-1
70.
400
0.38
060
3123
Cuiw
ei To
wer C
o.,
2013
-5-1
70.
200
0.19
0
6031
28CT
S In
tern
atio
nal
Tran
spor
tatio
n20
13-7
-26
0.08
00.
076
6031
67Bo
hai F
erry
2013
-6-2
70.
170
0.16
2
6033
33St
ar C
able
2013
-5-3
10.
048
0.04
660
3366
Sunr
ise20
13-4
-26
0.71
00.
675
6033
99Ne
w Ch
ina
Drag
on20
13-6
-20
0.05
50.
052
6037
66 L
oncin
Mot
or20
13-5
-29
0.17
50.
166
6039
93C
hina
Mol
ybde
num
Co
.,20
13-6
-25
0.12
00.
114
Note
: Sta
tistic
s re
leas
ed w
ithin
201
3 sh
ould
be
used
.

Listed Companies
2014 Fact Book 120
Table of Changes in Stock Short Names in 2013
Stock Code Date of Change New Short Name
Former Short Name
600112 2013-12-24 Tiancheng Holding Changzheng Electric
600234 2013-5-2 *ST Tianlong ST Tianlong
600258 2013-9-10 Beijing Tourism Group Hotels Beijing Capital Tourism
600265 2013-5-3 *ST Jinggu ST Jinggu
600280 2013-10-22 Central Emporium Nanjing Central Emporium
600292 2013-7-24 CPI Yuanda Jiulong Electric Power
600309 2013-6-6 Wanhua Chemical Yantai Wanhua
600323 2013-12-10 Grandblue Environment Nanhai Development
600332 2013-8-29 Baiyunshan Pharmaceutical Guangzhou Pharmaceutical
600381 2013-5-2 *ST Qinghai Sunshiny Mining ST Qinghai Sunshiny Mining
600490 2013-7-25 Pengxin International Mining Shanghai Synica
600556 2013-2-8 ST Beisheng Pharmaceutical *ST Beisheng Pharmaceutical
600556 2013-5-3 *ST Beisheng Pharmaceutical ST Beisheng Pharmaceutical
600562 2013-7-16 Glarun Technology Gaochun Ceramics
600578 2013-10-10 Jingneng Thermal Power Jinneng Thermal Power
600613 2013-10-22 Shenqi Pharmaceutical Wingsung Investment
600617 2013-5-3 *ST Lian Hua ST Lian Hua
600621 2013-2-8 Chinafortune Shanghai Jinling
600688 2013-8-20 Sinopec Shanghai Petrochemical S Sinopec Shanghai Petrochemical
600691 2013-4-17 Yangmei Chemical Dongxin Electrical Carbon
600698 2013-7-5 ST Qinqi Motorcycle *ST Qinqi Motorcycle
600751 2013-6-4 Tianjin Marine Shipping S Tianjin Marine Shipping
600769 2013-5-3 *ST Xianglong ST Xianglong
600771 2013-7-9Guangyuyuan Chinese Herbal Medicine
Topsun Science and Technology
600817 2013-2-8 ST Hongsheng *ST Hongsheng
600869 2013-9-13 Far East Cable S&P Pharmaceutical
600871 2013-8-20 Yizheng Chemical Fibre S Yizheng Chemical Fibre
601886 2013-6-3 Jangho Group Jangho Curtain Wall
900904 2013-10-22 Shenqi Pharmaceutical B Wingsung Investment B
900913 2013-5-3 *ST Lianhua B ST Lianhua B
900946 2013-7-5 ST Qinqi Motorcycle B *ST Qinqi Motorcycle B

Listed Companies
2014 Fact Book 121
Companies Subject to Delisting Risk Warnings in 2013
No Stock Code Short Name CommencementDate
Short Name after Enforcement of Delisting Risk Warnings
1 600961 Zhuzhou Smelter Group 2013-3-15 *ST Zhuzhou Smelter Group
2 601919 China COSCO 2013-3-29 *ST China COSCO
3 600707 IRICO Display Devices 2013-4-1 *ST IRICO Display Devices
4 600538Beihai Gofar Marine Biological Industry
2013-4-1*ST Beihai Gofar Marine Biological Industry
5 600760 Zhonghang Heibao 2013-4-2 *ST Zhonghang Heibao
6 600980BGRIMM Materials & Techology
2013-4-3 *ST BGRIMM Materials & Techology
7 601268 China Erzhong Group 2013-4-24 *ST China Erzhong Group
8 600381 ST Qinghai Sunshiny Mining 2013-5-2 *ST Qinghai Sunshiny Mining
9 600319 Yaxing Chemical 2013-5-2 *ST Yaxing Chemical
10 600444 Guotong Hi-tech Pipes 2013-5-2 *ST Guotong Hi-tech Pipes
11 600234 ST Tianlong 2013-5-2 *ST Tianlong
12 600074Zhongda New Material Group
2013-5-2 *ST Zhongda New Material Group
13 600769ST Xianglong Power Industry
2013-5-3 *ST Xianglong Power Industry
14 600555 Jiulongshan 2013-5-3 *ST Jiulongshan
15 900955 Jiulongshan B 2013-5-3 *ST Jiulongshan B
16 600265 ST Jinggu 2013-5-3 *ST Jinggu
17 600617 ST Lianhua 2013-5-3 *ST Lianhua
18 900913 ST Lianhua B 2013-5-3 *ST Lianhua B
19 600769 ST Xianglong 2013-5-3 *ST Xianglong
20 600301 Nanning Chemical Industry 2013-5-3 *ST Nanning Chemical Industry
21 600556ST Beisheng Pharmaceutical
2013-5-3 *ST Beisheng Pharmaceutical
22 600358 China United Travel 2013-5-3 *ST China United Travel

Listed Companies
2014 Fact Book 122
Companies Subject to other risk warning in 2013
No. A-share Code A-share Short Name Commencement Date A-share Short Name after Enforcement of Delisting Risk Warnings
1 600381 Qinghai Sunshiny Mining 2013-3-6 ST Qinghai Sunshiny Mining
Companies Subject to Listing Termination in 2013
No. A-share Code A-share Short Name B-share Code B-share Short Name
Commencement Date for Implementation of Listing Suspension
1 600087 *ST Tanker Corporation 2013-5-14
2 600385 *ST Jintai Group 2013-5-14
Companies Subject to Listing Termination in 2013
No. A-share Code A-share Short Name B-share Code B-share Short Name
Commencement Date for Implementation of Listing Termination
1 600253Topfond Pharmaceutical
2013-7-15
2 900949Southeast Electric Power B
2013-11-7
Companies Subject to Listing Resumption in 2013
No. A-share Code
A-share Short Name
B-share Code
B-share Short Name
Listing Date for the Announcement of Listing Resumption
A-share Short Name Subject to Listing Resumption
B-share Short Name Subject to Listing Resumption
1 600556*ST Beisheng Pharmaceutical
2013-2-8ST Beisheng Pharmaceutical
2 600817 *ST Hongsheng 2013-2-8ST Hongsheng Technology
3 600698 *ST Qingqi 900946*ST Qingqi B
2013-7-5 ST Qingqi ST Qingqi B

Listed Companies
2014 Fact Book 123
Companies Subject to Cancellation of Risk Warning in 2013
I Companies Subject to Withdrawal of Delisting Risk Warnings
II Companies Subject to Cancellation of Other Risk Warning
No. Company Code Company Short Name A-share Short Name after Withdrawal of
Delisting Risk Warnings
Commencement Date for Implementation of Withdrawal of Delisting Risk Warnings
1 600678 *ST Golden Summit Sichuan Golden Summit 2013-2-4
2 600076*ST Jadebird Huaguang Technology
Jadebird Huaguang Technology 2013-3-7
3 600338*ST Tibet Summit Industry
Tibet Summit Industry 2013-3-12
4 600691*ST Dongxin Electrical Carbon
Dongxin Electrical Carbon 2013-4-3
5 600733 *ST Qianfeng Electronics S Qianfeng Electronics 2013-4-8
6 600462*ST Shixian Bailu apermaking
Shixian Bailu Papermaking 2013-4-8
7 600359*ST Xinjiang Talimu Agriculture Development
Xinjiang Talimu Agriculture Development 2013-4-10
8 600392 *ST Tiancheng Shenghe Resources Holding 2013-5-2
9 600250 *ST Nanfang Textile Nanfang Textile 2013-5-6
10 600766 *ST Yuancheng Gold Yuancheng Gold 2013-5-9
11 600877 *ST China Jialing Industrial China Jialing Industrial 2013-5-10
No. A-shareCode A-share Short Name B-share
Code
B-share Short Name
A-share Short Name after Withdrawal of Delisting Risk Warnings
B-share Short Name after Withdrawal of Delisting Risk Warnings
Commencement Date for Implementation of Withdrawal of Delisting Risk Warnings
1 600656ST BoYuan Investment
BoYuan Investment 2013-1-30
2 600722ST Jinniu Chemical Industry
J i n n i u C h e m i c a l Industry
2013-1-31
3 600681 ST Winowner Group Winowner Group 2013-1-31
4 600083ST Boxin Investing & Holdings
Box in Inves t ing & Holdings
2013-2-1
5 600705 ST Avic Capital Avic Capital 2013-2-6

Listed Companies
2014 Fact Book 124
No. A-shareCode A-share Short Name B-share
Code
B-share Short Name
A-share Short Name after Withdrawal of Delisting Risk Warnings
B-share Short Name after Withdrawal of Delisting Risk Warnings
Commencement Date for Implementation of Withdrawal of Delisting Risk Warnings
6 600988STChifeng Jilong Gold Mining
Chifeng Jilong Gold Mining
2013-2-7
7 600608ST Shanghai Broadband Technology
Shanghai Broadband Technology
2013-2-8
8 600885 ST Hongfa Technology Hongfa Technology 2013-2-26
9 600870ST Xiamen Overseas Chinese Electronic
Xiamen Overseas Chinese Electronic
2013-3-14
10 900939ST Huili Building Materials B
Huili Building Materials B
2013-3-25
11 600455ST But'one Information Corporation
But'one Information Corporation
2013-3-28
12 600892ST Baocheng Investment
Baocheng Investment 2013-4-22
13 600751SST Tianjin Marine Shipping
900938ST Tianjin Marine Shipping B
S Tianjin Marine Shipping
Tianjin Marine Shipping B
2013-4-23
14 600771ST Topsun Science and Technology
Topsun Science and Technology
2013-4-26
15 600671ST TianMuShan Pharmaceutical Enterprise
TianMuShan Pharmaceutical Enterprise
2013-5-9

Bond Market


Bond Market
2014 Fact Book 127
Bond Market Overview of the Shanghai Stock Exchange in 2013
In 2013, the bond market of the Shanghai Stock Exchange (hereafter referred to as SSE) maintained a rapid
development in the number of listed bonds, outstanding amount and trading volume.
By December 31, 2013, 1,686 bonds were listed on SSE, an increase of 665 from 2012 by 65%. The 1.7219 trillion
yuan outstanding amount represented an increase of 660.7 billion yuan from 2012 by 62%. Among them, there were
156 T-bonds with an outstanding amount of 230.8 billion yuan; 62 local treasury bonds, with an outstanding amount
of 1.7 trillion yuan; 1226 corporate bonds (including enterprise bonds), with an outstanding amount of 1163.4 billion
yuan; 18 convertible bonds with an outstanding amount of 153.7 billion yuan; 10 separately-traded convertible bonds
with an outstanding amount of 59.8 billion yuan; 164 SME bonds with an outstanding amount of 20.7 billion yuan
and 50 other securities (including bonds issued by insurance companies, securities firms and ABS) with an outstanding
amount of 91.8 billion yuan. In 2013, SSE issued and listed 33 T-bonds, 24 local government bonds, 505 corporate
bonds, 4 convertible bonds, 125 SME bonds and 34 other securities.
Turnover of bonds recorded 63 trillion yuan, an increase of 25 trillion yuan from 2012 by 65%. Of the turnover, T-bonds
accounted for 77.11 billion yuan, corporate bonds 894.049 billion yuan, convertible bonds 479.397 billion yuan,
separately-traded convertible bonds 57.153 billion yuan and bonds repo 61.051877 trillion yuan.
On the secondary bond market, SSE T-Bond Index sustained the stable and slow upward trend of 2012, going up from
135.79 at the beginning of 2013 to 139.52 as of the end of 2013, an increase of 3.73 points or 2.75%.
The debenture bond market witnessed comparatively large fluctuations in 2013. Due to limited liquidity in the market,
SSE Enterprise Bond Index experienced a downward trend and SSE Corporate Bond Index went through smaller
increase in June. In November, SSE Enterprise Bond Index and SSE Corporate Bond Index kept a more downward trend. SSE
SSE T-bond Index SSE Enterprise Bond Index SSE Corporate Bond Index

Bond Market
2014 Fact Book 128
Enterprise Bond Index went up from 159.60 at the beginning of 2013 to 166.56 as of the end of 2013, an increase of 6.96
or 4.36% while SSE Corporate Bond Index went up from 142.04 to 146.15, an increase of 4.11 or 2.89%.
SSE actively promoted the innovation of bond products and the development of the bond market in 2013 in four
aspects. First, it focused its efforts on the expansion of the bond market’s scale, demonstrated by the record highs in
the number of listed bonds, outstanding amount and trading volume. Second, it promoted the innovation of the bond
market and products in an orderly way. Specifically, it launched the when-issued trading of treasury bonds for the first
time, carried out the trail program of first policy-oriented financial bonds, namely CDB bond, and encouraged business
banks to issue write-down bonds. In addition, it actively promoted products such as asset-backed bonds, exchangeable
bonds and insurance companies’ infrastructure liability schemes. Third, it continued to improve the infrastructure of
the bond market and remarkably further the integration of trading rules, mechanisms and systems of bonds. Fourth, it
strengthened the risk prevention mechanism of the bond market, including establishing the dynamic risk monitoring,
warning and treatment mechanism and the investor suitability system while optimizing the bond operation mechanism.
In the coming year during which China’s bond market is to have a rapid growth, SSE will continue to expand its bond
market’s scale, push up the innovation of bond products and foster more market investors. It will also complete the
trading mechanisms and rules of bonds, come up with more effective prevention and monitoring methods of bonds risks
and boost the healthy development of the bond market.

Bond Market
2014 Fact Book 129
Conditions for Government Bond Listings
In accordance with the provisions of the Securities Law, stock exchanges shall arrange for the listing and trading of
government bonds (G-bond) in accordance with decisions of departments authorized by the State Council.
Conditions for Enterprise Bond Listings
In accordance with the provisions of the Shanghai Stock Exchange Corporate Bond Listing Rules, enterprise bonds
issued by unincorporated legal person entities shall be listed and traded by reference to the listing rules for corporate
bonds.
Conditions for Corporate Bond Listings
Any issuer that applies for a bond listing shall satisfy the following conditions:
(1) The bonds have been approved by the competent department and issued;
(2) The term of the bonds is no less than one year;
(3) The value of bonds actually issued is no less than RMB 50 million;
(4) The bonds have been rated by a credit rating institution and the bonds have a good credit rating;
(5) When applying for a bond listing, the issuer remains in conformity with the statutory conditions for issuing corporate
bonds; and
(6) Other conditions recognized by SSE.
Applications for Corporate Bond Listings
1. Any issuer that applies for a bond listing shall submit the following documents to SSE:
(1) Bond listing application;
(2) Documents from competent departments approving the bond issue;
(3) A resolution approving the bond listing;
(4) A recommendation letter for the bond listing;
(5) Articles of Association;
(6) Company Business License;
(7) Bond offering method, issue announcement and issue information report;
(8) The credit rating report for the bonds and a statement on follow-up rating arrangements;
(9) Evidentiary documents on the value of bonds actually offered;
(10) Listing particulars;
(11) Audit reports for the issuer for the last three full accounting years issued by an accounting firm qualified to engage
in securities business;
(12) A statement on the credit standing of the guarantor and the guarantee agreement (if any);
(13) A statement on whether the issuer has any record of legal or regulatory violations in the last three years;
(14) A list of bondholders and a statement on bond custody arrangements; and
(15) Other documents required by SSE.
Listed companies that receive CSRC approval to issue corporate bonds may be exempted from aforesaid Items (5), (11)

Bond Market
2014 Fact Book 130
and (13).
2. Any issuer that applies for a bond listing shall ensure that the contents of documents submitted to SSE are authentic,
accurate, and complete and do not include any false or misleading statement or material omission.
3. SSE adopts a listing recommendation system for the listing of bonds; bonds for which a listing application is made
must be recommended by one to two institutions recognized by SSE, which shall issue a listing recommendation letter.
4. Listing sponsors shall meet the following requirements:
(1) They are SSE members or of another institution recognized thereby;
(2) They have no record of any serious legal or regulatory violations in the last year;
(3) The main business personnel responsible for recommendation work shall be familiar with SSE regulations and
relevant business rules; and
(4) Other conditions SSE deems necessary.
5. Listing sponsors shall perform the following obligations:
(1) To confirm that the bond issuer conforms to the listing conditions;
(2) To ensure that the directors and senior management personnel of the issuer understand the nature of their
responsibilities and assume the responsibilities specified in SSE listing rules and listing agreement;
(3) To assist the bond issuer in applying for a bond listing;
(4) To submit the listing recommendation letter to SSE;
(5) To ensure that the listing documents are authentic, accurate and complete and conform to prescribed requirements,
and that the materials included in the documents have been verified;
(6) To assist the bond issuer in arranging the bond listing with the Stock Exchange; and
(7) Other obligations to be performed by the listing sponsor as prescribed by SSE.
6. The listing sponsor shall ensure that the listing application materials, listing particulars and other relevant publicity
materials do not include any false or misleading statement or material omission, and shall guarantee to assume joint and
several liabilities therefore.
7. The listing sponsor may not conduct insider trading by taking advantage of inside information obtained in the course
of the listing recommendation process to seek benefits for itself or for others.
8. In the event any listing sponsor fails to comply with the aforesaid provisions, SSE shall deal with the matter in
accordance with relevant regulations.
Approval for Corporate Bond Listings
1. The listing committee established by SSE shall examine bond listing applications, make independent and professional
judgments, and formulate examination opinions; SSE shall decide whether to approve the listing based on the opinion of
the listing committee.
2. The bond issuer shall not, after filing the listing application and before the bond listing is approved, disclose relevant

Bond Market
2014 Fact Book 131
information without the consent of SSE.
3. The issuer and the listing sponsor must complete custody work for listed bonds with the custodian institution
designated by SSE before the bonds are listed and traded, and shall submit the list of bondholders to the custodian
institution designated by SSE after the same has been verified as correct. The issuer and the listing sponsor shall assume
full responsibility for the accuracy of the list.
4. Before bonds are listed and traded, the issuer shall announce the listing particulars in the information disclosure
newspapers and periodicals designated by CSRC and/or on SSE website, and shall make the listing particulars, approval
documents, and relevant listing application documents available at designated venues for public reference.
5. Before listing bonds, the issuer shall conclude a listing agreement with SSE.
Conditions for SSE Bond Filing and Listings
1. Any issuer that applies for a bond filing and listing shall satisfy the following conditions:
(1) The issuer is a limited liability company or a company limited by shares registered in the territory of China;
(2) The interest rate shall not exceed three times the benchmark interest rate of bank loans for the same period;
(3) The term of the bonds is no less than one year;
(4) Other conditions recognized by SSE.
2. The underwriting business carried out by securities companies shall comply with the laws, regulations, and regulatory
requirements of the China Securities Regulatory Commission and the relevant provisions of the Securities Association of
China.
3. Prior to bond issuance, underwriters should submit materials SSE for filing. Filing materials should contain the
following:
(1) Registration Form;
(2) Articles of Association of the Issuer and Company Business License (copy);
(3) The issuer’s competent authority’s resolution on private placement bond issuance matters;
(4) Private placement bond underwriting agreement;
(5) Private placement bond prospectus;
(6) The underwriter's due diligence investigation report;
(7) Private bond custody agreement and private bondholders' meeting rules;
(8) The audited financial report of the issuer’s last two full fiscal years by qualified securities and futures-related auditing
firms;
(9) The legal opinion by law firm on the issue of private placement bond;
(10) Issuance of all directors, supervisors and senior management on the issue of the application documents authenticity,
accuracy and completeness of the undertaking;
(11) Other documents required by SSE.
4. The private placement bond prospectus shall contain at least the following:
(1) Basic facts of the issuer;

Bond Market
2014 Fact Book 132
(2) The issuer's financial condition;
(3) Net private debt issue the basic conditions and terms of the issue, including the name of the bond, the total volume,
the period, the face value or interest rate determined way, the debt service period etc;
(4) Underwriting agency and underwriting arrangements;
(5) Use of proceeds and any change the use of funds during the subsistence;
(6) The transfer of private placement bond, scope and constraints;
(7) The specific content and manner of disclosure of information;
(8) Debt service protection mechanism, dividend policy, the private bonds fiduciary management and private
bondholders' meeting investor protection mechanisms arrangements;
(9) Private placement bond guarantees (if any);
(10) The private placement bond credit rating and tracking specific arrangements (if any);
(11) Risk factors and disclaimers of the private placement bond;
(12) The arbitration or other dispute resolution mechanisms;
(13) The issuer’s statement about lawful use of the raised money through the private placement bond and issuance
procedure compliance;
(14) Commitment made by all of the issuer’s board directors, supervisors and senior management on the authenticity
accuracy and completeness of the issuance document;
(15) Other important matters.
5. SSE examines all filing materials to check their completeness. If the mateirlas are deemed complete, SSE will issue
Filing Acceptance Notice within10 working days since the day on which filing materials are accepted.
Upon receiving the Filing Acceptance Notice, the issuer should complete issuance within six months. Otherwise, the
issuer must apply for filing again.
6. Two or more issuers can issue private placement bond together in the manner of collective issuance.
7. The issuer may issue private placement bonds with attached stock purchasing warrants or convertible terms and
conditions, as long as they comply with the laws and regulations of the China Securities Regulatory Commission related
to non-listed public company management provisions.
8. Qualified investors must sign a subscription agreement to subscribe for the private placement bonds. The Subscription
Agreement shall include subscription price, number of the subscription, the subscription rights and obligations and other
statements or commitments of the private placement bond.
9. After the issuance of private placement bonds, the issuer shall register in China Securities Depository and Clearing
Corporation Limited.
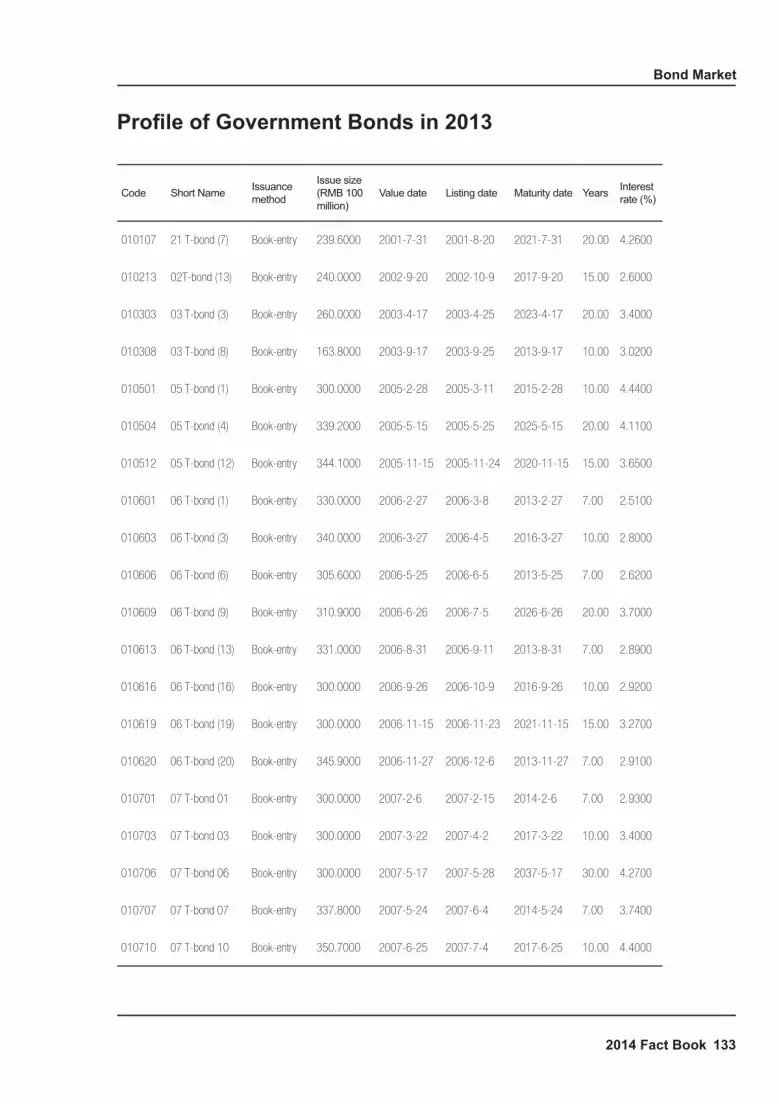
Bond Market
2014 Fact Book 133
Profile of Government Bonds in 2013
Code Short Name Issuance method
Issue size(RMB 100 million)
Value date Listing date Maturity date Years Interest rate (%)
010107 21 T-bond (7) Book-entry 239.6000 2001-7-31 2001-8-20 2021-7-31 20.00 4.2600
010213 02T-bond (13) Book-entry 240.0000 2002-9-20 2002-10-9 2017-9-20 15.00 2.6000
010303 03 T-bond (3) Book-entry 260.0000 2003-4-17 2003-4-25 2023-4-17 20.00 3.4000
010308 03 T-bond (8) Book-entry 163.8000 2003-9-17 2003-9-25 2013-9-17 10.00 3.0200
010501 05 T-bond (1) Book-entry 300.0000 2005-2-28 2005-3-11 2015-2-28 10.00 4.4400
010504 05 T-bond (4) Book-entry 339.2000 2005-5-15 2005-5-25 2025-5-15 20.00 4.1100
010512 05 T-bond (12) Book-entry 344.1000 2005-11-15 2005-11-24 2020-11-15 15.00 3.6500
010601 06 T-bond (1) Book-entry 330.0000 2006-2-27 2006-3-8 2013-2-27 7.00 2.5100
010603 06 T-bond (3) Book-entry 340.0000 2006-3-27 2006-4-5 2016-3-27 10.00 2.8000
010606 06 T-bond (6) Book-entry 305.6000 2006-5-25 2006-6-5 2013-5-25 7.00 2.6200
010609 06 T-bond (9) Book-entry 310.9000 2006-6-26 2006-7-5 2026-6-26 20.00 3.7000
010613 06 T-bond (13) Book-entry 331.0000 2006-8-31 2006-9-11 2013-8-31 7.00 2.8900
010616 06 T-bond (16) Book-entry 300.0000 2006-9-26 2006-10-9 2016-9-26 10.00 2.9200
010619 06 T-bond (19) Book-entry 300.0000 2006-11-15 2006-11-23 2021-11-15 15.00 3.2700
010620 06 T-bond (20) Book-entry 345.9000 2006-11-27 2006-12-6 2013-11-27 7.00 2.9100
010701 07 T-bond 01 Book-entry 300.0000 2007-2-6 2007-2-15 2014-2-6 7.00 2.9300
010703 07 T-bond 03 Book-entry 300.0000 2007-3-22 2007-4-2 2017-3-22 10.00 3.4000
010706 07 T-bond 06 Book-entry 300.0000 2007-5-17 2007-5-28 2037-5-17 30.00 4.2700
010707 07 T-bond 07 Book-entry 337.8000 2007-5-24 2007-6-4 2014-5-24 7.00 3.7400
010710 07 T-bond 10 Book-entry 350.7000 2007-6-25 2007-7-4 2017-6-25 10.00 4.4000

Bond Market
2014 Fact Book 134
Code Short Name Issuance method
Issue size(RMB 100 million)
Value date Listing date Maturity date Years Interest rate (%)
010713 07 T-bond 13 Book-entry 280.0000 2007-8-16 2007-8-24 2027-8-16 20.00 4.5200
019002 10 T-bond 02 Book-entry 260.0000 2010-2-4 2010-2-10 2020-2-4 10.00 3.4300
019003 10 T-bond 03 Book-entry 240.0000 2010-3-1 2010-3-5 2040-3-1 30.00 4.0800
019005 10 T-bond 05 Book-entry 260.0000 2010-3-11 2010-3-17 2017-3-11 7.00 2.9200
019006 10 T-bond 06 Book-entry 260.0000 2010-3-18 2010-3-24 2013-3-18 3.00 2.2300
019007 10 T-bond 07 Book-entry 260.0000 2010-3-25 2010-3-31 2020-3-25 10.00 3.3600
019008 10 T-bond 08 Book-entry 280.4000 2010-4-8 2010-4-14 2015-4-8 5.00 2.7000
019009 10 T-bond 09 Book-entry 280.0000 2010-4-15 2010-4-21 2030-4-15 20.00 3.9600
019010 10 T-bond 10 Book-entry 280.0000 2010-4-22 2010-4-28 2017-4-22 7.00 3.0100
019012 10 T-bond 12 Book-entry 280.0000 2010-5-13 2010-5-19 2020-5-13 10.00 3.2500
019013 10 T-bond 13 Book-entry 280.0000 2010-5-20 2010-5-26 2015-5-20 5.00 2.3800
019014 10 T-bond 14 Book-entry 280.0000 2010-5-24 2010-5-28 2060-5-24 50.00 4.0300
019015 10 T-bond 15 Book-entry 283.1000 2010-5-27 2010-6-2 2017-5-27 7.00 2.8300
019016 10 T-bond 16 Book-entry 280.0000 2010-6-3 2010-6-9 2013-6-3 3.00 2.3300
019017 10 T-bond 17 Book-entry 280.0000 2010-6-10 2010-6-18 2015-6-10 5.00 2.5300
019018 10 T-bond 18 Book-entry 280.0000 2010-6-21 2010-6-25 2040-6-21 30.00 4.0300
019019 10 T-bond 19 Book-entry 280.1000 2010-6-24 2010-6-30 2020-6-24 10.00 3.4100
019020 10 T-bond 20 Book-entry 299.7000 2010-7-8 2010-7-14 2015-7-8 5.00 2.5200
019022 10 T-bond 22 Book-entry 281.9000 2010-7-22 2010-7-28 2017-7-22 7.00 2.7600
019023 10 T-bond 23 Book-entry 280.0000 2010-7-29 2010-8-4 2040-7-29 30.00 3.9600
019024 10 T-bond24 Book-entry 304.4000 2010-8-5 2010-8-11 2020-8-5 10.00 3.2800

Bond Market
2014 Fact Book 135
Code Short Name Issuance method
Issue size(RMB 100 million)
Value date Listing date Maturity date Years Interest rate (%)
019025 10 T-bond 25 Book-entry 280.0000 2010-8-12 2010-8-18 2013-8-12 3.00 2.3000
019026 10 T-bond 26 Book-entry 280.0000 2010-8-16 2010-8-20 2040-8-16 30.00 3.9600
019027 10 T-bond 27 Book-entry 280.0000 2010-8-19 2010-8-25 2017-8-19 7.00 2.8100
019028 10 T-bond 28 Book-entry 282.2000 2010-8-26 2010-9-1 2015-8-26 5.00 2.5800
019029 10 T-bond 29 Book-entry 280.0000 2010-9-2 2010-9-8 2030-9-2 20.00 3.8200
019031 10 T-bond31 Book-entry 282.6000 2010-9-16 2010-9-21 2020-9-16 10.00 3.2900
019032 10 T-bond 32 Book-entry 287.1000 2010-10-14 2010-10-20 2017-10-14 7.00 3.1000
019033 10 T-bond 33 Book-entry 280.0000 2010-10-21 2010-10-27 2015-10-21 5.00 2.9100
019034 10 T-bond 34 Book-entry 280.0000 2010-10-28 2010-11-3 2020-10-28 10.00 3.6700
019035 10 T-bond 35 Book-entry 280.0000 2010-11-4 2010-11-10 2013-11-4 3.00 2.6800
019037 10 T-bond 37 Book-entry 280.0000 2010-11-18 2010-11-24 2060-11-18 50.00 4.4000
019038 10 T-bond 38 Book-entry 306.4000 2010-11-25 2010-12-1 2017-11-25 7.00 3.8300
019039 10 T-bond 39 Book-entry 321.4000 2010-12-2 2010-12-8 2015-12-2 5.00 3.6400
019040 10 T-bond 40 Book-entry 280.0000 2010-12-9 2010-12-15 2040-12-9 30.00 4.2300
019041 10 T-bond 41 Book-entry 307.8000 2010-12-16 2010-12-22 2020-12-16 10.00 3.7700
019102 11 T-bond 02 Book-entry 620.6000 2011-1-20 2011-1-26 2021-1-20 10.00 3.9400
019103 11 T-bond 03 Book-entry 625.2000 2011-1-27 2011-2-1 2018-1-27 7.00 3.8300
019104 11 T-bond 04 Book-entry 639.7000 2011-2-17 2011-2-23 2016-2-17 5.00 3.6000
019105 11 T-bond 05 Book-entry 280.0000 2011-2-24 2011-3-2 2041-2-24 30.00 4.3100
019106 11 T-bond06 Book-entry 300.0000 2011-3-3 2011-3-9 2018-3-3 7.00 3.7500
019107 11T-bond07 Book-entry 580.0000 2011-3-10 2011-3-16 2014-3-10 3.00 3.2200

Bond Market
2014 Fact Book 136
Code Short Name Issuance method
Issue size(RMB 100 million)
Value date Listing date Maturity date Years Interest rate (%)
019108 11T-bond08 Book-entry 300.0000 2011-3-17 2011-3-23 2021-3-17 10.00 3.8300
019110 11T-bond10 Book-entry 580.0000 2011-4-28 2011-5-5 2031-4-28 20.00 4.1500
019112 11T-bond12 Book-entry 300.0000 2011-5-26 2011-6-1 2061-5-26 50.00 4.4800
019113 11T-bond13 Book-entry 600.0000 2011-6-2 2011-6-9 2014-6-2 3.00 3.2600
019114 11T-bond14 Book-entry 600.0000 2011-6-9 2011-6-15 2016-6-9 5.00 3.4400
019115 11T-bond15 Book-entry 619.3000 2011-6-16 2011-6-22 2021-6-16 10.00 3.9900
019116 11T-bond16 Book-entry 580.0000 2011-6-23 2011-6-29 2041-6-23 30.00 4.5000
019117 11T-bond17 Book-entry 600.0000 2011-7-7 2011-7-13 2018-7-7 7.00 3.7000
019119 11T-bond19 Book-entry 630.5000 2011-8-18 2011-8-24 2021-8-18 10.00 3.9300
019121 11T-bond21 Book-entry 586.3000 2011-10-13 2011-10-19 2018-10-13 7.00 3.6500
019122 11T-bond22 Book-entry 293.0000 2011-10-20 2011-10-26 2016-10-20 5.00 3.5500
019123 11T-bond23 Book-entry 280.0000 2011-11-10 2011-11-16 2061-11-10 50.00 4.3300
019124 11T-bond24 Book-entry 560.5000 2011-11-17 2011-11-23 2021-11-17 10.00 3.5700
019125 11T-bond25 Book-entry 280.0000 2011-12-8 2011-12-14 2014-12-8 3.00 2.8200
019201 12T-bond01 Book-entry 280.0000 2012-1-12 2012-1-18 2013-1-12 1.00 2.7800
019202 12T-bond02 Book-entry 280.0000 2012-2-8 2012-2-14 2013-2-8 1.00 2.8700
019203 12T-bond03 Book-entry 580.0000 2012-2-16 2012-2-22 2017-2-16 5.00 3.1400
019204 12T-bond04 Book-entry 860.0000 2012-2-23 2012-2-29 2022-2-23 10.00 3.5100
019205 12T-bond05 Book-entry 946.7000 2012-3-8 2012-3-14 2019-3-8 7.00 3.4100
019206 12T-bond06 Book-entry 280.0000 2012-4-23 2012-4-27 2032-4-23 20.00 4.0300
019207 12T-bond07 Book-entry 649.4000 2012-4-26 2012-5-3 2015-4-26 3.00 2.9100

Bond Market
2014 Fact Book 137
Code Short Name Issuance method
Issue size(RMB 100 million)
Value date Listing date Maturity date Years Interest rate (%)
019208 12T-bond08 Book-entry 280.0000 2012-5-17 2012-5-23 2062-5-17 50.00 4.2500
019209 12T-bond09 Book-entry 1002.2000 2012-5-24 2012-5-30 2022-5-24 10.00 3.3600
019210 12T-bond10 Book-entry 943.5000 2012-6-7 2012-6-13 2019-6-7 7.00 3.1400
019211 12T-bond11 Book-entry 269.4000 2012-6-14 2012-6-20 2013-6-14 1.00 2.1500
019212 12T-bond12 Book-entry 280.0000 2012-6-28 2012-7-4 2042-6-28 30.00 4.0700
019213 12T-bond13 Book-entry 280.0000 2012-8-2 2012-8-8 2042-8-2 30.00 4.1200
019214 12T-bond14 Book-entry 560.6000 2012-8-16 2012-8-22 2017-8-16 5.00 2.9500
019215 12T-bond15 Book-entry 861.4000 2012-8-23 2012-8-29 2022-8-23 10.00 3.3900
019216 12T-bond16 Book-entry 828.2000 2012-9-6 2012-9-12 2019-9-6 7.00 3.2500
019217 12T-bond17 Book-entry 580.0000 2012-9-13 2012-9-19 2015-9-13 3.00 3.1000
019218 12T-bond18 Book-entry 280.0000 2012-9-27 2012-10-8 2032-9-27 20.00 4.1000
019219 12T-bond19 Book-entry 260.1000 2012-10-18 2012-10-24 2013-10-18 1.00 2.9400
019220 12T-bond20 Book-entry 260.0000 2012-11-15 2012-11-21 2062-11-15 50.00 4.3500
019221 12T-bond21 Book-entry 290.1000 2012-12-13 2012-12-19 2022-12-13 10.00 3.5500
019301 13T-bond01 Book-entry 480.0000 2013-1-10 2013-1-16 2018-1-10 5.00 3.1500
019302 13T-bond02 Book-entry 300.0000 2013-1-17 2013-1-23 2014-1-17 1.00 2.8100
019303 13T-bond03 Book-entry 820.0000 2013-1-24 2013-1-30 2020-1-24 7.00 3.4200
019304 13T-bond04 Book-entry 560.0000 2013-1-31 2013-2-6 2016-1-31 3.00 3.1000
019305 13T-bond05 Book-entry 787.9000 2013-2-21 2013-2-27 2023-2-21 10.00 3.5200
019306 13T-bond06 Book-entry 260.0000 2013-4-7 2013-4-10 2015-4-7 2.00 2.9200
019307 13T-bond07 Book-entry 300.0000 2013-4-11 2013-4-17 2014-4-11 1.00 2.6200

Bond Market
2014 Fact Book 138
Code Short Name Issuance method
Issue size(RMB 100 million)
Value date Listing date Maturity date Years Interest rate (%)
019308 13T-bond08 Book-entry 917.2000 2013-4-18 2013-4-24 2020-4-18 7.00 3.2900
019309 13T-bond09 Book-entry 260.0000 2013-4-22 2013-4-26 2033-4-22 20.00 3.9900
019310 13T-bond10 Book-entry 200.0000 2013-5-20 2013-5-24 2063-5-20 50.00 4.2400
019311 13T-bond11 Book-entry 900.0000 2013-5-23 2013-5-29 2023-5-23 10.00 3.3800
019312 13T-bond12 Book-entry 260.0000 2013-5-27 2013-5-31 2015-5-27 2.00 2.9800
019313 13T-bond13 Book-entry 600.0000 2013-5-30 2013-6-5 2018-5-30 5.00 3.0900
019314 13T-bond14 Book-entry 260.0000 2013-7-4 2013-7-10 2014-7-4 1.00 3.4800
019315 13T-bond15 Book-entry 901.5000 2013-7-11 2013-7-17 2020-7-11 7.00 3.4600
019316 13T-bond16 Book-entry 260.0000 2013-8-12 2013-8-16 2033-8-12 20.00 4.3200
019317 13T-bond17 Book-entry 600.2000 2013-8-15 2013-8-21 2016-8-15 3.00 3.7700
019318 13T-bond18 Book-entry 878.8000 2013-8-22 2013-8-28 2023-8-22 10.00 4.0800
019319 13T-bond19 Book-entry 260.0000 2013-9-16 2013-9-23 2043-9-16 30.00 4.7600
019320 13T-bond20 Book-entry 888.9000 2013-10-17 2013-10-23 2020-10-17 7.00 4.0700
019321 13T-bond21 Book-entry 240.0000 2013-10-21 2013-10-25 2015-10-21 2.00 3.7700
019322 13T-bond22 Book-entry 282.5000 2013-10-31 2013-11-6 2014-10-31 1.00 4.0100
019323 13T-bond23 Book-entry 572.1000 2013-11-7 2013-11-13 2018-11-7 5.00 4.1300
019324 13T-bond24 Book-entry 200.0000 2013-11-18 2013-11-22 2063-11-18 50.00 5.3100
019325 13T-bond25 Book-entry 240.0000 2013-12-9 2013-12-13 2043-12-9 30.00 5.0500
019714 07T-bond14 Book-entry 326.9000 2007-8-23 2007-8-31 2014-8-23 7.00 3.9000
019718 07T-bond18 Book-entry 324.7000 2007-11-26 2007-12-5 2014-11-26 7.00 4.3500
019801 08T-bond01 Book-entry 289.7000 2008-2-13 2008-2-21 2015-2-13 7.00 3.9500

Bond Market
2014 Fact Book 139
Code Short Name Issuance method
Issue size(RMB 100 million)
Value date Listing date Maturity date Years Interest rate (%)
019802 08T-bond02 Book-entry 280.0000 2008-2-28 2008-3-6 2023-2-28 15.00 4.1600
019803 08T-bond03 Book-entry 279.4000 2008-3-20 2008-3-28 2018-3-20 10.00 4.0700
019805 08T-bond05 Book-entry 280.0000 2008-4-21 2008-4-28 2013-4-21 5.00 3.6900
019806 08T-bond06 Book-entry 280.0000 2008-5-8 2008-5-16 2038-5-8 30.00 4.5000
019807 08T-bond07 Book-entry 271.5000 2008-5-19 2008-5-26 2015-5-19 7.00 4.0100
019810 08T-bond10 Book-entry 266.5000 2008-6-23 2008-7-1 2018-6-23 10.00 4.4100
019813 08T-bond13 Book-entry 240.0000 2008-8-11 2008-8-18 2028-8-11 20.00 4.9400
019814 08T-bond14 Book-entry 266.0000 2008-8-18 2008-8-25 2015-8-18 7.00 4.2300
019817 08T-bond17 Book-entry 260.0000 2008-9-16 2008-9-22 2013-9-16 5.00 3.6900
019818 08T-bond18 Book-entry 243.6000 2008-9-22 2008-9-26 2018-9-22 10.00 3.6800
019820 08T-bond20 Book-entry 240.0000 2008-10-23 2008-10-31 2038-10-23 30.00 3.9100
019822 08T-bond22 Book-entry 225.0000 2008-11-24 2008-11-28 2015-11-24 7.00 2.7100
019823 08T-bond23 Book-entry 240.0000 2008-11-27 2008-12-4 2023-11-27 15.00 3.6200
019825 08T-bond25 Book-entry 253.7000 2008-12-15 2008-12-19 2018-12-15 10.00 2.9000
019826 08T-bond26 Book-entry 260.0000 2008-12-18 2008-12-24 2013-12-18 5.00 1.7700
019901 09T-bond01 Book-entry 269.3000 2009-2-12 2009-2-18 2016-2-12 7.00 2.7600
019902 09T-bond02 Book-entry 220.0000 2009-2-19 2009-2-25 2029-2-19 20.00 3.8600
019903 09T-bond03 Book-entry 260.0000 2009-3-12 2009-3-18 2019-3-12 10.00 3.0500
019904 09T-bond04 Book-entry 564.3000 2009-4-2 2009-4-9 2014-4-2 5.00 2.2900
019905 09T-bond05 Book-entry 220.0000 2009-4-9 2009-4-16 2039-4-9 30.00 4.0200
019906 09T-bond06 Book-entry 252.1000 2009-4-16 2009-4-22 2016-4-16 7.00 2.8200

Bond Market
2014 Fact Book 140
Code Short Name Issuance method
Issue size(RMB 100 million)
Value date Listing date Maturity date Years Interest rate (%)
019907 09T-bond07 Book-entry 277.6000 2009-5-7 2009-5-13 2019-5-7 10.00 3.0200
019910 09T-bond10 Book-entry 295.0000 2009-6-4 2009-6-10 2014-6-4 5.00 2.2600
019911 09T-bond11 Book-entry 280.0000 2009-6-11 2009-6-17 2024-6-11 15.00 3.6900
019912 09T-bond12 Book-entry 282.7000 2009-6-18 2009-6-24 2019-6-18 10.00 3.0900
019913 09T-bond13 Book-entry 280.0000 2009-6-25 2009-7-1 2016-6-25 7.00 2.8200
019916 09T-bond16 Book-entry 283.0000 2009-7-23 2009-7-29 2019-7-23 10.00 3.4800
019917 09T-bond17 Book-entry 260.0000 2009-7-30 2009-8-5 2016-7-30 7.00 3.1500
019918 09T-bond18 Book-entry 275.8000 2009-8-6 2009-8-12 2014-8-6 5.00 2.9700
019919 09T-bond19 Book-entry 267.3000 2009-8-20 2009-8-26 2016-8-20 7.00 3.1700
019920 09T-bond20 Book-entry 260.0000 2009-8-27 2009-9-2 2029-8-27 20.00 4.0000
019923 09T-bond23 Book-entry 266.4000 2009-9-17 2009-9-23 2019-9-17 10.00 3.4400
019924 09T-bond24 Book-entry 268.0000 2009-9-24 2009-9-30 2014-9-24 5.00 2.9000
019925 09T-bond25 Book-entry 240.0000 2009-10-15 2009-10-21 2039-10-15 30.00 4.1800
019926 09T-bond26 Book-entry 274.9000 2009-10-22 2009-10-28 2016-10-22 7.00 3.4000
019927 09T-bond27 Book-entry 272.4000 2009-11-5 2009-11-11 2019-11-5 10.00 3.6800
019930 09T-bond30 Book-entry 200.0000 2009-11-30 2009-12-11 2059-11-30 50.00 4.3000
019931 09T-bond31 Book-entry 273.9000 2009-12-3 2009-12-9 2014-12-3 5.00 2.9000
019932 09T-bond32 Book-entry 271.2000 2009-12-17 2009-12-23 2016-12-17 7.00 3.2200
02005112Discounted Bond01
Book-entry 150.0000 2012-4-16 2012-4-20 2013-1-14 .75 0.0000
02005212Discounted Bond02
Book-entry 150.0000 2012-5-7 2012-5-11 2013-2-4 .75 0.0000
02005312Discounted Bond03
Book-entry 150.0000 2012-6-18 2012-6-25 2013-3-18 .75 0.0000

Bond Market
2014 Fact Book 141
Code Short Name Issuance method
Issue size(RMB 100 million)
Value date Listing date Maturity date Years Interest rate (%)
02005412Discounted Bond04
Book-entry 150.0000 2012-7-16 2012-7-20 2013-1-14 .50 0.0000
02005512Discounted Bond05
Book-entry 150.0000 2012-7-30 2012-8-3 2013-1-28 .50 0.0000
02005612Discounted Bond06
Book-entry 150.0000 2012-8-6 2012-8-10 2013-2-4 .50 0.0000
02005712Discounted Bond07
Book-entry 150.0000 2012-10-22 2012-10-26 2013-1-21 .25 0.0000
02005812Discounted Bond08
Book-entry 150.0000 2012-11-5 2012-11-9 2013-2-4 .25 0.0000
02005913Discounted Bond01
Book-entry 150.0000 2013-4-15 2013-4-19 2014-1-13 .75 0.0000
02006013Discounted Bond02
Book-entry 150.0000 2013-4-22 2013-4-26 2014-1-20 .75 0.0000
02006113Discounted Bond03
Book-entry 150.0000 2013-5-13 2013-5-17 2014-2-10 .75 0.0000
02006213Discounted Bond04
Book-entry 95.3000 2013-6-17 2013-6-21 2014-3-17 .75 0.0000
02006313Discounted Bond05
Book-entry 150.0000 2013-8-19 2013-8-23 2014-2-17 .50 0.0000
02006413Discounted Bond06
Book-entry 150.0000 2013-9-9 2013-9-13 2014-3-10 .50 0.0000
02006513Discounted Bond07
Book-entry 150.0000 2013-10-14 2013-10-18 2014-1-13 .25 0.0000
02006613Discounted Bond08
Book-entry 150.0000 2013-12-16 2013-12-20 2014-3-17 .25 0.0000
130050 10Local Bond01 286.0000 2010-6-21 2010-6-28 2013-6-21 3.00 2.7700
130051 10Local Bond02 152.0000 2010-6-21 2010-6-28 2015-6-21 5.00 2.9000
130052 10Local Bond03 232.0000 2010-7-19 2010-7-23 2013-7-19 3.00 2.3300
130053 10Local Bond04 284.0000 2010-8-10 2010-8-16 2013-8-10 3.00 2.3700
130054 10Local Bond05 186.0000 2010-8-10 2010-8-16 2015-8-10 5.00 2.6700
130055 10Local Bond06 195.0000 2010-8-24 2010-8-30 2013-8-24 3.00 2.3700
130056 10Local Bond07 206.0000 2010-9-7 2010-9-13 2013-9-7 3.00 2.3600
130057 10Local Bond08 152.0000 2010-9-7 2010-9-13 2015-9-7 5.00 2.6700

Bond Market
2014 Fact Book 142
Code Short Name Issuance method
Issue size(RMB 100 million)
Value date Listing date Maturity date Years Interest rate (%)
130058 10Local Bond09 181.0000 2010-11-15 2010-11-19 2013-11-15 3.00 3.2300
130059 10Local Bond10 126.0000 2010-11-15 2010-11-19 2015-11-15 5.00 3.7000
130060 11Local Bond01 254.0000 2011-7-12 2011-7-18 2016-7-12 5.00 3.8400
130061 11Local Bond02 239.4000 2011-7-12 2011-7-18 2014-7-12 3.00 3.9300
130062 11Local Bond03 226.6000 2011-8-2 2011-8-8 2014-8-2 3.00 4.0700
130063 11Local Bond04 220.0000 2011-8-9 2011-8-15 2016-8-9 5.00 4.1200
130064 11Local Bond05 236.0000 2011-8-23 2011-8-29 2014-8-23 3.00 4.0100
130065 11Local Bond06 240.0000 2011-8-30 2011-9-5 2016-8-30 5.00 4.3000
130066 11Local Bond07 176.0000 2011-10-18 2011-10-24 2014-10-18 3.00 3.6700
130067 11Local Bond08 179.0000 2011-10-25 2011-10-31 2016-10-25 5.00 3.7000
130068 11Shanghai01 36.0000 2011-11-16 2011-11-22 2014-11-16 3.00 3.1000
130069 11Shanghai02 35.0000 2011-11-16 2011-11-22 2016-11-16 5.00 3.3000
130070 11Guangdong01 34.5000 2011-11-21 2011-11-25 2014-11-21 3.00 3.0800
130071 11Guangdong02 34.5000 2011-11-21 2011-11-25 2016-11-21 5.00 3.2900
130072 11Zhejiang01 33.0000 2011-11-22 2011-11-28 2014-11-22 3.00 3.0100
130073 11Zhejiang02 34.0000 2011-11-22 2011-11-28 2016-11-22 5.00 3.2400
130074 11Shenzhen01 11.0000 2011-11-28 2011-12-2 2014-11-28 3.00 3.0300
130075 11Shenzhen02 11.0000 2011-11-28 2011-12-2 2016-11-28 5.00 3.2500
130076 12Local Bond01 Book-entry 206.0000 2012-6-18 2012-6-21 2015-6-18 3.00 2.7600
130077 12Local Bond02 Book-entry 210.0000 2012-7-2 2012-7-6 2017-7-2 5.00 3.0700
130078 12Local Bond03 Book-entry 239.0000 2012-7-10 2012-7-16 2015-7-10 3.00 2.7500

Bond Market
2014 Fact Book 143
Code Short Name Issuance method
Issue size(RMB 100 million)
Value date Listing date Maturity date Years Interest rate (%)
130079 12Local Bond04 Book-entry 239.0000 2012-7-17 2012-7-23 2017-7-17 5.00 3.0200
130080 12Local Bond05 Book-entry 231.0000 2012-7-24 2012-7-30 2015-7-24 3.00 2.7400
130081 12Local Bond06 Book-entry 233.0000 2012-7-31 2012-8-6 2017-7-31 5.00 3.1300
130082 12Local Bond07 Book-entry 216.0000 2012-8-13 2012-8-17 2015-8-13 3.00 2.9800
130083 12Local Bond08 Book-entry 221.0000 2012-8-20 2012-8-24 2017-8-20 5.00 3.3800
130084 12Shanghai01 Book-entry 44.5000 2012-8-24 2012-8-30 2017-8-24 5.00 3.2500
130085 12Shanghai02 Book-entry 44.5000 2012-8-24 2012-8-30 2019-8-24 7.00 3.3900
130086 12Guangdong01 Book-entry 43.0000 2012-9-7 2012-9-13 2017-9-7 5.00 3.2100
130087 12Guangdong02 Book-entry 43.0000 2012-9-7 2012-9-13 2019-9-7 7.00 3.4000
130088 12Local Bond09 Book-entry 206.0000 2012-9-17 2012-9-21 2015-9-17 3.00 3.4700
130089 12Local Bond10 Book-entry 210.0000 2012-9-17 2012-9-21 2017-9-17 5.00 3.5800
130090 12Zhejiang01 Book-entry 43.5000 2012-9-24 2012-9-28 2017-9-24 5.00 3.3000
130091 12Zhejiang02 Book-entry 43.5000 2012-9-24 2012-9-28 2019-9-24 7.00 3.4700
130092 12Shenzhen01 Book-entry 13.5000 2012-10-15 2012-10-19 2017-10-15 5.00 3.2200
130093 12Shenzhen02 Book-entry 13.5000 2012-10-15 2012-10-19 2019-10-15 7.00 3.4300
130094 13Local Bond01 Book-entry 210.0000 2013-6-17 2013-6-21 2016-6-17 3.00 3.5300
130095 13Local Bond02 Book-entry 212.0000 2013-6-17 2013-6-21 2018-6-17 5.00 3.6600
130096 13Local Bond03 Book-entry 242.0000 2013-7-1 2013-7-5 2016-7-1 3.00 3.7900
130097 13Local Bond04 Book-entry 243.0000 2013-7-15 2013-7-19 2018-7-15 5.00 3.8200
130098 13Local Bond05 Book-entry 236.0000 2013-7-29 2013-8-2 2016-7-29 3.00 3.9200
130099 13Local Bond06 Book-entry 238.0000 2013-8-5 2013-8-9 2018-8-5 5.00 3.8700

Bond Market
2014 Fact Book 144
Code Short Name Issuance method
Issue size(RMB 100 million)
Value date Listing date Maturity date Years Interest rate (%)
130100 13Local Bond07 Book-entry 253.0000 2013-8-20 2013-8-26 2016-8-20 3.00 4.2900
130101 13Local Bond08 Book-entry 255.0000 2013-8-20 2013-8-26 2018-8-20 5.00 4.4300
130102 13Shandong01 Book-entry 56.0000 2013-8-26 2013-8-30 2018-8-26 5.00 3.9400
130103 13Shandong02 Book-entry 56.0000 2013-8-26 2013-8-30 2020-8-26 7.00 4.0000
130104 13Local Bond09 Book-entry 260.0000 2013-9-3 2013-9-9 2016-9-3 3.00 4.3400
130105 13Shanghai01 Book-entry 56.0000 2013-9-9 2013-9-13 2018-9-9 5.00 3.9400
130106 13Shanghai02 Book-entry 56.0000 2013-9-9 2013-9-13 2020-9-9 7.00 4.0100
130107 13Local Bond10 Book-entry 262.0000 2013-9-10 2013-9-16 2018-9-10 5.00 4.4500
130108 13Guangdong01 Book-entry 60.5000 2013-9-17 2013-9-25 2018-9-17 5.00 4.0000
130109 13Guangdong02 Book-entry 60.5000 2013-9-17 2013-9-25 2020-9-17 7.00 4.1000
130110 13Jiangsu01 Book-entry 76.5000 2013-10-11 2013-10-16 2018-10-11 5.00 3.8800
130111 13Jiangsu02 Book-entry 76.5000 2013-10-11 2013-10-16 2020-10-11 7.00 4.0000
130112 13Local Bond11 Book-entry 216.0000 2013-10-15 2013-10-21 2016-10-15 3.00 4.2500
130113 13Local Bond12 Book-entry 221.0000 2013-10-22 2013-10-28 2018-10-22 5.00 4.3300
130114 13Zhejiang01 Book-entry 59.0000 2013-10-28 2013-11-5 2018-10-28 5.00 3.9600
130115 13Zhejiang02 Book-entry 59.0000 2013-10-28 2013-11-5 2020-10-28 7.00 4.1700
130116 13Shenzhen01 Book-entry 18.0000 2013-11-11 2013-11-15 2018-11-11 5.00 4.1100
130117 13Shenzhen02 Book-entry 18.0000 2013-11-11 2013-11-15 2020-11-11 7.00 4.1800

Bond Market
2014 Fact Book 145
Summary of Corporate Bonds in 2013(Including Convertible Bond)
Code Short NameIssue size (RMB100 million)
Date of Maturity
Opening (RMB)
Closing (RMB)
High(RMB)
Low(RMB)
Turnover value(RMB 10,000)
110003 Xinyu Steel Convertible Bond 27.60 2013-8-20 103.81 106.55 109.10 103.81 819350.52
110007 Bohui Convertible Bond 9.75 2014-9-23 99.59 102.76 110.96 99.52 220762.40
110009 Shuangliang Convertible Bond 7.20 2015-5-4 0.00 95.22 0.00 0.00 0.00
110011 Gehua Convertible Bond 16.00 2016-11-25 92.79 95.50 104.16 92.65 308536.79
110012Ningbo Marine Convertible Bond
7.20 2016-1-7 99.70 105.14 111.32 99.00 114408.91
110013 SDIC Power Convertible Bond 34.00 2017-1-25 123.70 128.50 144.31 106.15 974762.81
110015 Sinopec Convertible Bond 230.00 2017-2-23 103.88 96.04 115.60 95.51 8331769.84
110016Sichuan Investment Convertible Bond
21.00 2017-3-21 109.32 126.12 135.50 108.52 624730.02
110017China Shipping Development Convertible Bond
39.50 2017-8-1 88.85 91.47 98.85 88.85 350041.84
110018China GD Power Convertible Bond
55.00 2017-8-19 115.79 103.45 127.89 102.68 1691173.10
110019 Hengfeng Convertible Bond 4.50 2017-3-23 109.13 99.42 119.40 98.90 67121.65
110020 Nanshan Convertible Bond 60.00 2018-10-16 107.08 91.72 121.89 91.40 1879527.55
110022 Tongren Convertible Bond 12.05 2017-12-4 116.97 124.98 148.65 114.12 532746.57
110023 Minsheng Convertible Bond 200.00 2019-3-15 105.50 96.91 117.55 94.85 6775406.16
110024 Tunnel Convertible Bond 26.00 2019-9-13 103.00 97.90 106.38 97.00 468017.70
113001 BOC Convertible Bond 400.00 2016-6-2 96.98 96.98 105.80 96.35 10062303.41
113002 ICBC Convertible Bond 250.00 2016-8-31 111.00 101.65 121.77 101.00 7487367.48
113003Heavy Industry Convertible Bond
80.50 2018-6-4 106.30 116.76 146.49 104.19 5523186.59
113005 Ping An Convertible Bond 260.00 2019-11-22 104.10 107.32 107.95 101.51 1700006.05
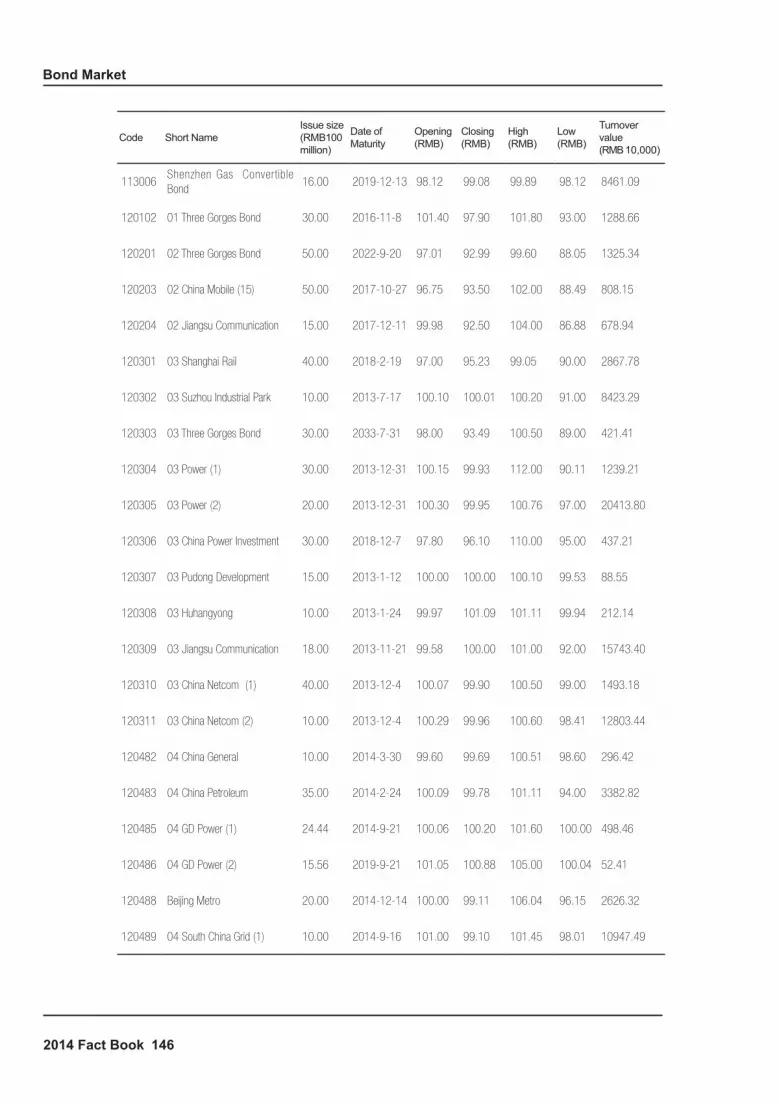
Bond Market
2014 Fact Book 146
Code Short NameIssue size (RMB100 million)
Date of Maturity
Opening (RMB)
Closing (RMB)
High(RMB)
Low(RMB)
Turnover value(RMB 10,000)
113006Shenzhen Gas Convertible Bond
16.00 2019-12-13 98.12 99.08 99.89 98.12 8461.09
120102 01 Three Gorges Bond 30.00 2016-11-8 101.40 97.90 101.80 93.00 1288.66
120201 02 Three Gorges Bond 50.00 2022-9-20 97.01 92.99 99.60 88.05 1325.34
120203 02 China Mobile (15) 50.00 2017-10-27 96.75 93.50 102.00 88.49 808.15
120204 02 Jiangsu Communication 15.00 2017-12-11 99.98 92.50 104.00 86.88 678.94
120301 03 Shanghai Rail 40.00 2018-2-19 97.00 95.23 99.05 90.00 2867.78
120302 03 Suzhou Industrial Park 10.00 2013-7-17 100.10 100.01 100.20 91.00 8423.29
120303 03 Three Gorges Bond 30.00 2033-7-31 98.00 93.49 100.50 89.00 421.41
120304 03 Power (1) 30.00 2013-12-31 100.15 99.93 112.00 90.11 1239.21
120305 03 Power (2) 20.00 2013-12-31 100.30 99.95 100.76 97.00 20413.80
120306 03 China Power Investment 30.00 2018-12-7 97.80 96.10 110.00 95.00 437.21
120307 03 Pudong Development 15.00 2013-1-12 100.00 100.00 100.10 99.53 88.55
120308 03 Huhangyong 10.00 2013-1-24 99.97 101.09 101.11 99.94 212.14
120309 03 Jiangsu Communication 18.00 2013-11-21 99.58 100.00 101.00 92.00 15743.40
120310 03 China Netcom (1) 40.00 2013-12-4 100.07 99.90 100.50 99.00 1493.18
120311 03 China Netcom (2) 10.00 2013-12-4 100.29 99.96 100.60 98.41 12803.44
120482 04 China General 10.00 2014-3-30 99.60 99.69 100.51 98.60 296.42
120483 04 China Petroleum 35.00 2014-2-24 100.09 99.78 101.11 94.00 3382.82
120485 04 GD Power (1) 24.44 2014-9-21 100.06 100.20 101.60 100.00 498.46
120486 04 GD Power (2) 15.56 2019-9-21 101.05 100.88 105.00 100.04 52.41
120488 Beijing Metro 20.00 2014-12-14 100.00 99.11 106.04 96.15 2626.32
120489 04 South China Grid (1) 10.00 2014-9-16 101.00 99.10 101.45 98.01 10947.49

Bond Market
2014 Fact Book 147
Code Short NameIssue size (RMB100 million)
Date of Maturity
Opening (RMB)
Closing (RMB)
High(RMB)
Low(RMB)
Turnover value(RMB 10,000)
120490 04 South China Grid (2) 20.00 2019-9-16 104.00 102.00 104.28 98.30 35385.63
120501 05 Shenergy 10.00 2015-2-1 101.98 100.50 110.18 90.56 1066.36
120502 05 Suzhou Industrial Park 12.00 2015-5-18 100.00 99.36 101.40 99.36 63.96
120503 05 Chongqing Waterworks 17.00 2015-4-25 101.50 99.99 101.55 89.00 3287.83
120505 05 Huadian 20.00 2015-6-29 98.01 98.00 102.04 91.10 211.03
120506 05 Datang 30.00 2020-4-28 0.00 108.00 0.00 0.00 0.00
120508 05 Railway 50.00 2020-7-28 97.00 92.00 110.00 90.00 226.90
120509 05 State Grid (1) 30.00 2015-7-7 100.40 99.50 103.00 90.01 295.60
120510 05 State Grid (2) 10.00 2015-7-7 100.00 98.50 101.90 89.12 998.36
120511 05 Shanghai Construction (1) 20.00 2015-7-26 101.10 101.00 101.10 101.00 1020.10
120512 05 Shanghai Construction (2) 10.00 2020-7-26 99.80 99.00 111.00 92.00 823.57
120516 05 China Power Investment 20.00 2015-7-11 100.00 95.48 101.45 89.15 21568.63
120519 05 Huaneng 20.00 2015-7-4 103.00 104.00 104.00 100.00 7.30
12052005 Hang zhou Mun i c i p a l Construction
10.00 2015-6-19 100.00 98.00 108.00 88.76 221.62
120521 05 Air China 30.00 2015-9-6 100.21 97.24 105.17 97.24 194.36
120522 05 Tietong 10.00 2015-8-17 0.00 100.00 0.00 0.00 0.00
120523 05 Fujian Expressway 20.00 2015-6-9 101.50 100.00 101.50 100.00 56.88
120525 05 China Nuclear (1) 10.00 2015-7-21 91.38 101.00 101.47 91.37 59.44
120527 05 Wuhan Urban Investment 10.00 2020-12-25 95.00 95.88 107.00 88.20 69.92
120529 05 Ningxia Coal 10.00 2020-9-15 100.00 98.00 110.00 86.59 2.05
120601 06 Datang 20.00 2026-2-15 0.00 96.49 0.00 0.00 0.00
120602 06 Hebei Construction 10.00 2026-3-27 91.99 84.51 103.00 80.39 195.60

Bond Market
2014 Fact Book 148
Code Short NameIssue size (RMB100 million)
Date of Maturity
Opening (RMB)
Closing (RMB)
High(RMB)
Low(RMB)
Turnover value(RMB 10,000)
120603 06 China Aerospace 20.00 2021-4-17 95.93 90.13 98.74 83.81 488.58
120604 06 State Grid (1) 10.00 2016-5-28 97.67 95.00 116.00 90.04 476.69
120605 06 Three Gorges Bond 30.00 2026-5-10 89.20 86.17 91.73 80.24 13084.88
120606 06 Zhangjiang 6.00 2013-5-18 99.68 100.49 100.49 90.51 240.59
120607 06 Shanghai Water 15.00 2021-6-28 0.00 98.70 0.00 0.00 0.00
120608 06 Shandong Expressway 10.00 2026-4-6 90.20 85.01 123.80 85.00 32.92
120609 06 Jiangxi Investment 8.00 2021-9-10 99.95 91.99 110.00 88.88 54.30
12061006 Hefei Municipal Construction Investment
10.00 2016-9-19 0.00 137.11 0.00 0.00 0.00
120701 07 World Expo (1) 20.00 2017-2-14 91.52 94.39 107.00 90.00 52.31
120702 07 World Expo (2) 20.00 2022-2-14 94.83 94.95 97.00 83.83 103.14
122000 07 Yangtze Power 40.00 2017-9-24 102.30 99.49 102.50 92.12 55866.60
12200107 Offshore China National Petroleum Engineering
12.00 2017-11-9 106.99 98.99 113.00 98.01 2092.96
122003 07 Huaneng G2 17.00 2014-12-25 101.50 99.80 112.20 92.55 33396.17
122004 07 Huaneng G3 33.00 2017-12-25 103.00 97.32 108.00 91.18 23649.35
122005 08 Vanadium and Titanium 13.00 2013-2-28 100.28 100.00 100.70 99.99 55881.51
122006 08 Gemdale 12.00 2016-3-10 101.02 98.40 112.60 90.64 45204.82
122007 08 Laiwu Steel 20.00 2018-3-25 102.01 96.80 105.49 93.04 145073.33
122008 08 Huaneng G1 40.00 2018-5-8 92.00 97.09 108.55 92.00 8199.04
122009 08 Xinhu 14.00 2016-7-2 106.50 101.69 109.00 101.22 388245.46
122011 08 Kingfa 10.00 2013-7-24 101.80 100.03 102.07 99.14 112436.96
122012 08 Poly 43.00 2013-7-11 100.71 100.01 111.00 99.60 186464.91
122013 08 North Star 17.00 2013-7-18 101.68 100.01 101.98 99.70 178967.52

Bond Market
2014 Fact Book 149
Code Short NameIssue size (RMB100 million)
Date of Maturity
Opening (RMB)
Closing (RMB)
High(RMB)
Low(RMB)
Turnover value(RMB 10,000)
122014 09 Yuyuan 5.00 2014-7-17 101.65 99.09 104.00 98.80 45928.29
122015 09 Yangtze Power 35.00 2019-7-30 95.50 94.40 108.67 88.88 423.96
122016 09 China National Materials 25.00 2016-7-29 101.00 99.99 103.99 99.34 17446.76
122017 09 Datang 30.00 2019-8-17 96.66 96.90 113.00 88.88 1808.02
12201809 China Communications Construction G1
21.00 2014-8-21 100.30 99.00 100.80 97.40 50957.77
122019 09 China Communications G2 79.00 2019-8-21 100.99 99.00 101.00 94.02 2328.14
122020 09 Forte Land 19.00 2014-9-22 103.21 100.20 104.98 99.30 296603.92
122021 09 Guanghui 10.00 2016-8-26 102.38 98.38 106.50 95.68 183901.31
122022 09 Chengtou 20.00 2014-9-11 100.00 99.90 101.00 98.00 47349.65
122023 09 Wanye 10.00 2014-9-17 103.10 99.99 104.90 98.50 172451.30
122024 09 Guoyang 14.00 2014-9-15 100.70 100.20 101.50 98.20 54042.36
122025 09 Beijing Capital Land 10.00 2014-9-24 102.38 99.60 103.10 90.03 71858.19
122026 09 Foton 10.00 2014-9-23 101.00 100.30 109.00 94.20 49841.53
122027 09 Beijing Urban Construction 9.00 2016-9-28 102.80 99.50 103.01 99.00 30728.71
122028 09 Huafa 18.00 2017-10-16 103.00 100.00 105.55 94.81 96067.00
122029 09 Vantone 10.00 2014-10-14 103.50 100.28 104.25 98.01 134600.87
12203009 Beijing Hualian Hypermarket
7.00 2015-11-2 99.87 98.50 112.00 98.00 44031.66
122032 09 Tunnel 14.00 2016-10-21 100.30 99.29 103.85 95.00 122923.41
122033 09 Fl Properties 55.00 2014-10-23 103.55 101.14 104.26 100.00 805633.13
122034 09 China Enterprise 12.00 2014-10-27 101.78 100.40 104.50 99.60 54808.28
122035 09 Suzhou Hi-Tech 10.00 2014-11-9 102.50 100.50 103.00 99.30 97211.88
122036 09 Shanghai Zhangjiang 20.00 2014-12-9 100.00 99.50 102.70 99.26 231546.63

Bond Market
2014 Fact Book 150
Code Short NameIssue size (RMB100 million)
Date of Maturity
Opening (RMB)
Closing (RMB)
High(RMB)
Low(RMB)
Turnover value(RMB 10,000)
122037 09 Sanyou 9.60 2017-11-26 101.00 99.40 104.72 97.90 100476.52
122038 09 Nanjing Xingang High-tech 10.00 2014-12-8 100.88 99.10 101.80 98.20 71515.05
122039 09 Anhui Expressway 20.00 2014-12-17 0.00 104.55 0.00 0.00 0.00
122040 09 New Huang Pu 10.00 2014-12-16 100.65 99.37 102.00 98.88 75691.45
122041 09 Zhaojin 15.00 2016-12-23 100.00 100.00 100.00 100.00 2465.00
122043 09 Zijiang 10.00 2017-12-28 100.80 99.20 105.00 98.32 135272.85
122044 10 Lianyungang 6.50 2015-1-25 101.00 99.30 101.80 99.00 48576.05
122045 10 Chinese Railway G1 10.00 2015-1-27 99.60 99.00 109.00 98.07 28927.89
122046 10 Chinese Railway G2 50.00 2020-1-27 99.50 93.99 112.00 88.21 107.41
122047 10 Capital Airport 01 19.00 2015-2-3 99.20 98.00 102.50 95.00 40906.31
122048 10 Capital Airport 02 30.00 2017-2-3 0.00 100.00 0.00 0.00 0.00
122049 10 Yingkou Port 12.00 2018-3-2 100.00 99.10 102.70 99.00 104676.20
122050 10 Shanshan 6.00 2017-3-26 100.00 99.00 103.89 97.50 71825.98
122051 10 Sinopec 01 110.00 2015-5-21 98.50 96.60 99.44 96.09 353423.59
122052 10 Sinopec 02 90.00 2020-5-21 95.00 91.79 98.80 91.79 1013.52
122053 10 Taihao 5.00 2015-9-27 100.50 98.30 102.00 91.00 76088.17
122054 10 Chinese Railway G3 25.00 2020-10-19 93.50 91.00 99.99 84.25 1896.40
122055 10 Chinese Railway G4 35.00 2025-10-19 90.03 91.60 98.50 85.00 512.21
122056 10 Longyuan 01 20.00 2015-12-10 0.00 101.23 0.00 0.00 0.00
122057 10 Longyuan 02 20.00 2020-12-10 0.00 100.00 0.00 0.00 0.00
122058 10 Yuyuan 5.00 2015-12-22 101.36 98.30 105.00 96.77 45262.20
122059 10 Chongqing Iron & Steel 20.00 2017-12-9 99.90 92.80 102.00 87.49 92426.53

Bond Market
2014 Fact Book 151
Code Short NameIssue size (RMB100 million)
Date of Maturity
Opening (RMB)
Closing (RMB)
High(RMB)
Low(RMB)
Turnover value(RMB 10,000)
122060 10 Yinge 7.50 2017-12-22 99.51 93.32 102.85 91.21 127501.55
122061 11 Western Mining 01 20.00 2016-1-17 100.05 100.05 100.05 100.05 54.03
122062 11 Western Mining 02 20.00 2021-1-17 0.00 100.00 0.00 0.00 0.00
122063 11 Longyuan 01 15.00 2016-1-21 0.00 100.00 0.00 0.00 0.00
122064 11 Longyuan 02 15.00 2021-1-21 0.00 100.00 0.00 0.00 0.00
12206511 Shanghai International Port 01
50.00 2016-3-30 100.10 99.43 104.00 95.00 875980.88
122066 11 Datang 01 30.00 2021-4-20 99.00 100.96 108.99 90.65 1362.84
122067 11 Nanjing Iron & Steel 40.00 2018-5-6 98.60 90.00 110.50 87.51 329402.67
122068 11 Conch Cement 01 70.00 2016-5-23 96.61 97.93 102.10 94.67 308896.03
122069 11 Conch Cement 02 25.00 2018-5-23 100.80 100.28 103.00 95.00 38037.72
122070 11 Hainan Airlines 01 35.60 2016-5-24 98.00 96.00 109.10 90.98 265041.69
122071 11 Hainan Airlines 02 14.40 2021-5-24 95.52 92.84 100.58 91.45 101036.11
122072 11 Dalian Port 23.50 2021-5-23 99.29 98.03 110.00 93.01 817.84
122073 11 Yunwei Bond 10.00 2018-6-1 98.00 83.50 100.20 82.00 259460.24
122074 11 Silan Microelectronics 6.00 2016-6-9 100.00 98.89 100.52 90.97 97923.93
122075 11 Liuzhou Iron & Steel Bond 20.00 2019-6-1 100.00 98.00 101.20 91.03 63121.93
122076 11 Conba 6.00 2016-6-8 101.70 99.47 109.00 94.00 68983.28
122077 11 Western Steel Bond 10.00 2019-6-15 100.00 99.00 102.00 93.56 70375.61
122078 11 Dongyangguang 9.00 2016-6-15 100.39 98.99 101.00 98.01 126473.54
12207911 Shanghai International Port 02
30.00 2016-7-6 100.97 99.10 102.20 98.82 304031.59
122080 11 Kangmei Pharmaceutical 25.00 2018-6-21 100.50 97.98 103.70 95.00 208160.27
122081 11 Star Lake 6.40 2017-7-7 99.00 100.15 101.17 97.00 32909.31

Bond Market
2014 Fact Book 152
Code Short NameIssue size (RMB100 million)
Date of Maturity
Opening (RMB)
Closing (RMB)
High(RMB)
Low(RMB)
Turnover value(RMB 10,000)
122082 11 Nanhai Development 6.50 2016-7-7 101.00 100.50 101.00 96.00 30393.81
122083 11 Tianwei 16.00 2018-7-11 99.99 82.78 102.00 82.50 46538.57
122084 11 Xiangtan Electric 9.50 2016-7-15 98.01 96.00 100.65 93.00 859.70
122085 11 Shenzhen Expressway 15.00 2016-7-27 102.50 99.88 103.70 99.60 93098.50
122086 11 Zhejiang Chint Electrics 15.00 2016-7-20 110.00 99.50 111.50 99.40 159132.96
122087 11 Lingyuan Iron & Steel 14.80 2019-8-1 101.00 94.90 103.20 85.27 25912.22
122088 11 Zongyi 7.00 2016-8-31 100.61 92.34 103.93 91.25 194387.60
122089 11 Maanshan Steel 01 31.60 2014-8-25 101.29 99.19 102.50 99.10 192488.43
122090 11 Maanshan Steel 02 23.40 2016-8-25 102.80 102.80 102.80 102.80 643758.83
12209111 Chongqing Mach iner y Electric
10.00 2016-8-17 103.00 103.49 106.00 102.50 31701.68
122092 11 Daqin Railway 01 40.00 2013-8-18 100.46 100.00 102.76 99.50 426371.61
122093 11 Zhongfu Industry 15.00 2019-8-29 100.06 89.00 104.98 88.98 340873.05
122094 11 Hisun Pharmaceutical 8.00 2016-8-25 103.15 103.00 108.00 92.00 39967.82
122095 11 Hangzhou Iron&Steel 14.00 2014-8-24 101.70 99.59 101.90 99.00 209706.53
122096 11 Joincare 10.00 2018-10-28 104.50 100.50 107.00 98.00 63017.45
122097 11 Pudong Road & Bridge 7.00 2016-10-24 103.80 100.79 105.00 99.00 60171.38
122098 11 Bayi Iron & Steel 12.00 2014-9-16 103.00 101.00 106.00 99.00 29883.69
122099 11 Dalian Port 02 26.50 2018-9-26 0.00 100.00 0.00 0.00 34452.00
122100 11 Huayi Electric Bond 7.00 2016-11-9 102.00 99.00 105.35 92.65 172765.47
122102 11 Guanghui 01 20.00 2017-11-3 102.75 100.00 105.62 95.00 326556.78
122103 11 AVIC Heavy Machinery 01 9.97 2017-2-8 101.85 98.50 102.50 98.50 107364.58
122105 11Anyang Iron & Steel 02 8.00 2019-2-14 100.60 82.06 102.50 80.77 175718.83

Bond Market
2014 Fact Book 153
Code Short NameIssue size (RMB100 million)
Date of Maturity
Opening (RMB)
Closing (RMB)
High(RMB)
Low(RMB)
Turnover value(RMB 10,000)
12210611 Datang Renewable Power 01
42.00 2016-11-8 101.45 98.13 103.24 96.00 255422.69
122107 11 Anyang Iron & Steel 01 10.00 2018-11-11 98.00 83.30 103.80 80.55 208594.03
122108 11 Suntien Green Energy 01 10.00 2017-11-18 100.75 99.20 101.70 98.50 106250.11
122109 11 Suntien Green Energy 02 10.00 2018-11-18 100.00 100.00 100.10 100.00 16994.00
122110 11 Joinworld 13.70 2018-11-17 102.00 98.00 105.00 97.05 82825.59
122111 11 Yongtai 5.00 2016-12-14 102.00 100.50 106.50 96.13 72069.53
122112 11 Shanghai VW 16.00 2018-1-6 102.40 102.90 108.00 92.10 235512.55
122113 11 Xinyu Iron and Steel 9.00 2016-12-21 101.10 90.00 103.75 86.09 123998.74
122114 11 First Heavy Industries 25.00 2016-12-20 100.15 97.99 102.25 92.00 169743.68
122115 11 Sinovel 01 26.00 2016-12-27 96.86 90.72 100.80 73.91 665569.74
122116 11 Sinovel 02 2.00 2016-12-27 97.84 86.73 100.80 82.46 19228.47
122117 11 Fujian Expressway 15.00 2017-3-8 101.80 99.49 103.20 99.00 148041.77
122118 12 Xingfa 01 3.00 2018-2-14 100.00 103.00 103.00 99.80 43502.39
122119 12 Xingfa 02 5.00 2017-2-14 103.99 100.29 106.37 90.00 65886.97
122121 11 Rizhao Port 5.00 2017-2-17 100.00 99.00 103.07 93.29 8225.31
122122 11 Jinggong Steel 7.00 2015-3-22 101.50 98.00 103.11 90.00 87027.90
122123 11 Sinochem 01 7.00 2016-3-5 100.20 97.00 101.55 93.50 18923.49
122124 11 Sinochem 02 12.00 2019-3-5 102.00 96.00 102.00 90.00 274063.12
122125 11 Meilan 8.00 2019-3-15 103.79 98.80 116.95 96.00 113969.61
122126 11 Pangda 02 22.00 2017-3-1 102.10 100.86 106.60 99.80 357584.69
122127 11 Eurasia 4.70 2019-3-21 105.80 100.58 107.20 95.03 60639.14
122128 11 Wuhan Steel 72.00 2015-3-2 100.00 98.16 100.60 88.60 29102.02

Bond Market
2014 Fact Book 154
Code Short NameIssue size (RMB100 million)
Date of Maturity
Opening (RMB)
Closing (RMB)
High(RMB)
Low(RMB)
Turnover value(RMB 10,000)
122129 12 Jiuquan Steel 30.00 2015-3-19 100.50 98.40 110.00 97.01 171110.85
122130 11 Hangmin 01 3.00 2015-3-22 102.40 100.00 103.50 93.36 26422.15
122131 11 Pien Tze Huang 3.00 2017-3-15 100.30 100.30 104.88 100.00 41265.16
12213212 Dr. Peng Telecom and Media
14.00 2017-3-12 103.01 100.02 108.00 97.00 276070.30
122133 11 Liuzhou Chemical Industry 5.10 2019-3-27 102.01 88.20 103.60 85.00 84162.33
122134 11 Sino-microelectronics 3.20 2019-4-10 101.40 94.10 107.46 93.52 141821.44
122135 12 Baotailong 10.00 2017-4-11 102.70 93.98 106.00 93.63 244275.61
122136 11 Fosun Pharmaceutical 15.00 2017-4-25 100.55 96.00 101.60 95.00 116689.31
122138 11 Guidong 01 6.00 2019-4-16 101.00 96.50 104.80 92.01 50222.91
122139 11 Hongcheng Waterworks 5.00 2017-5-2 100.80 96.00 102.00 94.80 33492.06
122140 12 Ningbo Port 01 10.00 2015-4-16 100.30 98.20 101.90 98.00 9495.59
122141 12 Tasly Pharmaceutical 01 4.00 2017-4-24 101.50 99.30 103.25 92.91 30298.23
12214211 Lugang Science and Technology
4.00 2017-4-23 101.10 96.30 104.99 94.18 104379.83
122143 12 Yili 01 8.00 2020-4-23 102.80 98.59 105.00 95.00 215754.51
122144 12 Luxin Bond 4.00 2017-4-25 102.70 101.40 110.00 90.00 57453.80
122145 11 Guidong 02 4.00 2019-6-20 97.00 100.00 100.00 90.10 10213.18
122146 12 Huaxin 01 10.00 2017-5-17 100.00 99.75 100.90 97.00 148687.35
122147 12 Huaxin 02 10.00 2019-5-17 100.00 96.98 100.80 96.98 111530.44
122148 11 Jilin Expressway 8.00 2019-6-21 99.00 97.38 101.98 90.50 51352.98
122149 12 Sinopec 01 130.00 2017-6-1 97.80 95.10 100.50 93.80 671320.33
122150 12 Sinopec 02 70.00 2022-6-1 98.00 93.88 106.00 90.05 264242.43
122151 12 GD Power 01 30.00 2017-6-15 97.80 95.10 100.00 93.50 185555.92

Bond Market
2014 Fact Book 155
Code Short NameIssue size (RMB100 million)
Date of Maturity
Opening (RMB)
Closing (RMB)
High(RMB)
Low(RMB)
Turnover value(RMB 10,000)
122152 12 GD Power 02 10.00 2019-6-15 100.00 99.00 100.10 89.90 34513.16
122153 12 Beijing Energy 01 24.00 2015-7-3 99.60 96.96 100.45 96.50 304827.03
122154 12 Beijing Energy 02 12.00 2017-7-3 90.04 96.50 100.10 90.04 179056.58
122155 12 Tianfu Thermoelectric 5.00 2017-6-6 100.50 98.98 101.80 95.00 83024.47
122156 12 Xiamen XGMA Machinery 15.00 2017-6-18 98.30 96.50 99.80 87.00 59818.07
12215712 Guangzhou Development Industry 01
23.50 2019-6-25 99.00 94.48 101.00 93.15 211916.98
122158 12 Xining Special Steel 4.30 2020-7-16 97.80 92.40 102.98 81.26 23048.86
122159 12 Yili 02 8.00 2020-7-19 99.98 91.92 100.50 90.30 135405.29
122161 12 Shentong Metro 02 4.00 2015-7-20 99.00 98.50 100.00 89.75 28773.87
122162 12 Zhongfu 10.00 2017-8-28 102.90 96.58 105.67 94.40 140990.89
122163 12 Eerduosi Resources 40.00 2017-8-30 99.70 97.49 110.00 91.00 46105.06
122164 12 Tongwei 5.00 2017-10-24 99.10 96.81 101.51 95.44 50681.93
122165 12 GD Power 03 33.00 2015-7-23 98.50 97.00 100.10 94.78 272007.22
122166 12 GD Power 04 7.00 2017-7-23 93.00 94.30 100.27 90.32 45854.57
122167 12 Yanzhou Coal 01 10.00 2017-7-23 0.00 100.00 0.00 0.00 0.00
122168 12 Yanzhou Coal 02 40.00 2022-7-23 99.99 97.00 99.99 95.00 1527.25
122169 12 Jinrui 1.50 2017-8-29 102.01 99.05 104.65 98.38 33753.55
12217012 Jiangzhong Pharmaceutical
5.00 2015-12-7 100.30 98.50 101.50 95.00 43566.22
12217112 China Shipping Development 01
10.00 2015-8-3 98.45 99.00 100.20 90.30 49674.24
12217212 China Shipping Development 02
15.00 2022-8-3 0.00 99.23 0.00 0.00 0.00
122173 12 China Communications 01 60.00 2017-8-9 100.90 96.01 100.90 87.20 1441.36
122174 12 China Communications 02 20.00 2022-8-9 0.00 99.76 0.00 0.00 0.00

Bond Market
2014 Fact Book 156
Code Short NameIssue size (RMB100 million)
Date of Maturity
Opening (RMB)
Closing (RMB)
High(RMB)
Low(RMB)
Turnover value(RMB 10,000)
122175 12 China Communications 03 40.00 2027-8-9 0.00 100.00 0.00 0.00 0.00
122176 12 Zhongchu 16.00 2019-8-13 98.30 99.00 105.00 89.66 22675.89
12217712 Guodian Technology and Environment 01
12.00 2015-8-20 99.75 99.98 99.98 99.35 14790.39
12217812 Guodian Technology and Environment 02
8.00 2017-8-20 99.80 95.22 100.00 95.22 17869.40
12217912 Guodian Technology and Environment 03
20.00 2022-8-20 0.00 100.00 0.00 0.00 19984.00
122180 12 Whirlwind 7.00 2017-8-23 101.00 98.50 101.70 96.81 53928.53
122181 12 Shanying Paper 8.00 2019-8-22 101.00 91.77 103.68 90.90 170874.35
122182 12 Jointown Pharmaceutical 16.00 2017-10-22 100.50 97.40 102.10 95.01 160641.46
122183 12 Prime Machinery 01 5.00 2017-8-31 99.95 101.20 101.20 99.95 8796.73
122184 12 First Heavy Industries 01 25.00 2017-9-3 99.60 96.00 101.70 95.00 46582.33
122185 12 Lifan 01 12.00 2015-9-19 102.30 99.30 103.88 97.80 150072.11
122186 12 Lifan 02 7.00 2017-9-19 102.50 97.25 106.97 94.99 112771.99
122187 12 Fiberglass 12.00 2019-10-17 100.40 96.29 102.74 95.00 93442.04
122188 12 Huaxin Cement 03 11.00 2019-11-9 100.00 96.00 103.00 96.00 44480.52
12218912 Wangfujing Department Store 01
11.00 2017-10-24 100.20 98.20 100.80 96.70 111997.80
12219012 Wangfujing Department Store 02
11.00 2019-10-24 99.00 95.70 102.30 94.00 23264.51
122191 12 Guiguan 01 8.00 2017-10-24 98.00 98.20 100.30 95.00 11415.59
122192 12 Guiguan 02 9.30 2022-10-24 0.00 100.00 0.00 0.00 10000.00
122193 12 Sinohydro Group 01 20.00 2019-10-29 97.42 94.14 108.00 94.00 650.45
122194 12 Sinohydro Group 02 30.00 2022-10-29 100.03 99.50 111.00 96.20 45168.18
12219512 China Shipping Development 03
15.00 2019-10-29 95.00 95.10 100.10 95.00 11023.42
12219612 China Shipping Development 04
10.00 2022-10-29 0.00 100.00 0.00 0.00 0.00

Bond Market
2014 Fact Book 157
Code Short NameIssue size (RMB100 million)
Date of Maturity
Opening (RMB)
Closing (RMB)
High(RMB)
Low(RMB)
Turnover value(RMB 10,000)
122197 12 Beijing Teamsun 01 9.00 2018-3-13 101.30 97.76 101.55 88.58 101619.75
122198 12 Huaneng Renewables 02 11.40 2015-10-29 99.80 97.50 101.15 95.64 61473.23
122199 12 Huaneng Renewables 02 8.60 2017-10-29 95.25 105.00 105.00 95.25 42045.56
122200 12 Shanxi Lanhua Sci-tech 30.00 2017-11-7 100.00 96.80 101.30 95.00 121754.04
122201 12 Kailuan Energy 15.00 2019-10-30 97.00 96.99 103.00 96.73 116530.28
122202 12 Conch 01 25.00 2017-11-7 99.00 100.00 100.50 86.61 164.21
122203 12 Conch 02 35.00 2022-11-7 0.00 100.00 0.00 0.00 0.00
12220412 Shuangliang Eco-energy Systems
8.00 2017-11-12 100.00 97.00 103.00 93.00 42444.47
122205 12 Shanghai Jiao Yun 8.00 2017-11-16 100.00 98.99 105.00 95.00 46844.09
122206 12Sailun 7.20 2015-11-15 99.50 97.50 101.90 95.10 46893.89
122207 12 Camel Group 8.00 2017-12-5 100.00 99.45 102.00 98.01 72712.96
122208 12 Zhaojin Mining Industry 12.00 2017-11-16 98.10 99.80 105.00 98.01 15.30
122209 12 Petrol China 01 160.00 2017-11-22 99.10 96.80 101.50 93.02 254216.82
122210 12 Petrol China 02 20.00 2022-11-22 99.00 99.80 99.80 99.00 6478.70
122211 12 Petrol China 03 20.00 2027-11-22 0.00 100.00 0.00 0.00 9978.00
122212 12 Beijing Jangho 9.00 2017-12-7 99.70 98.00 102.32 95.00 97364.46
12221312 Qingsong Building Materials and Chemicals
22.00 2019-12-5 100.20 96.10 103.51 92.22 192464.77
122214 12 Daqin 50.00 2015-12-10 100.01 97.78 102.20 97.50 630974.93
122215 12 Young Tech 01 16.00 2017-12-20 100.50 96.44 102.20 92.10 155861.64
122216 12 Tongkun Group 13.00 2018-1-21 100.00 95.00 101.50 93.50 74338.11
122217 12 Chongqing Water 15.00 2018-1-29 100.90 100.00 106.06 88.40 2435.38
122218 12 Air China 01 50.00 2023-1-18 100.50 97.00 101.00 90.03 24239.12

Bond Market
2014 Fact Book 158
Code Short NameIssue size (RMB100 million)
Date of Maturity
Opening (RMB)
Closing (RMB)
High(RMB)
Low(RMB)
Turnover value(RMB 10,000)
122219 12 Rongtai Industry 7.50 2018-1-24 100.20 91.99 100.55 89.30 46323.52
122220 12 CITIC Heavy Industries 01 12.00 2018-1-25 100.00 100.00 100.20 89.32 29001.52
122221 12 CITIC Heavy Industries 02 6.00 2020-1-25 100.00 100.10 100.10 90.50 38136.23
122222 12 Young Tech 02 9.00 2018-1-31 100.10 97.25 102.00 92.34 43483.67
12222312 Shanghai Electric Wind Energy 01
4.00 2016-2-27 100.00 100.00 100.80 99.50 24655.70
12222412 Shanghai Electric Wind Energy 02
16.00 2018-2-27 99.74 100.00 100.41 90.12 52601.24
122225 12 First Tractor 01 8.00 2018-3-4 100.00 96.00 100.70 89.71 37792.13
12222612 Baosheng Science and Technology
6.00 2018-3-6 90.20 96.90 96.90 90.20 51712.39
122227 13 Jianfeng 01 3.00 2018-6-5 100.00 96.50 100.00 89.68 1868.26
122228 13 Tasly 01 4.00 2018-3-29 100.73 96.00 121.00 90.49 13633.98
122229 12 Sinopharm Group01 40.00 2018-3-13 100.00 97.00 100.75 95.00 192909.03
122230 12 Shanghai Highly 10.00 2018-2-28 101.00 96.00 101.00 96.00 42397.69
122231 12 Shanghai Electric Power 15.00 2018-3-4 100.00 99.98 101.00 96.60 69086.28
12223212 China Merchants Securities 01
30.00 2018-3-5 98.91 100.00 100.50 98.91 9873.49
12223312 China Merchants Securities 02
15.00 2018-3-5 0.00 100.00 0.00 0.00 0.00
12223412 China Merchants Securities 03
55.00 2023-3-5 0.00 100.00 0.00 0.00 0.00
122235 12 Wuhu Port 15.00 2018-3-20 101.20 97.00 101.30 96.80 109063.87
122236 12 Harbin Electric 01 30.00 2018-3-11 99.70 100.48 100.50 97.80 28.12
12223712 Western Resources Holding
6.00 2018-3-8 100.20 92.00 101.00 89.03 11205.74
122238 13Ningbo Port 01 10.00 2016-3-13 100.00 96.30 101.10 89.32 42959.57
122239 13 China Petroleum 01 160.00 2018-3-15 97.81 95.98 100.35 94.50 101672.88
122240 13 China Petroleum 02 40.00 2023-3-15 93.27 93.27 93.30 93.27 38100.00

Bond Market
2014 Fact Book 159
Code Short NameIssue size (RMB100 million)
Date of Maturity
Opening (RMB)
Closing (RMB)
High(RMB)
Low(RMB)
Turnover value(RMB 10,000)
122241 12 Eastern Airlines 01 48.00 2023-3-18 90.20 101.00 101.00 90.00 5081.08
122242 12 Guangzhou Automobile 01 10.00 2018-3-20 99.00 100.29 101.76 90.31 20010.22
122243 12 Guangzhou Automobile 02 30.00 2023-3-20 0.00 100.00 0.00 0.00 0.00
122244 12 Datang 01 30.00 2023-3-27 100.00 97.00 100.10 87.50 18.69
122245 13 Ningbo Thermal Power 3.00 2020-4-15 100.00 100.00 100.70 98.50 697.51
122247 13 Fuxin 01 10.00 2018-3-25 100.50 101.00 101.00 96.37 3968.99
122248 13 Fuxin 02 10.00 2023-3-25 100.99 101.00 101.00 100.99 201.99
12224913 Pingdingshan Tianan Coal Mining
45.00 2023-4-17 100.50 100.00 100.50 95.58 93015.70
122250 13 Hebang 01 4.00 2020-4-22 100.20 94.98 101.00 90.00 86395.05
122251 13 CSR 01 15.00 2018-4-22 100.30 100.00 100.51 90.20 159.86
122252 13 CSR 02 15.00 2023-4-22 0.00 100.00 0.00 0.00 0.00
122253 12 First Tractor 02 7.00 2018-5-30 98.80 96.80 99.00 88.85 1773.61
122254 12 Biok 01 3.00 2018-5-22 100.00 99.50 100.00 93.10 9368.79
122255 13 Ganyue Expressway 01 18.00 2023-4-19 100.00 100.00 110.00 90.26 36336.09
122256 13 Freetrade Bond 3.50 2018-5-23 100.00 95.00 100.00 90.96 9431.64
122257 12 Yueyang Paper 01 8.50 2018-5-29 98.50 93.40 99.98 93.01 18843.91
122258 13 Yunnan Coal 2.50 2020-12-3 90.83 90.83 90.83 90.83 0.91
122259 13 CITIC 01 30.00 2018-6-7 98.00 93.39 100.00 90.21 52.43
122260 13 CITIC 02 120.00 2023-6-7 0.00 100.00 0.00 0.00 0.00
122261 13 Huatai 01 40.00 2018-6-5 100.00 100.00 100.00 100.00 0.20
122262 13 Huatai 02 60.00 2023-6-5 0.00 100.00 0.00 0.00 0.00
122263 12 Yuyuan 01 5.00 2018-6-17 100.99 94.98 100.99 89.11 1782.35

Bond Market
2014 Fact Book 160
Code Short NameIssue size (RMB100 million)
Date of Maturity
Opening (RMB)
Closing (RMB)
High(RMB)
Low(RMB)
Turnover value(RMB 10,000)
122264 13 Beijing Jinkelong 7.50 2018-8-13 0.00 100.00 0.00 0.00 3000.00
122265 13 Sichuan Road and Bridge 15.00 2018-7-26 0.00 100.00 0.00 0.00 58276.00
122266 13 CITIC 03 50.00 2016-8-5 100.00 97.00 100.00 96.50 75608.40
122267 13 Young Tech Bond 38.00 2018-8-6 100.00 97.15 100.30 97.00 95782.16
122268 12 China Airlines 02 35.00 2018-8-16 103.00 103.99 104.30 82.00 682.01
122269 12 China Airlines 03 15.00 2023-8-16 0.00 100.00 0.00 0.00 0.00
122270 13 Essence Securities 36.00 2018-8-19 100.00 100.00 100.00 100.00 111304.10
122273 13 Shandong Gold 01 20.00 2018-9-3 98.50 98.50 98.50 98.50 28904.05
122274 11 Hangmin 02 2.50 2016-9-16 100.01 96.50 100.01 96.50 2362.55
122276 13 Weiqiao 01 30.00 2018-10-23 97.00 99.63 100.00 93.00 260952.78
122277 13 Huayu 01 12.00 2015-11-18 98.50 98.50 98.50 98.50 5512.99
122278 13 Huayu 02 28.00 2018-11-18 99.88 105.50 105.50 99.88 3995.31
122279 13 Sinotrans Bond 20.00 2016-11-8 0.00 100.00 0.00 0.00 0.00
122280 13 Haitong 01 72.60 2016-11-25 99.80 98.50 99.80 90.78 10231.66
122281 13 Haitong 02 23.50 2018-11-25 0.00 100.00 0.00 0.00 0.00
122282 13 Haitong 03 23.90 2023-11-25 0.00 100.00 0.00 0.00 0.00
122283 13 Chengtun Bond 2.00 2018-12-12 99.98 99.89 99.98 90.15 27.55
122286 13 China Securities 47.00 2016-11-22 0.00 100.00 0.00 0.00 4000.00
122288 13 Soochow Securities 30.00 2018-11-18 0.00 100.00 0.00 0.00 0.00
12250012 Chenzhou Urban Construction and Investment
16.00 2019-9-13 103.60 105.73 105.73 100.02 142882.76
12250112 Shouguang Jincai Public Assets Management
12.00 2019-10-23 102.00 97.20 104.50 92.60 98751.32
122502 12 Harbin Heli 12.00 2018-9-26 104.87 99.49 105.52 99.49 48835.23

Bond Market
2014 Fact Book 161
Code Short NameIssue size (RMB100 million)
Date of Maturity
Opening (RMB)
Closing (RMB)
High(RMB)
Low(RMB)
Turnover value(RMB 10,000)
122503 12 Taiyuan Longcheng 20.00 2019-9-25 103.30 99.50 103.30 91.50 87463.56
122504 12 Tongliao Tiancheng 10.00 2019-9-24 101.84 97.24 104.80 96.50 139180.72
122505 12 Shaoxing Paojiang 10.00 2019-10-31 100.00 98.50 102.54 98.50 53435.03
122506 12 Wujiaotou 12.00 2020-10-31 100.00 99.50 108.00 95.61 89409.35
122507 12 Yujiaotou 10.00 2019-10-12 101.00 96.05 103.50 94.03 80914.48
122508 12 Forestry 13.00 2019-10-23 102.00 101.01 104.00 101.01 67339.42
122509 12 Bai City Zhongxing 10.00 2019-12-18 102.05 99.90 112.80 93.78 126034.65
12251012 Jingjiang Binjiang Xincheng
8.00 2018-10-23 100.50 100.00 103.28 90.83 83314.45
122513 12 Weixing Group 5.00 2019-10-23 101.80 98.00 102.00 96.40 42864.43
122514 12 Financial Street 19.00 2019-10-22 101.50 99.00 101.80 98.80 80777.90
12251512 Daqing Urban Construction Investment
22.00 2019-10-23 101.00 98.00 103.75 95.93 190587.96
122516 12 Qingzhou 01 8.00 2019-10-19 101.24 101.29 101.29 101.24 31884.25
122517 12 Qingzhou 02 4.00 2018-10-19 102.50 102.50 102.50 102.50 2070.10
122518 12 Poly Group 15.00 2019-10-25 100.01 100.05 100.05 100.01 49993.30
12251912 Xishan Economic Development Zone
7.00 2019-11-1 102.62 102.62 102.62 102.62 19427.90
122520 12 Tangshan Investment 10.00 2019-10-16 103.33 105.00 105.00 93.36 111034.22
122521 12 Jinyang Construction 12.00 2018-10-24 102.00 98.78 102.00 98.78 44689.20
122522 12 Xinghua City Construction 12.00 2018-10-23 103.01 99.89 104.86 95.00 196610.33
122523 12 Hailiang 01 6.00 2018-10-19 101.20 96.80 102.00 94.97 44055.62
122524 12 Hailiang 02 4.00 2019-10-19 100.76 102.00 103.00 100.00 4421.50
122525 12 Jiading Industrial Zone 8.00 2018-10-10 103.03 102.20 105.00 101.70 31260.59
12252612 Yongchuan District Huitong Construction
12.00 2019-10-16 101.70 103.50 104.50 95.00 79934.81

Bond Market
2014 Fact Book 162
Code Short NameIssue size (RMB100 million)
Date of Maturity
Opening (RMB)
Closing (RMB)
High(RMB)
Low(RMB)
Turnover value(RMB 10,000)
12252712 Wen l ing S ta te-owned Assets Investment
14.00 2019-9-18 104.00 102.05 112.50 93.00 129925.99
12252812 Hainan Harbor and Shipping
8.50 2019-10-18 0.00 100.00 0.00 0.00 1946.00
122530 12 Qitaihe Urban Construction 10.00 2019-10-18 102.01 98.79 104.91 95.00 67328.49
12253112 Taihu International Science Park
10.00 2019-9-17 101.40 100.98 104.50 95.05 82468.81
12253212 Yichang Financial Investment
15.00 2019-10-16 102.77 98.60 102.77 98.50 82337.72
12253312 Pinghu Urban Development and Investment
9.00 2019-9-18 101.73 101.30 104.50 100.00 44189.54
12253412 Qinhuangdao Development Zone
14.00 2019-10-17 101.50 104.88 104.88 92.99 106462.57
122535 12 Jiangsu Feida 8.00 2018-8-30 103.00 100.00 103.50 100.00 26584.62
12253612 Cixi State-owned Assets Investment
8.00 2019-9-20 101.87 103.35 103.35 101.87 62587.13
12253712 Karamay Urban Construction Investment
20.00 2019-9-4 102.63 102.40 105.50 95.00 25512.66
12253812 Fuzhou Urban and Rural Construction and Development
10.00 2018-9-25 101.02 101.02 101.02 101.02 86141.60
12253912 Fuxin Urban Infrastructure Construction Investment
12.00 2019-10-10 102.74 96.67 105.84 93.34 301695.29
122540 12 Nanjing Pukou 12.00 2019-10-8 101.70 104.00 110.88 97.73 225671.96
12254112 Ningxia Shangling Industrial
5.00 2018-10-16 103.80 97.91 104.99 94.41 71402.32
12254212 Aksu Xincheng Assets Investment
10.00 2018-10-10 104.20 97.00 105.80 95.50 171091.43
12254312 Qinzhou Development Investment
9.00 2019-10-16 102.54 102.28 106.30 100.00 129702.49
12254412 Chongqing Changshou Development
8.00 2019-9-25 103.01 103.10 103.10 103.01 16488.80
122545 12 Mongolia Hi-tech 10.00 2019-9-25 100.95 98.20 106.00 98.20 70592.26
122546 12 Nanjing High-tech 9.00 2019-9-7 101.82 101.82 101.82 101.82 29986.40
12254712 Qujing Development Investment
6.50 2019-9-6 102.60 103.29 103.55 102.56 7255.04
122549 12 Pizhou Runcheng 10.00 2019-9-25 100.78 100.90 105.95 96.20 193008.03
122550 12 Jiangsu Guoxin 20.00 2017-6-8 100.00 94.89 100.00 91.40 39652.53

Bond Market
2014 Fact Book 163
Code Short NameIssue size (RMB100 million)
Date of Maturity
Opening (RMB)
Closing (RMB)
High(RMB)
Low(RMB)
Turnover value(RMB 10,000)
122551 12 Rudong Investment 8.00 2019-9-24 104.30 105.00 105.00 104.30 19602.05
122552 12 Xinjiang Xinye 6.60 2019-8-15 100.00 100.02 100.03 100.00 16201.26
122553 12 Shangyu Traffic 10.00 2019-9-11 102.60 97.00 110.00 92.00 60411.08
122554 12 Dinghai 10.00 2020-8-31 105.30 103.00 105.30 96.89 49982.75
12255512 Changde Economic Development Investment
12.00 2019-9-12 102.70 104.00 104.00 98.37 77295.31
12255612 Xianning Urban Construction Investment
6.00 2018-8-31 102.80 99.00 106.00 95.29 77950.25
122557 12 Zhuzhou Hi-tech 10.00 2019-9-10 102.50 105.99 106.00 102.50 95412.70
12255812 Kunming Communication 01
14.00 2017-8-17 102.00 95.00 102.50 95.00 40196.32
12255912 Kunming Communication 02
13.00 2019-8-17 103.32 105.00 105.00 103.32 27136.40
12256012 Zibo Urban Assets Operation
15.00 2019-8-22 103.00 101.00 104.30 99.00 107875.68
12256112 Shangrao Urban Construction Investment
13.00 2019-9-10 101.76 99.00 115.00 98.56 210167.71
12256212 Yichun Urban Construction Investment
8.00 2019-7-24 102.51 95.88 108.00 95.08 152827.85
12256312 Bozhou Urban Construction Investment
15.00 2019-9-4 103.25 101.00 110.00 97.00 237637.14
12256412 Jiaojiang District State-owned Assets Management
10.00 2020-9-13 103.50 104.00 113.96 98.00 171888.99
122565 12 Shaoyang Investment 12.00 2018-9-11 101.00 100.00 106.37 99.00 112419.45
122566 12 Korla City Building 12.00 2018-9-10 103.30 99.99 112.00 97.02 179300.11
12256712 Xiaoqinghe Development and Construction Investment
18.00 2019-9-5 102.80 99.70 106.00 99.00 215513.96
12256812 Suizhou Urban Investment Group
7.00 2019-8-22 102.90 97.03 105.60 95.85 138335.40
122569 12 Tianjin Ecology 12.00 2019-8-14 102.00 101.30 105.00 94.00 149992.50
122570 12 Yunnan Water 10.00 2019-8-27 0.00 100.00 0.00 0.00 6027.00
12257112 X inzhan S ta te-owned Assets Management
14.00 2019-8-31 101.20 102.60 103.30 101.20 56775.63
12257212 Chengdu Investment Holdings Group
16.00 2019-9-4 101.55 98.00 103.20 94.10 41733.19

Bond Market
2014 Fact Book 164
Code Short NameIssue size (RMB100 million)
Date of Maturity
Opening (RMB)
Closing (RMB)
High(RMB)
Low(RMB)
Turnover value(RMB 10,000)
12257312 Mudanjiang State-owned Assets Investment
12.00 2019-8-30 0.00 100.00 0.00 0.00 33433.00
12257412 Huaian Development Holding
12.00 2019-9-6 104.50 101.30 104.50 94.25 53614.25
12257512 Feicheng Urban Assets Management
9.00 2018-8-14 100.45 98.49 103.99 90.10 63906.15
12257612Neijiang Investment Holding
7.00 2018-7-19 102.00 102.85 102.99 93.87 47785.56
12257712 Suzhou Xiangcheng Urban Construction
18.00 2019-9-3 0.00 100.00 0.00 0.00 60727.00
122578 12 Shanghai New Changning 7.00 2019-8-16 0.00 100.00 0.00 0.00 25125.00
122579 09 Sino-ocean Land Holdings 26.00 2015-6-23 100.00 99.50 101.65 95.19 253206.54
12258112 Tianjin Jinnan Urban Construction Investment
15.00 2019-6-18 100.50 97.49 101.78 94.70 153579.33
122582 12 Xiangtan Jiuhua 9.00 2019-8-29 102.88 96.92 109.88 94.53 124456.20
122583 12 Zunyi Investment 10.00 2019-3-13 108.00 101.83 118.80 94.71 69076.43
12258412 Songyuan Urban Development
13.00 2019-8-29 103.46 96.19 103.46 93.40 103233.91
122585 12 Xinhai Lian Development 13.00 2020-8-27 0.00 100.00 0.00 0.00 73319.00
12258612 Zhongshan Communication Development
6.00 2018-8-28 100.00 102.00 103.01 100.00 5288.12
12258712 Zunyi City Road and Bridge
18.00 2020-8-17 100.70 100.00 105.00 91.00 86141.09
12258812 Yiyang Urban Construction Investment
16.00 2019-8-24 101.89 98.80 104.36 95.00 105781.47
122589 12 Bijie Xintai Investment 16.00 2019-8-20 102.20 97.65 104.28 93.16 197419.46
12259012 Hecheng Construct ion Investment
15.00 2022-6-21 102.16 95.30 103.66 86.77 112549.23
12259112 Changzhou Communications Industry
15.00 2019-8-21 103.00 102.20 104.96 101.80 141297.64
12259212 Urumqi State-owned Assets Management
14.00 2018-4-28 97.60 97.60 97.60 97.60 42879.60
12259312 Hengyang Urban Construction Investment
18.00 2019-8-13 102.50 97.95 113.20 97.00 159037.75
12259412 Quanzhou Road and Bridge 01
8.00 2018-8-7 102.50 102.39 103.00 100.00 91060.33
12259512 Quanzhou Road and Bridge 02
8.00 2019-8-7 102.00 102.00 102.00 102.00 18343.10

Bond Market
2014 Fact Book 165
Code Short NameIssue size (RMB100 million)
Date of Maturity
Opening (RMB)
Closing (RMB)
High(RMB)
Low(RMB)
Turnover value(RMB 10,000)
12259612 Shanghai City Development
15.00 2018-8-21 101.80 106.00 106.00 100.00 160274.24
122597 12 Baoti Group 7.00 2018-8-21 100.50 101.45 101.45 100.50 17001.40
12259812 Jingmen Urban Construction Investment
8.00 2022-7-9 100.90 97.62 115.00 91.98 50751.18
122599 12 Fanjingshan Investment 12.00 2019-8-2 102.01 99.33 111.00 96.50 114881.10
122600 12 Taizhou Xintai Group 10.00 2018-8-14 101.49 101.49 101.49 101.49 25339.90
12260112 Baishan Urban Construction Inverstment
10.00 2019-7-31 101.30 97.39 108.32 93.68 126145.68
12260212 Songjiang Urban Construction Investment
12.00 2018-8-15 102.60 101.62 102.60 101.62 95450.36
12260312 Guangzhou Economic Technology Development Zone
25.00 2022-8-14 102.00 101.00 104.00 89.50 200732.96
122604 12 Jilin Railway Investment 8.00 2019-6-26 99.60 98.01 101.00 98.01 26287.10
122605 11 Ninghai 12.00 2017-12-31 104.06 103.88 104.30 99.20 12334.37
122606 12 Shunxin 8.00 2017-7-3 98.80 98.80 98.80 98.80 75800.00
122607 12 Chongqing Real Estate 50.00 2019-4-25 102.00 100.00 107.98 99.00 871523.42
122608 12 Xiyong Bond 16.00 2019-7-25 100.00 99.50 105.96 91.68 99680.71
12260912 Yangzhou Urban Construction
12.00 2019-7-26 100.00 101.50 101.50 100.00 79768.15
12261012 Yueqing National Investment
15.00 2019-6-29 100.00 102.27 102.40 100.00 90851.43
12261112 Chengdu Economic-Tech Development Zone 01
10.00 2018-7-17 101.30 101.30 101.30 101.30 102099.20
12261212 Chengdu Economic-Tech Development Zone 02
10.00 2019-7-17 98.58 99.98 102.98 93.03 54787.12
122613 12 Wuhai 16.00 2019-3-31 105.60 101.30 116.00 98.12 166530.65
12261412 Chongqing Jinyun Asset Management
10.00 2019-6-18 102.00 106.00 106.00 102.00 90085.21
122615 12 Baise 8.00 2019-7-4 0.00 100.00 0.00 0.00 64490.33
122616 12 Guizhou Railway 20.00 2022-3-27 106.89 99.50 108.56 98.01 35156.27
12261712 Xiangyang Construction Investment
15.00 2019-1-12 0.00 100.00 0.00 0.00 3050.00

Bond Market
2014 Fact Book 166
Code Short NameIssue size (RMB100 million)
Date of Maturity
Opening (RMB)
Closing (RMB)
High(RMB)
Low(RMB)
Turnover value(RMB 10,000)
122618 12 Tongzhong 15.00 2022-4-11 101.00 98.99 104.00 92.38 51570.19
122619 12 Qian’an 16.00 2018-7-11 98.99 97.14 102.50 95.03 225849.74
12262012 Urumchi Urban Construction Investment
9.00 2019-7-9 99.86 97.00 102.00 93.00 80188.98
12262112 Ganzhou Urban Development Investment
20.00 2018-7-10 98.80 98.50 105.75 97.00 220450.57
12262212 Jinzhou Urban Construction Investment
13.00 2019-6-13 0.00 100.00 0.00 0.00 88597.00
122623 12 Lvshun Construction 12.00 2019-7-2 101.00 102.00 103.00 96.00 185133.20
12262412 Binzhou Municipal Bincheng District Economic Development
8.00 2019-7-5 100.00 106.00 106.00 100.00 51097.32
122625 12 Shenghua 5.00 2019-7-2 99.00 99.00 99.00 99.00 20879.10
122626 12 Haiheng 12.00 2019-6-12 99.97 102.50 102.50 99.97 15093.80
12262712 Beijing Construction Engineering Group
8.00 2019-7-5 99.00 100.00 100.00 95.01 13019.27
12262812 Dongtai Communication Investment Group
10.00 2018-7-5 101.60 100.00 105.19 94.50 138361.87
122629 12 Pingdingshan Developmen 15.00 2019-5-8 104.50 103.97 104.50 95.11 165764.87
122630 12 Huitong Investment 18.00 2019-5-28 99.00 96.21 110.00 89.74 151097.98
122631 12 Shanxi GD Power 20.00 2022-5-24 101.22 97.00 101.22 97.00 23229.93
12263212 Jiangyin Urban Construction Investment
9.00 2019-6-11 101.00 98.00 105.00 98.00 149545.59
122633 12 Jiaxing Economic 9.00 2019-6-14 100.00 100.90 102.00 100.00 57935.77
12263412 Wuhu Economic and Tech Development Area 01
7.00 2018-6-8 99.40 103.10 103.10 99.40 59988.37
12263512 Wuhu Economic and Tech Development Area 02
10.00 2022-6-8 101.00 100.86 102.60 99.70 61944.42
122636 12 Lianyun Development 9.00 2019-6-19 101.50 101.50 101.50 101.50 14071.00
122637 12 Xincheng 12.00 2019-4-23 102.80 101.95 106.30 93.35 45781.09
122638 12 Xinyang Huaxin 10.00 2019-6-14 100.50 102.00 103.00 96.50 82442.16
122639 12 Shaoxing Chengbei 10.00 2018-6-11 99.00 98.36 108.00 97.00 41670.45

Bond Market
2014 Fact Book 167
Code Short NameIssue size (RMB100 million)
Date of Maturity
Opening (RMB)
Closing (RMB)
High(RMB)
Low(RMB)
Turnover value(RMB 10,000)
122640 12 Yizheng 8.00 2019-6-14 102.50 98.39 106.20 95.00 15006.58
122641 12 Wujin 14.00 2018-6-8 99.99 98.10 106.00 90.49 92463.80
122642 12 Chaoyang 16.00 2019-5-25 101.72 100.00 103.30 99.75 242761.05
122643 12 HNA Capital 15.00 2019-5-22 104.47 97.52 108.82 96.78 243503.11
122644 12 Tieling 12.00 2018-5-29 103.63 99.50 104.75 99.50 173939.31
122645 12 Suzhou Industrial Park 20.00 2019-5-30 102.50 102.50 102.50 102.50 55903.00
12264812 Xuancheng State-owned Assets Investment
10.00 2019-3-20 106.00 100.39 118.80 98.01 96992.49
12264912 Changsha Xingcheng Construction Investment
15.00 2019-4-6 106.45 101.98 117.80 100.50 221283.99
122650 12 Taineng Gas Group 5.00 2018-4-25 0.00 103.00 0.00 0.00 56863.50
12265112 Guang'an Investment Holding
8.00 2019-4-25 103.44 100.93 109.00 100.00 31086.19
12265212 Yangling Modern Agriculture
15.00 2019-5-23 102.51 100.00 108.20 98.00 195266.81
122654 12 Kunming Iron and Steel 20.00 2020-4-26 100.50 100.90 100.90 100.50 63639.75
122655 12 Tongling City Construction 15.00 2022-4-28 105.70 108.80 115.00 100.28 132174.20
122658 12 Panjin Construction 15.00 2019-5-17 102.80 100.00 105.70 100.00 222702.87
12265912 China National Petroleum 06
100.00 2022-4-12 97.00 95.60 100.00 93.50 16576.13
12266012 China National Petroleum 07
100.00 2022-4-12 100.20 94.13 100.20 88.76 114453.55
122661 12 Huaihua Bond 10.00 2018-3-22 103.26 99.85 107.85 99.23 39676.16
122662 12 Hefei Taohua 8.00 2019-3-27 108.00 100.72 121.00 100.16 54673.90
12266312 Science and Technology City Development
15.00 2019-5-15 101.00 98.50 112.00 91.00 104156.19
122664 12 Huludao 20.00 2019-3-1 106.01 107.77 110.04 104.00 99559.61
12266512 Zhenjiang Transport Investment
18.00 2019-5-8 100.50 102.54 104.63 100.50 97654.89
122666 12 State Grid 01 50.00 2022-4-17 0.00 100.00 0.00 0.00 4644.00

Bond Market
2014 Fact Book 168
Code Short NameIssue size (RMB100 million)
Date of Maturity
Opening (RMB)
Closing (RMB)
High(RMB)
Low(RMB)
Turnover value(RMB 10,000)
122667 12 State Grid 02 100.00 2027-4-17 100.80 100.80 100.80 100.80 15791.40
12266812 Liangshan State-owned Investment
5.00 2019-4-23 104.30 107.00 107.00 104.30 52697.26
122669 12 Guilin Bond 10.00 2018-5-9 100.40 98.00 113.00 93.80 84265.08
122670 12 Xinsheng Bond 15.00 2018-5-8 105.60 100.50 106.20 91.10 152804.46
122671 12 Yangtze River 5.00 2019-5-21 104.00 104.00 104.00 104.00 8847.01
122672 12 Xining Urban Investment 13.00 2019-4-27 103.70 99.70 106.60 97.10 87715.03
122673 12 Chongqing Fuling Lidu 8.00 2019-3-23 0.00 100.00 0.00 0.00 0.00
122674 12 Chongqing Qianjiang 9.00 2019-3-23 0.00 100.00 0.00 0.00 0.00
12267512 Hangzhou Urban Construction
16.00 2018-4-25 100.90 97.70 103.50 94.07 71626.49
12267612 Binjiang Urban Construction
12.00 2019-4-27 0.00 102.10 0.00 0.00 56636.00
122677 12 Jiangning Science Park 12.00 2019-4-28 102.00 99.50 104.50 99.50 93222.41
12267812 Yangzhou Chemical Industry
10.00 2019-4-25 103.00 100.98 108.50 94.82 193789.91
12267912 Bayannaoer Loop Water Affairs
10.00 2022-3-31 108.68 100.52 111.99 98.88 122160.58
12268012 Kunming Urban Construction
22.00 2018-4-13 104.50 100.50 106.40 94.14 233930.13
12268112 Hechuan Count r ys ide Agriculture Investment
15.00 2018-4-10 104.00 102.90 109.00 98.85 256919.94
122682 12 Yingkou 20.00 2020-4-18 103.60 99.43 111.24 96.01 161357.09
122683 12 Evergreen Industries 5.40 2018-4-24 100.57 94.67 105.20 90.98 157064.40
122684 12 Hefei Gaoxin 12.00 2019-3-22 104.80 99.06 108.20 96.51 69633.26
122685 12 Ji'an Urban Construction 16.00 2019-4-20 103.90 100.00 105.99 99.98 106639.89
122686 12 Baiyao Holdings 11.00 2019-3-30 101.20 97.00 103.68 97.00 60005.56
122687 12 Jintan Building 10.00 2019-3-14 103.50 103.00 109.00 98.16 41760.19
122688 12 Huatong 10.00 2019-4-18 103.80 100.00 103.90 97.00 28338.72

Bond Market
2014 Fact Book 169
Code Short NameIssue size (RMB100 million)
Date of Maturity
Opening (RMB)
Closing (RMB)
High(RMB)
Low(RMB)
Turnover value(RMB 10,000)
12268912 Suqian Economic Development
9.00 2019-3-26 103.95 99.00 105.50 99.00 109895.35
122690 12 Sanpower Group 8.00 2019-3-19 100.01 103.50 107.95 100.00 114867.98
122691 12 Wuqing 8.00 2019-3-27 0.00 100.00 0.00 0.00 20655.00
12269212 Zhangzhou Road and Bridge
11.00 2019-3-1 0.00 106.00 0.00 0.00 61019.00
12269312 Jiamusi Urban Construction and Investment
10.00 2019-3-22 104.80 102.99 107.99 99.03 24046.35
122694 12 Xingrong 8.00 2019-4-19 105.90 99.33 109.77 99.15 138602.82
12269512 Wuhua District State-owned Assets Investment
10.00 2018-3-15 105.54 100.17 108.74 98.58 147123.48
122696 12 Danyang Investment 15.00 2019-3-6 106.50 107.57 107.70 106.50 10633.88
122697 11 Taicang Assets 9.00 2018-12-31 104.80 100.00 107.00 100.00 3376.46
122698 12 Shuangliu 01 7.00 2019-3-16 105.50 110.30 111.80 97.21 27024.10
122699 12 Shuangliu 02 3.00 2019-3-16 105.00 99.00 119.00 97.80 10531.02
122700 12 Laibin Bond 9.00 2019-3-14 105.55 108.25 109.00 99.08 88123.72
12270112 Yuhang Urban Construction
12.00 2019-3-29 104.50 99.50 106.66 99.50 43913.09
122702 12 Hai’an Bond 15.00 2018-3-28 105.00 103.50 108.20 99.00 216709.26
12270312 Anshan Urban Construction
20.00 2019-3-5 105.00 103.50 109.80 102.48 128860.73
122704 12 Jiangdu 8.00 2019-3-23 104.50 97.76 115.00 97.50 72302.39
122705 12 Jiangsu Communications 25.00 2017-3-20 101.00 101.72 101.88 97.00 131647.33
122706 12 Haimen 12.00 2019-3-20 103.80 102.00 112.00 99.50 8159.34
122707 12 Taixing 12.00 2018-3-27 105.50 101.48 116.47 100.01 251236.81
122708 12 Ejin Horo Banner 16.00 2019-3-19 103.50 98.28 108.12 97.31 201329.35
122709 12 Mianyang 12.00 2019-3-26 103.60 99.50 107.40 98.00 77277.72
122710 12 Jinan City Construction 18.00 2018-3-26 104.00 100.65 105.90 97.01 92846.38

Bond Market
2014 Fact Book 170
Code Short NameIssue size (RMB100 million)
Date of Maturity
Opening (RMB)
Closing (RMB)
High(RMB)
Low(RMB)
Turnover value(RMB 10,000)
12271112 Zhengzhou New District Construction
20.00 2019-3-14 105.00 100.50 111.60 100.00 160023.97
122712 12 AVIC International 18.00 2019-3-12 99.00 95.00 102.00 87.95 63277.16
12271312 Hebei Jiantou Communication
14.00 2022-3-27 0.00 100.00 0.00 0.00 0.00
122714 12 Hailin Assets 8.00 2019-3-21 104.33 99.55 109.25 98.24 35112.61
122715 12 Chengdu New City 10.00 2019-3-19 106.38 98.51 109.50 97.29 121957.15
122716 12 Putian 11.00 2019-3-21 105.50 100.25 115.00 97.31 34282.89
122717 12 Quanxing Mining 15.00 2019-3-21 0.00 100.00 0.00 0.00 36103.00
122718 12 Yunan Assets 8.00 2019-3-23 108.00 101.50 119.00 100.56 122323.76
122719 12 Longyan Traffic 10.00 2022-3-19 106.10 103.00 111.00 98.55 93995.95
12272012 Ningbo Urban Construction
10.00 2018-3-1 0.00 100.00 0.00 0.00 77726.80
12272112 Liaoyuan State-owned Asset
10.00 2019-3-13 105.10 100.67 116.14 95.60 100452.50
122722 12 Huai'an Water 16.00 2019-3-8 107.80 104.50 109.00 94.98 118539.81
12272312 China National Petroleum 05
200.00 2022-3-15 92.46 99.90 99.90 91.93 30217.41
12272412 Panzhihua State-owned Assets
10.00 2022-3-13 108.00 109.50 112.99 106.03 102874.52
12272512 Suqian Industry Development
8.00 2018-3-8 96.61 100.50 104.02 96.61 81082.69
12272612 Liuzhou Dongcheng Investment
10.00 2019-2-15 107.50 101.98 108.45 100.00 110376.11
122727 12 Dongsheng 20.00 2018-2-28 105.50 99.76 107.99 98.50 220948.18
12272812 Xuzhou Economic Development Zone
18.00 2019-3-7 104.00 106.00 107.00 100.00 37103.58
122729 12 Jiangquan Group 8.00 2019-3-12 105.15 98.27 110.00 96.01 69500.73
122730 12 Jinjiang Bond 6.50 2018-2-23 104.42 101.50 104.42 101.50 33739.70
12273112 Zhenjiang New Area Economic Development
16.00 2019-3-1 105.00 102.90 115.00 100.10 41368.54
122732 12 Jiujiang Bond 20.00 2019-2-23 107.00 102.00 115.00 98.32 38892.79

Bond Market
2014 Fact Book 171
Code Short NameIssue size (RMB100 million)
Date of Maturity
Opening (RMB)
Closing (RMB)
High(RMB)
Low(RMB)
Turnover value(RMB 10,000)
12273311 Beijing State-owned Capital 01
40.00 2016-12-26 102.00 101.99 102.00 101.00 3837.39
12273411 Beijing State-owned Capitali 02
60.00 2021-12-26 100.42 100.42 100.42 100.42 10042.00
122735 11 Lu’an Bond 15.00 2018-12-28 104.42 105.00 105.00 104.42 15433.50
12273612 China National Petroleum 03
100.00 2019-2-22 0.00 100.00 0.00 0.00 0.00
12273712 China National Petroleum 04
100.00 2027-2-22 99.00 99.99 107.00 90.00 12870.58
12274012 Yan'an City Construction Investment
15.00 2017-2-8 104.00 102.70 108.50 99.00 23379.24
122741 11 Shuangyashan 10.00 2018-12-20 104.60 99.99 107.85 98.81 175796.49
122742 12 Shandong Expressway 20.00 2022-2-9 0.00 100.00 0.00 0.00 0.00
122743 12 Huafa Group 25.00 2018-2-16 108.00 102.64 112.28 100.60 268268.30
122744 11 Benxi Bond 20.00 2021-12-22 108.00 102.90 110.96 100.16 87354.51
122745 12 Fangda 01 5.00 2018-2-22 104.50 101.00 110.00 98.01 33695.75
122746 12 Fangda 02 5.00 2019-2-22 105.00 96.50 109.00 96.00 57411.37
122747 12 Shanxi Coal Transportation 25.00 2022-1-18 103.00 97.50 106.50 94.92 144046.17
12274812 China National Petroleum 01
100.00 2019-1-11 99.67 99.99 100.00 99.67 35699.89
12274912 China National Petroleum 02
100.00 2022-1-11 97.83 102.50 102.50 91.00 48914.64
122750 12 Changjingying 12.00 2019-1-16 102.50 102.50 109.00 99.26 16785.21
122751 11 Jixin Bond 5.00 2018-12-30 101.51 100.49 114.00 100.49 11561.48
122752 11 Dafeng Port 6.00 2017-11-15 106.05 102.00 110.59 100.51 66321.87
12275312 Jiangyan State-owned Assets Investment
7.00 2019-12-3 101.78 98.00 103.61 94.00 114167.24
122754 11 Tonghua Bond 10.00 2021-12-13 108.30 101.35 118.81 99.55 103833.80
12275512 Xiangtan City's Constructive Group
12.00 2019-3-16 102.80 102.50 108.50 99.80 80592.58
12275612 Gansu Agricultural Reclamation Group
8.00 2019-1-6 100.00 100.00 100.00 100.00 31165.00

Bond Market
2014 Fact Book 172
Code Short NameIssue size (RMB100 million)
Date of Maturity
Opening (RMB)
Closing (RMB)
High(RMB)
Low(RMB)
Turnover value(RMB 10,000)
122757 11 Dandong Bond 16.00 2018-12-21 103.13 97.77 107.29 97.18 369842.48
122758 11 Zhangbao Bond 9.00 2018-12-15 100.37 100.00 109.80 100.00 1408.12
122759 11 Taihao Bond 4.00 2018-12-27 0.00 107.10 0.00 0.00 0.00
122760 12 Yufu Bond 20.00 2019-9-4 101.60 98.10 103.80 98.10 149853.06
12276111 Xiaoshan State-owned Assets
20.00 2016-11-22 103.10 104.61 104.61 103.10 44317.51
122762 11 Wujiang Bond 13.00 2018-12-5 0.00 100.00 0.00 0.00 65916.00
12276311 Huainan Industrial Development Investment
9.00 2017-12-30 108.50 102.85 117.98 96.03 100426.73
122764 11 China Oceanwide 01 18.00 2017-12-13 107.15 101.47 113.80 94.31 41010.55
122765 11 China Oceanwide 02 10.00 2021-12-13 109.00 103.08 114.60 102.24 23597.64
12276611 Yichang Urban Construction Investment
10.00 2019-11-17 105.00 108.20 108.49 103.51 15243.21
122767 11 Yancheng Chengnan 15.00 2018-12-16 105.00 101.58 116.00 100.48 157096.77
12276811 Lanzhou Urban Development and Investment
15.00 2018-12-15 106.00 103.60 116.50 100.50 112582.51
122769 11 Longhai Bond 8.00 2017-12-2 106.10 101.05 109.49 94.53 72582.21
122770 11 State Grid 01 100.00 2021-12-8 101.46 98.50 104.00 96.00 106730.07
122771 11 State Grid 02 50.00 2026-12-8 98.80 98.80 98.80 98.80 5744.73
122772 11 Shanxi Coal 10.00 2018-12-6 106.00 106.00 106.00 106.00 16279.00
122773 11 Binhai 01 25.00 2016-11-23 0.00 100.00 0.00 0.00 0.00
122774 11 Binhai 02 25.00 2021-11-23 0.00 100.00 0.00 0.00 0.00
12277511 Xianyang Urban Construction and Investment
11.00 2017-12-9 106.25 100.80 107.80 96.97 48651.00
122776 11 Neoglory 16.00 2018-11-23 103.34 99.80 106.86 93.01 190190.34
122777 11 Wuzhong 15.00 2018-12-16 0.00 105.80 0.00 0.00 10556.00
122778 11 Xiamen CD Corporation 16.00 2019-10-28 106.70 101.50 106.70 98.00 61546.34

Bond Market
2014 Fact Book 173
Code Short NameIssue size (RMB100 million)
Date of Maturity
Opening (RMB)
Closing (RMB)
High(RMB)
Low(RMB)
Turnover value(RMB 10,000)
12277911 Zhuzhou Urban Construction Development
15.00 2021-11-10 106.57 102.00 110.85 98.28 90551.38
122780 11 Changsha Hi-tech 25.00 2017-11-22 103.50 100.25 103.50 100.00 18767.90
122781 11 Yongzhou Bond 10.00 2021-12-5 108.08 102.92 112.54 100.59 204488.37
122782 11 Ningxia State Farms 18.00 2018-11-16 100.00 99.50 100.87 99.50 4053.90
122783 11 Jiangsu Zhongneng 15.00 2018-11-15 102.00 84.45 103.60 81.43 91560.97
122784 11 ZTE Holdings 10.00 2019-10-28 103.50 103.50 105.00 93.36 13768.42
122786 11 Legend Holding 29.00 2018-10-31 102.52 102.56 102.56 94.88 13293.79
122787 11 Gantie Bond 10.00 2018-9-30 104.35 104.00 104.35 104.00 11166.10
122788 11 Sanming Bond 10.00 2018-6-14 101.60 102.00 106.15 100.00 64113.84
122789 11 Xiangyu Bond 9.00 2018-7-8 101.00 105.00 105.00 91.64 74631.90
122790 11 Zhuji Bond 15.00 2018-7-5 101.00 97.49 104.70 96.80 127231.56
122792 11 Handan Bond 10.00 2018-7-1 102.78 99.30 104.80 98.30 132342.76
12279311 Yangzhou Development Bond
10.00 2016-7-7 99.90 99.00 102.00 90.20 12472.66
122794 11 Haicheng Bond 8.00 2018-11-7 105.68 102.28 130.18 98.00 6210.17
122795 11 Zhucheng Bond 10.00 2018-4-26 0.00 100.00 0.00 0.00 0.00
12279611 Hebei Construction & Investment 01
10.00 2021-6-27 0.00 100.00 0.00 0.00 0.00
12279711 Hebei Construction & Investment 02
10.00 2024-6-27 0.00 100.00 0.00 0.00 0.00
122798 11 Taifeng Mining Bond 10.00 2018-6-22 100.70 101.00 105.50 97.50 74872.26
12279911 Wuhan State-owned Assets Managment
3.00 2018-6-17 102.35 100.50 102.35 100.07 22568.66
122800 11 Longkou Coal Power 10.00 2018-6-17 103.00 103.00 103.00 103.00 0.31
122801 11 Jiaozuo Bond 22.00 2018-6-8 103.50 103.90 103.90 93.35 239345.40
122802 11 Liaoyang Bond 20.00 2018-6-13 100.90 97.90 105.80 92.50 292050.08

Bond Market
2014 Fact Book 174
Code Short NameIssue size (RMB100 million)
Date of Maturity
Opening (RMB)
Closing (RMB)
High(RMB)
Low(RMB)
Turnover value(RMB 10,000)
122803 11 Chuzhou Bond 10.00 2021-11-30 104.04 98.94 110.08 97.61 75811.22
122804 11 Weinan 01 6.00 2017-6-8 100.98 100.35 101.10 99.38 17112.25
122805 11 Datong Bond 25.00 2017-6-1 100.75 97.98 106.00 97.65 302273.46
122806 11 Weinan 02 12.00 2018-6-8 102.50 98.50 102.50 95.13 67456.11
122807 11 Dongling Bond 4.00 2017-6-14 101.28 99.04 103.50 92.01 53856.04
122808 11 Tengzhou Bond 10.00 2018-5-24 100.00 103.42 106.00 99.00 25646.86
12280911 Dzungarian State-owned Assets
20.00 2018-5-10 101.00 97.78 105.30 92.43 297602.10
12281011 Zoup ing Sta te-owned Assets
5.00 2018-4-27 99.40 93.00 105.48 89.80 20479.08
122811 11 Inner Mongolia Nailung 8.00 2018-5-5 99.81 93.99 103.90 93.20 223089.04
122812 11 Huaibei Bond 12.00 2018-3-14 103.20 98.36 106.50 96.00 100060.58
122813 11 Ningxia Transport 15.00 2021-4-27 103.00 98.50 103.80 98.50 84833.85
122814 11 Dongying Bond 12.00 2018-4-20 103.60 102.50 104.50 101.50 48153.40
122815 11 Guanghui Bond 16.00 2017-4-19 100.00 99.63 102.00 90.68 182443.20
122816 11 Gaomi Bond 10.00 2018-4-8 0.00 100.00 0.00 0.00 34181.00
122817 11 Sanmen Bond 15.00 2018-4-25 97.28 99.89 105.49 97.28 215241.06
122818 11 Muping Bond 6.00 2019-3-4 105.60 101.05 111.17 97.00 83647.05
12281911 Changzhou Urban Construction
25.00 2018-4-25 101.50 98.20 108.80 94.82 169446.05
122820 11 Weifang Dongfang 5.00 2018-4-12 103.50 103.50 106.00 94.53 31285.24
122821 11 Jilin Urban Construction 20.00 2018-3-3 103.00 100.50 106.50 99.08 219822.61
122822 11 Hanzhong Bond 8.00 2018-3-14 100.75 96.48 105.53 94.17 87497.29
122823 11 Zhoushan Bond 15.00 2018-4-20 99.40 102.00 103.00 98.30 58422.38
122824 11 China Coal Construction 6.00 2018-3-15 0.00 102.04 0.00 0.00 25100.00

Bond Market
2014 Fact Book 175
Code Short NameIssue size (RMB100 million)
Date of Maturity
Opening (RMB)
Closing (RMB)
High(RMB)
Low(RMB)
Turnover value(RMB 10,000)
122825 11 Jingdezhen 8.00 2018-3-23 103.00 100.99 116.39 98.55 133052.83
122826 11 Beibu Gulf Port 15.00 2017-3-30 101.70 100.00 103.46 99.00 256500.79
122827 11 ENN Energy Holdings 5.00 2018-2-16 103.05 103.05 103.05 103.05 35684.40
122828 11 Fuzhou Bond 8.00 2018-2-28 104.60 101.50 108.50 97.36 55171.17
122829 11 Wanji Bond 8.00 2018-8-24 101.60 84.93 104.46 82.50 44421.08
12283011 Shenyang State-owned Assets
15.00 2019-3-16 102.60 99.70 107.00 99.00 130256.17
122831 11 Huitong Bond 10.00 2018-3-14 103.00 99.40 107.98 98.71 120177.58
122832 11 Taishan Bond 10.00 2018-3-2 104.00 103.01 104.80 99.50 97788.79
12283311 Ganzhou Urban Development
20.00 2018-4-22 96.61 97.90 106.00 92.00 266182.01
12283411 Mudanjiang State-owned Assets
15.00 2018-2-15 102.05 100.24 108.00 99.40 125263.47
122835 11 Xinglu Bond 10.00 2021-3-1 102.50 98.78 106.50 90.94 112160.99
122836 11 Panjin Bond 15.00 2018-3-1 102.00 97.99 107.00 96.60 277706.20
12283711 Wujin Economic Development
25.00 2018-2-24 102.98 98.99 104.08 97.20 329570.11
122838 11 Geely Bond 10.00 2018-6-21 102.00 104.50 104.50 97.90 67085.29
122839 11 Xintai Bond 12.00 2018-2-23 102.60 104.00 106.00 99.06 76307.70
122840 11 Linfen Bond 20.00 2019-2-22 102.70 103.00 115.02 99.30 260009.33
122841 11 Chongqing Tianjin Bond 6.00 2018-1-6 100.93 96.29 112.82 94.52 111571.86
12284211 Hechuan Urban Construction
6.00 2018-1-6 100.87 96.40 113.51 95.50 58833.88
122843 11 Suihua Bond 8.00 2018-2-28 103.00 100.45 116.39 94.00 136268.42
122844 11 Guiyang Urban Investment 20.00 2018-1-12 101.86 99.00 103.60 97.50 178945.88
122845 11 Hengdian Bond 12.00 2021-1-27 101.50 98.80 102.50 94.27 135525.85
122846 11 Yufu Bond 20.00 2018-2-22 103.00 98.80 104.20 95.10 143478.10

Bond Market
2014 Fact Book 176
Code Short NameIssue size (RMB100 million)
Date of Maturity
Opening (RMB)
Closing (RMB)
High(RMB)
Low(RMB)
Turnover value(RMB 10,000)
12284711 Ningbo Communications Investment
10.00 2021-2-10 101.00 100.00 103.60 98.90 94805.29
122848 10 Guilin Bond 10.00 2017-12-28 104.00 100.00 104.74 96.00 13798.69
122849 11 Xinyu Bond 14.00 2018-1-11 101.11 94.40 101.50 93.52 98148.40
122850 11 Huatai Bond 8.80 2018-3-2 101.00 95.99 103.30 95.00 66605.61
122851 10 Yuxi 01 8.00 2016-12-28 100.82 98.00 103.00 95.00 72475.92
122852 10 Yuxi 02 7.00 2017-12-28 101.30 99.70 103.20 98.50 28135.07
122853 10 Taiyuan Heavy Machinery 8.40 2020-12-31 101.50 101.00 101.53 92.00 83825.62
122854 11 Zhonghui Bond 10.00 2018-3-23 101.75 98.30 103.11 98.30 78791.83
122855 11 Chongqing Light Textile 7.00 2018-1-12 102.50 99.50 103.70 99.50 44090.16
122856 11 Zhuzhou Hi-tech 10.00 2018-8-18 102.21 101.60 106.68 99.40 134726.22
122857 10 Jiuhua Bond 10.00 2016-12-16 102.15 98.10 113.90 91.90 138429.47
12285810 Yancheng City-owned Assets 01
5.00 2016-12-16 100.95 100.00 102.50 99.90 46917.78
12285910 Yancheng City-owned Assets 02
10.00 2017-12-16 101.80 100.00 105.00 100.00 21371.68
122860 10 Longyuan 16.00 2017-2-9 100.50 97.50 101.00 95.00 9134.82
122861 09 Shaanxi Coal Chemistry 15.00 2017-12-17 0.00 101.50 0.00 0.00 0.00
122862 10 Fujian Energy 8.00 2017-12-2 0.00 100.00 0.00 0.00 0.00
122863 10 Yulin City Investment 14.00 2017-12-28 103.80 105.00 105.70 101.00 69405.99
122864 11 Shanghai Bund Investment 9.00 2018-3-11 104.04 102.00 106.80 100.50 72022.65
12286510 Jiangsu HaizhouwanDevelopment
10.00 2017-9-28 91.60 100.00 100.00 91.60 34829.58
12286610 Hangzhou CommunicationInvestment
12.00 2020-10-19 100.80 97.30 100.80 97.00 60691.35
12286711 Shijiazhuang City Investment
10.00 2021-3-9 101.00 99.00 104.50 99.00 111916.89
122868 10 Shenyang Coal 15.00 2017-12-21 102.25 97.30 102.36 95.01 32764.07

Bond Market
2014 Fact Book 177
Code Short NameIssue size (RMB100 million)
Date of Maturity
Opening (RMB)
Closing (RMB)
High(RMB)
Low(RMB)
Turnover value(RMB 10,000)
122869 10Shanghai Chemical 10.00 2017-10-22 100.00 100.40 101.00 100.00 33317.40
122870 10 Chongqing Dasheng 8.00 2017-6-2 0.00 100.00 0.00 0.00 3966.00
12287110 Zhenjiang CommunicationInvestment
10.00 2017-10-18 99.30 96.88 104.00 91.08 38539.07
122872 10 Fosun Bond 11.00 2017-12-24 101.50 101.50 102.00 96.99 62439.02
12287310 Nantong Economic & Technological Development Zone
10.00 2017-12-8 100.90 100.06 110.78 91.96 62873.27
122874 10 Honghe Investment 01 10.00 2016-12-9 100.60 99.50 105.50 96.06 73496.22
122875 10 Honghe Investment 02 10.00 2017-12-9 101.60 99.80 113.40 96.00 152211.45
12287611 Hainan Development Holdings
15.00 2018-1-20 100.75 100.20 101.85 100.20 57020.24
122877 10 Chongqing Nan’an 10.00 2017-12-24 99.80 101.65 102.15 93.36 30876.10
122879 10 Tianji 10.00 2017-11-25 101.00 100.00 101.12 100.00 25.36
122880 10 Tianye 12.00 2016-10-25 99.93 98.00 100.16 97.40 73720.91
122881 10 Wujiang 15.00 2018-12-23 103.77 100.99 105.00 96.00 106864.75
122882 10 Nanjing Hi-tech 12.00 2017-12-24 101.50 100.00 103.20 99.00 32595.05
122883 10 Chuxiong 15.00 2017-10-18 97.29 94.64 102.05 94.03 219045.31
122884 10 Xizi 4.50 2017-10-11 100.56 98.99 105.00 96.30 32043.68
122885 10 Hebei Communication 20.00 2025-9-28 0.00 100.00 0.00 0.00 5060.40
122886 10 Yunnan Investment 20.00 2017-8-24 97.95 96.04 113.00 90.45 75112.78
12288710 Chongqing Communication
10.00 2017-8-4 95.00 89.50 99.50 86.10 24827.50
122888 10 Huajing 15.00 2017-9-28 98.00 96.28 105.88 88.83 99016.71
122889 10 Daye Nonferrous 7.00 2018-10-15 98.98 99.00 99.00 97.01 8086.71
122890 10 Kaidi 10.00 2020-8-23 95.58 89.27 100.00 87.50 339708.12
122891 10 Tongliao 10.00 2017-9-1 96.58 95.20 102.10 94.41 231780.00

Bond Market
2014 Fact Book 178
Code Short NameIssue size (RMB100 million)
Date of Maturity
Opening (RMB)
Closing (RMB)
High(RMB)
Low(RMB)
Turnover value(RMB 10,000)
122892 10 Shouguang 10.00 2020-9-1 99.19 95.88 103.99 93.21 98864.32
122893 10 Dandong 15.00 2017-9-6 100.73 100.86 105.49 97.04 70657.16
122894 10 Nanchang Municipal 7.00 2017-8-3 100.50 100.50 100.50 100.50 89603.00
122895 10 Dezhou 7.00 2017-8-9 99.47 99.00 101.00 99.00 103160.34
122896 10 Wuhu Development 10.00 2017-8-25 100.00 101.00 101.00 95.01 81419.51
122897 10 Xiangfan Investment 10.00 2018-5-19 100.80 100.48 101.50 99.00 64914.16
122898 10 Pan National Investment 6.00 2020-7-29 98.50 100.40 100.50 93.00 370035.72
122899 10 Yangpu 01 12.00 2017-7-28 98.32 97.20 100.00 94.50 43565.77
122900 10 Yangpu 02 3.00 2017-7-28 100.00 105.50 105.50 99.11 49400.80
122901 10 Yingkou 20.00 2020-6-9 103.29 98.00 108.25 90.05 125826.90
122902 10 Chifeng 12.00 2017-5-18 100.10 99.49 112.26 95.99 68624.22
122903 10 Yancheng East 10.00 2017-6-8 98.00 95.50 103.00 90.05 41019.16
122904 10 Great Wall Investment 20.00 2020-5-24 98.00 98.00 98.00 98.00 69334.98
122905 10 Nanchang 12.00 2017-4-30 103.50 102.50 107.00 98.15 73392.73
122906 10 Wuhu Investment 01 14.00 2017-7-22 98.00 99.25 110.00 95.00 39008.53
122907 10 Wuhu Investment 02 6.00 2017-7-22 99.90 100.50 101.50 95.10 69904.61
122908 10 Jiangsu Communication 25.00 2016-6-1 99.83 95.10 108.00 93.41 34134.44
122909 10 Yixing 15.00 2016-5-20 100.00 96.30 100.74 93.80 351721.16
122910 10 Luohe 10.00 2017-3-30 0.00 100.00 0.00 0.00 0.00
122911 10 Anshan Urban Investment 20.00 2020-5-6 92.00 98.20 110.52 92.00 203642.68
122912 10 Hubei State-owned Captial 28.00 2020-5-11 102.00 98.00 102.30 92.38 166394.55
12291310 Nantong Industries Holding
8.00 2016-5-18 100.60 98.00 102.30 97.50 71662.15

Bond Market
2014 Fact Book 179
Code Short NameIssue size (RMB100 million)
Date of Maturity
Opening (RMB)
Closing (RMB)
High(RMB)
Low(RMB)
Turnover value(RMB 10,000)
122914 09 Fujian Building 10.00 2016-12-16 93.00 102.00 105.00 93.00 48029.64
12291510 Zhenjiang Water Conservancy Investment
20.00 2017-5-6 97.00 98.20 111.00 97.00 105425.20
122916 10 Honggutan 8.00 2017-3-9 103.00 100.25 116.10 100.00 145594.03
122917 10 Taicang Port 6.00 2020-1-21 103.50 99.54 103.50 93.68 15857.80
122918 10 Fuyang 10.00 2016-3-9 101.29 97.00 110.00 96.20 209556.18
122919 10 Shandong Commercial 7.00 2017-3-11 100.80 99.60 100.80 99.60 9241.00
122920 10 Huangshan 6.00 2017-2-9 101.88 99.20 105.50 81.01 106287.32
122921 10 Chenzhou 20.00 2017-1-21 103.99 101.16 116.81 99.61 243439.18
12292210 Changsha Advanced Technology
20.00 2017-1-25 101.50 99.50 102.90 98.80 80730.74
122923 10 Beijing Auto Investment 15.00 2017-1-29 101.10 98.75 101.20 97.00 200117.79
122924 10 Chaohu 12.00 2017-1-28 102.80 102.09 106.59 99.87 138101.43
12292509 Shenyang State-owned Capital
12.00 2016-11-27 104.50 101.30 107.60 100.26 124718.53
122926 09 Qinghai Investment 8.00 2015-12-29 101.00 97.92 101.08 96.50 49527.93
122927 09 Hainan Airlines 13.00 2019-12-24 101.85 99.16 106.80 98.18 128814.66
122928 09 Tieling 15.00 2019-12-22 102.89 99.70 107.50 99.41 171829.09
122929 09 Jiujiang 12.00 2016-12-18 101.52 104.60 104.90 101.25 14716.39
122930 09 Panjin 10.00 2016-12-16 105.00 102.00 106.70 98.09 102905.49
122931 09 Linhai 10.00 2016-11-6 105.00 100.98 107.88 99.51 76472.97
122932 09 Yicheng 12.00 2016-11-25 103.79 102.38 107.50 100.31 204539.92
122933 09 Nanshan 1 10.00 2015-10-20 101.80 103.80 104.18 101.80 11732.23
122934 09 Nanshan 2 10.00 2019-10-20 105.00 103.99 107.66 103.99 86989.00
122935 09 Nantong 23.00 2016-11-13 102.60 100.00 103.00 100.00 12922.84

Bond Market
2014 Fact Book 180
Code Short NameIssue size (RMB100 million)
Date of Maturity
Opening (RMB)
Closing (RMB)
High(RMB)
Low(RMB)
Turnover value(RMB 10,000)
12293609 Hecheng Urban Investment
12.00 2016-11-17 104.50 99.29 106.98 98.50 209591.47
122937 10 Liaoyuan 10.00 2017-1-26 104.45 99.22 109.00 96.30 185578.14
122938 09 Fenhu 10.00 2017-10-22 103.10 99.60 120.00 92.23 11650.75
122939 09 Ji’an 15.00 2016-10-28 106.50 101.59 110.00 100.21 86187.25
12294009 Xianyang Urban Investment
17.50 2019-9-30 107.98 101.11 117.99 98.51 162798.99
122941 10 Zhenjiang City Investment 20.00 2020-12-17 102.15 97.59 105.59 95.00 116640.78
122942 09 Jiangyin 25.00 2016-9-15 101.71 99.70 105.00 95.45 132997.24
122943 09 Waigaoqiao 8.50 2014-9-4 100.96 99.99 100.96 99.40 20020.96
122944 09 Zhuzhou Urban Investment 15.00 2016-8-28 103.01 99.82 106.00 97.80 77832.24
122945 09 Yushui 8.00 2016-7-31 102.90 99.80 113.20 95.71 23350.99
12294609 Yangzhou Urban Construction
20.00 2016-7-23 101.00 99.80 102.15 95.93 48730.90
12294709 Hefei Construction Investment
20.00 2014-7-8 100.40 99.25 101.05 98.00 136306.32
122948 09 Wuxi Communications 20.00 2016-7-8 98.50 98.00 101.00 95.99 51517.12
122949 09 Changzhou Investment 20.00 2016-7-1 100.60 98.30 103.00 90.37 113864.11
122950 09 Chongqing Energy 15.00 2016-7-1 99.00 100.30 101.30 99.00 54692.18
12295109 Huainan Urban Construction
15.00 2016-6-26 101.48 99.99 110.12 95.58 147438.89
122952 09 Ganzhou 15.00 2016-6-16 101.00 99.40 101.50 97.18 72693.22
12295309 Yueyang Urban Construction
10.00 2015-4-30 101.24 100.39 111.00 91.81 33963.17
122954 09 Wujin 22.00 2016-6-9 99.01 96.89 100.83 96.00 63914.30
122955 09 Xiangtan City Construction 9.00 2015-6-1 101.20 99.08 101.66 97.70 55616.26
122956 09 Changzhou Hi-tech 15.00 2019-6-4 100.00 99.29 101.00 97.01 19199.29
12295709 Chengdu Industry Investment
15.00 2016-6-4 98.65 99.00 101.50 97.30 136161.77

Bond Market
2014 Fact Book 181
Code Short NameIssue size (RMB100 million)
Date of Maturity
Opening (RMB)
Closing (RMB)
High(RMB)
Low(RMB)
Turnover value(RMB 10,000)
12295809 Changsha Economic Development
5.80 2015-5-22 102.80 99.75 114.45 93.94 130101.57
122959 09 Tsinghua Holdings 10.00 2016-5-19 99.51 99.29 102.10 99.00 47230.38
122960 09 Poly Group 13.00 2014-5-7 99.00 99.36 102.60 97.56 45870.87
122961 09 Wuhan Urban Investment 15.00 2019-5-25 100.57 99.20 101.50 95.00 85176.33
122962 09 Nanjing Communications 10.00 2016-5-7 100.30 99.30 101.80 98.00 81803.73
122964 09 Longhu 14.00 2016-5-5 103.70 100.45 106.00 99.00 215144.52
122965 09 Weifang Investment 7.00 2019-4-15 101.39 99.70 105.00 99.05 73840.96
122966 09 Dianchi Investment 8.00 2015-4-27 97.60 100.10 103.40 97.00 16784.05
122967 09 Fujian Zhanglong 10.00 2015-4-24 100.80 99.30 110.00 99.00 94360.05
12296809 Hangzhou Urban Investment
22.00 2015-4-14 99.86 100.26 106.38 98.00 238346.04
122969 09 Henan Investment 15.00 2019-4-15 99.00 99.81 100.30 99.00 7175.74
122970 09 Three Gorges 01 70.00 2014-4-8 99.00 99.95 99.95 95.90 25364.89
122971 09 Three Gorges 02 30.00 2016-4-8 99.00 96.20 100.00 90.00 2513.91
122972 09 Mianyang Investment 15.00 2016-4-8 102.00 99.80 104.40 99.00 198809.86
122973 09 Kunshan Chuangye 20.00 2016-3-30 98.50 97.50 100.87 88.94 67463.93
12297409 Zhengjiang City Construction
10.00 2015-3-30 100.75 100.00 111.80 98.60 106058.50
122975 09 Jinan Urban Construction 15.00 2019-3-26 98.35 96.00 99.90 90.00 36118.27
12297609 Yongcheng Coal & Electricity
13.00 2015-3-30 100.00 98.90 101.30 98.00 73390.99
12297909 Tianjin Jinbin Development 2
20.00 2014-3-25 98.00 99.46 100.00 97.35 26642.09
12298009 Tianjin Jinbin Development 3
25.00 2016-3-25 97.50 98.00 102.00 90.92 36788.91
122981 09 Tongling Urban Construction 5.00 2015-3-10 102.00 100.77 104.40 92.20 46226.89
12298209 Changchun Urban Development
12.00 2016-3-9 100.60 99.00 102.50 98.00 43579.35

Bond Market
2014 Fact Book 182
Code Short NameIssue size (RMB100 million)
Date of Maturity
Opening (RMB)
Closing (RMB)
High(RMB)
Low(RMB)
Turnover value(RMB 10,000)
122983 09 Nanjing Iron & Steel 25.00 2016-2-27 100.50 97.83 102.00 95.98 45872.98
122984 09 Lu’an Urban Construction 15.00 2016-3-2 103.68 101.00 114.69 75.18 209019.62
122985 09 Zhejiang Provincial Energy 47.00 2014-2-23 94.58 99.59 108.00 94.58 73107.93
122986 09 Chunhua 10.00 2016-2-11 101.50 99.80 112.00 98.00 43534.32
122987 08 Yunnan Coal Chemical 15.00 2013-12-19 0.00 99.87 0.00 0.00 0.00
122988 08 Chongqing Yulong 10.00 2016-1-15 102.34 100.00 106.00 99.72 89766.85
122989 08 Chongqing Communication 15.00 2015-12-10 99.99 98.30 111.00 92.00 51626.09
122991 08 Hainan Airlines 15.00 2014-12-25 102.00 100.63 107.20 98.06 52209.62
122992 08 Jiangsu Communication 25.00 2013-11-18 99.05 99.99 100.99 99.00 60700.16
122993 08 Wuyang Iron & Steel 6.00 2013-11-13 101.20 100.00 115.00 99.00 19284.44
122994 08 Yunnan Investment 15.00 2013-10-22 100.40 99.99 102.00 99.50 90993.69
12299508 Hefei Construction Investment
17.00 2018-8-28 103.00 101.00 108.30 92.40 120672.87
12299608 Changzhou Urban Construction
25.00 2015-9-24 101.00 99.20 102.99 99.00 192512.50
122997 08 Suzhou Hi-Tech 4.00 2013-10-9 101.25 99.98 101.66 99.51 177661.84
122998 04 Nanjing Tanker Suspended 10.00 2014-5-26 0.00 99.00 0.00 0.00 0.00
12299908 Guangzhou Paper Suspended
3.90 2018-3-13 103.00 102.50 104.00 99.00 774.31
123000 09 Yihua 10.00 2014-10-26 95.33 99.97 100.00 99.71 28983.00
123001 09 Shanghai Ace 2.50 2014-11-17 100.00 100.00 0.00 0.00 0.00
123002 09 Donghua 3.00 2015-12-28 100.00 100.00 104.50 99.00 61053.00
123003 09 Rebecca 3.00 2015-12-28 99.95 98.97 99.00 98.96 6532.00
123004 10 China Hi-tech 2.80 2017-2-2 102.40 100.00 109.50 94.70 10406.00
123005 09 New Hailian 15.00 2016-11-11 99.97 101.14 101.65 101.14 13155.00

Bond Market
2014 Fact Book 183
Code Short NameIssue size (RMB100 million)
Date of Maturity
Opening (RMB)
Closing (RMB)
High(RMB)
Low(RMB)
Turnover value(RMB 10,000)
123006 10 Wuhan Hi-tech 5.00 2020-5-24 100.00 100.00 0.00 0.00 0.00
123007 11 Weishanhu Mining 7.00 2021-1-7 100.00 102.27 102.27 102.27 10228.00
123008 11 Changzheng Electric 4.00 2014-11-16 99.63 99.93 107.54 99.83 78521.00
123009 12 Yangzhou SME Bone 2.18 2018-8-2 100.00 99.13 101.69 99.03 9145.00
123010 12 Hunan lingji Lingang 10.00 2018-10-15 100.00 98.81 100.32 98.81 11020.00
123011 13 Meizhou Bond 10.00 2020-9-10 100.00 100.01 100.01 99.89 16990.00
123012 13 Harbin Hitech 25.00 2020-9-16 100.00 100.00 100.00 100.00 12000.00
123413 13 Dongxing01 6.60 2016-11-27 100.00 100.00 0.00 0.00 0.00
123417 13Orient Securities Bond 36.00 2017-11-15 100.00 100.00 0.00 0.00 0.00
12342113 .Guotai Junan Securities Bond02
30.00 2014-11-7 100.00 100.00 0.00 0.00 0.00
12342213 China Securities Finance 46
14.00 2014-10-23 100.00 100.00 0.00 0.00 0.00
12342313 China Securities Finance 45
6.00 2014-4-23 100.00 100.00 0.00 0.00 0.00
123424 13China Securities Finance44 2.00 2014-7-22 100.00 100.00 0.00 0.00 0.00
123425 13China Securities Finance43 4.00 2014-8-17 100.00 100.00 0.00 0.00 0.00
123426 13China Securities Finance42 2.00 2014-7-17 100.00 100.00 0.00 0.00 0.00
123427 13China Securities Finance41 6.00 2014-10-15 100.00 100.00 0.00 0.00 0.00
123428 13China Securities Finance40 6.00 2014-4-16 100.00 100.00 0.00 0.00 0.00
123429 13China Securities Finance39 20.30 2014-1-16 100.00 100.00 0.00 0.00 0.00
123430 13China Securities Finance38 1.50 2014-6-30 100.00 100.00 0.00 0.00 0.00
123431 13China Securities Finance37 5.90 2014-3-25 100.00 100.00 0.00 0.00 0.00
123432 13China Securities Finance36 6.00 2014-3-23 100.00 100.00 0.00 0.00 0.00
123433 13China Securities Finance35 13.00 2013-12-17 100.00 100.00 0.00 0.00 0.00

Bond Market
2014 Fact Book 184
Code Short NameIssue size (RMB100 million)
Date of Maturity
Opening (RMB)
Closing (RMB)
High(RMB)
Low(RMB)
Turnover value(RMB 10,000)
123434 13China Securities Finance34 15.00 2014-3-17 100.00 100.00 0.00 0.00 0.00
123435 13China Securities Finance32 13.00 2014-3-13 100.00 99.65 100.00 99.65 279706.00
123436 13China Securities Finance33 24.00 2014-3-17 100.00 100.00 0.00 0.00 0.00
123437 13China Securities Finance31 6.00 2014-3-12 100.00 100.00 0.00 0.00 0.00
123438 13China Securities Finance28 20.00 2013-12-10 100.00 100.00 0.00 0.00 0.00
123439 13China Securities Finance29 28.50 2013-12-11 100.00 100.00 0.00 0.00 0.00
123440 13China Securities Finance30 15.00 2014-9-10 100.00 100.00 0.00 0.00 0.00
123441 13Galaxy04 2.00 2013-12-10 100.00 100.00 0.00 0.00 0.00
123442 13Galaxy02 10.00 2014-9-10 100.00 100.00 0.00 0.00 0.00
123443 13Galaxy03 25.00 2014-9-11 100.00 100.00 0.00 0.00 0.00
123445 13China Securities Finance27 10.00 2014-3-6 100.00 100.00 0.00 0.00 0.00
123446 13China Securities Finance26 12.00 2013-12-4 100.00 100.00 0.00 0.00 0.00
123449 13China Securities Finance25 5.00 2013-11-29 100.00 100.00 0.00 0.00 0.00
123450 13China Securities Finance24 7.00 2013-11-27 100.00 100.00 0.00 0.00 0.00
123451 13China Securities Finance23 13.00 2014-2-27 100.00 100.00 0.00 0.00 0.00
123452 13China Securities Finance22 5.00 2013-11-23 100.00 100.00 0.00 0.00 0.00
123453 13China Securities Finance21 24.00 2013-11-23 100.00 100.00 0.00 0.00 0.00
123454 13China Securities Finance20 6.00 2013-9-30 100.00 100.00 0.00 0.00 0.00
123455 13China Securities Finance19 19.00 2013-9-30 100.00 100.00 0.00 0.00 0.00
123456 13China Securities Finance18 1.40 2013-11-18 100.00 100.00 0.00 0.00 0.00
123457 13China Securities Finance17 16.97 2013-11-13 100.00 100.00 0.00 0.00 0.00
123458 13Galaxy01 5.00 2013-11-13 100.00 100.00 100.00 100.00 8000.00
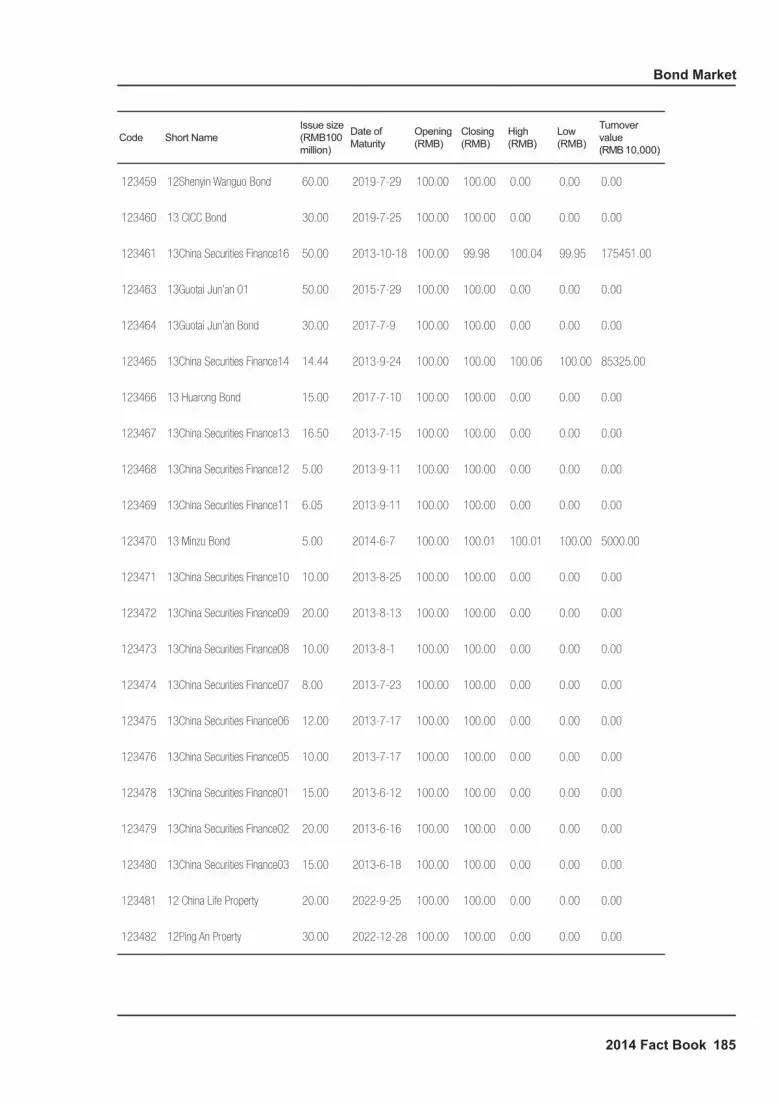
Bond Market
2014 Fact Book 185
Code Short NameIssue size (RMB100 million)
Date of Maturity
Opening (RMB)
Closing (RMB)
High(RMB)
Low(RMB)
Turnover value(RMB 10,000)
123459 12Shenyin Wanguo Bond 60.00 2019-7-29 100.00 100.00 0.00 0.00 0.00
123460 13 CICC Bond 30.00 2019-7-25 100.00 100.00 0.00 0.00 0.00
123461 13China Securities Finance16 50.00 2013-10-18 100.00 99.98 100.04 99.95 175451.00
123463 13Guotai Jun’an 01 50.00 2015-7-29 100.00 100.00 0.00 0.00 0.00
123464 13Guotai Jun’an Bond 30.00 2017-7-9 100.00 100.00 0.00 0.00 0.00
123465 13China Securities Finance14 14.44 2013-9-24 100.00 100.00 100.06 100.00 85325.00
123466 13 Huarong Bond 15.00 2017-7-10 100.00 100.00 0.00 0.00 0.00
123467 13China Securities Finance13 16.50 2013-7-15 100.00 100.00 0.00 0.00 0.00
123468 13China Securities Finance12 5.00 2013-9-11 100.00 100.00 0.00 0.00 0.00
123469 13China Securities Finance11 6.05 2013-9-11 100.00 100.00 0.00 0.00 0.00
123470 13 Minzu Bond 5.00 2014-6-7 100.00 100.01 100.01 100.00 5000.00
123471 13China Securities Finance10 10.00 2013-8-25 100.00 100.00 0.00 0.00 0.00
123472 13China Securities Finance09 20.00 2013-8-13 100.00 100.00 0.00 0.00 0.00
123473 13China Securities Finance08 10.00 2013-8-1 100.00 100.00 0.00 0.00 0.00
123474 13China Securities Finance07 8.00 2013-7-23 100.00 100.00 0.00 0.00 0.00
123475 13China Securities Finance06 12.00 2013-7-17 100.00 100.00 0.00 0.00 0.00
123476 13China Securities Finance05 10.00 2013-7-17 100.00 100.00 0.00 0.00 0.00
123478 13China Securities Finance01 15.00 2013-6-12 100.00 100.00 0.00 0.00 0.00
123479 13China Securities Finance02 20.00 2013-6-16 100.00 100.00 0.00 0.00 0.00
123480 13China Securities Finance03 15.00 2013-6-18 100.00 100.00 0.00 0.00 0.00
123481 12 China Life Property 20.00 2022-9-25 100.00 100.00 0.00 0.00 0.00
123482 12Ping An Proerty 30.00 2022-12-28 100.00 100.00 0.00 0.00 0.00

Bond Market
2014 Fact Book 186
Code Short NameIssue size (RMB100 million)
Date of Maturity
Opening (RMB)
Closing (RMB)
High(RMB)
Low(RMB)
Turnover value(RMB 10,000)
123485 12 Life Insurance 02 100.00 2022-11-5 100.00 100.00 0.00 0.00 0.00
123486 12 Xinhua Bond 100.00 2022-7-18 100.00 100.00 0.00 0.00 0.00
123487 12 Life Insurance 01 280.00 2022-6-29 100.00 100.00 0.00 0.00 0.00
123488 12 Ping’an Bond 90.00 2022-5-30 100.00 100.00 0.00 0.00 0.00
123489 11 Xinhua Bond 50.00 2021-9-29 100.00 100.00 0.00 0.00 0.00
123490 11 BOC Bond 14.00 2021-10-28 100.00 100.00 0.00 0.00 0.00
123491 11 Ping’an Bond 40.00 2021-9-29 100.00 100.00 0.00 0.00 0.00
123492 11 Life Insurance Bond 300.00 2021-10-26 100.00 100.00 0.00 0.00 0.00
123493 11 Taikang 01 10.00 2021-5-27 100.00 100.00 0.00 0.00 0.00
123494 11 Taikang 02 10.00 2021-6-1 100.00 100.00 0.00 0.00 0.00
123495 11 Guojun Bond 30.00 2017-1-28 100.00 100.00 100.00 100.00 9000.00
123496 10 Taikang 1 10.00 2020-9-16 98.15 98.15 0.00 0.00 0.00
123497 10 Taikang 2 10.00 2020-9-16 100.00 100.00 0.00 0.00 0.00
123498 10 Taikang 3 10.00 2020-9-16 100.00 100.00 0.00 0.00 0.00
123499 10 Taikang 4 10.00 2020-9-16 100.00 100.00 0.00 0.00 0.00
124000 12 Feng Investment 10.00 2019-9-24 103.00 98.96 106.32 94.60 78172.91
124001 12 Luo He Investment 12.00 2019-10-30 101.50 99.90 102.80 96.49 66174.28
124002 12 Menggaolu 15.00 2019-11-12 104.50 109.00 109.00 104.50 32541.15
124003 12 Zhuhai Water Group 5.00 2018-8-27 0.00 100.00 0.00 0.00 0.00
124004 12 Yancheng Chengnan 15.00 2019-10-26 101.76 96.83 104.00 95.00 76892.96
124005 12Kunshan Chuangye Holding 18.00 2019-11-7 0.00 100.00 0.00 0.00 63416.40
124006 12 Shaocheng Investment 13.00 2019-11-9 102.00 100.15 102.10 100.00 94293.35
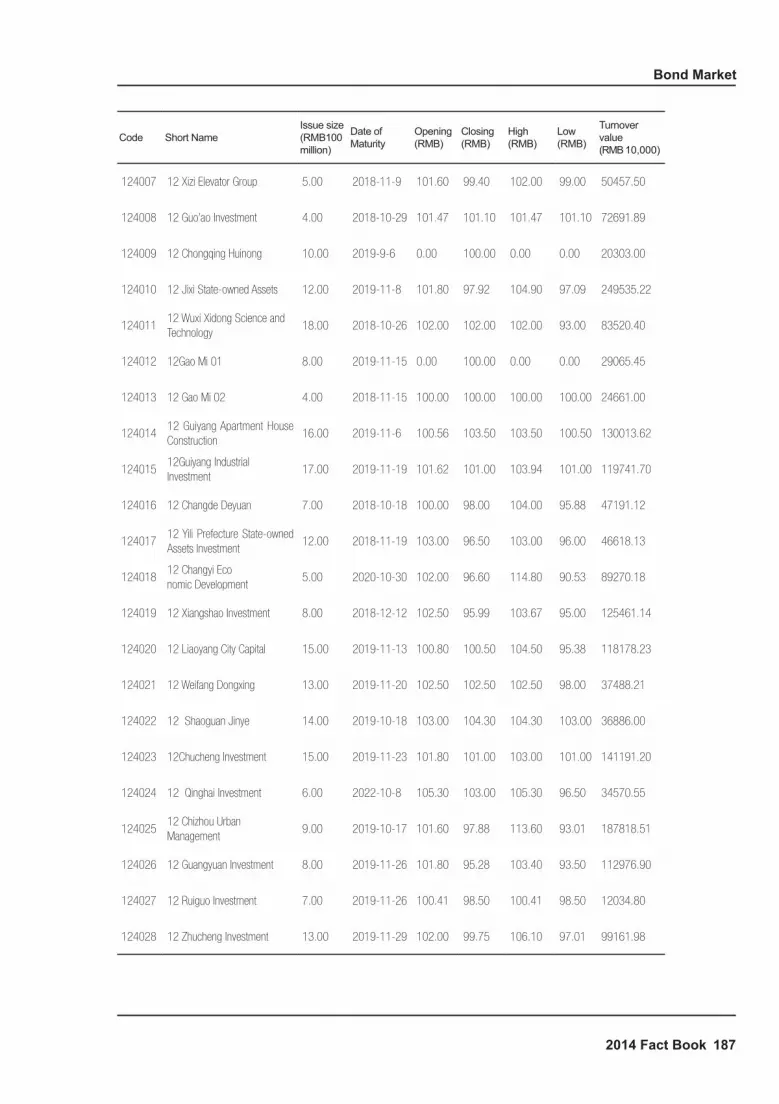
Bond Market
2014 Fact Book 187
Code Short NameIssue size (RMB100 million)
Date of Maturity
Opening (RMB)
Closing (RMB)
High(RMB)
Low(RMB)
Turnover value(RMB 10,000)
124007 12 Xizi Elevator Group 5.00 2018-11-9 101.60 99.40 102.00 99.00 50457.50
124008 12 Guo’ao Investment 4.00 2018-10-29 101.47 101.10 101.47 101.10 72691.89
124009 12 Chongqing Huinong 10.00 2019-9-6 0.00 100.00 0.00 0.00 20303.00
124010 12 Jixi State-owned Assets 12.00 2019-11-8 101.80 97.92 104.90 97.09 249535.22
12401112 Wuxi Xidong Science and Technology
18.00 2018-10-26 102.00 102.00 102.00 93.00 83520.40
124012 12Gao Mi 01 8.00 2019-11-15 0.00 100.00 0.00 0.00 29065.45
124013 12 Gao Mi 02 4.00 2018-11-15 100.00 100.00 100.00 100.00 24661.00
12401412 Guiyang Apartment House Construction
16.00 2019-11-6 100.56 103.50 103.50 100.50 130013.62
12401512Guiyang Industrial Investment
17.00 2019-11-19 101.62 101.00 103.94 101.00 119741.70
124016 12 Changde Deyuan 7.00 2018-10-18 100.00 98.00 104.00 95.88 47191.12
12401712 Yili Prefecture State-owned Assets Investment
12.00 2018-11-19 103.00 96.50 103.00 96.00 46618.13
12401812 Changyi Economic Development
5.00 2020-10-30 102.00 96.60 114.80 90.53 89270.18
124019 12 Xiangshao Investment 8.00 2018-12-12 102.50 95.99 103.67 95.00 125461.14
124020 12 Liaoyang City Capital 15.00 2019-11-13 100.80 100.50 104.50 95.38 118178.23
124021 12 Weifang Dongxing 13.00 2019-11-20 102.50 102.50 102.50 98.00 37488.21
124022 12 Shaoguan Jinye 14.00 2019-10-18 103.00 104.30 104.30 103.00 36886.00
124023 12Chucheng Investment 15.00 2019-11-23 101.80 101.00 103.00 101.00 141191.20
124024 12 Qinghai Investment 6.00 2022-10-8 105.30 103.00 105.30 96.50 34570.55
12402512 Chizhou Urban Management
9.00 2019-10-17 101.60 97.88 113.60 93.01 187818.51
124026 12 Guangyuan Investment 8.00 2019-11-26 101.80 95.28 103.40 93.50 112976.90
124027 12 Ruiguo Investment 7.00 2019-11-26 100.41 98.50 100.41 98.50 12034.80
124028 12 Zhucheng Investment 13.00 2019-11-29 102.00 99.75 106.10 97.01 99161.98

Bond Market
2014 Fact Book 188
Code Short NameIssue size (RMB100 million)
Date of Maturity
Opening (RMB)
Closing (RMB)
High(RMB)
Low(RMB)
Turnover value(RMB 10,000)
124029 12 Yulin Urban Construction 8.00 2019-11-26 101.49 98.00 108.00 98.00 56950.44
124030 12 Nanjing Urban Investment 23.00 2018-11-26 0.00 100.00 0.00 0.00 20065.00
124031 12 Henan Railway Investment 28.00 2022-11-19 100.40 107.00 107.00 100.40 64064.00
12403212 Yichang Urban Construction Investment
10.00 2019-11-8 102.79 102.79 102.79 102.79 32787.80
12403312 Suzhou Urban Construction Investment
20.00 2019-10-25 101.24 96.50 102.05 95.00 96093.29
12403412 Zhengzhou Chenjian Investment
16.00 2019-12-3 102.25 102.25 102.25 92.54 63217.28
124035 12 Shuyang Jinyuan 10.00 2019-12-3 99.51 103.50 103.50 99.51 256455.31
12403612 Zhangjiagang Economic Development
10.00 2019-11-16 100.00 102.00 103.20 99.31 94156.31
124037 12 Chongqing Jiangbei 18.00 2019-10-16 102.00 102.50 104.60 100.00 22032.11
124038 12 Yuanzhou Holdings 5.00 2019-12-4 101.65 92.20 110.66 84.40 93968.75
124039 12 Chongqing Jiangjin 13.00 2019-9-21 0.00 100.00 0.00 0.00 28152.20
124040 12 Shaoxing Didang 10.00 2018-12-5 101.80 98.00 102.95 98.00 82350.90
124041 12 Suqian Water 8.00 2019-12-4 101.40 101.50 101.80 101.40 68243.10
124042 12 Hubei Tourism Investment 8.00 2019-10-29 103.37 99.50 104.50 93.50 25497.07
124043 12 Shenzhen Liye 10.00 2018-12-3 100.50 96.50 110.00 90.26 151080.38
124044 12 Legend Holdings 23.00 2022-11-30 103.80 98.68 104.00 98.68 76909.21
12404512 Jiashan Economic Development
8.00 2019-12-3 108.00 108.00 108.00 108.00 26444.11
12404612 Puyang Urban Construction Investment
5.00 2019-10-29 103.00 100.00 108.00 94.00 45086.98
12404712 Qianxinan Prefecture Hongsheng
14.00 2019-11-22 102.00 98.22 103.77 93.50 71295.01
12404812 Heping District State-owned Assets
12.00 2019-11-13 102.80 98.81 102.80 97.00 180219.57
12404912 Yingkou Coastal Development
16.00 2019-11-16 103.50 103.50 103.50 103.50 24125.10
12405012 Yulin Urban Investment Management
15.00 2018-12-4 101.92 98.46 103.80 95.22 166094.42
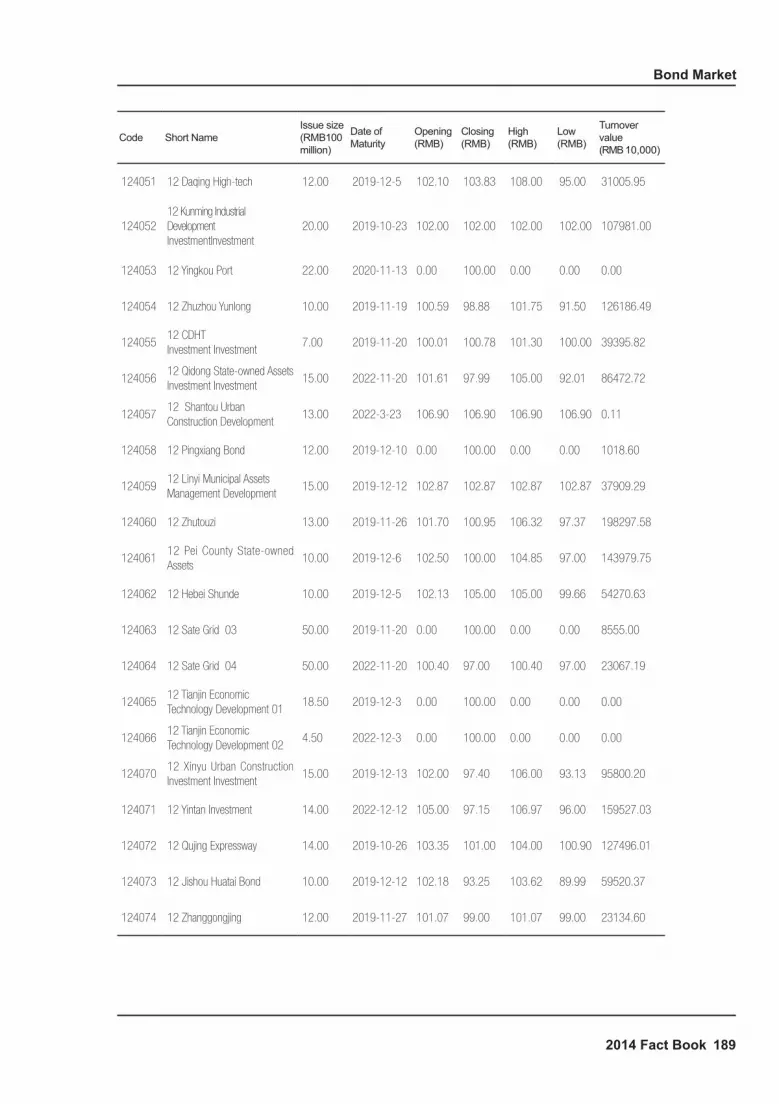
Bond Market
2014 Fact Book 189
Code Short NameIssue size (RMB100 million)
Date of Maturity
Opening (RMB)
Closing (RMB)
High(RMB)
Low(RMB)
Turnover value(RMB 10,000)
124051 12 Daqing High-tech 12.00 2019-12-5 102.10 103.83 108.00 95.00 31005.95
12405212 Kunming Industrial Development InvestmentInvestment
20.00 2019-10-23 102.00 102.00 102.00 102.00 107981.00
124053 12 Yingkou Port 22.00 2020-11-13 0.00 100.00 0.00 0.00 0.00
124054 12 Zhuzhou Yunlong 10.00 2019-11-19 100.59 98.88 101.75 91.50 126186.49
12405512 CDHT Investment Investment
7.00 2019-11-20 100.01 100.78 101.30 100.00 39395.82
12405612 Qidong State-owned Assets Investment Investment
15.00 2022-11-20 101.61 97.99 105.00 92.01 86472.72
12405712 Shantou Urban Construction Development
13.00 2022-3-23 106.90 106.90 106.90 106.90 0.11
124058 12 Pingxiang Bond 12.00 2019-12-10 0.00 100.00 0.00 0.00 1018.60
12405912 Linyi Municipal Assets Management Development
15.00 2019-12-12 102.87 102.87 102.87 102.87 37909.29
124060 12 Zhutouzi 13.00 2019-11-26 101.70 100.95 106.32 97.37 198297.58
12406112 Pei County State-owned Assets
10.00 2019-12-6 102.50 100.00 104.85 97.00 143979.75
124062 12 Hebei Shunde 10.00 2019-12-5 102.13 105.00 105.00 99.66 54270.63
124063 12 Sate Grid 03 50.00 2019-11-20 0.00 100.00 0.00 0.00 8555.00
124064 12 Sate Grid 04 50.00 2022-11-20 100.40 97.00 100.40 97.00 23067.19
12406512 Tianjin Economic Technology Development 01
18.50 2019-12-3 0.00 100.00 0.00 0.00 0.00
12406612 Tianjin Economic Technology Development 02
4.50 2022-12-3 0.00 100.00 0.00 0.00 0.00
12407012 Xinyu Urban Construction Investment Investment
15.00 2019-12-13 102.00 97.40 106.00 93.13 95800.20
124071 12 Yintan Investment 14.00 2022-12-12 105.00 97.15 106.97 96.00 159527.03
124072 12 Qujing Expressway 14.00 2019-10-26 103.35 101.00 104.00 100.90 127496.01
124073 12 Jishou Huatai Bond 10.00 2019-12-12 102.18 93.25 103.62 89.99 59520.37
124074 12 Zhanggongjing 12.00 2019-11-27 101.07 99.00 101.07 99.00 23134.60

Bond Market
2014 Fact Book 190
Code Short NameIssue size (RMB100 million)
Date of Maturity
Opening (RMB)
Closing (RMB)
High(RMB)
Low(RMB)
Turnover value(RMB 10,000)
12407512Huaibei Construction Investment Investment
18.00 2018-12-17 101.01 96.47 103.00 94.10 355332.42
12407612Jinhu County State-owned Assets Management Bond
8.00 2018-12-7 104.00 99.10 108.49 98.20 152958.14
124077 12 Fuzhou Construction 5.00 2019-12-10 0.00 100.00 0.00 0.00 5103.00
124078 12 Yunnan Urban Construction 5.00 2018-10-24 102.52 105.01 109.75 98.52 46491.37
12407912 Baoshan State-owned Assets Management
8.00 2019-12-10 102.80 97.68 104.82 92.78 136421.05
124080 12 Suhai Investment 10.00 2019-11-7 101.50 99.49 106.88 94.53 135742.62
124081 12 Changsha Pilot 18.00 2019-12-10 101.90 97.89 104.00 92.97 152758.95
124082 12 Qingdao Comson 20.00 2022-12-12 0.00 100.00 0.00 0.00 0.00
12408312 Huangshi Urban Construction Investment
10.00 2019-10-19 101.50 102.00 102.00 101.50 68489.35
124084 12 Shanghai Lingang 7.00 2019-12-10 0.00 100.00 0.00 0.00 14710.00
12408512 Shanghai Jinshan Investment
9.00 2019-12-21 101.60 101.60 101.60 101.60 40209.46
12408612 Zhuji Urban Construction Investment
16.00 2019-12-19 102.90 100.00 103.00 99.00 283358.76
124087 12 Wuhu Xinma 8.00 2019-11-14 0.00 100.00 0.00 0.00 17780.00
124088 12 Dongtai Bond 15.00 2019-12-26 102.20 97.50 104.10 93.50 97955.85
12408912 Ganzhou Development Bond
18.00 2018-12-26 101.61 97.50 103.00 97.00 200030.81
12409012Zunyi State-owned Assets Investment
20.00 2019-12-26 103.80 99.00 103.80 98.70 152165.40
124091 12 Yuxing Bond 12.00 2019-12-10 101.00 104.00 105.00 94.45 81968.15
124092 12 Ordos Huayan 12.00 2018-12-17 105.00 97.76 107.80 94.99 231231.34
12409312 Kashi Urban Construction Investment
8.00 2019-11-27 103.40 96.45 113.56 94.20 180575.01
12409412 Ningbo Communication Investment
8.00 2022-12-21 0.00 100.00 0.00 0.00 18227.00
12409512 Liupanshui Development Investment
16.00 2019-12-3 102.00 94.97 102.48 93.00 46743.38
124096 12 Huai'an Urban Assets 15.00 2019-12-26 104.06 101.00 104.06 100.54 136697.54

Bond Market
2014 Fact Book 191
Code Short NameIssue size (RMB100 million)
Date of Maturity
Opening (RMB)
Closing (RMB)
High(RMB)
Low(RMB)
Turnover value(RMB 10,000)
124097 12 Dazhou Investment 10.00 2018-12-26 102.94 98.89 103.20 97.70 52016.34
124098 12 Dazhou Investment 10.00 2019-12-25 102.80 100.00 110.00 91.51 43740.28
12409912 Deyang Construction Investment
10.00 2019-12-26 103.40 98.50 103.40 98.50 33449.28
12410012 Shishi City State-owned Investment
8.00 2019-9-13 104.50 98.44 109.95 96.71 95178.75
12410112 Jiangxi Expressway Investment
12.00 2017-12-3 0.00 100.00 0.00 0.00 0.00
124102 12 Lucky Air 7.00 2019-12-14 105.00 105.00 105.00 105.00 18221.11
124103 13 Tongchuang Bond 8.00 2020-1-9 100.00 98.00 106.00 93.66 46271.26
12410412 Chaohu Municipal and Town Construction Investment
12.00 2019-12-24 101.50 96.65 104.50 94.46 103444.37
124105 12 Yuyue Bond 3.00 2018-12-20 102.00 92.83 103.58 87.88 53949.62
124106 12 Handan Bond 20.00 2019-12-24 103.00 99.61 105.90 97.00 194459.53
124107 12 Luoyang Urban Investment 12.00 2019-12-31 102.81 98.20 103.50 88.85 69959.38
12410812 Wujiang Economic Development
15.00 2019-12-27 103.26 104.21 104.26 103.26 116858.95
12411013 Nanjing Xin'gang Development
7.00 2020-1-8 102.85 102.50 104.79 100.00 47294.46
124111 12 Changxing Construction 10.00 2019-11-30 102.41 97.00 103.00 92.99 7998.84
124112 13 Henan Shengrun 11.00 2019-1-10 103.00 96.85 105.80 91.50 94332.41
124113 12 Chongqi Publication 4.00 2019-11-23 0.00 100.00 0.00 0.00 2000.00
124114 12 Dafeng Bond 10.00 2019-12-13 102.08 99.50 103.30 98.00 36411.20
124116 12 Chongqing Beifei 10.00 2019-12-25 103.39 98.50 104.97 98.00 66154.94
124117 12 Anqing Urban Investment 18.00 2019-12-31 101.80 101.00 104.00 101.00 189069.41
124118 12 Zhongshan Xingzhong 7.00 2019-12-31 0.00 100.00 0.00 0.00 30490.00
124119 12 Circum-Taihu 12.00 2019-11-28 101.86 101.86 101.86 101.86 34944.79
124120 12 Quanzhuo Taishang 10.00 2019-12-10 0.00 100.00 0.00 0.00 20157.00

Bond Market
2014 Fact Book 192
Code Short NameIssue size (RMB100 million)
Date of Maturity
Opening (RMB)
Closing (RMB)
High(RMB)
Low(RMB)
Turnover value(RMB 10,000)
124121 12 Panjiang Bond 8.00 2019-12-28 0.00 100.00 0.00 0.00 5000.00
124122 13 Fuzhou Investment 12.00 2020-1-16 102.30 99.00 103.40 94.76 114473.30
12412313 Nanchang Urban Investment
13.00 2020-2-20 101.00 99.00 102.00 96.80 44898.19
124124 12 Shuangyashan 10.00 2019-12-25 100.00 102.00 110.00 100.00 2004.09
12412513 Wenzhou Economy Development
10.00 2020-1-15 99.90 107.00 107.00 99.90 139051.11
124126 12 Liuzhou Urban Investment 15.00 2022-12-31 101.75 103.99 105.00 96.20 92741.00
12412712 Huangyan District State-owned Assets
10.00 2018-12-17 102.85 103.50 103.50 100.00 92457.41
12412812 Xiaoshan Economic Development
14.00 2018-12-26 101.30 99.00 101.70 99.00 44540.65
12412912 Quanzhou Quangang Petrochemical Industrial Park Construction
10.00 2019-4-16 0.00 100.00 0.00 0.00 0.00
124130 13 Shaanxi Dongling 7.00 2023-1-15 101.18 91.45 104.00 90.34 132448.76
124131 13 Anshun State-owned Assets 8.00 2020-1-10 102.00 103.00 103.00 102.00 55424.21
124132 13 Gongyi Bond 10.00 2020-1-18 102.20 101.88 102.20 97.50 76342.66
124133 12 Ningxia Baofeng Energy 4.00 2019-11-19 100.65 93.00 104.00 91.10 1069.44
12413413 Quanzhou Urban Investment
17.00 2020-1-11 0.00 100.00 0.00 0.00 102853.00
12413513 Yunnan Expressway Development and Investment
20.00 2019-1-11 100.90 98.00 108.00 97.50 79968.54
124136 13 Taicang Urban Investment 16.00 2020-1-11 101.76 97.99 105.00 96.88 27283.56
12413713 Ganzhou Development Investment
15.00 2020-1-18 101.00 98.00 101.99 98.00 86253.78
12413812 Changsha Urban Construction Investment
18.00 2019-4-24 102.80 98.50 105.80 95.80 45123.20
124139 13 Nantong Gangzha 12.00 2020-1-9 0.00 100.00 0.00 0.00 99284.00
12414013 Cangzhou Urban ConstructionInvestment
12.00 2020-1-23 100.65 106.00 106.00 100.65 115212.21
124141 13 Zhejiang Geely 12.00 2020-1-24 0.00 100.00 0.00 0.00 130100.40

Bond Market
2014 Fact Book 193
Code Short NameIssue size (RMB100 million)
Date of Maturity
Opening (RMB)
Closing (RMB)
High(RMB)
Low(RMB)
Turnover value(RMB 10,000)
124142 13 Chongqing Three Gorges 10.00 2019-1-23 101.23 99.50 101.24 99.50 2026.29
124143 13 Taishan Investment 18.00 2020-1-25 102.40 102.00 104.33 102.00 139004.70
124144 13 Chengdu Urban Investment 20.00 2020-1-14 0.00 100.00 0.00 0.00 72274.00
124145 13 Chengdu Xingcheng 20.00 2020-1-28 101.38 101.38 101.38 101.38 15700.14
12414613 Hainan Development Holdings
25.00 2020-1-24 99.80 95.00 101.00 93.50 6084.93
124147 13 Ningbo Eastern Investment 15.00 2020-1-21 102.00 98.00 102.45 90.00 52481.76
124148 13 JinguanBond 10.00 2019-1-28 90.20 99.90 99.90 90.20 119805.17
12414913 Zhenjiang Water Conservancy Investment
14.00 2020-1-30 100.03 100.03 100.03 100.03 40012.00
124150 13 Nanchong Development 20.00 2020-1-28 0.00 100.00 0.00 0.00 0.00
124151 13 Changxing Island 18.00 2020-1-25 100.37 100.30 102.20 100.30 14663.30
124152 13 Nanjing Lukou 16.00 2023-1-29 0.00 100.00 0.00 0.00 0.00
124153 13 State Grid 01 100.00 2020-1-23 0.00 100.00 0.00 0.00 2932.50
124154 13 State Grid 02 100.00 2028-1-23 0.00 100.00 0.00 0.00 0.00
124155 13 Weinan Urban Investment 12.00 2020-1-15 96.00 99.00 99.00 92.00 22459.26
12415613 Chongqing Fuling State-owned Assets
17.00 2020-1-21 92.15 95.94 96.00 91.50 68762.08
124158 13 Xidongxincheng 15.00 2020-1-28 102.98 95.50 102.98 95.33 38715.70
12415913 Shaoxing Urban Village Renovation
12.00 2020-1-24 102.50 95.60 105.30 95.08 91855.61
124160 13 Penglaige Tourism 8.00 2021-1-30 100.88 100.88 100.88 100.88 37874.80
124161 13 Tianrui Group Cement 20.00 2021-2-4 101.70 95.85 105.50 91.81 50635.32
12416213 Jining High and New City Construction
12.00 2020-1-28 100.13 100.13 100.13 100.13 31500.10
12416313 Chengdu Culture and Tourism
5.00 2020-2-19 102.00 97.60 103.30 84.00 46443.48
12416413 Jianhu County Urban Construction Investment
10.00 2020-2-22 100.50 97.35 101.00 95.10 7899.92

Bond Market
2014 Fact Book 194
Code Short NameIssue size (RMB100 million)
Date of Maturity
Opening (RMB)
Closing (RMB)
High(RMB)
Low(RMB)
Turnover value(RMB 10,000)
12416513 Nanchang Municipal Public Investment
12.00 2020-2-25 100.26 100.25 100.26 100.25 72299.63
12416613 Jiangmen Binjiang Investment
12.00 2020-2-28 101.19 107.00 107.00 101.19 36797.56
124167 13 Yunnan InvestmentBond 12.00 2020-2-1 101.35 95.30 101.35 93.80 9576.44
12416813 Shaoxing County Central City
15.00 2019-2-26 0.00 100.00 0.00 0.00 44638.00
124169 13 Huafeng Bond 8.00 2020-2-26 102.00 98.01 105.00 93.50 150544.45
124170 13 Xiamen Xinglin 5.00 2020-2-22 0.00 100.00 0.00 0.00 10196.00
12417113 Changzhi Urban Construction Investment
13.00 2020-2-26 101.80 97.00 103.20 92.99 33631.74
124172 13 Changde Urban Investment 15.00 2020-2-25 101.00 99.99 103.00 93.50 27020.28
12417313 Shaanxi Non Ferrous Metals
15.00 2019-2-26 100.60 98.00 107.00 88.40 69001.23
124174 13 Jilin Urban Bond 18.00 2020-2-26 103.20 103.20 103.20 103.20 137940.10
124175 13 Xiangtan High-tech 8.00 2020-1-15 101.80 101.19 113.36 95.12 123413.54
124176 13 Wuhan Metro 20.00 2020-2-4 0.00 100.00 0.00 0.00 9540.00
124177 13 Urumqi High-tech 10.00 2020-3-5 0.00 100.00 0.00 0.00 6767.00
12417813Jining District Urban Investment
8.00 2020-3-19 103.00 93.60 103.40 91.00 121901.48
124179 13 Guangzhou Yuexiu 28.00 2020-2-28 0.00 100.00 0.00 0.00 31087.00
12418013 Qijiang District Eastern New City Development
12.00 2020-1-29 101.00 103.00 103.00 101.00 1954.51
12418113 Yuyao Economic Development Zone Construction Investment
10.00 2020-3-4 101.00 98.50 102.50 92.16 40984.28
124182 13 Jinggong Holding Bond 4.50 2018-3-5 103.00 99.98 105.06 92.06 7023.60
124183 13 Tianjin Guangcheng 15.00 2023-2-22 102.00 94.75 105.00 93.20 164221.67
12418413 Beijing Infrastructure Investment
28.00 2023-3-11 0.00 100.00 0.00 0.00 0.00
12418513Haining Assets ManagementBond
15.00 2020-3-6 101.00 101.00 101.00 101.00 10747.30

Bond Market
2014 Fact Book 195
Code Short NameIssue size (RMB100 million)
Date of Maturity
Opening (RMB)
Closing (RMB)
High(RMB)
Low(RMB)
Turnover value(RMB 10,000)
124187 13 Taifeng Mining Bond 9.00 2020-3-12 0.00 100.00 0.00 0.00 0.00
12418813 Zoucheng Urban Assets Management
12.00 2019-3-12 100.30 100.00 100.60 90.20 68033.04
124189 13 Dali Tourism 8.00 2020-3-7 99.34 99.34 99.34 99.34 63178.20
124190 13 Fengxian Nanqiao New City 6.50 2020-3-5 100.00 100.00 100.00 100.00 14652.20
124191 13 Hangzhou Hi-tech 5.00 2020-1-28 0.00 100.00 0.00 0.00 14242.00
12419213 Hanjiang Urban Construction
13.00 2020-3-12 0.00 100.00 0.00 0.00 23144.00
12419313 Wendeng Urban Assets Management
7.00 2020-3-6 100.00 103.00 103.20 97.80 44340.77
124194 13 Binhai 01 20.00 2018-3-13 101.50 101.50 101.50 101.50 5.08
124195 13 Binhai 02 30.00 2020-3-13 0.00 100.00 0.00 0.00 0.00
124196 13 Yantai Urban Construction 20.00 2020-3-14 101.52 96.50 103.10 94.61 118420.86
12419710 Chaoyang State-owned Assets 01
10.00 2016-2-1 100.22 100.22 100.22 100.22 97340.00
12419810 Chaoyang State-owned Assets 02
15.00 2017-2-1 0.00 100.00 0.00 0.00 0.00
124199 13 Taizhou Traffic Bond 8.00 2020-3-11 100.33 100.33 100.33 100.33 9586.60
124200 13 Zigong Hi-tech 10.00 2020-3-13 99.73 102.20 102.30 98.79 59650.62
124201 13 Nanping Expressway 15.00 2020-1-28 101.28 104.00 104.00 101.28 27899.90
124202 13 Pingtan Bond 12.00 2020-3-15 102.00 96.67 105.62 89.68 200629.25
124203 13 Jiujiang Fuhe 9.00 2019-3-19 106.00 106.00 106.00 106.00 98370.11
124204 13 Tianjin Urban Investment 80.00 2023-2-26 0.00 100.00 0.00 0.00 0.00
124205 13 Yuhang Innovation Bond 12.00 2020-3-18 102.00 101.50 102.69 97.00 49111.01
124206 13 Sunriver Bond 6.00 2020-2-26 102.00 92.96 102.09 92.68 59649.71
124207 13 Bayannur UrbanInvestment 18.00 2020-3-15 100.80 92.60 104.56 92.50 202487.40
124208 13 Xi'an Investment Bond 7.00 2023-3-19 106.00 106.00 106.00 106.00 13355.11
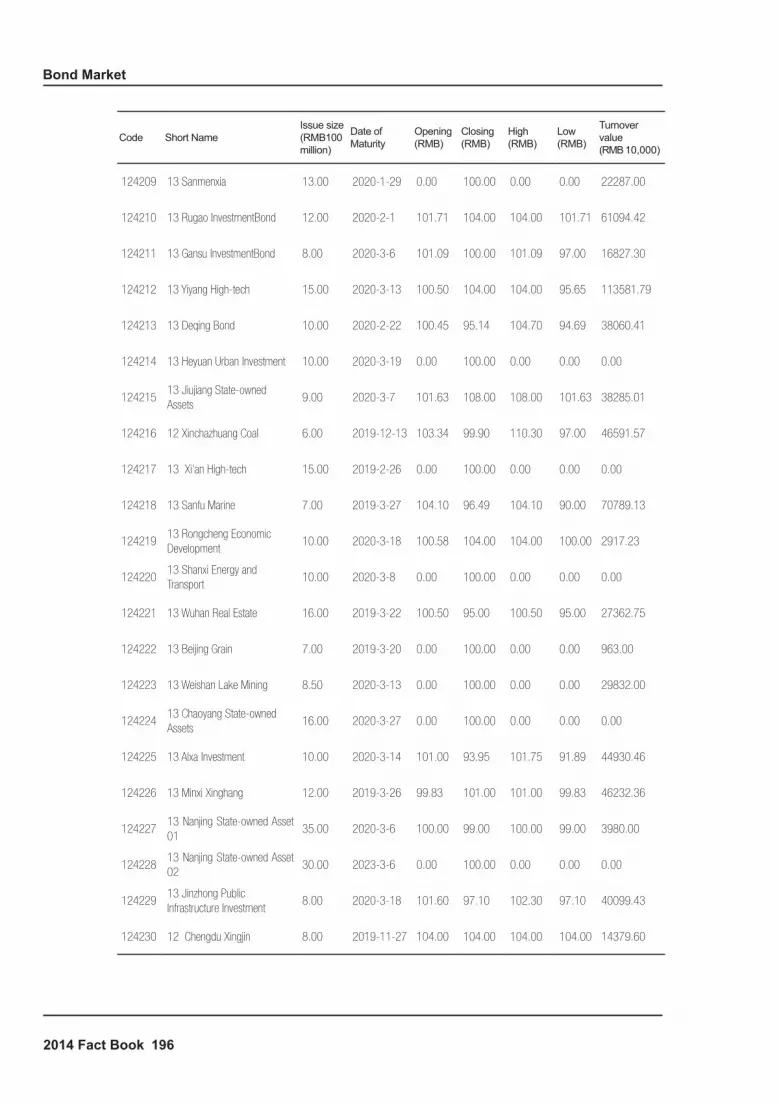
Bond Market
2014 Fact Book 196
Code Short NameIssue size (RMB100 million)
Date of Maturity
Opening (RMB)
Closing (RMB)
High(RMB)
Low(RMB)
Turnover value(RMB 10,000)
124209 13 Sanmenxia 13.00 2020-1-29 0.00 100.00 0.00 0.00 22287.00
124210 13 Rugao InvestmentBond 12.00 2020-2-1 101.71 104.00 104.00 101.71 61094.42
124211 13 Gansu InvestmentBond 8.00 2020-3-6 101.09 100.00 101.09 97.00 16827.30
124212 13 Yiyang High-tech 15.00 2020-3-13 100.50 104.00 104.00 95.65 113581.79
124213 13 Deqing Bond 10.00 2020-2-22 100.45 95.14 104.70 94.69 38060.41
124214 13 Heyuan Urban Investment 10.00 2020-3-19 0.00 100.00 0.00 0.00 0.00
12421513 Jiujiang State-owned Assets
9.00 2020-3-7 101.63 108.00 108.00 101.63 38285.01
124216 12 Xinchazhuang Coal 6.00 2019-12-13 103.34 99.90 110.30 97.00 46591.57
124217 13 Xi'an High-tech 15.00 2019-2-26 0.00 100.00 0.00 0.00 0.00
124218 13 Sanfu Marine 7.00 2019-3-27 104.10 96.49 104.10 90.00 70789.13
12421913 Rongcheng Economic Development
10.00 2020-3-18 100.58 104.00 104.00 100.00 2917.23
12422013 Shanxi Energy and Transport
10.00 2020-3-8 0.00 100.00 0.00 0.00 0.00
124221 13 Wuhan Real Estate 16.00 2019-3-22 100.50 95.00 100.50 95.00 27362.75
124222 13 Beijing Grain 7.00 2019-3-20 0.00 100.00 0.00 0.00 963.00
124223 13 Weishan Lake Mining 8.50 2020-3-13 0.00 100.00 0.00 0.00 29832.00
12422413 Chaoyang State-owned Assets
16.00 2020-3-27 0.00 100.00 0.00 0.00 0.00
124225 13 Alxa Investment 10.00 2020-3-14 101.00 93.95 101.75 91.89 44930.46
124226 13 Minxi Xinghang 12.00 2019-3-26 99.83 101.00 101.00 99.83 46232.36
12422713 Nanjing State-owned Asset 01
35.00 2020-3-6 100.00 99.00 100.00 99.00 3980.00
12422813 Nanjing State-owned Asset 02
30.00 2023-3-6 0.00 100.00 0.00 0.00 0.00
12422913 Jinzhong Public Infrastructure Investment
8.00 2020-3-18 101.60 97.10 102.30 97.10 40099.43
124230 12 Chengdu Xingjin 8.00 2019-11-27 104.00 104.00 104.00 104.00 14379.60

Bond Market
2014 Fact Book 197
Code Short NameIssue size (RMB100 million)
Date of Maturity
Opening (RMB)
Closing (RMB)
High(RMB)
Low(RMB)
Turnover value(RMB 10,000)
124231 13 Linhai Investment 12.00 2020-3-21 100.64 100.00 100.76 100.00 122534.80
12423213 Jiangsu Haizhouwan Development
10.00 2023-3-29 100.00 108.00 108.00 108.00 39968.51
124234 13 Shenzhen Metro 01 50.00 2023-3-25 0.00 100.00 0.00 0.00 0.00
124235 13 Qinghe Investment 7.00 2020-1-24 99.68 105.00 105.00 99.68 30346.71
12423612 Ma'anshan Economic Development
8.00 2019-12-20 100.64 100.64 100.64 100.64 67241.00
124238 13 Tongliao Investment 16.00 2020-4-9 102.05 101.70 102.05 101.70 49043.50
124239 13 Yinzhou City Investment 6.00 2020-3-18 0.00 100.00 0.00 0.00 11002.00
124240 13 Hefei Industrial Investment 10.00 2020-3-20 0.00 100.00 0.00 0.00 25653.00
124241 13 Yantai Development 8.00 2020-4-10 102.00 95.00 102.00 94.00 30801.65
124242 13 Yingkou Development 9.00 2020-4-8 100.00 91.92 102.00 88.00 82596.42
124243 13 Changzhou Hi-tech 16.00 2020-3-21 0.00 100.00 0.00 0.00 1979.00
12424413 Panyu Communication Investment
11.00 2019-4-12 101.73 101.73 101.73 101.73 27411.60
124245 13 Hangzhou Canal 10.00 2020-4-2 0.00 100.00 0.00 0.00 21345.00
124246 13 Liyang Urban Construction 12.00 2020-3-8 100.20 99.99 100.21 95.85 4944.70
12424713 Shaoxing Communications Investment
15.00 2020-3-4 0.00 100.00 0.00 0.00 0.00
124248 13 Beijing Gehua 6.00 2020-3-21 100.60 104.00 106.00 100.00 15094.26
124249 13 Dashiqiao Urban Investment 15.00 2020-2-21 101.00 102.98 102.98 100.98 36236.11
12425013 Suzhou Construction Investment
15.00 2020-4-17 101.21 100.71 101.21 100.71 43857.90
124251 13 Luxin Investment 10.00 2020-4-17 100.02 95.20 100.02 95.20 9443.89
124252 13 Handan Communications 10.00 2021-4-18 0.00 100.00 0.00 0.00 0.00
124253 13 Xinxiang Investment 9.00 2020-4-15 98.20 98.20 98.21 98.15 7730.86
124254 13 Changshu Development 10.00 2020-4-19 99.99 94.08 100.24 93.80 10520.53

Bond Market
2014 Fact Book 198
Code Short NameIssue size (RMB100 million)
Date of Maturity
Opening (RMB)
Closing (RMB)
High(RMB)
Low(RMB)
Turnover value(RMB 10,000)
124255 13 Zhejiang Xinchang 12.00 2020-4-24 100.00 100.00 100.00 100.00 800.00
124256 13 Supor 3.00 2020-4-11 100.80 96.97 102.99 90.01 32970.81
124257 13 Hainan Jinhai 12.00 2020-4-15 93.28 93.28 93.28 93.28 1.03
124258 13 Lu'an Mining 01 30.00 2023-4-25 100.49 103.00 103.00 100.49 221.59
124259 13 Lu'an Mining 02 10.00 2023-4-25 100.49 103.00 103.00 100.49 221.59
124260 13 Suining Development 6.00 2020-4-25 99.90 94.56 99.90 90.00 7786.01
124261 13 Anshan Urban Investment 20.00 2020-4-25 96.60 96.10 100.00 94.95 37076.52
124262 13 Chuxiong Investment 20.00 2020-3-29 101.11 99.26 102.51 98.50 129133.39
12426313 Lincang City State-Owned Assets
5.00 2020-4-11 101.90 102.54 102.80 98.40 156206.96
124264 13 Jinjiang Urban Investment 16.00 2020-4-26 0.00 100.00 0.00 0.00 37033.20
124265 13 Honghe Road 5.00 2020-5-6 100.00 98.34 101.00 89.12 35084.32
124266 13 Harbin Water Investment 15.00 2020-5-6 98.77 96.65 100.00 54.59 24348.33
124267 13 Jintan Investment 10.00 2020-4-26 0.00 100.00 0.00 0.00 10920.40
124268 13 Chongqing Nanfa 18.00 2020-4-27 100.00 100.00 100.00 100.00 32028.00
124269 13 Chongqing Dazu 12.00 2020-4-26 100.90 98.20 100.90 91.00 23242.49
124270 13 Chongqing Wansheng 13.00 2020-4-17 100.00 100.00 100.00 100.00 800.00
124271 13 Jinwaitan 5.00 2020-4-24 98.50 98.50 98.50 98.50 4438.50
124272 13 Suifenhe 10.00 2020-4-28 103.00 98.85 112.00 91.17 134062.93
124273 13 Sunhover Bond 5.00 2020-2-27 101.44 99.90 101.44 95.01 4067.04
124274 13 Anhui Nanxiang 3.00 2019-4-11 101.20 97.19 106.00 91.82 14902.38
124275 13 Longgang Investment 10.00 2019-3-27 100.39 96.50 102.00 96.50 61536.85
124276 13 Tianjin Jinbin Investment 5.50 2020-4-26 97.00 95.28 97.00 95.28 4971.08

Bond Market
2014 Fact Book 199
Code Short NameIssue size (RMB100 million)
Date of Maturity
Opening (RMB)
Closing (RMB)
High(RMB)
Low(RMB)
Turnover value(RMB 10,000)
124277 13 Dafeng Port 8.00 2020-5-8 103.00 96.00 112.99 90.22 11500.52
124278 13 Chongqing Shuangqiao 10.00 2020-4-26 101.79 101.54 102.79 92.02 91019.33
124279 13 Hailar 8.00 2020-5-14 100.27 93.00 107.00 90.99 5927.66
12428013 Nantong Economic Development
8.00 2020-5-17 0.00 100.00 0.00 0.00 7560.00
124281 13 Shijiazhuang Real Estate 22.00 2020-5-15 99.98 99.98 99.98 99.98 136685.00
124283 13 Wuhan New Harbor 8.00 2020-4-18 100.00 104.00 104.00 100.00 1879.20
124284 13 Hainan Yangpu 8.00 2020-3-11 0.00 100.00 0.00 0.00 5000.00
124285 13 Datong Coal Mine Group 54.00 2028-4-24 100.99 103.00 103.00 100.99 13932.59
124286 13 Hainan Airlines Bond 11.50 2020-4-15 101.39 109.00 109.00 101.39 51282.74
124287 13 Kingtec Bond 5.50 2020-5-23 98.73 100.37 100.37 98.73 26715.70
124288 13 Optics Valley Union 6.00 2019-10-23 0.00 100.00 0.00 0.00 5998.00
124289 13 Lishui City Investment 10.00 2020-5-23 100.20 94.01 101.00 93.12 53059.30
124290 13 Changsha Metro 25.00 2023-4-23 0.00 100.00 0.00 0.00 0.00
124291 13 Yanzhou Urban Investment 10.00 2021-5-28 100.00 92.80 102.00 89.99 31531.52
12429213 Lishui County Urban Construction
10.00 2020-5-29 96.70 93.00 97.00 87.10 27313.34
12429313 Xinjiang Wujiaqu Urban Construction
5.00 2020-5-23 0.00 100.00 0.00 0.00 0.00
124294 13 Jiangsu Huajing 12.00 2020-5-16 97.57 100.00 100.00 97.57 23592.78
124295 13 Nanjing Railway 13.00 2020-6-4 97.37 97.37 97.37 97.37 9715.10
124296 13 Huasheng Jiangquan 6.00 2020-5-31 100.30 95.42 101.99 89.30 26143.52
124297 13 Tongxiang Investment 13.00 2020-5-16 101.00 96.93 101.00 95.00 52038.72
124298 13 Linfen Investment 15.00 2020-5-23 100.00 100.00 100.80 100.00 66136.03
12429913 Xining Economic Development
6.00 2020-6-4 100.00 101.50 101.50 100.00 16003.20

Bond Market
2014 Fact Book 200
Code Short NameIssue size (RMB100 million)
Date of Maturity
Opening (RMB)
Closing (RMB)
High(RMB)
Low(RMB)
Turnover value(RMB 10,000)
124300 13 Yunnan Investment Holding 7.00 2018-5-24 0.00 100.00 0.00 0.00 14655.00
124301 13 Rizhao Port Bond 8.00 2020-6-6 100.00 92.82 100.00 89.00 44565.94
12430212 Guangxi Transportation Investment
20.00 2022-12-11 0.00 100.00 0.00 0.00 0.00
124303 13 Xianning City Rongsheng 15.00 2020-6-5 0.00 100.00 0.00 0.00 43769.80
124304 13 Hechuan Investment 10.00 2020-6-17 100.26 102.48 102.48 90.52 148410.67
12430513 Wafangdian State-owned Assets
15.00 2020-6-20 101.00 93.00 102.50 93.00 74498.15
124306 13 Hubei Sanning 5.00 2019-6-18 100.00 100.00 100.00 100.00 8700.00
12430713 Anqing Economic Development
6.00 2020-6-18 99.99 99.91 99.99 97.85 72217.56
124308 13 Meishan Hongda 16.00 2020-6-19 101.20 99.00 101.30 90.00 136977.63
124309 13 Hongchang Pipeline Gas 7.00 2020-6-20 100.30 92.44 100.60 90.78 54520.53
12431013 Nanchang Water Conservancy
15.00 2020-6-21 101.00 96.45 101.00 96.00 66368.21
12431113 Hongxiang State-owned Assets
16.00 2020-6-19 100.40 94.43 103.00 91.00 21416.09
124312 13 Jingdezhen 12.00 2020-6-25 100.75 101.86 101.86 96.60 75376.40
124313 13 Sujiatun 13.00 2020-6-20 100.80 94.00 100.80 90.96 88928.41
12431413 Guiyang Railway Construction
10.00 2020-6-18 97.10 97.10 97.10 97.10 35156.97
12431513 Wenzhou Communications Investment
10.00 2020-4-22 94.00 94.00 94.00 94.00 1873.40
124316 13 Xinzheng Investment 15.00 2019-6-28 100.50 97.43 100.50 94.50 55346.84
124317 13 Huafa Group 8.00 2019-6-5 99.23 94.31 100.00 94.28 64866.08
124318 13 Binzhou Urban Investment 11.00 2020-7-12 0.00 100.00 0.00 0.00 8918.00
12431913 Changji Prefecture State-owned Assets
15.00 2019-6-3 103.00 95.00 103.00 90.17 103157.46
124321 13 Yueyang Urban Investment 18.00 2020-7-12 0.00 100.00 0.00 0.00 925.00
12432213 Nanchang County Urban Development
12.00 2019-7-17 100.00 94.60 100.00 90.55 73726.79

Bond Market
2014 Fact Book 201
Code Short NameIssue size (RMB100 million)
Date of Maturity
Opening (RMB)
Closing (RMB)
High(RMB)
Low(RMB)
Turnover value(RMB 10,000)
124323 13 Xintian Pollution Control 15.00 2020-7-17 102.00 96.99 103.00 88.00 65103.88
124324 13 Baiyin Urban 13.00 2020-7-19 100.40 94.88 100.40 90.06 151093.96
124325 13 Beijing Biomedical 6.00 2020-7-23 0.00 100.00 0.00 0.00 987.00
12432613 Zhengzhou Public Housing Construction Investment
7.00 2020-7-17 0.00 100.00 0.00 0.00 3939.00
124327 13 China Power Investment 20.00 2023-7-22 103.00 103.00 103.00 103.00 2.06
12432912 Hui'an County State-owned Assets Investment
8.00 2019-10-15 103.23 106.45 106.45 103.23 3980.21
124330 13 Longyan Industry and Trade 8.00 2021-3-11 0.00 100.00 0.00 0.00 0.00
124332 13 Xiangtan Zhenxiang 18.00 2020-8-7 100.30 97.00 100.70 90.83 73666.07
12433313 Tongshan Urban Construction
16.00 2020-8-8 0.00 100.00 0.00 0.00 38152.00
12433413 Boertala State-owned Assets Investment
9.00 2020-8-9 100.20 93.88 102.99 92.60 46594.67
12433513 Haidian State-owned Capital
16.00 2020-8-7 100.00 100.00 101.00 97.50 8100.20
124336 13 Chongqing Real Estate 18.00 2020-8-22 100.00 103.00 103.00 98.80 23008.81
12433713 Tonglin Construction Investment
15.00 2020-8-26 0.00 100.00 0.00 0.00 0.00
12433813 Minbei Economic Development
18.00 2020-8-6 100.80 98.94 103.00 93.85 174264.71
12433913 Chongqing Urban Investment
22.00 2020-5-21 0.00 100.00 0.00 0.00 0.00
12434013 Zhangjiagang Free Trade Zone Zhangbao Industrial Bond
11.00 2020-8-23 0.00 100.00 0.00 0.00 3999.20
12434113 Turpan Region State-owned Asset
8.00 2019-8-9 0.00 100.00 0.00 0.00 9887.00
12434213 Qiannan State-owned Capital
15.00 2020-9-4 101.00 97.90 101.00 95.50 186173.19
124343 13 Yangjiang Bond 10.00 2020-9-9 101.00 95.55 101.00 92.42 13541.43
124344 13 Shanghai Nanfang 4.00 2019-9-9 104.00 104.00 104.00 104.00 12000.80
124345 13 Beijing Jingmei Bond 14.00 2020-9-9 0.00 100.00 0.00 0.00 109993.00

Bond Market
2014 Fact Book 202
Code Short NameIssue size (RMB100 million)
Date of Maturity
Opening (RMB)
Closing (RMB)
High(RMB)
Low(RMB)
Turnover value(RMB 10,000)
12434613 Rushan City State-owned Assets
13.00 2020-9-11 100.00 100.49 100.50 99.99 14236.32
12434713 Shijiazhuang Construction Investment
5.00 2020-9-9 100.00 100.00 100.00 100.00 9455.00
124348 13 Beijing Jingu 6.00 2020-9-6 0.00 100.00 0.00 0.00 11025.30
124349 13 Jiangsu Furudonghai 10.00 2020-9-13 0.00 100.00 0.00 0.00 29609.00
124350 13 Shanxi Coal Transportation 25.00 2023-1-28 100.00 103.00 103.00 100.00 4620.31
124351 13 Kezhou Bond 9.00 2020-9-16 100.10 94.99 100.29 93.00 30969.75
124352 13 Pingliang Bond 10.00 2020-9-17 90.20 105.00 105.00 90.20 5545.31
124353 13 Shangluo 01 10.00 2020-9-9 0.00 100.00 0.00 0.00 13510.00
124354 13 Shangluo 02 5.00 2019-9-9 0.00 100.00 0.00 0.00 30993.00
124355 13 Dawa Urban Investment 13.00 2020-9-17 103.00 100.30 104.80 94.00 29158.63
124356 13 Zhuhai Huihua 15.00 2020-9-17 100.58 96.60 100.77 95.01 3146.51
124357 13 Tianjin Estate Development 7.00 2020-8-6 97.75 97.00 100.00 96.77 10933.09
124358 13 Bengfu Urban Investment 16.00 2020-9-11 0.00 100.00 0.00 0.00 31956.00
124359 13 Sanming Investment 18.00 2020-3-5 0.00 100.00 0.00 0.00 0.00
124360 13 Cheng’a Bond 8.00 2020-9-12 100.01 99.88 100.50 97.00 49011.99
124361 13 Beijing Future Science Park 11.00 2019-9-22 0.00 100.00 0.00 0.00 14854.00
124362 13 Qinzhou Binhai 9.00 2020-8-27 0.00 100.00 0.00 0.00 0.00
12436313 Zhengzhou Development Investment
18.00 2020-9-24 99.36 104.00 104.00 99.00 13100.11
12436413 Yaodu Construction and Development
15.00 2020-9-27 102.00 99.50 102.00 90.49 132007.30
124365 13 Changrun Bond 6.00 2020-9-16 0.00 100.00 0.00 0.00 10001.00
124366 13 HSBC Investment 10.00 2020-10-11 100.29 99.00 100.78 99.00 107001.56
12436713 Wuxi Municipal Development
15.00 2020-10-11 104.30 100.00 110.00 100.00 55864.53

Bond Market
2014 Fact Book 203
Code Short NameIssue size (RMB100 million)
Date of Maturity
Opening (RMB)
Closing (RMB)
High(RMB)
Low(RMB)
Turnover value(RMB 10,000)
12436813 Zhengzhou Traffic Investment
18.00 2020-10-14 0.00 100.00 0.00 0.00 2837.00
12436913 Wuzhong City Urban Investment
10.00 2020-10-12 101.79 105.23 105.23 101.79 0.31
12437013 Shangyu Hangzhou Bay New District
18.00 2020-10-11 97.50 98.00 104.00 96.50 9209.21
124372 09 Haicang Investment Bond 6.00 2016-4-30 99.62 100.20 100.20 99.62 10951.70
124373 13 Pingtianhu 10.00 2020-10-23 100.40 95.98 100.40 92.50 68320.79
12437413 Tuscaloosa Area State-owned Assets
15.00 2019-10-16 0.00 100.00 0.00 0.00 24254.00
12437513 Hubei Asset Management company of supply and markteting
6.00 2019-10-10 0.00 100.00 0.00 0.00 3000.00
12437613 Chongqing Western Area Modern Logistics
15.00 2020-10-18 97.00 97.00 97.00 97.00 4883.39
124377 13 Chongqing Beicheng 9.00 2020-10-16 100.00 98.67 100.00 98.00 41166.50
124378 13 Xiangtan Jiuhua 18.00 2020-10-15 99.50 99.50 99.50 98.50 18589.50
124379 13 Xuchang Investment 12.00 2020-10-16 100.00 100.20 100.20 100.00 3966.00
124380 13 Caofeidian 20.00 2020-10-15 97.70 97.56 99.50 92.20 9801.59
12438109 Hengyang Urban Construction Investment
15.00 2016-11-16 101.00 101.00 101.00 101.00 0.10
12438210 Yunnan Construction Engineering
8.00 2016-11-19 0.00 100.00 0.00 0.00 0.00
124383 10 New Century Tourist Group 5.00 2016-11-18 0.00 100.00 0.00 0.00 0.00
12438413 Ya’an Development Investment
15.00 2020-9-13 0.00 100.00 0.00 0.00 0.00
124385 13 Longyan City Huijin Assets 11.00 2020-10-18 0.00 100.00 0.00 0.00 19900.00
124386 13 Xinyi Urban Bond 15.00 2020-10-15 99.85 97.23 102.99 97.23 5503.06
12438713Zhanjiang Infrastructure Construction Investment
12.00 2020-10-21 0.00 100.00 0.00 0.00 0.00
12438813 Rencheng Rongxin Development
6.00 2020-10-18 97.50 100.00 100.50 97.50 16034.66
124389 13 Ziyang Water 18.00 2020-10-21 106.00 99.00 106.00 98.50 6089.59

Bond Market
2014 Fact Book 204
Code Short NameIssue size (RMB100 million)
Date of Maturity
Opening (RMB)
Closing (RMB)
High(RMB)
Low(RMB)
Turnover value(RMB 10,000)
124390 13 Huludao Investment 01 14.00 2020-10-18 101.64 104.16 104.16 101.64 10025.21
124391 13 Huludao Investment 02 4.00 2023-10-18 99.87 99.73 101.00 99.73 8009.00
124392 13 Jingmen Investment 16.00 2020-10-17 99.89 99.50 105.00 99.50 14541.51
124393 13 Dalian Shunxing 12.00 2020-10-18 100.50 96.52 100.50 90.45 57468.92
124394 13 Yongzhou Urban Investment 10.00 2020-10-23 105.00 102.00 105.00 100.00 26078.51
12439513 Shiyan City Infrastructure Investment
16.00 2020-10-11 104.00 104.00 104.00 104.00 37911.08
12439613 Jiangyan Urban Construction Investment Development
8.00 2020-9-3 100.00 93.79 100.00 93.37 19425.74
12439713 Pi County State-owned Assets Investment
10.00 2020-10-15 106.50 107.99 107.99 106.50 16881.32
12439813 Zhuzhou Urban Construction Development
20.00 2020-10-16 105.50 96.45 105.50 90.00 45219.45
124399 13 Chenzhou High-tech 18.00 2020-10-21 100.00 99.50 103.16 99.50 13139.20
124400 13 Chongqing Shuangfu 12.00 2020-10-23 102.40 99.00 102.40 98.00 15492.93
12440113 Hebei Broadcast and Television Information Network
3.00 2021-10-23 0.00 100.00 0.00 0.00 0.00
124402 13 Danyang Investment 01 8.00 2020-10-23 99.83 98.10 99.83 98.00 6098.88
124403 13 Danyang Investment 02 8.00 2019-10-23 0.00 100.00 0.00 0.00 0.00
124404 13 Huaihua Industrial Park 12.00 2020-10-29 106.00 100.00 106.00 98.00 26984.43
12440513 Baoxing Industry and Trade Bond
10.00 2020-10-17 104.00 104.00 104.00 104.00 32539.08
12440613 Jingzhou Economic Technology Development
4.00 2020-12-9 0.00 100.00 0.00 0.00 0.00
124407 13 Taizhou Bond 18.00 2023-10-16 100.00 100.20 100.20 100.00 9995.00
12440813 Nanyang Investment Group Investment
18.00 2020-10-24 98.20 99.50 99.50 98.20 2997.20
12440913 Suqian Urban Construction Investment Investment
10.00 2020-10-29 0.00 100.00 0.00 0.00 0.00
124410 13State Grid 03 50.00 2020-10-23 0.00 100.00 0.00 0.00 0.00

Bond Market
2014 Fact Book 205
Code Short NameIssue size (RMB100 million)
Date of Maturity
Opening (RMB)
Closing (RMB)
High(RMB)
Low(RMB)
Turnover value(RMB 10,000)
124411 13 State Grid 04 50.00 2028-10-23 0.00 100.00 0.00 0.00 0.00
124412 13 Jinliyuan 10.00 2020-10-28 109.00 99.00 109.00 99.00 0.21
12441313 Shouguang Urban Investment
4.80 2020-10-18 0.00 100.00 0.00 0.00 6888.00
12441513 Hubei Provincial Communications Investment 01
5.00 2023-10-28 0.00 100.00 0.00 0.00 0.00
12441613 Hubei Provincial Communications Investment 02
25.00 2028-10-28 0.00 100.00 0.00 0.00 0.00
124417 13 Jiangmen High-tech 9.50 2020-11-4 109.00 100.00 109.00 100.00 3000.11
12441813 Yongli Industrial Group Bond
5.00 2019-10-29 0.00 100.00 0.00 0.00 0.00
12441913 Ulanqab Investment and Development
20.00 2020-10-31 0.00 100.00 0.00 0.00 0.00
124420 13 Haiyan State-owned Assets 12.00 2020-9-4 0.00 100.00 0.00 0.00 0.00
12442113 Haining Jianshan New District Development
13.00 2020-11-4 0.00 100.00 0.00 0.00 0.00
12442213Shanghai Chenj ia Town Construction Development Bond
8.00 2019-11-6 100.00 99.99 109.00 99.99 3601.14
12442313Yixing Industrial Park for Environmental Science&Technology
10.00 2020-10-18 0.00 100.00 0.00 0.00 0.00
12442413Liuzhou Dongcheng Investment and Development
10.00 2020-10-29 0.00 100.00 0.00 0.00 26000.00
12442513 Shenyang Heping District State-owned Assets Management
13.00 2020-11-5 97.50 97.50 97.50 97.50 46097.14
124426 13 Jiangyin Lingang New City 6.50 2020-11-7 95.60 100.00 100.00 95.60 1.06
12442713Bayannaoer Linhe District Urban Development Bond
10.00 2020-11-13 100.00 100.00 100.00 100.00 2948.10
12442813Guangdong Yueken Investment Bond
13.00 2019-11-15 0.00 100.00 0.00 0.00 0.00
12442913 Tinghu District Public Assets Investment and Management
10.00 2020-11-15 100.00 100.00 100.00 100.00 9479.50
12443113 Pulandian Urban Construction Investment 01
8.00 2020-11-19 105.00 105.00 105.00 105.00 4000.11
12443213Xiangyang Construction Investment Management
15.00 2020-11-11 0.00 100.00 0.00 0.00 8956.00
124433 12 Shanghai Minhang 16.00 2019-10-23 0.00 100.00 0.00 0.00 0.00

Bond Market
2014 Fact Book 206
Code Short NameIssue size (RMB100 million)
Date of Maturity
Opening (RMB)
Closing (RMB)
High(RMB)
Low(RMB)
Turnover value(RMB 10,000)
12443513Handan City Construction and Investment
18.00 2020-11-25 110.00 100.00 110.00 100.00 12117.47
124437 13Tianjin Jinghai 12.00 2020-11-26 105.00 105.00 105.00 105.00 0.11
12443913 Liuan Urban Construction Investment 01
6.00 2020-12-2 0.00 100.00 0.00 0.00 0.00
12444113 Kuche City Construction Investment 01
5.00 2020-12-9 103.00 102.50 103.00 100.00 33551.01
12445113Puyang Urban Construction Investment Investment
5.00 2020-12-11 0.00 100.00 0.00 0.00 0.00
124999 13Wuhan Metro Group Bond 23.00 2018-10-29 100.00 100.00 100.00 100.00 149000.00
125000 12 Suzhou Coating Glass 0.50 2014-6-8 100.00 100.01 100.04 100.00 19001.00
125001 12 Biam New Mateials 0.20 2013-12-11 99.57 99.61 100.00 99.61 1199.00
125002 12 Jiangning Water 2.00 2014-6-11 98.86 100.00 100.00 100.00 15100.00
125003 12 Qianjiang Fourth Bridge 1.00 2014-6-11 99.92 100.00 100.00 100.00 5000.00
125004 12 Xinning Water Supply 1.00 2014-6-12 100.00 100.00 100.38 99.91 16604.00
125005 12 Tongjie Technology 1.00 2015-6-12 96.14 96.47 100.00 96.47 13389.00
12500612 Fundant Advanced Metal Technologies
1.00 2015-6-12 100.01 100.00 100.20 100.00 23611.00
125007 12 Tianfang Sci&Tech 1.00 2015-6-12 100.01 100.00 100.04 99.95 22000.00
125008 12 Xinli Media 1.00 2014-6-18 99.99 100.00 100.00 100.00 7000.00
125009 12 Taizilong 1.00 2015-6-19 100.00 100.00 100.04 99.42 23197.00
125010 12 Dafeng Port 1.00 2013-6-27 100.00 100.00 0.00 0.00 0.00
125011 12 UBC Precision Bearing 0.25 2014-6-29 100.00 100.00 100.00 100.00 1500.00
125012 12 Jintai 01 0.15 2015-7-10 100.00 97.04 97.04 97.04 631.00
125013 12 Jintai 02 0.15 2015-7-10 100.00 100.00 0.00 0.00 0.00
125014 12 Xizi Trust 1.00 2014-7-13 100.00 100.00 0.00 0.00 0.00
125015 12 Tianwai 2.00 2015-7-18 100.00 100.00 100.47 99.45 37300.00

Bond Market
2014 Fact Book 207
Code Short NameIssue size (RMB100 million)
Date of Maturity
Opening (RMB)
Closing (RMB)
High(RMB)
Low(RMB)
Turnover value(RMB 10,000)
125016 12 Jiangnan 0.50 2014-7-20 100.16 100.00 100.00 99.34 7493.00
125017 12 Chiway Education 0.50 2014-8-1 100.00 100.00 0.00 0.00 0.00
125018 13 Yuhong Road 2.00 2016-3-18 100.00 100.00 100.02 100.00 15000.00
125019 12 Ningbo Green Energy 2.00 2014-8-10 100.00 99.64 100.00 99.64 52215.00
125020 12 Wujin Broadcasting 2.00 2015-8-15 100.00 98.45 100.15 98.45 10833.00
125021 12 Tongli Tourism 1.00 2014-8-6 100.00 101.00 101.00 99.24 16301.00
125022 12 Wuzhou Transformer 0.80 2015-8-2 99.98 100.00 100.00 99.31 12149.00
125023 12 Yarun 0.30 2014-8-28 100.00 100.00 0.00 0.00 0.00
125024 12 Xingmei 2.00 2015-8-28 100.00 100.00 100.03 100.00 36000.00
125025 12 Caohu Bond 1.50 2014-8-29 100.02 100.02 100.40 99.79 21514.00
125026 12 Kinghawk Pharmaceutical 0.20 2014-9-14 100.00 101.00 101.00 100.00 1202.00
125027 12 Yancheng Construction 2.00 2015-9-21 99.93 98.50 100.04 97.19 47205.00
12502812 Jiangsu T.Y. Environmental Energy 01
1.40 2015-9-27 98.81 100.00 100.00 100.00 17800.00
125029 12 Ruguzhuang 1.00 2015-10-10 100.00 100.03 104.51 98.73 35681.00
125030 12 Xitang Town Tourism 1.00 2015-10-10 100.00 100.02 103.00 100.00 20120.00
125031 12 Caohu 02 0.50 2014-8-29 100.00 99.88 99.88 99.88 499.00
125032 12 Hangzhou E.V. Automobile 2.00 2014-10-15 99.31 100.00 100.00 99.65 30479.00
125033 12 Jinfeng Investment 2.00 2015-10-16 100.00 102.00 102.00 99.98 41317.00
12503412 Dadongwu Group Steel Structure
2.00 2014-10-22 99.72 90.00 100.76 90.00 40830.00
125035 12 Huzhou Shangyue 0.70 2015-10-18 99.71 100.00 100.50 99.05 14176.00
125036 12 Jiangsu Dongsheng Water 0.60 2014-11-6 99.95 100.00 100.53 100.00 11629.00
125037 12 Hua’anda 0.20 2014-11-9 100.00 100.00 0.00 0.00 0.00
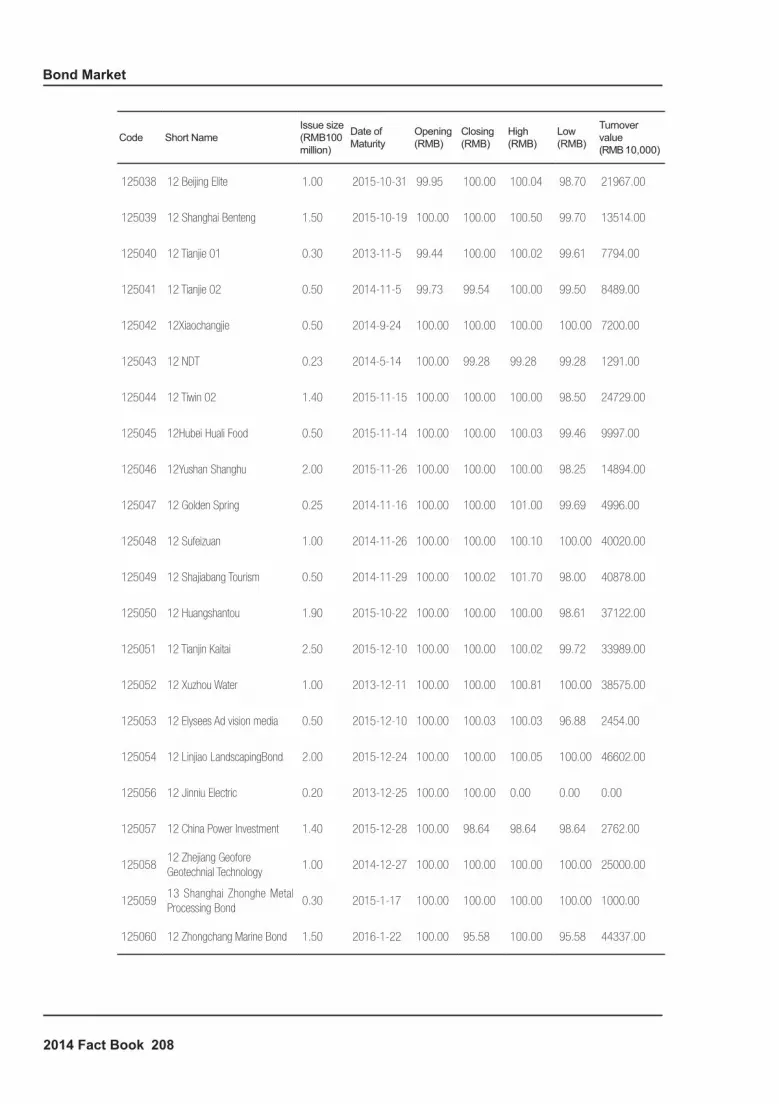
Bond Market
2014 Fact Book 208
Code Short NameIssue size (RMB100 million)
Date of Maturity
Opening (RMB)
Closing (RMB)
High(RMB)
Low(RMB)
Turnover value(RMB 10,000)
125038 12 Beijing Elite 1.00 2015-10-31 99.95 100.00 100.04 98.70 21967.00
125039 12 Shanghai Benteng 1.50 2015-10-19 100.00 100.00 100.50 99.70 13514.00
125040 12 Tianjie 01 0.30 2013-11-5 99.44 100.00 100.02 99.61 7794.00
125041 12 Tianjie 02 0.50 2014-11-5 99.73 99.54 100.00 99.50 8489.00
125042 12Xiaochangjie 0.50 2014-9-24 100.00 100.00 100.00 100.00 7200.00
125043 12 NDT 0.23 2014-5-14 100.00 99.28 99.28 99.28 1291.00
125044 12 Tiwin 02 1.40 2015-11-15 100.00 100.00 100.00 98.50 24729.00
125045 12Hubei Huali Food 0.50 2015-11-14 100.00 100.00 100.03 99.46 9997.00
125046 12Yushan Shanghu 2.00 2015-11-26 100.00 100.00 100.00 98.25 14894.00
125047 12 Golden Spring 0.25 2014-11-16 100.00 100.00 101.00 99.69 4996.00
125048 12 Sufeizuan 1.00 2014-11-26 100.00 100.00 100.10 100.00 40020.00
125049 12 Shajiabang Tourism 0.50 2014-11-29 100.00 100.02 101.70 98.00 40878.00
125050 12 Huangshantou 1.90 2015-10-22 100.00 100.00 100.00 98.61 37122.00
125051 12 Tianjin Kaitai 2.50 2015-12-10 100.00 100.00 100.02 99.72 33989.00
125052 12 Xuzhou Water 1.00 2013-12-11 100.00 100.00 100.81 100.00 38575.00
125053 12 Elysees Ad vision media 0.50 2015-12-10 100.00 100.03 100.03 96.88 2454.00
125054 12 Linjiao LandscapingBond 2.00 2015-12-24 100.00 100.00 100.05 100.00 46602.00
125056 12 Jinniu Electric 0.20 2013-12-25 100.00 100.00 0.00 0.00 0.00
125057 12 China Power Investment 1.40 2015-12-28 100.00 98.64 98.64 98.64 2762.00
12505812 Zhejiang Geofore Geotechnial Technology
1.00 2014-12-27 100.00 100.00 100.00 100.00 25000.00
12505913 Shanghai Zhonghe Metal Processing Bond
0.30 2015-1-17 100.00 100.00 100.00 100.00 1000.00
125060 12 Zhongchang Marine Bond 1.50 2016-1-22 100.00 95.58 100.00 95.58 44337.00

Bond Market
2014 Fact Book 209
Code Short NameIssue size (RMB100 million)
Date of Maturity
Opening (RMB)
Closing (RMB)
High(RMB)
Low(RMB)
Turnover value(RMB 10,000)
125061 12 Suqian Jintian 01 0.50 2016-1-18 100.00 100.50 100.50 99.74 10012.00
125062 13 Jiangning Logistics 2.00 2016-1-23 100.00 100.01 104.51 99.98 34251.00
125063 12 Yizheng Water 2.00 2016-1-17 100.00 102.00 102.00 99.74 31425.00
125064 12 Shanghai Sanhang 1.00 2016-1-28 100.00 100.00 100.00 99.90 8298.00
125065 12 Tianjin Tianlian 0.50 2015-1-29 100.00 100.00 0.00 0.00 0.00
125066 12 Zhejiang Huasite 0.60 2015-1-23 100.00 99.86 100.04 99.86 8796.00
125067 13 Yangzhou Weiheng Bond 1.50 2015-1-21 100.00 100.00 104.51 99.21 25506.00
12506813 Shandong Borun Industrial 01
3.50 2016-1-29 100.00 100.03 102.00 99.48 96666.00
125069 13 Rui’an Water01 1.50 2016-1-28 100.00 102.00 102.00 98.69 9486.00
12507012 Jiangsu Dafeng Harbor Bond
2.00 2015-1-22 100.00 100.00 0.00 0.00 0.00
125071 13 Shandong Best Precision 0.30 2016-1-31 100.00 100.00 100.00 100.00 6900.00
125072 12 Wuhan Nanhua 01 0.50 2015-12-10 100.00 100.00 100.00 100.00 9000.00
125073 12 Jangsu Zaolinwan Industrial 2.00 2016-2-6 100.00 100.00 102.00 99.36 16024.00
125074 12 Zhejiang Vibration Control 0.50 2015-2-4 100.00 100.00 100.00 100.00 4200.00
125075 13 China NT Pharma 3.00 2016-2-1 100.00 100.03 100.03 100.00 49002.00
12507612 Huzhou treasure shell Cashmere Products
2.00 2016-1-31 100.00 100.00 101.11 99.79 44527.00
125077 13 Guangzhou Cable 1.00 2015-2-27 100.00 100.00 0.00 0.00 0.00
125078 12 Jiangsu Dagang 01 2.00 2016-2-26 100.00 100.00 103.00 100.00 19620.00
125079 13 Rayspower 1.00 2015-2-27 100.00 100.00 100.00 100.00 6000.00
125080 13 Jiangsu Suyuan 01 0.50 2015-2-5 100.00 99.79 99.79 99.70 11473.00
125081 12 Jiutai Thermal Bond 2.00 2015-2-27 100.00 100.24 102.00 99.63 39933.00
12508213 Neptune offshore Engineering Development 01
0.15 2015-1-9 100.00 100.00 0.00 0.00 0.00

Bond Market
2014 Fact Book 210
Code Short NameIssue size (RMB100 million)
Date of Maturity
Opening (RMB)
Closing (RMB)
High(RMB)
Low(RMB)
Turnover value(RMB 10,000)
12508312 Zhejiang Pujiang Bailian Chemical
0.80 2016-2-26 100.00 100.00 0.00 0.00 0.00
12508412 Zhejiang Anji Xiuzhu Greening Engeering
2.50 2016-3-7 100.00 96.00 100.84 96.00 48928.00
12508513 Jiangsu Donghai Hongwei Quartz Produc
0.20 2014-3-1 100.00 100.00 0.00 0.00 0.00
125086 13 Jiangsu Tianshan Cemen 0.08 2014-3-1 100.00 100.00 0.00 0.00 0.00
12508713 Lian Yun Gang Tao Sheng Rong
0.13 2014-3-1 100.00 100.00 0.00 0.00 0.00
12508813 Shandong Zhongwen Industry Group
2.00 2016-3-12 100.00 100.03 102.90 99.99 26089.00
12508912 China National Complete Plant Import & Export
0.60 2016-3-22 100.00 100.00 100.00 99.21 4984.00
12509012 Jiangxin Gangqu Pollution Control
1.80 2016-3-25 100.00 100.00 100.00 100.00 11000.00
12509113 BrightGene Bio-Medical Technology
0.60 2016-3-21 100.00 100.00 0.00 0.00 0.00
125092 13 Dawn Communications 2.00 2016-3-26 100.00 100.00 100.00 100.00 10000.00
125093 13 Nantong Chemical 0.63 2016-3-25 100.00 100.00 100.00 99.49 2992.00
125094 13 Tianzheng Infrastructure 2.00 2016-3-21 100.00 100.10 100.10 99.81 15388.00
125095 12 Suqian Jintian 02 0.50 2016-3-12 100.00 100.00 100.12 98.00 5971.00
12509612 Beijing Qingyang Lihua Petrochemical
2.00 2016-4-22 100.00 100.00 0.00 0.00 0.00
125097 13 Anhui McKinnon 2.00 2016-4-22 100.00 100.00 0.00 0.00 0.00
125098 12 Yichang Sanxia Airport 1.00 2015-12-20 100.00 100.00 100.00 100.00 18000.00
12509913 Xuzhou Sentong ho novel Plate
1.80 2016-3-28 100.00 99.43 103.00 99.43 24273.00
12510013 Taizhou Newsummit Biopharma
0.30 2015-3-28 100.00 100.00 0.00 0.00 0.00
125101 13 Shangyu Zhenneng 1.26 2015-4-3 100.00 100.00 0.00 0.00 0.00
125102 13 Yangpu Scientific Innovation 1.20 2016-3-29 100.00 99.83 99.89 99.77 11984.00
12510313 Shanghai Palfin Mobile Control
0.15 2016-3-29 100.00 100.00 100.00 99.78 2997.00
125104 13Jiangsu Suyuan 02 0.50 2015-3-22 100.00 100.00 0.00 0.00 0.00

Bond Market
2014 Fact Book 211
Code Short NameIssue size (RMB100 million)
Date of Maturity
Opening (RMB)
Closing (RMB)
High(RMB)
Low(RMB)
Turnover value(RMB 10,000)
12510513 Shanghai Fuzhan Lighting Technology
0.15 2016-3-29 100.00 100.00 100.00 99.78 2997.00
125106 13 Borun 02 1.50 2016-4-17 100.00 100.00 102.90 98.90 15428.00
125107 13 Dahong Bond 3.00 2016-4-19 100.00 100.00 104.00 98.50 56313.00
125108 13 Songhelou 1.00 2015-4-10 100.00 100.02 100.02 100.00 4000.00
125109 13 Jiangsu Yudi 0.30 2015-4-2 100.00 100.86 100.86 100.86 3026.00
125110 13 Shandong Runfeng 1.50 2016-4-24 100.00 96.00 100.01 96.00 13378.00
125111 13 Weihai Lanxing 1.20 2015-5-8 100.00 100.00 100.00 100.00 6200.00
125112 13 Shandong Tianbao 1.00 2016-5-9 100.00 100.00 100.00 100.00 100.00
12511313 Shan Dong Boruige Bio-Source Products
0.80 2016-4-17 100.00 100.00 0.00 0.00 0.00
125114 12 Inner Mongolia Hengda 2.00 2016-4-18 100.00 102.00 102.00 98.52 17010.00
12511513 Zhongxiang City Hongda Industrial Development
1.00 2015-5-15 100.00 101.09 101.09 101.09 708.00
125116 13 Rugao Transport Services 2.50 2016-4-24 100.00 100.00 100.02 100.00 6500.00
125117 13Zhanwang Pharma 1.00 2016-5-23 100.00 100.00 103.00 99.65 10050.00
12511813 Tianjin Sunrise Science And Trade
2.00 2015-5-23 100.00 100.00 100.00 98.70 4790.00
125119 13 Zhenjiang Tourism 5.00 2015-5-23 100.00 100.00 100.96 98.51 139958.00
125120 13 Guangxi Beibu Gulf 01 1.50 2016-5-23 100.00 100.00 0.00 0.00 0.00
125121 13 Huai’an Logistics 3.00 2016-5-28 100.00 100.03 104.51 99.93 47030.00
125122 13 Zhejiang Tianzihu 2.50 2016-5-28 100.00 104.50 105.00 97.66 34093.00
125123 13 Rui’an Water 02 0.50 2016-5-27 100.00 104.00 104.00 100.00 5040.00
125124 13 CAC 02 0.37 2016-6-3 100.00 100.00 100.00 99.68 1197.00
125125 13 Anhui Huaihe Chemical 0.80 2016-5-30 100.00 100.00 100.02 100.00 3200.00
125126 13 Linyi Pharma 2.00 2016-5-27 100.00 100.00 100.02 99.66 32970.00

Bond Market
2014 Fact Book 212
Code Short NameIssue size (RMB100 million)
Date of Maturity
Opening (RMB)
Closing (RMB)
High(RMB)
Low(RMB)
Turnover value(RMB 10,000)
125127 13 Kaidi Electronical Bond 3.00 2016-6-27 100.00 100.00 0.00 0.00 0.00
125128 13 Tianlong Water 0.80 2015-6-19 100.00 100.10 100.10 99.99 3600.00
12512912 Shanghai mechanical & electronical
1.60 2015-6-18 100.00 100.00 0.00 0.00 0.00
125130 13 Beijing Bluesky 0.20 2016-6-19 100.00 100.00 0.00 0.00 0.00
125131 12 Dagang 02 2.00 2016-6-6 100.00 100.00 103.00 99.21 21883.00
125133 13 Wadu 01 0.50 2016-6-28 100.00 100.00 0.00 0.00 0.00
125134 13 Xinsanyin Printing& Dyeing 0.10 2016-6-28 100.00 100.00 100.00 100.00 1000.00
125135 13 Zhenjiang Sopo 0.50 2015-7-10 100.00 103.00 103.00 100.00 4045.00
125136 13 Linyi Pharma02 1.00 2016-7-17 100.00 100.00 0.00 0.00 0.00
125137 13 Shou County Agriculture 01 1.40 2016-8-1 100.00 100.00 103.00 100.00 26090.00
12513813 Nanjing Chemical &Industrial
2.00 2015-7-19 100.00 100.00 0.00 0.00 0.00
12513913 Guangzhou Agricultural Development
2.50 2016-8-12 100.00 100.02 104.00 100.00 50037.00
125140 13 Huangshantou 2.50 2016-8-28 100.00 100.01 100.01 100.00 10000.00
125141 13 Donglin 0.50 2016-8-28 100.00 100.00 0.00 0.00 0.00
125142 13 Chongqing Road 01 1.75 2016-8-29 100.00 100.00 105.03 99.85 50421.00
125143 13 Senhe Gardening 1.00 2015-8-23 100.00 100.00 0.00 0.00 0.00
125144 13 Beiding 01 0.50 2016-9-4 100.00 100.00 0.00 0.00 0.00
125145 13 Wise Welding 0.40 2016-9-5 100.00 100.00 0.00 0.00 0.00
125146 13 Zhejiang Yongli 3.00 2016-9-4 100.00 100.00 0.00 0.00 0.00
125147 13 Bright High Technology 0.94 2016-9-11 100.00 100.00 0.00 0.00 0.00
125148 13 Yaotang 01 0.50 2016-9-17 100.00 100.00 100.00 100.00 7500.00
125149 13 Beiding 02 1.50 2016-10-8 100.00 100.00 0.00 0.00 0.00

Bond Market
2014 Fact Book 213
Code Short NameIssue size (RMB100 million)
Date of Maturity
Opening (RMB)
Closing (RMB)
High(RMB)
Low(RMB)
Turnover value(RMB 10,000)
125150 13 Shenzhen SME Group 3.50 2015-9-26 100.00 100.00 0.00 0.00 0.00
125151 13 Longxin 5.00 2016-9-10 100.00 100.00 0.00 0.00 0.00
125152 13 Nantong Chenxi Welding 1.00 2016-9-24 100.00 100.00 0.00 0.00 0.00
125153 13 ZhichengBond 0.35 2016-10-31 100.00 100.00 0.00 0.00 0.00
125154 13 Huaiyin Water 01 1.10 2016-10-15 100.00 100.00 0.00 0.00 0.00
125155 13 Rongfeng 01 1.00 2016-10-10 100.00 104.00 104.00 100.00 9780.00
125156 13 Turing Bond 0.05 2014-10-15 100.00 100.00 0.00 0.00 0.00
125158 13 ADG Scaffolding 0.30 2016-10-15 100.00 100.00 0.00 0.00 0.00
125159 13 Wadou 02 0.50 2016-10-18 100.00 100.00 0.00 0.00 0.00
125160 13 Zhenjiang Travel 02 5.00 2016-10-22 100.00 98.77 98.77 98.77 9877.00
125161 13 Chongqing Shengsha 3.00 2016-10-23 100.00 100.00 103.01 100.00 23060.00
125162 13 Rongfeng 02 0.80 2016-10-24 100.00 100.00 0.00 0.00 0.00
125163 13 Yangcheng Bond 3.00 2016-5-29 100.00 100.00 0.00 0.00 0.00
125164 13 Taifeng Mining Bond 2.50 2016-10-16 100.00 100.00 0.00 0.00 0.00
125165 13 Jurong Fudi 01 1.25 2016-10-24 100.00 105.00 105.01 100.00 16240.00
12516613 Hai’an Radio & Television Broadcast Information
1.00 2015-10-30 100.00 100.00 0.00 0.00 0.00
125169 13 Huai’an Soft 01 1.15 2016-11-28 100.00 104.50 104.50 100.00 4090.00
125170 13 Tianjin No.6 Municipal 2.00 2016-11-15 100.00 100.00 0.00 0.00 0.00
125171 13 Gaoxin Bond 2.00 2016-11-14 100.00 100.00 0.00 0.00 0.00
125172 13 Junan Hongrun 1.00 2015-11-6 100.00 100.00 0.00 0.00 0.00
125175 13 Jiangsu Hengrui Medicine 1.50 2016-11-28 100.00 100.00 0.00 0.00 0.00
125176 13 Fujian Sanming Fangzhi 1.00 2016-12-5 100.00 100.00 0.00 0.00 0.00

Bond Market
2014 Fact Book 214
Code Short NameIssue size (RMB100 million)
Date of Maturity
Opening (RMB)
Closing (RMB)
High(RMB)
Low(RMB)
Turnover value(RMB 10,000)
126003 07 Yunnan Yuntianhua Bond 10.00 2013-1-29 99.65 99.94 99.98 99.61 23359.74
12600607 Shenzhen Expressway Bond
15.00 2013-10-9 97.50 99.83 99.83 89.53 24406.23
126007 07 Rizhao Bond 8.80 2013-11-27 97.08 99.94 99.95 91.62 19849.79
126008 08 SAIC Motor Bond 63.00 2013-12-19 96.75 99.93 99.96 96.61 466274.94
126009 08 Ganyue Bond 12.00 2014-1-28 96.20 99.59 99.70 93.03 35534.76
126010 08 COSCO Bond 10.50 2014-1-28 96.10 99.56 99.59 89.54 95037.06
126011 08 Sinopec Bond 300.00 2014-2-20 95.96 99.41 99.45 95.90 2720626.09
126013 08 Tsingtao Beer Bond 15.00 2014-4-2 95.10 98.68 99.59 95.10 176227.20
126014 08 GD Power Bond 39.95 2014-5-7 94.80 98.20 98.20 89.03 116352.50
12601508 Kangmei Pharmaceutical Bond
9.00 2014-5-8 94.02 97.94 98.60 94.01 105795.68
126016 08 Bao Steel Bond 100.00 2014-6-19 95.00 97.43 98.00 94.70 666606.57
126017 08 Gezhouba Bond 13.90 2014-6-25 94.00 97.27 98.50 86.51 168532.62
126018 08 Jiangxi CopperBond 68.00 2016-9-22 86.55 87.15 90.14 86.38 794795.28
126019 09 Changhong 30.00 2015-7-30 89.00 90.94 99.02 88.90 301943.07

Bond Market
2014 Fact Book 215
Monthly Bond Repo Turnover in 2013
Month Trading Value (RMB 10,000) Trading Volume (10,000 lots)
01 378820964.10 378820.97
02 284916764.07 284916.82
03 423357718.35 423357.78
04 373290896.85 373290.93
05 518461614.30 518461.62
06 460068043.31 460293.49
07 651780938.50 651785.27
08 625875096.52 625877.00
09 516907102.95 516912.17
10 516669682.50 516669.68
11 640533273.13 640537.20
12 714587216.14 714595.03
Turnover of Government Bond in Each Month of 2013
Month Turnover Value (RMB 10,000) Turnover Volume (10,000 lots)
01 716317.86 710.94
02 610653.37 605.82
03 683662.66 677.11
04 759307.10 749.13
05 578586.26 569.49
06 685420.41 677.88
07 787680.26 784.40
08 438496.74 438.92
09 506715.91 508.78
10 413664.76 418.35
11 622403.29 636.01
12 913104.18 926.09
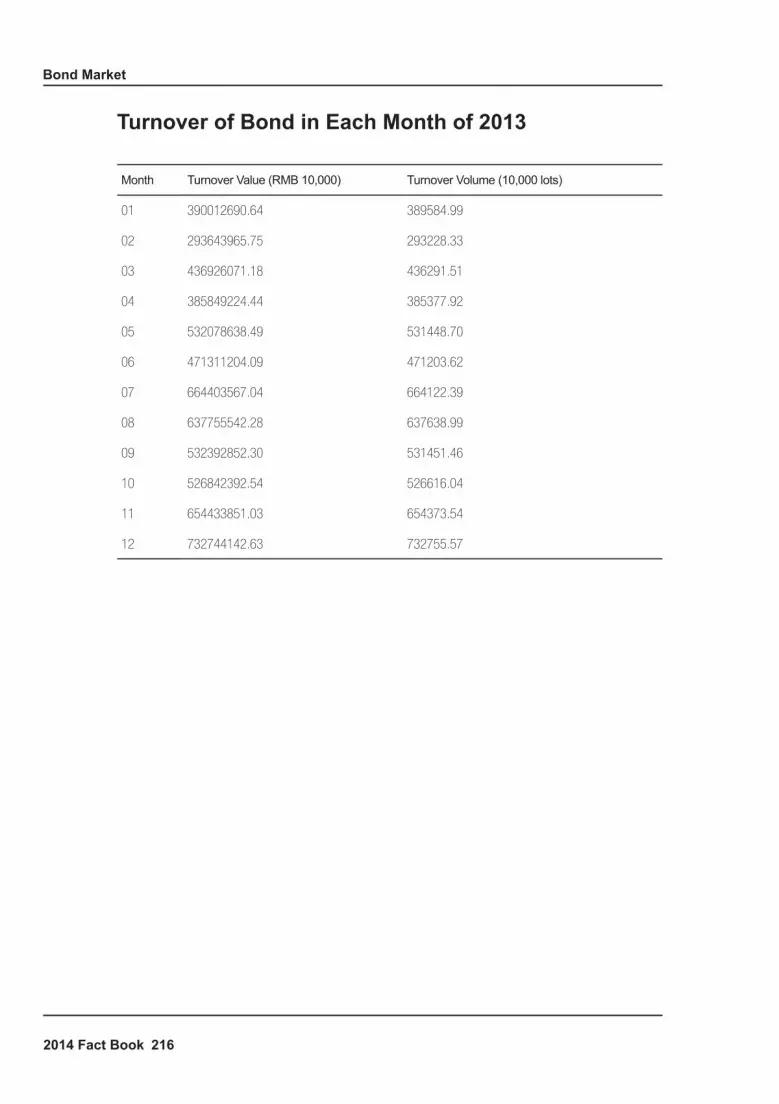
Bond Market
2014 Fact Book 216
Turnover of Bond in Each Month of 2013
Month Turnover Value (RMB 10,000) Turnover Volume (10,000 lots)
01 390012690.64 389584.99
02 293643965.75 293228.33
03 436926071.18 436291.51
04 385849224.44 385377.92
05 532078638.49 531448.70
06 471311204.09 471203.62
07 664403567.04 664122.39
08 637755542.28 637638.99
09 532392852.30 531451.46
10 526842392.54 526616.04
11 654433851.03 654373.54
12 732744142.63 732755.57

Bond Market
2014 Fact Book 217
List of Convertible Corporate Bonds (CCB) Openly Issued by Listed Companies in 2013
Name of Stock Minsheng Bank Tunnel Engineering China Ping An Shen Zhen Gas
Code of Stock 600016 600820 601318 601139
Abbr. for Subscription of CCB Minsheng Bank Tunnel Engineering China Ping An Shen Zhen Gas
Code for Subscription of CCB 733016 733820 783318 783139
Region Beijing Shanghai Guangdong Guangdong
Issuance Scale (RMB 100m) 200.00 26.00 260.00 16.00
Issuance Volume ( 10K lots) 2000 260 2600 160
Quotation for Subscription (RMB/ stock) 100 100 100 100
Issuance MethodPriority Placement, Online Pricing and Offline Placement
Priority Placement, Online Pricing and Offline Placement
Priority Placement, Online Pricing and Offline Placement
Priority Placement, Online Pricing and Offline Placement
Issuance Date ( T day)/ Value Date 2013/3/15 2013/9/13 2013/11/22 2013/12/13
Maturity (Year) 6 6 6 6
Maturity Date (M/D) 2019/3/15 2019/9/13 2019/11/22 2019/12/13
Listing Code 110023 110024 113005 113006
Abbr. for Listing Minsheng BankConvertible Bond
Tunnel EngineeringConvertible Bond
China Ping AnConvertible Bond
Shen Zhen GasConvertible Bond
Listing Date (L Day) 2013-3-29 2013-9-30 2013-12-9 2013-12-27
(Commencing Date for CCB) 2013-9-16 2014-3-14 2014-5-23 2014-6-14
Initial price for CCB 10.2300 9.7100 41.3300 8.4600


Funds


Funds
2014 Fact Book 221
Funds
Overview of the Fund Market in 2013
In 2013, SSE carried forward the development and innovations of the fund market following the established
development strategies, whose goal was to develop an exchange connecting hundreds of industries and a fund market
of global influence. To realize this goal, SSE adopted measures in six aspects, including expanding product chains,
developing market sectors, recreating liquidity, optimizing operation mechanisms, reorganizing sales channels and
segmenting investor groups.
Breakthroughs in Market Innovation
1. A corresponding setup for Exchange fund was basically established with the launch of five innovative products.
The five innovative products are Money Market ETFs, Subscription-Redemption Money Market Funds, Bond ETFs,
Sector-based ETFs and Gold ETFs. The introduction of Gold ETFs, Subscription-Redemption Money Market Funds and
Bond ETFs enriched the variety of listed funds in the fund market to a large extent. The vertical development of Sector-
based ETFs provided diverse configuration tools for the fund market. In addition, the launch of NASDAQ 100 ETFs and
S&P 500 ETFs realized the internationalization of cross-border ETFs, bringing SSE closer to its goal of developing a fund
market of global influence.
2. Earnings of fund holders were improved remarkably with a newly opened-up market.
The pledge-style repo market for ETFs was launched successfully, injecting new vitality into the fund market. Since its
launch in March, 2013, the pledge-style repo market has been operating smoothly, with its trading volume of repo this
year reaching 54.3 billion RMB, which meets investors’ cash management demands well.
3. Market liquidity was improved obviously through innovating trading mechanisms.
The day trading mechanism for Bond ETFs, Gold ETFs and Money ETFs was in good operation since its launch. Market
making was further promoted and implemented, with 16 security companies, including CITIC Securities Co., Ltd. and
Haitong Securities Co., Ltd., providing market making service for 21 ETFs, such as 300 ETF and 50 ETF.
4. Innovative business models for Exchange traded fund products were established.
The business models for and technology standards of innovative Exchange fund products were set up, whose
achievements won wide social acknowledgement. The business models for products such as Gold ETFs, Bond ETFs,
Money Market ETFs and Subscription-Redemption Money Market Funds were largely adopted by the fund industry. Gold
ETFs, Money Market Funds, Treasury Bond ETFs were awarded with the first, second and third prizes of 2013 Annual
Financial Innovation Award respectively.

Funds
2014 Fact Book 222
List of Innovative Fund Products
Category Code Short Name
Size of Net Value (in 100 million RMB)
Level of Net Value (in RMB)
Daily Turnover Value(in 100 million RMB)
ETF
Money ETF511990 Huabao Tianyi 52.80 100.05 73.35
511880 Yinhua Rili 6.12 103.17 3.46
Bond ETF
511010Treasury Bond ETF
8.91 96.29 2.70
511210Corporate Bond ETF
16.91 98.89 0.01
Gold ETF518800 Guotai Gold 0.41 2.38 0.11
518880 Gold ETF 2.43 2.38 0.10
Cross-border ETF
510900 H share ETF 1.22 0.99 0.00
513100NASDAQ Index ETF
0.59 1.16 0.01
513500 S&P 500 6.43 1.01 Not Listed
Subscription-Redemption Money Funds
519898 Xianjin Bao A 26.34 0.01 5.42
519888 Tianfu Kuaixian 87.40 0.01 29.56
519800 Margin A 6.17 0.01 0.52
519858 Gf Bao A 59.42 0.01 14.87
By the end of 2013
Record Highs in Market Size and Trading Volume
Business innovations injected new vitality into SSE’s fund market, leading to record highs in market size and trading
volume, as showed in the figure below.
By the end of 2013, there were 291 listed funds in SSE, an increase of 104.9% from 2012. Of the 291 funds, 49
funds were ETFs, an increase of 20 or 68.97%, and 7 funds were Subscription-Redemption Money Market Funds,
all newly added in 2013. 224 funds have been listed in SSE Open-end Fund Trading System, an increase of 121 or
117.48% from 2012.
By the end of 2013, the total market value of SSE’s fund market reached 368.7 billion RMB, an increase of 32.67%.
The total market value of ETFs reached 102.6 billion RMB, an increase of 33.2 billion RMB or 47.84% compared to
2012. The total market value of SSE Open-end Fund Trading System reached 220.5 billion RMB, an increase of 36.7
billion RMB or 19.96% compared to 2012.
The total trading volume of SSE’s fund market in 2013 reached 1997.5 billion RMB, an increase of 1679.2 billion RMB

Funds
2014 Fact Book 223
or 527.55% from 2012. The total trading volume of ETFs reached 875.7 billion RMB, an increase of 573.1 billion
RMB or 189.39% from 2012. The total trading volume of newly listed Subscription-Redemption Money Funds reached
1044.3 billion RMB.
Operation Mechanisms’ Optimization and Market Risks’ Prevention
SSE formulated the Management Measures on Safe Operation of Funds to clarify standards for fund operations and
ensure safe fund operations. It also promoted the development of fund information disclosure platform and electronic
office system for all fund business to have a better understanding of relevant demands.
SSE optimized the redemption mechanism of ETF by allowing ETFs to use shares subscribed or bought by investors to
meet the redemption demands of the same day, which effectively prevents redemption failures caused by the shortage
of constituent stocks inventory. It also improved the monitoring index of financing to buy and made announcements to
the public, which corrected the situation in which financing to buy ETF is easy to be suspended and more risks of margin
trading and short selling are prevented.
More Efforts on Market Promotion and Fund Investment Knowledge Dissemination
SSE organized a series of SSE ETF Financial Planner Training to improve trainees’ capabilities in ETF business. Thanks
to these activities, thousands of professional ETF investment consultants have been cultivated, covering more than 330
Quantity Market Value(in 100 million RMB)
Trading Value(in 100 million RMB)
ETF
Stock ETF 42 937 5342
Security ETF 2 26 1332
Gold ETF 2 4 33
Money ETF 2 59 2050
Subtotal 49 1026 8757
Subscription-Redemption Money Market Fund
7 213 10443
ETF Repo 2 —— 543
Closed-end Fund 9 243 232
SSE Open-end Fund Trading System 224 2205 ——
Total 291 3687 19975
By the end of 2013
Overview of SSE’Fund Market

Funds
2014 Fact Book 224
business departments of about 50 members. SSE also worked together with the Media, including Morning Post and
National Business Daily, to set up the column of SSE ETF Investment Class, a long-term media platform which could
effectively disseminate relevant knowledge and promote ETF. SSE published ETF Investment: from Laymen to Masters,
providing practical and reliable references for ETF training, publicity and promotion. By the end of 2013, the number of
SSE ETF holders had grown remarkably by 50% compared to 2012.

Funds
2014 Fact Book 225
Summary of Funds in 2013
Code Short Name
Size of Issuance(10,000 units)
High(RMB)
Low(RMB)
Opening(RMB)
Closing(RMB)
Change(%)
Turnover Volume(10,000 units)
Turnover Value(RMB10,000)
500002 Taihe Fund 200000 1.377 0.906 0.942 1.275 35.49 188154.67 211908.89
500003 Anxin Fund 200000 1.020 0.894 0.904 1.019 13.22 58904.42 57896.19
500005 Hansheng Fund 200000 1.263 0.980 0.997 1.181 23.12 135630.26 154952.60
500006 Yuyang Fund 200000 0.876 0.795 0.811 0.853 6.09 69417.24 58519.39
500008 Xinghua Fund 200000 0.968 0.877 0.891 0.946 6.89 54513.99 50782.44
500009 Anshun Fund 300000 1.114 0.897 0.916 1.097 20.15 226122.95 231943.46
500011 Jinxin Fund 300000 1.408 0.876 0.900 1.266 41.77 440001.48 511904.18
500015 Hanxing Fund 300000 0.943 0.768 0.815 0.922 13.97 194911.50 171327.62
500018 Xinghe Fund 300000 0.957 0.790 0.830 0.904 9.18 173605.78 154407.23
500038 Tongqian Fund 200000 1.000 0.792 0.859 0.938 9.96 229600.01 208589.54
500056 Kerui Fund 300000 0.950 0.743 0.760 0.906 19.68 281839.13 240155.40
500058 Yinfeng Fund 300000 0.772 0.635 0.675 0.743 10.40 374640.16 266235.58
510010 Governance ETF 354952.44 0.768 0.541 0.686 0.630 -7.49 147947.31 100957.53
510020 Chaoda ETF 49324.80 2.158 1.401 1.945 1.529 -21.35 19077.63 34304.22
510030 Value ETF 36502.87 2.889 1.972 2.543 2.290 -9.34 148500.37 353742.56
510050 50ETF 1274056.68 2.090 1.440 1.880 1.571 -12.40 10459534.69 18129442.51
510060 SOEs ETF 52295.92 1.250 0.899 1.171 1.010 -13.30 30268.44 32735.45
510070Private Enterprises ETF
24612.41 1.257 0.898 0.898 1.124 13.77 27117.28 30842.55
510090 Liability ETF 41358.11 0.998 0.691 0.852 0.791 -9.70 2992.06 2631.95
510110 Cycle ETF 10951.68 2.665 1.792 2.375 2.010 -13.59 6711.74 14922.73
510120 Non-cycle ETF 10949.24 1.974 1.530 1.707 1.816 6.57 5500.72 9815.79
510130 Mid-caps ETF 32068.51 2.490 1.924 2.278 2.335 3.59 41276.73 95383.11
510150 Consumption ETF 41073.16 3.000 2.250 2.400 2.688 12.42 9613.08 24597.53
510160 Well-off ETF 72005.74 0.373 0.269 0.346 0.309 -10.69 197388.80 63616.92
510170 Commodity ETF 26172.87 2.360 1.420 2.224 1.445 -34.62 159423.52 307049.14
510180 180ETF 627055.77 2.020 0.443 0.561 2.019 271.06 9899516.60 5373847.35
510190 Longtou ETF 25765.08 2.495 1.851 2.409 2.035 -12.96 3431.52 7569.96
510210Composite Index ETF
12813.85 2.548 1.908 2.384 2.225 -6.75 2445.01 5619.41
510220Small-medium ETF
2922.92 2.900 2.158 2.350 2.670 11.39 2702.55 6875.94
510230 Finance ETF 41826.16 4.069 2.711 3.430 3.180 -6.11 216162.77 731687.33

Funds
2014 Fact Book 226
Code Short Name
Size of Issuance(10,000 units)
High(RMB)
Low(RMB)
Opening(RMB)
Closing(RMB)
Change(%)
Turnover Volume(10,000 units)
Turnover Value(RMB10,000)
510260 Emerging ETF 65448.27 0.830 0.615 0.654 0.772 18.04 53423.64 40283.75
510270 SOEs ETF 9183.21 0.830 0.571 0.764 0.648 -15.18 10173.14 7323.96
510280 Growth ETF 33775.44 1.135 0.809 1.000 0.911 -9.17 16905.77 16925.27
510290 380ETF 16644.89 1.022 0.711 0.798 0.916 13.79 32570.80 29313.06
510300 300ETF 621318.77 2.787 2.040 2.554 2.376 -5.86 9299724.23 23080540.28
510310 HS300ETF 101809.58 1.045 0.815 1.017 0.925 0.00 355132.22 343463.00
510330 Huaxia 300 792834.98 2.847 2.046 2.583 2.363 0.00 715505.55 1738177.65
510410 Resource ETF 33125.84 0.948 0.579 0.905 0.588 -34.08 46611.70 35357.20
510420 180EWETF 12745.55 1.083 0.811 1.002 0.970 -3.00 55832.69 56827.47
510430 50Equal Weight 6692.45 1.243 0.857 1.150 0.942 -16.86 35717.59 38702.79
510440 500 Shanghai 3805.83 1.340 0.936 1.023 1.171 14.47 16778.50 18667.66
510450 180 High ETF 32492.07 1.182 1.000 1.005 1.045 0.00 58324.36 60987.49
510500 500ETF 414609.38 1.160 0.838 0.967 1.071 0.00 253718.16 255110.99
510510 Gf 500 10503.83 1.151 0.843 1.051 1.075 0.00 99538.25 105396.28
510610 Resource Industry 23858.69 1.000 0.751 0.967 0.783 0.00 227551.88 195338.38
510620 Material Industry 19496.67 0.994 0.725 0.977 0.842 0.00 90172.62 83431.47
510630Consumption Industry
16959.04 1.247 0.912 1.002 1.076 0.00 215926.60 228392.10
510650 Finance Industry 41795.25 1.069 0.797 1.007 0.916 0.00 513222.99 489574.21
510660Pharmaceutical Industry
71287.97 1.141 0.911 1.014 1.070 0.00 745911.64 791523.62
510680 Wanjia 380 50072.47 1.007 0.927 0.981 0.959 0.00 35916.04 35340.77
510700 Top100 ETF 6821.37 1.875 1.462 1.869 1.686 0.00 46394.58 82743.20
510880 Dividend ETF 67717.57 2.200 1.524 1.902 1.741 -8.37 132648.14 250175.11
510900 H share ETF 14902.19 1.128 0.807 1.090 0.987 -6.80 33993.91 34389.38
511010Treasury Bond ETF
1380.63 100.680 95.110 99.500 96.278 0.00 133386.38 13141481.63
511210Corporate Bond ETF
2056.90 99.590 91.000 98.400 98.244 0.00 1799.06 177734.66
511880 Yinhua Rili 203.20 103.960 100.001 100.152 103.173 0.00 12411.69 1267566.87
511990 Huabao Tianyi 2114.85 100.098 90.010 100.003 100.046 0.00 192359.36 19236573.40
512010Pharmaceuticla ETF
52117.37 0.970 0.840 0.970 0.956 0.00 30190.97 28557.97
513100NASDAQ Index ETF
5062.21 1.187 0.930 0.990 1.163 0.00 42461.78 43703.82
518800 Guotai Gold 1661.99 2.925 2.343 2.630 2.378 0.00 18861.06 47581.04
518880 Gold ETF 13774.08 2.837 2.342 2.633 2.376 0.00 108364.88 282512.23

Members


Members
2014 Fact Book 229
Members and Non-member Institutions
Overview of Members
By the end of 2013, SSE had 111 members, the same as that in 2012, 5970 member business departments, 684
more than that in 2012, and 5363 trading seats held by both member and non-member institutions. 9417 trading units
were opened, an increase of 1039 from 2012.
Registered capital
36 members had registered capital of less than 1 billion RMB, 33 members had registered capital of between 1
billion and 2 billion RMB, 19 members had registered capital of between 2 billion and 3 billion RMB, 9 members had
registered capital of between 3 billion and 5 billion RMB and 14 members over 5 billion RMB.
Listing
19 members are listed, 11 of them on SSE.
Overview of Non-member Institutions
Non-member institutions include fund management companies, insurance companies, insurance capital management
companies, and listed commercial banks which conduct business of SSE. As of the end of 2013, there were 87 such
fund management companies, 30 insurance companies, 12 insurance capital management companies, and 16 listed
commercial banks.
Member's Required Qualifications
a. a securities firm possessed with a legal position that is approved by CSRC to be established by law;
b. enjoy high creditability and outstanding business performance;
c. organization framework and business executives qualified by CSRC and the Exchange and the firm's precaution
measures against technical risks that meet the requirements of the Exchange;
d. accept the constitution and business rules of the Exchange and pay member's fee, seat fees and other fees as
required;
e. other qualifications specified by the Exchange.
A securities firm submits its application to the Exchange, which will accept it as one of its members upon the approval by
its board of governors.
The Administration of Member Seats and Trading Units
As is specified in the Member Administration Rules of the Shanghai Stock Exchange, a member shall maintain at
least one seat with the Exchange and commence securities trading after obtaining the seat via the trading unit of the
Exchange. There is a fixed cap on the number of seats and no more seats will be available. Member candidates may
obtain seats transferred from existing members. Obtained seats may not be returned to the Exchange. The Exchange
Members
2014 Fact Book 230
may set, adjust and limit the portfolio, means and scale of trading conducted by members.
Overview of the Operation
In 2013, SSE focused on the innovative development of member business, the establishment of innovative monitoring
mechanism of business risks, the improvement of service for members and the enhancement of members’ self-
regulation. Details includes: First, SSE launched the business of pledge-style repo of stock and pilot programs of
securities refinancing, continued to expand the coverage of securities margin trading and the range of underlying
securities, and supported institutions from different industries to participate in its innovative business and self innovation.
Second, SSE paid due attention to the risk control of innovative business, kept improving the effectiveness of its
supervision, and compiled risk monitoring reports for margin trading and short selling and pledge-style repo of stocks in
order to strike a balance between business innovations and compliance and risk control. Third, SSE made great efforts
to improve its comprehensive service capacity. To actually help its members improve their operation, innovation and risk
control, SSE collected and analyzed their opinions and suggestions in categories and gave feedback in time. Fourth, SSE
strengthened the members’ self-regulation with a focus on risk caution board, key account management, securities and
other non-stock trade categories and innovative business.

Members
2014 Fact Book 231
Geographical Distribution of SSE Members and Their Business Branches in 2013
Region NumberOf Members
Numberof Business Branches
Turnover Value(RMB 1 million)
Percentage(%)
Anhui 2 165 1324331.66 0.81
Beijing 19 287 25605766.90 15.58
Fujian 3 256 5700673.69 3.47
Gansu 1 66 352454.54 0.21
Guangdong 22 769 33206594.49 20.20
Guangxi 1 101 1458286.67 0.89
Guizhou 1 54 446443.72 0.27
Hainan 2 40 691703.94 0.42
Hebei 1 175 1176041.88 0.72
Henan 1 170 1447470.63 0.88
Heilongjiang 1 122 2423927.01 1.47
Hubei 2 204 3907837.07 2.38
Hunan 3 209 1986432.79 1.21
Jilin 2 104 831640.02 0.51
Jiangsu 6 445 9044901.93 5.50
Jiangxi 2 124 2183701.48 1.33
Liaoning 3 228 3009701.56 1.83
Inner Mongolia 2 66 662623.30 0.40
Ningxia 0 24 87316.47 0.05
Qinghai 1 16 63523.60 0.04
Shandong 2 315 3816818.25 2.32
Shanxi 2 130 790809.87 0.48
Shaanxi 3 140 1237054.88 0.75
Shanghai 16 501 44329096.22 26.97
Sichuan 4 242 3657529.71 2.23
Tianjin 1 108 1863059.81 1.13
Tibet 1 6 19393.19 0.01
Xinjiang 1 62 688762.83 0.42
Yunnan 2 101 1282929.78 0.78
Zhejiang 3 436 9635176.21 5.86
Chongqing 1 119 1431094.69 0.87

Members
2014 Fact Book 232
Membership (1990-2013)
Year Membership
1990 25
1991 29
1992 171
1993 481
1994 550
1995 553
1996 523
1997 467
1998 317
1999 309
2000 305
2001 255
2002 199
2003 171
2004 161
2005 152
2006 152
2007 142
2008 109
2009 107
2010 106
2011 112
2012 112
2013 111

Members
2014 Fact Book 233
Top 50 Members by Turnover in 2013
Rank Name Total Turnover(RMB 1 million)
Equity (RMB 1 million)
T-bond Spot (RMB 1 million)
T-bond Repo (RMB 1 million)
1 Guotai Junan Securities Co., Ltd. 10950838.26 2345146.09 14978.90 7109673.60
2 Citic Securities Co., Ltd. 9844697.83 1720917.40 18673.69 7639098.50
3 Haitong Securities Co., Ltd. 9668753.91 2202496.45 31842.97 6274785.20
4 Guosen Securities Co., Ltd. 8708142.32 1697661.40 3545.16 5705767.10
5 Shenyin & Wanguo Securities Co. Ltd. 8493466.55 2074285.96 3882.96 6164012.70
6 China Galaxy Securities Co., Ltd. 7980344.65 2356058.60 2196.26 4697151.80
7 China Securities Co., Ltd. 7377223.15 1558116.83 5148.69 4648760.80
8 Huatai Securities Co., Ltd. 7165854.05 2695637.00 1204.38 4141910.70
9 China Merchants Securities Co., Ltd. 6721023.74 1951610.53 5821.10 4590813.70
10 Gf Securities Co., Ltd. 6322683.28 1779443.91 3101.87 3936550.10
11 China International Capital Co., Ltd. 4902563.61 415547.46 12536.14 4256583.70
12 Orient Securities Co., Ltd. 3737871.58 695023.21 2650.15 2893806.10
13 Everbright Securities Co., Ltd. 3705037.78 1422995.73 729.50 2067764.40
14 Changjiang Securities Co., Ltd. 3518081.01 772030.80 825.89 2643467.70
15 Orient Securities Co., Ltd. 3419406.41 544183.40 3943.12 2726874.60
16 Essence Securities Co., Ltd. 3296356.97 1022073.12 1073.79 2205009.30
17 Industrial Securities Co., Ltd. 3078414.06 756886.93 1162.24 2241421.70
18 Shandong Qilu Securities Co., Ltd. 2515780.84 1046797.23 1000.18 1309075.70
19 Beijing Gaohua Securities Co., Ltd. 2402644.07 145371.25 1146.38 2244998.20
20 China Investment Securities Co., Ltd. 2348724.78 1060828.50 741.67 1245178.70
21 Hong Yuan Securities Co., Ltd. 2108265.40 663235.39 324.03 1387130.40
22 CITIC-Kington Securities Co., Ltd. 1806740.10 901940.16 41.92 831262.80
23 Founder Securities Co., Ltd. 1766228.79 821698.03 225.98 696717.20
24 Guangzhou Securities Co., Ltd. 1504522.18 179703.23 167.01 1252253.80
25 Sinolink Securities Co., Ltd. 1369949.77 312691.79 470.19 1031878.10

Members
2014 Fact Book 234
Rank Name Total Turnover(RMB 1 million)
Equity (RMB 1 million)
T-bond Spot (RMB 1 million)
T-bond Repo (RMB 1 million)
26 Southwest Securities Co., Ltd. 1323901.16 354398.64 1110.25 928852.70
27 Great Wall Securities Co., Ltd. 1304881.83 369883.21 810.19 908596.80
28 BOC International (China) Ltd. 1298930.86 401754.03 2089.45 837129.10
29 Soochow Securities Co., Ltd. 1284015.91 403713.04 208.86 693864.20
30 Shanghai Securities Co., Ltd. 1261089.98 376755.80 374.70 830520.10
31 Bohai Securities Co., Ltd. 1145422.83 245346.86 232.06 872633.80
32 Guoyuan Securities Co., Ltd. 1142113.98 514947.28 317.88 572368.90
33 Xiangcai Securities Co., Ltd. 1111703.04 330879.12 211.95 721419.40
34 Caitong Securities Brokerage Co., Ltd. 1094686.06 493234.47 1403.45 564685.10
35 Dongxing Securities Co., Ltd. 1011255.67 494110.74 183.80 484764.50
36 Minsheng Securities Co., Ltd. 970445.94 287717.16 440.91 653429.80
37 Guolian Securities Co., Ltd. 915313.75 247274.39 31.38 653721.10
38 West China Securities Co., Ltd. 899598.00 459685.39 109.75 425008.40
39 Northeast Securities Co ., Ltd. 866231.67 317477.26 161.32 533985.80
40 First Capital Securities Co., Ltd. 831471.87 122159.66 200.16 669332.70
41 Cinda Securities Co., Ltd. 829481.70 387615.01 178.39 426867.80
42 Zhejiang Merchants Securities Co., Ltd. 828001.81 489390.04 13.98 328962.50
43 Yingda Securities Co., Ltd. 818461.06 152672.65 573.87 648649.60
44 GF Huafu Securities Co., Ltd. 753140.70 340508.27 317.63 401994.40
45 Hongta Securities Co., Ltd. 721318.60 90862.43 172.23 622270.80
46 Daton Securities Co., Ltd. 692951.38 153833.47 39.04 528851.50
47 Sealand Securities Co., Ltd. 690575.76 286312.32 177.42 389173.90
48 Dongguan Securities Co., Ltd. 679289.60 280084.84 176.11 361444.00
49 China Minzu Securities Co., Ltd. 657278.91 299416.37 59.25 351531.50
50 Hengtai Securities Co., Ltd. 636999.13 179185.30 11.73 435271.40

Members
2014 Fact Book 235
Top 50 Members by Registered Capital in 2013
Rank Name Registered Capital (RMB10,000)
1 Citic Securities Co., Ltd. 1111690
2 Haitong Securities Co., Ltd. 958472
3 China Securities Finance Co., Ltd 750000
4 China Development Bank Securities Co., Ltd 737000
5 Guosen Securities Co., Ltd. 700000
5 Shenyin & Wanguo Securities Co. Ltd. 671576
7 Founder Securities Co., Ltd. 610000
8 Guotai Junan Securities Co., Ltd. 610000
9 China Securities Co., Ltd. 610000
10 China Galaxy Securities Co., Ltd. 600000
11 Gf Securities Co., Ltd. 591929
12 Huatai Securities Co., Ltd. 560000
13 Ping An Securities Co., Ltd. 550000
14 Shandong Qilu Securities Co., Ltd. 521224
15 China Jianyin Investment Securities Co., Ltd 500000
16 China Merchants Securities Co., Ltd. 466109
17 China Minzu Securities Co., Ltd. 448655
18 Orient Securities Co., Ltd. 428174
19 Bohai Securities Co., Ltd. 403719
20 Everbright Securities Co., Ltd. 341800
21 Essence Securities Co., Ltd. 319999
22 Xiangcai Securities Co., Ltd. 319725
23 Huarong Securities Co., Ltd. 317754
24 Goldstate Securities Co., Ltd. 317434
25 Zhejiang Merchants Securities Co., Ltd. 300000
26 Huaan Securities Co., Ltd. 282100

Members
2014 Fact Book 236
Rank Name Registered Capital (RMB10,000)
27 Guodu Securities Co., Ltd. 262298
28 Shanghai Securities Co., Ltd. 261000
29 Cinda Securities Co., Ltd. 256870
30 Shanxi Securities Co., Ltd. 239980
30 Changjiang Securities Co., Ltd. 237123
32 Southwest Securities Co., Ltd. 232255
33 Daton Securities Co.,Ltd. 220000
34 Yingda Securities Co.,Ltd. 220000
35 Industrial Securities Co., Ltd. 220000
36 Hengtai Securities Co., Ltd. 219470
37 Minsheng Securities Co., Ltd 217731
38 China Dragon Securities Co., Ltd. 215339
39 Fortune Securities Co., Ltd. 213573
40 Great Wall Securities Co., Ltd. 206700
41 Hongta Securities Co., Ltd. 205765
42 Central China Securities Co., Ltd. 203352
43 Dongxing Securities Co., Ltd 200400
44 Soochow Securities Co., Ltd. 200000
45 Wanlian Securities Co., Ltd. 200000
45 Hong Yuan Securities Co., Ltd. 198620
45 Avic Securities Co., Ltd. 198522
45 Guangzhou Securities Co., Ltd. 197776
45 First Capital Securities Co., Ltd 197000
50 Guoyuan Securities Co., Ltd 196410

Members
2014 Fact Book 237
Top Lead Underwriters of IPOs in 2013 (by Number of Deals Underwritten)
Rank Sequence Number of Lead Underwriter
Name ofLead Underwriter
Numberof Deals Underwritten
1 66 China International Capital Corporation Ltd. 1
Top Lead Underwriters of Rights Issues in 2013 (by Value of Fund Raised)
Rank Sequence Number of Lead Underwriter
Name ofLead Underwriter Value Underwritten
1 66 Citic Securities Co., Ltd. 0
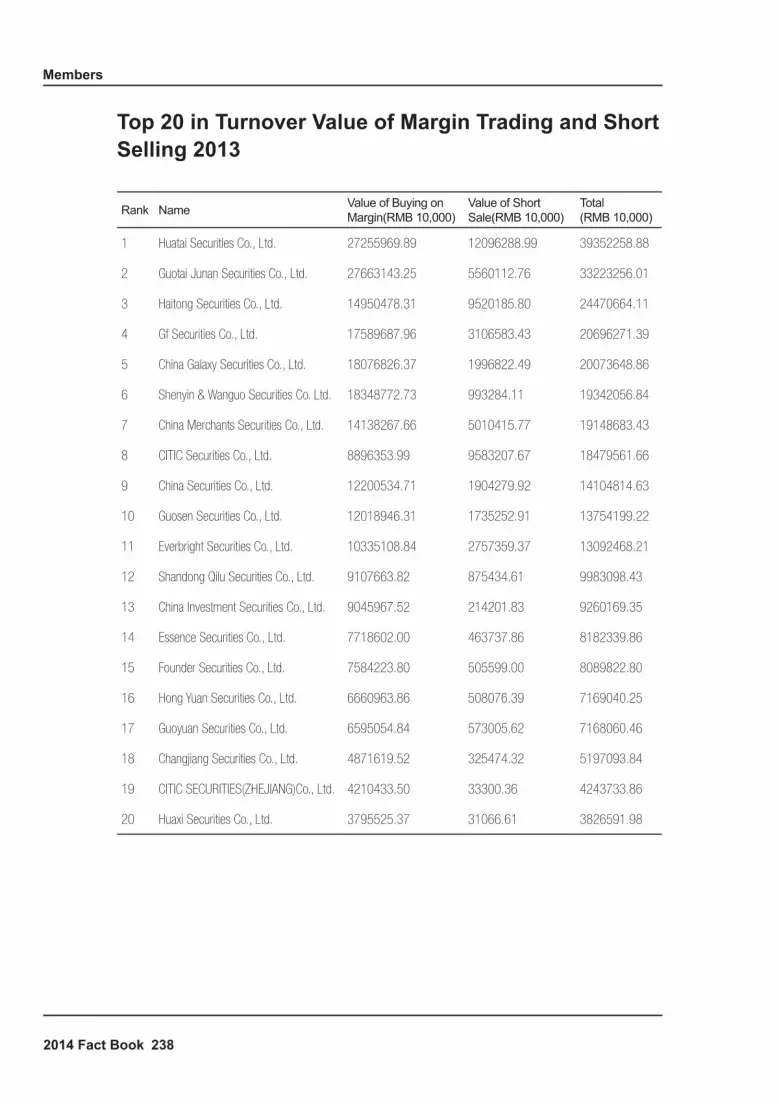
Members
2014 Fact Book 238
Top 20 in Turnover Value of Margin Trading and Short Selling 2013
Rank Name Value of Buying on Margin(RMB 10,000)
Value of Short Sale(RMB 10,000)
Total(RMB 10,000)
1 Huatai Securities Co., Ltd. 27255969.89 12096288.99 39352258.88
2 Guotai Junan Securities Co., Ltd. 27663143.25 5560112.76 33223256.01
3 Haitong Securities Co., Ltd. 14950478.31 9520185.80 24470664.11
4 Gf Securities Co., Ltd. 17589687.96 3106583.43 20696271.39
5 China Galaxy Securities Co., Ltd. 18076826.37 1996822.49 20073648.86
6 Shenyin & Wanguo Securities Co. Ltd. 18348772.73 993284.11 19342056.84
7 China Merchants Securities Co., Ltd. 14138267.66 5010415.77 19148683.43
8 CITIC Securities Co., Ltd. 8896353.99 9583207.67 18479561.66
9 China Securities Co., Ltd. 12200534.71 1904279.92 14104814.63
10 Guosen Securities Co., Ltd. 12018946.31 1735252.91 13754199.22
11 Everbright Securities Co., Ltd. 10335108.84 2757359.37 13092468.21
12 Shandong Qilu Securities Co., Ltd. 9107663.82 875434.61 9983098.43
13 China Investment Securities Co., Ltd. 9045967.52 214201.83 9260169.35
14 Essence Securities Co., Ltd. 7718602.00 463737.86 8182339.86
15 Founder Securities Co., Ltd. 7584223.80 505599.00 8089822.80
16 Hong Yuan Securities Co., Ltd. 6660963.86 508076.39 7169040.25
17 Guoyuan Securities Co., Ltd. 6595054.84 573005.62 7168060.46
18 Changjiang Securities Co., Ltd. 4871619.52 325474.32 5197093.84
19 CITIC SECURITIES(ZHEJIANG)Co., Ltd. 4210433.50 33300.36 4243733.86
20 Huaxi Securities Co., Ltd. 3795525.37 31066.61 3826591.98

Members
2014 Fact Book 239
Top 20 in Amount Outstanding of Margin Trading and Short Selling 2013
Rank NameValue of Buying on Margin(RMB 10,000)
Value of Short Sale(RMB 10,000)
Total(RMB 10,000)
1 Guotai Junan Securities Co., Ltd. 1630786.33 23660.05 1654446.38
2 CITIC Securities Co., Ltd. 1629376.20 24011.36 1653387.56
3 Haitong Securities Co., Ltd. 1468096.66 22457.25 1490553.91
4 Gf Securities Co., Ltd. 1306732.71 14723.32 1321456.02
5 China Merchants Securities Co., Ltd. 1286209.14 19919.51 1306128.66
6 Huatai Securities Co., Ltd. 1249417.11 17342.65 1266759.77
7 China Galaxy Securities Co., Ltd. 1191466.17 9361.62 1200827.80
8 Guosen Securities Co., Ltd. 1023039.62 9785.14 1032824.76
9 Shenyin & Wanguo Securities Co. Ltd. 1006513.69 3740.15 1010253.84
10 China Securities Co., Ltd. 976593.00 9457.36 986050.36
11 Everbright Securities Co., Ltd. 793211.11 12553.49 805764.60
12 Essence Securities Co., Ltd. 577079.34 3847.67 580927.01
13 CITIC SECURITIES(ZHEJIANG)Co., Ltd. 517085.80 0.00 517085.80
14 Founder Securities Co., Ltd. 487030.66 2412.51 489443.16
15 Shandong Qilu Securities Co., Ltd 464458.71 6095.59 470554.30
16 China Investment Securities Co., Ltd. 462636.23 1626.32 464262.55
17 Hong Yuan Securities Co., Ltd. 386219.24 1303.70 387522.94
18 Changjiang Securities Co., Ltd. 363420.66 1706.11 365126.76
19 Industrial Securities Co., Ltd. 282934.27 423.99 283358.26
20 Guoyuan Securities Co., Ltd. 269705.89 1018.75 270724.64

Members
2014 Fact Book 240
Number of Trading Accounts with SSE 1991-2013
Year Number of Accounts (10,000)
1997 1713
1998 1999
1999 2281
2000 2967
2001 3430
2002 3567
2003 3644
2004 3787
2005 3856
2006 4101
2007 7131
2008 7973
2009 8965
2010 9851
2011 10539
2012 10970
2013 11444

Members
2014 Fact Book 241
Segmentation of B-share Investors by Jurisdiction
Region Number of Trading Accounts
Percentage in Total Accounts (%)
New Trading Accounts in 2011
Percentage in Total New Accounts (%)
China (Mainland) 1358426 87.22 8018 87.51
United States 15302 0.98 433 4.73
Hong Kong SAR, China 17253 1.11 97 1.06
Canada 3807 0.24 72 0.79
Australia 3315 0.21 48 0.52
United Kingdom 2435 0.16 45 0.49
Taiwan 8771 0.56 35 0.38
Korea 1816 0.12 32 0.35
Japan 4599 0.30 30 0.33
Singapore 1960 0.13 25 0.27
China (Overseas) 125936 8.09 18 0.20
Germany 736 0.05 14 0.15
Holland 426 0.03 13 0.14
Macao SAR, China 813 0.05 9 0.10
France 647 0.04 6 0.07
Other 11292 0.72 267 2.91
Total 1557534 100.00 9162 100.00


Historical Statistics


Historical Statistics
2014 Fact Book 245
Historical Statistics
Earlier Share Turnover Value, 1991-2013
Year
Annual Turnover Value (RMB 100 million)
Number of Trading Days
Average Daily Turnover Value (RMB 100 million)
Average Daily Trading Volume(100 million shares)
Date of Highest Turnover Date of Lowest Turnover
Turnover Value(RMB 100 million)
Date
Turnover Value(RMB 100 million)
Date
1991 46.08 256 0.18 0.0002 2.01 19911231 0.008 19910517
1992 323.85 255 1.27 0.07 4.82 19921130 0.08 19920207
1993 2509.71 259 9.69 0.6 38.43 19931207 0.001 19930227
1994 5735.52 252 22.76 2.61 157.54 19940906 1.6 19940712
1995 3102.36 251 12.36 2.05 114.3 19950522 1.14 19950208
1996 9114.82 247 36.9 4.46 192.74 19961203 1.53 19960209
1997 13763.52 243 56.64 5.01 159.83 19970512 11.51 19971014
1998 12386.11 246 50.35 4.59 119 19980409 16.48 19981221
1999 16965.79 239 70.99 6.53 404.43 19990625 11.62 19990104
2000 31373.86 239 131.27 10.2 472.62 20000217 42.92 20000927
2001 22709.38 240 94.62 7.58 234.13 20011024 27.27 20011115
2002 16959.09 237 71.56 7.52 494.80 20020624 26.60 20021008
2003 20824.14 241 86.41 11.17 330.16 20030416 27.24 20030103
2004 26470.60 243 108.93 14.85 286.68 20040924 31.67 20040907
2005 19240.21 242 79.51 16.47 221.58 20050818 36.75 20050707
2006 57816.60 241 239.90 42.67 626.89 20061206 67.63 20060313
2007 305434.29 242 1262.13 100.52 2712.94 20070530 502.08 20071123
2008 180429.95 246 733.46 66.31 1896.84 20080424 217.96 20080909
2009 346511.91 244 1420.13 138.03 2969.29 20090729 461.01 20090105
2010 304312.009 242 1257.488 107.29 3076.923 20101102 432.142 20100705
2011 237560.453 244 973.608 86.86 2080.931 20110307 364.736 20111229
2012 164545.008 243 677.140 77.98 1709.832 20120314 332.122 20121126
2013 230266.027 238 967.504 112.26 1965.946 20130911 524.080 20130709

Historical Statistics
2014 Fact Book 246
Historical Highs in Stock Turnover Value
Daily All-time Highs in Turnover Value
Rank Date Turnover Value (RMB10,000)
1 2010-11-02 30769228.81
2 2010-10-18 30130725.65
3 2010-11-12 29876868.16
4 2009-07-29 29692889.17
5 2009-11-24 29077692.90
6 2010-11-11 28825572.40
7 2010-11-05 27378871.64
8 2010-10-15 27296221.86
9 2007-05-30 27129417.55
10 2010-10-14 26512225.14
Monthly All-time Highs in Turnover Value
Rank Date Turnover Value (RMB10,000)
1 2009-07 473348150.75
2 2010-11 459221196.35
3 2007-05 392825190.85
4 2009-11 391509476.83
5 2011-03 370341232.47
6 2010-10 368912823.25
7 2007-08 355977025.69
8 2007-06 353325027.52
9 2009-08 333670929.92
10 2007-04 320068667.95

Historical Statistics
2014 Fact Book 247
Quarterly All-time Highs in Turnover Value
Rank Date Turnover (RMB10,000)
1 2010-4 1093562840.23
2 2009-3 1090366122.12
3 2007-2 1066218886.32
4 2009-4 911044772.45
5 2007-3 876488190.10
6 2009-2 851774845.98
7 2011-1 789777146.89
8 2010-1 687069640.38
9 2011-2 664042480.13
10 2010-3 658329652.60

Historical Statistics
2014 Fact Book 248
Listed Shares on SSE, 1990-2013
Year Numberof Listed Companies
Number of Listed Securities
Proceeds Raised(RMB 100 million)
Share Capital Issued(100 million shares)
Market Cap (RMB 100 million)
1990 8 30 10.11 2.61 12.34
1991 8 46 0.24 2.72 29.43
1992 29 87 41.39 46.94 558.4
1993 106 190 93.47 235.54 2206.2
1994 171 259 150.82 418.88 2600.13
1995 188 258 58.16 560.66 2525.66
1996 293 368 202.22 749.86 5477.81
1997 383 467 474.6 975.37 9218.06
1998 438 526 377.15 1280.35 10625.9
1999 484 576 486.37 1580.15 14580.47
2000 572 657 914.32 2032.42 26930.86
2001 646 744 957.49 3164.44 27590.56
2002 715 826 614.3 3727.84 25363.72
2003 780 914 560.96 4170.39 29804.92
2004 837 996 456.9 4700.55 26014.34
2005 834 1069 299.77 5023.05 23096.13
2006 842 1126 1714.41 10279.54 71612.38
2007 860 1125 6701.33 14173.1 269838.87
2008 864 1184 2238.16 15410.39 97251.91
2009 870 1351 3343.15 16659.96 184655.23
2010 894 1500 5532.14 21939.51 179007.24
2011 931 1691 3199.69 23466.65 148376.22
2012 954 2098 2890.31 24617.62 158698.44
2013 953 2786 2515.72 25751.69 151165.27

Historical Statistics
2014 Fact Book 249
Top 10 Increases and Decreases in SSE Index Series
Top 10 Increases in SSE 50 Index (in percentage)
Rank Increase (%) Date Index at Close
1 9.673 2008-4-24 2981.186
2 9.414 2008-9-19 1650.537
3 8.459 2008-2-4 3796.130
4 8.200 2005-6-8 772.134
5 8.144 2008-8-20 2042.944
6 7.866 2008-9-22 1780.375
7 7.786 2008-11-10 1469.623
8 6.880 2009-3-4 1671.569
9 6.226 2007-8-20 3831.053
10 5.802 2008-11-19 1543.770
Top 10 Decreases in SSE 50 Index (in percentage)
Rank Decrease (%) Date Index at Close
1 -9.471 2007-2-27 2030.357
2 -8.181 2008-6-10 2480.763
3 -7.463 2008-1-22 3679.014
4 -7.274 2008-10-27 1305.705
5 -7.253 2007-6-4 2695.765
6 -7.235 2008-11-18 1459.109
7 -7.181 2008-1-28 3597.264
8 -7.066 2008-6-19 2201.340
9 -6.698 2009-8-31 2046.589
10 -6.613 2013-6-24 1525.166

Historical Statistics
2014 Fact Book 250
Top 10 Increases in SSE 50 Index (in point)
Rank Increase (point) Date Index at Close
1 296.077 2008-2-4 3796.130
2 262.933 2008-4-24 2981.186
3 224.525 2007-8-20 3831.053
4 191.430 2007-11-29 3975.709
5 175.863 2007-11-14 4247.162
6 164.640 2008-4-30 3125.533
7 157.687 2007-8-3 3520.144
8 153.845 2008-8-20 2042.944
9 150.060 2008-3-28 2910.511
10 143.802 2008-1-23 3822.816
Top 10 Decreases in SSE 50 Index (in point)
Rank Decrease (point) Date Index at Close
1 -296.696 2008-1-22 3679.014
2 -278.314 2008-1-28 3597.264
3 -228.662 2007-11-8 4154.969
4 -221.026 2008-6-10 2480.763
5 -220.244 2008-1-21 3975.710
6 -212.407 2007-2-27 2030.357
7 -210.823 2007-6-4 2695.765
8 -193.435 2007-5-30 2857.002
9 -186.438 2007-10-25 4364.123
10 -180.781 2007-9-11 3992.034

Historical Statistics
2014 Fact Book 251
Top 10 Increases in SSE 180 Index (in percentage)
Rank Increase(%) Date Index at Close
1 9.941 2001-10-23 3252.329
2 9.640 2002-6-24 3145.021
3 9.361 2008-9-19 4646.217
4 9.291 2008-4-24 8467.245
5 9.287 2000-2-14 3611.194
6 9.251 1996-12-18 2492.852
7 8.367 1997-2-19 2647.419
8 8.359 2008-2-4 10962.100
9 8.153 2005-6-8 2131.830
10 8.150 1996-9-23 2380.006
Top 10 Decreases in SSE 180 Index (in percentage)
Rank Decrease(%) Date Index at Close
1 -9.978 1996-12-16 2503.090
2 -9.424 1997-2-18 2443.012
3 -9.292 2007-2-27 5629.336
4 -8.842 1996-12-17 2281.762
5 -8.305 1998-8-17 2686.767
6 -8.166 2008-6-10 7172.485
7 -7.726 2008-1-22 10606.500
8 -7.699 2007-6-4 7768.518
9 -7.569 1997-5-22 3773.982
10 -7.512 1999-7-1 3907.150

Historical Statistics
2014 Fact Book 252
Top 10 Increases in SSE 180 Index (in point)
Rank Increase (point) Date Index at Close
1 845.600 2008-2-4 10962.100
2 719.788 2008-4-24 8467.245
3 606.570 2007-8-20 10905.940
4 488.150 2007-11-14 11646.790
5 468.420 2007-11-29 11005.300
6 458.920 2008-1-23 11065.420
7 426.313 2008-8-20 5738.693
8 419.333 2008-4-30 8875.784
9 400.099 2008-4-7 8533.584
10 398.938 2008-3-28 8623.912
Top 10 Decreases in SSE 180 Index (in point)
Rank Decrease (point) Date Index at Close
1 -888.120 2008-1-22 10606.500
2 -780.400 2008-1-28 10497.910
3 -647.975 2007-6-4 7768.518
4 -637.818 2008-6-10 7172.485
5 -622.945 2007-5-30 8497.412
6 -619.730 2007-11-8 11458.590
7 -595.890 2008-1-21 11494.620
8 -585.530 2007-10-25 12034.160
9 -576.664 2007-2-27 5629.336
10 -551.140 2007-9-11 11459.810
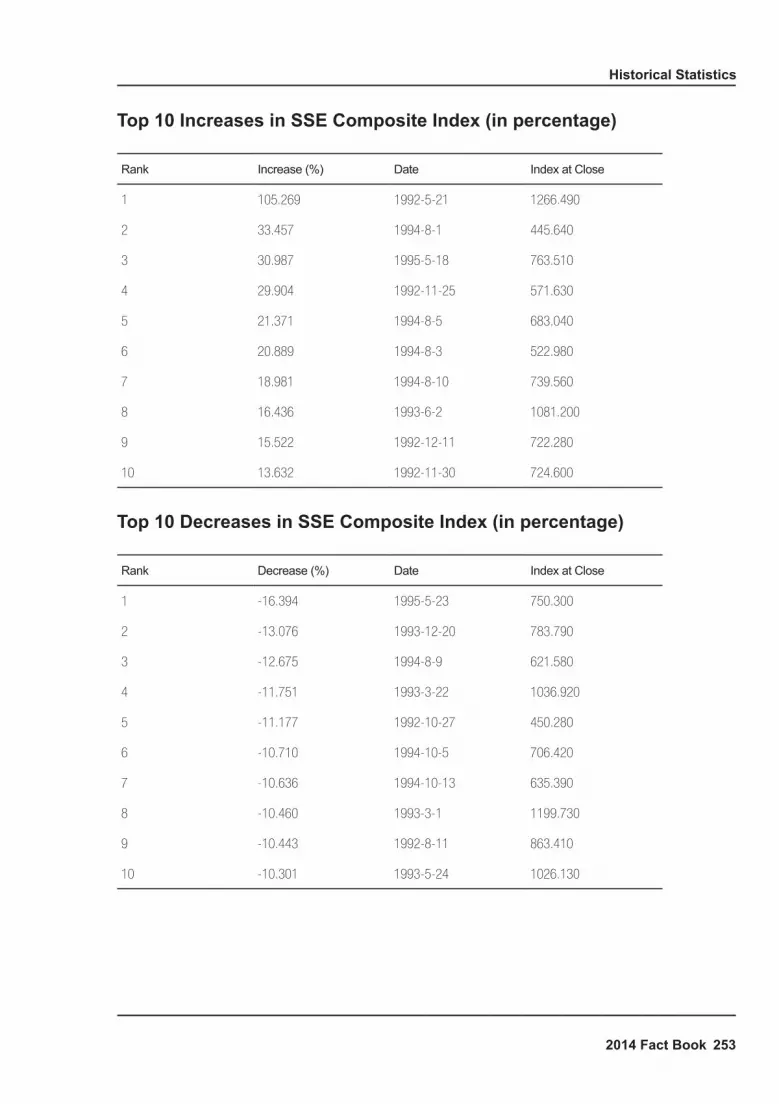
Historical Statistics
2014 Fact Book 253
Top 10 Increases in SSE Composite Index (in percentage)
Rank Increase (%) Date Index at Close
1 105.269 1992-5-21 1266.490
2 33.457 1994-8-1 445.640
3 30.987 1995-5-18 763.510
4 29.904 1992-11-25 571.630
5 21.371 1994-8-5 683.040
6 20.889 1994-8-3 522.980
7 18.981 1994-8-10 739.560
8 16.436 1993-6-2 1081.200
9 15.522 1992-12-11 722.280
10 13.632 1992-11-30 724.600
Top 10 Decreases in SSE Composite Index (in percentage)
Rank Decrease (%) Date Index at Close
1 -16.394 1995-5-23 750.300
2 -13.076 1993-12-20 783.790
3 -12.675 1994-8-9 621.580
4 -11.751 1993-3-22 1036.920
5 -11.177 1992-10-27 450.280
6 -10.710 1994-10-5 706.420
7 -10.636 1994-10-13 635.390
8 -10.460 1993-3-1 1199.730
9 -10.443 1992-8-11 863.410
10 -10.301 1993-5-24 1026.130

Historical Statistics
2014 Fact Book 254
Top 10 Increases in SSE Composite Index (in point)
Rank Increase (point) Date Index at Close
1 649.500 1992-5-21 1266.490
2 351.403 2008-2-4 4672.170
3 304.698 2008-4-24 3583.028
4 254.576 2007-11-14 5412.694
5 248.281 2007-8-20 4904.855
6 199.939 2007-11-29 5003.333
7 180.620 1995-5-18 763.510
8 179.254 2008-9-19 2075.091
9 178.813 2008-8-20 2523.282
10 169.701 2008-4-30 3693.106
Top 10 Decreases in SSE Composite Index (in point)
Rank Decrease (point) Date Index at Close
1 -354.684 2008-1-22 4559.751
2 -342.394 2008-1-28 4419.294
3 -330.341 2007-6-4 3670.401
4 -281.836 2007-5-30 4053.088
5 -280.715 2007-10-25 5562.394
6 -271.760 2007-11-8 5330.023
7 -268.808 2007-2-27 2771.791
8 -266.079 2008-1-21 4914.435
9 -257.337 2008-6-10 3072.333
10 -241.319 2007-9-11 5113.968

Historical Statistics
2014 Fact Book 255
World Securities Markets
Statistics of Stock Exchanges Around the World (by the end of December 2013)
Exchange Year-end Index
Number of Listed Companies Market Cap
(US$ million)Turnover (US$ million)
Local Foreign
NYSE 10400.33 (NYSE Composite Index) 1852 519 17949883.8 13700450.5
NASDAQ 4176.59 (Nasdaq Composite Index) 2328 309 6084969.7 9584742.2
TMX 13621.55 (S&P/TSX Composite Index) 3810 76 2113821.8 1371477.7
LSE 6749.09 (FTSE 100 Index) 2164 572 4428975.3 3050891.5
Euronext 3262.93 (SBF250) 935 127 3583899.7 1661878.3
Deutsche Börse AG 466.53 (CDAX) 639 81 1936106.3 1334544.9
ASX 5353.08 ( All Ordinaries) 1951 104 1365958.1 881555.6
Tokyo Stock Exchange 1302.29 (TOPIX) 3408 11 4543169.1 6304927.5
SGX 3167.43 (Straits Times Index) 479 297 744413.2 280926
Korea Exchange 2011.34 (KOSPI Composite Index) 1798 15 1234548.5 1284599.3
Bursa Malaysia 12853.63(FBM Emas) 900 10 500387.4 147872.8
National Stock Exchange of India
4914.85(S&P CNX 500 Index) 1678 1 1112952.3 478958.7
Stock Exchange of Thailand 1298.71 (SET Index) 585 N/A 354339.7 376024.4
HKEx 28109.1 (S&P/HKEx LargeCap Index) 1553 90 3100777.2 1323373.3
Taiwan Stock Exchange 8611.51 (TAIEX) 802 64 822707.4 623950.4
Source: http://www.world-exchanges.org

2014 Fact Book 256
Major Publications
“SSE Annual Statistics (2013)”, Shanghai Sanlian Bookstore,2013.
“Securities Law Review (published semi-annually)”, Law Press·China,2013.
“Corporate Governance Report (2013)”, Shanghai People’s Publishing House, 2013.
“Shanghai Stock Exchange Joint Research Report (2012)”, Shanghai People's Publishing House, 2012.
“Rules and Regulations of the Securities and Exchange Commission”, Law Press·China,2013.
Major Publications

2014 Fact Book 257
Registered Trademarks of Shanghai Stock Exchange
上证
中证
Shanghai Zhengquan Jiaoyisuo
SSE
SSEINDEX
上海证交所 CNINDEX
上交所 180 指数
上证所 ETFs
UCI CSI
GCI 易神
YISHEN
※ Registered Trademarks of Shanghai Stock Exchange. All Rights Reserved
Registered Trademarks of Shanghai Stock Exchange

For more information, please visit SSE website: www.sse.com.cn