Embed Size (px)
Citation preview

Factor Structure of the National Alzheimer’s CoordinatingCenters Uniform Dataset Neuropsychological Battery: Anevaluation of invariance between and within groups over time
Kathleen M. Hayden1,2, Richard N. Jones3, Catherine Zimmer4, Brenda L. Plassman2,Jeffrey N. Browndyke1,2,5, Carl Pieper1,6, Lauren H. Warren1,2, and Kathleen A. Welsh-Bohmer1,2
1 Joseph and Kathleen Bryan Alzheimer’s Disease Research Center, Duke University MedicalCenter, Durham, NC2 Department of Psychiatry and Behavioral Sciences, Duke University Medical Center, Durham,NC3 Aging Brain Center, Institute for Aging Research, Hebrew SeniorLife, Department of Psychiatry,Brigham and Women’s Hospital, Harvard Medical School, Boston MA4 The Odum Institute and Department of Sociology, University of North Carolina at Chapel Hill,Chapel Hill, NC5 Duke institute for Brain Sciences, Duke University, Durham NC6 Department of Biostatistics and Bioinformatics, Duke University Medical Center, Durham, NC
AbstractThe neuropsychological battery from the National Alzheimer’s Disease Coordinating Center(NACC) is designed to provide a sensitive assessment of mild cognitive disorders for multicenterinvestigations. Comprised of eight common neuropsychological tests (12 measures), the batteryassesses cognitive domains affected early in the course of Alzheimer’s disease (AD). Weexamined the factor structure of the battery across levels of cognition (normal, mild cognitiveimpairment (MCI), dementia) based on Clinical Dementia Rating (CDR) scores to determinecognitive domains tapped by the battery. Using data pooled from 29 NIA funded Alzheimer’sDisease Centers, exploratory factor analysis was used to derive a general model using half of thesample; four factors representing memory, attention, executive function, and language wereidentified. Confirmatory factor analysis (CFA) was used on the second half of the sample toevaluate invariance between groups and within groups over one year. Factorial invariance testingincluded systematic addition of constraints and comparisons of nested models. The general CFAmodel had a good fit. As constraints were added, model fit deteriorated slightly. Comparisonswithin groups demonstrated stability over one year. In a range of cognition from normal todementia, factor structures and factor loadings will vary little. Further work is needed to determineif domains become more or less distinct in severely cognitively compromised individuals.
Corresponding Author: Kathleen M. Hayden, Ph.D. DUMC, Joseph and Kathleen Bryan ADRC 2200 West Main Street, Suite A-200Durham, NC 27705 Phone: 919-668-1584 Fax: 919-668-0828 [email protected] is a PDF file of an unedited manuscript that has been accepted for publication. As a service to our customers we are providingthis early version of the manuscript. The manuscript will undergo copyediting, typesetting, and review of the resulting proof before itis published in its final citable form. Please note that during the production process errors may be discovered which could affect thecontent, and all legal disclaimers that apply to the journal pertain.
NIH Public AccessAuthor ManuscriptAlzheimer Dis Assoc Disord. Author manuscript; available in PMC 2012 April 1.
Published in final edited form as:Alzheimer Dis Assoc Disord. 2011 ; 25(2): 128–137. doi:10.1097/WAD.0b013e3181ffa76d.
NIH
-PA Author Manuscript
NIH
-PA Author Manuscript
NIH
-PA Author Manuscript

KeywordsFactor Analysis; invariance; neuropsychological tests; dementia; Alzheimer’s disease
IntroductionAn emerging line of research seeks to identify biomarkers for individuals at-risk forAlzheimer’s disease (AD)with imaging,1 cerebrospinal fluid,2 blood samples,3 and detailedneuropsychological testing.4 In dementia research, neuropsychological batteries wereoriginally developed with the goal of facilitating diagnosis; more recently the focus has beenon early diagnosis. In 1984, the National Institute of Neurological and CommunicativeDisorders and Stroke and the Alzheimer’s Disease and Related Disorders Association(NINCDS-ADRDA),5 specified 7 domains of cognition that may be impaired in AD.Neuropsychological test batteries, designed to tap these areas of cognition, have been usedto identify variations in cognitive performance such as declines in memory,6 that mayrepresent early disease pathology7. Different cognitive domains presumably reflect regionalbrain functions that may be affected either as part of the normal aging process, through thecourse of a neurodegenerative disease, or some other underlying pathology.7 We do notknow, however, whether or not cognitive domains change or shift over the course of disease,i.e., whether neuropsychological tests measure the same thing in normal individualscompared with those suffering from dementia, or if the variation is simply one of a generaldecline in performance reflecting a more global cognitive decline. In samples of individualswith mild impairment or AD, slightly different factor structures seem to emerge implyingthat there is variation between normals, mildly impaired, and AD patients’ pattern ofperformance on tests.8-11
Factor analysis is used to evaluate the construct validity of neuropsychological batteries andmeasures of invariance are used to gauge the stability of factor structures. Indications ofstability or instability across groups have implications for researchers seeking to determinehow cognitive domains are affected when comparing normal individuals to those sufferingfrom neurodegenerative disease such as AD. The stability with which factor structurescorrespond to cognitive domains across groups and over time has not been studiedextensively.
Understanding factor stability over the continuum of brain disease is important as we begindiagnosing neurodegenerative disease at earlier stages. Shifts in the factor structure betweengroups would suggest different relationships between the measures and may signal demiseof particular underlying neural systems or cognitive processes that cut across multiplecognitive domains. Herein we evaluate the factorial invariance of the National Alzheimer’sCoordinating Center (NACC) Uniform Data Set (UDS) neuropsychological battery todetermine if the factor structure varies across groups or over time.
MethodsThe NACC was established in 1999 in order to facilitate collection of standardized datafrom Alzheimer’s Disease Centers (ADC’s) across the United States. A neuropsychologicalbattery, part of the UDS, comprising 8 tests (12 measures) was developed with the goal oftapping the following cognitive domains in mild cognitive impairment (MCI) and AD:attention, speed of processing, executive function, episodic memory, and language.12 Testsin the battery (listed below) were selected to focus on markers of aging, MCI, and AD bybuilding on tests already being administered by a majority of ADCs while keepingparticipant burden low.12 All protocols and procedures were approved by the Institutional
Hayden et al. Page 2
Alzheimer Dis Assoc Disord. Author manuscript; available in PMC 2012 April 1.
NIH
-PA Author Manuscript
NIH
-PA Author Manuscript
NIH
-PA Author Manuscript

Review Boards of each ADC. Informed consent was obtained from all participants. (For amore detailed description of the UDS battery and NACC methodology see Morris 2006,13Beekley 2007,14 and Weintraub 2009.12)
Setting & ParticipantsData were collected at 29 NIA funded ADC’s using a standardized protocol. Participants arevolunteers from the community; each ADC has its own recruitment protocol and participantsare re-evaluated annually. The data consist of general demographic characteristics (age, sex,race, and education level in years), family history, health history, behavioral and functionalassessments, and clinical information. As of May 5, 2008, the ADC’s participating in NACCadministered 14,428 UDS initial assessment batteries to participants across the UnitedStates.
The UDS Neuropsychological BatteryThe UDS Neuropsychological Battery12 consists of 8 neuropsychological tests which arefocused on characterization of non-demented aging, mild cognitive impairment (MCI), andmild AD. The battery is fixed, i.e., administered in a standardized, uniform fashion at allADCs. Designed to be brief and to cover major cognitive domains, the tests included in thebattery are: Logical Memory Story A (Immediate and Delayed recall),15 the Boston NamingTest (30 item),16, 17 WAIS Digit Symbol,18 Trail Making Test Parts A & B,19 DigitsForward,15 Digits Backward,15 and semantic fluency (Animals,20 and Vegetables) (Table1). The Mini Mental State Examination (MMSE)21 was administered as a global indicatorof dementia severity along with the Clinical Dementia Rating (CDR).22, 23
Clinical Dementia RatingThe CDR,23, 24 administered to all participants as a part of the diagnostic process, takesinto consideration decline from a prior level of function by rating 6 cognitive domains.Domains assessed include memory, orientation, judgment and problem solving, communityaffairs, home and hobbies, and personal care. Although the CDR is used in the diagnosticprocess, the results of the neuropsychological battery are not specifically used to determineCDR scores.
Statistical methodsFactor Analysis—Factor analysis is a statistical technique that attempts to explaincovariation among a set of observed variables by introducing unobserved (latent) variablesthat are presumed to be causes of the observed variables. Conditional on the unobservedvariables, or factors, the observed variables are assumed to be uncorrelated. Observedvariables “load” on factors with regression parameter estimates that are referred to as factorloadings. Because latent variables are unobserved, their scale is arbitrary so it is common topresume a unit normal distribution. There are a variety of different algorithms for estimatingparameters of factor analysis models. In our study we used maximum likelihood parameterestimates as implemented in MPlus software (version 5.21, Muthén & Muthén, Los AngelesCA). Our analytic approach included both exploratory factor analysis (EFA; no a priorispecification of latent factors and loading matrix is unconstrained) and confirmatory factoranalysis (CFA; models are estimated given a fixed factor structure and the factor loadingmatrix contains many constraints).
Measures of Factorial Invariance—Construct validity can be assessed by evaluatingthe variability of the factor structure, or factorial invariance.25 Each form of invariancedescribed below is part of a hierarchy.26, 27 Beginning with simpler forms of invariance,restrictions are added and the level of similarity or dissimilarity between groups is evaluated
Hayden et al. Page 3
Alzheimer Dis Assoc Disord. Author manuscript; available in PMC 2012 April 1.
NIH
-PA Author Manuscript
NIH
-PA Author Manuscript
NIH
-PA Author Manuscript

by checking model fit11 (see description of fit statistics below). The most basic form ofinvariance, dimensional invariance, is an indication of the general structure specified byeach group and is present when the same number of common factors is identified in eachgroup. Configural invariance criteria are met when the same items are associated with thesame common factors in each group. Metric invariance, or weak factorial invariance, isachieved when adequate model fit is demonstrated while the factor loadings are heldconstant across groups. For scalar (strong) invariance, factor loadings and intercepts are heldconstant across groups. Finally, strict factorial invariance is met when factor loadings,intercepts, and residual variances are held constant across groups.28 We performed tests ofinvariance using a multiple group analysis approach, where factor analytic models areestimated in separate groups simultaneously, and hypotheses about invariance are tested byadding constraints across groups and assessing differences in global indices of model fit.
Analytic Approach—The sample was subdivided according to CDR score rather thandiagnoses because the results of the UDS neuropsychological battery are used in thediagnostic process. While the clinicians who assign CDR scores are not blinded to theresults of the UDS neuropsychological battery, it is not a required source of information forstaging disease severity. Individuals with CDR scores of 0.0 were considered cognitivelynormal. Those with scores of 0.5 were considered to have mild cognitive impairment (MCI),and those with scores greater than 0.5 were considered to have dementia. Because some ofthe tests in the battery typically yield skewed data (ceiling and floor effects), a Blomtransformation29 was applied to normalize the data.
Initial EFA were performed using one half of the sample in order to develop an empiricalmodel. A simple structure CFA model was then derived from the pattern of results found inthe EFA model. CFA was used to evaluate invariance between groups. We similarlyevaluated the stability of the factors over one year by comparing two time points within eachgroup. We did not consider individuals’ group membership from one time point to the nextbecause our focus was on the factor structure rather than individuals’ progress over time.Descriptive data analyses were performed using SAS statistical software.30 All factoranalyses were completed using MPlus statistical software.31
Model comparisons and fit statistics—A hierarchical set of models were produced inCFA with successively more restrictive criteria to assess levels of invariance. These nestedmodels were tested using Satorra-Bentler Scaled χ2 test32 to determine if each successivemodel was significantly different from the prior one. This test corrects for the sensitivity ofthe χ2 to large sample sizes by applying a scaling factor to correct for multivariate normality.A second test, the Bayesian Information Criterion (BIC) was also applied to differentiatenested models.33 The BIC corrects for the χ2 sensitivity to sample size by multiplying thedegrees of freedom by the natural log of the sample size and subtracting the product fromthe χ2; values less than zero represent models that have a better fit than a fully saturatedmodel. Finally, Modification Indices (MI) provide estimates of the change in χ2 value thatwould result if a given parameter was left unconstrained. MI can be inspected for sources ofmodel misfit.
The configural invariance model, the least constrained model, was used as the starting point.Individual model fit was evaluated by examining the following fit statistics. TheComparative Fit Index (CFI)34 captures the relative goodness of fit by comparing the modelto the data while adjusting for complexity or parsimony35 (better fit >0.90; range 0.0 -1.0).The Tucker-Lewis Index (TLI)36 is an incremental fit index that makes a comparisonbetween a null model and an incrementally more complex model37 (better fit > 0.90; range0.0 -1.0). These two indices are measures of relative fit, indicating improvement relative to anull model.38 The Root Mean Square Error of Approximation (RMSEA)39 is not very
Hayden et al. Page 4
Alzheimer Dis Assoc Disord. Author manuscript; available in PMC 2012 April 1.
NIH
-PA Author Manuscript
NIH
-PA Author Manuscript
NIH
-PA Author Manuscript

sensitive to sample size and distribution and is a good measure of practical fit (better fit<0.05). The Standardized Root Mean Square Residual (SRMR)40 is the standardizeddifference between variance and covariance and it is less sensitive to distribution and samplesize (better fit <0.05). The RMSEA and the SRMR reflect the size of the residuals associatedwith the model.38
ResultsA total of 14,428 participants completed initial assessment batteries as of 5 May 2008.Individuals under the age of 55 (n=517), those who reported a primary language other thanEnglish (1,080), and individuals who were missing a significant portion (10 or more) of thetest scores (n=811) were excluded. A total of 12,020 individuals provided sufficientinformation for inclusion in the analysis. Individuals who were not included in the sampletended to be younger (mean 70.3(14.2) vs. 75.6(8.9), p<0.001), female (59.8% vs. 57.2%,p=0.02), with lower levels of education (13.0(4.9) vs. 15.0(3.1), p<0.001), lower MMSEscores (20.0(9.8) vs. 25.5(5.4), p<0.001), and a greater proportion were non-whiteparticipants (25.2% vs. 16.7%, p<0.001).
Among those retained in the sample, individuals classified as normal were significantlyyounger than individuals classified as mildly cognitively impaired (p<0.001) and thosesuffering from dementia (p<0.001) (Table 2). Dementia cases were in turn older than themildly impaired individuals (p<0.001). The three groups were significantly different fromeach other on all other demographic characteristics. A listing of the sample means andstandard deviations for all the test scores can be found in Table 3. The mean scores fornormal individuals listed here are in line with means reported in a prior evaluation of thebattery;12 differences may be attributed to exclusionary criteria imposed on our sample. Thesample was randomly split into two subsamples of n=6010 each. The two samples were notstatistically significantly different from each other in their demographic characteristics ortest scores.
Initial exploratory factor analysis (EFA) was performed using half of the sample. Becausethe analysis was focused on factor structure and not data reduction, we considered model fitstatistics rather than factor extraction procedures such as examination of scree plots41 or theapplication of the “Eigenvalue greater than one” rule.42 After reviewing the fit statistics(CFI = 0.999, TLI = 0.997, RMSEA = 0.019, SRMR = 0.003) we concluded that a 5-factorsolution fit the data best.43 EFA was repeated for each of the cognitive subgroups todetermine if the general model was the same in each group. All three groups’ factorstructures were in agreement based on visual inspection, thus meeting criteria fordimensional invariance.
Using the EFA factor structure, a confirmatory factor analysis (CFA) model was built(Figure 1). We modified the original model in CFA to improve our fit by collapsing the fourdigits tests into one factor and allowing for a correlation between Digits Forward/DigitsForward Length, and Digits Backward/Digits Backward Length. Factor loadings, intercepts,and residual variances were free to vary across group(CFI = 0.989; TLI = 0.985; RMSEA =0.045; SRMR = 0.019). The sample was then stratified into three groups based on CDRscores and a multiple group CFA analysis was performed. The normal group consisted ofn=2409 individuals defined as having a CDR global score=0.0. A second group consisted ofn=2037 individuals with MCI defined as having a CDR score=0.5. The dementia group(n=1564) was defined as having a CDR score >0.5. The initial multiple group CFA had onlytwo constraints: variances were fixed at 1.0 and means were fixed at 0.0; this model had agood model fit, meeting criteria for configural invariance. There was a Heywood case(factor loading >1.0; negative variance)44 in the dementia group Logical Memory
Hayden et al. Page 5
Alzheimer Dis Assoc Disord. Author manuscript; available in PMC 2012 April 1.
NIH
-PA Author Manuscript
NIH
-PA Author Manuscript
NIH
-PA Author Manuscript
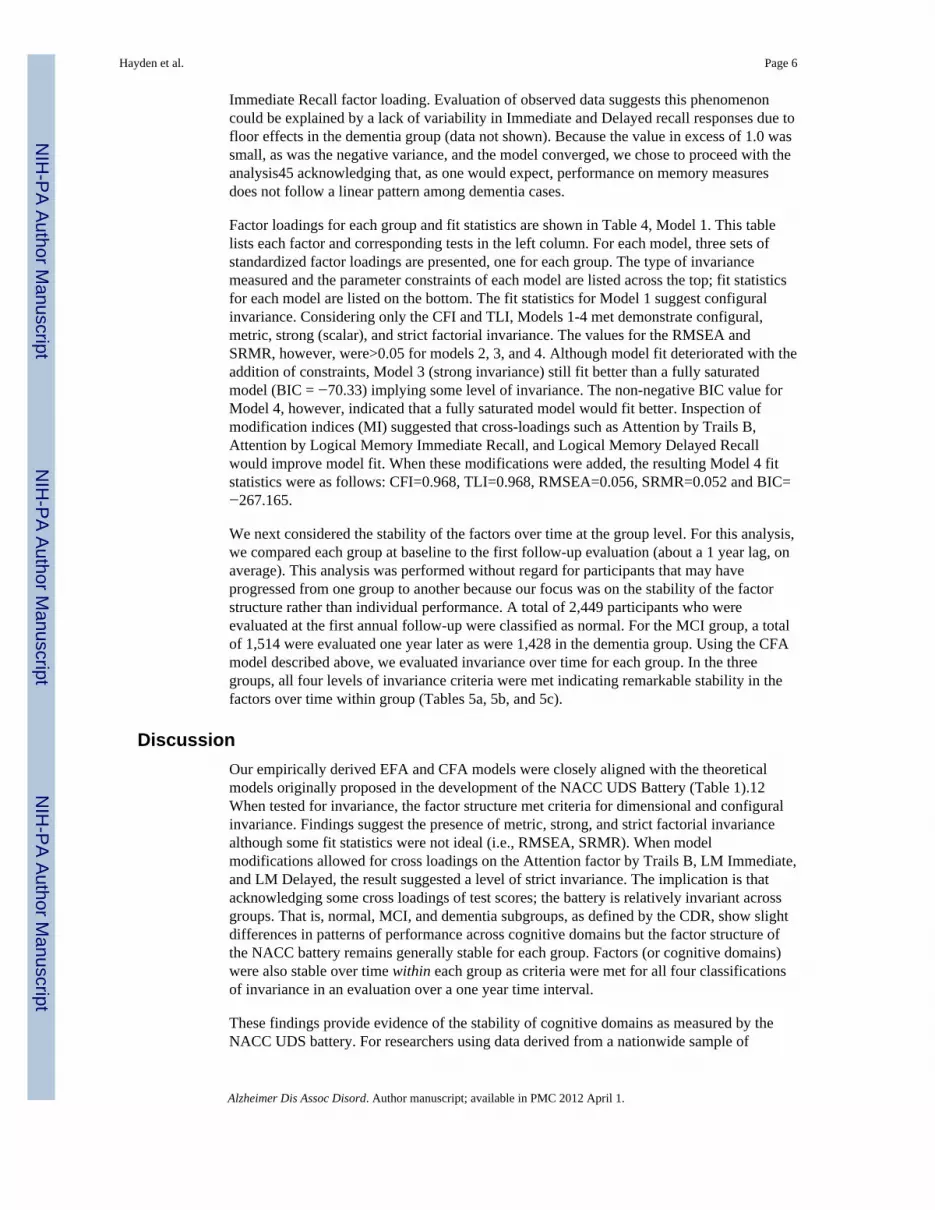
Immediate Recall factor loading. Evaluation of observed data suggests this phenomenoncould be explained by a lack of variability in Immediate and Delayed recall responses due tofloor effects in the dementia group (data not shown). Because the value in excess of 1.0 wassmall, as was the negative variance, and the model converged, we chose to proceed with theanalysis45 acknowledging that, as one would expect, performance on memory measuresdoes not follow a linear pattern among dementia cases.
Factor loadings for each group and fit statistics are shown in Table 4, Model 1. This tablelists each factor and corresponding tests in the left column. For each model, three sets ofstandardized factor loadings are presented, one for each group. The type of invariancemeasured and the parameter constraints of each model are listed across the top; fit statisticsfor each model are listed on the bottom. The fit statistics for Model 1 suggest configuralinvariance. Considering only the CFI and TLI, Models 1-4 met demonstrate configural,metric, strong (scalar), and strict factorial invariance. The values for the RMSEA andSRMR, however, were>0.05 for models 2, 3, and 4. Although model fit deteriorated with theaddition of constraints, Model 3 (strong invariance) still fit better than a fully saturatedmodel (BIC = −70.33) implying some level of invariance. The non-negative BIC value forModel 4, however, indicated that a fully saturated model would fit better. Inspection ofmodification indices (MI) suggested that cross-loadings such as Attention by Trails B,Attention by Logical Memory Immediate Recall, and Logical Memory Delayed Recallwould improve model fit. When these modifications were added, the resulting Model 4 fitstatistics were as follows: CFI=0.968, TLI=0.968, RMSEA=0.056, SRMR=0.052 and BIC=−267.165.
We next considered the stability of the factors over time at the group level. For this analysis,we compared each group at baseline to the first follow-up evaluation (about a 1 year lag, onaverage). This analysis was performed without regard for participants that may haveprogressed from one group to another because our focus was on the stability of the factorstructure rather than individual performance. A total of 2,449 participants who wereevaluated at the first annual follow-up were classified as normal. For the MCI group, a totalof 1,514 were evaluated one year later as were 1,428 in the dementia group. Using the CFAmodel described above, we evaluated invariance over time for each group. In the threegroups, all four levels of invariance criteria were met indicating remarkable stability in thefactors over time within group (Tables 5a, 5b, and 5c).
DiscussionOur empirically derived EFA and CFA models were closely aligned with the theoreticalmodels originally proposed in the development of the NACC UDS Battery (Table 1).12When tested for invariance, the factor structure met criteria for dimensional and configuralinvariance. Findings suggest the presence of metric, strong, and strict factorial invariancealthough some fit statistics were not ideal (i.e., RMSEA, SRMR). When modelmodifications allowed for cross loadings on the Attention factor by Trails B, LM Immediate,and LM Delayed, the result suggested a level of strict invariance. The implication is thatacknowledging some cross loadings of test scores; the battery is relatively invariant acrossgroups. That is, normal, MCI, and dementia subgroups, as defined by the CDR, show slightdifferences in patterns of performance across cognitive domains but the factor structure ofthe NACC battery remains generally stable for each group. Factors (or cognitive domains)were also stable over time within each group as criteria were met for all four classificationsof invariance in an evaluation over a one year time interval.
These findings provide evidence of the stability of cognitive domains as measured by theNACC UDS battery. For researchers using data derived from a nationwide sample of
Hayden et al. Page 6
Alzheimer Dis Assoc Disord. Author manuscript; available in PMC 2012 April 1.
NIH
-PA Author Manuscript
NIH
-PA Author Manuscript
NIH
-PA Author Manuscript

participants covering a range of cognitive function, it is important to know that the samedomains are being measured at different levels of cognitive function. Variation in testperformance then represents quantitative change rather than qualitative. This allows forcomparison across groups and over time.
Others have performed similar analyses using different neuropsychological batteries on arange of diagnostic groups with varying results.8, 11, 46, 47 In samples of individuals withmild impairment or AD, slightly different factor structures than those seen in normalsamples seem to emerge implying variation in the cognitive domains being measured. Thereare also differences in the number of factors extracted from various batteries. There are acouple of reasons for these differences. First, the psychometric characteristics of each testand each battery are important to consider as some may be better at cleanly measuringindividual cognitive domains than others. As noted previoiusly,7 normals’ performance onneurocognitive tests tends to be uniform, hence the one-factor solution typically found innormal subjects. Individuals suffering from neurodegenerative disease such as AD, tend toperform heterogeneously.
Second, the number of factors extracted can vary depending on the objective of the analysis.If data reduction is the goal, factor extraction based on the use of Eigenvalues42 or screeplots41 may be appropriate and can yield a smaller number of factors. When more factorsare extracted, the fit statistics tend to improve. It is up to the researchers to determine theappropriate number of factors that hang together and make theoretical sense. Parsimony andsimplicity play important roles.
The strengths of the current study are the large sample size and the fact that the NACCbattery was administered in a standardized fashion across sites. There are a number oflimitations to be noted. The sample is not population-based and therefore results may not begeneralizable. Centers may follow different protocols for volunteer recruitment and variouscenters have different areas of specialty, which may tend to attract volunteers with aparticular interest or family history. Participants were classified into three groups based onthe CDR. While not required, it is possible that test scores were considered in theassignment of CDR scores. The choice of the CDR as a grouping variable over actualdiagnoses was an attempt to avoid any tautology. Because we did not rely on diagnoses,there is likely a large degree of heterogeneity within each subgroup of participants. We didnot exclude participants with comorbid conditions, nor did we adjust for demographiccharacteristics as our focus was on the general factor structure of the battery. The batteryitself, while broad in scope may have limitations in its ability to tap cognitive domains.Some of the test results tend to be skewed, having floor and ceiling effects. To remedy thispossibility, a Blom transformation was applied to normalize the data and we used anMPLUS estimator that is robust to non-normality.
We found that the CFA factor structure fit all three CDR groups (i.e. dimensional andconfigural invariance held) and the ability of individual tests to adequately represent eachfactor varied only slightly between different groups defined by CDR scores. Our findingsprovide strong support for continued efforts to elucidate a biomarker of early dementiabased on detailed neuropsychological assessment. Insofar as factor structures are consistent,differences in performance within each group suggest impairments in those cognitivedomains rather than the inability of the battery to adequately measure performance. It isimportant to note the stability of the battery because impairments in specific cognitivedomains have been correlated with neuropathology in prior studies.7, 48 In general, ourfindings are in contrast to others who have found singular factor structures or factorstructures that vary in different patient populations.7, 49 Although this can be largelyattributed to differences in batteries used and sample characteristics, our results suggest that
Hayden et al. Page 7
Alzheimer Dis Assoc Disord. Author manuscript; available in PMC 2012 April 1.
NIH
-PA Author Manuscript
NIH
-PA Author Manuscript
NIH
-PA Author Manuscript

there are quantitatively, not qualitatively, different cognitive patterns in the three diagnosticcategories. In conclusion, we have found that the theoretical constructs behind thedevelopment of the UDS neuropsychological battery seem to hold. Within groups, thebattery demonstrates stability over a one year period. Longer term follow-up will be usefulin determining whether factor stability is maintained longitudinally at an individual level.
AcknowledgmentsWe would like to thank Drs. Walter Kukull and Leslie Phillips for their help in acquiring the NACC data, and Dr.Weintraub for permission to reproduce table 1. We would also like to thank the study participants who contributedtheir time and effort for the advancement of Alzheimer’s disease research.
Funding Sources: This work was supported by grants from the National Alzheimer’s Coordinating Center (NACCJunior Investigator grant: 2008-JI-02) and from the National Institute on Aging (P30- AG 028377, K01AG029336).
References1. Thal LJ, Kantarci K, Reiman EM, et al. The role of biomarkers in clinical trials for Alzheimer
disease. Alzheimer Dis Assoc Disord. Jan-Mar; 2006 20(1):6–15. [PubMed: 16493230]2. Andreasen N, Blennow K. CSF biomarkers for mild cognitive impairment and early Alzheimer’s
disease. Clinical Neurology and Neurosurgery. 2005; 107(3):165–173. [PubMed: 15823670]3. Irizarry MC. Biomarkers of Alzheimer disease in plasma. NeuroRx. Apr; 2004 1(2):226–234.
[PubMed: 15717023]4. Nestor PJ, Scheltens P, Hodges JR. Advances in the early detection of Alzheimer’s disease. Nat
Med. Jul; 2004 10(Suppl):S34–41. [PubMed: 15298007]5. McKhann G, Drachman D, Folstein M, et al. Clinical diagnosis of Alzheimer’s disease: report of the
NINCDS-ADRDA Work Group under the auspices of Department of Health and Human ServicesTask Force on Alzheimer’s Disease. Neurology. Jul; 1984 34(7):939–944. [PubMed: 6610841]
6. Welsh K, Butters N, Hughes J, et al. Detection of abnormal memory decline in mild cases ofAlzheimer’s disease using CERAD neuropsychological measures. Arch Neurol. Mar; 1991 48(3):278–281. [PubMed: 2001185]
7. Kanne SM, Balota DA, Storandt M, et al. Relating anatomy to function in Alzheimer’s disease:neuropsychological profiles predict regional neuropathology 5 years later. Neurology. Apr; 199850(4):979–985. [PubMed: 9566382]
8. Davis RN, Massman PJ, Doody RS. WAIS-R factor structure in Alzheimer’s disease patients: acomparison of alternative models and an assessment of their generalizability. Psychol Aging. Dec;2003 18(4):836–843. [PubMed: 14692868]
9. Delis DC, Jacobson M, Bondi MW, et al. The myth of testing construct validity using factor analysisor correlations with normal or mixed clinical populations: lessons from memory assessment. J IntNeuropsychol Soc. Sep; 2003 9(6):936–946. [PubMed: 14632252]
10. Woodard JL, Salthouse TA, Godsall RE, et al. Confirmatory factor analysis of the Mattis DementiaRating Scale in Patients with Alzheimer’s Disease. Psychol Assessment. 1996; 8(1):85–91.
11. Siedlecki KL, Honig LS, Stern Y. Exploring the structure of a neuropsychological battery acrosshealthy elders and those with questionable dementia and Alzheimer’s disease. Neuropsychology.May; 2008 22(3):400–411. [PubMed: 18444718]
12. Weintraub S, Salmon D, Mercaldo N, et al. The Alzheimer’s Disease Centers’ Uniform Data Set(UDS): the neuropsychologic test battery. Alzheimer Dis Assoc Disord. Apr-Jun; 2009 23(2):91–101. [PubMed: 19474567]
13. Morris JC, Weintraub S, Chui HC, et al. The Uniform Data Set (UDS): clinical and cognitivevariables and descriptive data from Alzheimer Disease Centers. Alzheimer Dis Assoc Disord. Oct-Dec; 2006 20(4):210–216. [PubMed: 17132964]
14. Beekly DL, Ramos EM, Lee WW, et al. The National Alzheimer’s Coordinating Center (NACC)database: the Uniform Data Set. Alzheimer Dis Assoc Disord. Jul-Sep; 2007 21(3):249–258.[PubMed: 17804958]
Hayden et al. Page 8
Alzheimer Dis Assoc Disord. Author manuscript; available in PMC 2012 April 1.
NIH
-PA Author Manuscript
NIH
-PA Author Manuscript
NIH
-PA Author Manuscript

15. Wechsler, D. Wechsler Memory Scale-Revised Manual. Psychological Corp; San Antonio: 1987.16. Goodglass, H.; Kaplan, E.; Barresi, B. Boston Diagnostic Aphasia Examination. Third Edition.
Pro-Ed; Austin, TX: 2001.17. Kaplan, EF.; Goodglass, H.; Weintraub, S. The Boston Naming Test. Lea & Febiger; Philadelphia:
1983.18. Wechsler, D. The Wechsler Adult Intelligence Scale Revised. Psychological Corporation; San
Antonio, TX: 1987.19. Reitan, R.; Wolfson, D. The Halstead-Reitan Neuropsychological Test Battery: Theory and
Clinical Interpretation. 2nd. ed. Neuropsychology Press; Tucson, AZ: 1993.20. Morris JC, Heyman A, Mohs RC, et al. The Consortium to Establish a Registry for Alzheimer’s
Disease (CERAD). Part I. Clinical and neuropsychological assessment of Alzheimer’s disease.Neurology. Sep; 1989 39(9):1159–1165. [PubMed: 2771064]
21. Folstein MF, Folstein SE, McHugh PR. “Mini-mental state”. A practical method for grading thecognitive state of patients for the clinician. J Psychiatr Res. 1975; 12(3):189–198. [PubMed:1202204]
22. Hughes CP, Berg L, Danziger WL, et al. A new clinical scale for the staging of dementia. Br JPsychiatry. Jun.1982 140:566–572. [PubMed: 7104545]
23. Morris JC. The Clinical Dementia Rating (CDR): current version and scoring rules. Neurology.Nov; 1993 43(11):2412–2414. [PubMed: 8232972]
24. Williams MM, Roe CM, Morris JC. Stability of the Clinical Dementia Rating, 1979-2007. ArchNeurol. Jun; 2009 66(6):773–777. [PubMed: 19506139]
25. Bontempo, DE.; Hofer, SM. Assessing Factorial Invariance in Cross-Sectional and LongitudinalStudies. In: Ong, AD.; Van Dulmen, MHM., editors. Handbook of Methods in PositivePsychology. Vol. Vol 13. Oxford: 2007.
26. Gregorich SE. Do self-report instruments allow meaningful comparisons across diverse populationgroups? Testing measurement invariance using the confirmatory factor analysis framework. MedCare. Nov; 2006 44(11 Suppl 3):S78–94. [PubMed: 17060839]
27. Meredith W, Teresi JA. An essay on measurement and factorial invariance. Med Care. Nov; 200644(11 Suppl 3):S69–77. [PubMed: 17060838]
28. Teresi JA. Overview of quantitative measurement methods. Equivalence, invariance, anddifferential item functioning in health applications. Med Care. Nov; 2006 44(11 Suppl 3):S39–49.[PubMed: 17060834]
29. Blom, G. Statistical Estimates and Transformed Beta Variables. John Wiley & Sons, Inc.; NewYork: 1958.
30. SAS/STAT [computer program]. Version 9.1. Cary, NC: 2003.31. Mplus: Statistical Analysis with Latent Variables [computer program]. Version. Muthen &
Muthen; Los Angeles, CA: 1998.32. Satorra A, Bentler P. A scaled difference chi-square test statistic for moment structure analysis.
Psychometrika. 2001; 66(4):507–514.33. Rafferty AE. Bayesian Model Selection in Social Research. Sociological Methodology. 1995;
25:111–163.34. Bentler PM. Comparative fit indexes in structural models. Psychol Bull. Mar; 1990 107(2):238–
246. [PubMed: 2320703]35. Iacobucci D. Structural equations modeling: Fit Indices, sample size, and advanced topics. Journal
of Consumer Psychology. 2010; 20:90–98.36. Tucker LR, Lewis C. A Reliability Coefficient for Maximum Likelihood Factor Analysis.
Psychometrika. 1973; 38(1):1–10.37. Widaman KF, Thompson JS. On specifying the null model for incremental fit indices in structural
equation modeling. Psychol Methods. Mar; 2003 8(1):16–37. [PubMed: 12741671]38. Bryant, FB.; King, SP.; Smart, CM. Multivariate Statistical Strategies for Construct Validation. In:
Ong, AD.; Van Dulmen, MHM., editors. Handbook of Methods in Positive Psychology. Vol. Vol13. Oxford: 2007.
Hayden et al. Page 9
Alzheimer Dis Assoc Disord. Author manuscript; available in PMC 2012 April 1.
NIH
-PA Author Manuscript
NIH
-PA Author Manuscript
NIH
-PA Author Manuscript

39. Steiger JH. Structural model evaluation and modification: An interval estimation approach.Multivariate Behavioral Research. 1990; 25:173–180.
40. Joreskog, KG.; Sorbom, D. LISREL 8: User’s reference guide. Scientific Software International;Chicago: 1996.
41. Cattell RB. The Scree Test for the Number of Factors. Multivariate Behavioral Research. 1966;1(2):245–276.
42. Kaiser HF. The application of electronic computers to factor analysis. Educational andPsychological Measurement. 1960; 20:141–151.
43. Reise SP, Widaman KF, Pugh RH. Confirmatory factor analysis and item response theory: twoapproaches for exploring measurement invariance. Psychol Bull. Nov; 1993 114(3):552–566.[PubMed: 8272470]
44. Heywood HB. On finite sequences of real numbers. Proc R Soc Lond A Math Phys Char. 1931;134(824):486–501.
45. Bollen, KA. Structural equations with latent variables. Wiley; New York: 1989.46. Collie A, Shafiq-Antonacci R, Maruff P, et al. Norms and the effects of demographic variables on
a neuropsychological battery for use in healthy ageing Australian populations. Aust N Z JPsychiatry. Aug; 1999 33(4):568–575. [PubMed: 10483853]
47. Loewenstein DA, Ownby R, Schram L, et al. An evaluation of the NINCDS-ADRDAneuropsychological criteria for the assessment of Alzheimer’s disease: a confirmatory factoranalysis of single versus multi-factor models. J Clin Exp Neuropsychol. Jun; 2001 23(3):274–284.[PubMed: 11404806]
48. Price JL, McKeel DW Jr. Buckles VD, et al. Neuropathology of nondemented aging: presumptiveevidence for preclinical Alzheimer disease. Neurobiol Aging. Jul; 2009 30(7):1026–1036.[PubMed: 19376612]
49. Jones SN, Ayers CR. Psychometric properties and factor structure of an expanded CERADneuropsychological battery in an elderly VA sample. Arch Clin Neuropsychol. May; 2006 21(4):359–365. [PubMed: 16766158]
Hayden et al. Page 10
Alzheimer Dis Assoc Disord. Author manuscript; available in PMC 2012 April 1.
NIH
-PA Author Manuscript
NIH
-PA Author Manuscript
NIH
-PA Author Manuscript

Figure 1.Confirmatory factor analysis model derived from exploratory factor analysis results.
Hayden et al. Page 11
Alzheimer Dis Assoc Disord. Author manuscript; available in PMC 2012 April 1.
NIH
-PA Author Manuscript
NIH
-PA Author Manuscript
NIH
-PA Author Manuscript

NIH
-PA Author Manuscript
NIH
-PA Author Manuscript
NIH
-PA Author Manuscript
Hayden et al. Page 12
Table 1
Uniform Data Set Neuropsychologic Test Battery12*
Domain/Function Test/Measure Maximum Scores
Dementia Severity Mini-Mental State Examination (MMSE) Total MMSE (30)Total Orientation items (10)
Attention Digit Span Forward Longest sequence (9)Total correct Trials (14)
Digit Span Backward Longest sequence (8)Total correct Trials (12)
Processing Speed Digit Symbol Total no. itemscompleted in 90 s (99)
Part A, Trail Making Test Total time (150 s)
Executive Function Part B Making Test Total time (300 s)
Memory Logical Memory Story A Immediate Recall
Total itemsrecalled (25)
Logical Memory Story A Delayed Recall
Total itemsrecalled (25)
Language
Verbal Fluency Animal Listgeneration
Total itemsin 1 minute
Vegetable Listgeneration
Total itemsin 1 minute
Naming Boston Naming Test (30 odd items) Total correct (30)
*Used with permission from NACC (Dr. Weintraub).12
Alzheimer Dis Assoc Disord. Author manuscript; available in PMC 2012 April 1.

NIH
-PA Author Manuscript
NIH
-PA Author Manuscript
NIH
-PA Author Manuscript
Hayden et al. Page 13
Table 2
Demographic characteristics of 12,020 NACC participants at initial visit
Characteristic Normaln=4,780
MCIn=4,081
Dementian=3,159
Totaln=12,020
Baseline Age (SD) 74.7 (8.9) 75.5 (8.7) 76.9 (9.0) 75.6 (8.9)
Female Sex (%) 3,142 (65.7) 2,072 (50.8) 1,657 (52.5) 6,871 (57.2)
Race (White)(%) 3,925 (82.3) 3,450 (84.8) 2,618 (83.0) 9,993 (83.3)
Education (SD) 15.4 (2.8) 15.0 (3.2) 14.2 (3.3) 15.0 (3.1)
Baseline MMSE (SD) 28.8 (1.5) 26.4 (3.5) 19.3 (6.1) 25.5 (5.4)
Abbreviations: MCI=Mild Cognitive Impairment; SD=Standard Deviation; MMSE =Mini Mental State Examination.
Alzheimer Dis Assoc Disord. Author manuscript; available in PMC 2012 April 1.

NIH
-PA Author Manuscript
NIH
-PA Author Manuscript
NIH
-PA Author Manuscript
Hayden et al. Page 14
Table 3
Neuropsychological Battery Test Scores, Means (SD)
Test Normal(CDR=0.0)
MCI(CDR=0.5)
Dementia(CDR>0.5)
TotalSample
LM Immediate Recall 13.5 (4.0) 8.7 (4.7) 3.6 (3.4) 9.4(5.7)
LM Delayed Recall 12.15 (4.4) 6.35 (5.1) 1.51 (2.8) 7.50 (5.1)
Digits Forward 8.52 (2.0) 7.80 (2.1) 6.65 (2.4) 7.80 (2.3)
Forward Length 6.69 (1.1) 6.34 (1.2) 5.68 (1.4) 6.31 (1.3)
Digits Backward 6.74 (2.2) 5.68 (2.2) 4.06 (2.1) 5.70 (2.4)
Backward Length 4.87 (1.2) 4.31 (1.3) 3.33 (1.4) 4.28 (1.4)
Trail Making Part A 36.45 (17.2) 50.40 (28.4) 84.71 (43.9) 52.64 (37.8)
Trail Making Part B 97.21 (55.8) 152.05 (83.0) 227.80 (85.1) 140.94 (86.7)
Digit Symbol 45.37 (12.5) 35.15 (13.4) 21.23 (13.7) 36.28 (16.1)
Animals 19.45 (5.7) 14.96 (5.6) 8.86 (4.8) 15.21 (6.9)
Vegetables 14.35 (4.4) 10.53 (4.0) 5.87 (3.7) 10.89 (5.3)
Boston Naming 26.82 (3.6) 24.13 (5.5) 17.58 (7.8) 23.56 (6.6)
Abbreviations: LM=Logical Memory; SD=Standard Deviation; CDR=Clinical Dementia Rating
Alzheimer Dis Assoc Disord. Author manuscript; available in PMC 2012 April 1.

NIH
-PA Author Manuscript
NIH
-PA Author Manuscript
NIH
-PA Author Manuscript
Hayden et al. Page 15
Tabl
e 4
Eval
uatio
n of
Inva
rianc
e A
cros
s Gro
ups:
Sta
ndar
dize
d Fa
ctor
Loa
ding
s
Tes
t
Mod
el 1
Con
figur
al In
vari
ance
Mod
el 2
Met
ric
Inva
rian
ceM
odel
3St
rong
(Sca
lar)
Fact
oria
l Inv
aria
nce
Mod
el 4
Stri
ct In
vari
ance
Fix
vari
ance
s=1
and
mea
ns=0
;fr
ee in
terc
epts
fact
or lo
adin
gs,
and
resi
dual
var
ianc
es
Fix
fact
or lo
adin
gs, v
aria
nces
=1,
and
mea
ns=0
; fre
e in
terc
epts
and
resi
dual
var
ianc
es
Fix
inte
rcep
ts, f
acto
r lo
adin
gs, a
ndva
rian
ces;
fix m
eans
=0 in
ref
eren
cegr
oup;
free
res
idua
l var
ianc
es
Fix
inte
rcep
ts, f
acto
r lo
adin
gs,
vari
ance
s, an
d re
sidu
al v
aria
nces
;fix
mea
ns=0
in r
efer
ence
gro
up
Nor
mN
=240
9M
CI
N=2
037
Dem
N=1
564
Nor
mN
=240
9M
CI
N=2
037
Dem
N=1
564
Nor
mN
=240
9M
CI
N=2
037
Dem
N=1
564
Nor
mN
=240
9M
CI
N=2
037
Dem
N=1
564
Mem
ory
LM Im
med
iate
Rec
all
0.92
0.98
1.04
0.99
90.
980.
920.
920.
900.
850.
900.
900.
90
LM D
elay
ed R
ecal
l0.
940.
840.
630.
850.
810.
830.
930.
880.
890.
890.
890.
89
Atte
ntio
n
Dig
its F
orw
ard
0.65
0.59
0.66
0.65
0.64
0.61
0.64
0.63
0.60
0.62
0.62
0.62
Dig
its F
wd
Leng
th0.
590.
560.
630.
610.
580.
570.
600.
580.
570.
580.
580.
58
Dig
its B
ackw
ard
0.88
0.91
0.89
0.89
0.89
0.90
0.90
0.89
0.91
0.90
0.90
0.90
Dig
its B
kwd
Leng
th0.
830.
860.
850.
850.
840.
850.
850.
850.
860.
860.
860.
86
Exe
cutiv
e
Trai
ls A
0.78
0.78
0.85
0.80
0.80
0.81
0.78
0.78
0.78
0.78
0.78
0.78
Trai
ls B
0.86
0.86
0.80
0.86
0.84
0.84
0.86
0.84
0.84
0.85
0.85
0.85
WA
IS (D
igit
Sym
bol)
0.79
0.82
0.90
0.82
0.83
0.86
0.83
0.84
0.87
0.84
0.84
0.84
Lan
guag
e
Ani
mal
s0.
740.
830.
900.
780.
820.
890.
760.
800.
860.
790.
790.
79
Veg
etab
les
0.58
0.69
0.79
0.64
0.69
0.75
0.68
0.73
0.79
0.72
0.72
0.72
Bos
ton
Nam
ing
0.63
0.64
0.67
0.66
0.63
0.64
0.64
0.61
0.63
0.62
0.62
0.62
Fit S
tatis
tics
CFI
0.98
50.
975
0.96
70.
957
TLI
0.97
80.
969
0.96
30.
958
RM
SEA
0.04
70.
055
0.06
00.
064
SRM
R0.
029
0.06
50.
072
0.07
1
† BIC
, p-v
alue
, df
−46
0.77
, −,
df=1
38−25
4.30
, p<
.000
1, d
f=16
2−70
.33,
p<.
0001
, df=
178
112.
90, p
<.00
01, d
f=20
2
Alzheimer Dis Assoc Disord. Author manuscript; available in PMC 2012 April 1.

NIH
-PA Author Manuscript
NIH
-PA Author Manuscript
NIH
-PA Author Manuscript
Hayden et al. Page 16
Tes
t
Mod
el 1
Con
figur
al In
vari
ance
Mod
el 2
Met
ric
Inva
rian
ceM
odel
3St
rong
(Sca
lar)
Fact
oria
l Inv
aria
nce
Mod
el 4
Stri
ct In
vari
ance
Fix
vari
ance
s=1
and
mea
ns=0
;fr
ee in
terc
epts
fact
or lo
adin
gs,
and
resi
dual
var
ianc
es
Fix
fact
or lo
adin
gs, v
aria
nces
=1,
and
mea
ns=0
; fre
e in
terc
epts
and
resi
dual
var
ianc
es
Fix
inte
rcep
ts, f
acto
r lo
adin
gs, a
ndva
rian
ces;
fix m
eans
=0 in
ref
eren
cegr
oup;
free
res
idua
l var
ianc
es
Fix
inte
rcep
ts, f
acto
r lo
adin
gs,
vari
ance
s, an
d re
sidu
al v
aria
nces
;fix
mea
ns=0
in r
efer
ence
gro
up
Nor
mN
=240
9M
CI
N=2
037
Dem
N=1
564
Nor
mN
=240
9M
CI
N=2
037
Dem
N=1
564
Nor
mN
=240
9M
CI
N=2
037
Dem
N=1
564
Nor
mN
=240
9M
CI
N=2
037
Dem
N=1
564
† S-B
χ2 p
-val
ue, d
fdf
= 1
38p
<.00
01, d
f = 1
62p
<.00
01, d
f = 1
78p
<.00
01, d
f = 2
02
† Nes
ted
mod
els t
este
d us
ing
BIC
33 a
nd S
ator
ra-B
entle
r Sca
led χ2
test
.32
Mod
el 1
was
use
d as
the
star
ting
poin
t as t
he le
ast c
onst
rain
ed m
odel
. Eac
h m
odel
was
foun
d to
be
stat
istic
ally
sign
ifica
ntly
diff
eren
t fro
m th
e pr
ior m
odel
bas
ed o
n bo
th m
easu
res
CFI
=Com
para
tive
fit in
dex,
bet
ter f
it >0
.90;
rang
e 0.
0 -1
.0 3
4
TLI=
Tuc
ker-
Lew
is in
dex:
bet
ter f
it >
0.90
; ran
ge 0
.0 -1
.0 3
6
RM
SEA
= R
oot m
ean
squa
re e
rror
of a
ppro
xim
atio
n: b
ette
r fit
<0.0
5 39
SRM
R =
Sta
ndar
dize
d ro
ot m
ean
squa
re re
sidu
al: b
ette
r fit
<0.0
539
BIC
= B
ayes
ian
Info
rmat
ion
Crit
erio
n: b
ette
r fit<
0.0
33
S-B
=Sat
orra
-Ben
tler S
cale
d χ2
test
. 32
Alzheimer Dis Assoc Disord. Author manuscript; available in PMC 2012 April 1.

NIH
-PA Author Manuscript
NIH
-PA Author Manuscript
NIH
-PA Author Manuscript
Hayden et al. Page 17
Tabl
e 5a
Eval
uatio
n of
Inva
rianc
e O
ver T
ime:
Nor
mal
(CD
R=0
.0)
Mod
el 1
Con
figur
al In
vari
ance
Mod
el 2
Met
ric
Inva
rian
ceM
odel
3St
rong
(Sca
lar)
Fact
oria
l Inv
aria
nce
Mod
el 4
Stri
ct In
vari
ance
Tes
tM
eans
and
var
ianc
es h
eld
cons
tant
Fact
or L
oadi
ng/V
aria
nces
/Mea
nshe
ld c
onst
ant
Inte
rcep
ts/F
acto
r L
oadi
ng/
Var
ianc
es h
eld
cons
tant
, mea
ns=0
in r
efer
ence
gro
up
Inte
rcep
ts/F
acto
r L
oadi
ng/
Var
ianc
es /
Res
idua
l Var
ianc
eshe
ld c
onst
ant,
mea
ns=0
inre
fere
nce
grou
p
Bas
elin
eN
=240
9Fo
llow
-up
N=2
449
Bas
elin
eN
=240
9Fo
llow
-up
N=2
449
Bas
elin
eN
=240
9Fo
llow
-up
N=2
449
Bas
elin
eN
=240
9Fo
llow
-up
N=2
449
Mem
ory
LM Im
med
iate
Rec
all
0.92
0.90
0.91
0.91
0.91
0.91
0.91
0.91
LM D
elay
ed R
ecal
l0.
940.
960.
950.
950.
950.
950.
950.
95
Atte
ntio
n
Dig
its F
orw
ard
0.65
0.65
0.65
0.65
0.65
0.65
0.65
0.65
Dig
its F
wd
Leng
th0.
590.
600.
600.
600.
600.
600.
600.
60
Dig
its B
ackw
ard
0.88
0.85
0.87
0.86
0.87
0.86
0.86
0.86
Dig
its B
kwd
Leng
th0.
830.
810.
820.
820.
820.
820.
820.
82
Exe
cutiv
e
Trai
ls A
0.78
0.81
0.79
0.81
0.79
0.81
0.80
0.80
Trai
ls B
0.86
0.86
0.86
0.86
0.86
0.86
0.86
0.86
WA
IS (D
igit
Sym
bol)
0.79
0.79
0.79
0.79
0.79
0.79
0.79
0.79
Lan
guag
e
Ani
mal
s0.
740.
750.
740.
750.
740.
750.
750.
75
Veg
etab
les
0.58
0.62
0.59
0.61
0.59
0.61
0.60
0.60
Bos
ton
Nam
ing
0.63
0.61
0.62
0.62
0.62
0.62
0.62
0.62
Fit S
tatis
tics
CFI
0.98
40.
984
0.98
30.
984
TLI
0.97
60.
979
0.98
00.
983
RM
SEA
0.05
00.
047
0.04
50.
042
SRM
R0.
029
0.03
00.
030
0.03
0
† BIC
, p-v
alue
, df
−13
6.26
, −, 92
−22
8.65
, p<
.000
1, 1
04−28
2.61
, p<
.000
1, 1
12−39
0.92
, p<
.000
1, 1
24
Alzheimer Dis Assoc Disord. Author manuscript; available in PMC 2012 April 1.

NIH
-PA Author Manuscript
NIH
-PA Author Manuscript
NIH
-PA Author Manuscript
Hayden et al. Page 18
Mod
el 1
Con
figur
al In
vari
ance
Mod
el 2
Met
ric
Inva
rian
ceM
odel
3St
rong
(Sca
lar)
Fact
oria
l Inv
aria
nce
Mod
el 4
Stri
ct In
vari
ance
Tes
tM
eans
and
var
ianc
es h
eld
cons
tant
Fact
or L
oadi
ng/V
aria
nces
/Mea
nshe
ld c
onst
ant
Inte
rcep
ts/F
acto
r L
oadi
ng/
Var
ianc
es h
eld
cons
tant
, mea
ns=0
in r
efer
ence
gro
up
Inte
rcep
ts/F
acto
r L
oadi
ng/
Var
ianc
es /
Res
idua
l Var
ianc
eshe
ld c
onst
ant,
mea
ns=0
inre
fere
nce
grou
p
Bas
elin
eN
=240
9Fo
llow
-up
N=2
449
Bas
elin
eN
=240
9Fo
llow
-up
N=2
449
Bas
elin
eN
=240
9Fo
llow
-up
N=2
449
Bas
elin
eN
=240
9Fo
llow
-up
N=2
449
† S-B
χ2 p
-val
ue, d
fdf
= 9
2p
= 0.
002,
df =
104
p <
0.00
1, d
f = 1
12p
= 0.
03, d
f = 1
24
† Nes
ted
mod
els t
este
d us
ing
BIC
33 a
nd S
ator
ra-B
entle
r Sca
led χ2
test
.32
Mod
el 1
was
use
d as
the
star
ting
poin
t as t
he le
ast c
onst
rain
ed m
odel
. Eac
h m
odel
was
foun
d to
be
stat
istic
ally
sign
ifica
ntly
diff
eren
t fro
m th
e pr
ior m
odel
bas
ed o
n bo
th m
easu
res
CFI
=Com
para
tive
fit in
dex,
bet
ter f
it >0
.90;
rang
e 0.
0 -1
.0 3
4
TLI=
Tuc
ker-
Lew
is in
dex:
bet
ter f
it >
0.90
; ran
ge 0
.0 -1
.0 3
6
RM
SEA
= R
oot m
ean
squa
re e
rror
of a
ppro
xim
atio
n: b
ette
r fit
<0.0
539
SRM
R =
Sta
ndar
dize
d ro
ot m
ean
squa
re re
sidu
al: b
ette
r fit
<0.0
540
BIC
= B
ayes
ian
Info
rmat
ion
Crit
erio
n: b
ette
r fit<
0.03
3
S-B
=Sat
orra
-Ben
tler S
cale
d χ2
test
.32
Alzheimer Dis Assoc Disord. Author manuscript; available in PMC 2012 April 1.

NIH
-PA Author Manuscript
NIH
-PA Author Manuscript
NIH
-PA Author Manuscript
Hayden et al. Page 19
Tabl
e 5b
Eval
uatio
n of
Inva
rianc
e O
ver T
ime:
MC
I (C
DR
=0.5
)
Mod
el 1
Con
figur
al In
vari
ance
Mod
el 2
Met
ric
Inva
rian
ceM
odel
3St
rong
(Sca
lar)
Fact
oria
l Inv
aria
nce
Mod
el 4
Stri
ct In
vari
ance
Tes
tM
eans
and
var
ianc
es h
eld
cons
tant
Fact
or L
oadi
ng/V
aria
nces
/Mea
nshe
ld c
onst
ant
Inte
rcep
ts/F
acto
r L
oadi
ng/
Var
ianc
es h
eld
cons
tant
, mea
ns=0
in r
efer
ence
gro
up
Inte
rcep
ts/F
acto
r L
oadi
ng/
Var
ianc
es /
Res
idua
l Var
ianc
eshe
ld c
onst
ant,
mea
ns=0
inre
fere
nce
grou
p
Bas
elin
eN
=203
7Fo
llow
-up
N=1
514
Bas
elin
eN
=203
7Fo
llow
-up
N=1
514
Bas
elin
eN
=203
7Fo
llow
-up
N=1
514
Bas
elin
eN
=203
7Fo
llow
-up
N=1
514
Mem
ory
LM Im
med
iate
Rec
all
0.98
0.99
0.97
1.01
0.97
1.00
0.98
0.98
LM D
elay
ed R
ecal
l0.
840.
850.
840.
850.
840.
850.
850.
85
Atte
ntio
n
Dig
its F
orw
ard
0.59
.61
0.60
0.60
0.60
0.60
0.60
0.60
Dig
its F
wd
Leng
th0.
560.
560.
550.
560.
560.
560.
560.
56
Dig
its B
ackw
ard
0.91
0.88
0.89
0.90
0.89
0.90
0.90
0.90
Dig
its B
kwd
Leng
th0.
860.
820.
840.
850.
840.
850.
850.
85
Exe
cutiv
e
Trai
ls A
0.78
0.80
0.78
0.80
0.78
0.80
0.79
0.79
Trai
ls B
0.86
0.87
0.85
0.87
0.85
0.87
0.86
0.86
WA
IS (D
igit
Sym
bol)
0.82
0.83
0.81
0.84
0.81
0.84
0.82
0.82
Lan
guag
e
Ani
mal
s0.
830.
840.
830.
840.
830.
840.
830.
83
Veg
etab
les
0.69
0.73
0.69
0.72
0.69
0.72
0.70
0.70
Bos
ton
Nam
ing
0.64
0.61
0.62
0.64
0.62
0.64
0.63
0.63
Fit S
tatis
tics
CFI
0.98
70.
986
0.98
60.
984
TLI
0.98
10.
983
0.98
40.
983
RM
SEA
0.04
30.
041
0.03
90.
040
SRM
R0.
026
0.03
00.
030
0.03
3
†BIC
, p-v
alue
, df
−36
0.32
,−, 92
−43
7.35
, p<
.000
1, 1
04−49
4.06
, p<
.000
1, 1
12−53
6.81
, p<
.000
1, 1
24
Alzheimer Dis Assoc Disord. Author manuscript; available in PMC 2012 April 1.

NIH
-PA Author Manuscript
NIH
-PA Author Manuscript
NIH
-PA Author Manuscript
Hayden et al. Page 20
Mod
el 1
Con
figur
al In
vari
ance
Mod
el 2
Met
ric
Inva
rian
ceM
odel
3St
rong
(Sca
lar)
Fact
oria
l Inv
aria
nce
Mod
el 4
Stri
ct In
vari
ance
Tes
tM
eans
and
var
ianc
es h
eld
cons
tant
Fact
or L
oadi
ng/V
aria
nces
/Mea
nshe
ld c
onst
ant
Inte
rcep
ts/F
acto
r L
oadi
ng/
Var
ianc
es h
eld
cons
tant
, mea
ns=0
in r
efer
ence
gro
up
Inte
rcep
ts/F
acto
r L
oadi
ng/
Var
ianc
es /
Res
idua
l Var
ianc
eshe
ld c
onst
ant,
mea
ns=0
inre
fere
nce
grou
p
Bas
elin
eN
=203
7Fo
llow
-up
N=1
514
Bas
elin
eN
=203
7Fo
llow
-up
N=1
514
Bas
elin
eN
=203
7Fo
llow
-up
N=1
514
Bas
elin
eN
=203
7Fo
llow
-up
N=1
514
†S-B
χ2 p
-val
ue, d
fdf
= 9
2p
<.00
01, d
f = 1
04p
= 0.
003,
df =
112
p <.
0001
, df =
124
† Nes
ted
mod
els t
este
d us
ing
the
BIC
33 a
nd S
ator
ra-B
entle
r Sca
led χ2
test
.32
Mod
el 1
was
use
d as
the
star
ting
poin
t as t
he le
ast c
onst
rain
ed m
odel
. Eac
h m
odel
was
foun
d to
be
stat
istic
ally
sign
ifica
ntly
diff
eren
t fro
m th
e pr
ior m
odel
bas
ed o
n bo
th m
easu
res
CFI
=Com
para
tive
fit in
dex,
bet
ter f
it >0
.90;
rang
e 0.
0 -1
.0 3
4
TLI=
Tuc
ker-
Lew
is in
dex:
bet
ter f
it >
0.90
; ran
ge 0
.0 -1
.0 3
6
RM
SEA
= R
oot m
ean
squa
re e
rror
of a
ppro
xim
atio
n: b
ette
r fit
<0.0
539
SRM
R=
Stan
dard
ized
root
mea
n sq
uare
resi
dual
: bet
ter f
it <0
.054
0
BIC
= B
ayes
ian
Info
rmat
ion
Crit
erio
n: b
ette
r fit<
0.03
3
S-B
=Sat
orra
-Ben
tler S
cale
d χ2
test
.32
Alzheimer Dis Assoc Disord. Author manuscript; available in PMC 2012 April 1.

NIH
-PA Author Manuscript
NIH
-PA Author Manuscript
NIH
-PA Author Manuscript
Hayden et al. Page 21
Tabl
e 5c
Eval
uatio
n of
Inva
rianc
e O
ver T
ime:
Dem
entia
(CD
R>0
.5)
Mod
el 1
Con
figur
al In
vari
ance
Mod
el 2
Met
ric
Inva
rian
ceM
odel
3St
rong
(Sca
lar)
Fact
oria
l Inv
aria
nce
Mod
el 4
Stri
ct In
vari
ance
Tes
tM
eans
and
var
ianc
es h
eld
cons
tant
Fact
or L
oadi
ng/V
aria
nces
/Mea
nshe
ld c
onst
ant
Inte
rcep
ts/F
acto
r L
oadi
ng/
Var
ianc
es h
eld
cons
tant
, mea
ns=0
in r
efer
ence
gro
up
Inte
rcep
ts/F
acto
r L
oadi
ng/
Var
ianc
es /
Res
idua
l Var
ianc
eshe
ld c
onst
ant,
mea
ns=0
inre
fere
nce
grou
p
Bas
elin
eN
=156
4Fo
llow
-up
N=1
428
Bas
elin
eN
=156
4Fo
llow
-up
N=1
428
Bas
elin
eN
=156
4Fo
llow
-up
N=1
428
Bas
elin
eN
=156
4Fo
llow
-up
N=1
428
Mem
ory
LM Im
med
iate
Rec
all
1.04
1.06
1.03
1.07
1.03
1.06
1.04
1.04
LM D
elay
ed R
ecal
l0.
630.
590.
610.
610.
620.
610.
610.
61
Atte
ntio
n
Dig
its F
orw
ard
0.66
0.66
0.66
0.67
0.66
0.67
0.66
0.66
Dig
its F
wd
Leng
th0.
630.
630.
630.
630.
630.
630.
630.
63
Dig
its B
ackw
ard
0.89
0.92
0.90
0.91
0.90
0.91
0.91
0.91
Dig
its B
kwd
Leng
th0.
850.
880.
860.
880.
860.
880.
870.
87
Exe
cutiv
e
Trai
ls A
0.85
0.85
0.85
0.86
0.85
0.86
0.85
0.85
Trai
ls B
0.80
0.77
0.78
0.79
0.78
0.79
0.79
0.79
WA
IS (D
igit
Sym
bol)
0.90
0.90
0.90
0.90
0.90
0.90
0.90
0.90
Lan
guag
e
Ani
mal
s0.
900.
900.
890.
900.
890.
910.
900.
90
Veg
etab
les
0.79
0.83
0.80
0.83
0.80
0.83
0.81
0.81
Bos
ton
Nam
ing
0.67
0.74
0.69
0.72
0.69
0.72
0.70
0.70
Fit S
tatis
tics
CFI
0.98
80.
988
0.98
80.
988
TLI
0.98
30.
985
0.98
60.
987
RM
SEA
0.04
40.
041
0.04
00.
038
SRM
R0.
030
0.03
30.
034
0.03
6
† BIC
, p-v
alue
, df
−38
1.56
, −, 92
−46
4.77
, p<
.000
1, 1
04−52
2.01
, p<
.000
1, 1
12−60
1.56
, p<
.000
1, 1
24
Alzheimer Dis Assoc Disord. Author manuscript; available in PMC 2012 April 1.

NIH
-PA Author Manuscript
NIH
-PA Author Manuscript
NIH
-PA Author Manuscript
Hayden et al. Page 22
Mod
el 1
Con
figur
al In
vari
ance
Mod
el 2
Met
ric
Inva
rian
ceM
odel
3St
rong
(Sca
lar)
Fact
oria
l Inv
aria
nce
Mod
el 4
Stri
ct In
vari
ance
Tes
tM
eans
and
var
ianc
es h
eld
cons
tant
Fact
or L
oadi
ng/V
aria
nces
/Mea
nshe
ld c
onst
ant
Inte
rcep
ts/F
acto
r L
oadi
ng/
Var
ianc
es h
eld
cons
tant
, mea
ns=0
in r
efer
ence
gro
up
Inte
rcep
ts/F
acto
r L
oadi
ng/
Var
ianc
es /
Res
idua
l Var
ianc
eshe
ld c
onst
ant,
mea
ns=0
inre
fere
nce
grou
p
Bas
elin
eN
=156
4Fo
llow
-up
N=1
428
Bas
elin
eN
=156
4Fo
llow
-up
N=1
428
Bas
elin
eN
=156
4Fo
llow
-up
N=1
428
Bas
elin
eN
=156
4Fo
llow
-up
N=1
428
† S-B
χ2 p
-val
ue, d
fdf
= 9
2p
= 0.
001,
df =
104
p <
0.01
, df =
112
p =
0.00
2, d
f = 1
24
† Nes
ted
mod
els t
este
d us
ing
BIC
33 a
nd S
ator
ra-B
entle
r Sca
led χ2
test
.32
Mod
el 1
was
use
d as
the
star
ting
poin
t as t
he le
ast c
onst
rain
ed m
odel
. Eac
h m
odel
was
foun
d to
be
stat
istic
ally
sign
ifica
ntly
diff
eren
tfr
om th
e pr
ior m
odel
bas
ed o
n bo
th m
easu
res
CFI
=Com
para
tive
fit in
dex,
bet
ter f
it >0
.90;
rang
e 0.
0 -1
.0 3
4
TLI=
Tuc
ker-
Lew
is in
dex:
bet
ter f
it >
0.90
; ran
ge 0
.0 -1
.0 3
6
RM
SEA
= R
oot m
ean
squa
re e
rror
of a
ppro
xim
atio
n: b
ette
r fit
<0.0
539
SRM
R=
Stan
dard
ized
root
mea
n sq
uare
resi
dual
: bet
ter f
it <0
.054
0
BIC
= B
ayes
ian
Info
rmat
ion
Crit
erio
n: b
ette
r fit<
0.03
3
S-B
=Sat
orra
-Ben
tler S
cale
d χ2
test
.32
Alzheimer Dis Assoc Disord. Author manuscript; available in PMC 2012 April 1.


