Embed Size (px)
Citation preview

Journal of Health Economics 25 (2006) 234–247
Factor substitution in nursing homes
John Cawleya,∗, David C. Grabowskib, Richard A. Hirthc
a 124 Martha Van Rensselaer Hall, Department of Policy Analysis and Management, College of Human Ecology,Cornell University, Ithaca, NY 14853-4401, United States
b Harvard University, United Statesc University of Michigan, United States
Received 1 April 2004; received in revised form 1 June 2005; accepted 30 June 2005Available online 26 January 2006
Abstract
This paper studies factor substitution in one important sector: the nursing home industry. Specifically,we measure the extent to which nursing homes substitute materials for labor when labor becomes relativelymore expensive. From a policy perspective, factor substitution in this market is important because materials-intensive methods of care are associated with greater risks of morbidity and mortality among nursing homeresidents. Studying longitudinal data from 1991 to 2000 on nearly every nursing home in the United States,we use the method of instrumental variables (IV) to address measurement error in nursing home wages. Theresults from the IV models yield evidence of factor substitution: higher nursing home wages are associatedwith greater use of psychoactive drugs and lower quality.© 2006 Elsevier B.V. All rights reserved.
JEL classification: I12; L1; J4
Keywords: Factor substitution; Nursing homes; Long-term care
1. Introduction
Nursing homes choose between labor- and materials-intensive methods of providing manytypes of care, including feeding, incontinence, and monitoring. This paper tests whether increasesin wages for direct care providers cause nursing homes to shift away from labor-intensive, andtowards more materials-intensive, production of care and whether increases in wages result inincreases in measures of poor quality of care.
∗ Corresponding author. Tel.: +1 607 255 0952; fax: +1 607 255 4071.E-mail address: [email protected] (J. Cawley).
0167-6296/$ – see front matter © 2006 Elsevier B.V. All rights reserved.doi:10.1016/j.jhealeco.2005.06.004

J. Cawley et al. / Journal of Health Economics 25 (2006) 234–247 235
Results from this analysis have important implications for policy. 1.6 million Americans livedin nursing homes in 1999 (National Center for Health Statistics, 2002). It has been projected that inthe next 20 years, 46% of Americans who survive to age 65 will use a nursing home at some point intheir lives (Spillman and Lubitz, 2002). The provision of nursing home care in materials-intensiveways is of particular interest because such methods are associated with greater risks of morbidityand mortality (Zinn, 1993; Harrington et al., 1992) and because nursing home residents are amongthe most vulnerable in society because of their deteriorated mental and physical condition and,often, their lack of family to monitor nursing home care (Hirth et al., 2000).
Factor substitution has been studied in hospitals (Jensen and Morrisey, 1986; Morrisey andJensen, 1990), health maintenance organizations (Okunade, 2003), physician practices (Escarceand Pauly, 1998), hospital pharmacies (Okunade, 1993), dentist offices (Okunade, 1999), and fortreatment of depression (Berndt et al., 1997). Two previous studies find evidence consistent withfactor substitution in nursing homes.Weisbrod (1988, 1998)speculated that church-sponsorednursing homes face lower labor costs because their employees are willing to work for lower wagesand in some cases as volunteers, and confirmed that church-related nonprofit nursing homes usesignificantly more labor than proprietary homes. He also found that although the percentage ofresidents admitted with a prescription for sedatives was similar in for-profit and non-profit homes,those in for-profit homes received more than four times as many doses per month.Zinn (1993)finds that higher wages for nursing home workers were associated with greater use of catheters,physical restraints, and feeding tubes. The current analysis improves on the previous literatureon two dimensions. First, we use recent (1991–2000) longitudinal data on nearly every nursinghome in the United States; the previous studies each used a single cross-section from the 1970sor 1980s. Second, we examine a wider variety of measures of materials-intensive methods of careand measures of quality of care.
2. Factor substitution in the production of nursing home care
In the long run, a profit-maximizing firm chooses the cost-minimizing combination of capital,labor, and materials to produce a given amount of output. However, in the short run, capital isfixed, and firms must minimize costs by adjusting their use of labor and materials. If wages rise,holding all else constant, the standard theory of factor substitution implies that a firm will seekto minimize costs by hiring less labor and using more materials.
We next describe how factor substitution operates in nursing homes specifically. Nursinghomes are staffed in part by registered nurses (RNs) and licensed practical nurses (LPNs), butthese workers provide little direct patient care. Nurse aides (NAs) provide 80–90% of the directcare to patients (Institute of Medicine (IOM), 1996). More than 90% of NAs are women andthree-fourths have not completed high school. They earn close to the minimum wage and lessthan half of them have any employer-provided health insurance. The labor market for NAs innursing homes is very fluid and is characterized by high turnover (Munroe, 1990).
The care provided by NAs is non-technical and consists primarily of helping residents withactivities of daily living (ADLs) such as eating, dressing, bathing, toileting, and walking. Forseveral types of such care, nursing homes choose between labor- or materials-intensive mannersof care. For example, managing incontinence may be labor-intensive, through regularly scheduledtoileting and bladder rehabilitation, or materials-intensive through urethral catheterization (Zinn,1993). Nursing homes face similar decisions with respect to feeding residents (hand feedingversus feeding tubes), and in monitoring and controlling residents’ behavior (constant monitoringby staff versus physical or chemical restraints).

236 J. Cawley et al. / Journal of Health Economics 25 (2006) 234–247
In some cases, the resident or a third-party payer shoulders some of the costs of materials-intensive care. For example, in some states nursing homes receive a higher Medicaid reimburse-ment for tube-fed patients (Mitchell et al., 2003). Prescription drugs must be paid for by homesout of the Medicare per diem, but Medicaid pays a discounted price for drugs on a per-drug basis,and private payers pay the nondiscounted price of the drug (Mendelson et al., 2002). This maylead economists to ask why nursing homes do not minimize costs by reducing staffing and puttingall residents on feeding tubes and psychoactive drugs.1 It may be due to a sense of humaneness,government oversight, fear of lawsuits, or competition based on quality of care.
Homes do not have complete freedom in choosing the amount of labor used in production;minimum staffing laws impose constraints. The federal government requires that Medicaid andMedicare certified nursing homes have LPNs on duty 24 hours a day, an RN on duty at least 8 ha day, 7 days a week and an RN director of nursing in place (Omnibus Budget ReconciliationAct, 1987). Some states impose further limits on staffing (Institute of Medicine, 1996). Theserequirements prevent nursing homes that are at or close to the minimums from significantlyaltering their factor mix, and will limit nursing home response to wage increases.
Nursing homes cannot directly increase output prices to recoup higher labor costs becauseMedicaid and Medicare are the primary payers for a majority of nursing homes and their paymentrates are revised only periodically to reflect changes in input prices (General Accounting Office(GAO), 2003).
Substitution of materials-intensive methods of care for labor-intensive methods of care isof interest because materials-intensive methods are typically associated with a greater risk ofmorbidity and mortality. Urethral catheterization places the resident at greater risk for urinarytract infection and long-term complications including bladder and renal stones, abcesses, andrenal failure. Feeding tubes can result in complications including self-extubation, infections,aspiration, misplacement of the tube, and pain. Immobility resulting from physical restraints mayincrease the risk of pressure ulcers, depression, mental and physical deterioration, and mortality(Zinn, 1993). Psychotropic drugs may also result in mental and physical deterioration (Harringtonet al., 1992).
Microeconomic models of factor substitution assume that quality of the output good is heldconstant, but for the reasons just described, in nursing homes a change in the input mix maychange the quality of care. Under the conditions of perfect information, perfect rationality, costlessmobility, and privately purchased care, one would predict that residents would respond to adecrease in quality by departing for a higher-quality facility. However, consumers in the nursinghome market tend to be poorly informed, many are cognitively impaired, and many are withoutrelatives to help them make decisions (Grabowski and Hirth, 2003). Moving between nursinghomes can be costly in time and effort; as a result, it is relatively uncommon (Hirth et al., 2000).
Our specific hypotheses regarding the effect of higher wages on the production of nursinghome care are as follows.
Hypothesis 1. Increases in local wages for nursing home workers result in nursing homesemploying fewer workers.
Hypothesis 2. Increases in local wages for nursing home workers cause nursing homes to providecare in materials-intensive ways.
1 In our sample, only 0.04% of homes had all of their residents on feeding tubes and only 0.37% had all their residentson psychoactive drugs.

J. Cawley et al. / Journal of Health Economics 25 (2006) 234–247 237
Hypothesis 3. Increases in local wages for nursing home workers decrease the quality of carein nursing homes.
3. The online survey certification and reporting system (OSCAR) data
This study uses longitudinal data from the federal Online Survey Certification and Reporting(OSCAR) system for 1991–2000 for the 48 contiguous United States (excluding Alaska, Hawaii,and the District of Columbia). The OSCAR system contains information from state surveys ofall federally certified Medicaid nursing facilities and Medicare skilled nursing care homes in theU.S.2 Collected and maintained by the Centers for Medicare and Medicaid Services (CMS), theOSCAR data are used to determine whether homes are complying with federal regulations. Everyfacility has an initial survey to verify compliance. Thereafter, states resurvey each facility every12 months, on average, and at least every 15 months (Harrington et al., 1999).
Although many of the elements in the OSCAR system are self-reported by the facilities, mostvariables are generally considered accurate and reliable (Harrington et al., 2000).3 The OSCARdata have been recommended for more extensive use by a recent IOM expert panel on nursinghome quality (IOM, 2001). Our sample includes 131,517 complete surveys from 18,306 nursinghomes conducted between 1991 and 2000. Summary statistics for the sample are contained inTable 1.
The OSCAR files are supplemented with data from several sources. Quarterly data on thewages of nursing home workers are from the Covered Employment and Wages data collectedby the Bureau of Labor Statistics (BLS). Annual county level demographic data are taken fromthe Bureau of Health Professions’ Area Resource File (ARF). Annual data on aggregate stateMedicaid payment rates come from multiple sources (Harrington et al., 1999; Grabowski et al.,2004). We also use data on the effective minimum wage rate law for each state and year. Allmonetary variables are converted to year 2000 dollars using the BLS consumer price index.
4. Empirical methods
4.1. Basic model
We initially use OLS to estimate the following regression of the relationship between the costof labor and outcomes related to factor substitution:
YHT = WHT βW + VT βV + XHT βX + αT + εHT (1)
The dependent variable,YHT, represents one of several outcomes of interest at nursing homeH attime T. The first set of dependent variables measures the quantity of labor used in production.4
There are two such outcomes: the number of NA hours per resident day, and the number ofprofessional nurse (RN and LPN) hours per resident day. We predict that the sign ofβW, thecoefficient on the real wages of nursing home workers, will be negative.
2 Almost 96% of all facilities nationwide are federally certified (Strahan, 1997).3 The staffing measures in the OSCAR are known to be implausibly high for certain facilities. These facilities were
eliminated from the dataset for the purposes of this study.4 The three sets of dependent variables have been alternatively framed as structural, process and outcome based indicators
of quality (Donabedian, 1966).

238 J. Cawley et al. / Journal of Health Economics 25 (2006) 234–247
Table 1Summary statistics of OSCAR data (N = 131,517)
Variable Mean S.D.
Nurse aides hours per resident day 2.13 1.43Professional nurse hours per resident day 1.26 1.23% Residents with catheter 0.079 0.086% Residents with feeding tube 0.064 0.081% Residents with restraints 0.16 0.16% Residents with psychoactive drugs 0.43 0.19% Residents with pressure ulcers 0.073 0.068% Residents bedfast 0.063 0.091% Residents chairfast 0.48 0.21% Residents bowel incontinent 0.42 0.19% Residents bladder incontinent 0.50 0.18Average hourly wage of SIC 805 in state (year 2000 dollars) 8.98 1.47For-profit 0.67 0.47Non-profit 0.27 0.44Number of beds 107.76 74.08Hospital-based 0.12 0.32Chain 0.53 0.50Activities of daily living (ADL) index 3.79 0.60Herfindahl index 0.21 0.24Per capita income (year 2000 dollars) 29,632.05 8559.56Elderly (age 65+) per square mile 140.44 419.88Average state Medicaid payment rate (year 2000 dollars) 94.85 22.25Effective minimum wage (year 2000 dollars) 5.24 0.28Average hourly wage of SIC 53 in state (year 2000 dollars) 8.12 1.10
The second set of dependent variables measures the extent of materials-intensive care. Thereare four such outcomes of interest: the proportion of residents in the facility with catheters, tubefeedings, physical restraints, or on psychoactive drugs.5 We predict that the sign of the coefficienton nursing home worker wages will be positive.
The third set of dependents variable measure the quality of care. We predict that higher nursinghome worker wages will be associated with increases in the following measures of poor qualitynursing home care (Abt, 2004; GAO, 2002): prevalence of pressure ulcers (which are commonlytermed bedsores), the percentage of residents who spend all or most of their day in bed (“bedfast”),the percentage of residents who spend all or most of their day in a chair (“chairfast”), and thepercentage of residents with occasional or frequent bowel incontinence or occasional or frequentbladder incontinence. In addition, several of our measures of materials-intensive care are alsorecognized as measures of quality: the percentage of residents who are physically restrained, andthe percentage of residents with catheters (Abt, 2004).
For each of the outcomes represented as a percentage of residents, we use the logit transforma-tion so dependent variables are of the form ln(Pi/(1− Pi)) wherePi represents the proportion ofresidents of nursing homei. Because the logit transformation assigns no value when the percentis equal to either zero or one, zero values were recoded as 0.0001 and values of one were recoded
5 Psychoactive medications include antipsychotic, antianxiety, antidepressant, and hypnotic medications.

J. Cawley et al. / Journal of Health Economics 25 (2006) 234–247 239
as 0.9999.6 In each regression, observations are weighted according to the number of residentsin nursing homeH at timeT.
Among the independent variables in Eq.(1), WHT is the real wage of nursing home workers inthe local labor market of nursing homeH at timeT. For each state, we use the average state-levelquarterly wage associated with Standard Industrial Classification (SIC) code 805: Nursing andPersonal Care Facilities Employees. This category includes employees in skilled nursing carefacilities, intermediate care facilities, and nursing and personal care facilities not classified in thefirst two categories.7
X is a vector of control variables andα is a year-specific intercept. We include an index foractivities of daily living to control for the underlying case-mix within the facility. This indexis equal to the average number of activities of daily living (ADLs) with which residents needassistance, which reflects the average dependence of the residents in each facility. ADLs formthe cornerstone of nursing home resident classification and play a major role in all state-levelMedicaid case-mix adjustment payment systems. Total number of certified beds, profit status(for-profit, not-for-profit and government), hospital-affiliation and whether the home is part of amultiple-facility chain are also included as facility-level control variables.
A Herfindahl index is included to control for the competitiveness of the county nursing homemarket. The population of individuals over age 75 per square mile in the county, and the realmedian income in the county, are also included as regressors. Given the importance of Medicaidas a payer of nursing home services (Grabowski, 2001), we also controlled for the real averagestate Medicaid payment rate.
We adjust the standard errors to account for the fact that we are regressing individual nursinghome outcomes on a regressor (nursing home wages) that varies only by state and quarter. As aresult of regressing micro outcomes on an aggregate regressor, unadjusted standard errors willbe biased downwards (Moulton, 1990). We adjust for this by bootstrapping the standard errors,selecting with replacement all observations by particular state and quarter.8 As expected, thisadjustment considerably increases the standard errors.
4.2. Instrumental variables model
One concern with the OLS model is that we use state-level wages, which reflect with error thewages faced by each individual home. To eliminate bias resulting from the error associated withstate-level wages, we also estimate models of instrumental variables (IV) controlling for statefixed effects.
We identify two plausible instruments for the wages of nursing home workers. The first isthe effective real minimum wage in the state. The effective minimum wage is the state’s ownlegislated minimum unless the federal minimum is greater, in which case the federal minimumwage is the state’s effective minimum wage. Nursing homes are primarily staffed by nurse aideswho tend to be paid at or near the minimum wage (Institute of Medicine, 1996), so a change in
6 Results were robust to using 0.001 and 0.999 or 0.00001 and 0.99999 in recoding the zero and one values.7 We also estimated our models using the county-level wage, but this is measured at the two-digit SIC code level. SIC
code 80 includes not only nursing home workers but also workers in medical offices, clinics, hospitals, medical and dentallaboratories. Estimates using the two-digit SIC measure were less supportive of our hypotheses, we suspect because it isan inaccurate measure of the wages of nursing home workers.
8 We conduct 50 replications to estimate the bootstrap standard errors, which is in the range recommended byEfronand Tibshirani (1993).
240 J. Cawley et al. / Journal of Health Economics 25 (2006) 234–247
the effective minimum wage rate represents an exogenous shock to nursing home wages (Machinet al., 2002). Over the period 1991–2000, there were 26 instances in which states changed theireffective minimum wage relative to the federal minimum wage. There were also two changesin the federal minimum wage over our period of study; the minimum wage increased from US$4.25 to 4.75 in 1996 and from US$ 4.75 to the current level of US$ 5.15 in 1997. We assumethat such changes are uncorrelated with worker productivity and uncorrelated with the demandfor labor-intensive nursing home care.
Our second instrument is the state wage rate for similar workers in a non-health care industry;the correlation between wages in the two sectors identifies local wage shocks for a given skilllevel of worker that are uncorrelated with nursing home worker productivity or with the demandfor labor-intensive nursing home care. Specifically, our second instrument is the average state realwage for Standard Industrial Classification (SIC) code 53: General Merchandise Stores; whichincludes department stores, variety stores and miscellaneous merchandise stores. This wage rateis likely to be correlated with nurse aide wages because, as stated in a 1996 IOM report, “wagesof nursing assistants are generally near the minimum wage and are comparable to levels offeredby fast food chains and retail establishments” (p. 160). The IOM committee “heard reports ofNAs leaving health care for retail jobs when a K-Mart opened” (p. 263). In Section5: RobustnessChecks, we describe that our results are largely robust to the use of wages from other sectors asinstruments.
The identifying assumption for our IV model is that the effective minimum wage and wagesfor general merchandise store employees are correlated with true nursing home worker wages,but are uncorrelated with the errors in variables associated with the state-level BLS measure ofnursing home worker wages.
Tests of overidentification (Sargan, 1958) indicate that our instruments have similar effectsin the staffing regressions, but different effects in the regressions concerning materials-intensivecare. Given that the effective minimum wage and the wages in other sectors are very unlikely tobe affected by nursing home decisions about methods of care, we believe that both instrumentsare valid, and that the results of the overidentification test reflect the fact that the instruments havedifferent marginal effects.
The IV analyses are weighted by the number of facility residents and the standarderrors reflect Huber–White corrections for intra-home correlation. The set of instruments farexceeds the minimum standard ofStaiger and Stock (1997). Table 2indicates that the instru-ments have anF-statistic equal to 88.37 and�R2 = 0.02. The first-stage coefficients on theinstruments are of the expected sign and each instrument is statistically significant at the1% level.
IV raises standard errors, and this loss of efficiency should only be incurred if somethingis gained in terms of consistency. A Hausman test is one piece of evidence as to whetherOLS estimates are inconsistent. Testing both instruments, we reject at the 1% level the nullhypothesis of OLS consistency only for the professional staffing measure. Although these Haus-man test results suggest that only for certain outcomes is the OLS coefficient inconsistent,the failure to reject the null hypothesis should not be confused with confirmation of the null.The difference in point estimates between OLS and IV (even though often not statisticallysignificant) suggest that IV estimation offers gains in consistency that are worth the loss inefficiency.
Although it is impossible to confirm that the instruments are uncorrelated with the error termin the second-stage regression, examining whether the instruments are strongly correlated withobservable factors can be informative (McClellan et al., 1994). To this end, the sample was divided

J. Cawley et al. / Journal of Health Economics 25 (2006) 234–247 241
Table 2First stage of IV estimation
Regressor Coefficient (t-statistic)
Effective minimum wage (year 2000 dollars) 0.27 (3.77)General merchandise store wage (year 2000 dollars) 0.43 (12.80)For-profit 0.005 (0.64)Non-profit 0.001 (0.12)Nursing home beds (100s) −0.0033 (−1.71)Hospital-based 0.015 (2.56)Chain 0.008 (3.02)Average ADLs −0.004 (−1.26)Herfindahl index 0.003 (0.51)Per capita income (year 2000 dollars in 1000s) 0.0005 (2.70)Population age 65+ per square mile (1000s) 0.007 (1.44)Medicaid rate (year 2000 dollar) 0.012 (5.43)Constant 2.84 (5.51)
R2 0.96�R2 associated with the instruments 0.02F-statistic of instruments 88.37Number of observations 131,517
Dependent variable: wage of nursing home workers (year 2000 dollars). Model includes state and year fixed effects.Regressions are weighted by the total number of residents in each facility.t-Statistics reflect standard errors Huber–Whiteadjusted for correlation in the error terms within state and quarter.
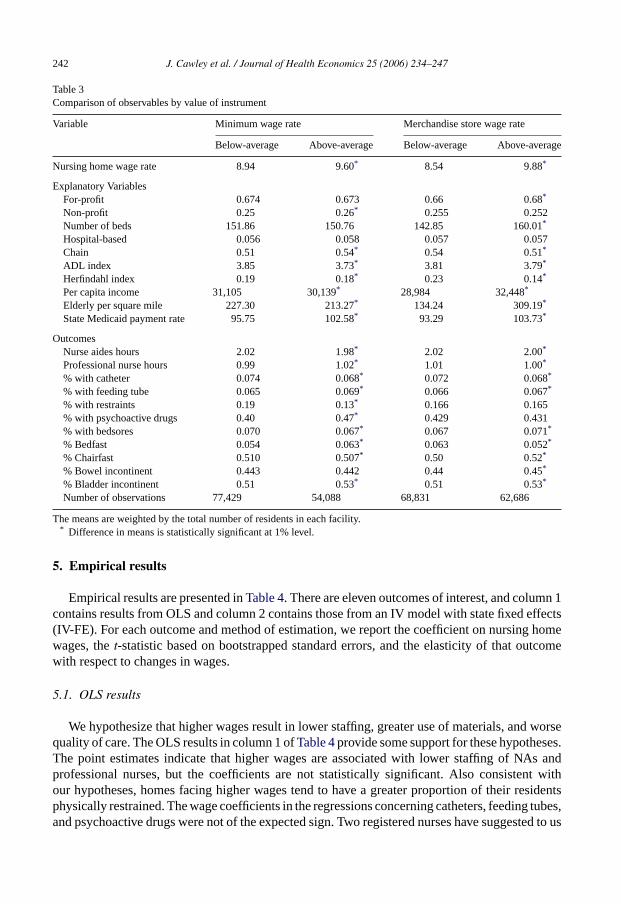
in two: observations for which the effective minimum wage was above the mean and observationsfor which it was below the mean. This process was repeated for the general merchandise storewage.Table 3lists variable means by group, and indicates whether the differences in the meansof the groups are statistically significant.
Table 3is divided into three sections. The first is devoted to nursing home wages, the secondto explanatory variables, and the third to outcome variables. The first section indicates that homesin states with above-average minimum wages pay on average 64 cents more per hour. Homesin states with above-average merchandise store wages pay on average US$ 1.34 more per hour.These are consistent with the assumption that the instruments are correlated with the potentiallyendogenous regressor.
The second section of the table presents means of the explanatory variables for the two groups.In general, the means of the variables are similar for the observations associated with above-and below-average values of the instrument; however, given the large sample, the differencein means is usually statistically significant. The largest differences in means occur betweenthose above and below the average merchandise store wage for the following variables: num-ber of beds, Herfindahl Index, per capita income, elderly per square mile and the state Medicaidpayment rate. The outcome variables in bottom section ofTable 3indicate only slight differ-ences between homes with high values of the instruments with those with low values of theinstruments. This comparison represents a preliminary, unconditional IV estimate of the effectof wages.
In summary, the instruments used in this study appear to be strongly correlated with theendogenous regressor. Although the difference in observables between homes with high and lowvalues of the instruments are usually statistically significant, the size of the difference is oftensmall.
242 J. Cawley et al. / Journal of Health Economics 25 (2006) 234–247
Table 3Comparison of observables by value of instrument
Variable Minimum wage rate Merchandise store wage rate
Below-average Above-average Below-average Above-average
Nursing home wage rate 8.94 9.60* 8.54 9.88*
Explanatory VariablesFor-profit 0.674 0.673 0.66 0.68*
Non-profit 0.25 0.26* 0.255 0.252Number of beds 151.86 150.76 142.85 160.01*
Hospital-based 0.056 0.058 0.057 0.057Chain 0.51 0.54* 0.54 0.51*
ADL index 3.85 3.73* 3.81 3.79*
Herfindahl index 0.19 0.18* 0.23 0.14*
Per capita income 31,105 30,139* 28,984 32,448*
Elderly per square mile 227.30 213.27* 134.24 309.19*
State Medicaid payment rate 95.75 102.58* 93.29 103.73*
OutcomesNurse aides hours 2.02 1.98* 2.02 2.00*
Professional nurse hours 0.99 1.02* 1.01 1.00*
% with catheter 0.074 0.068* 0.072 0.068*
% with feeding tube 0.065 0.069* 0.066 0.067*
% with restraints 0.19 0.13* 0.166 0.165% with psychoactive drugs 0.40 0.47* 0.429 0.431% with bedsores 0.070 0.067* 0.067 0.071*
% Bedfast 0.054 0.063* 0.063 0.052*
% Chairfast 0.510 0.507* 0.50 0.52*
% Bowel incontinent 0.443 0.442 0.44 0.45*
% Bladder incontinent 0.51 0.53* 0.51 0.53*
Number of observations 77,429 54,088 68,831 62,686
The means are weighted by the total number of residents in each facility.* Difference in means is statistically significant at 1% level.
5. Empirical results
Empirical results are presented inTable 4. There are eleven outcomes of interest, and column 1contains results from OLS and column 2 contains those from an IV model with state fixed effects(IV-FE). For each outcome and method of estimation, we report the coefficient on nursing homewages, thet-statistic based on bootstrapped standard errors, and the elasticity of that outcomewith respect to changes in wages.
5.1. OLS results
We hypothesize that higher wages result in lower staffing, greater use of materials, and worsequality of care. The OLS results in column 1 ofTable 4provide some support for these hypotheses.The point estimates indicate that higher wages are associated with lower staffing of NAs andprofessional nurses, but the coefficients are not statistically significant. Also consistent withour hypotheses, homes facing higher wages tend to have a greater proportion of their residentsphysically restrained. The wage coefficients in the regressions concerning catheters, feeding tubes,and psychoactive drugs were not of the expected sign. Two registered nurses have suggested to us

J. Cawley et al. / Journal of Health Economics 25 (2006) 234–247 243
Table 4Evidence of factor substitution
Dependent variable Ordinary least squares Instrumental variables withstate fixed effects
NAs per resident day −0.0092 −0.019(0.0076) (0.013)ε =−0.039 ε =−0.078
RNs and LPNs per resident day −0.0063 −0.0020(0.0051) (0.0069)ε =−0.045 ε =−0.015
Catheters −0.0457*** −0.016(0.0090) (0.018)ε =−0.378 ε =−0.131
Feeding tubes −0.005 0.036(0.019) (0.026)ε =−0.042 ε = 0.298
Physical restraints 0.116*** −0.180***
(0.023) (0.053)ε = .877 ε =−1.358
Psychoactive drugs −0.0316*** 0.051**
(0.0096) (0.021)ε =−0.162 ε = 0.263
Pressure ulcers 0.0317*** −0.016(0.0095) (0.014)ε = 0.264 ε =−0.132
Bowel 0.0359*** 0.069***
(0.0071) (0.015)ε = 0.187 ε = 0.359
Bladder 0.0317*** 0.071***
(0.0060) (0.012)ε = 0.143 ε = 0.319
Chairbound 0.0117* 0.027(0.0070) (0.019)ε = 0.054 ε = 0.123
Bedfast −0.107*** 0.102**
(0.021) (0.045)ε =−0.902 ε = 0.859
Nursing home wage coefficients (S.E.), and elasticities,N = 131,517. Standard errors are bootstrapped, with clusteringby state-quarter. From each bootstrapped sample, the regression is estimated with standard errors cluster-corrected at thenursing home level. The other regressors in each regression are: number of beds, Herfindahl index for the nursing homemarket, an index of the number of activities of daily living with which residents need assistance, real county per capitaincome, number of elderly residents in county per square mile, the real state-level Medicaid payment rate, year fixedeffects, and indicator variables for whether the nursing home is non-profit, part of a chain, or based in a hospital.
* Statistically significant at 10% level.** Statistically significant at the 5% level.
*** Statistically significant at the 1% level.

244 J. Cawley et al. / Journal of Health Economics 25 (2006) 234–247
that catheters may be a complement, not a substitute, for nurse labor, given the need for nurse timeto insert and supervise the catheter. Our results are consistent with their claim; a 10% increase innursing home wages is associated with 3.8% fewer residents with catheters.
The OLS results suggest strong impacts of wages on quality. Higher wages are associatedwith a higher percentage of residents who have pressure ulcers and who are incontinent (boweland bladder) and who are chairbound. The sign of the OLS coefficient on wages in the bedfastregression is of the opposite sign and is significant.
The mixed results may reflect bias resulting from errors in variables stemming from our useof state-level wages. To address this problem, we estimate IV models controlling for state fixedeffects.
5.2. Instrumental variables results
The IV-FE estimates are also consistent with factor substitution. The coefficients on nursinghome worker wages are negative, as predicted, in both the nurse aide and professional nurseregressions, but they are not statistically significant. Given the primary role of nurse aides indirect patient care, it is notable that the IV-FE estimate of the wage effect, while still small, isapproximately double the OLS estimate. However, the standard errors are also larger in the IV-FEmodel, leaving the effect statistically insignificant.
The IV-FE estimates are mixed as concerns the hypothesis that higher wages will lead toincreasingly materials-intensive provision of care. The wage coefficient on the psychoactive drugsregression is of the expected sign and statistically significant; an increase of 10% in nursinghome worker wages is associated with a 2.63% increase in the percent of residents who areon psychoactive drugs. The sign of the coefficient on wages in the feeding tubes regression isalso positive but is not statistically significant. The coefficients on wages in the catheters andphysical restraints regressions are of the opposite sign predicted, and that on physical restraintsis statistically significant.
The IV-FE results are strongest for the measures of quality. A 10% increase in the wagesof nursing home workers is associated with a 3.6% increase in the percent of residents withbowel incontinence, a 3.2% increase in the fraction of residents with bladder incontinence, anda 8.6% increase in the fraction of residents who are bedfast. The sign of the wage coefficient inthe chairbound regression is of the expected sign but is not statistically significant. The sign ofthe wage coefficient in the pressure ulcer regression is of the opposite sign predicted and is notstatistically significant.
In general, the IV-FE point estimates are larger in absolute magnitude than those from OLS,which is consistent with errors in variables associated with our use of state-level wages causingbias in the OLS estimates.
6. Extensions and robustness checks
We conducted the following robustness checks of these results. First, we re-estimated the modelby replacing the year dummies with year trend variable and controlling for both the national BLSproducer price index for pharmaceuticals and plastics as proxies for the costs of materials. Theresults from this alternate specification were similar to our main results.
In our models we exclude as regressors the percent of nursing home residents whose stay waspaid by Medicare and the percent paid by Medicaid, out of the concern that the labor–materialsmix of care was simultaneously determined with payer type. As a second robustness check we

J. Cawley et al. / Journal of Health Economics 25 (2006) 234–247 245
re-estimated the models controlling for percent Medicare and percent Medicaid yielded no mean-ingful changes in the results.
Third, we attempted to use only changes in minimum wage laws as an instrument but alone theyare not sufficiently powerful by the standards ofStaiger and Stock (1997). Fourth, we re-estimatedour IV models using as instruments wages from other occupations and sectors, including thoserelated to health (SIC 808: home health care, SIC 806: hospitals, and SIC 801: offices and clinicsof doctors of medicine) and sectors unrelated to health (SIC 581: eating and drinking places, andSIC 701: hotels and motels). We found that the results in the nurse aide, feeding tube, catheter, andbedsore regressions were remarkably robust to the choice of instrument. For the other outcomesof interest, professional staffing, restraints, and psychoactive drugs, results are generally robust tothe choice of wages from health sectors as instruments, but are generally not robust to the choiceof wages from a non-health sector as instruments.
Fifth, we experimented with dropping hospital-based nursing homes from our sample. Thisdid not substantially affect our estimates.
7. Conclusion
This paper measures the extent of factor substitution in the nursing home industry by estimatingIV models using longitudinal data from 1991 to 2000 on nearly every nursing home in the UnitedStates. We find evidence that when the wages of nursing home workers rise, nursing homesrespond by using more psychoactive drugs and providing a lower quality of care. Specifically, a10% increase in nursing home worker wages is associated with a 2.6% increase in the percentageof residents who are on psychoactive drugs, a 3.2–3.6% increase in the percentage of residentswho are incontinent, and a 8.6% increase in the percentage of residents who are bedfast.
The implications of these results extend beyond nursing homes.Buerhaus et al. (2000)predictthat the RN workforce will decline nearly 20% below projected workforce requirements by 2020.Ceteris paribus, this decrease in the supply of nurses will lead to higher wages. Policymakersshould anticipate that health care providers may react to such an increase in nurse wages bysubstituting away from nurse labor and towards other inputs. If the other input is physicianlabor, there may be no adverse effects for patients, but if providers substitute towards lower-skilled staff, materials or capital, patients may experience a lower quality of care. A numberof studies have already implicated low RN staffing as a source of adverse outcomes, includingincreased risk of mortality, experienced by medical and surgical patients (seeBuerhaus et al.,2002).
The existence of minimum staffing requirements may partially explain why the observeddeclines in staffing in response to higher wages were small and statistically insignificant. Nonethe-less, some effects of wages on materials use and quality were observed. Therefore, policymakersmay wish to limit the flexibility of nursing homes to substitute materials for labor. In particular,policymakers may wish to combine minimum staffing standards with indexing of Medicaid pay-ment rates to local labor market conditions so that homes with higher labor costs would receivehigher Medicaid payments. Such indexing must be combined with minimum staffing require-ments; otherwise homes in high-wage areas could pocket any additional Medicaid payment andcontinue to choose the factor mix that minimizes total costs. They may also seek to monitor andregulate the measures of poor quality of care.
Future work may seek to explore the substitution of professional nurse labor for nurse aidelabor and vice versa. We do not explore it in this paper because we lack separate wage indices forprofessional nurses and NAs with independent variation.

246 J. Cawley et al. / Journal of Health Economics 25 (2006) 234–247
Acknowledgements
The authors gratefully acknowledge financial support from the Center for Aging at the Univer-sity of Alabama at Birmingham (UAB). We thank Christine Bishop, Jim Burgess, Jeff DeSimone,Elizabeth Graddy, Dana Mukamel, Joann Spetz, two anonymous referees and seminar partici-pants at the Allied Social Science Associations meetings, Annual Health Economics Conference,Association of Public Policy and Management meetings, Southern Economic Association meet-ings, Southeastern Health Economics Study Group meetings, Cornell University, University ofRochester, Duke University, Harvard University, Indiana University–Purdue University Indi-anapolis and UAB Center for Aging for their helpful comments.
References
Abt Associates Inc., 2004. National Nursing Home Quality Measures: User’s Manual. Cambridge, MA.Berndt, E.R., Frank, R.G., McGuire, T.G., 1997. Alternative insurance arrangements and the treatment of depression.
American Journal of Managed Care 3 (2), 243–252.Buerhaus, P.I., Needleman, J., Mattke, S., Stewart, M., 2002. Strengthening hospital nursing. Health Affairs 21 (5),
123–132.Buerhaus, P.I., Staiger, D.O., Auerbach, D.I., 2000. Implications of an aging registered nurse workforce. Journal of the
American Medical Association 283 (22), 2948–2954.Donabedian, A., 1966. Evaluating the quality of medical care. Milbank Memorial Fund Quarterly 44, 166–206.Efron, B., Tibshirani, R.J., 1993. An Introduction to the Bootstrap. Chapman & Hall, New York.Escarce, J.J., Pauly, M.V., 1998. Physician opportunity costs in physician practice cost functions. Journal of Health
Economics 17, 129–151.General Accounting Office (GAO), 2002. Nursing homes: Public reporting of quality indicators has merit, but national
implementation is premature. (GAO-03-137). General Accounting Office, Washington, D.C.General Accounting Office (GAO), 2003. Medicaid Nursing Home Payments: States’ Payment Rates Largely Unaffected
by Recent Fiscal Pressures. United States General Accounting Office, Washington, DC.Grabowski, D.C., 2001. Medicaid reimbursement and the quality of nursing home care. Journal of Health Economics 20
(4), 549–569.Grabowski, D.C., Feng, Z., Intrator, O., Mor, V., 2004. Recent trends in state nursing home payment policies. Health
Affairs W4, 363–373.Grabowski, D.C., Hirth, R.A., 2003. Competitive spillovers across nonprofit and for-profit nursing homes. Journal of
Health Economics 22 (1), 1–22.Harrington, C., Swan, J.H., Wellin, V., Clemena, W., Carillo, H.M., 1999. 1998 State Data Book on Long Term Care
Program and Market Characteristics. Department of Social and Behavioral Sciences, University of California, SanFrancisco, CA.
Harrington, C., Tompkins, C., Curtis, M., Grant, L., 1992. Psychotropic drug use in long-term care facilities: a review ofthe literature. The Gerontologist 32 (6), 822–833.
Harrington, C., Zimmerman, D., Karon, S.L., Robinson, J., Beutel, P., 2000. Nursing home staffing and its relationshipto deficiencies. Journal of Gerontology: Social Sciences 55B (5), S278–S287.
Hirth, R.A., Banaszak-Holl, J.C., McCarthy, J.F., 2000. Nursing home to nursing home transfers: prevalence, time patternand resident correlates. Medical Care 38 (6), 660–669.
Institute of Medicine (IOM), 1996. Nursing Staffing in Hospitals and Nursing Homes: Is it Adequate? National AcademyPress, Washington, DC.
Institute of Medicine (IOM), 2001. Improving the Quality of Long-term Care. National Academy Press, Washington, DC.Jensen, G.A., Morrisey, M.A., 1986. The role of physicians in hospital production. Review of Economics and Statistics
68, 432–442.Machin, S., Manning, A., Rahman, L., 2002. Where the Minimum Wage Bites Hard: The Introduction of the UK National
Minimum Wage to a Low Wage Sector. London School of Economics, Unpublished data.McClellan, M., McNeill, B.J., Newhouse, J.P., 1994. Does more intensive treatment of myocardial infarction in the elderly
reduce mortality? Journal of the American Medical Association 272 (11), 859–866.

J. Cawley et al. / Journal of Health Economics 25 (2006) 234–247 247
Mendelson, D., Ramchand, R., Abramson, R., Tumlinson, A., 2002. Prescription drugs in nursing homes: managing costsand quality in a complex environment. National Health Policy Forum Issue Brief #784.
Mitchell, S.L., Buchanan, J.L., Littlehale, S., Hamel, M.B., 2003. Tube-feeding versus hand-feeding nursing home res-idents with advanced dementia: a cost comparison. Journal of the American Medical Directors Association 4 (1),27–33.
Morrisey, M.A., Jensen, G.A., 1990. Hospital demand for physicians. Quarterly Review of Economics and Business 30,16–39.
Moulton, B.R., 1990. An illustration of a pitfall in estimating the effects of aggregate variables in micro units. Review ofEconomics and Statistics 72 (2), 334–338.
Munroe, D.J., 1990. The influence of registered nurse staffing on the quality of nursing home care. Research in Nursing& Health 13 (4), 263–270.
National Center for Health Statistics, Centers for Disease Control, 2002. National Nursing Home Survey. World wideweb content.
Okunade, A.A., 2003. Are factor substitutions in HMO industry operations cost saving? Southern Economic Journal 69(4), 800–821.
Okunade, A.A., 1999. Will the real elasticity of substitution ‘in Norwegian dentistry’ please stand up? Health Economics8, 221–232.
Okunade, A.A., 1993. Production cost structure of US hospital pharmacies: time-series, cross-sectional bed size evidence.Journal of Applied Econometrics 8, 277–294.
Omnibus Budget Reconciliation Act, 1987. Subtitle C: Nursing Home Reform, Pub. L. No. 100–203.Sargan, J.D., 1958. The estimation of economic relationships using instrumental variables. Econometrica 26, 393–415.Spillman, B.C., Lubitz, J., 2002. New estimates of lifetime nursing home use: have patterns of use changed? Medical
Care 40 (10), 965–975.Staiger, D., Stock, J.H., 1997. Instrumental variables regression with weak instruments. Econometrica 65 (3), 557–586.Strahan, G.W., 1997. An overview of nursing homes and their current residents: data from the 1995 national nursing home
survey. Advance Data No. 280. National Center for Health Statistics, Centers for Disease Control and Prevention,U.S. Department of Health and Human Services.
Weisbrod, B.A., 1988. The Nonprofit Economy. Harvard University Press, Cambridge, MA.Weisbrod, B.A., 1998. Institutional form and organizational behavior. In: Powell, W.W., Clemens, E.S. (Eds.), Private
Action and the Public Good. Yale University Press, New Haven, CT.Zinn, J.S., 1993. The influence of nursing wage differentials on nursing home staffing and resident care decisions. The
Gerontologist 33 (6), 721–729.


