Embed Size (px)
Citation preview
-1
Factors influencing bug diversity (Insecta: Heteroptera)
in semi-natural habitats
CORINNE ZURBRUGG1 and THOMAS FRANK1,2,*1Zoological Institute, University of Bern, Baltzerstrasse 6, CH-3012 Bern, Switzerland; 2Present
address: Institute of Zoology, Department of Integrative Biology, University of Natural Resources
and Applied Life Sciences, Gregor Mendelstrasse 33, A-1180 Vienna, Austria; *Author for corre-
spondence (e-mail: [email protected]; phone: +43-1-47654-3201; fax: +43-1-47654-3203)
Received 9 July 2004; accepted in revised form 7 December 2004
Key words: Agroecosystems, Bug community, Canonical correspondence analysis, Ecological
compensation areas, Flower abundance, Functional groups, Insect diversity, Species richness,
Vegetation structure
Abstract. We investigated the abundance and species richness of heteropteran bugs and explored
environmental factors which influence bug diversity in three types of semi-natural habitats (wild-
flower areas, extensively used meadows, extensively grazed pastures). To cover this topic, it is
essential to know how much the relatively young wildflower areas contribute to biodiversity
compared with well-established extensive meadows and pastures. Total bug species richness and
phytophagous bug species richness were significantly higher in wildflower areas and meadows than
in pastures. In wildflower areas, we found the highest number of zoophagous bug species and
species overwintering in the egg-stage. Species overwintering as adults were most abundant in
meadows. Total number of bug species as well as species richness in either trophic groups and
overwintering strategies were significantly positively correlated with vegetation structure. Except
for overwintering strategies, the same was true to bug abundance. The bug community based on the
number of individuals per species was significantly explained by flower abundance and vegetation
structure, accounting for 18.4 and 16.8% of the variance, respectively. Our results indicate that
vegetation structure and flower abundance are key factors for bug species richness, abundance and
bug species composition. Since wildflower areas and meadows clearly increased bug species richness
and contained several specialised bug species that did not occur in pastures, we recommend the
promotion of wildflower areas and extensively used meadows in order to restore both high
heteropteran diversity and overall insect biodiversity in agricultural landscapes.
Introduction
In recent decades a dramatic decrease of biological diversity in Europeanagricultural landscapes can be observed (Edwards et al. 1999; Marshall andMoonen 2002). The rapid decline in plant and animal species diversity inmodern agricultural landscapes can be explained by two main causes. Firstly,most species disappear from agroecosystems due to habitat destruction byincreased farming intensity, a deterministic cause of extinction (Tscharntke andKruess 1999). Secondly, reductions in population size caused by habitat frag-mentation lead to further stochastic species losses (Baur and Erhardt 1995;Steffan-Dewenter and Tscharntke 2000). European countries are dominated by
Biodiversity and Conservation (2006) 15:275–294 � Springer 2006
DOI 10.1007/s10531-004-8231-7

agricultural landscapes (Jedicke 1994). Therefore, habitat managementschemes in these areas have a particularly high potential to restore overallbiodiversity and enable the survival of many species in modern cultivatedlandscapes. Invertebrates play an important role as major contributors to totalbiodiversity on farmland and as food for vertebrates, such as farmland birds(Fuller et al. 1995; McCracken and Bignal 1998). In response to an increasingawareness of the rapid decline of biological diversity, several approaches arecurrently being introduced to reduce this process. Since 1993, Swiss farmershave been financially supported to maintain ecological compensation areassuch as wildflower areas, extensively managed grasslands, hedges or orchards(Ullrich and Edwards 1999). Such non-cropped areas provide food resources,shelter and hibernation sites for insects and spiders which make different de-mands on their habitat (Lagerlof and Wallin 1993; Steffan-Dewenter andTscharntke 1997; Frank 1999; Keller and Hani 2000). Considering the differ-ential habitat use of arthropods means that only a mosaic of different habitatscan guarantee high species diversity in the agricultural landscape (Greiler 1994;Duelli and Obrist 2003). The purpose of ecological compensation areas is notonly to enhance biodiversity in intensively used arable land, but also to increasethe numbers of natural enemies of herbivores that feed on arable crops andtheir potential for natural pest control (Thomas et al. 2001; Barone and Frank2003). Because every habitat type has specific structural characteristics weassume that various habitat types contain differential insect communities.Consequently, the creation of different kinds of compensation areas is desirableto achieve high insect biodiversity. In this study three types of semi-naturalhabitats are explored, namely wildflower areas, extensively used meadows andextensively grazed pastures. Wildflower areas (a term synonymous with wild-flower or weed strips) were developed in the late 1980s, thereby being a rela-tively young type of ecological compensation area on Swiss farmland (Nentwig1988). The number of wildflower areas is continuously growing and this type ofsemi-natural area was previously shown to enhance species richness andabundance of arthropods remarkably (e.g. Lys and Nentwig 1992; Frank1998). While wildflower areas turned out to be important habitats forencouraging arthropod diversity, nothing is known about how much theycontribute to biodiversity compared with well-established compensation areassuch as extensively used meadows and extensively grazed pastures. Suchmeadows and pastures are well-tried types of ecological compensation areasbeing more common than wildflower areas. Extensive use of meadows andpastures is known to increase overall diversity of insects, including heteropt-eran bugs (Morris 2000; Di Giulio et al. 2001; Kruess and Tscharntke 2002).
Tscharntke and Greiler (1995) showed that invertebrate diversity in grass-land ecosystems could be predicted by using botanical parameters such as floraldiversity or other characteristics of vegetation structure. Considering theinfluence of environmental parameters (plant species richness, vegetationstructure, flower abundance, field size, surrounding landscape structure) oninsect diversity in different semi-natural habitats appears to be useful to
276

quantify the effect of measures enhancing biodiversity in the agriculturallandscape. True bugs (Heteroptera) were chosen as an indicator group forinsect diversity because they are an ecologically very diverse group, includingphytophagous and zoophagous species as well as generalists and specialists(Dolling 1991). Furthermore both larvae and adults live in the same habitatand react sensitively to environmental changes (Morris 1969, 1979; Otto 1996).Additionally, bug species richness was found to correlate strongly with totalarthropod richness in cultivated landscapes, making bugs an excellent groupfor biodiversity evaluation (Duelli and Obrist 1998).
The objectives of our investigation were (i) to show whether bug speciesrichness, abundance and assemblages differ significantly among wildflowerareas, extensively used meadows and pastures, and (ii) to determine commonkey factors significantly influencing bug species richness, abundance and thebug community based on the number of individuals per species. It is essentialto know how much each type of semi-natural habitat contributes to heter-opteran diversity in agroecosystems, particularly in terms of the comparisonbetween the newly established wildflower areas with the well-tried extensivemeadows and pastures. This knowledge can be used as a tool to make rec-ommendations about which types of ecological compensation areas shouldparticularly be promoted.
Material and methods
Research area and study sites
The study was carried out from the end of May to the end of September 2002 inthe western part of Bern, an intensively used arable region in Switzerland. Thearea containing the study sites measured about 9 km2. Three types of semi-natural habitats were studied (wildflower areas, extensively used meadows,extensively grazed pastures), using five replicates for each habitat type. Wild-flower areas have a minimum width of 3 m and are sown with a standardwildflower mixture of indigenous arable weeds, meadow and ruderal plantspecies (Gunter 2000). They are maintained for at least 2 years and a maximumof 6 years and the use of pesticides and fertilisers is not allowed. From thesecond year on, one half of the area may be mown in a yearly rotation after theflowering period. Extensively used meadows are sown with a standard mixtureconsisting of 95% grass and 5% herb seeds. No fertilisers and pesticides areallowed. Extensively used meadows have to be mown at least once a year butnot before 15 June. The five meadows surveyed were mown twice in thesampling period. The five wildflower areas and the five meadows were sown inspring 1999. The five pastures studied were extensively managed since spring1999, the time before they were managed intensively. Mean grazing intensity inthe extensively used pastures surveyed was 2.7 ± 0.2 cattle ha�1. Except forcow-pats, usage of additional fertilisers and pesticides is prohibited (Charollais
277

et al. 1999). Wildflower areas were dominated by Achillea millefolium, Hy-pericum perforatum, Leucanthemum vulgare, Origanum vulgare, Pastinaca sativaand Tanacetum vulgare. Plants with a high coverage in meadows were Cen-taurea jacea, Leucanthemum vulgare, Trifolium pratense and the grassesDactylis glomerata and Trisetum flavescens. In pastures, the same grasses as inthe meadows were dominant. Pastures were further dominated by Trifoliumrepens and Taraxacum officinale. The 15 study sites were selected to lie in thesame climate zone providing similar site conditions in terms of mean annualrainfall, temperature and altitude, which was about 600 m a.s.l. The size of thestudy sites ranged from 0.05 to 0.4 ha.
Sampling methods and bug parameters
Between the end of May and the end of September 2002, six samples were takenfrom each study site every 2 or 3 weeks. Sampling was only carried out when theweather conditions were favourable for bug activity, i.e. air temperature ofminimum 17 �C, sunshine, dry vegetation and moderate air conditions. Sam-pling was restricted to the period between 9.30 a.m. and 17.00 p.m., and thesampling order of the study sites varied between sampling dates. The heter-opteran bugs were collected using a standardised sweep-net method (Otto 1996).The sweep-net had a diameter of 40 cm andwas fitted with a heavy cloth suitablefor use in dense vegetation. For each sample, 100 sweeps weremade at a constantpace over a transect of about 80 m. The net was emptied after every 25th sweep,resulting in four subsamples per site at each sampling date. Afterwards, the foursubsamples were pooled and insects were killed immediately with ethyl acetate(C4H8O2). For data analysis, bug abundance (total number of adults and larvaeper site) and bug species richness (total number of adult bug species per site) wereused. Moreover, two functional groups were analysed considering the trophiclevel and the overwintering strategy of bugs, by separating into zoophagous(including zoophytophagous species) and phytophagous species, as well asspecies overwintering as eggs and species overwintering as adults. The adult bugswere determined with the help of entomological handbooks and publications(Wagner 1952, 1966, 1967, 1970–1975; Pericart 1983, 1984, 1987, 1998) and thenomenclature followedGunther and Schuster (2000). Larvae were only counted,but not determined to species level.
Environmental factors
To examine the influence of vegetation factors on bug species richness, bugabundance and bug communities, plant species richness, flower abundance andvegetation structure were analysed. Plant species richness was surveyed once inJune 2002 based on five 1 m2 plots randomly chosen in every site. Vegetation
278

structure and flower abundance were analysed six times during the bug sam-pling period. The sampling locations were ordered every 2 m along a transectof 50 m, resulting in 26 replicates per sampling date. These 50 m transects werelocated in the transects where the heteropteran bugs were collected. Flowerabundance was estimated in a 30 cm · 30 cm square using the followingscale: 0 = 0 flowers, 1 = 1–25, 2 = 26–50, 3 = 51–75, 4 = 76–100,5 =>100 flowers/900 cm2. To investigate the vegetation structure, a simplifiedversion of the point quadrat method was used (Kunzle 2002): (a) the samplingwas carried out along a transect, (b) instead of a needle a 150 cm long iron rodmeasuring 8 mm in diameter was used and (c) individual plant species were nottaken into account. The iron rod was marked at the heights of 15 cm (soillevel), 55 cm (40 cm mark), 95 cm (80 cm mark) and 135 cm (120 cm mark). Itwas put 15 cm vertically into the soil and every part of a plant, which was incontact with the rod, was counted for each height level separately. For dataanalysis, however, the arithmetic mean (mean number of plant parts touchingthe iron rod up to the height of 120 cm) of six subsamples with 26 replicateseach was used. Field size and the surrounding landscape structure were cal-culated using a 1:5000 map. The surrounding landscape structure was surveyedwithin a square by measuring the area of natural landscape in the surroundingof 300 m width of each site, thereby considering the dispersal range of heter-opteran bugs inhabiting open land (Ullrich and Edwards 1999). In this area theenvironment was separated into two habitat types: natural landscape (exten-sively managed meadows and pastures, wildflower areas, ruderal sites, orch-ards, hedges, woodlands) and others (intensively managed arable land, roads,buildings). None of the surroundings of different study sites did overlap. Fieldsize and percentage of natural landscape structure were used for statisticalanalyses.
Statistical analyses
For the analysis of the data, all samples were pooled over time, resulting in onesample per site. Flower abundance and vegetation structure were logarithmicand percentage of natural landscape structure was square root transformed toachieve normal distribution and homogeneity of residuals (Zar 1996). Per-centage data were also arcsine transformed. However, for analysis we usedsquare root transformed data, because percentage data were better normallydistributed when square root transformed. Bug data were transformed asnecessary (for details see Section Result). One-way-ANOVA was performedusing the program Systat 10.0 to ascertain differences in bug species richnessand abundance as well as differences in environmental factors between thethree habitat types. The Tukey-test was carried out for multiple comparisons.To examine the influence of environmental factors on bug species richness andabundance, multiple stepwise linear regression models (backward option) werecalculated using the program Systat 10.0. Curve estimations were used to test
279

for best fitting curves of the most explanatory factors using the program SPSS11.0. In addition to ANOVA and regression models, where only one singlevalue like species richness or abundance is analysed, canonical correspondenceanalysis (CCA) and correspondence analysis (CA) were calculated using theprogramme Canoco 4.5 (Ter Braak and Smilauer 2002). Using CCA and CA,the whole bug community was characterised based on the number of individ-uals per species and site. Species represented by less than five individuals andoccurring in only one site were omitted to reduce noise (Voigt et al. 2003). CCAand CA were performed using log (x + 0.1)-transformed species data in orderto prevent high values from unduly influencing the ordination and to considerzero values. Ordination by CCA was calculated to analyse the influence ofenvironmental factors on the bug community. The significance for each factorin the CCA was obtained by a Monte Carlo test run with 499 permutations.Ordination by CA was used to compare the similarity of the bug speciesassemblages among the three habitat types.
Results
Bug abundance and species richness in the three habitat types
Altogether we recorded 5029 individuals consisting of 1554 adults and 3476larvae of 75 bug species. In wildflower areas, we observed 69 species and 1820individuals (639 adults, 1181 larvae). In meadows, there were 53 species and1523 individuals (468 adults, 1055 larvae) and 31 species and 1686 individuals(447 adults, 1239 larvae) in pastures. Seventy per cent of all adult individualsand 28 species belonged to the Miridae, which were the dominating family inall habitat types (Table 1). Seventy-two per cent of all recorded species and85.5% of the adult individuals were phytophagous, whereas the minority werezoophagous or zoophytophagous, mainly Nabidae and Anthocoridae. Per-centages of phytophagous individuals were rather equal in all three habitattypes, but percentages of phytophagous species were lower in wildflower areas(69.4%) than in meadows and pastures (77%). Considering the overwinteringstrategy, 72% of the observed species and 66% of all individuals belonged tobugs overwintering as adults. 12.9% of the species and 20.4% of the individ-uals collected in pastures overwinter in the egg-stage. In wildflower areas30.6% and in meadows 20.7% of the species belonged to bugs overwintering aseggs, and percentages of individuals overwintering as eggs were also higher inwildflower areas (42.9%) than in meadows (34.1 %).
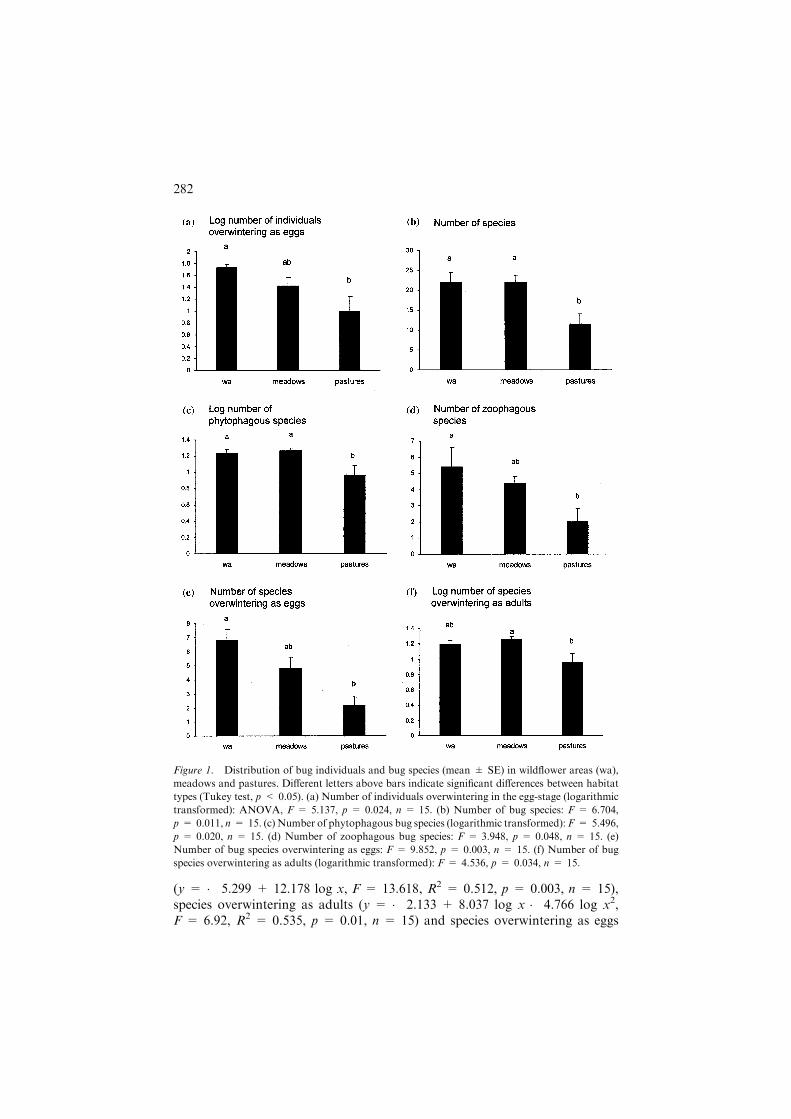
The number of bug individuals overwintering in the egg-stage was signifi-cantly higher in wildflower areas than in pastures (Figure 1a). By contrast, nodifferences were found in individuals overwintering as adults, in either trophicgroup, and in total bug abundance. The total number of bug species in wild-flower areas and meadows was significantly higher than in pastures(Figure 1b). The same was true to phytophagous bug species (Figure 1c). For
280

zoophagous species and species overwintering as eggs, significantly largernumbers were observed in wildflower areas compared to pastures (Figures 1d,e). Meadows contained significantly more species overwintering as adults thanpastures (Figure 1f).
Factors explaining bug abundance and species richness
We tested the influence of five environmental factors on bug species richnessand abundance using stepwise multiple regression. The variability of adultindividuals (Figure 2a), total bug abundance (y = 509.001 log x1.97, F = 5.53,R2 = 0.299, p = 0.035, n = 15), and the number of phytophagous individuals(�y = 12.465 log x1.28, F = 10.91, R2 = 0.456, p = 0.006, n = 15) andzoophagous individuals (�y = 5.432 log x2.02, F = 7.64, R2 = 0.37, p =0.016, n = 15) were best explained by vegetation structure. There was a sig-nificant negative relation between individuals overwintering as adults andsurrounding landscape structure in a perimeter of 300 m, which accounted for55.5% of the variance (Figure 2b). The distribution of bug individuals that areoverwintering as eggs was best explained by a negative relationship with fieldsize accounting for 69.3% of the variance (Figure 2c). Total bug speciesrichness and phytophagous bug species increased significantly with vegetationstructure, which explained 40.2% (Figure 2d) and 54.5% (Figure 2e) of thevariance, respectively. Also the variability of zoophagous bug species
Table 1. Bug families in terms of total numbers of species (sp) and adult individuals (ind)
occurring in all sites and in three types of semi-natural habitats, and percentage of individuals per
sum.
Family All sites
(n = 15)
Wildflower areas
(n = 5)
Meadows
(n = 5)
Pastures
(n = 5)
sp ind % sp ind % sp ind % sp ind %
Alydidae 1 2 0.1 0 0 0.0 1 2 0.4 0 0 0.0
Anthocoridae 4 17 1.1 4 14 2.2 2 2 0.4 1 1 0.2
Berytidae 1 6 0.4 0 0 0.0 1 4 0.9 2 2 0.5
Coreidae 2 7 0.5 2 5 0.8 1 2 0.4 0 0 0.0
Lygaeidae 9 27 1.7 6 11 1.7 5 9 1.9 7 7 1.6
Miridae 28 1087 69.9 19 404 63.2 20 318 68.0 13 365 81.6
Nabidae 8 191 12.3 8 81 12.7 6 64 13.7 5 46 10.3
Pentatomidae 9 66 4.3 6 17 2.6 6 39 8.3 4 10 2.2
Piesmatidae 1 8 0.5 0 0 0.0 1 7 1.5 1 1 0.2
Pyrrhocoridae 1 8 0.5 0 0 0.0 0 0 0.0 1 8 1.8
Rhopalidae 5 121 7.8 23 106 16.6 5 13 2.8 1 2 0.5
Saldidae 1 2 0.1 1 1 0.2 1 1 0.2 0 0 0.0
Scutelleridae 2 5 0.3 0 0 0.0 2 5 1.1 0 0 0.0
Tingidae 3 7 0.5 0 0 0.0 2 2 0.4 1 5 1.1
Sum 75 1554 100 69 639 100 53 468 100 31 447 100
Numbers refer to six samples per site. n = number of sites per habitat type.
281
(y = � 5.299 + 12.178 log x, F = 13.618, R2 = 0.512, p = 0.003, n = 15),species overwintering as adults (y = � 2.133 + 8.037 log x � 4.766 log x2,F = 6.92, R2 = 0.535, p = 0.01, n = 15) and species overwintering as eggs
Figure 1. Distribution of bug individuals and bug species (mean ± SE) in wildflower areas (wa),
meadows and pastures. Different letters above bars indicate significant differences between habitat
types (Tukey test, p < 0.05). (a) Number of individuals overwintering in the egg-stage (logarithmic
transformed): ANOVA, F = 5.137, p = 0.024, n = 15. (b) Number of bug species: F = 6.704,
p = 0.011, n = 15. (c) Number of phytophagous bug species (logarithmic transformed): F = 5.496,
p = 0.020, n = 15. (d) Number of zoophagous bug species: F = 3.948, p = 0.048, n = 15. (e)
Number of bug species overwintering as eggs: F = 9.852, p = 0.003, n = 15. (f) Number of bug
species overwintering as adults (logarithmic transformed): F = 4.536, p = 0.034, n = 15.
282

Figure 2. Effects of environmental factors on bug abundance and bug species richness. (a) Relation
between number of adult individuals and vegetation structure: y = 188.12 log x2.67, F = 13.52,
R2 = 0.51, p = 0.003, n = 15. Vegetation structure is logarithmic transformed. (b) Negative rela-
tion between number of individuals overwintering as adults and surrounding landscape:
�y = 11.696 � 0.965 �x, F = 18.451,R2 = 0.591, p = 0.001, n = 15. Surrounding landscape and
individuals overwintering as adults are square root transformed. (c) Negative relation between
number of individuals overwintering as eggs andfield size (ha): log y = 2.132 � 0.037x,F = 32.582,
R2 = 0.715, p < 0.001, n = 15. Individuals overwintering as eggs are logarithmic transformed. (d)
Relation between total number of bug species and vegetation structure: y = � 7.667 + 34.47 log x,
F = 10.396, R2 = 0.444, p = 0.007, n = 15. Vegetation structure is logarithmic transformed. (e)
Relation between number of phytophagous bug species and vegetation structure: log
y = � 2.0132 + 7.7209 log x � 4.5299 log x2, F = 7.19, R2 = 0.545, p = 0.009, n = 15. Vege-
tation structure and phytophagous bug species richness are logarithmic transformed.
283
(y = � 5.777 + 13.687 log x, F = 18.017, R2 = 0.581, p = 0.001, n = 15)were best explained by vegetation structure. Whereas total species richness,zoophagous species and species overwintering as eggs showed a continous in-crease with progressing vegetation structure (linear model), phytophagousspecies and species overwintering as adults were saturated at a certain level ofvegetation structure (quadratic model), suggesting that these bug featureswould not increase with additional vegetation structure.
Environmental factors surveyed showed different patterns between the threehabitat types. Flower abundance was significantly higher in wildflower areasthan in meadows and pastures (Tukey, p < 0.005). Vegetation structure in-creased significantly from pastures to meadows and wildflower areas(p < 0.05), and pastures were significantly larger in size than wildflower areas(p < 0.005). Plant species richness and surrounding landscape structure in aperimeter of 300 m to the study sites showed no significant differences betweenthe three habitat types. Since vegetation structure and field size differed sig-nificantly among habitat types and revealed significant relations with certainbug features, we tested whether these relations were caused by habitat effectrather than by an environmental factor. For that, we calculated multipleregression models where habitat types were dummy coded using meadows as abasis. Only in two of nine regression models (relation between adult bugindividuals and vegetation structure, and relation between bug species over-wintering as adults and vegetation structure) was there a significant habitateffect, but always explaining less variance than vegetation structure. Accord-ingly, significant relations found were predominantly due to the environmentalfactor, and only two relations were caused by both the environmental factor(vegetation structure) plus habitat effect.
Factors influencing bug communities
The bug community was examined relative to environmental factors usingcanonical correspondence analysis (CCA), which explained 44.2% of the totalvariance. Of the five environmental factors considered, only flower abundancecontributed significantly to the distribution of heteropteran bugs accountingfor 18.4% of the variance. The remaining variance was explained by the otherfactors (Table 2). A further CCA model excluding flower abundance, whichwas highly correlated with vegetation structure (Spearman’s rs = 0.861,p < 0.001, n = 15), explained 36.7% of the total variance of the bug com-munity. In this model vegetation structure was the only significant factoraccounting for 16.8% of the variance. The same results were obtained whenCCA models were analysed including also the rare species with less than fiveindividuals. A group of species (Aelia acuminata, Dicyphus globulifer, Sticto-pleurus punctatonervosus, Capsus ater, Megalocoleus molliculus, Plagiognathusarbustorum) was preferentially or exclusively found in wildflower areas(Table 3) and strongly correlated with flower abundance and vegetation
284

structure (Figure 3). Notostira elongata, Peritrechus geniculatus, Kalama tri-cornis, Piesma maculatum and Stenodema laevigata revealed an opposite dis-tribution. They were most abundant in pastures or meadows, and some ofthem were completely absent from wildflower areas (Table 3). Species corre-lated with plant species richness (Orius niger, Himacerus mirimicoides, Rhy-parochromus pini, Eysarcoris aeneus, Adelphocoris seticornis) dominated inwildfower areas or meadows and were absent from pastures.
Characterisation of the habitat types
In the correspondence analysis (CA) the cumulative percentage explained bythe first two axes was 36.2%. CA exhibited distinct clustering of the threehabitat types. Except for one site, the bug community within the wildflowerareas was very similar but clearly separated by axis 2 from communities ofmeadows and pastures. Bug species assemblages of pastures and wildflowerareas were most separated, while meadows were more similar to pastures(Figure 4).
Discussion
The dominance of the bug families Miridae, Nabidae and Rhopalidae sampledby sweep-netting in our study is typical for semi-natural habitats in cultivatedlandscapes (Kunzle 2002). Wildflower areas were characterised by oligopha-gous mirid species and mirids overwintering as eggs, and the rhopalidS. punctatonervosus. In meadows and pastures we recorded more generalistsand species overwintering as adults and bivoltine species such as the mirids
Table 2. Canonical correspondence analyses (CCA) including all environmental factors and
without flower abundance, showing variance explained by each environmental factor and Monte
Carlo procedure with 499 permutations.
Environmental factor Variance
Explained (%) p-Value F-ratio
All factors
Flower abundance 18.4 0.002 2.93
Plant species richness 7.7 0.180 1.26
Vegetation structure 6.9 0.278 1.16
Field size 6.1 0.498 1.01
Surrounding landscape 300 m 4.6 0.696 0.80
Without flower abundance
Vegetation structure 16.8 0.002 2.63
Plant species richness 7.6 0.182 1.28
Field size 6.1 0.522 0.98
Surrounding landscape 300 m 6.1 0.560 0.91
285

N. elongata, N. erratica and L. rugulipennis (Wagner 1952, 1966; Rieger 1978).Nabid species reached moderate abundances in all habitat types.
Our results clearly showed that total bug species richness and richness ofboth functional groups were usually lower in pastures than in wildflower areasand meadows. Except for individuals overwintering as eggs, however, numbersof individuals were never significantly different between any habitat type. CArevealed that the species composition of pastures was quite similar to that ofmeadows, but clearly separated from communities in wildflower areas. In allsituations but two (individuals overwintering as adults and eggs), vegetationstructure was the best explanatory factor for the distribution of bug speciesrichness and abundance. Among the factors analysed, flower abundance and
Figure 3. Canonical correspondence analysis (CCA) based on the most abundant phytophagous
(d) and zoophagous (s) bug species, showing axes 1 and 2. Environmental factors are displayed as
vectors. Abbreviations of bug species: Adelin, Adelphocoris lineolatus Gz.; Adeset, Adelphocoris
seticornis F.; Aelacu, Aelia acuminata L.; Bermin, Berytinus minor H.-S.; Clonor, Closterotomus
norvegicus Gm.; Capate, Capsus ater L.; Carfus, Carpocoris fuscispinus Boh.; Cormar, Coreus mar-
ginatus L.; Dicglo, Dicyphus globulifer Fall.; Dolbac, Dolycoris baccarum L.; Eysaen, Eysarcoris
aeneus Scop.; Himmir, Himacerus mirmicoides O.C; Kaltri, Kalama tricornis Schrank; Lepdol, Lep-
topterna dolobrata L.; Lygpra, Lygus pratensis L.; Lygrug, Lygus rugulipennis Popp.; Megmol,
Megalocoleus molliculus Fall.; Nabbre, Nabis brevis Sz; Nabfer, Nabis ferus L.; Nabpse, Nabis
pseudoferus Rem.; Nabpun, Nabis punctatus AC.; Nabrug, Nabis rugosus L.; Notelo, Notostira
elongata Geoffr.; Noterr, Notostira erratica L.; Orimaj, Orius majusculus Reut; Orinig, Orius niger
Wff; Pergen, Peritrechus geniculatus Hahn; Piemac, Piesma maculatum Lap.; Plaarb, Plagiognathus
arbustorum F.; Rhypin, Rhyparochromus pini L.; Stebin, Stenotus binotatus F.; Stecal, Stenodema
calcarata Fall.; Stelae, Stenodema laevigata L.; Stipun, Stictopleurus punctatonervosus Gz.; Tricae,
Trigonotylus caelestialium Kirk.
286

vegetation structure were the factors best explaining bug features. Becauseflower abundance and vegetation structure were highly correlated, they wererepresentative of each other. Thus, regression and CCA models led to the samepattern, indicating that both vegetation structure and flower abundance werekey factors influencing species richness, abundance (regression) and bug speciescomposition (CCA).
Although in previous studies plant species diversity was of high predictivevalue for arthropod species diversity (Dramstad and Fry 1995; Tscharntke andGreiler 1995; Kunzle 2002) and larval survival of plant feeding heteropteran
Table 3. Number of individuals of the 35 most abundance bug species in the three habitat types.
Species Family Wildflower
Areas
Meadows Pastures Total
Adelphocoris lineolatus Gz. Miridae 28 10 13 51
Adelophocoris seticornis F. Miridae 2 8 0 10
Aelia acuminate L. Pentatomidae 5 0 3 8
Berytinus minor H.S Berytidae 0 4 2 6
Capsus ater L. Miridae 74 0 0 74
Carpocoris fuscispinus Boh. Pentatomidae 2 29 5 36
Closterotomus norewegicus Gm. Miridae 44 110 12 166
Coreus marginatus L. Coreidae 4 2 0 6
Dolycoris baccarum L. Pentatomidae 3 4 1 8
Dicyphus globulifer Fail. Miridae 92 1 2 95
Eysarcoris aeneus Scop. Pentatomidae 4 1 0 5
Himacerus mirmicoides O. Costa Nabidae 8 4 0 12
Kalama tricornis Schrank Tingidae 0 1 4 5
Leptoptema dolobrate L. Miridae 40 5 0 45
Lygus Pratenis L. Miridae 11 8 1 20
Lygus rugulipennis Popp. Miridae 18 26 4 48
Megalocoleus molliculus Fall. Miridae 30 0 0 30
Nabis breve Sz. Nabidae 9 1 6 16
Nabis ferus L. Nabidae 9 19 13 41
Nabis pseudoferus Rem. Nabidae 33 12 16 61
Nabis punctatus A. Costa Nabidae 10 25 2 37
Nabis rugosus L. Nabidae 4 3 9 16
Notostira elongatea Geoffr Miridae 6 58 190 254
Notostria erratica L. Miridae 14 27 62 103
Orius majusculus Reut. Anthocoridae 6 1 1 8
Orius niger Wff. Anthocoridae 4 1 0 5
Peritrechus geniculatus Hahn Lygaeidae 1 1 6 8
Piesma maculatum Lap. Piesmatidae 0 7 1 8
Plagiognathus arbustorum F. Miridae 23 0 0 23
Rhyparochromus pini L. Lygaeidae 4 4 0 8
Stenodema calcarata Fall. Miridae 11 11 10 32
Stenodema laevigata L. Miridae 0 21 3 24
Stenotus binotatus F. Miridae 3 2 0 5
Stictopleurus punctatonervosus Gz. Rhopalidae 104 6 2 112
Trigonotylus caelestialium Kirk. Miridae 3 22 65 90
287

bugs (Di Giulio and Edwards 2003), in our study vegetation structure ex-pressed by the mean number of plant parts touching a rod was a moreimportant factor for the explanation of bug distribution. Similarly, vegetationcover abundance, a habitat characteristic comparable to vegetation structure ofthe present study, was observed to be among the best predictors of arthropodabundance (Borges and Brown 2001). Huusela-Veistola and Vasarainen (2000)showed that abundance and species richness of leafhoppers in grass stripsseemed to be more dependent on structural diversity of vegetation than onplant species richness per se. Brown et al. (1992) revealed that leafhopperassemblages were strongly affected by plant architecture as determined bygrazing treatment, but not by plant species composition except for a few spe-cialists. Intense grazing can reduce arthropod species diversity and abundance(Morris 1967; Gibson et al. 1992; Curry 1994), but it also affects grasslandthrough the selectivity of grass feeding by herbivorous vertebrates, e.g. bylocally eliminating vegetation, by causing mini successions, or through tram-pling and fertilising. These facts influence floral composition, which in turnaffects insect communities (Tscharntke and Greiler 1995). Murdoch et al.(1972) showed that ungrazed grasslands supported higher resource heteroge-neity for insects than pastures, because vegetation height was greater and thusplant architecture more complex. Kruess and Tscharntke (2002) observed ageneral trend of higher insect diversity on ungrazed grassland compared withgrazed pastures. In contrast to a mown meadow, a lightly grazed pasture isheterogeneous in its vertical vegetation structure. Nevertheless, total bug spe-cies, phytophagous bug species and species that are overwintering as adultswere more frequent in the meadows than in the pastures. The investigatedmeadows were cut twice in the sampling period. Perhaps this disturbance by
Figure 4. Correspondence analysis (CA) to compare the similarity of bug communities between
wildflower areas (s wa), meadows (u me) and pastures () pa), revealing axes 1 and 2. The five
replicates of each habitat type are enveloped to make similarities among habitat types more
apparent.
288
immediately removing the vegetation cover was not as big as the more con-tinuous disturbance by grazing. Morris (1979) showed for N. elongata that thetiming of life cycle in relation to the timing of management is important.N. elongata has two generations per year and was therefore less susceptible tocutting than univoltine grassland mirids. Furthermore, N. elongata usually wasnot significantly more common in untreated grassland compared with cutplots. N. elongata was the most abundant bug species in our study sites. Itreached much higher densities in pastures and meadows than in wildflowerareas, which shows that its phenology well fitted to the management regimesand further supports the observations described above.
There were significantly more zoophagous bug species in wildflower areasthan in pastures, whereas numbers of zoophagous individuals showed no dif-ferences between the habitat types. The reason why we only found differencesin species number is due to the fact that several rare species occurred inwildflower areas, but were absent from pastures. In the regression models thevariability of both zoophagous bug species and zoophagous individuals werebest explained by vegetation structure, which confirms previous findingsrevealing that zoophagous bug species were positively correlated with vegeta-tion structure (Kunzle 2002). Highly structured vegetation supports large insectpopulations by providing a greater potential surface for colonisation and moreresources, such as oviposition, resting and overwintering sites (May 1973; Priceet al. 1980; Lawton and Strong 1981; Lawton 1983). These advantages couldexplain the positive response of zoophagous bug species and individuals tovegetation structure. Due to denser and higher vegetation, predators find morehiding places and cover from their own enemies (Lagerlof and Wallin 1993;Morris 2000). Furthermore, richly structured habitats are colonised faster byprey populations (White and Hassal 1994), which may favour the nutritionalconditions of zoophagous bugs. Although pollen seems of poor value fordevelopment and reproduction of bugs, it perhaps represents an indirect cuefor finding developing prey populations (Fauvel 1999). Prey populations suchas thrips, aphids and psyllids were shown to be attracted by flower abundance(Russel 1989; Fauvel 1999), which was highest in wildflower areas in our study.We found most individuals of the zoophagous bugs O. niger, O. majusculus,H. mirmicoides and N. pseudoferus in wildflower areas.
The abundance of bugs, which are overwintering as eggs, was negativelyassociated with field size. Our results agree with previous research onHemiptera (Sanderson 1992) and are supported by a study reflecting highbutterfly densities in small habitats as an accumulation of individuals from thesurrounding landscape, as these fragments provide the only attractive habitatpatches (Steffan-Dewenter and Tscharntke 2000). In our study sites, field sizewas strongly negatively correlated with vegetation structure (Spearman’srs = � 0.856, p < 0.001, n = 15). This means that the smaller wildflowerareas showed a complex vegetation structure in contrast to the larger pasturesthat featured a low vegetation complexity, indicating that wildflower areasoffer better possibilities for laying eggs. One may assume that the negative
289

relationship between bug individuals overwintering as eggs and field size wascaused by the different vegetation structures in habitat types, rather than byfield size. However, partial correlation using vegetation structure as controlvariable revealed that there was a real relationship between bug individualsoverwintering as eggs and field size (partial correlation coefficient = �0.625,p = 0.017). Species overwintering as eggs depend on food plants in theiroverwintering site for development in spring, and thus cannot use annualplants (Wagner 1966; Ullrich 2001). This agrees with our study where manyhost plants of bug species overwintering in the egg-stage, such as Achillea,Tanacetum, other Asteraceae and Urtica, were most abundant in wildflowerareas. The amount of natural landscape surrounding a site had a negative effecton bug individuals overwintering as adults. Such individuals can disperse di-rectly after overwintering, thereby being independent of host plants at hiber-nation sites. Therefore, we assume that bugs overwintering as adults in fairlymonotonous areas colonise semi-natural areas where they find more favourableconditions for nutrition and reproduction. However, bugs overwintering inmore heterogenous areas may stay there and not colonise our study sites, whichmay have caused the negative relation between adult overwinterers andsurrounding landscape structure.
In the CCA, frequencies of certain bug species were strongly related tovegetation structure and flower abundance, which can be explained by the factthat these two environmental factors were positively correlated. Many speciesshowing a correlation with flower abundance and vegetation structure be-longed to the Miridae and were only abundant in wildflower areas. P. arbu-storum feeds on Urticaceae, M. molliculus on Tanacetum and Achillea, andD. globulifer onMelandryum. These findings are supported by the fact that theydepend on perennial host plants, which almost exclusively occurred in wild-flower areas. Leptopterna dolobrata is feeding on grasses (Alopecurus, Dactylis,Phleum). Thus this species would be expected to be more frequent in meadowsand pastures where these grasses are common. In former surveys L. dolobratawas adversely affected in its abundance by intensive management, thus wasreduced by both frequency of cutting and early cuts (Di Giulio et al. 2001).Since the females lay their eggs on the bottom part of grass stems (Kullenberg1944), damage to the eggs does probably not occur, but larval developmentmay be the critical phase because it takes place in June, when the extensivelyused meadows were cut. This may have been the reason for very low numbersof L. dolobrata in meadows and pastures.
In general, our results indicate that vegetation structure and flower abun-dance are of high predictive value for bug species richness, abundance and bugspecies composition. Wildflower areas and extensively used meadows hadhigher vegetation structure than extensively grazed pastures, and wildflowerareas also comprised higher flower abundance compared with pastures.Wildflower areas and extensively used meadows contained a number of spec-ialised bug species, while the pastures were characterised by common andwidespread species, which also occurred in meadows or wildflower areas. Since
290

wildflower areas and meadows clearly increased total bug species richness andthe majority of species occurring in extensively grazed pastures could also befound in the other two habitat types surveyed, we recommend the promotionof wildflower areas and extensively used meadows in order to restore highheteropteran diversity in modern cultivated landscapes. This recommendationis of practical relevance because the semi-natural habitats studied are part ofagri-environment schemes supported by the Swiss government and manage-ment prescriptions can be modified easily.
Acknowledgements
We are grateful to J.-P. Airoldi and P. Kehrli for statistical advice. Specialthanks to I. Kunzle for the help in determining the nabid species and advice infield work, and R. Egli and B. Tschanz for assistance with field work.R. Heckmann checked the determination of critical bug species. Special thanksto P. Borges and W. Rabitsch, and two anonymous referees for criticallycommenting on the draft version of the manuscript.
References
Barone M. and Frank T. 2003. Habitat age increases reproduction and nutritional condition in a
generalist arthropod predator. Oecologia 135: 78–83.
Baur B. and Erhardt A. 1995. Habitat fragmentation and habitat alterations: principal threats to
most animal and plant species. Gaia 4: 221–226.
Borges A.V. and Brown V.K. 2001. Phytophagous insects and web-building spiders in relation to
pasture vegetation complexity. Ecography 24: 68–82.
Brown V.K., Gibson C.W.D. and Kathirithamby J. 1992. Community organisation in leaf hoppers.
Oikos 65: 87–106.
Charollais M., Kuchen S., Mulhauser G., Schiess-Buhler C. and Schupbach H. 1999. Wegleitung
fur den okologischen Ausgleich auf dem Landwirtschaftsbetrieb. Landwirtschaftliche Berat-
ungszentrale LBL, Lindau.
Curry J.P. 1994. Grassland Invertebrate-ecology, Influence on Soil Fertility and Effects on Plant
Growth. Chapman and Hall, London.
Di Giulio M., Edwards P.J. and Meister E. 2001. Enhancing insect diversity in agricultural
grasslands: the roles of management and landscape structure. J. Appl. Ecol. 38: 310–319.
Di Giulio M. and Edwards P.J. 2003. The influence of host plant diversity and food quality on
larval survival of plant feeding heteropteran bugs. Ecol. Entomol. 28: 51–57.
Dolling W.R. 1991. The Hemiptera. Oxford University Press, Oxford.
Dramstad W. and Fry G. 1995. Foraging activity of bumblebees (Bombus) in relation to flower
resources on arable land. Agric. Ecosyst. Environ. 53: 123–135.
Duelli P. and Obrist K.M. 1998. In search for the best correlates for local organismal biodiversity in
cultivated areas. Biodivers. Conserv. 7: 297–309.
Duelli P. and Obrist K.M. 2003. Regional biodiversity in an agricultural landscape: the contri-
bution of seminatural habitat islands. Basic Appl. Ecol. 4: 129–138.
Edwards P.J., Kollmann J. and Wood D. 1999. Determinants of agrobiodiversity in the agricultural
landscape. In: Wood D. and Lenne J.M. (eds), Agrobiodiversity: Characterization, Utilization
and Management. CAB International, CABI Publishing, Wallingford Oxon, pp. 183–210.
291
Fauvel G. 1999. Diversity of Heteroptera in agroecosystems: role of sustainability and bioindica-
tion. Agric. Ecosyst. Environ. 74: 275–303.
Frank T. 1998. Attractiveness of sown weed strips on hoverflies (Syrphidae, Diptera), butterflies
(Rhopalocera, Ledidoptera), wild bees (Apoidea, Hymenoptera) and thread-waisted wasps
(Sphecidae, Hymenoptera). Mitt. Schweiz. Entomol. Ges. 71: 11–20.
Frank T. 1999. Density of adult hoverflies (Dipt., Syrphidae) in sown weed strips and adjacent
fields. J. Appl. Entomol. 123: 351–355.
Fuller R.J., Gregory R.D., Gibbons D.W., Marchant J.H., Wilson J.D., Baillie S.R. and Carter N.
1995. Population declines and range contractions among farmland birds in Britain. Conserv.
Biol. 9: 1425–1441.
Gibson C.W.D., Hambler C. and Brown V.K. 1992. Changes in spider (Araneae) assemblages in
relation to succession and grazing management. J. Appl. Ecol. 29: 133–142.
Greiler H.J. 1994. Insektengesellschaften auf selbstbegrunten und eingesaten Ackerbrachen.
Agrarokologie 11: 1–136.
Gunter M. 2000. Anlage und Pflege von mehrjahrigen Buntbrachen unter den Rahmenbedingungen
des schweizerischen Ackerbaugebietes. Agrarokologie 37: 1–154.
Gunther H. and Schuster G. 2000. Verzeichnis der Wanzen Mitteleuropas (Insecta: Heteroptera).
Mitt. Int. Entomol. Vereins 2: 1–69.
Huusela-Veistola E. and Vasarainen A. 2000. Plant succession in perennial grass strips and effects
on the diversity of leafhoppers (Homoptera, Auchenorrhyncha). Agric. Ecosyst. Environ. 80:
101–112.
Jedicke E. 1994. Biotopverbund. Ulmer, Stuttgart.
Keller S. and Hani F. 2000. Anspruche von Nutzlingen und Schadlingen an den Lebensraum. In:
Nentwig W. (ed), Streifenformige okologische Ausgleichsflachen in der Kulturlandschaft: Ack-
erkrautstreifen, Buntbrache, Feldrander. Verlag Agrarokologie, Bern, pp. 199–217.
Kruess A. and Tscharntke T. 2002. Contrasting responses of plant and insect diversity to variation
in grazing intensity. Biol. Conserv. 106: 293–302.
Kullenberg B. 1944. Studien uber die Biologie der Capsiden. Ph.D. thesis, University of Uppsala.
Kunzle I. 2002. Early succession of bug communities (Insecta: Heteroptera) on wildflower areas.
Diploma thesis, University of Bern.
Lagerlof J. and Wallin H. 1993. The abundance of arthropods along two field margins with
different types of vegetation composition: an experimental study. Agric. Ecosyst. Environ. 43:
141–154.
Lawton J.H. 1983. Plant architecture and the diversity of phytophagous insects. Ann. Rev.
Entomol. 28: 23–39.
Lawton J.H. and Strong D.R.J. 1981. Community patterns and competition in folivorous insects.
Am. Nat. 118: 317–338.
Lys J.-A. and Nentwig W. 1992. Augmentation of beneficial arthropods by strip-management. 4.
Surface activity, movements and activity density of abundant carabid beetles. Oecologia 92:
373–382.
Marshall E.J.P. and Moonen A.C. 2002. Field margins in Northern Europe: their functions and
interactions with agriculture. Agric. Ecosyst. Environ. 89: 5–21.
May R.M. 1973. Stability and Complexity in Model Ecosystems. Princeton University Press,
Princeton.
McCracken D.I. and Bignal E.M. 1998. Applying the results of ecological studies to land-use
policies and practices. J. Appl. Ecol. 35: 961–967.
Morris M.G. 1967. Differences between the invertebrate faunas of grazed and ungrazed chalk
grasslands. I. Responses of some phytophage insects to cessation of grazing. J. Anim. Ecol. 36:
459–474.
Morris M.G. 1969. Differences between the invertebrata faunas of grazed and ungrazed chalk
grasslands. III. The heteropterous fauna. J. Appl. Ecol. 6: 475–487.
Morris M.G. 1979. Responses of grassland invertebrates to management of cutting. II. Heterop-
tera. J. Appl. Ecol. 16: 417–432.
292

Morris M.G. 2000. The effects of structure and its dynamics on the ecology and conservation of
arthropods in British grasslands. Biol. Conserv. 95: 129–142.
Murdoch W.W., Evans F.C. and Peterson C.H. 1972. Diversity and pattern in plants and insects.
Ecology 53: 819–829.
Nentwig W. 1988. Augmentation of beneficial arthropods by strip-management. 1. Succession of
predacious arthropods and long-term change in the ratio of phytophagous and predacious
arthropods in a meadow. Oecologia 76: 597–606.
Otto A. 1996. Die Wanzenfauna montaner Magerwiesen und Grunbrachen im Kanton Tessin
(Insecta, Heteroptera). Ph.D. thesis, ETH, Zurich.
Pericart J. 1983. Hemipteres Tingidae Euro-mediterraneens. Faune de France 69. Federation
Francaise des Socieres de Sciences Naturelles, Paris.
Pericart J. 1984. Hemipteres Berytidae Euro-mediterraneens. Faune de France 70. Federation
Francaise des Socieres de Sciences Naturelles, Paris.
Pericart J. 1987. Hemipteres Nabidae d’ Europe Occidental et du Maghreb. Faune de France 71.
Federation Francaise des Socieres de Sciences Naturelles, Paris.
Pericart J. 1998. Hemipteres Lygaeidae d’ Europe Occidental et du Maghreb. Faune de France 84
A, B, C. Federation Francaise des Socieres de Sciences Naturelles, Paris.
Price P.W., Bouton C.E., Gross P., McPheron B.A., Thompson J.N. and Weis A.E. 1980. Inter-
actions among three trophic levels, the influence of plants on interactions between insect her-
bivores and natural enemies. Ann. Rev. Ecol. Syst. 11: 41–65.
Rieger C. 1978. Zur Verbreitung von Trigonotylus coelestialium (Kirklady), 1902. Mitt. Bayer.
Entomol. 27: 83–90.
Russel E.P. 1989. Enemies hypothesis: a review of the effect of vegetational diversity on predatory
insects and parasitoids. Environ. Entomol. 18: 590–599.
Sanderson R.A. 1992. Diversity and eveness of Hemiptera communities on naturally vegetated
derelict land in NW-England. Ecography 15: 154–160.
Steffan-Dewenter I. and Tscharntke T. 1997. Early succession of butterfly and plant communities
on set-aside fields. Oecologia 109: 294–302.
Steffan-Dewenter I. and Tschantke T. 2000. Butterfly community structure in fragmented habitats.
Ecol. Lett. 3: 449–456.
Ter Braak C.J.F. and Smilauer P. 2002. Canoco Reference Manual and CanoDraw for Windows
User’s Guide. Software for Canonical Community Ordination (version 4.5). Biometris,
Wageningen and Cesce Budejovice.
Thomas C.F.G., Parkinson L., Griffiths A., Fernandez Garcia A. and Marshall E.J.P. 2001.
Aggregation and temporal stability of carabid beetle distributions in field and hedgerow habitats.
J. Appl. Ecol. 38: 100–116.
Tscharntke T. and Greiler H.J. 1995. Insect communities, grasses and grasslands. Ann. Rev.
Entomol. 40: 535–558.
Tscharntke T. and Kruess A. 1999. Habitat fragmentation and biological control. In: Hawkins
B.A. and Cornell H.V. (eds), Theoretical Approaches to Biological Control. Cambridge Uni-
versity Press, Cambridge, pp. 190–205.
Ullrich K.S. 2001. The influence of wildflower-strips on plant and insect (Heteroptera) diversity in
an arable landscape. Ph.D. thesis, ETH, Zurich.
Ullrich K.S. and Edwards P.J. 1999. The colonization of wildflower-strips by insects (Heteroptera).
In: Maudsley M.J. and Marshall E.J.P. (eds), Heterogeneity in Landscape Ecology. Proceedings
of International Association for Landscape Ecology, UK, pp. 131–138.
Voigt W., Perner J., Davis A.J., Eggers T., Schumacher J., Bahrmann R., Fabian B., Heinrich W.,
Kohler G., Lichter D., Marstaller R. and Sander F. 2003. Trophic levels are differentially sen-
sitive to climate. Ecology 84: 2444–2453.
Wagner E. 1952. Blindwanzen oder Miriden. Fischer, Jena.
Wagner E. 1966. I. Pentatomorpha. Fischer, Jena.
Wagner E. 1967. II. Cimicomorpha. Fischer, Jena.
293

Wagner E. 1970–1975. Die Miridae des Mittelmeerraumes und der Makronischen Inseln
(Hemiptera, Heteroptera) Teil 1-3. Entomologische Abhandlungen 37. Akademische Ver-
lagsgesellschaft Geest & Portig, Leipzig.
White P.C.L. and Hassal M. 1994. Effects of management on spider communities of headlands in
cereal fields. Pedobiologia 38: 169–184.
Zar J.H. 1996. Biostatistical Analysis. Prentice-Hall International, London.
294


