Embed Size (px)
Citation preview
International Journal of Quality & Reliability ManagementFailure modes effects analysis (FMEA) for review of a diagnostic geneticlaboratory processKaren Claxton, Nicola Marie Campbell-Allen,
Article information:To cite this document:Karen Claxton, Nicola Marie Campbell-Allen, (2017) "Failure modes effects analysis (FMEA) forreview of a diagnostic genetic laboratory process", International Journal of Quality & ReliabilityManagement, Vol. 34 Issue: 2, pp.265-277, https://doi.org/10.1108/IJQRM-05-2015-0073Permanent link to this document:https://doi.org/10.1108/IJQRM-05-2015-0073
Downloaded on: 11 November 2017, At: 09:05 (PT)References: this document contains references to 17 other documents.To copy this document: [email protected] fulltext of this document has been downloaded 256 times since 2017*
Users who downloaded this article also downloaded:(2016),"A revised FMEA with application to a blow moulding process", International Journal ofQuality & Reliability Management, Vol. 33 Iss 7 pp. 900-919 <a href="https://doi.org/10.1108/IJQRM-10-2013-0171">https://doi.org/10.1108/IJQRM-10-2013-0171</a>(2017),"Six Sigma DMAIC project to improve the performance of an aluminum die castingoperation in Portugal", International Journal of Quality & Reliability Management, Vol. 34 Iss2 pp. 307-330 <a href="https://doi.org/10.1108/IJQRM-05-2015-0086">https://doi.org/10.1108/IJQRM-05-2015-0086</a>
Access to this document was granted through an Emerald subscription provided by emerald-srm:305060 []
For AuthorsIf you would like to write for this, or any other Emerald publication, then please use our Emeraldfor Authors service information about how to choose which publication to write for and submissionguidelines are available for all. Please visit www.emeraldinsight.com/authors for more information.
About Emerald www.emeraldinsight.comEmerald is a global publisher linking research and practice to the benefit of society. The companymanages a portfolio of more than 290 journals and over 2,350 books and book series volumes, aswell as providing an extensive range of online products and additional customer resources andservices.
Emerald is both COUNTER 4 and TRANSFER compliant. The organization is a partner of theCommittee on Publication Ethics (COPE) and also works with Portico and the LOCKSS initiative fordigital archive preservation.
*Related content and download information correct at time of download.
Dow
nloa
ded
by U
nive
rsity
of
Flor
ida
At 0
9:05
11
Nov
embe
r 20
17 (
PT)
Failure modes effects analysis(FMEA) for review of a diagnostic
genetic laboratory processKaren Claxton and Nicola Marie Campbell-Allen
School of Engineering and Advanced Technology, Massey University,Palmerston North, New Zealand
AbstractPurpose – For any improvement tool to be successfully integrated into an organizations’ qualityimprovement or risk management programme, it needs to be relatively easy-to-use and proven to providebenefits to the customer and organization. Many healthcare organizations are facing fiscal constraints andincreasing complexity of tests, putting strains on resources, particularly for those on “the shop floor” who are“hands on” in the design, delivery and improvement of products or services. Within a laboratory setting,there is often limited time for formal extensive process reviews; with the pressure to meet “turn-around times”for often “clinically urgent” results. Preventative and corrective actions are often identified through audits orroot-cause analysis in some cases after an event has occurred. The paper aims to discuss these issues.Design/methodology/approach – Failure modes effect analysis (FMEA) is a risk management tool, usedto identify prospective failures within processes or products, before they occur. Within laboratory healthcare,risk management for prevention of failure (particularly an inaccurate result) is imperative, and underpins thedesign of all steps of sample handling. FMEA was used to review a laboratory process for a “gene mutationtest” initially considered to have few opportunities for improvement. Despite this perception, a previousreview of the process, and the time restrictions for review, new improvements were identified withimplications to patient management.Findings – This study shows that FMEA can yield benefits, for prospective risk management and generalprocess improvement, within a laboratory setting where time and team input is restricted, and within aprocess that was considered to have few “problems”.Originality/value – The study was undertaken in a large metropolitan public health system laboratory –one of the largest in the country. This laboratory is a significant contributor to the health outcomes of patientsin the local region, and through its contribution to national laboratory testing and reporting. This was the firstuse of FMEA in this laboratory setting.Keywords Process improvement, Laboratory, Risk management, Failure modes effects analysis (FMEA),Quality managementPaper type Case study
1. IntroductionWithin healthcare settings accuracy and speed of reporting of laboratory results (turn-around time (TAT) – from receipt to reporting), is vital to clinical management. Delays ormistakes in reporting can negatively influence treatment initiation and procedure choice.These treatments and choices may affect “critical to health” outcomes. Laboratory tests areevolving as technological and treatment advances are made. Continuous reviews, throughquality improvement initiatives are important for meeting and adjusting to these changingneeds. Within many laboratory settings however, there is often limited time for moreproactive formal, team-based and extensive review processes of new and existing tests, withincreasing pressure to meet TAT for often clinically urgent results, increasing referralnumbers, cuts in staffing and the increasing complexity of tests. Preventative and correctiveactions may only occur following audits or root-cause analysis after an event has occurred,or a customer complaint has been received.
This paper discusses the results of a year-long project taken as part of studies towards aPost Graduate Diploma in Quality Systems at the Massey University, New Zealand.The study was undertaken in a large metropolitan public health system laboratory – one of
International Journal of Quality &Reliability Management
Vol. 34 No. 2, 2017pp. 265-277
© Emerald Publishing Limited0265-671X
DOI 10.1108/IJQRM-05-2015-0073
Received 6 May 2015Revised 22 October 2015
Accepted 16 November 2015
The current issue and full text archive of this journal is available on Emerald Insight at:www.emeraldinsight.com/0265-671X.htm
265
Failure modeseffects analysis
Dow
nloa
ded
by U
nive
rsity
of
Flor
ida
At 0
9:05
11
Nov
embe
r 20
17 (
PT)
the largest in the country. This laboratory is a significant contributor to the health outcomesof patients in the local region, and through its contribution to national laboratory testingand reporting.
Failure modes effect analysis (FMEA) is a risk management tool, used to identifyprospective failures within a process, product or service, before they occur, so that proactivesteps can be taken to design and implement robust processes. FMEA has been implementedin a number of varying scenarios and its name can reflect this usage – for example it canbe implemented:
• in the early design stages of a new product or service – and is referred in thatinstance as design FMEA;
• prior to implementation of manufacturing and/or service delivery processes inproduction or service settings – sometimes referred to as potential FMEA, FMEAand criticality analysis (FMECA), process FMEA; and
• as part of continuous improvement strategies, and pre- and post-process alterations.
Within laboratory healthcare, risk management for prevention of failure (particularly aninaccurate result) is imperative, and underpins the design of all steps of sample handlingfrom receipt to reporting. FMEA in this setting can be used to examine and document indetail, all steps of a process for failures (actual and/or potential), significance (or criticality)to the customer, and possible causes and existing controls to detect, prevent orreduce occurrence.
FMEA is used as an accreditation requirement for proactive risk management withinhealthcare organizations overseas (Shebl et al., 2012; Van Tilberg et al., 2006). Within NewZealand, ISO15189, 4.11 (NZS/ISO), stipulates that laboratories shall have documentedprocedures for determining where potential non-conformities exist, through review of dataand information – but it does not specify a method. Audits have the capacity forpreventative action limited to the scope of each review. FMEA is a proactive “self-auditing”improvement tool that provides for a detailed review and analysis of processes, and astructured systematic format for proactive identification of corrective and preventativeactions to reduce risks to the customer.
FMEA can be viewed as an extension of Shewhart’s PDCA cycle (Deming, 1986),examining not only the current, but the potential “situation” for each process step, “planningand doing” through recommended actions, “acting and checking” from following throughand re-evaluation for continuous improvement (McCain, 2006). FMEA can be used at thedevelopment stage, or for review of an existing process or product (Teng et al., 2004).
Implementation of FMEA involves the creation of a risk priority number (RPN) whichresults by rating the severity of each potential failure to the customer (S), the likelihood ofoccurrence of the failure (O) and the likelihood of detection (D) before the effect of the failurereaches the customer (McCain, 2006). The rating numbers are multiplied to determine aRPN, which is then used for prioritizing action (higher numbers generally taking priority),and measuring the effect of change after improvements are implemented (Tague, 2004;Rodriguez-Perez and Pena-Rodriguez, 2012). FMEA (and its variants) have been seen as atime-consuming tool and has not been used in this laboratory setting previously.
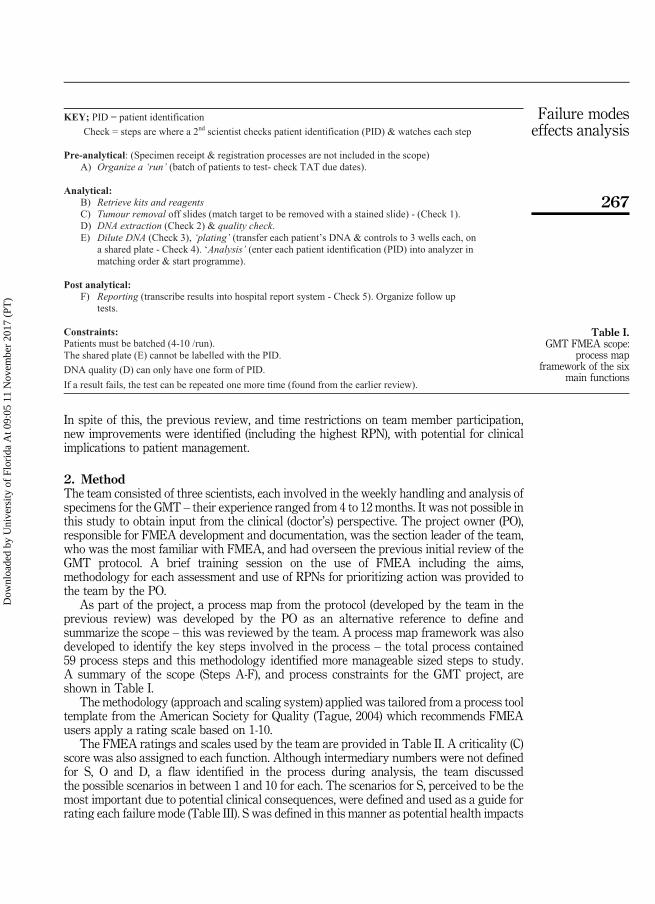
FMEA was used to review the “analytical” and “post analytical” phases of a newlaboratory process – a gene mutation test (GMT), (refer Table I), one year afterimplementation, and nine months after a process review (using brainstorming), resulting inimproved workflow. The aims of the FMEA were to use the same team to determine iffurther improvements could be identified, and to examine the utility of the FMEA’sstructured analysis and ranking system in prioritizing and minimizing risk in this setting.
The GMT uses a “black box” technology for the analytical phase, reliant on stepsset by the manufacturer, with restricted variation and limited access to process details.
266
IJQRM34,2
Dow
nloa
ded
by U
nive
rsity
of
Flor
ida
At 0
9:05
11
Nov
embe
r 20
17 (
PT)
In spite of this, the previous review, and time restrictions on team member participation,new improvements were identified (including the highest RPN), with potential for clinicalimplications to patient management.
2. MethodThe team consisted of three scientists, each involved in the weekly handling and analysis ofspecimens for the GMT – their experience ranged from 4 to 12 months. It was not possible inthis study to obtain input from the clinical (doctor’s) perspective. The project owner (PO),responsible for FMEA development and documentation, was the section leader of the team,who was the most familiar with FMEA, and had overseen the previous initial review of theGMT protocol. A brief training session on the use of FMEA including the aims,methodology for each assessment and use of RPNs for prioritizing action was provided tothe team by the PO.
As part of the project, a process map from the protocol (developed by the team in theprevious review) was developed by the PO as an alternative reference to define andsummarize the scope – this was reviewed by the team. A process map framework was alsodeveloped to identify the key steps involved in the process – the total process contained59 process steps and this methodology identified more manageable sized steps to study.A summary of the scope (Steps A-F), and process constraints for the GMT project, areshown in Table I.
The methodology (approach and scaling system) applied was tailored from a process tooltemplate from the American Society for Quality (Tague, 2004) which recommends FMEAusers apply a rating scale based on 1-10.
The FMEA ratings and scales used by the team are provided in Table II. A criticality (C)score was also assigned to each function. Although intermediary numbers were not definedfor S, O and D, a flaw identified in the process during analysis, the team discussedthe possible scenarios in between 1 and 10 for each. The scenarios for S, perceived to be themost important due to potential clinical consequences, were defined and used as a guide forrating each failure mode (Table III). S was defined in this manner as potential health impacts
Table I.GMT FMEA scope:
process mapframework of the six
main functions
267
Failure modeseffects analysis
Dow
nloa
ded
by U
nive
rsity
of
Flor
ida
At 0
9:05
11
Nov
embe
r 20
17 (
PT)
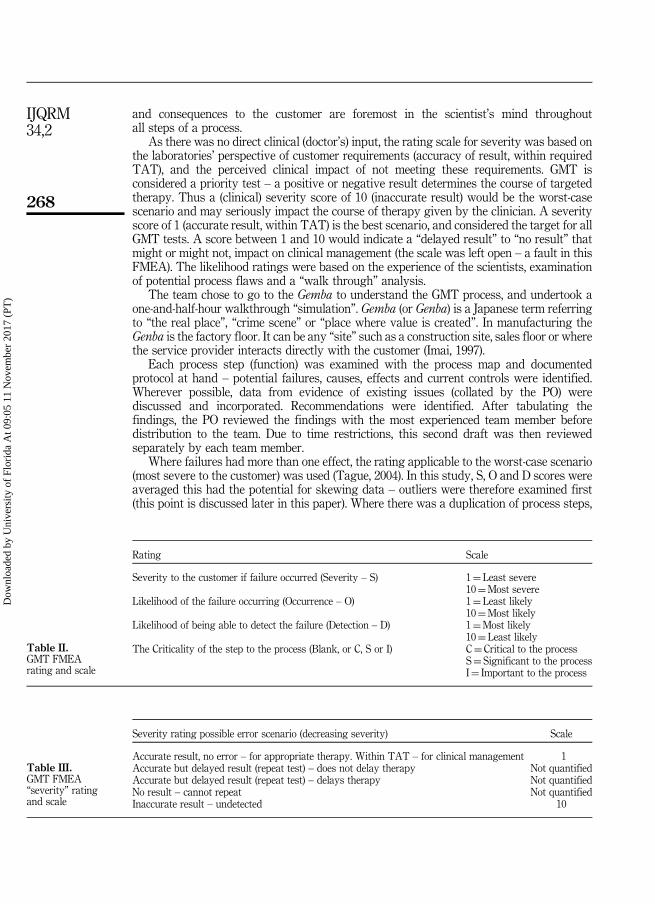
and consequences to the customer are foremost in the scientist’s mind throughoutall steps of a process.
As there was no direct clinical (doctor’s) input, the rating scale for severity was based onthe laboratories’ perspective of customer requirements (accuracy of result, within requiredTAT), and the perceived clinical impact of not meeting these requirements. GMT isconsidered a priority test – a positive or negative result determines the course of targetedtherapy. Thus a (clinical) severity score of 10 (inaccurate result) would be the worst-casescenario and may seriously impact the course of therapy given by the clinician. A severityscore of 1 (accurate result, within TAT) is the best scenario, and considered the target for allGMT tests. A score between 1 and 10 would indicate a “delayed result” to “no result” thatmight or might not, impact on clinical management (the scale was left open – a fault in thisFMEA). The likelihood ratings were based on the experience of the scientists, examinationof potential process flaws and a “walk through” analysis.
The team chose to go to the Gemba to understand the GMT process, and undertook aone-and-half-hour walkthrough “simulation”. Gemba (or Genba) is a Japanese term referringto “the real place”, “crime scene” or “place where value is created”. In manufacturing theGenba is the factory floor. It can be any “site” such as a construction site, sales floor or wherethe service provider interacts directly with the customer (Imai, 1997).
Each process step (function) was examined with the process map and documentedprotocol at hand – potential failures, causes, effects and current controls were identified.Wherever possible, data from evidence of existing issues (collated by the PO) werediscussed and incorporated. Recommendations were identified. After tabulating thefindings, the PO reviewed the findings with the most experienced team member beforedistribution to the team. Due to time restrictions, this second draft was then reviewedseparately by each team member.
Where failures had more than one effect, the rating applicable to the worst-case scenario(most severe to the customer) was used (Tague, 2004). In this study, S, O and D scores wereaveraged this had the potential for skewing data – outliers were therefore examined first(this point is discussed later in this paper). Where there was a duplication of process steps,
Rating Scale
Severity to the customer if failure occurred (Severity – S) 1¼Least severe10¼Most severe
Likelihood of the failure occurring (Occurrence – O) 1¼Least likely10¼Most likely
Likelihood of being able to detect the failure (Detection – D) 1¼Most likely10¼Least likely
The Criticality of the step to the process (Blank, or C, S or I) C¼Critical to the processS¼ Significant to the processI¼ Important to the process
Table II.GMT FMEArating and scale
Severity rating possible error scenario (decreasing severity) Scale
Accurate result, no error – for appropriate therapy. Within TAT – for clinical management 1Accurate but delayed result (repeat test) – does not delay therapy Not quantifiedAccurate but delayed result (repeat test) – delays therapy Not quantifiedNo result – cannot repeat Not quantifiedInaccurate result – undetected 10
Table III.GMT FMEA“severity” ratingand scale
268
IJQRM34,2
Dow
nloa
ded
by U
nive
rsity
of
Flor
ida
At 0
9:05
11
Nov
embe
r 20
17 (
PT)
data were compared and combined, using the highest score (only if the step and the effectwas the same). The S, O and D scores were multiplied to produce a RPN.
Analysis of the final FMEA results took two forms. First, errors were separated into the sixmain process functions (A-F, Table I), which linked issues clearly to their location within theprocess flow. Second, the RPN, S, O and D scores were compared, in descending order ofimportance, for each process function. Traditionally process functions with high RPN scores –(those associated with the highest risk), are actioned first to minimize risk – S×O can also beused (Tague, 2004). Individually high S, O and D scoresmay also indicate the need for prioritizingaction – S is the highest concern. However, improving controls may improve D and reduce O.
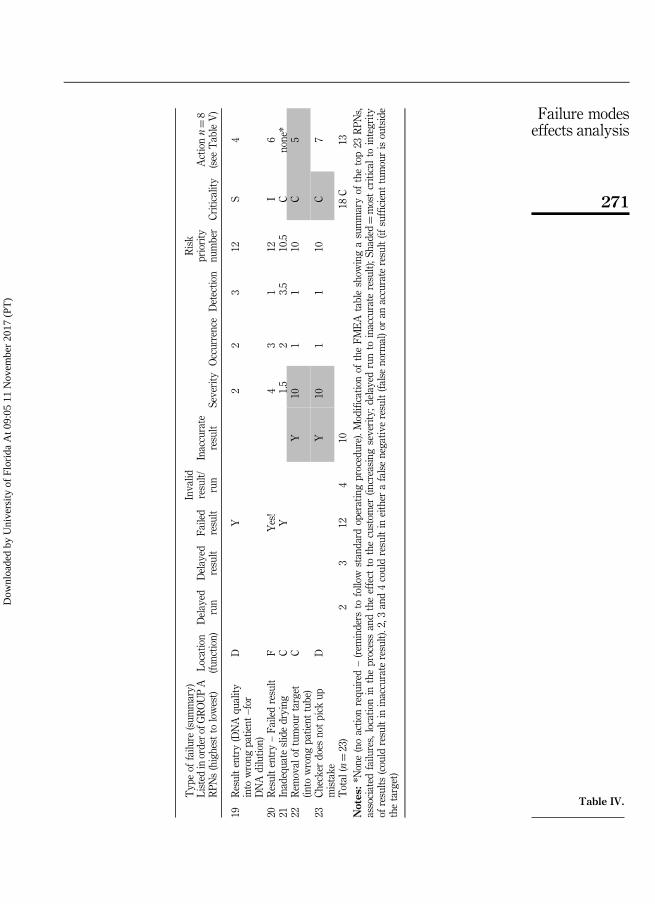
The data therefore were split into two groups, Group A containing the highest 23 RPNscores and all of the S and D scores of 10 (there were no O scores of 10), and Group B wasconstructed from the remaining 65 RPN scores of less than 10. The ranking system was thenexamined qualitatively to evaluate the scores for consistency with prioritizing action alignedwith meeting the needs of the customer. Key effects of “delayed run, delayed result, failedresult, invalid result/run and inaccurate result” (increasing in severity to the customer –refining the open scale from Table III) were used to search the effect column for consistencywith increasing RPN and S scores (Group A results are tabulated within Tables IV and V).
Analysis of the FMEA results enabled priority “improvement” actions to be determined.Changes deemed “easy” or “urgent and critical to the process” were made immediately, orwere allocated to a team member with a defined target and review date.
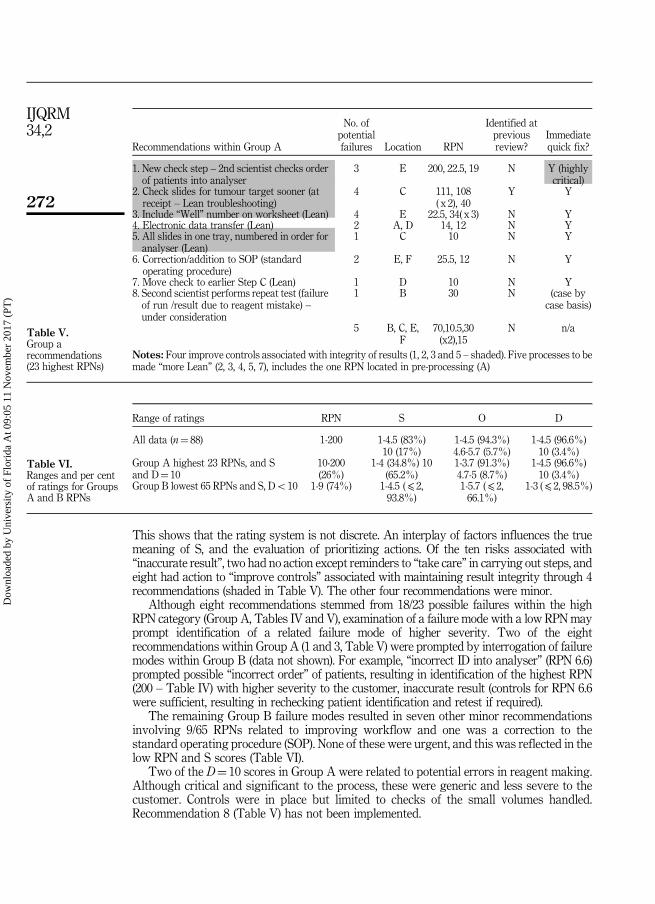
3. ResultsIn total, 88 potential failure modes were identified within the 59 GMT process steps.The FMEA resulted in eight improvements (within the highest 23 RPNs), seven of whichhad not been identified by the previous review (Table V). The highest RPN (200) resulted ina preventative action, critical to the integrity of test results – a second scientist recheckingthe order of patient’s samples into the analyser. The development of the FMEA wasworthwhile, for improving controls of this one risk alone. Evaluation of RPNs and the S, Oand D scores, although undertaken, was not required for prioritization, as all actions wereclear, uncomplicated “quick fixes” (Table V).
3.1 Score comparisons – RPN, S, O and DThe majority of S, O and D scores had “low” values – a range of 1-4.5 (Table VI). The highestO score was 5.7, in an area that did not require action. However there were 15 S scores andthree D scores of 10. The S and D scores of 10 were used to form Group A, containing thehighest 23 RPNs (range 10-200), with 26 per cent of 88 identified possible failures. Group Bhad lower S and D scores, and contained the lower 65 RPNs (range 1-9) – 74 per cent of allidentified possible failures. Occurrence was roughly the same for both groups (69.6 and66.1 per cent ⩽ 2) – see Groups A and B data in Table VI.
3.2 Consistency of ratings with “prioritizing” for customer needsHigh O and D scores can produce high RPN ratings, however in this study the majority ofrating ranges were low (Table VI). The high RPNs appear to be consistent with increasingseverity of effects, high S scores, and the need for action. Comparison of Group A data show10/23 risks were associated with possible “inaccurate result” (most severe failure to thecustomer) with S¼ 10 (shaded, Table IV). For 5/23 (the remaining five with S¼ 10, Table IV,not shaded), “inaccurate result” was not possible due to technical/internal kit controls.However these steps were classified as critical to the process, and were critical to resultintegrity (involving tumour removal C, and plating; transfer of all patient’s and control DNAto a shared plate, E,) and were therefore rated as S¼ 10.
269
Failure modeseffects analysis
Dow
nloa
ded
by U
nive
rsity
of
Flor
ida
At 0
9:05
11
Nov
embe
r 20
17 (
PT)

Typ
eof
failu
re(sum
mary)
Listed
inordero
fGROUPA
RPN
s(highest
tolowest)
Locatio
n(fu
nctio
n)Delayed
run
Delayed
result
Failed
result
Invalid
result/
run
Inaccurate
result
Severity
Occurrence
Detectio
n
Risk
priority
number
Criticality
Actionn¼8
(see
TableV)
1Pa
tientsenteredinto
analyser
inincorrectorder
EY
102
10200
C1
2Incorrectorientationof
tumourtargets
CY
Y10
3.7
3111
C2
3Rem
oval
oftumourtarget
(notarget
tissueremoved)
CY
Y10
2.7
4108
C2
4Rem
oval
oftumourtarget
(som
eremoved)
CY
Y10
2.7
4108
C2
5Reagent
(not
mixing)
BY
23.5
1070
Cnone*TableV
6Rem
oval
oftumourtarget
(notissueat
allrem
oved)
CY
YY
nana
102
240
C2
7Plating(patientDNAtransfer
toanotherpatient
well)
EY
Y10
1.7
234
C3
8Plating(patient
DNA
transfer
toem
ptywell)
EY
na10
1.7
234
C3
9Plating(patient
DNA
transfer
tocontrolw
ell)
EY
Yna
101.7
234
C3
10Reagent
wrong
concentration
B(Y)
1.5
210
30S
8
11Plating(not
changing
tips)
EY
101.5
230
Cnone*
12Plating(error
with
seal)
EY
Y10
1.5
230
Cnone*
13Plating(reagent
towrong
well)
EY
na10
1.7
1.5
25.5
C3
14Plating(positive
controlto
wrong
well)
EY
na10
1.7
1.5
25.5
C3and6
15Resultentry(in
correct
reporting)
FY
101.7
1.5
22.5
C1
16Plating(noseal)
EY
2.5
1.7
1.5
19C
117
Check(in
correctreport
recipients)
F(Y)
1.5
52
15I
none*
18Miscalculationof
TAT
A(Y)
14.7
314
4
(con
tinued)
Table IV.Group a FMEAresults (top 23 RPNs)
270
IJQRM34,2
Dow
nloa
ded
by U
nive
rsity
of
Flor
ida
At 0
9:05
11
Nov
embe
r 20
17 (
PT)
Typ
eof
failu
re(sum
mary)
Listed
inordero
fGROUPA
RPN
s(highest
tolowest)
Locatio
n(fu
nctio
n)Delayed
run
Delayed
result
Failed
result
Invalid
result/
run
Inaccurate
result
Severity
Occurrence
Detectio
n
Risk
priority
number
Criticality
Actionn¼8
(see
TableV)
19Resultentry(DNA
quality
into
wrong
patient
–for
DNA
dilutio
n)
DY
22
312
S4
20Resultentry–Fa
iledresult
FYes!
43
112
I6
21Inadequate
slidedrying
CY
1.5
23.5
10.5
Cnone*
22Rem
oval
oftumourtarget
(into
wrong
patient
tube)
CY
101
110
C5
23Ch
eckerdoes
notpick
upmistake
DY
101
110
C7
Total
(n¼23)
23
124
1018
C13
Notes
:*N
one(noactio
nrequ
ired
–(rem
inders
tofollow
standard
operatingprocedure).M
odificatio
nof
theFM
EA
tableshow
ingasummaryof
thetop23
RPN
s,associated
failu
res,locatio
nin
theprocessandtheeffect
tothecustom
er(in
creasing
severity;d
elayed
runto
inaccurate
result);S
haded¼mostcriticalto
integrity
ofresults
(could
resultin
inaccurate
result).2,3
and4couldresultin
either
afalsenegativ
eresult(fa
lsenorm
al)o
ran
accurate
result(if
sufficient
tumourisoutside
thetarget)
Table IV.
271
Failure modeseffects analysis
Dow
nloa
ded
by U
nive
rsity
of
Flor
ida
At 0
9:05
11
Nov
embe
r 20
17 (
PT)
This shows that the rating system is not discrete. An interplay of factors influences the truemeaning of S, and the evaluation of prioritizing actions. Of the ten risks associated with“inaccurate result”, two had no action except reminders to “take care” in carrying out steps, andeight had action to “improve controls” associated with maintaining result integrity through 4recommendations (shaded in Table V). The other four recommendations were minor.
Although eight recommendations stemmed from 18/23 possible failures within the highRPN category (Group A, Tables IV and V), examination of a failure mode with a low RPN mayprompt identification of a related failure mode of higher severity. Two of the eightrecommendations within Group A (1 and 3, Table V) were prompted by interrogation of failuremodes within Group B (data not shown). For example, “incorrect ID into analyser” (RPN 6.6)prompted possible “incorrect order” of patients, resulting in identification of the highest RPN(200 – Table IV) with higher severity to the customer, inaccurate result (controls for RPN 6.6were sufficient, resulting in rechecking patient identification and retest if required).
The remaining Group B failure modes resulted in seven other minor recommendationsinvolving 9/65 RPNs related to improving workflow and one was a correction to thestandard operating procedure (SOP). None of these were urgent, and this was reflected in thelow RPN and S scores (Table VI).
Two of the D¼ 10 scores in Group A were related to potential errors in reagent making.Although critical and significant to the process, these were generic and less severe to thecustomer. Controls were in place but limited to checks of the small volumes handled.Recommendation 8 (Table V) has not been implemented.
Recommendations within Group A
No. ofpotentialfailures Location RPN
Identified atpreviousreview?
Immediatequick fix?
1. New check step – 2nd scientist checks orderof patients into analyser
3 E 200, 22.5, 19 N Y (highlycritical)
2. Check slides for tumour target sooner (atreceipt – Lean troubleshooting)
4 C 111, 108( x 2), 40
Y Y
3. Include “Well” number on worksheet (Lean) 4 E 22.5, 34( x 3) N Y4. Electronic data transfer (Lean) 2 A, D 14, 12 N Y5. All slides in one tray, numbered in order foranalyser (Lean)
1 C 10 N Y
6. Correction/addition to SOP (standardoperating procedure)
2 E, F 25.5, 12 N Y
7. Move check to earlier Step C (Lean) 1 D 10 N Y8. Second scientist performs repeat test (failureof run /result due to reagent mistake) –under consideration
1 B 30 N (case bycase basis)
5 B, C, E,F
70,10.5,30(x2),15
N n/a
Notes: Four improve controls associated with integrity of results (1, 2, 3 and 5 – shaded). Five processes to bemade “more Lean” (2, 3, 4, 5, 7), includes the one RPN located in pre-processing (A)
Table V.Group arecommendations(23 highest RPNs)
Range of ratings RPN S O D
All data (n¼ 88) 1-200 1-4.5 (83%)10 (17%)
1-4.5 (94.3%)4.6-5.7 (5.7%)
1-4.5 (96.6%)10 (3.4%)
Group A highest 23 RPNs, and Sand D¼ 10
10-200(26%)
1-4 (34.8%) 10(65.2%)
1-3.7 (91.3%)4.7-5 (8.7%)
1-4.5 (96.6%)10 (3.4%)
Group B lowest 65 RPNs and S, Do10 1-9 (74%) 1-4.5 (⩽ 2,93.8%)
1-5.7 (⩽ 2,66.1%)
1-3 (⩽ 2, 98.5%)
Table VI.Ranges and per centof ratings for GroupsA and B RPNs
272
IJQRM34,2
Dow
nloa
ded
by U
nive
rsity
of
Flor
ida
At 0
9:05
11
Nov
embe
r 20
17 (
PT)
3.3 Utility of FMEA in identifying improvementsOne aim of FMEA is to eliminate or minimize risk by improving controls. The main benefit ofthe analysis was the preventative action from the highest RPN (200, S¼ 10) “patients enteredinto analyser in incorrect order” (at E). The FMEA highlighted this as a high risk not addressedby the team within the previous review. The FMEA brought to light that controls wereinsufficient, with the potential for “patient mix up” and the most severe effect for the customer“inaccurate result” (Table IV), with possible clinical consequences such as not being offeredtargeted therapy or being given inappropriate targeted therapy. A new check step using asecond scientist to recheck patient order with paperwork was introduced. For this oneimprovement, the FMEA was worthwhile. This control was also introduced for “result entry atreporting” at F (15th highest RPN 22.5, S¼ 10). FMEA analysis shows its value here – with asystematic detailed review of process steps. The previous review however, using Gemba andbrainstorming, may not have been as thorough, concentrating on pre-processing (A – whichrequired addition to the SOP, whereas functions B-F had concentrated on review of themanufacturer’s SOP (with no prescriptive check steps throughout, and no Gemba).
Table IV shows that all of the other top 23 RPNs were located within Steps B-F.Two areas known to have high risk were confirmed, and the check steps (controls)improved; recommendation 2, Table V (for “tumour removal issues” at C, second, third,fourth and sixth highest RPNs, Table IV), and recommendation 3 (for five possible “plating”errors, at E, seventh-ninth, 13th and 14th highest RPNs). For the five areas not requiringaction, controls were considered sufficient.
3.4 Revealing wasteFMEA revealed waste within the GMTprocess, resulting in five “Lean” improvements (Table V).Unnecessary repetition in three separate tube labelling and checking steps (2 identified withingroup B) were streamlined by moving to one “check” step, without introduction of new risk.Manual data entry, identified as a risk within two steps (RPNs 12 and 14, group A) waseliminated (recommendation 4) increasing efficiency and reducing risk.
4. Discussion4.1 Research limitations/study design flawsThis review was the first FMEA analysis conducted within the study organization. Traininggiven to the project team on FMEA and the use of this tool as a continuous improvementmethodology was undertaken by the PO. Time for dedication to the project was limited forall participants due to daily work constraints. There are flaws to be noted in this study.
4.1.1 The rating scale. The rating system was not as clearly defined as it could have beenand would be made more specific if the study were to be repeated. For example, criteria werenot specified for values between 2 and 9 of the rating scales. This meant that there was anincreased level of subjectivity to the assessments of S, O and D scores. The gap observed inthe S and D ranges in Group A (Table VI) may be due to this flaw – however this did notappear to hinder identification and resolution of issues. The modified rating, used inanalysis of the final FMEA, which incorporated customer expectations (Table III) wouldhave been more useful to the team at an earlier stage. If this analysis were to be repeated, orapplied to another process, the S, O and D scales would be defined with intermediarynumbers (expansion of Table III for instance), and tested before implementation.
4.1.2 Team involvement. Involvement of team members is all steps of the FMEA’sdevelopment and analysis was limited due to time and work constraints. The team consistedof a specialised group of genetic scientists. Their primary role was to process patientsamples in order to meet TATs on, or before due dates, in order to assist with thetimely delivery of clinical care which is critical to the health outcomes of the patient.
273
Failure modeseffects analysis
Dow
nloa
ded
by U
nive
rsity
of
Flor
ida
At 0
9:05
11
Nov
embe
r 20
17 (
PT)
Therefore, although meetings were scheduled for times agreed to by team members, not allparticipants were able to make face-to-face meetings. Elements of the project had to beundertaken via e-mail, with subsequent individual reviews of the draft FMEA then beingcompiled by the PO. This may have resulted in a gap in consensus decision making and areduction in the reliability of the final scores. More robust data may have been obtainedthrough greater team involvement. Were FMEA to be repeated, a more robust planning andteam selection process (also including a broader cross-section of staff, as outlined in Section4.1.4) would be applied to provide as many viewpoints as possible.
4.1.3 Rating bias. The data set in this study was small, consensus meetings were notable to be held, and scores were averaged, thus leaving room for skewed results. Teamconsensus could reduce bias, and use of a nominal group technique would add robustness toa further study.
4.1.4 Cross-functional team. The team was not “cross-functional”. There was no inputfrom medical (i.e. doctors) or management staff, and the input from laboratory staff waslimited (Section 4.1.2). This may result in a rating scale bias, as the genetic laboratoryscientists involved in the process may not have the same extensive knowledge of theconsequence of a potential failure to the patient. Thus, the overall “effects of failure”may notbe as reflective of clinical practice as they could be.
There was no direct input from the designer and manufacturer of the GMT and reasonsfor a failed or invalid test within a “black box” procedure are not always transparent andvisible to laboratory staff using the test.
Future improvement initiatives would involve introduction of the aims and scope of theproject to a broader cross-section of staff (rather than just the genetic scientists). This wouldassist with gaining “buy in” and involvement from a more multidisciplinary andcross-functional team, thus strengthening the review process.
4.1.5 Ambiguity within failure mode statements. There is some vagueness within thefailure mode statements. For example “delayed result” is actually an effect. Such ambiguitymay unintentionally bias ratings e.g. an S score can be influenced by the length of a delayand how urgently a result is needed. In Table IV, the 20th and 23rd highest RPNs areexamples of poorly worded modes.
4.2 Benefits achieved and alternative approachesAlthough this FMEA study has some failings and there are opportunities forimprovement, it yielded benefits, within review of a “black box” GMT process. Newimprovements were identified in spite of the previous review, including one significantpreventative action.
4.2.1 A reduction in the scope of the study. The PO required extensive time, outside ofdaily work, to compile findings from the 88 failure modes that resulted in the eightrecommendations from the 26 per cent highest RPNs. A smaller scope (sub-process) mayhave been more manageable for using the FMEA tool, reducing fatigue from data overload,and making compilation and analysis less taxing. Some authors report a smaller scope canresult in more specific recommendations (Van Tilberg et al., 2006), as FMEA can result inmany potential failure modes that are irrelevant (Lipol and Haq, 2011).
4.2.2 Alternative approaches to FMEA ratings. Several alternative approaches have beenidentified in the literature rather than the linear approach used here, and have beenrecommended to improve the efficiency of analysis. These include:
(1) prioritization matrices: to determine which areas to investigate further, aprioritization matrix could be used before tabulation, to narrow efforts to processsteps and inputs that have the biggest effect on customer (Rodriguez-Perez andPena-Rodriguez, 2012);
274
IJQRM34,2
Dow
nloa
ded
by U
nive
rsity
of
Flor
ida
At 0
9:05
11
Nov
embe
r 20
17 (
PT)
(2) hazard scoring matrices: these could be used after listing failure modes (Van Tilberget al., 2006) to prioritize areas for action;
(3) Pareto analysis: a Pareto chart could be used to rank and display the top RPNs(McCain, 2006; Lipol and Haq, 2011); and
(4) multiple analyses: analysis could be split between two teams for S and O and Drankings after cause-and-effect analysis (Ramu, 2009) thus adding another level ofassessment and robustness to the analysis process.
4.2.3 Utility of FMEA as a model. Regardless of the approach, there are questions regardingthe utility of FMEA. Studies have questioned the validity of the ranking system, withcalculations for the RPN being mathematically flawed (Shebl et al., 2012; Bowles, 2004). Thesame RPN number is possible from different combinations of the S, O and D scores, howeverthe meaning behind each rank is different, and there is a limited number of possible RPNscores (Shebl et al., 2012; Bowles, 2004). Where the same RPN is found, prioritization by S,then O then D may be used (Lipol and Haq, 2011). An alternative method uses S, O and D orS and D scores without multiplication (Reid, 2009).
4.2.3.1 Definitions of scales. Doubt over validity of RPNs for prioritization is furtherstrengthened by possible subjectivity when choosing scores for each failure mode. Definitionsof scales used should be customized to the area of review (McDermott et al., 2009), anddesigned by the team for clear understanding to reduce variation of interpretation. Data fromthe current situation, collected beforehand, may reduce variation. In situ simulations canstrengthen scores, rather than relying on brainstorming “from memory alone” (Davis et al.,2008). Voting can bring consensus, or using two teams to share and peer review results(Ramu, 2009). Interpretation of the importance of a factor – S, O and D, regardless of approach,are however, still influenced by personal values and belief. One study illustrates theinteraction of factors with the outcome of FMEA conducted simultaneously andindependently by two teams on the same process, with different (but both useful) results,influenced by the definition of the scales chosen, the approach (use of a SOP or walk through)and subjectivity of individuals (Oldenhof et al., 2011).
4.2.3.2 Interpretation of modes and effects. Analysis is not always straightforward for failuremodes. Modes can be confused with effects (Teng et al., 2004), or may have multiple possibleeffects, and ideally should be listed and ranked separately (Ramu, 2009). Rating each possibleeffect separately, and for all customers, would be cumbersome, particularly for a large scope.
Severity scores may not be discrete due to a variety of environmental factors outside ofthe analysis scope. Within healthcare S to a patient can vary depending on their symptomsand clinical needs. Additionally the effect of the same failure and S, could vary from patientto patient due to the inherent variability in health. Thus S is not discrete – and should themajority or the average situation be used? It is difficult to rate S without bias whenoccurrence for the majority (and thus S), is low. If a serious adverse event is possiblehowever then one could argue that this cannot be ignored.
This FMEA, study used the most severe possible effect to the patient for S scores thus evenwith an O of 1, data are skewed. An example of this is for the second, third and fourth highestRPNs (Table IV), with low O – all could result in “some tumour” or “no tumour” beingremoved, depending on the content of the whole specimen (outside of the intended target),varying from patient to patient. In this study the “worst-case scenario” was used.
4.2.3.3 Use for prioritizing. The interacting factors mentioned, suggest that RPNs shouldnot be used on their own, and should be more of a guide, particularly within healthcare(Shebl et al., 2012). A low RPN does not exclude the possibility of O. Improvements may alsohave unintended upstream or downstream effects; RPN can be calculated to examinepossible unintended effects (Williams, 2010). Where prioritization is unclear however,
275
Failure modeseffects analysis
Dow
nloa
ded
by U
nive
rsity
of
Flor
ida
At 0
9:05
11
Nov
embe
r 20
17 (
PT)
ratings may be useful. High scores of S, O and D are worth examining, individually andtogether. Reducing S (severity to the customer) is a priority, however high O and D with lowS may also be harmful to the internal/external customer, particularly in healthcare.For example, if results are frequently delayed, work could be lost, or clinical managementdelayed, thus having possible compounding effects outside of the scope of the review.
Some approaches support examining issues over a certain number with an aim to reduceRPNs by a chosen amount. However this approach may detract from the true objectives,of improving procedures to consistently meet customer requirements. FMEA is a livingdocument, with the contributing factors to risk, changing with the varying influences ofthe environment. An FMEA should be reviewed regularly to identify new risks, and afterimplementation of a corrective or preventative action (McCain, 2006; Tague, 2004). In analysis,it should be remembered that FMEA is a snapshot in time of many interacting factors.
5. ConclusionsFor any improvement tool to be successfully integrated into an organizations’ qualityimprovement or risk management programme, it needs to be relatively easy-to-use andproven to provide benefits to the customer and organization. Many healthcare organizationsare facing fiscal constraints and increasing complexity of tests, putting strains on resources,particularly for involvement of those on the “shop floor”, and who are “hands on” in theproduction of a product or service.
FMEA was useful within this review. Two relatively brief reviews by the team, increasedawareness of risk and improved controls, documentation and workflow within the GMT.The ranking system illustrated concordance with needed actions (eight recommendationsfrom 18/23 top RPNs, and seven minor changes in the lower 63 RPNs). Howeverprioritization using the scores were not required as needs to fulfil customer requirementswere obvious and solutions simple to implement.
FMEA broadens the scope for improvement, improves the depth of understanding of aprocess and identifies the possible failings within process steps. Within this study, theFMEA provided further improvements to an already reviewed process that was perceivedto have few problems.
FMEA does not require complicated statistics however, it does require time, patience andplanning for efficient and effective application. A team with current detailed knowledge ofthe area under review, including all inputs and all customers (a cross-functional team) willincrease the power of its application.
A clear scope with defined scales for ranking are also required. The rating system can bea useful guide however; analysis of the causes, controls and effects of the possible failuresmay be enough in itself to point the way for action to minimize risks to the customer. Whendefinitions of S are clear and focussed on the customer, actions may be obvious or urgent.Where risks can be minimized with simple solutions to improve controls withoutintroducing new risks, it may be possible to implement improvements immediately.
References
Bowles, J.B. (2004), “An assessment of RPN prioritization in a failure modes effects and criticalityanalysis”, Journal of the IEST, Vol. 47, pp. 51-56.
Davis, S., Riley, W., Gurses, A.P., Miller, K. and Hansen, H. (2008), “Failure modes and effects analysisbased on in situ simulations: a methodology to improve understanding of risks and failures”,in Henriksen, K., Battles, J.B., Keyes, M.A. and Grady, M.L. (Eds), Advances in Patient Safety:New Directions and Alternative Approaches (Vol. 3: Performance and Tools).
Deming, W.E. (1986), Out of the Crisis, MIT Centre for Advanced Engineering Study, Cambridge, MA.
276
IJQRM34,2
Dow
nloa
ded
by U
nive
rsity
of
Flor
ida
At 0
9:05
11
Nov
embe
r 20
17 (
PT)
Imai, M. (1997), Genba Kaizen: A Commonsense Low-cost Approach to Management, McGraw-HillProfessional, New York, NY, p. 13.
Lipol, L.S. and Haq, J. (2011), “Risk analysis method: FMEA/FMECA in the organizations”,International Journal of Basis and Applied Sciences, Vol. 11 No. 5.
McCain, C. (2006), “Using FMEA in a service setting”, Quality Progress, available at: http://asq.org/data/subscriptions/qp/2006/0906/qp0906mccain.html (accessed 22 July 2013).
McDermott, R.E., Mikulak, R.J. and Beauregard, M.R. (2009),The Basics of FMEA, 2nd ed., ProductivityPress, Taylor & Francis Group, LLC.
Oldenhof, M.T., van Leeuwen, J.F., Nauta, M.J., de Kaste, D., YMCF Odekeren Rombouts., Vredenbregt, M.J.,Weda, M. and Barends, D.M. (2011), “Consistency of FMEA used in validation of analyticalprocedures”, Journal of Pharmaceutical and Biomedical Analysis.
Ramu, G. (2009), “FMEA minus the pain”, Quality Progress, Vol. 43 No. 3, pp. 36-42.
Reid, D. (2009), “Major upgrade. New FMEA manual offers more flexibility”, Quality Progress,Vol. 43 No. 5.
Rodriguez-Perez, J. and Pena-Rodriguez, M.E. (2012), “Fail-safe FMEA: combination of quality toolskeeps risk in check”, Quality Progress, Vol. 45 No. 1, pp. 30-35.
Shebl, N.A., Franklin, B.D. and Barber, N. (2012), “Failure mode and effects analysis outputs: are theyvalid?”, BMC Health Services Research, Vol. 12 No. 150.
Tague, N.R. (2004), “Failure modes effects analysis”, available at: http://asq.org/learn-about-quality/process-analysis-tools/overview /fmea.html (accessed 22 July 2013).
Teng, G.S., Ho, M.S., Shumar, D. and Liu, P.C. (2004), “Implementing FMEA in a collaborative supplychain environment”, International Journal of Quality Management and Reliability Management,Vol. 23 No. 2, pp. 179-196.
Van Tilberg, C.M., Leistikow, I.P., Rademaker, C.M.A., Bierings, M.B. and van Dijk, A.T.H. (2006),“Health care failure mode and effect analysis: a useful proactive risk analysis in a pediatriconcology ward”, Quality and Safety in Health Care, Vol. 15, pp. 58-64.
Williams, T. (2010), “Minimizing risks: how to apply FMEA in services”, available at: www.isixsigma/tools-templates/fmea/minimizing-risks-how-apply-fmea-sevices/ (accessed 13 August 2013).
Further reading
NZS/ISO 15189 (2012), International Standard, Medical Laboratories – Requirements for Quality andCompetence, 3rd ed.
About the authorsKaren Claxton has completed studies towards a Post Graduate Diploma in Quality Systems andworks full-time in the laboratory of New Zealand’s largest metropolitan hospital. This study wasundertaken as part of her studies that required a significant industry improvement project to beundertaken using learning from previously studied papers in the Quality Systems Suite ofProgrammes at the Massey University.
Nicola Marie Campbell-Allen is a Member of the School of Engineering and Advanced Technology atMassey University in New Zealand. Her specialty areas include leadership andmanagement development,quality management, process improvement and business excellence. Nicola Marie Campbell-Allenis a National Evaluator for the New Zealand Business Excellence Awards, and joint Co-ordinator for thesuite of qualifications available within the Quality Systems framework taught at the Massey University.Nicola Marie Campbell-Allen is the corresponding author and can be contacted at: [email protected]
For instructions on how to order reprints of this article, please visit our website:www.emeraldgrouppublishing.com/licensing/reprints.htmOr contact us for further details: [email protected]
277
Failure modeseffects analysis
Dow
nloa
ded
by U
nive
rsity
of
Flor
ida
At 0
9:05
11
Nov
embe
r 20
17 (
PT)


