Embed Size (px)
Citation preview
Journal of Science and Technology in Civil Engineering, NUCE 2020. 14 (3): 125–135
FAILURE PROBABILITY ANALYSIS OF OVERHEADCRANE BRIDGE GIRDERS WITHIN UNCERTAIN
DESIGN PARAMETERS
Trinh Van Haia,∗, Nguyen Huu Thua, Ha Dang Tuana, Pham Van Hiua
aFaculty of Vehicle and Energy and Engineering (FVEE), Le Quy Don Technical University,236 Hoang Quoc Viet street, Bac Tu Liem district, Hanoi, Vietnam
Article history:Received 19/05/2020, Revised 16/07/2020, Accepted 29/07/2020
Abstract
In the design of steel crane girders, various sources of uncertainty such as material properties, loads, andgeometric tolerances are inherent and inevitable. Using deterministic structural and/or load conditions may leadto low-reliability systems in real applications. In this paper, the probability of failure of overhead crane bridgegirders with uncertain design parameters is investigated. First, the design problem of a crane double girderis introduced within a set of analytical stress and defection constraints. Then, the response surface method isused in conjunction with Monte Carlo methods to quantify the effect of the parameter uncertainties on theconstraints of stress and deflection. For illustrative examples, various configurations of girders with originaldeterministic parameters proposed in the literature are selected and their deterministic optimization values areconsidered as the mean of random variables. The obtained results reveal that uncertainties such as coefficientsof variation (COV) in structures and loads have strong effects on the probability of failure for all stated cranegirder configurations. For only a wheel load COV of 0.05 and geometric dimension COV of 0.025, the means ofgeometric parameters have to be larger than 1.1 their deterministic-based values in order to reach a probabilityof failure at a level of 10−4.Keywords: failure probability; double-box girder; overhead crane; Monte Carlo method.
https://doi.org/10.31814/stce.nuce2020-14(3)-11 c© 2020 National University of Civil Engineering
1. Introduction
Cranes are widely used for moving, lifting, and handling tasks in various industrial fields, such asconstruction and manufacturing [1, 2]. According to their primary dynamic properties and structuralcharacteristics, cranes can mainly be classified into three types: overhead crane, mobile crane, andtower crane. An overhead traveling crane consists of three independent motions (i.e. hosting, longtravel, and cross travel), which allow handling and transferring payloads from one position to anotherin the working space within its own traveling and hoisting. As a wide application and multi-functionalpurposes, overhead cranes are the primary equipment in the area of transport and handling machinery[1].
Cranes are widely used for moving, lifting, and handling tasks in various industrial fields, such asconstruction and manufacturing [1, 2]. According to their primary dynamic properties and structuralcharacteristics, cranes can mainly be classified into three types: overhead crane, mobile crane, and
∗Corresponding author. E-mail address: [email protected] (Hai, T. V.)
125
Hai, T. V., et al. / Journal of Science and Technology in Civil Engineering
tower crane. An overhead traveling crane consists of three independent motions (i.e. hosting, longtravel, and cross travel), which allow handling and transferring payloads from one position to anotherin the working space within its own traveling and hoisting. As a wide application and multi-functionalpurposes, overhead cranes are the primary equipment in the area of transport and handling machinery[1].
The main task during the design process of a bridge crane structure is to optimize the shape anddimensions of the main girder. In terms of deterministic-based design, different methods have beenproposed to archive the geometric parameters of the rectangular hollow section of the girder that hasa minimum area [3, 4]. Currently, these optimization methods mainly include finite element method(FEM) [5, 6], neural networks [7, 8], Lagrange multipliers [9, 10], amongst others [11, 12]. How-ever, these methods are all based on deterministic optimum designs without considering effects ofrandomness or uncertainties in the structure parameters and/or load conditions. Deterministic opti-mum designs, which are pushed to the limits of their constraint boundaries and have no room foruncertainty, may result in low-reliability designs [13, 14]. Recently, reliability-based design problemsof crane structure have been reported in a few reference works [15]. Using the FEM simulations andresponse surface method (RSM), a reliability-based design of the structure of tower crane was intro-duced in Ref. [16]. A neural network model based on finite element and first-order second-moment(FOSM) method is used to investigate the reliability and sensitivity of crane steel structure [17].
Structural reliability can be analyzed using analytical methods, such as FOSM and second-ordersecond moments (SOSM) or with simulation methods such as Monte Carlo (MC) method [18, 19].The FOSM method is very simple and requires minimal computation effort but sacrifices accuracyfor nonlinear limit state functions. The accuracy of the SOSM method is improved compared withthat of the FOSM [20]. However, SOSM method is not widely used due to demanding computationalcosts. MC method seems to be a computationally intensive option when requiring a large numberof samples to evaluate small failure probabilities (e.g., for multi-scale FEM computations in high-dimensional problems), but it is accurate for cases of large samplings available based on analytical orsurrogate models [21].
In this work, the design problem of a crane double girder is introduced within a set of analyticalstress and defection constraints. The response surface method is then used in conjunction with theMC method to quantify the effect of the parameter uncertainties on the proposed constraints in orderto estimate the failure probability of girder designs.
2. Formulations of girder design problem
2.1. Overhead crane and its girder structure
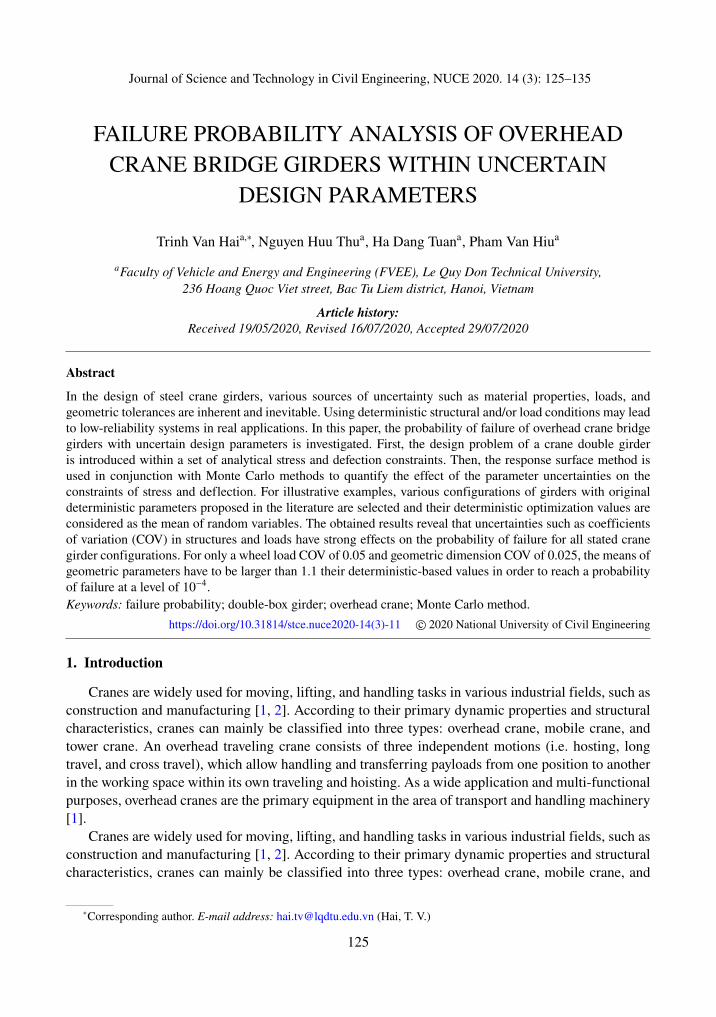
In this study, we consider a configuration of double girder overhead cranes, that makes up oftwo box-type bridge girders, two end trucks or end girders, and a trolley hoist assembly (Fig. 1(a)).The trolley hoist handling hook loads travels on top of rails that are mounted or welded to the top ofthe bridge girders. For a sake of simplicity, the cross-section of the girder (as shown in Fig. 1(c)) isassumed constant throughout its span, and the rail and the stiffeners are neglected in the calculationof the cross-sectional characteristics.
Fig. 1(b) shows the calculation schema for modeling a double girder of overhead cranes. Thissimplified model consists of a simple-span beam with a length of L. For single girder, two-wheelloads F are equal to a quarter of the total of the trolley mass Gt and the service load H. The lineardistributed masses q represents the self-weight of the girder and the additional distributed masses
126
Hai, T. V., et al. / Journal of Science and Technology in Civil Engineering
(like rails and the sidewalk). Noted that the wind load, buffer loads, and skew loads due to travellingare not considered here.
2.2. Constraint functions
The static problem for designing a crane structure has been proposed in a number of studies.Herein, we focus on three design constraints as follows [3]:Constraint on the static stress in the lower flange
The constraint on the static stress in the lower flange at mid-span due to biaxial bending is:
σs =Mx
Wx+
My
Wx≤ σs (1)
where Mx and My are the bending moments, Wx and Wy are the section moduli. σs is the allowablestress estimated as σs = αd(αsYs) where Ys is the yield stress, αd is the duty factor, and αs = 0.59[3, 22].
The moments of inertia are calculated as,
Ix =twh3
6+ 2
(b + 2d) t3f
12+
(h2
+t f
2
)2
(b + 2d) t f
Iy =
t f (b + 2d)3
6+ 2
ht3w
12+
(b2−
tw2
)2
htw
(2)
The section moduli are:
Wx =2Ix
h + 2t f; Wy =
2Iy
b + 2d(3)
The bending moment due to vertical loads is given as,
Mx =L2q8
+ψdH + Gt
8L
(L −
k2
)2
(4)
Journal of Science and Technology in Civil Engineering NUCE 2018 ISSN 1859-2996
3
that are mounted or welded to the top of the bridge girders. For a sake of simplicity, the cross-section of the girder (as shown in Fig. 1(c)) is assumed constant throughout its span, and the rail and the stiffeners are neglected in the calculation of the cross-sectional characteristics.
Figure 1. Crane configuration and calculation schema of its girder
Fig. 1(b) shows the calculation schema for modeling a double girder of overhead cranes. This simplified model consists of a simple-span beam with a length of L. For single girder, two-wheel loads F are equal to a quarter of the total of the trolley mass Gt and the service load H. The linear distributed masses q represents the self-weight of the girder and the additional distributed masses (like rails and the sidewalk). Noted that the wind load, buffer loads, and skew loads due to travelling are not considered here.
2.2. Constraint functions
The static problem for designing a crane structure has been proposed in a number of studies. Herein, we focus on three design constraints as follows [3]:
Constraint on the static stress in the lower flange
The constraint on the static stress in the lower flange at mid-span due to biaxial bending is:
(1) = + £yxs
x x
s
MM
W Ws s
(a) Structure of a overhead crane
Journal of Science and Technology in Civil Engineering NUCE 2018 ISSN 1859-2996
3
that are mounted or welded to the top of the bridge girders. For a sake of simplicity, the cross-section of the girder (as shown in Fig. 1(c)) is assumed constant throughout its span, and the rail and the stiffeners are neglected in the calculation of the cross-sectional characteristics.
Figure 1. Crane configuration and calculation schema of its girder
Fig. 1(b) shows the calculation schema for modeling a double girder of overhead cranes. This simplified model consists of a simple-span beam with a length of L. For single girder, two-wheel loads F are equal to a quarter of the total of the trolley mass Gt and the service load H. The linear distributed masses q represents the self-weight of the girder and the additional distributed masses (like rails and the sidewalk). Noted that the wind load, buffer loads, and skew loads due to travelling are not considered here.
2.2. Constraint functions
The static problem for designing a crane structure has been proposed in a number of studies. Herein, we focus on three design constraints as follows [3]:
Constraint on the static stress in the lower flange
The constraint on the static stress in the lower flange at mid-span due to biaxial bending is:
(1) = + £yxs
x x
s
MM
W Ws s
(b) Simplified model of crane girder
Journal of Science and Technology in Civil Engineering NUCE 2018 ISSN 1859-2996
3
that are mounted or welded to the top of the bridge girders. For a sake of simplicity, the cross-section of the girder (as shown in Fig. 1(c)) is assumed constant throughout its span, and the rail and the stiffeners are neglected in the calculation of the cross-sectional characteristics.
Figure 1. Crane configuration and calculation schema of its girder
Fig. 1(b) shows the calculation schema for modeling a double girder of overhead cranes. This simplified model consists of a simple-span beam with a length of L. For single girder, two-wheel loads F are equal to a quarter of the total of the trolley mass Gt and the service load H. The linear distributed masses q represents the self-weight of the girder and the additional distributed masses (like rails and the sidewalk). Noted that the wind load, buffer loads, and skew loads due to travelling are not considered here.
2.2. Constraint functions
The static problem for designing a crane structure has been proposed in a number of studies. Herein, we focus on three design constraints as follows [3]:
Constraint on the static stress in the lower flange
The constraint on the static stress in the lower flange at mid-span due to biaxial bending is:
(1) = + £yxs
x x
s
MM
W Ws s
(c) Girder cross-section
Figure 1. Crane configuration and calculation schema of its girder
127
Hai, T. V., et al. / Journal of Science and Technology in Civil Engineering
where (ψdH + Gt) /4 is the wheel load, q =(kgAρ + pr + ps
)g is the linear distributed weight with
kgAρ is girder distributed mass within considering stiffeners and diaphragms by a factor of kg = 1.05,and A = 2
[htw + (b + d) t f
]is the girder cross-sectional area given. k is the distance between the
trolley axes, g = 10 m/s2, and ρ = 7850 kg/m3.The bending moment due to horizontal loads is given as,
My = kM
L2q8
+Gt
8L
(L −
k2
)2 (5)
where kM = 0.3 × 0.5 with a factor of 0.3 represents the effect of inertia forces, and a factor of 0.5recognizes that two of four trolley wheels are driven [3].Constraint on fatigue stress
Based on the fatigue failure theory, the constraint on fatigue stress in the lower flange at mid-spanmay be given as [3],
σ f =Mx f
Wx+
My
Wx≤ σ f (6)
where σ f is the permissible tensile fatigue stress depending on the number of cycles NG and theratio fσ between the minimum and the maximum stress, fσ ≈ Mx1/Mx with Mx1 = L2q/8. Theapproximate formulas to calculate σ f are presented in Table 2. The moment Mx f due to fatigue isexpressed as,
Mx f =L2q8
+KpψdH + Gt
8L
(L −
k2
)2
(7)
where Kp is the spectrum factor.Constraint on static deflection
The maximum deflection due to all considered loads is estimated as,
wp =(H + Gt) (L − k)
192EIx
[3L2 − (L − k)2
]+
5qL4
384EIx≤ wp (8)
in which wp is the permissible deflection.
3. Formulation of structural reliability analysis
3.1. Definition of reliability
Time-independent reliability is often used in the design of civil structural systems under variousuncertainty sources. This definition can estimate the probability that the actual performance of anengineering system meets the required or specified design performance. By modeling uncertaintysources as random variables, the time-independent reliability R(X) can be formulated as,
R(X) = P (G(X) ≥ 0) = 1 − P (G(X) < 0) (9)
where the random vector X = [X1, X2, . . . , Xn]T presents uncertainty sources, G(X) is a system per-formance function, and P(E) is the probability of the event E. The uncertainties in vector X furtherpropagate and lead to the uncertainty of the system performance function G. In reliability analysis,equation G(X) = 0 is called the limit-state function, which divides the working space into the safetyregion G(X) ≥ 0 and the failure region G(X) < 0.
128
Hai, T. V., et al. / Journal of Science and Technology in Civil Engineering
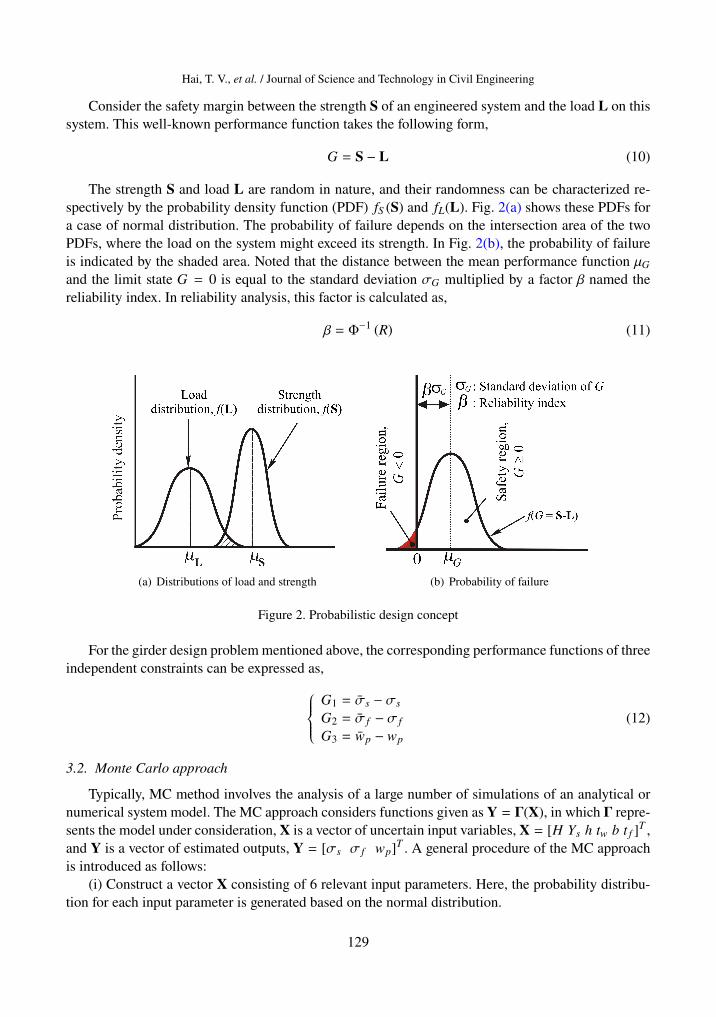
Consider the safety margin between the strength S of an engineered system and the load L on thissystem. This well-known performance function takes the following form,
G = S − L (10)
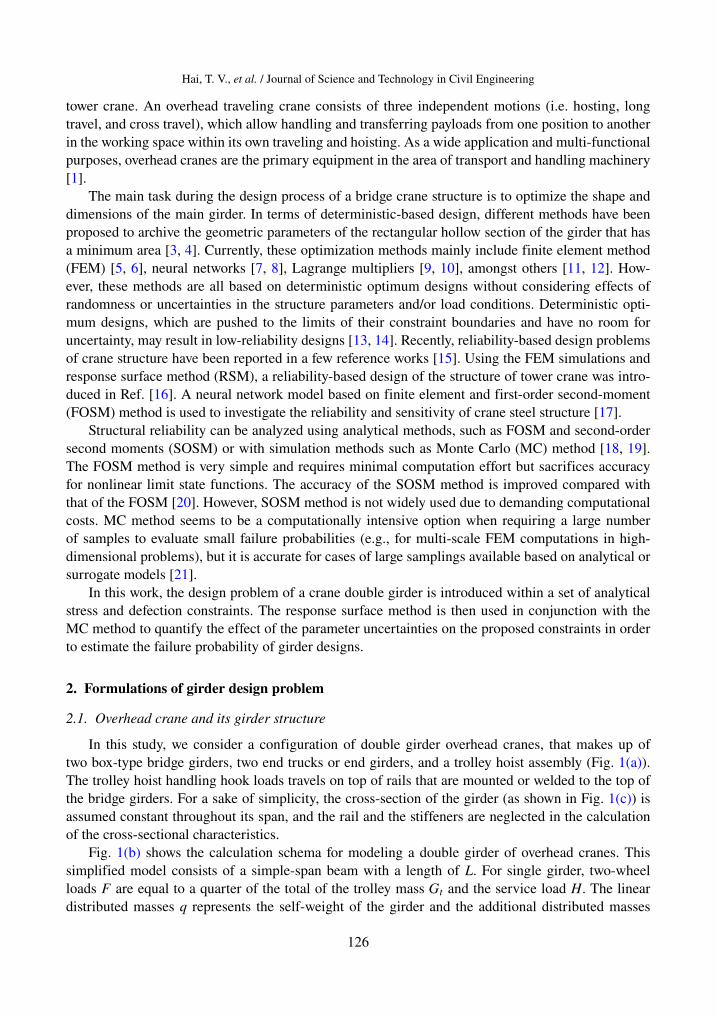
The strength S and load L are random in nature, and their randomness can be characterized re-spectively by the probability density function (PDF) fS (S) and fL(L). Fig. 2(a) shows these PDFs fora case of normal distribution. The probability of failure depends on the intersection area of the twoPDFs, where the load on the system might exceed its strength. In Fig. 2(b), the probability of failureis indicated by the shaded area. Noted that the distance between the mean performance function µG
and the limit state G = 0 is equal to the standard deviation σG multiplied by a factor β named thereliability index. In reliability analysis, this factor is calculated as,
β = Φ−1 (R) (11)
(a) Distributions of load and strength (b) Probability of failure
Figure 2. Probabilistic design concept
For the girder design problem mentioned above, the corresponding performance functions of threeindependent constraints can be expressed as,
G1 = σs − σs
G2 = σ f − σ f
G3 = wp − wp
(12)
3.2. Monte Carlo approach
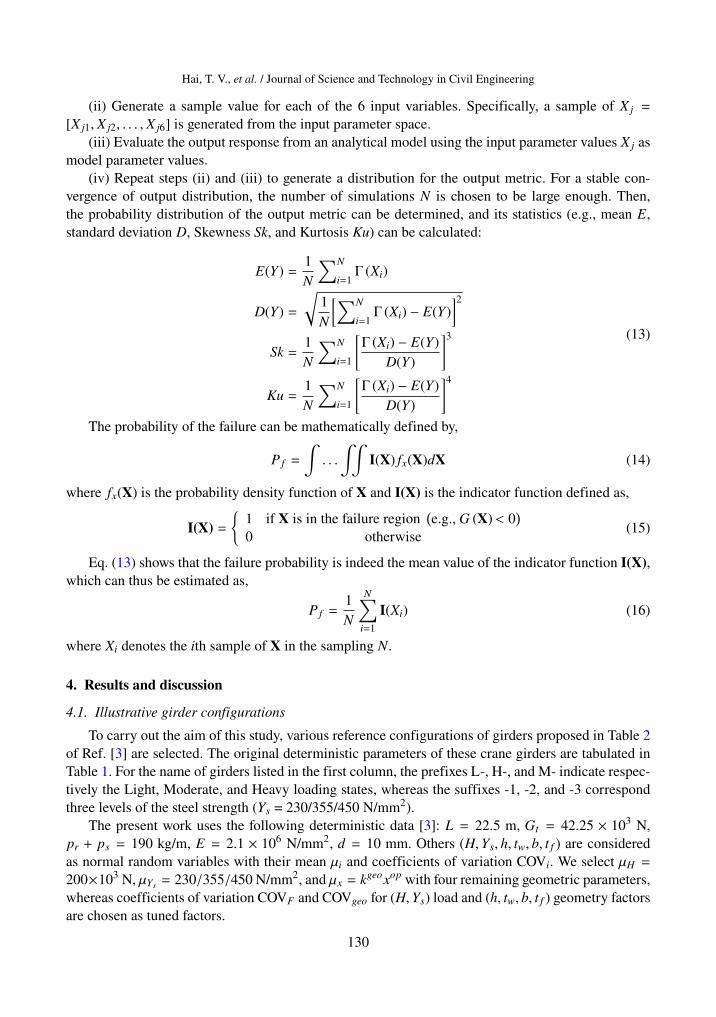
Typically, MC method involves the analysis of a large number of simulations of an analytical ornumerical system model. The MC approach considers functions given as Y = Γ(X), in which Γ repre-sents the model under consideration, X is a vector of uncertain input variables, X = [H Ys h tw b t f ]T ,and Y is a vector of estimated outputs, Y = [σs σ f wp]T . A general procedure of the MC approachis introduced as follows:
(i) Construct a vector X consisting of 6 relevant input parameters. Here, the probability distribu-tion for each input parameter is generated based on the normal distribution.
129
Hai, T. V., et al. / Journal of Science and Technology in Civil Engineering
(ii) Generate a sample value for each of the 6 input variables. Specifically, a sample of X j =
[X j1, X j2, . . . , X j6] is generated from the input parameter space.(iii) Evaluate the output response from an analytical model using the input parameter values X j as
model parameter values.(iv) Repeat steps (ii) and (iii) to generate a distribution for the output metric. For a stable con-
vergence of output distribution, the number of simulations N is chosen to be large enough. Then,the probability distribution of the output metric can be determined, and its statistics (e.g., mean E,standard deviation D, Skewness Sk, and Kurtosis Ku) can be calculated:
E(Y) =1N
∑N
i=1Γ (Xi)
D(Y) =
√1N
[∑N
i=1Γ (Xi) − E(Y)
]2
Sk =1N
∑N
i=1
[Γ (Xi) − E(Y)
D(Y)
]3
Ku =1N
∑N
i=1
[Γ (Xi) − E(Y)
D(Y)
]4
(13)
The probability of the failure can be mathematically defined by,
P f =
∫. . .
∫∫I(X) fx(X)dX (14)
where fx(X) is the probability density function of X and I(X) is the indicator function defined as,
I(X) =
{1 if X is in the failure region
(e.g., G (X)< 0
)0 otherwise
(15)
Eq. (13) shows that the failure probability is indeed the mean value of the indicator function I(X),which can thus be estimated as,
P f =1N
N∑i=1
I(Xi) (16)
where Xi denotes the ith sample of X in the sampling N.
4. Results and discussion
4.1. Illustrative girder configurations
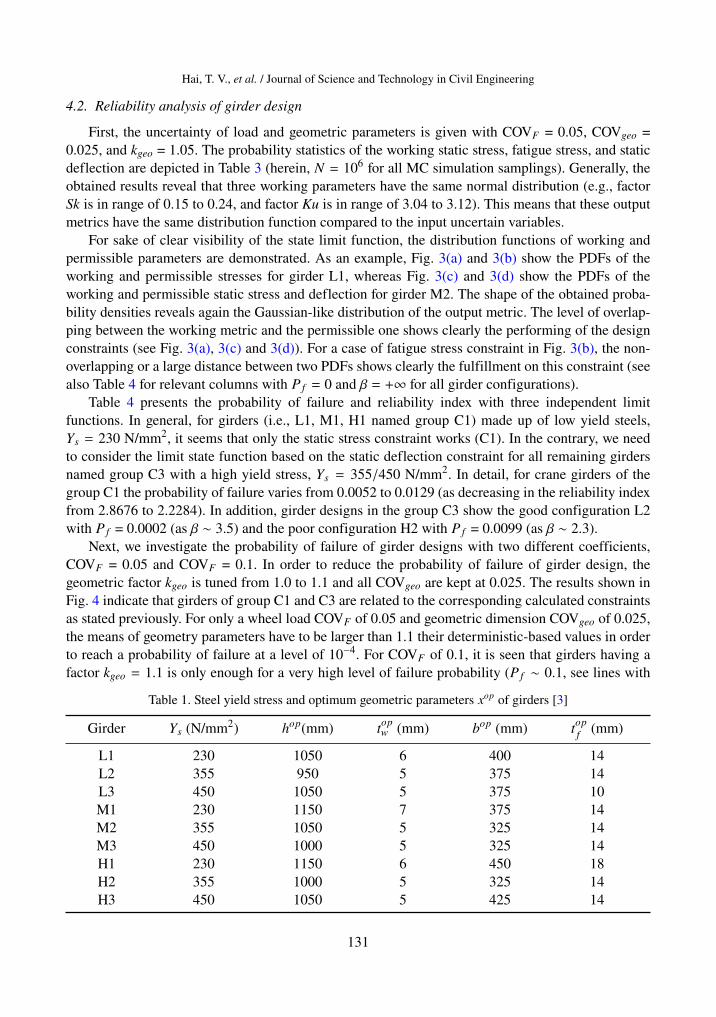
To carry out the aim of this study, various reference configurations of girders proposed in Table 2of Ref. [3] are selected. The original deterministic parameters of these crane girders are tabulated inTable 1. For the name of girders listed in the first column, the prefixes L-, H-, and M- indicate respec-tively the Light, Moderate, and Heavy loading states, whereas the suffixes -1, -2, and -3 correspondthree levels of the steel strength (Ys = 230/355/450 N/mm2).
The present work uses the following deterministic data [3]: L = 22.5 m, Gt = 42.25 × 10³ N,pr + ps = 190 kg/m, E = 2.1 × 10⁶ N/mm2, d = 10 mm. Others (H,Ys, h, tw, b, t f ) are consideredas normal random variables with their mean µi and coefficients of variation COVi. We select µH =
200×103 N, µYs = 230/355/450 N/mm2, and µx = kgeoxop with four remaining geometric parameters,whereas coefficients of variation COVF and COVgeo for (H,Ys) load and (h, tw, b, t f ) geometry factorsare chosen as tuned factors.
130
Hai, T. V., et al. / Journal of Science and Technology in Civil Engineering
4.2. Reliability analysis of girder design
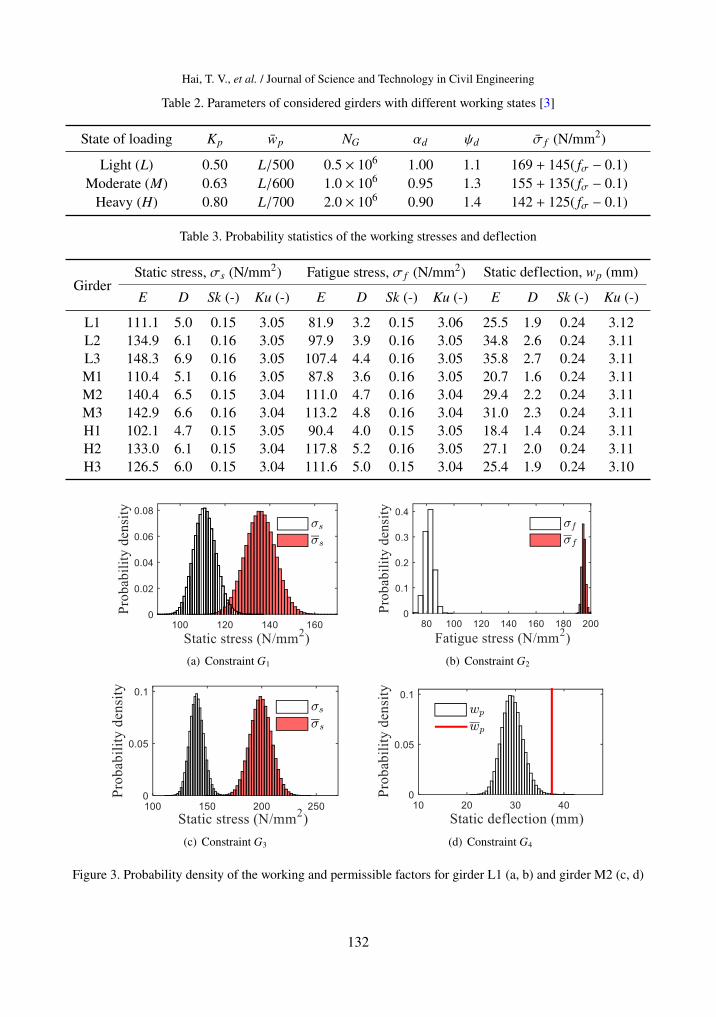
First, the uncertainty of load and geometric parameters is given with COVF = 0.05, COVgeo =0.025, and kgeo = 1.05. The probability statistics of the working static stress, fatigue stress, and staticdeflection are depicted in Table 3 (herein, N = 106 for all MC simulation samplings). Generally, theobtained results reveal that three working parameters have the same normal distribution (e.g., factorSk is in range of 0.15 to 0.24, and factor Ku is in range of 3.04 to 3.12). This means that these outputmetrics have the same distribution function compared to the input uncertain variables.
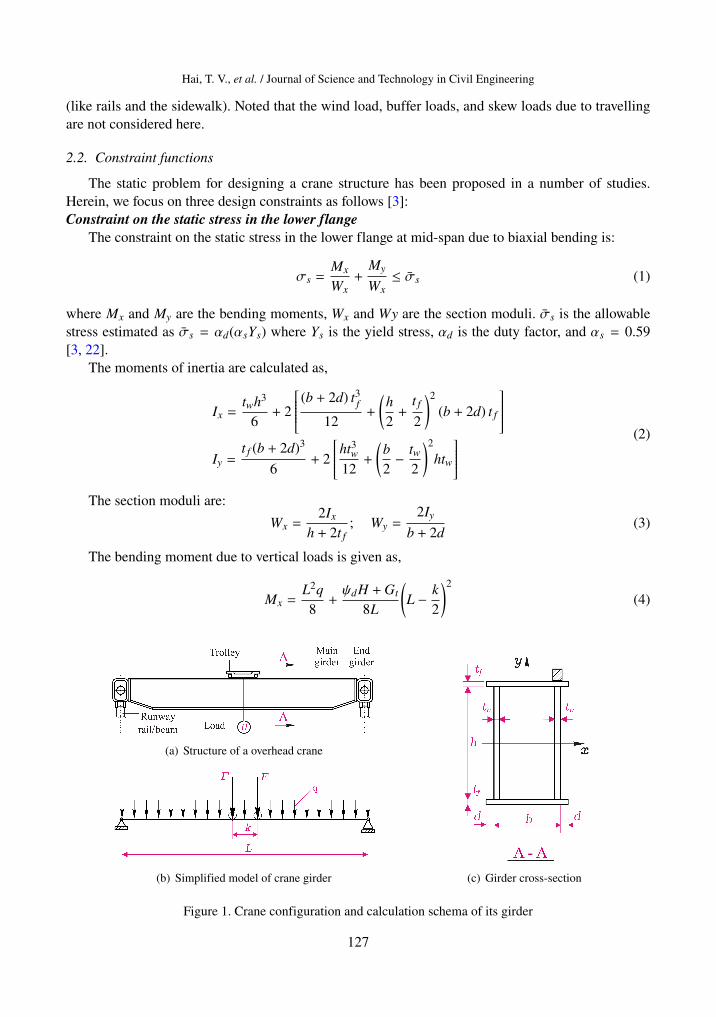
For sake of clear visibility of the state limit function, the distribution functions of working andpermissible parameters are demonstrated. As an example, Fig. 3(a) and 3(b) show the PDFs of theworking and permissible stresses for girder L1, whereas Fig. 3(c) and 3(d) show the PDFs of theworking and permissible static stress and deflection for girder M2. The shape of the obtained proba-bility densities reveals again the Gaussian-like distribution of the output metric. The level of overlap-ping between the working metric and the permissible one shows clearly the performing of the designconstraints (see Fig. 3(a), 3(c) and 3(d)). For a case of fatigue stress constraint in Fig. 3(b), the non-overlapping or a large distance between two PDFs shows clearly the fulfillment on this constraint (seealso Table 4 for relevant columns with P f = 0 and β = +∞ for all girder configurations).
Table 4 presents the probability of failure and reliability index with three independent limitfunctions. In general, for girders (i.e., L1, M1, H1 named group C1) made up of low yield steels,Ys = 230 N/mm2, it seems that only the static stress constraint works (C1). In the contrary, we needto consider the limit state function based on the static deflection constraint for all remaining girdersnamed group C3 with a high yield stress, Ys = 355/450 N/mm2. In detail, for crane girders of thegroup C1 the probability of failure varies from 0.0052 to 0.0129 (as decreasing in the reliability indexfrom 2.8676 to 2.2284). In addition, girder designs in the group C3 show the good configuration L2with P f = 0.0002 (as β ∼ 3.5) and the poor configuration H2 with P f = 0.0099 (as β ∼ 2.3).
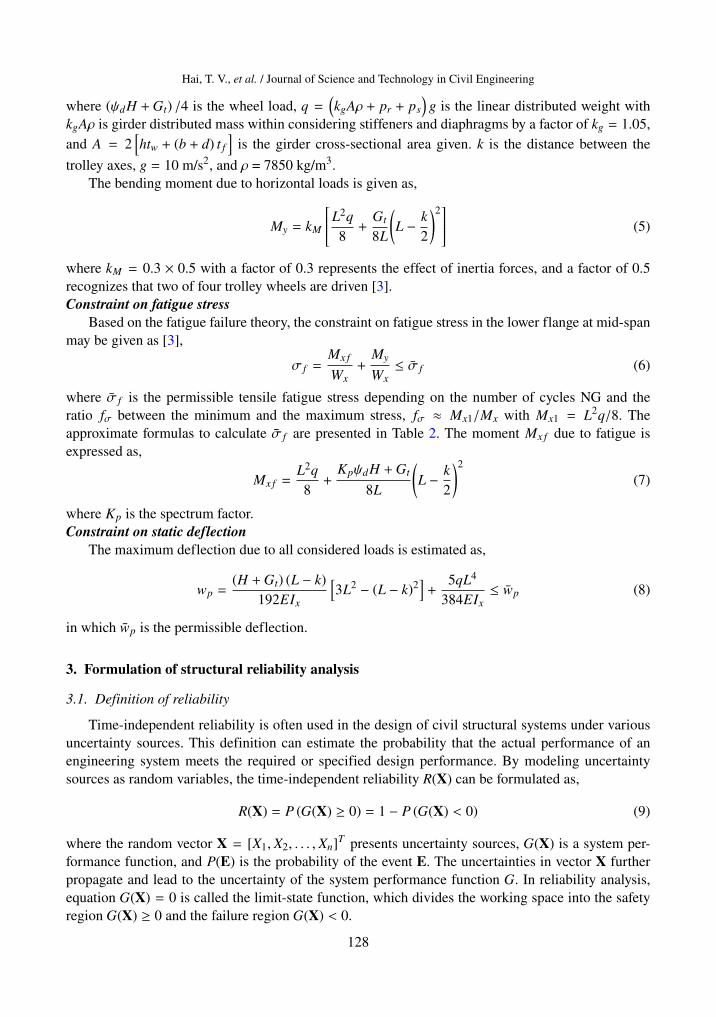
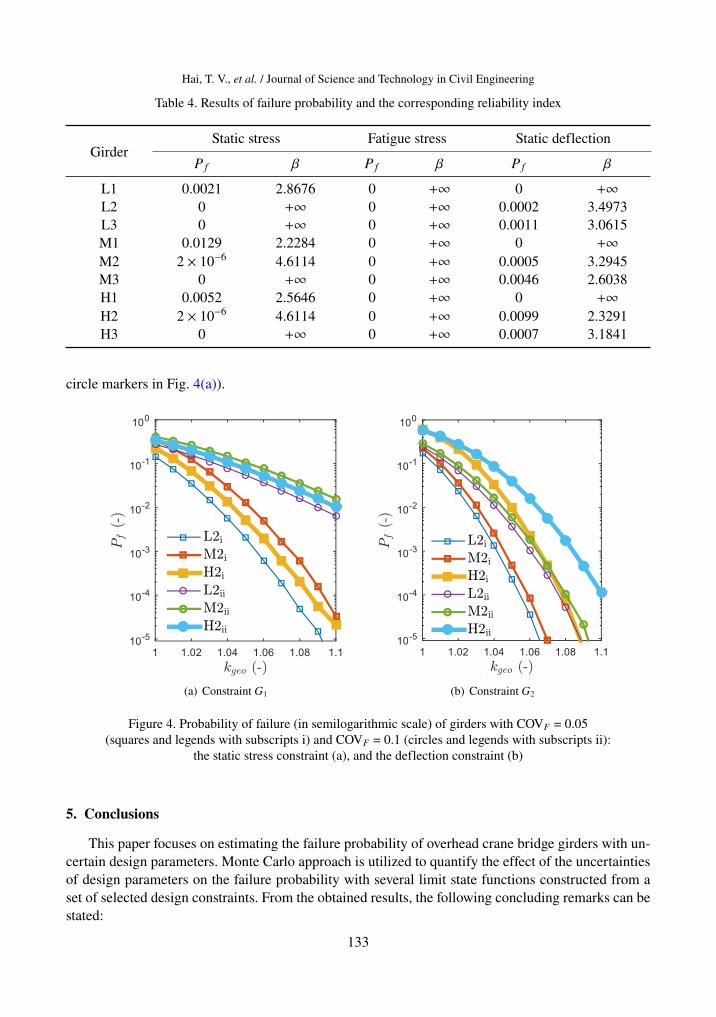
Next, we investigate the probability of failure of girder designs with two different coefficients,COVF = 0.05 and COVF = 0.1. In order to reduce the probability of failure of girder design, thegeometric factor kgeo is tuned from 1.0 to 1.1 and all COVgeo are kept at 0.025. The results shown inFig. 4 indicate that girders of group C1 and C3 are related to the corresponding calculated constraintsas stated previously. For only a wheel load COVF of 0.05 and geometric dimension COVgeo of 0.025,the means of geometry parameters have to be larger than 1.1 their deterministic-based values in orderto reach a probability of failure at a level of 10−4. For COVF of 0.1, it is seen that girders having afactor kgeo = 1.1 is only enough for a very high level of failure probability (P f ∼ 0.1, see lines with
Table 1. Steel yield stress and optimum geometric parameters xop of girders [3]
Girder Ys (N/mm2) hop(mm) topw (mm) bop (mm) top
f (mm)
L1 230 1050 6 400 14L2 355 950 5 375 14L3 450 1050 5 375 10M1 230 1150 7 375 14M2 355 1050 5 325 14M3 450 1000 5 325 14H1 230 1150 6 450 18H2 355 1000 5 325 14H3 450 1050 5 425 14
131
Hai, T. V., et al. / Journal of Science and Technology in Civil Engineering
Table 2. Parameters of considered girders with different working states [3]
State of loading Kp wp NG αd ψd σ f (N/mm2)
Light (L) 0.50 L/500 0.5 × 10⁶ 1.00 1.1 169 + 145( fσ − 0.1)Moderate (M) 0.63 L/600 1.0 × 10⁶ 0.95 1.3 155 + 135( fσ − 0.1)
Heavy (H) 0.80 L/700 2.0 × 10⁶ 0.90 1.4 142 + 125( fσ − 0.1)
Table 3. Probability statistics of the working stresses and deflection
GirderStatic stress, σs (N/mm2) Fatigue stress, σ f (N/mm2) Static deflection, wp (mm)
E D Sk (-) Ku (-) E D Sk (-) Ku (-) E D Sk (-) Ku (-)
L1 111.1 5.0 0.15 3.05 81.9 3.2 0.15 3.06 25.5 1.9 0.24 3.12L2 134.9 6.1 0.16 3.05 97.9 3.9 0.16 3.05 34.8 2.6 0.24 3.11L3 148.3 6.9 0.16 3.05 107.4 4.4 0.16 3.05 35.8 2.7 0.24 3.11M1 110.4 5.1 0.16 3.05 87.8 3.6 0.16 3.05 20.7 1.6 0.24 3.11M2 140.4 6.5 0.15 3.04 111.0 4.7 0.16 3.04 29.4 2.2 0.24 3.11M3 142.9 6.6 0.16 3.04 113.2 4.8 0.16 3.04 31.0 2.3 0.24 3.11H1 102.1 4.7 0.15 3.05 90.4 4.0 0.15 3.05 18.4 1.4 0.24 3.11H2 133.0 6.1 0.15 3.04 117.8 5.2 0.16 3.05 27.1 2.0 0.24 3.11H3 126.5 6.0 0.15 3.04 111.6 5.0 0.15 3.04 25.4 1.9 0.24 3.10
Journal of Science and Technology in Civil Engineering NUCE 2018 ISSN 1859-2996
9
Table 3. Probability statistics of the working stresses and deflection
Cran
e Static stress,ss
(N/mm2) Fatigue stress,sf
(N/mm2) Static deflection, wp
(mm) E D Sk (-) Ku (-) E D Sk (-) Ku (-) E D Sk (-) Ku (-)
L1 111.1 5.0 0.15 3.05 81.9 3.2 0.15 3.06 25.5 1.9 0.24 3.12 L2 134.9 6.1 0.16 3.05 97.9 3.9 0.16 3.05 34.8 2.6 0.24 3.11 L3 148.3 6.9 0.16 3.05 107.4 4.4 0.16 3.05 35.8 2.7 0.24 3.11 M1 110.4 5.1 0.16 3.05 87.8 3.6 0.16 3.05 20.7 1.6 0.24 3.11 M2 140.4 6.5 0.15 3.04 111.0 4.7 0.16 3.04 29.4 2.2 0.24 3.11 M3 142.9 6.6 0.16 3.04 113.2 4.8 0.16 3.04 31.0 2.3 0.24 3.11 H1 102.1 4.7 0.15 3.05 90.4 4.0 0.15 3.05 18.4 1.4 0.24 3.11 H2 133.0 6.1 0.15 3.04 117.8 5.2 0.16 3.05 27.1 2.0 0.24 3.11 H3 126.5 6.0 0.15 3.04 111.6 5.0 0.15 3.04 25.4 1.9 0.24 3.10
Figure 3. Probability density of the working and permissible factors for girder L1 (a,b) and girder M2 (c,d).
(Font chữ trong hình chưa đúng TIMES NEW ROMAN)
For sake of clear visibility of the state limit function, the distribution functions of working and permissible parameters are demonstrated. As an example, Fig. 3(a,b) show the PDFs of the working and permissible stresses for girder L1, whereas Fig. 3(c,d) show the PDFs of the working and permissible static stress and deflection for girder M2. The shape of the obtained probability densities reveals again the Gaussian-like distribution of the output metric. The level of overlapping between the working
(a) Constraint G1
Journal of Science and Technology in Civil Engineering NUCE 2018 ISSN 1859-2996
9
Table 3. Probability statistics of the working stresses and deflection
Cran
e Static stress,ss
(N/mm2) Fatigue stress,sf
(N/mm2) Static deflection, wp
(mm) E D Sk (-) Ku (-) E D Sk (-) Ku (-) E D Sk (-) Ku (-)
L1 111.1 5.0 0.15 3.05 81.9 3.2 0.15 3.06 25.5 1.9 0.24 3.12 L2 134.9 6.1 0.16 3.05 97.9 3.9 0.16 3.05 34.8 2.6 0.24 3.11 L3 148.3 6.9 0.16 3.05 107.4 4.4 0.16 3.05 35.8 2.7 0.24 3.11 M1 110.4 5.1 0.16 3.05 87.8 3.6 0.16 3.05 20.7 1.6 0.24 3.11 M2 140.4 6.5 0.15 3.04 111.0 4.7 0.16 3.04 29.4 2.2 0.24 3.11 M3 142.9 6.6 0.16 3.04 113.2 4.8 0.16 3.04 31.0 2.3 0.24 3.11 H1 102.1 4.7 0.15 3.05 90.4 4.0 0.15 3.05 18.4 1.4 0.24 3.11 H2 133.0 6.1 0.15 3.04 117.8 5.2 0.16 3.05 27.1 2.0 0.24 3.11 H3 126.5 6.0 0.15 3.04 111.6 5.0 0.15 3.04 25.4 1.9 0.24 3.10
Figure 3. Probability density of the working and permissible factors for girder L1 (a,b) and girder M2 (c,d).
(Font chữ trong hình chưa đúng TIMES NEW ROMAN)
For sake of clear visibility of the state limit function, the distribution functions of working and permissible parameters are demonstrated. As an example, Fig. 3(a,b) show the PDFs of the working and permissible stresses for girder L1, whereas Fig. 3(c,d) show the PDFs of the working and permissible static stress and deflection for girder M2. The shape of the obtained probability densities reveals again the Gaussian-like distribution of the output metric. The level of overlapping between the working
(b) Constraint G2
Journal of Science and Technology in Civil Engineering NUCE 2018 ISSN 1859-2996
9
Table 3. Probability statistics of the working stresses and deflection
Cran
e Static stress,ss
(N/mm2) Fatigue stress,sf
(N/mm2) Static deflection, wp
(mm) E D Sk (-) Ku (-) E D Sk (-) Ku (-) E D Sk (-) Ku (-)
L1 111.1 5.0 0.15 3.05 81.9 3.2 0.15 3.06 25.5 1.9 0.24 3.12 L2 134.9 6.1 0.16 3.05 97.9 3.9 0.16 3.05 34.8 2.6 0.24 3.11 L3 148.3 6.9 0.16 3.05 107.4 4.4 0.16 3.05 35.8 2.7 0.24 3.11 M1 110.4 5.1 0.16 3.05 87.8 3.6 0.16 3.05 20.7 1.6 0.24 3.11 M2 140.4 6.5 0.15 3.04 111.0 4.7 0.16 3.04 29.4 2.2 0.24 3.11 M3 142.9 6.6 0.16 3.04 113.2 4.8 0.16 3.04 31.0 2.3 0.24 3.11 H1 102.1 4.7 0.15 3.05 90.4 4.0 0.15 3.05 18.4 1.4 0.24 3.11 H2 133.0 6.1 0.15 3.04 117.8 5.2 0.16 3.05 27.1 2.0 0.24 3.11 H3 126.5 6.0 0.15 3.04 111.6 5.0 0.15 3.04 25.4 1.9 0.24 3.10
Figure 3. Probability density of the working and permissible factors for girder L1 (a,b) and girder M2 (c,d).
(Font chữ trong hình chưa đúng TIMES NEW ROMAN)
For sake of clear visibility of the state limit function, the distribution functions of working and permissible parameters are demonstrated. As an example, Fig. 3(a,b) show the PDFs of the working and permissible stresses for girder L1, whereas Fig. 3(c,d) show the PDFs of the working and permissible static stress and deflection for girder M2. The shape of the obtained probability densities reveals again the Gaussian-like distribution of the output metric. The level of overlapping between the working
(c) Constraint G3
Journal of Science and Technology in Civil Engineering NUCE 2018 ISSN 1859-2996
9
Table 3. Probability statistics of the working stresses and deflection
Cran
e Static stress,ss
(N/mm2) Fatigue stress,sf
(N/mm2) Static deflection, wp
(mm) E D Sk (-) Ku (-) E D Sk (-) Ku (-) E D Sk (-) Ku (-)
L1 111.1 5.0 0.15 3.05 81.9 3.2 0.15 3.06 25.5 1.9 0.24 3.12 L2 134.9 6.1 0.16 3.05 97.9 3.9 0.16 3.05 34.8 2.6 0.24 3.11 L3 148.3 6.9 0.16 3.05 107.4 4.4 0.16 3.05 35.8 2.7 0.24 3.11 M1 110.4 5.1 0.16 3.05 87.8 3.6 0.16 3.05 20.7 1.6 0.24 3.11 M2 140.4 6.5 0.15 3.04 111.0 4.7 0.16 3.04 29.4 2.2 0.24 3.11 M3 142.9 6.6 0.16 3.04 113.2 4.8 0.16 3.04 31.0 2.3 0.24 3.11 H1 102.1 4.7 0.15 3.05 90.4 4.0 0.15 3.05 18.4 1.4 0.24 3.11 H2 133.0 6.1 0.15 3.04 117.8 5.2 0.16 3.05 27.1 2.0 0.24 3.11 H3 126.5 6.0 0.15 3.04 111.6 5.0 0.15 3.04 25.4 1.9 0.24 3.10
Figure 3. Probability density of the working and permissible factors for girder L1 (a,b) and girder M2 (c,d).
(Font chữ trong hình chưa đúng TIMES NEW ROMAN)
For sake of clear visibility of the state limit function, the distribution functions of working and permissible parameters are demonstrated. As an example, Fig. 3(a,b) show the PDFs of the working and permissible stresses for girder L1, whereas Fig. 3(c,d) show the PDFs of the working and permissible static stress and deflection for girder M2. The shape of the obtained probability densities reveals again the Gaussian-like distribution of the output metric. The level of overlapping between the working
(d) Constraint G4
Figure 3. Probability density of the working and permissible factors for girder L1 (a, b) and girder M2 (c, d)
132
Hai, T. V., et al. / Journal of Science and Technology in Civil Engineering
Table 4. Results of failure probability and the corresponding reliability index
GirderStatic stress Fatigue stress Static deflection
P f β P f β P f β
L1 0.0021 2.8676 0 +∞ 0 +∞
L2 0 +∞ 0 +∞ 0.0002 3.4973L3 0 +∞ 0 +∞ 0.0011 3.0615M1 0.0129 2.2284 0 +∞ 0 +∞
M2 2 × 10⁻⁶ 4.6114 0 +∞ 0.0005 3.2945M3 0 +∞ 0 +∞ 0.0046 2.6038H1 0.0052 2.5646 0 +∞ 0 +∞
H2 2 × 10⁻⁶ 4.6114 0 +∞ 0.0099 2.3291H3 0 +∞ 0 +∞ 0.0007 3.1841
circle markers in Fig. 4(a)).Journal of Science and Technology in Civil Engineering NUCE 2018 ISSN 1859-2996
11
Figure 4. Probability of failure (in semilogarithmic scale) of girders with COVF = 0.05 (squares and legends with subscripts i) and COVF = 0.1 (circles and legends with
subscripts ii): the static stress constraint (a), and the deflection constraint (b).
5. Conclusions
This paper focuses on estimating the failure probability of overhead crane bridge girders with uncertain design parameters. Monte Carlo approach is utilized to quantify the effect of the uncertainties of design parameters on the failure probability with several limit state functions constructed from a set of selected design constraints. From the obtained results, the following concluding remarks can be stated:
(i) For the considered normal distribution, all output metrics including maximum stress and deflection tend to have the same distribution function in compared with the input uncertain variables.
(ii) By increasing the geometric factor from kgeo = 1 to kgeo = 1.1, we can make the deterministic-based designs with a low reliability (Pf ~ 0.5) to reliability-based designs with a very low failure probability (~ 10-4) for a case of COV < 0.05.
(iii) For high strength steels (Ys > 355 N/mm2) the deflection constraint should be considered only, whereas for low strength steels (Ys < 230 N/mm2) it is required to check the constraint on static stress. Having Pf = 0 for all girder configurations, this means that the constraint fatigue stress can be neglected.
Finally, it is obvious that uncertain design parameters lead to the failure probability of crane girders, but a reliability and sensitivity analysis of a crane girder involving parameters of its building frame [23] should be conducted in forthcoming works for reaching reliability-based designs in real applications.
Commented [A1]: Kiểm tra lại xem giá trị trên trục tung là Pf hay log(Pf) Vì cách biểu diễn 10 …. 10-1 …. Như hình là của hàm log
(a) Constraint G1
Journal of Science and Technology in Civil Engineering NUCE 2018 ISSN 1859-2996
11
Figure 4. Probability of failure (in semilogarithmic scale) of girders with COVF = 0.05 (squares and legends with subscripts i) and COVF = 0.1 (circles and legends with
subscripts ii): the static stress constraint (a), and the deflection constraint (b).
5. Conclusions
This paper focuses on estimating the failure probability of overhead crane bridge girders with uncertain design parameters. Monte Carlo approach is utilized to quantify the effect of the uncertainties of design parameters on the failure probability with several limit state functions constructed from a set of selected design constraints. From the obtained results, the following concluding remarks can be stated:
(i) For the considered normal distribution, all output metrics including maximum stress and deflection tend to have the same distribution function in compared with the input uncertain variables.
(ii) By increasing the geometric factor from kgeo = 1 to kgeo = 1.1, we can make the deterministic-based designs with a low reliability (Pf ~ 0.5) to reliability-based designs with a very low failure probability (~ 10-4) for a case of COV < 0.05.
(iii) For high strength steels (Ys > 355 N/mm2) the deflection constraint should be considered only, whereas for low strength steels (Ys < 230 N/mm2) it is required to check the constraint on static stress. Having Pf = 0 for all girder configurations, this means that the constraint fatigue stress can be neglected.
Finally, it is obvious that uncertain design parameters lead to the failure probability of crane girders, but a reliability and sensitivity analysis of a crane girder involving parameters of its building frame [23] should be conducted in forthcoming works for reaching reliability-based designs in real applications.
Commented [A1]: Kiểm tra lại xem giá trị trên trục tung là Pf hay log(Pf) Vì cách biểu diễn 10 …. 10-1 …. Như hình là của hàm log
(b) Constraint G2
Figure 4. Probability of failure (in semilogarithmic scale) of girders with COVF = 0.05(squares and legends with subscripts i) and COVF = 0.1 (circles and legends with subscripts ii):
the static stress constraint (a), and the deflection constraint (b)
5. Conclusions
This paper focuses on estimating the failure probability of overhead crane bridge girders with un-certain design parameters. Monte Carlo approach is utilized to quantify the effect of the uncertaintiesof design parameters on the failure probability with several limit state functions constructed from aset of selected design constraints. From the obtained results, the following concluding remarks can bestated:
133
Hai, T. V., et al. / Journal of Science and Technology in Civil Engineering
(i) For the considered normal distribution, all output metrics including maximum stress and de-flection tend to have the same distribution function in compared with the input uncertain variables.
(ii) By increasing the geometric factor from kgeo = 1 to kgeo = 1.1, we can make the deterministic-based designs with a low reliability (P f ∼ 0.5) to reliability-based designs with a very low failureprobability (∼ 10−4) for a case of COV < 0.05.
(iii) For high strength steels (Ys > 355 N/mm2) the deflection constraint should be consideredonly, whereas for low strength steels (Ys < 230 N/mm2) it is required to check the constraint on staticstress. Having P f = 0 for all girder configurations, this means that the constraint fatigue stress can beneglected.
Finally, it is obvious that uncertain design parameters lead to the failure probability of cranegirders, but a reliability and sensitivity analysis of a crane girder involving parameters of its buildingframe [23] should be conducted in forthcoming works for reaching reliability-based designs in realapplications.
References
[1] Hong, K.-S., Shah, U. H. (2019). Dynamics and control of industrial cranes. Springer.[2] Verschoof, I. J. (2002). Cranes: design, practice, and maintenance. Wiley-Blackwell.[3] Farkas, J. (1986). Economy of higher-strength steels in overhead travelling cranes with double-box girders.
Journal of Constructional Steel Research, 6(4):285–301.[4] Rao, S. S. (1978). Optimum design of bridge girders for electric overhead traveling cranes. Journal of
Engineering for Industry, 100(3):375–382.[5] Liu, P. F., Xing, L. J., Liu, Y. L., Zheng, J. Y. (2014). Strength analysis and optimal design for main girder
of double-trolley overhead traveling crane using finite element method. Journal of Failure Analysis andPrevention, 14(1):76–86.
[6] Pinca, C. B., Tirian, G. O., Socalici, A. V., Ardeleadn, D. E. (2009). Dimensional optimization for thestrength structure of a traveling crane. WSEAS Transactions on Applied and theoretical Mechanics, 4(4):147–156.
[7] Tam, C. M., Tong, T. K. L. (2003). GA-ANN model for optimizing the locations of tower crane andsupply points for high-rise public housing construction. Construction Management and Economics, 21(3):257–266.
[8] Lagaros, N. D., Papadrakakis, M. (2012). Applied soft computing for optimum design of structures.Structural and Multidisciplinary Optimization, 45(6):787–799.
[9] Mijailovic, R., Kastratovic, G. (2009). Cross-section optimization of tower crane lattice boom. Meccanica,44(5):599.
[10] Gasic, M. M., Savkovic, M. M., Bulatovic, R. R., Petrovic, R. S. (2011). Optimization of a pentagonalcross section of the truck crane boom using Lagrange’s multipliers and differential evolution algorithm.Meccanica, 46(4):845–853.
[11] Jármai, K. (1990). Decision support system on IBM PC for design of economic steel structures appliedto crane girders. Thin-Walled Structures, 10(2):143–159.
[12] Sun, C., Tan, Y., Zeng, J., Pan, J.-S., Tao, Y. (2011). The structure optimization of main beam for bridgecrane based on an improved PSO. Journal of Computers, 6(8):1585–1590.
[13] Sun, G., Li, G., Zhou, S., Li, H., Hou, S., Li, Q. (2011). Crashworthiness design of vehicle by usingmultiobjective robust optimization. Structural and Multidisciplinary Optimization, 44(1):99–110.
[14] Lagaros, N. D., Plevris, V., Papadrakakis, M. (2010). Neurocomputing strategies for solving reliability-robust design optimization problems. Engineering Computations, 27(7):819–840.
[15] Fan, X., Bi, X. (2015). Reliability-based design optimization for crane metallic structure using ACO andAFOSM based on China standards. Mathematical Problems in Engineering, 2015:1–12.
[16] Yu, L., Cao, Y., Chong, Q., Wu, X. (2011). Reliability-based design for the structure of tower crane
134
Hai, T. V., et al. / Journal of Science and Technology in Civil Engineering
under aleatory and epistemic uncertainties. In 2011 International Conference on Quality, Reliability,Risk, Maintenance, and Safety Engineering, IEEE, 938–943.
[17] Meng, W., Yang, Z., Qi, X., Cai, J. (2013). Reliability analysis-based numerical calculation of metalstructure of bridge crane. Mathematical Problems in Engineering, 2013:1–5.
[18] Ditlevsen, O., Madsen, H. O. (1996). Structural reliability methods. Wiley, Chichester, UK.[19] Duong, B., van Gelder, P. (2016). Calibrating resistance factors under load and resistance factor design
method (LRFD) using Monte-Carlo simulation. Journal of Science and Technology in Civil Engineering(STCE)-NUCE, 10(5):79–87.
[20] Hu, C., Youn, B. D., Wang, P. (2019). Engineering design under uncertainty and health prognostics.Springer.
[21] Zio, E. (2013). System reliability and risk analysis. In The Monte Carlo simulation method for systemreliability and risk analysis, Springer, 7–17.
[22] British Standards Institution, BS 2573 (1983). Part I, Rules for the design of cranes, specification forclassification, stress calculations and design criteria for structures. London, BSI.
[23] Thuat, D. V., Chuong, H. V., Hoa, N. D. (2017). Evaluation of lateral static earthquake and wind loadsapplied on one-story industrial steel building frames with cranes. Journal of Science and Technology inCivil Engineering (STCE)-NUCE, 11(1):11–18. (in Vietnamese).
135


