Embed Size (px)
Citation preview

Farmer Trust in Agricultural Cooperatives: Evidence from Missouri Corn and Soybean Producers
Harvey S. James, Jr. University of Missouri-Columbia
146 Mumford Hall Columbia, MO 65211 Phone: 573-884-9682
Email: [email protected]
Michael E. Sykuta* University of Missouri-Columbia
135B Mumford Hall Columbia, MO 65211 Phone: 573-882-1738
Email: [email protected]
Draft: May 14, 2004
Paper prepared for presentation at the 2004 meetings of the American Agricultural Economics Association, in Denver, Colorado, August 1-4, 2004
Abstract: We examine whether cooperatives are characterized by greater trust than investor-owned firms. We survey 2000 Missouri corn and soybean farmers and find that trust and farmer perceptions of trustworthiness and competence are higher in cooperatives than in investor-owned firms and that trust is a significant factor explaining the choice of farmers to market to cooperatives rather than investor-owned firms. Interestingly, we find that trust is more significant in producers’ decisions for marketing soybeans than for corn. JEL Codes: Q130, Z130 * We appreciate insights and comments offered by Michael Cook and the research assistance of Athanasios Chymis. We gratefully acknowledge financial support provided through a grant from the Coase Foundation.

Farmer Trust in Agricultural Cooperatives: Evidence from Missouri Corn and Soybean
Producers
Introduction
Agricultural producer-owned firms (POFs), or cooperatives, occupy a special place in the
American economic landscape. Agriculture is one of few sectors of the U.S. economy in which
cooperative firms directly compete on a large scale with investor-owned agribusiness firms
(IOFs). The USDA (2003) reports there were 3,229 agricultural cooperatives in the United
States in 2001, with membership totaling more than 3 million and producing a net income of
over $1.35 billion. As of 1999, 27 percent of total farm marketing (e.g., crops, livestock, and
poultry) was accounted for by agricultural cooperatives, and 27 percent of all farm inputs (e.g.,
feed, seed, fertilizer, crop protectants, and petroleum) were purchased through cooperatives
(Kraenzle, 2001).
Because they are owned by and operated for the benefit of their agricultural producer
members, POFs have a distinctly different objective and focus than traditional IOFs. While
POFs provide financial benefits to the producers with whom they do business, either in the form
of cost-based pricing, reduced-price services, or patronage refunds, IOFs focus on financial
returns to (non-producer) investors. Sykuta and Cook (2001) argue this difference in
organizational objectives may create greater trust in the relation between producers and
producer-owned agribusinesses than between producers and IOFs. Shapira (1999) argues that
capitalist firms are “low-trust and coercive” while kibbutzim are “high-trust and democratic.”
Shaffer (1987) asserts that trust makes or breaks a cooperative, in part because the contract
between producers and the cooperative is more relational in cooperatives than in investor-owned
1

firms (IOFs) and because cooperatives are generally more reluctant than IOFs to impose
sanctions on its members.
Despite the theoretical arguments, there is little empirical evidence showing that POFs
are characterized by greater trust than IOFs. Balbach (1998) examines differences in contracts
between U.S. sugar beet producers and producer-owned and investor-owned refining companies,
arguing that the more efficient contracts with cooperatives is attributed to the higher trust
producers have with the cooperative than with the IOF. Shapiro (1999) argues that the decline in
cooperative effectiveness is attributed to the transition from a high-trust to low-trust culture. In
these studies trust is implied but not directly measured.
A 2003 survey of 2,031 U.S. adults conducted by Opinion Research Corporation
measured the relative degree of trust in cooperatives and IOFs. The survey revealed that “two-
thirds of consumers believe businesses that are owned and governed by their customers and have
consumers on their boards of directors are more trustworthy than those that do not” (NCBA,
2003). However, this survey examined consumer attitudes only. In related research,
Chloupkova, Svendsen and Svendsen (2003) showed how the institutional environment helps
create and destroy trust within cooperatives, but they did not compare how trust in cooperatives
is affected vis-à-vis IOFs. Ole Borgen (2001) showed why trust is important in cooperatives and
how trust can be generated, but he did not compare trust in cooperatives with that of IOFs. And
James and Sykuta (2003) found that agricultural POFs with governance structures more
resembling those of IOFs exhibit lower levels of organizational trust. While such studies focus
on the level of trust within organizations, they don’t address the effect of trust when it comes to
producers’ choice of doing business with either a POF or an IOF.
2

The purpose of our paper is to fill the gap in the empirical literature linking trust to
cooperative (producer-owned) and investor-owned organizations. We use data from a survey of
2000 Missouri corn and soybean farmers to examine the relationship between trust and the
choice of agricultural organization to which farmers marketed their 2002 crop year harvest. We
asked farmers whether they marketed their 2002 crops to cooperatives or investor-owned
agribusinesses. We also asked about the degree to which they trusted the organizations to which
they marketed their crops, the terms of the marketing agreement, and other questions about their
farming practices and experiences. We find that producers have a higher trust in POFs than in
IOFs when marketing their soybean crops, but not when marketing their corn harvests.
Background
Trust is an expectation that one would not be exploited by another (James, 2002). This
expectation is based in part on perceptions of the trustworthiness (or honesty) and competence of
the entities in whom trust is placed (see James, 2002; Levi, 2000; Nooteboom, 2002). For
example, consider the case of public support for biotechnology. If the public is confident that it
would not be exploited (e.g., the public perceives biotechnology institutions to be trustworthy
and competent), then the public would be more likely to trust and, in turn, support biotechnology
institutions. However, if the public expects to be exploited (e.g., public perceptions are that
biotechnology institutions have a vested interest to misrepresent the safety and efficacy of
biotechnology or have insufficient knowledge to conduct biotechnology-based research and
development), then the public would be less willing to trust and hence support biotechnology
institutions (see Hunt and Frewer, 2001; James, 2003).
3

There is a growing literature on the relationship between trust and organizations. Some
researchers link organizations to the formation and destruction of trust (e.g., Zucker, 1986).
Other researchers show that trust is a factor affecting organizational form. For instance, La
Porta, Lopez-de-Silanes, Shleifer, and Vishny (1997) provide evidence that trust is positively
correlated with the size of firms in an economy. Simply, trust explains, in part, the existence of
large firms (see also Fukuyama, 1995).
At a most basic level, trust is often equated with cooperation, such as in economic models
of trust (James, 2002). For instance, La Porta et al (1997, p. 333) state that
[e]conomists have developed two views of trust as a tendency to cooperate. One view, rooted in repeated game theory, holds that trust is a prior that an opponent is cooperative rather than fully rational (e.g., plays only tit-for-tat in a repeated prisoner’s dilemma). … Another view, rooted in economic experiments, holds that people cooperate even in one-shot encounters, such as the dictator game or the ultimatum game …
If trust is rooted in cooperation, then we might expect that agricultural “cooperatives” –
by definition – ought to be characterized by trust. However, whether producer-owned firms
(POFs) are characterized by greater trust than investor-owned firms (IOFs) is a question that has
not been fully examined in the literature. Some researchers have suggested that POFs have
higher levels of trust than IOFs (e.g., Sykuta and Cook, 2001; Shapira, 1999; Shaffer, 1987).
However, the evidence is inconclusive. Although cooperatives are not immune to problems that
can erode public trust, the fact that cooperatives are governed by the members who patronize
them might provide important advantages with respect to trust formation, at least compared to
investor-owned firms. Thus, we expect that producers will have higher trust in producer-owned
cooperatives than in IOFs. To examine the relationship between trust and agricultural
organization, we follow La Porta et al (1997) who use trust to explain organizations. In our
paper we examine whether trust is a factor explaining the decision of producers to market their
4
crops to POFs or IOFs, holding constant other factors expected to affect that decision, such as
price received by the organization and the organization’s location.
Data and Methods
We worked with the Missouri Agricultural Statistics Service (MASS) to implement the
survey. MASS drew a sample of 2,000 farmers from the population of Missouri (USA) corn and
soybean farmers with farms in excess of 50 acres in the USDA farm census. The survey was
stratified by size and by USDA reporting district in the state to ensure a statistically
representative sample. Surveys were mailed in late February 2003 with a second mailing to non-
respondents in March 2003. We received 369 responses (142 from the first wave, 227 from the
second), resulting in an overall response rate of 18.5 percent.1 This response rate is not unusual
for surveys mailed to farmers early in the calendar year (see Pennings, Irwin, and Good, 2002).
Additionally, the only significant difference between first and second wave respondents was that
first wave respondents were nine percent less likely to be involved in non-farm business
activities than second wave respondents. In all other respects the characteristics of first and
second wave respondents were statistically identical.
We asked farmers how they marketed their 2002 corn and soybean harvests. We also
asked farmers about the extent to which they trusted the organizations to which they marketed
their harvests, how long they had dealt with the organization to which they sold their 2002 crop,
whether they earned any off-farm income, and information about their personal and farming
backgrounds.
1 The surveys were mailed by MASS in University of Missouri envelops, with postage-paid return envelops addressed to MASS. MASS checked off respondents against the original mailing list and forwarded the anonymous responses to the authors.
5

The average farmer in our sample was 58 years old, farmed approximately 750 acres and
had 34 years of farming experience. Seventy-nine percent of respondents had a soybean harvest
in 2002, 61 percent had a corn harvest, and 57 percent harvested both corn and soybeans. Sixty
percent did not have any off-farm business activities, while 43 percent utilized only family
members’ labor during harvest. Our respondent sample is 94 percent male, 87 percent married,
and 97 percent Caucasian. The average yield for soybean farmers in our sample was 33 bushels
per acre, while the average yield for corn producers was 104 bushels per acre. Soybean farmers
in our sample received an average price of $5.38 per bushel for their 2002 crop, while corn
producers received an average price of $2.35 per bushel. These yield and price averages are
consistent with statewide averages for Missouri farmers reported by the Missouri Department of
Agriculture and the U.S. Department of Agriculture for the 2002 crop year,2 suggesting that our
sample is a good representation of Missouri corn and soybean farmers. See Table 1 for a
complete listing of variables and their definitions.
We are interested in examining whether and how trust correlates with the decision of
farmers to market their 2002 crop to POFs or IOFs, after controlling for other factors we expect
to influence the marketing decision (such as prices received and distance to the POF or IOF, for
example).3 We measure trust (TRUST) by asking farmers to indicate the degree to which they
agreed with the assessment that the cooperative or agribusiness to which they marketed their
2002 corn or soybean harvests “would stay within the terms of the agreement.” Respondents
indicated by answering definitely agree, tend to agree, tend to disagree, or definitely disagree.
2 According to the 2003 Missouri Farm Facts, the average soybean yield in Missouri in 2002 was 34 bushels per acres, with an average price received by farmers of $5.40 per bushel. For corn producers, the average yield statewide in 2002 was 105 bushels per acre, with an average price received of $2.45 per bushel (MODA/USDA, 2003, pp.5, 64). 3 Because we are interested in the question of whether trust affects the marketing decision of farmers, we removed from our sample those respondents who marketed either corn or soybeans to both a POF and an IOF. For soybean farmers, this resulted in a loss of 10 observations; for corn farmers, this resulted in the loss of 11 observations.
6
In addition to the trust variable, we also asked farmers about their perceptions of the
honesty and competence of the POF or IOF to which they marketed their crops, since perceptions
of honesty and competence are known to affect trust in organizations.4 We measure perceptions
of honesty (HONEST) by the question: “Think about the honesty and integrity of the people in
the [cooperative or agribusiness] who explained the terms of the contract to you and who paid
you and took delivery of your grain. Overall, how would you rate the honesty and integrity of
these people?” Respondents indicated by answering very high, high, average, low or very low.
Similarly, perceptions of competence (COMPETENT) were measured by the question: “Think
about the competence of the people in the [cooperative or agribusiness] who explained the terms
of the contract to you and who paid you and took delivery of your grain – their knowledge of the
industry and your business, their interpersonal skills, their ability to answer your questions, etc.
Overall, how would you rate the competence of these people?” Respondents indicated by
answering very high, high, average, low or very low.
Because TRUST, HONEST, and COMPETENT are ordinal qualitative variables rather
than cardinal variables, we employ the transformation procedure outlined by Terza (1987) to
replace each discrete category (e.g., low, average, high) with a number.5 If (where jd Jj ,...,1=
and J is the number of discrete categories) is the discrete category value for variable D, then d
is replaced with , where n is the probability density function of the
j
jjjjjj pnnd /)]()([ˆ11 δδ −= −−
4 For example, Nooteboom (2002, pp. 56, 57) says that organizational trust can be considered by an examination of “honesty trust” and “competence trust” in the organization. 5 Alternatively, we could assign the categories in the variable TRUST, for instance, as Definitely Agree=4, Tend to Agree=3, Tend to Disagree=2, and Definitely Disagree=1. We reject this approach because it assigns an arbitrary mean to the variable TRUST (as well as the other qualitative ordinal variables, HONEST and COMPETENT). See Terza (1987) for a discussion.
7
standard normal distribution evaluated at jδ , is the percentage of the sample observed in
category j, and
jp
jδ is calculated as follows: First, let
(dN
(dN
(dN
=jδ
11 ) p=
212 ) pp +=
…
1211 ...) −− +++= jj ppp .
Then,
, ()(1
1 ∑=
−j
iipN 1,...,1 −= Jj ),
where is the inverse of the standard normal cumulative distribution function, and 1−N −∞=0δ
and +∞=Jδ . Table 2 gives the transformed values for these variables.
Because we surveyed farmers after they had made their marketing decisions, trust may
not be exogenous. That is, respondents’ perspectives of trust in the organizations to which they
marketed their crops would likely be affected by their actual experiences with those
organizations for the crop year in question. In order to control for that endogeneity, we use
honesty and competence (a) as independent variables to explain producers’ choice of marketing
organization, and (b) as instruments of trust in a two-stage specification.6
While trust in the organization might be important, we expect other factors to affect the
decision of farmers to market to either POFs or IOFs. In this case we control for the price
offered for the crop and the distance to the agricultural organization. The variable PRICE is the
final price, measured in dollars per bushel, received by the farmer at the time of delivery of his
6 In this way we follow the pattern utilized by La Porta et al (1997) who, in addition to linking trust to organization, analyzed an assumed instrument of trust (in their case, “hierarchical religion”) as a factor affecting organization.
8

grain. The variable DISTANCE is the distance, in miles, the farmer traveled to deliver his
harvest to the POF or IOF. We also control for farm and farmer heterogeneity by including the
following additional variables in our analysis: The total number of acres that the respondent
farms (FARMSIZE); whether the farmer had above-average farming experience
(FARMEXPERIENCE); whether the respondent was not involved in any off-farm business
activities (FARMONLY); whether the respondent had exclusively family members (such as
spouse, children, siblings, parents, cousins, etc) help with their 2002 crop harvest, either as paid
or unpaid workers (FAMILYHELP); and the educational level, marital status, and age of
respondents.
Results
Tables 3 and 4 list summary statistics for our sample of respondents. According to Table
3, approximately 33 percent of soybean farmers marketed their 2002 soybean harvests to
producer-owned firms (POFs). Additionally, over 70 percent of soybean farmers also planted
corn in 2002. In contrast, Table 4 shows that only 26.6 percent of corn farmers marketed to
cooperatives and nearly all corn farmers (93 percent) also farmed soybeans.
With respect to the question of trust, Table 3 shows that for soybean farmers the mean of
TRUST in producer-owned firms is significantly greater (p=0.04 in a difference of means test)
than the mean of TRUST for investor-owned firms. Similarly, the mean values for HONEST
and COMPETENT are greater for POFs than for IOFs (p=0.02 and p=0.15, respectively). This
suggests that soybean farmers place significantly more trust in POFs than IOFs and that they
perceive POFs to be characterized by significantly greater levels of honesty and competence than
IOFs. Additionally, in comparison to farmers who marketed their soybean crops to
9

agribusinesses, soybean farmers marketing to cooperatives received a lower price for their crop,
traveled a shorter distance to deliver their harvest, had smaller farms, were more likely to have
above-average farming experience, were less likely to rely exclusive on family to help with
harvest, and were older.7 In all other respects the differences between farmers marketing to
POFs and IOFs were not significantly different.
Interestingly, Table 4 provides a different picture from the perspective of corn growers,
with respect to perceptions of trust in POFs and IOFs. In the case of the variable TRUST, there
is virtually no difference between trust in POFs and trust in IOFs. Average perceptions of
honesty (HONEST) are slightly larger in cooperatives than in agribusinesses, but not
significantly so (p=0.26). Farmers perceive cooperatives to be more competent (COMPETENT)
than IOFs, but only weakly so (p=0.14). This suggests that corn growers do not consider POFs
and IOFs to differ in terms of their trustworthiness. However, there are important differences in
the characteristics of corn farmers who market to POFs rather than IOFs. Farmers selling their
corn to cooperatives instead of IOFs received a lower price for their crop, traveled a shorter
distance for delivery, had smaller farms, were more likely to be involved in off-farm business
activities, were more likely to have attended at least some college, and were older.8
The differences in trust in POFs and IOFs can also be observed from an examination of
the biserial correlations between measures of trust and choice of POF and correlations between
trust, honesty and competence variables.9 As seen in Table 5, TRUST, HONEST and
COMPETENT are significantly correlated with POF (the decision of soybean farmers to market
their grain to a cooperative). However, in the case of corn growers, no measure of trust is
7 In a difference of means test, the differences noted here are significant at the 10 percent level or better. 8 In a difference of means test, the differences noted here are significant at the 10 percent level or better. 9 A biserial correlation measures the correlation between a dichotomous variable (e.g., POF) and a continuous variable (e.g., Trust).
10
correlated with POF. Importantly, HONEST and COMPETENT are highly correlated with
TRUST, providing prima facie evidence that perceptions of honesty and competence are good
indicators of trust. Indeed, the relationship between perceptions of honesty and competence and
trust exists for both corn and soybean farmers.
Tables 6 and 7 present results from a Probit analysis of the effects of trust and other
variables on the marketing decisions of farmers. Although the coefficient itself in a Probit model
is not directly interpretable in terms of the magnitude of the effect in the probability a farmer
marketing to a POF, it is possible to calculate the change in probability, given a unit change in
the respective variable, by looking at the estimated coefficient times the density function of the
standard normal distribution evaluated at the fitted value of the regression (see Greene, 2000, ch.
19).
In Table 6 we present results of our analysis of soybean farmers. We find that TRUST,
as well as HONEST and COMPETENT, are highly correlated with POFs. Specifically, TRUST
increases the probability that a soybean farmer will market his crop to a POF by 10.5 percent,
even after controlling for other factors expected to affect the decision of farmers to market their
crop to a POF. Controlling for the expected endogeneity of trust by examining perceptions of
honesty and competence as independent variables, we find that the variables HONEST and
COMPETENT each improve the likelihood of a farmer marketing to a POF by nine and eight
percent, respectively. We also use HONEST and COMPETENT as instruments in a two-stage
model in which predicted values of trust (TRUST_HAT) from the first-stage regression are used
in a second-stage Probit model. We find that the impact of trust not only remains significant but
also increase in importance, in that trust increases the likelihood that farmers market their
soybeans to POFs by 19 percent.
11
Although trust and perceptions of honesty and competence in the organization to which a
farmer markets his crop are important in the marketing decision, they are not the most important
factors, according to our analysis. The most important factor, according to our data, is price.
The fact that IOFs offer farmers a higher price for their soybean harvest than POFs reduces the
likelihood that soybean farmers will market their crop to a POF by nearly 32 percent.10 This
might explain why more than two-thirds of soybean farmers in our sample marketed their 2002
harvest to IOFs. We also find distance is a significant factor affecting the marketing decision of
soybean farmers. The greater the distance to the organization, the less likely the farmer will
market to a POF, other things being equal. Stated differently, farmers appear to be more willing
to travel a greater distance to an IOF than to a POF.
Table 7 presents a different picture of the effect of trust on the decision of corn producers
to market their crop to POFs. We find that trust is not significantly correlated with the POF or
IOF decision of corn farmers, even after controlling for expected endogeneity by examining the
effects of perceived honesty and competence and by using perceptions of honesty and
competence as instruments of trust. Instead, as in the case of soybean farmers, price is the most
important factor. The fact that IOFs offer a higher price for corn, on average, reduces the
likelihood that farmers will market to a POF by nearly 57 percent. The next most significant and
10 We note that one reason the price variable is negative and significant is that producer-owned firms generally return revenue to producers in the form of a patronage refund. Therefore, some farmers might be willing to accept a lower price for their crop from a POF in anticipation of receiving a patronage refund from the POF. However, the fact that the price and distance variables are significant might indicate that the expected patronage refund is not sufficient to induce some farmers to market to a POF. If the expected patronage refund were sufficient to make up the difference between the POF and IOF price, then the PRICE variable would not be expected to be significant. That is, at the margin, farmers would be indifferent between marketing to a POF and IOF, if the patronage refund paid by the POF was expected to “make up the difference” between the IOF and POF prices. We believe the relationship among patronage refund, price paid and other factors on the marketing decision of farmers is an important problem that deserves further research.
12

important factor is distance. The further a POF is from a farmer, the less likely he is to market
his corn there.
Discussion
We find that farmers marketing soybeans place significantly higher trust in POFs than
IOFs and that trust is a significant factor affecting the decision of soybean farmers to market
their grain to a POF, other things being equal. However, while trust matters for soybean
producers, the relationship between trust and agricultural organization does not appear to be the
same for corn farmers. We find that trust is not different between POFs and IOF for corn
farmers. We offer two possible explanations for this finding.
First, as seen in Tables 3 and 4, while a little more than two-thirds of corn farmers also
grow soybeans, nearly all soybean farmers grow corn. Moreover, more than two-thirds of
soybean farmers marketed their crop to IOFs. Thus, it is possible that the decision farmers are
making with respect to the marketing of soybeans is a driver for the corn marketing decision and
that the marketing decision of corn farmers may not be independent enough from the soybean
decision for us to adequately capture the effect of trust on choice of marketing organizations
from a corn farmer perspective. For example, for the subset of farmers growing both corn and
soybeans, 71.62 percent of farmers marketing their soybeans to a POF also marketed their corn
to a POF. In contrast, only 8.82 percent of farmers marketing their soybeans to an IOF market
their corn to a POF. Additional evidence for the fact that soybeans might be influencing the
marketing of corn comes from the fact that the SOY variable in Table 7 is negative and large,
although it is not statistically significant. Nevertheless, the negative sign might indicate that the
13

soybean decision has an important (and negative) effect on the marketing decision of corn
farmers.
Second, the fact that nearly all corn producers also planted soybeans might indicate a
desire on the part of some corn producers for greater diversification, which could, in turn,
indicate a lower tolerance for risk than soybean producers. Because “uncertainty and
vulnerability are the core elements of trust relations” (Heimer, 2001, p. 43), farmers who are
relatively more averse to risk than others might also be less willing to trust, or at least be less
willing to impute trust in the organization to which they market their harvests.
Conclusion
Our results present an interesting puzzle concerning the nature of producers’ relationships
with the organizations to which they market their crops. The literatures on collective
organizations and on trust both suggest that agricultural producers would have higher trust in
producer-owned marketing organizations than in investor-owned firms. Our results suggest that
while such a trust relationship appears to exist in soybean marketing relationships, it is not
evidenced in corn marketing relationships. The puzzle is why such a difference would exist
between the two products. As noted above, one possibility is that the choice of organization for
marketing soybeans also dictates the choice for marketing corn when a farmer produces both
products. Another is that corn producers appear more likely to diversify their crop products (by
also growing soybeans) more than soybean producers, perhaps exhibiting a higher degree of risk
aversion or a higher perceived uncertainty, both of which would be negatively correlated with
trust. Other explanations may exist as well, such as whether the products will be used for local
versus distant end consumer markets (e.g., for a local feed mill versus for export). We hope to
14

explore these and other possible differences that may explain the puzzle and provide a better
understanding of the formation and role of trust in producers’ marketing decisions.
15

Table 1. Variable names and definitions.
Variable Definition
POF Dummy variable equal to one if respondent marketed his 2002 crops to a producer-owned firm (cooperative); equal to zero if 2002 crops marketed to an agribusiness.
TRUST Qualitative response variable based on respondent’s agreement with the statement that the cooperative or agribusiness would stay within the terms of the agreement, where response options are Definitely Agree, Tend to Agree, Tend to Disagree, or Definitely Disagree.
HONEST Qualitative response variable based on respondent’s assessment of the honesty and integrity of the people within the cooperative or agribusiness who explained contract terms, took delivery of the crop, and paid the farmer, where response options are Very High, High, Average, Low, and Very Low.
COMPETENT Qualitative response variable based on respondent’s assessment of the competence (such as knowledge of industry and interpersonal skills) of the people within the cooperative or agribusiness who explained contract terms, took delivery of the crop, and paid the farmer, where response options are Very High, High, Average, Low, and Very Low.
PRICE Price received by respondent for 2002 crop at time of delivery.
DISTANCE Distance, in miles, from respondent’s farm to cooperative or agribusiness where delivery of 2002 crop occurred.
FARMSIZE Number of acres farmed by respondent.
FARMEXP Dummy variable equal to one if the respondent had above-average number of years farming experience.
FARMONLY Dummy variable equal to one of respondent was not involved in any off-farm business ventures or occupations in 2002.
FAMILYHELP Dummy variable equal to one if only family members helped the respondent with the 2002 crop harvest.
COLLEGE Dummy variable equal to one if respondent attended at least some college.
MARRIED Dummy variable equal to one if the respondent was married.
AGE Respondent’s age.
CORN Dummy variable equal to one if soybean producers also planted corn in 2002.
SOY Dummy variable equal to one if corn farmers also planted soybeans in 2002.
16

Table 2. Terza (1987) transformation values for trust, honesty and competence variables.
Variable Ordinal Response Category Terza (1987) Transformed Cardinal Value
Soybean Growers
TRUST
Definitely Agree 0.6510
Tend to Agree -0.9089
Tend to Disagree -2.3564
Definitely Disagree -2.8742
HONEST
Very High 1.0043
High -0.2437
Average -1.3049
Low -2.2448
Very Low -2.8735
COMPETENT
Very High 1.1570
High -0.0730
Average -1.1842
Low -2.2359
Very Low -2.5860
Corn Growers
TRUST
Definitely Agree 0.5455
Tend to Agree -1.0154
Tend to Disagree -2.4610
Definitely Disagree –
HONEST
Very High 1.0781
High -0.1388
Average -1.2301
Low -2.2428
Very Low -2.7307
COMPETENT
Very High 1.1590
High 0.0137
Average -1.0664
Low -2.2622
Very Low -2.6985
17

Table 3. Summary statistics for soybean producers.
All Soybean Growers Soybean Growers Marketing to POFs Soybean Growers Marketing to IOFs
Variable Mean S.D. Min Max Mean S.D. Min Max Mean S.D. Min Max
POF 0.326 0.470 0 1 1 0
TRUST 0.000 0.813
-2.874 0.651 0.173 0.725 -0.909 0.651 -0.096 0.846 -2.874 0.651
HONEST 0.000 0.908 -2.874 1.004 0.216 0.827 -1.305 1.004 -0.135 0.934 -2.874 1.004
COMPETENT 0.000 0.918 -2.586 1.157 0.135 0.863 -1.184 1.157 -0.077 0.943 -2.586 1.157
PRICE 5.38 0.436 2.50 6.18 5.20 0.528 2.50 6.18 5.47 0.348 4.50 6.12
DISTANCE 23.1 27.298 1 212 10.6 10.607 1 60 30.3 31.110 1 212
FARMSIZE 838.4 926.0 50 5800 642.5 740.1 50 5500 933.7 991.6 50 5800
FARMYEARS 34.7 13.910 6 67 35.4 15.270 6 67 34.4 13.231 7 65
FARMEXP 0.514 0.501 0 1 0.587 0.495 0 1 0.479 0.501 0 1
FARMONLY 0.635 0.482 0 1 0.571 0.498 0 1 0.667 0.473 0 1
FAMILYHELP 0.440 0.497 0 1 0.359 0.482 0 1 0.479 0.501 0 1
COLLEGE 0.472 0.500 0 1 0.489 0.503 0 1 0.463 0.500 0 1
MARRIED 0.876 0.330 0 1 0.837 0.371 0 1 0.895 0.308 0 1
AGE 58.2 12.710 26 86 60.5 13.195 31 86 57.0 12.348 26 86
CORN 0.716 0.452 0 1 0.717 0.453 0 1 0.716 0.452 0 1
18

Table 4. Summary statistics for corn producers.
All Corn Growers Corn Growers Marketing to POFs Corn Growers Marketing to IOFs
Variable Mean S.D. Min Max Mean S.D. Min Max Mean S.D. Min Max
POF 0.266 0.443 0 1 1 0
TRUST 0.000 0.797
-2.461 0.546 -0.030 0.887 -2.461 0.546 0.018 0.744 -1.015 0.546
HONEST 0.000 0.915 -2.731 1.078 0.115 0.931 -2.243 1.078 -0.078 0.902 -2.731 1.078
COMPETENT 0.000 0.920 -2.699 1.159 0.157 0.917 -1.066 1.159 -0.102 0.913 -2.699 1.159
PRICE 2.35 0.249 1.45 2.90 2.26 0.235 1.60 2.70 2.40 0.244 1.45 2.90
DISTANCE 20.4 21.754 1 108 9.8 8.399 2 60 27.0 24.742 1 108
FARMSIZE 903.8 966.090 48 5800 665.9 863.404 50 5500 990.2 989.226 50 5800
FARMYEARS 33.7 13.724 7 67 35.9 16.156 8 67 33.1 12.705 7 65
FARMEXP 0.467 0.500 0 1 0.544 0.503 0 1 0.440 0.498 0 1
FARMONLY 0.671 0.471 0 1 0.571 0.499 0 1 0.708 0.456 0 1
FAMILYHELP 0.458 0.499 0 1 0.439 0.501 0 1 0.465 0.500 0 1
COLLEGE 0.463 0.500 0 1 0.561 0.501 0 1 0.427 0.496 0 1
MARRIED 0.883 0.322 0 1 0.860 0.350 0 1 0.892 0.312 0 1
AGE 56.7 13.098 26 86 60.6 14.097 32 86 55.3 12.454 26 86
SOY 0.930 0.256 0 1 0.947 0.225 0 1 0.924 0.267 0 1
19
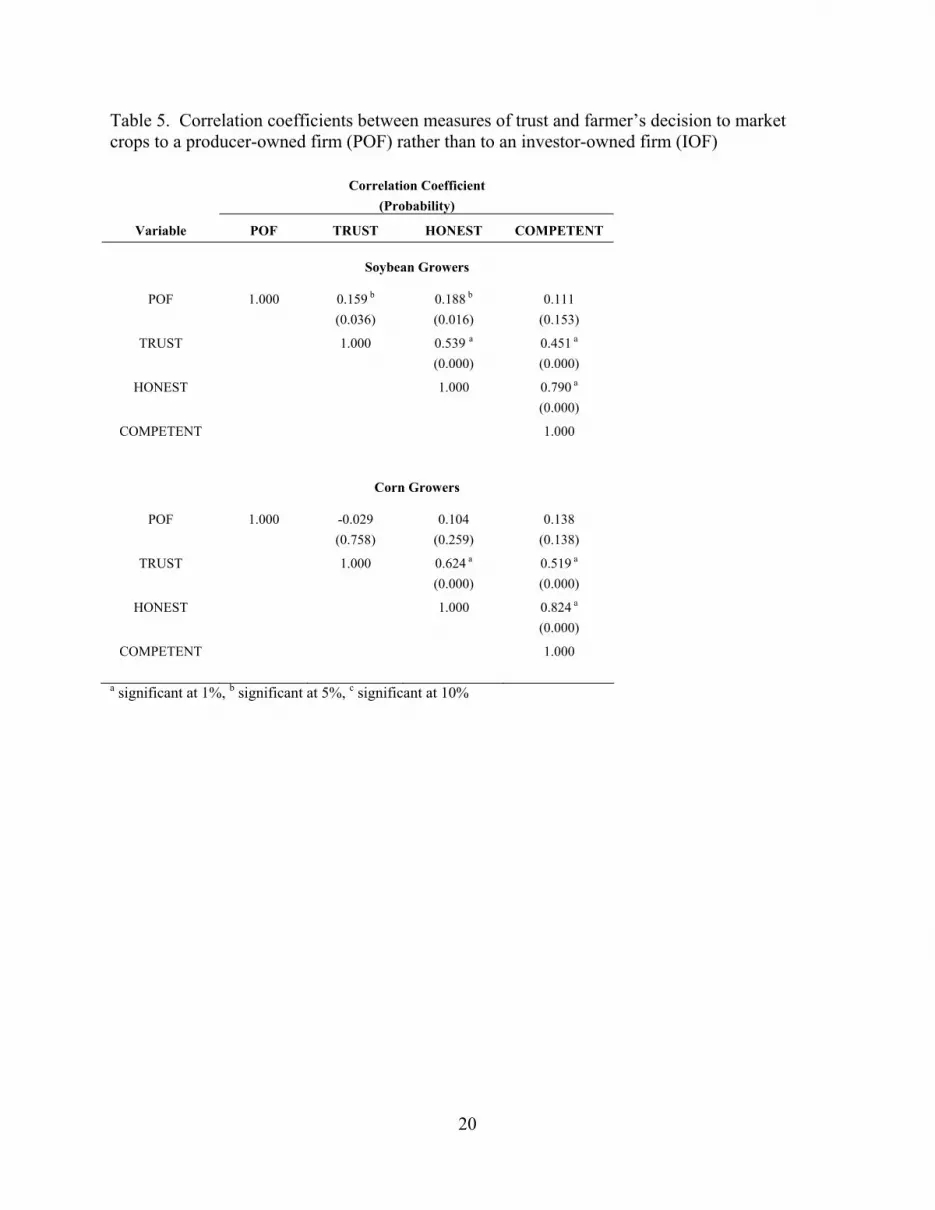
Table 5. Correlation coefficients between measures of trust and farmer’s decision to market crops to a producer-owned firm (POF) rather than to an investor-owned firm (IOF)
Correlation Coefficient
(Probability)
Variable POF TRUST HONEST COMPETENT
Soybean Growers
POF 1.000 0.159 b (0.036)
0.188 b (0.016)
0.111 (0.153)
TRUST 1.000 0.539 a (0.000)
0.451 a (0.000)
HONEST 1.000 0.790 a (0.000)
COMPETENT 1.000
Corn Growers
POF 1.000 -0.029 (0.758)
0.104 (0.259)
0.138 (0.138)
TRUST 1.000 0.624 a (0.000)
0.519 a (0.000)
HONEST 1.000 0.824 a (0.000)
COMPETENT 1.000
a significant at 1%, b significant at 5%, c significant at 10%
20

Table 6. Probit analysis of farmer decision to market 2002 soybean harvest to producer-owned firms (POFs) rather than investor-owned firms (IOFs).
Variable TRUST HONEST COMPETENT TRUST_HAT
INTERCEPT
9.682 a
(3.982) [2.391]
14.451 a (4.519) [3.584]
13.991 a (4.415) [3.400]
14.555 a (4.548) [3.551]
TRUST
0.425 a (0.173) [0.105]
0.779 b (0.332) [0.190]
HONEST
0.364 b (0.161) [0.090]
COMPETENT
0.335 b (0.161) [0.081]
PRICE
-1.286 a (0.395) [-0.318]
-1.302 a (0.376) [-0.323]
-1.267 a (0.377) [-0.308]
-1.268 a (0.381) [-0.309]
LN(DISTANCE)
-0.515 a (0.143) [-0.127]
-0.467 a (0.148) [-0.116]
-0.521 a (0.145) [-0.127]
-0.487 a (0.149) [-0.119]
LN(FARMSIZE)
0.060 (0.141) [0.015]
-0.066 (0.149) [-0.016]
-0.037 (0.146) [-0.009]
-0.074 (0.152) [-0.018]
FARMEXP
0.598 c (0.325) [0.148]
0.871 a (0.351) [0.216]
0.780 b (0.344) [0.190]
0.791 b (0.354) [0.193]
FARMONLY
-0.742 a (0.289) [-0.183]
-0.599 b (0.307) [-0.149]
-0.664 b (0.298) [-0.161]
-0.635 b (0.317) [-0.155]
FAMILYHELP
-0.493 c (0.274) [-0.122]
-0.842 a (0.300) [-0.209]
-0.877 a (0.299) [-0.213]
-0.834 a (0.305) [-0.203]
COLLEGE
0.144 (0.279) [0.036]
0.137 (0.286) [0.034]
0.039 (0.287) [0.009]
0.060 (0.295) [0.015]
MARRIED
-0.477 (0.353) [-0.118]
-0.655 c (0.380) [-0.162]
-0.673 c (0.389) [-0.164]
-0.711 c (0.398) [-0.173]
LN(AGE)
-0.431 (0.796) [-0.106]
-1.351 (0.855) [-0.335]
-1.288 (0.841) [-0.313]
-1.373 (0.861) [-0.335]
CORN
0.180 (0.293) [0.044]
-0.107 (0.306) [0.027]
0.037 (0.309) [0.009]
-0.006 (0.319) [0.001]
Pseudo R-square % Correctly Predicted Likelihood Ratio (DF)
Ave Density
.470 86.6
60.935(11) a 0.247
.471 85.3
57.772(11) a 0.248
.481 86.7
60.480(11) a 0.243
.485 86.1
58.305(11) a 0.244
a significant at 1%, b significant at 5%, c significant at 10% Standard errors in parentheses. Estimated slope in brackets, calculated by multiplying coefficient with average density.
21

Table 7. Probit analysis of farmer decision to market 2002 corn harvest to producer-owned firms (POFs) rather than investor-owned firms (IOFs).
Variable TRUST HONEST COMPETENT TRUST_HAT
INTERCEPT
7.232 c (4.264) [1.996]
5.642 (4.158) [1.631]
7.151 c (4.270) [2.031]
6.939 c (4.225) [1.991]
TRUST
-0.012 (0.199) [0.003]
0.242 b (0.339) [0.069]
HONEST
0.171 (0.183) [0.049]
COMPETENT
0.227 (0.188) [0.064]
PRICE
-2.049 a (0.779) [-0.566]
-1.418 b (0.664) [-0.410]
-1.428 b (0.658) [-0.406]
-1.325 b (0.656) [-0.380]
LN(DISTANCE)
-0.492 a (0.176) [-0.136]
-0.398 b (0.169) [-0.115]
-0.369 b (0.173) [-0.105]
-0.394 b (0.170) [-0.113]
LN(FARMSIZE)
0.015 (0.163) [-0.004]
-0.085 (0.161) [-0.205]
-0.109 (0.160) [-0.031]
-0.120 (0.162) [-0.034]
FARMEXP
0.595 (0.426) [0.164]
0.633 (0.411) [0.183]
0.740 c (0.419) [0.210]
0.668 c (0.413) [0.192]
FARMONLY
-0.450 (0.367) [-0.124]
-0.639 c (0.346) [-0.185]
-0.640 c (0.343) [-0.182]
-0.649 c (0.345) [-0.186]
FAMILYHELP
-0.115 (0.315) [-0.032]
-0.152 (0.315) [-0.044]
-0.263 (0.324) [-0.075]
-0.222 (0.322) [-0.064]
COLLEGE
0.012 (0.332) [0.003]
0.065 (0.319) [0.019]
0.066 (0.322) [0.019]
0.057 (0.323) [0.016]
MARRIED
-0.585 (0.497) [-0.161]
-0.315 (0.477) [-0.091]
-0.302 (0.489) [-0.086]
-0.353 (0.480) [-0.101]
LN(AGE)
-0.027 (0.868) [-0.007]
-0.003 (0.860) [0.001]
-0.350 (0.878) [-0.099]
-0.316 (0.875) [-0.091]
SOY
-1.030 (0.852) [-0.284]
-0.715 (0.824) [-0.207]
-0.752 (0.820) [-0.214]
-0.689 (0.823) [-0.198]
Pseudo R-square % Correctly Predicted Likelihood Ratio (DF)
Ave Density
.388 81.9
33.694(11) a 0.276
.367 80.4
32.824 11) a 0.289
.374 81.0
32.819(11) a 0.284
.366 80.7
31.732(11) a 0.287
a significant at 1%, b significant at 5%, c significant at 10% Standard errors in parentheses. Estimated slope in brackets, calculated by multiplying coefficient with average density.
22

References
Balbach, J.K, “The Effect of Ownership on Contract Structure, Cost, and Quality: The Case of
the U.S. Beet Sugar Industry,” in J.S. Royer and R.T Rogers (eds.), The Industrialization
of Agriculture: Vertical Coordination in the U.S. Food System, Aldershot, England:
Ashgate Publishing, 1998, pp. 155-184.
Chloupkova, Jarka, Gunnar Lind Haase Svendsen, and Gert Tinggaard Svendsen, “Building and
Destroying Social Capital: The Case of Cooperative Movements in Denmark and
Poland,” Agriculture and Human Values, 20(3), 2003, pp. 241-252.
Fukuyama, Francis, Trust: The Social Virtues and the Creation of Prosperity, New York, NY:
Free Press, 1995.
Greene, William H., Econometric Analysis, 4/e, Upper Saddle River, NJ: Prentice-Hall, 2000.
Heimer, Carol A., “Solving the Problem of Trust.” In K.S. Cook (ed.) Trust in Society, New
York, NY: Russell Sage Foundation, 2001, pp. 40-88.
Hunt, S., and Frewer, L. J., “Trust in Sources of Information About Genetically Modified Food
Risks in the UK,” British Food Journal, 103(1), 2001, pp. 46-62.
James, Harvey S., Jr., “The Trust Paradox: A Survey of Economic Inquiries into the Nature of
Trust and Trustworthiness,” Journal of Economic Behavior and Organization, 47(3),
2002, pp. 291-307.
James, Harvey S., Jr., “The Effect of Trust on Public Support for Biotechnology: Evidence from
the U.S. Biotechnology Study, 1997-1998,” Agribusiness: An International Journal,
19(2), 2003, pp. 155-168.
James, Harvey S., Jr., and Michael Sykuta, “Organizational Antecedents of Trust in Producer-
Owned Cooperatives,” CORI Working Paper #2003-07, University of Missouri, 2003
23
Kraenzle, Charles A., “Co-ops’ Share of Farm Market, Major Cash Expenditures Down in ‘99,”
Rural Cooperatives, 68(1), 2001, available online at
http://www.rurdev.usda.gov/rbs/pub/jan01/contents.htm, accesses March 24, 2003.
La Porta, Rafael, Florencio Lopez-de-Silanes, Andreai Shleifer, and Robert W. Vishny, “Trust in
Large Organizations,” American Economic Review Papers and Proceedings, 87(2), 1997,
pp. 333-338.
Levi, Margaret, “When Good Defenses Make Good Neighbors: A Transaction Cost Approach to
Trust, the Absence of Trust and Distrust,” in C. Menard, (ed.) Institutions, Contracts and
Organizations: Perspectives from New Institutional Economics, Northampton, MA:
Edward Elgar, 2000, pp. 137-157.
Missouri Department of Agriculture (MODA) and United States Department of Agriculture
(USDA), 2003 Missouri Farm Facts, Columbia, MO: Missouri Agricultural Statistics
Service, 2003, available online at
http://agebb.missouri.edu/mass/farmfact/pdf/farmfacts.pdf, downloaded March 16, 2004.
National Cooperative Business Association (NCBA), “Survey Reveals More Trust for
Cooperatives than for Investor-owned Corporations: Consumers Trust More Accountable
Businesses, Prefer Cooperatives,” press release issued October 1, 2003, available online
at http://www.ncba.org/pubs_newsrel.cfm?nrid=78.
Nooteboom, Bart, Trust: Forms, Foundations, Functions, Failures and Figures, Northampton,
MA: Edward Elgar, 2002.
Ole Borgen, Svein, “Identification as a Trust-generating Mechanism in Cooperatives,” Annals of
Public and Cooperative Economics, 72(2), 2001, pp. 209-228.
24

25
Pennings, Joost M.E., Scott H. Irwin, and Darrel L. Good, “Surveying Farmers: A Case Study,”
Review of Agricultural Economics, 24(1), 2002, pp. 266-277.
Shaffer, James D., “Thinking About Farmers’ Cooperatives, Contracts, and Economic
Coordination,” J.S. Royer (ed.), Cooperative Theory: New Approaches, ACS Service
Report no. 18, Washington, DC: USDA, 1987, pp. 61-86.
Shapira, Reuven, “Loss of Communal Sustainability: The Kibbutz Shift from High-Trust to
Low-trust Culture,” Journal of Rural Cooperation, 27(1), 1999, pp. 55-68.
Sykuta, Michael E., and Michael L. Cook, “A New Institutional Economics Approach to
Cooperatives and Contracting,” American Journal of Agricultural Economics, 83(5),
2001, pp. 1273-1279.
Terza, Joseph V., “Estimating Linear Models with Ordinal Qualitative Regressors,” Journal of
Econometrics, 34(3), 1987, pp. 275-291.
United States Department of Agriculture (USDA), Farmer Cooperative Statistics, 2001, USDA
Rural Business-Cooperative Service, Service Report 61, March 2003, available online at
http://www.rurdev.usda.gov/rbs/pub/sr61.pdf, downloaded March 29, 3003.
Zucker, Lynne G., “Production of Trust: Institutional Sources of Economic Structure, 1840-
1920,” Research in Organizational Behavior, 8, 1986, pp. 53-111.


