Embed Size (px)
Citation preview

Fast Inversion Recovery Magnetic Resonance Angiography ofthe Intracranial Arteries
Ek T. Tan, John Huston III, M.D., Norbert G. Campeau, M.D., and Stephen J. Riederer, Ph.D.MR Research Laboratory, Mayo Clinic, Rochester, MN 55905
AbstractInversion-prepared pulse sequences can be used for non-contrast magnetic resonance angiography(MRA), but suffer from long scan times when acquired using conventional non-acceleratedtechniques. This work proposes a subtraction-based spin-labeling, 3D fast inversion recoverymagnetic resonance angiography (FIR-MRA) method for imaging the intracranial arteries. FIR-MRA uses alternating cycles of non-selective and slab-selective inversions, leading to dark-bloodand bright-blood images, respectively. The signal difference between these images eliminatesstatic background tissue and generates the angiogram. To reduce scan time, segmented fastgradient recalled echo readout and parallel imaging are applied. The inversion recovery withembedded self-calibration (IRES) method used allows for parallel acceleration at factors of twoand above. An off-resonance selective inversion provides effective venous suppression with nodetriment to the depiction of arteries. FIR-MRA was compared against conventional 3D time-of-flight (TOF) angiography at 3T in eight normal subjects. Results showed that FIR-MRA hadsuperior vessel conspicuity in the distal vessels (P < 0.05), and equal or better vessel continuityand venous suppression. However, FIR-MRA had inferior vessel sharpness (P < 0.05) in four ofnine vessel groups. The clinical utility of FIR-MRA was demonstrated in three MRA patients.
Keywords
Non-contrast-enhanced angiography; inversion recovery; magnetic resonance angiography;parallel imaging; spin-labeling
INTRODUCTION
As has been recently reviewed (1), non-contrast-enhanced magnetic resonance angiography(NCE-MRA) methods have had a long history of development, and have been applied invirtually every vascular system in the body. The discovery in the last several years of anassociation between gadolinium-based contrast agents and nephrogenic systemic fibrosis(NSF) in patients with renal impairment (2,3) has prompted renewed interest in NCE-MRAmethods. One class of NCE-MRA utilizes flow-related enhancement of blood into a regionpreviously saturated by selective excitation. This class includes spin-labeling or taggingmethods (4,5) and time-of-flight (TOF) methods (6,7). These methods are suited for imagingthe relatively fast flow of the intracranial arteries, specifically for detection and diagnosticevaluation of aneurysms, arteriovenous malformations (AVM) and vascular stenosis. Thepulse sequence most frequently utilized for intracranial MRA at our institution is 3D time-of-flight (TOF) (7) acquired with flow compensation (8) and the multiple overlapping thin-slab acquisition (MOTSA) technique (9). Because the TOF sequence is subject to signal
Correspondence: Stephen J. Riederer, Ph.D., MR Research Laboratory, Mayo Clinic, 200 First Street, SW, Rochester, MN 55905,Phone: 507-284-6209, [email protected].
NIH Public AccessAuthor ManuscriptMagn Reson Med. Author manuscript; available in PMC 2011 June 1.
Published in final edited form as:Magn Reson Med. 2010 June ; 63(6): 1648–1658. doi:10.1002/mrm.22456.
NIH
-PA
Author M
anuscriptN
IH-P
A A
uthor Manuscript
NIH
-PA
Author M
anuscript

saturation, MOTSA can provide improved vessel conspicuity over a single-slab acquisitionof equal thickness. However, the spatial saturation pulses that are applied for venoussuppression do not necessarily discriminate between veins and arteries, which can result inthe appearance of discontinuous vessels at slab interfaces.
The goal of this work was to develop a 3D NCE-MRA method for imaging the intracranialarteries with high spatial resolution and image quality. Techniques for generating vascularcontrast using inversion recovery have been described in the literature (4,5,10–11). Onepermutation of such techniques (4) uses non-selective and selective inversion cycles togenerate respectively control (dark-blood) and labeled (bright-blood) images, similar to thatdescribed in perfusion imaging with spin-labeling (12–15). Rather than acquiring twoseparate scans (4), both datasets can be acquired in an alternating fashion as a single scan(13–15) to reduce mis-registration between both datasets. The complex difference betweenboth datasets results in the elimination of static tissue and the generation of vascular contrastfrom unsaturated blood flowing into the selective inversion slab. Such spin-labeling MRAcan provide high vessel-to-background contrast and high vessel conspicuity, as seen in2DFT carotid and intracranial imaging with cine (16–17). Sampling at high spatialresolution and 3DFT imaging would also provide superior depiction of vessel morphology(18), similar to that seen in 3D TOF. However, 3D spin-labeling MRA can potentially havevery long scan times (> 15 minutes) due to the long inversion intervals and the need for twoinversion cycles for data collection.
In this work, we propose the fast inversion recovery (FIR-MRA) technique for highresolution, 3DFT non-contrast-enhanced MRA. FIR-MRA uses non-selective and selectiveinversion pulses along with an appropriate inversion time for interleaved acquisition of dark-blood and bright-blood T1-weighted images in a single scan. Subtraction of the two imagesyields an MR angiogram. Use of multiple repetitions of a fast gradient recalled echo (GRE)sequence for readout (19) provides an initial speedup. Parallel imaging (20–22) at factors oftwo and above is applied. To exploit the intrinsic delay intervals within the inversion-prepared sequence for calibration acquisition, the inversion recovery with embedded self-calibration (IRES) method (23) is applied, which provides effectively increased accelerationover that of standard self-calibration. Additionally, an off-resonance selective inversionprovides effective venous suppression. The principal parameters of FIR-MRA wereinvestigated using simulations and in vivo imaging. The image quality of 3D FIR-MRA wascompared to 3D TOF in eight normal subjects using qualitative evaluation criteria. FIR-MRA was further assessed in three patient studies.
MATERIALS AND METHODS
Basic Principles of FIR-MRA Technique
Similar to the flow-sensitive alternating inversion recovery (FAIR) (14–15) perfusionimaging method applied in angiography (16–17), 3D FIR-MRA is a non-contrast techniquethat employs two different cycles of inversion preparation. As shown schematically in Fig.1A, during the first inversion cycle a non-selective inversion is applied whereby theinversion time TI is chosen to null the signal of the inverted blood. In the second inversioncycle, a selective inversion is applied to the targeted axial imaging slab. Blood proximal tothe inversion slab remains fully or highly magnetized, and flows into the slab during aprescribed in-flow interval, set to equal TI of the first cycle. Every cycle pair acquires thesame points in k-space. A complex difference between signals acquired from the twoinversion cycles eliminates static tissue in the imaging slab, and generates an angiogram dueto the inflowing, magnetized blood.
Tan et al. Page 2
Magn Reson Med. Author manuscript; available in PMC 2011 June 1.
NIH
-PA
Author M
anuscriptN
IH-P
A A
uthor Manuscript
NIH
-PA
Author M
anuscript

As shown in the pulse sequence diagram of Fig. 1B, in each cycle, TI defines the timeinterval from the inversion pulse to initiation of the readout as performed with a train of nRspoiled GRE pulses of flip angle α selective for the targeted imaging slab. The delay time(TD) from the end of the readout train to the next inversion pulse allows for magnetizationrecovery. The cycle time (TC) defines the overall interval between consecutive inversionpulses. Sampling of ky-kz space by the readout train is done using an interleaved elliptical-centric phase-encoding order (24). The simulated longitudinal magnetizations of blood(arteries and veins) and tissue are also shown in Fig. 1B. For the arteries, two possiblescenarios are depicted. In the first scenario, the arterial blood prior to reaching the imagingslab is assumed to be uninverted prior to reaching the imaging slab, and thus has fullmagnetization at the beginning of each TC interval. In the second scenario, arterial blood isassumed to be slower and has experienced one or more previous non-selective inversionpulses, resulting in high but not full magnetization at the beginning of each TC interval. TIis chosen to simultaneously null arterial blood during the non-selective cycle, and to providesufficient time for inflow of fully or highly magnetized blood during the selective cycle.
In generating the plots of Fig. 1B it was assumed that venous blood and brain tissueremained within the imaging slab, resulting in identical magnetization behavior for bothcycles. On the other hand, inflowing arterial blood is fully or highly magnetized in theselective case and is inverted for the non-selective case. During the subsequent readout themultiple α RF pulses cause a transient behavior of the measured arterial signal, particularlyfor the selective case.
Characterization of Principal Parameters
A characteristic of the magnetization-prepared FIR-MRA method presented here is that themeasured signal levels within a cycle vary from one repetition of the segmented readout tothe next. This causes signal modulation across the phase-encode directions of k-space. Thereare two primary effects that lead to the signal modulation of the arterial blood. The firsteffect is T1-recovery from inverted blood seen mainly during the first (black-blood) cycle,which results only in mild signal modulation. The second effect is signal saturation due tothe application of multiple α pulses within a readout cycle. To study these effects, theconcept of an arrival time similar to that described in (16) is introduced here. The arrivaltime, t is defined as the time taken for blood just proximal to the selective inversion slab toarrive at an imaged pixel. The t of a pixel increases with the intra-slab distance blood musttravel from the proximal slab boundary to that pixel. All imaged pixels experience the firstsignal modulation effect. In addition, pixels at increasingly positive t values experienceprogressively greater signal modulation (second effect) because the blood has beensubjected to an increasing number of α pulses. The pixels with t > TI will have negligibledifference signal because blood will not have arrived at such pixels prior to start of readout.
Based on early feasibility studies, four parameters of importance to arterial signalmodulation and vessel conspicuity were (I) inversion time, TI; (II) GRE flip angle,α ; (III)the number of repetitions per inversion cycle, nR; and (IV) the parallel acceleration factor, R.These parameters were evaluated with simulations and in vivo experiments. Simulationswere performed using standard Bloch equations, which assumed T1 relaxation times at 3.0Tof 1600 msec and 850 msec for blood and brain tissue respectively. TI values of 600 msec,750 msec and 900 msec were deemed suitable for visualizing the intracranial vasculature. αvalues of 10°, 15° and 20° were chosen to determine the effects of signal saturation due tothe α pulses. nR values between 30 and 60 were tested to understand the effects of increasedsignal modulation with increased nR. Since increasing nR also reduces scan time, a constantscan time analysis of R was performed to understand the trade-off between parallelacceleration (R) and fast GRE (nR). R was varied between 1 and 3 such that nR R wasconstant.
Tan et al. Page 3
Magn Reson Med. Author manuscript; available in PMC 2011 June 1.
NIH
-PA
Author M
anuscriptN
IH-P
A A
uthor Manuscript
NIH
-PA
Author M
anuscript

Venous Suppression with Selective Slab Extension
For venous suppression, the slab-selective inversion was extended in the superior directionfor in vivo imaging as depicted in Fig. 1A. The objective was to extend minimally beyondthe top of the brain. This required a shift in the center frequency of the selective inversionpulse and an appropriate decrease in magnitude of the slab-select gradient. A fifthparameter, the (V) fractional superior extension of the inversion slab for venous suppression,ε was studied with in vivo experiments. When expressed as a fraction of the sectionthickness of the imaging slab, ε was varied from 0 (no extension) to 1.0 (doubled thickness).In multi-slab acquisitions stacked in the superior-inferior (S/I) direction, ε was defined withrespect to the most superior imaging slab. The most superior extent of that slab was thenused as the most superior extent for all other imaging slabs.
Comparing Standard Self-Calibrated Parallel Imaging with IRES
For parallel acquisition, self-calibrated methods (22,26) may provide certain advantagesover separate calibration scans that acquire k-space center samples in an acquisition separatefrom the accelerated acquisition (21). However, the net acceleration of self-calibration isreduced from nominal because calibration samples at the k-space center are incorporatedinto the acquisition. In addition, this can cause increased signal modulation in FIR-MRAbecause the k-space center is more densely sampled compared to the k-space periphery. Theuse of separate calibration avoids added signal modulation but requires a separate calibrationscan. We used the inversion recovery with embedded self-calibration (IRES) technique (23),which performs calibration acquisitions during the TD interval used for magnetizationrecovery. Because the same degree of under-sampling is used for the entirety of k-space,IRES preserves the nominal acceleration of the under-sampling factor and avoids the extramodulation caused by self-calibration.
FIR-MRA acquired with IRES was compared to that acquired with standard self-calibrationusing both signal simulations and in vivo imaging. Acceleration factors of R = 2 to 4 weretested. Like the α pulses, the IRES calibration acquisitions also employed GRE but with aflip angle β that was typically smaller than α. The number of β pulses per cycle in this workwas typically 14, which was deemed sufficient for accurate calibration while still beingallowable within the TD intervals used.
In Vivo Imaging of Normal Subjects
Eight normal subjects (ages 25 to 46, 5 Male) were recruited for comparing the new FIR-MRA to a TOF MRA sequence optimized for routine intracranial imaging at our institution,using a protocol approved by our institutional research review board. Studies wereperformed on a 3.0 T whole-body scanner (GE Healthcare, Signa 14× software) using an 8-element coil of 75 cm circumference (Invivo Corp, Orlando FL, USA). Parameters areshown in Table 1. For TOF, spatial saturation bands 4 cm thick were also applied superior toeach slab for venous suppression. For FIR-MRA, an adiabatic inversion pulse (pulse widthof 16 msec, bandwidth = 2 kHz) (27) was used.
For both exams, axial excitation slabs were used. The frequency encoding was anterior-posterior (A/P) and phase-encoding was right-left (R/L). An R = 2, one-dimensional (1-D)acceleration was applied along the phase-encoding direction. For TOF, reconstruction forparallel imaging was performed using a commercial, image space-based method (ASSET,GE Healthcare, Signa v14); for 3D FIR-MRA, the IRES (23) method was implemented andimages were reconstructed offline using Matlab (R2008a, The Mathworks Inc., Natick, MA,USA) with k-space-based GRAPPA (22) in the x-kY-kZ hybrid-space.
Tan et al. Page 4
Magn Reson Med. Author manuscript; available in PMC 2011 June 1.
NIH
-PA
Author M
anuscriptN
IH-P
A A
uthor Manuscript
NIH
-PA
Author M
anuscript

The first two normal subjects were also imaged more extensively for characterizing theparameters of the FIR-MRA sequence. The parameters were varied one at a time, keepingthe remaining parameters constant as reflected in Table 1.
Patient Studies
In addition to the eight normal subjects, the clinical feasibility of FIR-MRA was evaluatedin studies of three patients who were referred for MRA. In the first patient study (67 year-old, female), a saccular aneurysm at the right middle cerebral artery (MCA) trifurcation wasdetected with x-ray computed tomography angiography (CTA). The patient underwent MRAwith 3D TOF, 3D FIR-MRA, and a higher-resolution 3D FIR-MRA (0.7 mm slicethickness). In the second study, a patient (76 year-old, female) with an aneurysm of the rightinternal carotid artery was followed up with MRA one year after the endovascular coilprocedure to evaluate any remnants of the aneurysm. The patient underwent 3D TOF, 3DFIR-MRA and contrast-enhanced MRA (CE-MRA) acquired after a timing bolus. In thethird and final study (29 year-old male), the filling and draining patterns of a left temporallobe AVM were evaluated with 3D TOF, 3D CE-MRA, and 3D FIR-MRA. In the secondand third patients, x-ray digital subtraction angiography (DSA) images acquired prior to theMRA were available.
Evaluations
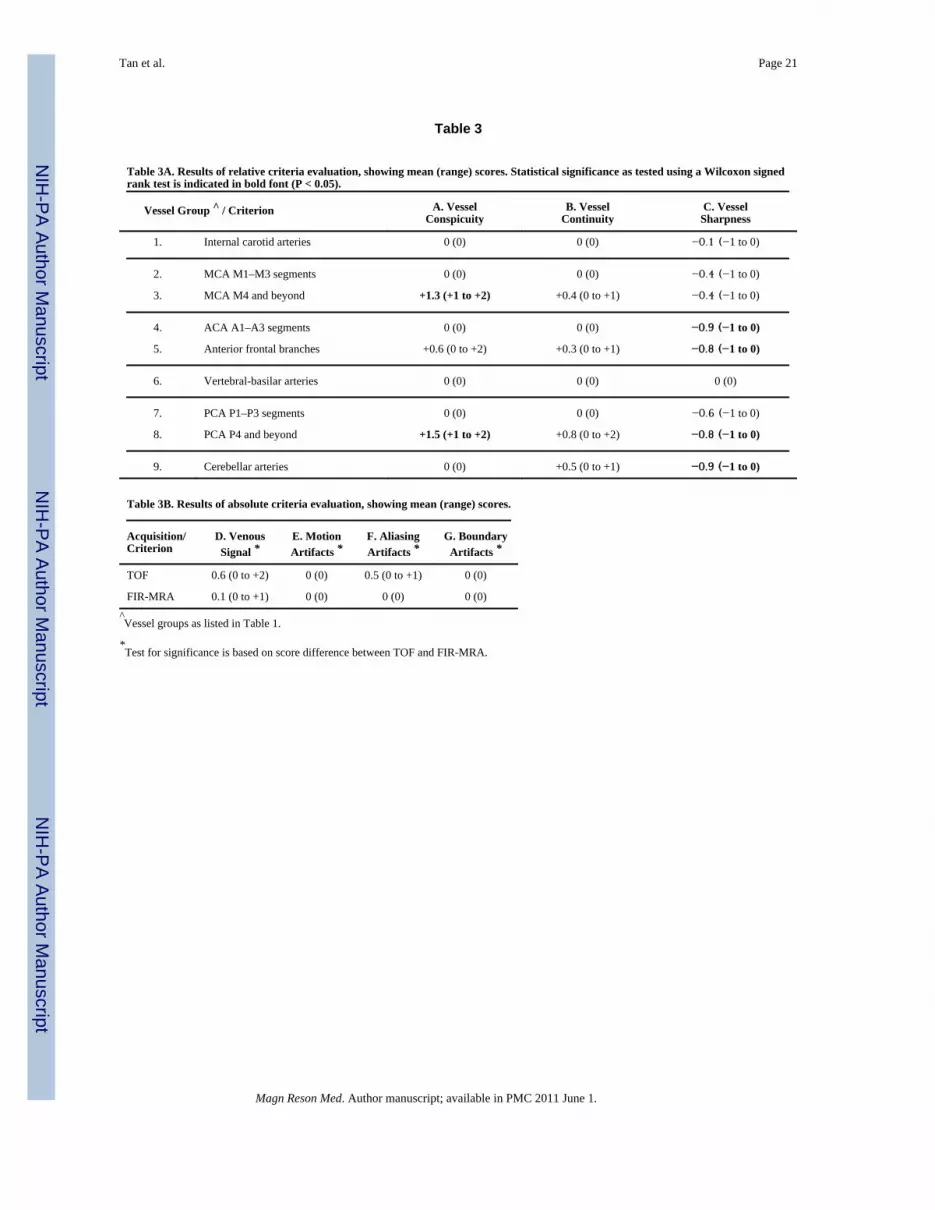
The FIR-MRA vs. TOF comparison was evaluated as follows. For each subject, twoneuroradiologists well-experienced in MRA were presented with full volume, axialmaximum-intensity-projections (MIPs), and source images from both exams suitable forinteractive multi-planar review using a workstation (Advantage Windows, GE Healthcare,v4.4). FIR-MRA results were compared with TOF for each subject, using three criteria(vessel conspicuity, continuity and sharpness) and evaluated using a five-point scale in eachof nine vessel groups (Table 2A). These vessel groups were the internal carotid arteries, themiddle cerebral arteries (MCA) M1 to M3 segments, MCA M4 segments and beyond, theanterior cerebral arteries (ACA) A1 to A3 segments, the anterior frontal branches, thevertebral-basilar arteries, the posterior cerebral arteries (PCA) P1 to P3 segments, PCA P4segments and beyond, and the cerebellar arteries. Additionally, FIR-MRA and TOF examswere evaluated individually using four criteria (venous signal, motion artifacts, aliasingartifacts and boundary artifacts), defined on a four-point scale (Table 2B). The non-parametric Wilcoxon signed rank method (28) was used to test for a significant difference inimage quality between TOF and FIR-MRA for each criterion, where P < 0.05 was taken tobe statistically significant.
RESULTS
Characterization of Principal Parameters
Fig. 2A illustrates various arrival time positions. These positions are indicated in Fig. 2B–E,which show the variation of the principal parameters (I to IV) in plots of vessel contrast vs.kr, the radial distance from the origin in kY–kZ space. Fig. 2B shows that the lowest TI of600 msec produces the largest peak signal at t = 0 msec but has no signal in k-space center att = 750 msec. Fig. 2C shows that an increase in α results in both an increase in peak signal atkr = 0 but also an undesirable increase in signal modulation. Fig. 2D shows that an increasein nR results in increased signal modulation. Fig. 2E shows the constant scan time analysisfor different nR · R pairs, whereby the trend for a decrease in R is similar to that of anincrease in α (Fig. 2C).
Fig. 3 shows experimental demonstrations of varying the principal parameters. Increasing TIresults in decreased vessel signal but increased distal vessel conspicuity (Parameter I, A–C,
Tan et al. Page 5
Magn Reson Med. Author manuscript; available in PMC 2011 June 1.
NIH
-PA
Author M
anuscriptN
IH-P
A A
uthor Manuscript
NIH
-PA
Author M
anuscript

arrows). Increasing α reduces background noise but at the cost of reduced vessel sharpness(Parameter II, D–F). Increasing nR from 30 to 60 reduces vessel sharpness (Parameter III,G–J). Decreasing R under the constant scan time analysis (Parameter IV, K–M) providessimilar observations to that seen in Fig. 3G–J (Parameter III). Venous signal was diminishedwhen ε was increased from 0.0 to 0.8 (Parameter V, N–P) and was eliminated at ε = 0.8.Over this range no discernible changes in arterial signal were observed.
Parallel Imaging with IRES
Fig. 4A shows FIR-MRA signal simulations of acquisitions with standard self-calibrationand IRES calibration. The signal modulation of IRES is independent of R, but the standardself-calibrated acquisition experiences increased signal modulation with increased R. Fig.4(B,D) show the FIR-MRA acquisitions with IRES whereby net accelerations (Rnet) wereequivalent to the applied acceleration (R). Fig. 4(C,E) show that acquisitions with standardself-calibration experience both reduced Rnet and increased signal modulation, especially atthe higher acceleration of R = 3 (E).
In Vivo Study: Comparing FIR-MRA to Conventional TOF
Tables 3A–B summarize the results from the evaluation. For vessel conspicuity, FIR-MRAwas shown to be significantly superior to TOF in two of the nine vessel groups, superior butnot statistically so in one, and similar to TOF in the remaining six groups. For vesselcontinuity, FIR-MRA was deemed superior to TOF for four distal vessel groups, and similarto TOF for the remaining vessel groups. However, none of the vessel groups had statisticallysignificant improved vessel continuity. For vessel sharpness, TOF was superior in eight ofnine groups, but statistically so in only four of them. In terms of venous signal and aliasingartifacts (Table 3B), the overall image quality of both exams was good. Statisticalsignificance was not shown in any of these groups, but FIR-MRA was scored equal or betterthan TOF in every subject. Neither substantial motion nor boundary artifacts were noted foreither exam.
Fig. 5 shows TOF and FIR-MRA images from one of the normal subjects. In addition toillustrating some of the findings in the qualitative comparison, the images also showsuperior background suppression of FIR-MRA (E) compared to TOF (A). An improvedtissue and CSF contrast was seen in the bright-blood source images of FIR-MRA (F) ascompared to TOF (B).
Patient Studies
Fig. 6 shows results from the first patient study. The right MCA aneurysm could be seen inthe CTA exam (A), TOF (B), and FIR-MRA (C). Both MRA methods revealed the presenceof another aneurysm of diameter 4 mm in the cavernous region of the left internal carotidartery. A higher-resolution, single-slab FIR-MRA (D) provided an improvement in vesselsharpness over the standard FIR-MRA (C).
In the second patient study (Fig. 7), the x-ray DSA (A–B) of the right carotid is shown priorto and after the endovascular coil procedure. The aneurysm remnants were best seen in thecontrast-enhanced MRA (CE-MRA) (D), followed by FIR-MRA (E) then TOF (C). Superiorvessel conspicuity was observed in FIR-MRA relative to TOF in this elderly patient (76years old).
In the final patient study (Fig. 8), x-ray DSA (A–B) of the left carotid circulation is shown.The nidus of the AVM was best visualized on the FIR-MRA angiogram (E) compared toTOF (C) and CE-MRA (D). In addition, the feeding arteries, the nidus and the large draining
Tan et al. Page 6
Magn Reson Med. Author manuscript; available in PMC 2011 June 1.
NIH
-PA
Author M
anuscriptN
IH-P
A A
uthor Manuscript
NIH
-PA
Author M
anuscript

vein were distinguishable from each other and from the surrounding brain tissue in the FIR-MRA bright-blood image (F), unlike the other two MRA techniques (C–D).
DISCUSSION
We have developed a high-resolution, 3D, non-contrast-enhanced FIR-MRA techniqueutilizing spin-labeling for intracranial angiography. The principal parameters of thesequence were identified and optimized. The technique was both tested in normal humansubjects and used in three patients referred for clinical MRA. The choice of employing asingle-scan spin-labeling technique provided superior conspicuity of distal vessels over 3DTOF. Simultaneously, dark-blood and bright-blood T1-weighted images are produced,which may have added diagnostic benefits in discriminating arteries from veins and braintissue. The off-center selective inversion provides an effective venous suppression schemethat discriminates venous blood from arterial blood. The combination of fast GRE andparallel imaging allowed for a high resolution, 3D intracranial MRA exam of 7.7 minutes. Inparticular, the IRES method for parallel imaging resulted in neither loss of net accelerationnor further signal modulation. The principal limitation of FIR-MRA vs. TOF was some lossof vessel sharpness. This is due to the signal modulation during the readout. FIR-MRA alsodid have a somewhat longer scan time than TOF (6.4 minutes with calibration scan).Conceivably, improved receiver coils could allow higher acceleration, thereby reducing thedegree of signal modulation, and reducing the loss of sharpness.
To evaluate vessel continuity apart from vessel conspicuity, vessels that were conspicuous inFIR-MRA but not in TOF were given a zero score for vessel continuity. This was notedmost prominently in the anterior frontal branches (vessel group 5). The aliasing artifacts inTOF were typically seen in the pontine region of the brain, and were attributed to the image-space-based reconstruction used rather than to the TOF technique. Ghosting artifacts wereobserved in TOF but did not factor in the evaluations as these were attributed mostly to thelinear phase-encoding order of TOF. While the presence of veins in TOF did not result innon-diagnostic images, the application of saturation bands for venous suppression alsosuppressed arteries that re-enter the imaging slab, contributing to the appearance of vesseldiscontinuity. In comparison, the venous suppression method in FIR-MRA was moreeffective and was not detrimental to the depiction of arteries.
There are some other limitations of FIR-MRA. In spite of FIR-MRA being acquired in asingle-scan manner, motion that occurs at time scales smaller than TC may result in imageartifacts. Motion between the acquisitions of consecutive slabs may also occur in both FIR-MRA and TOF. However, no motion artifacts were observed (Table 3B). A limitation ofspin-labeling-based techniques mentioned in the literature (26) is the signal drop-out in theproximal vessels at large TI (~ 1500 msec). This arises from the scanner’s maximum field-of-view that limits the extent of the labeling region proximal to the imaging slab. In thiswork, these signal drop-out effects were not observed, given the smaller TI (≤ 900 msec)used and the maximum FOV was 48 cm. Finally, because the FIR-MRA technique relies onthe long T1 of blood, FIR-MRA must be performed prior to any intravenous injection ofGadolinium-based contrast agents.
There are several parameters that were not demonstrated in this work. TC could be increasedto increase vascular contrast, but would also result in scan time increase. The number ofslabs could be reduced by increasing the slab thickness of each slab, but this couldpotentially reduce vessel conspicuity. The readout bandwidth could be reduced to increaseSNR, but doing so would increase signal de-phasing due to a longer TE. The use of balancedsteady-state free precession (bSSFP) as seen in other NCE-MRA methods (29–31) couldprovide increased efficiency due to shorter TE and increased received signal. In this work
Tan et al. Page 7
Magn Reson Med. Author manuscript; available in PMC 2011 June 1.
NIH
-PA
Author M
anuscriptN
IH-P
A A
uthor Manuscript
NIH
-PA
Author M
anuscript

however, the choice of spoiled GRE avoided the issues of banding artifacts and specificabsorption rate (SAR) intrinsic to bSSFP. All acquisitions in this study were obtained at 3T,which from theory is advantageous vs. 1.5T because a longer T1 of blood at 3T increasesvessel signal.
There are several potential benefits of FIR-MRA. The improved conspicuity of distalvessels, aneurysm remnants (Fig. 7), and the nidus of the AVM (Fig. 8) all suggest that FIR-MRA may be better than TOF in depicting vascular territories with slow flow. The ability todistinguish vessel components from tissue with draining veins appearing dark in bright-blood FIR-MRA may provide a new avenue for evaluating AVMs. The completebackground suppression in FIR-MRA allowed visualizations with volume rendering andMIPs to be performed without the need for image segmentation, facilitating for example,automatic aneurysm detection algorithms (32–33). Branches of the external carotid arterieswere unevaluated but were observed to also be better depicted in FIR-MRA due toobscuration by bright, subcutaneous fat in TOF. Hence, FIR-MRA may be useful forevaluation of giant cell arteritis, which characteristically involves the superficial temporalartery. Finally, for multi-contrast carotid plaque imaging (34), FIR-MRA can simultaneouslyprovide high luminal signal and blood-nulled T1-contrast, hence avoiding the need forimage registration.
CONCLUSION
The non-contrast angiographic technique of 3D fast inversion recovery MRA (FIR-MRA)has demonstrated improved distal vessel conspicuity relative to standard 3D TOF inintracranial imaging, and has demonstrated clinical utility in imaging aneurysms and AVMs.
AcknowledgmentsThe authors would like to acknowledge the valuable technical help of Matt A. Bernstein Ph.D., Eric A. Borisch,Roger C. Grimm, Clifton R. Haider, Tom C. Hulshizer, Joseph M. Kreidermacher, Gary M. Miller M.D., Phillip J.Rossman and Diane M. Sauter. We acknowledge grant support of NIH EB000212, HL070620, and RR018898.
REFERENCES
1. Miyazaki M, Lee VS. Nonenhanced MR angiography. Radiology. 2008; 248(1):20–43. [PubMed:18566168]
2. Grobner T. Gadolinium--a specific trigger for the development of nephrogenic fibrosing dermopathyand nephrogenic systemic fibrosis? Nephrol Dial Transplant. 2006; 21(4):1104–1108. [PubMed:16431890]
3. Sadowski EA, Bennett LK, Chan MR, Wentland AL, Garrett AL, Garrett RW, Djamali A.Nephrogenic systemic fibrosis: risk factors and incidence estimation. Radiology. 2007; 243(1):148–157. [PubMed: 17267695]
4. Nishimura DG, Macovski A, Pauly JM, Conolly SM. MR angiography by selective inversionrecovery. Magn Reson Med. 1987; 4(2):193–202. [PubMed: 3561250]
5. Edelman RR, Siewert B, Adamis M, Gaa J, Laub G, Wielopolski P. Signal targeting with alternatingradiofrequency (STAR) sequences: Application to MR angiography. Magn Reson Med. 1994;31(2):233–238. [PubMed: 8133761]
6. Keller PJ, Drayer BP, Fram EK, Williams KD, Dumoulin CL, Souza SP. MR angiography with two-dimensional acquisition and three-dimensional display. Work in progress. Radiology. 1989; 173(2):527–532. [PubMed: 2798885]
7. Masaryk TJ, Modic MT, Ruggieri PM, Ross JS, Laub G, Lenz GW, Tkach JA, Haacke EM, SelmanWR, Harik SI. Three-dimensional (volume) gradient-echo imaging of the carotid bifurcation:preliminary clinical experience. Radiology. 1989; 171(3):801–806. [PubMed: 2717755]
Tan et al. Page 8
Magn Reson Med. Author manuscript; available in PMC 2011 June 1.
NIH
-PA
Author M
anuscriptN
IH-P
A A
uthor Manuscript
NIH
-PA
Author M
anuscript

8. Haacke EM, Lenz GW. Improving MR image quality in the presence of motion by using rephasinggradients. AJR Am J Roentgenol. 1987; 148(6):1251–1258. [PubMed: 3495155]
9. Parker DL, Yuan C, Blatter DD. MR angiography by multiple thin slab 3D acquisition. Magn ResonMed. 1991; 17(2):434–451. [PubMed: 2062215]
10. Li D, Haacke EM, Mugler JP III, Berr S, Brookeman JR, Hutton MC. Three-dimensional time-of-flight MR angiography using selective inversion recovery RAGE with fat saturation and ECG-triggering: Application to renal arteries. Magn Reson Med. 1994; 31(4):414–422. [PubMed:8208117]
11. Wilman AH, Huston J III, Riederer SJ. Three-dimensional magnetization-prepared time-of-flightMR angiography of the carotid and vertebral arteries. Magn Reson Med. 1997; 37(2):252–259.[PubMed: 9001150]
12. Detre JA, Leigh JS, Williams DS, Koretsky AP. Perfusion imaging. Magn Reson Med. 1992;23:37–45. [PubMed: 1734182]
13. Edelman RR, Siewert B, Darby DG, Thangaraj V, Nobre AC, Mesulam MM, Warach S.Qualitative mapping of cerebral blood flow and functional localization with echo-planar MRimaging and signal targeting with alternating radio frequency. Radiology. 1994; 192(2):513–520.[PubMed: 8029425]
14. Kim SG. Quantification of relative cerebral blood flow change by flow-sensitive alternatinginversion recovery (FAIR) technique: application to functional mapping. Magn Reson Med. 1995;34:293–301. [PubMed: 7500865]
15. Kwong KK, Chesler DA, Weisskoff RM, Donahue KM, Davis TL, Ostergaard L, Campbell TA,Rosen BR. MR perfusion studies with T1-weighted echo planar imaging. Magn Reson Med. 1995;34(6):878–887. [PubMed: 8598815]
16. Warmuth C, Ruping M, Forschler A, Koennecke HC, Valdueza JM, Kauert A, Schreiber SJ,Siekmann R, Zimmer C. Dynamic spin labeling angiography in extracranial carotid artery stenosis.Am J Neuroradiol. 2005; 26(5):1035–1043. [PubMed: 15891156]
17. Sallustio F, Kern R, Gunther M, Szabo K, Griebe M, Meairs S, Hennerici M, Gass A. Assessmentof intracranial collateral flow by using dynamic arterial spin labeling MRA and transcranial color-coded duplex ultrasound. Stroke. 2008; 39(6):1894–1897. [PubMed: 18403739]
18. Dumoulin CL, Souza SP, Walker MF, Wagle W. Three-dimensional phase contrast angiography.Magn Reson Med. 1989; 9:139–149. [PubMed: 2709992]
19. Mugler JP III, Brookeman JR. Three-dimensional magnetization-prepared rapid gradient-echoimaging (3D MP RAGE). Magn Reson Med. 1990; 15(1):152–157. [PubMed: 2374495]
20. Sodickson DK, Manning WJ. Simultaneous acquisition of spatial harmonics (SMASH): Fastimaging with radiofrequency coil arrays. Magn Reson Med. 1997; 38:591–603. [PubMed:9324327]
21. Pruessmann KP, Weiger M, Scheidegger MB, Boesiger P. SENSE: Sensitivity encoding for fastMRI. Magn Reson Med. 1999; 42(5):952–962. [PubMed: 10542355]
22. Griswold MA, Jakob PM, Heidemann RM, Nittka M, Jellus V, Wang J, Kiefer B, Haase A.Generalized autocalibrating partially parallel acquisitions (GRAPPA). Magn Reson Med. 2002;47(6):1202–1210. [PubMed: 12111967]
23. Tan ET, Riederer SJ. Inversion Recovery with Embedded Self-Calibration (IRES). Magn ResonMed. 2009; 62(2):459–467. [PubMed: 19365864]
24. Wilman AH, Riederer SJ. Performance of an elliptical centric view order for signal enhancementand motion artifact suppression in breath-hold three-dimensional gradient echo imaging. MagnReson Med. 1997; 38(5):793–802. [PubMed: 9358454]
25. Moody AR, Murphy RE, Morgan PS, Martel AL, Delay GS, Allder S, MacSweeney ST, TennantWG, Gladman J, Lowe J, Hunt BJ. Characterization of complicated carotid plaque with magneticresonance direct thrombus imaging in patients with cerebral ischemia. Circulation. 2003; 107(24):3047–3052. [PubMed: 12796133]
26. Heidemann RM, Griswold MA, Haase A, Jakob PM. VD-AUTO-SMASH imaging. Magn ResonMed. 2001; 45(6):1066–1074. [PubMed: 11378885]
27. Silver MS, Joseph RI, Hoult DI. Highly selective π/2 and π pulse generation. J Magn Reson. 1984;59:347–351.
Tan et al. Page 9
Magn Reson Med. Author manuscript; available in PMC 2011 June 1.
NIH
-PA
Author M
anuscriptN
IH-P
A A
uthor Manuscript
NIH
-PA
Author M
anuscript

28. Forthofer, RN.; Lee, ES. Introduction to biostatistics: A guide to design, analysis, and discovery.Academic Press; 1995.
29. Koktzoglou I, Edelman RR. STAR and STARFIRE for flow-dependent and flow-independentnoncontrast carotid angiography. Magn Reson Med. 2009; 61(1):117–124. [PubMed: 19097217]
30. Leupold, J.; Hennig, J.; Scheffler, K. 3D Time-of-Flight MRA using inversion recovery TrueFISP;Proc ISMRM; Hawaii USA: 2002. p. 138
31. Koktzoglou I, Edelman RR. Fast projective carotid MR angiography using arterial spin-labeledbalanced SSFP. J Magn Reson Imaging. 2008; 28(3):778–782. [PubMed: 18777548]
32. Hirai T, Korogi Y, Arimura H, Katsuragawa S, Kitajima M, Yamura M, Yamashita Y, Doi K.Intracranial aneurysms at MR angiography: effect of computer-aided diagnosis on radiologists'detection performance. Radiology. 2005; 237(2):605–610. [PubMed: 16179404]
33. Yang, X.; Blezek, DJ.; Cheng, LT.; Ryan, WJ.; Erickson, BJ. Society for Imaging Informatics inMedicine. North Carolina USA: 2009. Computer-aided detection (CAD) of intracranial aneurysmsin MR angiography.
34. Yuan C, Mitsumori LM, Beach KW, Maravilla KR. Carotid atherosclerotic plaque: NoninvasiveMR characterization and identification of vulnerable lesions. Radiology. 2001; 221(2):285–299.[PubMed: 11687667]
Tan et al. Page 10
Magn Reson Med. Author manuscript; available in PMC 2011 June 1.
NIH
-PA
Author M
anuscriptN
IH-P
A A
uthor Manuscript
NIH
-PA
Author M
anuscript

Figure 1.The fast inversion recovery MRA (FIR-MRA) technique. (A) Illustration of angiogramgenerated by taking the difference between signals from the non-selective and slab-selectiveinversions. The directions of blood flow are indicated by the arrows. The selective inversionslab is extended by a fraction ε in the superior (cephalad) direction for suppression ofvenous signal. (B) Illustration of the FIR-MRA pulse sequence, whereby consecutiveinversion pulses have an interval of TC. Simulated magnetizations of fully magnetizedarterial blood (Arteries1), arterial blood subjected to previous non-selective inversion pulses(Arteries2), and intra-slab venous blood and white matter tissue are shown. Acquisition takesplace within the shaded region of the plots.
Tan et al. Page 11
Magn Reson Med. Author manuscript; available in PMC 2011 June 1.
NIH
-PA
Author M
anuscriptN
IH-P
A A
uthor Manuscript
NIH
-PA
Author M
anuscript

Figure 2.An (A) illustration of arrival time t, and the (B–E) simulated vascular signals obtained atvarious arrival time positions indicated as 1 (t = 0), 2 (t = 750 msec when t ≤ TI) and 3 (t =750 msec when t > TI). The plots show vascular signal (obtained as a difference betweensignal acquired between the selective and non-selective cycles similar to the Arteries2 plotsof Fig. 1B) vs. kr, the radial distance in ky-kz space. The simulations are used to evaluate (B)Parameter I (TI); (C) Parameter II (α); (D) Parameter III (nR); and (E) Parameter IV (R)under a constant scan time analysis, which takes into account noise increase due to R. Thecontrol parameters are reflected in Table 1.
Tan et al. Page 12
Magn Reson Med. Author manuscript; available in PMC 2011 June 1.
NIH
-PA
Author M
anuscriptN
IH-P
A A
uthor Manuscript
NIH
-PA
Author M
anuscript

Figure 3.In vivo results acquired for a normal subject (30 year-old, male) with axial MIPs (8 cmthick) shown in inverse video. Parameter I, TI at (A) 600 msec, (B) 750 msec, and (C) 900msec. Arrows in (B) and (C) depict enhancement of the distal branches of the middlecerebral circulation not seen in (A). The dashed box in (A) defines the sub-volume shownfor (D–M). Parameter II, α at (D) 10°, (E) 15° and (F) 20°, all at R = 3. Parameter III, nR at(G) 30, (H) 40, and (J) 60, and the constant scan time analysis of Parameter IV with (K) nR= 40, R = 3, (L) nR = 60, R = 2, and (M) nR = 120, R = 1. Parameter V, ε at (N) 0.0, (O) 0.4,and (P) 0.8. Undesirable venous signal in the superior sagittal sinus was seen when ε < 0.8(arrows, N, O). The control parameters are reflected in Table 1.
Tan et al. Page 13
Magn Reson Med. Author manuscript; available in PMC 2011 June 1.
NIH
-PA
Author M
anuscriptN
IH-P
A A
uthor Manuscript
NIH
-PA
Author M
anuscript

Figure 4.Comparisons of IRES vs. standard self-calibration (SC) in 3D FIR-MRA acquisitions of anormal subject (30 year-old, male). (A) Signal modulation of vessel contrast against k-space; and (B–E) targeted, coronal reformat MIPs (4 cm thick) of FIR-MRA acquisitions ofthe proximal slab using parameters indicated in Table 1. The acquisitions are (B) IRES R =Rnet = 2, (C) SC R = 2 (Rnet = 1.8), (D) IRES R = Rnet = 3 and (E) SC R = 3 (Rnet = 2.4). SChad increased signal modulation vs. IRES calibration at the same R, resulting in increasedsignal modulation (arrows, C,E).
Tan et al. Page 14
Magn Reson Med. Author manuscript; available in PMC 2011 June 1.
NIH
-PA
Author M
anuscriptN
IH-P
A A
uthor Manuscript
NIH
-PA
Author M
anuscript

Figure 5.3D TOF (top row, A–D) and 3D FIR-MRA (bottom row, E–H) images from one normalsubject (37 year-old, male). Full volume axial MIPs shown in inverse video (A, E)demonstrate the superior distal vessel conspicuity and superior background suppression ofFIR-MRA. Improved tissue contrast and CSF signal suppression were seen in the FIR-MRAbright-blood source image (F) compared to the corresponding axial slice from TOF (B). Thetargeted, sagittal MIPs of the left carotid circulation (C, G) and that of the vertebralcirculation (D, H) show that FIR-MRA had both superior vessel conspicuity and inferiorvessel sharpness in the distal vessels. Venous signal was seen in TOF (A, D, arrows) but wasnot discernible in FIR-MRA. The loss of vessel continuity due to spatial saturation bands(D, arrow head) was apparent in TOF.
Tan et al. Page 15
Magn Reson Med. Author manuscript; available in PMC 2011 June 1.
NIH
-PA
Author M
anuscriptN
IH-P
A A
uthor Manuscript
NIH
-PA
Author M
anuscript

Figure 6.Images from the first patient study (67 year-old female). A 4 mm × 7 mm saccular aneurysmat the right middle cerebral artery (MCA) trifurcation (arrow head in all figure parts) wasdetected with (A) CTA shown in coronal reformat. The same aneurysm was well depictedwith MRI, shown in targeted, coronal MIPs of (B) 3D TOF (1.4 mm slice thickness S/I), (C)3D FIR-MRA (1.4 mm slice thickness, acquisition time of 7.7 minutes), and (D) high-resolution single-slab 3D FIR-MRA (0.7 mm slice thickness, acquisition time of 15.4minutes). A second, 4 mm diameter cavernous aneurysm in the left internal carotid arterywas detected with MRA (arrow, B–D) and was retrospectively seen in CTA (arrow, A).Improved vessel sharpness was seen in the (D) higher-resolution FIR-MRA as compared tothe standard FIR-MRA (C).
Tan et al. Page 16
Magn Reson Med. Author manuscript; available in PMC 2011 June 1.
NIH
-PA
Author M
anuscriptN
IH-P
A A
uthor Manuscript
NIH
-PA
Author M
anuscript

Figure 7.Images from the second patient study (76 year-old female) of a coiled aneurysm of the rightinternal carotid artery. Right carotid, sagittal x-ray digital subtraction angiography (DSA)shows the aneurysm (A) prior to and (B) after the endovascular coil procedure. Sagittalprojections (4 cm thick) of (C) TOF, (D) contrast-enhanced MRA (CE-MRA) acquired aftera timing bolus, and (E) FIR-MRA show that the appearance of aneurysm remnants (arrows)of FIR-MRA was more similar to the CE-MRA than the TOF was. Superior vesselconspicuity was also observed in FIR-MRA relative to TOF (arrow heads).
Tan et al. Page 17
Magn Reson Med. Author manuscript; available in PMC 2011 June 1.
NIH
-PA
Author M
anuscriptN
IH-P
A A
uthor Manuscript
NIH
-PA
Author M
anuscript
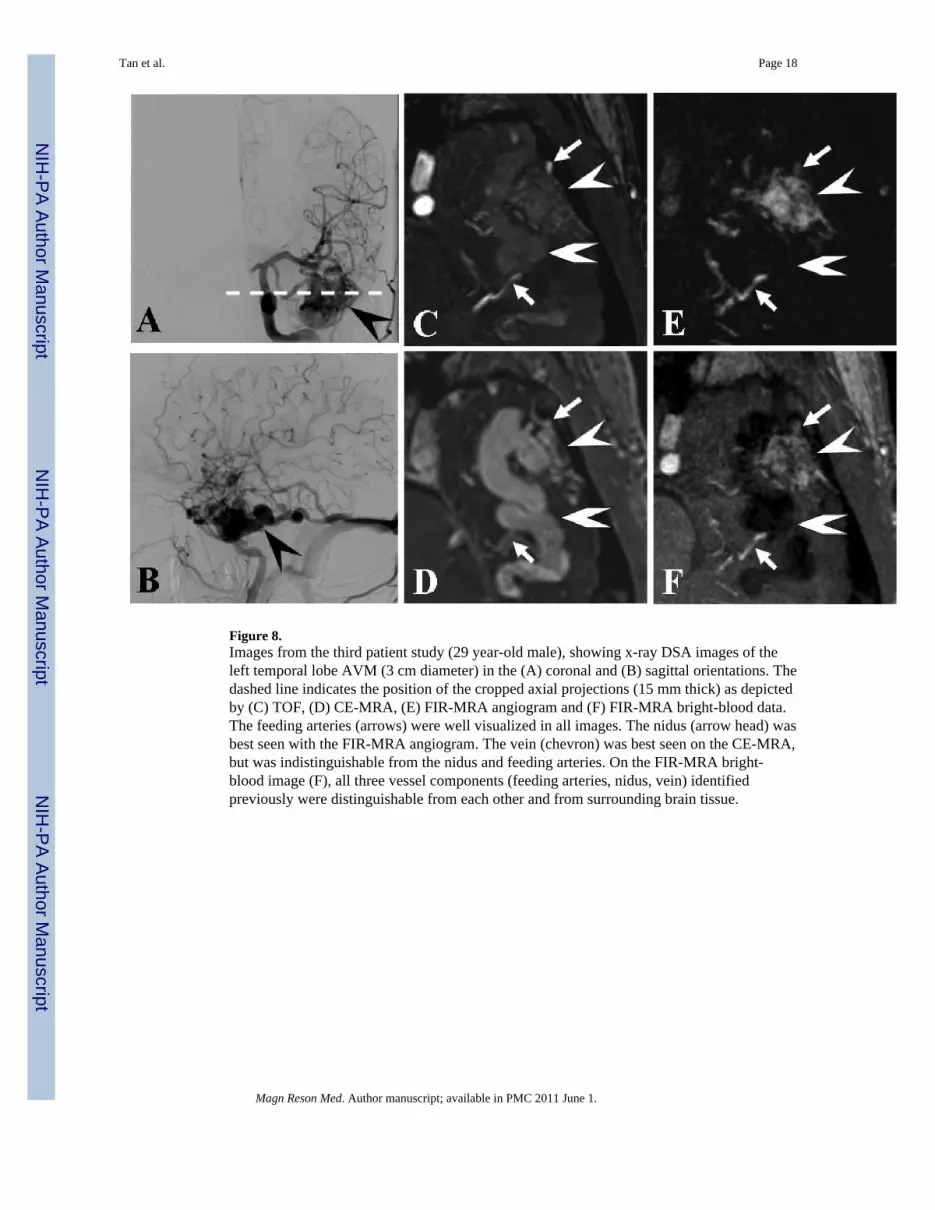
Figure 8.Images from the third patient study (29 year-old male), showing x-ray DSA images of theleft temporal lobe AVM (3 cm diameter) in the (A) coronal and (B) sagittal orientations. Thedashed line indicates the position of the cropped axial projections (15 mm thick) as depictedby (C) TOF, (D) CE-MRA, (E) FIR-MRA angiogram and (F) FIR-MRA bright-blood data.The feeding arteries (arrows) were well visualized in all images. The nidus (arrow head) wasbest seen with the FIR-MRA angiogram. The vein (chevron) was best seen on the CE-MRA,but was indistinguishable from the nidus and feeding arteries. On the FIR-MRA bright-blood image (F), all three vessel components (feeding arteries, nidus, vein) identifiedpreviously were distinguishable from each other and from surrounding brain tissue.
Tan et al. Page 18
Magn Reson Med. Author manuscript; available in PMC 2011 June 1.
NIH
-PA
Author M
anuscriptN
IH-P
A A
uthor Manuscript
NIH
-PA
Author M
anuscript

NIH
-PA
Author M
anuscriptN
IH-P
A A
uthor Manuscript
NIH
-PA
Author M
anuscript
Tan et al. Page 19
Table 1
Pulse sequence parameters of 3D TOF and 3D FIR-MRA.
3D TOF 3D FIR-MRA
TC / TI / TR / TE (msec) − / − / 38 / 3.9 1600 / 750 / 9.5 / 3.2
α / β (°) 25 / − 15 / 5
Acquisition Bandwidth (kHz) ±15.63 ±15.63
Sampling Matrix (X × Y × Z) 384 × 210 × 32 288 × 240 × 32
Image Display Matrix 512 × 512 × 144 512 × 512 × 144
Sampling Resolution (mm3) 0.5 × 0.8 × 1.4 0.6 × 0.7 × 1.4
Image Display Resolution (mm3) 0.4 × 0.4 × 0.7 0.4 × 0.4 × 0.7
Partial Echo 0.75 0.75
Number of Slab Overlap Slices 6 6
Slab Thickness (cm) 4.5 4.5
Number of Slabs 3 3
Total Slab Thickness (cm) 10 10
Axial Field of View (cm) 18 18
Parallel Acceleration Factor 2, in Y (R/L) 2, in Y (R/L)
Phase-encoding Order Linear Elliptical Centric
Repetitions per Cycle, nR - 60
Use of Flow Compensation Gradients Yes, in X and Z No
Total Scan Time (minutes) 6.4 7.7
Magn Reson Med. Author manuscript; available in PMC 2011 June 1.

NIH
-PA
Author M
anuscriptN
IH-P
A A
uthor Manuscript
NIH
-PA
Author M
anuscript
Tan et al. Page 20
Table 2
Table 2A. Scheme of relative evaluation criteria for comparison between TOF and FIR-MRA.
Evaluation Criteria
Criterion Description
A. Vessel Conspicuity Presence and extent of presence of vessels
B. Vessel Continuity The degree of continuous vessel presence through slabs
C. Vessel Sharpness The crispness of edges of vessels
Evaluation Scale and Vessel Groups
Score Interpretation VesselGroups
−2 TOF is markedly better than FIR-MRA
9 Vessel
groups*
−1 TOF is slightly better than FIR-MRA
0 Negligible differences
+1 FIR-MRA is slightly better than TOF
+2 FIR-MRA is markedly better than TOF
Table 2B. Scheme of absolute evaluation criteria for comparison between TOF and FIR-MRA.
Evaluation Criteria
Criterion Description
D. Venous Signal Presence of venous signal
E. Motion Artifacts Presence of motion artifacts
F. Aliasing Artifacts Aliasing due to parallel imaging
G. Boundary Artifacts Artifacts observed at slab boundaries
Evaluation Scale
Score Interpretation
0 Negligible presence
1 Mild presence does not degrade diagnostic quality
2 Mild presence that degrades diagnostic quality
3 Presence that severely degrades diagnostic quality
*Vessel groups: 1. Internal carotid arteries; 2. Middle cerebral arteries (MCA) M1 to M3 segments; 3. MCA M4 segments and beyond; 4. Anterior
cerebral arteries (ACA) A1 to A3 segments, 5. Anterior frontal branches, 6. Vertebral-basilar arteries; 7. Posterior cerebral arteries (PCA) P1 to P3segments; 8. PCA P4 segments and beyond; 9. Cerebellar arteries.
Magn Reson Med. Author manuscript; available in PMC 2011 June 1.
NIH
-PA
Author M
anuscriptN
IH-P
A A
uthor Manuscript
NIH
-PA
Author M
anuscript
Tan et al. Page 21
Table 3
Table 3A. Results of relative criteria evaluation, showing mean (range) scores. Statistical significance as tested using a Wilcoxon signedrank test is indicated in bold font (P < 0.05).
Vessel Group ^ / Criterion A. VesselConspicuity
B. VesselContinuity
C. VesselSharpness
1. Internal carotid arteries 0 (0) 0 (0) −0.1 (−1 to 0)
2. MCA M1–M3 segments 0 (0) 0 (0) −0.4 (−1 to 0)
3. MCA M4 and beyond +1.3 (+1 to +2) +0.4 (0 to +1) −0.4 (−1 to 0)
4. ACA A1–A3 segments 0 (0) 0 (0) −0.9 (−1 to 0)
5. Anterior frontal branches +0.6 (0 to +2) +0.3 (0 to +1) −0.8 (−1 to 0)
6. Vertebral-basilar arteries 0 (0) 0 (0) 0 (0)
7. PCA P1–P3 segments 0 (0) 0 (0) −0.6 (−1 to 0)
8. PCA P4 and beyond +1.5 (+1 to +2) +0.8 (0 to +2) −0.8 (−1 to 0)
9. Cerebellar arteries 0 (0) +0.5 (0 to +1) −0.9 (−1 to 0)
Table 3B. Results of absolute criteria evaluation, showing mean (range) scores.
Acquisition/Criterion
D. VenousSignal *
E. MotionArtifacts *
F. AliasingArtifacts *
G. BoundaryArtifacts *
TOF 0.6 (0 to +2) 0 (0) 0.5 (0 to +1) 0 (0)
FIR-MRA 0.1 (0 to +1) 0 (0) 0 (0) 0 (0)
^Vessel groups as listed in Table 1.
*Test for significance is based on score difference between TOF and FIR-MRA.
Magn Reson Med. Author manuscript; available in PMC 2011 June 1.


