Embed Size (px)
Citation preview
Journal of Agribusiness 25,1(Spring 2007):31S45© 2007 Agricultural Economics Association of Georgia
Feasible Fumigant-Herbicide SystemAlternatives to Methyl Bromide forBell Pepper Producers
Mark M. Byrd, Cesar L. Escalante, Esendugue G. Fonsah,and Michael E. Wetzstein
With the current methyl bromide (MeBr) system for producing Georgia’s peppersbeing phased out, alternative fumigant and herbicide systems for producers areanalyzed. Using stochastic dominance analyses, two alternatives exceedingMeBr’s yield and financial efficiency were identified. A programming model,incorporating simulation-optimization techniques, generated optimal productionand financial plans. Results indicate potential economic viability under alternativesystems vis-à-vis the traditional MeBr production system. The Telone II andChloropicrin combination with Metham potassium may offer a viable substitutefor MeBr.
Key Words: fumigant, herbicide, methyl bromide, multi-period programming,optimization, simulation, stochastic dominance
On September 16, 1987, 24 nations ratified the Montreal Protocol on Substances thatDeplete the Ozone Layer. A component of this international agreement identifiedsubstances causing significant damage to the ozone layer. Methyl bromide (MeBr)was one such substance considered a major toxic contributor to ozone depletion, andthus was recommended for an accelerated phase-out originally set in 2005.
MeBr’s contribution to agriculture and its integral role in facilitating internationaltrade have led to a general agreement that there should be allowances for “critical,”“quarantine,” and “pre-shipment” uses. The Protocol states that a use of MeBrshould qualify as “critical” only if the nominating party determines that its lack ofavailability would result in a significant market disruption, and there are no techni-cally and economically feasible alternatives available. These potential alternativesshould be acceptable from the standpoint of environment and health and be suitableto the crops and circumstances of the nomination (United Nations Environment
Mark M. Byrd is a former graduate student; Cesar L. Escalante and Esendugue G. Fonsah are assistant professors; andMichael E. Wetzstein is professor, all in the Department of Agricultural and Applied Economics, University ofGeorgia. The authors would like to thank Drs. Stanley Culpepper and David Langston of the University of Georgiafor sharing with us their technical expertise, and two anonymous reviewers for their helpful comments andsuggestions.
32 Spring 2007 Journal of Agribusiness
1 Comparing yield structures involves analyzing not just the overall yield level but also the relative proportionsof the different pepper grades that command different market prices. For example, the proportion of jumbo peppersassigned the fancy pepper grade is compared with the proportion of the regular US 1 & 2 pepper grade since the formercommands a much higher price.
Programme, 2000). The phase-out schedule, for developed nations including theUnited States, adheres to a 100% reduction by the year 2005, but allows for emer-gency uses after 2005.
Currently MeBr serves as an agricultural fumigant primarily used to controlweeds, nematodes, soil-borne pests, and diseases. It has been widely adopted by U.S.agricultural producers because of its ease of use, affordable cost, and effectivenessin most climates. However, with the imposed ban on its use, research efforts havefocused on identifying alternative fumigants which would at least equal, if notexceed, MeBr’s technical efficacy and financial efficiency.
California and Florida have conducted significant research examining alternativesand the economic impact resulting from the phase-out. The majority of these experi-ments have focused on strawberries and tomatoes, the major crops of interest inFlorida and California, thus leaving some void in information on the feasibility ofinput substitution strategies for other vegetable crops (U.S. Department of Agricul-ture/Economic Research Service, 2001). In Georgia, vegetables are the second mostvaluable crop, with a farm-gate value of $901 million (Boatright and McKissick,2003). Georgia ranks third nationally in acreage of fresh market vegetables planted.Vegetable growers in Georgia argue that eliminating MeBr will reduce yields andincrease production costs (Seabrook, 2005). During the past several years, Georgiaproducers have been pressed for time to identify technically and economicallyfeasible alternative production systems as a replacement for MeBr.
Unlike California, researchers and scientists in Georgia and Florida have had todeal with another issue in their search for alternative fumigation-herbicide systems.Yellow and purple nutsedge are common weeds that thrive in the southeasternUnited States due to its humid climate. In order to control for nutsedge, it is neces-sary to apply a combination of plastic mulch, fumigants, and herbicides to cropssuch as tomato and pepper (Gilreath and Santos, 2004). A list of fumigants such asmetham sodium (MNa), chloropicrin (teargas) (Pic), anhydrous ammonia (AHN4),and 1,3-dichloropropene (1,3-D) have been tested in combination with the herbicidesnapropamide, metolachlor, and pebulate, and analyzed in comparison to MeBr(Gilreath, Noling, and Santos, 2004). While these tests focused on identifyingcomparable yield structures1 among alternative chemicals, the financial feasibilityof these substitutes was not a priority.
This study addresses the financial feasibility of available fumigation-herbicidealternatives both from risky and risk-free operating situations by employing twoanalytical tools, stochastic dominance and simulation-optimization techniques,respectively. Specifically, the second-degree stochastic dominance analysis is firstapplied to consider the riskiness of the alternative fumigant-herbicide systems andto identify the most risk-efficient method. Data limitations to capture the riskiness
Byrd et al. Alternatives to Methyl Bromide for Bell Pepper Producers 33
of newly established alternative production systems on an annual basis have resultedin the formulation of a multi-period linear programming framework that is used toanalyze the comparative yield efficiency and financial feasibility of three alternativefumigation-herbicide systems under a risk-free operating environment. These threealternatives are based on field trials conducted by University of Georgia scientistsin Tifton, Georgia, during 2002S2003 relative to a base treatment system involvingMeBr.
Stochastic Dominance Analysis
Stochastic dominance (SD) analysis is a risk-efficiency criterion for determining therisk-efficient set of alternatives available to producers when faced with uncertainoutcomes. It allows for a ranking of alternatives based on producers’ risk prefer-ences. Researchers have developed multiple variations of stochastic dominance, butits two basic criteria are first- and second-degree stochastic dominance. We employsecond-degree stochastic dominance (SDSD) analysis, which eliminates dominatedor inefficient distributions from the first-degree stochastic dominance set (Huang andLitzenberger, 1988). This is accomplished by adding the assumption of risk aversionto the decision-making process with respect to agents’ preferences. (For more detaileddiscussion of SDSD, interested readers are referred to Huang and Litzenberger.)
Risk-averse agents seeking to maximize utility will never prefer a dominateddistribution. Therefore, a second-degree stochastically efficient set of alternativeswill be comprised of only nondominated distributions, and any further reduction ofthis set will require additional assumptions concerning risk preferences (Anderson,Dillon, and Hardaker, 1977).
The existence of crossings of distribution plots could, however, cause second-degree stochastic dominance failure or the inability to determine the dominancerankings of the distributions being analyzed. Hammond (1974) has proposed anapproach to deal with the crossings problem. He contends that the rankings of alter-natives in this case will depend on the decision maker’s risk aversion coefficient.Thus, in this analysis, two scenarios of high and low risk aversion are considered tocapture any variations in the rankings of alternatives.
Four variables are separately considered in the stochastic dominance analysis:
1. An aggregate yield measure that disregards the pepper grade components of totalyield.
2. A jumbo (fancy pepper grade) yield measure which commands a higher pricethan the regular US1&2 pepper grade.
3. A gross revenue measure where the grade components of total yield are weightedby the grades’ respective prices.
4. A net return per acre measure derived from the extrapolated experimental yieldsand the corresponding variable and fixed costs for each acre of pepper farmoperations.
34 Spring 2007 Journal of Agribusiness
2 In contrast, the stochastic dominance analysis performed in this study utilized experimental data that allowed forthe measurement of risk from a cross-sectional (experimental plots) point of view, instead of the time-seriesperspective required for a multi-period nonlinear risk programming analysis. Variables in the programming model are
For variables 3 and 4, the experimental yields are extrapolated to acre-scale revenuesgiven the fact that experimental plots are 0.001 of an acre.
The yield data used in this study were obtained from field trials conducted in 2002and 2003 at the University of Georgia (UGA) Center for Agribusiness and EconomicDevelopment’s experimental plots in Tifton, Georgia. The Center’s scientists deter-mined a set of fumigants and herbicides to be tested based on current and pastliterature (Culpepper and Langston, 2000). These field experiments addressed majorpest control concerns of Georgia bell pepper producers, and aimed to identify aneffective control for nutsedge, a weed that cannot be controlled with black plasticmulching. The experiments analyzed two herbicide systems (no herbicide controland the Command-Devrinol-Dual Magnum prescription), along with three fumigantoptions on 6' × 35' experimental plots. Results of these field trials determined thefumigants’ overall ability to control nutsedge growth. Culpepper and Langstonreport that the herbicide system contributed to nutsedge control by increasing thecontainment (growth suppression) rate from 24% to 27%.
The three alternative fumigant systems considered are C35+KPAM, Telone II+Chloropicrin, and C35+Chloropicrin, and each were separately combined with acommonly prescribed herbicide system consisting of Clomazone (Command),Napropamide (Devrinol), and s-metolachlor (Dual Magnum). KPAM serves as anabbreviated term for metham potassium, C35 identifies a Telone II and Chloropicrincombination, and Telone II represents 1,3-Dichloropropene.
In this study, stochastic dominance analysis was conducted using yield and costrecords for two production cycles of six experimental plots developed by the UGA-Tifton scientists for each of the four fumigation-herbicide systems. A bell pepperenterprise budget model prepared by the UGA Agricultural Economics Extensionteam was used to calculate values for gross and net returns, which are two of the fourvariables considered in the stochastic dominance analysis.
The Multi-Period Programming Model
The financial and production decisions of a representative Georgia pepper producerare analyzed using simulation-optimization techniques in a mathematical program-ming framework. The producer’s goal is to optimize his or her expected utility ofaccumulated net worth over a specified planning horizon. The choice between usinga nonlinear risk and a linear risk-free programming model is constrained by datalimitations. Nonlinear risk programming models require the construction of avariance-covariance matrix to account for risk. In this matrix, several years of histor-ical cost and returns data, among other data requirements, will be needed for thenewly identified alternative fumigant-herbicide systems. In view of the lack of morelongitudinal, annual data on these new production methods, a risk programmingmodel could not be developed at this time.2
Byrd et al. Alternatives to Methyl Bromide for Bell Pepper Producers 35
calculated on a production year basis. While the risk component of most decision variables can be defined usingavailable historical annual data, the untested new methyl bromide alternative fumigation methods do not havehistorical data that can provide estimates of their riskiness. In light of the production-year perspective of thismulti-period programming model, the cross-sectional observations for the returns for these new methods cannot beused to substitute for the required time-series data.
The risk-neutral linear programming (LP) model employed in this study accountsfor the net changes in final wealth regardless of the producer’s risk considerations(Gwinn, Barry, and Ellinger, 1992; Barry and Willmann, 1976; Escalante and Barry,2001). The programming problem in matrix format is constructed as:
(1) Max Z = CX
s.t.: AX # b,
X $ 0,
where Z is a matrix of the total objective value, C is a column vector representingthe contribution of each unit of X to the objective function, A is the use of the itemsin the ith constraint by one unit of x j, and b is the upper limit imposed by eachconstraint (McCarl and Spreen, 1994). The final inequality imposes a nonnegativityconstraint on the decision variables. Major components of equation (1) are describedbelow, with a full discussion provided in Byrd (2005).
The model operates under a five-year planning horizon in its determination of theproducer’s optimal net accumulation of wealth (net income over this period). Thefinal accumulation of net worth is calculated by accruing the values of farmland,equipment, and cash balance at the end of the planning horizon less all financingcharges contracted over the same period. The model’s constraints establish limits onland availability, machinery requirements, off-farm investments, consumption, andborrowing levels. In order to capture the timing of certain cash flows within eachyear, the model has two subperiods in its cash transfer equations
The model’s empirical properties resemble previous multi-period programmingmodels (Barry and Willmann, 1976; Gwinn, Barry, and Ellinger, 1992) that definea large matrix of activities and constraints where submatrices along the maindiagonal elements correspond to the time periods and off-diagonal elements provideinformation on transfers among the model’s activities. The major activities includeproduction and marketing, land, and machinery investments, related borrowingalternatives, farmland leasing under cash-rent conditions, short-term borrowing, off-farm investments, liquidity management, consumption, and taxation. Specifically,the model allows the expansion of production area by either entering into a one-yearrenewable cash leasing contract or purchasing additional acreage of farmland.Machinery requirements in each production year can be satisfied through alreadyowned equipment and, if necessary, the purchase of new machinery. Laborrequirements can be supplied by family members and hired farm laborers. The modelassigns a credit facility for each of the operator’s financing needs. Aside from equity
36 Spring 2007 Journal of Agribusiness
funds that may be used when the operator generates a cash flow surplus, landacquisition, equipment purchases, and working capital requirements may be financedby long-, intermediate-, and short-term credit facilities, respectively. Withdrawalsfor family living expenditures are evenly divided and disbursed in each of the twosubperiods. The operator also derives off-farm income by investing in nonfarmassets. The cash transfer equations take up the investment as an outflow in the firstsubperiod and recover the same amount along with gains from investment in thesecond subperiod.
The final goal of optimizing a producer’s net worth is predicated and begins withthe analysis of a base-case representative farm model. The base model accounts forthe activity measures and financial conditions of a typical producer’s operations.Adjustments to components of the base model reveal variations in the profitabilityand cost structure of the producer’s operations. This analysis involves iterativelyrunning the base-case farm model by introducing adjustments in the productionsystem as defined by the fumigants and herbicides employed as chemical controlson the farm. More specifically, the production system using MeBr and an accom-panying menu of herbicides is chosen to serve as the base case. The other threealternative fumigation systems, using the same herbicide system as that in the MeBrsystem, are then tested against this base case. In each iterative run of the base model,yields and input costs applicable to each alternative system are used.
The Representative Georgia Pepper Farm
The simulation-optimization analysis is applied to a representative Georgia pepperoperation whose conditions define the initial resource, financial, and operating levelsof the base model. The financial attributes were constructed according to the averagefinancial operating conditions of approximately 50 farm operations registered withthe Georgia Farm Business Farm Management Association in 2001. The initial oper-ation size is 362 acres, of which 300 acres are owned by the producer and 62 acresare rented.
The producer’s pre-operating balance sheet declares a total farm asset value of$1,843,234, which includes $468,900 worth of machinery and equipment and farm-land value of $645,000. The producer’s assets were financed by current ($241,688),intermediate ($422,010), and long-term ($350,099) debts as well as the operation’sequity funds ($829,437). Based on these figures, the producer’s debt-to-asset ratiois 0.55. The producer’s annual living expenditures in the pre-operating year amountto $31,729, excluding income taxes. That year, the producer generated a net farmincome of $20,171 plus a net nonfarm income of $13,180, both before taxes.
Average yields and costs were calculated from the production records for twocycles for the six experimental plots (for each fumigant-herbicide system). Thesecost-returns data were then used as inputs in each version of the multi-period pro-gramming model.
Byrd et al. Alternatives to Methyl Bromide for Bell Pepper Producers 37
3 These values are within the acceptable range determined by Babcock, Choi, and Feinerman (1993).4 Annual average prices for jumbo and US 1 & 2 peppers in 2003 were used in this analysis under the assumption
that this year represented a normal or representative year for producers relative to the abnormally high market pricesin 2004 resulting from production shrinkage from hurricanes.
Results
The results of the two analytical methods are presented in tables 1, 2, and 3. Theeffect of risk aversion on producers’ preferred rankings of alternative productionsystems (as suggested by Hammond, 1974) is considered in the stochastic domin-ance analysis. In this approach, two scenarios are modeled by setting the risk-aversion coefficients at 0.00004 and 0.004 to represent conditions of low and highrisk aversion, respectively.3
Stochastic Dominance Rankings and Risk Aversion
Based on total experimental yields (table 1), the C35+KPAM is the most preferredproduction system under both low and high levels of risk aversion. This systemproduced the highest mean yield of 36.33 lbs. per plot, but has a high relativevariability with a coefficient of variation (CV) of 0.4737, ranking second among thefour production systems. MeBr, despite its low relative variability (CV) of 0.4582,could not overtake C35+KPAM in the overall rankings due to its mean yield of only32.67 lbs. per plot. C35+PIC and T2+PIC are in third and fourth place, respec-tively, in the low risk-aversion category, and in fourth and third place, respectively,in the high risk-aversion category. While C35+PIC has the least volatile yieldresults, its mean yield of 32.33 lbs. per plot is too low to enable it to dominateC35+KPAM in the preference rankings.
The preference ordering based on jumbo grade alone reveals the vulnerability ofthe MeBr system vis-à-vis the three other systems. MeBr’s mean jumbo yield of10.22 lbs. per plot is eclipsed by the top two jumbo yields of 15.00 and 12.56 lbs.per plot delivered by the C35+KPAM and T2+PIC systems, respectively. Thepreference rankings are identical in both the low and high risk-aversion categories(table 1).
The gross revenue rankings introduce the price component4 to serve as weightsfor the different pepper grades, and thus capture variations in the pepper gradecompositions in the four production systems. Consistent with the total and jumboyield rankings, C35+KPAM dominates the other three production systems in thegross revenue rankings with its mean of $14,821 per acre (highest mean) despite itshighly variable revenue structure (CV of 0.4472). MeBr’s second-place rank interms of total yield is pulled down in the gross revenue rankings due to lowerproportion of jumbo yield relative to this pepper grade’s proportion to total yield inthe other fumigation methods, which commands a higher price than the US1&2pepper grade. MeBr is ranked third by the less risk-averse decision maker, while themore risk-averse producer considers it the least preferred system. C35+PIC, which
38 Spring 2007 Journal of Agribusiness
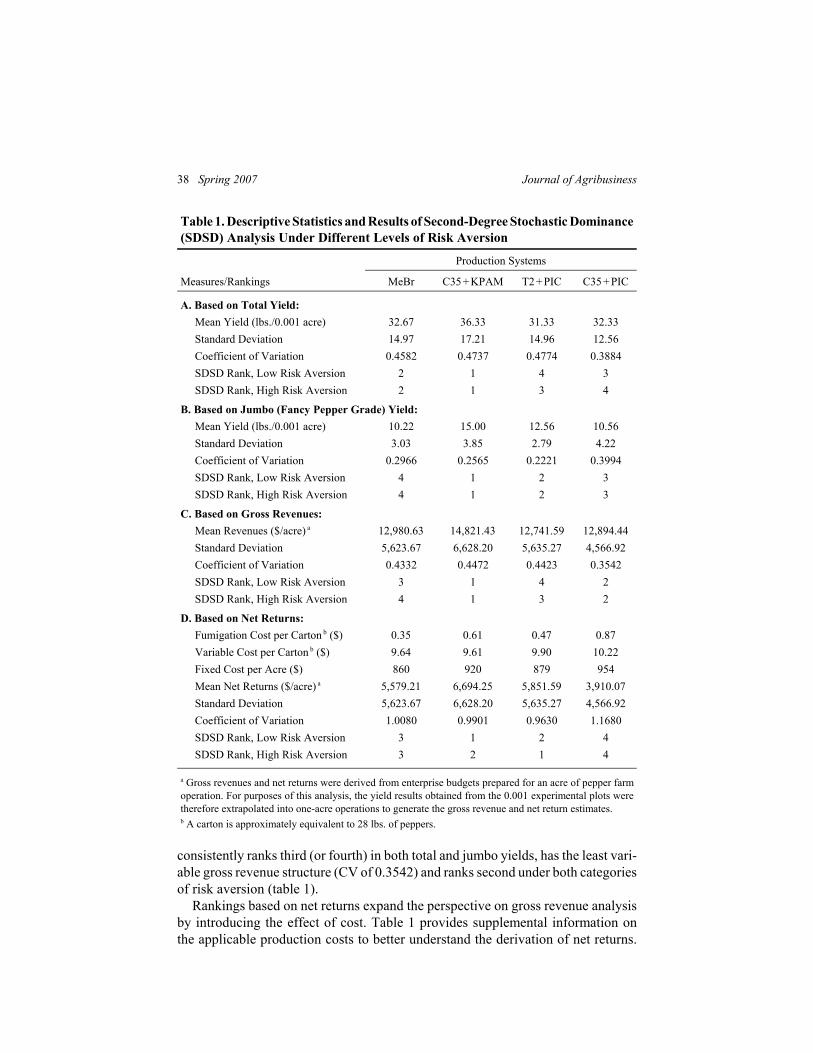
Table 1. Descriptive Statistics and Results of Second-Degree Stochastic Dominance(SDSD) Analysis Under Different Levels of Risk Aversion
Production Systems
Measures/Rankings MeBr C35 + KPAM T2 + PIC C35 + PIC
A. Based on Total Yield: Mean Yield (lbs./0.001 acre) 32.67 36.33 31.33 32.33 Standard Deviation 14.97 17.21 14.96 12.56 Coefficient of Variation 0.4582 0.4737 0.4774 0.3884 SDSD Rank, Low Risk Aversion 2 1 4 3 SDSD Rank, High Risk Aversion 2 1 3 4
B. Based on Jumbo (Fancy Pepper Grade) Yield: Mean Yield (lbs./0.001 acre) 10.22 15.00 12.56 10.56 Standard Deviation 3.03 3.85 2.79 4.22 Coefficient of Variation 0.2966 0.2565 0.2221 0.3994 SDSD Rank, Low Risk Aversion 4 1 2 3 SDSD Rank, High Risk Aversion 4 1 2 3
C. Based on Gross Revenues: Mean Revenues ($/acre) a 12,980.63 14,821.43 12,741.59 12,894.44 Standard Deviation 5,623.67 6,628.20 5,635.27 4,566.92 Coefficient of Variation 0.4332 0.4472 0.4423 0.3542 SDSD Rank, Low Risk Aversion 3 1 4 2 SDSD Rank, High Risk Aversion 4 1 3 2
D. Based on Net Returns: Fumigation Cost per Carton b ($) 0.35 0.61 0.47 0.87 Variable Cost per Carton b ($) 9.64 9.61 9.90 10.22 Fixed Cost per Acre ($) 860 920 879 954 Mean Net Returns ($/acre) a 5,579.21 6,694.25 5,851.59 3,910.07 Standard Deviation 5,623.67 6,628.20 5,635.27 4,566.92 Coefficient of Variation 1.0080 0.9901 0.9630 1.1680 SDSD Rank, Low Risk Aversion 3 1 2 4 SDSD Rank, High Risk Aversion 3 2 1 4
a Gross revenues and net returns were derived from enterprise budgets prepared for an acre of pepper farmoperation. For purposes of this analysis, the yield results obtained from the 0.001 experimental plots weretherefore extrapolated into one-acre operations to generate the gross revenue and net return estimates.b A carton is approximately equivalent to 28 lbs. of peppers.
consistently ranks third (or fourth) in both total and jumbo yields, has the least vari-able gross revenue structure (CV of 0.3542) and ranks second under both categoriesof risk aversion (table 1).
Rankings based on net returns expand the perspective on gross revenue analysisby introducing the effect of cost. Table 1 provides supplemental information onthe applicable production costs to better understand the derivation of net returns.
Byrd et al. Alternatives to Methyl Bromide for Bell Pepper Producers 39
Producers argue that MeBr’s advantage of cost efficiency is difficult to match. Thesummary in table 1 supports this argument, with MeBr requiring the least fumigationcost per carton and fixed cost per acre. However, C35+KPAM and T2+PIC closelymatch MeBr’s cost efficiency. Specifically, C35+KPAM has a probably insignifi-cant lower variable cost per carton of $9.61 versus MeBr’s $9.64. Among the threealternative systems, T2+PIC’s fumigation cost per carton of $0.47 comes closest toMeBr’s $0.35.
Considering both gross revenue and cost structures, the net return rankings favorC35+KPAM and T2+PIC over MeBr. C35+KPAM’s ranking is not surprising, con-sidering its consistently high placement in all previous rankings (total yield, jumboyield, and gross revenues). T2+PIC, which ranks in the last two places in the grossrevenue rankings, is the most preferred system by the more risk-averse producer,mainly owing to this system’s CV of 0.9630 (the lowest among the four systems).C35+PIC, the most expensive production system based on the cost summary in table1, is the least preferred system under both categories of risk aversion, and this costdisadvantage pulls down its second place finish in the gross revenue rankings.
Optimal Production Plans
The LP model [equation (1)] delivers solutions to the optimization problem for eachperiod throughout the five-year time horizon. Additions and/or reductions to boththe producer’s assets and liabilities dictate adjustments to the final value of accum-ulated net worth. These adjustments can be made through increases or decreases inthe model’s decision variables representing land purchases, cash-rented acreage, newequipment purchases, off-farm investments, and incremental short-, intermediate-,and long-term debt.
Each optimization of the four production systems began with an identical set ofassumptions concerning specific attributes of the representative farm. For example,beginning land values and cash rent levels, equipment costs, family consumption,off-farm income and yields on off-farm investments, depreciation schedules, andinterest on credit facilities were constant values at initial time T(0) for all systems.Variables including per acre variable production costs, gross returns, overhead costs,and net margins, along with farm wage rates, were forecasted to increase due toinflation.
Conveying the LP solutions for the production variables as five-year averages, thesummary in table 2 indicates that MeBr and C35+KPAM systems yield similarpreferred solutions relative to the other two systems. The more detailed yearlyprogramming solutions in table 3 reveal some trends in production and financingdecisions made under the different production systems.
Farm Size Solutions and Farmland Control Arrangements
An upper-limit constraint on total production of 1,000 acres per system has beenimposed on the farm size solutions reported in tables 2 and 3. Given this constraint,
40 Spring 2007 Journal of Agribusiness
5 Note that the solutions for land purchase activity measures are incremental measures that express the additionalacres purchased in excess of the initial endowment of 300 acres. The values for acres rented do not accumulate duringthe planning period. Producers rent land for a period of one year, and at the beginning of the next period must againdecide how much acreage to devote to renting. This figure is then carried over and added to purchases made duringthe next period, with this process being repeated over the life of the planning period.
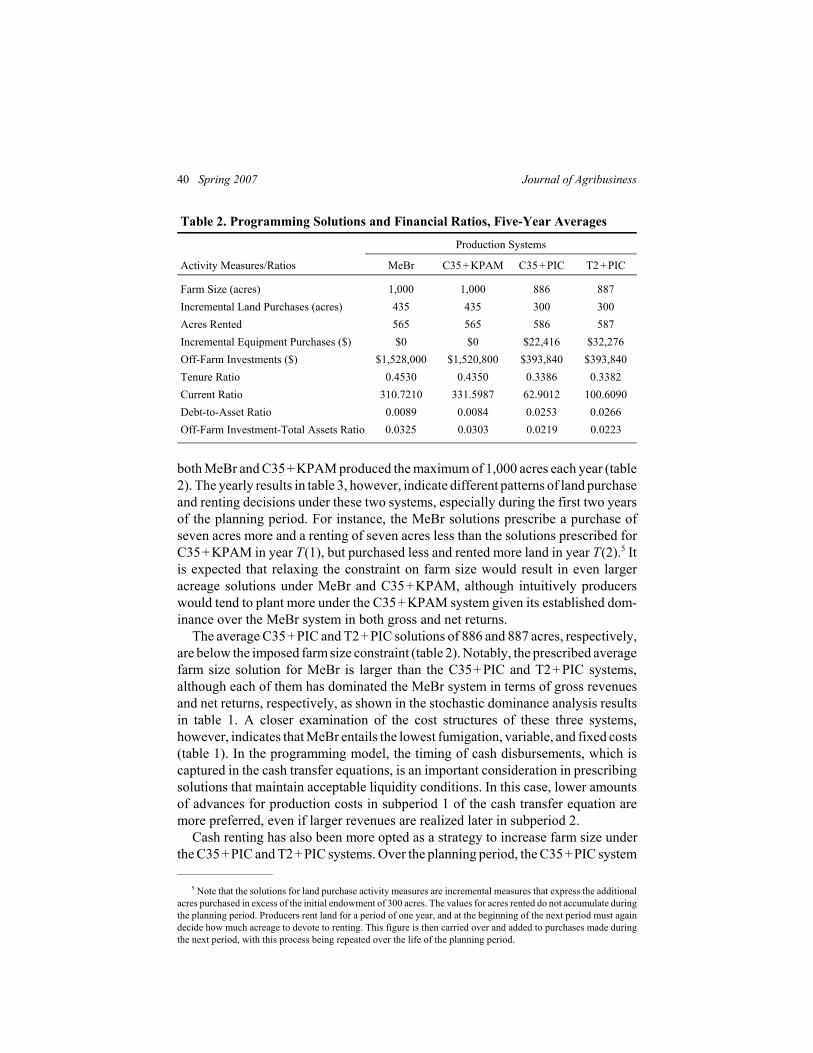
Table 2. Programming Solutions and Financial Ratios, Five-Year Averages
Production Systems
Activity Measures/Ratios MeBr C35 + KPAM C35 + PIC T2 + PIC
Farm Size (acres) 1,000 1,000 886 887Incremental Land Purchases (acres) 435 435 300 300Acres Rented 565 565 586 587Incremental Equipment Purchases ($) $0 $0 $22,416 $32,276Off-Farm Investments ($) $1,528,000 $1,520,800 $393,840 $393,840Tenure Ratio 0.4530 0.4350 0.3386 0.3382Current Ratio 310.7210 331.5987 62.9012 100.6090Debt-to-Asset Ratio 0.0089 0.0084 0.0253 0.0266Off-Farm Investment-Total Assets Ratio 0.0325 0.0303 0.0219 0.0223
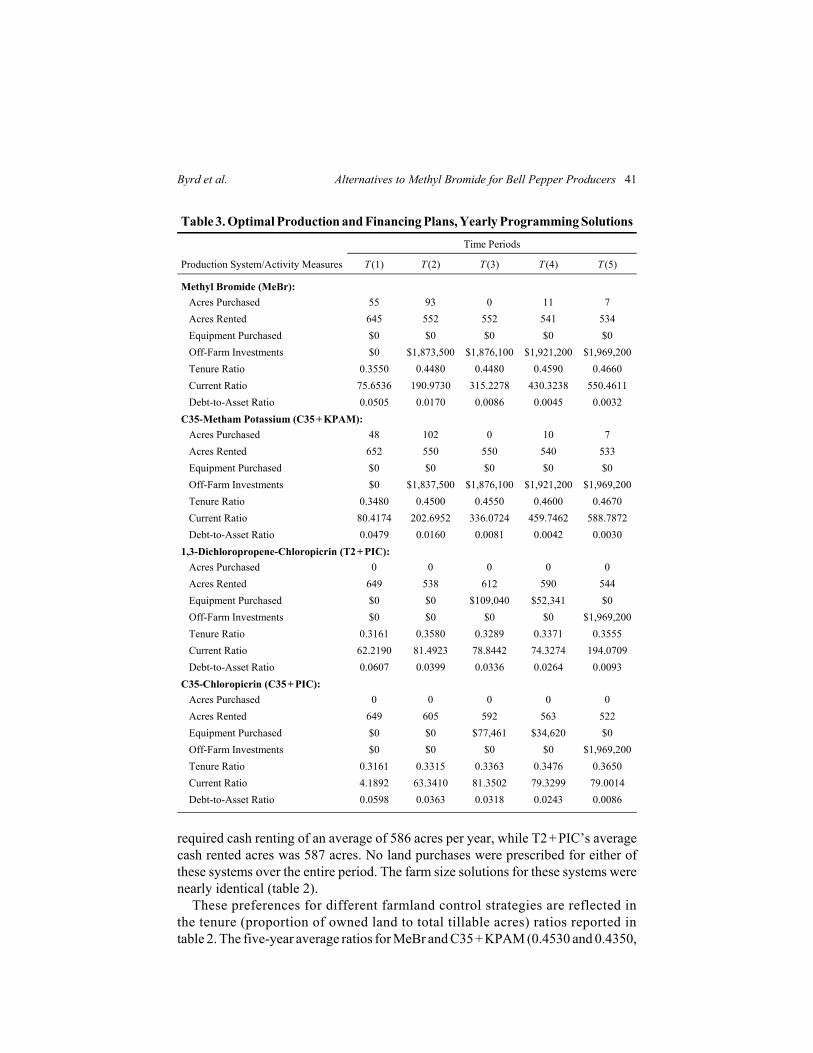
both MeBr and C35+KPAM produced the maximum of 1,000 acres each year (table2). The yearly results in table 3, however, indicate different patterns of land purchaseand renting decisions under these two systems, especially during the first two yearsof the planning period. For instance, the MeBr solutions prescribe a purchase ofseven acres more and a renting of seven acres less than the solutions prescribed forC35+KPAM in year T(1), but purchased less and rented more land in year T(2).5 Itis expected that relaxing the constraint on farm size would result in even largeracreage solutions under MeBr and C35+KPAM, although intuitively producerswould tend to plant more under the C35+KPAM system given its established dom-inance over the MeBr system in both gross and net returns.
The average C35+PIC and T2+PIC solutions of 886 and 887 acres, respectively,are below the imposed farm size constraint (table 2). Notably, the prescribed averagefarm size solution for MeBr is larger than the C35+PIC and T2+PIC systems,although each of them has dominated the MeBr system in terms of gross revenuesand net returns, respectively, as shown in the stochastic dominance analysis resultsin table 1. A closer examination of the cost structures of these three systems,however, indicates that MeBr entails the lowest fumigation, variable, and fixed costs(table 1). In the programming model, the timing of cash disbursements, which iscaptured in the cash transfer equations, is an important consideration in prescribingsolutions that maintain acceptable liquidity conditions. In this case, lower amountsof advances for production costs in subperiod 1 of the cash transfer equation aremore preferred, even if larger revenues are realized later in subperiod 2.
Cash renting has also been more opted as a strategy to increase farm size underthe C35+PIC and T2+PIC systems. Over the planning period, the C35+PIC system
Byrd et al. Alternatives to Methyl Bromide for Bell Pepper Producers 41
Table 3. Optimal Production and Financing Plans, Yearly Programming SolutionsTime Periods
Production System/Activity Measures T (1) T (2) T (3) T (4) T (5)
Methyl Bromide (MeBr): Acres Purchased 55 93 0 11 7 Acres Rented 645 552 552 541 534 Equipment Purchased $0 $0 $0 $0 $0 Off-Farm Investments $0 $1,873,500 $1,876,100 $1,921,200 $1,969,200 Tenure Ratio 0.3550 0.4480 0.4480 0.4590 0.4660 Current Ratio 75.6536 190.9730 315.2278 430.3238 550.4611 Debt-to-Asset Ratio 0.0505 0.0170 0.0086 0.0045 0.0032C35-Metham Potassium (C35 + KPAM): Acres Purchased 48 102 0 10 7 Acres Rented 652 550 550 540 533 Equipment Purchased $0 $0 $0 $0 $0 Off-Farm Investments $0 $1,837,500 $1,876,100 $1,921,200 $1,969,200 Tenure Ratio 0.3480 0.4500 0.4550 0.4600 0.4670 Current Ratio 80.4174 202.6952 336.0724 459.7462 588.7872 Debt-to-Asset Ratio 0.0479 0.0160 0.0081 0.0042 0.00301,3-Dichloropropene-Chloropicrin (T2 + PIC): Acres Purchased 0 0 0 0 0 Acres Rented 649 538 612 590 544 Equipment Purchased $0 $0 $109,040 $52,341 $0 Off-Farm Investments $0 $0 $0 $0 $1,969,200 Tenure Ratio 0.3161 0.3580 0.3289 0.3371 0.3555 Current Ratio 62.2190 81.4923 78.8442 74.3274 194.0709 Debt-to-Asset Ratio 0.0607 0.0399 0.0336 0.0264 0.0093C35-Chloropicrin (C35 + PIC): Acres Purchased 0 0 0 0 0 Acres Rented 649 605 592 563 522 Equipment Purchased $0 $0 $77,461 $34,620 $0 Off-Farm Investments $0 $0 $0 $0 $1,969,200 Tenure Ratio 0.3161 0.3315 0.3363 0.3476 0.3650 Current Ratio 4.1892 63.3410 81.3502 79.3299 79.0014 Debt-to-Asset Ratio 0.0598 0.0363 0.0318 0.0243 0.0086
required cash renting of an average of 586 acres per year, while T2+PIC’s averagecash rented acres was 587 acres. No land purchases were prescribed for either ofthese systems over the entire period. The farm size solutions for these systems werenearly identical (table 2).
These preferences for different farmland control strategies are reflected inthe tenure (proportion of owned land to total tillable acres) ratios reported intable 2. The five-year average ratios for MeBr and C35+KPAM (0.4530 and 0.4350,
42 Spring 2007 Journal of Agribusiness
respectively) are higher than those obtained for the other two production systems.As suggested by these results, given the scale and size of production solutionsprescribed for the MeBr and C35+KPAM systems, the returns and cash flowavailable to producers under these systems are more favorable and encourage moreinvestments in farmland relative to the other two systems.
Off-Farm Investment Solutions
Discrepancies among solutions for the financial decision variables were pronouncedbetween the MeBr and C35+KPAM production systems versus C35+PIC andT2+PIC. Each of the four farm models began with an initial allocation of off-farminvestments totaling $100,000. The former two systems realized off-farm investmentsof approximately $1.5 million per year over five years (table 2). In contrast, produc-tion systems C35+PIC and T2+PIC were prescribed equal solutions of $393,840invested in off-farm activities per year when averaged over the planning period.
The ratio of off-farm investments to total assets reveals that more money is allo-cated outside of the primary revenue-generating activities of the farm for MeBr andC35+KPAM where off-farm investments represent about 3% of all assets. A slightlylower proportion (about 2%) is obtained for the other two systems (table 2).
The larger farm size solutions prescribed for the C35+KPAM and MeBr systemsand their relatively high average net returns from production (table 1) allow them togenerate more excess funds that can be set aside for off-farm investments. Off-farminvestment decisions in the model are evaluated against the returns structure of thecompeting farm production investment alternative. In the model, off-farm yields areassumed to be lower than the net returns that can be generated from farm production.Apparently, the model has initially optimized the more lucrative farm investmentsolutions (through the prescribed acreage solutions) and only considered investingexcess cash generated in off-farm activities. In all four systems analyzed, excesscash to be allocated for other investments can easily be accumulated given the largeacreage solutions prescribed by the model and the net returns levels reported foreach production system in table 1. As C35+KPAM dominates the rest in terms ofgenerating net returns, this system is expected to invest more in off-farm activitiesupon relaxation of the farm size constraint.
Liquidity and Solvency Solutions
In terms of liquidity, all current ratio results are highly favorable (table 2) as thefarm relies less on short-term credit to finance operating capital requirements and,at the same time, accumulates off-farm investments that increase total current assets.C35+KPAM with a current ratio of 331.59 had the highest liquidity. MeBr was alsohighly liquid with a ratio of 310.72. The ratios for all four systems were well abovethe critical value (around 2.0 times as established by some analysts for certainenterprises), indicating each had the ability to quickly pay off short-term debts.
Byrd et al. Alternatives to Methyl Bromide for Bell Pepper Producers 43
Leverage positions, as measured by the debt-to-asset ratio, are likewise favorableunder all production systems. Debt-to-asset ratios ranged from less than 1% (0.008for C35+KPAM) to a high of approximately 0.027 for T2+PIC.
These results indicate less reliance on external funds to cover capital and oper-ating funding requirements. They suggest that external financing is considered morecostly than internally generated funds which can be reinvested into the business tocover cash flow requirements. The cost of borrowing used in this analysis is set at8% to coincide with the prevailing rates at the time when the Federal Open MarketCommittee has been increasing the federal funds rate. Again, large acreage solutionsprescribed by the model, coupled with the high levels of average net returns per acre,allow the accumulation of excess cash that more than adequately covers operatingand all other cash requirements. This financial self-reliance significantly reduces theneed to avail of large short-, medium- or long-term loans to supplement internallygenerated funds in covering all funding requirements. Apparently, the small amountsof external funds (loans) reflected in the programming solutions were incurred tostrategically finance cash flow gaps resulting from the timing of certain fund dis-bursements and inflows.
Summary and Conclusions
The current MeBr system—which has proven to be a reliable, affordable, andeffective fumigant—is slated to be phased out under the Montreal Protocol. Seekingalternative environmental and economically feasible systems, a two-year UGA fieldexperiment has identified three production systems as possible replacements. Thesethree systems involve combinations of three fumigant chemicals and a commonlyprescribed herbicide system that have effectively controlled pests and generatedequal or higher yields than the MeBr system.
This study extends the technical efficiency analysis by utilizing stochastic domin-ance techniques to compare the production and financial efficiencies of MeBr andalternative production systems. The analytical framework also accounts for the effectof producers’ risk attitudes on the efficiency rankings of the four systems. Resultsof our analyses indicate that under conditions of both low and high risk aversion,only the C35+KPAM system outperforms the MeBr system in total yields, althoughall three alternative systems dominated the MeBr system in jumbo pepperproduction. Considering gross revenue, with price premiums for the preferred peppergrades, along with all operating costs for calculating net returns, C35+KPAM wasthe only system that consistently outperformed MeBr in terms of both gross and netreturns. Notably, another alternative system, T2+PIC, dominated the MeBr systemin net returns. The C35+PIC system produced the least favored risk-return profilefor both the less and highly risk-averse decision maker. The net-return dominanceof C35+KPAM and T2+PIC systems over the MeBr system can be attributed toboth their comparable production cost structure with MeBr and their more favorableyield structure. Both the C35+KPAM and T2+PIC production systems have theability to produce a larger proportion of the premium-priced jumbo peppers.
44 Spring 2007 Journal of Agribusiness
The cost-return estimates under the four production systems were further analyzedusing simulation-optimization techniques under a multi-period programming frame-work. Results indicate similar optimal production and financing plans for MeBr andC35+KPAM systems. Under these systems, optimal farm size solutions are pre-scribed at the maximum acreage limit set, with greater reliance on land ownershipthan cash renting. The larger farm size solutions, enhanced by capability of all foursystems to generate high-level net returns per acre, have resulted in the accumulationof more excess funds, some portions of which have been allocated to off-farminvestments to diversify the farm’s asset portfolio. These same factors, coupled withthe more costly nature of external financing assumed in the analysis, producedprogramming solutions that reflect less reliance on external funds to cover capitaland operating funding requirements.
Our results suggest that economically viable alternatives may exist for Georgiapepper producers to replace MeBr. However, the successful adoption of these alter-natives has yet to be determined and could depend on the alternatives’ consistency,efficiency, and reliability across different farm conditions and over longer periodsof time. Producers have relied on the MeBr’s ability to eradicate diseases and pestsover a wide range of environmental conditions and growing conditions. Only actualon-farm use of the suggested fumigants can ascertain whether, like MeBr, thealternatives are equally flexible and adaptable to different farm conditions (such asirrigation levels, soil conditions, diseases, or pests not captured by the experiments).Moreover, producers have already established the consistency of yields under MeBrover time. Although environmentally friendly alternatives have been found to beequally or more financially efficient in experimental trials, there is not enoughevidence that they can deliver consistent yields at comparable costs over long-runvarying environmental conditions.
References
Anderson, J. R., J. L. Dillon, and B. Hardaker. (1977). Agricultural Decision Analysis,1st edition, pp. 65S108. Ames, IA: Iowa State University Press.
Babock, B. A., E. K. Choi, and E. Feinerman. (1993). “Risk and probability premiumsfor CARA utility functions.” Journal of Agricultural and Resource Economics 18,17S24.
Barry, P. J., and D. R. Willmann. (1976). “A risk programming analysis of forward con-tracting with credit constraints.” American Journal of Agricultural Economics 58,62S70.
Boatright, S. R., and J. C. McKissick. (2003). 2003 Georgia Farm Gate Vegetable Sur-vey Report. Pub. No. SR-04-01. College of Agricultural and Environmental Sciences,University of Georgia, Athens.
Byrd, M. M. (2005). “A farm-level approach to the methyl bromide phase-out: Identify-ing alternatives and maximizing net worth using stochastic dominance and optimi-zation procedures.” Unpublished master’s thesis, Department of Agricultural andApplied Economics, University of Georgia, Athens.
Byrd et al. Alternatives to Methyl Bromide for Bell Pepper Producers 45
Carpenter, J., L. Gianessi, and L. Lynch. (2000). “The economic impact of the scheduledU.S. phaseout of methyl bromide.” National Center for Food and Agricultural Policy,Washington, DC.
Culpepper, S., and D. B. Langston. (2000). “Replacement of methyl bromide by integrat-ing the use of alternative soil fumigants, cultural practices, and herbicides for tomato,pepper, and watermelon.” Proposal to CSREES/IFAFS for Program No. 14 areaentitled “Critical and Emerging Pest Management Challenges.” Prepared throughCenter for Agribusiness and Economic Development, University of Georgia.
Escalante, C. L., and P. J. Barry. (2001, December). “Risk balancing in an integratedfarm risk management plan.” Journal of Agricultural and Applied Economics 33(3),413S429.
Gilreath, J. P., J. W. Noling, and B. M. Santos. (2004). “Methyl bromide alternatives forbell pepper (Capsicum annuum) and cucumber (Cucumis sativas) rotations.” CropProtection 23, 347S351.
Gilreath, J. P., and B. M. Santos. (2004). “Efficacy of methyl bromide alternatives onpurple nutsedge control (Cyperus rotundus) in tomato and pepper.” Weed Technology18, 141S145.
Gwinn, A. S., P. J. Barry, and P. N. Ellinger. (1992). “Farm financial structure underuncertainty: An application to grain farms.” Agricultural Finance Review 52, 43S56.
Hammond, J. S., III. (1974). “Simplifying the choice between uncertain prospects wherepreference is nonlinear.” Managerial Science 20, 1047S1072.
Huang, C., and R. Litzenberger. (1988). Foundations for Financial Economics. UpperSaddle River, NJ: Prentice-Hall.
McCarl, B. A., and T. H. Spreen. (1994). Applied Mathematical Programming UsingAlgebraic Systems. Department of Agricultural Economics, Texas A&M University,College Station.
Seabrook, C. (2005, February 14). “Vegetable growers rely on ozone-depleting gas.”The Atlanta Journal-Constitution. Online. Available at http://www.ajc.com/news/content/news/science/0205/14pesticide.html. [Accessed December 14, 2005.]
United Nations, Environment Programme. (2000). The Montreal Protocol on Substancesthat Deplete the Ozone Layer. United Nations, New York.
U.S. Department of Agriculture, Economic Research Service. (2001, December). Vege-tables and Melons Outlook Report. USDA/ERS, Washington, DC. Online. Availableat http://www.ers.usda.gov/publications/so/view.asp?f=/specialty/vgs-bb/. [Lastaccessed July 2005.]


