Embed Size (px)
Citation preview

Finding feasible pathways in metabolic networks
Esa Pitkanen1,3, Ari Rantanen1, Juho Rousu2, and Esko Ukkonen1
1 Department of Computer Science, University of Helsinki, Finland2 Royal Holloway, University of London, UK
3 Email: [email protected]. Surface mail: Department of Computer Science,P.O.Box 68, FIN-00014 University of Helsinki, Finland
Abstract. Recent small-world studies of the global structure of meta-bolic networks have been based on the shortest-path distance. In thispaper, we propose new distance measures that are based on the struc-ture of feasible metabolic pathways between metabolites. We argue thatthese distances capture the complexity of the underlying biochemicalprocesses more accurately than the shortest-path distance. To test ourapproach in practice, we calculated our distances and shortest-path dis-tances in two microbial organisms, S. cerevisiae and E. coli. The resultsshow that metabolite interconversion is significantly more complex thanwas suggested in previous small-world studies. We also studied the ef-fect of reaction removals (gene knock-outs) on the connectivity of theS. cerevisiae network and found out that the network is not particularlyrobust against such mutations.
1 Introduction
Information on both biochemical reactions and enzymatic function of gene prod-ucts has been made available in databases such as KEGG [6] and MetaCyc [8].This knowledge has made it possible to analyze and predict genome-scale prop-erties of metabolism in various organisms.
Two main approaches have been proposed for global analysis of metabolism,a graph-theoretical one [5, 9, 1] that focuses on the topology of the metabolicnetwork, and an approach studying the capabilities of a metabolic network insteady-state conditions using stoichiometric equations [12, 11].
In the graph-theoretical approach, the focus is in identifying node ranks, pathlengths and clustering properties of metabolic network. Considering metabolicnetworks just as graphs consisting of nodes and edges and using shortest-pathlength as a distance function, it was suggested that metabolic networks in gen-eral possess the scale-free property: metabolite rank distribution P (k) follows apower-law P (k) ≈ k−γ , with γ ≈ 2.2 for many organisms [5]. Consequently, thenetwork contains a small number of hub nodes that connect otherwise distantparts of the network. Because the average path length in a scale-free networkis relatively short and the network exhibits a high degree of co-clustering, suchnetwork is an example of a so-called small world (see, e.g., [7]). Furthermore,it was observed that random deletions of metabolites from metabolic networks

have little effect on average path length between metabolites [5]. This served asa basis for claims that metabolic networks were robust against mutations.
It was quickly noticed, however, that in metabolic networks typical hubmetabolites include energy and redox cofactors (e.g., ATP and NAD) that areinvolved with several reactions that may be otherwise non-related. Thus, theshortest paths between metabolites often were routed through these cofactors,which can be considered misleading. This observation led to studies correctingthe problem via manually removing the cofactors from the analysis [9] and to thecomputational approach by Arita [1] that circumvented the cofactor problem bylooking at atom-level behaviour of metabolic pathways; he suggested that in avalid metabolic pathway at least one (carbon) atom should be transferred fromthe source to the target. Analysis of these atom-level pathways in [1] yieldedfor E. coli significantly longer average path lengths than the analysis of [5] or[9]. However, both analyses consider pathways that transfer only one metaboliteor atom from source to target, and disregard the other metabolites or atomsinvolved in the pathway.
In this paper we use stricter criteria for a valid metabolic pathway. Namely,we require that on a valid pathway all atoms of the target metabolite need tobe reachable from the source. We argue that this definition is biologically morerealistic than the previous definitions described above as the production of ametabolite via a pathway requires the atoms to be transferred from source totarget and introduce two novel distance measures between metabolites.
We study the structural properties of two high–quality metabolic networks,the networks of S. cerevisiae and E. coli. We also compare our distance func-tions against the shortest-path distance function. It turns out that in these twometabolic worlds the two approaches give quite clearly differing results.
The structure of the paper is as follows. In Section 2, we formalize metabolicnetworks, give our distance functions and show how they relate to the shortest-path distance. In Section 3, we study the computational complexity of thesedistances and give algorithms for evaluating them. In Section 4, we present theresults of evaluating these as well as the shortest-path distances for all metabolitepairs in metabolic networks of two microbial organisms and study the effect ofreaction deletions on the distances of metabolites. Section 5 concludes the articlewith discussion.
2 Metabolic networks, and-or graphs, and metabolic
distances
A metabolic reaction is a pair (I, P ) where I = (I1, . . . , Im) are the m inputmetabolites and P = (P1, . . . , Pn) are the n product metabolites of the reaction.Each member of I and P belongs to the set M of the metabolites of the metabolicsystem under consideration. Note that by this definition a metabolic reaction isdirected and that we omit the stoichiometric coefficients which are not relevantfor our current study. Bidirectional reactions are modeled by pairs of unidirec-tional reactions (I, P ) and (P, I). Also note that when applying our theory, we

want to follow how the atoms are transmitted by the reactions and will thereforeomit cofactor metabolites from M , I , and P .
A metabolic network is given by listing the metabolic reactions that form thenetwork. Let R = (R1, . . . , Rk) be a set of k reactions where each Ri = (Ii, Pi)for some subsets Ii and Pi of M . The corresponding metabolic graph which wealso call a metabolic network, has nodes M ∪ R and arcs as follows: there isa directed arc from Mj ∈ M to Ri ∈ R iff Mj ∈ Ii, and a directed arc fromRi ∈ R to Mj ∈ M iff Mj ∈ Pi. We call the nodes of the network that are in M
the metabolite nodes and the nodes in R the reaction nodes. Figure 1 gives anexample graph in which the reaction nodes are shown as bullets and metabolitenodes contain abbreviated metabolite names.
A metabolic pathway in a metabolic network is a concept that is used some-what loosely in biochemistry. It seems clear, however, that it is not sufficient toconsider only simple paths in a metabolic graph. The metabolic interpretationof the network has to be taken into account: a reaction can operate only if allits input substrates are present in the system. Respectively, a metabolite canbecome present in a system only if it is produced by at least one reaction. Weconsider some (source) metabolites to be always present in a system, and denotethese metabolites by A. Therefore, our metabolic network is in fact an and-or-graph [10] with reactions as and-nodes and metabolites as or-nodes. A similarinterpretation of a metabolic network has been used in a previous study [3].
To properly take into account this interpretation, we need to define distancemeasures for metabolite pairs that relate to the complexity of and-or-graphsconnecting the pair. Let us start with reachability from source metabolites A:
– A reaction Ri = (Ii, Pi) is reachable from A in R, if each metabolite in Ii isreachable from A in R.
– A metabolite C is reachable from A in R, if C ∈ A or some reaction Rj =(Ij , Pj) such that C ∈ Pj is reachable from A in R.
We will define metabolic pathways from A as certain minimal sets of reactionsthat are reachable from A and produce the target metabolite. To this end, forany F ⊆ R, we let Inputs(F ) denote the set of the input metabolites andProducts(F ) denote the set of the output metabolites of F . Moreover, we denoteby W (A, F ) the subset of R that is reachable from A in F . Hence W (A, F ) isthe reactions in R that can be reached from A without going outside F .
A feasible metabolism from A is a set F ⊆ R which satisfies (i) F = W (A, F ),that is, the entire F is reachable from A without going outside F itself. Specifi-cally, a feasible metabolism from A to t is a set F for which it additionally holdsthat (ii) t ∈ Products(F ).
We then define that a metabolic pathway from A to t is any minimal feasiblemetabolism F from A to t, that is, removing any reaction from F leads toviolation of requirement (i) or (ii). Thus, a metabolic pathway is a minimalsubnetwork capable of performing the conversion from A to t.
Now, different distance measures can be defined. We define the metabolicdistance from A to t to be the size of the smallest metabolic pathway from A

OSUCICITOAmOA
AKGCITm
ICITm
CIT
ALAPYR
GLU
Fig. 1. A feasible metabolism (a pathway, in fact) from pyruvate (PYR) to alanine(ALA). In this network, pyruvate and glutamate (GLU) are combined to producealanine. Here, ds(PY R, ALA) = 1, dp(PY R, ALA) = 9, and dm(PY R,ALA) = 10.
to t. This distance captures the idea that the distance equals minimum numberof reactions in total needed to produce t from A. The production distance fromA to t is the smallest diameter taken over all metabolic pathways from A tot, where diameter of a metabolic pathway is taken as the length of the longestsimple path in the pathway. Hence, production distance is the minimum numberof sequential (successive) reactions needed to convert A to t. In the following werestrict ourself to a single source metabolite, that is |A| = 1, to be better ableto compare with shortest-path analysis.
We denote by dp(A, t) the production distance and by dm(A, t) the metabolicdistance from A to t. Moreover, ds(A, t) denotes the standard shortest-pathdistance.
It should be immediately clear that these distances satisfy:
Theorem 1. ds(A, t) ≤ dp(A, t) ≤ dm(A, t).
Figure 1 shows a feasible metabolism producing alanine from pyruvate. Thereader can easily verify that this metabolism is in fact a metabolic pathwayaccording to our technical definition: removal of any reaction would destroy theintegrity of the network. Note that pyruvate is a sufficient precursor to produceall intermediates in this pathway, and no additional input substrates are needed.
Let us conclude this section by relating the metabolic distance to the shortest-path distance. The two distances can be seen as two extremes in a continuumin the following sense. We denote by S the set of auxiliary metabolites that areavailable as reaction substrates without explicitly producing them from A. Inmetabolic distance, the set S of auxiliary metabolites is empty. Therefore, allreaction substrates required for the conversion to t need to be produced fromA. Let us now consider gradually extending the set of auxiliary metabolites toinclude all metabolite subsets of size 1, 2, 3, . . . , |M |. Let S1 ⊂ S2 ⊂ · · · ⊂ M beany such sequence, and denote by dm,S(A, t) the size of the minimum feasiblemetabolism from A to t with S being the set of auxiliary metabolites. It is easyto see that the distances satisfy
dm,M (A, t) ≤ · · · ≤ dm,S1(A, t) ≤ dm,∅(A, t) = dm(A, t),
as adding more and more metabolites to the set of auxiliary metabolites can onlydecrease the size of the required subgraph. Moreover, from some 1 ≤ ` ≤ |M |onwards the distances equal the shortest-path distance
dm,S`(A, t) = dm,S`+1
(A, t) = · · · = dm,M (A, t) = ds(A, t)

as the length of shortest-path is a lower bound to the size of the feasible sub-graph and the shortest-path becomes a feasible metabolism when all intermediatemetabolites along the path are reachable.
A B
CD E F
Fig. 2. In this network, metabolic distance dm,S(A, t) = 5 when the set of auxiliarymetabolites S is empty, and dm,S(A,B) = 1 when C ∈ S.
3 Algorithms and complexity
In this section, we discuss computation of the metabolic and production dis-tances. We then give an algorithm to quickly find a feasible, but possibly nonmin-imal, metabolism. Unfortunately, exact metabolic distance cannot be computedefficiently unless P = NP .
Definition 1. (MINIMAL-FEASIBLE-PATHWAY). Given a set of reactionsR, a set of source metabolites A, a target metabolite t and an integer k, is themetabolic distance dm(A, t) less or equal k?
The intractability of this problem is proven via a reduction from a propo-sitional STRIPS planning problem PLANMIN that concerns the existence of aplan from a initial state to a goal state, consisting of at most k operations [2].We omit the proof due to the lack of space.
Theorem 2. MINIMAL-FEASIBLE-PATHWAY is NP-complete.
This implies that also the special case with |A| = 1 is NP-complete. Next, weconcentrate on calculating lower and upper bounds for the metabolic distance.
Production distance dp(A, Mi) can be computed efficiently with Algorithm1. Search starts from the source metabolites A and proceeds in breadth-firstorder, visiting a reaction node only after all its input metabolite nodes havebeen visited, and a metabolite node after any of its producing reaction nodeshas been visited. The production distance to metabolite nodes is stored in tabled and to reaction nodes in table w. The running time is linear in the size of thenetwork because each metabolite node is put in the queue Q at most once.
Taking advantage of production distances, we can quickly find some feasiblemetabolism from A to t with Algorithm 2. The size of this metabolism gives anupper bound dm for the metabolic distance dm. The algorithm maintains a listof unsatisfied metabolites. Initially the list contains only metabolite t. The ideaof the algorithm is to satisfy one unsatisfied metabolite Mi in turn by addinga reaction to the network that produces Mi. If the metabolite Mi has multipleproducers, a reaction with smallest production distance is chosen, breaking tiesarbitrarily. The running time is again linear.

Algorithm 1 Calculate production distances from A to all other metabolites
Input: A set of reactions R, a set of input metabolites AOutput: Pair (d, w), where d[i] = dp(A,Mi) and w[i] = max{dp(A, Mj) | Mj ∈Inputs(Ri)}Procedure CalculateProductionDistances(R, A):
1: for all Mi ∈M do
2: if Mi ∈ A then
3: d[i]← 04: else
5: d[i]←∞6: for all Ri ∈ R do
7: B[i]← |Inputs(Ri)| % unsatisfied inputs8: w[i]←∞9: Q : queue
10: Q← Q ∪A11: while Q 6= ∅ do
12: Mi ← remove first(Q)
13: for all Rj ∈ Consumers(Mi) do
14: B[j]← B[j] − 115: if B[j] = 0 then
16: w[j]← d[i]17: for all Mk ∈ Products(Rj) do
18: if d[k] =∞ then
19: d[k]← w[j] + 120: append(Q, Mk)21: return (d, w)
Algorithm 2 Find a feasible metabolism from A to t
Input: A set of reactions R, a set of input metabolites A, a target metabolite tOutput: Feasible metabolism G ⊆ R or infeasible if no feasible metabolism existsProcedure FindFeasibleMetabolism(R, A, t):
1: (d,w)← CalculateProductionDistances(R, A)2: if d[i] =∞ then
3: return infeasible
4: V ← {t} {set of visited metabolites}5: Q : queue {unsatisfied metabolites}6: append(Q, t)7: G← ∅8: while Q 6= ∅ do
9: Mi ← remove first(Q)10: Rj ← argminRj
{w[j] |Mi ∈ Products(Rj)}
11: G← G ∪ {Rj}12: for all Mk ∈ Inputs(Rj) do
13: if Mk /∈ V then
14: append(Q, Mk)
15: V ← V ∪ {Mk}16: return G

4 Experiments
To test our definition of metabolic pathway, we studied the genome-scale metabolicnetworks of two microbial organisms, namely Saccharomyces cerevisiae (yeast)[4] and Escherichia coli 4.
We calculated simple path lengths and production distances (Algorithm 1)in metabolic networks. In addition, we calculated a feasible metabolism for allmetabolite pairs with Algorithm 2 for which such metabolism existed. Whilethis metabolism is not necessarily minimal, the size of this metabolism gives usan upper bound for metabolic distance. To concentrate on primary metabolismand to be able to compare with previous results, we deleted 89 cofactors, suchas energy and redox metabolites, from models. We also removed metabolitesdesignated as externals and reactions either consuming or producing them.
0
10
20
30
40
50
60
70
0 5000 10000 15000 20000 25000 30000 35000
Dist
ance
Metabolite pair
Shortest-path length dsUpper bound for metabolic distance dm
Production distance dp
Fig. 3. Production distances, upper bounds for metabolic distance given by Algo-rithm 2 and shortest-path lengths in the metabolic network of S. cerevisiae betweenall metabolite pairs sorted in ascending production distance order. Only every tenthmetabolite pair is included to reduce clutter.
Metabolic distances in two metabolic networks In S. cerevisiae, we foundthat production distance was defined for 23.2% of 154803 metabolite pairs5 forwhich there was a connecting simple path (33.6% for E. coli). Table 1 summarizesthe results. Average production distance in both networks is significantly higherthan average simple path length, implying that metabolic distance is higheras well. Results for simple paths only include paths between metabolite pairsfor which a feasible metabolism exists. Figure 3 shows results for all pairs for
4 Metabolic network models of S. cerevisiae (iFF708, 1175 reactions) and E. coli
(iJE660a, 739 reactions) were obtained from http://systemsbiology.ucsd.edu/
organisms/5 The total of number of pairs is 352242 (cofactors excluded).

which a metabolic pathway exists in ascending production distance order. Weobserve that the size of a smallest metabolic pathway is largely independent ofthe corresponding shortest-path length.
Table 1. Means and standard deviations (in parenthesis) of shortest-path lengths(ds), production distances (dp), and upper bounds for metabolic distance (dm) givenby Algorithm 2 for S. cerevisiae and E. coli.
Organism ds dp dm
E. coli 5.78(2.30)
14.55(6.40)
19.06 (12.5)
S. cerevisiae 6.11(2.40)
16.72(7.74)
20.34 (11.3)
0
1000
2000
3000
4000
5000
6000
0 10 20 30 40 50 60 70 80
Freq
uenc
y
Distance
Shortest-path length dsUpper bound for metabolic distance dm
Production distance dp
Fig. 4. Histograms of production distances, upper bounds for metabolic distance givenby Algorithm 2 and shortest-path lengths for S. cerevisiae.
This result demonstrates the shortfall of approaches using simple paths thatdo not transfer all atoms from source to target: not nearly all simple pathscan be interpreted as biologically plausible pathways. Analysis based on simplepaths does not take into account the inherent nature of metabolic networks asa system of chemical reactions. In order to proceed, all substrates of a chemicalreaction must be present in the system. Therefore, since two thirds of metabolitepairs with a connecting simple path in yeast do not have a connecting metabolicpathway, we claim that previous small world analysis may produce misleadingresults.
Furthermore, even if two metabolites can be connected with both a simplepath and a metabolic pathway, the metabolic pathway is much more complexthan the simple path. This can be seen in Figures 4 and 5 which show the his-tograms of three distances for S. cerevisiae and E. coli, respectively. We can
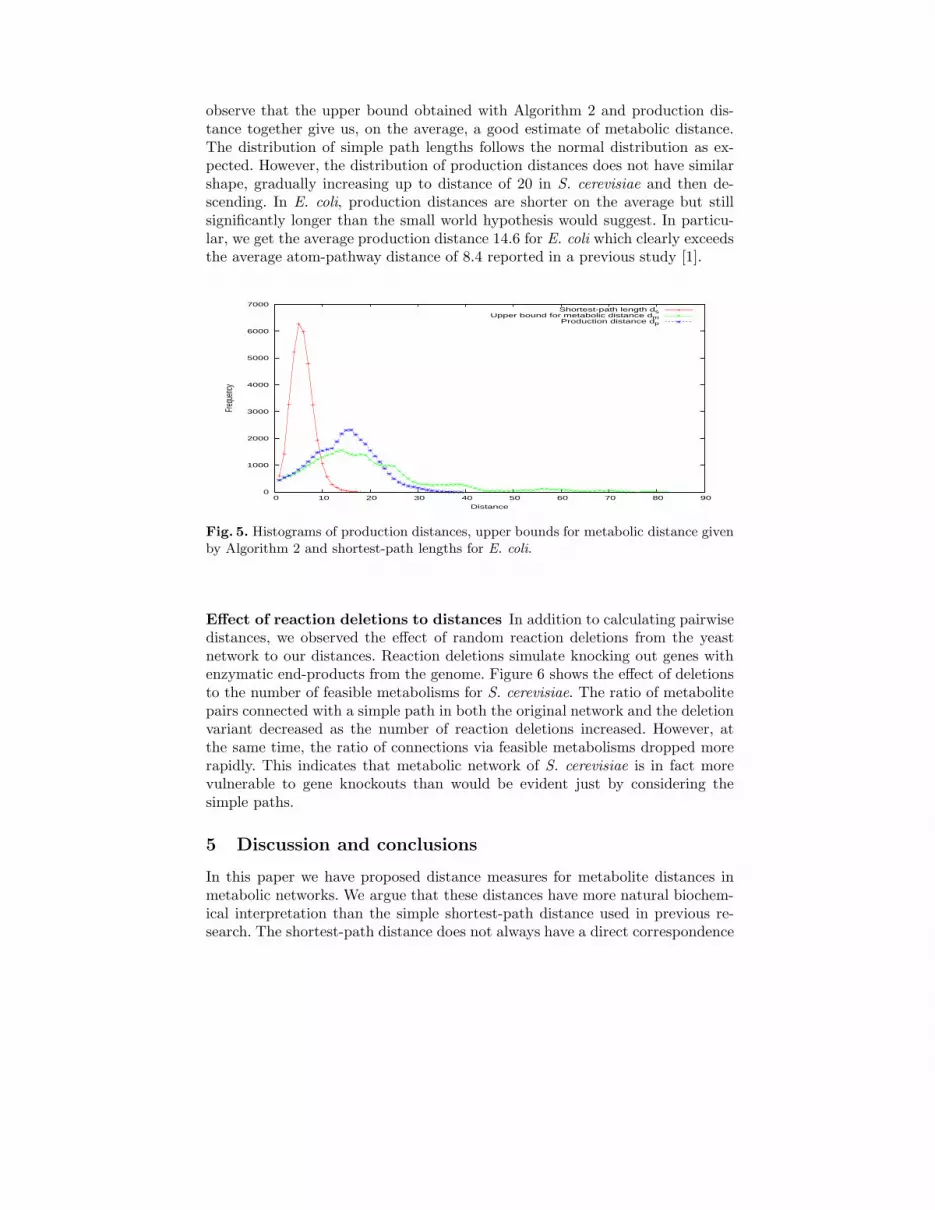
observe that the upper bound obtained with Algorithm 2 and production dis-tance together give us, on the average, a good estimate of metabolic distance.The distribution of simple path lengths follows the normal distribution as ex-pected. However, the distribution of production distances does not have similarshape, gradually increasing up to distance of 20 in S. cerevisiae and then de-scending. In E. coli, production distances are shorter on the average but stillsignificantly longer than the small world hypothesis would suggest. In particu-lar, we get the average production distance 14.6 for E. coli which clearly exceedsthe average atom-pathway distance of 8.4 reported in a previous study [1].
0
1000
2000
3000
4000
5000
6000
7000
0 10 20 30 40 50 60 70 80 90
Frequ
ency
Distance
Shortest-path length dsUpper bound for metabolic distance dm
Production distance dp
Fig. 5. Histograms of production distances, upper bounds for metabolic distance givenby Algorithm 2 and shortest-path lengths for E. coli.
Effect of reaction deletions to distances In addition to calculating pairwisedistances, we observed the effect of random reaction deletions from the yeastnetwork to our distances. Reaction deletions simulate knocking out genes withenzymatic end-products from the genome. Figure 6 shows the effect of deletionsto the number of feasible metabolisms for S. cerevisiae. The ratio of metabolitepairs connected with a simple path in both the original network and the deletionvariant decreased as the number of reaction deletions increased. However, atthe same time, the ratio of connections via feasible metabolisms dropped morerapidly. This indicates that metabolic network of S. cerevisiae is in fact morevulnerable to gene knockouts than would be evident just by considering thesimple paths.
5 Discussion and conclusions
In this paper we have proposed distance measures for metabolite distances inmetabolic networks. We argue that these distances have more natural biochem-ical interpretation than the simple shortest-path distance used in previous re-search. The shortest-path distance does not always have a direct correspondence

0
0.1
0.2
0.3
0.4
0.5
0.6
0.7
0.8
0.9
1
0 200 400 600 800 1000
Ratio
of co
nser
ved p
athwa
ys
Number of deleted reactions
Simple pathsFeasible metabolisms
Fig. 6. Robustness of yeast against reaction deletions. The red (upper) curve givesthe relative amount of connections via simple paths that are preserved after n =0 . . . 1000 deletions. The green curve gives the same quantity for connections via feasiblemetabolisms and indicates quite weak robustness. Averages over 100 repetitions.
to the inherent difficulty of producing a metabolite from another. The distancesas we defined them take into account the fact that, in order to produce thetarget metabolite, all atoms of the target should be reachable from the sourcemetabolites. Our metabolic distance, in addition, measures the genomic capacity(in terms of number of enzymes involved) that is required for the conversion.
In addition, we showed that there is a unified way to interpret the metabolicand shortest-path distances: Metabolic distance is the size of the minimal feasiblemetabolism from A to t when no other metabolite than A is available initially.Shortest-path distance is the size of the minimal feasible metabolism from A tot when all metabolites required by the reactions along the path are availableat the outset. An interesting further research direction is to study the contin-uum between the two extremes by allowing some subsets of metabolites to beavailable besides source metabolites A, either by allowing some biologically inter-esting nutrients or conducting more systematic study, looking for possible phasetransitions in the distances as the function of the number of allowed metabolites.
In our experiments we discovered that the average metabolic distance be-tween pairs of metabolites in the metabolic network of S. cerevisiae is con-siderably longer than the corresponding shortest-path distance. In E. coli weobserved the average metabolic distance to be longer than average atom-pathdistance reported in a previous study. This is because atom-path distance relatesto transforming a single atom between metabolites, while our distance measuresthe complexity of total conversion. Also, the distribution of the distances takesa different shape: normal-like distribution of the shortest-path lengths is notreproduced when our more realistic measures are used.
In the second experiment, we studied the effect of random deletions of en-zymes on metabolite distances. Our simulations show that the metabolic networkof S. cerevisiae may not be as robust to mutations as stated previously.

Another future direction is to make a more comprehensive study on theeffect of reaction deletions on important biological pathways, such as amino acidproduction and DNA synthesis. In addition we plan to apply our analysis toother organisms that have publicly available metabolic network models.
Acknowledgements. This work has been supported by the SYSBIO programmeof Academy of Finland. In addition, the work by Juho Rousu has been supportedby Marie Curie Individual Fellowship grant HPMF-CT-2002-02110.
References
1. M. Arita. The metabolic world of Escherichia coli is not small. PNAS, 101(6):1543–1547, 2004.
2. T. Bylander. The computational complexity of propositional STRIPS planning.Artificial Intelligence, 69(1-2):165–204, 1994.
3. O. Ebenhoh, T. Handorf, and R. Heinrich. Structural analysis of expandingmetabolic networks. Genome Informatics, 15(1):35–45, 2004.
4. J. Forster, I. Famili, P. Fu, B. Palsson, and J. Nielsen. Genome-scale reconstructionof the Saccharomyces cerevisiae metabolic network. Genome Research, (13):244–253, 2003.
5. H. Jeong, B. Tombor, R. Albert, Z. N. Oltvai, and A.-L. Barabasi. The large-scaleorganization of metabolic networks. Nature, (407):651–654, 2000.
6. M. Kanehisa and S. Goto. Kegg: Kyoto encyclopedia of genes and genomes. Nucleic
Acids Res., 28:27–30, 2000.7. J. Kleinberg. The small-world phenomenon: An algorithmic perspective. In Proc.
32nd ACM Symposium on Theory of Computing, 2000.8. C. J. Krieger, P. Zhang, L. A. Mueller, A. Wang, S. Paley, M. Arnaud, J. Pick,
S. Y. Rhee, and P. D. Karp. MetaCyc: a multiorganism database of metabolicpathways and enzymes. Nucleic Acids Research, 32(1):D438–42, 2004.
9. H.-W. Ma and A.-P. Zeng. Reconstruction of metabolic networks from genomedata and analysis of their global structure for various organisms. Bioinformatics,19(2):270–277, 2003.
10. S. J. Russell and P. Norvig. Artifical Intelligence: A Modern Approach. PrenticeHall, 2nd edition, 2003.
11. C. H. Schilling, D. Letscher, and B. Palsson. Theory for the systemic definitionof metabolic pathways and their use in interpreting metabolic function from apathway-oriented perspective. Journal of Theoretical Biology, (203):228–248, 2003.
12. S. Schuster, D. A. Fell, and T. Dandekar. A general definition of metabolic path-ways useful for systematic organization and analysis of complex metabolic network.Nature Biotechnology, 18:326–332, March 2000.


